Embed Size (px)
Citation preview
DASHRATH PRASAD FERTILIZERS PVT. LTD. SY. NO. 274/1, 274/2, 276/A2, 277/A1, TEKULAPALLI VILLAGE, PENUBALLI MANDAL, KHAMMAM DISTRICT, TELANGANA
FINAL EIA REPORT
1. ENVIRONMENTAL IMPACT ASSESSMENT 2. ENVIRONMENT MANAGEMENT PLAN 3. PUBLIC CONSULTATION 4. COMPLIANCE OF TERMS OF REFERENCE 5. ANNEXURES
Project No. 0318‐16‐01March 2018
Dashrath Prasad Fertilizers Pvt. Ltd. 274/1, 274/2, 276/A2, 277/A1, Tekulapalli Village, Penuballi Mandal, Khammam District, Telangana – 507 302 Phone: +91 95735 74455 E‐mail: [email protected]; [email protected]
STUDIES AND DOCUMENTATION BY TEAM Labs and Consultants B‐115‐117 & 509, Annapurna Block, Aditya Enclave, Ameerpet, Hyderabad‐500 038. Phone: 040‐23748 555/23748616, Telefax: 040‐23748666
SUBMITTED TO STATE LEVEL ENVIRONMENT IMPACT ASSESSMENT AUTHORITY,
TELANGANA, GOVERNMENT OF INDIA
DASHRATH PRASAD FERTILIZERS PVT. LTD. SY. NO. 274/1, 274/2, 276/A2, 277/A1, TEKULAPALLI VILLAGE, PENUBALLI MANDAL, KHAMMAM DISTRICT, TELANGANA
1. ENVIRONMENTAL IMPACT ASSESSMENT REPORT
Project No. 0318‐16‐01March 2018
Dashrath Prasad Fertilizers Pvt. Ltd. 274/1, 274/2, 276/A2, 277/A1, Tekulapalli Village, Penuballi Mandal, Khammam District, Telangana – 507 302 Phone: +91 95735 74455 E‐mail: [email protected]; [email protected]
STUDIES AND DOCUMENTATION BY TEAM Labs and Consultants B‐115‐117 & 509, Annapurna Block, Aditya Enclave, Ameerpet, Hyderabad‐500 038. Phone: 040‐23748 555/23748616, Telefax: 040‐23748666
SUBMITTED TO STATE LEVEL ENVIRONMENT IMPACT ASSESSMENT AUTHORITY,
TELANGANA, GOVERNMENT OF INDIA

Dashrath Prasad Fertilizers Pvt. Ltd. Contents
CONTENTS
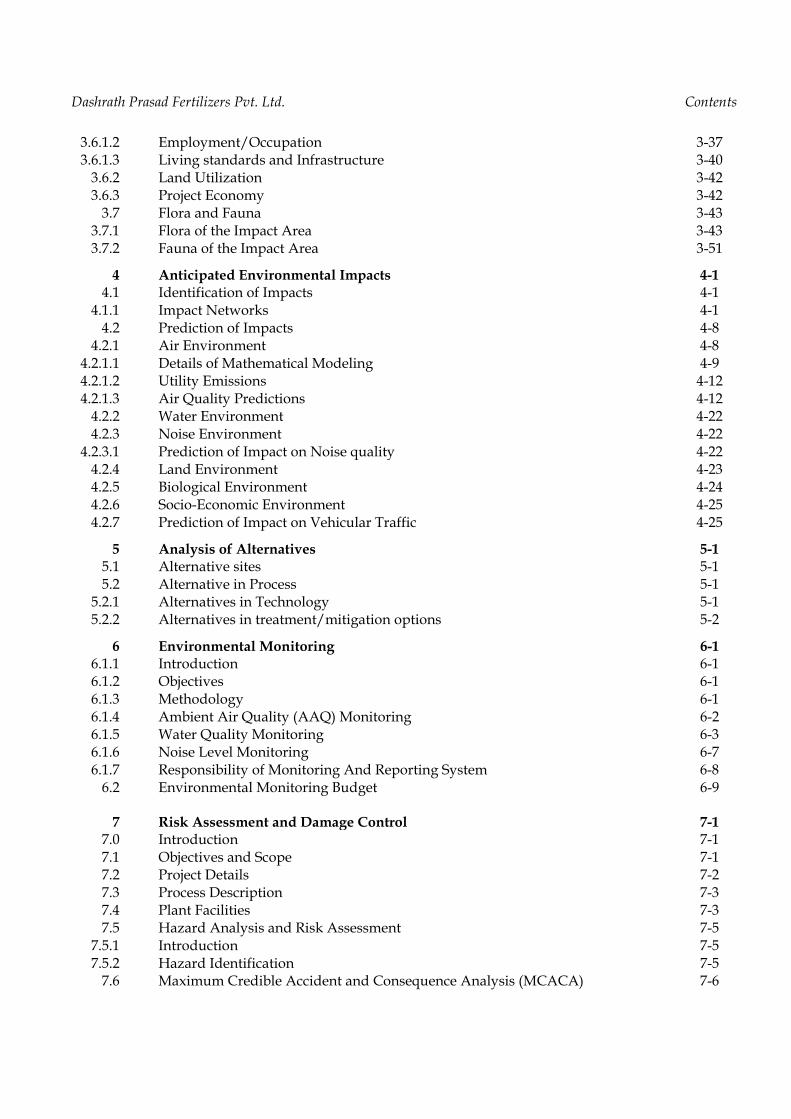
Section Description Page No.
1.0 Introduction of The Project 1-1 1.1 Product Profile 1-2 1.2 Technology 1-3 1.3 Plant Location & Layout 1-3 1.4 Scope of EIA Studies 1-6
2 Process Description and Pollution control Facilities 2-1 2.1 Process Description of Single Super Phosphate (SSP) 2-1 2.2 Utilities 2-4 2.3 Water Requirement 2-4 2.4 Pollution Control Facilities 2-4
2.4.1 Water Pollution 2-5 2.4.2 Air Pollution 2-5
2.4.2.1 Emissions from Utilities 2-5 2.4.2.2 Emissions from Process 2-6
2.4.2.2.1 Process Description of 5 Stage Scrubbing System 2-6 2.4.2.3 Fugitive Emissions 2-7
2.4.4 Solid Waste 2-8 2.4.5 Noise Pollution 2-9
3.0 Baseline Environmental Status 3-1 3.1 Introduction 3-1 3.2 Land Environment 3-1
3.2.1 Physiography 3-1 3.2.2 Geology 3-4 3.2.3 Hydrogeology 3-6 3.2.4 Soils 3-8
3.3 Water Environment 3-13 3.3.1 Surface Water Resources 3-13
3.3.1.1 Surface water Quality 3-13 3.3.1.2 Ground Water resources 3-15 3.3.1.3 Quality Of Ground Water 3-15
3.4 Air Environment 3-19 3.4.1 Meteorology 3-19 3.4.2 Meteorological Station at Plant Site 3-22 3.4.3 Ambient air quality 3-25 3.4.4 Scope of field study 3-25 3.4.5 Description of sampling locations 3-27 3.4.6 Ambient Air Quality Status 3-29 3.4.7 Noise environment 3-31 3.4.8 Traffic Study 3-34
3.5 Socio economic environment 3-35 3.6 Demography 3-35
3.6.1 Population Distribution 3-35 3.6.1.1 Literacy 3-36
Dashrath Prasad Fertilizers Pvt. Ltd. Contents
3.6.1.2 Employment/Occupation 3-37 3.6.1.3 Living standards and Infrastructure 3-40
3.6.2 Land Utilization 3-42 3.6.3 Project Economy 3-42
3.7 Flora and Fauna 3-43 3.7.1 Flora of the Impact Area 3-43 3.7.2 Fauna of the Impact Area 3-51
4 Anticipated Environmental Impacts 4-1 4.1 Identification of Impacts 4-1
4.1.1 Impact Networks 4-1 4.2 Prediction of Impacts 4-8
4.2.1 Air Environment 4-8 4.2.1.1 Details of Mathematical Modeling 4-9 4.2.1.2 Utility Emissions 4-12 4.2.1.3 Air Quality Predictions 4-12
4.2.2 Water Environment 4-22 4.2.3 Noise Environment 4-22
4.2.3.1 Prediction of Impact on Noise quality 4-22 4.2.4 Land Environment 4-23 4.2.5 Biological Environment 4-24 4.2.6 Socio-Economic Environment 4-25 4.2.7 Prediction of Impact on Vehicular Traffic 4-25
5 Analysis of Alternatives 5-1 5.1 Alternative sites 5-1 5.2 Alternative in Process 5-1
5.2.1 Alternatives in Technology 5-1 5.2.2 Alternatives in treatment/mitigation options 5-2
6 Environmental Monitoring 6-1 6.1.1 Introduction 6-1 6.1.2 Objectives 6-1 6.1.3 Methodology 6-1 6.1.4 Ambient Air Quality (AAQ) Monitoring 6-2 6.1.5 Water Quality Monitoring 6-3 6.1.6 Noise Level Monitoring 6-7 6.1.7 Responsibility of Monitoring And Reporting System 6-8
6.2 Environmental Monitoring Budget 6-9
7 Risk Assessment and Damage Control 7-1 7.0 Introduction 7-1 7.1 Objectives and Scope 7-1 7.2 Project Details 7-2 7.3 Process Description 7-3 7.4 Plant Facilities 7-3 7.5 Hazard Analysis and Risk Assessment 7-5
7.5.1 Introduction 7-5 7.5.2 Hazard Identification 7-5
7.6 Maximum Credible Accident and Consequence Analysis (MCACA) 7-6
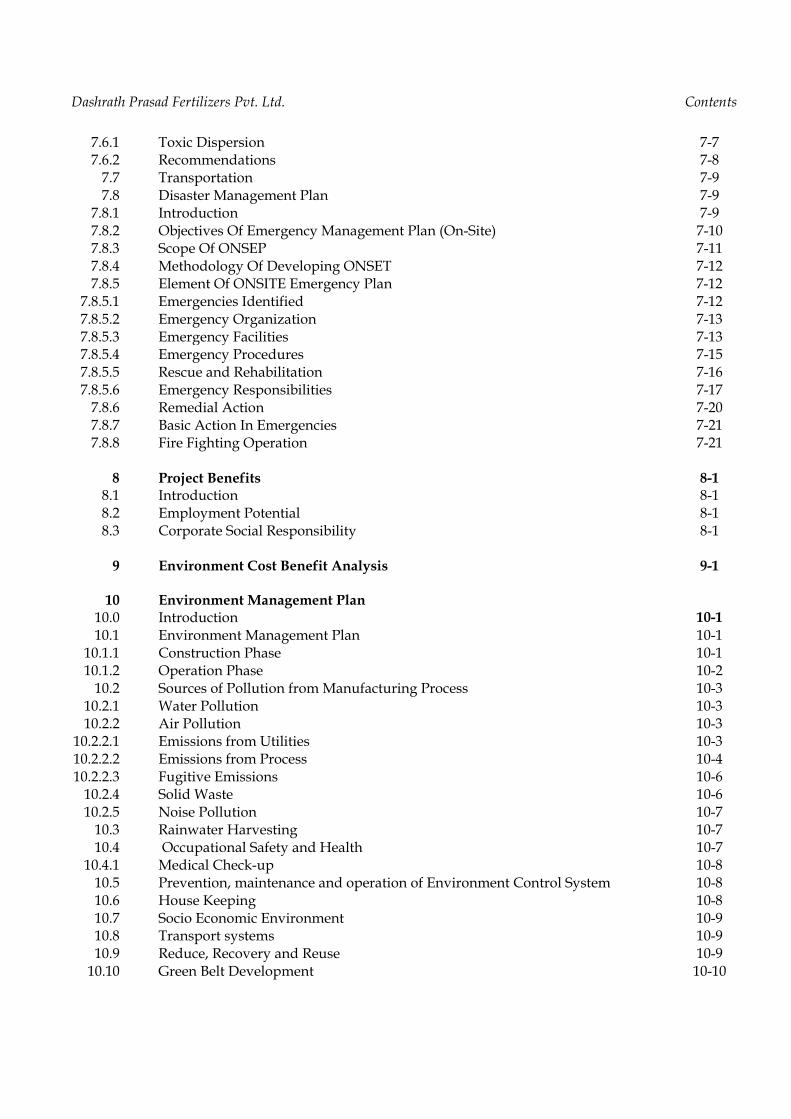
Dashrath Prasad Fertilizers Pvt. Ltd. Contents 7.6.1 Toxic Dispersion 7-7 7.6.2 Recommendations 7-8
7.7 Transportation 7-9 7.8 Disaster Management Plan 7-9
7.8.1 Introduction 7-9 7.8.2 Objectives Of Emergency Management Plan (On-Site) 7-10 7.8.3 Scope Of ONSEP 7-11 7.8.4 Methodology Of Developing ONSET 7-12 7.8.5 Element Of ONSITE Emergency Plan 7-12
7.8.5.1 Emergencies Identified 7-12 7.8.5.2 Emergency Organization 7-13 7.8.5.3 Emergency Facilities 7-13 7.8.5.4 Emergency Procedures 7-15 7.8.5.5 Rescue and Rehabilitation 7-16 7.8.5.6 Emergency Responsibilities 7-17
7.8.6 Remedial Action 7-20 7.8.7 Basic Action In Emergencies 7-21 7.8.8 Fire Fighting Operation 7-21
8 Project Benefits 8-1
8.1 Introduction 8-1 8.2 Employment Potential 8-1 8.3 Corporate Social Responsibility 8-1
9 Environment Cost Benefit Analysis 9-1
10 Environment Management Plan
10.0 Introduction 10-1 10.1 Environment Management Plan 10-1
10.1.1 Construction Phase 10-1 10.1.2 Operation Phase 10-2
10.2 Sources of Pollution from Manufacturing Process 10-3 10.2.1 Water Pollution 10-3 10.2.2 Air Pollution 10-3
10.2.2.1 Emissions from Utilities 10-3 10.2.2.2 Emissions from Process 10-4 10.2.2.3 Fugitive Emissions 10-6
10.2.4 Solid Waste 10-6 10.2.5 Noise Pollution 10-7
10.3 Rainwater Harvesting 10-7 10.4 Occupational Safety and Health 10-7
10.4.1 Medical Check-up 10-8 10.5 Prevention, maintenance and operation of Environment Control System 10-8 10.6 House Keeping 10-8 10.7 Socio Economic Environment 10-9 10.8 Transport systems 10-9 10.9 Reduce, Recovery and Reuse 10-9
10.10 Green Belt Development 10-10
Dashrath Prasad Fertilizers Pvt. Ltd. Contents
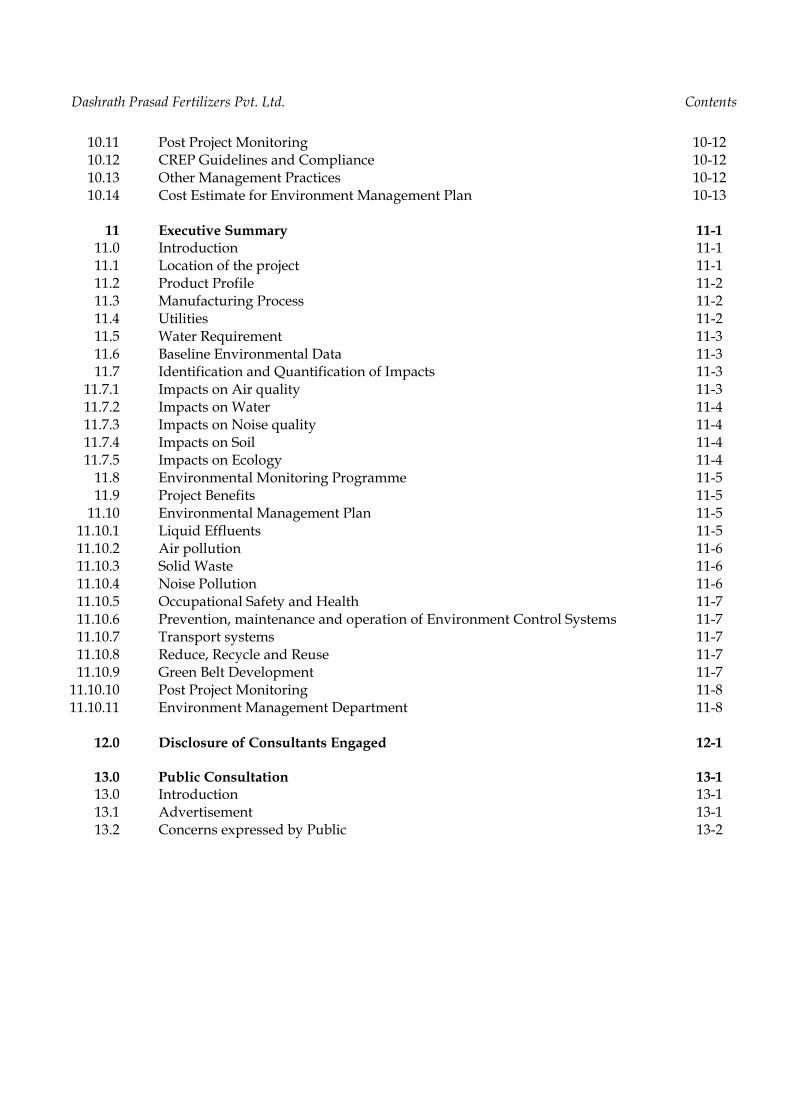
10.11 Post Project Monitoring 10-12 10.12 CREP Guidelines and Compliance 10-12 10.13 Other Management Practices 10-12 10.14 Cost Estimate for Environment Management Plan 10-13
11 Executive Summary 11-1
11.0 Introduction 11-1 11.1 Location of the project 11-1 11.2 Product Profile 11-2 11.3 Manufacturing Process 11-2 11.4 Utilities 11-2 11.5 Water Requirement 11-3 11.6 Baseline Environmental Data 11-3 11.7 Identification and Quantification of Impacts 11-3
11.7.1 Impacts on Air quality 11-3 11.7.2 Impacts on Water 11-4 11.7.3 Impacts on Noise quality 11-4 11.7.4 Impacts on Soil 11-4 11.7.5 Impacts on Ecology 11-4
11.8 Environmental Monitoring Programme 11-5 11.9 Project Benefits 11-5
11.10 Environmental Management Plan 11-5 11.10.1 Liquid Effluents 11-5 11.10.2 Air pollution 11-6 11.10.3 Solid Waste 11-6 11.10.4 Noise Pollution 11-6 11.10.5 Occupational Safety and Health 11-7 11.10.6 Prevention, maintenance and operation of Environment Control Systems 11-7 11.10.7 Transport systems 11-7 11.10.8 Reduce, Recycle and Reuse 11-7 11.10.9 Green Belt Development 11-7
11.10.10 Post Project Monitoring 11-8 11.10.11 Environment Management Department 11-8
12.0 Disclosure of Consultants Engaged 12-1
13.0 Public Consultation 13-1 13.0 Introduction 13-1 13.1 Advertisement 13-1 13.2 Concerns expressed by Public 13-2
Dashrath Prasad Fertilizers Pvt. Ltd. Contents
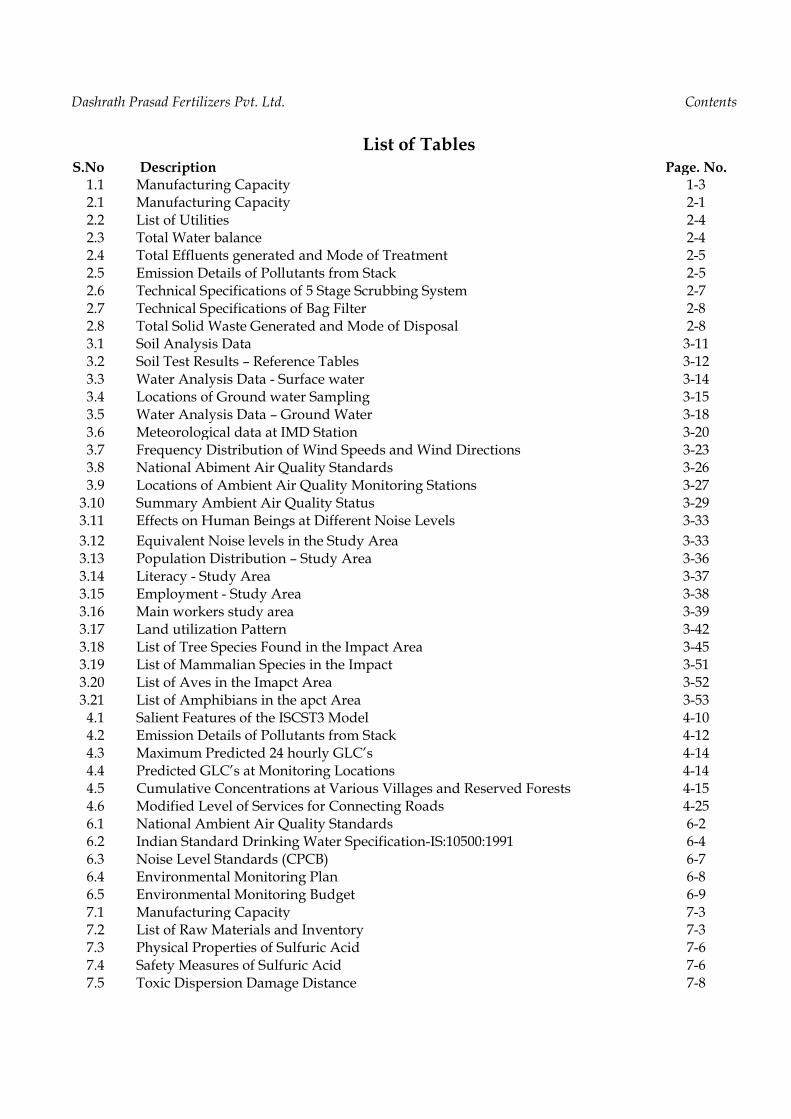
List of Tables S.No Description Page. No.
1.1 Manufacturing Capacity 1-3 2.1 Manufacturing Capacity 2-1 2.2 List of Utilities 2-4 2.3 Total Water balance 2-4 2.4 Total Effluents generated and Mode of Treatment 2-5 2.5 Emission Details of Pollutants from Stack 2-5 2.6 Technical Specifications of 5 Stage Scrubbing System 2-7 2.7 Technical Specifications of Bag Filter 2-8 2.8 Total Solid Waste Generated and Mode of Disposal 2-8 3.1 Soil Analysis Data 3-11 3.2 Soil Test Results – Reference Tables 3-12 3.3 Water Analysis Data - Surface water 3-14 3.4 Locations of Ground water Sampling 3-15 3.5 Water Analysis Data – Ground Water 3-18 3.6 Meteorological data at IMD Station 3-20 3.7 Frequency Distribution of Wind Speeds and Wind Directions 3-23 3.8 National Abiment Air Quality Standards 3-26 3.9 Locations of Ambient Air Quality Monitoring Stations 3-27
3.10 Summary Ambient Air Quality Status 3-29 3.11 Effects on Human Beings at Different Noise Levels 3-33 3.12 Equivalent Noise levels in the Study Area 3-33 3.13 Population Distribution – Study Area 3-36 3.14 Literacy - Study Area 3-37 3.15 Employment - Study Area 3-38 3.16 Main workers study area 3-39 3.17 Land utilization Pattern 3-42 3.18 List of Tree Species Found in the Impact Area 3-45 3.19 List of Mammalian Species in the Impact 3-51 3.20 List of Aves in the Imapct Area 3-52 3.21 List of Amphibians in the apct Area 3-53 4.1 Salient Features of the ISCST3 Model 4-10 4.2 Emission Details of Pollutants from Stack 4-12 4.3 Maximum Predicted 24 hourly GLC’s 4-14 4.4 Predicted GLC’s at Monitoring Locations 4-14 4.5 Cumulative Concentrations at Various Villages and Reserved Forests 4-15 4.6 Modified Level of Services for Connecting Roads 4-25 6.1 National Ambient Air Quality Standards 6-2 6.2 Indian Standard Drinking Water Specification-IS:10500:1991 6-4 6.3 Noise Level Standards (CPCB) 6-7 6.4 Environmental Monitoring Plan 6-8 6.5 Environmental Monitoring Budget 6-9 7.1 Manufacturing Capacity 7-3 7.2 List of Raw Materials and Inventory 7-3 7.3 Physical Properties of Sulfuric Acid 7-6 7.4 Safety Measures of Sulfuric Acid 7-6 7.5 Toxic Dispersion Damage Distance 7-8
Dashrath Prasad Fertilizers Pvt. Ltd. Contents
10.1 Total Effluents Generated and Mode of Treatment 10-3 10.2 Emission Details of Pollutants from Stack 10-4 10.3 Technical Specifications of 5 Stage Scrubbing System 10-5 10.4 Technical Specifications of Bag Filter 10-6 10.5 Solid Waste and Mode of Disposal 10-6 10.6 Activity Wise CSR – Budget (2018-19 to 2022-23) – Program 10-9 10.7 Recommended Plant Species to Develop Green Belt 10-10 10.8 Environmental Management Cost estimate 10-13 10.9 Item Wise Tentative Capital Cost Estimate for Environment Management 10-14 11.1 Manufacturing Capacity 11-2 11.2 List of Utilities 11-2 11.3 Total Water Balance 11-3 11.4 Total Effluent Generated and Mode of Treatment 11-5 13.1 Concerns Raised in Public Hearing and Responses 13-2 13.2 Response to Public Representations 13-7
Dashrath Prasad Fertilizers Pvt. Ltd. Contents
List of Figures
S.No Description Page. No. 1.1 Location of M/s. Dashrath Prasad Fertilizers Pvt. Ltd. 1-4 1.2 Plant Layout of M/s. Dashrath Prasad Fertilizers Pvt. Ltd. 1-5 2.1 Schematic Diagram of Single Super Phosphate Manufacturing 2-3 2.2 Schematic Diagram of 5 Stage Scrubbing System 2-7 3.1 M/s. Dashrath Prasad Fertilizers Pvt. Ltd. - Site Photographs 3-2 3.2 Base map of the study area 3-3 3.3 Geological map of the study area 3-5 3.4 Hydrogeological Map of the study area 3-7 3.5 Land use and land cover map of the study area 3-9 3.6 Soil Sampling Locations 3-10 3.7 Drainage Pattern of the Study area 3-16 3.8 Water Sampling Locations 3-17 3.9 Wind Rose Diagram at Site 3-24
3.10 Ambient Air Quality Monitoring Locations 3-28 3.11 Graphs Showing the Results of Ambient Air Quality 3-30 3.12 Noise Sampling Locations 3-32 3.13 Peak Hour Traffic 3-34 3.14 Population Distribution of the Study Area 3-36 3.15 Literacy of Study Area 3-37 3.16 Employment – Study Area 3-39 3.17 Habit Wise no. of Species found in the Impact Area 3-50 3.18 Ecosystem Wise no. of Species found in the Impact Area 3-51
4.1 Impacts Network For Air Environment 4-2 4.2 Impacts Network For Noise Environment 4-3 4.3 Identification of Likely Impacts For Waste Water 4-4 4.4 Impacts Network For Land Environment 4-5 4.5 Impacts Network For Soil Micro Flora Fauna 4-6 4.6 Impact Network For Socio-Economic And Cultural Environment 4-7 4.7 Isopleths Showing 24 Hourly GLC’s of SPM 4-16 4.8 Isopleths Showing 24 Hourly GLC’s of PM10 4-17 4.9 Isopleths Showing 24 Hourly GLC’s of PM2.5 4-18
4.10 Isopleths Showing 24 Hourly GLC’s of SO2 4-19 4.11 Isopleths Showing 24 Hourly GLC’s of NOX 4-20 4.12 Isopleths Showing 24 Hourly GLC’s of HF 4-21
7.1 Plant Layout of M/s. Dashrath Prasad Fertilizers Pvt. Ltd. 7-4 7.2 Spill Pool Evaporation Puddle – 500 MT Storage Tank 7-8
10.1 Schematic Diagram of 5 Stage Scrubbing System 10-5 10.2 Green Belt of M/s. Dashrath Prasad Fertilizers Pvt. Ltd. 10-11
Dashrath Prasad Fertilizers Pvt. Ltd. Environmental Impact Assessment Report
Team Labs and consultants 1-1
1.0 INTRODUCTION
1.0 Introduction of the Project (Terms of Reference No. 2(iii))
Fertilizers are generally defined as “any material, organic or inorganic, one or more of
chemical elements required for plant growth”. Fertilizers have played a vital role
insuccess of India’s green revolution and consequently self-reliance in food grains
production. The increase in fertilizer consumption has contributed significantly to
sustainable production of food grains in the country.
Single superphosphate (SSP) was the first commercial mineral fertilizer and it led to the
development of the modern plant nutrient industry. This material was once the most
commonly used fertilizer, but other phosphorus (P) fertilizers have largely replaced
SSP because of its relatively low P content.
Dashrath Prasad Fertilizers Pvt. Ltd. proposes to include Single Super Phosphate (SSP)
manufacturing facility in permitted/consented NPK Fertilizers (by mixing only) unit in
an area of 12.6 acres located at Sy. No. 274/1, 274/2, 276/A2, 277/A1, Tekulapalli
Village, Penuballi Mandal, Khammam District, Telangana. The capital cost of the
project is Rs. 5.5 crores. Prior environmental clearance is mandated by Ministry of
Environment, Forest and Climate Change (MoEFCC), vide SO 1533, dated September
14, 2006, for Chemical Fertilizers manufacturing activity. The project sought terms of
reference for preparation of EIA report during March 2017. The terms of reference for
the environmental impact assessment studies was obtained from TS SEIAA vide letter
no. Lr. No. SEIAA/TS/OL/YDR-01/2017-707 dated 18.05.2017 and the public hearing
was conducted on 22.02.2018 as part of environmental clearance process.
Dashrath Prasad Fertilizers Pvt. Ltd., is conscious of its responsibility towards the
society in minimizing pollution load due to the proposed inclusion of manufacturing
unit and accordingly decided to carry out the Environmental Impact Assessment to
identify the negative and positive impacts and to delineate effective measures to
control the pollution and to mitigate the environmental pollution. Dashrath Prasad
Fertilizers Pvt. Ltd., appointed Team Labs and Consultants for the preparation of
Environmental Impact Assessment report.
Dashrath Prasad Fertilizers Pvt. Ltd. Environmental Impact Assessment Report
Team Labs and consultants 1-2
Immediately after the receipt of the work order for the preparation of EIA report, the
collection of primary (field data) and secondary (data available with various state and
central government agencies) data has begun. Reconnaissance survey of the region
was carried out during of February 2017, and various sampling locations to monitor
environmental parameters have been identified. Subsequently, monitoring has
commenced for collection of data on meteorology, ambient air quality, surface and
ground water quality, soil characteristics, noise levels flora and fauna at the specified
locations during March 2017 to June 2017. The other studies such as socio-economic
profile, land use pattern etc are based on secondary data collected from various
Government agencies and validated through the primary surveys. The Ambient air
monitoring locations have been selected based on the initial Air dispersion Modeling
carried out by using the meteorological data generated at India Meteorological
Department (IMD).
Field team of M/s. Team Labs and Consultants worked in the study area during March
2017 to June 2017, and base line data for various environmental components i.e., air,
water, soil, noise and flora and fauna and socio economic status of people was collected
in a circular area of 10 km radius by taking the industry site as the center point, to
assess the existing environmental status as per the guidelines specified by Ministry of
Environment, Forest and Climate Change (MoEF&CC), Government of India. This
report presents the results of environmental impact assessment study along with the
environmental management plan, necessary to avoid or mitigate the observed
environmental impacts of the proposed inclusion of Single Super Phosphate
manufacturing unit.
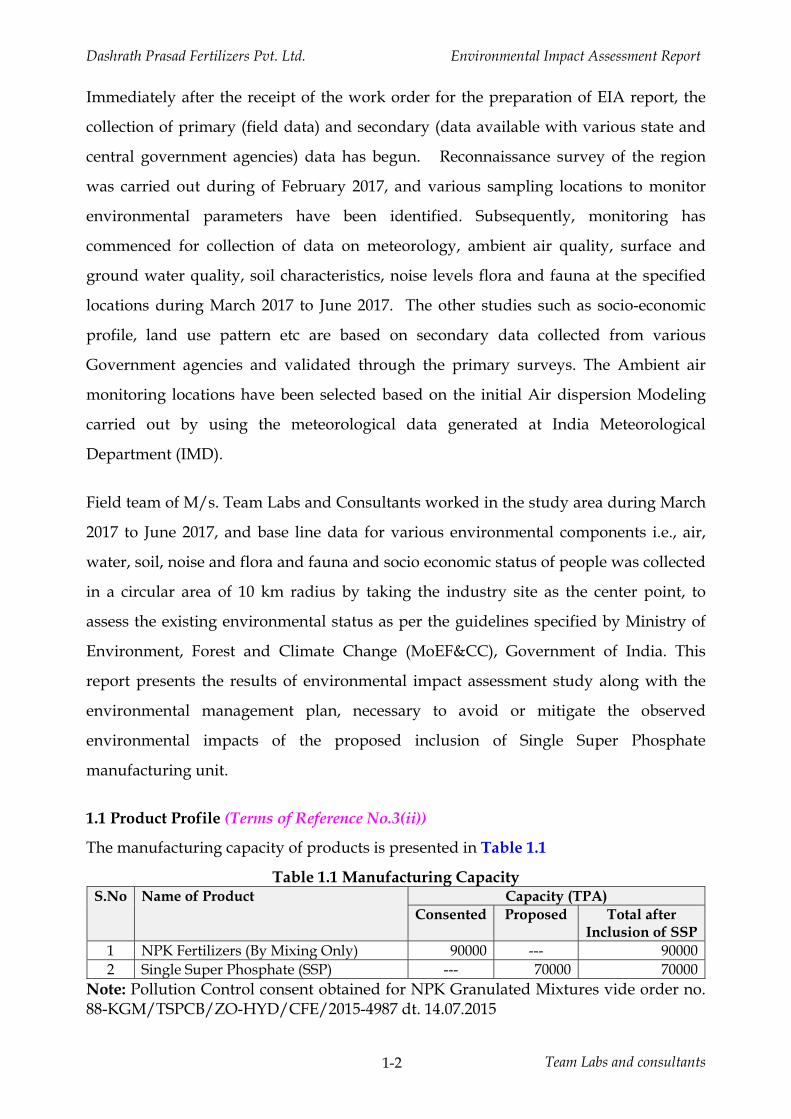
1.1 Product Profile (Terms of Reference No.3(ii))
The manufacturing capacity of products is presented in Table 1.1
Table 1.1 Manufacturing Capacity S.No Name of Product Capacity (TPA)
Consented Proposed Total after Inclusion of SSP
1 NPK Fertilizers (By Mixing Only) 90000 --- 90000 2 Single Super Phosphate (SSP) --- 70000 70000
Note: Pollution Control consent obtained for NPK Granulated Mixtures vide order no. 88-KGM/TSPCB/ZO-HYD/CFE/2015-4987 dt. 14.07.2015
Dashrath Prasad Fertilizers Pvt. Ltd. Environmental Impact Assessment Report
Team Labs and consultants 1-3
1.2 Technology The S.S.P is produced by reacting 75 % Sulphuric acid with ground Rock
phosphate powder followed by drying, granulating and packing.
1.3 Plant Location & Layout
The plant site is located at Survey No. 274/1, 274/2, 276/A2, 277/A1, Tekulapalli
Village, Penuballi Mandal, Khammam District, Telangana spread over an area of 12.6
acres. The site is located at the intersection of 170 11’ 53” (N) latitude and 800 36’ 29”
(E) longitude. The site elevation above mean sea level (MSL) is in the range of 112-115
m. The plant site is surrounded by open agricultural lands in all directions except
north, State Highway-42 (Khamma – Sathupally) in North direction. The nearest
habitation from the site is Tekulapalli village located at a distance of 1.2 km in east
direction. The main approach road is State Highway 42 connecting Khammam
andSathupally at a distance of 0.1 km in north direction. The nearest Town Tiruvuru is
at a distance of 8.2 km in southeast direction. The nearest Railway station is
Bhadrachalam Road at a distance of 40 km in northeast direction and nearest airport is
Vijayawada International Airport (Gannavaram) located at a distance of 130 km in
southeast direction. Nagarjuna sagar Main Branch Canal is flowing from northwest to
southeast direction at a distance of 2.5 km in north direction. Madhira Branch canal is at
a distance of 6.2 km in west direction. Kannegiri RF is at a distance of 7.2 km in north
direction. Inter state boundary of Andhra Pradesh – Telangana is at a distance of 5.9 km
in southwest direction. There is no National Park, Wildlife sanctuary, ecologically
sensitive area within the impact area of 10 km. Location map and site layout is as
shown in Fig 1.1 and Fig 1.2.
Dashrath Prasad Fertilizers Pvt. Ltd. Environmental Impact Assessment Report
Team Labs and consultants 1-4
Fig 1.1 Location of M/s. Dashrath Prasad Fertilizers Pvt. Ltd. (Terms of Reference No.4(ii))
Dashrath Prasad Fertilizers Pvt. Ltd. Environmental Impact Assessment Report
Team Labs and consultants 1-5
Fig 1.2 Plant Layout of M/s. Dashrath Prasad Fertilizers Pvt. Ltd.
(Terms of Reference No.4(vi) & (viii))
---
PLANT LAYOUTTITLE:
DRAWN BY: NNC
RAW MATERIAL SHED
Admin office
DWG No:
Toilets
Stores
Dashrath Fertilizers Pvt. Ltd.
FINISHED MATERIAL SHED
GATE
RAW MATERIAL SHED
FINISHED MATERIAL SHED
PROJECT:
DATE: 05-04-20171
Existing Unit
SCALE: 1 :1000
Proposed Unit
MAIN ROAD
1
SHEET No:
Dashrath Prasad Fertilizers Pvt. Ltd. Environmental Impact Assessment Report
Team Labs and consultants 1-6
1.4 Scope of EIA Studies
EIA study involves three basic components, viz. identification, prediction and
evaluation of impacts. The scope of EIA study incorporating the Terms of reference
(TOR) obtained from the SEIAA, Telangana is as follows:
• An intensive reconnaissance and preliminary collection of environmental
information to plan field study.
• Field studies to collect preliminary information, particularly on the quality of
the physical environment. Experienced scientists and engineers will collect the
data.
• Base line data generation and characterization of air, water, soil, noise and
vegetation in the ten kilometer radius area (impact zone) over a period of Three
months.
• A thorough study of the process including provisions for pollution control, and
environmental management that includes prediction of impacts and relevant
mathematical modeling.
• Preparation of Environmental Monitoring Program.
• Preparation of Environmental Management Plan suggesting suitable methods
for mitigating and controlling the pollution levels. Environmental Monitoring
Plan is suggested for monitoring the pollution loads at various facilities in the
premises and to ensure compliance with the statutory requirements.
Dashrath Prasad Fertilizers Pvt. Ltd. Environmental Impact Assessment Report
2-1 Team Labs and Consultants
2.0 PROCESS DESCRIPTION AND POLLUTION CONTROL FACILITIES
M/s. Dashrath Prasad Fertilizers Pvt. Ltd. proposes to include Single Super Phosphate
manufacturing facility in permitted/consented NPK Fertilizers (by mixing only) unit in an
area of 12.6 acres located at Sy. No. 274/1, 274/2, 276/A2, 277/A1, Tekulapalli Village,
Penuballi Mandal, Khammam District, Telangana. The manufacturing capacity of products
is presented in Table 2.1.
Table 2.1 Manufacturing Capacity S.No Name of Product Capacity (TPA)
Consented Proposed Total after Inclusion of SSP
1 NPK Fertilizers (By Mixing Only) 90000 --- 90000 2 Single Super Phosphate (SSP) --- 70000 70000
Note: Pollution Control consent obtained for NPK Granulated Mixtures vide order no. 88-KGM/TSPCB/ZO-HYD/CFE/2015-4987 dt. 14.07.2015
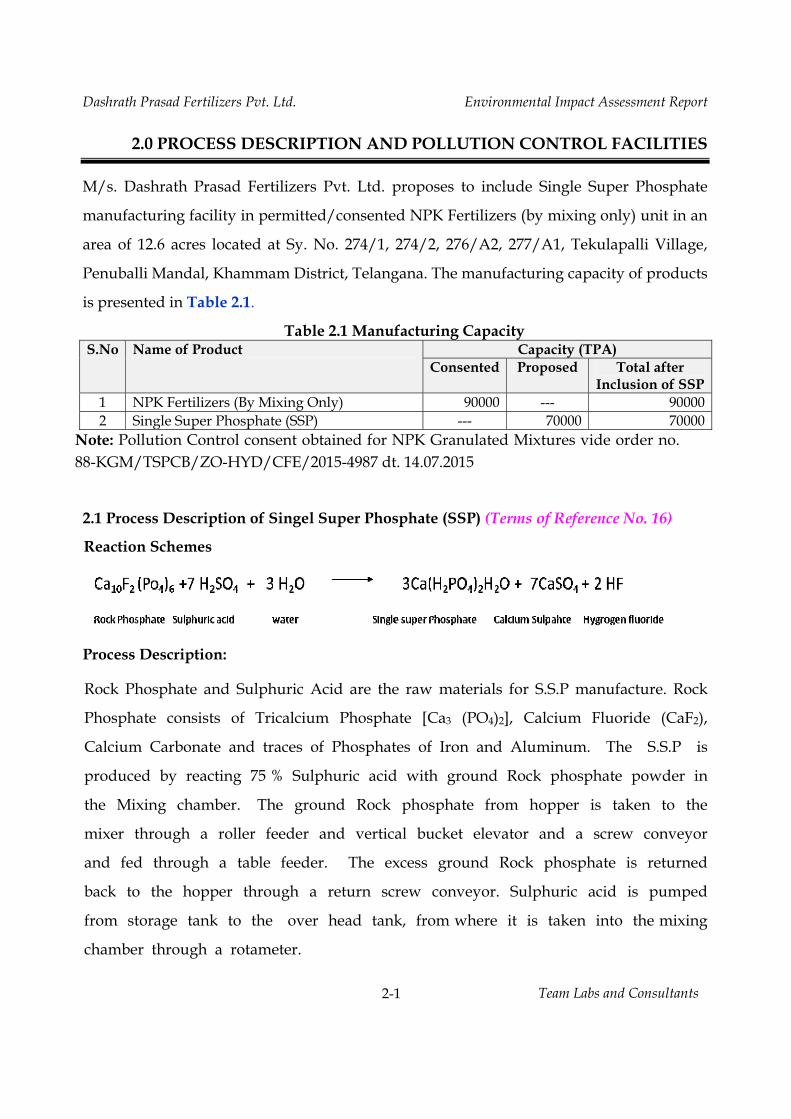
2.1 Process Description of Singel Super Phosphate (SSP) (Terms of Reference No. 16)
Reaction Schemes
Process Description:
Rock Phosphate and Sulphuric Acid are the raw materials for S.S.P manufacture. Rock
Phosphate consists of Tricalcium Phosphate [Ca3 (PO4)2], Calcium Fluoride (CaF2),
Calcium Carbonate and traces of Phosphates of Iron and Aluminum. The S.S.P is
produced by reacting 75 % Sulphuric acid with ground Rock phosphate powder in
the Mixing chamber. The ground Rock phosphate from hopper is taken to the
mixer through a roller feeder and vertical bucket elevator and a screw conveyor
and fed through a table feeder. The excess ground Rock phosphate is returned
back to the hopper through a return screw conveyor. Sulphuric acid is pumped
from storage tank to the over head tank, from where it is taken into the mixing
chamber through a rotameter.
Dashrath Prasad Fertilizers Pvt. Ltd. Environmental Impact Assessment Report
2-2 Team Labs and Consultants
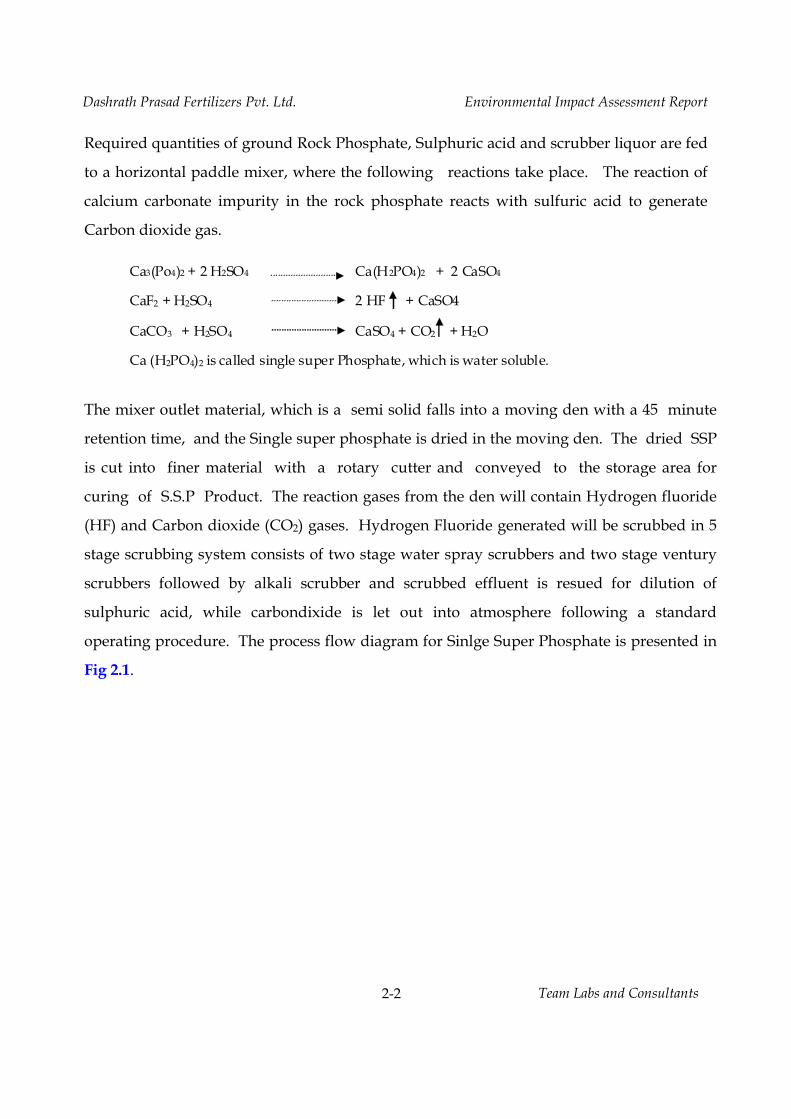
Required quantities of ground Rock Phosphate, Sulphuric acid and scrubber liquor are fed
to a horizontal paddle mixer, where the following reactions take place. The reaction of
calcium carbonate impurity in the rock phosphate reacts with sulfuric acid to generate
Carbon dioxide gas.
The mixer outlet material, which is a semi solid falls into a moving den with a 45 minute
retention time, and the Single super phosphate is dried in the moving den. The dried SSP
is cut into finer material with a rotary cutter and conveyed to the storage area for
curing of S.S.P Product. The reaction gases from the den will contain Hydrogen fluoride
(HF) and Carbon dioxide (CO2) gases. Hydrogen Fluoride generated will be scrubbed in 5
stage scrubbing system consists of two stage water spray scrubbers and two stage ventury
scrubbers followed by alkali scrubber and scrubbed effluent is resued for dilution of
sulphuric acid, while carbondixide is let out into atmosphere following a standard
operating procedure. The process flow diagram for Sinlge Super Phosphate is presented in
Fig 2.1.
Ca3(Po4)2 + 2 H2SO4 Ca(H2PO4)2 + 2 CaSO4
CaF2 + H2SO4 2 HF + CaSO4
CaCO3 + H2SO4 CaSO4 + CO2 + H2O
Ca (H2PO4)2 is called single super Phosphate, which is water soluble.

Dashrath Prasad Fertilizers Pvt. Ltd. Environmental Impact Assessment Report
2-3 Team Labs and Consultants
Fig
2.1
Sche
mat
ic D
iagr
am o
f Sin
gle
Supe
r Pho
spha
te M
anuf
actu
ring
MIX
ER
WEI
GH
ING
FEE
DER
RO
TO M
ETER
SSP
godo
wn
OV
ER S
IZE
MA
TER
IAL
ELEV
ETO
R
C.R
HO
PPER
PRO
CES
S FL
OW
DIA
GR
AM
OF
SIN
GLE
SUPE
R P
HO
SPH
ATE
MA
NU
FAC
TUR
ING
AC
ID P
UM
P
WA
TER
TA
NK
MIL
L FA
N
DEN
WA
TER
PU
MP
BA
LL M
ILL
5 St
age
SCR
UB
BIN
G
SYST
EM
SCR
EEN
OR
CLA
SSIF
IER
AC
ID T
AN
K
GR
HO
PPER
MIX
ED F
EED
SC
REW
CO
NV
EYO
R
AC
ID S
TOR
AG
E TA
NK
RP
DEN
SCR
EW
CO
NV
EYO
R
DU
ST C
HA
MBE
R
Dashrath Prasad Fertilizers Pvt. Ltd. Environmental Impact Assessment Report
2-4 Team Labs and Consultants
2.2 Utilities
It is proposed to establish 1 x 250 kVA DG set in addition to existing 320 kVA DG set to
cater the power requirement during load shutdown period. The list of utilities is presented
in Table 2.2.
Table 2.2 List of Utilities S.No Description Capacity (TPA)
Consented Proposed Total after Inclusion of SSP
1 DG Set (kVA)* 1 x 320 1 x 250 1 x 320 and 1 x 250 * DG sets will be used during load shut down periods only. 2.3 Water Requirement (Terms of Reference No.3 (vii))
Water is mainly used for scrubbers, domestic usage and gardening. The total water
requirement after inclusion of Singel Super Phosphate shall be 42.5 KLD. The required
water shall be drawn from ground water. The water balance for daily consumption is
presented in Table 2.3.
Table 2.3 Total Water Balance Purpose INPUT (KLD) OUTPUT (KLD)
Loss Effluent Consented
Process 2.5 2.5* Domestic 3 0.6 2.4 Total - I 5.5 3.1 2.4
Proposed Scrubber 30 30** Domestic 2 0.4 1.6 Water for gardening 5 5 Total - II 37 5.4 31.6 Grand Total (I + II) 42.5 8.5 34 * 2.5 KL of the losses mentioned in the consented products is part of the product. ** 30 KL of the effluent from scrubber is reused for acid dilution.
2.4 Pollution Control Facilities:
Wastewater from domestic usage, air emissions from process and standby DG sets and
solid wastes are the major pollutants from the process operations of SSP manufacturing
activity. The pollution control measures proposed to treat/mitigate the emissions and
effluents are described as follows.
Dashrath Prasad Fertilizers Pvt. Ltd. Environmental Impact Assessment Report
2-5 Team Labs and Consultants
2.4.1 Water Pollution:
No wastewater is generated from SSP manufacturing process. Wastewater from scrubbing
will be reued for dilution of concentrated sulphuric acid. The domestic wastewater is sent to
septic tank followed by soak pit. The wastewater generated and mode of treatment is
presented in Table 2.4.
Table 2.4 Total Effluent Generated and Mode of Treatment Description Quantity (KLD) Mode of Treatment
Consented Propsoed Total after Inclusion of SSP
Scrubber Effluent 30 30 Reused for dilution of sulphuric acid
Domestic Wastewater 2.4 1.6 4 Sent to Septic tank followed by soak pit.
Total 2.4 31.6 34
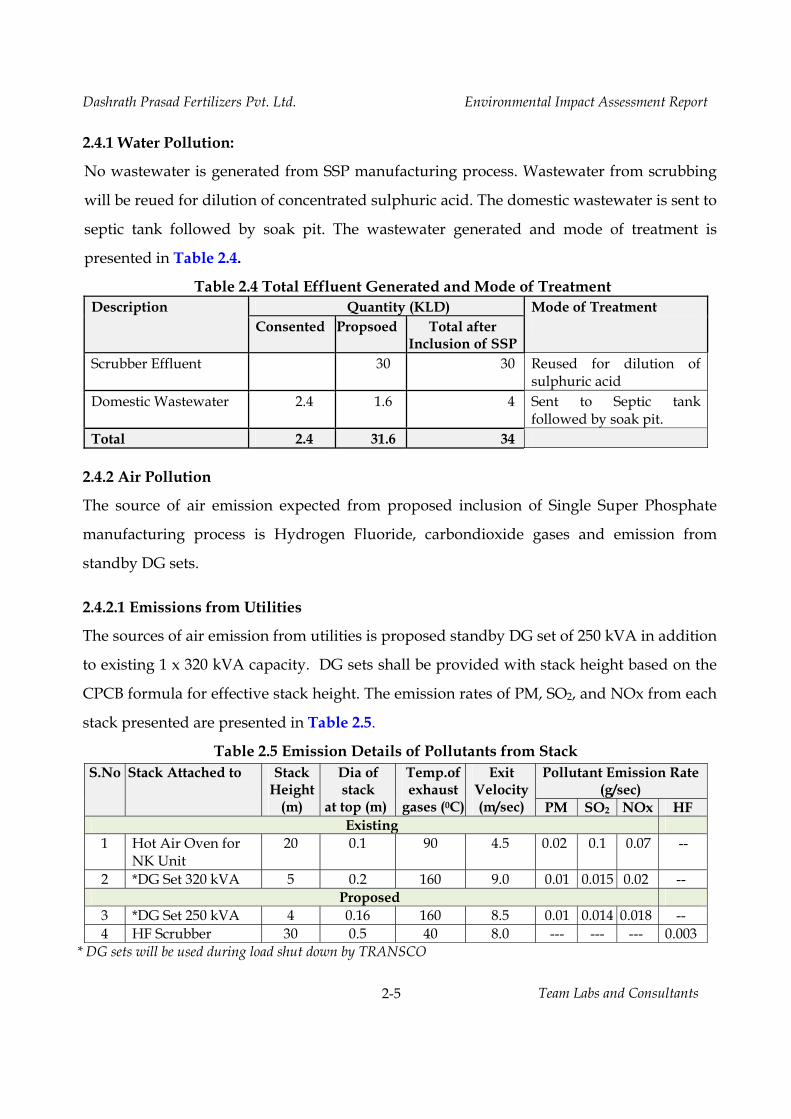
2.4.2 Air Pollution
The source of air emission expected from proposed inclusion of Single Super Phosphate
manufacturing process is Hydrogen Fluoride, carbondioxide gases and emission from
standby DG sets.
2.4.2.1 Emissions from Utilities
The sources of air emission from utilities is proposed standby DG set of 250 kVA in addition
to existing 1 x 320 kVA capacity. DG sets shall be provided with stack height based on the
CPCB formula for effective stack height. The emission rates of PM, SO2, and NOx from each
stack presented are presented in Table 2.5.
Table 2.5 Emission Details of Pollutants from Stack S.No Stack Attached to Stack
Height (m)
Dia of stack
at top (m)
Temp.of exhaust
gases (0C)
Exit Velocity (m/sec)
Pollutant Emission Rate (g/sec)
PM SO2 NOx HF Existing
1 Hot Air Oven for NK Unit
20 0.1 90 4.5 0.02 0.1 0.07 --
2 *DG Set 320 kVA 5 0.2 160 9.0 0.01 0.015 0.02 -- Proposed
3 *DG Set 250 kVA 4 0.16 160 8.5 0.01 0.014 0.018 -- 4 HF Scrubber 30 0.5 40 8.0 --- --- --- 0.003
* DG sets will be used during load shut down by TRANSCO
Dashrath Prasad Fertilizers Pvt. Ltd. Environmental Impact Assessment Report
2-6 Team Labs and Consultants
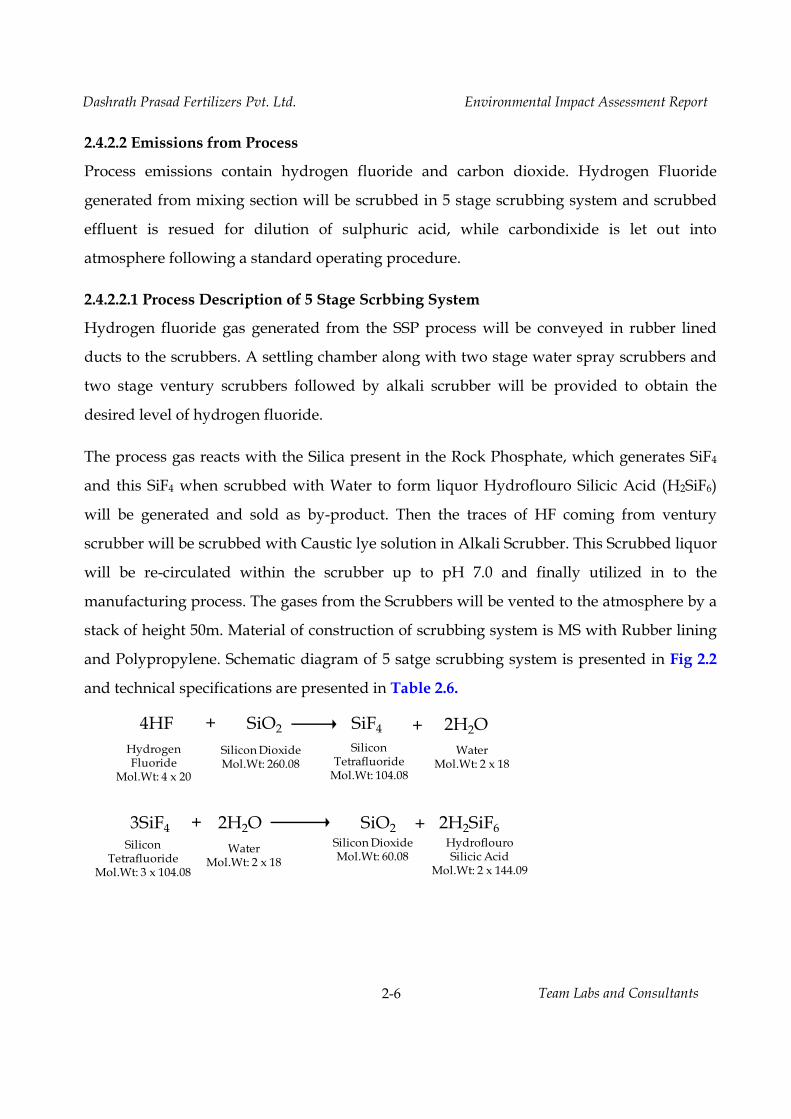
2.4.2.2 Emissions from Process
Process emissions contain hydrogen fluoride and carbon dioxide. Hydrogen Fluoride
generated from mixing section will be scrubbed in 5 stage scrubbing system and scrubbed
effluent is resued for dilution of sulphuric acid, while carbondixide is let out into
atmosphere following a standard operating procedure.
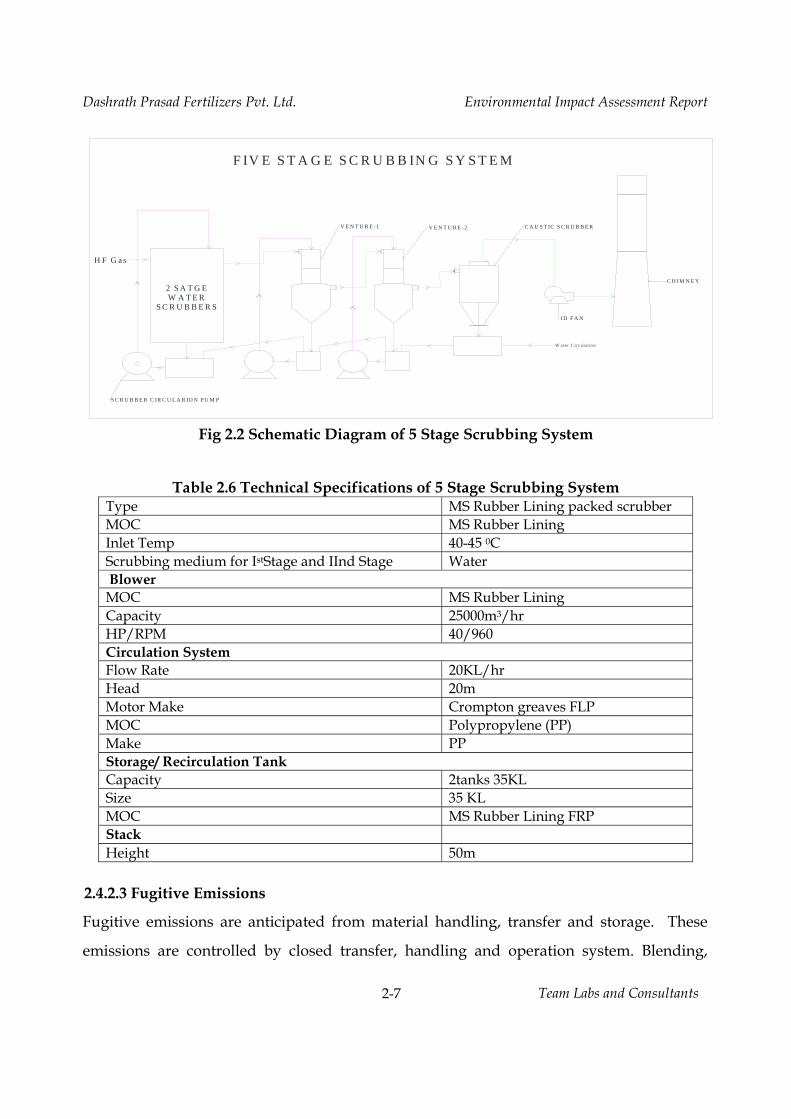
2.4.2.2.1 Process Description of 5 Stage Scrbbing System
Hydrogen fluoride gas generated from the SSP process will be conveyed in rubber lined
ducts to the scrubbers. A settling chamber along with two stage water spray scrubbers and
two stage ventury scrubbers followed by alkali scrubber will be provided to obtain the
desired level of hydrogen fluoride.
The process gas reacts with the Silica present in the Rock Phosphate, which generates SiF4
and this SiF4 when scrubbed with Water to form liquor Hydroflouro Silicic Acid (H2SiF6)
will be generated and sold as by-product. Then the traces of HF coming from ventury
scrubber will be scrubbed with Caustic lye solution in Alkali Scrubber. This Scrubbed liquor
will be re-circulated within the scrubber up to pH 7.0 and finally utilized in to the
manufacturing process. The gases from the Scrubbers will be vented to the atmosphere by a
stack of height 50m. Material of construction of scrubbing system is MS with Rubber lining
and Polypropylene. Schematic diagram of 5 satge scrubbing system is presented in Fig 2.2
and technical specifications are presented in Table 2.6.
4HF + SiO2 SiF4 + 2H2O
3SiF4 + 2H2O SiO2 + 2H2SiF6Hydroflouro Silicic Acid
Mol.Wt: 2 x 144.09
Silicon DioxideMol.Wt: 60.08
Silicon Tetrafluoride
Mol.Wt: 3 x 104.08
WaterMol.Wt: 2 x 18
Silicon Tetrafluoride
Mol.Wt: 104.08
WaterMol.Wt: 2 x 18
Silicon DioxideMol.Wt: 260.08
Hydrogen Fluoride
Mol.Wt: 4 x 20
Dashrath Prasad Fertilizers Pvt. Ltd. Environmental Impact Assessment Report
2-7 Team Labs and Consultants
Fig 2.2 Schematic Diagram of 5 Stage Scrubbing System
Table 2.6 Technical Specifications of 5 Stage Scrubbing System
Type MS Rubber Lining packed scrubber MOC MS Rubber Lining Inlet Temp 40-45 0C Scrubbing medium for IstStage and IInd Stage Water Blower MOC MS Rubber Lining Capacity 25000m3/hr HP/RPM 40/960 Circulation System Flow Rate 20KL/hr Head 20m Motor Make Crompton greaves FLP MOC Polypropylene (PP) Make PP Storage/ Recirculation Tank Capacity 2tanks 35KL Size 35 KL MOC MS Rubber Lining FRP Stack Height 50m
2.4.2.3 Fugitive Emissions
Fugitive emissions are anticipated from material handling, transfer and storage. These
emissions are controlled by closed transfer, handling and operation system. Blending,
W a te r C irc u la tio n
ID F A N
S C R U B B E R C IR C U L A R IO N P U M P
2 S A T G EW A T E R
S C R U B B E R S
F IV E S T A G E S C R U B B IN G S Y S T E M
C H IM N E Y
C A U S T IC S C R U B B E RV E N T U R E -2V E N T U R E -1
H F G as
Dashrath Prasad Fertilizers Pvt. Ltd. Environmental Impact Assessment Report
2-8 Team Labs and Consultants
Grinding is conducted in Hammer mills, while the Granulation would be conducted in
Pulverizer followed by Granulation Drum and Classifier. Bag filter will be provided to
collect the dust in granulation section and reused in product mixing. Technical
specifications of Bag filter is presented in Table 2.7.
Table 2.7 Technical Specifications of Bag Filter Description Value Application To Handle Process Dust Volume 34,000 m3/hr Temperature of Gas (0 C) 30-60 No of Bags 110 Bag size Φ x lg in m 0.15 x 3.5 Air to Cloth Ratio(m3/min/m2 ) 1.0 Fabric Non woven Polyester (SL) Weight ( gm/m2 ) 550 Inlet Dust Load 600 gm/m3 Outlet Dust Load < 50 mg/nm3
2.4.4 Solid Waste
No Solid wastes are generated from the process. The utilities i.e., DG sets generate waste
oil and used batteries. The scrubbing of HF gas from process leads to generation of
Hydrofluoro Silicic acid is a reusable product, which can be sold either as a byproduct or
mixed with main product, SSP. The waste oil and used batteries are sold to authorized
recyclers. Ash from boiler is sold to brick manufacturers in the local area. The quantity of
solid waste generated in the plant and the disposal practice is presented in Table 2.8.
Table 2.8 Total Solid Waste Generated and Mode of Disposal S.
No Description Units Consented Proposed Total after
Inclusion of SSP
Mode of Disposal
1 Ash from Hor Air Oven from NPK Unit
TPD 1.5 1.5 Sold to Brick manufactures
2 Waste oil LPA 150 130 280 Sent to Authorized Recyclers
3 Used batteries No.s/year
6 6
4 Hydroflouro Silicic Acid
TPM 238 238 Sold as by-product
Dashrath Prasad Fertilizers Pvt. Ltd. Environmental Impact Assessment Report
2-9 Team Labs and Consultants
2.4.5 Noise Pollution
Noise is anticipated from manufacturing of SSP are mainly from granulator, dryers and
bucket elevators, screw conveyors, pumps and DG set. The DG set shall be kept in a
separate enclosed room with acoustic enclosure. Closed bucket elevators and screw
conveyors will be used to minimize noise levels. The motors and compressors shall be
provided with guards and shall be mounted adequately to ensure the reduction of noise
and vibration. The employees working in noise generating areas shall be provided with
earmuffs. The employees shall be trained in the mitigation measures and personal
protection measures to be taken to avoid noise related health impacts.
Dashrath Prasad Fertilizers Pvt. Ltd Environmental Impact Assessment Report
3-1 Team Labs and Consultants
CHAPTER 3.0 BASELINE ENVIRONMENTAL STATUS
3.1 Introduction
Collection of base line data is an integral aspect of the preparation of Environmental
Impact Assessment Report. Baseline data reflects the present status of environment
before initiation of any activity of project. The possible effects due to proposed
Dashrath Prasad Fertilizers Pvt. Ltd are estimated and superimposed on the compiled
baseline data subsequently to assess environmental impacts. The study was conducted
in the impact area; 10 km radius area surrounding the project site, during March 05,
2017 – June 04, 2017. Studies were undertaken to generate baseline data of
Micrometeorology, Ambient air quality (AAQ), water quality, noise levels, flora and
fauna, land use, soil quality and socio-economic status of the community were
collected.
3.2 Land Environment
Land and soil constitute basic components of physical environment. The location of an
industrial project may cause changes in land, land use, soil and denudational processes
in different intensities contingent on sptial proximity of the activity and receptors.
Land and soil may be altered within the vicinity of 5 km radius and to a lesser extent
upto 10 km radial distance due to development of the project.
3.2.1 Physiography
The plant site of 12.60 acres is located at Survey No. 274/1, 274/2, 276/A2, 277/A1,
Tekulapalli Village, Penuballi Mandal, Khammam District, Telangana State. The site is
located at the intersection of 170 11’ 53” (N) latitude and 800 36’ 29” (E) longitude. The
site elevation above mean sea level (MSL) is in the range of 112-115 m. The plant site is
surrounded by open agricultural lands in all directions except north, State Highway-42
(Khamma – Sathupally) in North direction. The nearest habitation from the site is
Tekulapalli village located at a distance of 1.2 km in east direction. The main approach
road is State Highway 42 connecting Khammam andSathupally at a distance of 0.1 km
in north direction. The nearest Town Tiruvuru is at a distance of 8.2 km in southeast
direction. The nearest Railway station is Bhadrachalam Road at a distance of 40 km in
northeast direction and nearest airport is Vijayawada International Airport
Dashrath Prasad Fertilizers Pvt. Ltd Environmental Impact Assessment Report
3-2 Team Labs and Consultants
(Gannavaram) located at a distance of 130 km in southeast direction. Nagarjuna sagar
Main Branch Canal is flowing from northwest to southeast direction at a distance of 2.5
km in north direction. Madhira Branch canal is at a distance of 6.2 km in west direction.
Kannegiri RF is at a distance of 7.2 km in north direction. Inter state boundary of
Andhra Pradesh – Telangana is at a distance of 5.9 km in southwest direction. There is
no National Park, Wildlife sanctuary, ecologically sensitive area within the impact area
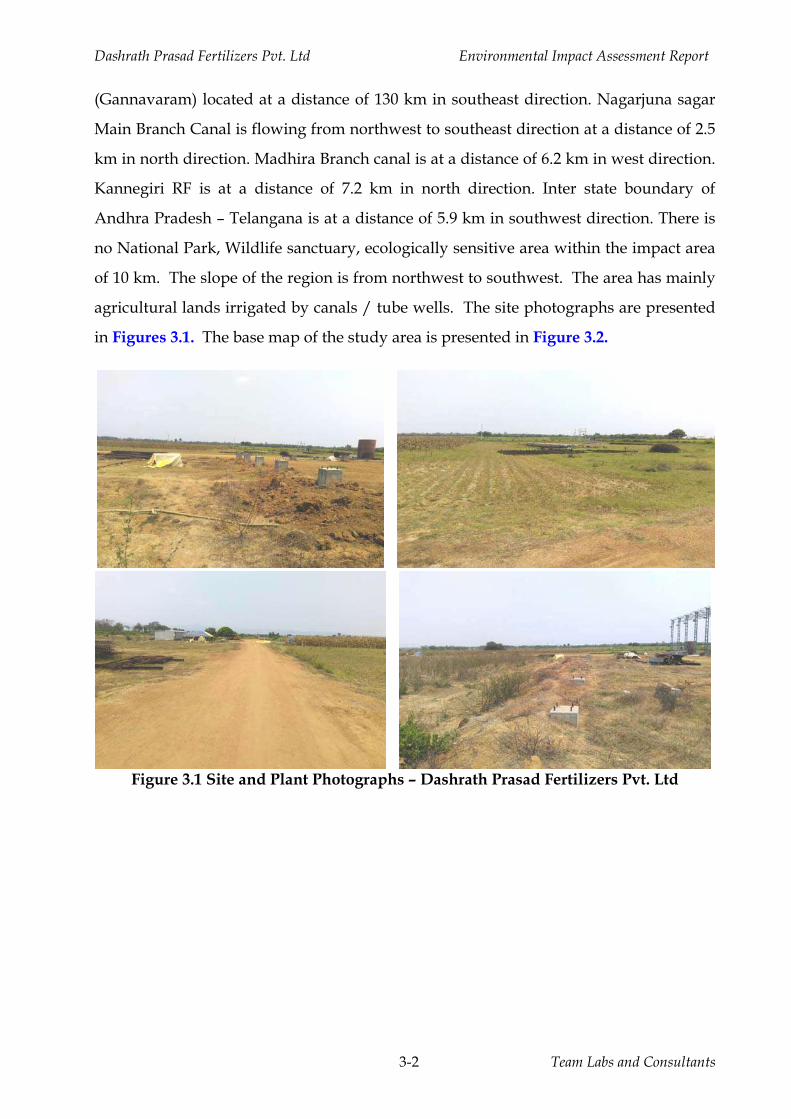
of 10 km. The slope of the region is from northwest to southwest. The area has mainly
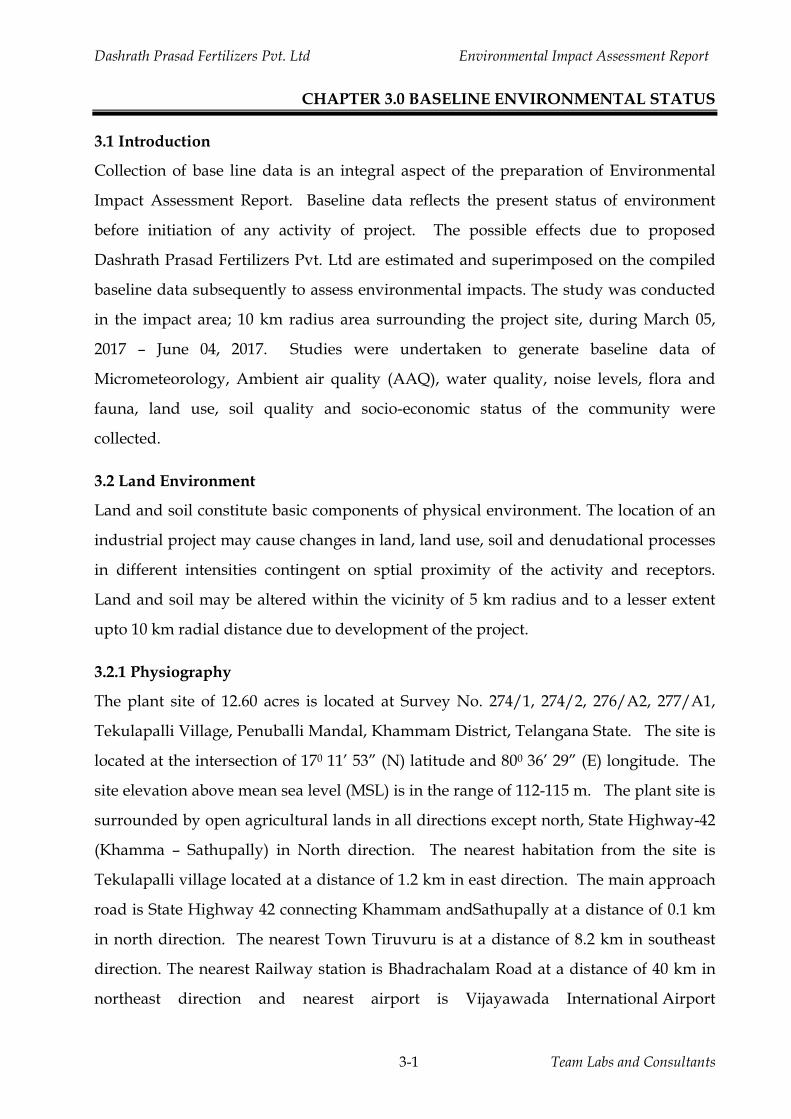
agricultural lands irrigated by canals / tube wells. The site photographs are presented
in Figures 3.1. The base map of the study area is presented in Figure 3.2.
Figure 3.1 Site and Plant Photographs – Dashrath Prasad Fertilizers Pvt. Ltd
Dashrath Prasad Fertilizers Pvt. Ltd Environmental Impact Assessment Report
3-3 Team Labs and Consultants
Figure 3.2 Base map of the study area
Dashrath Prasad Fertilizers Pvt. Ltd Environmental Impact Assessment Report
Team Labs and Consultants 3-4
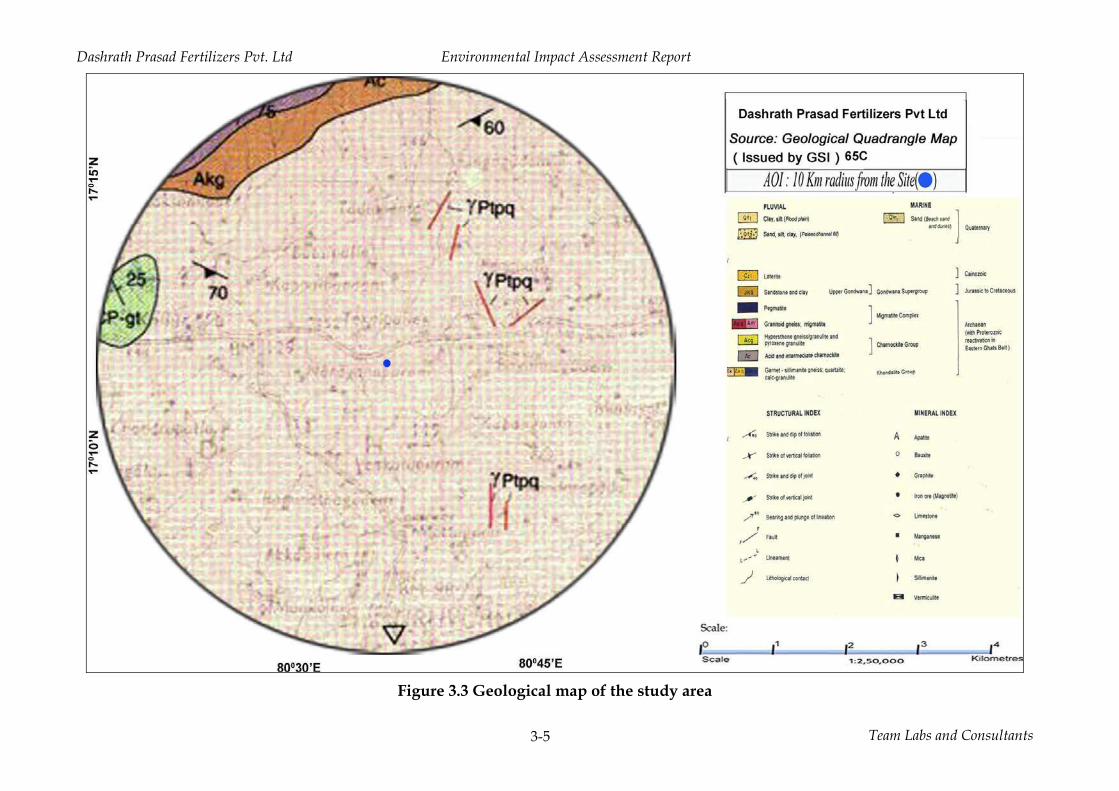
3.2.2 Geology
The study area forms a part of the Indian Peninsular shield, which has remained stable
since the formation of the crust. During the Archean Era, a part of this area was
occupied by two vast geo-synclines which got deposition of sediments in them. Later,
they were subjected to diastrophic movements resulting in folding, faulting and
uplifting and subjected to metamorphism. These gave rise to Khondalite and
dharwarian suit of rocks. These suits of rocks have occupied in the extreme Eastern,
South and central parts of the study area. During the late Archaean Era, igneous
intrusions of alkaline rocks, basic to ultrabasic rocks. The study consists of Pegmaties
and quartz veins. Where argillaceous, calcareous and arenaceious sediments were
deposited which were later subjected to folding, faulting and partly metamorphosed
during subsequent periods.
Archaeans
The Archaean rocks comprises of peninsular gneissic complex, Khondalite suit of rocks,
charnokites, anorthosites, hornblende/biotite chlorite quartz schists, acidic, alkaline,
basic intrusives and veins of quartz and pegmatites. The Charnockites and Pyroxene
granulites occur mostly as bands in the Khondalite suit of rocks and are characterizes
by the presence of minerals such as diopside, hypersthene etc., The Charnockites range
in composition from acidic to basic and ultrabasic. The Dharwars comprises of banded
magnetite quartzite, ferruginous quartzites, quartz – chlorite schists, mica schists,
amphibolites and calc-schists.
Gondwana Super Group
The Gondwana rocks in the area forms a part of Pranhita Godavari basin of fossil
ferrous fluviatile sediments of determine to Jurassic age. The Gondwana Super Group
sediments occurring in the area are divisible into the lower Gondwana Group and the
upper Gondwana Group. The lower Gondwana Group comprises of Talchirs, Barkars
Barren measure and Kamthi formations where as the upper Gondwana Group is
represented by Kota formation. The Talchirs consist of glacioal boulder beds,
sandstones and shales.
Dashrath Prasad Fertilizers Pvt. Ltd Environmental Impact Assessment Report
Team Labs and Consultants 3-5
Figure 3.3 Geological map of the study area
Dashrath Prasad Fertilizers Pvt. Ltd Environmental Impact Assessment Report
Team Labs and Consultants 3-6
3.2.3 Hydrogeology
The hydrogeological conditions generally Based on landform formation, ground water
level variations, recharge, specific yield and ground water potential the
hydrogeomorphic units of the subjected area is delineated. Crystalline formations like
khondolites, charnockites, migmatites and gneisses etc. can be grouped as hard rocks,
while the unconsolidated formations like the alluvial sediments can be classified as soft
rocks. The semi consolidated formations like sandstones are grouped under soft rocks,
though limited in occurrence. The occurrence and movement of groundwater in the
different geological formations of the area Ground water occurs under the water table
conditions in the weathered basalts in the joints and fractures. Thickness of weathering
in traps ranges up to 21 m. In this study area Dug wells and dug-cum bore wells range
in the depth between 4 and 15 m. Generally in well bores from the bottom of the dug
wells pierced through the entire thickness of weathered zone in order to increase the
yield of the wells. The water level in the dug wells ranges from 2 to 12 m. The yield of
dug cum bore wells is around 40 m3/h and capable of pumping continuously 6 hours
per day. The development of ground water is poor in the area underlain by traps. The
depth to water level in them is ranged from 0.5 to 0.9m.
The applied area exists dendritic drainage pattern. Declining trend of 0.2 m/year has
been observed in 42% of monitoring wells and 18 % of the observation wells shows
declining trend of less than 0.2 m/ year. During post monsoon season only 22 % of the
wells are showing declining trend of < 0.2 m/ year. Falling trend of about 0.4m/year
prevail in parts of Kallur and Penuballi mandals in Khammam district, Telangana and
Tiruvuru mandal in Krishna district, Andhra Pradesh pre and post monsoon seasons.
Archaean crystalline formations occupy more than 50% of the study area. Weathered
and fractured granites and gneisses form aquifer system; the depth of weathering varies
between 10 and and fractures extend from 30 to 60m bgl. Beyond 60 m depths the
possibility of encountering fracture zones is rare but not uncommon. Ground water is
generally tapped from shallow weathered zones through large diameter open wells
located in granitic terrain ranging in depth from 5 to 16m with depths to water levels
range from 4 to 15.75m bgl. The average yield of these dug wells range between 10 and
30 KLD. Hydrogeological Map of the study area is presented in Figure 3.4.

Dashrath Prasad Fertilizers Pvt. Ltd Environmental Impact Assessment Report
Team Labs and Consultants 3-7
Figure 3.4 Hydrogeological Map of the study area
Dashrath Prasad Fertilizers Pvt. Ltd Environmental Impact Assessment Report
Team Labs and Consultants 3-8
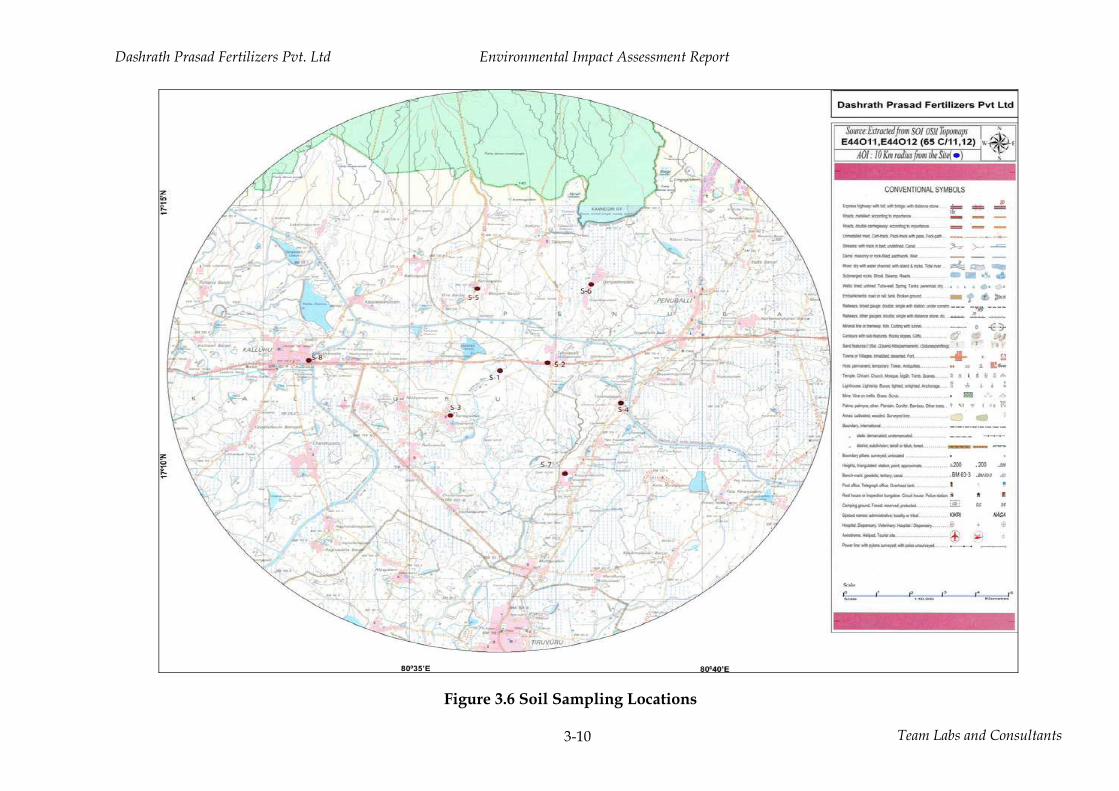
3.2.4 Soils
Soil may be defined as a thin layer of earth’s crust that serves as a natural medium for
the growth of plants. It is the unconsolidated mineral matter that has been subjected to
and influenced by genetic and environmental factors such as parent materials, climate,
organisms and physico-chemical action of wind, water and sunlight, all acting over a
period of time. Soil differs from the parent materials in the morphological, physical,
chemical and biological properties. Also soil differs among them in some or all the
genetic or environmental factors, therefore, some soils are yellow, some are black, and
some are coarse textured. They serve as a reservoir of nutrients for plants and crop and
also provide mechanical anchorage and favorable tilth.
The Soil characteristics include both physical and chemical parameters. M/s. Team
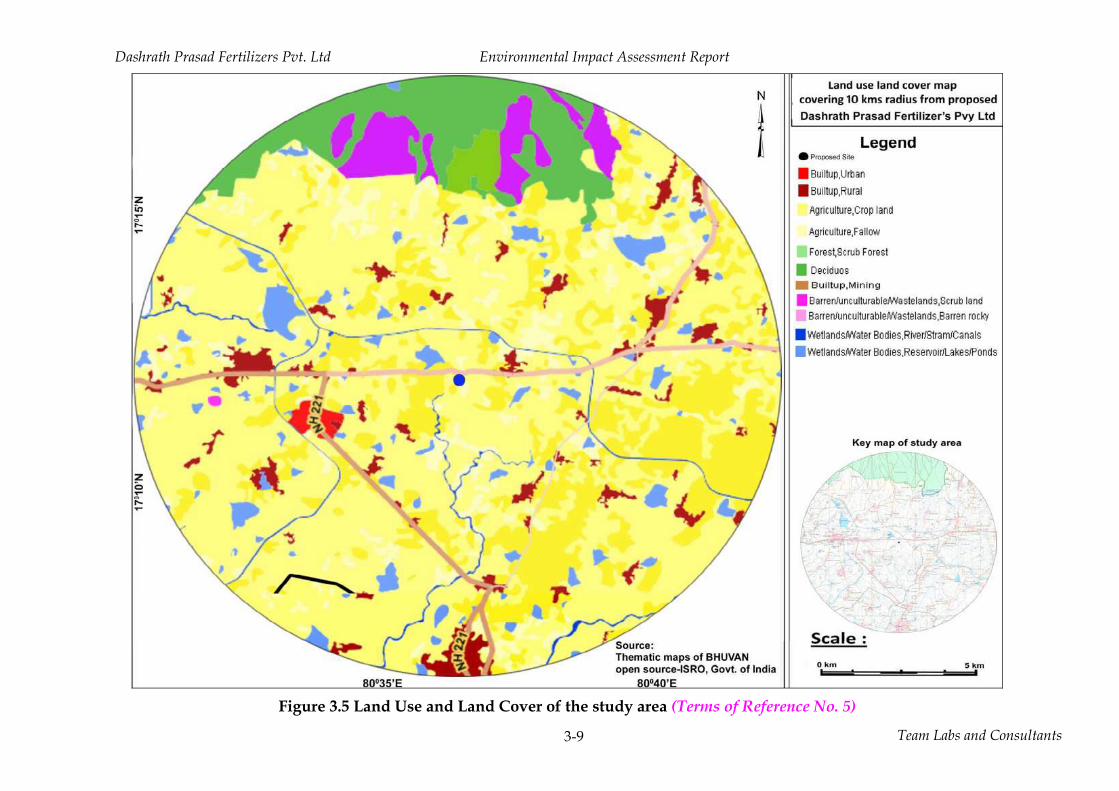
Labs and Consultants field team carried out soil survey to assess the soil characteristics
of the study area. The land use and land cover map of the study are shown in Figure
3.5. It may be noted that the land use land cover map reflects predominantly
agricultural lands. The impact area also has a significant percentage of agriculture
nature of the impact area, and also its dependence on tank for irrigation.
Representative soil sampling was done at various locations and these locations are
shown in Figure 3.6. Analytical data of soil samples is presented in Table 3.1.
Dashrath Prasad Fertilizers Pvt. Ltd Environmental Impact Assessment Report
Team Labs and Consultants 3-9
Figure 3.5 Land Use and Land Cover of the study area (Terms of Reference No. 5)
Dashrath Prasad Fertilizers Pvt. Ltd Environmental Impact Assessment Report
Team Labs and Consultants 3-10
Figure 3.6 Soil Sampling Locations
Dashrath Prasad Fertilizers Pvt. Ltd Environmental Impact Assessment Report
Team Labs and Consultants 3-11
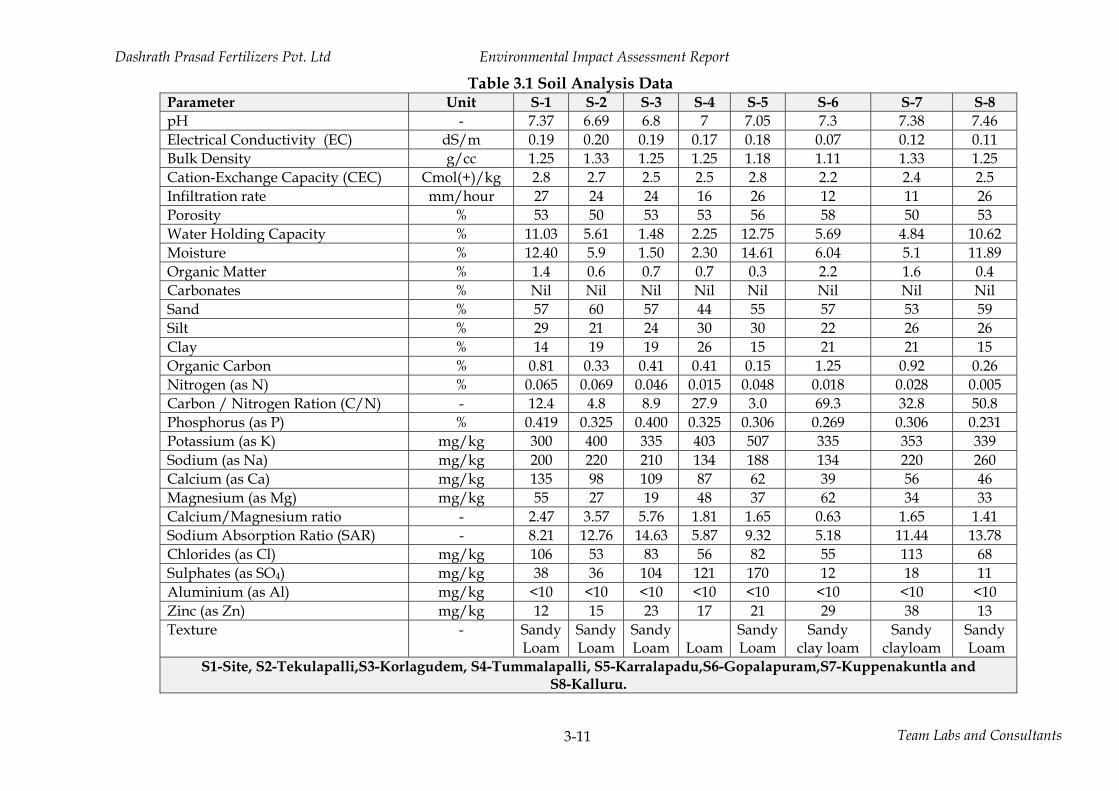
Table 3.1 Soil Analysis Data Parameter Unit S-1 S-2 S-3 S-4 S-5 S-6 S-7 S-8 pH - 7.37 6.69 6.8 7 7.05 7.3 7.38 7.46 Electrical Conductivity (EC) dS/m 0.19 0.20 0.19 0.17 0.18 0.07 0.12 0.11 Bulk Density g/cc 1.25 1.33 1.25 1.25 1.18 1.11 1.33 1.25 Cation-Exchange Capacity (CEC) Cmol(+)/kg 2.8 2.7 2.5 2.5 2.8 2.2 2.4 2.5 Infiltration rate mm/hour 27 24 24 16 26 12 11 26 Porosity % 53 50 53 53 56 58 50 53 Water Holding Capacity % 11.03 5.61 1.48 2.25 12.75 5.69 4.84 10.62 Moisture % 12.40 5.9 1.50 2.30 14.61 6.04 5.1 11.89 Organic Matter % 1.4 0.6 0.7 0.7 0.3 2.2 1.6 0.4 Carbonates % Nil Nil Nil Nil Nil Nil Nil Nil Sand % 57 60 57 44 55 57 53 59 Silt % 29 21 24 30 30 22 26 26 Clay % 14 19 19 26 15 21 21 15 Organic Carbon % 0.81 0.33 0.41 0.41 0.15 1.25 0.92 0.26 Nitrogen (as N) % 0.065 0.069 0.046 0.015 0.048 0.018 0.028 0.005 Carbon / Nitrogen Ration (C/N) - 12.4 4.8 8.9 27.9 3.0 69.3 32.8 50.8 Phosphorus (as P) % 0.419 0.325 0.400 0.325 0.306 0.269 0.306 0.231 Potassium (as K) mg/kg 300 400 335 403 507 335 353 339 Sodium (as Na) mg/kg 200 220 210 134 188 134 220 260 Calcium (as Ca) mg/kg 135 98 109 87 62 39 56 46 Magnesium (as Mg) mg/kg 55 27 19 48 37 62 34 33 Calcium/Magnesium ratio - 2.47 3.57 5.76 1.81 1.65 0.63 1.65 1.41 Sodium Absorption Ratio (SAR) - 8.21 12.76 14.63 5.87 9.32 5.18 11.44 13.78 Chlorides (as Cl) mg/kg 106 53 83 56 82 55 113 68 Sulphates (as SO4) mg/kg 38 36 104 121 170 12 18 11 Aluminium (as Al) mg/kg <10 <10 <10 <10 <10 <10 <10 <10 Zinc (as Zn) mg/kg 12 15 23 17 21 29 38 13 Texture - Sandy
Loam Sandy Loam
Sandy Loam Loam
Sandy Loam
Sandy clay loam
Sandy clayloam
Sandy Loam
S1-Site, S2-Tekulapalli,S3-Korlagudem, S4-Tummalapalli, S5-Karralapadu,S6-Gopalapuram,S7-Kuppenakuntla and S8-Kalluru.
Dashrath Prasad Fertilizers Pvt. Ltd Environmental Impact Assessment Report
Team Labs and Consultants 3-12
The test results of soil samples collected in the impact area are interpreted referring to
the book; “Interpreting soil test results”. The reference tables are presented in Table
3.2. The pH of soil samples ranges from Neutral to mildily alkaline. The cation
exchange capacity of the soils is very low in all samples, contributed mainly by
Potassium exchangeable ions. The level of nitrogen of the soils is Very low to low. The
calcium magnesium ratio of the samples reflects calcium is low to Balanced. Bulk
density of soil of impact varies from 1.18-1.33 g/cc among Sandy Loam (5 samples),
1.11-1.33 g/cc among Sandy clay loam soils. The porosity values range from 50-56 %
among Sandy Loam (5 samples), 50-58 % among Sandy clay loam soils. Soil texture is
predominantly Sandy loam.
Table 3.2 Soil Test Results – Reference Tables General interpretation of pH Measured Rating for Cation Exchange Capacity
pH Range Classification CEC (Cmol)+)/kg <4.5 Extremely Acidic Very low <6 * 4.51 -5.0 Very Strong Acidic Low 6-12 5.1-5.5 Strong Acid Moderate 12-25 5.6- 6.0 Moderately Acid High 25-40 6.1-6.5 Slightly acid Very High >40 6.6-7.3 Neutral Source: Metson (1961)
* Soils with CEC less than three are often low in fertility and susceptible to soil acidification.
7.4-7.8 Mildily Alkaline 7.9 -8.4 Moderately Alkaline 8.5-9.0 Strongly Alkaline >9.0 Very Strongly Alkaline
Source: Bruce and Rayment (1982). Ca/mg Ratio Base Saturation as a Criterion of Leaching
Description Range (%BS) Rating <1 Ca Deficient 70-100 Very Weakly Leached 1-4 Ca (Low) 50-70 Weakly Leached 4-6 Balanced 30-50 Moderately Leached 6-10 Mg (Low) 15-30 Strongly Leached >10 Mg deficient 0-15 Very Strongly Leached Source: Eckert (1987) Source: Metson (1961)
Rating of Total Nitrogen Extractable Potassium (K) Rating (% by W) Description K <0.05 Very low low <150 ppm* (< 0.4 meq/100 g soil) 0.05-0.15 Low medium 150–250 ppm (0.4–0.6 meq/100 g soil) 0.15-0.25 Modium high 250–800 ppm (0.6–2.0 meq/100 g soil) 0.25-0.50 High excessive >800 ppm (>2.0 meq/100 g soil) >0.5 Very High Source: Abbott (1989) Source: Bruce and Rayment (1982)
Dashrath Prasad Fertilizers Pvt. Ltd Environmental Impact Assessment Report
Team Labs and Consultants 3-13
3.3 Water Environment
Industrial development of any region is contingent on the availability of sufficient
water resources, as most of the process industries require water for process or cooling
purposes. The potential for exploitation of ground water resources increases as
development of new projects increases in industrial and agricultural areas. With the
increasing industrialization and urbanization the possibilities of contamination of
surface water and ground water sources are rapidly increasing. The water resources
in the area broadly fall into following categories:
1. Surface Water resources: Streams and ponds, etc. 2. Ground Water resources: Accumulation in deeper strata of ground. 3.3.1 Surface Water Resources
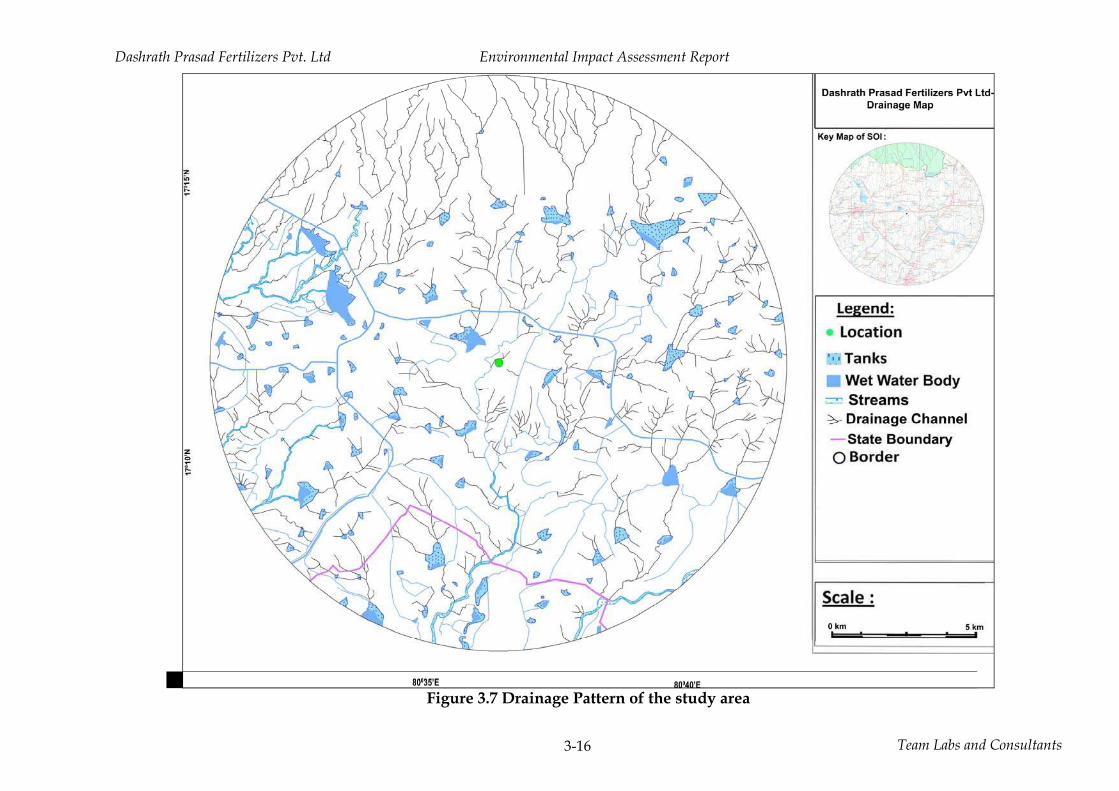
Nagarjunasagar branch canal is flowing from Northwest to southeasr direction at a
distance of 1.5 km in north and southwest direction. There are a few surface water
surface bodies like natural lakes and tanks in the study area. The drainage pattern of
the impact area is dendritic and the flow is mainly into Padamata vagu. The drainage
pattern of the impact area is presented in Figure 3.7.
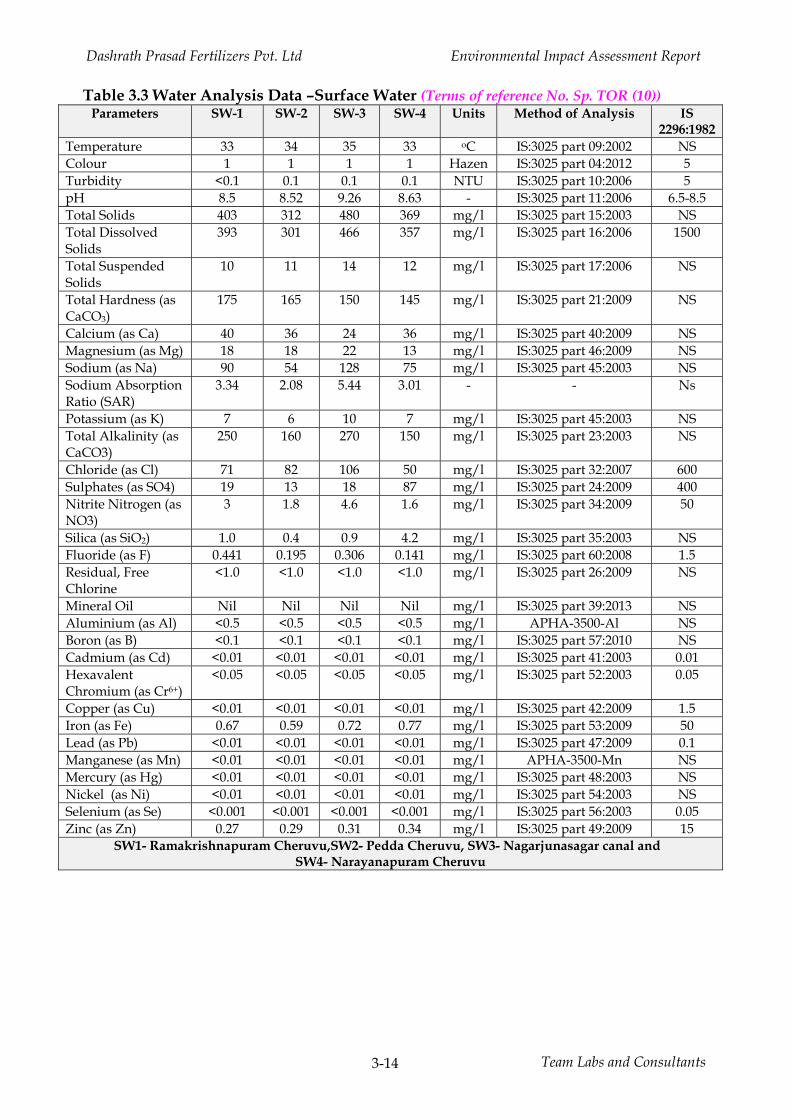
3.3.1.1 Surface Water Quality
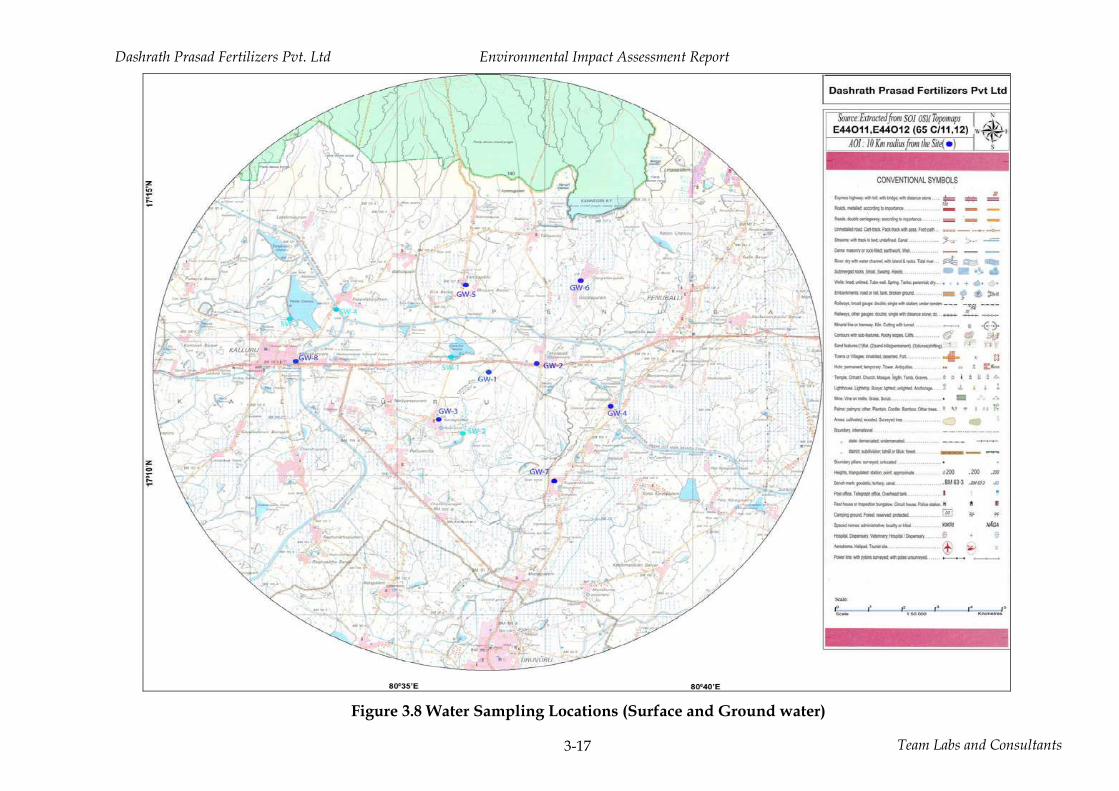
The sampling locations of both ground and surface water are presented in Figure 3.8.
The analytical results of water samples drawn from various locations in the study area
during monitoring are presented in Table 3.3.
Dashrath Prasad Fertilizers Pvt. Ltd Environmental Impact Assessment Report
Team Labs and Consultants 3-14
Table 3.3 Water Analysis Data –Surface Water (Terms of reference No. Sp. TOR (10))Parameters SW-1 SW-2 SW-3 SW-4 Units Method of Analysis IS
2296:1982 Temperature 33 34 35 33 oC IS:3025 part 09:2002 NS Colour 1 1 1 1 Hazen IS:3025 part 04:2012 5 Turbidity <0.1 0.1 0.1 0.1 NTU IS:3025 part 10:2006 5 pH 8.5 8.52 9.26 8.63 - IS:3025 part 11:2006 6.5-8.5 Total Solids 403 312 480 369 mg/l IS:3025 part 15:2003 NS Total Dissolved Solids
393 301 466 357 mg/l IS:3025 part 16:2006 1500
Total Suspended Solids
10 11 14 12 mg/l IS:3025 part 17:2006 NS
Total Hardness (as CaCO3)
175 165 150 145 mg/l IS:3025 part 21:2009 NS
Calcium (as Ca) 40 36 24 36 mg/l IS:3025 part 40:2009 NS Magnesium (as Mg) 18 18 22 13 mg/l IS:3025 part 46:2009 NS Sodium (as Na) 90 54 128 75 mg/l IS:3025 part 45:2003 NS Sodium Absorption Ratio (SAR)
3.34 2.08 5.44 3.01 - - Ns
Potassium (as K) 7 6 10 7 mg/l IS:3025 part 45:2003 NS Total Alkalinity (as CaCO3)
250 160 270 150 mg/l IS:3025 part 23:2003 NS
Chloride (as Cl) 71 82 106 50 mg/l IS:3025 part 32:2007 600 Sulphates (as SO4) 19 13 18 87 mg/l IS:3025 part 24:2009 400 Nitrite Nitrogen (as NO3)
3 1.8 4.6 1.6 mg/l IS:3025 part 34:2009 50
Silica (as SiO2) 1.0 0.4 0.9 4.2 mg/l IS:3025 part 35:2003 NS Fluoride (as F) 0.441 0.195 0.306 0.141 mg/l IS:3025 part 60:2008 1.5 Residual, Free Chlorine
<1.0 <1.0 <1.0 <1.0 mg/l IS:3025 part 26:2009 NS
Mineral Oil Nil Nil Nil Nil mg/l IS:3025 part 39:2013 NS Aluminium (as Al) <0.5 <0.5 <0.5 <0.5 mg/l APHA-3500-Al NS Boron (as B) <0.1 <0.1 <0.1 <0.1 mg/l IS:3025 part 57:2010 NS Cadmium (as Cd) <0.01 <0.01 <0.01 <0.01 mg/l IS:3025 part 41:2003 0.01 Hexavalent Chromium (as Cr6+)
<0.05 <0.05 <0.05 <0.05 mg/l IS:3025 part 52:2003 0.05
Copper (as Cu) <0.01 <0.01 <0.01 <0.01 mg/l IS:3025 part 42:2009 1.5 Iron (as Fe) 0.67 0.59 0.72 0.77 mg/l IS:3025 part 53:2009 50 Lead (as Pb) <0.01 <0.01 <0.01 <0.01 mg/l IS:3025 part 47:2009 0.1 Manganese (as Mn) <0.01 <0.01 <0.01 <0.01 mg/l APHA-3500-Mn NS Mercury (as Hg) <0.01 <0.01 <0.01 <0.01 mg/l IS:3025 part 48:2003 NS Nickel (as Ni) <0.01 <0.01 <0.01 <0.01 mg/l IS:3025 part 54:2003 NS Selenium (as Se) <0.001 <0.001 <0.001 <0.001 mg/l IS:3025 part 56:2003 0.05 Zinc (as Zn) 0.27 0.29 0.31 0.34 mg/l IS:3025 part 49:2009 15
SW1- Ramakrishnapuram Cheruvu,SW2- Pedda Cheruvu, SW3- Nagarjunasagar canal and SW4- Narayanapuram Cheruvu
Dashrath Prasad Fertilizers Pvt. Ltd Environmental Impact Assessment Report
Team Labs and Consultants 3-15
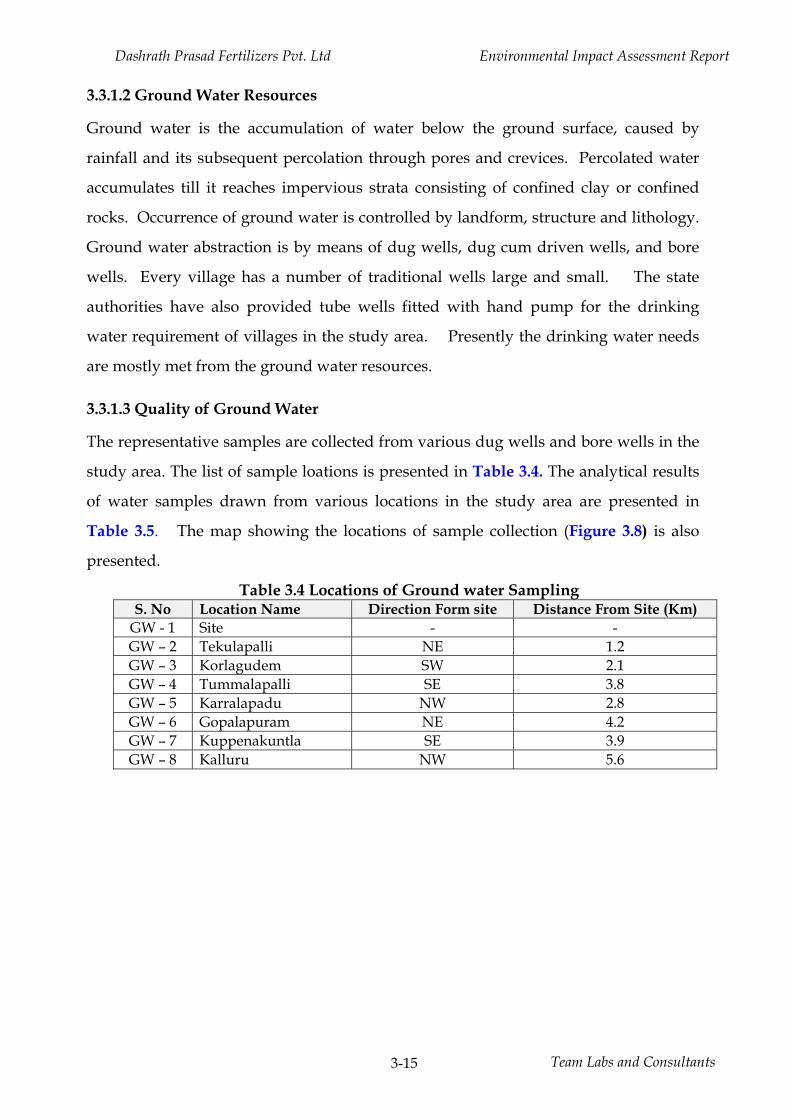
3.3.1.2 Ground Water Resources
Ground water is the accumulation of water below the ground surface, caused by
rainfall and its subsequent percolation through pores and crevices. Percolated water
accumulates till it reaches impervious strata consisting of confined clay or confined
rocks. Occurrence of ground water is controlled by landform, structure and lithology.
Ground water abstraction is by means of dug wells, dug cum driven wells, and bore
wells. Every village has a number of traditional wells large and small. The state
authorities have also provided tube wells fitted with hand pump for the drinking
water requirement of villages in the study area. Presently the drinking water needs
are mostly met from the ground water resources.
3.3.1.3 Quality of Ground Water
The representative samples are collected from various dug wells and bore wells in the
study area. The list of sample loations is presented in Table 3.4. The analytical results
of water samples drawn from various locations in the study area are presented in
Table 3.5. The map showing the locations of sample collection (Figure 3.8) is also
presented.
Table 3.4 Locations of Ground water Sampling S. No Location Name Direction Form site Distance From Site (Km)
GW - 1 Site - - GW – 2 Tekulapalli NE 1.2 GW – 3 Korlagudem SW 2.1 GW – 4 Tummalapalli SE 3.8 GW – 5 Karralapadu NW 2.8 GW – 6 Gopalapuram NE 4.2 GW – 7 Kuppenakuntla SE 3.9 GW – 8 Kalluru NW 5.6
Dashrath Prasad Fertilizers Pvt. Ltd Environmental Impact Assessment Report
Team Labs and Consultants 3-16
Figure 3.7 Drainage Pattern of the study area
Dashrath Prasad Fertilizers Pvt. Ltd Environmental Impact Assessment Report
Team Labs and Consultants 3-17
Figure 3.8 Water Sampling Locations (Surface and Ground water)
Dashrath Prasad Fertilizers Pvt. Ltd Environmental Impact Assessment Report
Team Labs and Consultants 3-18
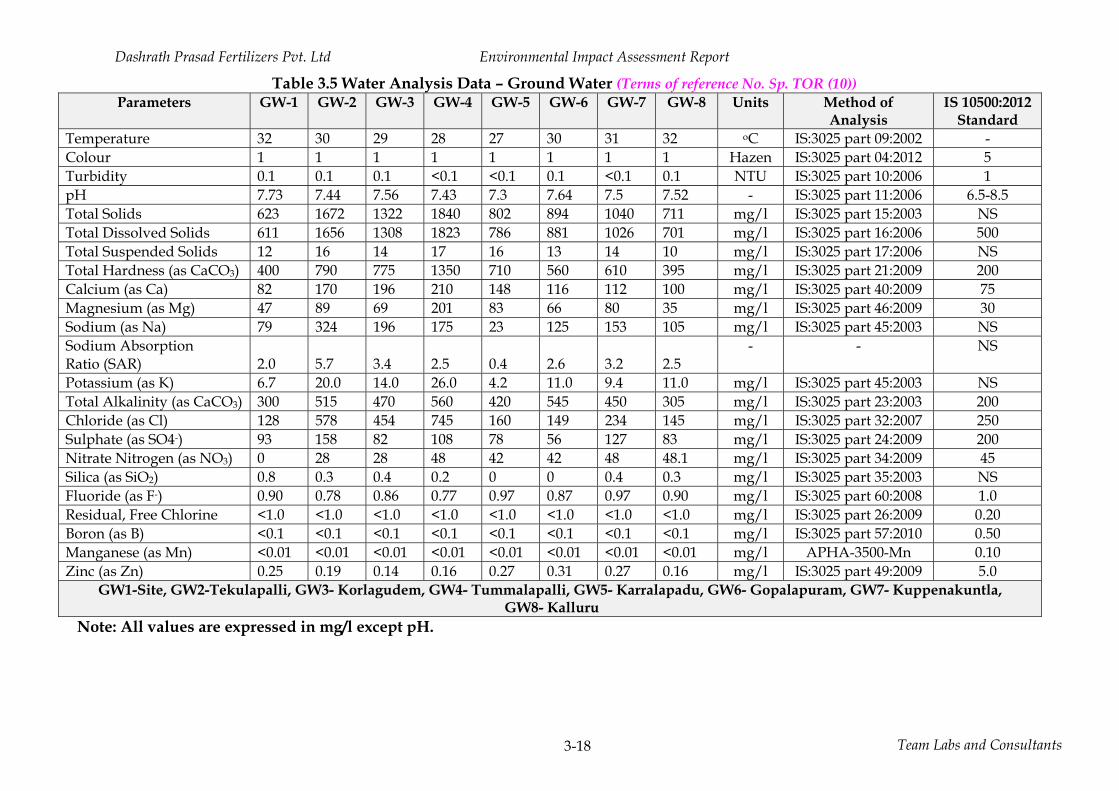
Table 3.5 Water Analysis Data – Ground Water (Terms of reference No. Sp. TOR (10)) Parameters GW-1 GW-2 GW-3 GW-4 GW-5 GW-6 GW-7 GW-8 Units Method of
Analysis IS 10500:2012
Standard Temperature 32 30 29 28 27 30 31 32 oC IS:3025 part 09:2002 - Colour 1 1 1 1 1 1 1 1 Hazen IS:3025 part 04:2012 5 Turbidity 0.1 0.1 0.1 <0.1 <0.1 0.1 <0.1 0.1 NTU IS:3025 part 10:2006 1 pH 7.73 7.44 7.56 7.43 7.3 7.64 7.5 7.52 - IS:3025 part 11:2006 6.5-8.5 Total Solids 623 1672 1322 1840 802 894 1040 711 mg/l IS:3025 part 15:2003 NS Total Dissolved Solids 611 1656 1308 1823 786 881 1026 701 mg/l IS:3025 part 16:2006 500 Total Suspended Solids 12 16 14 17 16 13 14 10 mg/l IS:3025 part 17:2006 NS Total Hardness (as CaCO3) 400 790 775 1350 710 560 610 395 mg/l IS:3025 part 21:2009 200 Calcium (as Ca) 82 170 196 210 148 116 112 100 mg/l IS:3025 part 40:2009 75 Magnesium (as Mg) 47 89 69 201 83 66 80 35 mg/l IS:3025 part 46:2009 30 Sodium (as Na) 79 324 196 175 23 125 153 105 mg/l IS:3025 part 45:2003 NS Sodium Absorption Ratio (SAR) 2.0 5.7 3.4 2.5 0.4 2.6 3.2 2.5
- - NS
Potassium (as K) 6.7 20.0 14.0 26.0 4.2 11.0 9.4 11.0 mg/l IS:3025 part 45:2003 NS Total Alkalinity (as CaCO3) 300 515 470 560 420 545 450 305 mg/l IS:3025 part 23:2003 200 Chloride (as Cl) 128 578 454 745 160 149 234 145 mg/l IS:3025 part 32:2007 250 Sulphate (as SO4-) 93 158 82 108 78 56 127 83 mg/l IS:3025 part 24:2009 200 Nitrate Nitrogen (as NO3) 0 28 28 48 42 42 48 48.1 mg/l IS:3025 part 34:2009 45 Silica (as SiO2) 0.8 0.3 0.4 0.2 0 0 0.4 0.3 mg/l IS:3025 part 35:2003 NS Fluoride (as F-) 0.90 0.78 0.86 0.77 0.97 0.87 0.97 0.90 mg/l IS:3025 part 60:2008 1.0 Residual, Free Chlorine <1.0 <1.0 <1.0 <1.0 <1.0 <1.0 <1.0 <1.0 mg/l IS:3025 part 26:2009 0.20 Boron (as B) <0.1 <0.1 <0.1 <0.1 <0.1 <0.1 <0.1 <0.1 mg/l IS:3025 part 57:2010 0.50 Manganese (as Mn) <0.01 <0.01 <0.01 <0.01 <0.01 <0.01 <0.01 <0.01 mg/l APHA-3500-Mn 0.10 Zinc (as Zn) 0.25 0.19 0.14 0.16 0.27 0.31 0.27 0.16 mg/l IS:3025 part 49:2009 5.0
GW1-Site, GW2-Tekulapalli, GW3- Korlagudem, GW4- Tummalapalli, GW5- Karralapadu, GW6- Gopalapuram, GW7- Kuppenakuntla, GW8- Kalluru
Note: All values are expressed in mg/l except pH.
Dashrath Prasad Fertilizers Pvt. Ltd Environmental Impact Assessment Report
Team Labs and Consultants 3-19
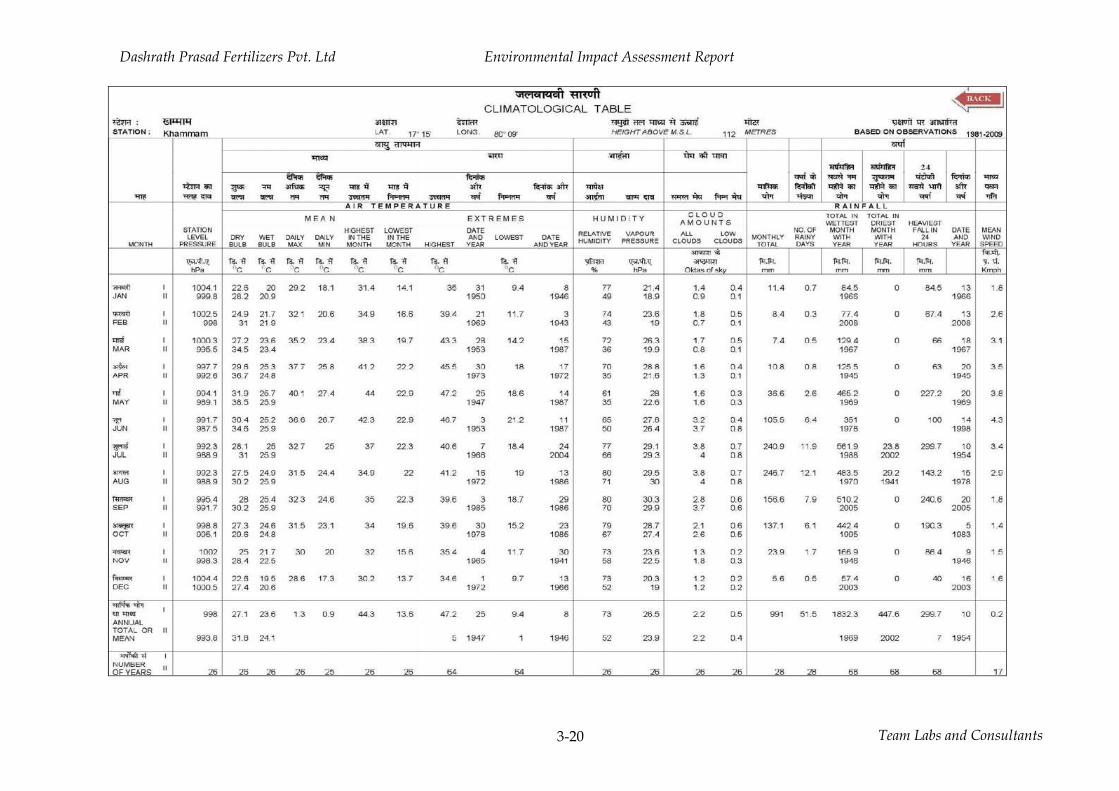
3.4 Air Environment
3.4.1 Meteorology
Micro meteorological studies are simultaneously conducted with ambient air quality
monitoring. Meteorology plays a vital role in effecting the dispersion of pollutants,
once discharged into the atmosphere, their transport, dispersion and diffusion into the
environment. The meteorological data is very useful for interpretation of the baseline
information and for model study of air quality impacts also. Since meteorological data
show wide fluctuations with time, meaningful interpretation can only be drawn from
long term and reliable data. Such source of data is the Indian Meteorological
Department (IMD), which maintains a network of meteorological stations at several
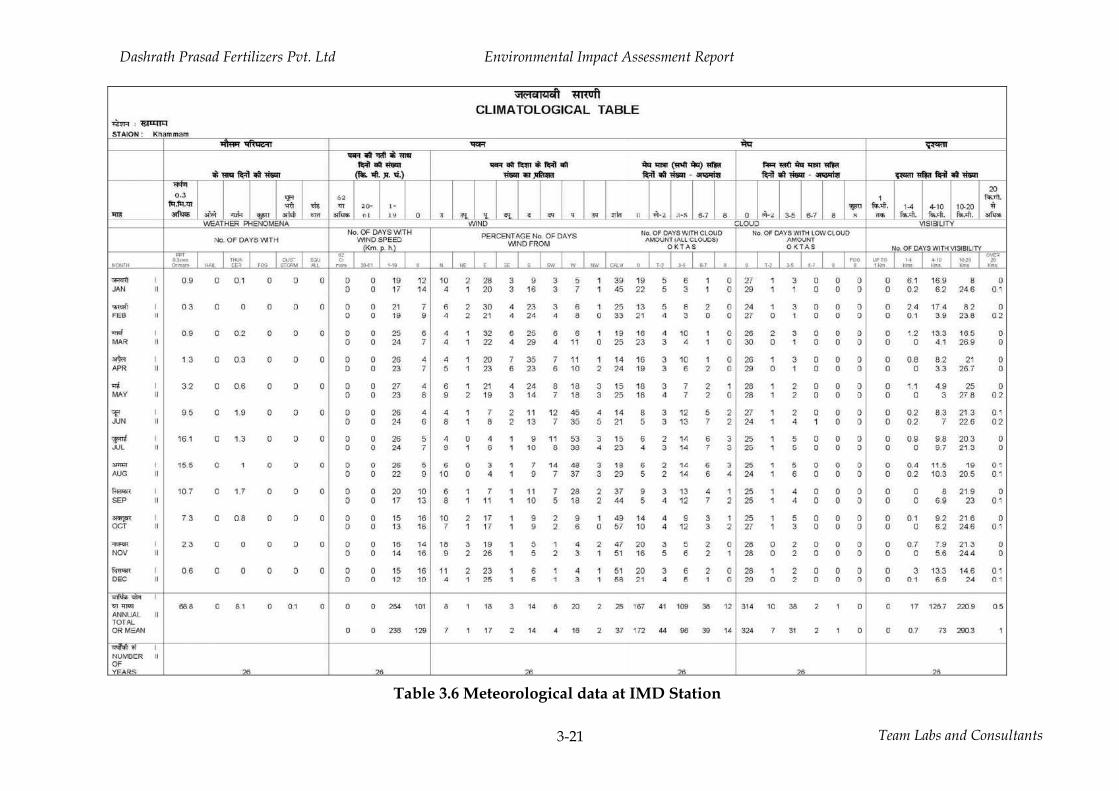
important locations. The data recorded for IMD station at Khammam is summarized
and the salient features of the summarized data are as follows in the Table 3.6.
Dashrath Prasad Fertilizers Pvt. Ltd Environmental Impact Assessment Report
Team Labs and Consultants 3-20
Dashrath Prasad Fertilizers Pvt. Ltd Environmental Impact Assessment Report
Team Labs and Consultants 3-21
Table 3.6 Meteorological data at IMD Station
Dashrath Prasad Fertilizers Pvt. Ltd Environmental Impact Assessment Report
Team Labs and Consultants 3-22
3.4.2 Meteorological Station at Plant Site
The micro meteorological data at the industry site is collected simultaneously with
ambient air quality monitoring. The station was installed at height of 10 meters above
the ground level and the same is located in such a way that there are no obstructions
facilitating free flow of wind. Wind speed, wind direction, humidity, temperature and
rainfall are recorded on hourly basis. Salient features of micro meteorological data
collected are as follows:
1. Wind Direction and Speed:
The hourly wind speed and wind direction observations are computed during various
seasons of study period and the same are presented in Table 3.7 and the wind rose
diagrams are presented in Figure 3.9. The following observations can be made from the
collected data;
• Calm period is observed to be 1.0 % during the time of monitoring.
• The predominant wind direction is South-Southeast.
• Other than predominant wind directions wind was blowing in South and southeast.
• Mostly the wind speeds are observed to be in the range of 5-10 kmph and 10-15 kmph.
2. Temperature: (a) Maximum: 42.9 0C (b) Minimum: 21.2 0C (c) Average: 29.8 0C
3. Humidity: The daily relative humidity values are observed to range between 48 -
72%.
4. Rain Fall: (a) Maximum: 2.2 mm (b) Minimum: 0 mm (c) Mean: 0.6 mm
Dashrath Prasad Fertilizers Pvt. Ltd Environmental Impact Assessment Report
Team Labs and Consultants 3-23
Table 3.7 Frequency Distribution of Wind Speeds and Wind Directions
Wind Direction Wind Speed in kmph Calm 1 - 5 5-10 10-15 >15 Total
N 0.45 0.41 0.14 0.05 1.04 NNE 0.50 0.50 0.09 1.09 NE 0.27 0.09 0.14 0.05 0.54 ENE 0.23 0.23 0.45 E 0.41 0.32 0.14 0.86 ESE 0.54 0.63 0.32 1.49 SE 2.17 10.33 6.70 0.63 19.84 SSE 3.62 9.74 8.47 0.77 22.60 S 4.98 10.33 6.93 0.27 22.51 SSW 5.34 8.74 4.39 0.09 18.57 SW 1.31 2.67 1.13 0.05 5.16 WSW 0.72 0.54 1.27 W 0.59 0.72 0.05 1.36 WNW 0.27 0.23 0.14 0.63 NW 0.59 0.23 0.00 0.05 0.86 NNW 0.18 0.36 0.09 0.09 0.72 CALM 1.00 1.00 Total 1.00 22.19 46.06 28.71 2.04 100.00
(Data Period: March 05, 2017 – June 04, 2017)

Dashrath Prasad Fertilizers Pvt. Ltd Environmental Impact Assessment Report
Team Labs and Consultants 3-24
WRPLOT View - Lakes Environmental Software
WIND ROSE PLOT:
Station # 1
COMMENTS: COMPANY NAME:
M/s Dashrath Prasad Fertilizers Pvt. Ltd
MODELER:
M/s.Team Labs and Consultsnts, Hyderabad.
PROJECT NO.:
NORTH
SOUTH
WEST EAST
5%
10%
15%
20%
25%
WIND SPEED (m/s)
>= 4.2
2.8 - 4.2
1.4 - 2.8
0.3 - 1.4
Calms: 1.00%
TOTAL COUNT:
2208 hrs.
CALM WINDS:
1.00%
DATA PERIOD:
Start Date: 05-03-2017 - 00:00End Date: 04-06-2017 - 23:00
AVG. WIND SPEED:
2.21 m/s
DISPLAY:
Wind SpeedDirection (blowing from)
Figure 3.9 Wind Rose Diagram at Site
Dashrath Prasad Fertilizers Pvt. Ltd Environmental Impact Assessment Report
Team Labs and Consultants 3-25
3.4.3 Ambient Air Quality
Air pollution means the presence in the outdoor atmosphere of one or more or
combinations thereof in such quantities and of such duration as are or may tend to be
injurious to human, plant or animal life or property. Air pollutants include smoke,
vapors, soot, fumes, gases, mist, odors, particulate matter, radioactive material or
noxious chemicals. With upcoming industrial activity a range of different pollutants
are released into the atmosphere that are dispersed and have a significant impact on
neighborhood air environment. Thus collection of base line data of air environment
occupies a predominant role in the impact assessment. The ambient air quality status
across the study zone forms basis for prediction of the impacts due to the proposed
project.
The data required to assess air quality impacts in and around neighborhood is achieved
by designing such a network, which encompasses micro meteorological conditions,
quantity and quality of emissions, locations, during, resources / monitoring technology
and operational criteria.
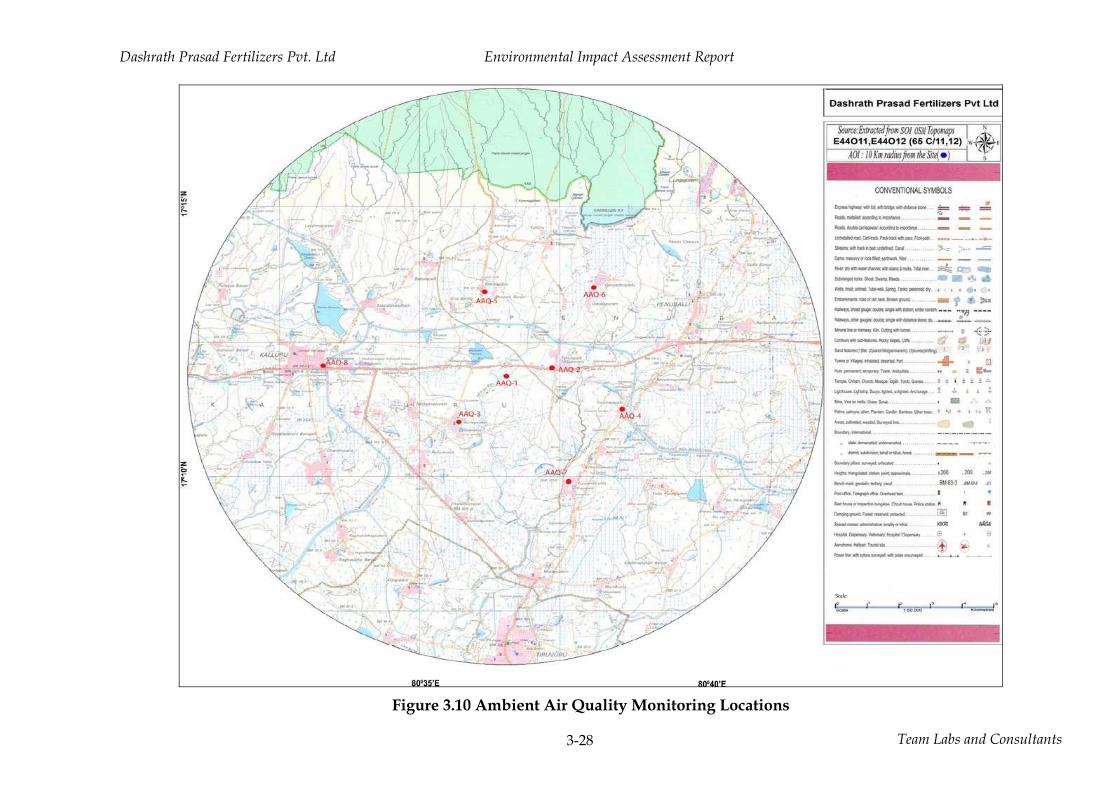
3.4.4 Scope of Field Study
The scope of baseline status of the ambient air quality can be assessed through a well-
designed ambient air quality stations network. Ambient air quality monitoring of the
study area consisting of 10 km radius with the plant site as the center point was carried
out during the study period. Ambient air quality was monitored at eight locations
spread over entire study area. Figure 3.10 presents the locations of eight ambient air
quality-monitoring stations. At each sampling station monitoring was carried out for
24 hours in a day for 2 days a week, and for three months. The major air pollutants
monitored on 24 hourly basis are; PM10, PM2.5, Sulfur dioxide and Oxides of Nitrogen.
Sampling and analysis of the above variables is according to the guidelines of Central
Pollution Control Board. National Ambient Air Qualiy Standards is presented in Table
3.8.
Dashrath Prasad Fertilizers Pvt. Ltd Environmental Impact Assessment Report
Team Labs and Consultants 3-26
Table 3.8 National Ambient Air Quality Standards Pollutant Time
Weighted Average
Concentration in Ambient Air IRR ESA Methods of Measurement
Sulphur Dioxide (SO2) Annual* 24 Hours**
50 80
20 80
Improved west and Gaeke Ultraviolet fluorescence
Nitrogen Dioxide (NO2) Annual* 24 Hours**
40 80
30 80
Modified Jacob & Hochheiser (Nn-Arsenite) Chemiluminescence
Particulate Matter (Size Less than 10µm) or PM10
Annual* 24 Hours**
60 100
60 100
Gravimetic TOEM Beta Attenuation
Particulate Matter (Size Less than 2.5µm) or PM2.5
Annual* 24 Hours**
40 60
40 60
Gravimetic TOEM Beta Attenuation
Ozone (O3) 8 hours** 1 hour**
100 180
100 180
UV Photometric Chemilminescence Chemical Method
Lead (Pb) Annual* 24 hours**
0.50
1.0
0.50
1.0
AAS /ICP method after sampling on EPM 2000 or equivalent filter paper ED - XRF using Teflon filter.
Carbon Monoxide (CO) 8 hours** 1 hour**
02 04
02 04
Non Dispersive Infra Red Spectroscopy
Ammonia (NH3) Annual* 24 hours**
100 400
100 400
Chemilminescence Indophenol blue method
Benzene (C6H6) Annual* 05 05
Gas Chromotography based continuous analyzer Absorption and Desorption followed by GC analysis
Benzo (o) Pyrene(BaP) – Particulate Phase only,
Annual* 01 01 Solvent extraction followed by HPLC/GC analysis
Arsenic (As), Annual* 06 06 AAS/ICP method after sampling on EPM 2000 or equivalent filter paper
Nickel (Ni), Annual* 20 20 AAS/ICP method after sampling on EPM 2000 or equivalent filter paper
IRR - Industrial, Residential, Rural and Other Area, ESA- Ecological Sensitive Area (Notified by Central Government)
G.S.No.826 (E) dated 16th November, 2009. Vide letter no. F. No. Q-15017/43/2007-CPW *Annual Arithmetic mean of minimum 104 measurements in a year at a particular site taken twice a week 24 hourly at uniform interval. **24 hourly/8/1 hourly monitored values as applicable, shall be complied with 98 percent of the time in a year.2% of time they may be exceeded the limits but not on two consecutive days of monitoring.
Dashrath Prasad Fertilizers Pvt. Ltd Environmental Impact Assessment Report
Team Labs and Consultants 3-27
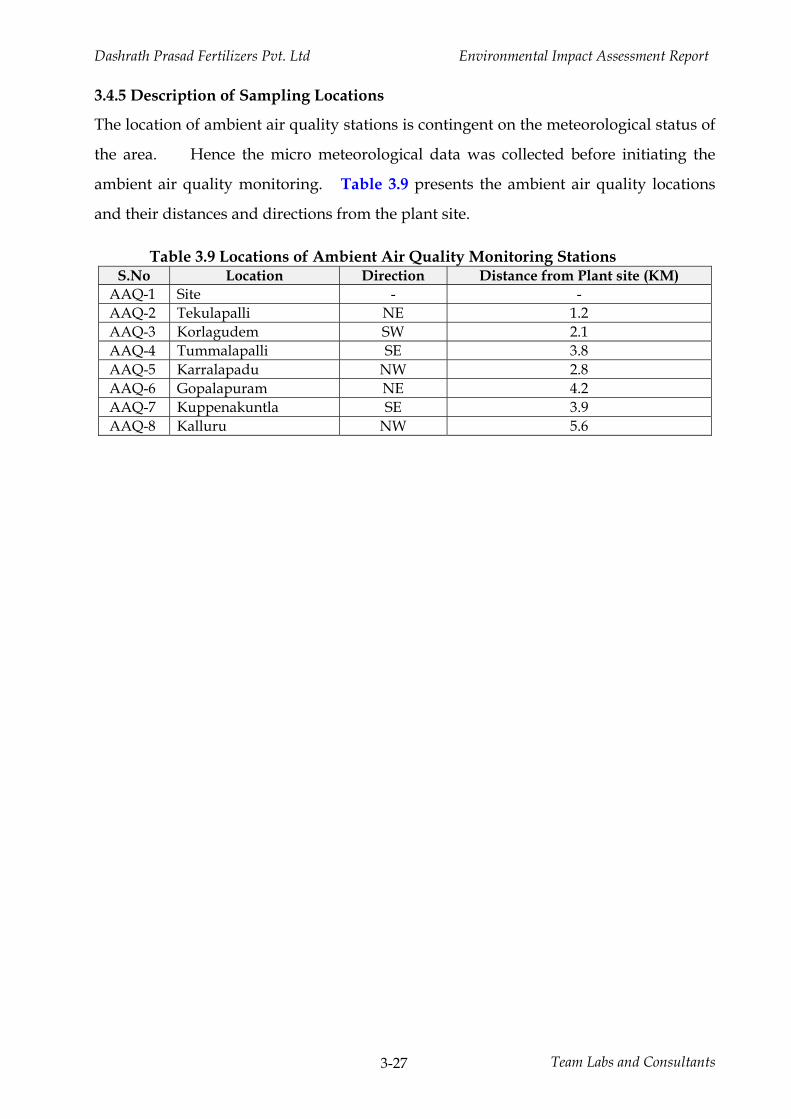
3.4.5 Description of Sampling Locations
The location of ambient air quality stations is contingent on the meteorological status of
the area. Hence the micro meteorological data was collected before initiating the
ambient air quality monitoring. Table 3.9 presents the ambient air quality locations
and their distances and directions from the plant site.
Table 3.9 Locations of Ambient Air Quality Monitoring Stations S.No Location Direction Distance from Plant site (KM)
AAQ-1 Site - - AAQ-2 Tekulapalli NE 1.2 AAQ-3 Korlagudem SW 2.1 AAQ-4 Tummalapalli SE 3.8 AAQ-5 Karralapadu NW 2.8 AAQ-6 Gopalapuram NE 4.2 AAQ-7 Kuppenakuntla SE 3.9 AAQ-8 Kalluru NW 5.6
Dashrath Prasad Fertilizers Pvt. Ltd Environmental Impact Assessment Report
Team Labs and Consultants 3-28
Figure 3.10 Ambient Air Quality Monitoring Locations
Dashrath Prasad Fertilizers Pvt. Ltd Environmental Impact Assessment Report
Team Labs and Consultants 3-29
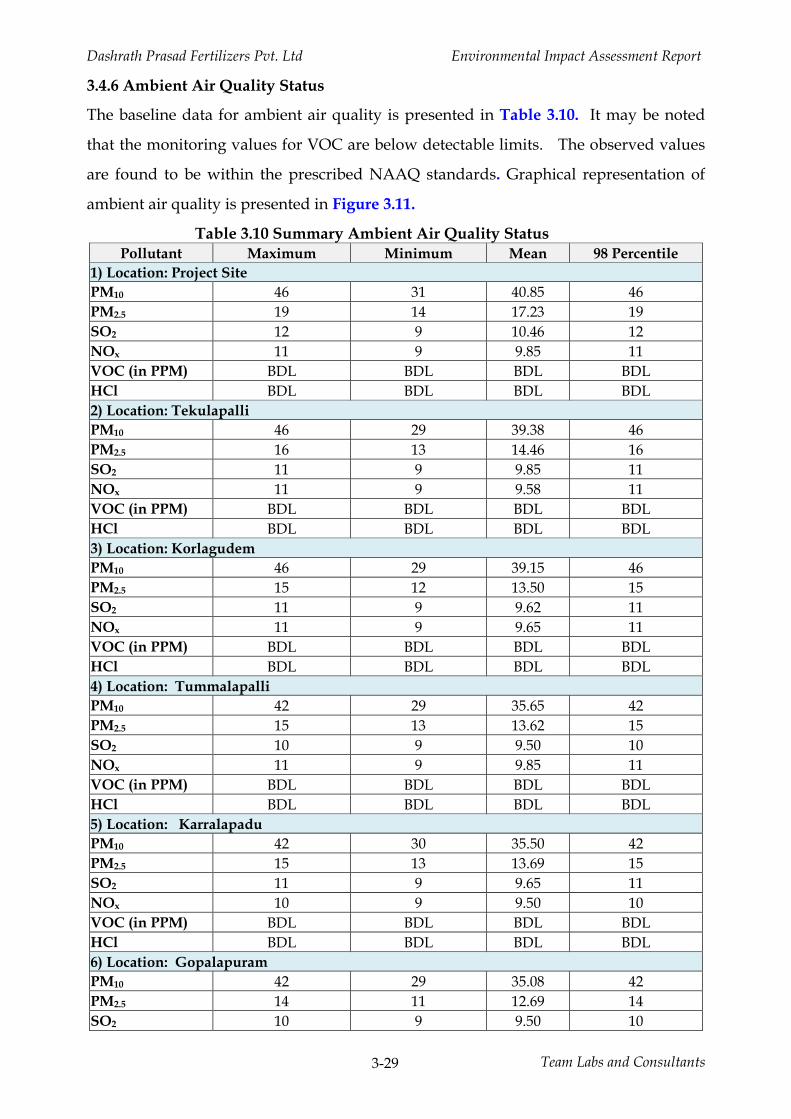
3.4.6 Ambient Air Quality Status
The baseline data for ambient air quality is presented in Table 3.10. It may be noted
that the monitoring values for VOC are below detectable limits. The observed values
are found to be within the prescribed NAAQ standards. Graphical representation of
ambient air quality is presented in Figure 3.11.
Table 3.10 Summary Ambient Air Quality Status Pollutant Maximum Minimum Mean 98 Percentile
1) Location: Project Site PM10 46 31 40.85 46 PM2.5 19 14 17.23 19 SO2 12 9 10.46 12 NOx 11 9 9.85 11 VOC (in PPM) BDL BDL BDL BDL HCl BDL BDL BDL BDL 2) Location: Tekulapalli PM10 46 29 39.38 46 PM2.5 16 13 14.46 16 SO2 11 9 9.85 11 NOx 11 9 9.58 11 VOC (in PPM) BDL BDL BDL BDL HCl BDL BDL BDL BDL 3) Location: Korlagudem PM10 46 29 39.15 46 PM2.5 15 12 13.50 15 SO2 11 9 9.62 11 NOx 11 9 9.65 11 VOC (in PPM) BDL BDL BDL BDL HCl BDL BDL BDL BDL 4) Location: Tummalapalli PM10 42 29 35.65 42 PM2.5 15 13 13.62 15 SO2 10 9 9.50 10 NOx 11 9 9.85 11 VOC (in PPM) BDL BDL BDL BDL HCl BDL BDL BDL BDL 5) Location: Karralapadu PM10 42 30 35.50 42 PM2.5 15 13 13.69 15 SO2 11 9 9.65 11 NOx 10 9 9.50 10 VOC (in PPM) BDL BDL BDL BDL HCl BDL BDL BDL BDL 6) Location: Gopalapuram PM10 42 29 35.08 42 PM2.5 14 11 12.69 14 SO2 10 9 9.50 10
Dashrath Prasad Fertilizers Pvt. Ltd Environmental Impact Assessment Report
Team Labs and Consultants 3-30
Pollutant Maximum Minimum Mean 98 Percentile NOx 11 9 9.73 11 VOC (in PPM) BDL BDL BDL BDL HCl BDL BDL BDL BDL 7) Location: Kuppenakuntla PM10 41 29 33.96 41 PM2.5 14 12 13.42 14 SO2 11 9 9.73 11 NOx 11 9 9.96 11 VOC (in PPM) BDL BDL BDL BDL HCl BDL BDL BDL BDL 8) Location:Kalluru PM10 42 32 38.19 42 PM2.5 14 12 13.31 14 SO2 11 9 9.69 11 NOx 11 9 9.65 11 VOC (in PPM) BDL BDL BDL BDL HCl BDL BDL BDL BDL • Note: Pollutant concentrations are presented in µg/m³ • BDL: Below detectable limit
0102030405060708090
100
AAQ-1 AAQ-2 AAQ-3 AAQ-4 AAQ-5 AAQ-6 AAQ-7 AAQ-8
PM
10
, µg
/m3
AAQ Monitoring Locations
MaximumMinimum
NAAQ Standard
0
10
20
30
40
50
60
AAQ-1 AAQ-2 AAQ-3 AAQ-4 AAQ-5 AAQ-6 AAQ-7 AAQ-8
PM2.
5, µg
/m3
AAQ Monitoring Locations
NAAQ Standard
Maximum
Minimum
0
10
20
30
40
50
60
70
80
AAQ-1 AAQ-2 AAQ-3 AAQ-4 AAQ-5 AAQ-6 AAQ-7 AAQ-8
so2,
µg/
m3
AAQ Monitoring Locations
NAAQ Standard
Maximum
Minimum
0
10
20
30
40
50
60
70
80
AAQ-1 AAQ-2 AAQ-3 AAQ-4 AAQ-5 AAQ-6 AAQ-7 AAQ-8
NO
X, µ
g/m
3
AAQ Monitoring Locations
NAAQ Standard
Maximum
Minimum
Figure 3.11 Graphs Showing the Results of Ambient Air Quality
Dashrath Prasad Fertilizers Pvt. Ltd Environmental Impact Assessment Report
Team Labs and Consultants 3-31
3.4.7 Noise Environment
Noise is an unwanted sound without musical quality. Artificial noise and its impact
on environment, grown apace with advancing human civilization. Noise pollution is
equally hazardous to environment as air, water and other forms of pollution. Various
noise measurement units have been introduced to describe, in a single number, the
response of an average human to a complex sound made up of various frequencies at
different loudness levels. The most common scale is, weighted decibel dB (A), and
measured as the relative intensity level of one sound with respect to another sound
(reference sound).
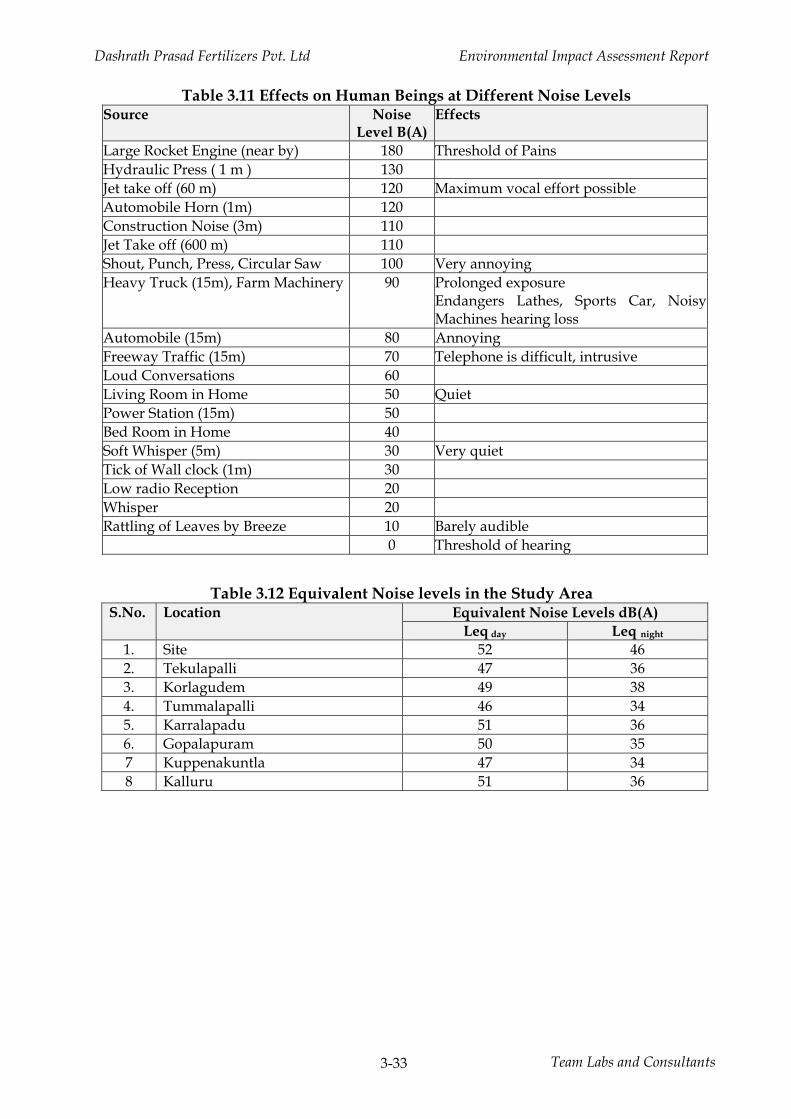
The impact of noise depends on its characteristics (instantaneous, intermittent or
continuous in nature), time of day (day or night) and location of noise source. Table
3.11 shows the effects of different noise levels on human beings. The environmental
impact of noise can have several effects varying from noise induced hearing loss to
annoying depending on noise levels.
The assessment of noise pollution on neighborhood environment due to the proposed
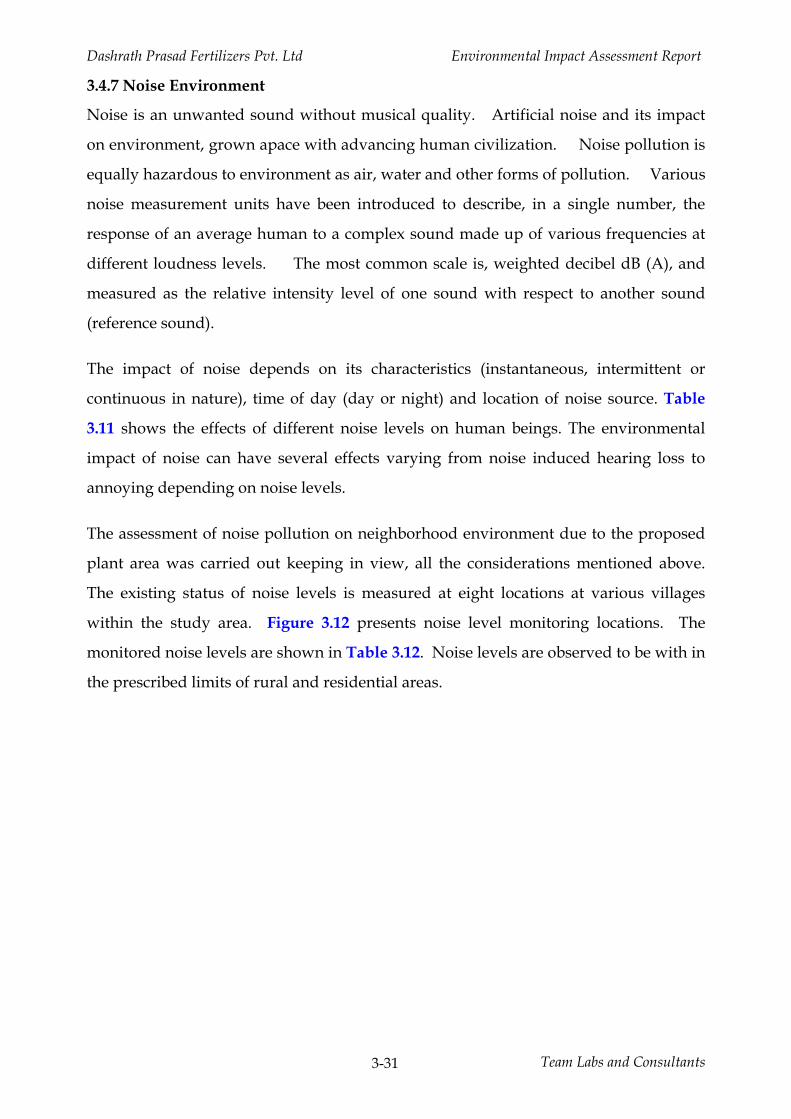
plant area was carried out keeping in view, all the considerations mentioned above.
The existing status of noise levels is measured at eight locations at various villages
within the study area. Figure 3.12 presents noise level monitoring locations. The
monitored noise levels are shown in Table 3.12. Noise levels are observed to be with in
the prescribed limits of rural and residential areas.
Dashrath Prasad Fertilizers Pvt. Ltd Environmental Impact Assessment Report
Team Labs and Consultants 3-32
Figure 3.12 Noise Sampling Locations
Dashrath Prasad Fertilizers Pvt. Ltd Environmental Impact Assessment Report
Team Labs and Consultants 3-33
Table 3.11 Effects on Human Beings at Different Noise Levels Source Noise
Level B(A) Effects
Large Rocket Engine (near by) 180 Threshold of Pains Hydraulic Press ( 1 m ) 130 Jet take off (60 m) 120 Maximum vocal effort possible Automobile Horn (1m) 120 Construction Noise (3m) 110 Jet Take off (600 m) 110 Shout, Punch, Press, Circular Saw 100 Very annoying Heavy Truck (15m), Farm Machinery 90 Prolonged exposure
Endangers Lathes, Sports Car, Noisy Machines hearing loss
Automobile (15m) 80 Annoying Freeway Traffic (15m) 70 Telephone is difficult, intrusive Loud Conversations 60 Living Room in Home 50 Quiet Power Station (15m) 50 Bed Room in Home 40 Soft Whisper (5m) 30 Very quiet Tick of Wall clock (1m) 30 Low radio Reception 20 Whisper 20 Rattling of Leaves by Breeze 10 Barely audible 0 Threshold of hearing
Table 3.12 Equivalent Noise levels in the Study Area S.No. Location Equivalent Noise Levels dB(A)
Leq day Leq night 1. Site 52 46 2. Tekulapalli 47 36 3. Korlagudem 49 38 4. Tummalapalli 46 34 5. Karralapadu 51 36 6. Gopalapuram 50 35 7 Kuppenakuntla 47 34 8 Kalluru 51 36
Dashrath Prasad Fertilizers Pvt. Ltd Environmental Impact Assessment Report
Team Labs and Consultants 3-34
3.4.8 Traffic Study
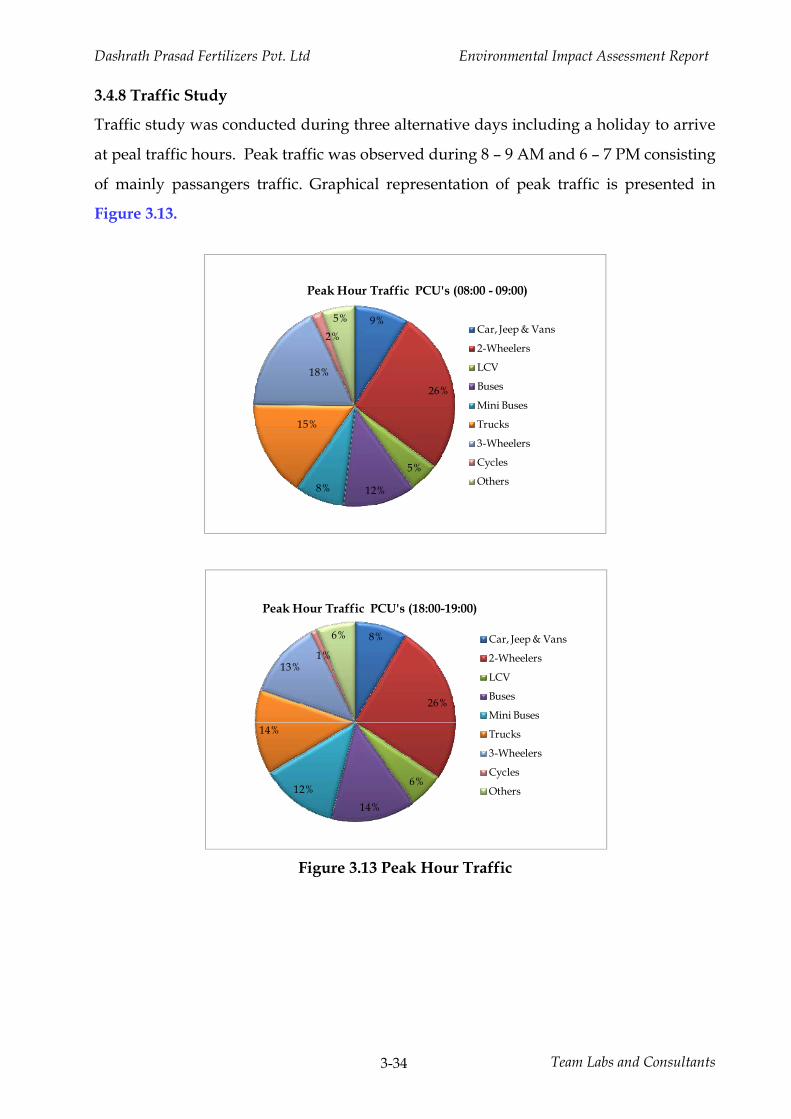
Traffic study was conducted during three alternative days including a holiday to arrive
at peal traffic hours. Peak traffic was observed during 8 – 9 AM and 6 – 7 PM consisting
of mainly passangers traffic. Graphical representation of peak traffic is presented in
Figure 3.13.
9%
26%
5%
12%8%
15%
18%
2%
5%
Peak Hour Traffic PCU's (08:00 - 09:00)
Car, Jeep & Vans
2-Wheelers
LCV
Buses
Mini Buses
Trucks
3-Wheelers
Cycles
Others
8%
26%
6%
14%
12%
14%
13%1%
6%
Peak Hour Traffic PCU's (18:00-19:00)
Car, Jeep & Vans
2-Wheelers
LCV
Buses
Mini Buses
Trucks
3-Wheelers
Cycles
Others
Figure 3.13 Peak Hour Traffic
Dashrath Prasad Fertilizers Pvt. Ltd Environmental Impact Assessment Report
Team Labs and Consultants 3-35
3.5 Socio Economic Environment
Industrial development reflects in social development, i.e., growth in infrastructure
facilities, growth in employment rates, increased demands for housing, and other
amenities etc., which will have a bearing on the socio economic status.
Socio-economic survey is conducted to ascertain the existing socio-economic status to
compare the same with the developments due to the project. Baseline data of
demographic characteristics- occupational status, literacy, health status and the access
to infrastructure facilities for social development in the project area has been studied
from the secondary data collected from census department By M/s. Team Labs and
Consultants.
Demographic characteristics of the study area falling within 10 km radius of the project
site have been compiled to assess the pre-project socio-economic status. Secondary data
has been collected from various government agencies i.e., chief planning officer,
Khammam and Krishna district and other government departments of forestry,
irrigation etc., and Mandal Development Offices of the relevant government
departments. Census 2011 was complied and presented as follows
3.6 Demography
The study area falls under the following mandals of Khammam District; Penuballi,
Kallur in Telangana state and Krishna district; Tiruvuru in Andhra Pradesh. Study
area comprises of 36 revenue villages and 8 hamlets apart from Tiruvuru Town.
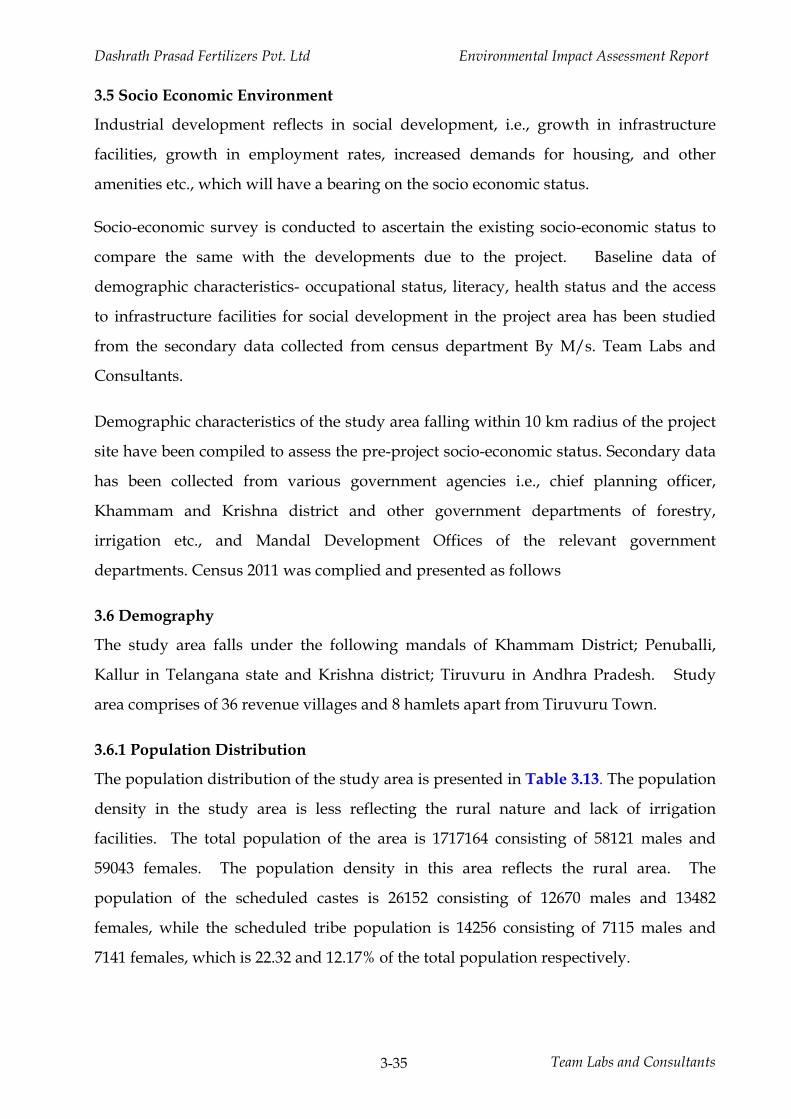
3.6.1 Population Distribution
The population distribution of the study area is presented in Table 3.13. The population
density in the study area is less reflecting the rural nature and lack of irrigation
facilities. The total population of the area is 1717164 consisting of 58121 males and
59043 females. The population density in this area reflects the rural area. The
population of the scheduled castes is 26152 consisting of 12670 males and 13482
females, while the scheduled tribe population is 14256 consisting of 7115 males and
7141 females, which is 22.32 and 12.17% of the total population respectively.
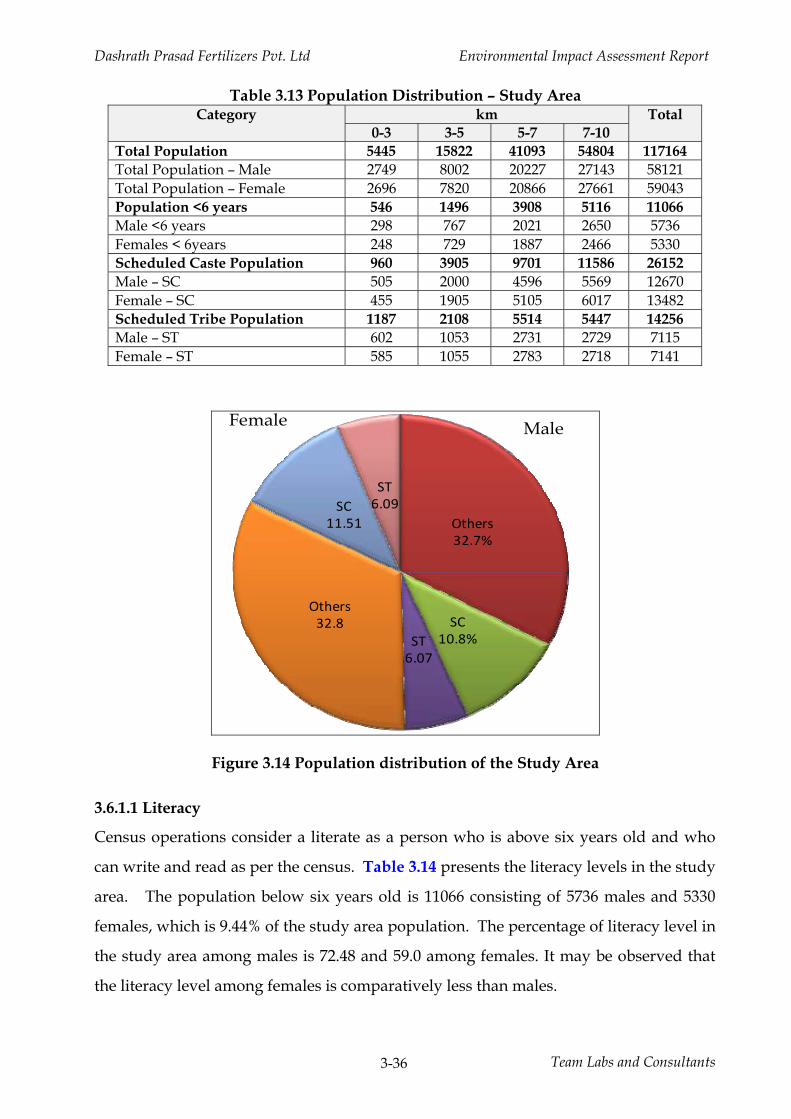
Dashrath Prasad Fertilizers Pvt. Ltd Environmental Impact Assessment Report
Team Labs and Consultants 3-36
Table 3.13 Population Distribution – Study Area Category km Total
0-3 3-5 5-7 7-10 Total Population 5445 15822 41093 54804 117164 Total Population – Male 2749 8002 20227 27143 58121 Total Population – Female 2696 7820 20866 27661 59043 Population <6 years 546 1496 3908 5116 11066 Male <6 years 298 767 2021 2650 5736 Females < 6years 248 729 1887 2466 5330 Scheduled Caste Population 960 3905 9701 11586 26152 Male – SC 505 2000 4596 5569 12670 Female – SC 455 1905 5105 6017 13482 Scheduled Tribe Population 1187 2108 5514 5447 14256 Male – ST 602 1053 2731 2729 7115 Female – ST 585 1055 2783 2718 7141
Male
Others32.7%
SC10.8%ST
6.07
Female
Others32.8
SC11.51
ST6.09
Figure 3.14 Population distribution of the Study Area
3.6.1.1 Literacy
Census operations consider a literate as a person who is above six years old and who
can write and read as per the census. Table 3.14 presents the literacy levels in the study
area. The population below six years old is 11066 consisting of 5736 males and 5330
females, which is 9.44% of the study area population. The percentage of literacy level in
the study area among males is 72.48 and 59.0 among females. It may be observed that
the literacy level among females is comparatively less than males.
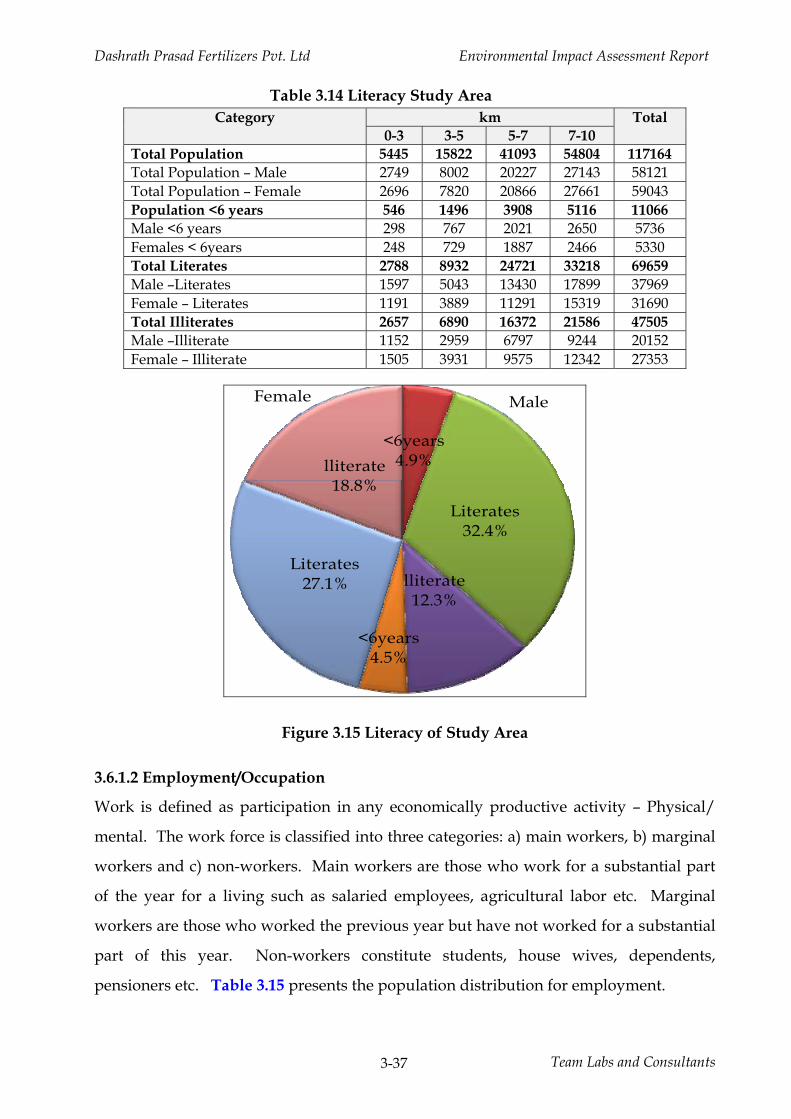
Dashrath Prasad Fertilizers Pvt. Ltd Environmental Impact Assessment Report
Team Labs and Consultants 3-37
Table 3.14 Literacy Study Area Category km Total
0-3 3-5 5-7 7-10 Total Population 5445 15822 41093 54804 117164 Total Population – Male 2749 8002 20227 27143 58121 Total Population – Female 2696 7820 20866 27661 59043 Population <6 years 546 1496 3908 5116 11066 Male <6 years 298 767 2021 2650 5736 Females < 6years 248 729 1887 2466 5330 Total Literates 2788 8932 24721 33218 69659 Male –Literates 1597 5043 13430 17899 37969 Female – Literates 1191 3889 11291 15319 31690 Total Illiterates 2657 6890 16372 21586 47505 Male –Illiterate 1152 2959 6797 9244 20152 Female – Illiterate 1505 3931 9575 12342 27353
Male
<6years4.9%
Literates32.4%
lliterate12.3%
Female
<6years4.5%
Literates27.1%
lliterate18.8%
Figure 3.15 Literacy of Study Area
3.6.1.2 Employment/Occupation
Work is defined as participation in any economically productive activity – Physical/
mental. The work force is classified into three categories: a) main workers, b) marginal
workers and c) non-workers. Main workers are those who work for a substantial part
of the year for a living such as salaried employees, agricultural labor etc. Marginal
workers are those who worked the previous year but have not worked for a substantial
part of this year. Non-workers constitute students, house wives, dependents,
pensioners etc. Table 3.15 presents the population distribution for employment.
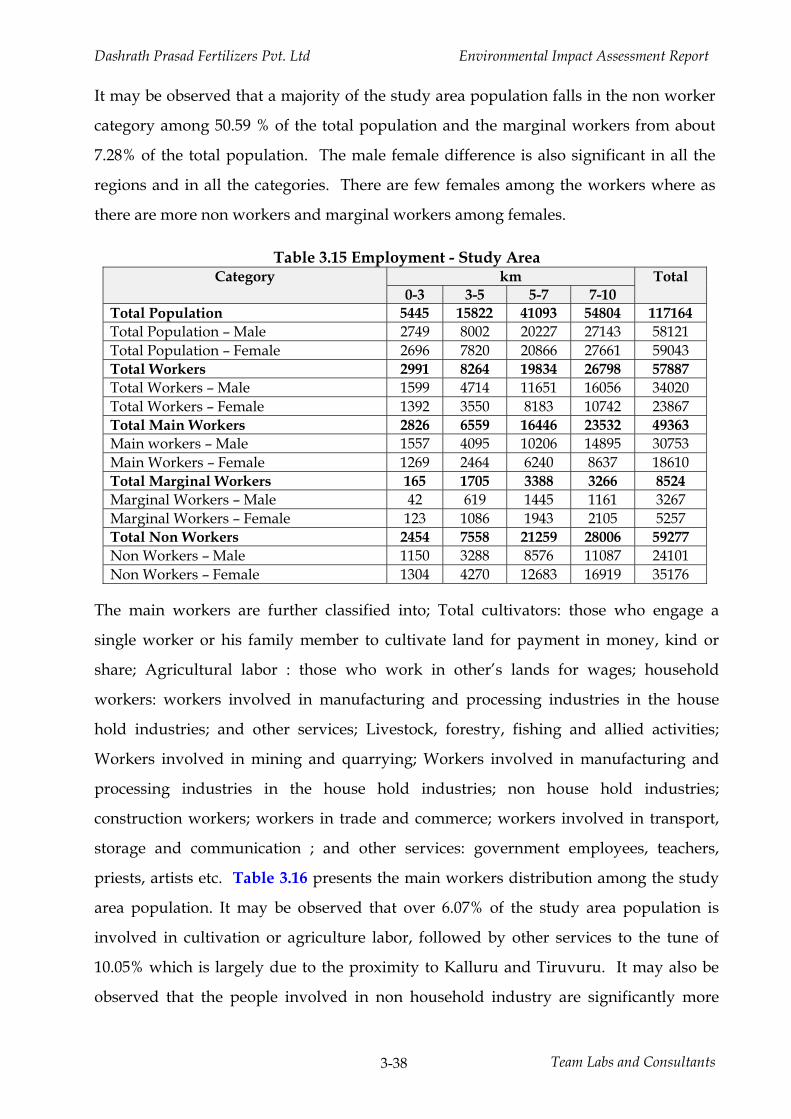
Dashrath Prasad Fertilizers Pvt. Ltd Environmental Impact Assessment Report
Team Labs and Consultants 3-38
It may be observed that a majority of the study area population falls in the non worker
category among 50.59 % of the total population and the marginal workers from about
7.28% of the total population. The male female difference is also significant in all the
regions and in all the categories. There are few females among the workers where as
there are more non workers and marginal workers among females.
Table 3.15 Employment - Study Area Category km Total
0-3 3-5 5-7 7-10 Total Population 5445 15822 41093 54804 117164 Total Population – Male 2749 8002 20227 27143 58121 Total Population – Female 2696 7820 20866 27661 59043 Total Workers 2991 8264 19834 26798 57887 Total Workers – Male 1599 4714 11651 16056 34020 Total Workers – Female 1392 3550 8183 10742 23867 Total Main Workers 2826 6559 16446 23532 49363 Main workers – Male 1557 4095 10206 14895 30753 Main Workers – Female 1269 2464 6240 8637 18610 Total Marginal Workers 165 1705 3388 3266 8524 Marginal Workers – Male 42 619 1445 1161 3267 Marginal Workers – Female 123 1086 1943 2105 5257 Total Non Workers 2454 7558 21259 28006 59277 Non Workers – Male 1150 3288 8576 11087 24101 Non Workers – Female 1304 4270 12683 16919 35176
The main workers are further classified into; Total cultivators: those who engage a
single worker or his family member to cultivate land for payment in money, kind or
share; Agricultural labor : those who work in other’s lands for wages; household
workers: workers involved in manufacturing and processing industries in the house
hold industries; and other services; Livestock, forestry, fishing and allied activities;
Workers involved in mining and quarrying; Workers involved in manufacturing and
processing industries in the house hold industries; non house hold industries;
construction workers; workers in trade and commerce; workers involved in transport,
storage and communication ; and other services: government employees, teachers,
priests, artists etc. Table 3.16 presents the main workers distribution among the study
area population. It may be observed that over 6.07% of the study area population is
involved in cultivation or agriculture labor, followed by other services to the tune of
10.05% which is largely due to the proximity to Kalluru and Tiruvuru. It may also be
observed that the people involved in non household industry are significantly more
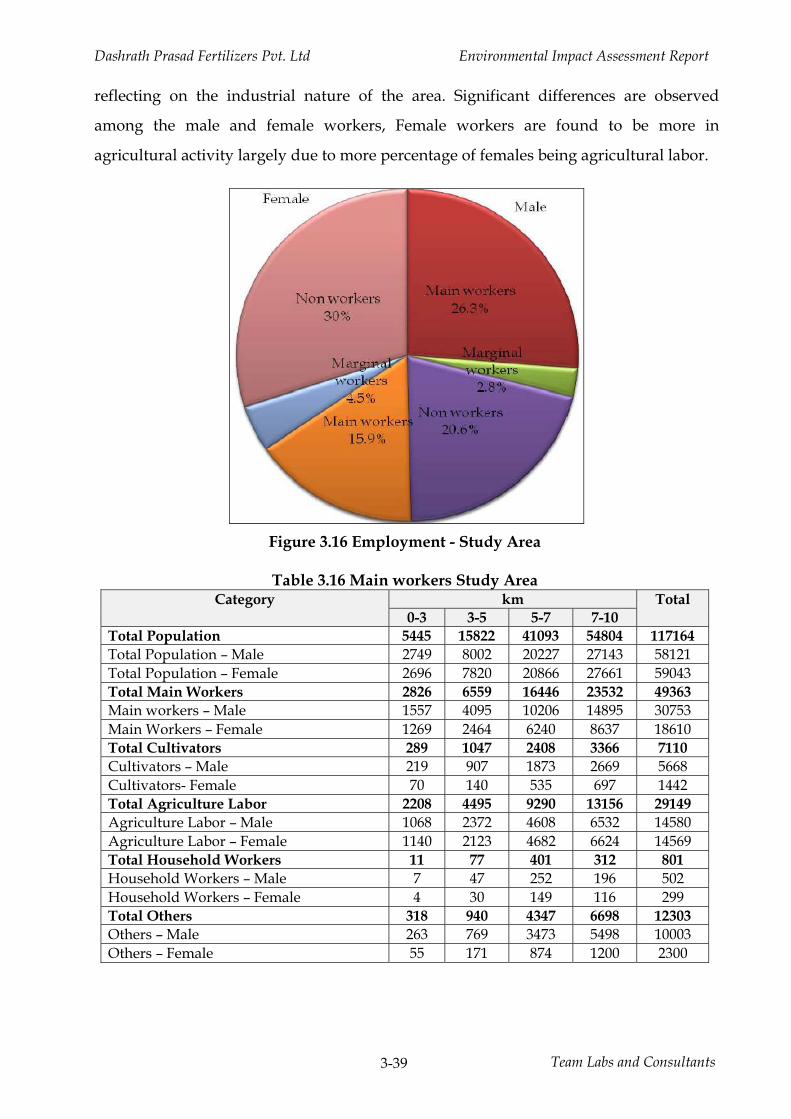
Dashrath Prasad Fertilizers Pvt. Ltd Environmental Impact Assessment Report
Team Labs and Consultants 3-39
reflecting on the industrial nature of the area. Significant differences are observed
among the male and female workers, Female workers are found to be more in
agricultural activity largely due to more percentage of females being agricultural labor.
Figure 3.16 Employment - Study Area
Table 3.16 Main workers Study Area
Category km Total 0-3 3-5 5-7 7-10
Total Population 5445 15822 41093 54804 117164 Total Population – Male 2749 8002 20227 27143 58121 Total Population – Female 2696 7820 20866 27661 59043 Total Main Workers 2826 6559 16446 23532 49363 Main workers – Male 1557 4095 10206 14895 30753 Main Workers – Female 1269 2464 6240 8637 18610 Total Cultivators 289 1047 2408 3366 7110 Cultivators – Male 219 907 1873 2669 5668 Cultivators- Female 70 140 535 697 1442 Total Agriculture Labor 2208 4495 9290 13156 29149 Agriculture Labor – Male 1068 2372 4608 6532 14580 Agriculture Labor – Female 1140 2123 4682 6624 14569 Total Household Workers 11 77 401 312 801 Household Workers – Male 7 47 252 196 502 Household Workers – Female 4 30 149 116 299 Total Others 318 940 4347 6698 12303 Others – Male 263 769 3473 5498 10003 Others – Female 55 171 874 1200 2300
Dashrath Prasad Fertilizers Pvt. Ltd Environmental Impact Assessment Report
Team Labs and Consultants 3-40
3.6.1.3 Living Standards and Infrastructure
Sustainable development of any area is dependent not only the population but also on
the availability of infrastructure which leads to better living standards. The
infrastructure facilities are essential in providing education, awareness, health,
communication, potable water, transport etc. The standards of living are the sum of the
availability of the infrastructure to the subject community, wide variations in terms of
income, economic conditions and patterns of spending.
The infrastructure facilities available in the impact zone are reflecting the rural nature
of the entire study area.
I. Educational Facilities
The educational facilities available in the rural areas are meager, despite the proximity
to urban area of Kalluru and Tiruvuru. There are 85 primary schools, 8 middle schools
and 14 high schools in the study area. There are three junior colleges in the area. The
higher educational need of the population is met by Kalluru and Tiruvuru, which has a
number of private engineering college, PG colleges, junior olleges and degree colleges.
The distict Head quater of Khammam caters to educational needs of surrounding areas
ad fer as 50 kms away from Kalluru and Tiruvuru.
II. Health facilities
The medical and health facilities available in the impact zone are inadequate; there are
two PHC, twenty PHS and no child welfare centers and 1 RP centre in the entire area.
The health needs of the population in this area are met by quacks and other semi
qualified persons.
III. Availability of Potable Water
The entire population in this area is dependent on ground water for drinking purposes.
There are no protected water supply schemes in all the villages except in 2 villages.
About 12 villages in the study area are dependent on tube wells, while the remaining
villages are dependent on wells and hand pumps.
Dashrath Prasad Fertilizers Pvt. Ltd Environmental Impact Assessment Report
Team Labs and Consultants 3-41
IV. Transport and Communication
Transport is essentially provided by the Telangana State Road Transport Corporation
(TSRTC)/ Andhra Pradesh State Road Transport Corporation (APSRTC). Most of the
study area has excellent road network in all the villages except in one village, which has
kacha roads. TSRTC/APSRTC bus facility is available for the all the villages. However
it is observed that a number of private transport vehicles are observed in the area
connecting them to Kalluru and Tiruvuru.
V. Sources of Energy and Availability
The primary source of energy in the study area is electricity, and the entire study area
has electricity for agriculture and domestic purpose. The urban areas have LPG facility
for their cooking purpose. A significant number of people in the urban area are also
dependent on Kerosene for cooking purposes, which is contingent on the vagaries of
public distribution system. A majority of the rural area is mostly dependent on
Kerosene, dried cow dung cakes, wood from roadside trees for their domestic energy
needs.
VI. Post and Telegraph facilities
There are 2 post offices in the area and one post and Telegraph office in the study area.
Phone facilities however are extended to some of the villages.
VII. Housing
Census defines the house hold as a group of persons living together and sharing their
meals from a common kitchen. The number of households in the impact zone is 26784,
while the number of the houses is 26557. The density of the households is
approximately four. The traditional houses made up of mud walls and covered by dry
common grass and leaves of bourses are commonly found in the rural area, which are
not considered pucca houses. The government has been augmenting the housing
standards by constructing housing colonies for various weaker sections of the society.
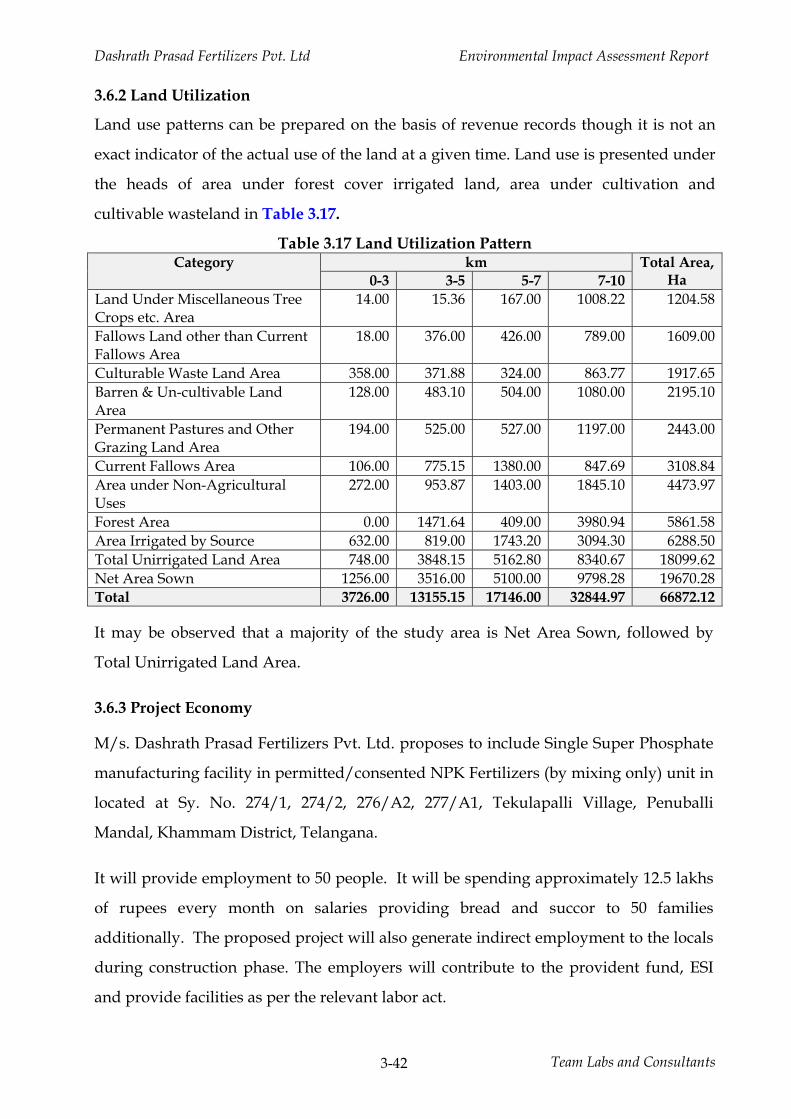
Dashrath Prasad Fertilizers Pvt. Ltd Environmental Impact Assessment Report
Team Labs and Consultants 3-42
3.6.2 Land Utilization
Land use patterns can be prepared on the basis of revenue records though it is not an
exact indicator of the actual use of the land at a given time. Land use is presented under
the heads of area under forest cover irrigated land, area under cultivation and
cultivable wasteland in Table 3.17.
Table 3.17 Land Utilization Pattern Category km Total Area,
Ha 0-3 3-5 5-7 7-10 Land Under Miscellaneous Tree Crops etc. Area
14.00 15.36 167.00 1008.22 1204.58
Fallows Land other than Current Fallows Area
18.00 376.00 426.00 789.00 1609.00
Culturable Waste Land Area 358.00 371.88 324.00 863.77 1917.65 Barren & Un-cultivable Land Area
128.00 483.10 504.00 1080.00 2195.10
Permanent Pastures and Other Grazing Land Area
194.00 525.00 527.00 1197.00 2443.00
Current Fallows Area 106.00 775.15 1380.00 847.69 3108.84 Area under Non-Agricultural Uses
272.00 953.87 1403.00 1845.10 4473.97
Forest Area 0.00 1471.64 409.00 3980.94 5861.58 Area Irrigated by Source 632.00 819.00 1743.20 3094.30 6288.50 Total Unirrigated Land Area 748.00 3848.15 5162.80 8340.67 18099.62 Net Area Sown 1256.00 3516.00 5100.00 9798.28 19670.28 Total 3726.00 13155.15 17146.00 32844.97 66872.12
It may be observed that a majority of the study area is Net Area Sown, followed by
Total Unirrigated Land Area.
3.6.3 Project Economy
M/s. Dashrath Prasad Fertilizers Pvt. Ltd. proposes to include Single Super Phosphate
manufacturing facility in permitted/consented NPK Fertilizers (by mixing only) unit in
located at Sy. No. 274/1, 274/2, 276/A2, 277/A1, Tekulapalli Village, Penuballi
Mandal, Khammam District, Telangana.
It will provide employment to 50 people. It will be spending approximately 12.5 lakhs
of rupees every month on salaries providing bread and succor to 50 families
additionally. The proposed project will also generate indirect employment to the locals
during construction phase. The employers will contribute to the provident fund, ESI
and provide facilities as per the relevant labor act.
Dashrath Prasad Fertilizers Pvt. Ltd Environmental Impact Assessment Report
Team Labs and Consultants 3-43
The proximity of Kalluru and Tiruvuru will provide access to the extensive medical
facilities available apart from the ESI medical facilities to the employees and their
families. An industrial Canteen is established by the company.
It may be concluded that satisfactory amenities are available for the population of the
impact zone, while the amenities are available either within the village or at a
minimum distance of 8 km. The area also has large tracts of waste lands which can be
utilized for industrial development. The plant has been contributing to the industrial
growth of the area, which in turn; generates employment, and improve the
infrastructure facilities of the area by strengthening the same economically.
3.7 Flora and Fauna
In order to assess the baseline status of the flora of the study area, field surveys were
undertaken during the summer season of 2017. Primary data on flora was collected
from extensive field surveys during the study period. As far as the fauna is concerned,
both primary and secondary were used and validated basing on published reports of
the ZSI, Forest department and research papers.
3.7.1 Flora of the Impact area: The proposed project site is open land surrounded by
Paddy crop. The canals and reserved forest present in the study area are also
considered. The possible impacted regions are studied. The sampling points are
selected in all the directions and ecosystems along with the wind direction pattern.
Identification of Species: Species of flora and fauna are identified through local field
guides. Unidentified plants are taken pictures and later confirmed by forest officials.
Secondary data: The key referral material is from Telangana state working plan data of
the forest department. Certain published papers related to region in the recent years are
also considered. Ground validation has done through elderly village people and
personal field visits.
Within the project site the area is totally covered with small herbs and grass varieties.
The proposed project falls in
Dashrath Prasad Fertilizers Pvt. Ltd Environmental Impact Assessment Report
Team Labs and Consultants 3-44
6D – Deccan Peninsula Deccan Plateau as per the Biogeography Classification of
India.
Hot Semi arid type as per the India's Köppen climate classification.
The vegetation of the study area falls under
5A: Southern tropical dry deciduous forests C3: Southern dry mixed deciduous
forest;
6A: Southern tropical thorn forests DS1: Southern thorn scrub, 2S1: Secondary
dry deciduous forest
by revised classification of Indian forest types (Champion and Seth, 1968). These types
of forests are seen throughout the Eastern Ghats and few parts of Western Ghats of the
country.
Field observation:
The project site with full of weeds and scattered with few shrub species. The entire area
is with terrestrial vegetation is without any forest or agriculture land and it was devoid
of any ecologically sensitive biological resources. No REET species present in the
impact area. No migratory corridors or breeding grounds for faunal species are present.
The common butterflies, dragonflies, lizards, birds and smaller mammals are observed.
The most commonly seen flora in the project site are Achyranthes aspera, Hyptis
suaveolens, Tephrosia purpurea, Ipomoea triloba, Ipomoea obscura, Alternanthera sessilis,
Zizyphus nummularia, Abutilon indicum, Tridax procumbens, Phyllanthus amarus are
dominant here. Lantana camara, Pithacalobium dulsi, Annona squamosa, etc are sporadically
found. Different types of grasses are commonly distributed throughout the region.
Impact area
Impact area is mostly with human habitations. Nagarjuna Sagar 21st main canal,
Madhira Branch canal, Pedda Chreruvu, Kondrupadu Cheruvu are main aquatic
bodies. Azadirachta indica, Ficus hispida, Prosopis juliflora, Pongamia pinnata, Dalbergia
sisoo, Phoenix sylvestris, Butea monosperma, Albizia lebbeck, Vitex negundo, Polyalthia
longifolia, Acacia nilotica, Ailanthus excelsa are dominant here. Eucalyptus is widely spread
over buffer zone. Calotropis is the dominant shrub and Pergularia daemia and Ipomoea nil
Dashrath Prasad Fertilizers Pvt. Ltd Environmental Impact Assessment Report
Team Labs and Consultants 3-45
are other climbers commonly present here. Most of the region is covered with roads
and residential colonies. Hence vegetative survey mainly conducted at road side for
trees and near agricultural areas. There are no endangered and endemic plants present
in the impact area. There are no medicinal, timber / fuel wood, fodder and other socio-
economic purposes. The faunal composition was also estimated based on the direct and
indirect evidences.
Among the flora, Tamarindus indica, Acacia auriculiformis, Caesalpinia pulcherrima, Delonix
regia, Peltophorum pterocarpum, Terminalia catappa, Dalbergia sissoo are predominant near
road side. Mangifera and coconut and other common fruit yielding trees are very
common here. Phoenix aculis, Pithecellobium dulce, Pongamia pinnata, Azadirachta indica,
Prosopis spicegera, P. cinerea, Ficus sp, Acacia sp, Tibullus terrstris, Achyranthes aspera,
Hygrophila auriculata, Leucas aspera, Euphorbia cordifolia, E. tirucelli. Opuntia, are mainly
restricted to waste lands. Prosopis juliflora is widely distributed near the nala present
adjoining to plant. Borassus flabellifer, Ailanthus excelsa, Butea monosperma, Cassia siamea,
Gmelina arborea are rarely distributed in the buffer area. No specific plants or animal species
requires conservation. List of tree species found the the impact area is presented in
Table 3.18.
Table 3.18 List of Tree Species Found in the Impact Area S.No. Botanical Name Common name Family
1 Acacia auriculiformis Australia thumma Mimosaceae 2 Acacia chundra Mimosaceae 3 Acacia leucophloea Thella thumma Mimosaceae 4 Acacia nilotica Nalla tumma Mimosaceae 5 Aegle marmelos Maredu Rutaceae 6 Ailanthus excelsa Peddamanu Simaroubaceae 7 Albizia amara Konda sigara Leguminosae 8 Albizia lebbek Dirisanam Mimosaceae 9 Alstonia scholaris Edakulapala Apocynaceae
10 Anacardium occidentale Jeedi mamidi Anacardiaceae 11 Annona squamosa Sithaphalam Annonaceae 12 Anogeissus latifolia Chirumanu Combretaceae 13 Artocarpus heterophyllus Panasa Moraceae 14 Azadirachta indica Vepa Meliaceae 15 Balanites aegyptiaca Adavi velaga Zygophyllaceae 16 Bauhinia purpurea Kanchana u Leguminosaae 17 Bauhinia racemosa Are Caesalpiniaceae 18 Bauhinia retusa Goddari Leguminosae 19 Bauhinia variagata Mandari Caesalpiniaceae
Dashrath Prasad Fertilizers Pvt. Ltd Environmental Impact Assessment Report
Team Labs and Consultants 3-46
20 Borassus flabellifer Taati / Taadi Palmae 21 Bridelia retusa Koramanu Euphorbiaceae 22 Butea frondosa Moduga Leguminosae 23 Caesalpinia pulcherrima Rathna gandhi Fabaceae 24 Caryota urens Jeeluga Palmae 25 Cassia fistula Rela Leguminosae 26 Cassia siamea Seema tangedu Leguminosae 27 Casuarina equisetifolia Sarugudu Casuarinaceae 28 Ceiba pentandra Malvaceae 29 Chloroxylon swietenia Billudu Rutaceae 30 Chukrasia tabularis Konda vepa Meliaceae 31 Cleistanthus collinus Kodisa Euphorbiaceae 32 Cocos nucifera Coconut Araceae 33 Dalbergia lanceolaria Nagalla pachari Leguminosae 34 Dalbergia sissoo Sisso or seesum Caesalpiniaceae 35 Decalepis hahiltonii Maredu kommulu Periplocaceae 36 Delonix regia Chittikesaram Leguminosae 37 Dendrocalamus strictus Sanna vedru Graminae 38 Dichrostachys cinerea Velthuru Leguminosae 39 Diospyros melanoxylon Thumki Euphorbiaceae 40 Dolichandrone falcata Kodavali Bignoniaceae 41 Erythrina indica Baditha Leguminosae 42 Eucalyptus globulus Neelagiri Myrtaceae 43 Euphorbia trigona Kattimandu Fuphorbiaceae 44 Feronia elephantum Velaga Rutaceae 45 Ficus benghalensis Marri Moraceae 46 Ficus hispida Bommedu Moraceae 47 Ficus microcape Moraceae 48 Ficus racemosa Medi Moraceae 49 Ficus religiosa Raavi Moraceae 50 Gmelina arborea Gummadi teku Verbenaceae 51 Gyrocarpus americanus Thanuku Hernandiaceae 52 Hardwickia binata Yepi Leguminosae 53 Holarrhena antidysenterica Pala Apocynaceae 54 Holoptelea integrifolia Nemali naara Ulmaceae 55 Lannea coromandelica Gumpena Anacardiaceae 56 Leucaena leucocephala Subabul Mimosaceae 57 Limonia acidissima Velaga Rutaceae 58 Mangifera indica Mamidi Anacardiaceae 59 Melia azedarach Thuraka vepa Meliaceae 60 Mitragyna parvifolia Battaganike Rubiaceae 61 Morinda tinctoria Thogaru Rubiaceae 62 Nerium odoratum Ganneru Apocynaceae 63 Pandanus tectorius Mogali Pandanaceae 64 Peltophorum pterocarpum Kondachinta Leguminosae 65 Phoenix sylvestris Eetha Araceae 66 Phyllanthus emblica Usiri Euphorbiaceae 67 Pithecellobium dulce Seema chinta Mimosaceae 68 Plumeria alba Tella devaganneru Apocynaceae 69 Plumeria rubra Erra devaganneru Apocynaceae
Dashrath Prasad Fertilizers Pvt. Ltd Environmental Impact Assessment Report
Team Labs and Consultants 3-47
70 Polyalthia longifolia Ashoka Annonaceae 71 Polyalthia pendula Asoka Annonaceae 72 Pongamia pinnata Ganuga Fabaceae 73 Prosopis chilensis Mulla thumma Leguminosae 74 Prosopis juliflora English tumma Mimosaceae 75 Prosopis spicigera Jammi chettu Leguminosaae 76 Randia uliginosa Nalla manga Rubiaceae 77 Samanea saman Nidrabhangi Mimosaceae 78 Sapindus emarginatus Konkudu Sapindaceae 79 Semecarpus anacardium Nalla Jeedi Anacardiaceae 80 Soymida febrifuga Somi Meliaceae 81 Spondias mangifera Adavi-mamidi Anacardiaceae 82 Strychnos nux vomica Musti Loganiaceae 83 Syzygium cumini Neradu Myrtaceae 84 Tamarindus indica Chinta Leguminosae 85 Tecoma stans Patcha turai Bignoniaceae 86 Tectona grandis Teak Verbenaceae 87 Terminalia bellirica Tani Combretaceae 88 Terminelia chebula Karaka Combretaceae 89 Thespecia populnea Ganga Raavi Malvaceae 90 Thevetia neriifolia Pacha ganneru Apocynaceae 91 Trema orientalis Boggu chettu Ulmaceae 92 Vitex negundo Vaavili Verbenaceae 93 Wrightia tinctoria Akupala, Tellapala Apocynaceae 94 Xylocarpus obovatus Senuga Meliaceae 95 Ziziphus jujube Regu Rhamnaceae 96 Ziziphus mauritiana Regu Rhamnaceae 97 Ziziphus oenopolia Pariki Rhamnaceae 98 Aeschynomene aspera Jeluga Leguminosae 99 Agave americana Gitta nara Asparagaceae
100 Aloe vera Kithanara Tiliaceae 101 Caesalpinia bonducella Caesalpinaceae 102 Calotropis gigantea Tella Jilledu Asclepiadaceae 103 Carissa carandas Apocynaceae 104 Cassia auriculata Leguminosae 105 Desmodium pulchellum Deyyapu mokka Laguminosae 106 Dodonaea viscosa Bandedu Sapindaceae 107 Erythroxylon monogynum Dedaraaku Erythroxylaceae 108 Euphorbia cactus Jemudu Euphorbiaceae 109 Grewia obtusa Jaana Tiliaceae 110 Grewia tilliaefolia Pedda Jaana Thada Tiliaceae 111 Grewia hirsuta Jana Tiliaceae 112 Ipomoea carnea Rubber mokka Convolvulaceae 113 Ixora coccinea Ramabanam Rubiaceae 114 Jatropha glandulifera Yerranepalamu Euphorbiaceae 115 Lantana camara Lantana Verbenaceae 116 Opuntia elatior Nagamullu Cactaceae 117 Parkinsonia aculeata Simathumma Leguminosae 118 Pavetta indica Papidi Rubiaceae 119 Phoenix acaulis Chitteetha Palmae
Dashrath Prasad Fertilizers Pvt. Ltd Environmental Impact Assessment Report
Team Labs and Consultants 3-48
120 Plumbago zeylanica Chitramulam Plumbaginaceae 121 Randia dumetorum Rubiaceae 122 Xanthium strumarium Marula-Mathangi Asteraceae 123 Azolla pinnata Salviniaceae 124 Eichornia crassipes Pontederiaceae 125 Hydrilla verticillata Hydrocharitaceae 126 Ipomoea aquatica Thooti Koora Convolvulaceae 127 Lemna minor Araceae 128 Limnophila Plantaginaceae 129 Nelumbo nucifera Nelumbonaceae 130 Nymphaea pubescens Nymphaeaceae 131 Nymphoides hydrophylla Kukk-Tamara Menyanthaceae 132 Operculina turpethum Erra Tegada Convolvulaceae 133 Pistia Araceae 134 Typha angustata Jammu Typhaceae 135 Abutilon indicum Thuthuru Benda Malvaceae 136 Acalypha indica Euphorbiaceae 137 Achyranthes aspera Uttareni Amaranthaceae 138 Aerva lanata Konda Pindi Amaranthaceae 139 Ageratum conyzoides Vasavi Asteraceae 140 Alternanthera sessilis Ponaganti kura Amaranthaceae 141 Amaranthus spinosus Mulla thotakoora Amaranthaceae 142 Amaranthus viridis Chilakathotakoora Amaranthaceae 143 Andrographis echioides Chalavala puri kada Acanthaceae 144 Andrographis paniculata Nela Vemu Acanthaceae 145 Argemone mexicana Bhrama dandi Papaveraceae 146 Asparagus racemosus Pilliteegalu Asperagaceae 147 Barleria montana Konda picchi chettu Acanthaceae 148 Barleria prionitis Acanthaceae 149 Biophytum nervifolium Junuku Malpighiaceae 150 Blumea mollis Kukkapogaku Asteraceae 151 Boerhavia diffusa Atukamaamidi Nyctaginaceae 152 Boerhavia erecta Nyctaginaceae 153 Cassia occidentalis Adavi Chennangi Leguminosae 154 Cassia tora Tagarisa Caesalpiniaceae 155 Catharanthus roseus Billaganneru Apocynaceae 156 Cleome gynandra African cabbage Cleomaceae 157 Cleome viscosa Yerri Vaminta Cleomaceae 158 Colocasia esculenta Atuka tiga Araceae 159 Cressa cretica Convolvulaceae 160 Crotalaria retusa Leguminosae 161 Crotan bonplantianum Bhu thulasi Euphorbiacea 162 Cynodon dactylon Garika Poaceae 163 Cyperus castaneus Poaceae 164 Datura metel Nalla Ummetta Solanaceae 165 Datura stramonium Tella Ummetta Solanaceae 166 Dioscorea oppositifolia Adda dumpa Dioscoreaceae 167 Eclipta alba Gunta galijru Asteraceae 168 Euphorbia antiquorum Bontha Jemudu Euphorbiaceae 169 Euphorbia hirta Nanubalu Euphorbiaceae
Dashrath Prasad Fertilizers Pvt. Ltd Environmental Impact Assessment Report
Team Labs and Consultants 3-49
170 Euphorbia nivulia Aaku jemudu Euphorbiaceae 171 Euphorbia pulcherima Euphorbiaceae 172 Euphorbia tirucalli Tirucalli Euphorbiaceae 173 Hyptis suaveolens Maha beera Lamiaceae 174 Leucas aspera Tummi Lamiaceae 175 Leucas cephalotes Thummi Lamiaceae 176 Mimosa pudica Atthi pathi Leguminosae 177 Mollugo nudicaulis Peddaparapatakamu Molluginaceae 178 Ocimum sanctum Tulasi Lamiaceae 179 Oldenlandia umbellata Chiru veru Rubiaceae 180 Oxalis corniculata Indian Sorrel Oxalidaceae 181 Parthenium hysterophorus Congress Grass Asteraceae 182 Pavonia zeylanica Karubenda Malvaceae 183 Phyllanthus amanus Nela Usiri Euphorbiaceae 184 Phyllanthus reticulatus Pulasari / Puliseru Euphorbiaceae 185 Physalis minima Budda bhushada Solanaceae 186 Portulaca quadrifida Goddu pavali Portulacaceae 187 Ruellia tuberosa chetapatakaayala mokka Acanthaceae 188 Sesamum alatum Rekka nuvvulu Pedaliaceae 189 Sesuvium maritimum Aizoaceae 190 Sida acuta Bala Malvaceae 191 Sida cordata Bala Malvaceae 192 Solanum surattense Nela Vakudu Solanaceae 193 Solanum trilobatum Vuchinta Solanaceae 194 Solanum xanthocarpum Vakabu Solanaceae 195 Sphaeranthus indicus Bodasaramu Asteraceae 196 Tephrosia purpurea Vempala Leguminosae 197 Tridax procumbens Asteraceae 198 Triumfetta rhomboidea Marla Benda Taccaceae 199 Urena lobata Pedda benda Malvaceae 200 Vanda tessellata Kodikalla chettu Orchidaceae 201 Vernonia cinerea Sahadevi Asteraceae 202 Waltheria indica Nalla Benda Sterculiaceae 203 Ziziphus nummularia Nela regu Rhamnaceae 204 Brachiaria eruciformis Poaceae 205 Chloris barbata Poaceae 206 Cymbopogon citratus Poaceae 207 Cyperus flavidus Cyperaceae 208 Cyperus rotundus Cyperaceae 209 Digitaria ciliaris Poaceae 210 Eragrostis tenella Poaceae 211 Fimbristylis cymosa Pulupu gaddi Cyperaceae 212 Saccharum spontaneum Kaki Cheraku Poaceae 213 Spinifex littoreus Poaceae 214 Zizania latifolia Poaceae 215 Abrus precatorius Guriginja Leguminosae 216 Acacia caesia Kirintha Mimosaceae 217 Aristolochia indica Iswara theega Aristolochiaceae 218 Bauhinia vahlii Adda theega Leguminosaae 219 Cardiospermum halicacabum Sapindaceae
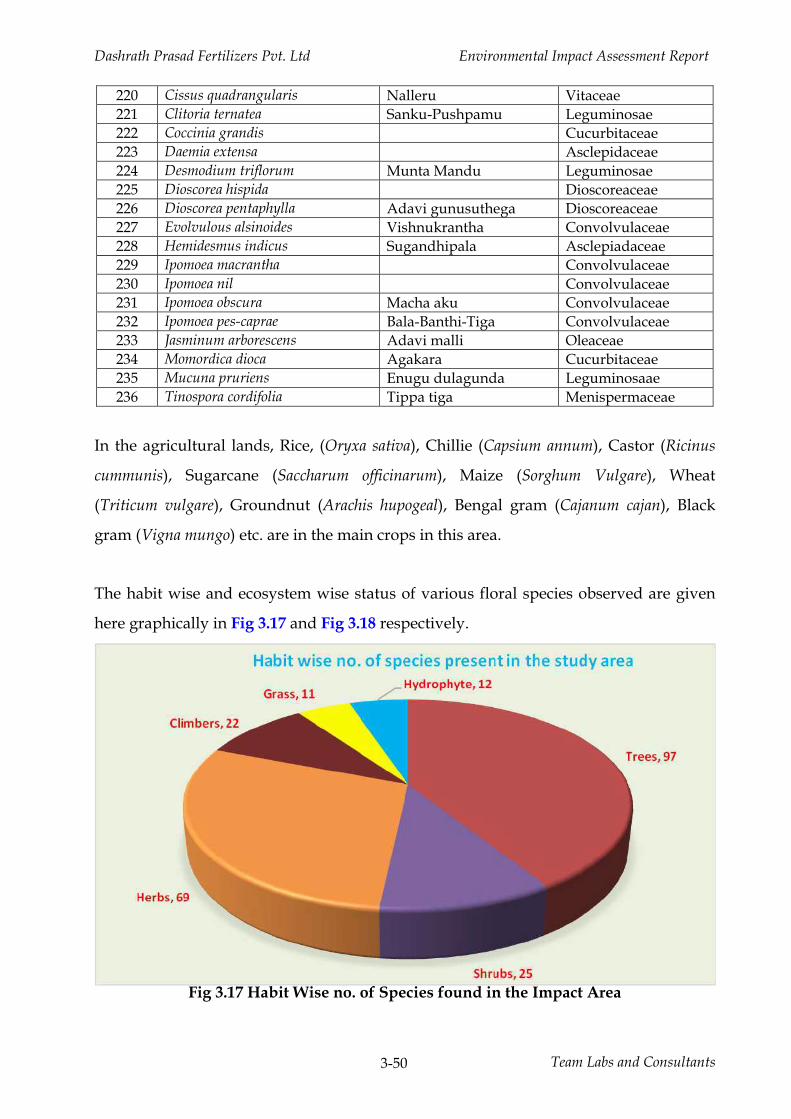
Dashrath Prasad Fertilizers Pvt. Ltd Environmental Impact Assessment Report
Team Labs and Consultants 3-50
220 Cissus quadrangularis Nalleru Vitaceae 221 Clitoria ternatea Sanku-Pushpamu Leguminosae 222 Coccinia grandis Cucurbitaceae 223 Daemia extensa Asclepidaceae 224 Desmodium triflorum Munta Mandu Leguminosae 225 Dioscorea hispida Dioscoreaceae 226 Dioscorea pentaphylla Adavi gunusuthega Dioscoreaceae 227 Evolvulous alsinoides Vishnukrantha Convolvulaceae 228 Hemidesmus indicus Sugandhipala Asclepiadaceae 229 Ipomoea macrantha Convolvulaceae 230 Ipomoea nil Convolvulaceae 231 Ipomoea obscura Macha aku Convolvulaceae 232 Ipomoea pes-caprae Bala-Banthi-Tiga Convolvulaceae 233 Jasminum arborescens Adavi malli Oleaceae 234 Momordica dioca Agakara Cucurbitaceae 235 Mucuna pruriens Enugu dulagunda Leguminosaae 236 Tinospora cordifolia Tippa tiga Menispermaceae
In the agricultural lands, Rice, (Oryxa sativa), Chillie (Capsium annum), Castor (Ricinus
cummunis), Sugarcane (Saccharum officinarum), Maize (Sorghum Vulgare), Wheat
(Triticum vulgare), Groundnut (Arachis hupogeal), Bengal gram (Cajanum cajan), Black
gram (Vigna mungo) etc. are in the main crops in this area.
The habit wise and ecosystem wise status of various floral species observed are given
here graphically in Fig 3.17 and Fig 3.18 respectively.
Fig 3.17 Habit Wise no. of Species found in the Impact Area
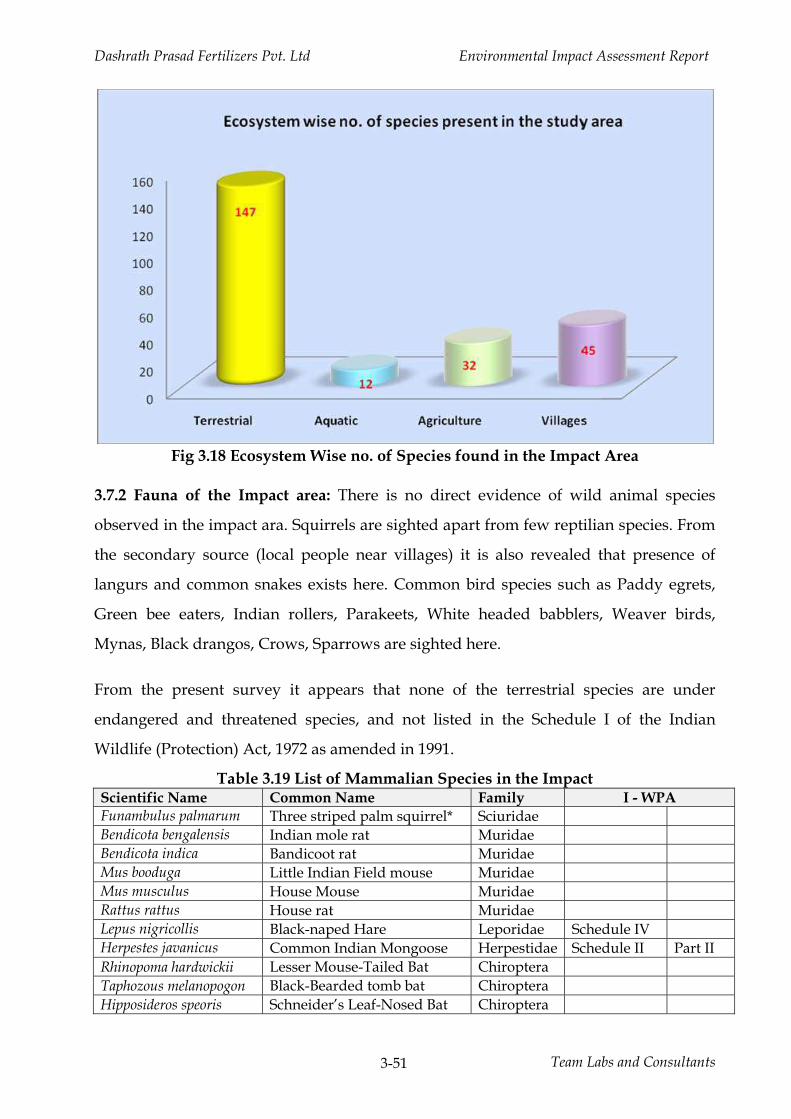
Dashrath Prasad Fertilizers Pvt. Ltd Environmental Impact Assessment Report
Team Labs and Consultants 3-51
Fig 3.18 Ecosystem Wise no. of Species found in the Impact Area
3.7.2 Fauna of the Impact area: There is no direct evidence of wild animal species
observed in the impact ara. Squirrels are sighted apart from few reptilian species. From
the secondary source (local people near villages) it is also revealed that presence of
langurs and common snakes exists here. Common bird species such as Paddy egrets,
Green bee eaters, Indian rollers, Parakeets, White headed babblers, Weaver birds,
Mynas, Black drangos, Crows, Sparrows are sighted here.
From the present survey it appears that none of the terrestrial species are under
endangered and threatened species, and not listed in the Schedule I of the Indian
Wildlife (Protection) Act, 1972 as amended in 1991.
Table 3.19 List of Mammalian Species in the Impact Scientific Name Common Name Family I - WPA Funambulus palmarum Three striped palm squirrel* Sciuridae Bendicota bengalensis Indian mole rat Muridae Bendicota indica Bandicoot rat Muridae Mus booduga Little Indian Field mouse Muridae Mus musculus House Mouse Muridae Rattus rattus House rat Muridae Lepus nigricollis Black-naped Hare Leporidae Schedule IV Herpestes javanicus Common Indian Mongoose Herpestidae Schedule II Part II Rhinopoma hardwickii Lesser Mouse-Tailed Bat Chiroptera Taphozous melanopogon Black-Bearded tomb bat Chiroptera Hipposideros speoris Schneider’s Leaf-Nosed Bat Chiroptera
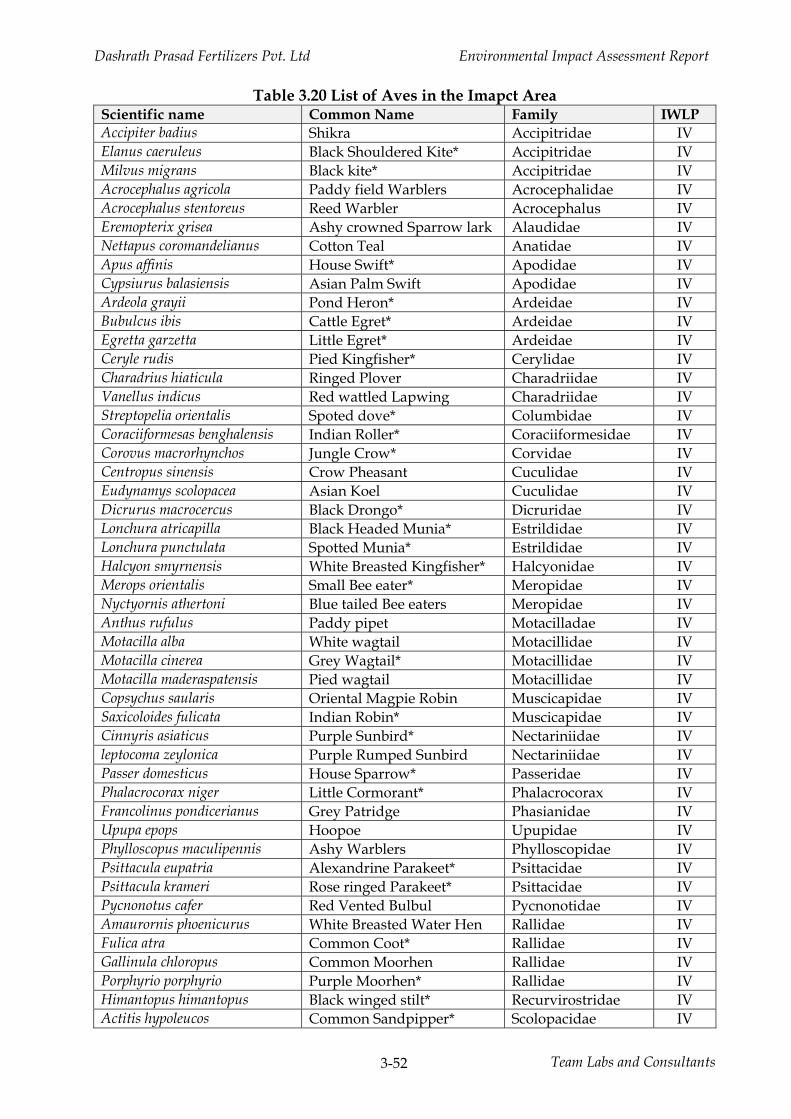
Dashrath Prasad Fertilizers Pvt. Ltd Environmental Impact Assessment Report
Team Labs and Consultants 3-52
Table 3.20 List of Aves in the Imapct Area Scientific name Common Name Family IWLP Accipiter badius Shikra Accipitridae IV Elanus caeruleus Black Shouldered Kite* Accipitridae IV Milvus migrans Black kite* Accipitridae IV Acrocephalus agricola Paddy field Warblers Acrocephalidae IV Acrocephalus stentoreus Reed Warbler Acrocephalus IV Eremopterix grisea Ashy crowned Sparrow lark Alaudidae IV Nettapus coromandelianus Cotton Teal Anatidae IV Apus affinis House Swift* Apodidae IV Cypsiurus balasiensis Asian Palm Swift Apodidae IV Ardeola grayii Pond Heron* Ardeidae IV Bubulcus ibis Cattle Egret* Ardeidae IV Egretta garzetta Little Egret* Ardeidae IV Ceryle rudis Pied Kingfisher* Cerylidae IV Charadrius hiaticula Ringed Plover Charadriidae IV Vanellus indicus Red wattled Lapwing Charadriidae IV Streptopelia orientalis Spoted dove* Columbidae IV Coraciiformesas benghalensis Indian Roller* Coraciiformesidae IV Corovus macrorhynchos Jungle Crow* Corvidae IV Centropus sinensis Crow Pheasant Cuculidae IV Eudynamys scolopacea Asian Koel Cuculidae IV Dicrurus macrocercus Black Drongo* Dicruridae IV Lonchura atricapilla Black Headed Munia* Estrildidae IV Lonchura punctulata Spotted Munia* Estrildidae IV Halcyon smyrnensis White Breasted Kingfisher* Halcyonidae IV Merops orientalis Small Bee eater* Meropidae IV Nyctyornis athertoni Blue tailed Bee eaters Meropidae IV Anthus rufulus Paddy pipet Motacilladae IV Motacilla alba White wagtail Motacillidae IV Motacilla cinerea Grey Wagtail* Motacillidae IV Motacilla maderaspatensis Pied wagtail Motacillidae IV Copsychus saularis Oriental Magpie Robin Muscicapidae IV Saxicoloides fulicata Indian Robin* Muscicapidae IV Cinnyris asiaticus Purple Sunbird* Nectariniidae IV leptocoma zeylonica Purple Rumped Sunbird Nectariniidae IV Passer domesticus House Sparrow* Passeridae IV Phalacrocorax niger Little Cormorant* Phalacrocorax IV Francolinus pondicerianus Grey Patridge Phasianidae IV Upupa epops Hoopoe Upupidae IV Phylloscopus maculipennis Ashy Warblers Phylloscopidae IV Psittacula eupatria Alexandrine Parakeet* Psittacidae IV Psittacula krameri Rose ringed Parakeet* Psittacidae IV Pycnonotus cafer Red Vented Bulbul Pycnonotidae IV Amaurornis phoenicurus White Breasted Water Hen Rallidae IV Fulica atra Common Coot* Rallidae IV Gallinula chloropus Common Moorhen Rallidae IV Porphyrio porphyrio Purple Moorhen* Rallidae IV Himantopus himantopus Black winged stilt* Recurvirostridae IV Actitis hypoleucos Common Sandpipper* Scolopacidae IV
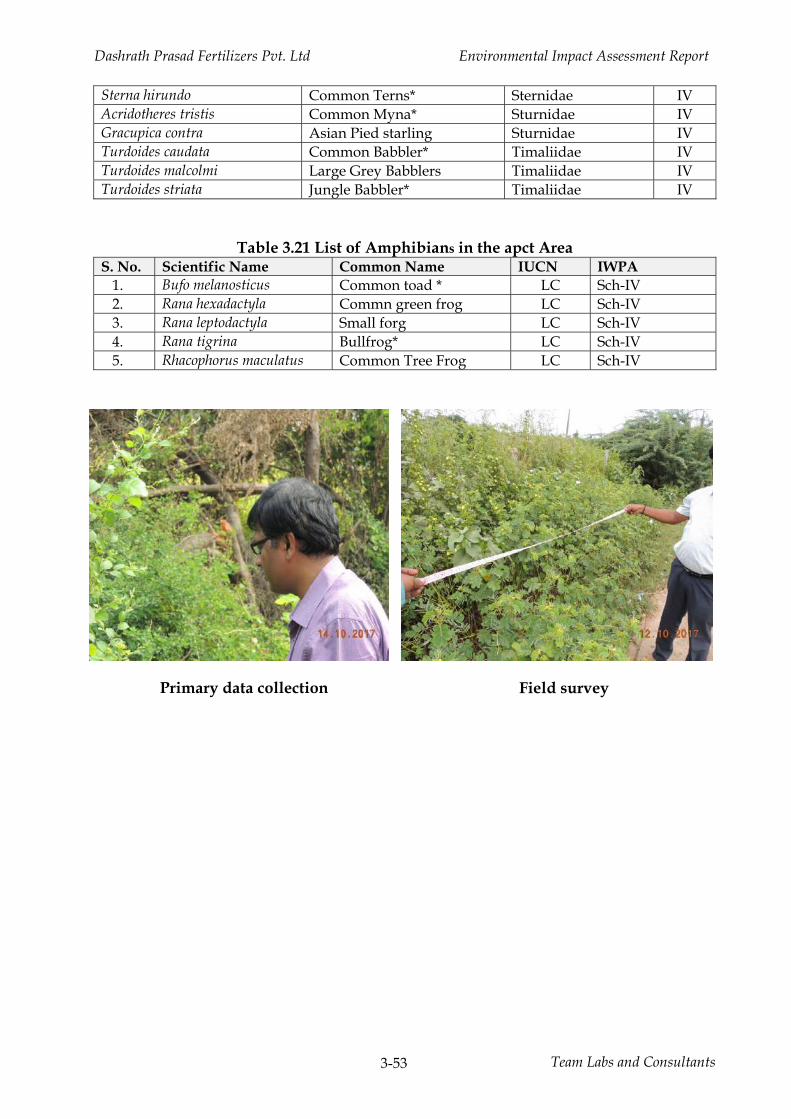
Dashrath Prasad Fertilizers Pvt. Ltd Environmental Impact Assessment Report
Team Labs and Consultants 3-53
Sterna hirundo Common Terns* Sternidae IV Acridotheres tristis Common Myna* Sturnidae IV Gracupica contra Asian Pied starling Sturnidae IV Turdoides caudata Common Babbler* Timaliidae IV Turdoides malcolmi Large Grey Babblers Timaliidae IV Turdoides striata Jungle Babbler* Timaliidae IV
Table 3.21 List of Amphibians in the apct Area S. No. Scientific Name Common Name IUCN IWPA
1. Bufo melanosticus Common toad * LC Sch-IV 2. Rana hexadactyla Commn green frog LC Sch-IV 3. Rana leptodactyla Small forg LC Sch-IV 4. Rana tigrina Bullfrog* LC Sch-IV 5. Rhacophorus maculatus Common Tree Frog LC Sch-IV
Primary data collection
Field survey
Dashrath Prasad Fertilizers Pvt. Ltd Environmental Impact Assessment Report
4-1 Team Labs and Consultants
CHAPTER 4.0 ANTICIPATED ENVIRONMENTAL IMPACTS
4.1 Identification of Impacts
Identification of Impacts is one of the basic analytical steps of EIA for subsequent
prediction and evaluation of impacts. Impact is a change in baseline due to interaction
of a development activity with environment, or interaction of environment with
development activity, or change in baseline due to a man made emergency. The
proposed inclusion of Single Super Phosphate (SSP) manufacturing facility in
permitted/consented NPK Fertilizers (by mixing only) unit. The impacts were assessed
for construction stage, operation stage and emergency cases. Initially the assessment
was done to identify impacts due to the proposed development activity using net work
method which mainly follows cause condition and effect relationship. The interaction
of project activity on the environment was assessed by posing questions related to each
aspect of project activity envisaged as part of Dashrath Prasad Fertilizers Pvt. Ltd.
4.1.1 Impact Networks
The purpose of identifying the impacts is that it aids in making appropriate decision to
mitigate the adverse consequences if any. It may be pointed out that the distinction
between magnitude and importance of impact should be appreciated. Thus the degree
of extensiveness and scale of impacts and the consequences based on value judgments
are generalized while identifying impacts; as it is imperative that the impact will
normally lead to a chain of reactions. The construction of network charts brings out to
certain extent the appropriate levels of risks that may occur due to the interventions
while interacting with hydrological, biological and social systems. Figure 4.1 to 4.6
present the identified impacts for various components of environment viz. air, noise,
water, land and socio economic aspects. In the above-mentioned Figure the lines mean -
- "has an effect on."
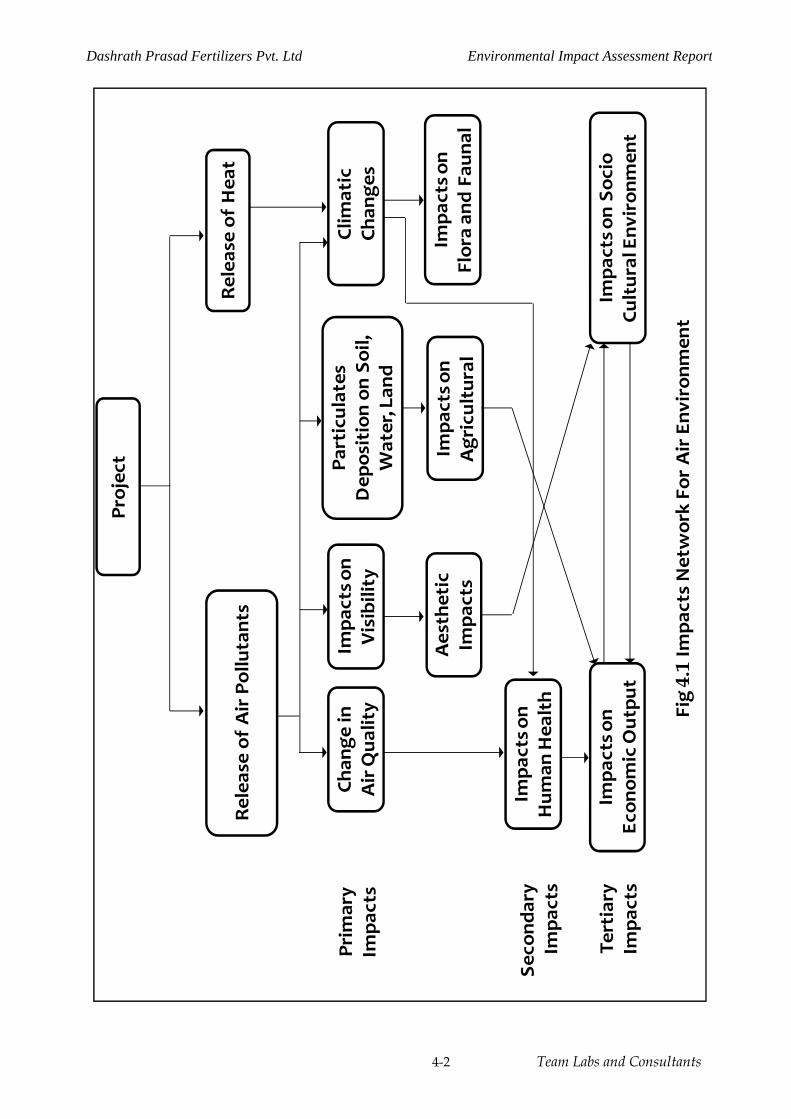
Dashrath Prasad Fertilizers Pvt. Ltd Environmental Impact Assessment Report
4-2 Team Labs and Consultants
Projec
t
Relea
se of Air Pollutant
s
Prim
ary
Impa
cts
Chan
ge in
Air Qua
lity
Impa
cts o
n Visibility
Particulates
Dep
osition on Soil,
Water, Lan
d
Clim
atic
Chan
ges
Aes
thetic
Impa
cts
Impa
cts o
n Agr
icultural
Impa
cts o
n Flor
a an
d Fa
unal
Impa
cts o
n Hum
an Hea
lth
Impa
cts o
n Ec
onom
ic Out
put
Seco
ndary
Impa
cts
Tertiary
Impa
cts
Impa
cts o
n So
cio
Cultur
al Env
iron
men
t
Relea
se of Hea
t
Fig
4.1Im
pacts Networ
k Fo
r Air Env
iron
men
t
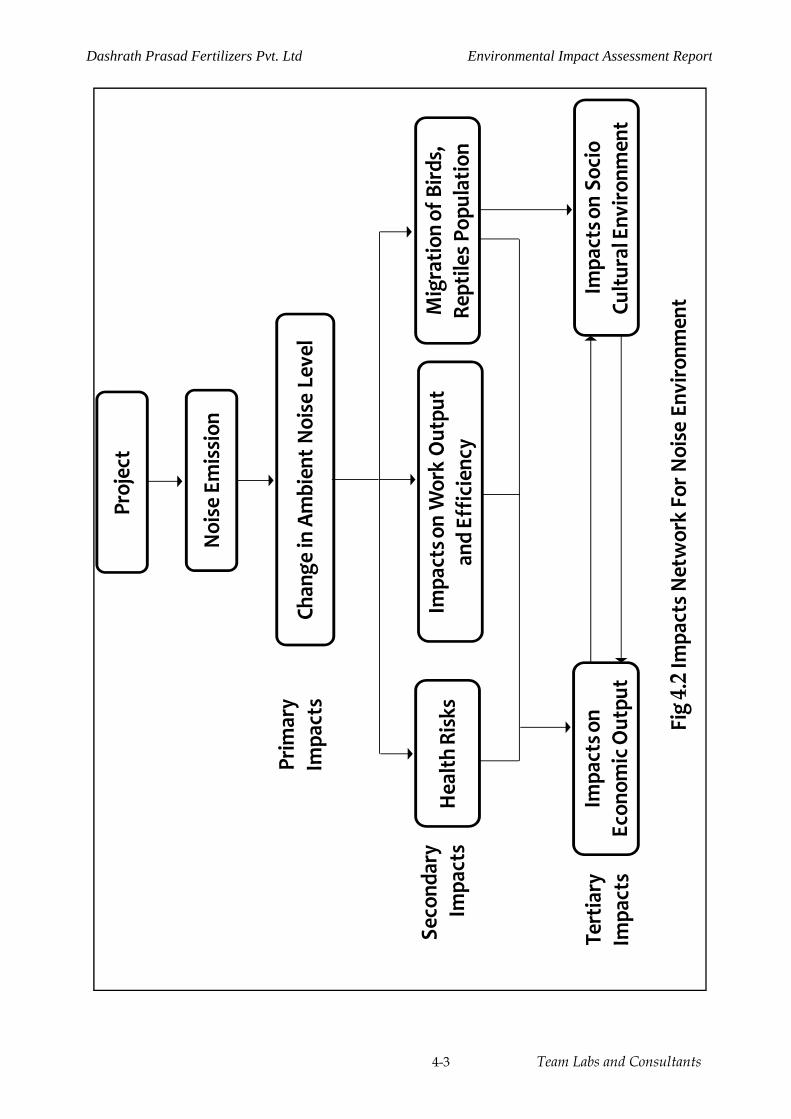
Dashrath Prasad Fertilizers Pvt. Ltd Environmental Impact Assessment Report
4-3 Team Labs and Consultants
Projec
t
Prim
ary
Impa
cts
Hea
lth Risks
Migratio
n of Bird
s,
Rept
iles P
opulation
Impa
cts o
n Ec
onom
ic Out
put
Seco
ndary
Impa
cts
Tertiary
Impa
cts
Impa
cts o
n So
cio
Cultu
ral E
nviro
nmen
t
Fig
4.2I
mpa
cts N
etwor
k Fo
r Noise Env
ironm
ent
Noise Emission
Chan
ge in Ambien
t Noise Lev
el
Impa
cts o
n Wor
k Out
put
and Ef
ficienc
y
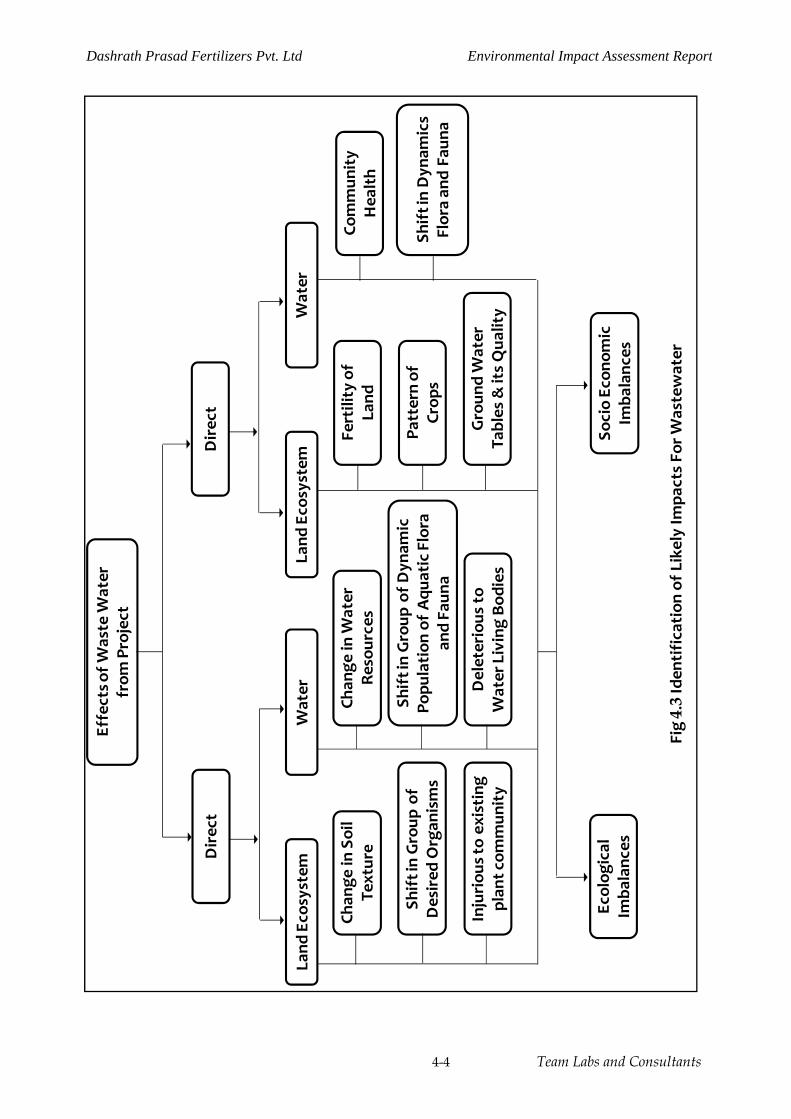
Dashrath Prasad Fertilizers Pvt. Ltd Environmental Impact Assessment Report
4-4 Team Labs and Consultants
Effects o
f Was
te W
ater
from
Pro
ject
Land Eco
system
Chan
ge in Soil
Textur
e
Fig
4.3Iden
tifica
tion of L
ikely Im
pacts Fo
r Was
tewater
Direc
t
Shift in Gro
up of
Des
ired O
rgan
isms
Injuriou
s to ex
isting
plan
t com
mun
ity
Water
Chan
ge in W
ater
Reso
urce
s
Shift in Gro
up of D
ynam
ic
Popu
lation of Aqu
atic Flora
and Fa
una
Deleterious to
Water Living Bo
dies
Land Eco
system
Fertility of
Land
Direc
t
Pattern of
Crop
s
Gro
und W
ater
Tables & its Qua
lityWater
Commun
ity
Hea
lth
Shift in Dyn
amics
Flor
a an
d Fa
una
Ecolog
ical
Imba
lanc
esSo
cio Ec
onom
ic
Imba
lanc
es
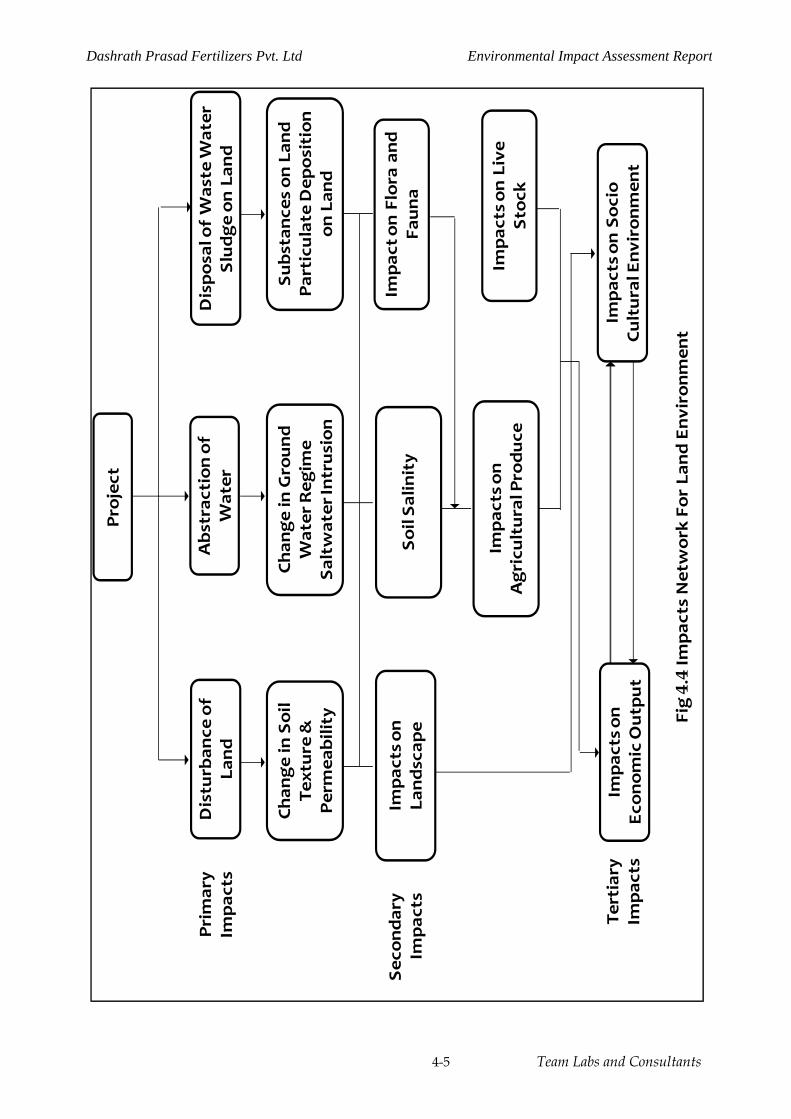
Dashrath Prasad Fertilizers Pvt. Ltd Environmental Impact Assessment Report
4-5 Team Labs and Consultants
Project
Distu
rban
ce of
Land
Prim
ary
Impa
cts
Seco
ndary
Impa
cts
Fig
4.4Im
pacts Networ
k Fo
r La
nd Env
iron
men
t
Abs
trac
tion of
Water
Dispo
sal o
f W
aste W
ater
Slud
ge on La
nd
Chan
ge in Soil
Textur
e &
Perm
eability
Chan
ge in Gro
und
Water Reg
ime
Saltwater In
trus
ion
Subs
tanc
es on La
nd
Particulate Dep
osition
on La
nd
Soil Sa
linity
Impa
cts o
n La
ndscap
eIm
pact on Flor
a an
d Fa
una
Impa
cts o
n Agr
icultu
ral P
rodu
ceIm
pacts o
n Live
Stoc
k
Impac
ts on
Econ
omic Out
put
Tertiary
Impa
cts
Impa
cts o
n So
cio
Cultural E
nviron
men
t

Dashrath Prasad Fertilizers Pvt. Ltd Environmental Impact Assessment Report
4-6 Team Labs and Consultants
Pro
ject
Nitro
gen Fixing
Fig 4
.5Im
pac
ts Network For Soil Micro Flora and Fau
na
Was
tewater
Soil Matrix
Soil Acidification
Affec
t Native Soil Biota
Air Emission
Solid W
aste
Nitrifying
Oth
er PH Sen
sitive
Micro Flora
Dec
omposition M
ineralization of Org
anic M
atter
Red
uction in Soil Fe
rtility and Pro
ductivity
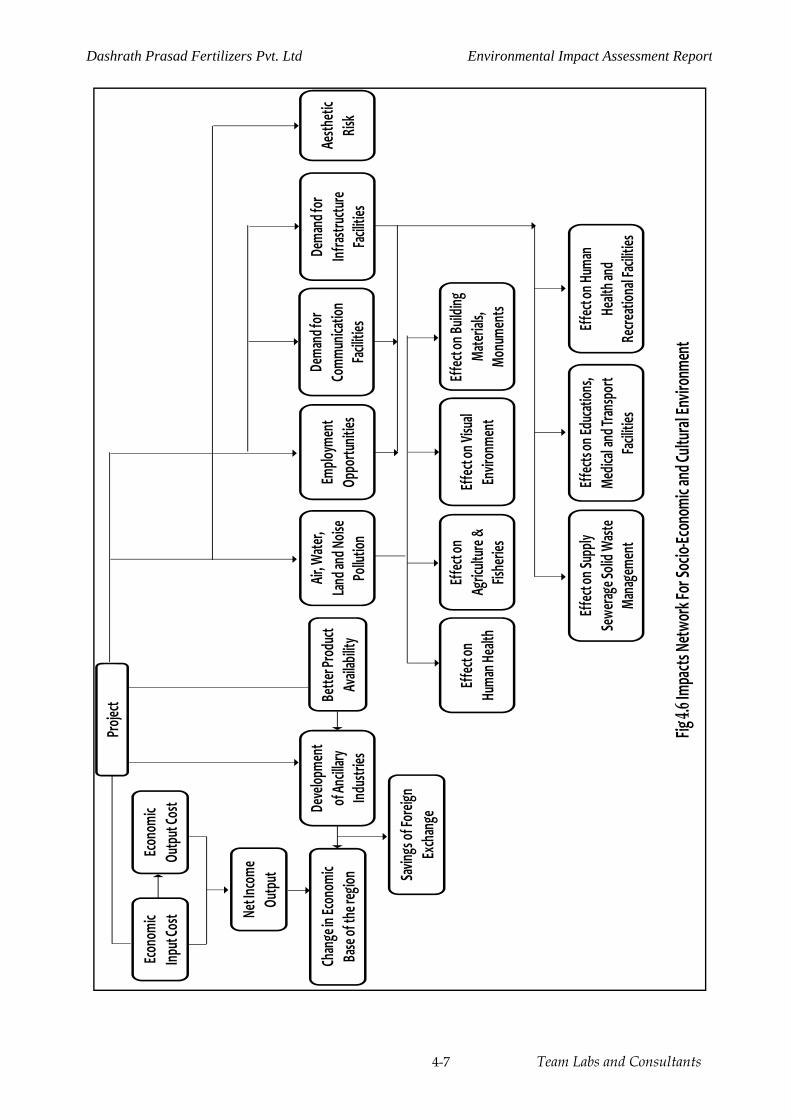
Dashrath Prasad Fertilizers Pvt. Ltd Environmental Impact Assessment Report
4-7 Team Labs and Consultants
Proje
ct
Fig 4.6
Impa
cts Ne
twor
k For
Socio‐Ec
onom
ic and Cu
ltural En
viron
ment
Econ
omic
Input
Cost
Econ
omic
Outp
ut Co
st
Net In
come
Ou
tput
Chan
ge in Ec
onom
ic Ba
se of th
e reg
ion
Deve
lopme
nt
of An
cillary
Ind
ustri
es
Savin
gs of Fo
reign
Exch
ange
Bette
r Pro
duct
Avail
abilit
y
Air, W
ater,
Land an
d Nois
e Po
llutio
n
Emplo
ymen
t Op
portu
nities
Dema
nd fo
r Co
mmun
icatio
n Fa
cilitie
s
Dema
nd fo
r Inf
rastru
cture
Facili
ties
Aesth
etic
Risk
Effec
t on
Huma
n Hea
lth
Effec
t on
Agric
ulture
&
Fishe
ries
Effec
t on V
isual
Envir
onme
nt
Effec
t on B
uildin
g Ma
terial
s, Mo
nume
nts
Effec
t on S
upply
Se
werag
e Soli
d Wast
e Ma
nage
ment
Effec
ts on Ed
ucati
ons,
Medic
al an
d Tran
spor
t Fa
cilitie
s
Effec
t on H
uman
Healt
h and
Recre
ation
al Fa
cilitie
s
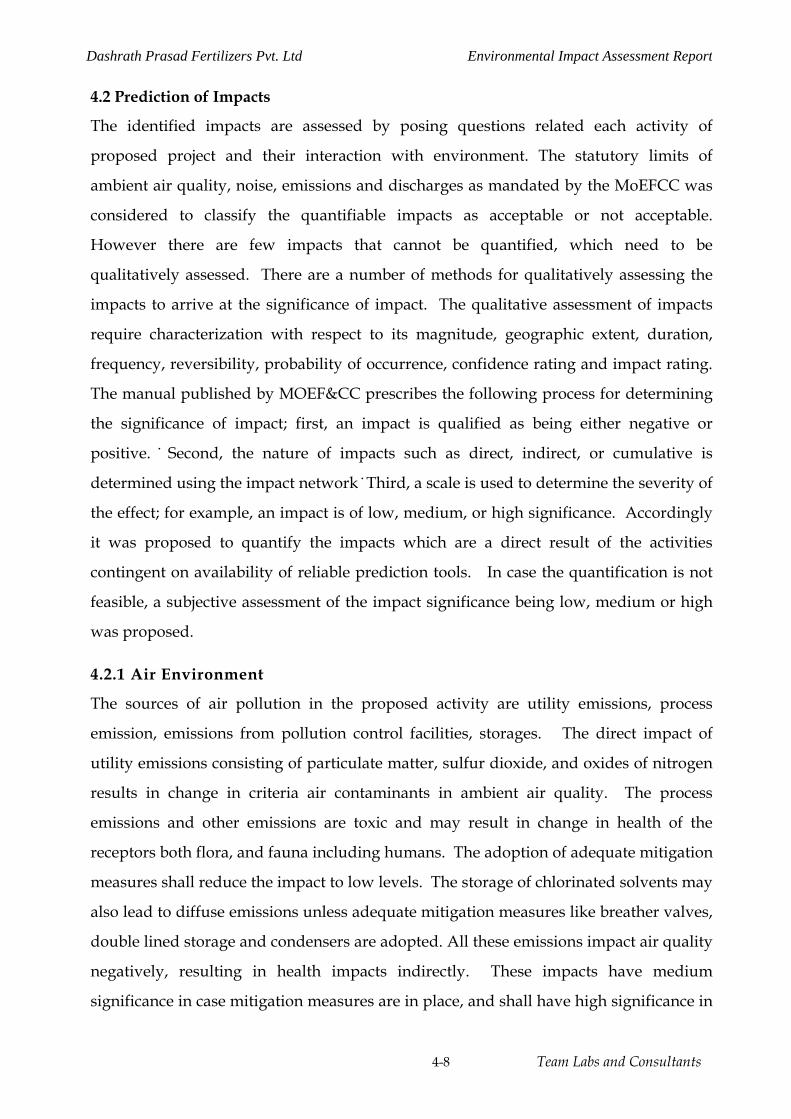
Dashrath Prasad Fertilizers Pvt. Ltd Environmental Impact Assessment Report
4-8 Team Labs and Consultants
4.2 Prediction of Impacts
The identified impacts are assessed by posing questions related each activity of
proposed project and their interaction with environment. The statutory limits of
ambient air quality, noise, emissions and discharges as mandated by the MoEFCC was
considered to classify the quantifiable impacts as acceptable or not acceptable.
However there are few impacts that cannot be quantified, which need to be
qualitatively assessed. There are a number of methods for qualitatively assessing the
impacts to arrive at the significance of impact. The qualitative assessment of impacts
require characterization with respect to its magnitude, geographic extent, duration,
frequency, reversibility, probability of occurrence, confidence rating and impact rating.
The manual published by MOEF&CC prescribes the following process for determining
the significance of impact; first, an impact is qualified as being either negative or
positive. ̇ Second, the nature of impacts such as direct, indirect, or cumulative is
determined using the impact network ̇ Third, a scale is used to determine the severity of
the effect; for example, an impact is of low, medium, or high significance. Accordingly
it was proposed to quantify the impacts which are a direct result of the activities
contingent on availability of reliable prediction tools. In case the quantification is not
feasible, a subjective assessment of the impact significance being low, medium or high
was proposed.
4.2.1 Air Environment
The sources of air pollution in the proposed activity are utility emissions, process
emission, emissions from pollution control facilities, storages. The direct impact of
utility emissions consisting of particulate matter, sulfur dioxide, and oxides of nitrogen
results in change in criteria air contaminants in ambient air quality. The process
emissions and other emissions are toxic and may result in change in health of the
receptors both flora, and fauna including humans. The adoption of adequate mitigation
measures shall reduce the impact to low levels. The storage of chlorinated solvents may
also lead to diffuse emissions unless adequate mitigation measures like breather valves,
double lined storage and condensers are adopted. All these emissions impact air quality
negatively, resulting in health impacts indirectly. These impacts have medium
significance in case mitigation measures are in place, and shall have high significance in
Dashrath Prasad Fertilizers Pvt. Ltd Environmental Impact Assessment Report
4-9 Team Labs and Consultants
case of anthropogenic and natural emergencies as well as in case no mitigation
measures are proposed. The change in ambient air quality due to the utility emissions
of DPFPL, is predicted by using an air quality impact prediction model. The impacts
due to the proposed project shall be felt mainly within the plant area and the immediate
surroundings.
4.2.1.1 Details of Mathematical Modeling
A large number of different mathematical models for dispersion calculations are in
practice in many parts of the world. Most of the models for prediction of downwind
concentrations are based on Gaussian dispersion. The principle behind the Gaussian
dispersion models is Gaussian probability distribution of concentration in both vertical
and horizontal cross wind directions about the plume central line.
Predictions of ground level concentrations of the pollutants were carried out based on
site meteorological data collected during the study period. For calculation of predicted
ground level concentrations, ISCST3 model of Lakes Environmental based on USEPA,
ISCST3 algorithms, was used; as it’s based on more sophisticated algorithm
incorporating deposition, better algorithm for area sources, etc.
Brief History of the ISC Models
The ISC3 models are based on revisions to the algorithms contained in the ISC2 models.
The latter came about as a result of a major effort to restructure and reprogram the ISC
models that began in April 1989, and was completed in March 1992. The
reprogramming effort was largely motivated by the need to improve the quality,
reliability, and maintainability of the code when numerous "bugs" were discovered
after the implementation of the revised downwash algorithms for shorter stacks.
However, the goals of the reprogramming effort also included improving the user
interface by modifying the input file structure and the output products.
Overview of New Features in the ISC3 Models
The ISC3 models include several new features. A revised area source algorithm and
revised dry deposition algorithm have been incorporated in the models. The ISC3
models also include an algorithm for modeling impacts of particulate emissions from
open pit sources, such as surface coal mines. The Short Term model includes a new wet
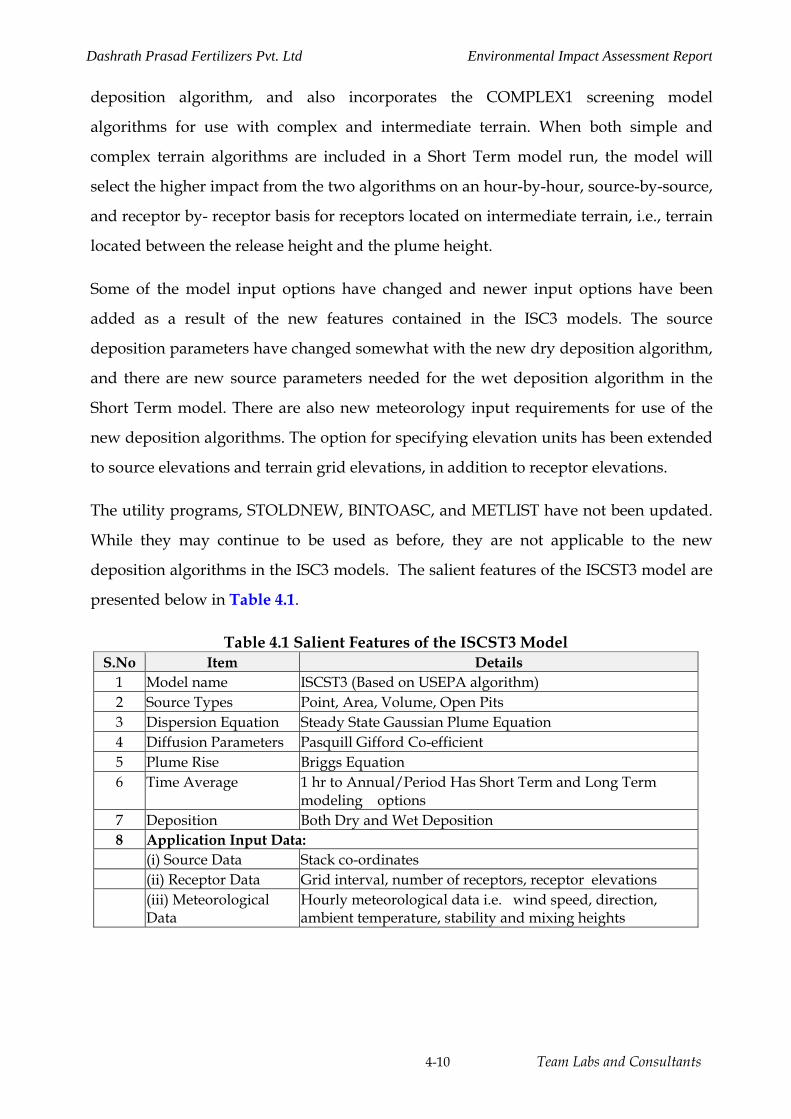
Dashrath Prasad Fertilizers Pvt. Ltd Environmental Impact Assessment Report
4-10 Team Labs and Consultants
deposition algorithm, and also incorporates the COMPLEX1 screening model
algorithms for use with complex and intermediate terrain. When both simple and
complex terrain algorithms are included in a Short Term model run, the model will
select the higher impact from the two algorithms on an hour-by-hour, source-by-source,
and receptor by- receptor basis for receptors located on intermediate terrain, i.e., terrain
located between the release height and the plume height.
Some of the model input options have changed and newer input options have been
added as a result of the new features contained in the ISC3 models. The source
deposition parameters have changed somewhat with the new dry deposition algorithm,
and there are new source parameters needed for the wet deposition algorithm in the
Short Term model. There are also new meteorology input requirements for use of the
new deposition algorithms. The option for specifying elevation units has been extended
to source elevations and terrain grid elevations, in addition to receptor elevations.
The utility programs, STOLDNEW, BINTOASC, and METLIST have not been updated.
While they may continue to be used as before, they are not applicable to the new
deposition algorithms in the ISC3 models. The salient features of the ISCST3 model are
presented below in Table 4.1.
Table 4.1 Salient Features of the ISCST3 Model S.No Item Details
1 Model name ISCST3 (Based on USEPA algorithm) 2 Source Types Point, Area, Volume, Open Pits 3 Dispersion Equation Steady State Gaussian Plume Equation 4 Diffusion Parameters Pasquill Gifford Co-efficient 5 Plume Rise Briggs Equation 6 Time Average 1 hr to Annual/Period Has Short Term and Long Term
modeling options 7 Deposition Both Dry and Wet Deposition 8 Application Input Data: (i) Source Data Stack co-ordinates (ii) Receptor Data Grid interval, number of receptors, receptor elevations (iii) Meteorological
Data Hourly meteorological data i.e. wind speed, direction, ambient temperature, stability and mixing heights

Dashrath Prasad Fertilizers Pvt. Ltd Environmental Impact Assessment Report
4-11 Team Labs and Consultants
Model Formulation
The model uses the following steady state Gaussian plume equation. The basic
equation for calculating the concentration of pollutants for any point in x, y, z co-
ordinates is given below:
C(x,y,z,H) = Q/2π σy σz U exp[-1/2(y/σy)2] x [exp{-1/2(z-h/σz)2} + exp{-1/2 (z+H/σz)2}]
Where C= Concentration of pollutants in mg/cu m Q= Strength of emissions in g/sec. H= Effective Height (m), i.e., physical height + plume raise y, z= diffusion coefficients in y and z directions in m. U= average wind velocity in m/sec. The following assumptions are made in Gaussian dispersion model.
This model assumes no diffusion in the down wind direction and thus applicable to a
plume and not a puff of pollutant. The dispersion parameter values used for horizontal
dispersion coefficient and vertical dispersion coefficients are those given in the “Work
book of atmospheric dispersion estimates”. These dispersion coefficients assume a
sampling time of about 10 min., the height values of interest to be in the lowest several
hundred meters of the atmosphere, a surface corresponding to the open country. The
stacks are tall enough to be free from building turbulence so that no aerodynamic down
wash occurs. The given stability exists from ground level to well above the top of the
plume.
The Gaussian dispersion model has been tested extensively for its validity and found to
be reasonably applicable for different atmospheric conditions. BIS has also adopted this
basic plume dispersion model. Hence the same model is adopted for predictions of
downwind concentrations of pollutants in this report.
Meteorological Data
Data recorded by the weather monitoring station at site on wind speed, direction, solar
isolation, temperature and cloud cover at one hourly interval for three months i.e. One
full season has been used for computations.
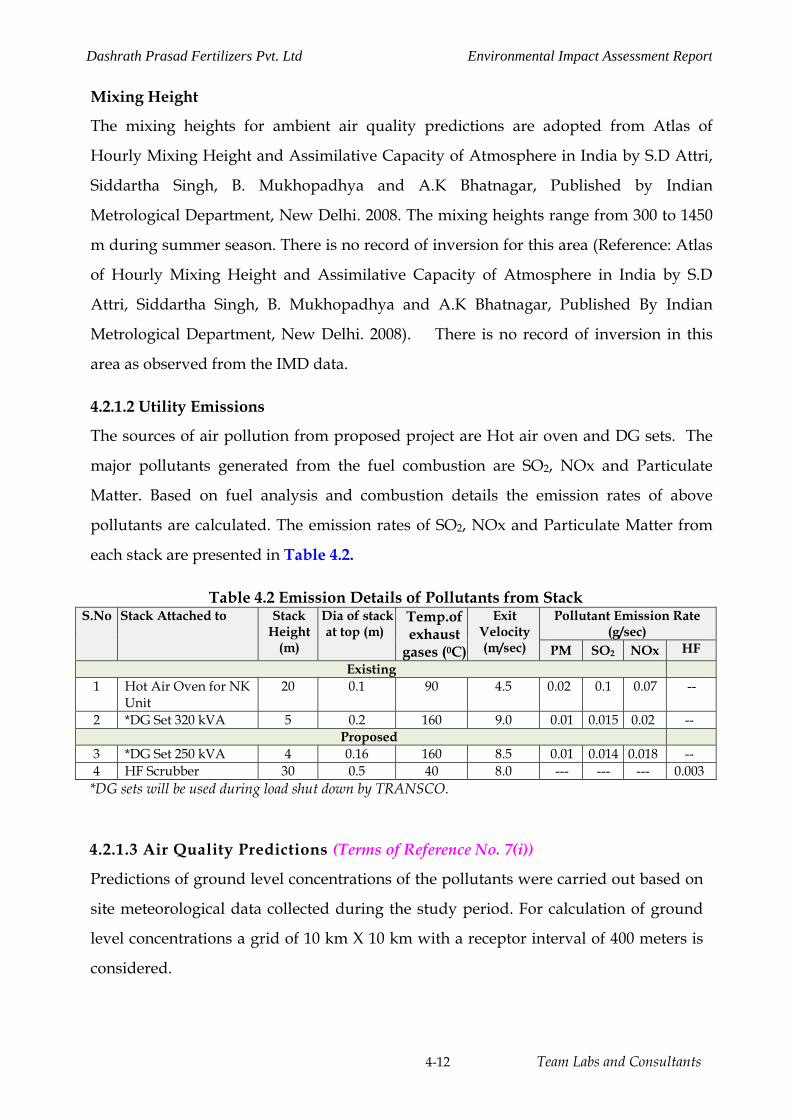
Dashrath Prasad Fertilizers Pvt. Ltd Environmental Impact Assessment Report
4-12 Team Labs and Consultants
Mixing Height
The mixing heights for ambient air quality predictions are adopted from Atlas of
Hourly Mixing Height and Assimilative Capacity of Atmosphere in India by S.D Attri,
Siddartha Singh, B. Mukhopadhya and A.K Bhatnagar, Published by Indian
Metrological Department, New Delhi. 2008. The mixing heights range from 300 to 1450
m during summer season. There is no record of inversion for this area (Reference: Atlas
of Hourly Mixing Height and Assimilative Capacity of Atmosphere in India by S.D
Attri, Siddartha Singh, B. Mukhopadhya and A.K Bhatnagar, Published By Indian
Metrological Department, New Delhi. 2008). There is no record of inversion in this
area as observed from the IMD data.
4.2.1.2 Utility Emissions
The sources of air pollution from proposed project are Hot air oven and DG sets. The
major pollutants generated from the fuel combustion are SO2, NOx and Particulate
Matter. Based on fuel analysis and combustion details the emission rates of above
pollutants are calculated. The emission rates of SO2, NOx and Particulate Matter from
each stack are presented in Table 4.2.
Table 4.2 Emission Details of Pollutants from Stack S.No Stack Attached to Stack
Height (m)
Dia of stack at top (m)
Temp.of exhaust
gases (0C)
Exit Velocity (m/sec)
Pollutant Emission Rate (g/sec)
PM SO2 NOx HF Existing
1 Hot Air Oven for NK Unit
20 0.1 90 4.5 0.02 0.1 0.07 --
2 *DG Set 320 kVA 5 0.2 160 9.0 0.01 0.015 0.02 -- Proposed
3 *DG Set 250 kVA 4 0.16 160 8.5 0.01 0.014 0.018 -- 4 HF Scrubber 30 0.5 40 8.0 --- --- --- 0.003
*DG sets will be used during load shut down by TRANSCO.
4.2.1.3 Air Quality Predictions (Terms of Reference No. 7(i))
Predictions of ground level concentrations of the pollutants were carried out based on
site meteorological data collected during the study period. For calculation of ground
level concentrations a grid of 10 km X 10 km with a receptor interval of 400 meters is
considered.
Dashrath Prasad Fertilizers Pvt. Ltd Environmental Impact Assessment Report
4-13 Team Labs and Consultants
The composition of particulate matter was obtained from USEPA AIRCHIEF AP-42
and the same was considered in determining the source concentration of PM10 and
PM2.5 for prediction purpose. The predicted maximum 24 hourly ground level
concentrations of Suspended Particulate Matter, PM10, PM2.5, SO2 and NOx and
distance of occurrence during different seasons of study period are presented in Table
4.3.
It may be observed that the annual predicted maximum 24 hourly GLC’s of PM, PM10,
PM2.5, SO2, NOx and HF are 1.65, 0.66, 0.78, 2.92, 5.64 and 0.07 μg/m3 respectively and
the maximum values are observed at a distance of 0.4 km from the center of plant site
in northeast direction. However it may be noted that the predicted values of the SO2
and NOx are based on the assumption that the DG sets are used constantly, where as
the DG set usage is only during load shut down from TRANSCO.
The GLC’s are also predicted at air quality monitoring locations and the predicted
GLC’s are presented in Tables 4.4 and the cumulative concentrations at various
villages are tabulated in Table 4.5. It may be observed from the table that the
predicted results show that the incremental rise over existing base line status of
ambient air quality is within the limits prescribed by National Ambient Air Quality
standards (NAAQ), and hence the impact due to the proposed project is low on
ambient air quality. Hence the control measures and height of stack is sufficient to
disperse the pollutants into the atmosphere and keeping the baseline levels within the
prescribed limits. The predicted ground level concentrations are graphically displayed
for SPM, PM10, PM2.5, SO2, and NOx respectively in Figure 4.7 – 4.12.
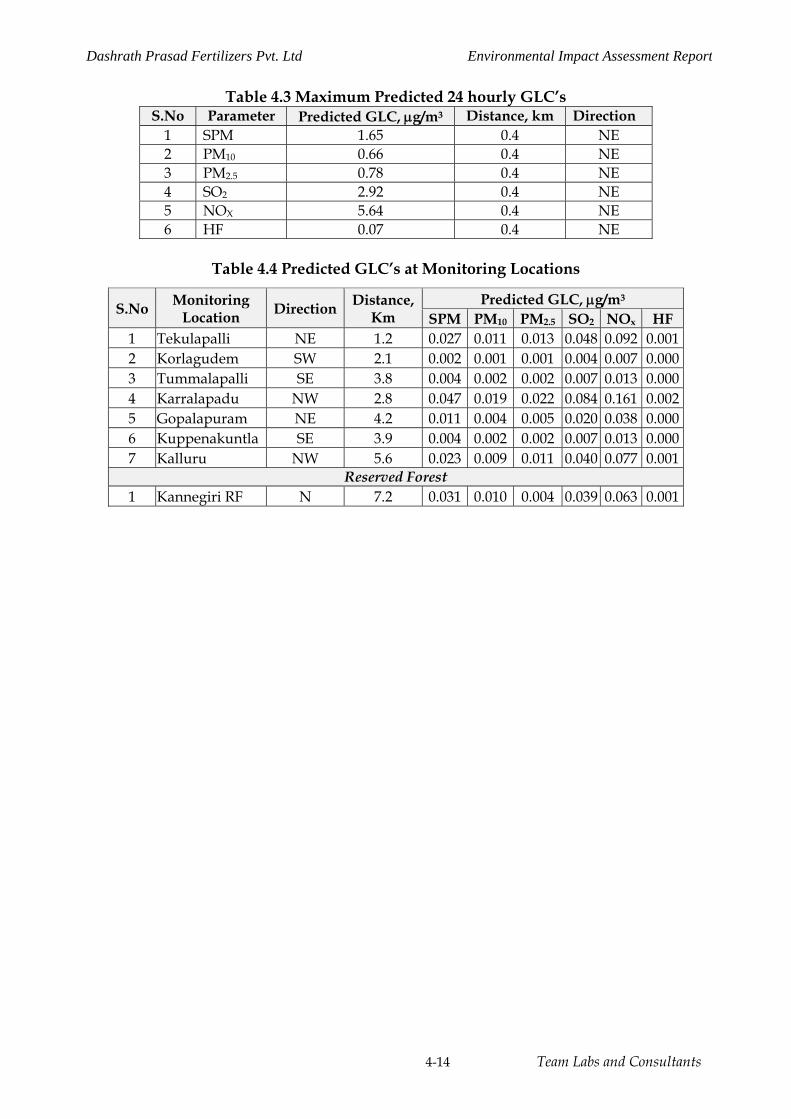
Dashrath Prasad Fertilizers Pvt. Ltd Environmental Impact Assessment Report
4-14 Team Labs and Consultants
Table 4.3 Maximum Predicted 24 hourly GLC’s S.No Parameter Predicted GLC, μg/m3 Distance, km Direction
1 SPM 1.65 0.4 NE 2 PM10 0.66 0.4 NE 3 PM2.5 0.78 0.4 NE 4 SO2 2.92 0.4 NE 5 NOX 5.64 0.4 NE 6 HF 0.07 0.4 NE
Table 4.4 Predicted GLC’s at Monitoring Locations
S.No Monitoring Location Direction Distance,
Km Predicted GLC, μg/m3
SPM PM10 PM2.5 SO2 NOx HF 1 Tekulapalli NE 1.2 0.027 0.011 0.013 0.048 0.092 0.001 2 Korlagudem SW 2.1 0.002 0.001 0.001 0.004 0.007 0.000 3 Tummalapalli SE 3.8 0.004 0.002 0.002 0.007 0.013 0.000 4 Karralapadu NW 2.8 0.047 0.019 0.022 0.084 0.161 0.002 5 Gopalapuram NE 4.2 0.011 0.004 0.005 0.020 0.038 0.000 6 Kuppenakuntla SE 3.9 0.004 0.002 0.002 0.007 0.013 0.000 7 Kalluru NW 5.6 0.023 0.009 0.011 0.040 0.077 0.001
Reserved Forest 1 Kannegiri RF N 7.2 0.031 0.010 0.004 0.039 0.063 0.001
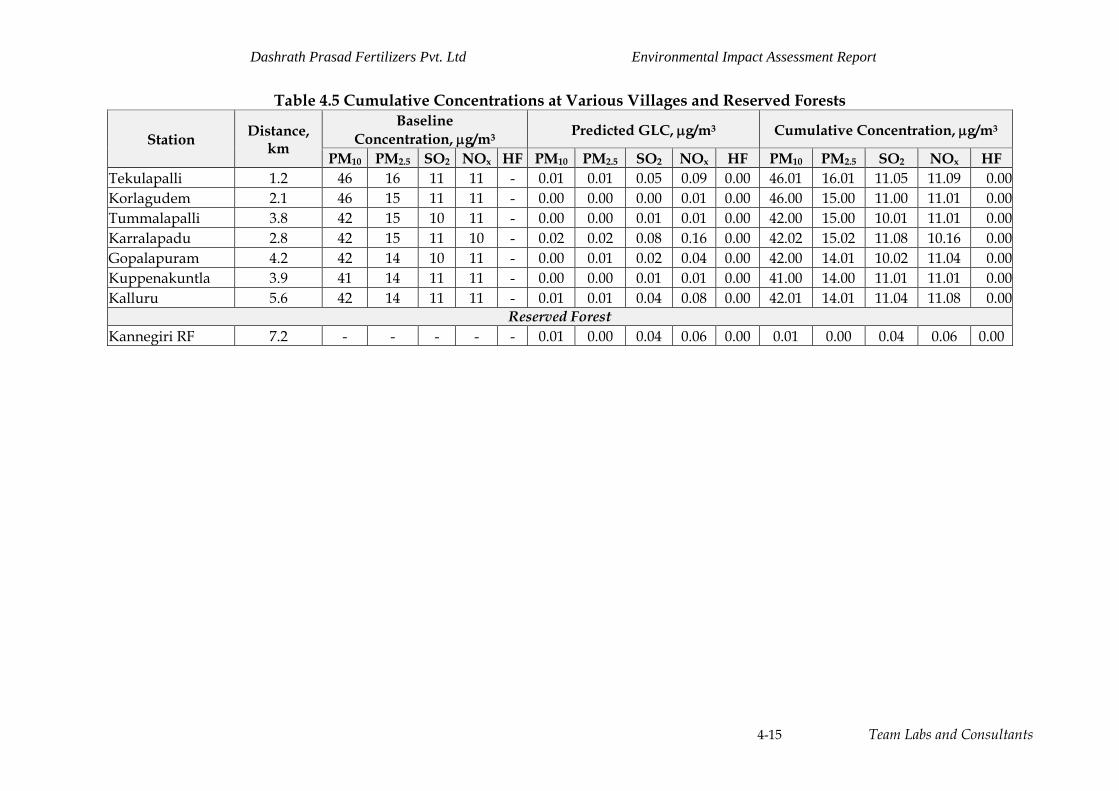
Dashrath Prasad Fertilizers Pvt. Ltd Environmental Impact Assessment Report
4-15 Team Labs and Consultants
Table 4.5 Cumulative Concentrations at Various Villages and Reserved Forests
Station Distance, km
Baseline Concentration, μg/m3 Predicted GLC, μg/m3 Cumulative Concentration, μg/m3
PM10 PM2.5 SO2 NOx HF PM10 PM2.5 SO2 NOx HF PM10 PM2.5 SO2 NOx HF Tekulapalli 1.2 46 16 11 11 - 0.01 0.01 0.05 0.09 0.00 46.01 16.01 11.05 11.09 0.00Korlagudem 2.1 46 15 11 11 - 0.00 0.00 0.00 0.01 0.00 46.00 15.00 11.00 11.01 0.00Tummalapalli 3.8 42 15 10 11 - 0.00 0.00 0.01 0.01 0.00 42.00 15.00 10.01 11.01 0.00Karralapadu 2.8 42 15 11 10 - 0.02 0.02 0.08 0.16 0.00 42.02 15.02 11.08 10.16 0.00Gopalapuram 4.2 42 14 10 11 - 0.00 0.01 0.02 0.04 0.00 42.00 14.01 10.02 11.04 0.00Kuppenakuntla 3.9 41 14 11 11 - 0.00 0.00 0.01 0.01 0.00 41.00 14.00 11.01 11.01 0.00Kalluru 5.6 42 14 11 11 - 0.01 0.01 0.04 0.08 0.00 42.01 14.01 11.04 11.08 0.00
Reserved Forest Kannegiri RF 7.2 - - - - - 0.01 0.00 0.04 0.06 0.00 0.01 0.00 0.04 0.06 0.00
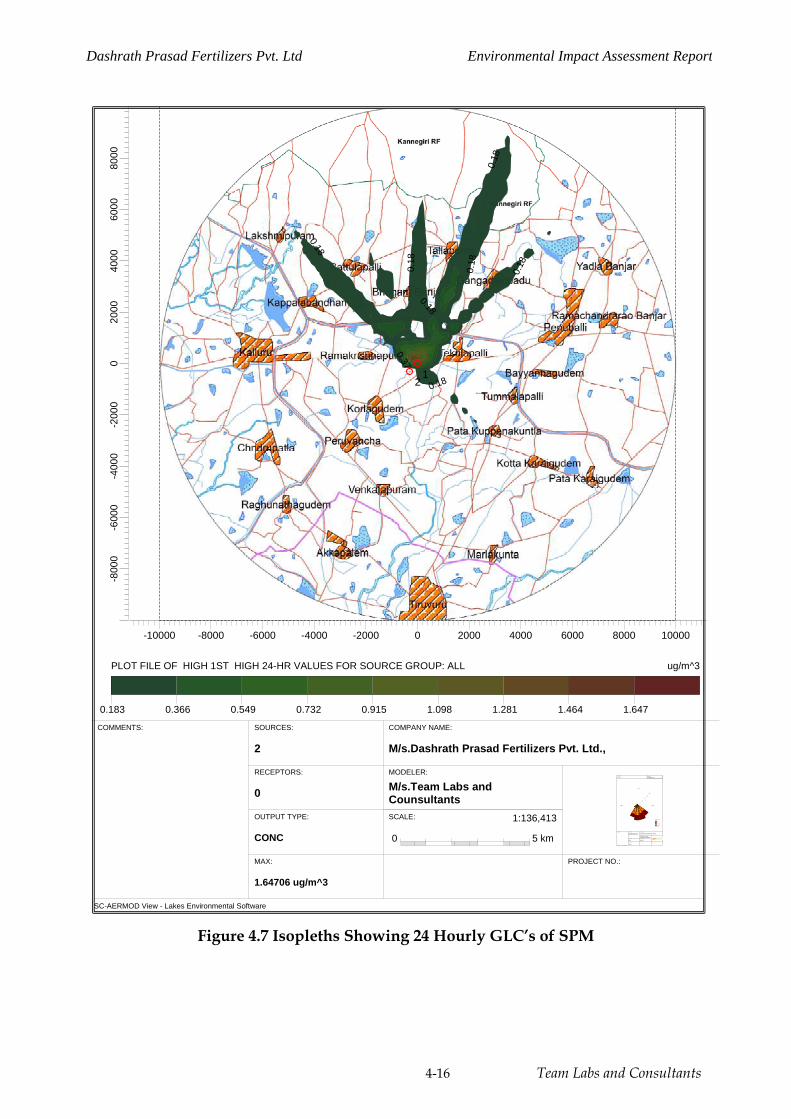
Dashrath Prasad Fertilizers Pvt. Ltd Environmental Impact Assessment Report
4-16 Team Labs and Consultants
Figure 4.7 Isopleths Showing 24 Hourly GLC’s of SPM
SC-AERMOD View - Lakes Environmental Software
PROJECT NO.:
SCALE:
0 5 km
1:136,413
COMMENTS:
MODELER:
M/s.Team Labs and Counsultants
COMPANY NAME:
M/s.Dashrath Prasad Fertilizers Pvt. Ltd.,
SOURCES:
2
RECEPTORS:
0
OUTPUT TYPE:
CONC
MAX:
1.64706 ug/m^3
ug/m^3PLOT FILE OF HIGH 1ST HIGH 24-HR VALUES FOR SOURCE GROUP: ALL
0.183 0.366 0.549 0.732 0.915 1.098 1.281 1.464 1.647
0.18
0.180.18
0.18
0.18
0.18
0.18
0.372
1
-10000 -8000 -6000 -4000 -2000 0 2000 4000 6000 8000 10000
-800
0-6
000
-400
0-2
000
020
0040
0060
0080
00
WRPLOT View - Lakes Environmental Software
WIND ROSE PLOT:
Station # 1
COMMENTS: COMPANY NAME:
M/s Dashrath Prasad Fertilizers Pvt. Ltd
MODELER:
M/s.Team Labs and Consultsnts, Hyderabad.
PROJECT NO.:
NORTH
SOUTH
WEST EAST
5%
10%
15%
20%
25%
WIND SPEED (m/s)
>= 4.2
2.8 - 4.2
1.4 - 2.8
0.3 - 1.4
Calms: 1.00%
TOTAL COUNT:
2208 hrs.
CALM WINDS:
1.00%
DATA PERIOD:
Start Date: 05-03-2017 - 00:00End Date: 04-06-2017 - 23:00
AVG. WIND SPEED:
2.21 m/s
DISPLAY:
Wind SpeedDirection (blowing from)
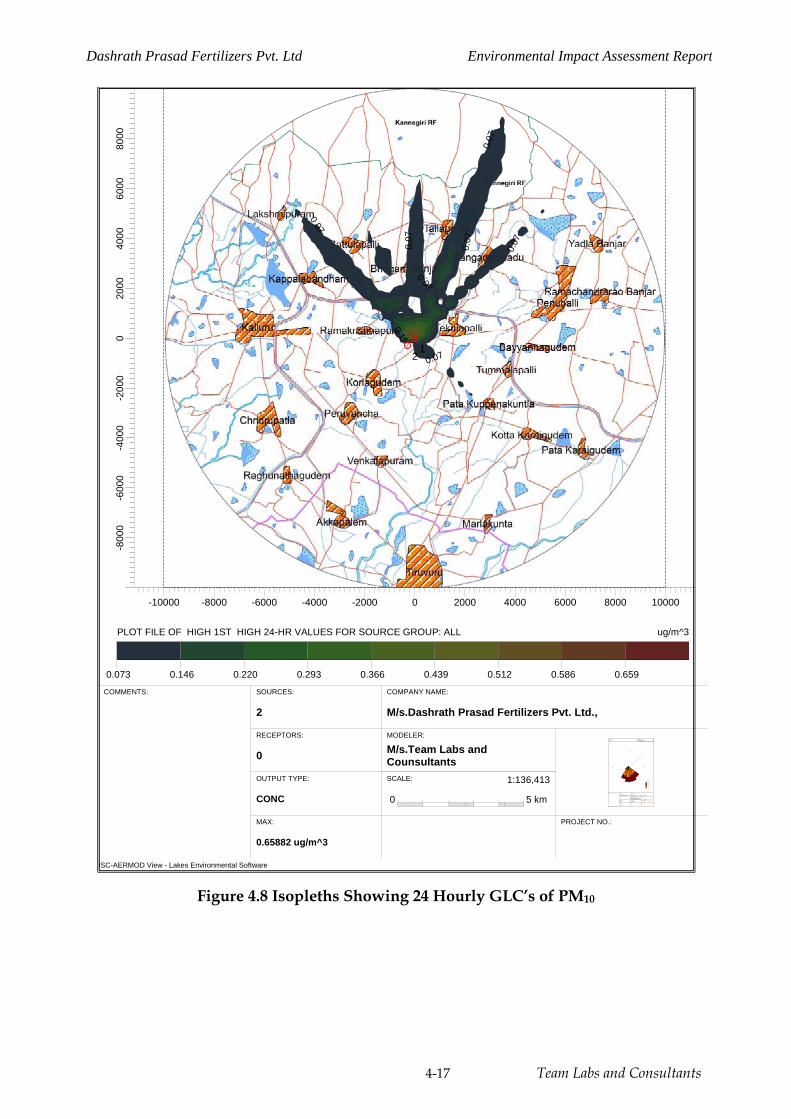
Dashrath Prasad Fertilizers Pvt. Ltd Environmental Impact Assessment Report
4-17 Team Labs and Consultants
Figure 4.8 Isopleths Showing 24 Hourly GLC’s of PM10
ISC-AERMOD View - Lakes Environmental Software
PROJECT NO.:
SCALE:
0 5 km
1:136,413
COMMENTS:
MODELER:
M/s.Team Labs and Counsultants
COMPANY NAME:
M/s.Dashrath Prasad Fertilizers Pvt. Ltd.,
SOURCES:
2
RECEPTORS:
0
OUTPUT TYPE:
CONC
MAX:
0.65882 ug/m^3
ug/m^3PLOT FILE OF HIGH 1ST HIGH 24-HR VALUES FOR SOURCE GROUP: ALL
0.073 0.146 0.220 0.293 0.366 0.439 0.512 0.586 0.659
0.07
0.070.07
0.07
0.07
0.07
0.07
0.15
21
-10000 -8000 -6000 -4000 -2000 0 2000 4000 6000 8000 10000
-800
0-6
000
-400
0-2
000
020
0040
0060
0080
00
WRPL OT View - Lakes Environ me ntal Softwa re
WIND ROSE PL OT:
Station # 1
COMMENTS: COMPANY NAME:
M/s Dashrath Prasad Fertilizers Pvt. Ltd
MODELER:
M/s.Team Labs and Consultsnts, Hyderabad.
PROJECT N O.:
NORTH
SOUTH
WEST EAST
5%
10%
15%
20%
25%
WIND SPEED (m/s)
>= 4.2
2.8 - 4.2
1.4 - 2.8
0.3 - 1.4
Calms: 1.00%
TOTAL COUNT:
2208 hrs.
CALM WINDS:
1.00%
DATA PERIOD :
Start Date: 05-03-2017 - 00:00End Date: 04-06-2017 - 23:00
AVG. WIN D SPEED:
2.21 m/s
DISPL AY:
Wind SpeedDirection (blowing from)

Dashrath Prasad Fertilizers Pvt. Ltd Environmental Impact Assessment Report
4-18 Team Labs and Consultants
Figure 4.9 Isopleths Showing 24 Hourly GLC’s of PM2.5
SC-AERMOD View - Lakes Environmental Software
PROJECT NO.:
SCALE:
0 5 km
1:136,413
COMMENTS:
MODELER:
M/s.Team Labs and Counsultants
COMPANY NAME:
M/s.Dashrath Prasad Fertilizers Pvt. Ltd.,
SOURCES:
2
RECEPTORS:
0
OUTPUT TYPE:
CONC
MAX:
0.77894 ug/m^3
ug/m^3PLOT FILE OF HIGH 1ST HIGH 24-HR VALUES FOR SOURCE GROUP: ALL
0.087 0.173 0.260 0.346 0.433 0.519 0.606 0.692 0.779
0.09
0.090.09
0.090.17
21
-10000 -8000 -6000 -4000 -2000 0 2000 4000 6000 8000 10000
-800
0-6
000
-400
0-2
000
020
0040
0060
0080
00
WRPLOT View - Lakes Environmen tal Software
WIND ROSE PLOT:
Station # 1
COMMEN TS: COMPANY NAME:
M/s Dashrath Prasad Fertilizers Pvt. Ltd
MODELER:
M/s.Team Labs and Consultsnts, Hyderabad.
PR OJECT NO.:
NORTH
SOUTH
WEST EAST
5%
10%
15%
20%
25%
WIND SPEED (m/s)
>= 4.2
2.8 - 4.2
1.4 - 2.8
0.3 - 1.4
Calms: 1.00%
TOTAL COUNT:
2208 hrs.
CALM WINDS:
1.00%
DATA PERIOD:
Start Date: 05-03-2017 - 00:00End Date: 04-06-2017 - 23:00
AVG. WIND SPEED:
2.21 m/s
D ISPLAY:
Wind SpeedDirection (blowing from)

Dashrath Prasad Fertilizers Pvt. Ltd Environmental Impact Assessment Report
4-19 Team Labs and Consultants
Figure 4.10 Isopleths Showing 24 Hourly GLC’s of SO2
ISC-AERMOD View - Lakes Environmental Software
PROJECT NO.:
SCALE:
0 5 km
1:136,413
COMMENTS:
MODELER:
M/s.Team Labs and Counsultants
COMPANY NAME:
M/s.Dashrath Prasad Fertilizers Pvt. Ltd.,
SOURCES:
2
RECEPTORS:
0
OUTPUT TYPE:
CONC
MAX:
2.92903 ug/m^3
ug/m^3PLOT FILE OF HIGH 1ST HIGH 24-HR VALUES FOR SOURCE GROUP: ALL
0.426 0.651 0.977 1.302 1.627 1.953 2.278 2.604 2.929
0.43
0.43
0.43
0.43
0.43
0.65
21
-10000 -8000 -6000 -4000 -2000 0 2000 4000 6000 8000 10000
-800
0-6
000
-400
0-2
000
020
0040
0060
0080
00
WRPLOT View - Lakes Environmental Software
WIND ROSE PLOT:
Station # 1
COMMENTS: COMPANY NAME:
M/s Dashrath Prasad Fertilizers Pvt. Ltd
MODELER:
M/s.Team Labs and Consultsnts, Hyderabad.
PROJECT NO.:
NORTH
SOUTH
WEST EAST
5%
10%
15%
20%
25%
WIND SPEED (m/s)
>= 4.2
2.8 - 4.2
1.4 - 2.8
0.3 - 1.4
Calms: 1.00%
TOTAL COUNT:
2208 hrs.
CALM WINDS:
1.00%
DATA PERIOD:
Start Date: 05-03-2017 - 00:00End Date: 04-06-2017 - 23:00
AVG. WIND SPEED:
2.21 m/s
DISPLAY:
Wind SpeedDirection (blowing from)
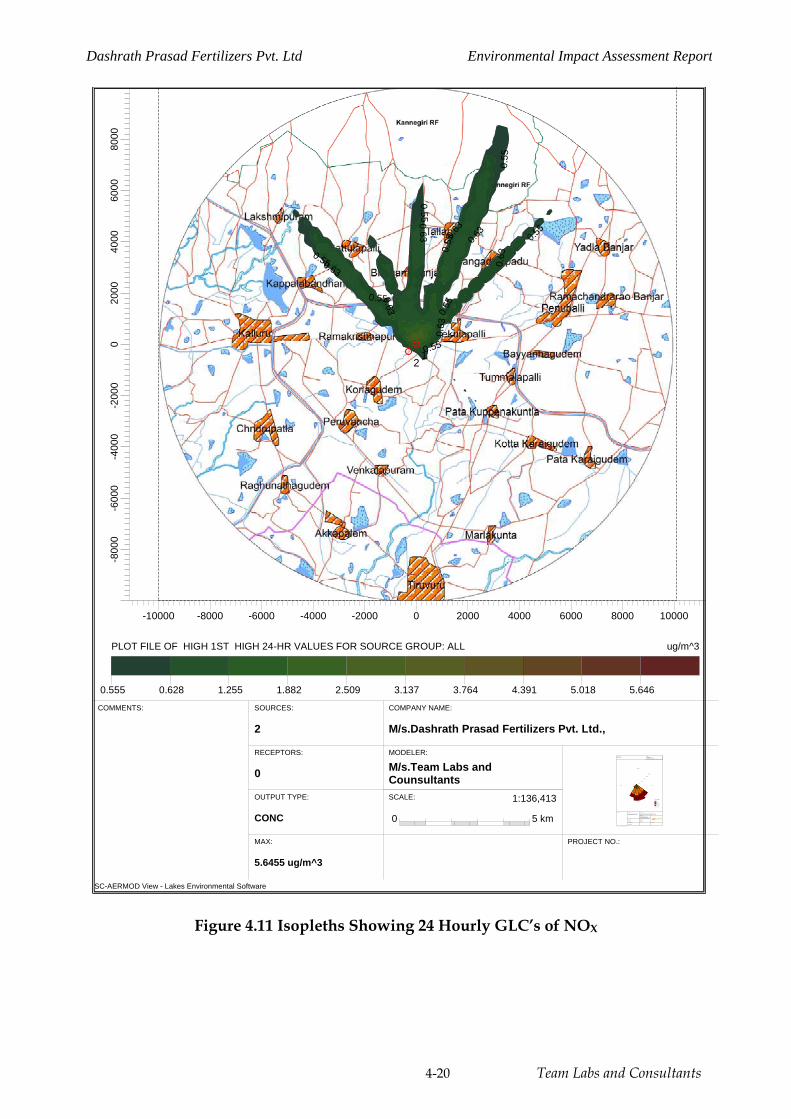
Dashrath Prasad Fertilizers Pvt. Ltd Environmental Impact Assessment Report
4-20 Team Labs and Consultants
Figure 4.11 Isopleths Showing 24 Hourly GLC’s of NOX
SC-AERMOD View - Lakes Environmental Software
PROJECT NO.:
SCALE:
0 5 km
1:136,413
COMMENTS:
MODELER:
M/s.Team Labs and Counsultants
COMPANY NAME:
M/s.Dashrath Prasad Fertilizers Pvt. Ltd.,
SOURCES:
2
RECEPTORS:
0
OUTPUT TYPE:
CONC
MAX:
5.6455 ug/m^3
ug/m^3PLOT FILE OF HIGH 1ST HIGH 24-HR VALUES FOR SOURCE GROUP: ALL
0.555 0.628 1.255 1.882 2.509 3.137 3.764 4.391 5.018 5.646
0.55
0.55
0.55
0.55
0.55
0.55
0.55
0.55
0.63
0.63
0.63
0.63
0.630.630.63
21
-10000 -8000 -6000 -4000 -2000 0 2000 4000 6000 8000 10000
-800
0-6
000
-400
0-2
000
020
0040
0060
0080
00
WRPLOT View - Lakes Environmental Software
WIND ROSE PLOT:
Station # 1
COMMENTS: COMPANY NAME:
M/s Dashrath Prasad Fertilizers Pvt. Ltd
MODELER:
M/s.Team Labs and Consultsnts, Hyderabad.
PROJECT NO.:
NORTH
SOUTH
WEST EAST
5%
10%
15%
20%
25%
WIND SPEED (m/s)
>= 4.2
2.8 - 4.2
1.4 - 2.8
0.3 - 1.4
Calms: 1.00%
TOTAL COUNT:
2208 hrs.
CALM WINDS:
1.00%
DATA PERIOD:
Start Date: 05-03-2017 - 00:00End Date: 04-06-2017 - 23:00
AVG. WIND SPEED:
2.21 m/s
DISPLAY:
Wind SpeedDirection (blowing from)
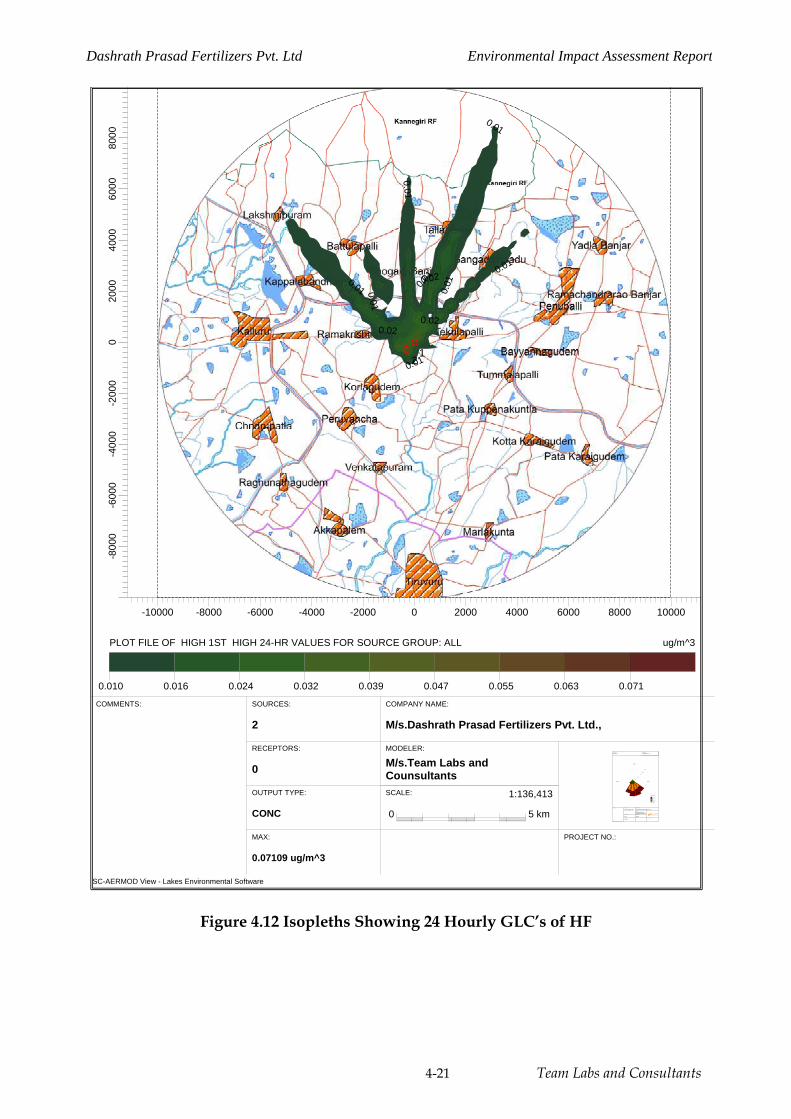
Dashrath Prasad Fertilizers Pvt. Ltd Environmental Impact Assessment Report
4-21 Team Labs and Consultants
Figure 4.12 Isopleths Showing 24 Hourly GLC’s of HF
SC-AERMOD View - Lakes Environmental Software
PROJECT NO.:
SCALE:
0 5 km
1:136,413
COMMENTS:
MODELER:
M/s.Team Labs and Counsultants
COMPANY NAME:
M/s.Dashrath Prasad Fertilizers Pvt. Ltd.,
SOURCES:
2
RECEPTORS:
0
OUTPUT TYPE:
CONC
MAX:
0.07109 ug/m^3
ug/m^3PLOT FILE OF HIGH 1ST HIGH 24-HR VALUES FOR SOURCE GROUP: ALL
0.010 0.016 0.024 0.032 0.039 0.047 0.055 0.063 0.071
0.01
0.01
0.01
0.01
0.01
0.01
0.01
0.01
0.020.02
0.02
21
-10000 -8000 -6000 -4000 -2000 0 2000 4000 6000 8000 10000
-800
0-6
000
-400
0-2
000
020
0040
0060
0080
00
WRPLOT View - Lakes Environmental Software
WIND ROSE PLOT:
Station # 1
COMMENTS: COMPANY NAME:
M/s Dashrath Prasad Fertilizers Pvt. Ltd
MODELER:
M/s.Team Labs and Consultsnts, Hyderabad.
PROJECT NO.:
NORTH
SOUTH
WEST EAST
5%
10%
15%
20%
25%
WIND SPEED (m/s)
>= 4.2
2.8 - 4.2
1.4 - 2.8
0.3 - 1.4
Calms: 1.00%
TOTAL COUNT:
2208 hrs.
CALM WINDS:
1.00%
DATA PERIOD:
Start Date: 05-03-2017 - 00:00End Date: 04-06-2017 - 23:00
AVG. WIND SPEED:
2.21 m/s
DISPLAY:
Wind SpeedDirection (blowing from)
Dashrath Prasad Fertilizers Pvt. Ltd Environmental Impact Assessment Report
4-22 Team Labs and Consultants
4.2.2 Water Environment
The water environment of the proposed project consists of water from bore wells, and
wastewater from domestic usage. The total water required of quantity after inclusion of
Single Super Phosphate (SSP) in consented NPK fertilizers unit is 42.5 KLD. Wastewater
from domestic usage sent to septic tank followed by soak pit. Effluent from scrubbers is
reused in acid dilution.
4.2.3 Noise Environment
The project activities that have an impact on noise environment are operational
equipment, pumps, compressors, DG set resulting in direct impact of increasing ambient
noise levels both within the work room area and outside. Excessive noise will trigger
health risks such as headaches, depression, deafness and retardation of sensory
mechanisms in the impact area population. The incremental noise levels due to these
activities were predicted and the values reflect low impact outside the premises. The
increase in noise levels shall have low impact, restricted to within site area due to its low
magnitude and occasional frequency. The incremental noise levels however shall have
direct negative impact on the noise levels, with low significance due to mitigation
measures and also due to absence of sensitive receptors within 500 m of the sources.
4.2.3.1 Prediction of Impact on Noise Quality
The sound pressure level generated by noise source decreases with increasing distance
from the source due to wave divergence. An additional decrease in sound pressure
levels also occurs with increasing distance from the source due to atmospheric effect or
interaction with the objects in the transmission path. This is due to excess attenuation.
The sound pressure level is also affected by medium of travel and environmental
conditions. The propagation model has been devised to take into account these factors
and predict the noise levels at various distances round a single or a multiple source.
The model uses the following formula as a basis for such predictions.
(Lob) = (Lr) - (Ldiv) - (Latm) Where (Lob) = Observed noise level at a distance R from source (Lr) = Noise level of source measured at reference distance r (Ldiv) = Loss due to divergence at distance R from source = 20 log (R/r) (Latm) = Attenuation due to atmosphere at distance R from the source.
Dashrath Prasad Fertilizers Pvt. Ltd Environmental Impact Assessment Report
4-23 Team Labs and Consultants
= a x R/100, where a is atmospheric attenuation coefficient in dB (A)/100m.
For hemispherical wave divergence in a homogenous loss free atmosphere (Latm) = 0.
The total impact of all sources at particular place is then estimated by adding as the contribution of noise from each of the following sources as follows; i=n (Lob)i/10 (Leq) = 10 log Σ {10 } i=1
Where n = total number of sources
The calculated noise levels are further super imposed (logarithmically) on the
background noise levels. The model assumes that the noise spectrum is mainly centered
on a spectrum of 1000 Hz and attenuation due to building materials is also at the same
frequency.
The major sources of noise generation are SSP are mainly from granulator, dryers, bucket
elevators, screw conveyors, pumps and DG set which emit noise level of maximum 90 dB
(A) - 110 dB (A) at a reference distance of 1m from the source. The predicted cumulative
noise levels due to the source and the existing level as calculated from the logarithmic
model without noise attenuation ranged between 55 and 75 Db (A) at distances ranging
between 87 to 165 m which falls within the plant boundary. The impact of noise on the
population in the surrounding area will be negligible, as the nearest habitation is at least
500 m away from the site.
4.2.4 Land Environment
The proposed project plan involves construction of additional SSP manufacturing facility
which includes, construction of process equipment, storage facilities and raw material
conveyor system. There is no alteration of terrain, and may lead to additional sealing of
land due to increased foot print. No Solid wastes are generated from the process. The
waste oil from DG set and used batteries from are sold to authorized recyclers. The
impact on land environment is mainly due to accidental spillages of raw materials and
wastes. The project has neutral impact on land environment, terrain and soils as there is
no additional land requirement, and the impacts if any are restricted to within the site
with negligible magnitude and is felt mainly during project work only. The operational
Dashrath Prasad Fertilizers Pvt. Ltd Environmental Impact Assessment Report
4-24 Team Labs and Consultants
phase impacts shall be low due to effective implementation of mitigative measures in
handling, storing and transferring wastes and chemicals.
4.2.5 Biological Environment
The ecological factors that are considered most significant as far as the impact on flora
and fauna concerned are:
1. Whether there shall be any reduction in species diversity?
2. Whether there shall be any habitat loss or fragmentation?
3. Whether there shall be any additional risk or threat to the rare or endangered or endemic or threatened (REET) species?
4. Whether there shall be any impairment of ecological functions such as
(i) disruption of food chains,
(ii) decline in species population and or
(iii) Alterations in predator-prey relationships?
5. Whether it is possible to attain the global objectives of ‘no net loss’ of biodiversity?
6. Whether it is possible to improve the biological diversity through the proposed activity?
There is no direct threat to any rare or endangered or threatened biological species as
indicated by the baseline data, due to the proposed project, as it entails no additional
land acquisition, and the proposed construction area has sparse vegetation. Kannegiri RF
at a distance of 7.2 km in north direction. The project is not going to cause any
fragmentation of habitat or disruption of food cycles or destruction of breeding grounds
or blockade of migratory routes. The major impacts of the project are mainly during
construction and subsequently on account of atmospheric pollution. The industry is
required to limit its emissions as per the NAAQ of 2009. It has to strictly adhere to the
conditions stipulated by the regulatory bodies. The project authorities are going to take
all steps and measures in order to strictly comply with National Ambient Air Quality
Standards of 2009. The project may not have impacts on terrestrial flora and fauna.
Further, as there are no rare or endangered or threatened (RET) species within the impact
area, the project does not pose any direct threat to the survival of any rare species. Hence,
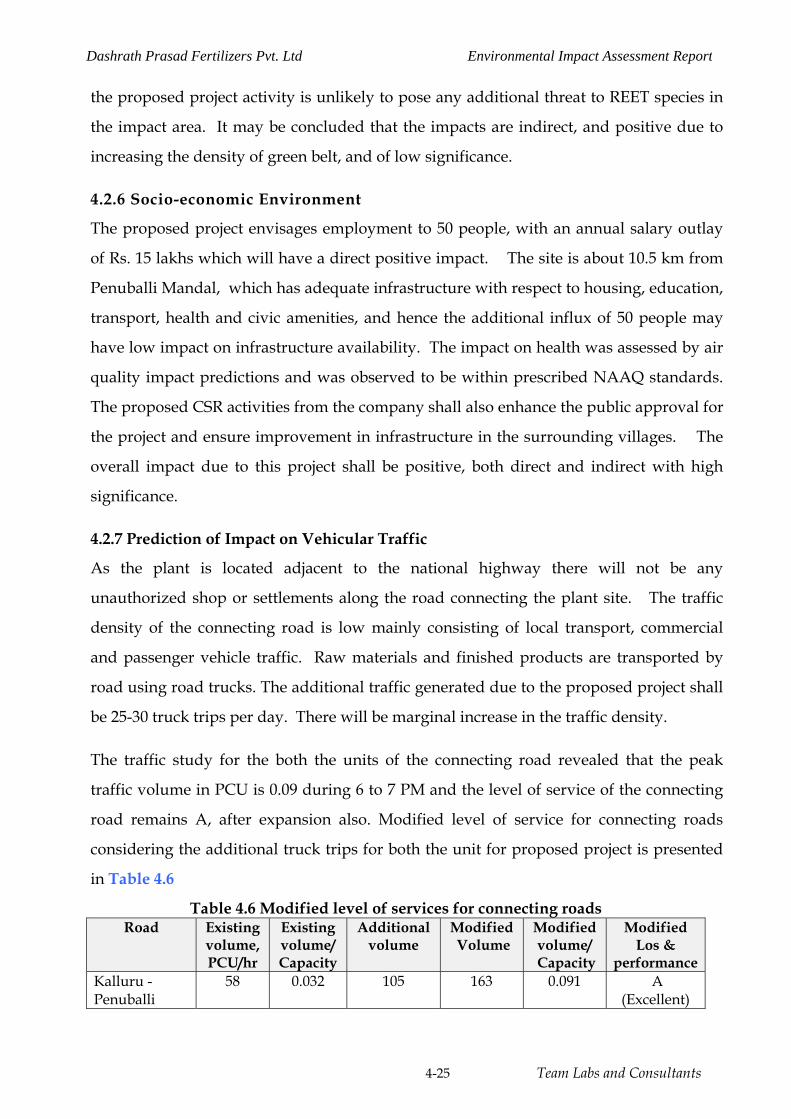
Dashrath Prasad Fertilizers Pvt. Ltd Environmental Impact Assessment Report
4-25 Team Labs and Consultants
the proposed project activity is unlikely to pose any additional threat to REET species in
the impact area. It may be concluded that the impacts are indirect, and positive due to
increasing the density of green belt, and of low significance.
4.2.6 Socio-economic Environment
The proposed project envisages employment to 50 people, with an annual salary outlay
of Rs. 15 lakhs which will have a direct positive impact. The site is about 10.5 km from
Penuballi Mandal, which has adequate infrastructure with respect to housing, education,
transport, health and civic amenities, and hence the additional influx of 50 people may
have low impact on infrastructure availability. The impact on health was assessed by air
quality impact predictions and was observed to be within prescribed NAAQ standards.
The proposed CSR activities from the company shall also enhance the public approval for
the project and ensure improvement in infrastructure in the surrounding villages. The
overall impact due to this project shall be positive, both direct and indirect with high
significance.
4.2.7 Prediction of Impact on Vehicular Traffic
As the plant is located adjacent to the national highway there will not be any
unauthorized shop or settlements along the road connecting the plant site. The traffic
density of the connecting road is low mainly consisting of local transport, commercial
and passenger vehicle traffic. Raw materials and finished products are transported by
road using road trucks. The additional traffic generated due to the proposed project shall
be 25-30 truck trips per day. There will be marginal increase in the traffic density.
The traffic study for the both the units of the connecting road revealed that the peak
traffic volume in PCU is 0.09 during 6 to 7 PM and the level of service of the connecting
road remains A, after expansion also. Modified level of service for connecting roads
considering the additional truck trips for both the unit for proposed project is presented
in Table 4.6
Table 4.6 Modified level of services for connecting roads Road Existing
volume, PCU/hr
Existing volume/ Capacity
Additional volume
Modified Volume
Modified volume/
Capacity
Modified Los &
performance Kalluru - Penuballi
58 0.032 105 163 0.091 A (Excellent)
Dashrath Prasad Fertilizers Pvt. Ltd. Environmental Impact Assessment Report
Team Labs And Consultants 5-1
5.0 ANALYSIS OF ALTERNATIVES
M/s. Dashrath Prasad Fertilizers Pvt. Ltd. proposes to include Single Super Phosphate
(SSP) manufacturing facility in permitted/consented NPK Fertilizers (by mixing only)
unit in an area of 12.6 acres located at Sy. No. 274/1, 274/2, 276/A2, 277/A1,
Tekulapalli Village, Penuballi Mandal, Khammam District, Telangana.
Analysis of alternatives was undertaken to assess sites, process, and technology and
treatment options. The site is not assessed in this case as the proposal is inclusion of
SSP manufacturing facility in permitted/consented NPK Fertilizers (by mixing only)
unit. The objective of this assessment is to identify best available technology not
entailing excessive costs, and to reduce pollution loads by optimizing both raw material
and resource consumption.
5.1 Alternative Sites (Terms of Reference No.4(iii))
The proposal is inclusion of SSP manufacturing facility in permitted/consented NPK
Fertilizers (by mixing only) unit of area 12.6 acres. The manufacturing activity of SSP
will be on East side, whereas consented NPK Fertilizers is on west side of plant area.
5.2 Alternative in Process
The S.S.P is produced by reacting 75 % Sulphuric acid with ground Rock
phosphate powder, the only manufacturing process utilize so far.
5.2.1 Alternatives in Technology
SSP manufacturing is produced by reacting 75 % Sulphuric acid with ground Rock
phosphate powder followed by drying, cutting and curing of SSP, wherein each stage
of process involves different type equipment which are potential sources of process and
diffuse emissions. Hence the alternatives were reviewed for charging the material and
scrubbing of process emissions.
Open conveyor technology shall be completely avoided to reduce diffuse emissions
and loss into atmosphere of raw materials. Closed conveyor transfer technology will be
adopted to minimize the diffuse emission. Alternatives in technology for scrubbing of
Dashrath Prasad Fertilizers Pvt. Ltd. Environmental Impact Assessment Report
Team Labs And Consultants 5-2
Hydrogen fluoride are assessed are four stage vertical column water scrubbing in series
followed by caustic scrubber and two stage vertical column water scrubbing followed
by two stage venture scrubber and caustic scrubber.
The load on final caustic scrubber will be more by treating Hydrogen fluoride using
four stage water scrubbers in series. To reduce the load on caustic scrubber, two stage
ventury scrubbers in series placed in between secondary water scrubber and caustic by
replacing third and fourth water scrubbers.
The advantage of ventury scrubber is intensive mixing of gas and fluid at the neck of
ventury compare to normal water scrubber, thereby reducing the quantity of un-
scrubbed HF which further scrubbed in caustic scrubber to obtain the desired level of
hydrogen fluoride.
5.2.2 Alternatives in treatment/mitigation options
The effluents from the proposed SSP manufacturing are scrubbing effluent. Effluent
from scrubbers will be reused for acid dilution for process. Bag filters will be provided
in grinding and packing section instead of multicone cyclone separators and dust
collected in bag filters will be reused in process.
Dashrath Prasad Fertilizers Pvt. Ltd. Environmental Impact Assessment Report
Team Labs And Consultants 6-1
6.0 ENVIRONMENTAL MONITORING
6.1.1 Introduction
The environmental monitoring programme provides such information on which
management decision may be taken during construction and operation phases. It
provides basis for evaluating the efficiency of mitigation and pollution control
measures and suggest further actions that need to be taken to achieve the desired effect.
The monitoring includes:
(i) Visual observations;
(ii) Monitoring of environmental parameters at specific locations;
(iii) Sampling and regular testing of these parameters.
6.1.2 Objectives
The objectives of the environmental monitoring programme are:
• Evaluation of the efficiency of mitigation and pollution control measures;
• Updating of the actions and impacts on baseline data;
• Adoption of additional mitigation measures if the present measures are
insufficient;
• Generating the data, which may be incorporated in environmental
management plan in future projects.
6.1.3 Methodology
Monitoring methodology covers the following key aspects:
• Components to be monitored;
• Parameters for monitoring of the above components;
• Monitoring frequency;
• Monitoring standards;
• Responsibilities for monitoring;
• Direct responsibility,
• Overall responsibility;
• Monitoring costs.
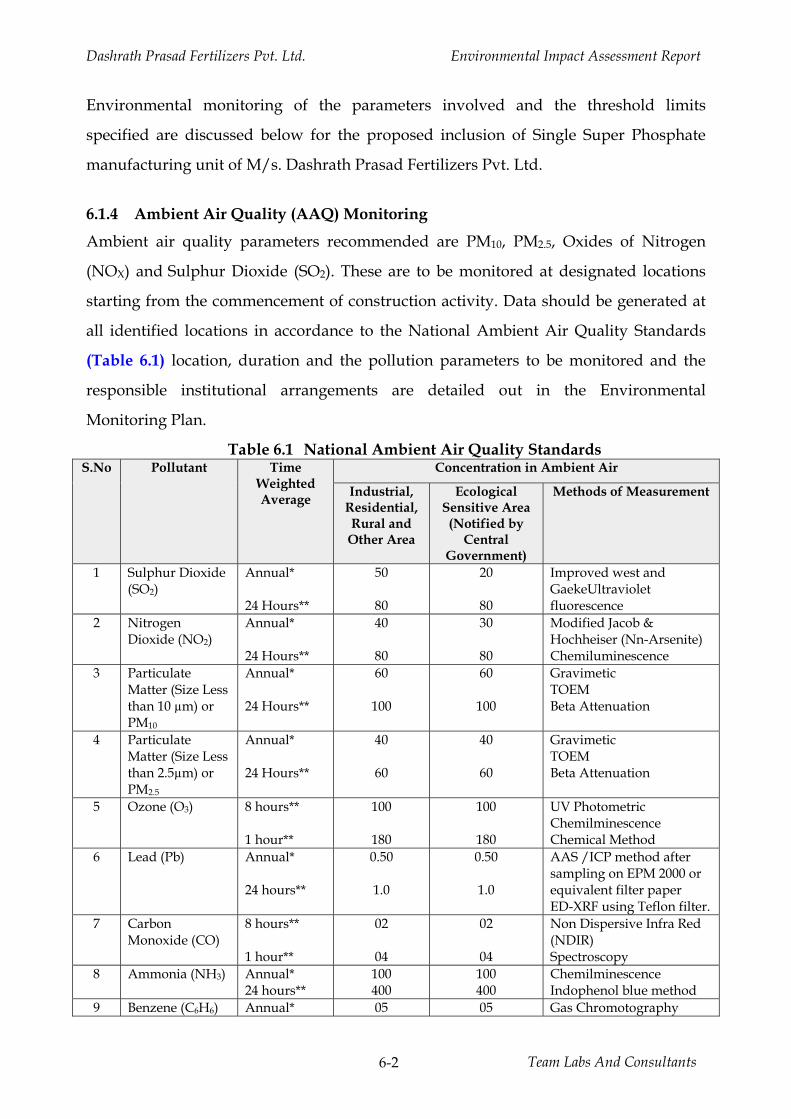
Dashrath Prasad Fertilizers Pvt. Ltd. Environmental Impact Assessment Report
Team Labs And Consultants 6-2
Environmental monitoring of the parameters involved and the threshold limits
specified are discussed below for the proposed inclusion of Single Super Phosphate
manufacturing unit of M/s. Dashrath Prasad Fertilizers Pvt. Ltd.
6.1.4 Ambient Air Quality (AAQ) Monitoring
Ambient air quality parameters recommended are PM10, PM2.5, Oxides of Nitrogen
(NOX) and Sulphur Dioxide (SO2). These are to be monitored at designated locations
starting from the commencement of construction activity. Data should be generated at
all identified locations in accordance to the National Ambient Air Quality Standards
(Table 6.1) location, duration and the pollution parameters to be monitored and the
responsible institutional arrangements are detailed out in the Environmental
Monitoring Plan.
Table 6.1 National Ambient Air Quality Standards S.No Pollutant Time
Weighted Average
Concentration in Ambient Air
Industrial, Residential, Rural and
Other Area
Ecological Sensitive Area (Notified by
Central Government)
Methods of Measurement
1 Sulphur Dioxide (SO2)
Annual* 24 Hours**
50
80
20
80
Improved west and GaekeUltraviolet fluorescence
2 Nitrogen Dioxide (NO2)
Annual* 24 Hours**
40
80
30
80
Modified Jacob & Hochheiser (Nn-Arsenite) Chemiluminescence
3 Particulate Matter (Size Less than 10 µm) or PM10
Annual* 24 Hours**
60
100
60
100
Gravimetic TOEM Beta Attenuation
4 Particulate Matter (Size Less than 2.5µm) or PM2.5
Annual* 24 Hours**
40
60
40
60
Gravimetic TOEM Beta Attenuation
5 Ozone (O3) 8 hours** 1 hour**
100
180
100
180
UV Photometric Chemilminescence Chemical Method
6 Lead (Pb) Annual* 24 hours**
0.50
1.0
0.50
1.0
AAS /ICP method after sampling on EPM 2000 or equivalent filter paper ED-XRF using Teflon filter.
7 Carbon Monoxide (CO)
8 hours** 1 hour**
02
04
02
04
Non Dispersive Infra Red (NDIR) Spectroscopy
8 Ammonia (NH3) Annual* 24 hours**
100 400
100 400
Chemilminescence Indophenol blue method
9 Benzene (C6H6) Annual* 05 05 Gas Chromotography
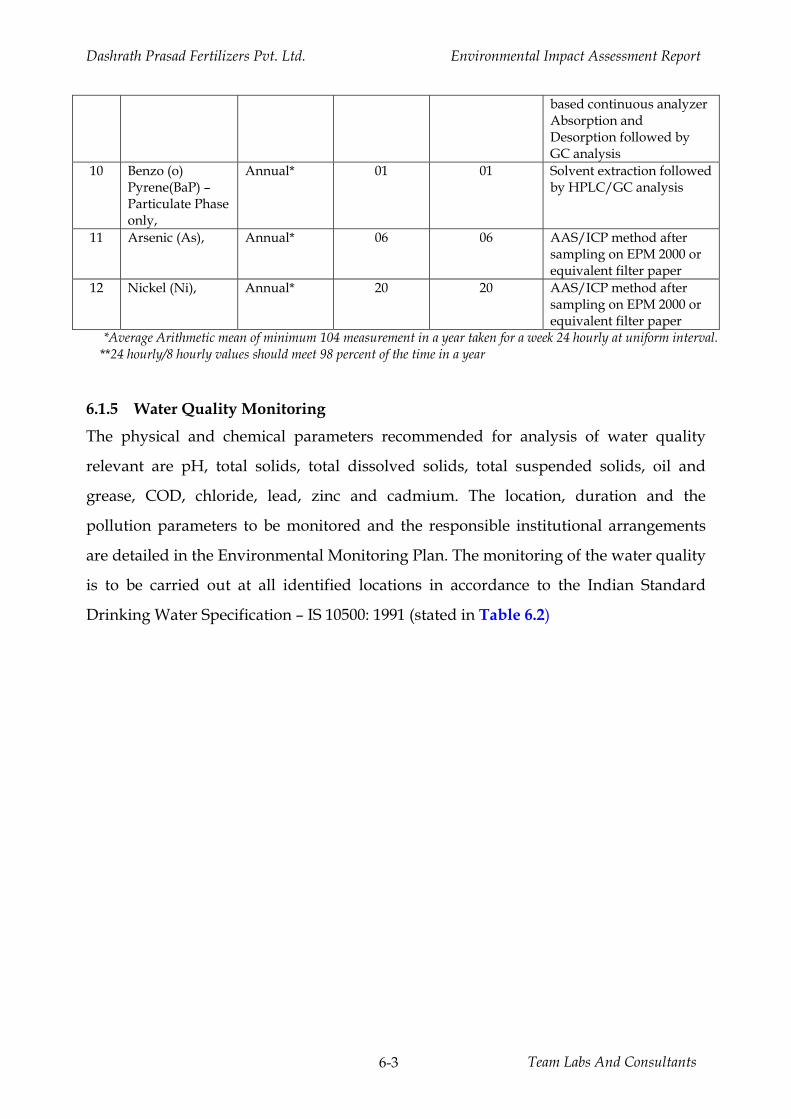
Dashrath Prasad Fertilizers Pvt. Ltd. Environmental Impact Assessment Report
Team Labs And Consultants 6-3
based continuous analyzer Absorption and Desorption followed by GC analysis
10 Benzo (o) Pyrene(BaP) – Particulate Phase only,
Annual* 01 01 Solvent extraction followed by HPLC/GC analysis
11 Arsenic (As), Annual* 06 06 AAS/ICP method after sampling on EPM 2000 or equivalent filter paper
12 Nickel (Ni), Annual* 20 20 AAS/ICP method after sampling on EPM 2000 or equivalent filter paper
*Average Arithmetic mean of minimum 104 measurement in a year taken for a week 24 hourly at uniform interval. **24 hourly/8 hourly values should meet 98 percent of the time in a year
6.1.5 Water Quality Monitoring
The physical and chemical parameters recommended for analysis of water quality
relevant are pH, total solids, total dissolved solids, total suspended solids, oil and
grease, COD, chloride, lead, zinc and cadmium. The location, duration and the
pollution parameters to be monitored and the responsible institutional arrangements
are detailed in the Environmental Monitoring Plan. The monitoring of the water quality
is to be carried out at all identified locations in accordance to the Indian Standard
Drinking Water Specification – IS 10500: 1991 (stated in Table 6.2)
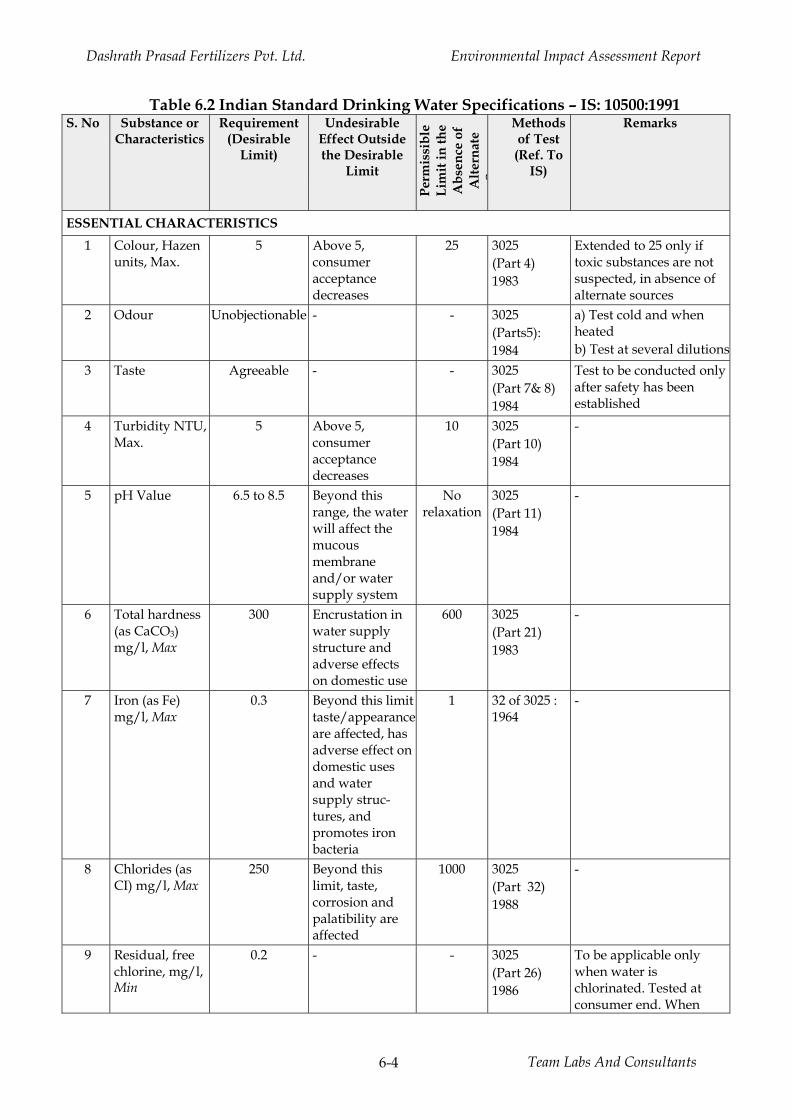
Dashrath Prasad Fertilizers Pvt. Ltd. Environmental Impact Assessment Report
Team Labs And Consultants 6-4
Table 6.2 Indian Standard Drinking Water Specifications – IS: 10500:1991 S. No Substance or
Characteristics Requirement
(Desirable Limit)
Undesirable Effect Outside the Desirable
Limit
Perm
issi
ble
Lim
it in
the
Abs
ence
of
Alte
rnat
e S
Methods of Test
(Ref. To IS)
Remarks
ESSENTIAL CHARACTERISTICS 1 Colour, Hazen
units, Max. 5 Above 5,
consumer acceptance decreases
25 3025 (Part 4) 1983
Extended to 25 only if toxic substances are not suspected, in absence of alternate sources
2 Odour Unobjectionable - - 3025 (Parts5): 1984
a) Test cold and when heated b) Test at several dilutions
3 Taste Agreeable - - 3025 (Part 7& 8) 1984
Test to be conducted only after safety has been established
4 Turbidity NTU, Max.
5 Above 5, consumer acceptance decreases
10 3025 (Part 10) 1984
-
5 pH Value 6.5 to 8.5 Beyond this range, the water will affect the mucous membrane and/or water supply system
No relaxation
3025 (Part 11) 1984
-
6 Total hardness (as CaCO3) mg/l, Max
300 Encrustation in water supply structure and adverse effects on domestic use
600 3025 (Part 21) 1983
-
7 Iron (as Fe) mg/l, Max
0.3 Beyond this limit taste/appearance are affected, has adverse effect on domestic uses and water supply struc-tures, and promotes iron bacteria
1 32 of 3025 : 1964
-
8 Chlorides (as CI) mg/l, Max
250 Beyond this limit, taste, corrosion and palatibility are affected
1000 3025 (Part 32) 1988
-
9 Residual, free chlorine, mg/l, Min
0.2 - - 3025 (Part 26) 1986
To be applicable only when water is chlorinated. Tested at consumer end. When
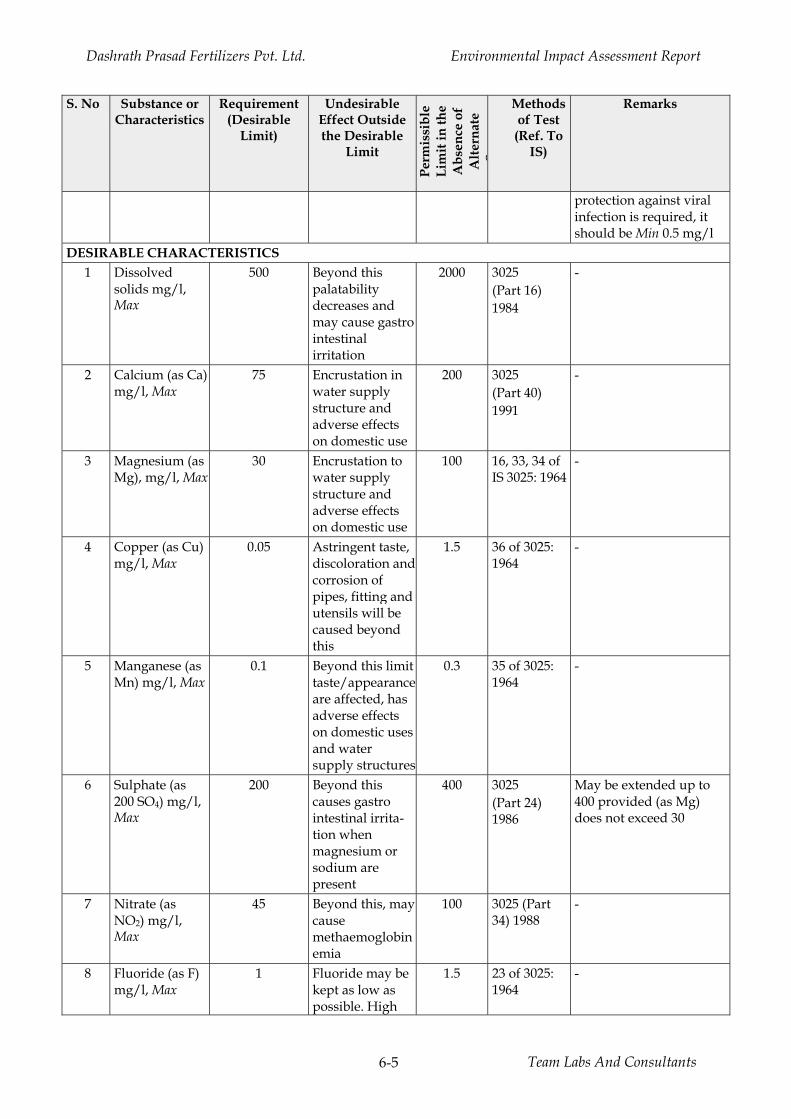
Dashrath Prasad Fertilizers Pvt. Ltd. Environmental Impact Assessment Report
Team Labs And Consultants 6-5
S. No Substance or Characteristics
Requirement (Desirable
Limit)
Undesirable Effect Outside the Desirable
Limit
Perm
issi
ble
Lim
it in
the
Abs
ence
of
Alte
rnat
e S
Methods of Test
(Ref. To IS)
Remarks
protection against viral infection is required, it should be Min 0.5 mg/l
DESIRABLE CHARACTERISTICS 1 Dissolved
solids mg/l, Max
500 Beyond this palatability decreases and may cause gastro intestinal irritation
2000 3025 (Part 16) 1984
-
2 Calcium (as Ca) mg/l, Max
75 Encrustation in water supply structure and adverse effects on domestic use
200 3025 (Part 40) 1991
-
3 Magnesium (as Mg), mg/l, Max
30 Encrustation to water supply structure and adverse effects on domestic use
100 16, 33, 34 of IS 3025: 1964
-
4 Copper (as Cu) mg/l, Max
0.05 Astringent taste, discoloration and corrosion of pipes, fitting and utensils will be caused beyond this
1.5 36 of 3025: 1964
-
5 Manganese (as Mn) mg/l, Max
0.1 Beyond this limit taste/appearance are affected, has adverse effects on domestic uses and water supply structures
0.3 35 of 3025: 1964
-
6 Sulphate (as 200 SO4) mg/l, Max
200 Beyond this causes gastro intestinal irrita-tion when magnesium or sodium are present
400 3025 (Part 24) 1986
May be extended up to 400 provided (as Mg) does not exceed 30
7 Nitrate (as NO2) mg/l, Max
45 Beyond this, may cause methaemoglobinemia
100 3025 (Part 34) 1988
-
8 Fluoride (as F) mg/l, Max
1 Fluoride may be kept as low as possible. High
1.5 23 of 3025: 1964
-
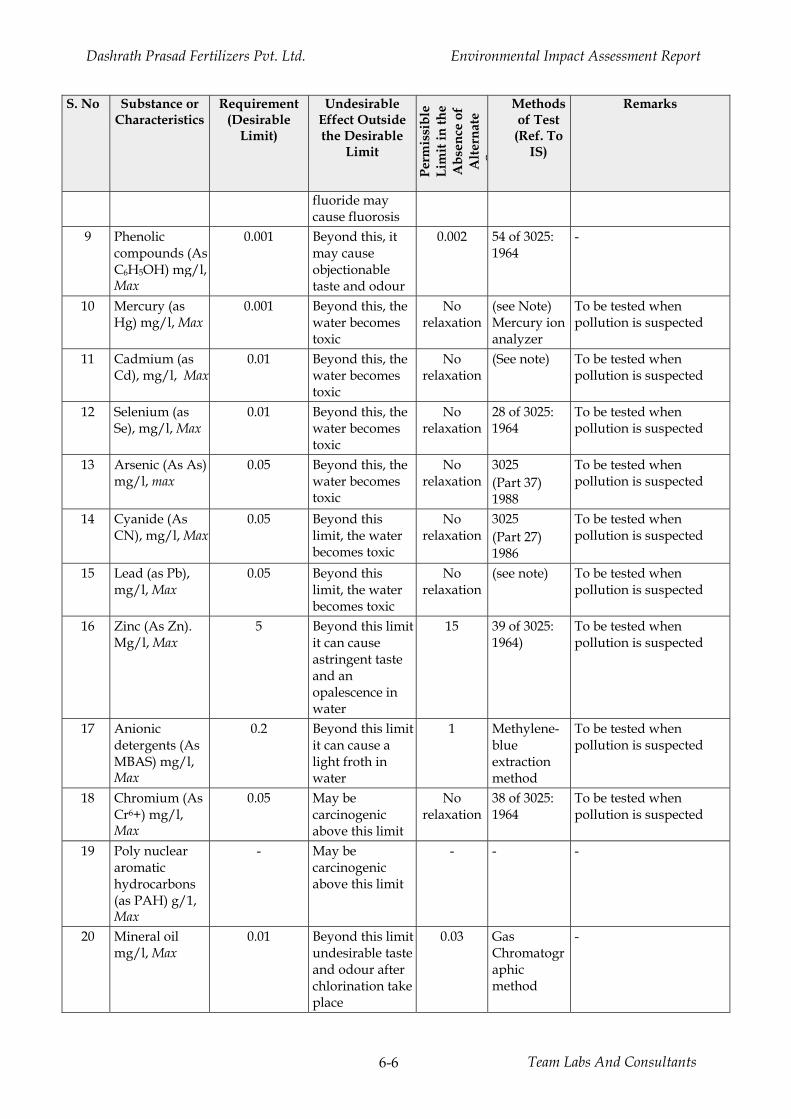
Dashrath Prasad Fertilizers Pvt. Ltd. Environmental Impact Assessment Report
Team Labs And Consultants 6-6
S. No Substance or Characteristics
Requirement (Desirable
Limit)
Undesirable Effect Outside the Desirable
Limit
Perm
issi
ble
Lim
it in
the
Abs
ence
of
Alte
rnat
e S
Methods of Test
(Ref. To IS)
Remarks
fluoride may cause fluorosis
9 Phenolic compounds (As C6H5OH) mg/l, Max
0.001 Beyond this, it may cause objectionable taste and odour
0.002 54 of 3025: 1964
-
10 Mercury (as Hg) mg/l, Max
0.001 Beyond this, the water becomes toxic
No relaxation
(see Note) Mercury ion analyzer
To be tested when pollution is suspected
11 Cadmium (as Cd), mg/l, Max
0.01 Beyond this, the water becomes toxic
No relaxation
(See note) To be tested when pollution is suspected
12 Selenium (as Se), mg/l, Max
0.01 Beyond this, the water becomes toxic
No relaxation
28 of 3025: 1964
To be tested when pollution is suspected
13 Arsenic (As As) mg/l, max
0.05 Beyond this, the water becomes toxic
No relaxation
3025 (Part 37) 1988
To be tested when pollution is suspected
14 Cyanide (As CN), mg/l, Max
0.05 Beyond this limit, the water becomes toxic
No relaxation
3025 (Part 27) 1986
To be tested when pollution is suspected
15 Lead (as Pb), mg/l, Max
0.05 Beyond this limit, the water becomes toxic
No relaxation
(see note) To be tested when pollution is suspected
16 Zinc (As Zn). Mg/l, Max
5 Beyond this limit it can cause astringent taste and an opalescence in water
15 39 of 3025: 1964)
To be tested when pollution is suspected
17 Anionic detergents (As MBAS) mg/l, Max
0.2 Beyond this limit it can cause a light froth in water
1 Methylene-blue extraction method
To be tested when pollution is suspected
18 Chromium (As Cr6+) mg/l, Max
0.05 May be carcinogenic above this limit
No relaxation
38 of 3025: 1964
To be tested when pollution is suspected
19 Poly nuclear aromatic hydrocarbons (as PAH) g/1, Max
- May be carcinogenic above this limit
- - -
20 Mineral oil mg/l, Max
0.01 Beyond this limit undesirable taste and odour after chlorination take place
0.03 Gas Chromatographic method
-
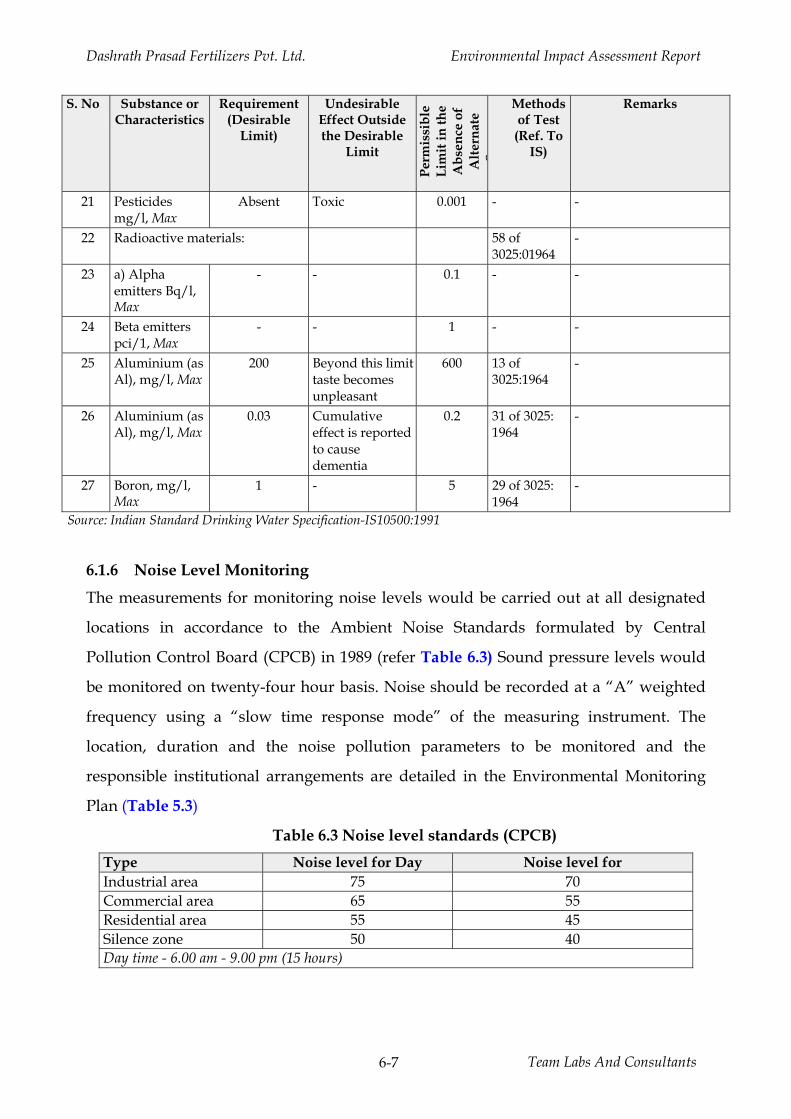
Dashrath Prasad Fertilizers Pvt. Ltd. Environmental Impact Assessment Report
Team Labs And Consultants 6-7
S. No Substance or Characteristics
Requirement (Desirable
Limit)
Undesirable Effect Outside the Desirable
Limit
Perm
issi
ble
Lim
it in
the
Abs
ence
of
Alte
rnat
e S
Methods of Test
(Ref. To IS)
Remarks
21 Pesticides mg/l, Max
Absent Toxic 0.001 - -
22 Radioactive materials: 58 of 3025:01964
-
23 a) Alpha emitters Bq/l, Max
- - 0.1 - -
24 Beta emitters pci/1, Max
- - 1 - -
25 Aluminium (as Al), mg/l, Max
200 Beyond this limit taste becomes unpleasant
600 13 of 3025:1964
-
26 Aluminium (as Al), mg/l, Max
0.03 Cumulative effect is reported to cause dementia
0.2 31 of 3025: 1964
-
27 Boron, mg/l, Max
1 - 5 29 of 3025: 1964
-
Source: Indian Standard Drinking Water Specification-IS10500:1991
6.1.6 Noise Level Monitoring
The measurements for monitoring noise levels would be carried out at all designated
locations in accordance to the Ambient Noise Standards formulated by Central
Pollution Control Board (CPCB) in 1989 (refer Table 6.3) Sound pressure levels would
be monitored on twenty-four hour basis. Noise should be recorded at a “A” weighted
frequency using a “slow time response mode” of the measuring instrument. The
location, duration and the noise pollution parameters to be monitored and the
responsible institutional arrangements are detailed in the Environmental Monitoring
Plan (Table 5.3)
Table 6.3 Noise level standards (CPCB) Type Noise level for Day Noise level for Industrial area 75 70 Commercial area 65 55 Residential area 55 45 Silence zone 50 40 Day time - 6.00 am - 9.00 pm (15 hours)
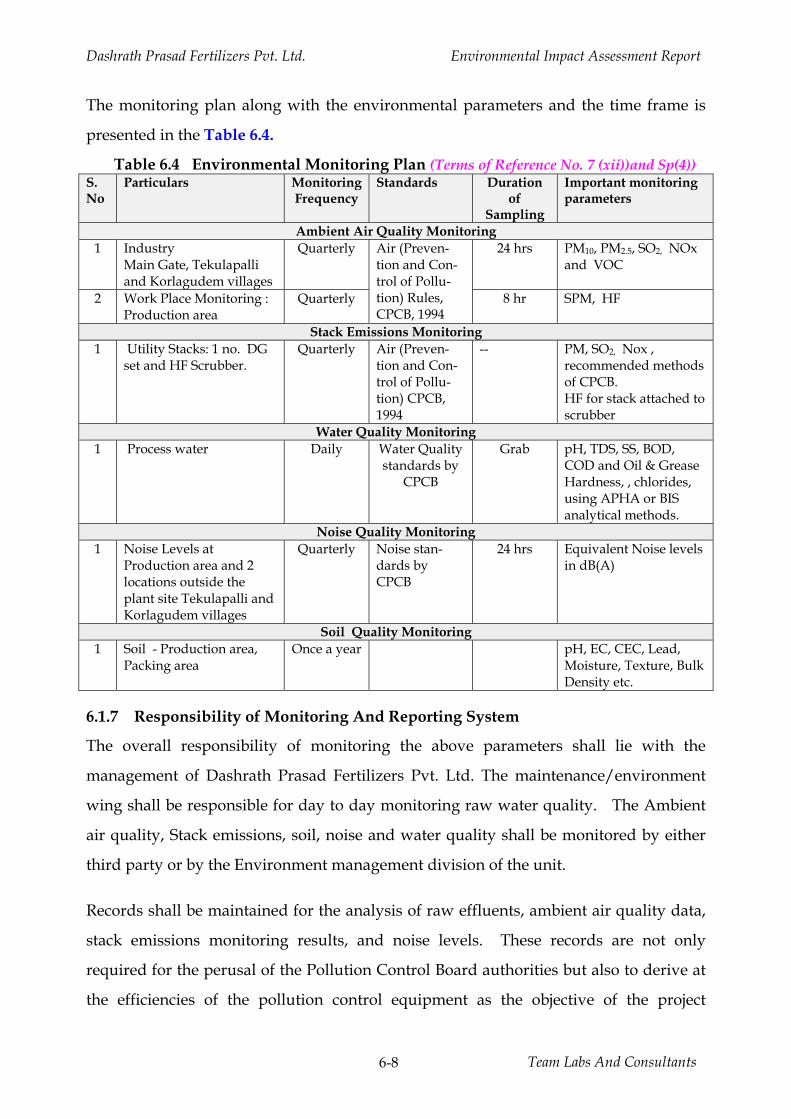
Dashrath Prasad Fertilizers Pvt. Ltd. Environmental Impact Assessment Report
Team Labs And Consultants 6-8
The monitoring plan along with the environmental parameters and the time frame is
presented in the Table 6.4.
Table 6.4 Environmental Monitoring Plan (Terms of Reference No. 7 (xii))and Sp(4)) S. No
Particulars Monitoring Frequency
Standards Duration of
Sampling
Important monitoring parameters
Ambient Air Quality Monitoring 1 Industry
Main Gate, Tekulapalli and Korlagudem villages
Quarterly Air (Preven-tion and Con-trol of Pollu-tion) Rules, CPCB, 1994
24 hrs PM10, PM2.5, SO2, NOx and VOC
2 Work Place Monitoring : Production area
Quarterly 8 hr SPM, HF
Stack Emissions Monitoring 1 Utility Stacks: 1 no. DG
set and HF Scrubber.
Quarterly Air (Preven-tion and Con-trol of Pollu-tion) CPCB, 1994
-- PM, SO2, Nox , recommended methods of CPCB. HF for stack attached to scrubber
Water Quality Monitoring 1 Process water Daily Water Quality
standards by CPCB
Grab pH, TDS, SS, BOD, COD and Oil & Grease Hardness, , chlorides, using APHA or BIS analytical methods.
Noise Quality Monitoring 1 Noise Levels at
Production area and 2 locations outside the plant site Tekulapalli and Korlagudem villages
Quarterly Noise stan-dards by CPCB
24 hrs Equivalent Noise levels in dB(A)
Soil Quality Monitoring 1 Soil - Production area,
Packing area Once a year pH, EC, CEC, Lead,
Moisture, Texture, Bulk Density etc.
6.1.7 Responsibility of Monitoring And Reporting System
The overall responsibility of monitoring the above parameters shall lie with the
management of Dashrath Prasad Fertilizers Pvt. Ltd. The maintenance/environment
wing shall be responsible for day to day monitoring raw water quality. The Ambient
air quality, Stack emissions, soil, noise and water quality shall be monitored by either
third party or by the Environment management division of the unit.
Records shall be maintained for the analysis of raw effluents, ambient air quality data,
stack emissions monitoring results, and noise levels. These records are not only
required for the perusal of the Pollution Control Board authorities but also to derive at
the efficiencies of the pollution control equipment as the objective of the project
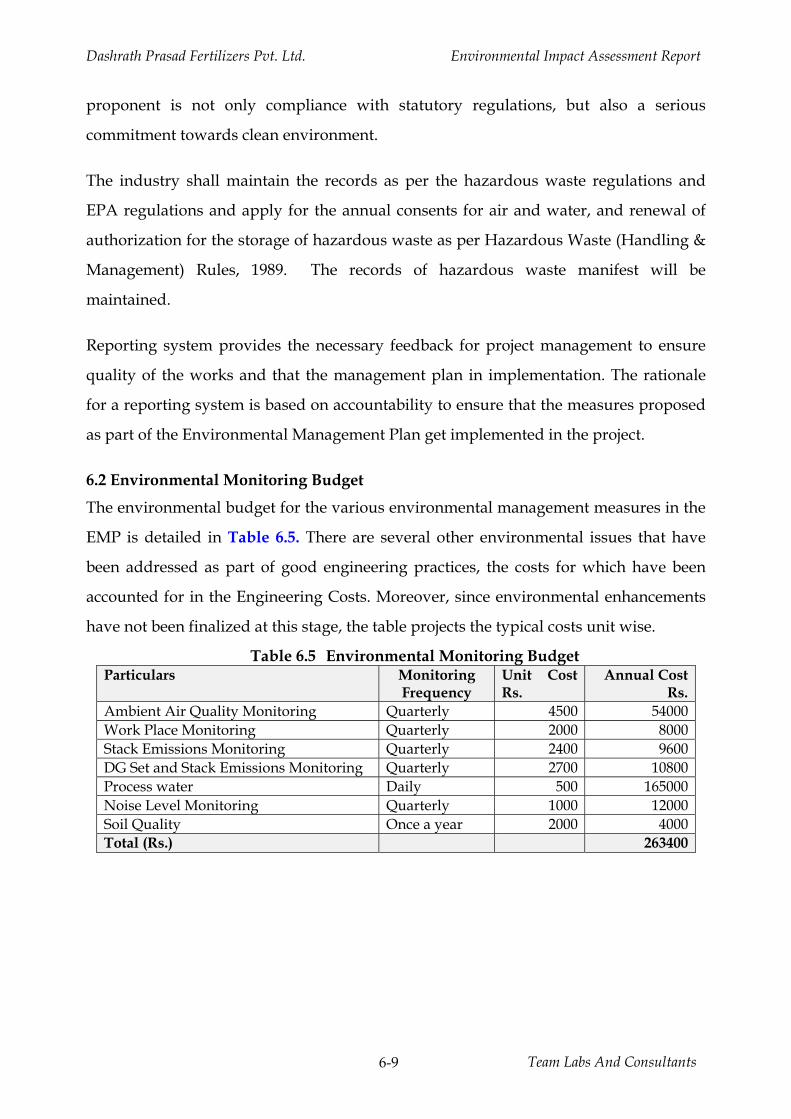
Dashrath Prasad Fertilizers Pvt. Ltd. Environmental Impact Assessment Report
Team Labs And Consultants 6-9
proponent is not only compliance with statutory regulations, but also a serious
commitment towards clean environment.
The industry shall maintain the records as per the hazardous waste regulations and
EPA regulations and apply for the annual consents for air and water, and renewal of
authorization for the storage of hazardous waste as per Hazardous Waste (Handling &
Management) Rules, 1989. The records of hazardous waste manifest will be
maintained.
Reporting system provides the necessary feedback for project management to ensure
quality of the works and that the management plan in implementation. The rationale
for a reporting system is based on accountability to ensure that the measures proposed
as part of the Environmental Management Plan get implemented in the project.
6.2 Environmental Monitoring Budget
The environmental budget for the various environmental management measures in the
EMP is detailed in Table 6.5. There are several other environmental issues that have
been addressed as part of good engineering practices, the costs for which have been
accounted for in the Engineering Costs. Moreover, since environmental enhancements
have not been finalized at this stage, the table projects the typical costs unit wise.
Table 6.5 Environmental Monitoring Budget Particulars Monitoring
Frequency Unit Cost Rs.
Annual Cost Rs.
Ambient Air Quality Monitoring Quarterly 4500 54000 Work Place Monitoring Quarterly 2000 8000 Stack Emissions Monitoring Quarterly 2400 9600 DG Set and Stack Emissions Monitoring Quarterly 2700 10800 Process water Daily 500 165000 Noise Level Monitoring Quarterly 1000 12000 Soil Quality Once a year 2000 4000 Total (Rs.) 263400

Dashrath Prasad Fertilizers Pvt. Ltd. Environmental Impact Assessment Report
7-1 Team Labs and Consultants
7.0 RISK ASSESSMENT AND DAMAGE CONTROL 7.0 Introduction
This chapter presents the risk assessment study results for the plant operations, transport
and storage of raw materials, and identifies maximum credible accident scenarios to draw
the emergency management plan addressing various credible scenarios identified.
7.1. Objectives and Scope
The production of Single Super Phosphate (SSP) involves usage of rock phosphate and
sulfuric acid. The risks associated with the chemical industry are commensurate with their
rapid growth and development. Apart from their utility, chemicals have their own
inherent properties and hazards. The whole lifecycle of a chemical should be considered
when assessing its dangers and benefits. In order to ensure the health and safety of
persons at or near the facilities, Govt. has approved some regulations. The regulation
requires Employers to consult with employees in relation to:
- Identification of major hazards and potential major accidents - Risk assessment - Adoption of control measures - Establishment and implementation of a safety management system - Development of the safety report
The involvement of the employees in identification of hazards and control measures
enhances their awareness of these issues and is critical to the achievement of safe
operation in practice. In order to comply with regulatory authorities, M/s Dashrath Prasad
Fertilizers Pvt. Ltd. have entrusted Team Labs and Consultants, Hyderabad to review and
prepare Hazard analysis and Risk assessment for their facility along with an approach to
on-site emergency preparedness plan as required under the acts and rules. (Manual on
emergency preparedness for chemical hazards, MOEF, New Delhi). In this endeavor, the
methodology adopted is based on;
• visualizing various probable undesirable events which lead to major accidents
Dashrath Prasad Fertilizers Pvt. Ltd. Environmental Impact Assessment Report
7-2 Team Labs and Consultants
• detailed and systematic assessment of the risk associated with each of those
hazards, including the likelihood and consequences of each potential major accident
event; and
• Identifying the technical and other control measures that are necessary to reduce
that risk to a level that is as low as reasonably practicable.
The strategy to tackle such emergencies, in-depth planning and person(s) or positional
responsibilities of employees for implementation and coordination of timely and effective
response measures are described in onsite detail in Emergency Plan.
7.2 Project Details
The plant site is located at Survey No. 274/1, 274/2, 276/A2, 277/A1, Tekulapalli Village,
Penuballi Mandal, Khammam District, Telangana spread over an area of 12.6 acres. The
site is located at the intersection of 170 11’ 53” (N) latitude and 800 36’ 29” (E) longitude.
The site elevation above mean sea level (MSL) is in the range of 112-115 m. The plant site
is surrounded by open agricultural lands in all directions except north, State Highway-42
(Khamma – Sathupally) in North direction. The nearest habitation from the site is
Tekulapalli village located at a distance of 1.2 km in east direction. The main approach
road is State Highway 42 connecting Khammam andSathupally at a distance of 0.1 km in
north direction. The nearest Town Tiruvuru is at a distance of 8.2 km in southeast
direction. The nearest Railway station is Bhadrachalam Road at a distance of 40 km in
northeast direction and nearest airport is Vijayawada International Airport (Gannavaram)
located at a distance of 130 km in southeast direction. Nagarjuna sagar Main Branch Canal
is flowing from northwest to southeast direction at a distance of 2.5 km in north direction.
Madhira Branch canal is at a distance of 6.2 km in west direction. Kannegiri RF is at a
distance of 7.2 km in north direction. Interstate boundary of Andhra Pradesh – Telangana
is at a distance of 5.9 km in southwest direction. There is no National Park, Wildlife
sanctuary, ecologically sensitive area within the impact area of 10 km. The manufacturing
capacity is presented in Table 7.1 Chemical inventory is presented in Table 7.2
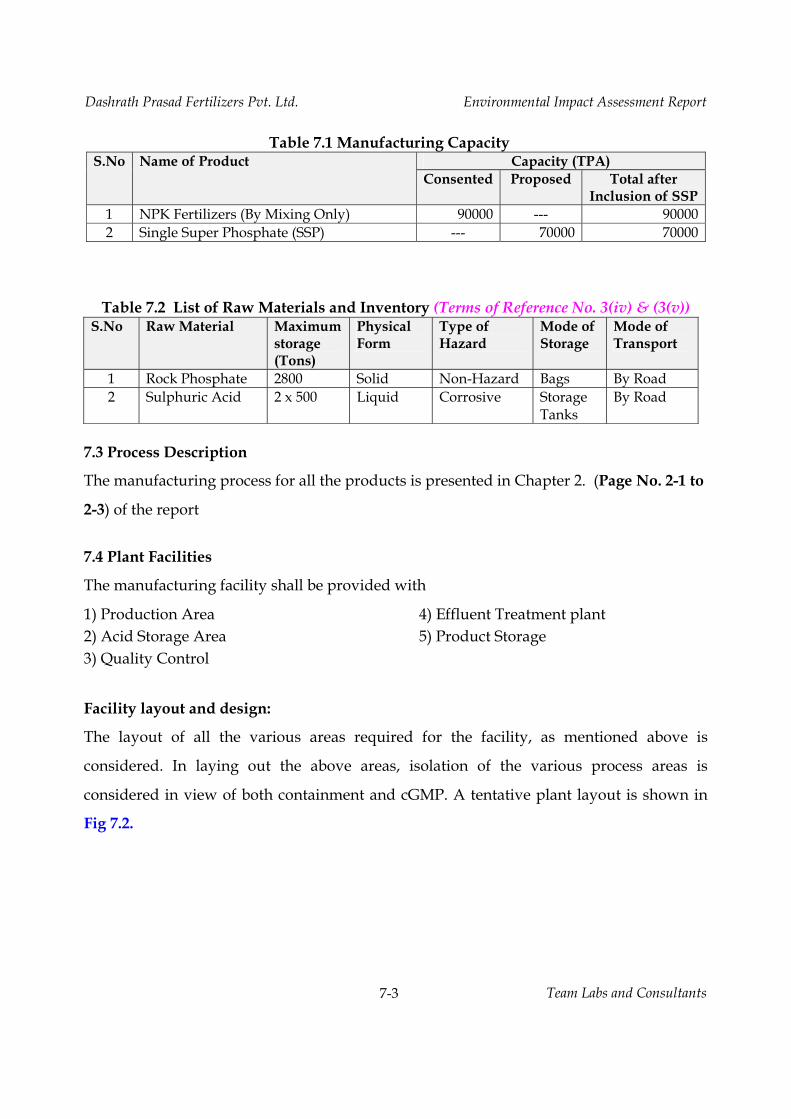
Dashrath Prasad Fertilizers Pvt. Ltd. Environmental Impact Assessment Report
7-3 Team Labs and Consultants
Table 7.1 Manufacturing Capacity S.No Name of Product Capacity (TPA)
Consented Proposed Total after Inclusion of SSP
1 NPK Fertilizers (By Mixing Only) 90000 --- 90000 2 Single Super Phosphate (SSP) --- 70000 70000
Table 7.2 List of Raw Materials and Inventory (Terms of Reference No. 3(iv) & (3(v)) S.No Raw Material Maximum
storage (Tons)
Physical Form
Type of Hazard
Mode of Storage
Mode of Transport
1 Rock Phosphate 2800 Solid Non-Hazard Bags By Road 2 Sulphuric Acid 2 x 500 Liquid Corrosive Storage
Tanks By Road
7.3 Process Description
The manufacturing process for all the products is presented in Chapter 2. (Page No. 2-1 to
2-3) of the report
7.4 Plant Facilities
The manufacturing facility shall be provided with
1) Production Area 2) Acid Storage Area 3) Quality Control
4) Effluent Treatment plant 5) Product Storage
Facility layout and design:
The layout of all the various areas required for the facility, as mentioned above is
considered. In laying out the above areas, isolation of the various process areas is
considered in view of both containment and cGMP. A tentative plant layout is shown in
Fig 7.2.
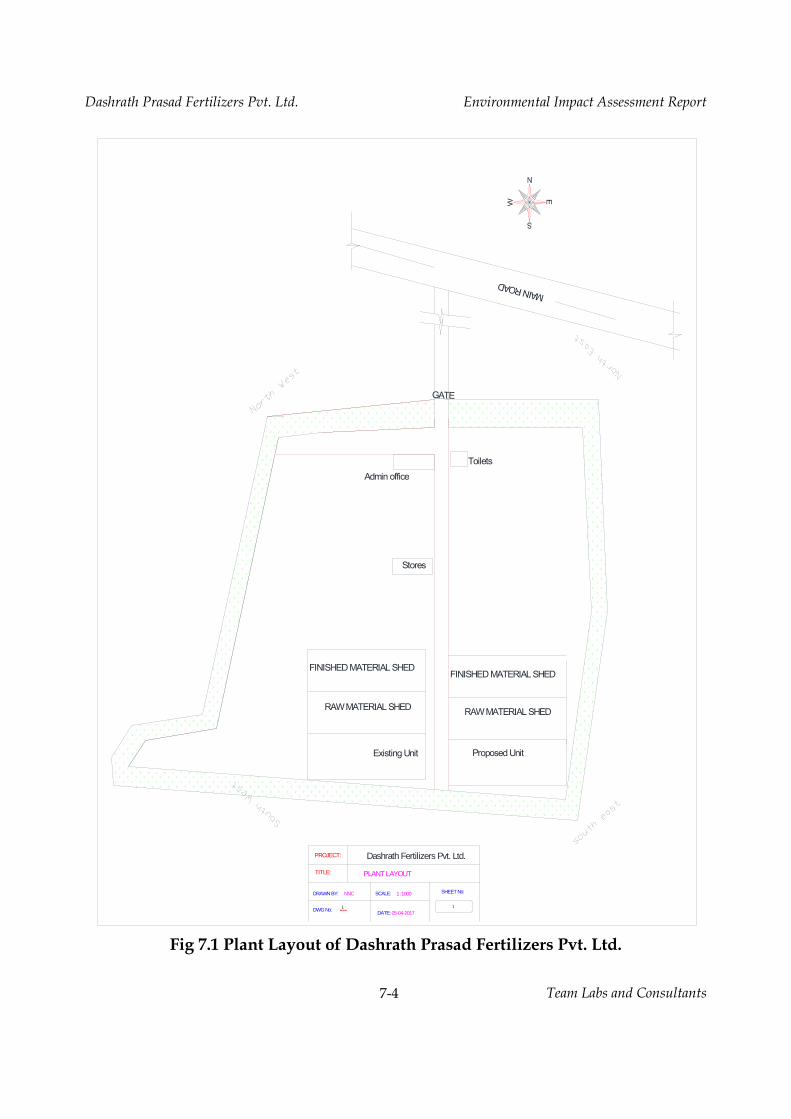
Dashrath Prasad Fertilizers Pvt. Ltd. Environmental Impact Assessment Report
7-4 Team Labs and Consultants
Fig 7.1 Plant Layout of Dashrath Prasad Fertilizers Pvt. Ltd.
---
PLANT LAYOUTTITLE:
DRAWN BY: NNC
RAW MATERIAL SHED
Admin office
DWG No:
Toilets
Stores
Dashrath Fertilizers Pvt. Ltd.
FINISHED MATERIAL SHED
GATE
RAW MATERIAL SHED
FINISHED MATERIAL SHED
PROJECT:
DATE: 05-04-20171
Existing Unit
SCALE: 1 :1000
Proposed Unit
MAIN ROAD
1
SHEET No:
Dashrath Prasad Fertilizers Pvt. Ltd. Environmental Impact Assessment Report
7-5 Team Labs and Consultants
7.5 Hazard Analysis and Risk Assessment
7.5.1 Introduction.
Hazard analysis involves the identification and quantification of the various hazards
(unsafe conditions) that exist in the plant. On the other hand, risk analysis deals with the
identification and quantification of risks, the plant equipment and personnel are exposed
to, due to accidents resulting from the hazards present in the plant.
Risk analysis follows an extensive hazard analysis. It involves the identification and
assessment of risks; the neighboring populations are exposed to as a result of hazards
present. This requires a thorough knowledge of failure probability, credible accident
scenario, vulnerability of population's etc. Much of this information is difficult to get or
generate. Consequently, the risk analysis is often confined to maximum credible accident
studies.
7.5.2 Hazard Identification (Terms of Reference No. 3(ix))
Hazard identification and risk assessment involves a critical sequence of information
gathering and the application of a decision-making process. These assist in discovering
what could possibly cause a major accident (hazard identification), how likely it is that a
major accident would occur and the potential consequences (risk assessment) and what
options there are for preventing and mitigating a major accident (control measures).
These activities should also assist in improving operations and productivity and reduce
the occurrence of incidents and near misses.
The chemical and process industries have been using a variety of hazard identification
techniques for many years, ranging from simple screening checklists to highly structured
Hazard and Operability (HAZOP) analysis. The HAZOP process can also include
assessment of the causes of accidents, their likelihood and the consequences that may
arise, so as to decide if the risk is acceptable, unacceptable or requires further study.
After identifying hazards through a qualitative process, quantification of potential
consequences of identified hazards using simulation modelling is undertaken. Estimation
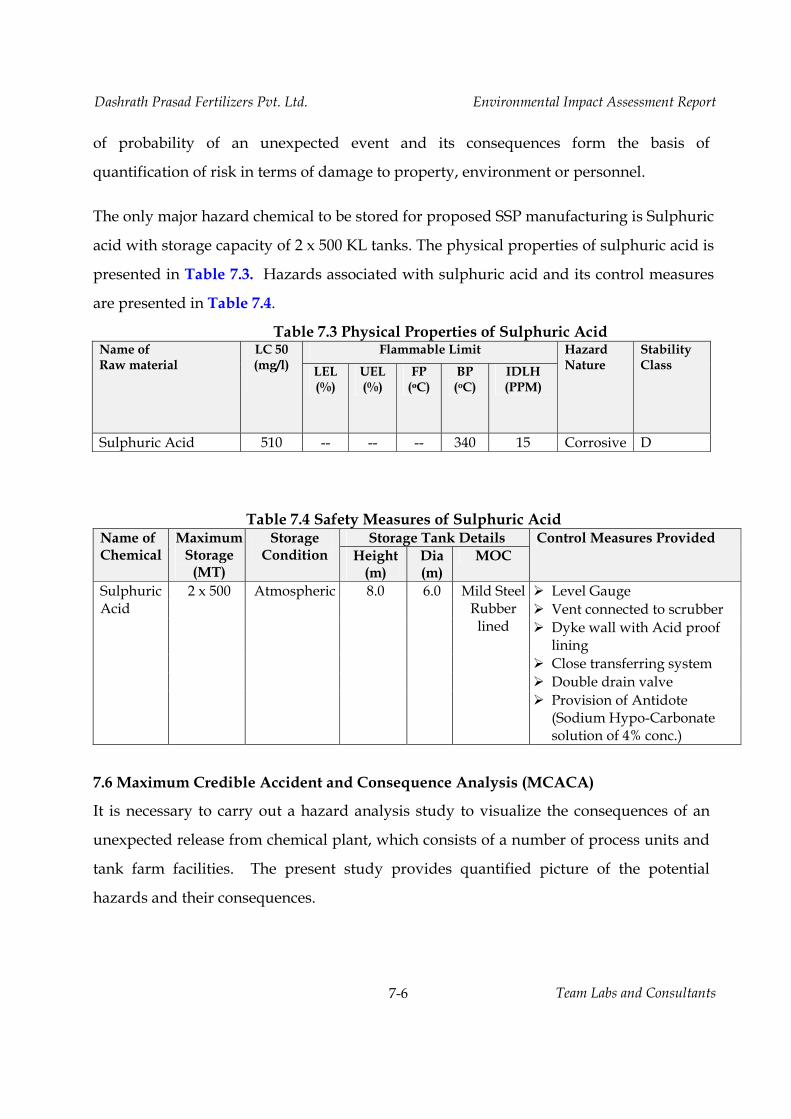
Dashrath Prasad Fertilizers Pvt. Ltd. Environmental Impact Assessment Report
7-6 Team Labs and Consultants
of probability of an unexpected event and its consequences form the basis of
quantification of risk in terms of damage to property, environment or personnel.
The only major hazard chemical to be stored for proposed SSP manufacturing is Sulphuric
acid with storage capacity of 2 x 500 KL tanks. The physical properties of sulphuric acid is
presented in Table 7.3. Hazards associated with sulphuric acid and its control measures
are presented in Table 7.4.
Table 7.3 Physical Properties of Sulphuric Acid Name of Raw material
LC 50 (mg/l)
Flammable Limit Hazard Nature
Stability Class LEL
(%) UEL (%)
FP (oC)
BP (oC)
IDLH (PPM)
Sulphuric Acid 510 -- -- -- 340 15 Corrosive D
Table 7.4 Safety Measures of Sulphuric Acid Name of Chemical
Maximum Storage
(MT)
Storage Condition
Storage Tank Details Control Measures Provided Height
(m) Dia (m)
MOC
Sulphuric Acid
2 x 500 Atmospheric 8.0 6.0 Mild Steel Rubber
lined
Level Gauge Vent connected to scrubber Dyke wall with Acid proof
lining Close transferring system Double drain valve Provision of Antidote
(Sodium Hypo-Carbonate solution of 4% conc.)
7.6 Maximum Credible Accident and Consequence Analysis (MCACA)
It is necessary to carry out a hazard analysis study to visualize the consequences of an
unexpected release from chemical plant, which consists of a number of process units and
tank farm facilities. The present study provides quantified picture of the potential
hazards and their consequences.
Dashrath Prasad Fertilizers Pvt. Ltd. Environmental Impact Assessment Report
7-7 Team Labs and Consultants
7.6.1 Toxic Dispersion:
Whenever there is an accident release of volatile material into atmosphere, it gets
dispersed into atmospheric air. The concentration of the material in space with respect to
time is determined using appropriate dispersion models. Toxic models are employed to
assess the consequences to human health as a result of exposure to toxic gases.
When IDLH (Immediate Danger to Life and Health) are used in conjunction with air
dispersion modeling, the resulting analysis can help evaluate the potential consequences
of any toxic chemical release from point of view of public health and welfare.
A material may be considered as toxic or poisonous, when a small quantity can cause
injurious effect on an average normal adult human being. There are several ways of
expressing the severity of toxic nature of the chemicals. These are;
TLV – Threshold Limit Value The maximum concentration limit for a normal eight-hour workday and 40 hours per
week to which nearly all workers may be repeatedly exposed day after day with out any
effects on health.
IDLH- Immediate Danger to Life and Health The maximum concentration limit to which a healthy worker can be exposed for 30
minutes and escape without suffering irreversible health effects or escape impairing
symptoms.
LD50 – Median lethal dose
The dose at which 50 percent of test animals die following exposure. Dose is usually
expressed as milligrams for kilogram of body weight of test animal. The most popular
way of expressing lethality of toxic loads is to use probit functions.
P = A + B ln (Cn t) where P is probit value, A , B, n – constants specific to the chemical t -- time of exposure in seconds, c – concentration in mg /m 3 or ppm.
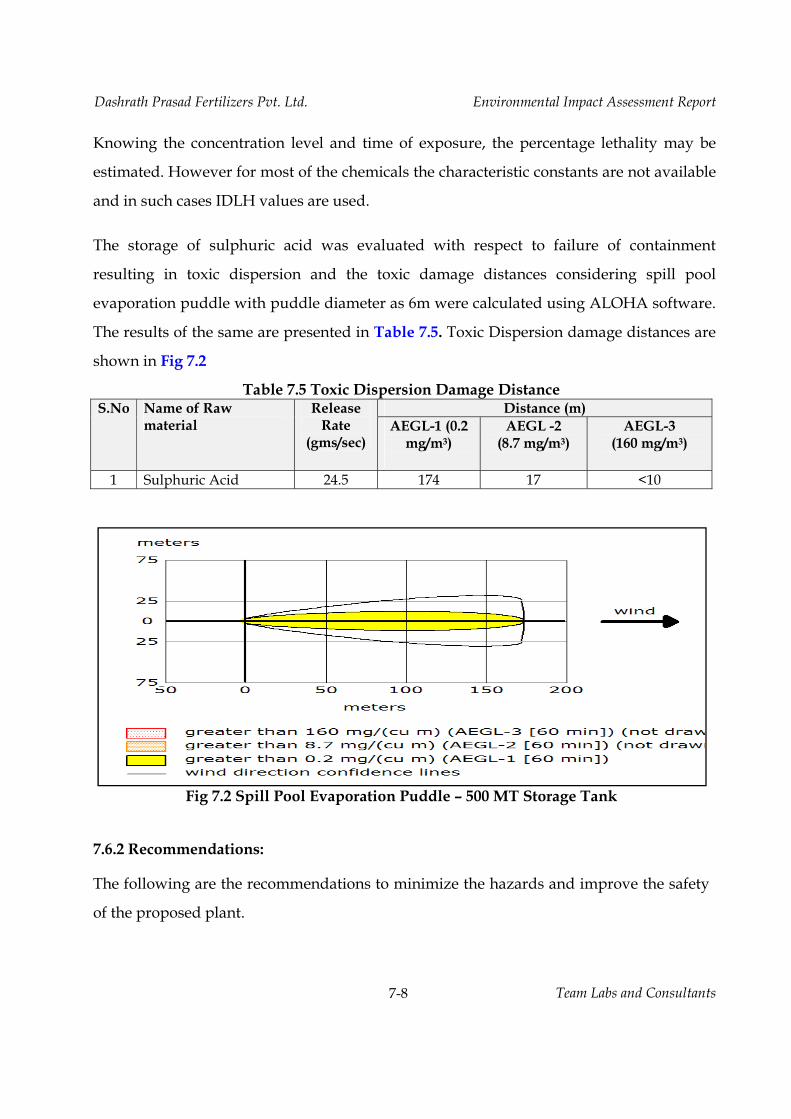
Dashrath Prasad Fertilizers Pvt. Ltd. Environmental Impact Assessment Report
7-8 Team Labs and Consultants
Knowing the concentration level and time of exposure, the percentage lethality may be
estimated. However for most of the chemicals the characteristic constants are not available
and in such cases IDLH values are used.
The storage of sulphuric acid was evaluated with respect to failure of containment
resulting in toxic dispersion and the toxic damage distances considering spill pool
evaporation puddle with puddle diameter as 6m were calculated using ALOHA software.
The results of the same are presented in Table 7.5. Toxic Dispersion damage distances are
shown in Fig 7.2
Table 7.5 Toxic Dispersion Damage Distance
Fig 7.2 Spill Pool Evaporation Puddle – 500 MT Storage Tank
7.6.2 Recommendations:
The following are the recommendations to minimize the hazards and improve the safety
of the proposed plant.
S.No Name of Raw material
Release Rate
(gms/sec)
Distance (m) AEGL-1 (0.2
mg/m3)
AEGL -2 (8.7 mg/m3)
AEGL-3 (160 mg/m3)
1 Sulphuric Acid 24.5 174 17 <10

Dashrath Prasad Fertilizers Pvt. Ltd. Environmental Impact Assessment Report
7-9 Team Labs and Consultants
In view of hazardous nature of operations, it is recommended to adopt best practices
with respect to design, operation and maintenance.
• All electrical fittings involved in and around the pipeline and operation system
should conform to flame/explosion proof regulations.
• Strict hot work control and display of danger signs should be ensured.
• rovision of Antidote (Sodium Hypo-Carbonate solution of 4% conc.)
• It is suggested to provide fire extinguishers in process plant.
• Fire protection equipment should be well maintained so that it is available when
required. They should be located for quick accessibility. Provide carbon dioxide fire
extinguishers and DCP extinguishers for Electrical fires.
• It is suggested to have a periodical review of safety awareness and safety training
requirements of plant employees with respect to hazards present in the plant.
• In general, all pipelines carrying liquids/vapor are periodically checked for their
integrity.
7.7 Transportation (Terms of Reference No. 7(iii)
All the raw materials and finished products are transported by road. The plant is located
near state highway, and there will not be any unauthorized shop or settlements along the
road connecting the plant site. There will be 25-30 truck trips per day to the factory.
Safety signage is placed at various locations in the battery limit.
7.8 Disaster Management Plan (Terms of Reference No. 7(xiii)
7.8.1 Introduction
A disaster is a catastrophic situation in which suddenly, people are plunged into
helplessness and suffering and, as a result, need protection, clothing, shelter, medical and
social care and other necessities of life.
Disasters can be divided into two main groups. In the first, are disasters resulting from
natural phenomena like earthquakes, volcanic eruptions, storm surges, cyclones, tropical
storms, floods, avalanches, landslides, and forest fires. The second group includes
Dashrath Prasad Fertilizers Pvt. Ltd. Environmental Impact Assessment Report
7-10 Team Labs and Consultants
disastrous events occasioned by man, or by man's impact upon the environment.
Examples are armed conflict, industrial accidents, radiation accidents, factory fires,
explosions and escape of toxic gases or chemical substances, river pollution, mining or
other structural collapses, air, sea, rail and road transport accidents and can reach
catastrophic dimensions in terms of human loss.
There can be no set criteria for assessing the gravity of a disaster in the abstract since this
depends to a large extent on the physical, economic and social environment in which it
occurs. However, all disasters bring in their wake similar consequences that call for
immediate action, whether at the local, national or international level, for the rescue and
relief of the victims. This includes the search for the dead and injured, medical and social
care, removal of the debris, the provision of temporary shelter for the homeless, food,
clothing and medical supplies, and the rapid re- establishment of essential services.
An emergency may be said to begin when operator at the plant or in charge of storage of
hazardous chemicals cannot cope up with a potentially hazardous incident, which may
turn into an emergency. The emergencies could be a major fire or explosion or release of
toxic gas or a combination of them.
The proposed plant store only sulphuric acid in a 2 x 500 MT storage tank of MS rubber
lined, which are corrosive in nature, and the storage will be as per the Controller of
Explosives and OISD norms. The hierarchy of the employees is yet to be determined
and the project is still in the initial stages of designing. Hence a tentative disaster
management plan is prepared to be suitably modified before commissioning of the plant.
7.8.2 Objectives of Emergency Management Plan (ON-SITE) (Terms of Reference No. 7(xiii) A quick and effective response during emergency can have tremendous significance on
whether the situation is controlled with little loss or it turns into a major emergency
Therefore, the objectives of this Onsite Emergency Plan (ONSEP);
Dashrath Prasad Fertilizers Pvt. Ltd. Environmental Impact Assessment Report
7-11 Team Labs and Consultants
During Emergency: Is to provide basic guidance to the personnel for effectively
combating such situations to minimize loss of life, damage to property and loss of
property.
• To localize the emergency and if possible eliminate it;
• To minimize the consequences of an emergency;
• To prevent spreading of the damage in other areas;
• To give necessary warning to plant personnel and neighborhood;
• To maximize resource utilization and combined efforts towards the emergency
operations;
• To mobilize internal resources and utilize them in the most effective way;
• To arrange rescue of persons, transport and treatment of causalities; • To seek necessary help from industries in neighborhood or local authorities;
• To provide information to government agencies and to provide information to
public.
During Normal Time:
• To keep the required emergency equipment in stock at right places and ensure their working condition;
• To keep the concerned personnel fully trained in the use of emergency equipment;
• Preserving records, evidence of situation for subsequent emergency etc.
7.8.3 Scope of ONSEP
This ONSEP is prepared for industrial emergencies like fires, explosions, toxic releases,
asphyxia and does not cover natural calamities and societal disturbances related
emergencies (like strikes, bomb threats, civil Commissions etc). Also, the scope of this
ONSEP is limited to onsite emergencies and does not include measures for off site
Emergency Management. Necessary information with regards to Off Site Emergency
Management will be furnished to district authorities.
Dashrath Prasad Fertilizers Pvt. Ltd. Environmental Impact Assessment Report
7-12 Team Labs and Consultants
7.8.4 Methodology of Developing ONSEP
The consideration in preparing this Emergency Plan includes the following steps:
• Identification and assessment of hazards and risks; • Identifying, appointment of personnel & Assignment of Responsibilities; • Identification and equipping Emergency Control Center; • Identification of Assembly, Rescue points, Medical Facilities; • Formulation of plan and of emergency sources; • Training, Rehearsal & Evaluation; • Action on Site.
Earlier, a detailed Hazard Analysis and Risk Assessment were carried out for the plant
facilities and the hazards are quantified. The likely locations of hazards and consequences
are evaluated, duly following the standard procedure.
7.8.5 Elements of Onsite Emergency Plan
Important elements considered in this plan are:
• Identification of emergencies • Emergency organization • Emergency facilities • Emergency procedures • Communications during emergency • Rescue, Transport and Rehabilitation • Roles and responsibilities of key personnel and essential employees • Mutual aid.
7.8.5.1 Emergencies Identified
Spillage of sulfuric acid during unloading and transferring from from tankers,
transfering to day tanks due to corroded pipelines, are the possible emergencies in the
pipelines, fire near storage, DG set, and Transformers are the other possible
emergencies.
The other emergencies are risks due to cyclonic conditions, earth quake, lightning, floods
(natural calamities), sabotage, bombing (social and other reasons) etc. which are not
under the management control.

Dashrath Prasad Fertilizers Pvt. Ltd. Environmental Impact Assessment Report
7-13 Team Labs and Consultants
Priority of protection in the event of an emergency is; Life and safety of personnel,
preservation of property, restoration of normalcy.
7.8.5.2 Emergency Organization
The project employs a total of 50 people in 3 shifts. The general shift will be for the
administrative employees, while the three shifts of 8 hours each are for technical
employees. Key personnel and essential employees are identified and are assigned
emergency responsibilities.
Security personnel, all operators, fitters, electricians etc. in the shifts are designated
essential employees. During emergencies, their services are drafted for essential
operations.
7.8.5.3 Emergency Facilities
a) Emergency Control Center (ECC)
It is a location where all key personnel like Chief Coordinator, Emergency controller,
maintenance coordinator can assemble and monitor aspects related to emergency and
take decisions related to emergency. The office room is designated as ECC. In case if this
area is affected, zone security room is designated as alternative ECC.
The following information and facilities would be maintained at the ECC in Plant Control
room:
Latest copy of Onsite Emergency Plan and Offsite Emergency Plan (as provided by
District Emergency Authority)
• Intercom Telephone; • P& T Telephone; • Telephone directories (internal and P&T); • Factory Layout, site plan; • Emergency shutdown procedures for generators and fuel supply system; • Nominal roll of employees; • List and addresses of key personnel;
Dashrath Prasad Fertilizers Pvt. Ltd. Environmental Impact Assessment Report
7-14 Team Labs and Consultants
• List and addresses of emergency coordinators; • List and addresses of first aid providers; • List and addresses of employees trained in fire fighting; • List and addresses of qualified trained persons; • Material safety data sheets of raw materials; • Duties of key personnel; • Important addresses and telephone numbers including those of fuel supplying
company, government agencies, neighboring industries and other sources of help, outs side experts;
The following emergency equipment is made available at alternate ECC (Security point):
• Fire proximity suit/Gloves/Helmets; • Hand tools suitable for pipe lines (non sparking type); • Gaskets; • Teflon tape; • Flame proof torches/batteries; • 1/2 crow bar; • Spade; • Manila rope; • Spark arrestor; • Spare fan belt for truck; • First aid box; • Public address megaphone, hand bell, Emergency torch.
b) Assembly points
Office room is identified as Assembly point and is in a low intensity fire affected zone.
Additionally the following places in plan are designated as safe assembly points: Time
office, and green belt area near the main road. The locations of assembly points would be
reviewed later.
c) Fire fighting Facilities The fire fighting facilities which shall be provided
d) Location of First aid Boxes
The first aid boxes will be located at the following places: preparation areas,
administrative office, time office, and will be under the charge of security coordinator.
Dashrath Prasad Fertilizers Pvt. Ltd. Environmental Impact Assessment Report
7-15 Team Labs and Consultants
e) Emergency siren
Emergency siren will be provided with 0.5 km range of audibility and the location will be
time office. The siren will operate on regular supply and also on emergency electrical
supply. Shift electrical engineer of plant on receipt of information from shift incharge, is
authorized to operate the siren.
f) Emergency escapes
Emergency escapes in the plant area and floor wise emergency escapes will be
conspicuously marked.
g) Wind sock
Wind socks to observe the wind directions will be installed on the top of production
block.
7.8.5.4 Emergency Procedures
a) Procedure for Raising Emergency alarm
Whenever and whoever notices an emergency or a situation with a potential emergency
should forthwith raise alarm by calling on the available communication network or
shouting or approaching the shift incharge, furnishing details. Anybody noticing fire
should inform the plant control room immediately. The shift in-charge at informs the site
head.
b) Control Room staff
If an emergency is reported then plant control room staff must, request for the location,
nature and severity of emergency and obtain the caller's name, telephone number, and
inform the shift incharge or site head who ever are available in the shift.
c) Emergency communication
The following communications will be used during emergencies; P&T Telephones,
intercom, hand bell and siren. If any of the equipment is not working, runners would be
engaged to send the communication.
Dashrath Prasad Fertilizers Pvt. Ltd. Environmental Impact Assessment Report
7-16 Team Labs and Consultants
d) Warning/Alarm Communication of emergency
Emergency siren would be operated to alert all other employees on the orders of manager
(electrical). The emergency is communicated by the Emergency siren mode of wailing for
3 minutes. When the emergency has been brought under control, the Emergency
controller will direct plant control staff giving an 'all clear signal', by way of normal siren
(continuously for 3 minutes).
7.8.5.5 Rescue and Rehabilitation
Emergency vehicle will be made available round the clock under the charge of manager
(electrical) who is emergency coordinator. Security personnel are trained in rescue
operations. Persons rescued would be taken to First aid centre for further medical
attention or Safe Assembly Points as per the condition of the rescued person.
a) Transport Vehicles and Material Trucks
The transport vehicles and vehicles with materials would immediately withdraw to
outside the factory. Security guard of the shift is responsible for this. Transport vehicles
would wait at the security at the main entrance to provide emergency transport. This is
ensured by security coordinator.
b) Mock drill
Occasional mock drill is essential to evaluate that the ONSEP is meeting the objectives.
Adequate training is given to all staff members before conducting the mock drill. Mock
drills will be initiated with table top exercise, followed by pre-informed mock drills, and
few uninformed mock drills in the first phase. Functional exercises (communication,
Emergency shutdown, fire fighting at different locations, rescue etc.) are carried out in
the second phase.
Mock drills will familiarize the employees with the concept and procedures and help in
evaluating their performance. These scheduled and unscheduled mock drills are
conducted during shift change, public holidays, in night shift once in 6 months.
Dashrath Prasad Fertilizers Pvt. Ltd. Environmental Impact Assessment Report
7-17 Team Labs and Consultants
Response time, strict adherence to discharge of responsibilities, difficulties and
inconsistencies experienced are recorded and evaluated. Fire officer will assists
Emergency coordinator in designing and extending such mock drills and in evaluating
the response.
c) Review
The Emergency plan is reviewed periodically to evaluate the effectiveness, and during
change in organizational structure, isolation of equipment for longer duration, and
during increase in inventory of fuel and other chemicals. Manger Electrical and
Emergency coordinator initiates and authorizes such review as and when required, and
the changes if any will be duly informed to all the employees concerned.
7.8.5.6 Emergency Responsibilities
I. Chief Coordinator
The chief coordinator shall be General manger and Alternate is Manager Electrical.
• He is overall incharge of emergency operations. • He reaches emergency control center as soon as he receives emergency
information. • He coordinates with emergency controller, maintenance coordinator. • He provides necessary resources required at the emergency site. • He will inform the inspector of factories, and other statutory authorities. • Prepares accident report/investigation. • Arranges for keeping records of chronological events and orders an
investigation report and preserves evidence. • Gives a public statement if necessary.
II. Emergency controller - Shift in charge
On receiving the message about emergency;
• He will assume charge as chief coordinator till general manger arrives at scene and takes charge as a chief coordinator.
• Takes actions to minimize the consequences and directs emergency management and fire control/other causes with available personnel to put off or to reduce the consequences.
Dashrath Prasad Fertilizers Pvt. Ltd. Environmental Impact Assessment Report
7-18 Team Labs and Consultants
• On the arrival of chief coordinator, he will hand over the charge of Chief coordinator and assists him.
• He will identify the need of evacuating any personnel in the vicinity of the affected zone.
• Exercises operational control of the installation and outside the affected area and directs emergency operations.
• Declares emergency and orders plant control room for operation of emergency siren.
• Continuously reviews and assesses possible development to determine most probable courses of events.
• Initiates suspension of all work permits during the period of major emergency for safe guarding the plant and other personnel.
III. Incident Controller
The Supervisor assumes the role of incident controller in the following instances of
emergencies.
• Protects himself and proceeds to site quickly. • Assess the magnitude of the incident. • Initiates the emergency procedure to secure the safety of the workers and
minimise damage to installation and property. • He will undertake all possible steps for safe isolation of plant systems, first
aid and fire fighting. • He keeps in touch with plant control room till emergency controller arrives
at the scene of emergency, • Organizes essential employees present in the shift. • Ensures that adequate personal protective equipment is available foe
essential employees. • Arranges for search of causalities. • Arranges evacuation of non-essential workers to assemble at designated
assembly points.
• During the fire fighting operations seeks help from electrical/mechanical maintenance personnel for isolation of machine/section involved in fire as the need arises.
• Once the situation is under control, guides different persons for salvage and cleanup operations.
Dashrath Prasad Fertilizers Pvt. Ltd. Environmental Impact Assessment Report
7-19 Team Labs and Consultants
• Assists in assessing the loss, preparation of accident report with the assistance of security officer and senior officials of respective departments present during the accident, investigates the fire with a view to find out causative factors ad action needed to prevent recurrence.
IV. Communicator – production supervisor
• The Control Room Shift Electrical Engineer assumes the role of Communicator and passes the information related to emergency to Incident Controller and Chief Coordinator.
• Other vulnerable installation in the plant is alerted about the emergency. • On the Instructions from chief coordinator, neighboring installations are
alerted about the emergency. • On the instructions from Chief Coordinator, mutual assistance is called
from neighboring industries. • On the instructions from Chief Coordinator, seeks help form fire brigade. • Provides emergency Telephone rosters are provided in Plant control room
and Fire Station. V. Security Coordinator.
The production supervisor will assume the responsibilities of security coordinator, and
his responsibilities are;
• On receipt of fire call from plant control he prepares for fire fighting and collects necessary equipment.
• Organizes rescue of persons trapped in work areas. • Assists administration coordinator in organizing Mock drills, evaluation
and debriefing. • During normal situations keeps the fire fighting capabilities in fully ready
condition by maintaining equipment. • Organizes fire drills on periodic basis and evaluates the same. • Arranges to clear off unconnected persons and trucks from the vicinity and
off the main gate. • Instructs security guards posted on duty in the nearby industries to cordon
off the affected section and to control the crowd at the scene of fire. • Arranges to control law and order till local authorities for Law and order till
police arrive at site. • Post security guard at the scene of fire to check for possible re-ignition, after
the emergency is over.
Dashrath Prasad Fertilizers Pvt. Ltd. Environmental Impact Assessment Report
7-20 Team Labs and Consultants
• Assists Resource coordinator in organizing Mock Drills, evaluation and debriefing.
VI. Person Noticing Fire
Any employee on noticing fire will take the following steps;
• Takes protection • Raises alarm – shouts fire! Fire!! Fire!!! Or other emergency. • Informs Shift In charge, or at the control room over telephone giving clear
message about the exact location of fire and names of equipment/machinery involved in fire.
• If Telephone is not working, quickly goes to either Plant Control Room and informs.
VII. Trained Fire Fighting Person
The employees trained in fire fighting will take the following steps in the event of fire
apart from following the instructions of security coordinator apart from;
• Protects self • Raises alarm • Attempts to put out the fire using fire extinguishers. • If necessary, operates fixed firefighting equipment. • Stands by in safety for further instructions.
7.8.6 Remedial Action
The cause of emergency is identified and action is taken from operation point of view
such as isolating or shutdown etc.
I. Failure of pipelines: feeding into the pipeline is stopped. Isolate the leaking
pipeline by closing the relevant valves. Transfer the material present to other
pipelines. Shutdown the pump. Close the suction and discharge valves of the
pump
II. Personal Protection: The people, who are assigned to the rescue operations,
must wear suitable personnel protective equipment such as self-contained
breathing apparatus and fire suit. They should remain in the incident area as
Dashrath Prasad Fertilizers Pvt. Ltd. Environmental Impact Assessment Report
7-21 Team Labs and Consultants
long as he can safely stay there. In spite of the wearing safety protective
equipment if he is unable to stay in the contaminated area, he should leave
immediately.
7.8.7 BASIC ACTION IN EMERGENCIES
Immediate action is the most important factor in emergency control because the first few
seconds count, as fires develop and spread very quickly unless prompt and efficient
action is taken.
• Take immediate steps to stop leakage/fire and raise alarm simultaneously. • Stop all operations and ensure closure and isolation valves. • Saving of human life shall get priority in comparison to stocks/assets. • Plant personnel with specific duties should assemble at the nominated place. • All vehicles except those required for emergency use should be moved away from
the operating area, in an orderly manner by the predetermined route. • Electrical system except for control supplies, utilities, lighting and fire fighting
system should be isolated. • Block all roads in the adjacent area and enlist police support for the purpose if
warranted.
7.8.8 FIRE FIGHTING OPERATIONS
Enlist support of local fire brigade and neighboring industries.
• Fire fighting personnel working close to fire must wear protective clothing and
equipment including safety harness and manned lifeline. They must be protected
continuously by water sprays. Water protection for fire fighters should never be
shut off even though the flames appear to have been extinguished until all
personnel are safely out of the danger area.
• Fire fighters should advance towards a fire in down wind direction.
• In case of any emergency situation, it is of paramount importance to avoid
endangering human life in the event of fire, involving or seriously exposing plant
equipment.
Dashrath Prasad Fertilizers Pvt. Ltd. Environmental Impact Assessment Report
Team Labs And Consultants 8-1
8.0 PROJECT BENEFITS
8.1 Introduction
M/s. Dashrath Prasad Fertilizers Pvt. Ltd. proposes to include Single Super Phosphate
manufacturing facility in permitted/consented NPK Fertilizers (by mixing only) unit in
an area of 12.6 acres located at Sy. No. 274/1, 274/2, 276/A2, 277/A1, Tekulapalli
Village, Penuballi Mandal, Khammam District, Telangana. The proposed project
involves a capital expenditure of Rs. 5.5 crores contributing to the local economy due to
consumption of building construction materials from the surrounding areas and usage
of construction labour from surrounding villages.
8.2 Employment Potential
The proposed project will provide employment to 50 people. It will be spending
approximately Rs. 12.5 Lakhs of rupees every month on salaries providing bread and
succour to 50 families additionally. The proposed project will also generate indirect
employment to the locals during construction phase in the order of 15 people for a
period of 6-8 months. The employers will contribute to the provident fund, ESI and
provide facilities as per the relevant labour act.
8.3 Corporate Social Responsibility
The management proposes to spend 2.5% of the capital cost of expansion and 2% of
profits during operation towards social development activities in the surrounding
villages. The objective is to obtain a social licence from the stake holders who are
likely to be affected due to the proposed manufacturing activity.
Tax Income
The proposed capital expenditure of Rs. 5.5 crores includes GST on various equipment
and services to the tune of Rs. 65 lakhs. The provision of employment also directly
contributes to additional income tax and also indirectly contributes to additional GST
due to various transactions. The operation of the proposed project also results in
additional GST and also additional income tax on profits and also from employee
salaries.
Dashrath Prasad Fertilizers Pvt. Ltd. Environmental Impact Assessment Report
Team Labs And Consultants 9-1
9.0 ENVIRONMENT COST BENEFIT ANALYSIS
State Expert Appraisal Committee (SEAC) of Telangana advised the proponent to
prepare EIA based on Standard Terms of Reference issued by Ministry of Environment,
Forests and Climate Change (MoEFCC) for “Chemical Fertilizers” in the SEAC meeting
held on 07.04.2017. The terms of reference for the environmental impact assessment
studies was obtained from TS SEIAA vide letter no. Lr. No. SEIAA/TS/OL/YDR-
01/2017-707 dated 18.05.2017. The standard TOR does not mention Environment Cost
Benefit Analysis and hence the same was not conducted.
DASHRATH PRASAD FERTILIZERS PVT. LTD. SY. NO. 274/1, 274/2, 276/A2, 277/A1, TEKULAPALLI VILLAGE, PENUBALLI MANDAL, KHAMMAM DISTRICT, TELANGANA
2. ENVIRONMENT MANAGEMENT PLAN
Project No. 0318‐16‐01March 2018
Dashrath Prasad Fertilizers Pvt. Ltd. 274/1, 274/2, 276/A2, 277/A1, Tekulapalli Village, Penuballi Mandal, Khammam District, Telangana – 507 302 Phone: +91 95735 74455 E‐mail: [email protected]; [email protected]
STUDIES AND DOCUMENTATION BY TEAM Labs and Consultants B‐115‐117 & 509, Annapurna Block, Aditya Enclave, Ameerpet, Hyderabad‐500 038. Phone: 040‐23748 555/23748616, Telefax: 040‐23748666
SUBMITTED TO STATE LEVEL ENVIRONMENT IMPACT ASSESSMENT AUTHORITY,
TELANGANA, GOVERNMENT OF INDIA
Dashrath Prasad Fertilizers Pvt. Ltd. Environment Management Plan
10-1 Team Labs and Consultants
CHAPTER 10.0ENVIRONMENT MANAGEMENT PLAN
10.0 Introduction
Environmental management plan is effectively implemented to eliminate, control or
mitigate the pollution levels. The hierarchy of management measures begins with
prevention followed by minimization, reuse, recycling, recovery, while safe disposal is
considered as the last option.
The management plan is drawn in consultation with the project proponents with reference
to potential impacts monitored, identified and predicted in the previous chapters. The
measures to be taken for mitigation and control of the impacts are presented. The measures
proposed to address the impacts identified in environmental impact aassessment report of
the same are presented in appendix of the environmental impact assessment report. Review
of the process is the essential component of environmental management. M/s. Dashrath
Prasad Fertilizers Pvt. Ltd., had been conducting experiments to optimize the consumption
of raw materials and to increase the yield of the product.
10.1 Environment Management Plan 10.1.1 Construction Phase (Terms of Reference No. 10) As the unit is located near the state highway, potential of pollution during construction
phase due to transport of construction materials will be less when compared to the
operational stage as construction takes place for about 6-8 months. However industry will
ensure that pollution potential in the construction phase is at a minimum. Wherever
applicable, detailed procedures will be developed for control of pollution during project
construction phase. Separate rooms will be provided for laborers and casual workers. The
following measures will be adopted to minimize pollution load during construction phase.
Site Preparation
During site preparation considerable amount of soil movement is involved due to
excavation and leveling operations. During construction it is necessary to control uplift of
dust during excavation, leveling and transportation by water sprinkling along the
Dashrath Prasad Fertilizers Pvt. Ltd. Environment Management Plan
10-2 Team Labs and Consultants
temporary roads and exposed soil areas. The clearing of plants, shrubs and trees will be
limited to the footprint, so as to reduce disturbance of biodiversity.
Sanitation
Considering the standards of hygiene, workers involved in construction will be provided
temporary toilets, and drinking water. The toilets will be attached to septic tank so as to
minimize the percolation and to control the subsequent impact on the environment. These
facilities will be adequately designed and maintained to ensure minimum environmental
impact.
Noise
The site is located in a place where habitation is minimum and at distance of 1.2 Km. Thus
there will be minor insignificant impact due to noise on the inhabitants. The construction
workers on site will be provided with personal protective equipment like earmuffs for those
who work near noise generating equipment/sources.
Wastes from Construction Equipment
Construction activity involves a number of operations that utilize equipment like DG sets.
Dozers, cranes etc. These equipment are a source of emissions and solid wastes. Proactive
maintenance to mitigate emissions, while hazardous solid wastes of waste oils and used
batteries are sent to authorized recyclers. Spillage is avoided and spill control measures are
adopted to minimize contamination of soil and ground water resources. The empty
containers of paints, thinners etc shall be sold to authorized buyers.
10.1.2 Operation Phase
During operation stage liquid effluents from domestic usage, air pollution from process and
standby DG set, and solid waste from process and DG set are the major pollution. The
environment management plan is drawn in consultation with the project authorities of
Dashrath Prasad Fertilizers Pvt. Ltd. and other technical consultants involved in preparing
the project plan. The management, mitigation and enhancement measures identified for
significant impact sources are presented as follows;
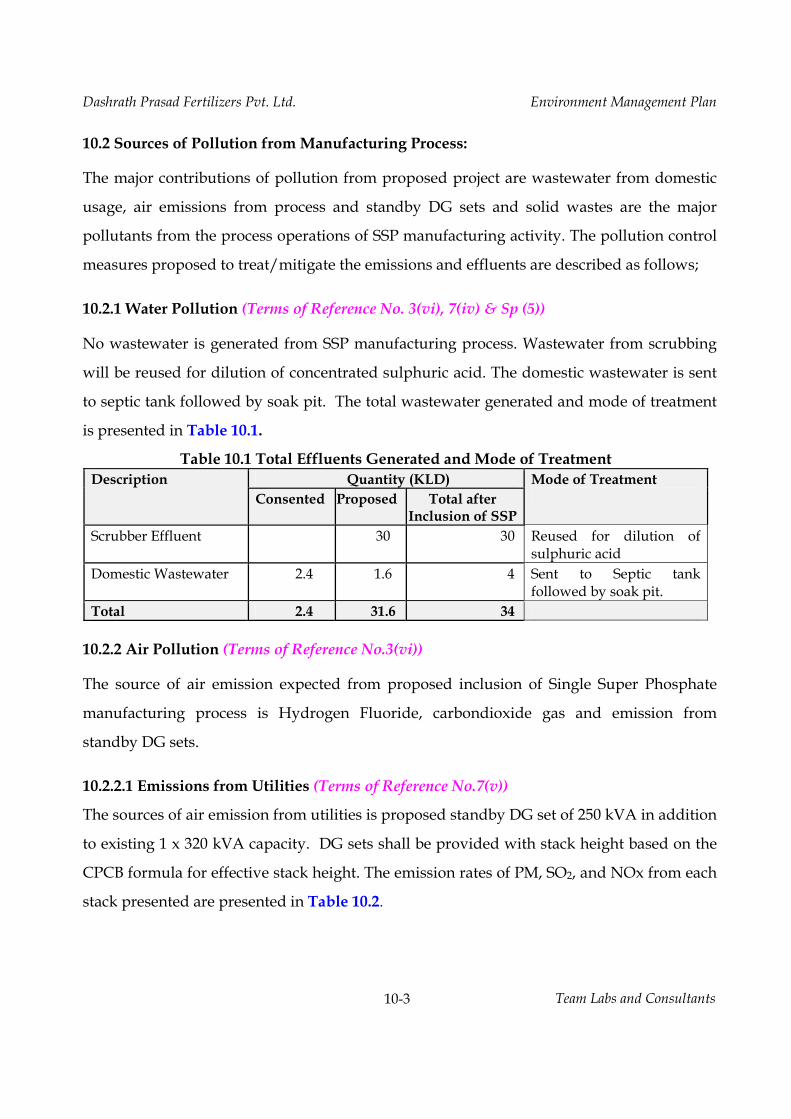
Dashrath Prasad Fertilizers Pvt. Ltd. Environment Management Plan
10-3 Team Labs and Consultants
10.2 Sources of Pollution from Manufacturing Process:
The major contributions of pollution from proposed project are wastewater from domestic
usage, air emissions from process and standby DG sets and solid wastes are the major
pollutants from the process operations of SSP manufacturing activity. The pollution control
measures proposed to treat/mitigate the emissions and effluents are described as follows;
10.2.1 Water Pollution (Terms of Reference No. 3(vi), 7(iv) & Sp (5))
No wastewater is generated from SSP manufacturing process. Wastewater from scrubbing
will be reused for dilution of concentrated sulphuric acid. The domestic wastewater is sent
to septic tank followed by soak pit. The total wastewater generated and mode of treatment
is presented in Table 10.1.
Table 10.1 Total Effluents Generated and Mode of Treatment Description Quantity (KLD) Mode of Treatment
Consented Proposed Total after Inclusion of SSP
Scrubber Effluent 30 30 Reused for dilution of sulphuric acid
Domestic Wastewater 2.4 1.6 4 Sent to Septic tank followed by soak pit.
Total 2.4 31.6 34
10.2.2 Air Pollution (Terms of Reference No.3(vi))
The source of air emission expected from proposed inclusion of Single Super Phosphate
manufacturing process is Hydrogen Fluoride, carbondioxide gas and emission from
standby DG sets.
10.2.2.1 Emissions from Utilities (Terms of Reference No.7(v))
The sources of air emission from utilities is proposed standby DG set of 250 kVA in addition
to existing 1 x 320 kVA capacity. DG sets shall be provided with stack height based on the
CPCB formula for effective stack height. The emission rates of PM, SO2, and NOx from each
stack presented are presented in Table 10.2.
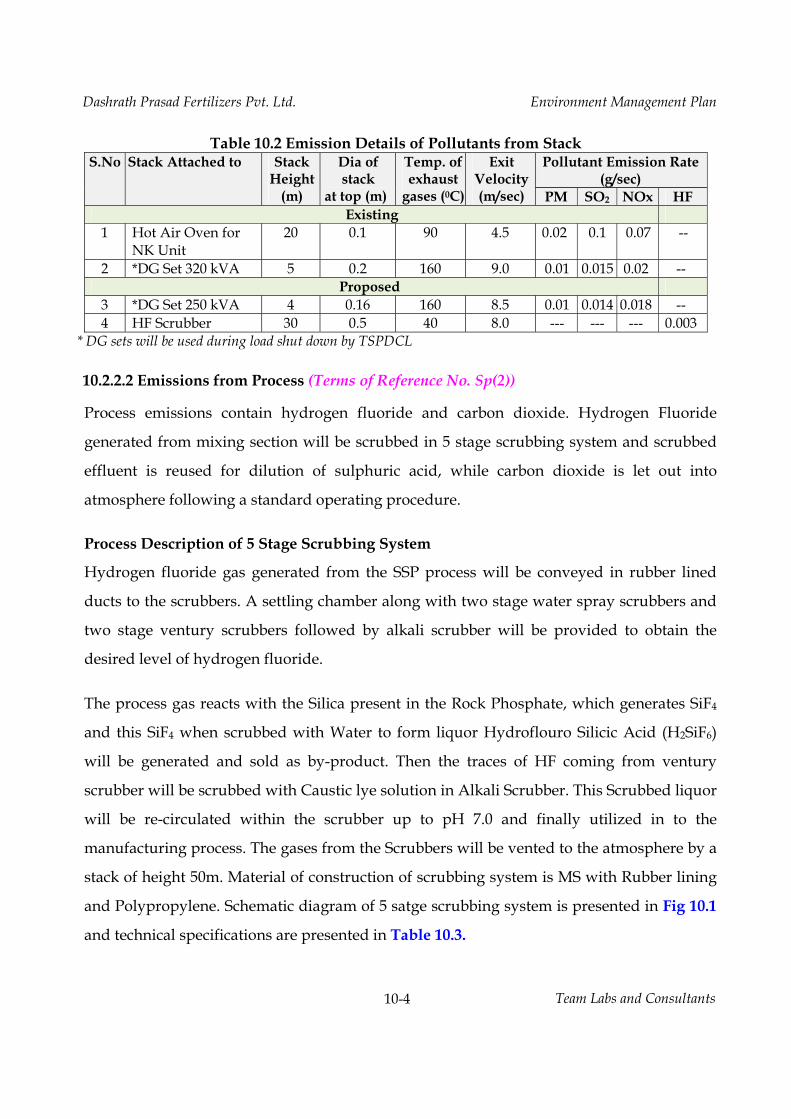
Dashrath Prasad Fertilizers Pvt. Ltd. Environment Management Plan
10-4 Team Labs and Consultants
Table 10.2 Emission Details of Pollutants from Stack S.No Stack Attached to Stack
Height (m)
Dia of stack
at top (m)
Temp. of exhaust
gases (0C)
Exit Velocity (m/sec)
Pollutant Emission Rate (g/sec)
PM SO2 NOx HF Existing
1 Hot Air Oven for NK Unit
20 0.1 90 4.5 0.02 0.1 0.07 --
2 *DG Set 320 kVA 5 0.2 160 9.0 0.01 0.015 0.02 -- Proposed
3 *DG Set 250 kVA 4 0.16 160 8.5 0.01 0.014 0.018 -- 4 HF Scrubber 30 0.5 40 8.0 --- --- --- 0.003
* DG sets will be used during load shut down by TSPDCL
10.2.2.2 Emissions from Process (Terms of Reference No. Sp(2))
Process emissions contain hydrogen fluoride and carbon dioxide. Hydrogen Fluoride
generated from mixing section will be scrubbed in 5 stage scrubbing system and scrubbed
effluent is reused for dilution of sulphuric acid, while carbon dioxide is let out into
atmosphere following a standard operating procedure.
Process Description of 5 Stage Scrubbing System
Hydrogen fluoride gas generated from the SSP process will be conveyed in rubber lined
ducts to the scrubbers. A settling chamber along with two stage water spray scrubbers and
two stage ventury scrubbers followed by alkali scrubber will be provided to obtain the
desired level of hydrogen fluoride.
The process gas reacts with the Silica present in the Rock Phosphate, which generates SiF4
and this SiF4 when scrubbed with Water to form liquor Hydroflouro Silicic Acid (H2SiF6)
will be generated and sold as by-product. Then the traces of HF coming from ventury
scrubber will be scrubbed with Caustic lye solution in Alkali Scrubber. This Scrubbed liquor
will be re-circulated within the scrubber up to pH 7.0 and finally utilized in to the
manufacturing process. The gases from the Scrubbers will be vented to the atmosphere by a
stack of height 50m. Material of construction of scrubbing system is MS with Rubber lining
and Polypropylene. Schematic diagram of 5 satge scrubbing system is presented in Fig 10.1
and technical specifications are presented in Table 10.3.
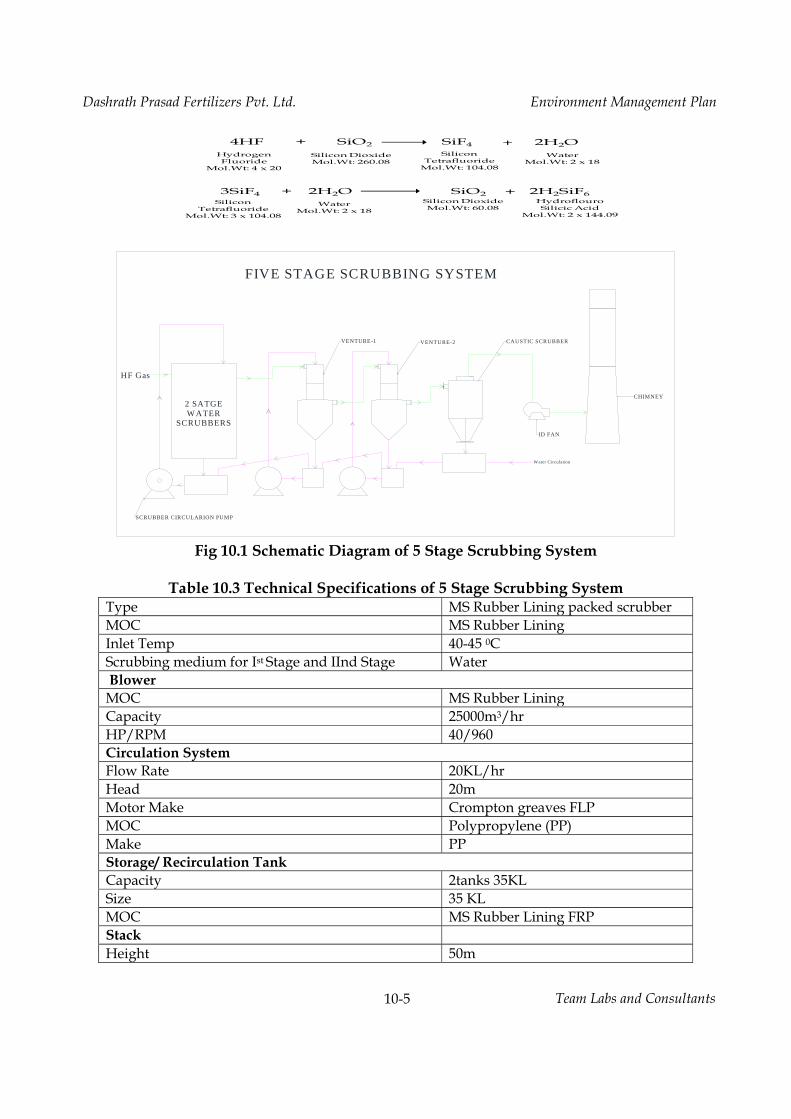
Dashrath Prasad Fertilizers Pvt. Ltd. Environment Management Plan
10-5 Team Labs and Consultants
Fig 10.1 Schematic Diagram of 5 Stage Scrubbing System
Table 10.3 Technical Specifications of 5 Stage Scrubbing System
Type MS Rubber Lining packed scrubber MOC MS Rubber Lining Inlet Temp 40-45 0C Scrubbing medium for Ist Stage and IInd Stage Water Blower MOC MS Rubber Lining Capacity 25000m3/hr HP/RPM 40/960 Circulation System Flow Rate 20KL/hr Head 20m Motor Make Crompton greaves FLP MOC Polypropylene (PP) Make PP Storage/ Recirculation Tank Capacity 2tanks 35KL Size 35 KL MOC MS Rubber Lining FRP Stack Height 50m
4HF + SiO2 SiF4 + 2H2O
3SiF4 + 2H2O SiO2 + 2H2SiF6Hydroflouro Silicic Acid
Mol.Wt: 2 x 144.09
Silicon DioxideMol.Wt: 60.08
Silicon Tetrafluoride
Mol.Wt: 3 x 104.08
WaterMol.Wt: 2 x 18
Silicon Tetrafluoride
Mol.Wt: 104.08
WaterMol.Wt: 2 x 18
Silicon DioxideMol.Wt: 260.08
Hydrogen Fluoride
Mol.Wt: 4 x 20
W ater Circulation
ID FAN
SCRUBBER CIRCULARION PUMP
2 SATGEWATER
SCRUBBERS
FIVE STAGE SCRUBBING SYSTEM
CHIMNEY
CAUSTIC SCRUBBERVENTURE-2VENTURE-1
HF Gas
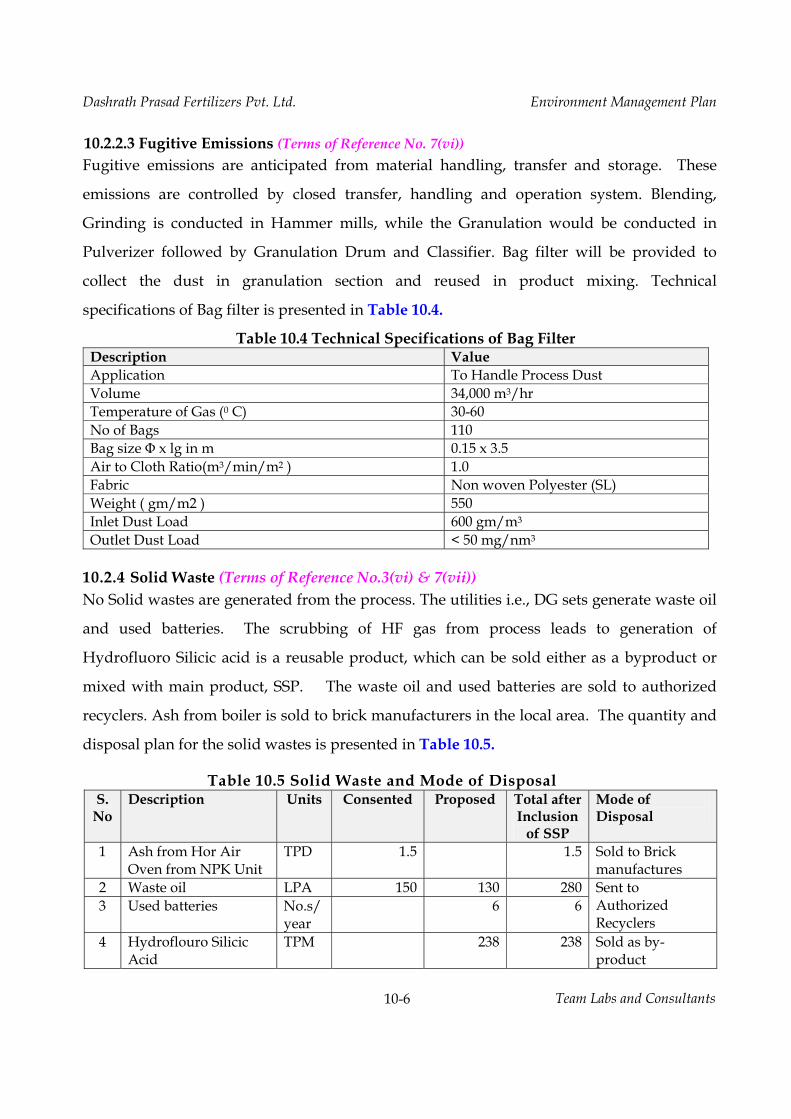
Dashrath Prasad Fertilizers Pvt. Ltd. Environment Management Plan
10-6 Team Labs and Consultants
10.2.2.3 Fugitive Emissions (Terms of Reference No. 7(vi)) Fugitive emissions are anticipated from material handling, transfer and storage. These
emissions are controlled by closed transfer, handling and operation system. Blending,
Grinding is conducted in Hammer mills, while the Granulation would be conducted in
Pulverizer followed by Granulation Drum and Classifier. Bag filter will be provided to
collect the dust in granulation section and reused in product mixing. Technical
specifications of Bag filter is presented in Table 10.4.
Table 10.4 Technical Specifications of Bag Filter Description Value Application To Handle Process Dust Volume 34,000 m3/hr Temperature of Gas (0 C) 30-60 No of Bags 110 Bag size Φ x lg in m 0.15 x 3.5 Air to Cloth Ratio(m3/min/m2 ) 1.0 Fabric Non woven Polyester (SL) Weight ( gm/m2 ) 550 Inlet Dust Load 600 gm/m3 Outlet Dust Load < 50 mg/nm3
10.2.4 Solid Waste (Terms of Reference No.3(vi) & 7(vii)) No Solid wastes are generated from the process. The utilities i.e., DG sets generate waste oil
and used batteries. The scrubbing of HF gas from process leads to generation of
Hydrofluoro Silicic acid is a reusable product, which can be sold either as a byproduct or
mixed with main product, SSP. The waste oil and used batteries are sold to authorized
recyclers. Ash from boiler is sold to brick manufacturers in the local area. The quantity and
disposal plan for the solid wastes is presented in Table 10.5.
Table 10.5 Solid Waste and Mode of Disposal S.
No Description Units Consented Proposed Total after
Inclusion of SSP
Mode of Disposal
1 Ash from Hor Air Oven from NPK Unit
TPD 1.5 1.5 Sold to Brick manufactures
2 Waste oil LPA 150 130 280 Sent to Authorized Recyclers
3 Used batteries No.s/year
6 6
4 Hydroflouro Silicic Acid
TPM 238 238 Sold as by-product
Dashrath Prasad Fertilizers Pvt. Ltd. Environment Management Plan
10-7 Team Labs and Consultants
10.2.5 Noise Pollution
Noise is anticipated from manufacturing of SSP are mainly from granulator, dryers, bucket
elevators, screw conveyors, pumps and DG set. The DG set shall be kept in a separate
enclosed room with acoustic enclosure. Closed bucket elevators and screw conveyors will
be used to minimize noise levels. The motors and compressors shall be provided with
guards and shall be mounted adequately to ensure the reduction of noise and vibration.
The employees working in noise generating areas shall be provided with earmuffs. The
employees shall be trained in the mitigation measures and personal protection measures to
be taken to avoid noise related health impacts.
10.3 Rainwater Harvesting (Terms of Reference No.7(x))
Rain water harvesting shall be adopted by providing rain water harvesting structures along
the drains, storm water storage sump and tanks. Storm water drains are provided with rain
water harvesting structures which will act as flow dissipaters and also as infiltration
trenches. Filtration points shall ensure percolation of water and enhance the ground water
table. The site area will be provided with 6 nos. of rain water harvesting structures.
10.4 Occupational Safety and Health (Terms of Reference No. 8(iii) & Sp (14))
Many worker health and safety hazards are posed by operations. They include safety
hazards from moving machine parts, equipment and pipes, heavy manual handling of
materials and equipment, heated surfaces and hot workplace environments, confined
spaces and hazardous energy sources (e.g., electricity); and high noise levels.
The best engineering controls for reducing occupational hazards are closed operation,
exhaust provision, provision of scrubbers, barrier guards on moving machine parts, control
switches and emergency stop devices to mitigate and avoid physical, chemical, electrical
and mechanical hazards.
Personal protective equipment shall be provided to all the employees including contract
employees. All the employees shall be provided with gumshoe, helmet, masks, and
goggles. The other equipment like ear muffs, gloves, respirators, aprons etc., will be
Dashrath Prasad Fertilizers Pvt. Ltd. Environment Management Plan
10-8 Team Labs and Consultants
provided to employees depending on the work area allocated to them. The PPE selection
shall strictly follow the prescribed guidelines of MSDS. The budget allocated for personal
protective equipment is Rs. 2.6 lakhs and Rs. 1.2 lakhs for health checkup.
10.4.1 Medical Check-up (Terms of Reference No.8(ii))
M/s Dashrath Prasad Fertilizers Pvt. Ltd., shall adopt a medical program of pre
employment screening, periodic medical examination, emergency treatment, non
emergency treatment, and record keeping and review. The pre employment screening and
periodic medical examination shall follow the guidelines of factories act. The pre
employment screening shall obtain medical history, occupational history followed by
physical examination and baseline monitoring for specific exposures.
10.5 Prevention, maintenance and operation of Environment Control System
The pollution control equipment will be monitored periodically and will be checked for its
performance and pro-active maintenance will be adopted. The environmental monitoring
results will be evaluated to identify the problems/under performance of the equipment.
Necessary steps will be taken to rectify the identified problems/defects. The management
agrees that the evaluation of the performance of pollution control measures and
occupational safety measures to arrive at their efficiency and proposes to adopt new
measures for efficient pollution control which will be a regular exercise.
All pollution control equipments are adequately designed and operating staff of the
pollution control equipment have good experience in the operation and maintenance of the
equipment. Standby equipment provided for all critical equipment to ensure continuous
operation of pollution control equipment and preventive maintenance is done as per the
schedule to avoid breakdown.
10.6 House Keeping
Good house-keeping practices will be adopted. Paper waste is minimized by adopting intra
office network. Sufficient workspace and proper lighting will be provided.
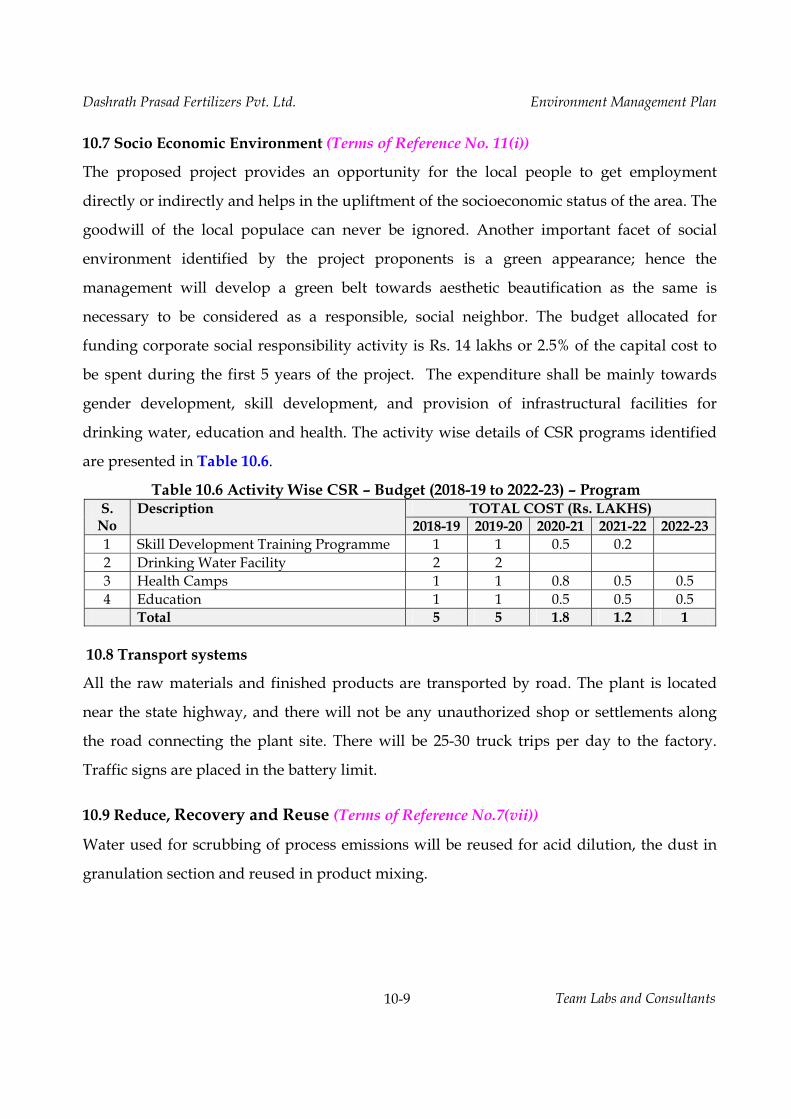
Dashrath Prasad Fertilizers Pvt. Ltd. Environment Management Plan
10-9 Team Labs and Consultants
10.7 Socio Economic Environment (Terms of Reference No. 11(i))
The proposed project provides an opportunity for the local people to get employment
directly or indirectly and helps in the upliftment of the socioeconomic status of the area. The
goodwill of the local populace can never be ignored. Another important facet of social
environment identified by the project proponents is a green appearance; hence the
management will develop a green belt towards aesthetic beautification as the same is
necessary to be considered as a responsible, social neighbor. The budget allocated for
funding corporate social responsibility activity is Rs. 14 lakhs or 2.5% of the capital cost to
be spent during the first 5 years of the project. The expenditure shall be mainly towards
gender development, skill development, and provision of infrastructural facilities for
drinking water, education and health. The activity wise details of CSR programs identified
are presented in Table 10.6.
Table 10.6 Activity Wise CSR – Budget (2018-19 to 2022-23) – Program S.
No Description TOTAL COST (Rs. LAKHS)
2018-19 2019-20 2020-21 2021-22 2022-23 1 Skill Development Training Programme 1 1 0.5 0.2 2 Drinking Water Facility 2 2 3 Health Camps 1 1 0.8 0.5 0.5 4 Education 1 1 0.5 0.5 0.5 Total 5 5 1.8 1.2 1
10.8 Transport systems
All the raw materials and finished products are transported by road. The plant is located
near the state highway, and there will not be any unauthorized shop or settlements along
the road connecting the plant site. There will be 25-30 truck trips per day to the factory.
Traffic signs are placed in the battery limit.
10.9 Reduce, Recovery and Reuse (Terms of Reference No.7(vii))
Water used for scrubbing of process emissions will be reused for acid dilution, the dust in
granulation section and reused in product mixing.
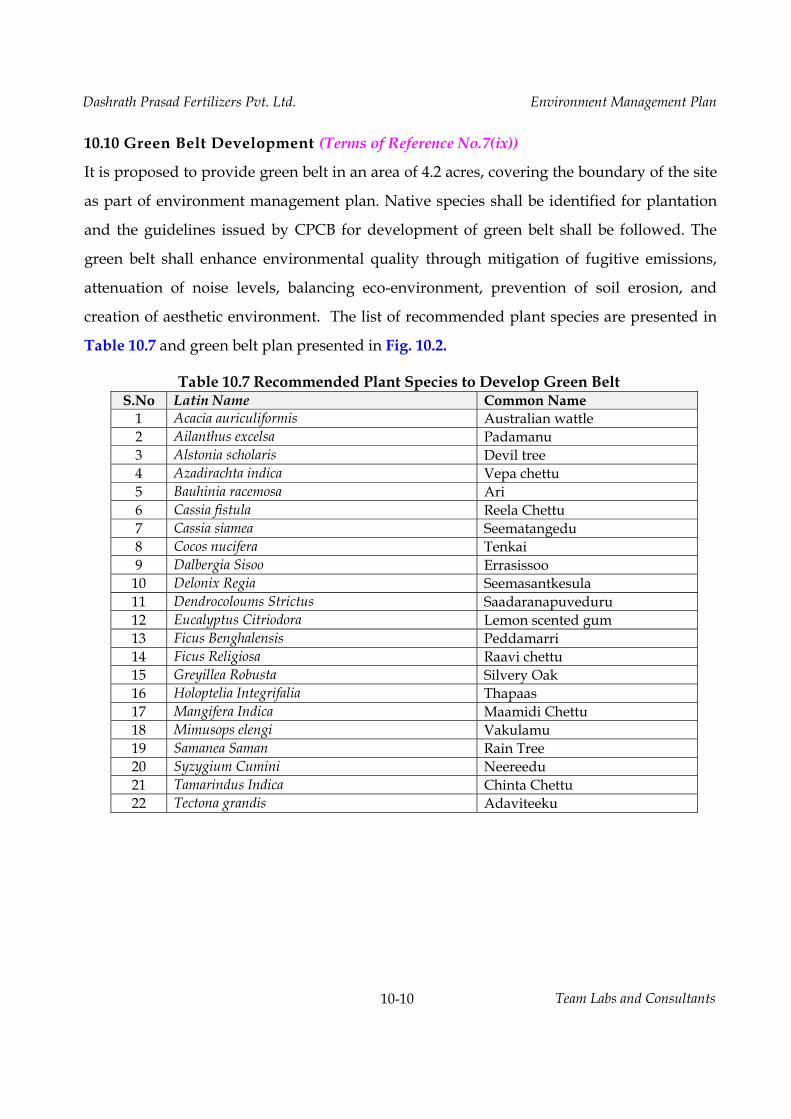
Dashrath Prasad Fertilizers Pvt. Ltd. Environment Management Plan
10-10 Team Labs and Consultants
10.10 Green Belt Development (Terms of Reference No.7(ix))
It is proposed to provide green belt in an area of 4.2 acres, covering the boundary of the site
as part of environment management plan. Native species shall be identified for plantation
and the guidelines issued by CPCB for development of green belt shall be followed. The
green belt shall enhance environmental quality through mitigation of fugitive emissions,
attenuation of noise levels, balancing eco-environment, prevention of soil erosion, and
creation of aesthetic environment. The list of recommended plant species are presented in
Table 10.7 and green belt plan presented in Fig. 10.2.
Table 10.7 Recommended Plant Species to Develop Green Belt S.No Latin Name Common Name
1 Acacia auriculiformis Australian wattle 2 Ailanthus excelsa Padamanu 3 Alstonia scholaris Devil tree 4 Azadirachta indica Vepa chettu 5 Bauhinia racemosa Ari 6 Cassia fistula Reela Chettu 7 Cassia siamea Seematangedu 8 Cocos nucifera Tenkai 9 Dalbergia Sisoo Errasissoo
10 Delonix Regia Seemasantkesula 11 Dendrocoloums Strictus Saadaranapuveduru 12 Eucalyptus Citriodora Lemon scented gum 13 Ficus Benghalensis Peddamarri 14 Ficus Religiosa Raavi chettu 15 Greyillea Robusta Silvery Oak 16 Holoptelia Integrifalia Thapaas 17 Mangifera Indica Maamidi Chettu 18 Mimusops elengi Vakulamu 19 Samanea Saman Rain Tree 20 Syzygium Cumini Neereedu 21 Tamarindus Indica Chinta Chettu 22 Tectona grandis Adaviteeku
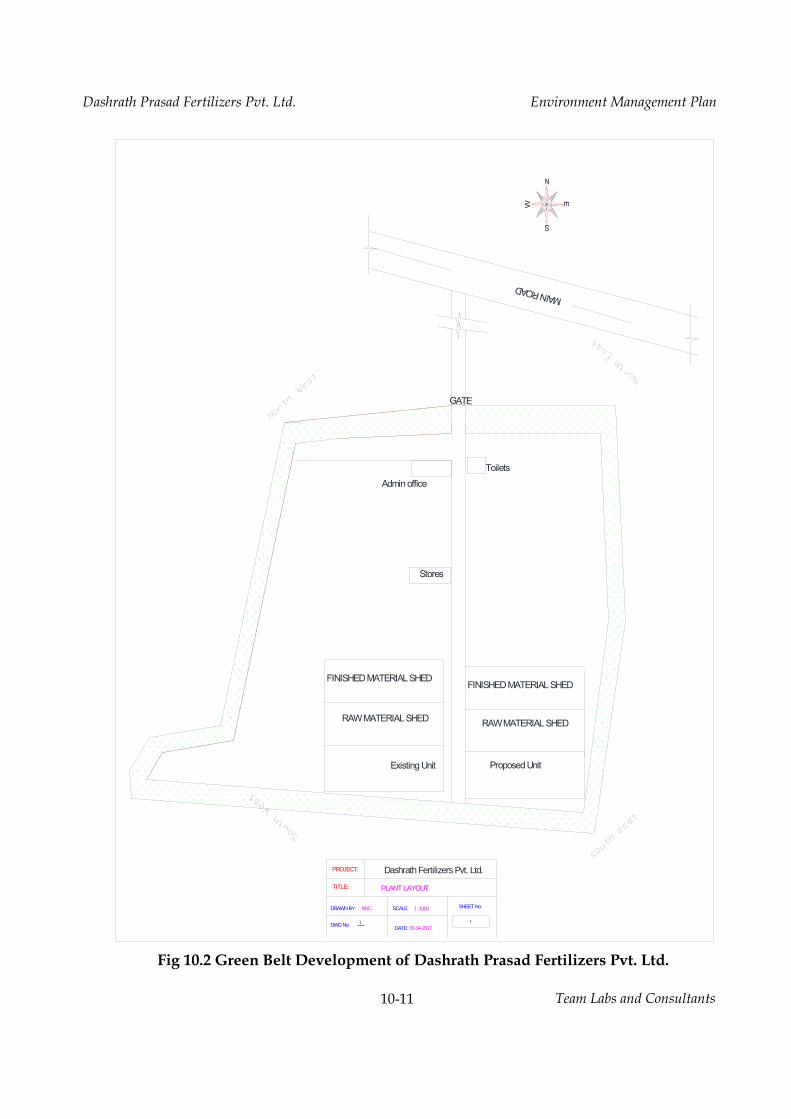
Dashrath Prasad Fertilizers Pvt. Ltd. Environment Management Plan
10-11 Team Labs and Consultants
Fig 10.2 Green Belt Development of Dashrath Prasad Fertilizers Pvt. Ltd.
---
PLANT LAYOUTTITLE:
DRAWN BY: NNC
RAW MATERIAL SHED
Admin office
DWG No:
Toilets
Stores
Dashrath Fertilizers Pvt. Ltd.
FINISHED MATERIAL SHED
GATE
RAW MATERIAL SHED
FINISHED MATERIAL SHED
PROJECT:
DATE: 05-04-20171
Existing Unit
SCALE: 1 :1000
Proposed Unit
MAIN ROAD
1
SHEET No:
Dashrath Prasad Fertilizers Pvt. Ltd. Environment Management Plan
10-12 Team Labs and Consultants
10.11 Post Project Monitoring (Terms of Reference No. 9(iii))
The post project monitoring can be an activity of Dashrath Prasad Fertilizers Pvt. Ltd., is by
hiring services of the consultants. Records shall be maintained for the analysis of raw water,
ambient air quality data, stack emissions monitoring results, and noise levels. These records
are not only required for the perusal of the pollution control board authorities but also to
derive at the efficiencies of the pollution control equipment as the objective of the project
proponent is not only compliance with statutory regulations, but also a serious commitment
towards clean environment.
The industry shall be regularly maintaining the records as per the hazardous waste
regulations and EPA regulations and is applying for the annual consents for air and water,
and renewal of authorization for the storage of hazardous waste.
10.12 CREP Guideline and Compliance
CREP Guideline Compliance Wastewater Management There is no generation of wastewater due to the
manufacture of SSP. The used scrubbing medium is reused for acid dilution.
Control of air pollution Five Stage scrubbing system is provided for process emissions. Bag filters are provided for dust collection at granulation section.
Management of solid waste No solid waste generation from process. 10.13 Other Management Practices
The industry will maintain records as per the hazardous waste regulations and EPA
regulations and apply for the annual consents for air and water, and renewal of
authorization for the storage of hazardous waste as per Hazardous Waste (Handling &
Management) Rules, 1989 and subsequent amendments. The records of hazardous waste
manifest will be maintained.
The industry shall obtain the consent for operation (CFO) as required under section 25/26
of the Water Act, 1974 and under section 21/22 of Air Act, 1981 before trial production and
commissioning from the Sate Pollution Control Board. The CFO will be renewed each year

Dashrath Prasad Fertilizers Pvt. Ltd. Environment Management Plan
10-13 Team Labs and Consultants
by the industry. The industry will obtain the necessary permissions under Hazardous Waste
(Management and Handling) Rules 1989, and Manufacture, Storage and Import of
Hazardous Chemicals Rules, 1989, issued by the Ministry of Environment and Forests, New
Delhi. The industry will submit environmental statement every year before September 30,
and monthly water cess returns. The management ensures that it will comply with all the
directions and regulations issued by the Ministry of Environment and Forests, New Delhi,
State and Central Pollution Control Boards. The Consent for Establishment, Consent for
Operation will be displayed in a conspicuous location for the information of the inspecting
authorities of different departments.
10.14 Cost Estimate for Environment Management Plan (Terms of Reference No.7(xi))
It is estimated that the total capital cost for implementing the Environment Management
plan is Rs. 178 lakhs, while the recurring costs for the same is Rs. 26.2 Lakhs/year. The
cost estimate is presented in Table 10.8. The item wise tentative capital cost estimate for
environment management measures is presented in Table 10.9
Table 10.8 Environmental Management Cost estimate S.No Description Capital
Cost Recurring Cost/year
1 Air pollution Control 118 15 2 Water pollution Control 33 5 3 Noise pollution Control 8 2 4 Environment Monitoring and Management 5 1 5 Occupational Health 8 2 6 Green Belt 4 0.8 7 Others (S. Waste) 2 0.4
Total (Rs. Lakhs) 178 26.5
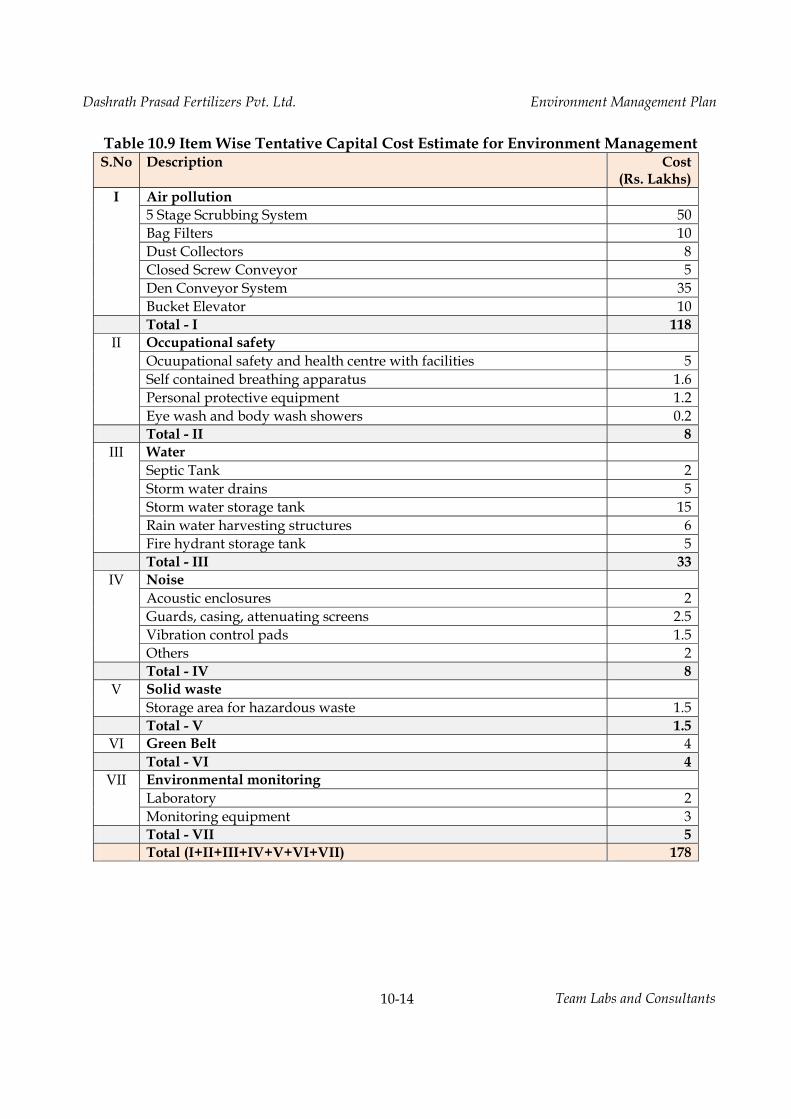
Dashrath Prasad Fertilizers Pvt. Ltd. Environment Management Plan
10-14 Team Labs and Consultants
Table 10.9 Item Wise Tentative Capital Cost Estimate for Environment Management S.No Description Cost
(Rs. Lakhs) I
Air pollution 5 Stage Scrubbing System 50 Bag Filters 10 Dust Collectors 8 Closed Screw Conveyor 5 Den Conveyor System 35 Bucket Elevator 10
Total - I 118 II
Occupational safety Ocuupational safety and health centre with facilities 5 Self contained breathing apparatus 1.6 Personal protective equipment 1.2 Eye wash and body wash showers 0.2
Total - II 8 III
Water Septic Tank 2 Storm water drains 5 Storm water storage tank 15 Rain water harvesting structures 6 Fire hydrant storage tank 5
Total - III 33 IV
Noise Acoustic enclosures 2 Guards, casing, attenuating screens 2.5 Vibration control pads 1.5 Others 2
Total - IV 8 V
Solid waste Storage area for hazardous waste 1.5
Total - V 1.5 VI Green Belt 4 Total - VI 4
VII
Environmental monitoring Laboratory 2 Monitoring equipment 3
Total - VII 5 Total (I+II+III+IV+V+VI+VII) 178
Dashrath Prasad Fertilizers Pvt. Ltd. Environmental Impact Assessment Report
Team Labs and consultants 11-1
CHAPTER 11.0 EXECUTIVE SUMMARY
11.0 Introduction
Fertilizers are generally defined as “any material, organic or inorganic, one or more of
chemical elements required for plant growth”. Fertilizers have played a vital role in
success of India’s green revolution and consequently self-reliance in food grains
production. The increase in fertilizer consumption has contributed significantly to
sustainable production of food grains in the country.
Single superphosphate (SSP) was the first commercial mineral fertilizer and it led to the
development of the modern plant nutrient industry. This material was once the most
commonly used fertilizer, but other phosphorus (P) fertilizers have largely replaced SSP
because of its relatively low P content.
Dashrath Prasad Fertilizers Pvt. Ltd. proposes to include Single Super Phosphate (SSP)
manufacturing facility in permitted/consented NPK Fertilizers (by mixing only) unit in
an area of 12.6 acres located at Sy. No. 274/1, 274/2, 276/A2, 277/A1, Tekulapalli
Village, Penuballi Mandal, Khammam District, Telangana. The capital cost of the project
is Rs. 5.5 crores. Prior environmental clearance is mandated by Ministry of Environment,
Forest and Climate Change (MoEFCC), vide SO 1533, dated September 14, 2006, for
Chemical Fertilizers manufacturing activity. The project sought terms of reference for
preparation of EIA report during March 2017. The terms of reference for the
environmental impact assessment studies was obtained from TS SEIAA vide letter no.
Lr. No. SEIAA/TS/OL/YDR-01/2017-707 dated 18.05.2017 and the public hearing was
conducted on 22.02.2018 as part of environmental clearance process.
11.1 Location of the Project:
The plant site is located at Survey No. 274/1, 274/2, 276/A2, 277/A1, Tekulapalli
Village, Penuballi Mandal, Khammam District, Telangana spread over an area of 12.6
acres. The site is located at the intersection of 170 11’ 53” (N) latitude and 800 36’ 29” (E)
longitude. The site elevation above mean sea level (MSL) is in the range of 112-115 m.
The plant site is surrounded by open agricultural lands in all directions except north,
State Highway-42 (Khamma – Sathupally) in North direction. The nearest habitation
Dashrath Prasad Fertilizers Pvt. Ltd. Environmental Impact Assessment Report
Team Labs and consultants 11-2
from the site is Tekulapalli village located at a distance of 1.2 km in east direction. The
main approach road is State Highway 42 connecting Khammam and Sathupally at a
distance of 0.1 km in north direction. The nearest Town Tiruvuru is at a distance of 8.2
km in southeast direction. The nearest Railway station is Bhadrachalam Road at a
distance of 40 km in northeast direction and nearest airport is Vijayawada
International Airport (Gannavaram) located at a distance of 130 km in southeast
direction. Nagarjuna sagar Main Branch Canal is flowing from northwest to southeast
direction at a distance of 2.5 km in north direction. Kannegiri RF is at a distance of 7.2 km
in north direction. Madhira Branch canal is at a distance of 6.2 km in west direction.
Interstate boundary of Andhra Pradesh – Telangana is at a distance of 5.9 km in
southwest direction. There is no National Park, Wildlife sanctuary, ecologically sensitive
area within the impact area of 10 km.
11.2 Product Profile
The manufacturing capacity is presented in the Table No. 11.1.
Table 11.1 Manufacturing Capacity S.No Name of Product Capacity (TPA)
Consented Proposed Total after Inclusion of SSP
1 NPK Fertilizers (By Mixing Only) 90000 --- 90000 2 Single Super Phosphate (SSP) --- 70000 70000
11.3 Manufacturing Process
The S.S.P is produced by reacting 75 % Sulphuric acid with ground Rock
phosphate powder followed by drying, granulating and packing. The manufacturing
process is presented in chapter 2 of EIA report.
11.4 Utilities
It is proposed to establish 1 x 250 kVA DG set in addition to existing 320 kVA DG set to
cater the power requirement during load shutdown period. The list of utilities is
presented in Table 11.2.
Table 11.2 List of Utilities S.No Description Capacity (TPA)
Consented Proposed Total after Inclusion of SSP
1 DG Set (kVA)* 1 x 320 1 x 250 1 x 320 and 1 x 250 *DG sets will be used during load shut down by Transco.
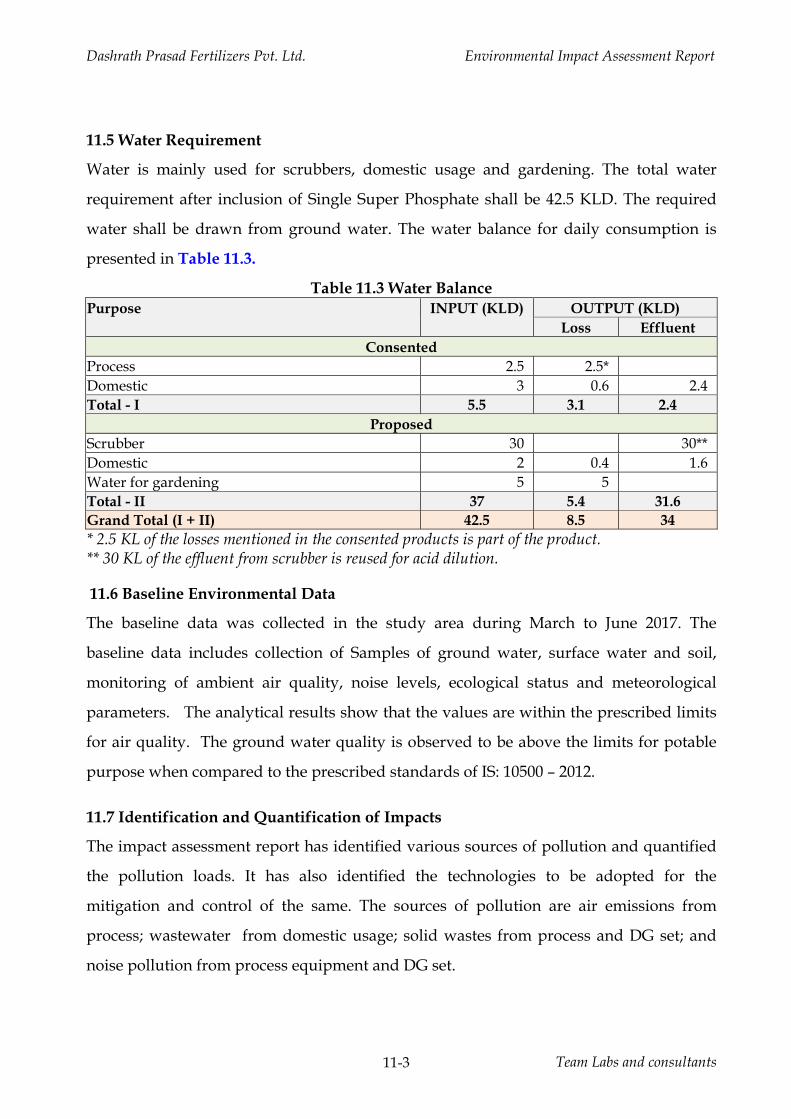
Dashrath Prasad Fertilizers Pvt. Ltd. Environmental Impact Assessment Report
Team Labs and consultants 11-3
11.5 Water Requirement
Water is mainly used for scrubbers, domestic usage and gardening. The total water
requirement after inclusion of Single Super Phosphate shall be 42.5 KLD. The required
water shall be drawn from ground water. The water balance for daily consumption is
presented in Table 11.3.
Table 11.3 Water Balance Purpose INPUT (KLD) OUTPUT (KLD)
Loss Effluent Consented
Process 2.5 2.5* Domestic 3 0.6 2.4 Total - I 5.5 3.1 2.4
Proposed Scrubber 30 30** Domestic 2 0.4 1.6 Water for gardening 5 5 Total - II 37 5.4 31.6 Grand Total (I + II) 42.5 8.5 34 * 2.5 KL of the losses mentioned in the consented products is part of the product. ** 30 KL of the effluent from scrubber is reused for acid dilution.
11.6 Baseline Environmental Data
The baseline data was collected in the study area during March to June 2017. The
baseline data includes collection of Samples of ground water, surface water and soil,
monitoring of ambient air quality, noise levels, ecological status and meteorological
parameters. The analytical results show that the values are within the prescribed limits
for air quality. The ground water quality is observed to be above the limits for potable
purpose when compared to the prescribed standards of IS: 10500 – 2012.
11.7 Identification and Quantification of Impacts
The impact assessment report has identified various sources of pollution and quantified
the pollution loads. It has also identified the technologies to be adopted for the
mitigation and control of the same. The sources of pollution are air emissions from
process; wastewater from domestic usage; solid wastes from process and DG set; and
noise pollution from process equipment and DG set.
Dashrath Prasad Fertilizers Pvt. Ltd. Environmental Impact Assessment Report
Team Labs and consultants 11-4
1178.1 Impacts on Air quality: The impacts on air quality shall be due to the emissions
from process and standby DG set. The incremental concentrations are quantified using
ISC-AERMOD model based on ISCST3 Algorithm. The results indicate marginal increase
in ambient air quality concentration. The predicted values for SPM, PM10, PM2.5, SO2,
NOx, and HF are 1.65, 0.66, 0.78, 2.92, 5.64 and 0.07 μg/m3 respectively and the
maximum values are observed at a distance of 0.4 km from the center of plant site in
northeast direction. The cumulative values of baseline air quality combined with
predicted values are found to be within the prescribed limits of National Ambient Air
Quality Standards. The mitigation and control measures of air pollution shall ensure
that the impact on air quality is local – within the site area and its surroundings.
11.7.2 Impacts on Water: Water is essentially used for scrubbing and domestic purposes.
The total fresh water required after inclusion of SSP 42.5 KLD, will be drawn from
ground water sources. No wastewater is generated from SSP manufacturing process.
Wastewater from scrubbing will be reused for dilution of concentrated sulphuric acid.
The domestic wastewater is sent to septic tank followed by soak pit. No impact on water
quality is expected.
11.7.3 Impacts on Noise quality: The noise levels may increase due to granulators, dryer,
bucket elevators and screw conveyors, motors, compressors, DG set and other activities.
The major source of noise generation is DG set which emit noise level of maximum 110
dB (A) at a reference distance of 1m from the source. The predicted cumulative noise
levels (as calculated by the logarithmic model without noise attenuation) ranged
between 55 and 75 dB(A) at distances of 87 to 165m.
11.7.4 Impacts on Soil: No solid wastes generated from process. The waste oil and used
batteries are sold to authorized recyclers. Ash from boiler is sold to brick manufacturers
in the local area. The operational phase impacts shall be neutral due to effective
implementation of mitigation measures in handling, storing and transferring of raw
materials, products and development of green belt.
Dashrath Prasad Fertilizers Pvt. Ltd. Environmental Impact Assessment Report
Team Labs and consultants 11-5
11.7.5 Impacts on Ecology: There are no endangered species of flora and fauna in the
impact area. The impact on biological environment is neutral with the effect confined
mainly to the site area.
Dashrath Prasad Fertilizers Pvt. Ltd. Environmental Impact Assessment Report
Team Labs and consultants 11-6
11.8 Environmental Monitoring Programme
It is proposed to monitor Ambient Air Quality (AAQ) for PM10, PM2.5, SO2 and NOX,
stack emissions for process and DG sets, noise levels on quarterly basis. Water, treated
wastewater on daily basis, soil analysis will be done once in a year.
11.9 Project Benefits
There is a potential for direct/indirect employment of about 15 people during
construction phase and 50 during operation phase of project. The project shall have
positive impact on socioeconomic environment due to provision of employment both
direct and indirect and proposed CSR activities.
11.10 Environment Management Plan
The management plan is drawn in consultation with project proponents and technical
consultants after evaluating various mitigation and control measures to address the
impacts identified, predicted and monitored. The impacts during construction stage are
temporary and less significant; the management plan for impacts identified during
operation stage is described as follows;
11.10.1 Liquid Effluents
No wastewater is generated from SSP manufacturing process. Wastewater from
scrubbing will be reused for dilution of concentrated sulphuric acid. The domestic
wastewater is sent to septic tank followed by soak pit. Total wastewater generated and
mode of treatment is presented in Table 11.4.
Table 11.4 Total Effluent Generated and Mode of Treatment Description Quantity (KLD) Mode of Treatment
Consented Proposed Total after Inclusion of SSP
Scrubber Effluent 30 30 Reused for dilution of sulphuric acid
Domestic Wastewater 2.4 1.6 4 Sent to Septic tank followed by soak pit.
Total 2.4 31.6 34
Dashrath Prasad Fertilizers Pvt. Ltd. Environmental Impact Assessment Report
Team Labs and consultants 11-7
11.10.2 Air Pollution
The sources of air emission from utilities is proposed standby DG set of 250 kVA in
addition to existing 1 x 320 kVA capacity. DG sets shall be provided with stack height
based on the CPCB formula for effective stack height.
Process emissions contain hydrogen fluoride and carbon dioxide. Hydrogen Fluoride
generated from mixing section will be scrubbed in 5 stage scrubbing system and
scrubbed effluent is resued for dilution of sulphuric acid, while carbondixide is let out
into atmosphere following a standard operating procedure
Process Description of 5 Stage Scrubbing System
Hydrogen fluoride gas generated from the SSP process will be conveyed by lined ducts
to the scrubbers. A settling chamber along with two stage water spray scrubbers and two
stage ventury scrubbers followed by alkali scrubber (5 stage) will be provided to obtain
the desired level of hydrogen fluoride
Fugitive Emission
Fugitive emissions are anticipated from material handling, transfer and storage. These
emissions are controlled by closed transfer, handling and operation system. Blending,
Grinding is conducted in Hammer mills, while the Granulation would be conducted in
Pulverizer followed by Granulation Drum and Classifier. Bag filter will be provided to
collect the dust in granulation section and reused in product mixing.
11.10.3 Solid Waste
No Solid wastes are generated from the process. The utilities i.e., DG sets generate waste
oil and used batteries. The scrubbing of HF gas from process leads to generation of
Hydrofluoro Silicic acid is a reusable product, which can be sold either as a byproduct
or mixed with main product, SSP. The waste oil and used batteries are sold to
authorized recyclers. Ash from boiler is sold to brick manufacturers in the local area.
11.10.4 Noise Pollution
Noise is anticipated from granulator, dryers, bucket elevators, screw conveyors, pumps
and DG set. Closed bucket elevators and screw conveyors will be used to minimize noise
levels, DG set shall be provided with acoustic enclosure. Motors and compressors shall
Dashrath Prasad Fertilizers Pvt. Ltd. Environmental Impact Assessment Report
Team Labs and consultants 11-8
be mounted properly to ensure reduction of noise and vibration. Employees working in
noise generating areas shall be provided with appropriate personnel protective
equipment.
11.10.5 Occupational Safety and Health
Personal Protective Equipment (PPE) i.e., hand gloves, safety goggles, safety shoes,
safety helmets, respiratory masks etc. are provided to all the employees working in the
plant.
11.10.6 Prevention, maintenance and operation of Environment Control Systems
The pollution control equipment is monitored periodically to estimate their efficiency
and performance potential as part of adoptive management. Proactive maintenance and
monitoring program for all equipment and machinery is adopted to identify the
problems/under performance of the equipment. Necessary measures will be adopted to
rectify the identified problems/defects. The management agrees that the results of
monitoring will be reviewed periodically to adopt new measures if necessary, for
efficient pollution control.
11.10.7 Transport systems
All the raw materials and finished products are transported by road. Dedicated parking
facility is provided for transport vehicles. There will be 25-30 truck trip per day to the
factory for transporting raw materials and products. Traffic signage will be placed in
the battery limit.
11.10.8 Reduce, Recycle and Reuse
Water used for scrubbing of Hydrogen Fluoride emissions will be reused for acid
dilution, the dust in granulation section reused in product mixing.
11.10.9 Green Belt Development
It is proposed to provide green belt in an area of 4.2 acres, covering the boundary of the
site as part of environment management plan. Native species shall be identified for
plantation and the guidelines issued by CPCB for development of green belt shall be
followed. The green belt shall enhance environmental quality through mitigation of
Dashrath Prasad Fertilizers Pvt. Ltd. Environmental Impact Assessment Report
Team Labs and consultants 11-9
fugitive emissions, attenuation of noise levels, balancing eco-environment, consumption
of treated effluent, prevention of soil erosion, and creation of aesthetic environment.
11.10.10 Post Project Monitoring
Environmental monitoring for water, air, noise and solid waste quality shall be
conducted periodically either by proponent or third party. The frequency of monitoring
and the quality parameters shall be as suggested by the Ministry of Environment and
Forests and Climate Change, Government of India.
11.10.11 Environment Management Department
The Environment Management Cell of the project shall be headed by the plant head,
followed by operators, chemists and fitters/helpers.
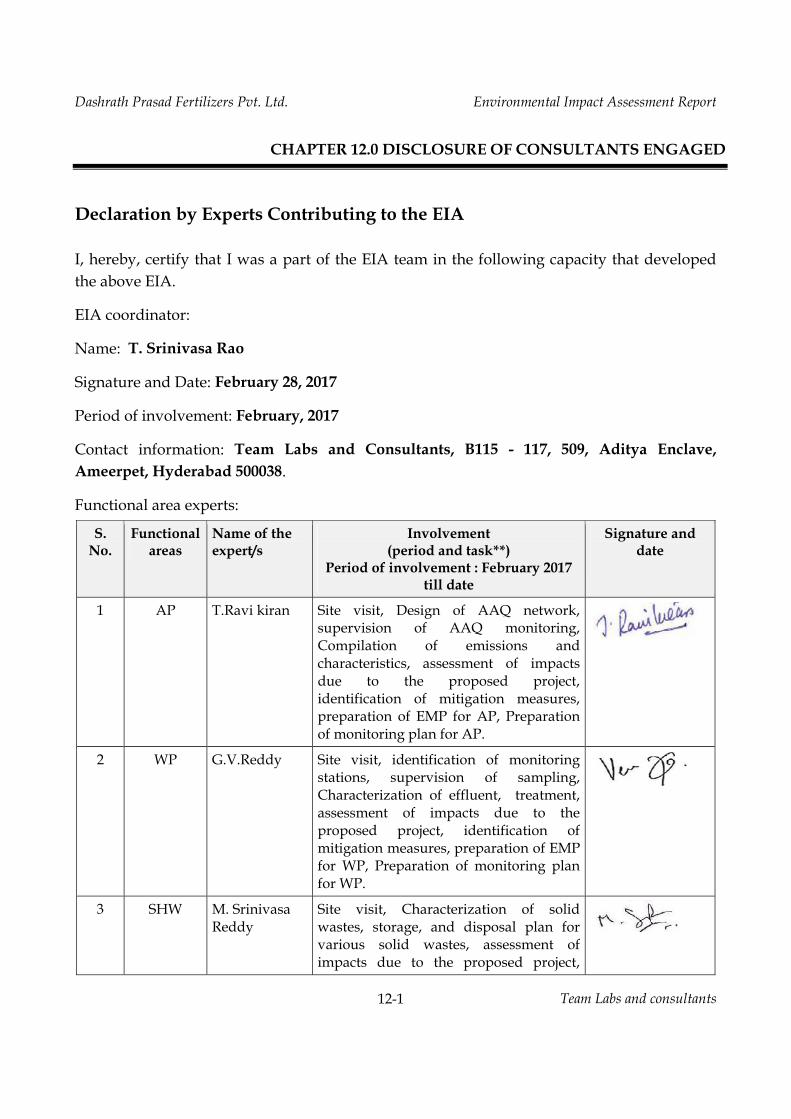
Dashrath Prasad Fertilizers Pvt. Ltd. Environmental Impact Assessment Report
Team Labs and consultants
12-1
CHAPTER 12.0 DISCLOSURE OF CONSULTANTS ENGAGED
Declaration by Experts Contributing to the EIA I, hereby, certify that I was a part of the EIA team in the following capacity that developed the above EIA.
EIA coordinator:
Name: T. Srinivasa Rao
Signature and Date: February 28, 2017
Period of involvement: February, 2017
Contact information: Team Labs and Consultants, B115 - 117, 509, Aditya Enclave, Ameerpet, Hyderabad 500038.
Functional area experts:
S. No.
Functional areas
Name of the expert/s
Involvement (period and task**)
Period of involvement : February 2017 till date
Signature and date
1 AP T.Ravi kiran Site visit, Design of AAQ network, supervision of AAQ monitoring, Compilation of emissions and characteristics, assessment of impacts due to the proposed project, identification of mitigation measures, preparation of EMP for AP, Preparation of monitoring plan for AP.
2 WP G.V.Reddy Site visit, identification of monitoring stations, supervision of sampling, Characterization of effluent, treatment, assessment of impacts due to the proposed project, identification of mitigation measures, preparation of EMP for WP, Preparation of monitoring plan for WP.
3 SHW M. Srinivasa Reddy
Site visit, Characterization of solid wastes, storage, and disposal plan for various solid wastes, assessment of impacts due to the proposed project,
Dashrath P
4
5
6
7
8
9
Prasad Fertili
SE
EB
HG
SC
AQ
LU
izers Pvt. Ltd
G.V.Reddy
I. SivaramaKrishna
G.V.A. Ramakrish
D. Sundar
M. SrinivasReddy
G.V.A. Ramakrish
d.
identprepa
y Site collecof imsocioeconoPrepa
a Site collecbiodibasedmitiggreenprepa
hna Identby assesthe srain wimpaand m
Rao Identand interpassesaccidetc., a
sa AssismoniclimaIdentdata met weatdetaimodeconcemodeprepaFAE of EM
hna Prepausing
12-2
tification oaration of E
visit, primction of the
mpacts due to economiomy, preparation of S
visit, primction relaiversity, ad on IAIA ggation measn belt plaration of E
tification ofpreparing
ssment of gsite and impwater harve
acts due to mitigation m
tification ofcharacter
pretation ossment of idental releasand mitigat
sting AP FAitoring statiatological atification monitoring
data collether station,ils, Air qeling, Calentrations el, Assearation of i and EIA coMP.
aration of lg satellite
En
of mitigatiEMP for SH
mary and see impact arto the propoic status paration oSE part of EI
mary and seated to assessment guidelines, sures, and an and c
EB part of E
f water she the drground watpact area, esting plan,ground wa
measures.
f soil samprization oof soil anaimpacts duses of chemtion measur
AE in identiions by proand other hof Micromg station, section usin, Preparatio
quality implculation o
of solvenssment ofsopleths, asoordinator
land use laimagery,
nvironmenta
ion measuW.
econdary dea, assessmosed project
and proof CSR pIA report.
econdary decology a
of impa preparationpreparationcost estimIA report.
eds of the arainage mter potentiapreparation, assessmen
ater abstract
pling locatif the soalysis repo
ue to spillagmicals, efflueres.
fying the Aoviding norhistorical dmeteorologsupervisionng Automon of emiss
pact predictof work ro
nts using f results assisting the in preparat
and cover mground tr
l Impact Ass
Team Labs a
ures,
data ment
t on oject plan,
data and acts n of n of
mate,
area map, al of n of nt of tion
ions oils, orts, ges, ents
AAQ mal
data, gical n of
matic sion tion oom box and AP tion
map ruth
sessment Rep
and consulta
port
ants
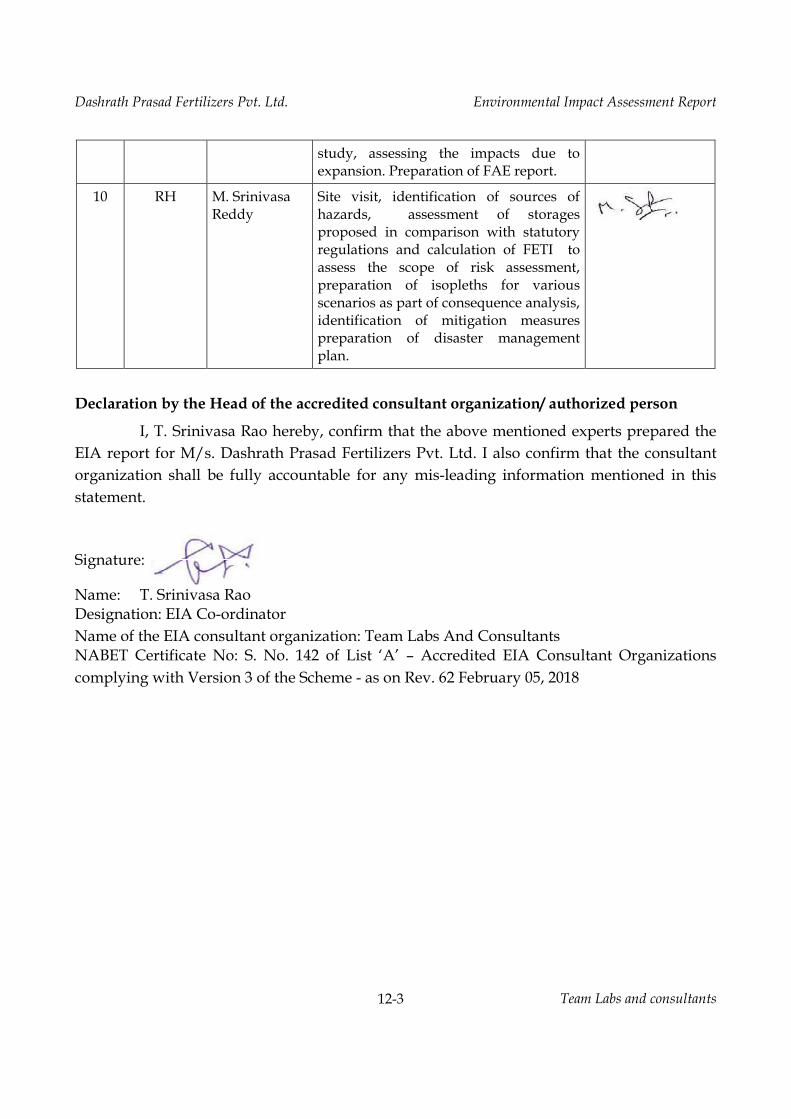
Dashrath Prasad Fertilizers Pvt. Ltd. Environmental Impact Assessment Report
Team Labs and consultants
12-3
study, assessing the impacts due to expansion. Preparation of FAE report.
10 RH M. Srinivasa Reddy
Site visit, identification of sources of hazards, assessment of storages proposed in comparison with statutory regulations and calculation of FETI to assess the scope of risk assessment, preparation of isopleths for various scenarios as part of consequence analysis, identification of mitigation measures preparation of disaster management plan.
Declaration by the Head of the accredited consultant organization/ authorized person
I, T. Srinivasa Rao hereby, confirm that the above mentioned experts prepared the EIA report for M/s. Dashrath Prasad Fertilizers Pvt. Ltd. I also confirm that the consultant organization shall be fully accountable for any mis-leading information mentioned in this statement.
Signature:
Name: T. Srinivasa Rao Designation: EIA Co-ordinator Name of the EIA consultant organization: Team Labs And Consultants NABET Certificate No: S. No. 142 of List ‘A’ – Accredited EIA Consultant Organizations complying with Version 3 of the Scheme - as on Rev. 62 February 05, 2018
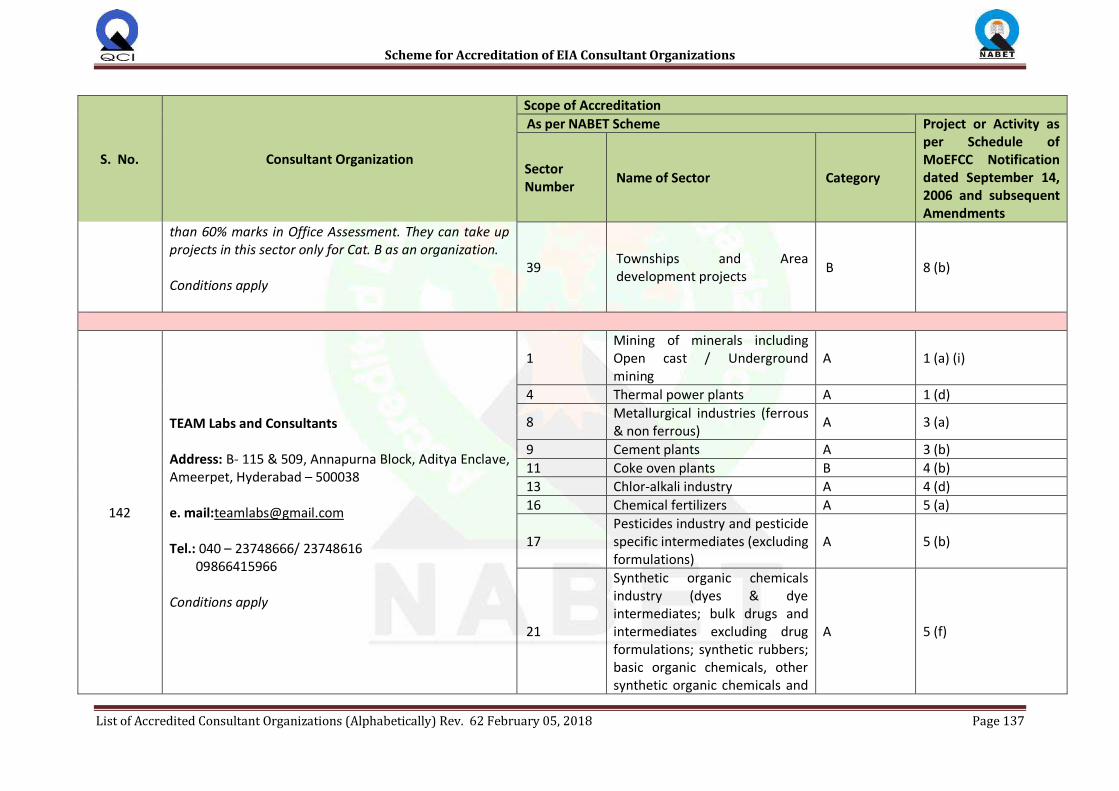
Scheme for Accreditation of EIA Consultant Organizations
List of Accredited Consultant Organizations (Alphabetically) Rev. 62 February 05, 2018 Page 137
S. No. Consultant Organization
Scope of Accreditation
As per NABET Scheme Project or Activity as per Schedule of MoEFCC Notification dated September 14, 2006 and subsequent Amendments
Sector Number
Name of Sector Category
than 60% marks in Office Assessment. They can take up projects in this sector only for Cat. B as an organization. Conditions apply
39 Townships and Area development projects
B 8 (b)
142
TEAM Labs and Consultants Address: B- 115 & 509, Annapurna Block, Aditya Enclave, Ameerpet, Hyderabad – 500038 e. mail:[email protected] Tel.: 040 – 23748666/ 23748616 09866415966 Conditions apply
1 Mining of minerals including Open cast / Underground mining
A 1 (a) (i)
4 Thermal power plants A 1 (d)
8 Metallurgical industries (ferrous & non ferrous)
A 3 (a)
9 Cement plants A 3 (b)
11 Coke oven plants B 4 (b)
13 Chlor-alkali industry A 4 (d)
16 Chemical fertilizers A 5 (a)
17 Pesticides industry and pesticide specific intermediates (excluding formulations)
A 5 (b)
21
Synthetic organic chemicals industry (dyes & dye intermediates; bulk drugs and intermediates excluding drug formulations; synthetic rubbers; basic organic chemicals, other synthetic organic chemicals and
A 5 (f)
Scheme for Accreditation of EIA Consultant Organizations
List of Accredited Consultant Organizations (Alphabetically) Rev. 62 February 05, 2018 Page 138
S. No. Consultant Organization
Scope of Accreditation
As per NABET Scheme Project or Activity as per Schedule of MoEFCC Notification dated September 14, 2006 and subsequent Amendments
Sector Number
Name of Sector Category
chemical intermediates)
22 Distilleries A 5 (g)
25 Sugar Industry B 5 (j)
31
Industrial estates/ parks/ complexes/Areas, export processing Zones(EPZs), Special economic zones(SEZs), Biotech Parks, Leather Complexes
A 7 (c)
34 Highways A 7 (f)
38 Building and construction projects
B 8(a)
39 Townships and Area development projects
B 8 (b)
143
Terracon Ecotech Pvt. Ltd. Address: 202, Kingston, Tejpal Road, Vile Parle (E), Mumbai 400057, India e. mail: [email protected] Tel.:022-2613939/40/41, 9820828087 Conditions apply
2 Off shore and on shore oil and gas exploration, development and production
A 1(b)
3 River valley, hydel, drainage and irrigation projects
A 1 (c)
27
Oil & gas transportation pipeline (crude and refinery/ petrochemical products), passing through national parks/ sanctuaries/coral reefs /ecologically sensitive Areas including LNG terminal
A 6 (a)

DASHRATH PRASAD FERTILIZERS PVT. LTD. SY. NO. 274/1, 274/2, 276/A2, 277/A1, TEKULAPALLI VILLAGE, PENUBALLI MANDAL, KHAMMAM DISTRICT, TELANGANA
3. PUBLIC CONSULTATION
Project No. 0318‐16‐01March 2018
Dashrath Prasad Fertilizers Pvt. Ltd. 274/1, 274/2, 276/A2, 277/A1, Tekulapalli Village, Penuballi Mandal, Khammam District, Telangana – 507 302 Phone: +91 95735 74455 E‐mail: [email protected]; [email protected]
STUDIES AND DOCUMENTATION BYTEAM Labs and Consultants B‐115‐117 & 509, Annapurna Block, Aditya Enclave, Ameerpet, Hyderabad‐500 038. Phone: 040‐23748 555/23748616, Telefax: 040‐23748666
SUBMITTED TO STATE LEVEL ENVIRONMENT IMPACT ASSESSMENT AUTHORITY,
TELANGANA, GOVERNMENT OF INDIA
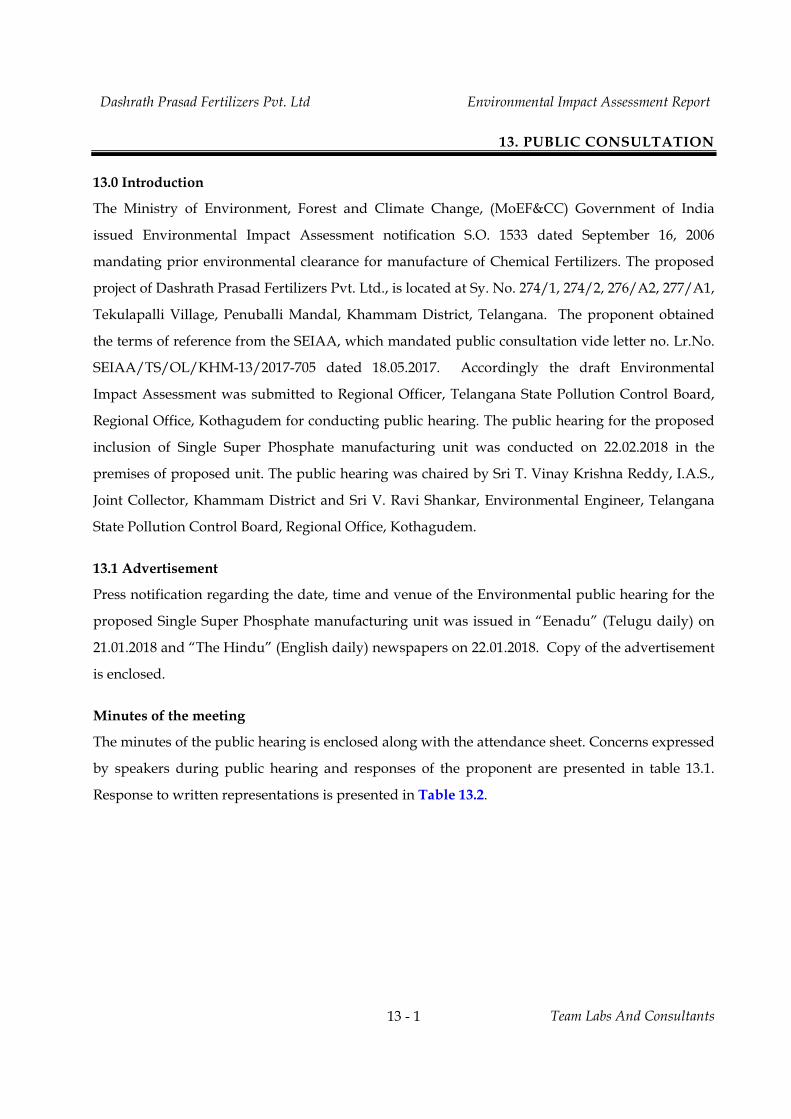
Dashrath Prasad Fertilizers Pvt. Ltd Environmental Impact Assessment Report
Team Labs And Consultants 13 - 1
13. PUBLIC CONSULTATION 13.0 Introduction
The Ministry of Environment, Forest and Climate Change, (MoEF&CC) Government of India
issued Environmental Impact Assessment notification S.O. 1533 dated September 16, 2006
mandating prior environmental clearance for manufacture of Chemical Fertilizers. The proposed
project of Dashrath Prasad Fertilizers Pvt. Ltd., is located at Sy. No. 274/1, 274/2, 276/A2, 277/A1,
Tekulapalli Village, Penuballi Mandal, Khammam District, Telangana. The proponent obtained
the terms of reference from the SEIAA, which mandated public consultation vide letter no. Lr.No.
SEIAA/TS/OL/KHM-13/2017-705 dated 18.05.2017. Accordingly the draft Environmental
Impact Assessment was submitted to Regional Officer, Telangana State Pollution Control Board,
Regional Office, Kothagudem for conducting public hearing. The public hearing for the proposed
inclusion of Single Super Phosphate manufacturing unit was conducted on 22.02.2018 in the
premises of proposed unit. The public hearing was chaired by Sri T. Vinay Krishna Reddy, I.A.S.,
Joint Collector, Khammam District and Sri V. Ravi Shankar, Environmental Engineer, Telangana
State Pollution Control Board, Regional Office, Kothagudem.
13.1 Advertisement
Press notification regarding the date, time and venue of the Environmental public hearing for the
proposed Single Super Phosphate manufacturing unit was issued in “Eenadu” (Telugu daily) on
21.01.2018 and “The Hindu” (English daily) newspapers on 22.01.2018. Copy of the advertisement
is enclosed.
Minutes of the meeting
The minutes of the public hearing is enclosed along with the attendance sheet. Concerns expressed
by speakers during public hearing and responses of the proponent are presented in table 13.1.
Response to written representations is presented in Table 13.2.
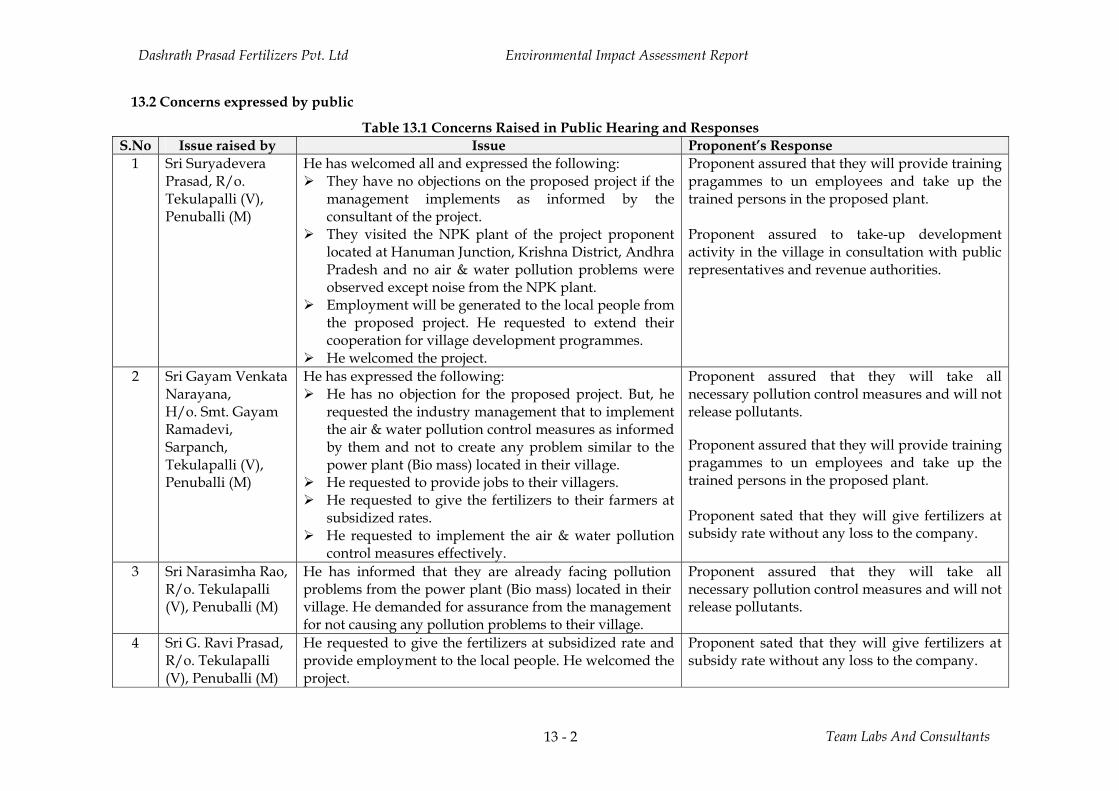
Dashrath Prasad Fertilizers Pvt. Ltd Environmental Impact Assessment Report
Team Labs And Consultants 13 - 2
13.2 Concerns expressed by public
Table 13.1 Concerns Raised in Public Hearing and Responses S.No Issue raised by Issue Proponent’s Response
1 Sri Suryadevera Prasad, R/o. Tekulapalli (V), Penuballi (M)
He has welcomed all and expressed the following: They have no objections on the proposed project if the
management implements as informed by the consultant of the project.
They visited the NPK plant of the project proponent located at Hanuman Junction, Krishna District, Andhra Pradesh and no air & water pollution problems were observed except noise from the NPK plant.
Employment will be generated to the local people from the proposed project. He requested to extend their cooperation for village development programmes.
He welcomed the project.
Proponent assured that they will provide training pragammes to un employees and take up the trained persons in the proposed plant. Proponent assured to take-up development activity in the village in consultation with public representatives and revenue authorities.
2 Sri Gayam Venkata Narayana, H/o. Smt. Gayam Ramadevi, Sarpanch, Tekulapalli (V), Penuballi (M)
He has expressed the following: He has no objection for the proposed project. But, he
requested the industry management that to implement the air & water pollution control measures as informed by them and not to create any problem similar to the power plant (Bio mass) located in their village.
He requested to provide jobs to their villagers. He requested to give the fertilizers to their farmers at
subsidized rates. He requested to implement the air & water pollution
control measures effectively.
Proponent assured that they will take all necessary pollution control measures and will not release pollutants.
Proponent assured that they will provide training pragammes to un employees and take up the trained persons in the proposed plant. Proponent sated that they will give fertilizers at subsidy rate without any loss to the company.
3 Sri Narasimha Rao, R/o. Tekulapalli (V), Penuballi (M)
He has informed that they are already facing pollution problems from the power plant (Bio mass) located in their village. He demanded for assurance from the management for not causing any pollution problems to their village.
Proponent assured that they will take all necessary pollution control measures and will not release pollutants.
4 Sri G. Ravi Prasad, R/o. Tekulapalli (V), Penuballi (M)
He requested to give the fertilizers at subsidized rate and provide employment to the local people. He welcomed the project.
Proponent sated that they will give fertilizers at subsidy rate without any loss to the company.
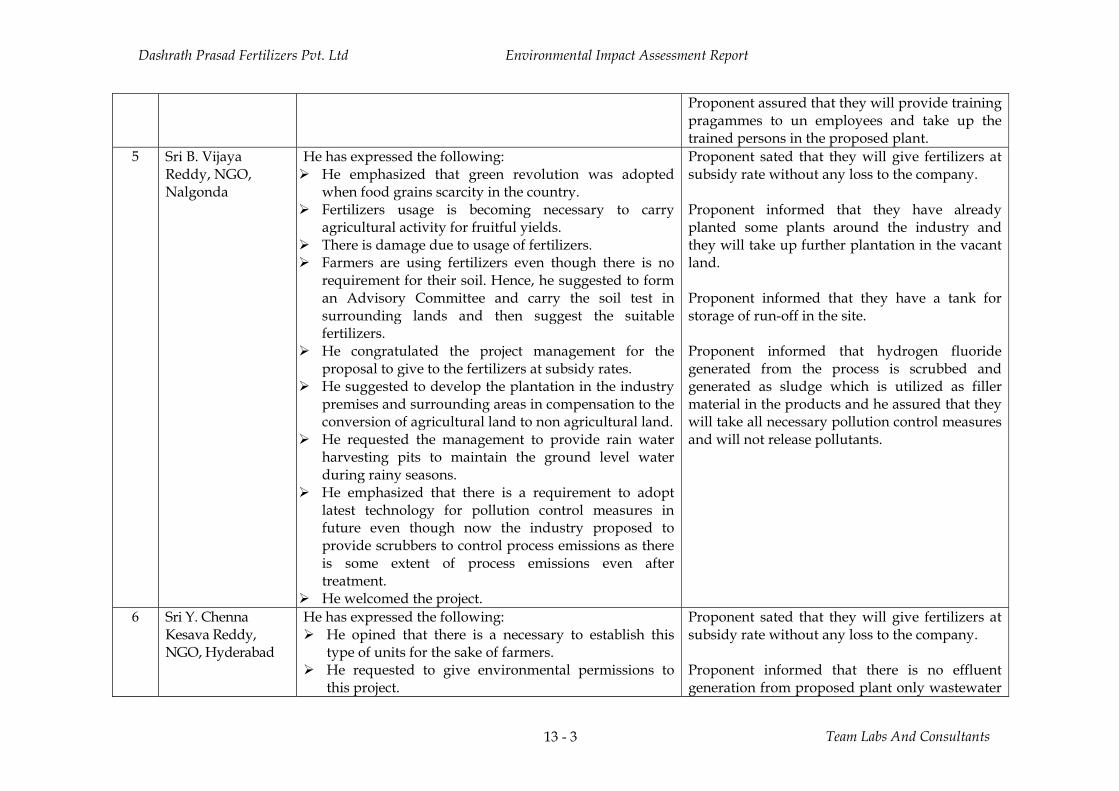
Dashrath Prasad Fertilizers Pvt. Ltd Environmental Impact Assessment Report
Team Labs And Consultants 13 - 3
Proponent assured that they will provide training pragammes to un employees and take up the trained persons in the proposed plant.
5 Sri B. Vijaya Reddy, NGO, Nalgonda
He has expressed the following: He emphasized that green revolution was adopted
when food grains scarcity in the country. Fertilizers usage is becoming necessary to carry
agricultural activity for fruitful yields. There is damage due to usage of fertilizers. Farmers are using fertilizers even though there is no
requirement for their soil. Hence, he suggested to form an Advisory Committee and carry the soil test in surrounding lands and then suggest the suitable fertilizers.
He congratulated the project management for the proposal to give to the fertilizers at subsidy rates.
He suggested to develop the plantation in the industry premises and surrounding areas in compensation to the conversion of agricultural land to non agricultural land.
He requested the management to provide rain water harvesting pits to maintain the ground level water during rainy seasons.
He emphasized that there is a requirement to adopt latest technology for pollution control measures in future even though now the industry proposed to provide scrubbers to control process emissions as there is some extent of process emissions even after treatment.
He welcomed the project.
Proponent sated that they will give fertilizers at subsidy rate without any loss to the company. Proponent informed that they have already planted some plants around the industry and they will take up further plantation in the vacant land. Proponent informed that they have a tank for storage of run-off in the site. Proponent informed that hydrogen fluoride generated from the process is scrubbed and generated as sludge which is utilized as filler material in the products and he assured that they will take all necessary pollution control measures and will not release pollutants.
6 Sri Y. Chenna Kesava Reddy, NGO, Hyderabad
He has expressed the following: He opined that there is a necessary to establish this
type of units for the sake of farmers. He requested to give environmental permissions to
this project.
Proponent sated that they will give fertilizers at subsidy rate without any loss to the company. Proponent informed that there is no effluent generation from proposed plant only wastewater
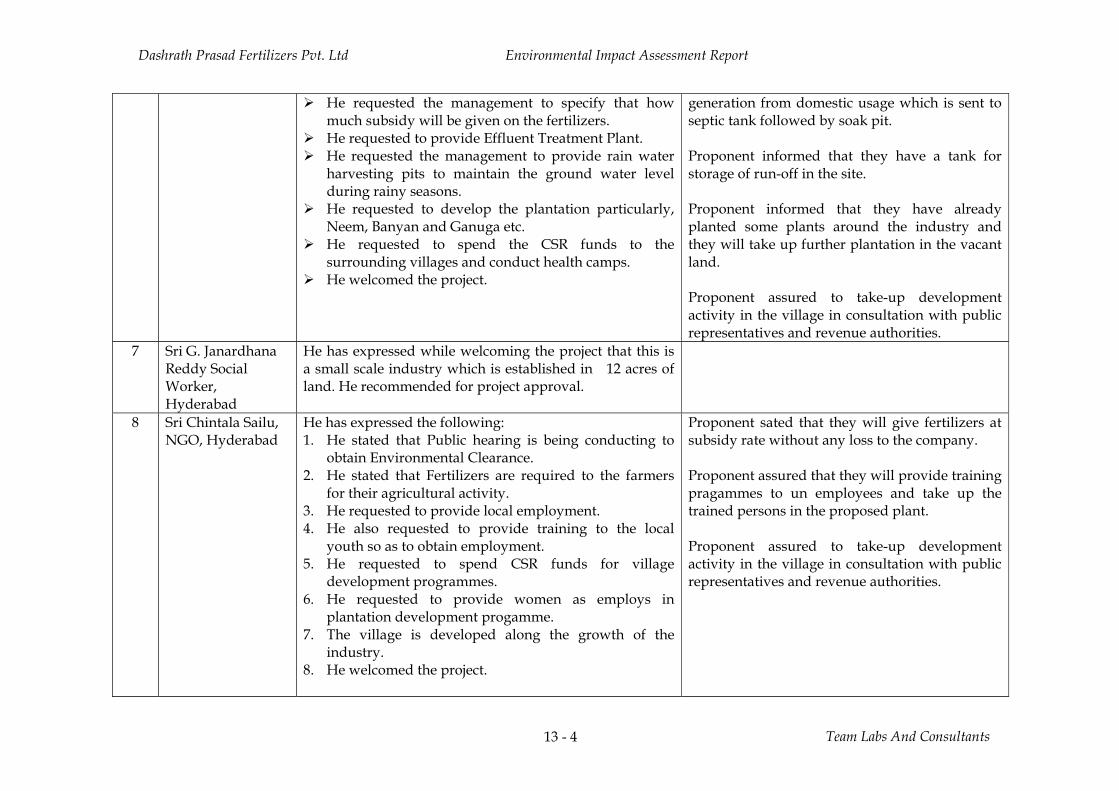
Dashrath Prasad Fertilizers Pvt. Ltd Environmental Impact Assessment Report
Team Labs And Consultants 13 - 4
He requested the management to specify that how much subsidy will be given on the fertilizers.
He requested to provide Effluent Treatment Plant. He requested the management to provide rain water
harvesting pits to maintain the ground water level during rainy seasons.
He requested to develop the plantation particularly, Neem, Banyan and Ganuga etc.
He requested to spend the CSR funds to the surrounding villages and conduct health camps.
He welcomed the project.
generation from domestic usage which is sent to septic tank followed by soak pit. Proponent informed that they have a tank for storage of run-off in the site. Proponent informed that they have already planted some plants around the industry and they will take up further plantation in the vacant land. Proponent assured to take-up development activity in the village in consultation with public representatives and revenue authorities.
7 Sri G. Janardhana Reddy Social Worker, Hyderabad
He has expressed while welcoming the project that this is a small scale industry which is established in 12 acres of land. He recommended for project approval.
8 Sri Chintala Sailu, NGO, Hyderabad
He has expressed the following: 1. He stated that Public hearing is being conducting to
obtain Environmental Clearance. 2. He stated that Fertilizers are required to the farmers
for their agricultural activity. 3. He requested to provide local employment. 4. He also requested to provide training to the local
youth so as to obtain employment. 5. He requested to spend CSR funds for village
development programmes. 6. He requested to provide women as employs in
plantation development progamme. 7. The village is developed along the growth of the
industry. 8. He welcomed the project.
Proponent sated that they will give fertilizers at subsidy rate without any loss to the company. Proponent assured that they will provide training pragammes to un employees and take up the trained persons in the proposed plant. Proponent assured to take-up development activity in the village in consultation with public representatives and revenue authorities.
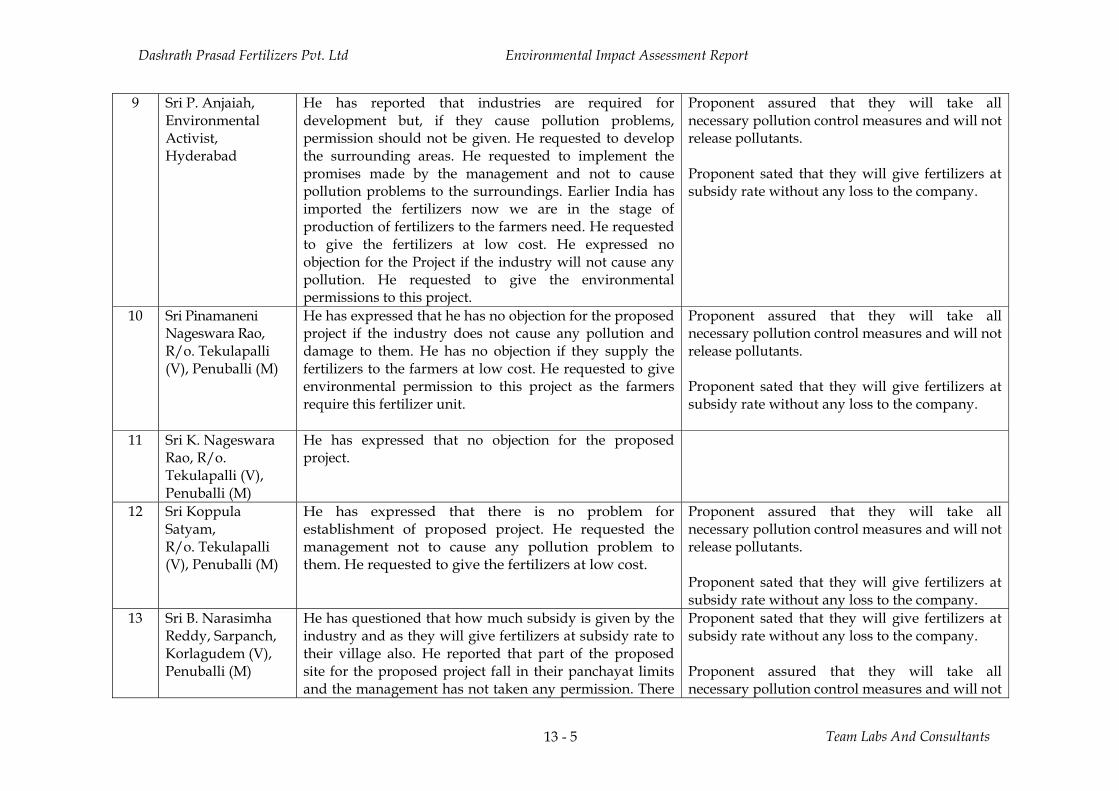
Dashrath Prasad Fertilizers Pvt. Ltd Environmental Impact Assessment Report
Team Labs And Consultants 13 - 5
9 Sri P. Anjaiah, Environmental Activist, Hyderabad
He has reported that industries are required for development but, if they cause pollution problems, permission should not be given. He requested to develop the surrounding areas. He requested to implement the promises made by the management and not to cause pollution problems to the surroundings. Earlier India has imported the fertilizers now we are in the stage of production of fertilizers to the farmers need. He requested to give the fertilizers at low cost. He expressed no objection for the Project if the industry will not cause any pollution. He requested to give the environmental permissions to this project.
Proponent assured that they will take all necessary pollution control measures and will not release pollutants. Proponent sated that they will give fertilizers at subsidy rate without any loss to the company.
10 Sri Pinamaneni Nageswara Rao, R/o. Tekulapalli (V), Penuballi (M)
He has expressed that he has no objection for the proposed project if the industry does not cause any pollution and damage to them. He has no objection if they supply the fertilizers to the farmers at low cost. He requested to give environmental permission to this project as the farmers require this fertilizer unit.
Proponent assured that they will take all necessary pollution control measures and will not release pollutants. Proponent sated that they will give fertilizers at subsidy rate without any loss to the company.
11 Sri K. Nageswara Rao, R/o. Tekulapalli (V), Penuballi (M)
He has expressed that no objection for the proposed project.
12 Sri Koppula Satyam, R/o. Tekulapalli (V), Penuballi (M)
He has expressed that there is no problem for establishment of proposed project. He requested the management not to cause any pollution problem to them. He requested to give the fertilizers at low cost.
Proponent assured that they will take all necessary pollution control measures and will not release pollutants. Proponent sated that they will give fertilizers at subsidy rate without any loss to the company.
13 Sri B. Narasimha Reddy, Sarpanch, Korlagudem (V), Penuballi (M)
He has questioned that how much subsidy is given by the industry and as they will give fertilizers at subsidy rate to their village also. He reported that part of the proposed site for the proposed project fall in their panchayat limits and the management has not taken any permission. There
Proponent sated that they will give fertilizers at subsidy rate without any loss to the company. Proponent assured that they will take all necessary pollution control measures and will not
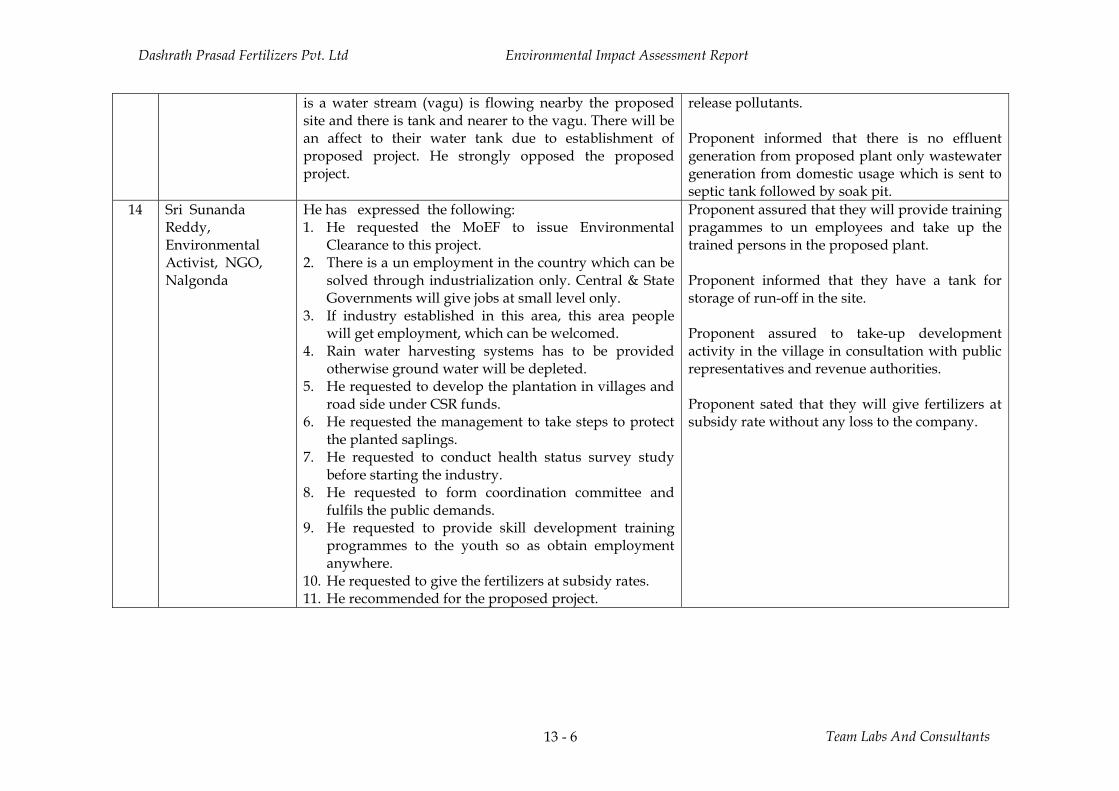
Dashrath Prasad Fertilizers Pvt. Ltd Environmental Impact Assessment Report
Team Labs And Consultants 13 - 6
is a water stream (vagu) is flowing nearby the proposed site and there is tank and nearer to the vagu. There will be an affect to their water tank due to establishment of proposed project. He strongly opposed the proposed project.
release pollutants. Proponent informed that there is no effluent generation from proposed plant only wastewater generation from domestic usage which is sent to septic tank followed by soak pit.
14 Sri Sunanda Reddy, Environmental Activist, NGO, Nalgonda
He has expressed the following: 1. He requested the MoEF to issue Environmental
Clearance to this project. 2. There is a un employment in the country which can be
solved through industrialization only. Central & State Governments will give jobs at small level only.
3. If industry established in this area, this area people will get employment, which can be welcomed.
4. Rain water harvesting systems has to be provided otherwise ground water will be depleted.
5. He requested to develop the plantation in villages and road side under CSR funds.
6. He requested the management to take steps to protect the planted saplings.
7. He requested to conduct health status survey study before starting the industry.
8. He requested to form coordination committee and fulfils the public demands.
9. He requested to provide skill development training programmes to the youth so as obtain employment anywhere.
10. He requested to give the fertilizers at subsidy rates. 11. He recommended for the proposed project.
Proponent assured that they will provide training pragammes to un employees and take up the trained persons in the proposed plant. Proponent informed that they have a tank for storage of run-off in the site. Proponent assured to take-up development activity in the village in consultation with public representatives and revenue authorities. Proponent sated that they will give fertilizers at subsidy rate without any loss to the company.
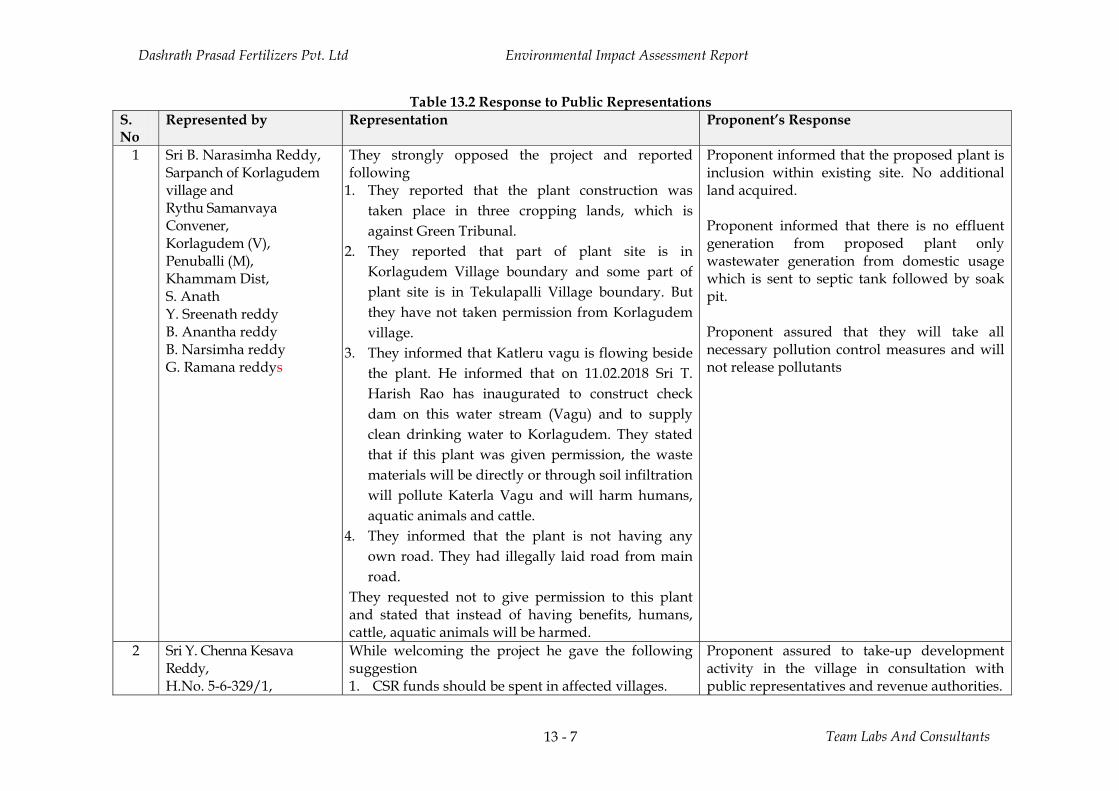
Dashrath Prasad Fertilizers Pvt. Ltd Environmental Impact Assessment Report
Team Labs And Consultants 13 - 7
Table 13.2 Response to Public Representations S. No
Represented by Representation Proponent’s Response
1 Sri B. Narasimha Reddy, Sarpanch of Korlagudem village and Rythu Samanvaya Convener, Korlagudem (V), Penuballi (M), Khammam Dist, S. Anath Y. Sreenath reddy B. Anantha reddy B. Narsimha reddy G. Ramana reddys
They strongly opposed the project and reported following
1. They reported that the plant construction was taken place in three cropping lands, which is against Green Tribunal.
2. They reported that part of plant site is in Korlagudem Village boundary and some part of plant site is in Tekulapalli Village boundary. But they have not taken permission from Korlagudem village.
3. They informed that Katleru vagu is flowing beside the plant. He informed that on 11.02.2018 Sri T. Harish Rao has inaugurated to construct check dam on this water stream (Vagu) and to supply clean drinking water to Korlagudem. They stated that if this plant was given permission, the waste materials will be directly or through soil infiltration will pollute Katerla Vagu and will harm humans, aquatic animals and cattle.
4. They informed that the plant is not having any own road. They had illegally laid road from main road.
They requested not to give permission to this plant and stated that instead of having benefits, humans, cattle, aquatic animals will be harmed.
Proponent informed that the proposed plant is inclusion within existing site. No additional land acquired. Proponent informed that there is no effluent generation from proposed plant only wastewater generation from domestic usage which is sent to septic tank followed by soak pit. Proponent assured that they will take all necessary pollution control measures and will not release pollutants
2 Sri Y. Chenna Kesava Reddy, H.No. 5-6-329/1,
While welcoming the project he gave the following suggestion 1. CSR funds should be spent in affected villages.
Proponent assured to take-up development activity in the village in consultation with public representatives and revenue authorities.
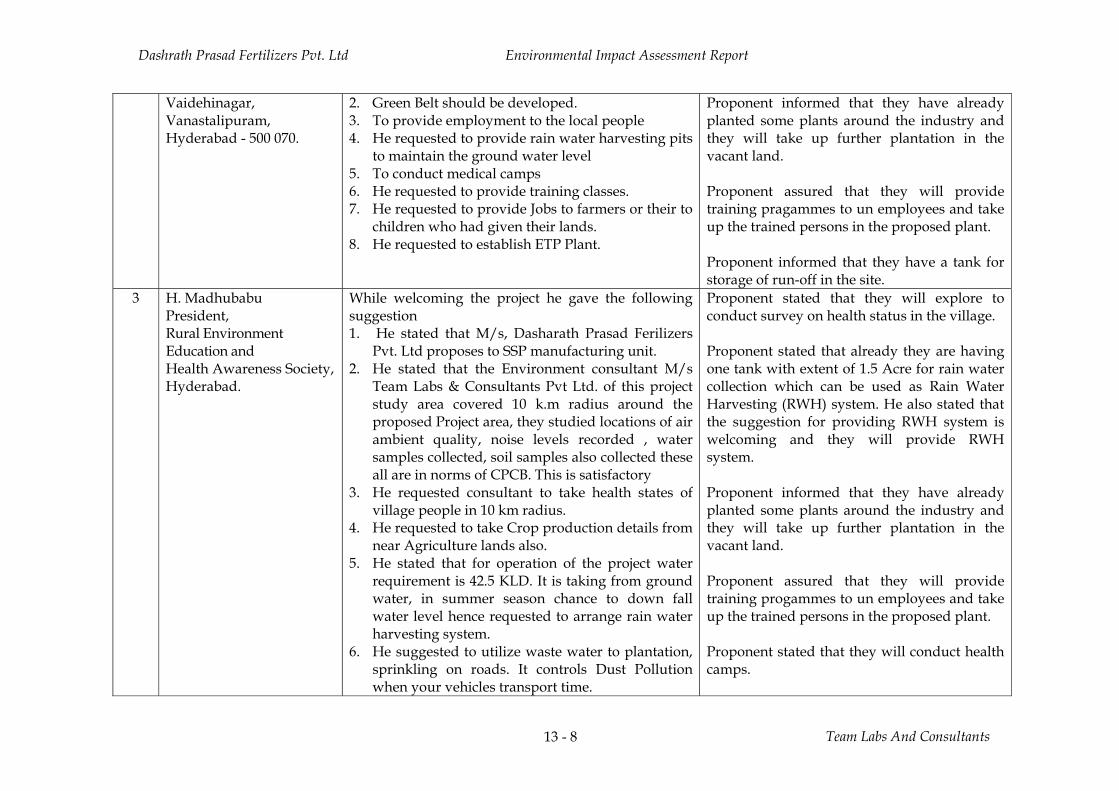
Dashrath Prasad Fertilizers Pvt. Ltd Environmental Impact Assessment Report
Team Labs And Consultants 13 - 8
Vaidehinagar, Vanastalipuram, Hyderabad - 500 070.
2. Green Belt should be developed. 3. To provide employment to the local people 4. He requested to provide rain water harvesting pits
to maintain the ground water level 5. To conduct medical camps 6. He requested to provide training classes. 7. He requested to provide Jobs to farmers or their to
children who had given their lands. 8. He requested to establish ETP Plant.
Proponent informed that they have already planted some plants around the industry and they will take up further plantation in the vacant land. Proponent assured that they will provide training pragammes to un employees and take up the trained persons in the proposed plant. Proponent informed that they have a tank for storage of run-off in the site.
3 H. Madhubabu President, Rural Environment Education and Health Awareness Society, Hyderabad.
While welcoming the project he gave the following suggestion 1. He stated that M/s, Dasharath Prasad Ferilizers
Pvt. Ltd proposes to SSP manufacturing unit. 2. He stated that the Environment consultant M/s
Team Labs & Consultants Pvt Ltd. of this project study area covered 10 k.m radius around the proposed Project area, they studied locations of air ambient quality, noise levels recorded , water samples collected, soil samples also collected these all are in norms of CPCB. This is satisfactory
3. He requested consultant to take health states of village people in 10 km radius.
4. He requested to take Crop production details from near Agriculture lands also.
5. He stated that for operation of the project water requirement is 42.5 KLD. It is taking from ground water, in summer season chance to down fall water level hence requested to arrange rain water harvesting system.
6. He suggested to utilize waste water to plantation, sprinkling on roads. It controls Dust Pollution when your vehicles transport time.
Proponent stated that they will explore to conduct survey on health status in the village. Proponent stated that already they are having one tank with extent of 1.5 Acre for rain water collection which can be used as Rain Water Harvesting (RWH) system. He also stated that the suggestion for providing RWH system is welcoming and they will provide RWH system. Proponent informed that they have already planted some plants around the industry and they will take up further plantation in the vacant land. Proponent assured that they will provide training progammes to un employees and take up the trained persons in the proposed plant. Proponent stated that they will conduct health camps.
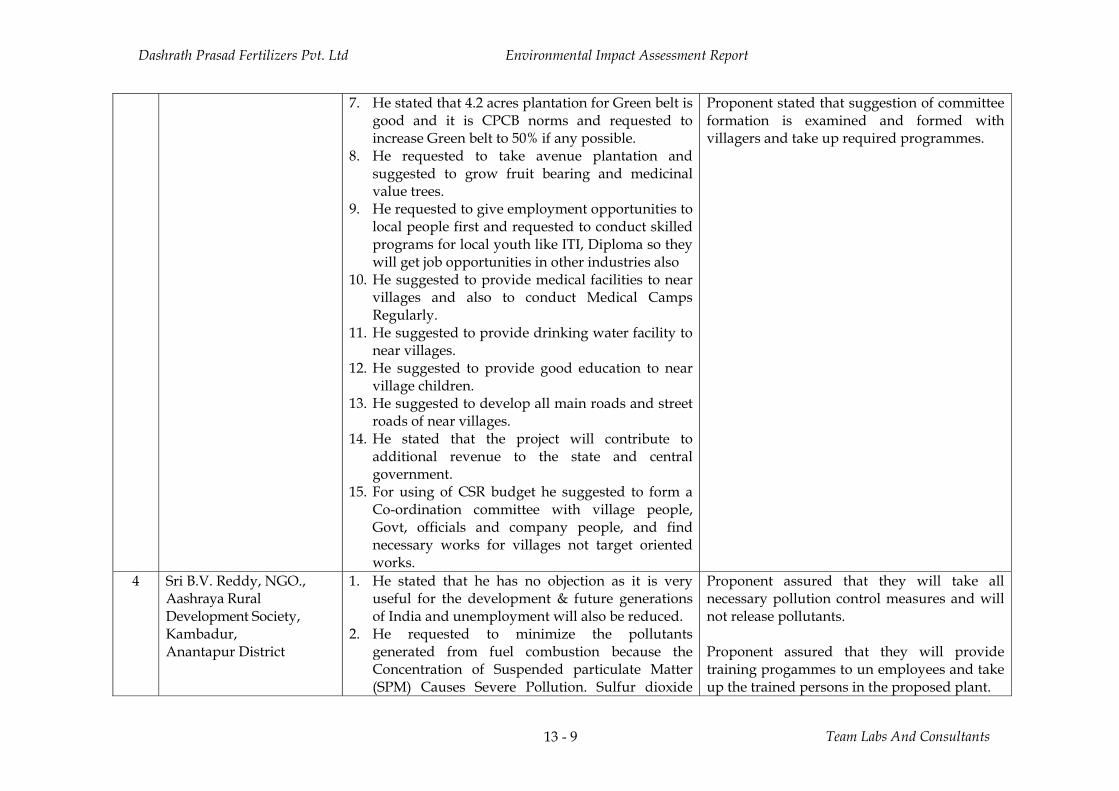
Dashrath Prasad Fertilizers Pvt. Ltd Environmental Impact Assessment Report
Team Labs And Consultants 13 - 9
7. He stated that 4.2 acres plantation for Green belt is good and it is CPCB norms and requested to increase Green belt to 50% if any possible.
8. He requested to take avenue plantation and suggested to grow fruit bearing and medicinal value trees.
9. He requested to give employment opportunities to local people first and requested to conduct skilled programs for local youth like ITI, Diploma so they will get job opportunities in other industries also
10. He suggested to provide medical facilities to near villages and also to conduct Medical Camps Regularly.
11. He suggested to provide drinking water facility to near villages.
12. He suggested to provide good education to near village children.
13. He suggested to develop all main roads and street roads of near villages.
14. He stated that the project will contribute to additional revenue to the state and central government.
15. For using of CSR budget he suggested to form a Co-ordination committee with village people, Govt, officials and company people, and find necessary works for villages not target oriented works.
Proponent stated that suggestion of committee formation is examined and formed with villagers and take up required programmes.
4 Sri B.V. Reddy, NGO., Aashraya Rural Development Society, Kambadur, Anantapur District
1. He stated that he has no objection as it is very useful for the development & future generations of India and unemployment will also be reduced.
2. He requested to minimize the pollutants generated from fuel combustion because the Concentration of Suspended particulate Matter (SPM) Causes Severe Pollution. Sulfur dioxide
Proponent assured that they will take all necessary pollution control measures and will not release pollutants. Proponent assured that they will provide training progammes to un employees and take up the trained persons in the proposed plant.
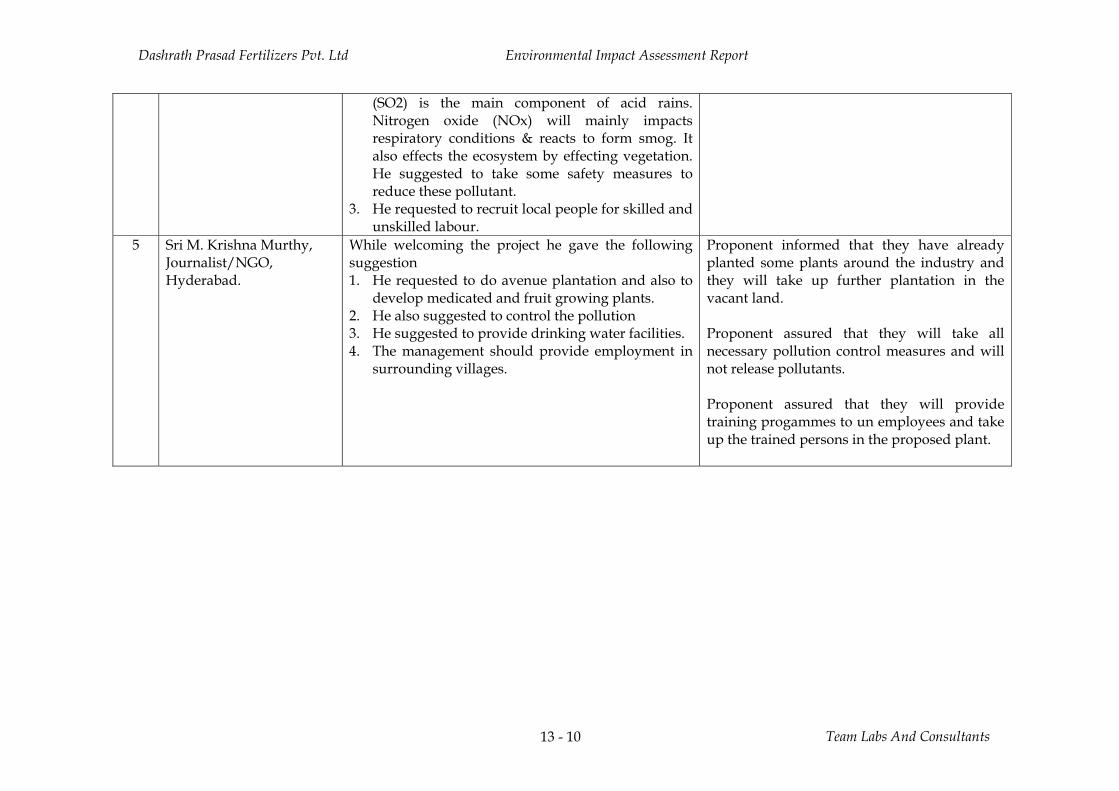
Dashrath Prasad Fertilizers Pvt. Ltd Environmental Impact Assessment Report
Team Labs And Consultants 13 - 10
(SO2) is the main component of acid rains. Nitrogen oxide (NOx) will mainly impacts respiratory conditions & reacts to form smog. It also effects the ecosystem by effecting vegetation. He suggested to take some safety measures to reduce these pollutant.
3. He requested to recruit local people for skilled and unskilled labour.
5 Sri M. Krishna Murthy, Journalist/NGO, Hyderabad.
While welcoming the project he gave the following suggestion 1. He requested to do avenue plantation and also to
develop medicated and fruit growing plants. 2. He also suggested to control the pollution 3. He suggested to provide drinking water facilities. 4. The management should provide employment in
surrounding villages.
Proponent informed that they have already planted some plants around the industry and they will take up further plantation in the vacant land. Proponent assured that they will take all necessary pollution control measures and will not release pollutants. Proponent assured that they will provide training progammes to un employees and take up the trained persons in the proposed plant.

Scanned by CamScanner
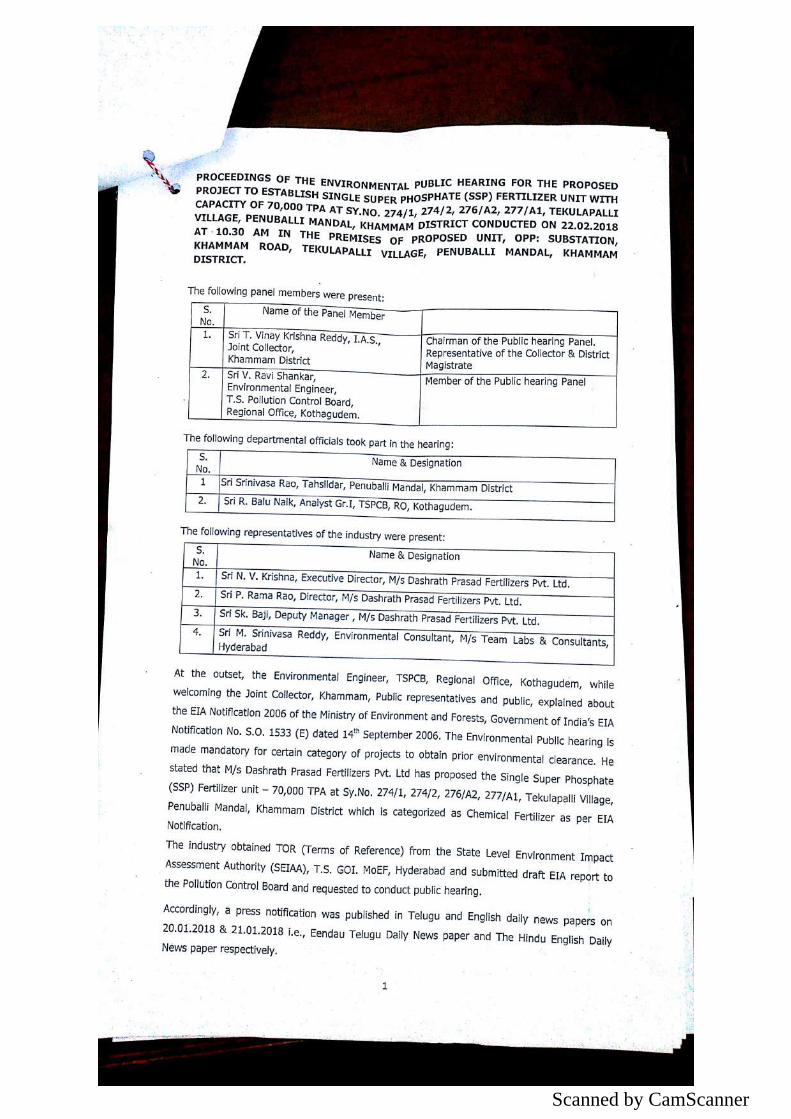
Scanned by CamScanner
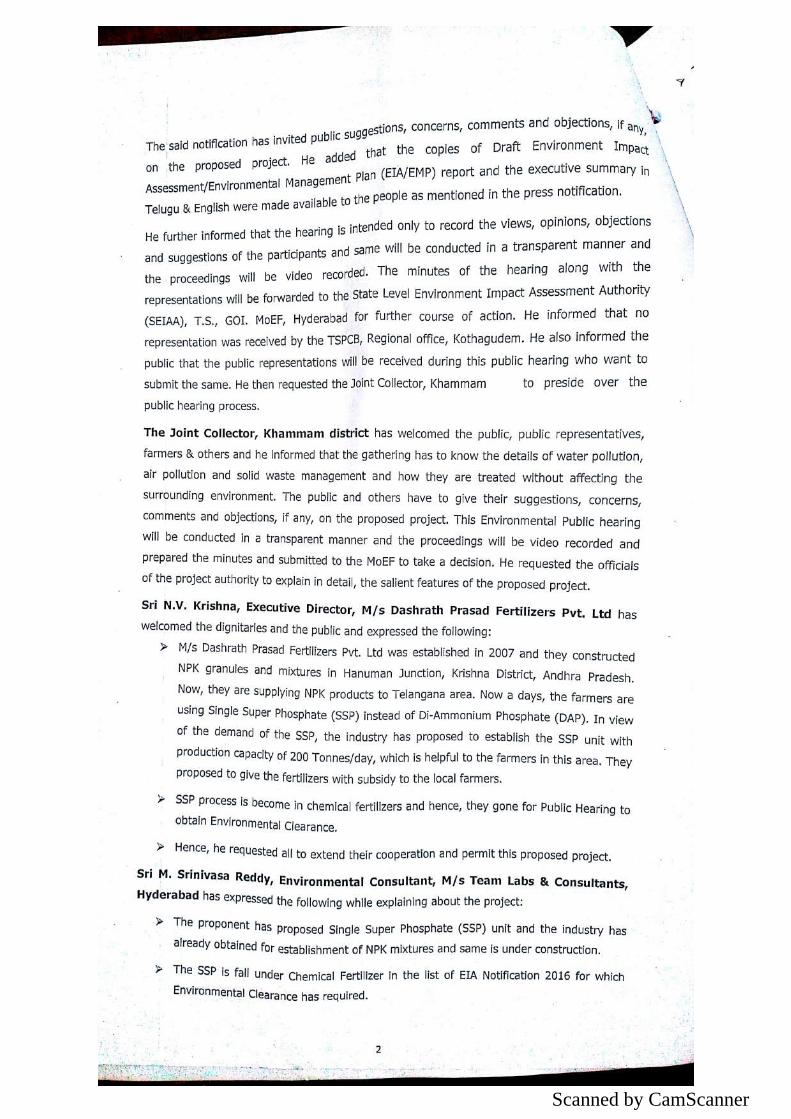
Scanned by CamScanner
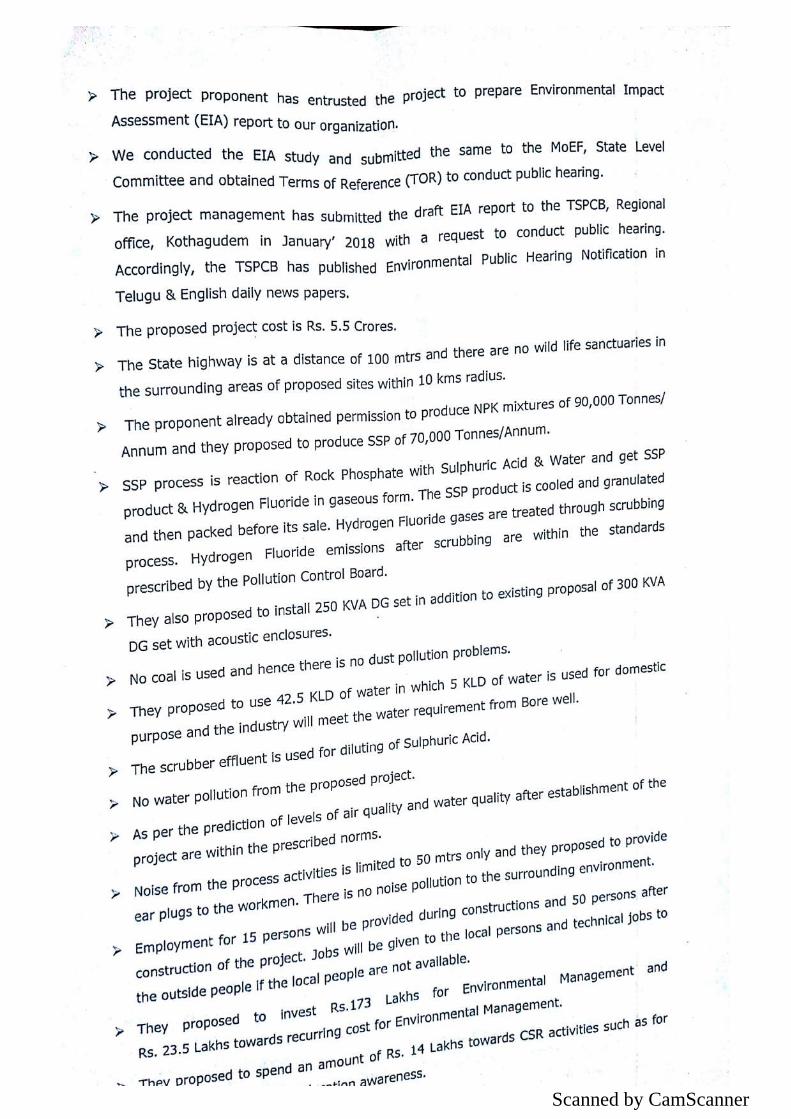
Scanned by CamScanner
Scanned by CamScanner
Scanned by CamScanner
Scanned by CamScanner
Scanned by CamScanner
Scanned by CamScanner
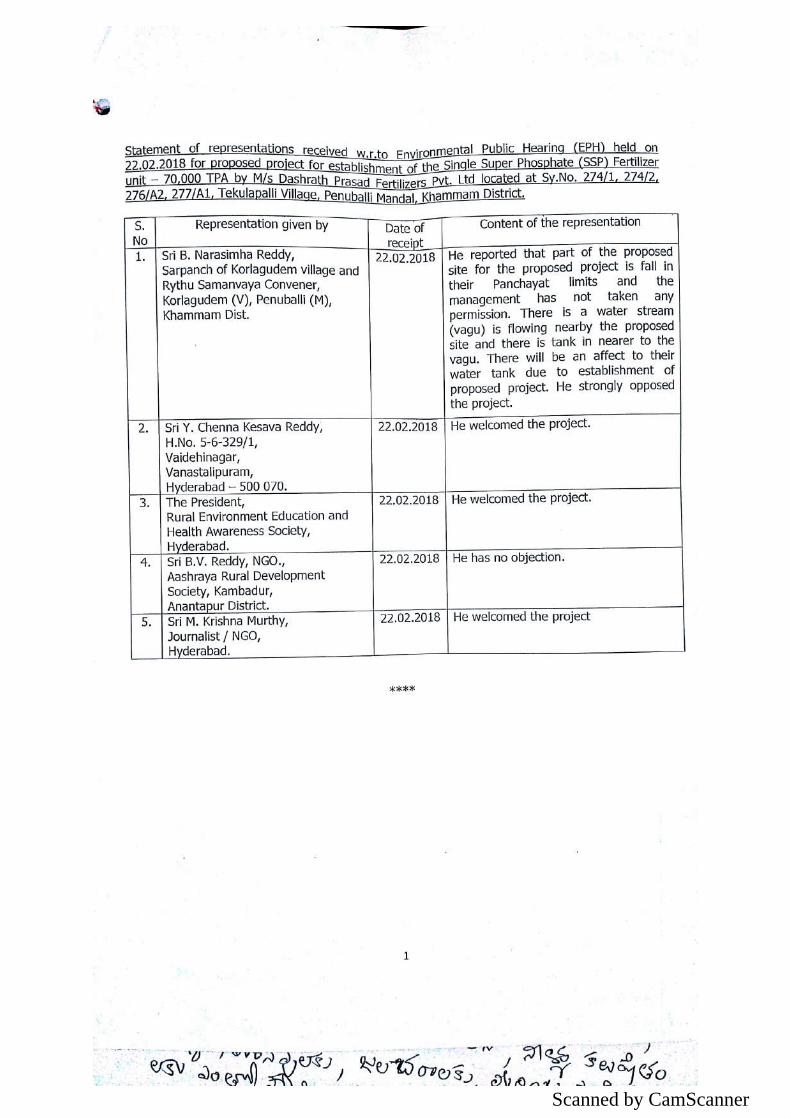
Scanned by CamScanner
Scanned by CamScanner
Scanned by CamScanner
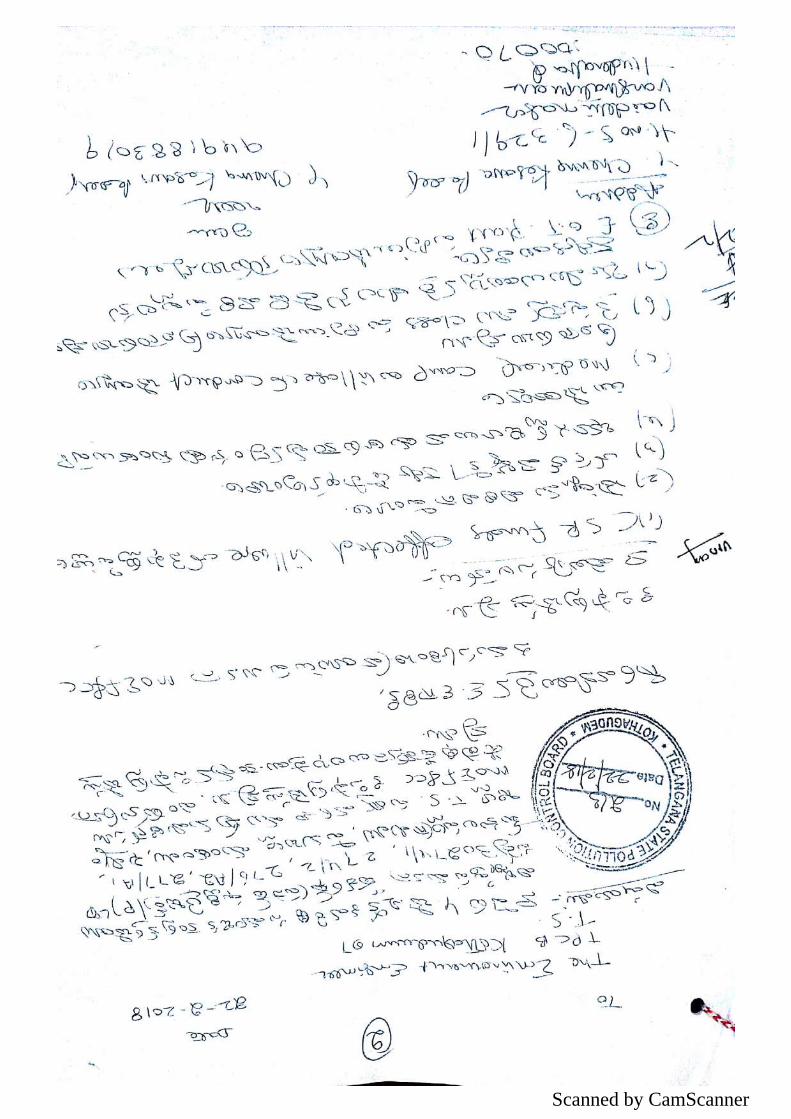
Scanned by CamScanner
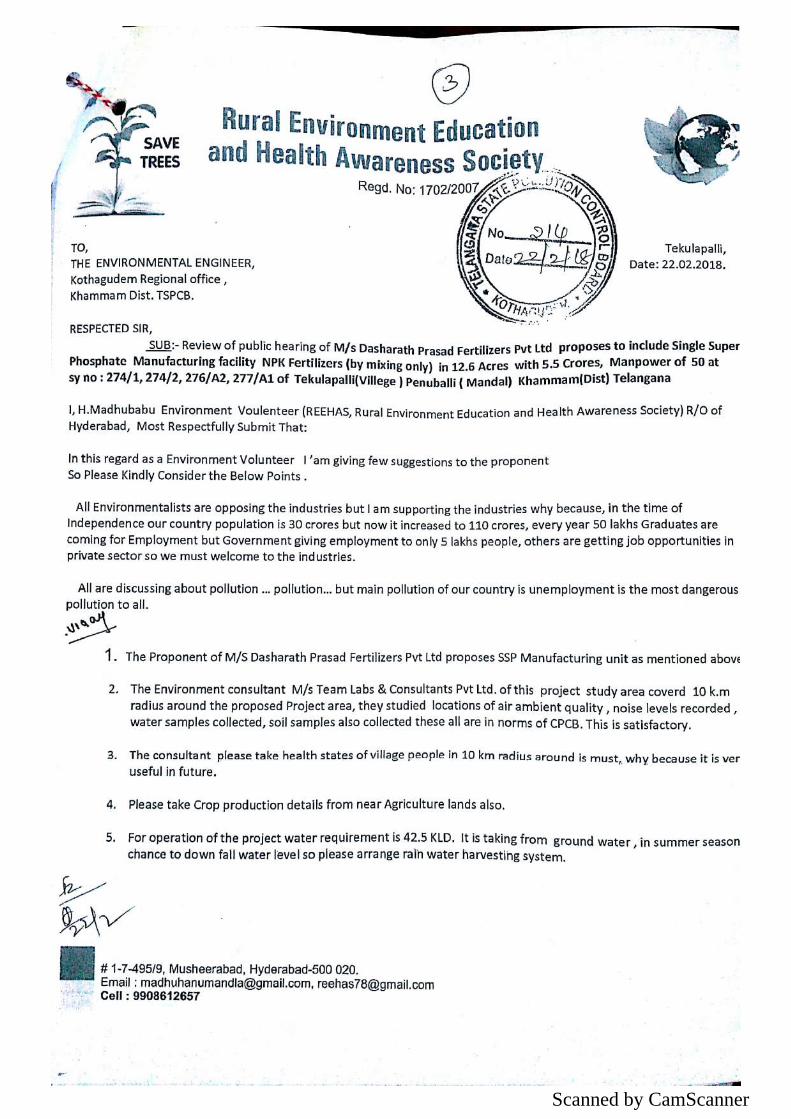
Scanned by CamScanner
Scanned by CamScanner
Scanned by CamScanner
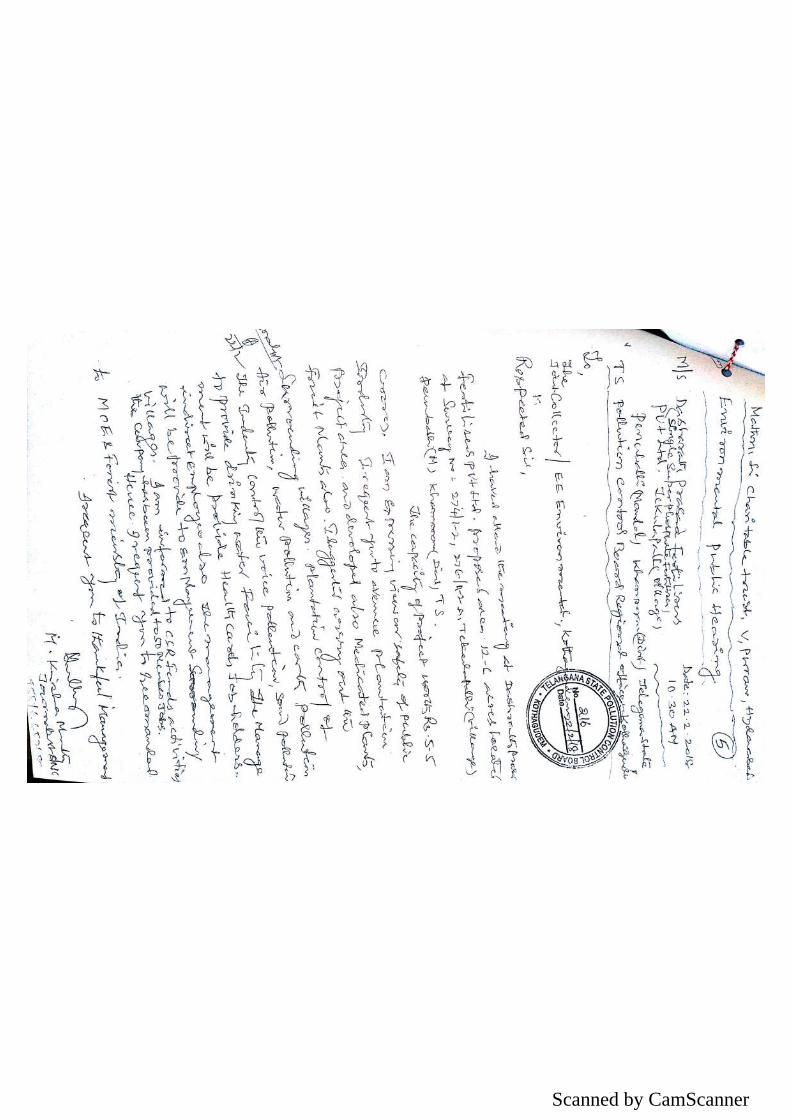
Scanned by CamScanner
Scanned by CamScanner
Scanned by CamScanner
DASHRATH PRASAD FERTILIZERS PVT. LTD. SY. NO. 274/1, 274/2, 276/A2, 277/A1, TEKULAPALLI VILLAGE, PENUBALLI MANDAL, KHAMMAM DISTRICT, TELANGANA
4. COMPLIANCE OF TERMS OF REFERENCE
Project No. 0318‐16‐01March 2018
Dashrath Prasad Fertilizers Pvt. Ltd. 274/1, 274/2, 276/A2, 277/A1, Tekulapalli Village, Penuballi Mandal, Khammam District, Telangana – 507 302 Phone: +91 95735 74455 E‐mail: [email protected]; [email protected]
STUDIES AND DOCUMENTATION BYTEAM Labs and Consultants B‐115‐117 & 509, Annapurna Block, Aditya Enclave, Ameerpet, Hyderabad‐500 038. Phone: 040‐23748 555/23748616, Telefax: 040‐23748666
SUBMITTED TO STATE LEVEL ENVIRONMENT IMPACT ASSESSMENT AUTHORITY,
TELANGANA, GOVERNMENT OF INDIA
151
STANDARD TERMS OF REFERENCE (TOR) FOR EIA/EMP REPORT FORPROJECTS/ACTIVITIES REQUIRING ENVIRONMENT CLEARANCE
5(a): STANDARD TERMS OF REFERENCE FOR CONDUCTINGENVIRONMENT IMPACT ASSESSMENT STUDY FOR CHEMICALFERTILIZERS AND INFORMATION TO BE INCLUDED IN EIA/EMPREPORT
A. STANDARD TERMS OF REFERENCE
1) Executive Summary
2) Introduction
i. Details of the EIA Consultant including NABET accreditation
ii. Information about the project proponent
iii. Importance and benefits of the project
3) Project Description
i. Cost of project and time of completion.
ii. Products with capacities for the proposed project.
iii. If expansion project, details of existing products with capacities and whether adequate landis available for expansion, reference of earlier EC if any.
iv. List of raw materials required and their source along with mode of transportation.
v. Other chemicals and materials required with quantities and storage capacities
vi. Details of Emission, effluents, hazardous waste generation and their management.
vii. Requirement of water, power, with source of supply, status of approval, water balance diagram,man-power requirement (regular and contract)
viii. Process description along with major equipments and machineries, process flow sheet(quantative) from raw material to products to be provided
ix. Hazard identification and details of proposed safety systems.
x. Expansion/modernization proposals:
a. Copy of all the Environmental Clearance(s) including Amendments thereto obtained forthe project from MOEF/SEIAA shall be attached as an Annexure. A certified copy of thelatest Monitoring Report of the Regional Office of the Ministry of Environment and Forestsas per circular dated 30th May, 2012 on the status of compliance of conditions stipulatedin all the existing environmental clearances including Amendments shall be provided. Inaddition, status of compliance of Consent to Operate for the ongoing Iexisting operationof the project from SPCB shall be attached with the EIA-EMP report.
b. In case the existing project has not obtained environmental clearance, reasons for nottaking EC under the provisions of the EIA Notification 1994 and/or EIA Notification
152
STANDARD TERMS OF REFERENCE (TOR) FOR EIA/EMP REPORT FOR PROJECTS/ACTIVITIES REQUIRING ENVIRONMENT CLEARANCE
2006 shall be provided. Copies of Consent to Establish/No Objection Certificate and Consentto Operate (in case of units operating prior to EIA Notification 2006, CTE and CTO of FY2005-2006) obtained from the SPCB shall be submitted. Further, compliance report to theconditions of consents from the SPCB shall be submitted.
4) Site Details
i. Location of the project site covering village, Taluka/Tehsil, District and State, Justification forselecting the site, whether other sites were considered.
ii. A toposheet of the study area of radius of 10km and site location on 1:50,000/1:25,000 scale onan A3/A2 sheet. (including all eco-sensitive areas and environmentally sensitive places)
iii. Details w.r.t. option analysis for selection of site
iv. Co-ordinates (lat-long) of all four corners of the site.
v. Google map-Earth downloaded of the project site.
vi. Layout maps indicating existing unit as well as proposed unit indicating storage area, plantarea, greenbelt area, utilities etc. If located within an Industrial area/Estate/Complex, layoutof Industrial Area indicating location of unit within the Industrial area/Estate.
vii. Photographs of the proposed and existing (if applicable) plant site. If existing, showphotographs of plantation/greenbelt, in particular.
viii. Landuse break-up of total land of the project site (identified and acquired), government/private - agricultural, forest, wasteland, water bodies, settlements, etc shall be included. (notrequired for industrial area)
ix. A list of major industries with name and type within study area (10km radius) shall beincorporated. Land use details of the study area
x. Geological features and Geo-hydrological status of the study area shall be included.
xi. Details of Drainage of the project upto 5km radius of study area. If the site is within 1 kmradius of any major river, peak and lean season river discharge as well as flood occurrencefrequency based on peak rainfall data of the past 30 years. Details of Flood Level of theproject site and maximum Flood Level of the river shall also be provided. (mega green fieldprojects)
xii. Status of acquisition of land. If acquisition is not complete, stage of the acquisition processand expected time of complete possession of the land.
xiii. R&R details in respect of land in line with state Government policy.
5) Forest and wildlife related issues (if applicable):
i. Permission and approval for the use of forest land (forestry clearance), if any, andrecommendations of the State Forest Department. (if applicable)
ii. Landuse map based on High resolution satellite imagery (GPS) of the proposed site delineatingthe forestland (in case of projects involving forest land more than 40 ha)
153
STANDARD TERMS OF REFERENCE (TOR) FOR EIA/EMP REPORT FORPROJECTS/ACTIVITIES REQUIRING ENVIRONMENT CLEARANCE
iii. Status of Application submitted for obtaining the stage I forestry clearance along with lateststatus shall be submitted.
iv. The projects to be located within 10 km of the National Parks, Sanctuaries, Biosphere Reserves,Migratory Corridors of Wild Animals, the project proponent shall submit the map dulyauthenticated by Chief Wildlife Warden showing these features vis-à-vis the project locationand the recommendations or comments of the Chief Wildlife Warden-thereon.
v. Wildlife Conservation Plan duly authenticated by the Chief Wildlife Warden of the StateGovernment for conservation of Schedule I fauna, if any exists in the study area.
vi. Copy of application submitted for clearance under the Wildlife (Protection) Act, 1972, to theStanding Committee of the National Board for Wildlife.
6) Environmental Status
i. Determination of atmospheric inversion level at the project site and site-specific micro-meteorological data using temperature, relative humidity, hourly wind speed and directionand rainfall.
ii. AAQ data (except monsoon) at 8 locations for PM10, PM2.5, SO2, NOX, CO and otherparameters relevant to the project shall be collected. The monitoring stations shall be basedCPCB guidelines and take into account the pre-dominant wind direction, population zoneand sensitive receptors including reserved forests.
iii. Raw data of all AAQ measurement for 12 weeks of all stations as per frequency given in theNAQQM Notification of Nov. 2009 along with - min., max., average and 98% values foreach of the AAQ parameters from data of all AAQ stations should be provided as an annexureto the EIA Report.
iv. Surface water quality of nearby River (100m upstream and downstream of discharge point)and other surface drains at eight locations as per CPCB/MoEF&CC guidelines.
v. Whether the site falls near to polluted stretch of river identified by the CPCB/MoEF&CC, ifyes give details.
vi. Ground water monitoring at minimum at 8 locations shall be included.
vii. Noise levels monitoring at 8 locations within the study area.
viii. Soil Characteristic as per CPCB guidelines.
ix. Traffic study of the area, type of vehicles, frequency of vehicles for transportation of materials,additional traffic due to proposed project, parking arrangement etc.
x. Detailed description of flora and fauna (terrestrial and aquatic) existing in the study areashall be given with special reference to rare, endemic and endangered species. If Schedule-I fauna are found within the study area, a Wildlife Conservation Plan shall be prepared andfurnished.
xi. Socio-economic status of the study area.
154
STANDARD TERMS OF REFERENCE (TOR) FOR EIA/EMP REPORT FOR PROJECTS/ACTIVITIES REQUIRING ENVIRONMENT CLEARANCE
7) Impact and Environment Management Plan
i. Assessment of ground level concentration of pollutants from the stack emission based onsite-specific meteorological features. In case the project is located on a hilly terrain, theAQIP Modelling shall be done using inputs of the specific terrain characteristics fordetermining the potential impacts of the project on the AAQ. Cumulative impact of all sourcesof emissions (including transportation) on the AAQ of the area shall be assessed. Details ofthe model used and the input data used for modelling shall also be provided. The air qualitycontours shall be plotted on a location map showing the location of project site, habitationnearby, sensitive receptors, if any.
ii. Water Quality modelling - in case of discharge in water body
iii. Impact of the transport of the raw materials and end products on the surrounding environmentshall be assessed and provided. In this regard, options for transport of raw materials andfinished products and wastes (large quantities) by rail or rail-cum road transport or conveyor-cum-rail transport shall be examined.
iv. A note on treatment of wastewater from different plant operations, extent recycled and reusedfor different purposes shall be included. Complete scheme of effluent treatment. Characteristicsof untreated and treated effluent to meet the prescribed standards of discharge under E(P)Rules.
v. Details of stack emission and action plan for control of emissions to meet standards.
vi. Measures for fugitive emission control
vii. Details of hazardous waste generation and their storage, utilization and management. Copiesof MOU regarding utilization of solid and hazardous waste in cement plant shall also beincluded. EMP shall include the concept of waste-minimization, recycle/reuse/recovertechniques, Energy conservation, and natural resource conservation.
viii. Proper utilization of fly ash shall be ensured as per Fly Ash Notification, 2009. A detailedplan of action shall be provided.
ix. Action plan for the green belt development plan in 33 % area i.e. land with not less than1,500 trees per ha. Giving details of species, width of plantation, planning schedule etc. shallbe included. The green belt shall be around the project boundary and a scheme for greeningof the roads used for the project shall also be incorporated.
x. Action plan for rainwater harvesting measures at plant site shall be submitted to harvestrainwater from the roof tops and storm water drains to recharge the ground water and also touse for the various activities at the project site to conserve fresh water and reduce the waterrequirement from other sources.
xi. Total capital cost and recurring cost/annum for environmental pollution control measuresshall be included.
xii. Action plan for post-project environmental monitoring shall be submitted.
155
STANDARD TERMS OF REFERENCE (TOR) FOR EIA/EMP REPORT FORPROJECTS/ACTIVITIES REQUIRING ENVIRONMENT CLEARANCE
xiii. Onsite and Offsite Disaster (natural and Man-made) Preparedness and EmergencyManagement Plan including Risk Assessment and damage control. Disaster managementplan should be linked with District Disaster Management Plan.
8) Occupational health
i. Plan and fund allocation to ensure the occupational health & safety of all contract and casualworkers
ii. Details of exposure specific health status evaluation of worker. If the workers' health is beingevaluated by pre designed format, chest x rays, Audiometry, Spirometry, Vision testing (Far& Near vision, colour vision and any other ocular defect) ECG, during pre placement andperiodical examinations give the details of the same. Details regarding last month analyzeddata of above mentioned parameters as per age, sex, duration of exposure and departmentwise.
iii. Details of existing Occupational & Safety Hazards. What are the exposure levels of hazardsand whether they are within Permissible Exposure level (PEL). If these are not within PEL,what measures the company has adopted to keep them within PEL so that health of the workerscan be preserved,
iv. Annual report of heath status of workers with special reference to Occupational Health andSafety.
9) Corporate Environment Policy
i. Does the company have a well laid down Environment Policy approved by its Board ofDirectors? If so, it may be detailed in the EIA report.
ii. Does the Environment Policy prescribe for standard operating process / procedures to bringinto focus any infringement / deviation / violation of the environmental or forest norms /conditions? If so, it may be detailed in the EIA.
iii. What is the hierarchical system or Administrative order of the company to deal with theenvironmental issues and for ensuring compliance with the environmental clearanceconditions? Details of this system may be given.
iv. Does the company have system of reporting of non compliances / violations of environmentalnorms to the Board of Directors of the company and / or shareholders or stakeholders atlarge? This reporting mechanism shall be detailed in the EIA report.
10) Details regarding infrastructure facilities such as sanitation, fuel, restroom etc. to be provided to thelabour force during construction as well as to the casual workers including truck drivers duringoperation phase.
11) Enterprise Social Commitment (ESC)
i. Adequate funds (at least 2.5 % of the project cost) shall be earmarked towards the EnterpriseSocial Commitment based on Public Hearing issues and item-wise details along with time
156
STANDARD TERMS OF REFERENCE (TOR) FOR EIA/EMP REPORT FOR PROJECTS/ACTIVITIES REQUIRING ENVIRONMENT CLEARANCE
bound action plan shall be included. Socio-economic development activities need to be elaboratedupon.
12) Any litigation pending against the project and/or any direction/order passed by any Court of Lawagainst the project, if so, details thereof shall also be included. Has the unit received any noticeunder the Section 5 of Environment (Protection) Act, 1986 or relevant Sections of Air and WaterActs? If so, details thereof and compliance/ATR to the notice(s) and present status of the case.
13) A tabular chart with index for point wise compliance of above TOR.
B. SPECIFIC TERMS OF REFERENCE FOR EIA STUDIES FOR CHEMICALFERTILIZER
1. Details on requirement of energy and water alongwith its source and authorization from theconcerned department.
2. Energy conservation in ammonia synthesis for urea production and comparison with besttechnology.
3. Details of ammonia storage and risk assessment thereof.
4. Measures for control of urea dust emissions from prilling tower.
5. Measures for reduction of fresh water requirement.
6. Details of proposed source-specific pollution control schemes and equipments to meet thenational standards for fertilizer.
7. Details of fluorine recovery system in case of phosphoric acid plants and SSP to recoverfluorine as hydrofluorosilicicacid (H2SiF6) and its uses.
8. Management plan for solid/hazardous waste including storage, utilization and disposal ofbye products viz., chalk, spent catalyst, hydro fluoro silicic acid and phosphor gypsum, sulphurmuck,etc.
9. Details on existing ambient air quality for PM10, PM2.5, Urea dust*, NH3*, SO2*,NOx*,HF*,F*,Hydrocarbon ( Methane and Non-Methane) etc., and expected, stack andfugitive emissions and evaluation of the adequacy of the proposed pollution control devicesto meet standards for point sources and to meet AAQ standards.(*as applicable)
10. Details on water quality parameters in and around study area such as pH, Total KjeldhalNitrogen, Free Ammonical Nitrogen, free ammonia, Cyanide, Vanadium, Arsenic, SuspendedSolids, Oil and Grease, *Cr as Cr+6, *Total Chromium, Fluoride, etc.
***
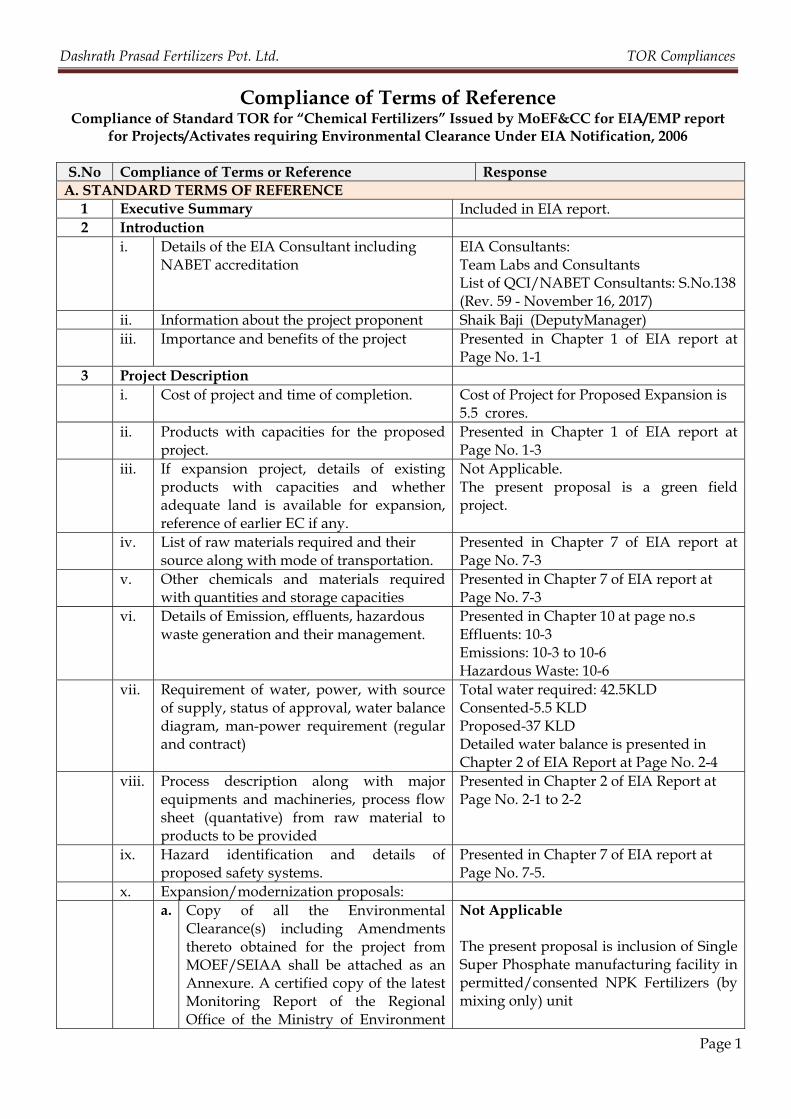
Dashrath Prasad Fertilizers Pvt. Ltd. TOR Compliances
Page 1
Compliance of Terms of Reference Compliance of Standard TOR for “Chemical Fertilizers” Issued by MoEF&CC for EIA/EMP report
for Projects/Activates requiring Environmental Clearance Under EIA Notification, 2006
S.No Compliance of Terms or Reference Response A. STANDARD TERMS OF REFERENCE
1 Executive Summary Included in EIA report. 2 Introduction i. Details of the EIA Consultant including
NABET accreditation EIA Consultants: Team Labs and Consultants List of QCI/NABET Consultants: S.No.138 (Rev. 59 - November 16, 2017)
ii. Information about the project proponent Shaik Baji (DeputyManager) iii. Importance and benefits of the project Presented in Chapter 1 of EIA report at
Page No. 1-1 3 Project Description i. Cost of project and time of completion. Cost of Project for Proposed Expansion is
5.5 crores. ii. Products with capacities for the proposed
project. Presented in Chapter 1 of EIA report at Page No. 1-3
iii. If expansion project, details of existing products with capacities and whether adequate land is available for expansion, reference of earlier EC if any.
Not Applicable. The present proposal is a green field project.
iv. List of raw materials required and their source along with mode of transportation.
Presented in Chapter 7 of EIA report at Page No. 7-3
v. Other chemicals and materials required with quantities and storage capacities
Presented in Chapter 7 of EIA report at Page No. 7-3
vi. Details of Emission, effluents, hazardous waste generation and their management.
Presented in Chapter 10 at page no.s Effluents: 10-3 Emissions: 10-3 to 10-6 Hazardous Waste: 10-6
vii. Requirement of water, power, with source of supply, status of approval, water balance diagram, man-power requirement (regular and contract)
Total water required: 42.5KLD Consented-5.5 KLD Proposed-37 KLD Detailed water balance is presented in Chapter 2 of EIA Report at Page No. 2-4
viii. Process description along with major equipments and machineries, process flow sheet (quantative) from raw material to products to be provided
Presented in Chapter 2 of EIA Report at Page No. 2-1 to 2-2
ix. Hazard identification and details of proposed safety systems.
Presented in Chapter 7 of EIA report at Page No. 7-5.
x. Expansion/modernization proposals: a. Copy of all the Environmental
Clearance(s) including Amendments thereto obtained for the project from MOEF/SEIAA shall be attached as an Annexure. A certified copy of the latest Monitoring Report of the Regional Office of the Ministry of Environment
Not Applicable The present proposal is inclusion of Single Super Phosphate manufacturing facility in permitted/consented NPK Fertilizers (by mixing only) unit
Dashrath Prasad Fertilizers Pvt. Ltd. TOR Compliances
Page 2
and Forests as per circular dated 30th May, 2012 on the status of compliance of conditions stipulated in all the existing environmental clearances including Amendments shall be provided. In addition, status of compliance of Consent to Operate for the ongoing existing operation of the project from SPCB shall be attached with the EIA-EMP report.
b. In case the existing project has not obtained environmental clearance, reasons for not taking EC under the provisions of the EIA Notification 1994 and/or EIA Notification 2006 shall be provided. Copies of Consent to Establish/No Objection Certificate and Consent to Operate (in case of units operating prior to EIA Notification 2006, CTE and CTO of FY 2005-2006) obtained from the SPCB shall be submitted. Further, compliance report to the conditions of consents from the SPCB shall be submitted.
Not Applicable The present proposal is inclusion of Single Super Phosphate manufacturing facility in permitted/consented NPK Fertilizers (by mixing only) unit
4 Site Details i. Location of the project site covering village,
Taluka/Tehsil, District and State, Justification for selecting the site, whether other sites were considered.
M/s. Dashrath Prasad Fertilizers Pvt. Ltd. Survey No. 274/1, 274/2, 276/A2, 277/A1, Tekulapalli Village, Vijayarai Panchayath, Penuballi Mandal, Khammam District, Telangana Total land area: 12.6 acres.
ii. A topo sheet of the study area of radius of 10km and site location on 1:50,000/1:25,000 scale on an A3/A2 sheet. (including all eco-sensitive areas and environmentally sensitive places)
Presented in Chapter 1 of EIA report at Page No. 1-5.
iii. Details w.r.t. option analysis for selection of site
Presented in Chapter 5 of EIA report at Page No. 5-1.
iv. Co-ordinates (lat-long) of all four corners of the site.
S.No Latitude Longitude 1 17O11’49.39” 80O 36’25.22” 2 17O11’48.70” 80O 36’35.15” 3 17O11’53.04” 80O 36’35.17” 4 17O11’55.26” 80O 36’28.82” 5 17O11’51.04” 80O 36’27.09” 6 17O11’50.35” 80O 36’25.33”
v. Google map-Earth downloaded of the project site.
Enclosed at Annexure - I
vi. Layout maps indicating existing unit as well as proposed unit indicating storage area, plant area, greenbelt area, utilities etc. If located within an Industrial
Plant layout is presented in Chapter 1 of EIA report at Page No. 1-4
Dashrath Prasad Fertilizers Pvt. Ltd. TOR Compliances
Page 3
area/Estate/Complex, layout of Industrial Area indicating location of unit within the Industrial area/Estate.
vii. Photographs of the proposed and existing (if applicable) plant site. If existing, show Photographs of plantation/greenbelt, in particular.
Photographs of Plant site is presented in Chapter 3 of EIA report at Page No. 3-2
viii. Land use break-up of total land of the project site (identified and acquired), government/private - agricultural, forest, wasteland, water bodies, settlements, etc shall be included. (not required for industrial area)
The total site area is 12.6 acres (Already acquired)
ix. A list of major industries with name and type within study area (10km radius) shall be Incorporated. Land use details of the study area
No Major industries within 10km radius. Land use and Land Cover map of the study area is presented in Chapter 3 of EIA report at Page No. 3-9.
x. Geological features and Geo-hydrological status of the study area shall be included.
Presented in Chapter 3 of EIA report at Page No. 3-4 to 3-7
xi. Details of Drainage of the project upto 5km radius of study area. If the site is within 1 km radius of any major river, peak and lean season river discharge as well as flood occurrence Frequency based on peak rainfall data of the past 30 years. Details of Flood Level of the Project site and maximum Flood Level of the river shall also be provided. (mega green field projects)
Drainage pattern of the impact area is presented in Chapter 3 of EIA report at Page No. 3-16
xii. Status of acquisition of land. If acquisition is not complete, stage of the acquisition process and expected time of complete possession of the land.
The total site area is 12.6 acres (Already acquired)
xiii. R&R details in respect of land in line with state Government policy.
Not Applicable. The total site area is 12.6 acres only.
5 Forest and wildlife related issues (if applicable): i. Permission and approval for the use of
forest land (forestry clearance), if any, and recommendations of the State Forest Department. (if applicable)
Not Applicable
ii. Land use map based on High resolution satellite imagery (GPS) of the proposed site delineating the forestland (in case of projects involving forest land more than 40 ha)
Land use and Land Cover map of the study area is presented in Chapter 3 of EIA report at Page No. 3-9
iii. Status of Application submitted for obtaining the stage I forestry clearance along with latest status shall be submitted.
Not Applicable
iv. The projects to be located within 10 km of the National Parks, Sanctuaries, Biosphere
There are no National Parks, Sanctuaries, Biosphere Reserves, Migratory Corridors
Dashrath Prasad Fertilizers Pvt. Ltd. TOR Compliances
Page 4
Reserves, Migratory Corridors of Wild Animals, the project proponent shall submit the map duly authenticated by Chief Wildlife Warden showing these features vis-à-vis the project location and the recommendations or comments of the Chief Wildlife Warden-thereon.
of Wild Animals within the impact area of 10 km.
v. Wildlife Conservation Plan duly authenticated by the Chief Wildlife Warden of the State Government for conservation of Schedule I fauna, if any exists in the study area.
Not Applicable
vi. Copy of application submitted for clearance under the Wildlife (Protection) Act, 1972, to the Standing Committee of the National Board for Wildlife.
Not Applicable
6 Environmental Status i. Determination of atmospheric inversion
level at the project site and site-specific micrometeorological data using temperature, relative humidity, hourly wind speed and direction and rainfall.
Site-specific micrometeorological data presented in Chapter 3 of EIA report at Page No. 3-19 to 3-24
ii. AAQ data (except monsoon) at 8 locations for PM10, PM2.5, SO2, NOX, CO and other parameters relevant to the project shall be collected. The monitoring stations shall be based CPCB guidelines and take into account the pre-dominant wind direction, population zone and sensitive receptors including reserved forests.
AAQ data presented in Chapter 3 of EIA report at Page No. 3-27 to 3-28
iii. Raw data of all AAQ measurement for 12 weeks of all stations as per frequency given in the NAQQM Notification of Nov. 2009 along with - min., max., average and 98% values for each of the AAQ parameters from data of all AAQ stations should be provided as an annexure to the EIA Report.
Data of all AAQ stations is presented in Chapter 3 of EIA report at Page No. 3-29 and 3-30
iv. Surface water quality of nearby River (100m upstream and downstream of discharge point) and other surface drains at eight locations as per CPCB/MoEF&CC guidelines.
Surface water analysis is presented in Chapter 3 of EIA report at Page No. 3-14
v. Whether the site falls near to polluted stretch of river identified by the CPCB/MoEF&CC, if yes give details.
No.
vi. Ground water monitoring at minimum at 8 locations shall be included.
Ground Monitoring locations presented in Chapter 3 of EIA report at Page No. 3-15 to 3-18.
vii. Noise levels monitoring at 8 locations within the study area.
Noise levels monitoring is presented in Chapter 3 of EIA report at Page No. 3-33
viii. Soil Characteristic as per CPCB guidelines. Soil Characteristics is presented in Chapter

Dashrath Prasad Fertilizers Pvt. Ltd. TOR Compliances
Page 5
3 of EIA report at Page No. 3-11 ix. Traffic study of the area, type of vehicles,
frequency of vehicles for transportation of materials, additional traffic due to proposed project, parking arrangement etc.
The additional traffic generated due to the proposed expansion shall be 25-30 truck trips per day.
x. Detailed description of flora and fauna (terrestrial and aquatic) existing in the study area shall be given with special reference to rare, endemic and endangered species. If Schedule-I fauna are found within the study area, a Wildlife Conservation Plan shall be prepared and furnished.
Flora and Fauna of the Impact area is presented in Chapter 3 of EIA report at Page No. 3-43 to 3-53
xi. Socio-economic status of the study area. Socio-Economic status of the impact area is presented in Chapter 3 of EIA report at Page No. 3-35 to 3-41.
7 Impact and Environment Management Plan i. Assessment of ground level concentration
of pollutants from the stack emission based on site-specific meteorological features. In case the project is located on a hilly terrain, the AQIP Modelling shall be done using inputs of the specific terrain characteristics for determining the potential impacts of the project on the AAQ. Cumulative impact of all sources of emissions (including transportation) on the AAQ of the area shall be assessed. Details of the model used and the input data used for modelling shall also be provided. The air quality contours shall be plotted on a location map showing the location of project site, habitation nearby, sensitive receptors, if any.
Predictions of ground level concentrations using ISC-AERMOD using ISCST3 model is of the pollutants presented in Chapter 4 of EIA report at Page No. 4-12 to 4-21. There will be 25-30 truck trips per day after expansion. Emissions considered from transport of vehicles as line source.
ii. Water Quality modelling - in case of discharge in water body
Not applicable No wastewater is generated from SSP manufacturing process. Total effluent generated and Mode of treatment is presented in Chapter 10 of EIA report Page No. 10-3
iii. Impact of the transport of the raw materials and end products on the surrounding environment shall be assessed and provided. In this regard, options for transport of raw materials and finished products and wastes (large quantities) by rail or rail-cum road transport or conveyor cum- rail transport shall be examined.
There will be 25 - 30 truck trips per day. Truck transport Incidents and concerns are presented in Chapter 7 of EIA report at Page No. 7-16.
iv. A note on treatment of wastewater from different plant operations, extent recycled and reused for different purposes shall be included. Complete scheme of effluent treatment. Characteristics of untreated and
Quantity, quality of effluent generated from different operation is presented in Chapter 10 Chapter 10 of EIA report at Page No. 10-3.
Dashrath Prasad Fertilizers Pvt. Ltd. TOR Compliances
Page 6
treated effluent to meet the prescribed standards of discharge under E (P) Rules.
v. Details of stack emission and action plan for control of emissions to meet standards.
Presented in Chapter 10 Chapter 10 of EIA report at Page No. 10-4.
vi. Measures for fugitive emission control Presented in Chapter 10 of EIA report at Page No. 10-6.
vii. Details of hazardous waste generation and their storage, utilization and management. Copies of MOU regarding utilization of solid and hazardous waste in cement plant shall also be included. EMP shall include the concept of waste-minimization, recycle/reuse/recover Techniques, Energy conservation, and natural resource conservation.
Presented in Chapter 10 of EIA report at Page No. 10-6. Reduce, reuse and recycled concept is presented in waste-minimization, Energy conservation is presented in Chapter 10 of EIA report at Page No. 10-9
viii. Proper utilization of fly ash shall be ensured as per Fly Ash Notification, 2009. A detailed plan of action shall be provided.
Ash generated from Hot Air Oven from NPK Unit is 1.5 TPD and same sold to brick manufactures.
ix. Action plan for the green belt development plan in 33 % area i.e. land with not less than 1,500 trees per ha. Giving details of species, width of plantation, planning schedule etc. shall be included. The green belt shall be around the project boundary and a scheme for greening of the roads used for the project shall also be incorporated.
Green belt are proposed to be developed is 4.2 acres. Layout showing green belt development is presented in Chapter 10 at Page No. 10-11.
x. Action plan for rainwater harvesting measures at plant site shall be submitted to harvest rainwater from the roof tops and storm water drains to recharge the ground water and also to use for the various activities at the project site to conserve fresh water and reduce the water requirement from other sources.
Presented in Chapter 10 of EIA report at Page No. 10-7.
xi. Total capital cost and recurring cost/annum for environmental pollution control measures shall be included.
Total Capital Cost: Rs. 5.5 crores EMP Cost estimate: Rs. 178 Lakhs Recurring Cost on EMP: Rs. 26.2 Laksh/annum. Details are presented in Chapter 10 at Page no. 10-13
xii. Action plan for post-project environmental monitoring shall be submitted.
Presented in Chapter 6 of EIA report at Page No. 6-8.
xiii. Onsite and Offsite Disaster (natural and Man-made) Preparedness and Emergency Management Plan including Risk Assessment and damage control. Disaster management plan should be linked with District Disaster Management Plan.
Disaster Management Plan is presented in Chapter 7 of EIA report at Page No.7-10.
Onsite and Offsite Disaster is presented in Chapter 7 of EIA report at Page No.7-11.
8 Occupational Health i. Plan and fund allocation to ensure the
occupational health & safety of all contract Total: 3.8 Lakhs/annum PPE: 2.6 Lakhs/annum
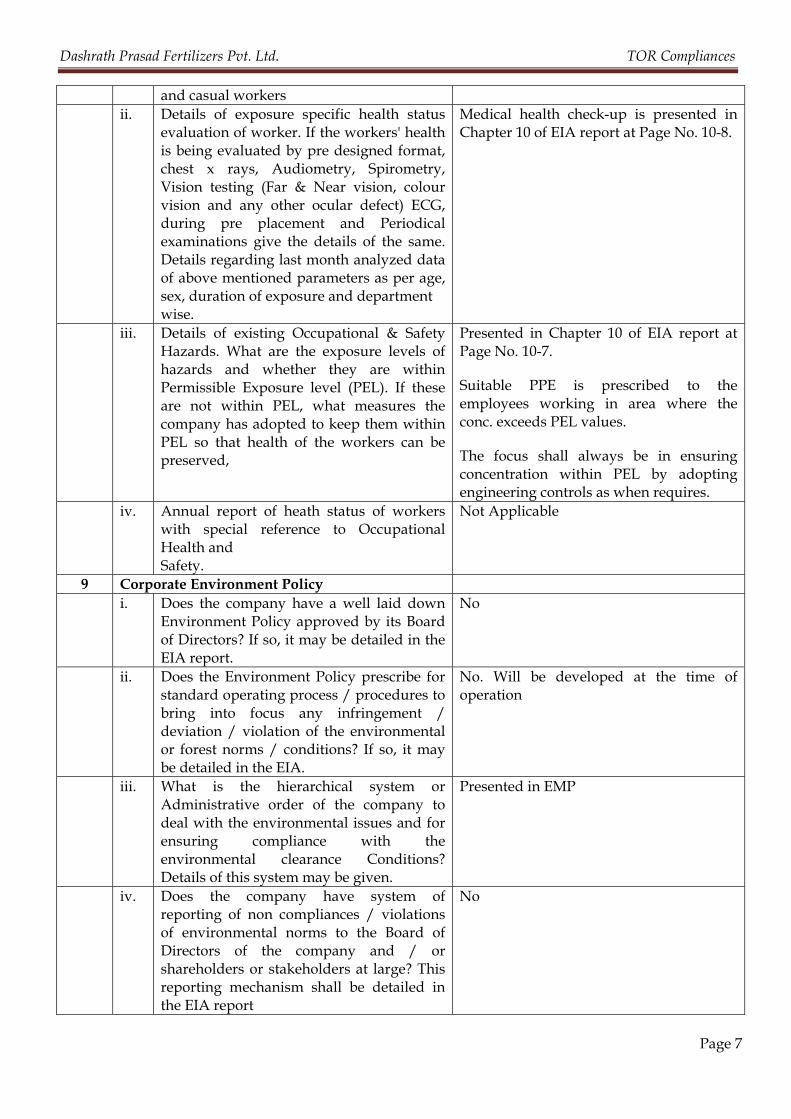
Dashrath Prasad Fertilizers Pvt. Ltd. TOR Compliances
Page 7
and casual workers ii. Details of exposure specific health status
evaluation of worker. If the workers' health is being evaluated by pre designed format, chest x rays, Audiometry, Spirometry, Vision testing (Far & Near vision, colour vision and any other ocular defect) ECG, during pre placement and Periodical examinations give the details of the same. Details regarding last month analyzed data of above mentioned parameters as per age, sex, duration of exposure and department wise.
Medical health check-up is presented in Chapter 10 of EIA report at Page No. 10-8.
iii. Details of existing Occupational & Safety Hazards. What are the exposure levels of hazards and whether they are within Permissible Exposure level (PEL). If these are not within PEL, what measures the company has adopted to keep them within PEL so that health of the workers can be preserved,
Presented in Chapter 10 of EIA report at Page No. 10-7.
Suitable PPE is prescribed to the employees working in area where the conc. exceeds PEL values.
The focus shall always be in ensuring concentration within PEL by adopting engineering controls as when requires.
iv. Annual report of heath status of workers with special reference to Occupational Health and Safety.
Not Applicable
9 Corporate Environment Policy i. Does the company have a well laid down
Environment Policy approved by its Board of Directors? If so, it may be detailed in the EIA report.
No
ii. Does the Environment Policy prescribe for standard operating process / procedures to bring into focus any infringement / deviation / violation of the environmental or forest norms / conditions? If so, it may be detailed in the EIA.
No. Will be developed at the time of operation
iii. What is the hierarchical system or Administrative order of the company to deal with the environmental issues and for ensuring compliance with the environmental clearance Conditions? Details of this system may be given.
Presented in EMP
iv. Does the company have system of reporting of non compliances / violations of environmental norms to the Board of Directors of the company and / or shareholders or stakeholders at large? This reporting mechanism shall be detailed in the EIA report
No
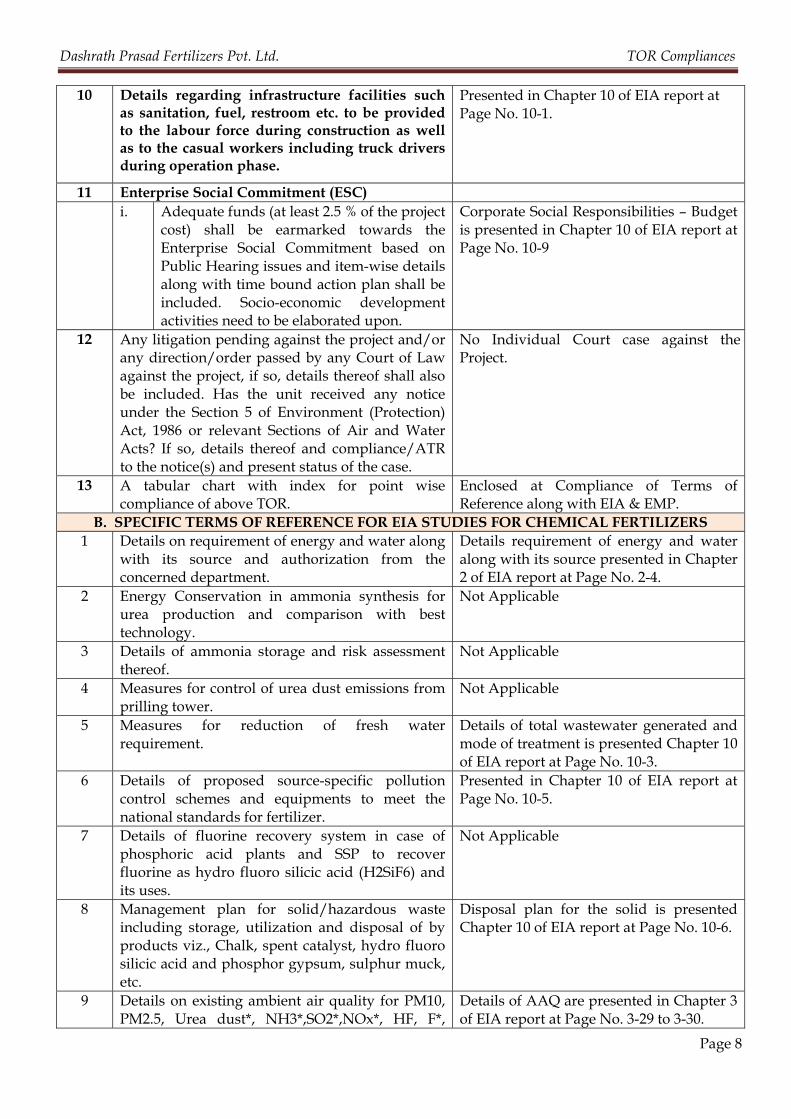
Dashrath Prasad Fertilizers Pvt. Ltd. TOR Compliances
Page 8
10 Details regarding infrastructure facilities such as sanitation, fuel, restroom etc. to be provided to the labour force during construction as well as to the casual workers including truck drivers during operation phase.
Presented in Chapter 10 of EIA report at Page No. 10-1.
11 Enterprise Social Commitment (ESC) i. Adequate funds (at least 2.5 % of the project
cost) shall be earmarked towards the Enterprise Social Commitment based on Public Hearing issues and item-wise details along with time bound action plan shall be included. Socio-economic development activities need to be elaborated upon.
Corporate Social Responsibilities – Budget is presented in Chapter 10 of EIA report at Page No. 10-9
12 Any litigation pending against the project and/or any direction/order passed by any Court of Law against the project, if so, details thereof shall also be included. Has the unit received any notice under the Section 5 of Environment (Protection) Act, 1986 or relevant Sections of Air and Water Acts? If so, details thereof and compliance/ATR to the notice(s) and present status of the case.
No Individual Court case against the Project.
13 A tabular chart with index for point wise compliance of above TOR.
Enclosed at Compliance of Terms of Reference along with EIA & EMP.
B. SPECIFIC TERMS OF REFERENCE FOR EIA STUDIES FOR CHEMICAL FERTILIZERS 1 Details on requirement of energy and water along
with its source and authorization from the concerned department.
Details requirement of energy and water along with its source presented in Chapter 2 of EIA report at Page No. 2-4.
2 Energy Conservation in ammonia synthesis for urea production and comparison with best technology.
Not Applicable
3 Details of ammonia storage and risk assessment thereof.
Not Applicable
4 Measures for control of urea dust emissions from prilling tower.
Not Applicable
5 Measures for reduction of fresh water requirement.
Details of total wastewater generated and mode of treatment is presented Chapter 10 of EIA report at Page No. 10-3.
6 Details of proposed source-specific pollution control schemes and equipments to meet the national standards for fertilizer.
Presented in Chapter 10 of EIA report at Page No. 10-5.
7 Details of fluorine recovery system in case of phosphoric acid plants and SSP to recover fluorine as hydro fluoro silicic acid (H2SiF6) and its uses.
Not Applicable
8 Management plan for solid/hazardous waste including storage, utilization and disposal of by products viz., Chalk, spent catalyst, hydro fluoro silicic acid and phosphor gypsum, sulphur muck, etc.
Disposal plan for the solid is presented Chapter 10 of EIA report at Page No. 10-6.
9 Details on existing ambient air quality for PM10, PM2.5, Urea dust*, NH3*,SO2*,NOx*, HF, F*,
Details of AAQ are presented in Chapter 3 of EIA report at Page No. 3-29 to 3-30.
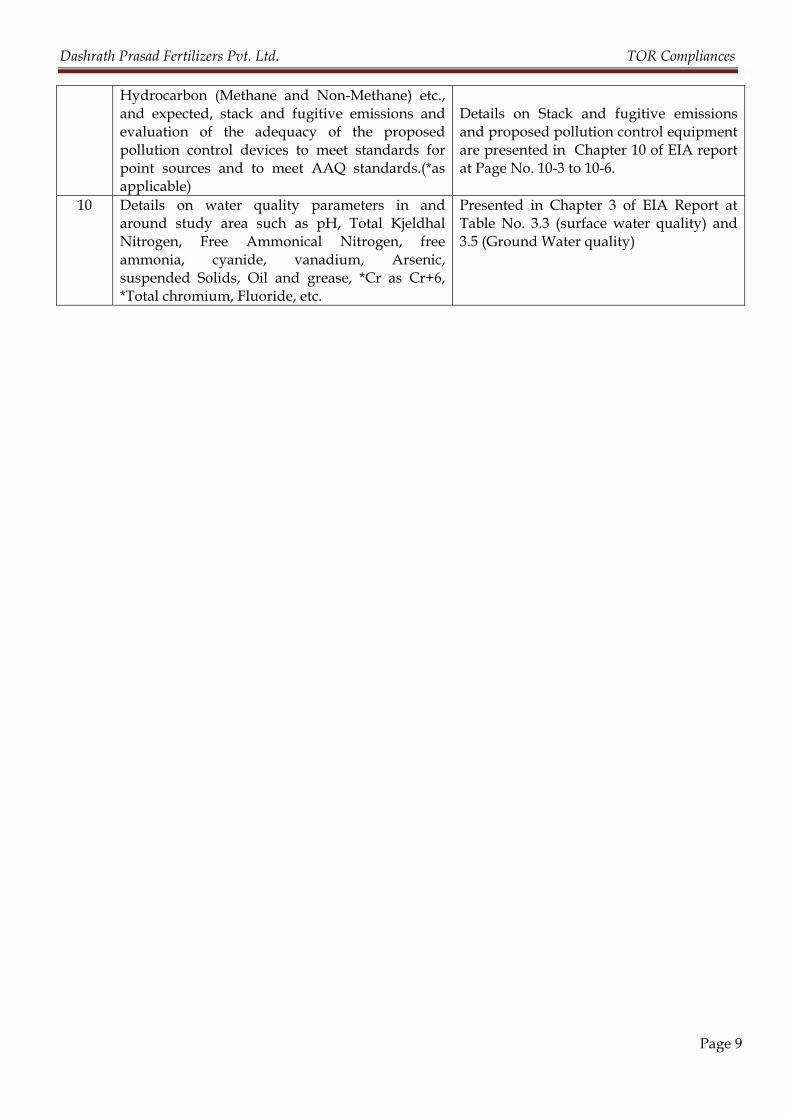
Dashrath Prasad Fertilizers Pvt. Ltd. TOR Compliances
Page 9
Hydrocarbon (Methane and Non-Methane) etc., and expected, stack and fugitive emissions and evaluation of the adequacy of the proposed pollution control devices to meet standards for point sources and to meet AAQ standards.(*as applicable)
Details on Stack and fugitive emissions and proposed pollution control equipment are presented in Chapter 10 of EIA report at Page No. 10-3 to 10-6.
10 Details on water quality parameters in and around study area such as pH, Total Kjeldhal Nitrogen, Free Ammonical Nitrogen, free ammonia, cyanide, vanadium, Arsenic, suspended Solids, Oil and grease, *Cr as Cr+6, *Total chromium, Fluoride, etc.
Presented in Chapter 3 of EIA Report at Table No. 3.3 (surface water quality) and 3.5 (Ground Water quality)
DASHRATH PRASAD FERTILIZERS PVT. LTD. SY. NO. 274/1, 274/2, 276/A2, 277/A1, TEKULAPALLI VILLAGE, PENUBALLI MANDAL, KHAMMAM DISTRICT, TELANGANA
5. ANNEXURES
Project No. 0318‐16‐01March 2018
Dashrath Prasad Fertilizers Pvt. Ltd. 274/1, 274/2, 276/A2, 277/A1, Tekulapalli Village, Penuballi Mandal, Khammam District, Telangana – 507 302 Phone: +91 95735 74455 E‐mail: [email protected]; [email protected]
STUDIES AND DOCUMENTATION BY TEAM Labs and Consultants B‐115‐117 & 509, Annapurna Block, Aditya Enclave, Ameerpet, Hyderabad‐500 038. Phone: 040‐23748 555/23748616, Telefax: 040‐23748666
SUBMITTED TO STATE LEVEL ENVIRONMENT IMPACT ASSESSMENT AUTHORITY,
TELANGANA, GOVERNMENT OF INDIA
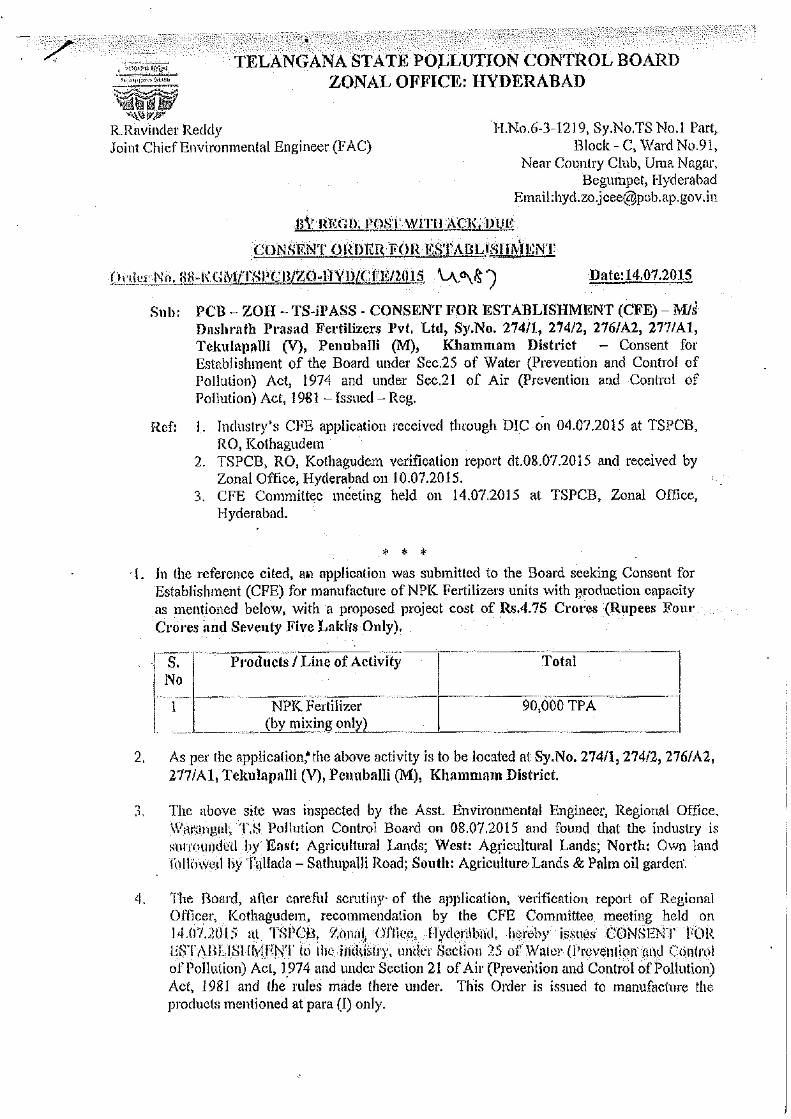
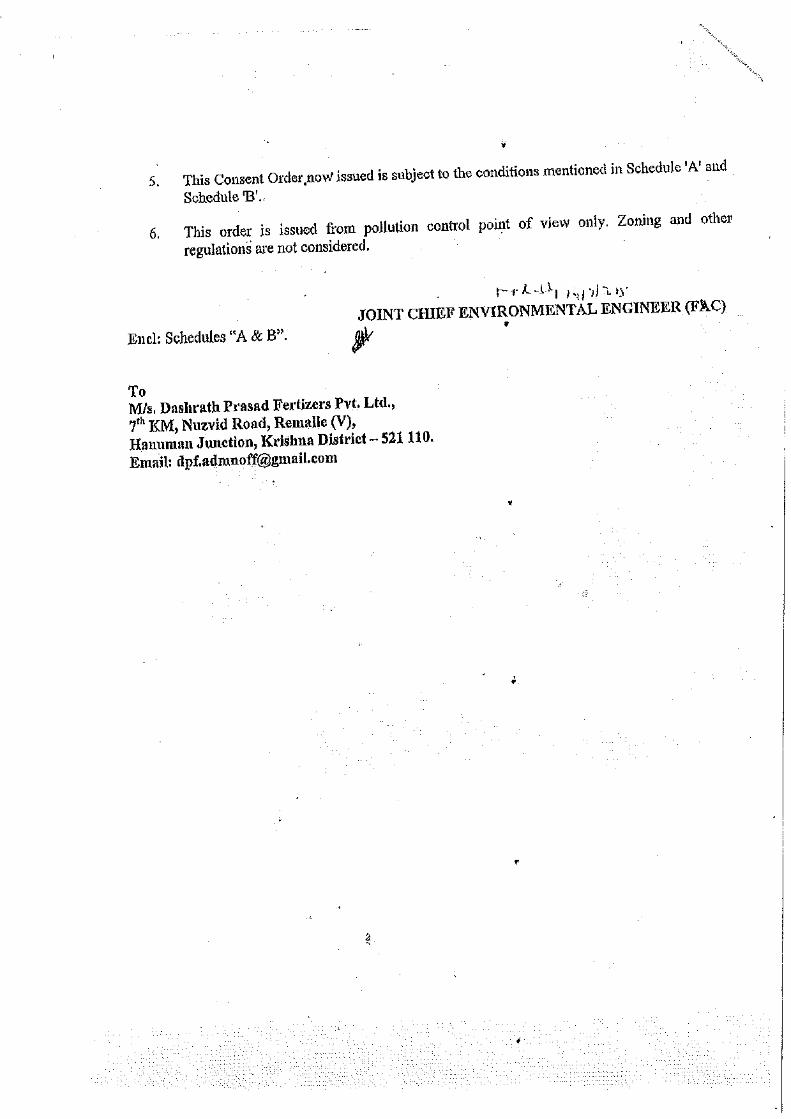

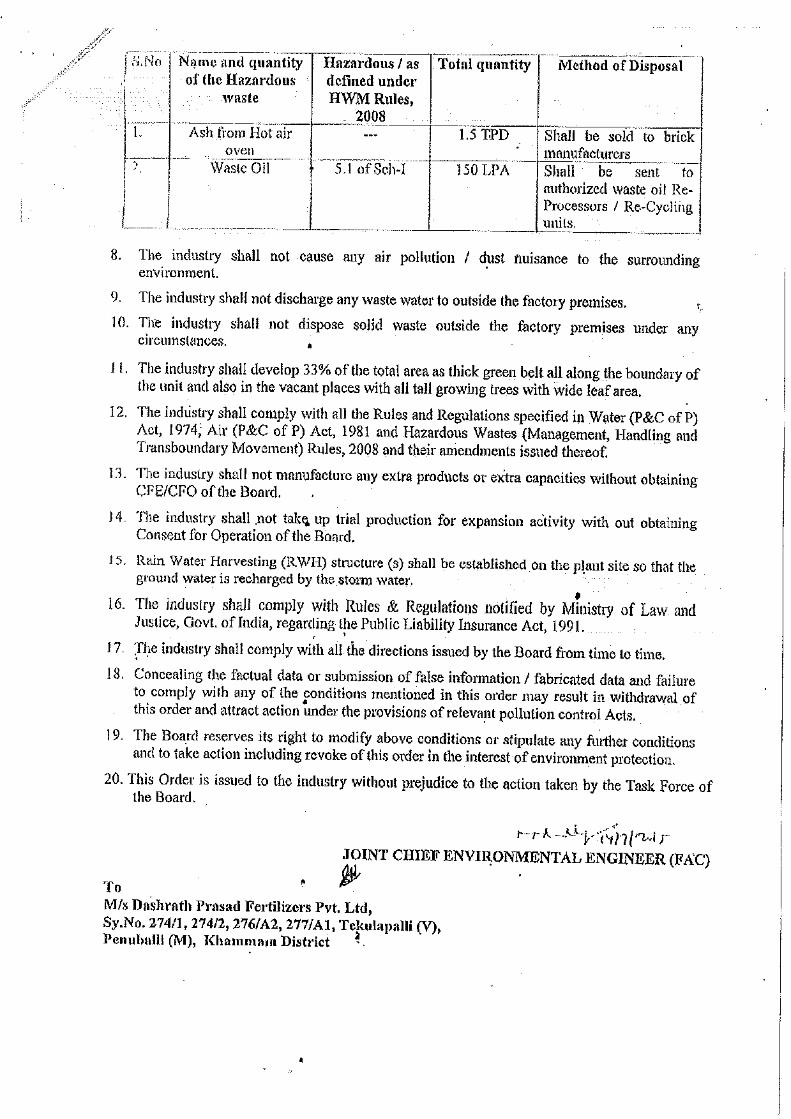
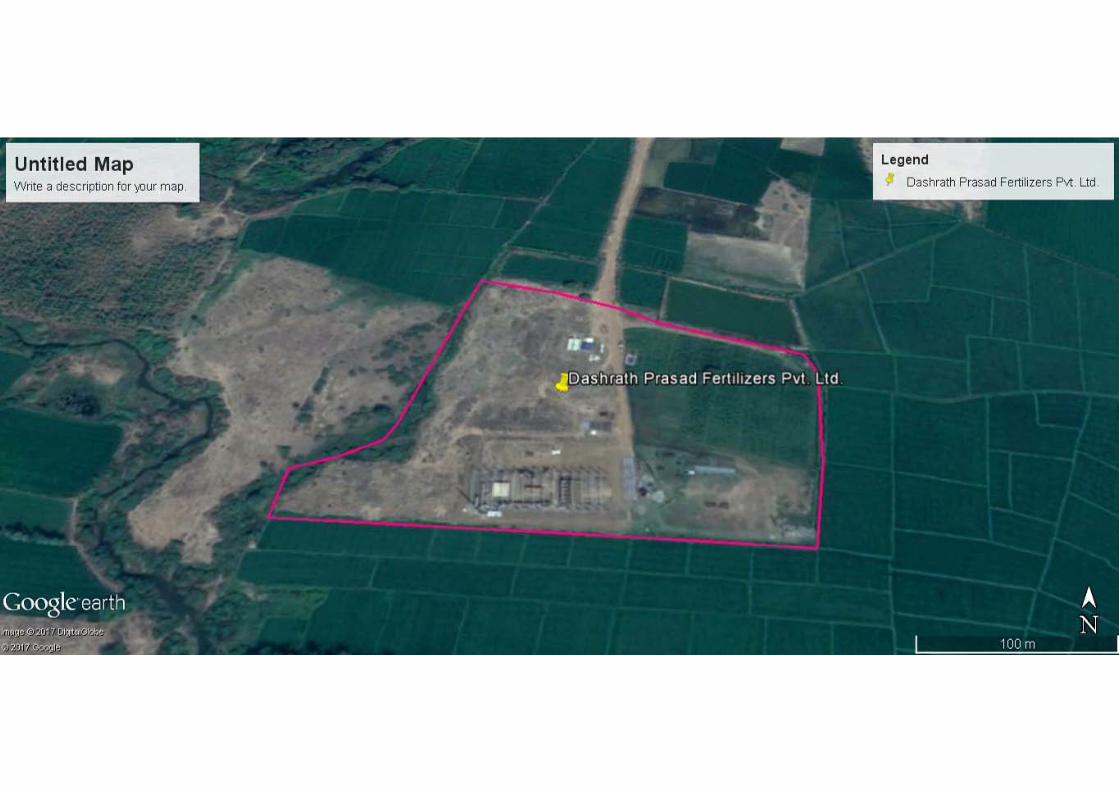

DASHRATH PRASAD FERTILIZERS PVT. LTD. SY. NO. 274/1, 274/2, 276/A2, 277/A1, TEKULAPALLI VILLAGE, PENUBALLI MANDAL, KHAMMAM DISTRICT, TELANGANA
STUDIES AND DOCUMENTATION BY TEAM Labs and Consultants QCI: MoE&F OM, List A-1, S.No.25. (An ISO 9001:2008, ISO 14001:2004 & OHSAS 18001:2007 Certified Organization) B-115, Annapurna Block, Aditya Enclave Ameerpet, Hyderabad-500 038. Phone: 040-23748 555/616, Telefax: 040-23748666 Email: [email protected]