Embed Size (px)
Citation preview
1
Press release in accordance with Consob regulation n. 11971/99
Esprinet 2017 results approved by the Board
Proposed dividend of € 0.135 per share
2017 full year results:
Consolidated sales: € 3,217.2 million (+6% vs € 3,042.3 million as at 31 December 2016)
Gross profit: € 167.8 million (+2% vs € 163.9 million) Operating income (EBIT): € 34.3 million -11% vs € 38.6 million)
Net income: € 26.3 million (-2% vs € 26.9 million)
Net financial position as at 31 December 2017 positive by € 123.1 million (vs Net financial position as at 31 December 2016 positive by 105.4 million)
VimercatVimercatVimercatVimercate (Monza e (Monza e (Monza e (Monza Brianza), 21 MarchBrianza), 21 MarchBrianza), 21 MarchBrianza), 21 March 2018201820182018 ---- The Board of Directors of Esprinet S.p.A. (Italian Stock Exchange:
PRT) met today under the chairmanship of Mr. Francesco Monti to examine and approve the draft of the separated and the consolidated financial statements for the fiscal year ended at 31 December 2017, both prepared in accordance with IFRSs requirements.
The net income for the full year 2017 was respectively € 26.3 million and € 12,8 million, while basic earnings per share was € 0.51. Based on these results, the Board of Directors will propose to the Annual Shareholders’ Meeting the
distribution of a dividend of € 0.135 per ordinary share1 , corresponding to a pay-out ratio of 27%2. The statement for the period ending at 31 December 2017 is still under the revision of Independent Auditor
and it is at disposal of the Board of Statutory Auditor. By 12 April 2018 it will be available by the company headquarter (Vimercate, via Energy Park 20), on the company internet site www.esprinet.com (‘Investor Relation’, section ‘Financial Data’) and with further
publication pursuant to the applicable law, as well as the Report of Statutory Auditor and the Report of Independent Auditor.
The Board of Director also approved the Corporate Governance Report and the Report on Remuneration, both prepared in accordance with the art. 123-bis of the TUF.
These documents will be sent to Borsa Italiana and will be available by the company headquarter (Vimercate, via Energy Park 20), on the company internet site www.esprinet.com (‘Investor Relation’) and with further publication pursuant to the applicable law at the time of the publication of this statement. A) A) A) A) Esprinet Group’s financial highlights The Group’s main economic, financial and asset results as at 31 December 2017 are hereby summarised:
1 Corresponding to a dividend yield of 3.28% (based on Esprinet share closing price of € 4.12 as at 20 March 2018). 2 Based on consolidated net profit of the Esprinet Group.
2
• Consolidated salesConsolidated salesConsolidated salesConsolidated sales equal to € 3,217.2 million showed an increase of +6% (€ 174.8 million) compared to
€ 3,042.3 million as at 31 December 2016. With the same consolidation scope, i.e. excluding the 2016
acquired companies contribution in both the fiscal years, consolidated sales would have been equal to € 2,566 million (€ 2,654 million in the same period of 2016);
• ConsolidatedConsolidatedConsolidatedConsolidated Gross profit Gross profit Gross profit Gross profit equal to € 167.8 million showed an increase of +2% (€ 3.9 million) compared to the same period of 2016 as a consequence of higher sales only partially offset by a decrease in the gross
profit margin. With the same consolidation scope, i.e. excluding the 2016 acquired companies contribution in both the fiscal years, consolidated gross profit would have been equal to € 136.5 million, decreased by -6% compared to the same period of 2016 (€ 145.0 million);
• Other incomeOther incomeOther incomeOther income, recorded only at 31 December 2016, amounted to € 2.8 million and referred entirely to the
gain realized from the newly established company EDSlan S.r.l. for the business unit acquisition relating to distribution activities in networking, cabling, VoIP and UCC – unified communication sectors, from the former EDSlan S.p.A.;
• OpOpOpOperating Incomeerating Incomeerating Incomeerating Income (EBIT) (EBIT) (EBIT) (EBIT) as at 31 December 2017, equal to € 34.3 million, showed a reduction of -11%
compared to 31 December 2016 (€ 38.6 million) with an EBIT margin decreased to 1.07% from 1.27% mainly due to a reduction in the gross profit margin. With the same consolidation scope, i.e. excluding the 2016
acquired companies contribution in both the fiscal years, EBIT would have been equal to € 24.0 million compared to € 29.3 million in the same period of 2016;
• ConsolidatedConsolidatedConsolidatedConsolidated Profit before income taxes Profit before income taxes Profit before income taxes Profit before income taxes equal to € 33.6 million, (-6% compared to 31 December 2016), showed a reduction less pronounced than the EBIT reduction mainly as consequence of higher financial
income due to lower estimate of contractual consideration to be paid for the remaining Celly S.p.A. shares (20%) purchase;
• Consolidated Net incomeConsolidated Net incomeConsolidated Net incomeConsolidated Net income equal to € 26.3 million, showed a reduction of -2% (€ -0.6 million) compared to 31 December 2016;
• Basic earnings per ordinary share Basic earnings per ordinary share Basic earnings per ordinary share Basic earnings per ordinary share as at 31 December 2017, equal to € 0.51, showed a reduction of -2%
compared of 31 December 2016 (€ 0.52).
SalesSalesSalesSales 3,217, 172 3,217, 172 3,217, 172 3,217, 172 100 .00%100.00%100.00%100.00% 3,042,330 3,042,330 3,042,330 3,042,330 100.00%100.00%100.00%100.00% 174,842 174,842 174,842 174,842 6%6%6%6%
Cost of sales (3,049,409) -94.79% (2,878,435) -94.61% (170,974) 6%
Gross profi tGross profi tGross profi tGross profi t 167,763 167,763 167,763 167,763 5.21%5.21%5.21%5.21% 163,895 163,895 163,895 163,895 5.39%5.39%5.39%5.39% 3,868 3,868 3,868 3,868 2%2%2%2%
Other income - 0.00% 2,838 0.09% (2,838) -100%
Sales and marketing costs (53,800) -1.67% (49,871) -1.64% (3,929) 8%
Overheads and administrative costs (79,616) -2.47% (78,296) -2.57% (1,320) 2%
Operating income (EBIT)Operating income (EBIT)Operating income (EBIT)Operating income (EBIT) 34,347 34,347 34,347 34,347 1 .07%1 .07%1 .07%1 .07% 38,566 38,566 38,566 38,566 1 .27%1 .27%1 .27%1 .27% (4,219)(4,219)(4,219)(4,219) -11%-11%-11%-11%
Finance costs - net (749) -0.02% (2,847) -0.09% 2,098 -74%
Other investments expenses / (incomes) 36 0.00% 1 0.00% 35 3500%
Profi t before income taxesProfi t before income taxesProfi t before income taxesProfi t before income taxes 33,634 33,634 33,634 33,634 1 .05%1 .05%1 .05%1 .05% 35,720 35,720 35,720 35,720 1 . 17%1 . 17%1 . 17%1 . 17% (2,086)(2,086)(2,086)(2,086) -6%-6%-6%-6%
Income tax expenses (7,355) -0.23% (8,850) -0.29% 1,495 -17%
Net incomeNet incomeNet incomeNet income 26,279 26,279 26,279 26,279 0.82%0.82%0.82%0.82% 26,870 26 ,870 26 ,870 26 ,870 0.88%0.88%0.88%0.88% (591)(591)(591)(591) -2%-2%-2%-2%
Earnings per share - basic (euro) 0.51 0.52 (0.01) -2%
%%%% %%%% Var.Var .Var .Var . Var . %Var . %Var . %Var . %(euro/000)(euro/000)(euro/000)(euro/000) 2017201720172017 2016201620162016
3
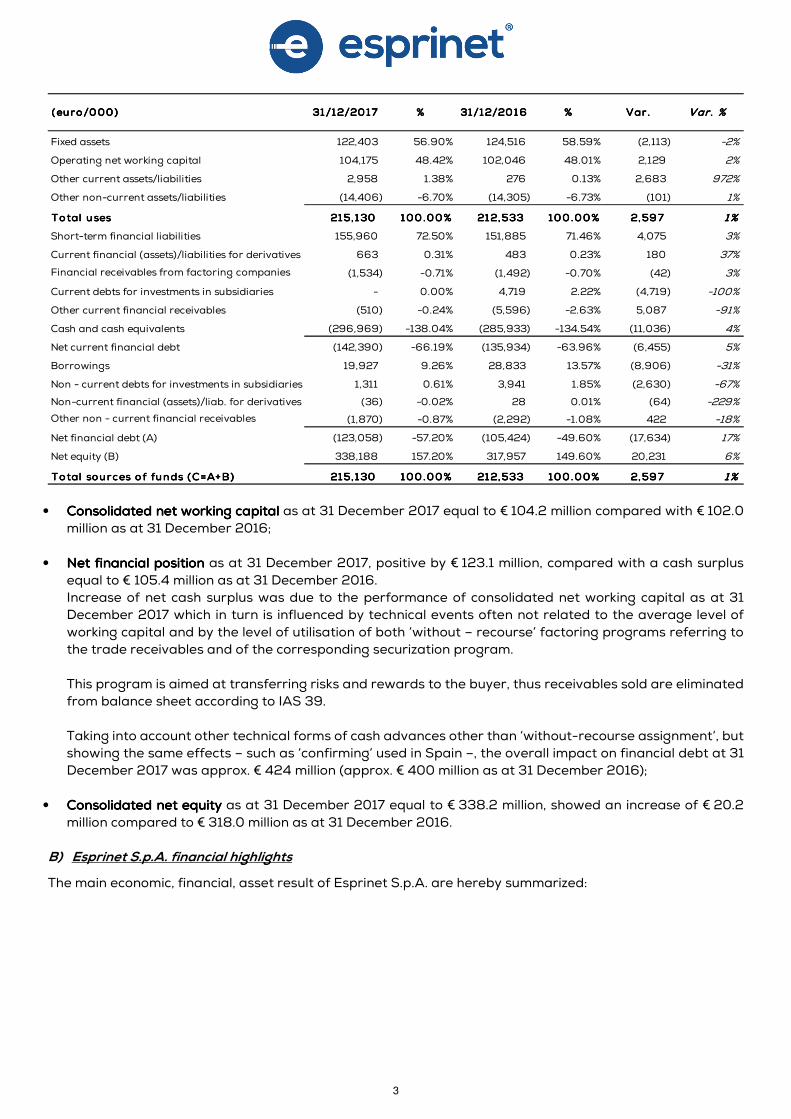
• Consolidated net working capitalConsolidated net working capitalConsolidated net working capitalConsolidated net working capital as at 31 December 2017 equal to € 104.2 million compared with € 102.0
million as at 31 December 2016;
• Net financial positionNet financial positionNet financial positionNet financial position as at 31 December 2017, positive by € 123.1 million, compared with a cash surplus
equal to € 105.4 million as at 31 December 2016. Increase of net cash surplus was due to the performance of consolidated net working capital as at 31 December 2017 which in turn is influenced by technical events often not related to the average level of
working capital and by the level of utilisation of both ‘without – recourse’ factoring programs referring to the trade receivables and of the corresponding securization program.
This program is aimed at transferring risks and rewards to the buyer, thus receivables sold are eliminated from balance sheet according to IAS 39.
Taking into account other technical forms of cash advances other than ‘without-recourse assignment’, but showing the same effects – such as ‘confirming’ used in Spain –, the overall impact on financial debt at 31 December 2017 was approx. € 424 million (approx. € 400 million as at 31 December 2016);
• Consolidated net equityConsolidated net equityConsolidated net equityConsolidated net equity as at 31 December 2017 equal to € 338.2 million, showed an increase of € 20.2
million compared to € 318.0 million as at 31 December 2016.
B) Esprinet S.p.A. financial highlights
The main economic, financial, asset result of Esprinet S.p.A. are hereby summarized:
(euro/000)(euro/000)(euro/000)(euro/000) 31/12/201731/12/201731/12/201731/12/2017 %%%% 31/12/201631/12/201631/12/201631/12/2016 %%%% Var.Var .Var .Var . Var. %Var. %Var. %Var. %
Fixed assets 122,403 56.90% 124,516 58.59% (2,113) -2%
Operating net working capital 104,175 48.42% 102,046 48.01% 2,129 2%
Other current assets/liabilities 2,958 1.38% 276 0.13% 2,683 972%
Other non-current assets/liabilities (14,406) -6.70% (14,305) -6.73% (101) 1%
Total usesTotal usesTotal usesTotal uses 215,130215,130215,130215,130 100 .00%100.00%100.00%100.00% 212,533212,533212,533212,533 100 .00%100.00%100.00%100.00% 2,5972,5972,5972,597 1%1%1%1%
Short-term financial liabilities 155,960 72.50% 151,885 71.46% 4,075 3%
Current financial (assets)/liabilities for derivatives 663 0.31% 483 0.23% 180 37%
Financial receivables from factoring companies (1,534) -0.71% (1,492) -0.70% (42) 3%
Current debts for investments in subsidiaries - 0.00% 4,719 2.22% (4,719) -100%
Other current financial receivables (510) -0.24% (5,596) -2.63% 5,087 -91%
Cash and cash equivalents (296,969) -138.04% (285,933) -134.54% (11,036) 4%
Net current financial debt (142,390) -66.19% (135,934) -63.96% (6,455) 5%
Borrowings 19,927 9.26% 28,833 13.57% (8,906) -31%
Non - current debts for investments in subsidiaries 1,311 0.61% 3,941 1.85% (2,630) -67%
Non-current financial (assets)/liab. for derivatives (36) -0.02% 28 0.01% (64) -229%
Other non - current financial receivables (1,870) -0.87% (2,292) -1.08% 422 -18%
Net financial debt (A) (123,058) -57.20% (105,424) -49.60% (17,634) 17%
Net equity (B) 338,188 157.20% 317,957 149.60% 20,231 6%
Total sources of funds (C=A+B)Total sources of funds (C=A+B)Total sources of funds (C=A+B)Total sources of funds (C=A+B) 215,130215,130215,130215,130 100 .00%100.00%100.00%100.00% 212,533212,533212,533212,533 100 .00%100.00%100.00%100.00% 2,5972,5972,5972,597 1%1%1%1%
4
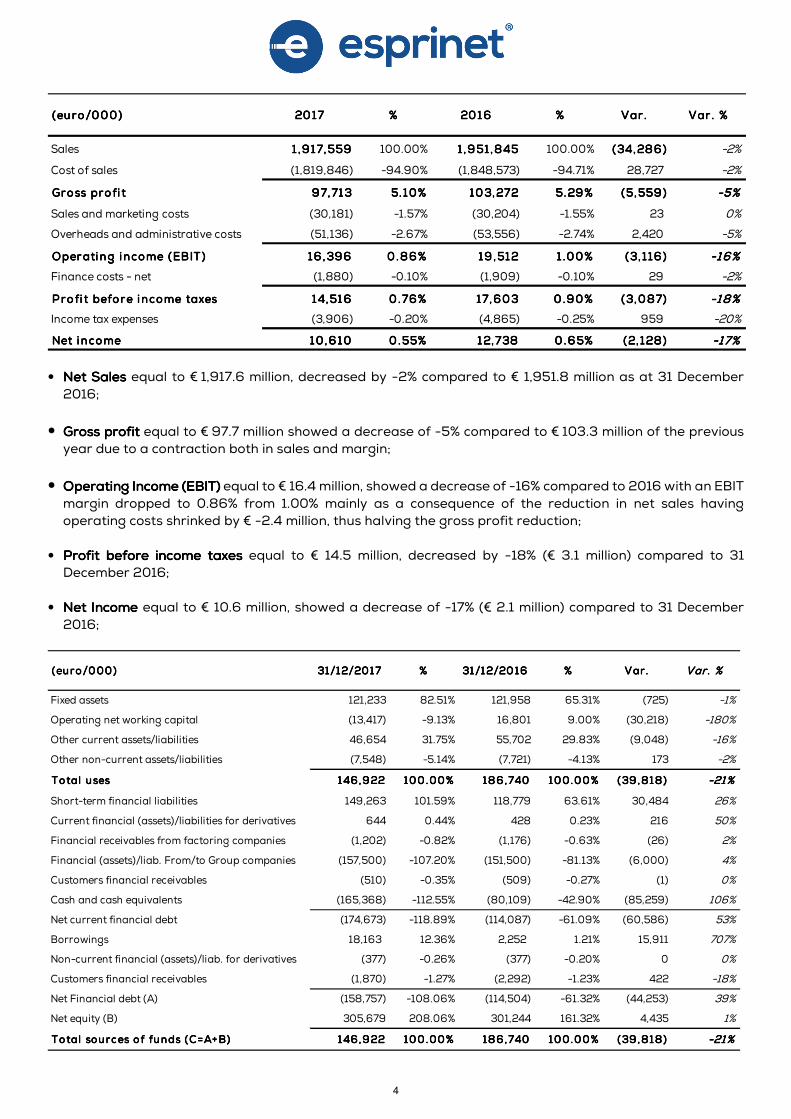
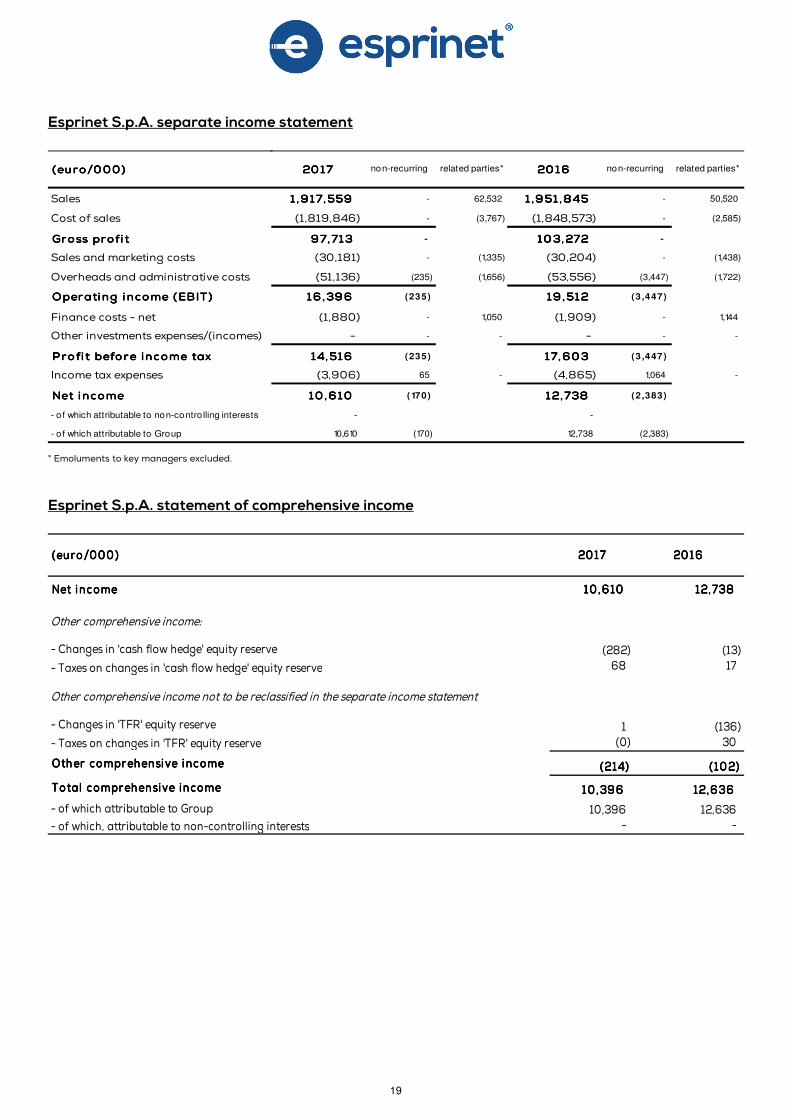
• Net Net Net Net SalesSalesSalesSales equal to € 1,917.6 million, decreased by -2% compared to € 1,951.8 million as at 31 December
2016;
• Gross profitGross profitGross profitGross profit equal to € 97.7 million showed a decrease of -5% compared to € 103.3 million of the previous year due to a contraction both in sales and margin;
• Operating Income (EBIT)Operating Income (EBIT)Operating Income (EBIT)Operating Income (EBIT) equal to € 16.4 million, showed a decrease of -16% compared to 2016 with an EBIT
margin dropped to 0.86% from 1.00% mainly as a consequence of the reduction in net sales having operating costs shrinked by € -2.4 million, thus halving the gross profit reduction;
• Profit before income taxesProfit before income taxesProfit before income taxesProfit before income taxes equal to € 14.5 million, decreased by -18% (€ 3.1 million) compared to 31 December 2016;
• Net IncomeNet IncomeNet IncomeNet Income equal to € 10.6 million, showed a decrease of -17% (€ 2.1 million) compared to 31 December
2016;
Sales 1 ,917,559 1 ,917,559 1 ,917,559 1 ,917,559 100.00% 1 ,951 ,845 1 ,951 ,845 1 ,951 ,845 1 ,951 ,845 100.00% (34,286)(34,286)(34,286)(34,286) -2%
Cost of sales (1,819,846) -94.90% (1,848,573) -94.71% 28,727 -2%
Gross profi tGross profi tGross profi tGross profi t 97,713 97,713 97,713 97,713 5. 10%5.10%5.10%5.10% 103,272 103,272 103,272 103,272 5.29%5.29%5.29%5.29% (5,559)(5,559)(5,559)(5,559) -5%-5%-5%-5%
Sales and marketing costs (30,181) -1.57% (30,204) -1.55% 23 0%
Overheads and administrative costs (51,136) -2.67% (53,556) -2.74% 2,420 -5%
Operating income (EBIT )Operating income (EBIT )Operating income (EBIT )Operating income (EBIT ) 16 ,396 16 ,396 16 ,396 16 ,396 0.86%0.86%0.86%0.86% 19 ,512 19 ,512 19 ,512 19 ,512 1 .00%1 .00%1 .00%1 .00% (3, 116)(3, 116)(3, 116)(3, 116) -16%-16%-16%-16%
Finance costs - net (1,880) -0.10% (1,909) -0.10% 29 -2%
Profi t before income taxesProfi t before income taxesProfi t before income taxesProfi t before income taxes 14,516 14,516 14,516 14,516 0.76%0.76%0.76%0.76% 17,603 17,603 17,603 17,603 0.90%0.90%0.90%0.90% (3,087)(3,087)(3,087)(3,087) -18%-18%-18%-18%
Income tax expenses (3,906) -0.20% (4,865) -0.25% 959 -20%
Net incomeNet incomeNet incomeNet income 10,610 10,610 10,610 10,610 0.55%0.55%0.55%0.55% 12,738 12,738 12,738 12,738 0.65%0.65%0.65%0.65% (2, 128)(2, 128)(2, 128)(2, 128) -17%-17%-17%-17%
(euro/000)(euro/000)(euro/000)(euro/000) 2017201720172017 2016201620162016%%%% %%%% Var.Var .Var .Var . Var . %Var . %Var . %Var . %
(euro/000)(euro/000)(euro/000)(euro/000) 31/12/201731/12/201731/12/201731/12/2017 %%%% 31/12/201631/12/201631/12/201631/12/2016 %%%% Var.Var.Var.Var. Var. %Var. %Var. %Var. %
Fixed assets 121,233 82.51% 121,958 65.31% (725) -1%
Operating net working capital (13,417) -9.13% 16,801 9.00% (30,218) -180%
Other current assets/liabilities 46,654 31.75% 55,702 29.83% (9,048) -16%
Other non-current assets/liabilities (7,548) -5.14% (7,721) -4.13% 173 -2%
Total usesTotal usesTotal usesTotal uses 146,922 146,922 146,922 146,922 100.00%100.00%100.00%100.00% 186,740 186,740 186,740 186,740 100.00%100.00%100.00%100.00% (39 ,818)(39 ,818)(39 ,818)(39 ,818) -21%-21%-21%-21%
Short-term financial liabilities 149,263 101.59% 118,779 63.61% 30,484 26%
Current financial (assets)/liabilities for derivatives 644 0.44% 428 0.23% 216 50%
Financial receivables from factoring companies (1,202) -0.82% (1,176) -0.63% (26) 2%
Financial (assets)/liab. From/to Group companies (157,500) -107.20% (151,500) -81.13% (6,000) 4%
Customers financial receivables (510) -0.35% (509) -0.27% (1) 0%
Cash and cash equivalents (165,368) -112.55% (80,109) -42.90% (85,259) 106%
Net current financial debt (174,673) -118.89% (114,087) -61.09% (60,586) 53%
Borrowings 18,163 12.36% 2,252 1.21% 15,911 707%
Non-current financial (assets)/liab. for derivatives (377) -0.26% (377) -0.20% 0 0%
Customers financial receivables (1,870) -1.27% (2,292) -1.23% 422 -18%
Net Financial debt (A) (158,757) -108.06% (114,504) -61.32% (44,253) 39%
Net equity (B) 305,679 208.06% 301,244 161.32% 4,435 1%
Total sources of funds (C=A+B)Total sources of funds (C=A+B)Total sources of funds (C=A+B)Total sources of funds (C=A+B) 146,922 146,922 146,922 146,922 100.00%100.00%100.00%100.00% 186,740 186,740 186,740 186,740 100.00%100.00%100.00%100.00% (39 ,818)(39 ,818)(39 ,818)(39 ,818) -21%-21%-21%-21%
5
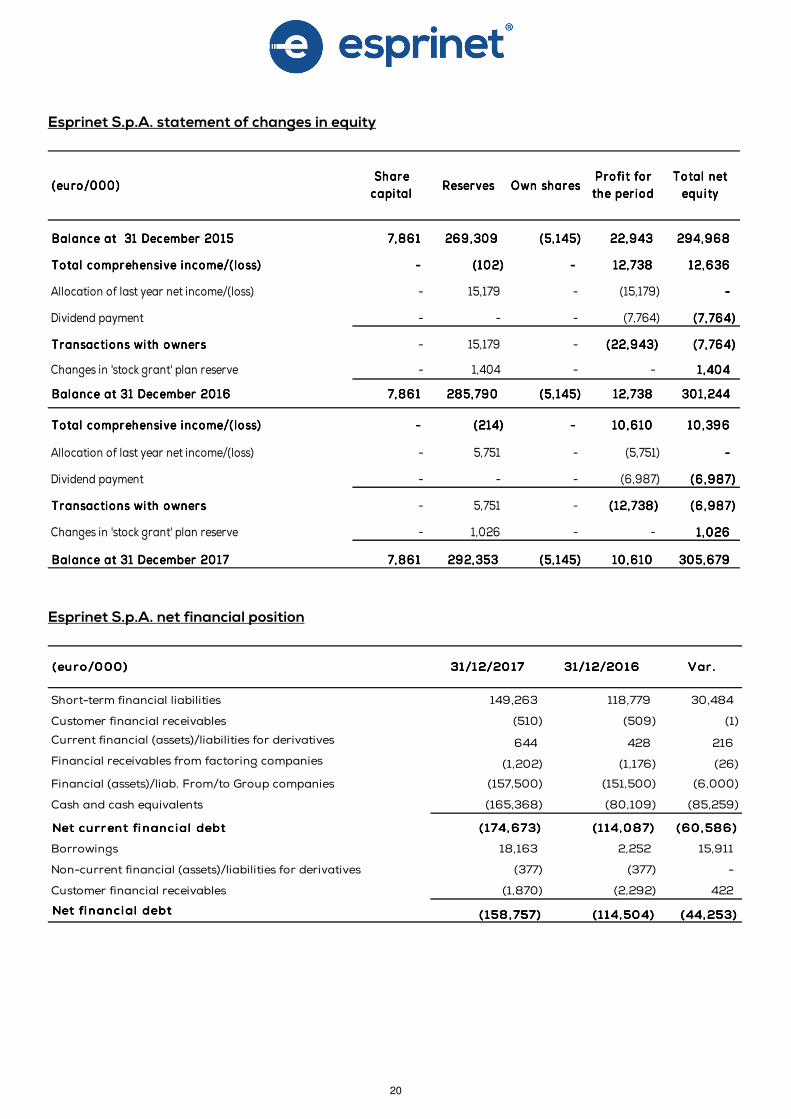
• Consolidated net working capitalConsolidated net working capitalConsolidated net working capitalConsolidated net working capital as at 31 December 2017 was equal to € -13.4 million compared to € 16.8 million as at 31 December 2016;
• NetNetNetNet financial positionfinancial positionfinancial positionfinancial position as at 31 December 2017, was positive by € 158.8 million, compared with a cash surplus equal to € 114.5 million as at 31 December 2016. The impact of ‘without-recourse’ factoring programmes referring to the trade receivables as at 31 December 2017 was equal to € 169 million
(approx. € 123 million as at 31 December 2016);
• Net EquityNet EquityNet EquityNet Equity as at 31 December 2017 was equal to € 305.7 million.
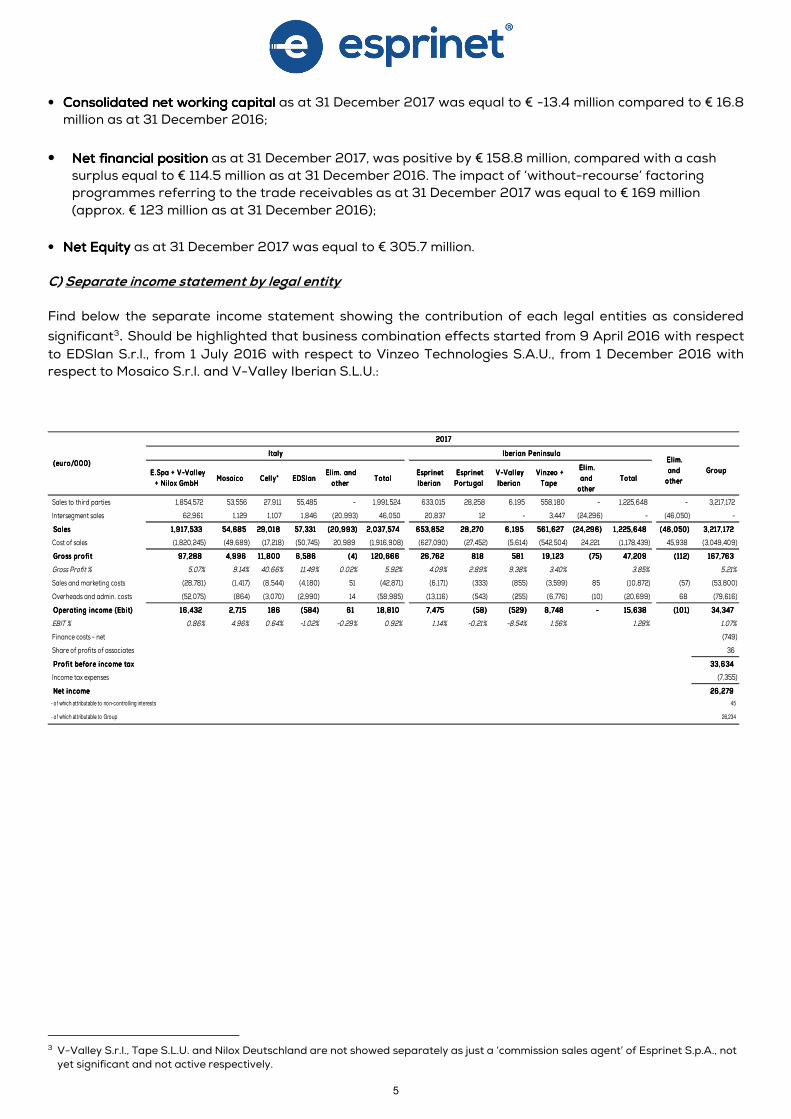
C) Separate income statement by legal entity
Find below the separate income statement showing the contribution of each legal entities as considered
significant3. Should be highlighted that business combination effects started from 9 April 2016 with respect to EDSlan S.r.l., from 1 July 2016 with respect to Vinzeo Technologies S.A.U., from 1 December 2016 with respect to Mosaico S.r.l. and V-Valley Iberian S.L.U.:
3 V-Valley S.r.l., Tape S.L.U. and Nilox Deutschland are not showed separately as just a ‘commission sales agent’ of Esprinet S.p.A., not yet significant and not active respectively.
E.Spa + V-Val l ey E.Spa + V-Val l ey E.Spa + V-Val l ey E.Spa + V-Val l ey
+ Ni lox GmbH + Ni lox GmbH + Ni lox GmbH + Ni lox GmbH Mosaico Mosaico Mosaico Mosaico Cel l y* Cel l y* Cel l y* Cel l y* EDSlan EDSlan EDSlan EDSlan
El im. and El im. and El im. and El im. and
other other other other Total Total Total Total
Espr inet Espr inet Espr inet Espr inet
Iberi an Iberi an Iberi an Iberi an
Espr inet Espr inet Espr inet Espr inet
Portugal Portugal Portugal Portugal
V-Val ley V-Val ley V-Val ley V-Val ley
Iberian Iberian Iberian Iberian
V inzeo + V inzeo + V inzeo + V inzeo +
Tape Tape Tape Tape
El im. El im. El im. El im.
and and and and
other other other other
Total Total Total Total
Sales to third parties 1,854,572 53,556 27,911 55,485 - 1,991,524 633,015 28,258 6,195 558,180 - 1,225,648 - 3,217,172
Intersegment sales 62,961 1,129 1,107 1,846 (20,993) 46,050 20,837 12 - 3,447 (24,296) - (46,050) -
SalesSalesSalesSales 1,917,5331,917,5331,917,5331,917,533 54,68554,68554,68554,685 29 ,01829 ,01829 ,01829 ,018 57,33157,33157,33157,331 (20,993)(20,993)(20,993)(20,993) 2,037,5742,037,5742,037,5742,037,574 653,852653,852653,852653,852 28 ,27028,27028,27028,270 6 , 1956 ,1956 ,1956 ,195 561 ,627561 ,627561 ,627561 ,627 (24,296)(24,296)(24,296)(24,296) 1 ,225,6481 ,225,6481 ,225,6481 ,225,648 (46 ,050)(46 ,050)(46 ,050)(46 ,050) 3,217, 1723,217, 1723,217, 1723,217, 172
Cost of sales (1,820,245) (49,689) (17,218) (50,745) 20,989 (1,916,908) (627,090) (27,452) (5,614) (542,504) 24,221 (1,178,439) 45,938 (3,049,409)
Gross pro fi tGross pro fi tGross pro fi tGross pro fi t 97,28897,28897,28897,288 4,9964,9964,9964,996 1 1 ,80011 ,80011 ,80011 ,800 6 ,5866,5866,5866,586 (4)(4)(4)(4) 120,666120,666120,666120,666 26 ,76226,76226,76226,762 818818818818 581581581581 19, 12319,12319,12319,123 (75)(75)(75)(75) 47,20947,20947,20947,209 ( 112)( 112)( 112)( 112) 167,763167,763167,763167,763
Gross Profit % 5.07% 9.14% 40.66% 11.49% 0.02% 5.92% 4.09% 2.89% 9.38% 3.40% 3.85% 5.21%
Sales and marketing costs (28,781) (1,417) (8,544) (4,180) 51 (42,871) (6,171) (333) (855) (3,599) 85 (10,872) (57) (53,800)
Overheads and admin. costs (52,075) (864) (3,070) (2,990) 14 (58,985) (13,116) (543) (255) (6,776) (10) (20,699) 68 (79,616)
Operating income (Ebi t)Operating income (Ebi t)Operating income (Ebi t)Operating income (Ebi t) 16 ,43216 ,43216 ,43216 ,432 2,7152,7152,7152,715 186186186186 (584)(584)(584)(584) 61616161 18,81018,81018,81018,810 7,4757,4757,4757,475 (58)(58)(58)(58) (529)(529)(529)(529) 8 ,7488,7488,7488,748 ---- 15,63815,63815,63815,638 (101)(101)(101)(101) 34,34734,34734,34734,347
EBIT % 0.86% 4.96% 0.64% -1.02% -0.29% 0.92% 1.14% -0.21% -8.54% 1.56% 1.28% 1.07%
Finance costs - net (749)
Share of profits of associates 36
P ro fi t before income taxPro fi t before income taxPro fi t before income taxPro fi t before income tax 33,63433,63433,63433,634
Income tax expenses (7,355)
Net incomeNet incomeNet incomeNet income 26,27926,27926,27926,279
- o f which attributable to non-contro lling interests 45
- o f which attributable to Group 26,234
(eu ro/000)(eu ro/000)(eu ro/000)(eu ro/000)ItalyItalyItalyItaly Iber ian Peninsu la Iber ian Peninsu la Iber ian Peninsu la Iber ian Peninsu la
El im. El im. El im. El im.
and and and and
o ther o ther o ther o ther
Group Group Group Group
2017 2017 2017 2017
6
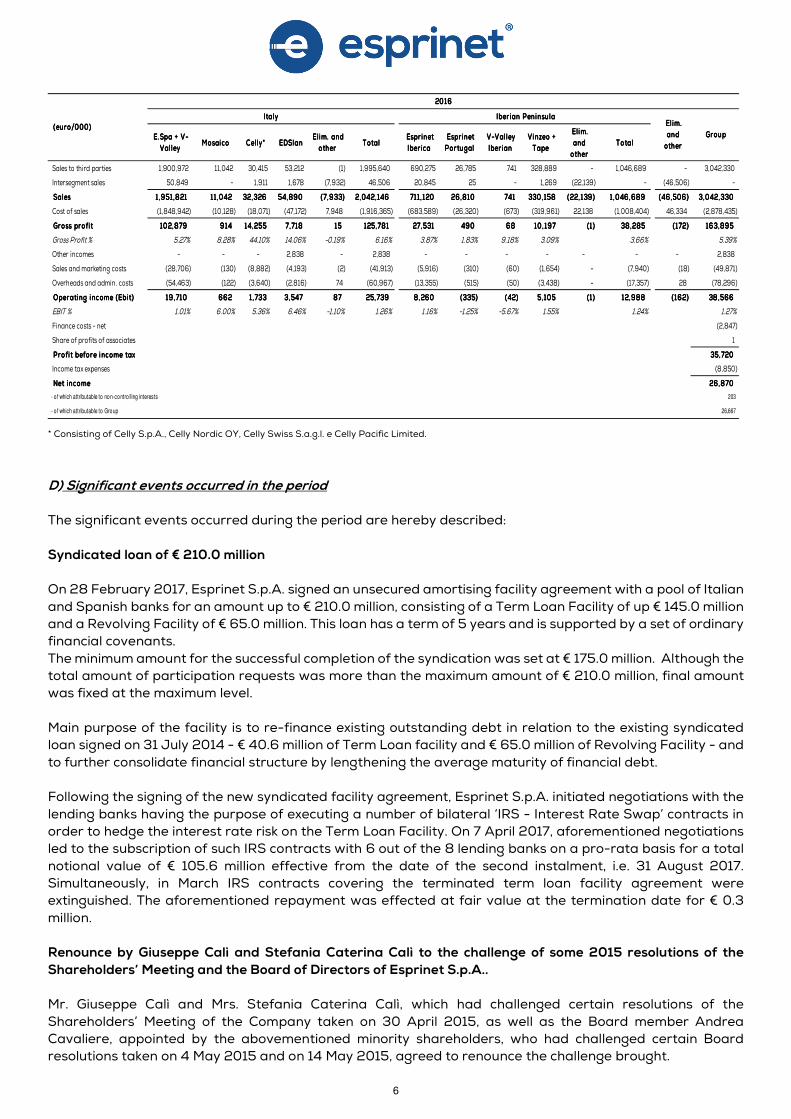
* Consisting of Celly S.p.A., Celly Nordic OY, Celly Swiss S.a.g.l. e Celly Pacific Limited. D) Significant events occurred in the period The significant events occurred during the period are hereby described:
Syndicated loan of € 210.0 million
On 28 February 2017, Esprinet S.p.A. signed an unsecured amortising facility agreement with a pool of Italian
and Spanish banks for an amount up to € 210.0 million, consisting of a Term Loan Facility of up € 145.0 million and a Revolving Facility of € 65.0 million. This loan has a term of 5 years and is supported by a set of ordinary financial covenants.
The minimum amount for the successful completion of the syndication was set at € 175.0 million. Although the total amount of participation requests was more than the maximum amount of € 210.0 million, final amount was fixed at the maximum level.
Main purpose of the facility is to re-finance existing outstanding debt in relation to the existing syndicated loan signed on 31 July 2014 - € 40.6 million of Term Loan facility and € 65.0 million of Revolving Facility - and
to further consolidate financial structure by lengthening the average maturity of financial debt. Following the signing of the new syndicated facility agreement, Esprinet S.p.A. initiated negotiations with the
lending banks having the purpose of executing a number of bilateral ‘IRS - Interest Rate Swap’ contracts in order to hedge the interest rate risk on the Term Loan Facility. On 7 April 2017, aforementioned negotiations led to the subscription of such IRS contracts with 6 out of the 8 lending banks on a pro-rata basis for a total
notional value of € 105.6 million effective from the date of the second instalment, i.e. 31 August 2017. Simultaneously, in March IRS contracts covering the terminated term loan facility agreement were extinguished. The aforementioned repayment was effected at fair value at the termination date for € 0.3
million. Renounce by Giuseppe Calì and Stefania Caterina Calì to the challenge of some 2015 resolutions of the
Shareholders’ Meeting and the Board of Directors of Esprinet S.p.A.. Mr. Giuseppe Calì and Mrs. Stefania Caterina Calì, which had challenged certain resolutions of the
Shareholders’ Meeting of the Company taken on 30 April 2015, as well as the Board member Andrea Cavaliere, appointed by the abovementioned minority shareholders, who had challenged certain Board resolutions taken on 4 May 2015 and on 14 May 2015, agreed to renounce the challenge brought.
E.Spa + V- E.Spa + V- E.Spa + V- E.Spa + V-
Val ley Val ley Val ley Val ley Mosai co Mosai co Mosai co Mosai co Cel ly* Cel ly* Cel ly* Cel ly* EDSlan EDSlan EDSlan EDSlan
El im. and El im. and El im. and El im. and
other o ther o ther o ther Total Total Total Total
Espr inet Espr inet Espr inet Espr inet
Iber ica Iber ica Iber ica Iber ica
Espr inet Espr inet Espr inet Espr inet
Portugal Portugal Portugal Portugal
V-Val ley V-Val ley V-Val ley V-Val ley
Iber ian Iber ian Iber ian Iber ian
Vi nzeo + Vi nzeo + Vi nzeo + Vi nzeo +
Tape Tape Tape Tape
El im. El im. El im. El im.
and and and and
other o ther o ther o ther
Total Total Total Total
Sales to third parties 1,900,972 11,042 30,415 53,212 (1) 1,995,640 690,275 26,785 741 328,889 - 1,046,689 - 3,042,330
Intersegment sales 50,849 - 1,911 1,678 (7,932) 46,506 20,845 25 - 1,269 (22,139) - (46,506) -
SalesSalesSalesSales 1 ,951 ,8211 ,951 ,8211 ,951 ,8211 ,951 ,821 1 1 ,04211 ,04211 ,04211 ,042 32,32632,32632,32632,326 54,89054,89054,89054,890 (7,933)(7,933)(7,933)(7,933) 2,042,1462,042,1462,042,1462,042,146 711 , 120711 , 120711 , 120711 , 120 26 ,81026,81026,81026,810 741741741741 330,158330,158330,158330,158 (22, 139)(22, 139)(22, 139)(22, 139) 1 ,046,6891 ,046,6891 ,046,6891 ,046,689 (46 ,506)(46,506)(46,506)(46,506) 3,042,3303,042,3303,042,3303,042,330
Cost of sales (1,848,942) (10,128) (18,071) (47,172) 7,948 (1,916,365) (683,589) (26,320) (673) (319,961) 22,138 (1,008,404) 46,334 (2,878,435)
Gross profi tGross profi tGross profi tGross profi t 102,879102,879102,879102,879 914914914914 14,25514,25514,25514,255 7,7187,7187,7187,718 15151515 125,781125,781125,781125,781 27,53127,53127,53127,531 490490490490 68686868 10 , 19710 , 19710 , 19710 , 197 (1 )(1 )(1 )(1 ) 38,28538,28538,28538,285 ( 172)( 172)( 172)( 172) 163,895163,895163,895163,895
Gross Profit % 5.27% 8.28% 44.10% 14.06% -0.19% 6.16% 3.87% 1.83% 9.18% 3.09% 3.66% 5.39%
Other incomes - - - 2,838 - 2,838 - - - - - - - 2,838
Sales and marketing costs (28,706) (130) (8,882) (4,193) (2) (41,913) (5,916) (310) (60) (1,654) - (7,940) (18) (49,871)
Overheads and admin. costs (54,463) (122) (3,640) (2,816) 74 (60,967) (13,355) (515) (50) (3,438) - (17,357) 28 (78,296)
Operati ng i ncome (Ebi t)Operati ng i ncome (Ebi t)Operati ng i ncome (Ebi t)Operati ng i ncome (Ebi t) 19 , 71019 ,71019 ,71019 ,710 662662662662 1 , 7331 , 7331 , 7331 , 733 3,5473,5473,5473,547 87878787 25,73925,73925,73925,739 8 ,2608,2608,2608,260 (335)(335)(335)(335) (42)(42)(42)(42) 5,1055,1055,1055,105 (1 )(1 )(1 )(1 ) 12,98812,98812,98812,988 ( 162)( 162)(162)(162) 38 ,56638 ,56638 ,56638 ,566
EBIT % 1.01% 6.00% 5.36% 6.46% -1.10% 1.26% 1.16% -1.25% -5.67% 1.55% 1.24% 1.27%
Finance costs - net (2,847)
Share of profits of associates 1
Profi t before i ncome taxProfi t before i ncome taxProfi t before i ncome taxProfi t before i ncome tax 35,72035,72035,72035,720
Income tax expenses (8,850)
Net incomeNet incomeNet incomeNet income 26,87026,87026,87026,870
- o f which attributable to non-contro lling interests 203
- o f which attributable to Group 26,667
(euro/000)(euro/000)(euro/000)(euro/000)ItalyItalyItalyItaly Iber ian Pen insu la Iber ian Pen insu la Iber ian Pen insu la Iber ian Pen insu la
El im. El im. El im. El im.
and and and and
other other other other
Group Group Group Group
2016201620162016
7
The abovementioned shareholders and Board member took said decision after having examined with the Company, in the context of the judicial proceeding, the respective positions on a juridical ground. Thereafter,
these shareholders and the Board member acknowledged the fairness of the said resolutions taken by the Shareholders’ Meeting and by the Board of Directors of the Company.
At the same time, Mr. Cavaliere resigned from the Esprinet S.p.A. Board of Directors. Thus, Esprinet S.p.A. Board of Director submitted to the Shareholders' Meeting any subsequent decisions.
Esprinet S.p.A. Annual Shareholders Meeting
On 4 May 2017 Esprinet Shareholders’ meeting, held in second call, approved the separate financial
statements for the fiscal year ended at 31 December 2016 and the distribution of a dividend of 0.135 euro per ordinary share, corresponding to a pay-out ratio of 26%.4 The dividend payment was scheduled from 10 May 2017, clipping of coupon no. 12 on 8 May 2017 and record
date on 9 May 2017. The Annual Shareholders’ Meeting has also:
• approved the first section of the Report on Remuneration art.123 – ter, Par.6 of the Legislative Decree no.
58/1998; • resolved upon the integration of the number of directors of Esprinet S.p.A. determined in the number of
twelve by the Shareholders’ Meeting held on 30 April, 2015, appointing Prof. Ariela Caglio as new director in substitution of Mr. Andrea Cavaliere who resigned from his office on 20 February 2017;
• resolved to authorize the acquisition and disposal of own shares, within 18 months since the resolution,
provided that any such purchase does not exceed the maximum of 2,620,217 ordinary shares of Esprinet
(5% of the Company’s share capital), simultaneously revoking, with respect to the unused portion of it, the former authorization resolved by the Shareholder’s Meeting of 4 May 2016;
• authorized the Company to update the economic conditions of the statutory auditing mandate, assigned
to EY S.p.A. to the extent of € 12,000 thousand for the financial years 2016, 2017 and 2018 each, for recurrent additional activities concerning the consolidated financial statements following the perimeter
expansion and of € 5,000 thousand for the auditory activity concerning the PPA (Purchase Price Allocation) to be executed only with reference to the financial statement as of 31 December 2016.
The Shareholders’ Meeting passed special resolution amending articles 4, 5, 8, 11, 13, 16, 19 of Esprinet S.p.A. By-Laws.
Nilox Deutschland GmbH established
On 11 July 2017 the new legal entity Nilox Deutschland GmbH with operating office in Düsseldorf, was established, in order to expand selling and distribution activities of Nilox products (brand owned by Esprinet
S.p.A.) in Germany. The Company having share capital equal to € 100,000 thousand, entirely paid-up as at establishment date,
is 100% owned by Esprinet S.p.A.. At the date of this financial report approval the company was still non-operating.
Disposal of Ascendeo S.A.S. shareholding
On 2 August 2017, Celly S.p.A. completed the disposal share in the associate company Ascendeo S.A.S..
The shareholding, consisting of 9,250 shares at nominal value of 1 euro representing 25% share capital of associate who aims to promote and manage Muvit brand products, was transferred to a price equal to €
75,000 thousand to the major shareholder Ascendeo France S.A.S..
4 Based on Esprinet Group’s consolidated net profit
8
Breach of financial covenants on Facility Agreement
The Group’s financial structure includes a ‘Senior’ medium-long term loan granted to Esprinet S.p.A. on
February 2017 from a pool of banks and consists of a 5-year ‘amortising’ Term loan facility with an original amount of 145.00 million euro and a 5-year ‘amortising’ Revolving facility of 65.00 million euro. At 31 of December 2017 the Term loan facility amounted to 130.5 million, while the Revolving facility line was not used.
The above mentioned loan is without guarantees therefore, as is common practice, is supported by a set of n.4 ordinary financial covenants which non-compliance will cause the withdrawal of advantageous term of payment and the lending banks right to request early repayment.
At 31 December 2017, although compliance with the above-mentioned covenants has to be verified on the annual consolidated financial statement certified by Auditors based on Group’s quarterly financial results, it
is estimated that of the n.4 planned covenants only n.3 have been respected while the remaining has not been fulfilled. For this reason, in accordance with applicable accounting standards, the total ‘amortising’ line amount – as
well as the liability representing the ‘fair value’ of the ‘IRS-Interest Rate Swap’ contracts finalised on interest rate risk hedging on the loan- was reclassified as current financial payable. In relation to the above, the Group has already started negotiation with a pool of banks finalised to obtain
waiver to exercise their right of early repayment.
Changes in tax disputes
On 10 July 2017, the Provincial Tax Commission issued a judgement that upheld the Esprinet appeal, against the assessment notice of 82 thousand euro (plus penalties and interests) related to IRAP and direct taxation,
issued by the Italian Revenue Office against Monclick S.r.l. relating to tax period 2012 (a year in which the company was still part of the Esprinet Group). On 17 October 2017 the Italian Revenue Office issued an appeal against the first instance judgement and
Esprinet S.p.A. presented its counter-arguments entering an appearance. On 11 December 2017 the Italian Revenue Office closed a tax audit relating to IRES, IRAP and VAT of the
subsidiary Celly S.p.A. for the fiscal year 2014 (on 12 May of the same year Celly entered in the Esprinet Group) serving a tax notice. From the tax audit report some breaches have arisen resulting in a disallowance of costs. Waiting for the
assessment, Celly S.p.A. is evaluating the better defensive strategy together with its advisories. Acquisition from Itway Group of the business unit ‘VAD-Value Added Distribution’ purchase price adjustment
On 30 November 2017 the contractual terms, provided for the quantification of the differed consideration expected in relation to the acquisition made by Esprinet Group a year earlier through the two subsidiaries
Mosaico S.r.l. and V-Valley Iberian S.L.U of the business units “VAD-Value Added Distribution” from Itway Group, expired,
The differed consideration was definitively quantified to 5.2 million compared with an initial estimate of 5,8 million, since was based on the achievement of agreed financial targets; Goodwill value initially recorded was consequently adjusted to 10.2 million euro.
The differed price is fully settled as at 31 December 2017. E) Subsequent events
Relevant events occurred after the period-end are briefly described below: Changes in tax disputes
On 4 December 2017, the Regional Tax Commission, where Esprinet S.p.A. appealed against the judgement issued in 2016 by the Provincial Tax Commission relating to indirect taxation, required the deposit of certain
9
additional documents and adjourned the hearing which was held on 19 March 2018. This judgement issued the recovery of VAT, equal to 2.8 million euro (plus penalties and interests), referring to taxable transactions entered into in 2010 with a customer company whose purchases benefited from tax exemption by virtue of a
declaration issued by the same company, which eventually did not qualify as a frequent exporter. On 31 December 2017, pursuant to the administrative procedure, advances equal to 4.5 million euro were paid and were booked under 'Other tax assets'.
On 10 January 2018 the Provincial Tax Commission filed a judgement referring to Esprinet S.p.A. indirect taxes relating to an assessment claiming VAT of 1.0 million euro, plus penalties and interests. The tax authority
claims that some transactions in 2011 are taxable in respect of which a customer had previously filed a declaration of intent, but later failed to fulfil the requirements needed to qualify as a frequent exporter. Pursuant to the administrative procedure, on 31 December 2017 advances equal to 0.4 million euro were paid
and then booked under 'Other tax assets' and on 23 February 2018 was paid another advance equal to 1.5 million euro booked in 'Other tax assets' also.
On 4 September 2017, Celly S.p.A. was served a correction and settlement notice relating to the registration fees due with reference to the form of the business unit disposal from Celly (selling party) to the company Rosso Garibaldi S.p.A..
Since, pursuant to law, Celly S.p.A. was jointly committed to the payment of the amount requested by the Tax Office and the purchaser was declared bankrupt in December, on 12 January 2018 the higher registration fee and interests totalling 4 thousand euro were paid.
On 4 July 2017 Edslan S.r.l. was served a correction and settlement notice, equal to approx. 180 thousand euro, relating to the reassessment of the business unit acquired on 8 June 2016 from Edslan S.p.A. (now I-
Trading S.r.l.). On 24 January 2018, an appeal was filed by Edslan S.r.l..
On 16 June 2017 the Revenue Office issued the invitation to appear to initiate adversarial proceedings and any assessment relating to the agreement (signed on 13 December 2016) referring to the business unit acquisition from ItWay S.p.A.
During the meeting with the Tax Office, the Company pointed out that a definitive price had not been set since price adjustments by the first months of 2018 are expected. On 26 January 2018, a summary agreement was signed on the company sold price, pending the Revenue
Office judgements.
On 30 November 2017, Esprinet S.p.A. issued an appeal body with the Provincial Tax Commission against the advance payments request, as per administrative procedure, with reference to an assessment notice
received on 2 October 2017 asking for 3.1 million euro (plus penalties and interests) of VAT recovery relating to an assessment claiming VAT on 2012 taxable transactions entered into with three customers whose purchases benefited from tax exemption as frequent exporters which eventually proved to be false.
On 19 December 2017, the President of the Commission, recognising not only the 'fumus' and 'periculum' but also the lack of urgency, temporarily suspended the contested act until the collegial judgement on the assessment from the court assigned. On 23 February 2018 the Provincial Tax Commission confirmed the
contested act suspension.
F) Outlook
The European distribution market grew by +4% in 2017 compared to the previous year (source: Context, February 2018), whilst the fourth quarter was +3% compared to the same period of 2016.
Italy was substantially stable year-over-year, whilst the fourth quarter decreased by -1% vs the same period of 2016. Spain posted a strong growth of +9% with the fourth quarter’s trend in line with the yearly one.
The distribution market has started 2018 with a +8% growth in Italy and +10% in Spain (source: Context, February 2018), boosted by the excellent performance of smartphones in both countries.
10
The rationalization of the cost structure, which began in 2017 with the primary goal of guaranteeing a significantly lower break-even point, will continue in 2018 as a logical outcome of the renewed focus on reducing fixed costs.
The continuous fine-tune of both the operating process and the level of service are resulting in a higher customer satisfaction, as demonstrated by both the good feedbacks received by customers and suppliers as well as by some new business opportunities that we believe might positively contribute to the economics of
the Group. The competitive landscape should gradually show a lower pressure compared to the previous year, as demonstrated by the sales trend in the first weeks of the current year.
The management confirms 2018 sales to grow ‘low-single digit’ due to the positive effect of the Italian operations and the expected reduction of sales in Spain, arising from the eroded revenue in the ‘retailers’
fulfillment sector, only partially counterbalanced by other business units. With respect to profitability, EBIT should be comprised between € 39-41 million, net of non-recurring items.
G) Dividend proposal
The Board of Directors will submit to the approval of the Shareholders Meeting the distribution of a dividend of € 0.135 for each ordinary share. The dividend shall be paid out from 16 May 2018 (ex-coupon no. 13 on 14
May 2018 and record date on 15 May 2018).
H) 2018 Shareholders’ meeting Call The Ordinary Meeting will be held at the Cosmo Hotel, Via Torri Bianche n. 4, Vimercate (MB), at 11:00 a.m. on 4 May 2018 (single call), to discuss the following:
Agenda:Agenda:Agenda:Agenda:
1. Financial Statement of Esprinet S.p.A. as at December 2017: 1.1 Approval of 2017 Financial Statement; Directors' Report on Operations, Statutory Auditors’
Report, Independent Auditors’ Report, presentation of the Consolidated Financial Statement of Esprinet Group as at 31 December 2017.
1.2 Allocation of income of the year.
2. Board of Directors Appointments for fiscal years 2018/2020. 2.1 Definition of the number of the Board of Directors. 2.2 Directors’ Appointments. 2.3 Appointment of the Chairman of the Board of Directors. 2.4 Definition of the remuneration.
3. Board of Statutory Auditors Appointments for fiscal years 2018/2020.
3.1 Members Appointments. 3.2 Chairman Appointment. 3.3 Definition of the remuneration.
4. Report on Remuneration. Resolutions on the first section of the Report on Remuneration pursuant to
par. 6 of the art. 123-ter of the legislative decree 58/1998.
5. Proposal for authorization of a 18 months a buy-back plan of owned shares, for the maximum number of shares legally allowed; correlated repeal of the authorization for the plan, or the unused portion of it, resolved during the Shareholders’ Meeting of 4 May 2017.
6. Proposal for the approval of a Long Term Incentive Plan, in relation to remuneration policies and in
accordance with article 114-bis of legislative decree 58/1998, for the members of the Company's Board of Directors and other executives for the period 2018/2019/2020. The object of the plan is the free allocation of ordinary shares in the Company (“performance stock grants”) to beneficiaries
11
designated by the Board of Directors, up to a maximum of 1,150,000 shares in the Company in portfolio.
7. Integration of fees for the legal accounting support of the Esprinet S.p.A. consolidated financial statement.
DECLARATION EX ART. 154DECLARATION EX ART. 154DECLARATION EX ART. 154DECLARATION EX ART. 154----bis, paragraph 2 Legislative Decree n.58/1998 (T.U.F.)bis, paragraph 2 Legislative Decree n.58/1998 (T.U.F.)bis, paragraph 2 Legislative Decree n.58/1998 (T.U.F.)bis, paragraph 2 Legislative Decree n.58/1998 (T.U.F.)
The officer charged with the drawing up of the accounting documents of the company, Pietro Aglianò, declares that, in compliance with the provisions of paragraph 2 of Article 154 bis of Legislative Decree
n.58/1998 (T.U.F.), the financial data shown in this press release corresponds to the findings resulting from accounting documents, books and accounting records. Annex: Summary of economic and financial results (Group/Esprinet S.p.A.).
For further information:
Michele BertaccoMichele BertaccoMichele BertaccoMichele Bertacco Esprinet S.p.A. – IR and Communications Director Tel. +39 02 40496.1 - [email protected]
Esprinet (based in Vimercate ItalyEsprinet (based in Vimercate ItalyEsprinet (based in Vimercate ItalyEsprinet (based in Vimercate Italy; Borsa ; Borsa ; Borsa ; Borsa Italiana: PRT)Italiana: PRT)Italiana: PRT)Italiana: PRT), is the holding of a Group engaged in the “B2B”
distribution of technology products at the top of the market in Italy and Spain. The 2017 turnover of € 3.2
billion places Esprinet among the top 50 Italian industrial groups and the top 10 distributors worldwide. Thanks to a business model based on the coexistence of different sales channels tailored to the specific characteristics of 36.000 reseller clients, Esprinet markets about 700 brands and over 57,000 products
available in 130,000 square meters of managed warehouses. Through the V-Valley division, Esprinet is able to distribute value-added products, services and IT solutions. The Group’s activities also cover Portugal, and the production and sales of the named brands “Celly” (smartphones accessories) and “Nilox” (outdoor
technology).
12
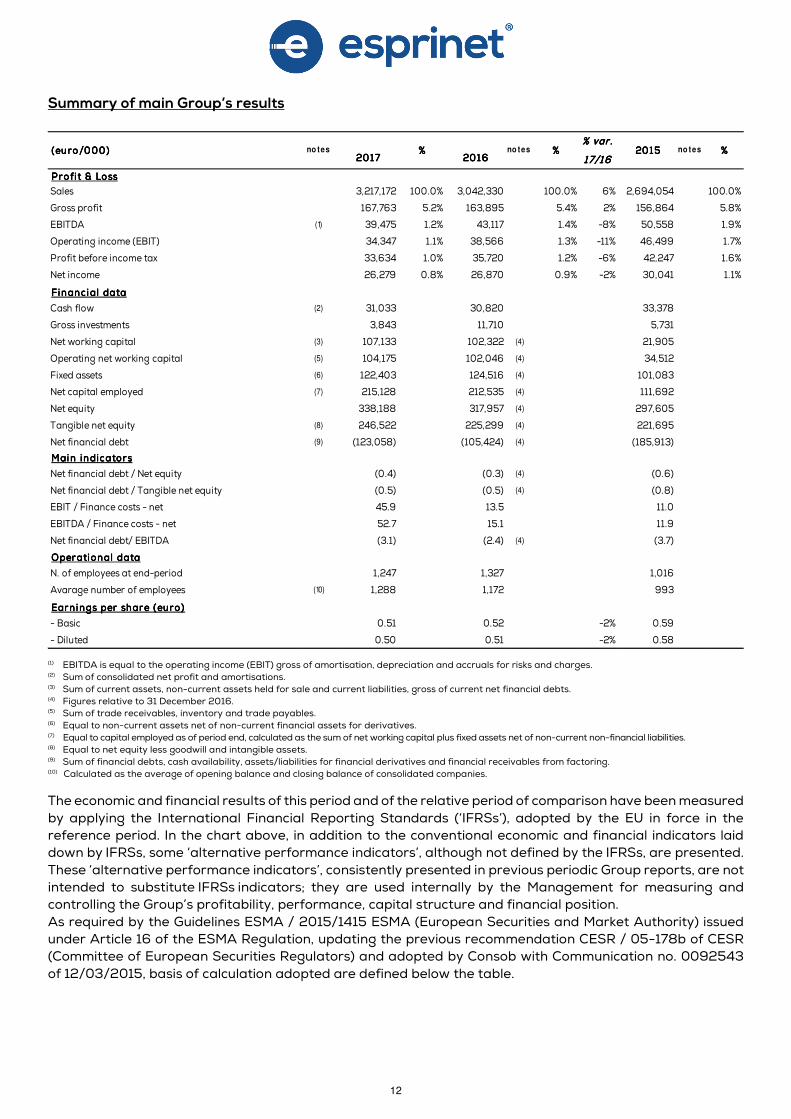
Summary of main Group’s results
(1) EBITDA is equal to the operating income (EBIT) gross of amortisation, depreciation and accruals for risks and charges. (2) Sum of consolidated net profit and amortisations. (3) Sum of current assets, non-current assets held for sale and current liabilities, gross of current net financial debts. (4) Figures relative to 31 December 2016. (5) Sum of trade receivables, inventory and trade payables. (6) Equal to non-current assets net of non-current financial assets for derivatives. (7) Equal to capital employed as of period end, calculated as the sum of net working capital plus fixed assets net of non-current non-financial liabilities. (8) Equal to net equity less goodwill and intangible assets. (9) Sum of financial debts, cash availability, assets/liabilities for financial derivatives and financial receivables from factoring. (10) Calculated as the average of opening balance and closing balance of consolidated companies.
The economic and financial results of this period and of the relative period of comparison have been measured
by applying the International Financial Reporting Standards (‘IFRSs’), adopted by the EU in force in the reference period. In the chart above, in addition to the conventional economic and financial indicators laid down by IFRSs, some ‘alternative performance indicators’, although not defined by the IFRSs, are presented.
These ‘alternative performance indicators’, consistently presented in previous periodic Group reports, are not intended to substitute IFRSs indicators; they are used internally by the Management for measuring and controlling the Group’s profitability, performance, capital structure and financial position.
As required by the Guidelines ESMA / 2015/1415 ESMA (European Securities and Market Authority) issued under Article 16 of the ESMA Regulation, updating the previous recommendation CESR / 05-178b of CESR (Committee of European Securities Regulators) and adopted by Consob with Communication no. 0092543
of 12/03/2015, basis of calculation adopted are defined below the table.
% var .% var .% var .% var .
2017201720172017 2016201620162016 17/1617/1617/1617/16
Profi t & LossProfi t & LossProfi t & LossProfi t & Loss
Sales 3,217,172 100.0% 3,042,330 100.0% 6% 2,694,054 100.0%
Gross profit 167,763 5.2% 163,895 5.4% 2% 156,864 5.8%
EBITDA (1) 39,475 1.2% 43,117 1.4% -8% 50,558 1.9%
Operating income (EBIT) 34,347 1.1% 38,566 1.3% -11% 46,499 1.7%
Profit before income tax 33,634 1.0% 35,720 1.2% -6% 42,247 1.6%
Net income 26,279 0.8% 26,870 0.9% -2% 30,041 1.1%
Financ ial dataFinanc ial dataFinanc ial dataFinanc ial data
Cash flow (2) 31,033 30,820 33,378
Gross investments 3,843 11,710 5,731
Net working capital (3) 107,133 102,322 (4) 21,905
Operating net working capital (5) 104,175 102,046 (4) 34,512
Fixed assets (6) 122,403 124,516 (4) 101,083
Net capital employed (7) 215,128 212,535 (4) 111,692
Net equity 338,188 317,957 (4) 297,605
Tangible net equity (8) 246,522 225,299 (4) 221,695
Net financial debt (9) (123,058) (105,424) (4) (185,913)
Main indicatorsMain indicatorsMain indicatorsMain indicators
Net financial debt / Net equity (0.4) (0.3) (4) (0.6)
Net financial debt / Tangible net equity (0.5) (0.5) (4) (0.8)
EBIT / Finance costs - net 45.9 13.5 11.0
EBITDA / Finance costs - net 52.7 15.1 11.9
Net financial debt/ EBITDA (3.1) (2.4) (4) (3.7)
Operational dataOperational dataOperational dataOperational data
N. of employees at end-period 1,247 1,327 1,016
Avarage number of employees (10) 1,288 1,172 993
Earnings per share (euro)Earnings per share (euro)Earnings per share (euro)Earnings per share (euro)
- Basic 0.51 0.52 -2% 0.59
- Diluted 0.50 0.51 -2% 0.58
(euro/000)(euro/000)(euro/000)(euro/000) no tes %%%% no tes %%%% 2015201520152015 %%%%no tes
13
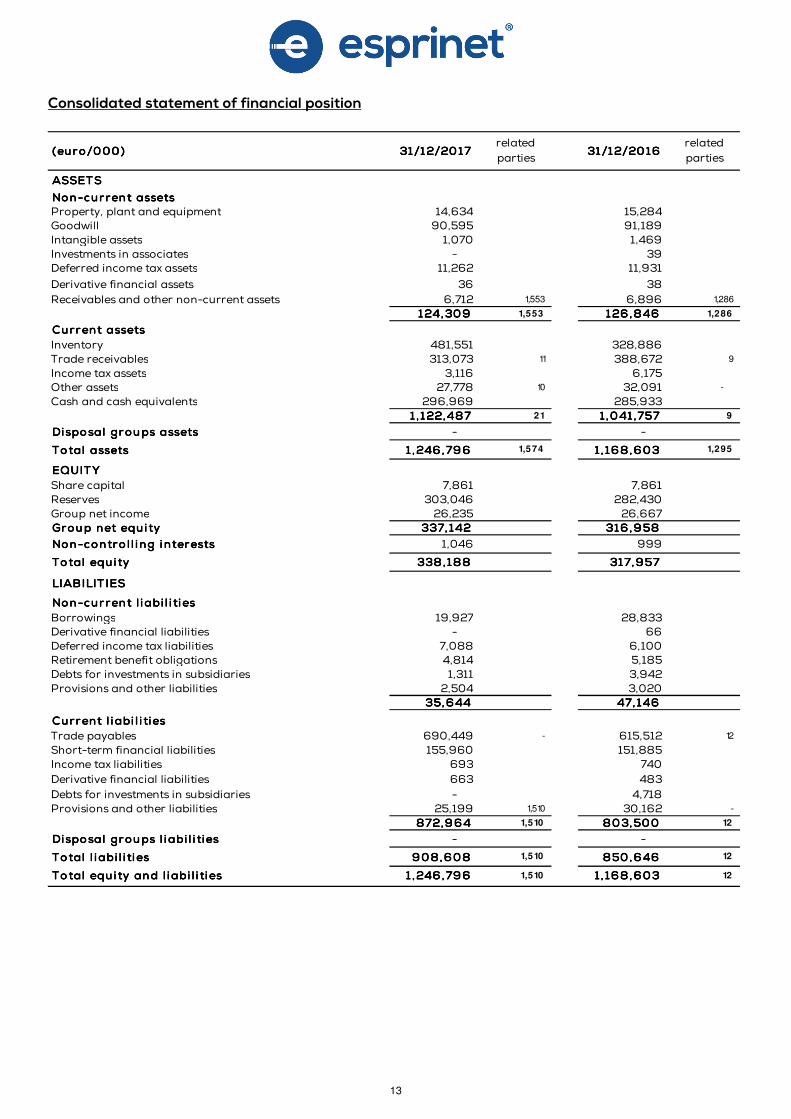
Consolidated statement of financial position
ASSETSASSETSASSETSASSETS
Non-current assetsNon-current assetsNon-current assetsNon-current assetsProperty, plant and equipment 14,634 15,284 Goodwill 90,595 91,189 Intangible assets 1,070 1,469 Investments in associates - 39 Deferred income tax assets 11,262 11,931
Derivative financial assets 36 38
Receivables and other non-current assets 6,712 1,553 6,896 1,286
124,309124,309124,309124,309 1,553 126,846126,846126,846126,846 1,286
Current assetsCurrent assetsCurrent assetsCurrent assets
Inventory 481,551 328,886 Trade receivables 313,073 11 388,672 9
Income tax assets 3,116 6,175 Other assets 27,778 10 32,091 -
Cash and cash equivalents 296,969 285,933 1 , 122,4871 ,122,4871 ,122,4871 ,122,487 21 1 ,041 ,7571 ,041 ,7571 ,041 ,7571 ,041 ,757 9
Disposal groups assetsDisposal groups assetsDisposal groups assetsDisposal groups assets - -
Total assetsTotal assetsTotal assetsTotal assets 1 ,246,7961 ,246,7961 ,246,7961 ,246,796 1,574 1 , 168,6031, 168,6031, 168,6031, 168,603 1,295
EQUITYEQUITYEQUITYEQUITY
Share capital 7,861 7,861 Reserves 303,046 282,430 Group net income 26,235 26,667 Group net equ i tyGroup net equ i tyGroup net equ i tyGroup net equ i ty 337, 142337, 142337, 142337, 142 316 ,958316,958316,958316,958
Non-contro l l i ng interestsNon-contro l l i ng interestsNon-contro l l i ng interestsNon-contro l l i ng interests 1,046 999
Total equ i tyTotal equ i tyTotal equ i tyTotal equ i ty 338,188338,188338,188338,188 317,957317,957317,957317,957
LIABILIT IESLIABILIT IESLIABILIT IESLIABILIT IES
Non-current l iabi l i ti esNon-current l iabi l i ti esNon-current l iabi l i ti esNon-current l iabi l i ti es
Borrowings 19,927 28,833 Derivative financial liabilities - 66 Deferred income tax liabilities 7,088 6,100 Retirement benefit obligations 4,814 5,185 Debts for investments in subsidiaries 1,311 3,942 Provisions and other liabilities 2,504 3,020
35,64435,64435,64435,644 47, 14647, 14647, 14647, 146
Current l iabi l i tiesCurrent l iabi l i tiesCurrent l iabi l i tiesCurrent l iabi l i ties
Trade payables 690,449 - 615,512 12
Short-term financial liabilities 155,960 151,885 Income tax liabilities 693 740
Derivative financial liabilities 663 483
Debts for investments in subsidiaries - 4,718 Provisions and other liabilities 25,199 1,510 30,162 -
872,964872,964872,964872,964 1,510 803,500803,500803,500803,500 12
Disposal groups l iabi l i tiesDisposal groups l iabi l i tiesDisposal groups l iabi l i tiesDisposal groups l iabi l i ties - -
Total l i abi l i ti esTotal l i abi l i ti esTotal l i abi l i ti esTotal l i abi l i ti es 908,608908,608908,608908,608 1,510 850,646850,646850,646850,646 12
Total equ i ty and l iabi l i ti esTotal equ i ty and l iabi l i ti esTotal equ i ty and l iabi l i ti esTotal equ i ty and l iabi l i ti es 1 ,246,7961 ,246,7961 ,246,7961 ,246,796 1,510 1 , 168,6031, 168,6031, 168,6031, 168,603 12
(euro/000)(euro/000)(euro/000)(euro/000) 31/12/201731/12/201731/12/201731/12/2017related
parties
related
parties31/12/201631/12/201631/12/201631/12/2016
14
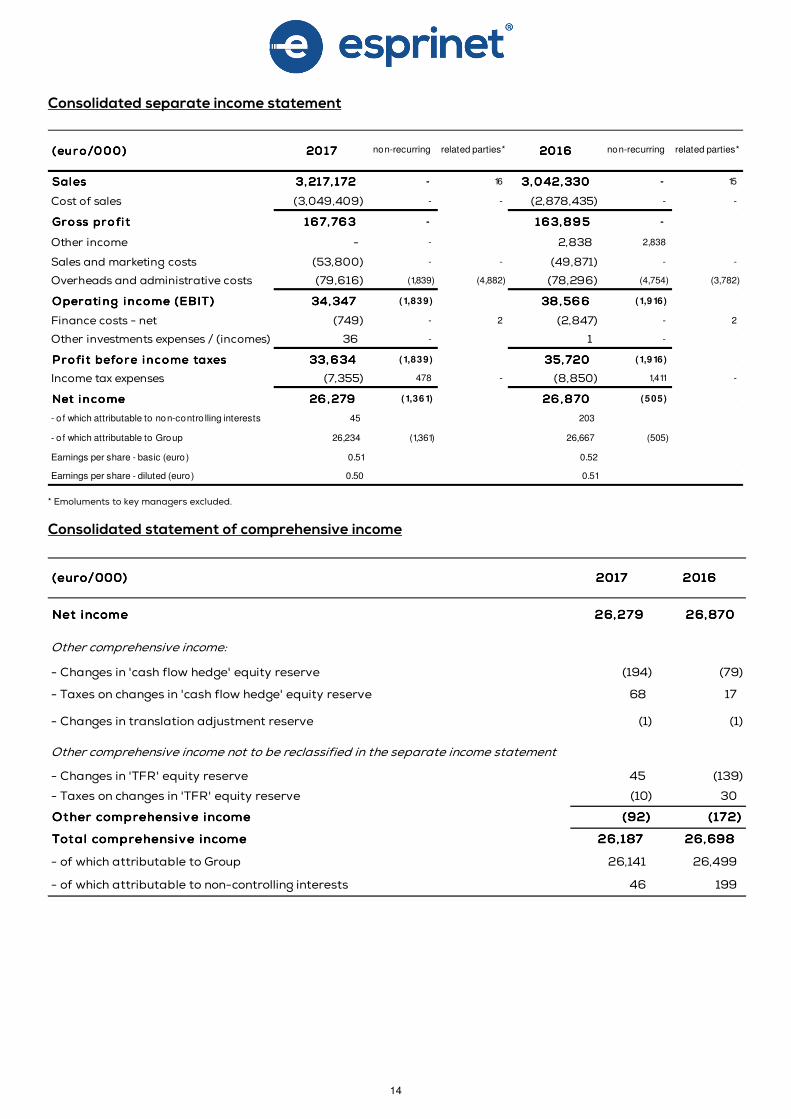
Consolidated separate income statement
* Emoluments to key managers excluded.
Consolidated statement of comprehensive income
SalesSalesSalesSales 3,217, 1723,217, 1723,217, 1723,217, 172 - 16 3,042,3303,042,3303,042,3303,042,330 - 15
Cost of sales (3,049,409) - - (2,878,435) - -
Gross profi tGross profi tGross profi tGross profi t 167,763167,763167,763167,763 - 163,895163,895163,895163,895 -
Other income - - 2,838 2,838
Sales and marketing costs (53,800) - - (49,871) - -
Overheads and administrative costs (79,616) (1,839) (4,882) (78,296) (4,754) (3,782)
Operating income (EBIT)Operating income (EBIT)Operating income (EBIT)Operating income (EBIT) 34,34734,34734,34734,347 (1,839) 38,56638,56638,56638,566 (1,916)
Finance costs - net (749) - 2 (2,847) - 2
Other investments expenses / (incomes) 36 - 1 -
Profi t before income taxesProfi t before income taxesProfi t before income taxesProfi t before income taxes 33,63433,63433,63433,634 (1,839) 35,72035,72035,72035,720 (1,916)
Income tax expenses (7,355) 478 - (8,850) 1,411 -
Net incomeNet incomeNet incomeNet income 26,27926,27926,27926,279 (1,361) 26,87026,87026,87026,870 (505)
- o f which attributable to non-contro lling interests 45 203
- o f which attributable to Group 26,234 (1,361) 26,667 (505)
Earnings per share - basic (euro) 0.51 0.52
Earnings per share - diluted (euro) 0.50 0.51
non-recurring related parties*(euro/000)(euro/000)(euro/000)(euro/000) non-recurring related parties* 2017 2017 2017 2017 2016 2016 2016 2016
Net incomeNet incomeNet incomeNet income 26,27926,27926,27926,279 26,87026,87026,87026,870
Other comprehensive income:
- Changes in 'cash flow hedge' equity reserve (194) (79)
- Taxes on changes in 'cash flow hedge' equity reserve 68 17
- Changes in translation adjustment reserve (1) (1)
Other comprehensive income not to be reclassified in the separate income statement
- Changes in 'TFR' equity reserve 45 (139)
- Taxes on changes in 'TFR' equity reserve (10) 30
Other comprehensive incomeOther comprehensive incomeOther comprehensive incomeOther comprehensive income (92)(92)(92)(92) (172)(172)(172)(172)
Total comprehensive incomeTotal comprehensive incomeTotal comprehensive incomeTotal comprehensive income 26,18726,18726,18726,187 26,69826,69826,69826,698
- of which attributable to Group 26,141 26,499
- of which attributable to non-controlling interests 46 199
(euro/000)(euro/000)(euro/000)(euro/000) 2017201720172017 2016201620162016
15
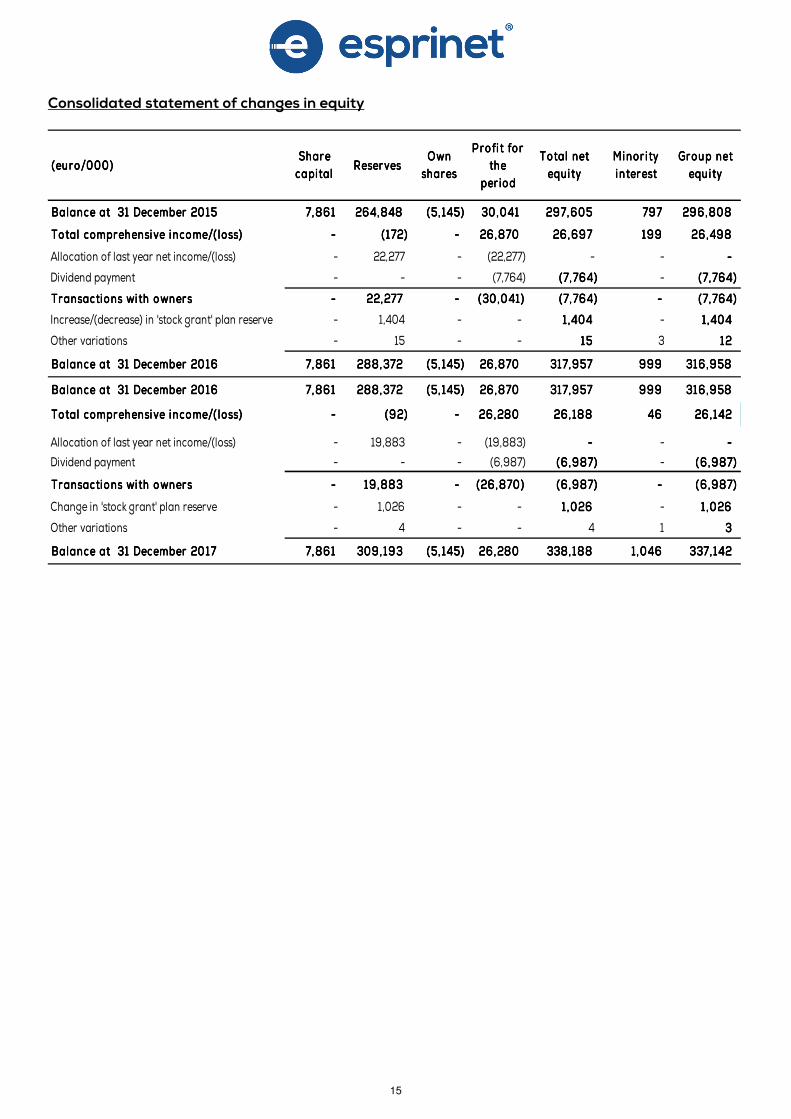
Consolidated statement of changes in equity
Balance at 31 December 2015Balance at 31 December 2015Balance at 31 December 2015Balance at 31 December 2015 7,8617,8617,8617,861 264,848264,848264,848264,848 (5, 145)(5, 145)(5, 145)(5, 145) 30,04130,04130,04130,041 297,605297,605297,605297,605 797797797797 296,808296,808296,808296,808
Total comprehensive income/( loss)Total comprehensive income/( loss)Total comprehensive income/( loss)Total comprehensive income/( loss) ---- ( 172)(172)(172)(172) ---- 26 ,87026,87026,87026,870 26 ,69726,69726,69726,697 199199199199 26 ,49826,49826,49826,498
Allocation of last year net income/(loss) - 22,277 - (22,277) - - ----
Dividend payment - - - (7,764) (7,764)(7,764)(7,764)(7,764) - (7,764)(7,764)(7,764)(7,764)
Transactions wi th ownersTransactions wi th ownersTransactions wi th ownersTransactions wi th owners ---- 22,27722,27722,27722,277 ---- (30 ,041 )(30,041)(30,041)(30,041) (7,764)(7,764)(7,764)(7,764) ---- (7,764)(7,764)(7,764)(7,764)
Increase/(decrease) in 'stock grant' plan reserve - 1,404 - - 1 ,4041 ,4041 ,4041 ,404 - 1 ,4041,4041,4041,404
Other variations - 15 - - 15151515 3 12121212
Balance at 31 December 2016Balance at 31 December 2016Balance at 31 December 2016Balance at 31 December 2016 7,8617,8617,8617,861 288,372288,372288,372288,372 (5, 145)(5, 145)(5, 145)(5, 145) 26,87026,87026,87026,870 317,957317,957317,957317,957 999999999999 316 ,958316,958316,958316,958
Balance at 31 December 2016Balance at 31 December 2016Balance at 31 December 2016Balance at 31 December 2016 7,8617,8617,8617,861 288,372288,372288,372288,372 (5, 145)(5, 145)(5, 145)(5, 145) 26,87026,87026,87026,870 317,957317,957317,957317,957 999999999999 316 ,958316,958316,958316,958
Total comprehensive income/( loss)Total comprehensive income/( loss)Total comprehensive income/( loss)Total comprehensive income/( loss) ---- (92)(92)(92)(92) ---- 26 ,28026,28026,28026,280 26 , 18826,18826,18826,188 46464646 26 ,14226 ,14226 ,14226 ,142
Allocation of last year net income/(loss) - 19,883 - (19,883) ---- - ----
Dividend payment - - - (6,987) (6 ,987)(6 ,987)(6 ,987)(6 ,987) - (6 ,987)(6 ,987)(6 ,987)(6 ,987)
Transactions wi th ownersTransactions wi th ownersTransactions wi th ownersTransactions wi th owners ---- 19 ,88319,88319,88319,883 ---- (26,870)(26,870)(26,870)(26,870) (6 ,987)(6 ,987)(6 ,987)(6 ,987) ---- (6 ,987)(6 ,987)(6 ,987)(6 ,987)
Change in 'stock grant' plan reserve - 1,026 - - 1 ,0261 ,0261 ,0261 ,026 - 1 ,0261 ,0261 ,0261 ,026
Other variations - 4 - - 4 1 3333
Balance at 31 December 2017Balance at 31 December 2017Balance at 31 December 2017Balance at 31 December 2017 7,8617,8617,8617,861 309,193309,193309,193309,193 (5, 145)(5, 145)(5, 145)(5, 145) 26,28026,28026,28026,280 338,188338,188338,188338,188 1 ,0461,0461,0461,046 337,142337,142337,142337,142
Own Own Own Own
sharessharessharessharesReservesReservesReservesReserves
Share Share Share Share
capitalcapitalcapitalcapital(euro/000)(euro/000)(euro/000)(euro/000)
Group net Group net Group net Group net
equ i tyequ i tyequ i tyequ i ty
Minor i ty Minor i ty Minor i ty Minor i ty
interestinterestinterestinterest
Total net Total net Total net Total net
equi tyequi tyequi tyequi ty
Profi t for P rofi t for P rofi t for P rofi t for
the the the the
per iodper iodper iodper iod
16
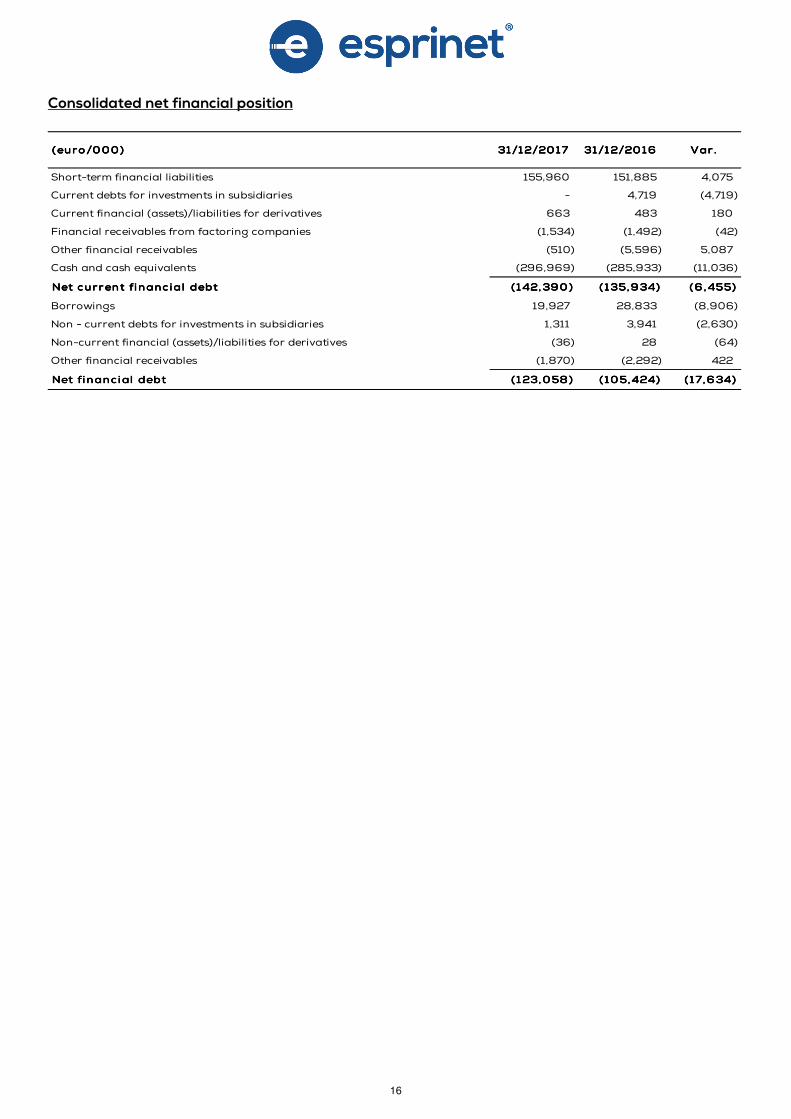
Consolidated net financial position
(euro/000)(euro/000)(euro/000)(euro/000) 31/12/201731/12/201731/12/201731/12/2017 31/12/201631/12/201631/12/201631/12/2016 Var . Var . Var . Var .
Short-term financial liabilities 155,960 151,885 4,075
Current debts for investments in subsidiaries - 4,719 (4,719)
Current financial (assets)/liabilities for derivatives 663 483 180
Financial receivables from factoring companies (1,534) (1,492) (42)
Other financial receivables (510) (5,596) 5,087
Cash and cash equivalents (296,969) (285,933) (11,036)
Net current financ ial debtNet current financ ial debtNet current financ ial debtNet current financ ial debt (142,390)(142,390)(142,390)(142,390) (135,934)(135,934)(135,934)(135,934) (6 ,455)(6 ,455)(6 ,455)(6 ,455)
Borrowings 19,927 28,833 (8,906)
Non - current debts for investments in subsidiaries 1,311 3,941 (2,630)
Non-current financial (assets)/liabilities for derivatives (36) 28 (64)
Other financial receivables (1,870) (2,292) 422
Net financial debtNet financial debtNet financial debtNet financial debt (123,058)(123,058)(123,058)(123,058) (105,424)(105,424)(105,424)(105,424) (17,634)(17,634)(17,634)(17,634)
17
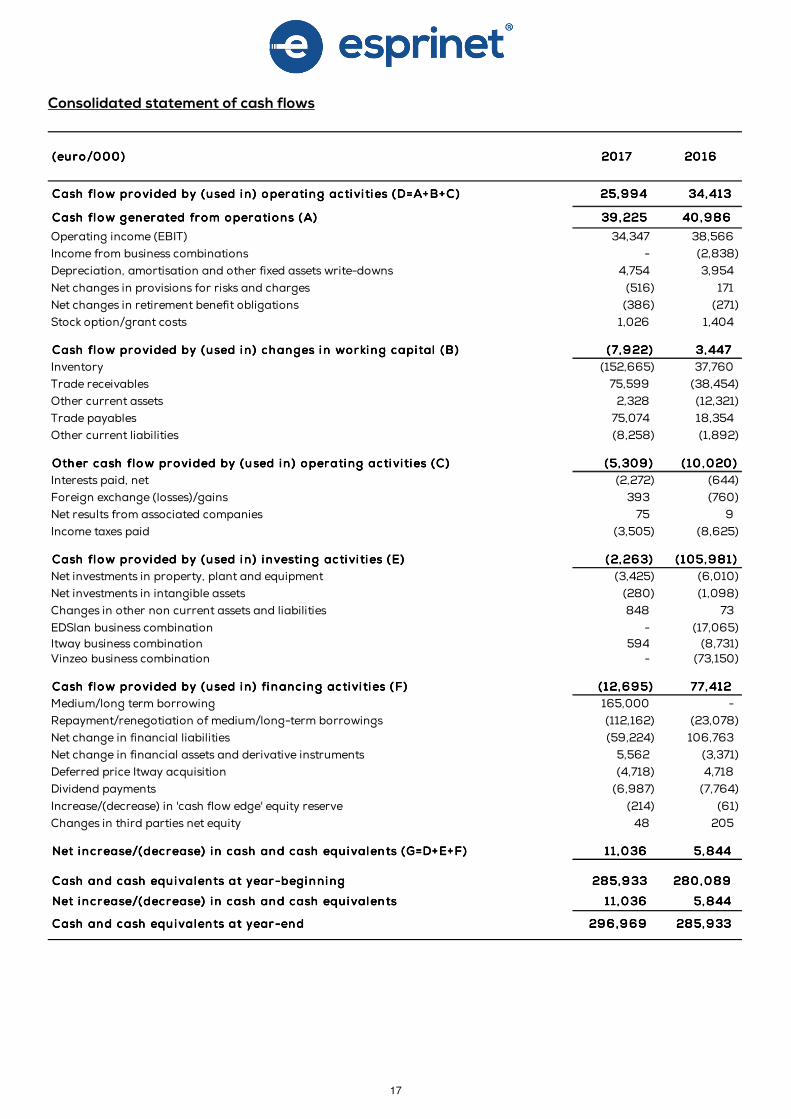
Consolidated statement of cash flows
Cash flow provided by (used in) operating activi ti es (D=A+B+C)Cash flow provided by (used in) operating activi ti es (D=A+B+C)Cash flow provided by (used in) operating activi ti es (D=A+B+C)Cash flow provided by (used in) operating activi ti es (D=A+B+C) 25,99425,99425,99425,994 34,41334,41334,41334,413
Cash flow generated from operations (A)Cash flow generated from operations (A)Cash flow generated from operations (A)Cash flow generated from operations (A) 39 ,22539,22539,22539,225 40 ,98640,98640,98640,986
Operating income (EBIT) 34,347 38,566
Income from business combinations - (2,838)
Depreciation, amortisation and other fixed assets write-downs 4,754 3,954
Net changes in provisions for risks and charges (516) 171
Net changes in retirement benefit obligations (386) (271)
Stock option/grant costs 1,026 1,404
Cash flow provided by (used in) changes in working capital (B)Cash flow provided by (used in) changes in working capital (B)Cash flow provided by (used in) changes in working capital (B)Cash flow provided by (used in) changes in working capital (B) (7,922)(7,922)(7,922)(7,922) 3,4473,4473,4473,447
Inventory (152,665) 37,760
Trade receivables 75,599 (38,454)
Other current assets 2,328 (12,321)
Trade payables 75,074 18,354
Other current liabilities (8,258) (1,892)
Other cash flow provided by (used in ) operating activi ties (C)Other cash flow provided by (used in ) operating activi ties (C)Other cash flow provided by (used in ) operating activi ties (C)Other cash flow provided by (used in ) operating activi ties (C) (5,309)(5,309)(5,309)(5,309) ( 10 ,020)( 10 ,020)( 10 ,020)( 10 ,020)
Interests paid, net (2,272) (644)
Foreign exchange (losses)/gains 393 (760)
Net results from associated companies 75 9
Income taxes paid (3,505) (8,625)
Cash flow provided by (used in) i nvesting activi ti es (E)Cash flow provided by (used in) i nvesting activi ti es (E)Cash flow provided by (used in) i nvesting activi ti es (E)Cash flow provided by (used in) i nvesting activi ti es (E) (2,263)(2,263)(2,263)(2,263) (105,981)(105,981)(105,981)(105,981)
Net investments in property, plant and equipment (3,425) (6,010)
Net investments in intangible assets (280) (1,098)
Changes in other non current assets and liabilities 848 73
EDSlan business combination - (17,065)
Itway business combination 594 (8,731)Vinzeo business combination - (73,150)
Cash flow provided by (used in) financ ing activi ti es (F)Cash flow provided by (used in) financ ing activi ti es (F)Cash flow provided by (used in) financ ing activi ti es (F)Cash flow provided by (used in) financ ing activi ti es (F) (12,695)(12,695)(12,695)(12,695) 77,41277,41277,41277,412
Medium/long term borrowing 165,000 -
Repayment/renegotiation of medium/long-term borrowings (112,162) (23,078)
Net change in financial liabilities (59,224) 106,763
Net change in financial assets and derivative instruments 5,562 (3,371)
Deferred price Itway acquisition (4,718) 4,718
Dividend payments (6,987) (7,764)
Increase/(decrease) in 'cash flow edge' equity reserve (214) (61)
Changes in third parties net equity 48 205
Net increase/(decrease) in cash and cash equ ivalents (G=D+E+F)Net increase/(decrease) in cash and cash equ ivalents (G=D+E+F)Net increase/(decrease) in cash and cash equ ivalents (G=D+E+F)Net increase/(decrease) in cash and cash equ ivalents (G=D+E+F) 11 ,03611 ,03611 ,03611 ,036 5,8445,8445,8445,844
Cash and cash equ ivalents at year-beginningCash and cash equ ivalents at year-beginningCash and cash equ ivalents at year-beginningCash and cash equ ivalents at year-beginning 285,933285,933285,933285,933 280,089280,089280,089280,089
Net increase/(decrease) in cash and cash equ ivalentsNet increase/(decrease) in cash and cash equ ivalentsNet increase/(decrease) in cash and cash equ ivalentsNet increase/(decrease) in cash and cash equ ivalents 11 ,03611 ,03611 ,03611 ,036 5,8445,8445,8445,844
Cash and cash equ ivalents at year-endCash and cash equ ivalents at year-endCash and cash equ ivalents at year-endCash and cash equ ivalents at year-end 296,969296,969296,969296,969 285,933285,933285,933285,933
(euro/000)(euro/000)(euro/000)(euro/000) 2017 2017 2017 2017 2016 2016 2016 2016
18
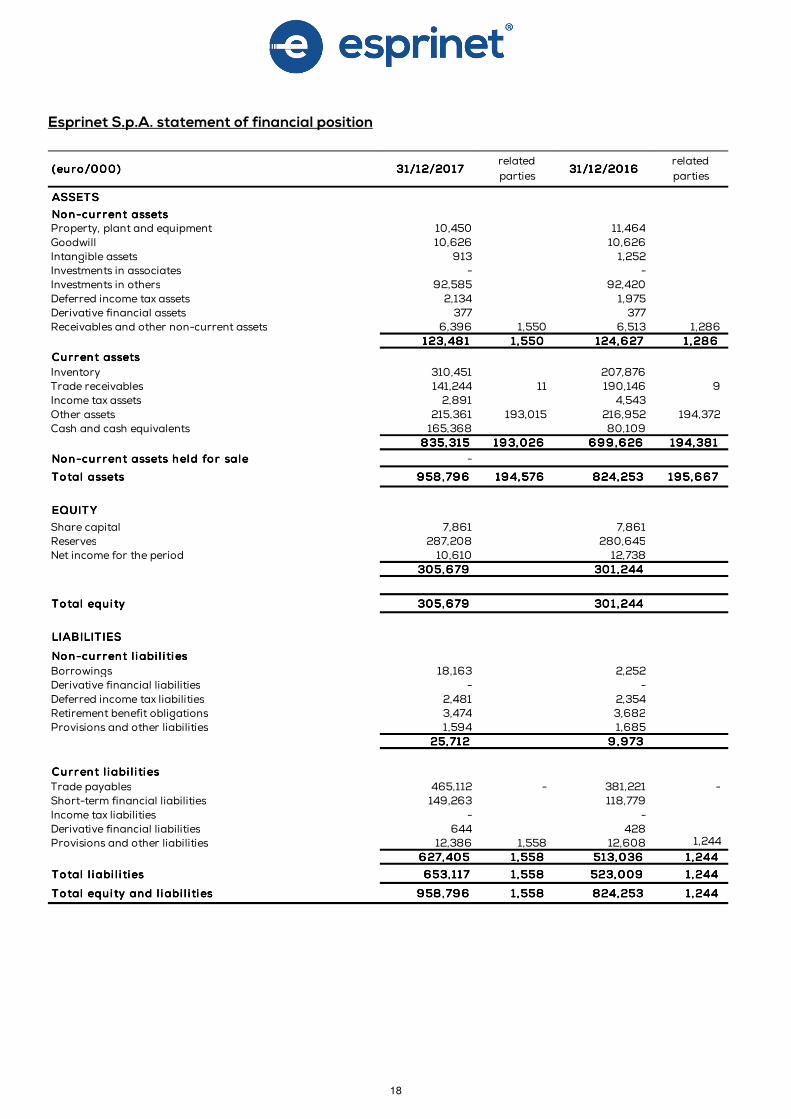
Esprinet S.p.A. statement of financial position
ASSETSASSETSASSETSASSETS
Non-current assetsNon-current assetsNon-current assetsNon-current assetsProperty, plant and equipment 10,450 11,464 Goodwill 10,626 10,626 Intangible assets 913 1,252 Investments in associates - - Investments in others 92,585 92,420 Deferred income tax assets 2,134 1,975 Derivative financial assets 377 377 Receivables and other non-current assets 6,396 1,550 6,513 1,286
123,481123,481123,481123,481 1 ,5501 ,5501 ,5501 ,550 124,627124,627124,627124,627 1 ,2861 ,2861 ,2861 ,286
Current assetsCurrent assetsCurrent assetsCurrent assets
Inventory 310,451 207,876 Trade receivables 141,244 11 190,146 9 Income tax assets 2,891 4,543 Other assets 215,361 193,015 216,952 194,372 Cash and cash equivalents 165,368 80,109
835,315835,315835,315835,315 193,026193,026193,026193,026 699 ,626699,626699,626699,626 194,381194,381194,381194,381
Non-current assets held for saleNon-current assets held for saleNon-current assets held for saleNon-current assets held for sale -
Total assetsTotal assetsTotal assetsTotal assets 958,796958,796958,796958,796 194,576194,576194,576194,576 824,253824,253824,253824,253 195,667195,667195,667195,667
EQUITYEQUITYEQUITYEQUITY
Share capital 7,861 7,861 Reserves 287,208 280,645 Net income for the period 10,610 12,738
305,679305,679305,679305,679 301 ,244301 ,244301 ,244301 ,244
Non-contro l l ing interestsNon-contro l l ing interestsNon-contro l l ing interestsNon-contro l l ing interests
Total equ i tyTotal equ i tyTotal equ i tyTotal equ i ty 305,679305,679305,679305,679 301 ,244301 ,244301 ,244301 ,244
LIABILIT IESLIABILIT IESLIABILIT IESLIABILIT IES
Non-current l i abi l i ti esNon-current l i abi l i ti esNon-current l i abi l i ti esNon-current l i abi l i ti es
Borrowings 18,163 2,252 Derivative financial liabilities - - Deferred income tax liabilities 2,481 2,354 Retirement benefit obligations 3,474 3,682 Provisions and other liabilities 1,594 1,685
25,71225,71225,71225,712 9 ,9739,9739,9739,973
Current l iabi l i tiesCurrent l iabi l i tiesCurrent l iabi l i tiesCurrent l iabi l i ties
Trade payables 465,112 - 381,221 - Short-term financial liabilities 149,263 118,779 Income tax liabilities - - Derivative financial liabilities 644 428 Provisions and other liabilities 12,386 1,558 12,608 1,244
627,405627,405627,405627,405 1 ,5581 ,5581 ,5581 ,558 513,036513,036513,036513,036 1 ,2441 ,2441 ,2441 ,244
Total l iabi l i tiesTotal l iabi l i tiesTotal l iabi l i tiesTotal l iabi l i ties 653,117653,117653,117653,117 1 ,5581 ,5581 ,5581 ,558 523,009523,009523,009523,009 1 ,2441 ,2441 ,2441 ,244
Total equ i ty and l i abi l i ti esTotal equ i ty and l i abi l i ti esTotal equ i ty and l i abi l i ti esTotal equ i ty and l i abi l i ti es 958,796958,796958,796958,796 1 ,5581 ,5581 ,5581 ,558 824,253824,253824,253824,253 1 ,2441 ,2441 ,2441 ,244
related
parties(euro/000)(euro/000)(euro/000)(euro/000) 31/12/201731/12/201731/12/201731/12/2017
related
parties31/12/201631/12/201631/12/201631/12/2016
19
Esprinet S.p.A. separate income statement
* Emoluments to key managers excluded.
Esprinet S.p.A. statement of comprehensive income
Sales 1 ,917,5591 ,917,5591 ,917,5591 ,917,559 - 62,532 1 ,951 ,8451 ,951 ,8451 ,951 ,8451 ,951 ,845 - 50,520
Cost of sales (1,819,846) - (3,767) (1,848,573) - (2,585)
Gross profi tGross profi tGross profi tGross profi t 97,71397,71397,71397,713 - 103,272103,272103,272103,272 -
Sales and marketing costs (30,181) - (1,335) (30,204) - (1,438)
Overheads and administrative costs (51,136) (235) (1,656) (53,556) (3,447) (1,722)
Operating income (EBIT )Operating income (EBIT )Operating income (EBIT )Operating income (EBIT ) 16 ,39616,39616,39616,396 (235) 19 ,51219,51219,51219,512 (3 ,447)
Finance costs - net (1,880) - 1,050 (1,909) - 1,144
Other investments expenses/(incomes) - - - - - -
Profi t before income taxProfi t before income taxProfi t before income taxProfi t before income tax 14,51614,51614,51614,516 (235) 17,60317,60317,60317,603 (3 ,447)
Income tax expenses (3,906) 65 - (4,865) 1,064 -
Net incomeNet incomeNet incomeNet income 10,61010,61010,61010,610 (170) 12,73812,73812,73812,738 (2 ,383)
- o f which attributable to non-controlling interests - -
- o f which attributable to Group 10,610 (170) 12,738 (2,383)
(euro/000)(euro/000)(euro/000)(euro/000) non-recurring related parties* non-recurring related parties*2017201720172017 2016201620162016
Net incomeNet incomeNet incomeNet income 10,61010,61010,61010,610 12,73812,73812,73812,738
Other comprehensive income:
- Changes in 'cash flow hedge' equity reserve (282) (13)
- Taxes on changes in 'cash flow hedge' equity reserve 68 17
Other comprehensive income not to be reclassified in the separate income statement
- Changes in 'TFR' equity reserve 1 (136)
- Taxes on changes in 'TFR' equity reserve (0) 30
Other comprehensive incomeOther comprehensive incomeOther comprehensive incomeOther comprehensive income (214)(214)(214)(214) (102)(102)(102)(102)
Total comprehensive incomeTotal comprehensive incomeTotal comprehensive incomeTotal comprehensive income 10,39610,39610,39610,396 12,63612,63612,63612,636
- of which attributable to Group 10,396 12,636
- of which, attributable to non-controlling interests - -
(euro/000)(euro/000)(euro/000)(euro/000) 2017201720172017 2016201620162016
20
Esprinet S.p.A. statement of changes in equity
Esprinet S.p.A. net financial position
Balance at 31 December 2015Balance at 31 December 2015Balance at 31 December 2015Balance at 31 December 2015 7,8617,8617,8617,861 269,309269,309269,309269,309 (5, 145)(5, 145)(5, 145)(5, 145) 22,94322,94322,94322,943 294,968294,968294,968294,968
Total comprehensive income/( loss)Total comprehensive income/( loss)Total comprehensive income/( loss)Total comprehensive income/( loss) ---- ( 102)(102)(102)(102) ---- 12,73812,73812,73812,738 12,63612,63612,63612,636
Allocation of last year net income/(loss) - 15,179 - (15,179) ----
Dividend payment - - - (7,764) (7,764)(7,764)(7,764)(7,764)
Transactions wi th ownersTransactions wi th ownersTransactions wi th ownersTransactions wi th owners - 15,179 - (22,943)(22,943)(22,943)(22,943) (7,764)(7,764)(7,764)(7,764)
Changes in 'stock grant' plan reserve - 1,404 - - 1 ,4041 ,4041 ,4041 ,404
Balance at 31 December 2016Balance at 31 December 2016Balance at 31 December 2016Balance at 31 December 2016 7,8617,8617,8617,861 285,790285,790285,790285,790 (5, 145)(5, 145)(5, 145)(5, 145) 12,73812,73812,73812,738 301 ,244301 ,244301 ,244301 ,244
Total comprehensive income/( loss)Total comprehensive income/( loss)Total comprehensive income/( loss)Total comprehensive income/( loss) ---- (214)(214)(214)(214) ---- 10 ,61010 ,61010 ,61010 ,610 10 ,39610 ,39610 ,39610 ,396
Allocation of last year net income/(loss) - 5,751 - (5,751) ----
Dividend payment - - - (6,987) (6 ,987)(6 ,987)(6 ,987)(6 ,987)
Transactions wi th ownersTransactions wi th ownersTransactions wi th ownersTransactions wi th owners - 5,751 - ( 12,738)(12,738)(12,738)(12,738) (6 ,987)(6 ,987)(6 ,987)(6 ,987)
Changes in 'stock grant' plan reserve - 1,026 - - 1 ,0261 ,0261 ,0261 ,026
Balance at 31 December 2017Balance at 31 December 2017Balance at 31 December 2017Balance at 31 December 2017 7,8617,8617,8617,861 292,353292,353292,353292,353 (5, 145)(5, 145)(5, 145)(5, 145) 10 ,61010 ,61010 ,61010 ,610 305,679305,679305,679305,679
(euro/000)(euro/000)(euro/000)(euro/000)Share Share Share Share
capi talcapi talcapi talcapi talReservesReservesReservesReserves Own sharesOwn sharesOwn sharesOwn shares
Profi t for Profi t for Profi t for Profi t for
the per iodthe per iodthe per iodthe per iod
Total net Total net Total net Total net
equ i tyequ i tyequ i tyequ i ty
(euro/000)(euro/000)(euro/000)(euro/000) 31/12/201731/12/201731/12/201731/12/2017 31/12/201631/12/201631/12/201631/12/2016 Var . Var . Var . Var .
Short-term financial liabilities 149,263 118,779 30,484
Customer financial receivables (510) (509) (1)
Current financial (assets)/liabilities for derivatives 644 428 216
Financial receivables from factoring companies (1,202) (1,176) (26)
Financial (assets)/liab. From/to Group companies (157,500) (151,500) (6,000)
Cash and cash equivalents (165,368) (80,109) (85,259)
Net current financ ial debtNet current financ ial debtNet current financ ial debtNet current financ ial debt ( 174,673)( 174,673)( 174,673)( 174,673) (1 14,087)(1 14,087)(1 14,087)(1 14,087) (60 ,586)(60 ,586)(60 ,586)(60 ,586)
Borrowings 18,163 2,252 15,911
Non-current financial (assets)/liabilities for derivatives (377) (377) -
Customer financial receivables (1,870) (2,292) 422
Net financial debtNet financial debtNet financial debtNet financial debt ( 158,757)( 158,757)( 158,757)( 158,757) (1 14,504)(114,504)(114,504)(114,504) (44,253)(44,253)(44,253)(44,253)
21
Esprinet S.p.A. statement of cash flows
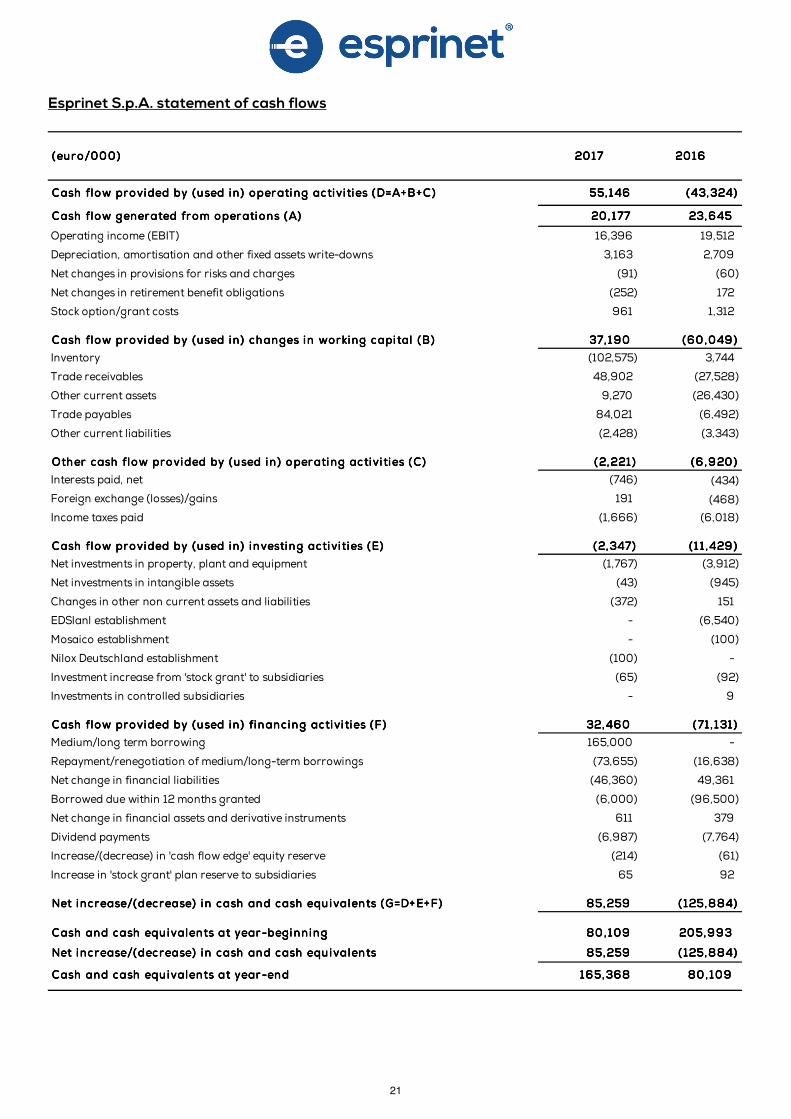
Cash flow provided by (used in) operating activi ties (D=A+B+C)Cash flow provided by (used in) operating activi ties (D=A+B+C)Cash flow provided by (used in) operating activi ties (D=A+B+C)Cash flow provided by (used in) operating activi ties (D=A+B+C) 55,14655,14655,14655,146 (43,324)(43,324)(43,324)(43,324)
Cash flow generated from operations (A)Cash flow generated from operations (A)Cash flow generated from operations (A)Cash flow generated from operations (A) 20,17720,17720,17720,177 23,64523,64523,64523,645
Operating income (EBIT) 16,396 19,512
Depreciation, amortisation and other fixed assets write-downs 3,163 2,709
Net changes in provisions for risks and charges (91) (60)
Net changes in retirement benefit obligations (252) 172
Stock option/grant costs 961 1,312
Cash flow provided by (used in) changes in working capi tal (B)Cash flow provided by (used in) changes in working capi tal (B)Cash flow provided by (used in) changes in working capi tal (B)Cash flow provided by (used in) changes in working capi tal (B) 37,19037,19037,19037,190 (60 ,049)(60 ,049)(60 ,049)(60 ,049)
Inventory (102,575) 3,744
Trade receivables 48,902 (27,528)
Other current assets 9,270 (26,430)
Trade payables 84,021 (6,492)
Other current liabilities (2,428) (3,343)
Other cash flow provided by (used in ) operating activi ties (C)Other cash flow provided by (used in ) operating activi ties (C)Other cash flow provided by (used in ) operating activi ties (C)Other cash flow provided by (used in ) operating activi ties (C) (2,221 )(2,221 )(2,221 )(2,221 ) (6 ,920)(6 ,920)(6 ,920)(6 ,920)
Interests paid, net (746) (434)
Foreign exchange (losses)/gains 191 (468)
Income taxes paid (1,666) (6,018)
Cash flow provided by (used in) investing activi ties (E)Cash flow provided by (used in) investing activi ties (E)Cash flow provided by (used in) investing activi ties (E)Cash flow provided by (used in) investing activi ties (E) (2,347)(2,347)(2,347)(2,347) (1 1 ,429)(1 1 ,429)(1 1 ,429)(1 1 ,429)
Net investments in property, plant and equipment (1,767) (3,912)
Net investments in intangible assets (43) (945)
Changes in other non current assets and liabilities (372) 151
EDSlanl establishment - (6,540)
Mosaico establishment - (100)
Nilox Deutschland establishment (100) -
Investment increase from 'stock grant' to subsidiaries (65) (92)
Investments in controlled subsidiaries - 9
Cash flow provided by (used in) financing activi ties (F)Cash flow provided by (used in) financing activi ties (F)Cash flow provided by (used in) financing activi ties (F)Cash flow provided by (used in) financing activi ties (F) 32,46032,46032,46032,460 (71 , 131 )(71 , 131 )(71 , 131 )(71 , 131 )
Medium/long term borrowing 165,000 -
Repayment/renegotiation of medium/long-term borrowings (73,655) (16,638)
Net change in financial liabilities (46,360) 49,361
Borrowed due within 12 months granted (6,000) (96,500)
Net change in financial assets and derivative instruments 611 379
Dividend payments (6,987) (7,764)
Increase/(decrease) in 'cash flow edge' equity reserve (214) (61)
Increase in 'stock grant' plan reserve to subsidiaries 65 92
Net increase/(decrease) in cash and cash equ ivalents (G=D+E+F)Net increase/(decrease) in cash and cash equ ivalents (G=D+E+F)Net increase/(decrease) in cash and cash equ ivalents (G=D+E+F)Net increase/(decrease) in cash and cash equ ivalents (G=D+E+F) 85,25985,25985,25985,259 ( 125,884)( 125,884)( 125,884)( 125,884)
Cash and cash equ ivalents at year-beginn ingCash and cash equ ivalents at year-beginn ingCash and cash equ ivalents at year-beginn ingCash and cash equ ivalents at year-beginn ing 80 ,10980,10980,10980,109 205,993205,993205,993205,993
Net increase/(decrease) in cash and cash equ ivalentsNet increase/(decrease) in cash and cash equ ivalentsNet increase/(decrease) in cash and cash equ ivalentsNet increase/(decrease) in cash and cash equ ivalents 85,25985,25985,25985,259 ( 125,884)( 125,884)( 125,884)( 125,884)
Cash and cash equ ivalents at year-endCash and cash equ ivalents at year-endCash and cash equ ivalents at year-endCash and cash equ ivalents at year-end 165,368165,368165,368165,368 80 ,10980,10980,10980,109
(euro/000)(euro/000)(euro/000)(euro/000) 2017201720172017 2016201620162016


![Raymond James Conference - Esprinet S.p.A. - IT & …investor.esprinet.com/contenuti/download/[11.12.2014]Esprinet_RJ.pdf · Technology wholesale distributor in Italy, ... 13 AVNET](https://img.pdfslide.us/doc/110x75/5ac2d6487f8b9aae1b8b9eff/raymond-james-conference-esprinet-spa-it-11122014esprinetrjpdftechnology.jpg)
![Esprinet Group Investor Conferenceinvestor.esprinet.com/contenuti/download/[15.09.2015]PRT... · 2015-09-15 · • Outsourced sales & marketing force • Broad Customer Base •](https://img.pdfslide.us/doc/110x75/5f1cb71858cae127e93da045/esprinet-group-investor-15092015prt-2015-09-15-a-outsourced-sales-.jpg)


![Esprinet Group STAR Conferenceinvestor.esprinet.com/contenuti/download/[30.03.2015]STAR...2015/03/30 · events and are subject to a number of uncertainties and other factors, many](https://img.pdfslide.us/doc/110x75/5f030fcb7e708231d4075800/esprinet-group-star-30032015star-20150330-events-and-are-subject-to-a.jpg)
![ESPRINET STranslate this pageinvestor.esprinet.com/contenuti/download/[04.04.2014]2013...2014-04-04 · ESPRINET S.P.A. RELAZIONE SUL GOVERNO SOCIETARIO E GLI ASSETTI PROPRIETARI ai](https://img.pdfslide.us/doc/110x75/5f399b95d5818411ea3aabde/esprinet-stranslate-this-040420142013-2014-04-04-esprinet-spa-relazione.jpg)


![2016 second quarter - Esprinetinvestor.esprinet.com/contenuti/download/[15.09.2016]H1...2016/09/15 · 1 Press release in accordance with Consob Regulation n. 11971/99 Esprinet to](https://img.pdfslide.us/doc/110x75/5f746168ccf002319d234c9a/2016-second-quarter-15092016h1-20160915-1-press-release-in-accordance.jpg)