Embed Size (px)
Citation preview
Q2 2019 Financial Highlights
September 12, 2019
2
Forward looking statement
This presentation may contain forward-looking statements that are subject to risks and uncertainties, including those pertaining to the anticipated benefits to be realized from the proposals described herein. Forward-looking statements may include, in particular, statements about future events, future financial performance, plans, strategies, expectations, prospects, competitive environment, regulation, supply and demand.
Esprinet has based these forward-looking statements on its view and assumptions with respect to future events and financial performance. Actual financial performance could differ materially from that projected in the forward-looking statements due to the inherent uncertainty of estimates, forecasts and projections, and financial performance may be better or worse than anticipated.
Given these uncertainties, readers should not put undue reliance on any forward-looking statements. The information contained in this presentation is subject to change without notice and Esprinet does not undertake any duty to update the forward-looking statements, and the estimates and the assumptions associated with them, except to the extent required by applicable laws and regulations.

FINANCIALS
BUSINESS UPDATE
OUTLOOK & FINAL REMARKS
Q&A SESSION
AGENDA
4
ICONA
ICONA
ICONA
ICONA
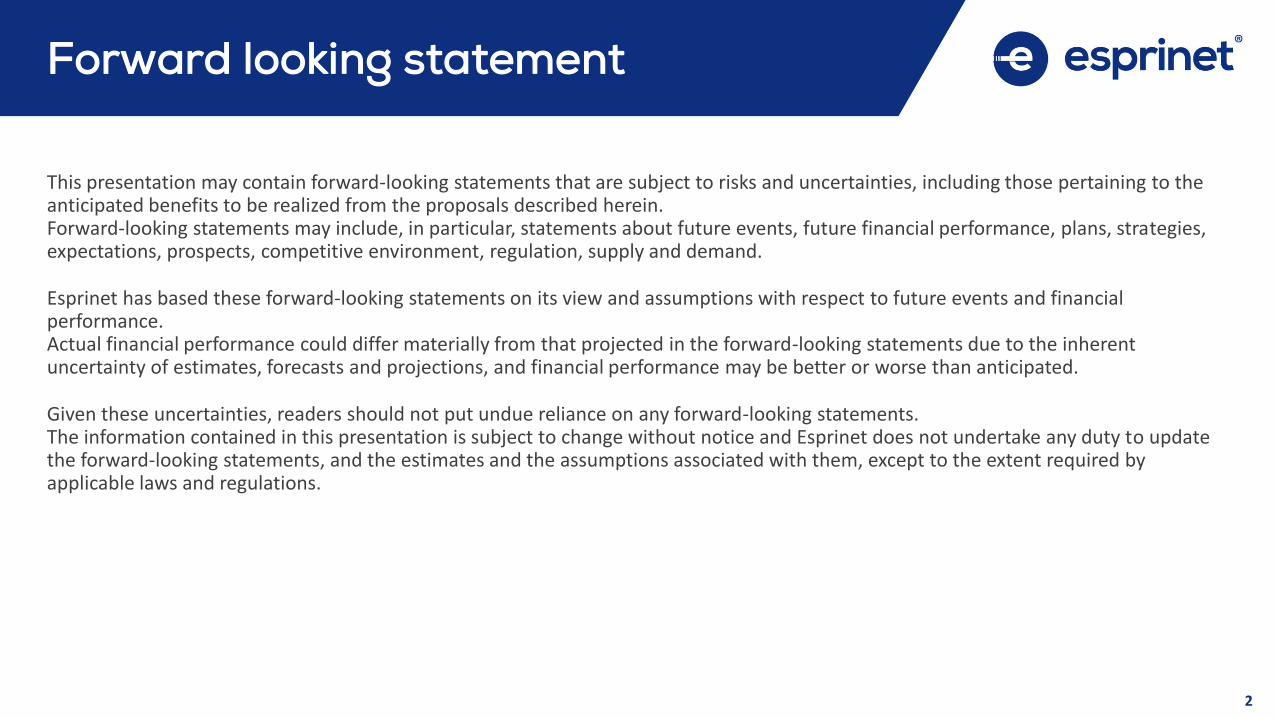
Q2 in a nutshell
Sales
EBIT
Net profit
Net financial debt
842 M€
7.2 M€(1)
4.6 M€
183.1 M€
+11% on Q2 2018
+30% on Q2 2018
+67% on Q2 2018
90.0 M€ excluding IFRS 16
NOTES(1) 6.2 M€ (+12%) excluding effects of IFRS 16 «Leases».

FINANCIALS
6
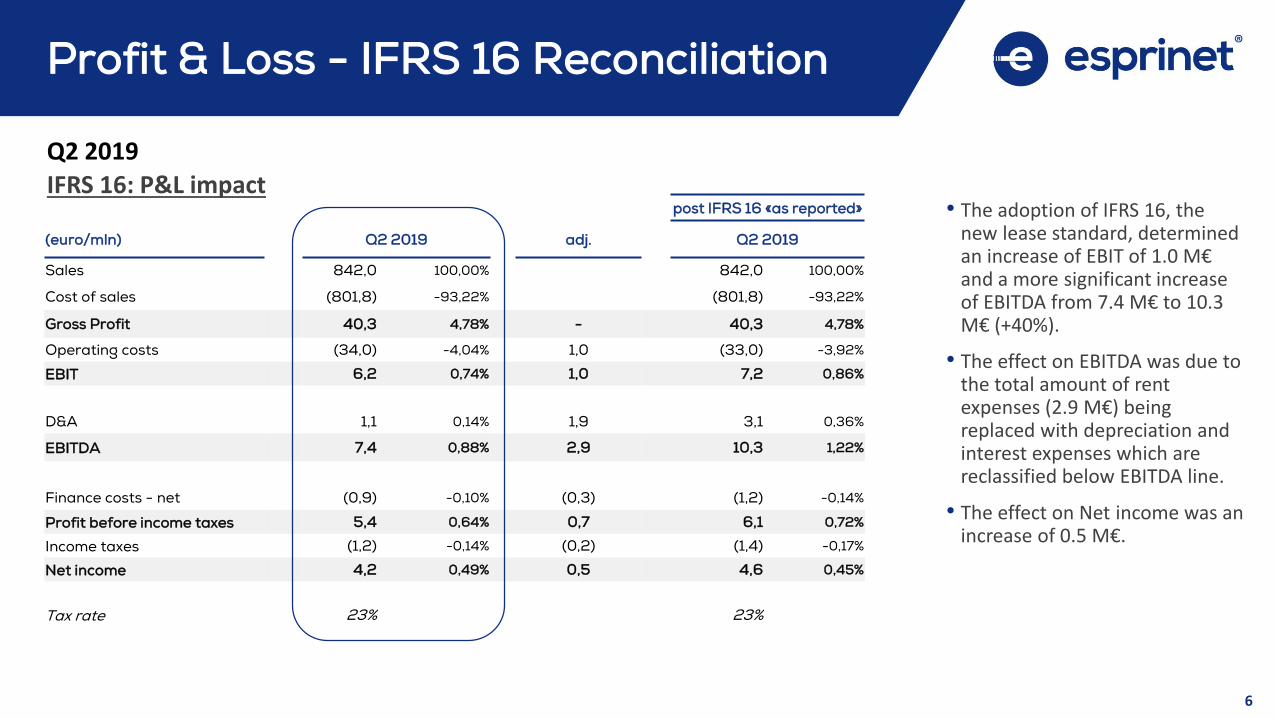
Profit & Loss - IFRS 16 Reconciliation
IFRS 16: P&L impactpost IFRS 16 «as reported»
(euro/mln) Q2 2019 adj. Q2 2019
Sales 842,0 100,00% 842,0 100,00%
Cost of sales (801,8) -93,22% (801,8) -93,22%
Gross Profit 40,3 4,78% - 40,3 4,78%
Operating costs (34,0) -4,04% 1,0 (33,0) -3,92%
EBIT 6,2 0,74% 1,0 7,2 0,86%
D&A 1,1 0,14% 1,9 3,1 0,36%
EBITDA 7,4 0,88% 2,9 10,3 1,22%
Finance costs - net (0,9) -0,10% (0,3) (1,2) -0,14%
Profit before income taxes 5,4 0,64% 0,7 6,1 0,72%
Income taxes (1,2) -0,14% (0,2) (1,4) -0,17%
Net income 4,2 0,49% 0,5 4,6 0,45%
Tax rate 23% 23%
• The adoption of IFRS 16, the new lease standard, determinedan increase of EBIT of 1.0 M€ and a more significant increaseof EBITDA from 7.4 M€ to 10.3 M€ (+40%).
• The effect on EBITDA was due to the total amount of rent expenses (2.9 M€) beingreplaced with depreciation and interest expenses which are reclassified below EBITDA line.
• The effect on Net income was an increase of 0.5 M€.
Q2 2019
7
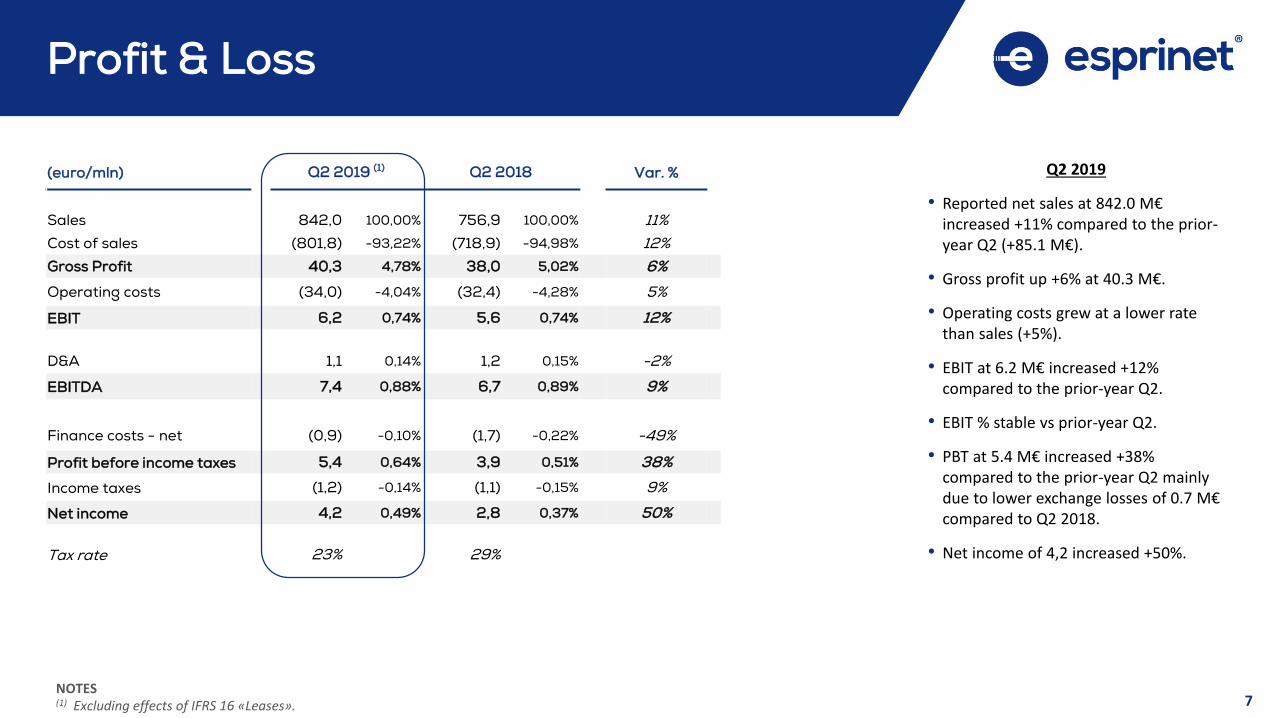
Profit & Loss
(euro/mln) Q2 2019 (1) Q2 2018 Var. %
Sales 842,0 100,00% 756,9 100,00% 11%
Cost of sales (801,8) -93,22% (718,9) -94,98% 12%
Gross Profit 40,3 4,78% 38,0 5,02% 6%
Operating costs (34,0) -4,04% (32,4) -4,28% 5%
EBIT 6,2 0,74% 5,6 0,74% 12%
D&A 1,1 0,14% 1,2 0,15% -2%
EBITDA 7,4 0,88% 6,7 0,89% 9%
Finance costs - net (0,9) -0,10% (1,7) -0,22% -49%
Profit before income taxes 5,4 0,64% 3,9 0,51% 38%
Income taxes (1,2) -0,14% (1,1) -0,15% 9%
Net income 4,2 0,49% 2,8 0,37% 50%
Tax rate 23% 29%
NOTES(1) Excluding effects of IFRS 16 «Leases».
Q2 2019
• Reported net sales at 842.0 M€ increased +11% compared to the prior-year Q2 (+85.1 M€).
• Gross profit up +6% at 40.3 M€.
• Operating costs grew at a lower rate than sales (+5%).
• EBIT at 6.2 M€ increased +12% compared to the prior-year Q2.
• EBIT % stable vs prior-year Q2.
• PBT at 5.4 M€ increased +38% compared to the prior-year Q2 mainly due to lower exchange losses of 0.7 M€ compared to Q2 2018.
• Net income of 4,2 increased +50%.
8
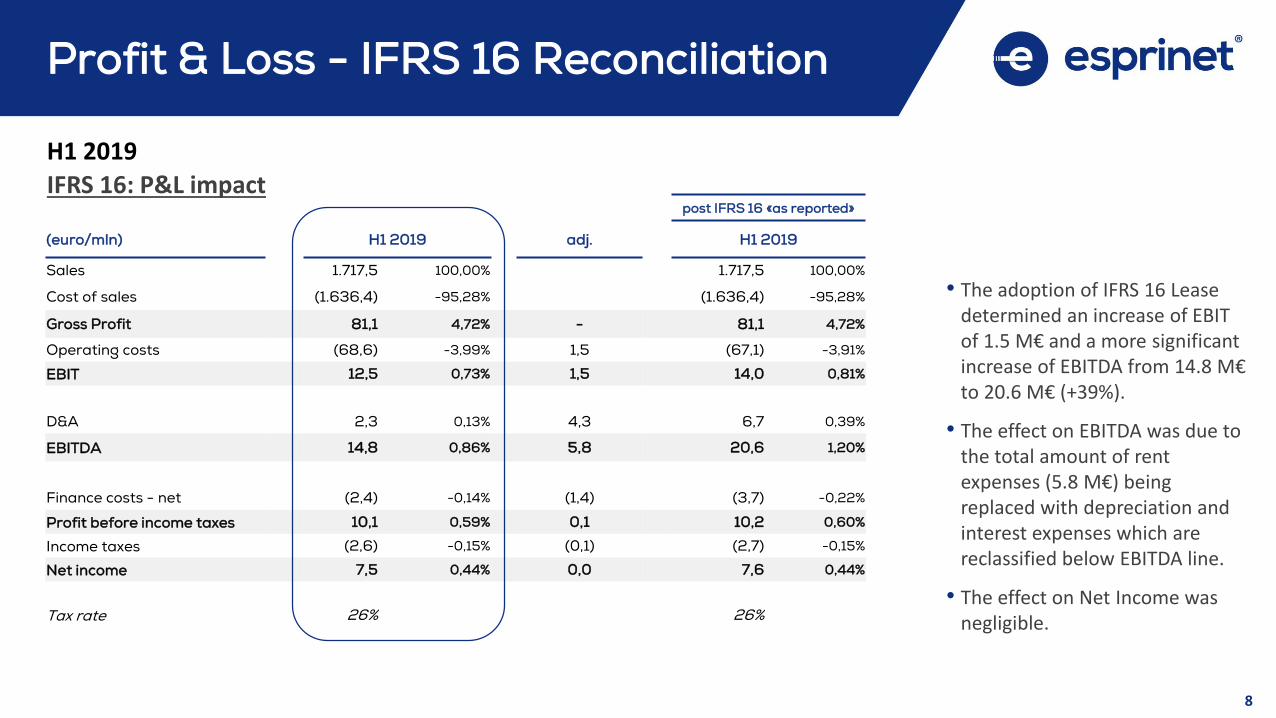
Profit & Loss - IFRS 16 Reconciliation
IFRS 16: P&L impactpost IFRS 16 «as reported»
(euro/mln) H1 2019 adj. H1 2019
Sales 1.717,5 100,00% 1.717,5 100,00%
Cost of sales (1.636,4) -95,28% (1.636,4) -95,28%
Gross Profit 81,1 4,72% - 81,1 4,72%
Operating costs (68,6) -3,99% 1,5 (67,1) -3,91%
EBIT 12,5 0,73% 1,5 14,0 0,81%
D&A 2,3 0,13% 4,3 6,7 0,39%
EBITDA 14,8 0,86% 5,8 20,6 1,20%
Finance costs - net (2,4) -0,14% (1,4) (3,7) -0,22%
Profit before income taxes 10,1 0,59% 0,1 10,2 0,60%
Income taxes (2,6) -0,15% (0,1) (2,7) -0,15%
Net income 7,5 0,44% 0,0 7,6 0,44%
Tax rate 26% 26%
• The adoption of IFRS 16 Leasedetermined an increase of EBIT of 1.5 M€ and a more significantincrease of EBITDA from 14.8 M€ to 20.6 M€ (+39%).
• The effect on EBITDA was due to the total amount of rent expenses (5.8 M€) beingreplaced with depreciation and interest expenses which are reclassified below EBITDA line.
• The effect on Net Income wasnegligible.
H1 2019
9
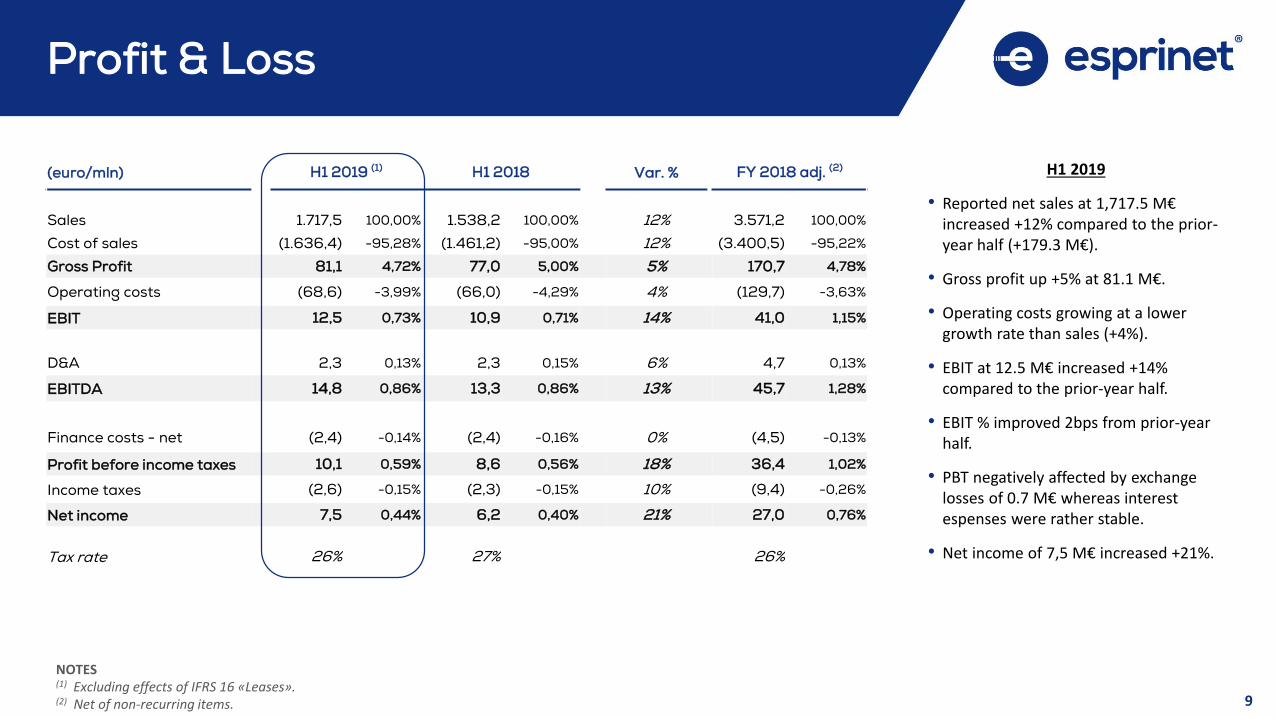
(euro/mln) H1 2019 (1) H1 2018 Var. % FY 2018 adj. (2)
Sales 1.717,5 100,00% 1.538,2 100,00% 12% 3.571,2 100,00%
Cost of sales (1.636,4) -95,28% (1.461,2) -95,00% 12% (3.400,5) -95,22%
Gross Profit 81,1 4,72% 77,0 5,00% 5% 170,7 4,78%
Operating costs (68,6) -3,99% (66,0) -4,29% 4% (129,7) -3,63%
EBIT 12,5 0,73% 10,9 0,71% 14% 41,0 1,15%
D&A 2,3 0,13% 2,3 0,15% 6% 4,7 0,13%
EBITDA 14,8 0,86% 13,3 0,86% 13% 45,7 1,28%
Finance costs - net (2,4) -0,14% (2,4) -0,16% 0% (4,5) -0,13%
Profit before income taxes 10,1 0,59% 8,6 0,56% 18% 36,4 1,02%
Income taxes (2,6) -0,15% (2,3) -0,15% 10% (9,4) -0,26%
Net income 7,5 0,44% 6,2 0,40% 21% 27,0 0,76%
Tax rate 26% 27% 26%
Profit & Loss
NOTES(1) Excluding effects of IFRS 16 «Leases».(2) Net of non-recurring items.
H1 2019
• Reported net sales at 1,717.5 M€ increased +12% compared to the prior-year half (+179.3 M€).
• Gross profit up +5% at 81.1 M€.
• Operating costs growing at a lower growth rate than sales (+4%).
• EBIT at 12.5 M€ increased +14% compared to the prior-year half.
• EBIT % improved 2bps from prior-yearhalf.
• PBT negatively affected by exchangelosses of 0.7 M€ whereas interestespenses were rather stable.
• Net income of 7,5 M€ increased +21%.
10
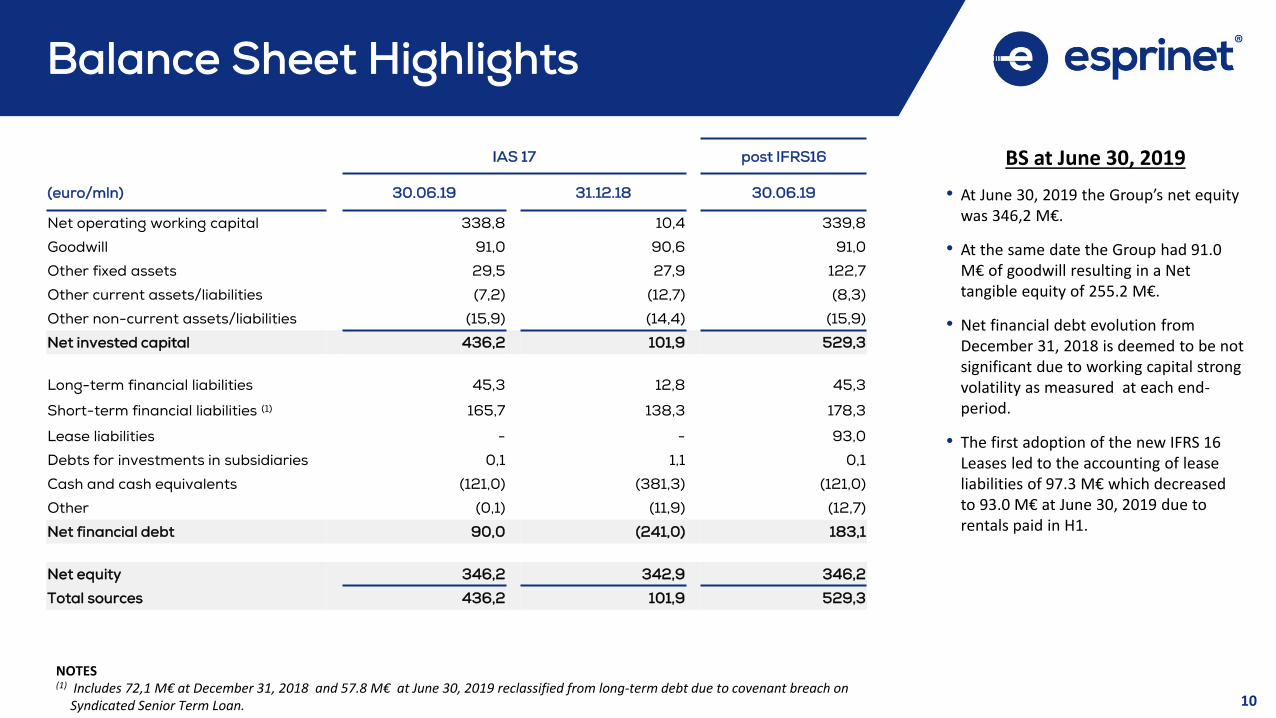
Balance Sheet Highlights
IAS 17 post IFRS16
(euro/mln) 30.06.19 31.12.18 30.06.19
Net operating working capital 338,8 10,4 339,8
Goodwill 91,0 90,6 91,0
Other fixed assets 29,5 27,9 122,7
Other current assets/liabilities (7,2) (12,7) (8,3)
Other non-current assets/liabilities (15,9) (14,4) (15,9)
Net invested capital 436,2 101,9 529,3
Long-term financial liabilities 45,3 12,8 45,3
Short-term financial liabilities (1) 165,7 138,3 178,3
Lease liabilities - - 93,0
Debts for investments in subsidiaries 0,1 1,1 0,1
Cash and cash equivalents (121,0) (381,3) (121,0)
Other (0,1) (11,9) (12,7)
Net financial debt 90,0 (241,0) 183,1
Net equity 346,2 342,9 346,2
Total sources 436,2 101,9 529,3
NOTES(1) Includes 72,1 M€ at December 31, 2018 and 57.8 M€ at June 30, 2019 reclassified from long-term debt due to covenant breach on
Syndicated Senior Term Loan.
BS at June 30, 2019
• At June 30, 2019 the Group’s net equity was 346,2 M€.
• At the same date the Group had 91.0 M€ of goodwill resulting in a Net tangible equity of 255.2 M€.
• Net financial debt evolution from December 31, 2018 is deemed to be not significant due to working capital strong volatility as measured at each end-period.
• The first adoption of the new IFRS 16 Leases led to the accounting of lease liabilities of 97.3 M€ which decreased to 93.0 M€ at June 30, 2019 due to rentals paid in H1.
11
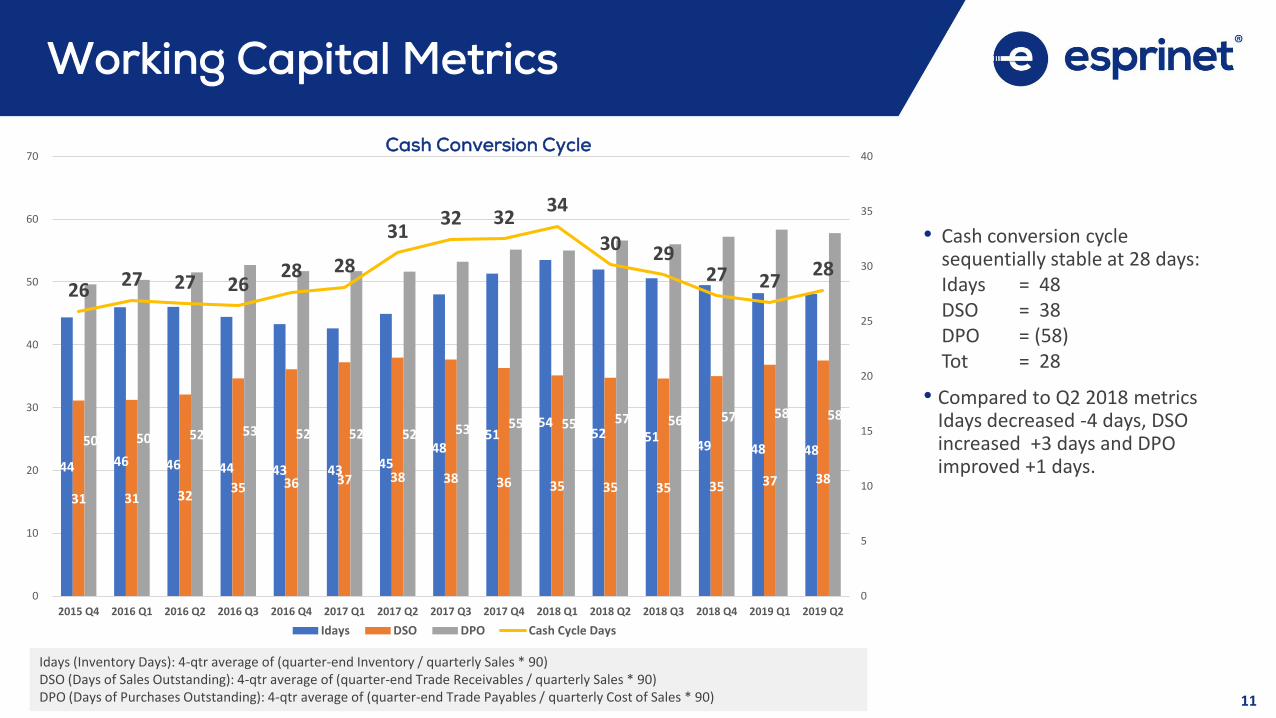
Working Capital Metrics
Idays (Inventory Days): 4-qtr average of (quarter-end Inventory / quarterly Sales * 90)DSO (Days of Sales Outstanding): 4-qtr average of (quarter-end Trade Receivables / quarterly Sales * 90)DPO (Days of Purchases Outstanding): 4-qtr average of (quarter-end Trade Payables / quarterly Cost of Sales * 90)
Cash Conversion Cycle
• Cash conversion cyclesequentially stable at 28 days: Idays = 48DSO = 38DPO = (58) Tot = 28
• Compared to Q2 2018 metricsIdays decreased -4 days, DSO increased +3 days and DPO improved +1 days.44 46 46 44 43 43 45
48 51
54 52 51
49 48 48
31 31 32 35 36 37 38 38 36 35 35 35 35 37 38
50 50 52 53 52 52 52 53 55 55 57 56 57 58 58
26 27 27 26
28 28
31 32 32
34
30 29 27 27
28
0
5
10
15
20
25
30
35
40
0
10
20
30
40
50
60
70
2015 Q4 2016 Q1 2016 Q2 2016 Q3 2016 Q4 2017 Q1 2017 Q2 2017 Q3 2017 Q4 2018 Q1 2018 Q2 2018 Q3 2018 Q4 2019 Q1 2019 Q2
Idays DSO DPO Cash Cycle Days
12
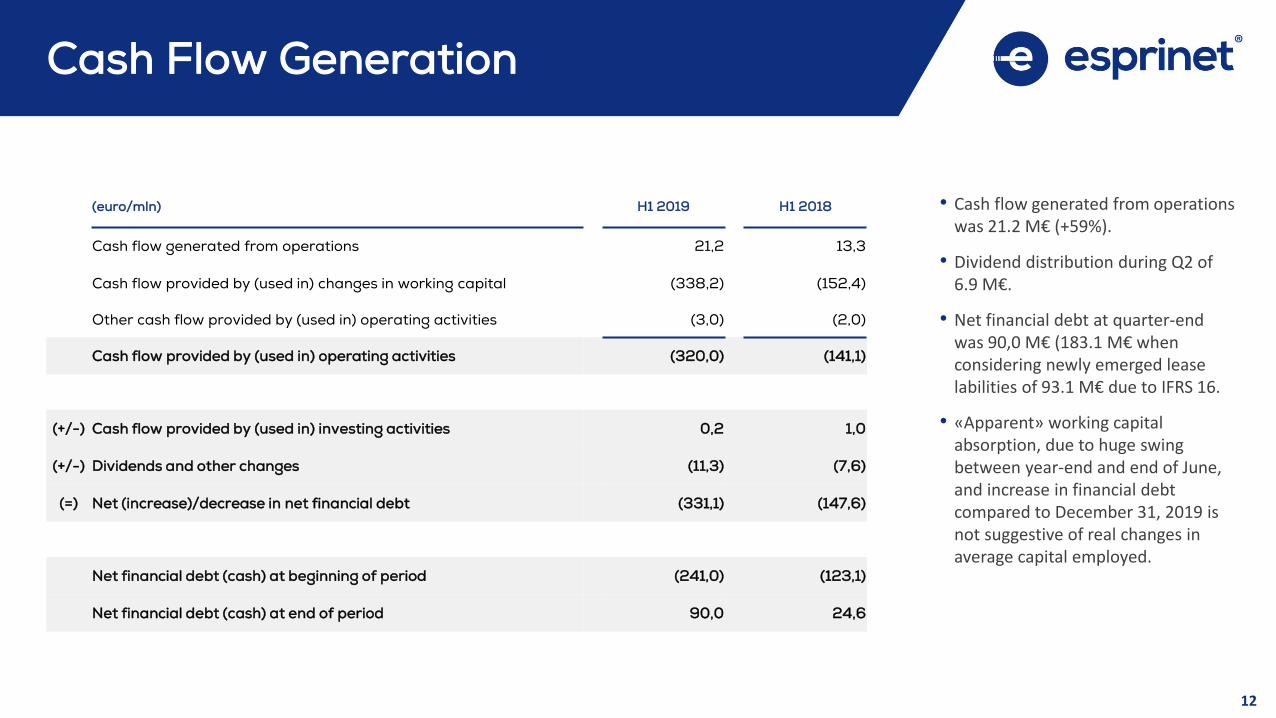
Cash Flow Generation
(euro/mln) H1 2019 H1 2018
Cash flow generated from operations 21,2 13,3
Cash flow provided by (used in) changes in working capital (338,2) (152,4)
Other cash flow provided by (used in) operating activities (3,0) (2,0)
Cash flow provided by (used in) operating activities (320,0) (141,1)
(+/-) Cash flow provided by (used in) investing activities 0,2 1,0
(+/-) Dividends and other changes (11,3) (7,6)
(=) Net (increase)/decrease in net financial debt (331,1) (147,6)
Net financial debt (cash) at beginning of period (241,0) (123,1)
Net financial debt (cash) at end of period 90,0 24,6
• Cash flow generated from operations was 21.2 M€ (+59%).
• Dividend distribution during Q2 of 6.9 M€.
• Net financial debt at quarter-end was 90,0 M€ (183.1 M€ whenconsidering newly emerged leaselabilities of 93.1 M€ due to IFRS 16.
• «Apparent» working capital absorption, due to huge swing between year-end and end of June, and increase in financial debtcompared to December 31, 2019 isnot suggestive of real changes in average capital employed.
13
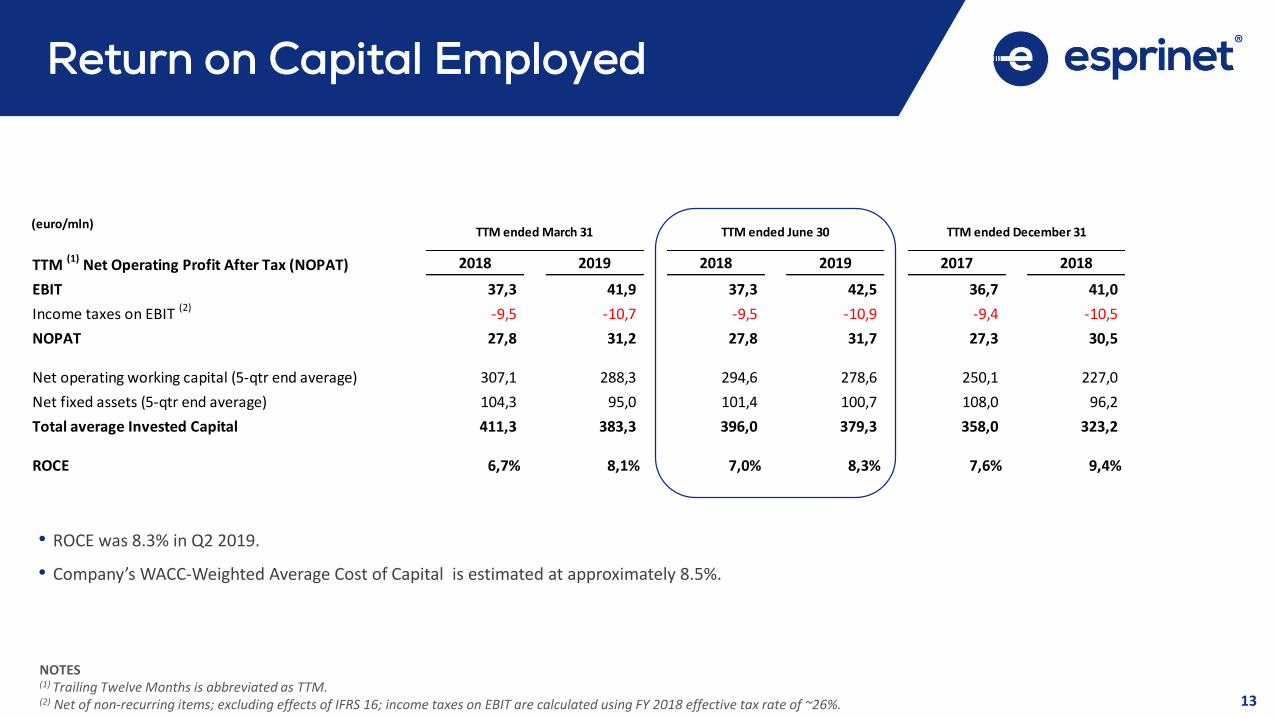
Return on Capital Employed
NOTES(1) Trailing Twelve Months is abbreviated as TTM.(2) Net of non-recurring items; excluding effects of IFRS 16; income taxes on EBIT are calculated using FY 2018 effective tax rate of ~26%.
(euro/mln)
TTM (1)
Net Operating Profit After Tax (NOPAT) 2018 2019 2018 2019 2017 2018
EBIT 37,3 41,9 37,3 42,5 36,7 41,0
Income taxes on EBIT (2)
-9,5 -10,7 -9,5 -10,9 -9,4 -10,5
NOPAT 27,8 31,2 27,8 31,7 27,3 30,5
Net operating working capital (5-qtr end average) 307,1 288,3 294,6 278,6 250,1 227,0
Net fixed assets (5-qtr end average) 104,3 95,0 101,4 100,7 108,0 96,2
Total average Invested Capital 411,3 383,3 396,0 379,3 358,0 323,2
ROCE 6,7% 8,1% 7,0% 8,3% 7,6% 9,4%
TTM ended March 31 TTM ended December 31TTM ended June 30
• ROCE was 8.3% in Q2 2019.
• Company’s WACC-Weighted Average Cost of Capital is estimated at approximately 8.5%.
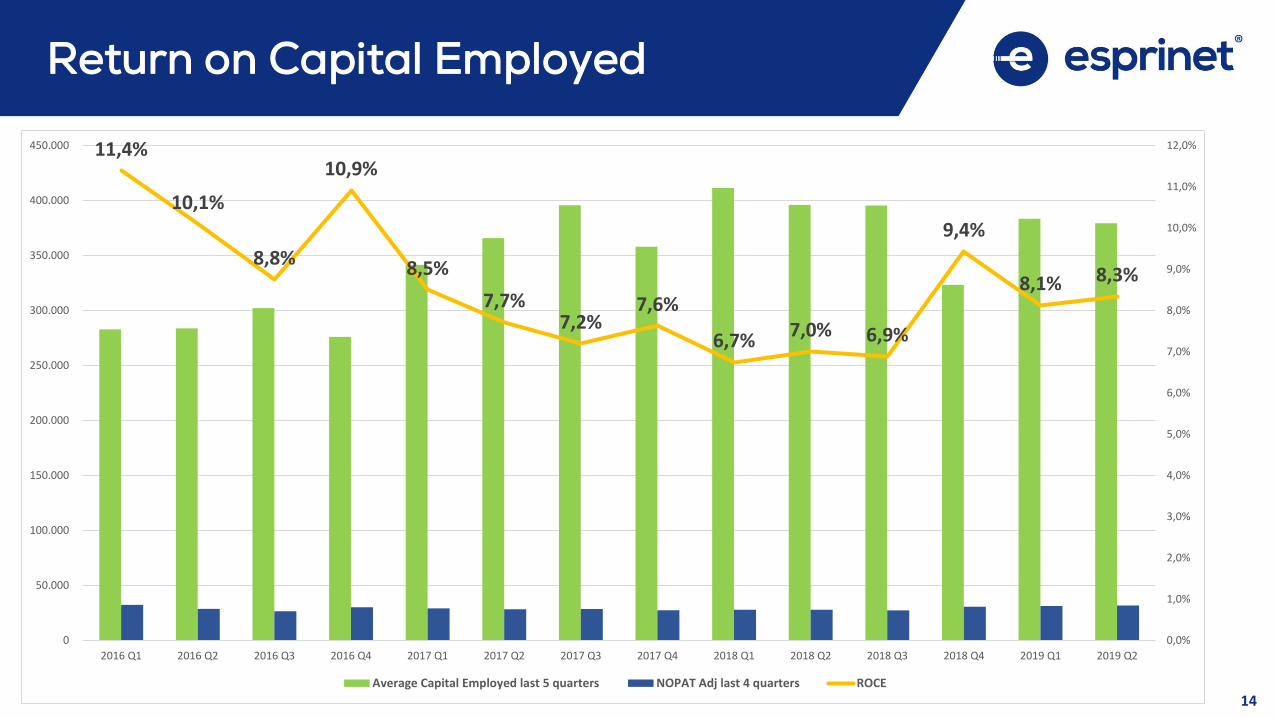
14
Return on Capital Employed
11,4%
10,1%
8,8%
10,9%
8,5%
7,7%7,2%
7,6%
6,7%7,0% 6,9%
9,4%
8,1% 8,3%
0,0%
1,0%
2,0%
3,0%
4,0%
5,0%
6,0%
7,0%
8,0%
9,0%
10,0%
11,0%
12,0%
0
50.000
100.000
150.000
200.000
250.000
300.000
350.000
400.000
450.000
2016 Q1 2016 Q2 2016 Q3 2016 Q4 2017 Q1 2017 Q2 2017 Q3 2017 Q4 2018 Q1 2018 Q2 2018 Q3 2018 Q4 2019 Q1 2019 Q2
Average Capital Employed last 5 quarters NOPAT Adj last 4 quarters ROCE
15
Debt Structure review
• Unsecured 3-year Syndicated Revolving Credit Facility near to be finalised by Esprinet SpA with a pool of 9 Italian andSpanish banks in order to replace oustanding facility expiring in February 2022, the financial covenants of which werebreached based on FY 2018 consolidated results.
• By far, according to official and unofficial approvals from lenders, it’s probable to significantly over-reach fixedmaximum level of up to 125.0 M€.
• The set of covenants supporting the facility is more favorauble because of less stringent thresholds based on morerealistic Group’ financial projections for the next three years.
• The initial timetable envisaging the signing-off of the facility agreement by end of September is still expected to bemet.
• Between end of February and mid-May 2019 a number of unsecured bilateral mid-term loans with local banks werecompleted by spanish subsidiaries (Esprinet Iberica and Vinzeo) amounting at total nominal 47.0 M€ with an averagetenor of approximately 3.5 years.
• Taking into consideration the above, Group’ debt structure can be considered as adequate in terms of size, degree ofcommitment and flexibility to support future business.
16
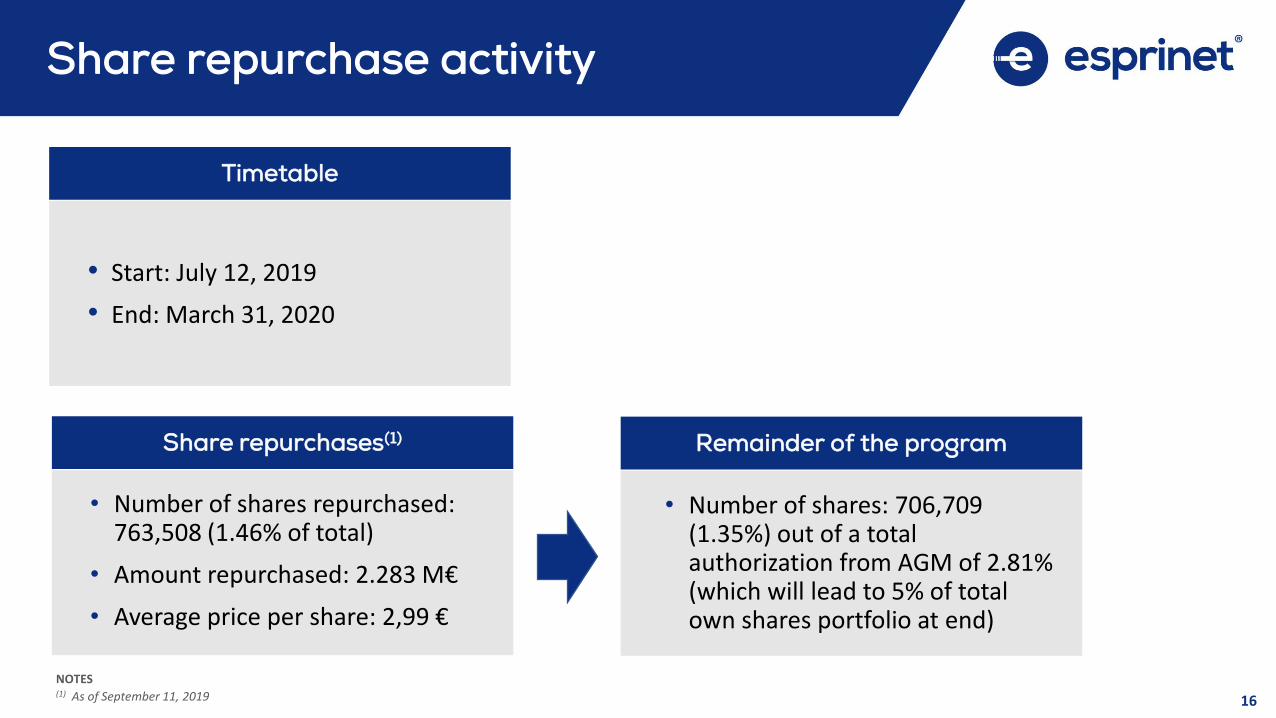
Share repurchase activity
• Start: July 12, 2019
• End: March 31, 2020
Timetable
• Number of shares repurchased: 763,508 (1.46% of total)
• Amount repurchased: 2.283 M€
• Average price per share: 2,99 €
Share repurchases(1) Remainder of the program
NOTES(1) As of September 11, 2019
• Number of shares: 706,709 (1.35%) out of a total authorization from AGM of 2.81% (which will lead to 5% of total own shares portfolio at end)

BUSINESS UPDATE
18
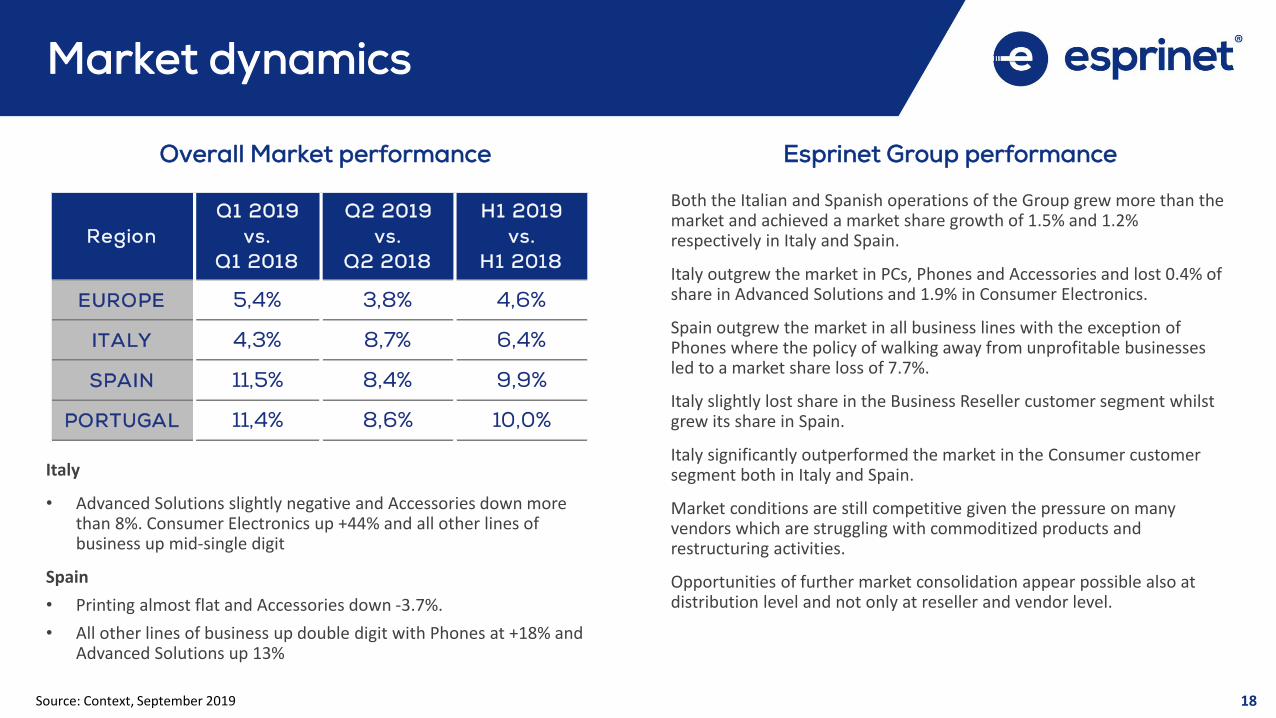
Overall Market performance Esprinet Group performance
Market dynamics
Italy
• Advanced Solutions slightly negative and Accessories down more than 8%. Consumer Electronics up +44% and all other lines of business up mid-single digit
Spain
• Printing almost flat and Accessories down -3.7%.
• All other lines of business up double digit with Phones at +18% and Advanced Solutions up 13%
Both the Italian and Spanish operations of the Group grew more than the market and achieved a market share growth of 1.5% and 1.2% respectively in Italy and Spain.
Italy outgrew the market in PCs, Phones and Accessories and lost 0.4% of share in Advanced Solutions and 1.9% in Consumer Electronics.
Spain outgrew the market in all business lines with the exception of Phones where the policy of walking away from unprofitable businesses led to a market share loss of 7.7%.
Italy slightly lost share in the Business Reseller customer segment whilstgrew its share in Spain.
Italy significantly outperformed the market in the Consumer customersegment both in Italy and Spain.
Market conditions are still competitive given the pressure on manyvendors which are struggling with commoditized products and restructuring activities.
Opportunities of further market consolidation appear possible also atdistribution level and not only at reseller and vendor level.
Source: Context, September 2019
Region
Q1 2019
vs.
Q1 2018
Q2 2019
vs.
Q2 2018
H1 2019
vs.
H1 2018
EUROPE 5,4% 3,8% 4,6%
ITALY 4,3% 8,7% 6,4%
SPAIN 11,5% 8,4% 9,9%
PORTUGAL 11,4% 8,6% 10,0%
19
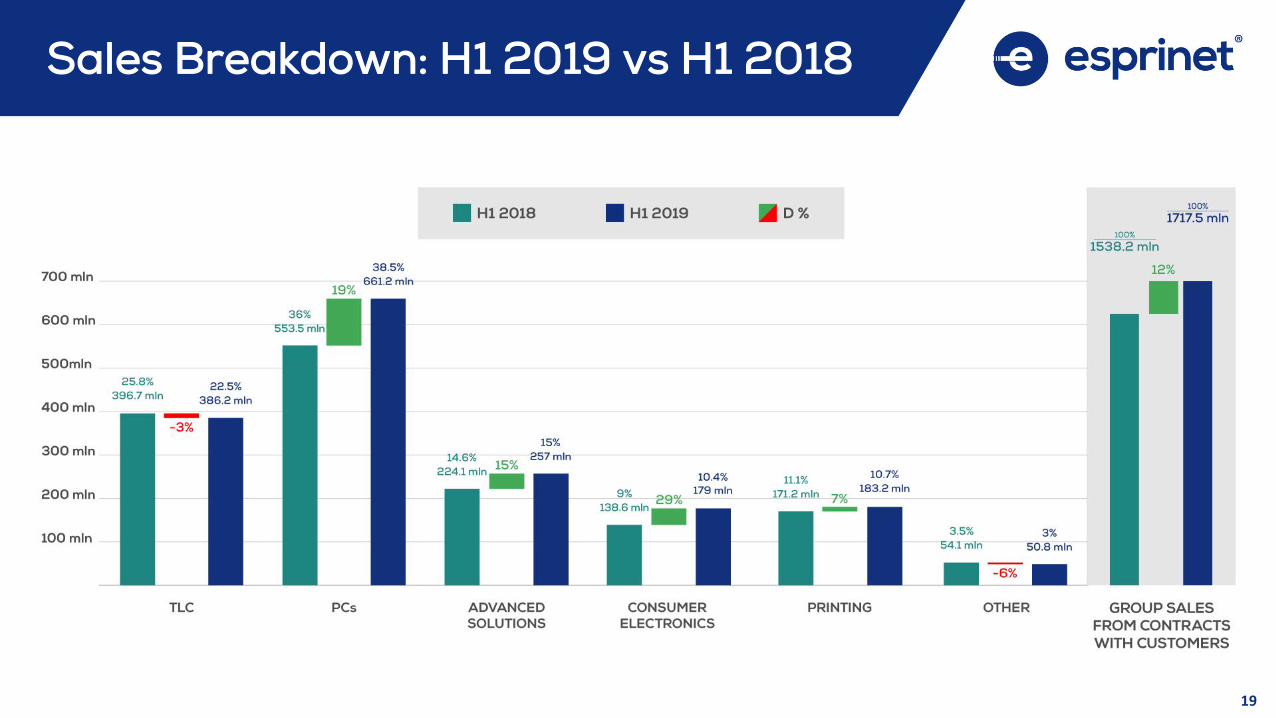
Sales Breakdown: H1 2019 vs H1 2018
20
ICONA
ICONA
ICONA
ICONA
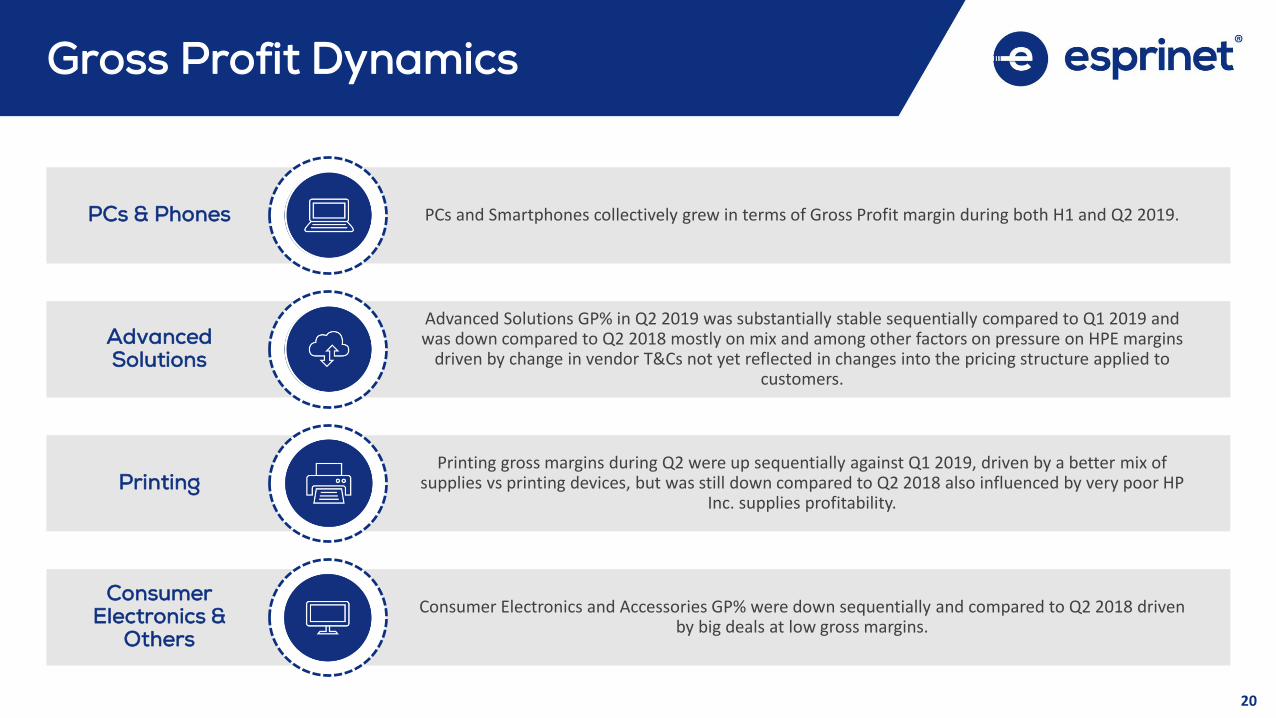
Gross Profit Dynamics
PCs & Phones
Advanced Solutions
Printing
Consumer Electronics &
Others
PCs and Smartphones collectively grew in terms of Gross Profit margin during both H1 and Q2 2019.
Advanced Solutions GP% in Q2 2019 was substantially stable sequentially compared to Q1 2019 and was down compared to Q2 2018 mostly on mix and among other factors on pressure on HPE margins
driven by change in vendor T&Cs not yet reflected in changes into the pricing structure applied to customers.
Printing gross margins during Q2 were up sequentially against Q1 2019, driven by a better mix of supplies vs printing devices, but was still down compared to Q2 2018 also influenced by very poor HP
Inc. supplies profitability.
Consumer Electronics and Accessories GP% were down sequentially and compared to Q2 2018 drivenby big deals at low gross margins.
21
Gross Profit Dynamics
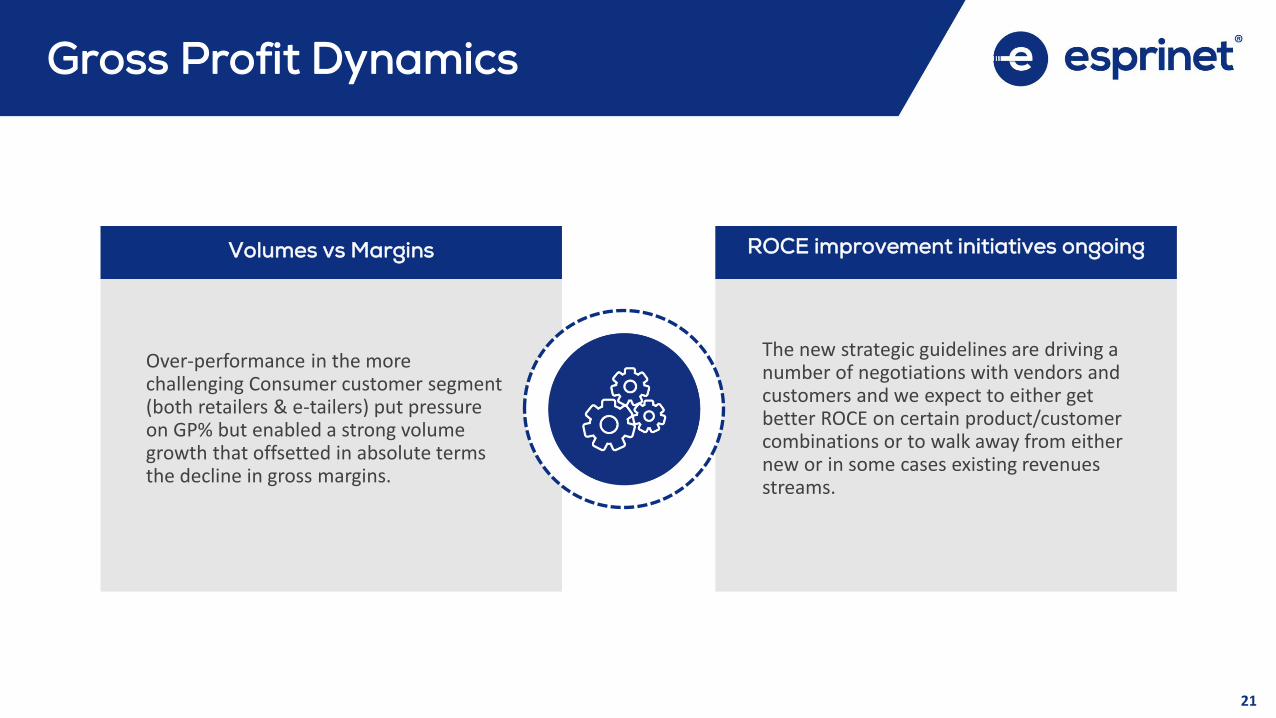
Volumes vs Margins
The new strategic guidelines are driving a number of negotiations with vendors and customers and we expect to either getbetter ROCE on certain product/customer combinations or to walk away from eithernew or in some cases existing revenues streams.
ROCE improvement initiatives ongoing
Over-performance in the more challenging Consumer customer segment(both retailers & e-tailers) put pressure on GP% but enabled a strong volume growth that offsetted in absolute termsthe decline in gross margins.
22
Working Capital Dynamics
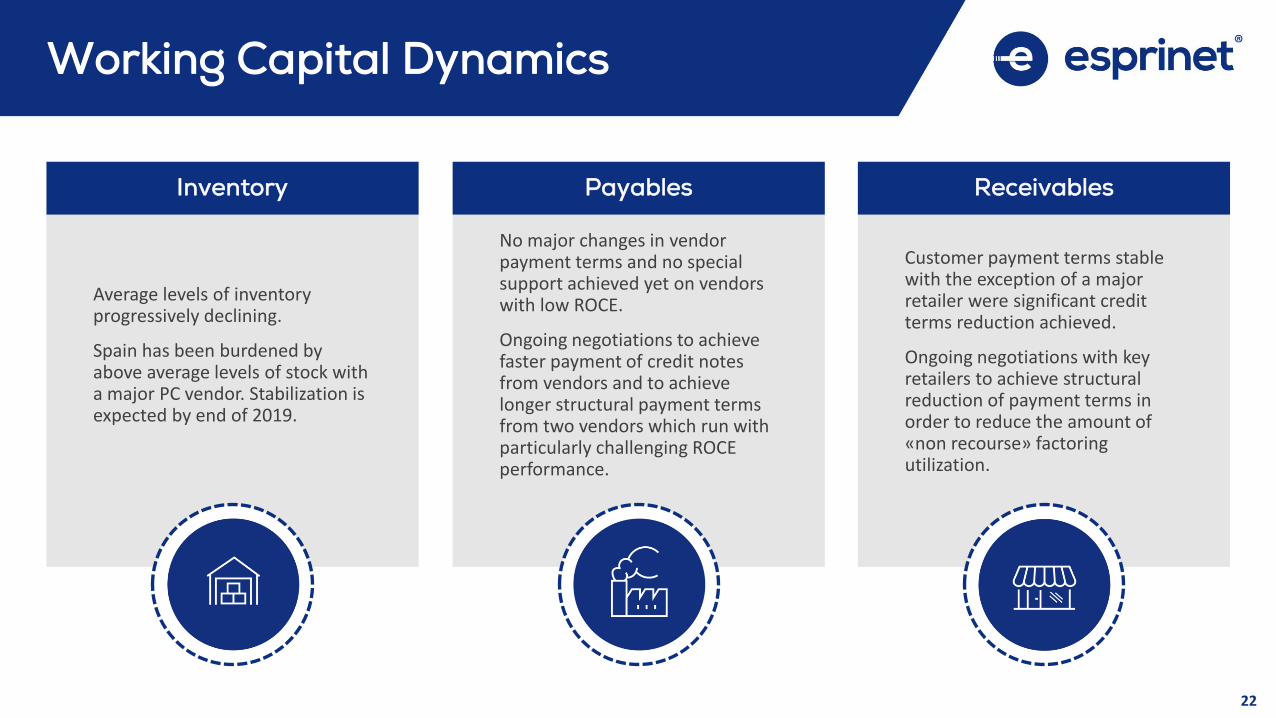
Average levels of inventory progressively declining.
Spain has been burdened by above average levels of stock with a major PC vendor. Stabilization isexpected by end of 2019.
Inventory
Customer payment terms stablewith the exception of a major retailer were significant credit terms reduction achieved.
Ongoing negotiations with keyretailers to achieve structuralreduction of payment terms in order to reduce the amount of «non recourse» factoring utilization.
Receivables
No major changes in vendor payment terms and no special support achieved yet on vendorswith low ROCE.
Ongoing negotiations to achievefaster payment of credit notes from vendors and to achievelonger structural payment termsfrom two vendors which run with particularly challenging ROCE performance.
Payables
23
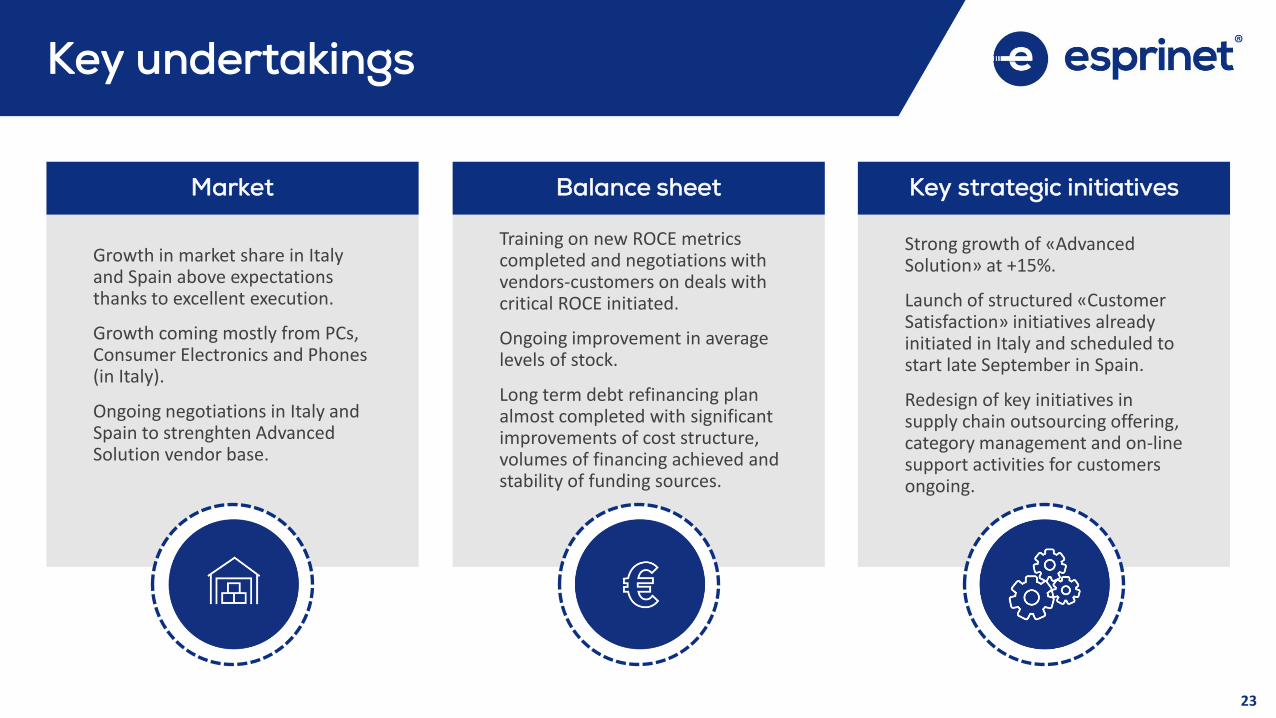
Key undertakings
Growth in market share in Italy and Spain above expectationsthanks to excellent execution.
Growth coming mostly from PCs, Consumer Electronics and Phones (in Italy).
Ongoing negotiations in Italy and Spain to strenghten Advanced Solution vendor base.
Market
Strong growth of «Advanced Solution» at +15%.
Launch of structured «CustomerSatisfaction» initiatives alreadyinitiated in Italy and scheduled to start late September in Spain.
Redesign of key initiatives in supply chain outsourcing offering, category management and on-line support activities for customersongoing.
Key strategic initiatives
Training on new ROCE metricscompleted and negotiations with vendors-customers on deals with critical ROCE initiated.
Ongoing improvement in average levels of stock.
Long term debt refinancing plan almost completed with significantimprovements of cost structure, volumes of financing achieved and stability of funding sources.
Balance sheet

OUTLOOK & FINAL
REMARKS
25
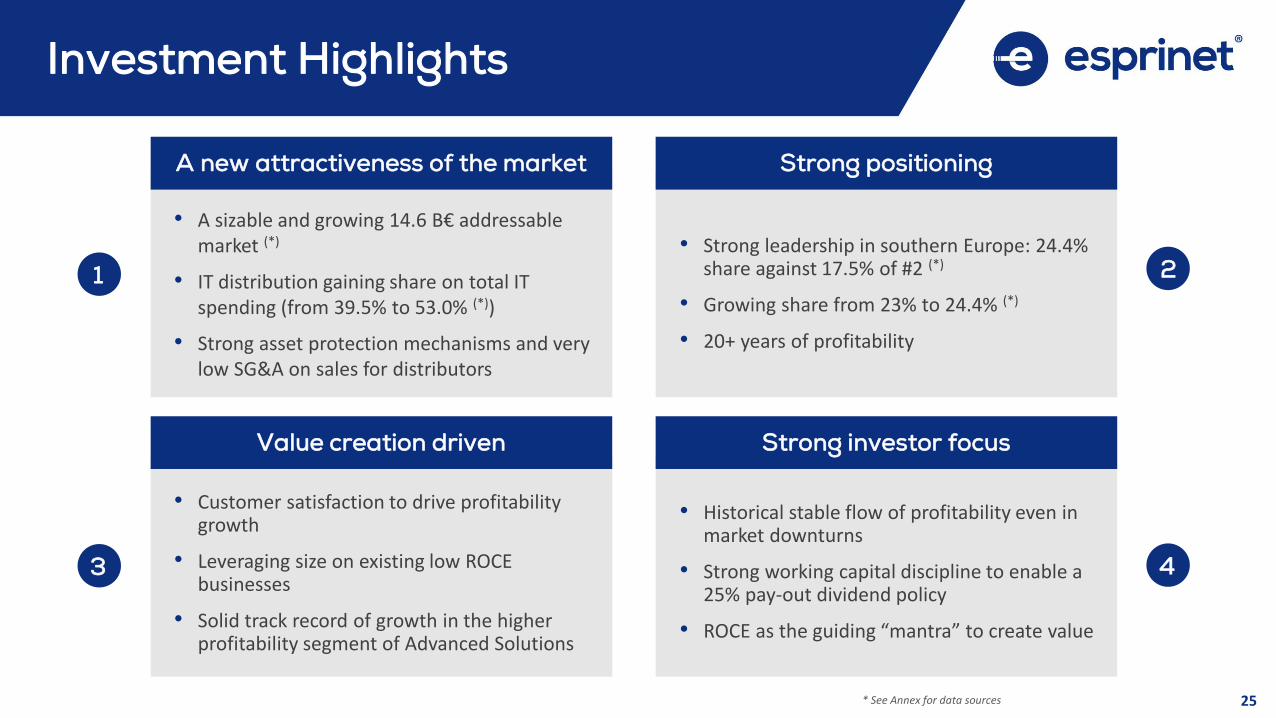
Investment Highlights
• A sizable and growing 14.6 B€ addressable market (*)
• IT distribution gaining share on total IT spending (from 39.5% to 53.0% (*))
• Strong asset protection mechanisms and very low SG&A on sales for distributors
A new attractiveness of the market
• Strong leadership in southern Europe: 24.4% share against 17.5% of #2 (*)
• Growing share from 23% to 24.4% (*)
• 20+ years of profitability
Strong positioning
• Customer satisfaction to drive profitability growth
• Leveraging size on existing low ROCE businesses
• Solid track record of growth in the higher profitability segment of Advanced Solutions
Value creation driven
• Historical stable flow of profitability even in market downturns
• Strong working capital discipline to enable a 25% pay-out dividend policy
• ROCE as the guiding “mantra” to create value
Strong investor focus
1 2
43
* See Annex for data sources
26
Outlook / Delivery
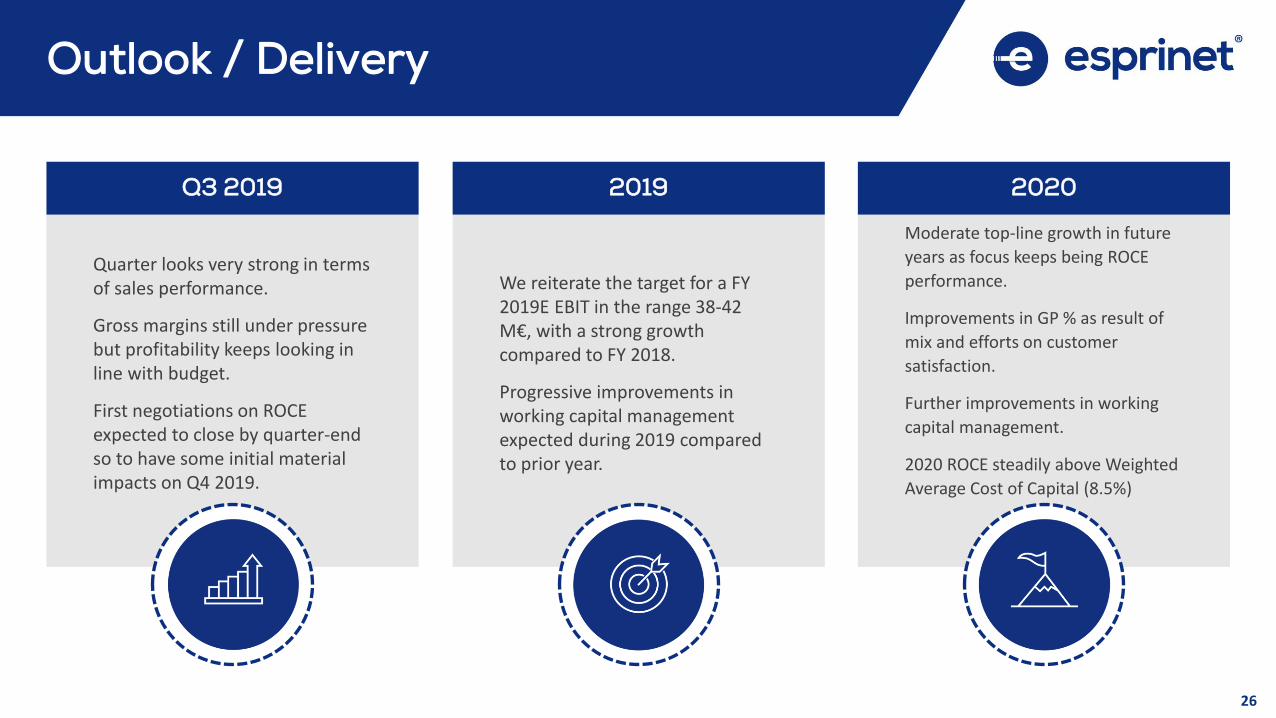
Quarter looks very strong in termsof sales performance.
Gross margins still under pressure but profitability keeps looking in line with budget.
First negotiations on ROCE expected to close by quarter-end so to have some initial material impacts on Q4 2019.
Q3 2019
Moderate top-line growth in future
years as focus keeps being ROCE
performance.
Improvements in GP % as result of
mix and efforts on customer
satisfaction.
Further improvements in working
capital management.
2020 ROCE steadily above Weighted
Average Cost of Capital (8.5%)
2020
We reiterate the target for a FY 2019E EBIT in the range 38-42 M€, with a strong growth compared to FY 2018.
Progressive improvements in working capital management expected during 2019 compared to prior year.
2019
27
Final remarks
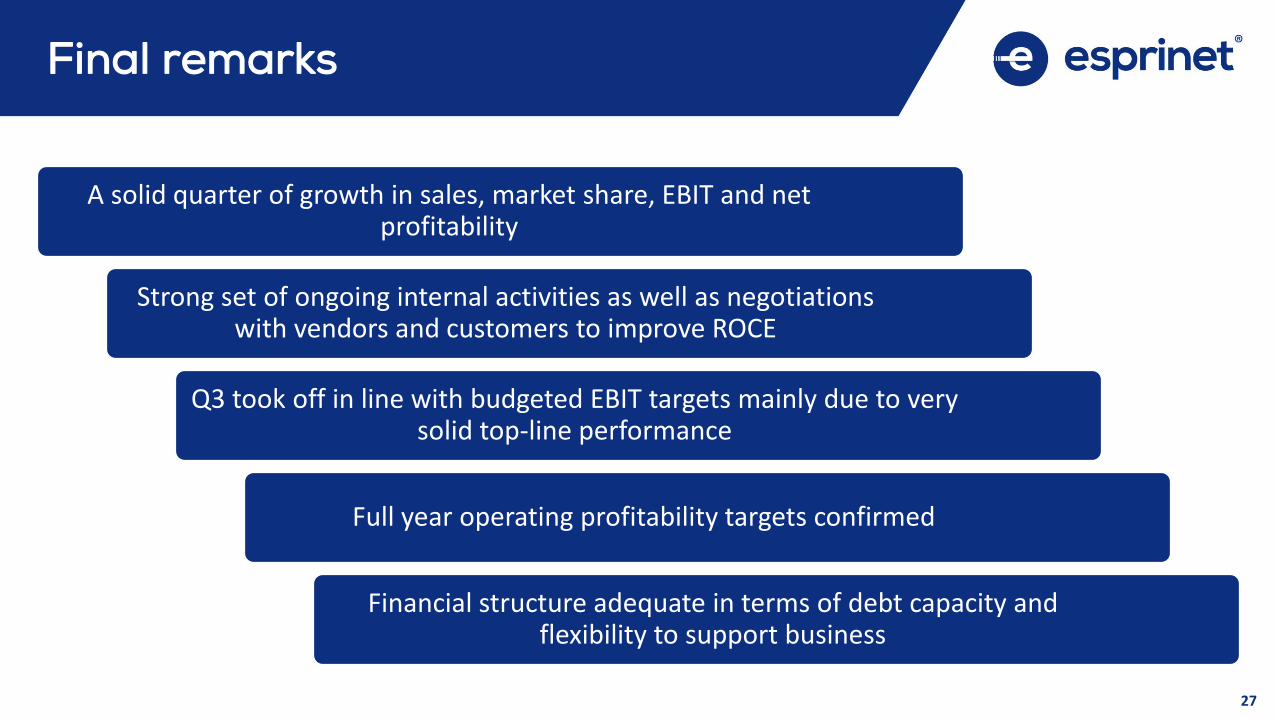
A solid quarter of growth in sales, market share, EBIT and net profitability
Strong set of ongoing internal activities as well as negotiationswith vendors and customers to improve ROCE
Q3 took off in line with budgeted EBIT targets mainly due to verysolid top-line performance
Full year operating profitability targets confirmed
Financial structure adequate in terms of debt capacity and flexibility to support business
28
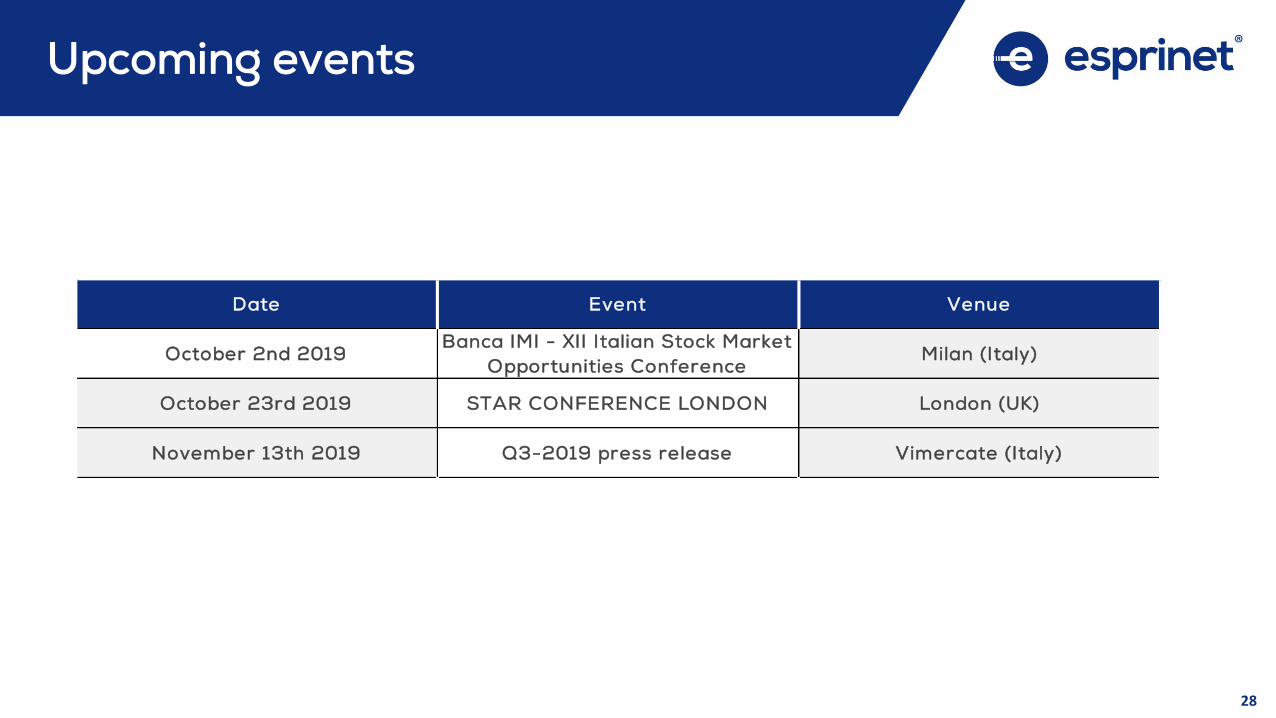
Upcoming events
Date Event Venue
October 2nd 2019Banca IMI - XII Italian Stock Market
Opportunities ConferenceMilan (Italy)
October 23rd 2019 STAR CONFERENCE LONDON London (UK)
November 13th 2019 Q3-2019 press release Vimercate (Italy)

Q & A
30

THE INDUSTRY
32
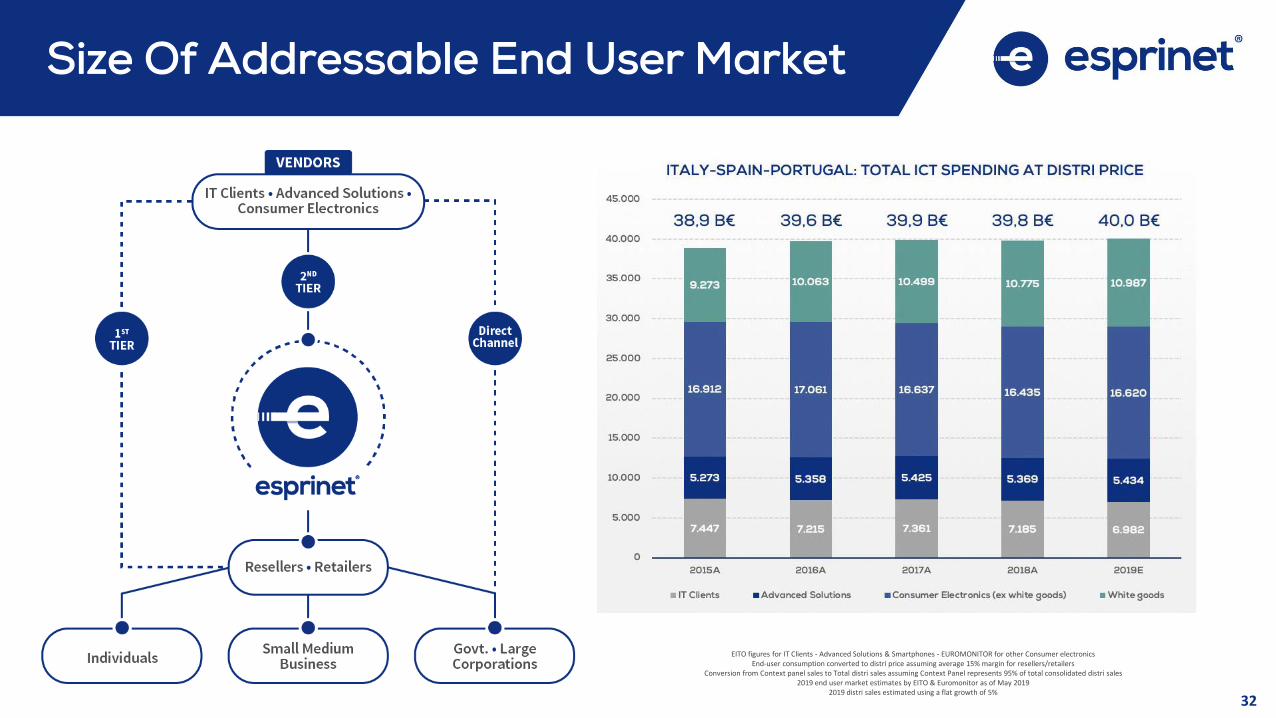
Size Of Addressable End User Market
EITO figures for IT Clients - Advanced Solutions & Smartphones - EUROMONITOR for other Consumer electronicsEnd-user consumption converted to distri price assuming average 15% margin for resellers/retailers
Conversion from Context panel sales to Total distri sales assuming Context Panel represents 95% of total consolidated distri sales2019 end user market estimates by EITO & Euromonitor as of May 2019
2019 distri sales estimated using a flat growth of 5%
33
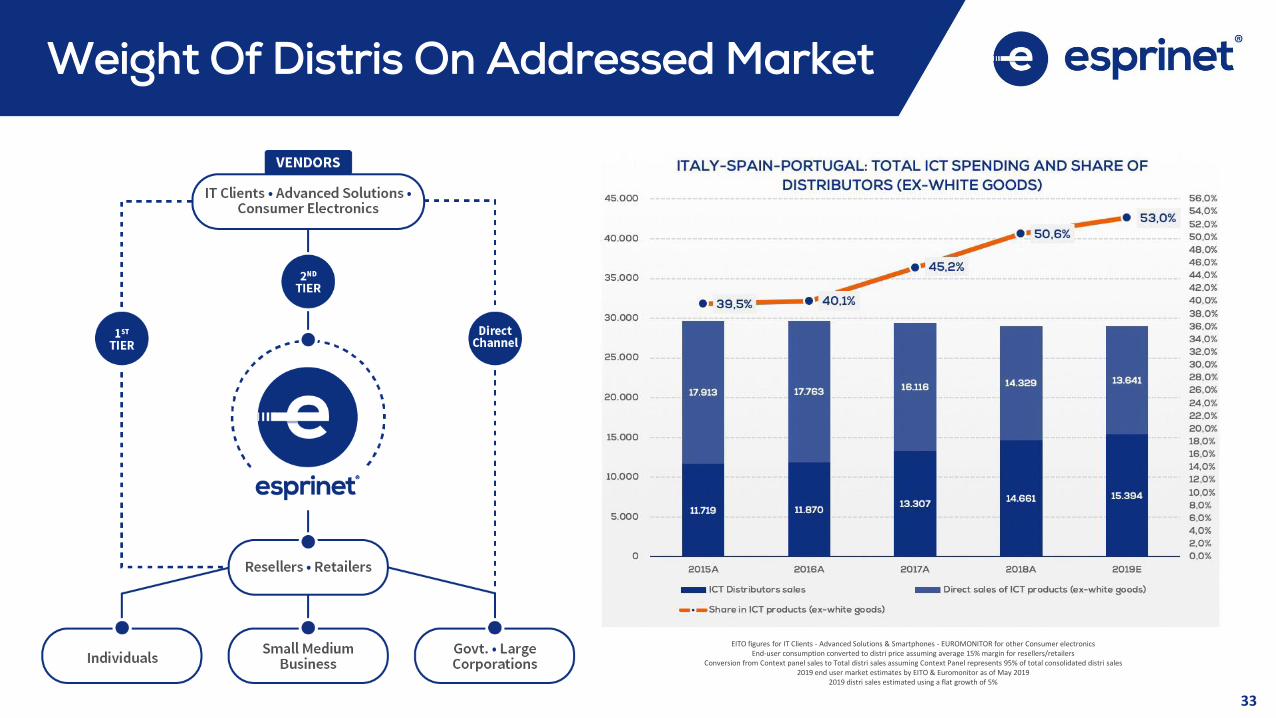
EITO figures for IT Clients - Advanced Solutions & Smartphones - EUROMONITOR for other Consumer electronicsEnd-user consumption converted to distri price assuming average 15% margin for resellers/retailers
Conversion from Context panel sales to Total distri sales assuming Context Panel represents 95% of total consolidated distri sales2019 end user market estimates by EITO & Euromonitor as of May 2019
2019 distri sales estimated using a flat growth of 5%
Weight Of Distris On Addressed Market