Embed Size (px)
Citation preview
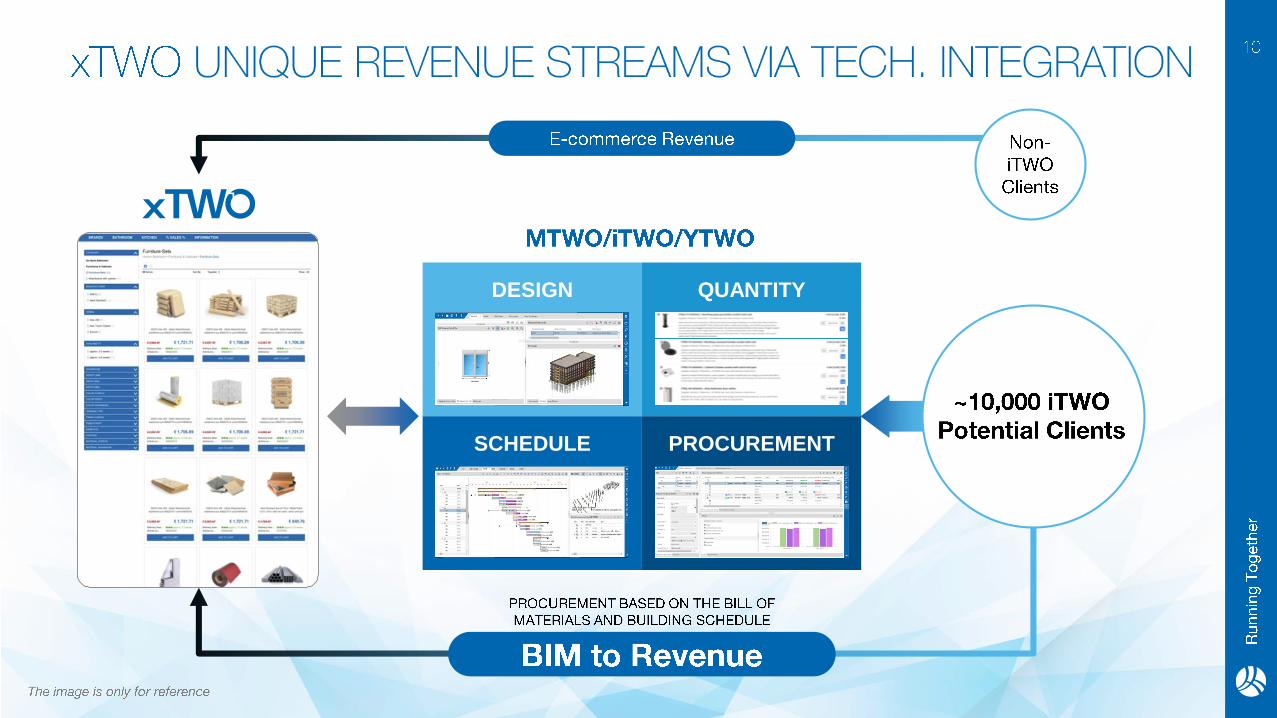
DESIGN
SCHEDULE
QUANTITY
PROCUREMENT
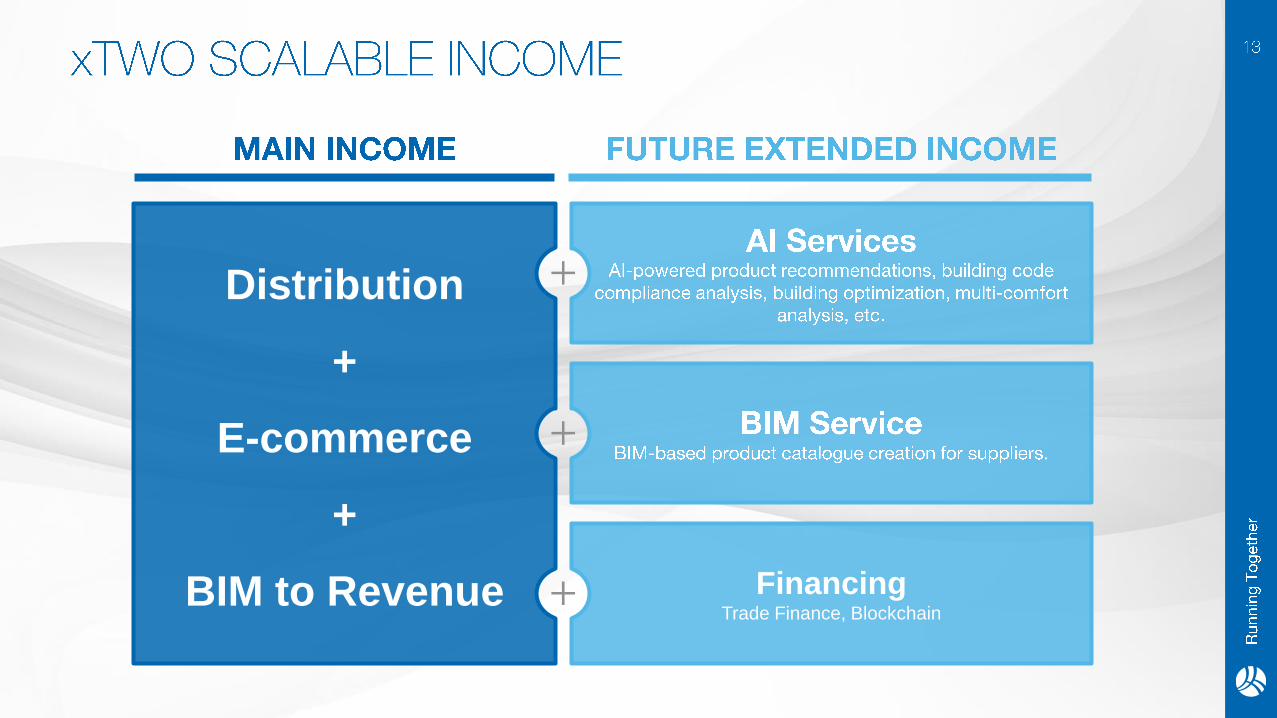
Distribution
+
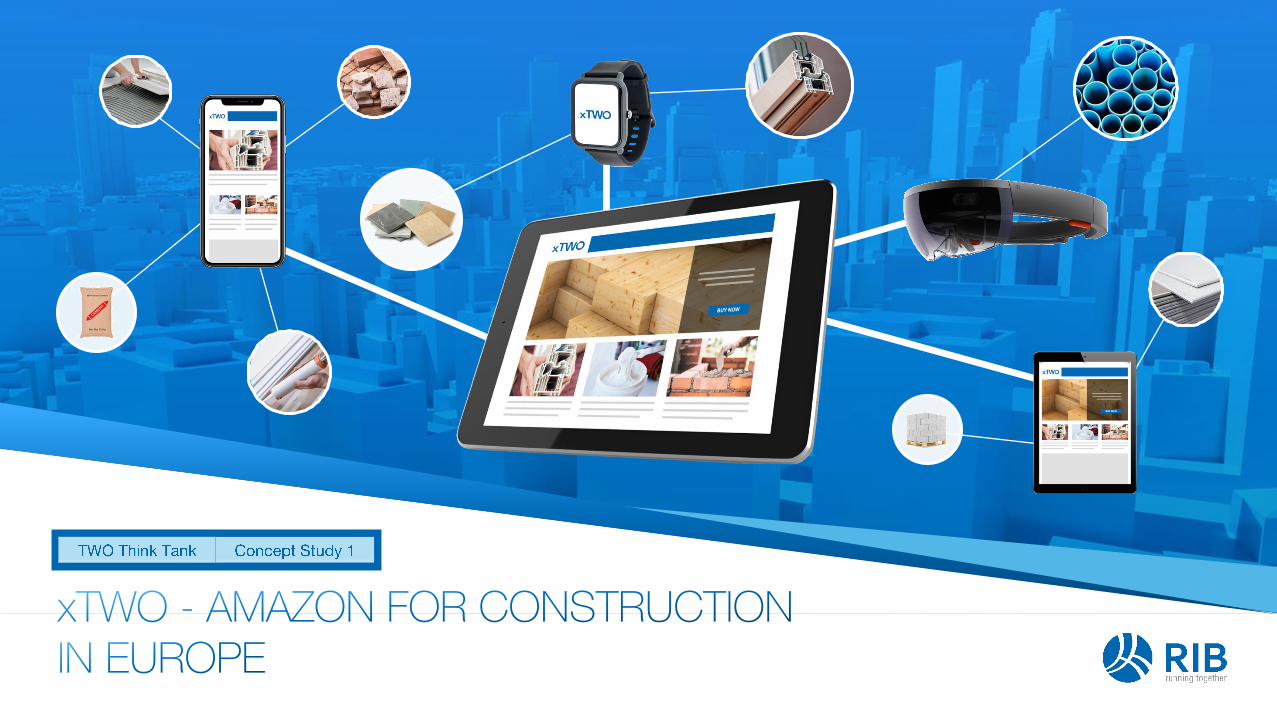
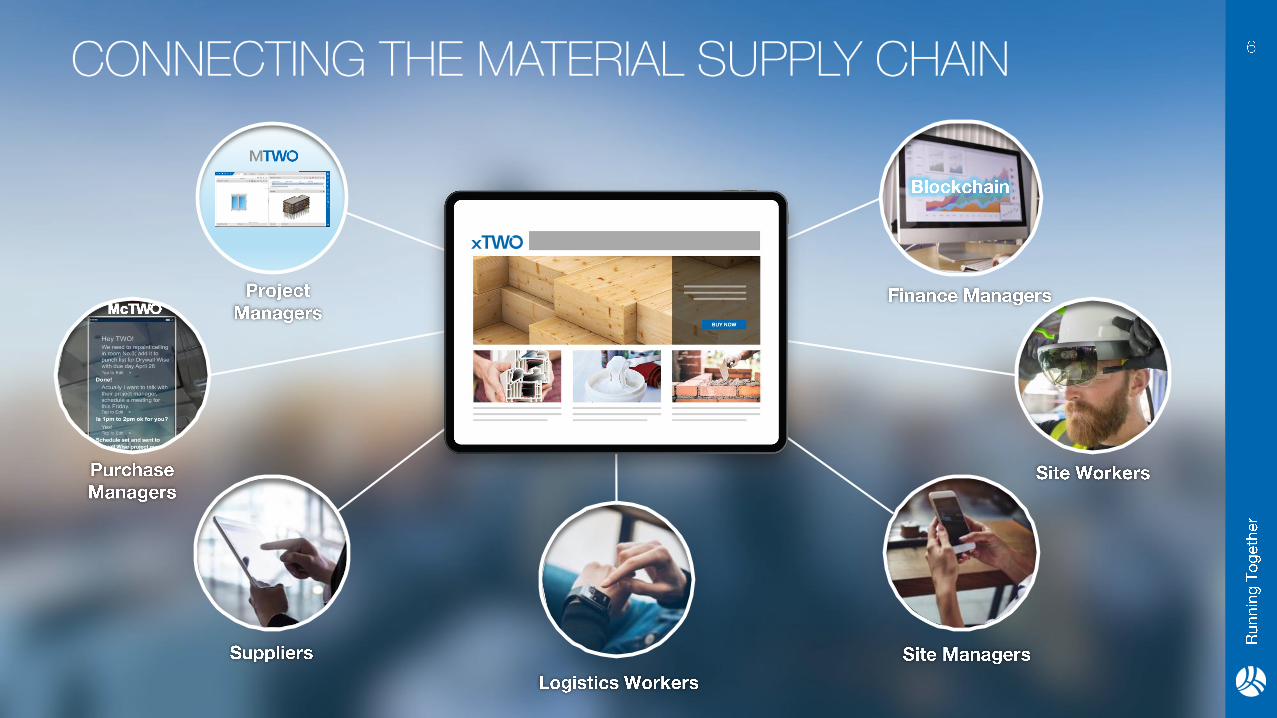
E-commerce
+
BIM to Revenue
.
FinancingTrade Finance, Blockchain
•
•
•
•
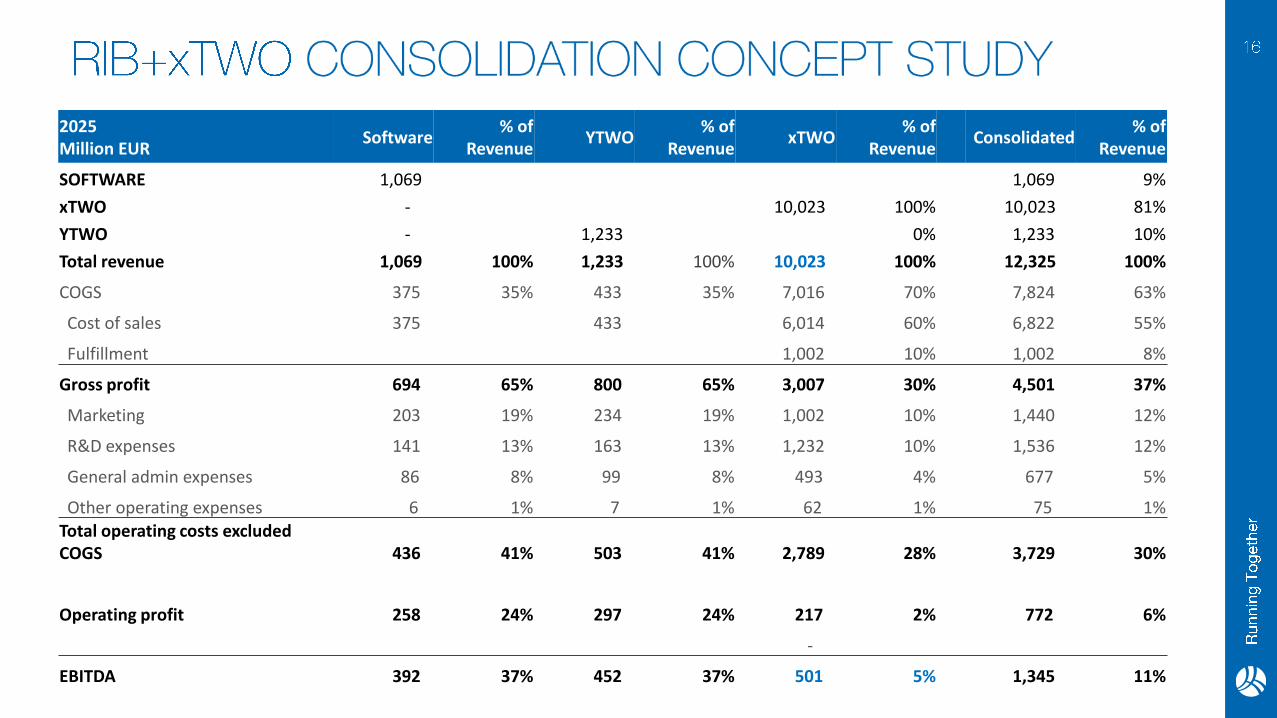
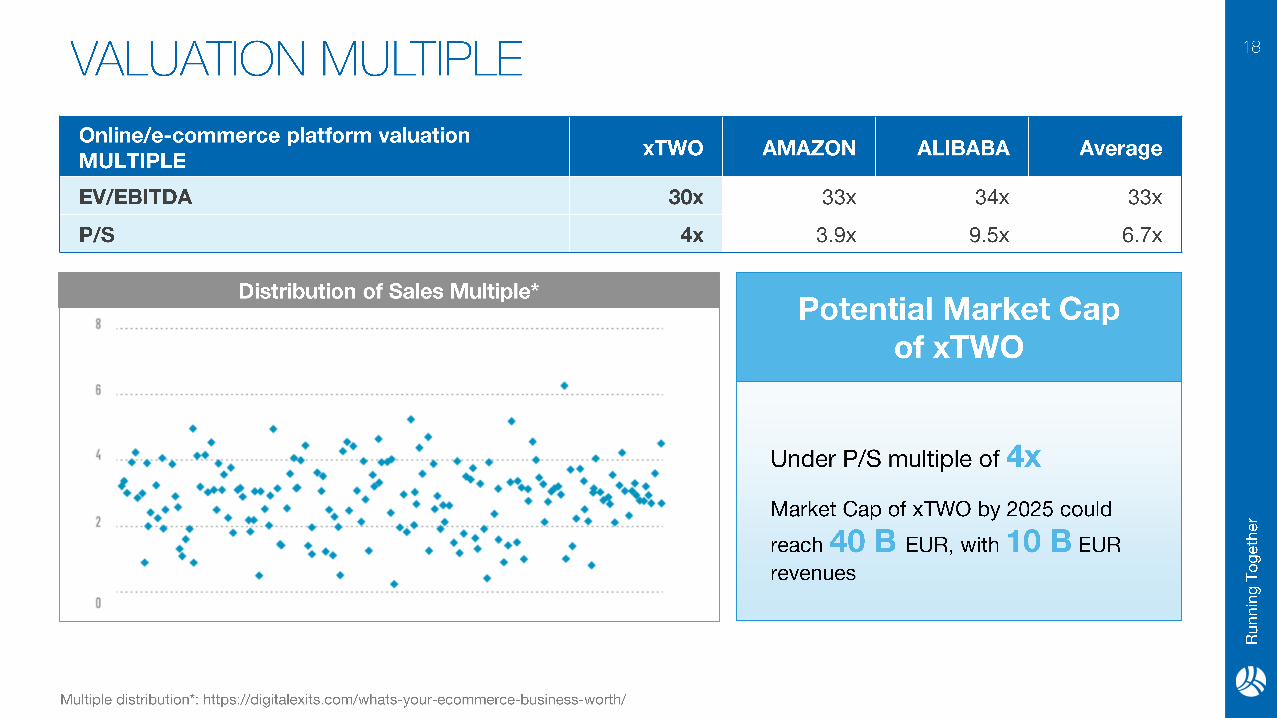
2025Million EUR
Software% of
RevenueYTWO
% of Revenue
xTWO% of
RevenueConsolidated
% of Revenue
SOFTWARE 1,069 1,069 9%
xTWO - 10,023 100% 10,023 81%
YTWO - 1,233 0% 1,233 10%
Total revenue 1,069 100% 1,233 100% 10,023 100% 12,325 100%
COGS 375 35% 433 35% 7,016 70% 7,824 63%
Cost of sales 375 433 6,014 60% 6,822 55%
Fulfillment 1,002 10% 1,002 8%
Gross profit 694 65% 800 65% 3,007 30% 4,501 37%
Marketing 203 19% 234 19% 1,002 10% 1,440 12%
R&D expenses 141 13% 163 13% 1,232 10% 1,536 12%
General admin expenses 86 8% 99 8% 493 4% 677 5%
Other operating expenses 6 1% 7 1% 62 1% 75 1%
Total operating costs excluded COGS 436 41% 503 41% 2,789 28% 3,729 30%
Operating profit 258 24% 297 24% 217 2% 772 6%
-
EBITDA 392 37% 452 37% 501 5% 1,345 11%
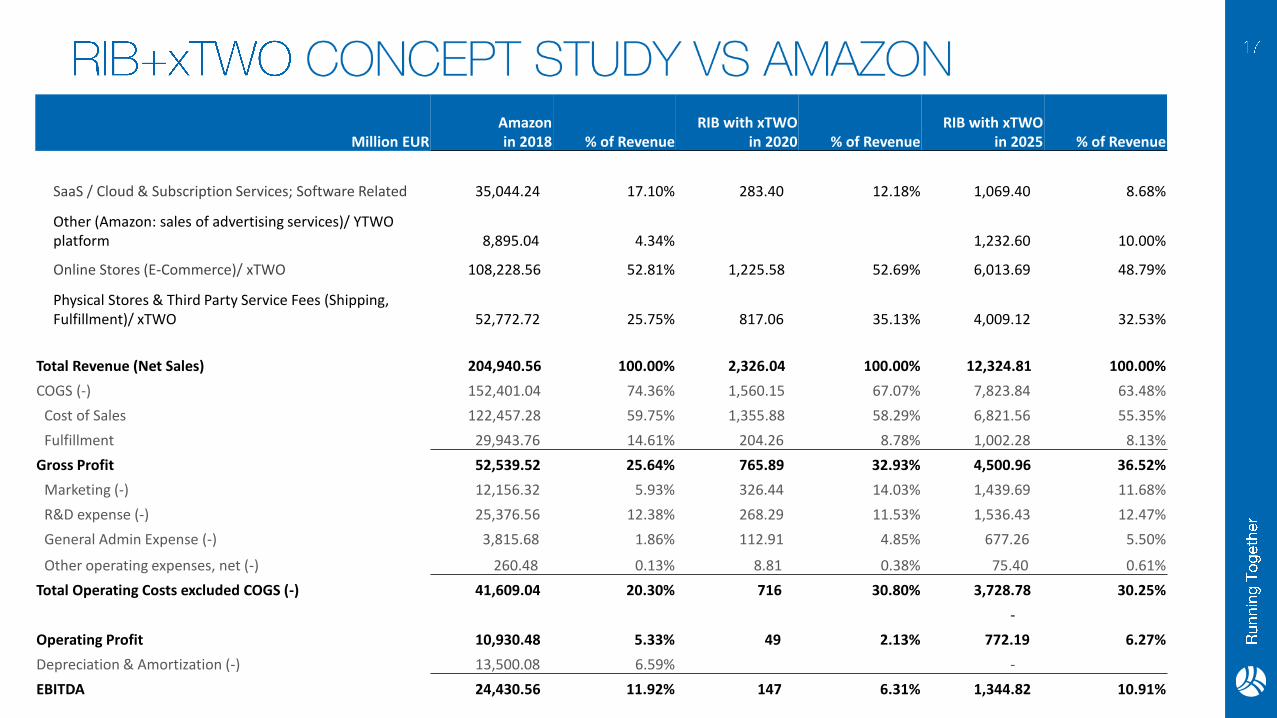
Million EURAmazonin 2018 % of Revenue
RIB with xTWOin 2020 % of Revenue
RIB with xTWOin 2025 % of Revenue
SaaS / Cloud & Subscription Services; Software Related 35,044.24 17.10% 283.40 12.18% 1,069.40 8.68%
Other (Amazon: sales of advertising services)/ YTWO platform 8,895.04 4.34% 1,232.60 10.00%
Online Stores (E-Commerce)/ xTWO 108,228.56 52.81% 1,225.58 52.69% 6,013.69 48.79%
Physical Stores & Third Party Service Fees (Shipping, Fulfillment)/ xTWO 52,772.72 25.75% 817.06 35.13% 4,009.12 32.53%
Total Revenue (Net Sales) 204,940.56 100.00% 2,326.04 100.00% 12,324.81 100.00%
COGS (-) 152,401.04 74.36% 1,560.15 67.07% 7,823.84 63.48%
Cost of Sales 122,457.28 59.75% 1,355.88 58.29% 6,821.56 55.35%
Fulfillment 29,943.76 14.61% 204.26 8.78% 1,002.28 8.13%
Gross Profit 52,539.52 25.64% 765.89 32.93% 4,500.96 36.52%
Marketing (-) 12,156.32 5.93% 326.44 14.03% 1,439.69 11.68%
R&D expense (-) 25,376.56 12.38% 268.29 11.53% 1,536.43 12.47%
General Admin Expense (-) 3,815.68 1.86% 112.91 4.85% 677.26 5.50%
Other operating expenses, net (-) 260.48 0.13% 8.81 0.38% 75.40 0.61%
Total Operating Costs excluded COGS (-) 41,609.04 20.30% 716 30.80% 3,728.78 30.25%
-
Operating Profit 10,930.48 5.33% 49 2.13% 772.19 6.27%
Depreciation & Amortization (-) 13,500.08 6.59% -
EBITDA 24,430.56 11.92% 147 6.31% 1,344.82 10.91%