Embed Size (px)
Citation preview

Power of Combining SAXS with Other Methods
Geosynchronous Satellite Launch VehicleISRO
AshishCSIR‐Institute of Microbial Technology
Chandigarh INDIA

SAXS Data: Strengths, Weaknesses, Ways to Complement/Supplement
Guru Mantra??
Suspect – the problem
Prospect – weigh your chances
Approach – carve the best path
Collate – physics, chemistry, biology
Empower – self/community
Two simple questions:
How come others get (good )results?
Can SAXS bail me out?
WeaknessesLow resolution informationUnderstanding (acceptance) is limitedSample preparation – pre‐ / post‐characterizationStandardsProne to individual
StrengthsNo need for “that” crystal or “those” NMR conditionsConditions – close to other experimentsWider range of data collectionNot limited to chemical modification of the proteinReliable estimation of aggregated / non‐aggregated
particle‐particle interactionsglobular nature or inherently disorderedRG, Dmax, I0ab initiomodeling, visual insight
AND THERE IS SO MUCH MORE TO EXPLORE
Ways to complement/supplementother biophysical data – crystallography, NMR, theoretical models ‐ templatesCD, FT‐IR, HX experiments (MS/NMR), foot printingMutagenesis, Functional Assays, Pull‐downsA lot of reading SANS

Easy Problem: Designing Biobetters of Plasma Gelsolin
Plasma Gelsolin: Prognostic Marker of Health
Skeletal Injuries, Traumatic Brain Injury,Malaria, Arthritis, Sepsis, 2° and 3° Burn,Cystic Fibrosis, Multiple Sclerosis,Allogenic Transplantation, AlzheimerOn‐time partum – Being revised[Risk / before time partum] – 2012 JHU
Gelsolin Replacement TherapyBurn & Sepsis model of mice and rat: 88% improved outcome compared to placebo
‐2008:2010:2011
ChallengeScale‐up of Mice dose to human – 24 gm!Can we lower the dose requirement?

Gelsolin: A six domain protein which requires Ca2+ or low pH
GSN G2 G3G1 G6G4 G539 133 271137 247 419367 511 516 618 640 731
SAXS based Insight
3 –statevs.
2‐ state?
PDB ID: 1D0N
Pope & Gooch 1997
Synchrotron Foot‐printingMark Chance & group
Ashish et al 2007

Ca2+

Low pH induced shape changes in Gelsolin
Garg R et al 2011

Extension of G1 domain from other domains is essential step for F‐actin severing.
DesigningF‐actinSevering
CompetentMinimizedGelsolins
Attention please: This slide does not have SAXS data or SAXS based models
0 20 40 60 80 100 120 140
1x10⁵
2x10⁵
3x10⁵
4x10⁵
5x10⁵
F-Actin G2-G6 GSN G1-G3 G1-G2 1-161 25-161 36-161 42-161
Rel
ativ
e Fl
uore
scen
ce
Time (sec)
42-161
36-161
25-161
1-161
G1-G2
G1-G3
dT GSN
GSN
G4-G6
G2-G6
0 1000 2000 3000 4000 5000 6000 7000
*
Rate of Decrement in Fluorescence
46-60 sec 31-45 sec 0-30 sec
25-156
25-158
34-161
32-161
30-161
28-161
25-161
GSN
G2-G6
0 2000 4000 6000 8000
*
**
Rate of Decrement in Fluorescence
46-60 sec 31-45 sec 0-30 sec25‐161
28‐161
Contro
lPla
cebo
GSN 0.5 m
gGSN 1
mg
GSN 2 m
gGSN 4
mgGSN 8
mg
0
20
40
60
80
100
120
140
160
###
% o
f Pla
sma
Gel
solin
Lev
els
(pG
SN) pGSN
0
20
40
60
80
100
120
48hours
0
20
40
60
80
100
120
G1-G3
GSN
GSN + rG
SN
PBS
% o
f GSN
leve
ls in
mic
e in
ject
ed w
ith rG
SN(B
ased
on
Wes
tern
Blo
t)
24 hours
Control
GSN28
-161 0 1 2 3 4 5 6 7
0
25
50
75
100 ControlPBSGSNG1-G328-161G4-G6G2-G6
DaysPe
rcen
t Sur
viva
l
Current status:8 mg dose per mice ~ 24 gm dose for 150 pound human1 mg per mice ~ 3 gm dose!
Peddada N et al Under ReviewProvisional Patents Filed
G2-G6
GSNdT
GSN
G1-G3
G1-G2
1-161
25-161
36-161
42-161
0
20
40
60
80
100
120
∆F
[Nor
mal
ized
to
F-ac
tin a
lon
e] pH 7 pH 6 pH 5
0
40
80
120
pH 7 pH 5
G2-G6
GSNdT G
SNG1-G
3G1-G
21-16125-1
6136
-16142-1
61
0
20
40
60
80
100
120
∆F
[Nor
mal
ized
to F
-act
in a
lone
] EGTA
1mM Ca2+
G2-G6
GSN25-1
6128
-161
30-161
32-161
34-161
28-1
5825
-156
0
40
80
120
∆F
[Nor
mal
ized
to F
-act
in a
lone
]
1mM EGTA 1mM Ca2+
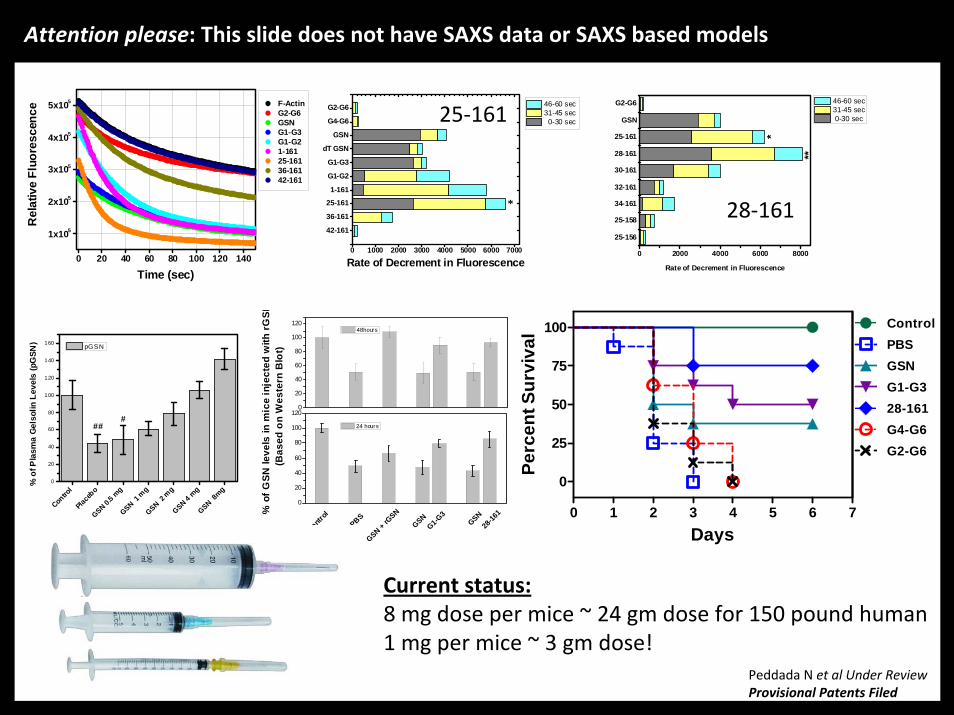
∆T and G1‐G3 are Ca2+/pH independent but when we chop further….?
Is the role of SAXS over?
This work is still under progress…

Ambitious Problem: Reverting “lost” filtration ability
Filtration – 180 L per day – 7.5 L per hour!ReabsorptionSecretionExcretion
Filtration is driven by hydraulic/blood pressure in the capillariesof the glomerulus, which in turn are formed by specialized cellscalled podocytes. Podocytes have interdigitated shape known asfoot processes.
Nephrin
Membrane
Neph1
Podocin
Actin Cadherin
FAT
Foot process
ZO-1
Interaction betweenCytoplasmic domainof Neph1 and PDZ1domain of ZO‐1 issomehow criticalfor functional shapeof podocytes

If we can solve the structure of Neph1CD/PDZ‐1 ZO‐1, then ……..may be we can…?
No sequence similarity basedtemplate or biophysical characterization
X‐ray crystallography based PDBs were available (2H3M)
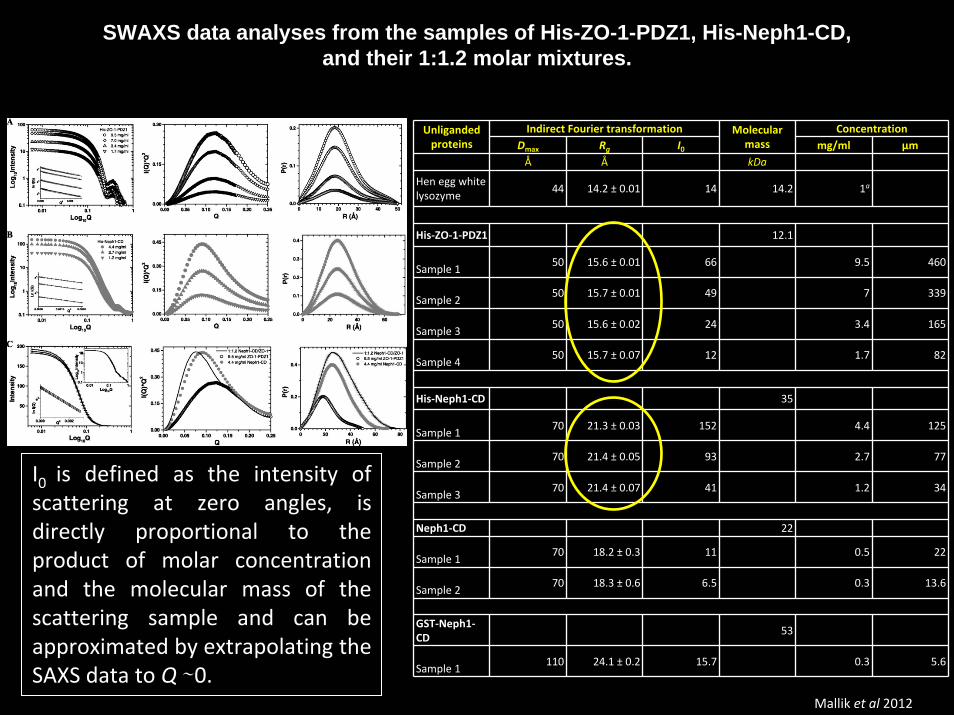
SWAXS data analyses from the samples of His-ZO-1-PDZ1, His-Neph1-CD, and their 1:1.2 molar mixtures.
Mallik et al 2012
Indirect Fourier transformation ConcentrationUnliganded proteins
Molecular massDmax Rg I0 mg/ml μm
Å Å kDa
Hen egg white lysozyme
44 14.2 ± 0.01 14 14.2 1a
His‐ZO‐1‐PDZ1 12.1
Sample 150 15.6 ± 0.01 66 9.5 460
Sample 250 15.7 ± 0.01 49 7 339
Sample 350 15.6 ± 0.02 24 3.4 165
Sample 450 15.7 ± 0.07 12 1.7 82
His‐Neph1‐CD 35
Sample 170 21.3 ± 0.03 152 4.4 125
Sample 270 21.4 ± 0.05 93 2.7 77
Sample 370 21.4 ± 0.07 41 1.2 34
Neph1‐CD 22
Sample 170 18.2 ± 0.3 11 0.5 22
Sample 270 18.3 ± 0.6 6.5 0.3 13.6
GST‐Neph1‐CD
53
Sample 1110 24.1 ± 0.2 15.7 0.3 5.6
I0 is defined as the intensity of scattering at zero angles, is directly proportional to the product of molar concentration and the molecular mass of the scattering sample and can be approximated by extrapolating the SAXS data to Q ∼0.

SWAXS data based structure reconstructionFiltering parameter and CD based fold based model
Mallik et al 2012

Complex of Neph1CD/ZO-1 PDZ1
Indirect Fourier transformationMolar ratio of
His‐ZO‐1/His‐Neph1 Dmax Rg I0Expected I0
Percentage of 1:1 binding
Å Å %
0.8 80 23.9 ± 0.05 187 205 90
1.0 80 24.0 ± 0.07 190 212 90
1.2 80 24.2 ± 0.15 197 207 95
Mallik et al 2012

Attempted Complex of Neph1CD point mutants/ZO-1 PDZ1
Mallik et al 2012

Other uses of SAXS data based filtered model of Neph1-CD
Functional study of mammalian Neph proteins in Drosophila melanogaster
Deciphering the molecular details of Neph1CD/Myo1c interaction and determining its physiological significanceThe KIN1 motif highlighted in yellow.
Helmstädter et al 2012 Arif et al Script being composed

Now, coming back to original problem
Docking Score
Filters
32 34 36 38 40
1:1 Complex
Neph1-CD PDZ1 ZO-1
2 Hours 14 Hours 24 Hours 48 Hours
Abs
orba
nce
@28
0nm
Elution Time (mL)32 34 36 38 40
1:1 Complex
Neph1-CD PDZ1 ZO-1
2 Hours 14 Hours 24 Hours 48 Hours
Abs
orba
nce
@28
0nm
Elution Time (mL)
Few molecules
5 0 0 0 5 0 0 5 0 1 0 52 0
4 0
6 0
8 0
1 0 0
Perc
enta
ge o
f pea
k ar
ea u
nder
com
plex
vs. a
ll pea
ks in
FP
LC p
rofil
es
F o ld d i lu ti o n o f X u s e d ( re la ti v e t o m o le s o f p ro te in s )
2 h o u rs 1 4 h o u rs 2 4 h o u rs 4 8 h o u rs 6 0 h o u rs
N O I D 5 0 0 0 5 0 0 5 0 50
2 0
4 0
6 0
8 0
1 0 0
Per
cent
age
of p
eak
area
und
er c
ompl
ex
vs. a
ll pea
ks in
FPL
C p
rofil
es
F o l d d i lu ti o n o f X u s e d ( re la ti v e t o m o le s o f p ro te in s )
2 h o u r s 1 4 h o u r s 2 4 h o u r s 4 8 h o u r s 6 0 h o u r s
NO
BIN
DIN
G O
CC
UR
S BE
TWEE
N
∆TH
V N
eph1
-CD
/ZO
-1-P
DZ1
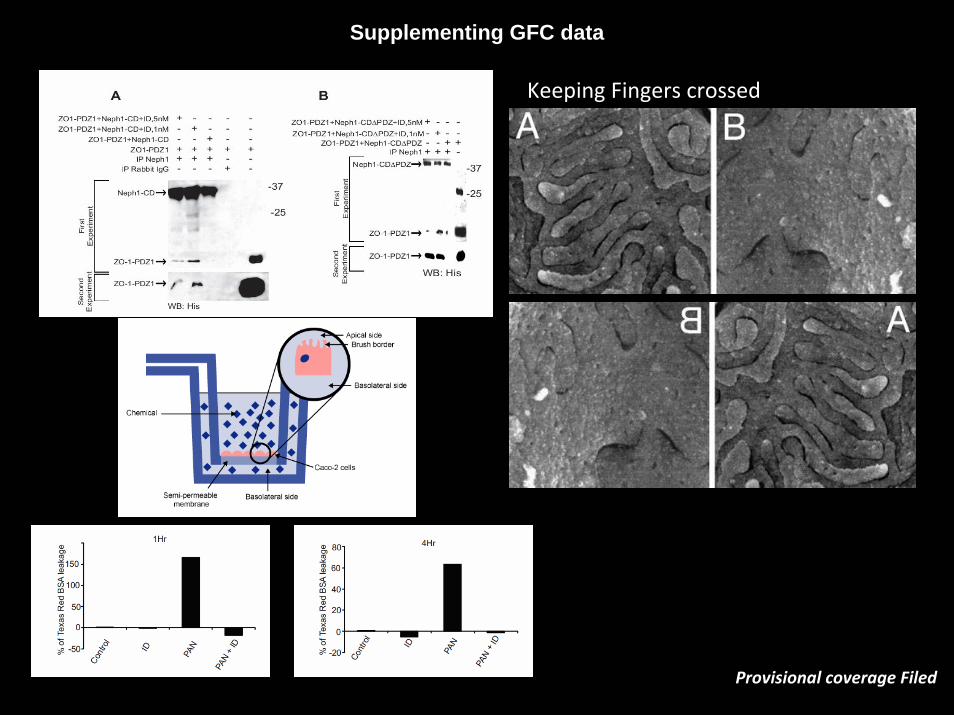
Supplementing GFC data
Keeping Fingers crossed
Provisional coverage Filed

Hour-Glass Model of the Flu Infectivity
CrazyExample

Shape of HA trimer
0.01 0.1
0.1
1
10
100 pH 8 pH 7.5 pH 6.7 pH 5.7 pH 4.7 pH 3
Log 1
0 I(Q
)
Log10 Q0.0002 0.0004 0.0006
0.5
1.0
Nor
mal
ized
Log
I 0
Q2

Drug Site/Peptide Docking
Identification of Druggable Site:1.Conserved in all known pathogenic strains of flu2.In folded trimer, surface exposed3.No propensity to undergo glycosylation4.Involved in keeping interchain contacts
Penetrating Binder Peripheral Binder

in vitro experiments
in vitro validation1.Peptides were synthesized, purified, characterized2.SAXS experiments were repeated 3.[Peptide]/[HA trimer] ~ 3:1
8 7 6 5 4 3100
200
300
400
500
600 Native HA +Peptide P1 +Peptide P2 +Peptide P3 +Peptide P4 +Peptide P5
Max
imum
Lin
ear D
imen
sion
(Å)
pH8 7 6 5 4 3
100
200
300
400
500
600 Native HA +Peptide P1 +Peptide P2 +Peptide P3 +Peptide P4 +Peptide P5
Max
imum
Lin
ear D
imen
sion
(Å)
pH8 7 6 5 4 3
100
200
300
400
500
600 Native HA +Peptide P1 +Peptide P2 +Peptide P3 +Peptide P4 +Peptide P5
Max
imum
Lin
ear D
imen
sion
(Å)
pH8 7 6 5 4 3
100
200
300
400
500
600 Native HA +Peptide P1 +Peptide P2 +Peptide P3 +Peptide P4 +Peptide P5
Max
imum
Lin
ear D
imen
sion
(Å)
pH8 7 6 5 4 3
100
200
300
400
500
600 Native HA +Peptide P1 +Peptide P2 +Peptide P3 +Peptide P4 +Peptide P5
Max
imum
Lin
ear D
imen
sion
(Å)
pH
H1N1 H5N1 H9N2 H3N2 H14N5
Patent Filed

Test Case

SAXS Data: Strengths, Weaknesses, Ways to Complement/Supplement
Guru Mantra??
Suspect – the problem
Prospect – weigh your chances
Approach – carve the best path
Collate – physics, chemistry, biology
Empower – self/community
Two simple answers:
You will also good results….
If problem is right, and SAXS is applied correctly…..
WeaknessesLow resolution informationUnderstanding (acceptance) is limitedSample preparation – pre‐ / post‐characterizationStandardsProne to individual
StrengthsNo need for “that” crystal or “those” NMR conditionsConditions – close to other experimentsWider range of data collectionNot limited to chemical modification of the proteinReliable estimation of aggregated / non‐aggregated
particle‐particle interactionsglobular nature or inherently disorderedRG, Dmax, I0ab initiomodeling, visual insight
AND THERE IS SO MUCH MORE TO EXPLORE
Ways to complement/supplementother biophysical data – crystallography, NMR, theoretical models ‐ templatesCD, FT‐IR, HX experiments (MS/NMR), foot printingMutagenesis, Functional Assays, Pull‐downsA lot of reading SANS

Acknowledgements
Dr. Joanna Krueger, UNC Charlotte
Dr. Deepak Nihalani, U Penn
US‐DOE beam line access
My huge & crazy team in Chandigarh‐Dr. Renu Garg – GRT translation‐Leena Mallik – Neph1‐Yogendra Rathore – CD4/gp120 , SK/HPG, t‐PA,…..‐Ashish Solanki – Neutralizing mAbs, Chip assays…‐Kalpana Pandey – Anti‐influenza‐Shikha Singh – TIR domains of TLRs‐Nagesh Peddada – Bonsai Gelsolins, PDZs, …‐Pankaj Sharma – Lysozyme amyloids, PDZs‐Amin Sagar – Actin Nucleation, CD4s, β‐lac………‐Reema – Rediscovering Calmodulin‐Maulik – Designer Antibodies‐Samir K. Nath
Project Assistants
ATSAS team –Svergun
Critics
Reviewers of Journals who declined ourWorks