Embed Size (px)
Citation preview
Potential of Sugar Beet on the Atherton Tableland
A report for the Rural Industries Research and Development Corporation by B R Weeden
December 2000 RIRDC Publication No 00/167 RIRDC Project No DAQ-211A
ii
© 2000 Rural Industries Research and Development Corporation. All rights reserved. ISBN 0 642 58197 5 ISSN 1440-6845 Potential of Sugar Beet on the Atherton Tableland Publication No. 00/167 Project No. DAQ 211A The views expressed and the conclusions reached in this publication are those of the author and not necessarily those of persons consulted. RIRDC shall not be responsible in any way whatsoever to any person who relies in whole or in part on the contents of this report. This publication is copyright. However, RIRDC encourages wide dissemination of its research, providing the Corporation is clearly acknowledged. For any other enquiries concerning reproduction, contact the Publications Manager on phone 02 6272 3186.
Researcher Contact Details Brett Weeden Southedge Research Station GPO Box 174 Mareeba. QLD 4880
Phone: 07 40932246 Fax: 07 40932237: Email: [email protected]
RIRDC Contact Details Rural Industries Research and Development Corporation Level 1, AMA House 42 Macquarie Street BARTON ACT 2600 PO Box 4776 KINGSTON ACT 2604 Phone: 02 6272 4539 Fax: 02 6272 5877 Email: [email protected]. Website: http://www.rirdc.gov.au
Published in December 2000 Printed on environmentally friendly paper by Canprint

iii
Foreword The two main sources of sucrose (sugar) for human consumption are sugar cane and sugar beet.Sugar beet is grown mainly in temperate climates of the northern hemisphere and constitutes about one third of the worlds sugar production. In recent years the development of more heat tolerant sugar beet varieties has created interest in Queensland in growing sugar beet for sugar production. Joint funded SRDC / RIRDC sugar beet studies in 1993/4 at Mackay and the Burdekin area in north Queensland showed that sugar production from sugar beet was at least comparable to that from sugar cane and that sugar beets, when mixed in with sugar cane, could be processed through a sugar cane mill. A major recommendation from that study was to look at the potential of sugar beet in other areas. At this time sugar cane was expanding rapidly from coastal areas onto the Atherton Tableland, an area about 70 kilometres inland from Cairns in north Queensland with available land and irrigation water. The expansion was so great and rapid that by 1998 a new sugar cane mill (the first to be built in 73 years) was operational. This publication studies the potential of sugar beet to play a role in sugar production from the Atherton Tablelands area. It documents the sugar production from a number of sugar beet varieties accessed from a range of overseas seed companies, studies the effects of some different management practices on sugar yield and, using a simple gross margin analysis, looks at likely costs of production and returns. An initial literature search indicated the enormous amount of information available for use. The review of literature resulted in a ‘Compendium of Sugar Beet Information’ which lists over 1,000 titles of relevant research documents as well as contacts for seed companies and research facilities. Results from field trials showed that sugar production from sugar beet was comparable to that from sugar cane grown locally and was similar to yields achieved commercially overseas. Manipulation of inputs such as nitrogen and irrigation showed the potential for greater gains in sugar yield. Economically sugar beet showed similar returns to current crops grown in the region - peanuts, navy beans and sugar cane for example. This project was funded from RIRDC Core Funds which are provided by the Federal Government. This report, a new addition to RIRDC’s diverse range of over 600 research publications, forms part of our New Plants Products R&D program, which aims to facilitate the development of new industries based on plants or plant products that have commercial potential for Australia. Most of our publications are available for viewing, downloading or purchasing online through our website: • downloads at www.rirdc.gov.au/reports/Index.htm • purchases at www.rirdc.gov.au/eshop Peter Core Managing Director Rural Industries Research and Development Corporation
iv
Acknowledgments I would like to acknowledge and thank the following for funding and supporting this project. • Rural Industries Research and Development Corporation Dr David Evans, Research Manager • NQ Co-op Ltd Mr Lex Starmer, General Manager • CSR Ltd Mr Terry Morgan, Technical Field Officer • South Johnstone Sugar Mill Mr Dennis Stephenson, Manager Mr Bruce Ross, Chemist Ms Kylie Sala, Lab Assistant. • Queensland Department of Primary Industries Mr Laurie Owens for his technical assistance in conducting the field trials Ms Joanne DeFaveri, Ms Angela Reid and Mr Scott Foster for statistical analysis of the data Staff and farm hands at Southedge Research Station • Other Contributors Mr Robin Limb, British Sugar, UK Mr Mike May, Brooms Barn sugar beet research centre, UK Dr David Hindle, General Manager, Betaseed Inc., USA Mr Rick Jones, formerly Pacific Seeds Professor David Midmore, Central Queensland University
v
Contents Foreword ................................................................................................................ iii Acknowledgments ................................................................................................ iv List of Tables/Figures ............................................................................................. vii Abbreviations ....................................................................................................... viii Executive Summary ............................................................................................ ix 1. Introduction 1.1 General introduction 1 1.2 Sugar beet history in Australia 1 1.3 Project development 1 2. Literature review 2.1 Introduction 2 2.2 Species development 2 2.3 Germination, seedling and root growth 2 2.4 Sucrose accumulation 3 2.5 Harvesting (maturity) 3 2.6 Leaf growth and photosynthesis 4 2.7 Nitrogen 5 2.8 Water use and irrigation 8 2.9 Plant spacing and light interception 11 2.10 Modelling sugar beet growth 12 2.11 Economics of sugar beet production 13 3. Objectives 14 4. Methodology 4.1 1998 field trials 4.1.1 Site details SRS 98 15 4.1.2 Trial design and management 15 4.1.3 Canopy growth, harvest and sugar analysis 16 4.2 1999 field trials - site 1 4.2.1 Site details SRS 99A 16 4.2.2 Trial design and management 16 4.2.3 Canopy cover, harvest and sugar analysis 17 4.3 1999 field trials - site 2 4.3.1 Site details SRS 99B 17 4.3.2 Trial design and management 17 4.3.3 Canopy cover, harvest and sugar analysis 18 4.4 Economic analysis 4.4.1 System used 18 4.4.2 Assumptions 18 4.4.3 Comparison to other crops 19
5. Results
vi
5.1 1998 field research 5.1.1 Canopy growth 20 5.1.2 Root and sugar yields 20 5.2 1999 field research - site 1 5.2.1 Canopy growth 21 5.2.2 Root and sugar yields 22 5.2.3 Sugar accumulation 22 5.3 1999 field research - site 2 5.3.1 Canopy growth 24 5.3.2 Root and sugar yields 25 5.3.3 Nitrogen, population and irrigation effects 26 5.4 Economic analysis 26 6. Discussion 6.1 1998 results 30 6.2 1999 results Site 1 31 6.3 1999 results Site 2 33 6.4 Irrigation and sugar production 34 6.5 Weed control, pests and diseases 34 6.6 Nutrition 35 6.7 Sugar beet economics 36 6.8 Potential production areas 36 7. Conclusions 38 8. Recommendations 39 9. Appendices 9.1 Seed company and variety information 40 9.2 Weather data 41 9.3 Long term sugar price 1949 - 1999 42 10. References 43 A Compendium of Sugar Beet Information (covering agronomy, varieties and seed treatments, planting and cultivation, nutrition, pests, diseases, weed control, irrigation harvesting and storage, yield and quality, rotations and soil aspects, production aspects, stockfeed aspects, and models.)

vii
List of Tables Table 1. 1998 root and sugar yields 21 Table 2. 1999 root and sugar yields 22 Table 3. Measured sugar content at different sampling times 23 Table 4. Measured sugar content for each variety across time 23 Table 5. Interaction effects of nitrogen rate, irrigation amount and population level on root yield, sugar content and sugar yield 25 Table 6. Gross margin analysis of sugar beet 27 Table 7. Gross margin estimates for other crops 28 Table 8. Sugar yield estimates for a range of sugar contents and root yields 29 Table 9. Gross margin estimates with changes to sugar price and yield 29 Table 10. Effect of nitrogen rate, irrigation amount and population level on mean root yield, sugar content and sugar yields 33 Table 11. Irrigation, rainfall and sugar yields 34 List of Figures Figure 1. 1998 canopy growth 20 Figure 2. 1999 canopy growth 21 Figure 3. Effect of nitrogen rate on canopy growth 24 Figure 4. Effect of population level on canopy growth 24 Figure 5. Effect of irrigation amount on canopy growth 25 Figure 6. Effect of nitrogen rate on root and sugar yield 26 Figure 7. Mean monthly maximum and minimum temperature and total rainfall and pan evaporation at Southedge Research Station 1998 41 Figure 8. Mean monthly maximum and minimum temperature and total rainfall and pan evaporation at Southedge Research Station 1999 41 Figure 9. Long term mean monthly radiation at Southedge Research Station 1971 - 91 41 Figure 10. Long term sugar prices 1949 - 99 42
viii
Abbreviations/Glossary ABARE Australian Bureau of Agricultural Resource Economics Brix A measure of the total soluble solids in a solution. A refractometer is used and the result is
normally quoted on a percentage basis. It is used as an indirect measurement of sugar in a solution. Brix is calculated as part of the measurement of Pol percentage and CCS.
BSES Bureau of Sugar Experiment Stations. The main organisation conducting sugar cane
research in Queensland. CCS Commercial Cane Sugar. A calculation that uses the temperature corrected pol and brix
measurements of the first expressed juice and fibre percentage to give the sucrose percentage in sugar cane for payment purposes in Queensland sugar mills. It incorporates a number of assumptions with regards to the effects of impurities and milling efficiencies.
CSR CSR Sugar. A division of CSR Ltd. DAP Days after planting ET Evapotranspiration MDIA Mareeba - Dimbulah Irrigation Area. An area on the north western end of the Atherton
Tableland Pol An indirect measurement of sucrose in a solution. A polarimeter is used to measure the
amount of optical rotation. Pol % Pol percent juice is the measurement of the amount of sucrose in a solution. It is calculated
from the Pol reading and adjusted according to the brix measurement. Pol percent juice is used as the actual amount of available sucrose in a solution for sugar yield calculations.
RIRDC Rural Industries Research and Development Corporation SRDC Sugar Research and Development Corporation TSH Tonnes sugar per hectare TSHM Tonnes sugar per hectare per month
ix
Executive Summary Sugar beet is grown in the temperate climates of the world for sugar whereas in warmer climates, such as Queensland, sugar production is based on sugar cane. Sugar content of sugar beet is about 25% higher than that found in sugar cane with production from sugar beet supplying about one third of world production. In most countries where sugar beet is grown it is considered a high value crop and with a crop length of about 5 - 6 months is used in rotation with other crops such as maize, cereals and potatoes. Improvements in sugar content of sugar beet has been greater than that in sugar cane in recent years and the development of more heat - tolerant varieties has seen a greater interest in growing sugar beet in areas currently growing sugar cane. In 1993/4 CSR conducted trials in the Mackay/Burdekin areas of north Queensland to study the performance of a number of sugar beet varieties. The trials were conducted in areas where soil conditions were not really suitable for sugar cane due to salinity or sodicity problems. Results varied; pests and diseases were a problem in the humid, coastal climate and growing sugar beet required many more management skills compared to those for sugar cane. However when given suitable conditions sugar production from sugar beet was at least equal to that from high yielding sugar cane when compared on a tonnes of sugar produced per month (TSHM) basis. As well it was shown that sugar beet could be processed through a conventional sugar cane mill when mixed in with the cane at a ratio of 0.15 to 0.85. An added bonus was that it required less water to grow a tonne of sugar using sugar beet compared to sugar cane. It was concluded that areas currently producing high yields of sugar cane would not grow sugar beet due to sugar beet not fitting into the current sugar cane rotation, sugar beet could not be grown continuously and the greater management skills required, however areas with a cooler climate, a farmer base with skills in row cropping and a sugar cane infrastructure should be investigated. The Atherton Tablelands (about 70 kilometres inland from Cairns) was suggested as sugar cane was just starting to expand into this area at the time. Since 1996 there has been a rapid expansion of sugar cane production on the Atherton Tableland and surrounding districts. This expansion saw the building of the first new sugar cane mill in Queensland for 73 years. Cane crushed in 1999 by the new mill totalled 480,000 tonnes which is estimated to increase to 800,000 tonnes by 2002. As well sugar cane grown on the Tableland is also being processed at South Johnstone mill about 100 kilometers to the southeast. The expansion onto the Tablelands has been due to declining yields and sugar content of sugar cane grown on the coast, several years of devastating storms and cyclones, population growth of the regional centres Cairns and Innisfail taking up cane land for residential use and the availability of land and irrigation water on the Tableland. Given this situation the recommendation from the CSR trials was discussed and a project studying the potential of sugar beet on the Atherton Tableland was developed. The objectives of the project were to review the literature and compile a compendium of useful research information and to study the performance of a number of sugar beet varieties in terms of growth and sugar production. Using this information the economics of sugar beet production were to be assessed. The literature review indicated the enormous amount of reference information available for sugar beet. Sugar beet is grown in many of the highly developed countries of Europe (UK, France, Germany and Holland), Japan, as well as a number of states in the USA (California, North Dakota and Michigan). As such highly developed research and development institutions are in place to support the sugar beet industries. A major focus of sugar beet research is variety development and a large number of varieties were available for selection and study in the project. Those trialed were from seed companies with varieties suitable for areas that had growing conditions most similar to those locally and so a number of varieties grown in California were tested. As well a couple had resistance to some of the local diseases and so these were also included.

x
Along with the variety evaluation another trial studied the effects of nitrogen, irrigation and population on sugar beet growth and sugar yield. Finally the economics of sugar beet production were examined using simple gross margin analysis to see if sugar beet could be a profitable enterprise within the farming framework of the Atherton Tableland. Results from the variety evaluation showed firstly that sugar beet could be grown successfully in the local environment. The beets grew well and any problems encountered (such as pests and diseases) were controlled satisfactorily using available chemicals and management practices. Fresh root yields ranged from 50 - 60 tonnes/hectare, sugar content of the roots averaged 18.7 % and sugar yields were in the 9 - 11 tonnes/hectare range which are all comparable to results from commercial crops grown overseas. The best performing varieties were those specifically bred for use in hotter climates (California). Studying the sugar content of sugar beets at different stages showed that sugar concentration did increase significantly over the later stages of growth and that an economic sugar yield could be expected over a reasonably long harvest period. This is an important consideration if an industry was to develop. Irrigation applied showed sugar production of about 2 tonnes per megalitre of water applied which is less than that required locally for sugar from sugar cane (about 1.5 tonnes/megalitre). Irrigation water and supply has become an important consideration as the rapid growth of sugar cane has put the current system under stress. Infrastructure improvements in the irrigation scheme are underway with the possibility of another dam being built within the current irrigation scheme. Results from the management trial indicated that recommendations made for sugar beet production overseas in terms of nitrogen rate to use, plant population to have and irrigation amounts required apply to crops grown locally. In these warmer climates however, canopy growth is more rapid and as such may mean crop length can be shortened compared to overseas. The economic study showed that given the current very low sugar prices growing sugar beet on the Atherton Tableland is probably a doubtful economic proposition, a situation that applies to many sugar cane growers as well. However the long-term outlook for sugar price is positive and when this long - term average sugar price is used sugar beet becomes a commercially viable proposition. The commercial potential of sugar beet is totally reliant on the infrastructure and support of the sugar cane industry. Processing the sugar beets is possible through a sugar cane mill and so their involvement is absolutely necessary for any progress. It is very unlikely that a stand alone sugar beet mill would be built locally, although if it were the beet pulp would be available which is a very valuable stock feed. Also the development of any sugar beet industry would require the import of specialist harvesting equipment not available in Australia. It is envisaged that harvest would be under a contract system similar to that which operates for sugar cane. The conclusions drawn from this research are that sugar beet can be an economic crop for local producers when the price for sugar gets back to more ‘normal’ levels. Sugar beet has a number of advantages as a new crop for local growers. It will ‘fit’ into current crop rotations, can be an excellent break crop for sugar cane and the processing and marketing of the final product - sugar - is well established. For a sugar beet industry to develop the local sugar cane industry, specifically the sugar mill, would have be involved and that a major capital investment in harvesting equipment is required. Given these
xi
two factors are met current infrastructure in terms of the management skills of local producers, soil types, irrigation water and equipment and market are well established. It is recommended that given the large number of new varieties being developed overseas each year, and a trend towards producing varieties more suited to warmer climates, an on-going variety assessment research program is considered. As well the next stage of actually processing sugar beets through a local mill should be studied. On a broader scale other areas of Queensland located close to sugar cane producing areas should be considered for sugar beet. One such area is around Emerald in central Queensland where interest in rotational crops for the cotton industry is high. A small pilot study of sugar beet indicated high yields but low sugar content. It is felt that sugar content could be improved with changes to the nitrogen and irrigation inputs. Although too far away to transport sugar beets to the coastal sugar mills around Mackay for processing, discussions with growers indicated that some sort of initial processing of the sugar beets locally and then transport of the syrup for refinement may be a more practical way. This would have the added advantage of the sugar beet pulp (an excellent stock feed) being available for sale to the local cattle feedlot industry and would offset some of the processing and transport costs. Another area for consideration is the Dawson River valley closer to the Mackay sugar cane areas. This area has become a Queensland Government project initiative with the development of an irrigation scheme. Sugar beet has been included in the list of possible new crops for the region. A major limitation to sugar beet production in other areas of Australia is the lack of sugar cane infrastructure and hence processing facilities. Development outside current sugar cane production areas would require large capital inputs for processing facilities, harvesting equipment and marketing infrastructure. The other potential for sugar beet of course is its use to produce ethanol fuel, an area that received substantial consideration in Australia during the oil crisis of the early 1970’s. Given the current and projected increases in fuel prices it is a crop that may yet again be considered for commercial production. It has been estimated that 1 hectare of sugar beet would produce about 4,500 litres of ethanol. The Federal Government has recently announced that $2 million will be made available to develop ethanol technology. The results from this project and those from the CSR studies will provide useful and important information toward the development of this technology.
1
1. Introduction 1.1 General Sugar beet is a short-term crop of about 6 months grown in temperate regions of mainly the northern hemisphere for sugar production. Sugar beet has a higher (about 25%) sucrose content compared to sugar cane. About a third of the World’s sugar production comes from sugar beet (about 40 million tonnes in 1999). Australia is the only populated continent currently not growing sugar beet as a commercial source of sugar. Since 1996 there has been a rapid expansion of sugar cane production on the Atherton Tableland and surrounding districts (about 70 kilometres inland from Cairns in North Queensland). This expansion saw the building of the first new sugar cane mill in Queensland for 73 years. Cane crushed by the new mill in 1999 totalled 480,000 tonnes which is estimated to increase to 800,000 tonnes by 2002. As well sugar cane grown on the Tableland is also being processed at South Johnstone mill about 100 kilometers to the southeast. The expansion onto the Tablelands has been due to declining yields and sugar content of sugar cane grown on the coast, several years of devastating storms and cyclones, population growth of the regional centres Cairns and Innisfail taking up cane land for residential use and the availability of land and irrigation water on the Tableland. Concurrent with this expansion has been an interest from various sugar industry groups, including millers, on the potential of sugar beet in Queensland. This interest prompted initial studies in 1993 (Morgan et al, 1995) where sugar beet was seen to offer an opportunity of increasing sugar production in areas which were marginal or unsuitable for sugar cane production due to sodicity, salinity and soil diseases. Results varied; pests and diseases were a problem in the humid, coastal climate and growing sugar beet required many more management skills compared to those for sugar cane. However when given suitable conditions sugar production from sugar beet was at least equal to that from high yielding sugar cane when compared on a tonnes of sugar produced per month (TSHM) basis. As well it was shown that sugar beet could be processed through a conventional sugar cane mill when mixed in with the cane at a ratio of 0.15 to 0.85. An added bonus was that it required less water to grow a tonne of sugar using sugar beet compared to sugar cane. It was concluded that there was little prospect of high yielding sugar cane areas being planted to sugar beet, mainly due to the greater management skills required, however areas with a cooler climate and a farmer base with skills in row cropping should be investigated. The Atherton Tablelands was suggested as sugar cane was just starting to expand into this area at the time. 1.2 Sugar beet history in Australia Sugar beet was grown commercially at Maffra, Victoria from about 1890 through to the 1930’s until dairying became a more profitable enterprise (Williams, 1919, 1920, 1924, 1931., Pywell, 1937). Since this time sugar beet has not been grown commercially for sugar in Australia although they were considered in a number of studies for ethanol production during the 1970’s oil crisis (Sheldon, 1980) and grown by individual dairy farmers for fodder production. 1.3 Development of this project This project was developed from the recommendations made by Morgan et al (1995) who suggested that further sugar beet research should target areas where the climate is cooler, there are producers with the required management skills and there is a sugar cane mill available for processing. They nominated the Atherton Tableland as a potential area for consideration. The project was jointly funded by RIRDC and NQ Co - Op Ltd with ‘in - kind’ contributions from Mr Terry Morgan, CSR Ltd and South Johnstone Sugar Mill.

2
2. Literature review 2.1 Introduction This review is based on the required aim of the project which was to study the commercial potential of sugar beet in the local area. This required field trials to study the growth and sugar yield of a number of sugar beet varieties and the effect of nitrogen rate, irrigation level and plant spacing on growth and sugar yield of sugar beet. Most of the literature cited is from research conducted in the UK, Europe and the USA (specifically California) and hence there is little comparison climate-wise between these areas and the dry, tropical conditions experienced locally. The main difference however is that in the northern hemisphere crops are reaching maturity for harvest when temperatures are rapidly decreasing toward winter, locally, crops will be at this stage when temperatures and evaporative demands are at the highest. The impact of this physiologically on sugar production and accumulation is not well documented. Of all the sugar beet growing areas, California has growing conditions the most similar to those locally in terms of daytime temperatures, evaporation rates and daily radiation receipts. As well, irrigation is an essential part of production, an absolute requirement for production locally. In the major sugar beet growing areas of temperate regions, the main factor controlling yield is the amount of radiation intercepted (Scott et al. 1973). In tropical latitudes radiation is more intense and canopies can become light-saturated and so the relationship between yield and radiation interception is not so consistent. For sugar beet production in dry areas (where irrigation is essential for production) yield is more closely related to the amount of water available and the dryness of the atmosphere (Scott and Jaggard, 1993). Sugar beet growth and production locally then is more likely to be influenced by the effects of high temperatures (day and night) on growth and sugar accumulation towards harvest and the availability and uptake of water and nutrients. 2.2 Species development Sugar beet (Beta vulgaris) is a biennial plant of the Chenopodiaceae family with the root crop grown and harvested in the first season for sugar. The evolution of cultivated sugar beet is from ancestral maritime forms centred around the Mediterranean region. It is one of four main groups including beetroot and fodder beet (mangolds) and is, along with sugar cane, the only major source of sucrose (sugar). Estimated world sugar production is 124.4 million metric tonnes for 2000 - 01 of which about 30% (37.3 million tonnes) is from sugar beet (USDA, 2000). Australia is the only populated continent not growing sugar beet as a commercial source of sugar. 2.3 Germination, seedling and root growth Base temperature for germination is 3°C and using modern, monogerm pelleted seed emergence takes 5-10 days. Once established the seedling enters a period of leaf initiation with very little root growth so by six weeks the plant has 8-10 leaves but only a small root. From this stage onward leaf and root growth occur simultaneously with the root making up an increasing proportion of total plant dry weight (Scott et al. 1974).
3
Analysis of leaf initiation and growth and responses to temperature and nitrogen are covered in detail by Milford et al. (1985a,b,c). Leaf area index (LAI) reaches a maximum close to the time the largest leaf reaches full size then declines with leaves appearing and expanding in a linear relationship with thermal time. Hosford et al. (1984) studied the changes in phytohormones during the growth of the storage root and found distinct periods of cell expansion then division. During the period of maximum cell division (at 20-60 g root dry matter) of the cambia and cambial products, cell number increased exponentially. In the UK, the seedling tap root initially grows downwards at about 10 mm/day then increases to about 15 mm/day for most of the growing season. The mature root system is profusely branched, deep (1.5 m) but generally sparse with a typical rooting density in the top soil of 2 cm root/ml soil. This declines sharply with depth (Brown and Dunham, 1989). Brown and Biscoe (1985) found most of the fibrous root system in the top 30 cm and on the basis of weight accounted for a progressively decreasing proportion of total biomass, from approximately 10% in early growth to about 3% at full canopy. Before the storage root enlarges, however, the fibrous root system may represent at least 30% of the total dry matter. When the storage root starts to enlarge a major share of the production is partitioned to it and by harvest the ratio of root to total dry matter is normally in the range of 0.65 to 0.75. 2.4 Sucrose accumulation Sucrose enters the root via the phloem and is stored in the vacuoles of the parenchyma cells both in the vascular zone (greatest concentration) and parenchymatous zone (Giaquinta, 1979). Milford (1973) found that as cell size increased the sucrose content per cell increased nearly proportionally with cell volume. Above a certain volume however (10-15 x 10-8 cm3) there was a less than proportionate increase in sucrose. He concluded that cell size was a major determinant of sucrose concentration and is greatest in the centre section of the root with the largest diameter and it falls off above, below and outside this point. Thus sugar concentration is a function of the relative proportions of large and small cells, and a storage root composed of many small cells (close to the cambia) would be more efficient at accumulating sugar than one composed of fewer large cells. There is a strong negative correlation between storage root dry mass yield and high sucrose concentration which hinders breeders attempts to raise sugar yields. Fresh weight concentrations of sucrose in modern varieties are in the 15-20% (g sugar per 100 g fresh root) range. 2.5 Harvesting (maturity) There is no evidence that sugar beets go through a ‘ripening’ stage and so harvesting times can be manipulated. This factor is used by processors to extend the period of harvest in order to spread overhead costs although in normal circumstances beets would not be harvested before sugar concentration reached at least 14%.
4
Milford (1973) found that sugar as a proportion of the root’s dry matter reaches a maximum (70-72%) and thereafter sugar and non-sugar dry matters are accumulated in parallel. It is usual for sugar concentration on a fresh weight basis to increase progressively through the season but its maximum value and time reached varies considerably from year to year. Milford and Thorne (1973) reported that changes in external conditions, such as cold night temperatures or bright day conditions, only changed the sugar concentration by changing the water content in the plants. 2.6 Leaf growth and photosynthesis Sugar beet is a C3 plant and fixes carbon dioxide by the Calvin cycle. Milford et al. (1985 a-d) described in detail the patterns of leaf appearance and expansion and found that after emergence, beet leaves were produced continuously throughout the growing season; the first pair appear synchronously and later leaves appear singly on a 5:13 phyllotaxis. During maximum growth 2-3 leaves appeared each week (at thermal time intervals of 30°C day and a base temperature of 3°C) reaching about 40 at full cover. Goodman (1966) showed that maximum leaf area index (LAI) needed to reach 3 to achieve maximum growth rate and that the time it took to reach this figure had a marked effect on total dry matter and sugar production (Scott and Jaggard, 1993). Timing of full leaf cover with the occurrence of maximum radiation receipts is an important consideration in temperate climates. Attempts to accelerate early leaf growth (cover) using more fertiliser or increasing plant density have been unsuccessful because any extra dry matter produced stays in the leaves and little is translocated to the root (Draycott and Webb, 1971). In temperate climates leaf production and expansion is limited by low temperatures. Lenton and Milford (1977) tried using gibberellic acid (GA) on sugar beet plants and found they responded by increasing leaf area and petiole growth but the effects did not usually translate into increased accumulation of sugar. In countries where sugar beet matures in warm conditions continued leaf growth may prevent maximum sugar accumulation. Wittwer and Hansen (1952) used late season applications of growth retardants to prevent new leaves growing resulting in increased dry matter of the harvested roots. The potential for photosynthesis (and hence dry matter production) is set by the amount of solar radiation intercepted by the foliage. Glauert (1983) studied the effects of temperature and irradiance (0-800 W/m2 total radiation) on C02 exchange and assimilation of sugar beet and found a very close relationship between C02 uptake and irradiance. Both increased progressively through the morning then declined later in the day. The response curve of net photosynthesis (per unit of land covered by foliage) to incident radiation showed there was an increase over the whole range of radiation but with a diminishing response. This response was maintained for many weeks indicating the continued production of leaves, however, eventually the overall increasing age of the leaf surface means net photosynthesis decreases. It wasn’t until temperature in the gas exchange system reached very low levels (< 2° C) that response to light was diminished. Glauert’s system enabled an estimate of night respiration with an average dry matter loss of 2 /m2/day which was related to the amount of dry matter assimilated during the previous day. Whenever dry matter accumulation exceeded about 20 g/m2/day, the respiration rate in the two hours after dusk increased from the usual value of about 0.15 g/m2/day to about 0.3 g/m2/day.

5
Thus dry matter production can be estimated from the measured amount of C02 uptake during the day which is directly proportional to the amount of radiation intercepted by leaves during that day. From Glauert’s study a ‘conversion coefficient’ for the conversion of intercepted radiation or C02 uptake into dry matter was possible. For the conversion of intercepted radiation to biomass the coefficient averaged 1.93 g/MJ (+/- 0.188), and 1.72 g/MJ when estimated from C02 uptake during the day (C02 uptake being directly proportional to the amount of radiation intercepted by the foliage during the day). Scott and Jaggard (1993) related light energy intercepted between sowing and harvest to biomass, root and sugar yields for 13 beet crops between 1978 and 1990. They found the overall conversion efficiency for biomass to be 1.6 g/MJ and reasoned the lower figure to be due to loss of dead leaves and a portion of the fibrous root system from the biomass. When they factored in an estimate of lost leaf weight from the data of Milford et al. (1985a) the coefficient became 1.71 g/MJ, a value similar to that estimated from gas exchange. The coefficient representing the conversion of intercepted light to sugar production was 0.97 g/MJ. They explained differences in the harvest index (ratio of sugar yield to total biomass yield) over time from 0.49 to 0.56 by a change of variety (the new variety was able to partition more assimilate into the root later in the season), and other factors such as nitrogen uptake and rainfall/irrigation effects. 2.7 Nitrogen Nitrogen is the single most important nutrient for sugar beet growth and sugar production. When in short supply yield is drastically reduced, when in excess the colour and vigour (size and number) of the leaf canopy is improved. This has led to the widespread over-use of nitrogen which decreases sugar percentage and juice purity (Draycott, 1993). Draycott (1993) has summarised the effects of nitrogen on various aspects of sugar beet growth as follows: 2.7.1 Germination and emergence Moderate amounts of nitrogen can decrease the percentage of seeds producing established plants. For each 40 kg of N broadcast before sowing this percentage was decreased by about 10% (zero application resulted in 90% establishment). A small, initial dose is recommended (about 40 kg/ha) to permit establishment and early growth and then the balance required can be applied at the 2-4 true leaf stage. 2.7.2 Concentration and uptake Sugar beet are generally thought to need to take up 200-250 kg/ha N in total to give maximum root yields and so in most cases fertiliser applications of nitrogen is a requirement. In crops producing maximum yields the tops contain about 3 grams N per 100 grams in dry matter at harvest and the roots about 0.8 grams. Studies with 15N (Haunold, 1983., Lindemann et al. 1983., Broeshart, 1983) showed beet crops took up between 50-80% of applied N from depths down to 120cm.
6
Milford and Watson (1971) reported that nitrogen fertiliser increased plant and root dry weight and leaf area and decreased the sugar content. The change in leaf area accounted wholly for the increase in plant dry weight produced by the addition of nitrogen because net assimilation rate was unaffected. Nitrogen did not alter the partition of the total assimilate between roots and leaves. Houba (1973) showed that a continuous uptake of nitrogen increases the growth of leaves that appear late and prolongs the period of foliage-dominated growth. Crops growing under these conditions partitioned much more of their biomass to the growth of tops, and root and sugar yield was decreased. Carter et al. (1976) found that N uptake by the crop was linearly related to the total available N (NT). Average uptake of the total plant was 5.4 kg / metric ton of fresh roots at the maximum sucrose yield. 2.7.3 Leaf growth and production In early season growth nitrogen increases leaf size and number and therefore increases dry matter production per unit land area. Later in the season nitrogen maintains this increase and therefore increases root dry matter production and hence sugar production. Armstrong et al. (1983, 1986) showed that nitrogen fertiliser did not affect the conversion of intercepted radiation to dry matter but greatly increased the amount intercepted. If conditions are favourable for early growth plants may need to take up as much as 5 kg N/ha/day and this period extends from the 4-5 leaf stage until full canopy. During this period LAI is directly related to the amount of nitrogen in the crop. Milford et al. (1985a) showed that the rate of leaf expansion per unit thermal time was positively related and very sensitive to the nitrogen concentration of the leaves. The aim then is to apply enough nitrogen to boost early leaf growth and then maintain this until harvest but avoid an excess which depresses sugar yield and juice quality. On soils with little residual nitrogen sugar yield response tends to reach a maximum at the 100-150 kg/ha range of applied N, whereas sugar percentage and juice purity tend to be at a maximum at rates less than 50 kg/ha applied nitrogen. 2.7.4 Sugar and root yield Nitrogen in excess of requirement decreases sugar yields. Draycott and Durrant (1971) reported that sugar yield was related to the total nitrogen concentration in the tops and roots and to uptake. As well, leaf colour was a good guide to nitrogen concentration. Halvorson and Hartman (1980) reported that maximum sucrose production did not coincide with maximum whole root yield and that sucrose production was maximum at the same nitrogen level independent of the cultivar studied. Adams et al. (1983) quantified the difference and showed that substantially lower levels of nitrogen (about 90 kg/ha) are required for maximum recoverable sucrose yield compared to that required for maximum root yield. On a very fine sandy loam (0.9% organic matter and about 30-40 kg/ha NO3 N in the soil) Anderson and Peterson (1988) found that the optimum nitrogen rate was 50 kg/ha higher for root yields than for maximum sucrose production. Carter et al. (1976) estimated that near maximum sucrose yields were obtained when total N (NT) was about 35 kg/ha less than that needed for maximum root yields.
7
2.7.5 Root quality The decrease in sugar percentage with high nitrogen rates is due mainly to increased water retention in the root. The level of amino compounds (particularly α amino acids) in juice is a measure of its purity. At increasing levels these compounds impair the crystallisation of sugar in the factory process. A decrease in juice purity largely reflects increasing concentration of amino compounds caused by excessive uptake of nitrate late in the season. Dutton and Bowler (1984) suggested that for optimum returns for grower and processor the aim should be to have an upper limit of amino nitrogen of 150-200 mg N/100g sugar. 2.7.6 Predicting fertiliser requirements The two main prerequisites for estimating the amount of fertiliser N to apply are the amount of soil available nitrogen prior to sowing and the amount that will be mineralised during the growing season. Carter et al. (1976) showed that the total N (NT) needed for maximum root and sucrose yields can be predicted over a range of climatic conditions with corresponding large differences in yield potentials. They found the optimum nitrogen level from all sources to vary between 5-6 kg per metric ton of beet roots produced. Neeteson and Smilde (1983) reviewed methods of predicting fertiliser nitrogen requirements. An example of the estimate of the optimum fertiliser requirement (Nop) is given made on the basis of mineral nitrogen present in soil samples 0-60cm depth taken before sowing (Nmin) :
Nop = 220 – 1.7 Nmin
Increasingly accurate estimates of the amount of mineralised nitrogen available for crop use through the growing period are being used in crop growth models to estimate fertiliser nitrogen requirements under widely varying conditions (Greenwood et al., 1984). 2.7.7 Timing and form of application In the UK ammonium nitrate is the most commonly used form of nitrogen fertiliser but in many other countries urea is the norm. Irrespective of form, it is necessary that the nitrate ends up in the zone around the roots due to rainfall, irrigation or drilling. An ideal supply and uptake pattern shows 30-40 kg/ha nitrogen applied immediately after sowing with a further 90 kg/ha applied at the two leaf stage at a soil mineral nitrogen content of 75 kg/ha. (Draycott, 1993). It is important that available N is depleted by harvest time.
8
2.8 Water use and irrigation The evolution of cultivated sugar beet from ancestral maritime forms centred around the Mediterranean region explains the crop’s ability to survive salinity (only cotton and barley are more tolerant) and drought. As a crop it has a long vegetative phase and deep root system and a capacity for osmotic adjustment. Dunham (1993) reviewed the current knowledge on aspects of sugar beet growth and water use, and irrigation and in particular reported the following: 2.8.1 Crop water use There are many ways to estimate the water use by crops (Sharma, 1985). Typical ET measurements for sugar beet crops range from about 400 mm where the growing season is short and cool (Finland) to 1500 mm for an irrigated crop in southern California. Young seedlings use very little water and so water use (ET) at this stage is mainly the evaporation from the soil surface. As the crop develops water use increases and evaporation from the soil surface declines and provided the crop remains unstressed, rises to a maximum at full crop cover. Pruitt et al. (1972) measured ET for an April planted, fully irrigated sugar beet crop at Davis, California and found ET of about 1 mm/day at 4 weeks; 4.5 mm/day at 8 weeks; 7.8 mm/day at full canopy and 5 mm/day at harvest (mid-September) for a crop total of 900 mm. A number of researchers (Doorenbos and Pruitt,1984; Brown et al., 1987b) have calculated crop coefficients (Kcrop) for beet at full cover using ET = Kcrop ∗ ETref and found Kcrop values in the range 1.05 to 1.3 at full cover. On a sandy soil (85% sand, 2% clay), Hang and Miller (1986a) used ET = 0.95 ∗ Epan at full crop cover. They found that maximum dry matter production and sucrose yield occurred at an irrigation rate equivalent to about 85% of the estimated ET with no further benefit of increasing irrigation rates beyond estimated ET rates. 2.8.2 Water use and yield Just as there is a direct relationship between growth and intercepted radiation, so a similar relationship exists between growth and water use. This is because the potential for photosynthesis, and thus dry matter production, and the potential for transpiration, are both set by the amount of solar radiation intercepted by the canopy (Scott and Jaggard, 1993). A useful approximation is that total dry matter production (Y) and transpiration (T) per unit area are directly proportional (Y/T = qT) where qT is a constant for a particular species provided the range of climate is not too wide. In sugar beet a number of studies have related Y and S (sugar yield) to ET enabling Y/ET = qET and S/ET = sET to be derived. Dry matter production per unit of water used, or water use efficiency (qET) ranged from 0.0021 (2.1 g/kg) in the hot, dry climate of California with approximate total ET of 1150 mm (Howell et al., 1987) to 0.0068 (6.8 g/kg) in the cooler, wetter climate of the UK with approximate total ET of 450 mm (Dunham, 1989). Estimates from other studies of dry matter produced per amount of water used range from 5-7 g/kg (qET = 0.005 to 0.007) in temperate climates (UK), (Scott and Jaggard,1993) to 2.3 g/kg (qET = 0.0023) in the arid environment of California (Ghariani, 1981).
9
Hang and Miller (1986b) found on a sandy soil that the maximum growth rate of tops occurred between days 51 – 121 (8.42 g m-2 day), for roots it was between days 51 – 135 (20.98 g m-2 day) with irrigation set at 115% ET. The most efficient use of water in terms of partitioning to root growth was about 100% ET for a sandy soil. In temperate climates total biomass production is closely related to intercepted radiation, however in dry, continental climates nearer the equator (California for example), the overriding control of yield is via the amount of water available and the dryness of the atmosphere (Scott and Jaggard, 1993). 2.8.3 Water stress As water stress develops in sugar beet and plants experience low leaf water potential and Relative Water Content (RWC) for longer each day, the rate of growth of leaves and storage root declines resulting in slower cell expansion and smaller stomatal conductance. This means less carbon dioxide uptake for dry matter production (Milford et al., 1985b). The rate of appearance of individual leaves is only slightly reduced by stress but their productive life before senescence is considerably shortened (Milford et al.,1985a). The stomata of mature leaves close when leaf water potential is about –1.5 Mpa, for younger leaves stomatal closure occurs at about –1.8 Mpa and wilting at about –2.0 Mpa. Therefore small, actively photosynthesising leaves can survive at the centre of the crown when all the older leaves are wilting or dead. Crop measurements such as leaf cover, LAI and radiation interception increase more slowly and decline faster in stressed crops (Brown et al., 1987 a,b). By harvest, the ratio of root to total dry matter is normally in the range of 0.65 to 0.75. Ghariani (1981) found stress appeared to increase this ratio indicating top growth was more restricted than root growth. Hang and Miller (1986b), however, found the ratio decreased when their plants were under or over watered. The ratio was largest (0.74) when water applied was sufficient for maximum growth. It is suggested that these contradictory results may be due partly in the difficulty in accounting for all the fibrous roots and dead leaves in total dry matter estimations. The ratio of sugar to root dry matter in modern varieties is normally about 0.75. Nutrition affects this ratio slightly but water stress has no detectable effects (Ghariani, 1981; Brown et al., 1987b). 2.8.4 Irrigation and yield In most sugar beet growing areas of the world irrigation is used as a supplement to rainfall and typically only 100-200 mm are needed to ensure growth is not limited. In other areas (USA, Egypt, Pakistan) irrigation is essential for beet production with 500-1000 mm commonly used. Irrigation for maximum yield should supply the minimum amount required for unrestricted growth and so any growth response will depend on how much extra is needed. Frequent irrigation tends to increase the amount of evaporation from the soil (E) during early growth especially and then significant amounts can remain in the soil at harvest and so in practice all the water applied does not translate into water used by the crop. Under these conditions root and sugar yield have lower water use efficiencies. Where irrigation is supplementary, yield responses generally increase as seasonal rainfall decreases (Draycott and Messem, 1977). This relationship has limited use for irrigation management during a particular season as seasonal variation in rainfall has an over-riding effect.
10
Where irrigation dominates water applied, yield is related directly to amount applied and responses become much more predictable. The relationship between yield and irrigation can be described using equations (water production functions) and often include other factors such as nitrogen applied. An example developed for use in Texas by Lansford et al. (1989) has the form:
Yroots = a + b I2 + c I3 + d N + e N2 + ƒ I N where Yroots = yield of roots, a to ƒ are constants, I = total seasonal irrigation, N = applied nitrogen 2.8.5 Irrigation and sugar levels In crops where water is not limiting sugar concentration rises to a maximum sometime before harvest at between 15-20% for modern varieties. In stressed crops sugar concentration rises more quickly and under severe stress can be 5% higher than in un-stressed crops (Hang and Miller, 1986a). Generally, though, a wide range of irrigation treatments has little effect on sugar concentration at harvest, mainly due to the effects of seasonal rainfall (Winter, 1988). 2.8.6 Irrigation and nutrient uptake Irrigation can stop fine roots from dying in dry soil, help move nutrient ions towards the roots, increase mineralisation of soil organic matter and enables more soil water to be transpired. However irrigation can also leach nutrients (especially nitrogen) below the root zone and this is the only nutrient which has shown an interaction with irrigation. When nitrogen is limiting, irrigation sometimes increases the crop’s responsiveness to moderate rates of nitrogen (Last et al., 1983) and when nitrogen supply is plentiful, irrigation can reduce the build-up of α amino nitrogen impurities in the roots (Winter, 1990). 2.8.7 Irrigation methods Practically all known methods of irrigating (furrow, sprinkler, booms, rain guns, centre pivots etc) are used to irrigate sugar beet somewhere in the world with the aim of applying the right amount of water uniformly. Haddock et al. (1974) compared furrow and sprinkler methods and found that although sprinklers produced plants with larger, greener tops there were no differences in sugar production between the two methods. Sugar yield per unit of irrigation was lower with the furrow method as it used about 20% more water. Draycott and Messem (1977) showed no consistent difference in yield response between trickle and sprinkler irrigation in trials in the UK.

11
2.8.8 Irrigation timing In areas where irrigation supplies most of the water for growth, pre-planting irrigation is usually essential. Once established young seedlings have little transpirational demand and provided root growth is not restricted they are unlikely to be water stressed. Stress is more likely to occur when the leaf canopy is expanding rapidly and reaches full cover although on very hot days even well-watered crops can wilt. With its deep-rooting habit, no sensitive growth stage (such as flowering) and the fact that yield and quality are not greatly affected by moderate water stress means sugar beet is less affected than many field crops by water stress (potatoes and vegetables for example). As well, a stressed crop can regain full production capacity once water becomes non-limiting. The basis for judging timing and amount of irrigation to apply varies from unaided farmer assessments to methods based on crop or soil measurements or recent rainfall and evaporation data. Leaf water potential (Stegman and Bauer, 1977), the difference between leaf and air temperature (Jackson, 1982), soil water potential (Cassel and Bauer, 1976) and water balance equations (Hang and Miller, 1986a) have all been used to schedule irrigation on sugar beet. Excess irrigation is wasteful and can reduce yields due to waterlogging, nutrient leaching, increased pest and disease problems and harvest difficulties. The aim then is to irrigate so that the crop can use significant amounts of soil water within the root zone and build up a sizeable water deficit towards harvest provided growth is not restricted. In the USA, where irrigation is essential (and relatively low cost), there has been a tendency to over-irrigate. A number of studies have aimed at decreasing amounts by reducing applications to a smaller fraction of ETref (Hang and Miller, 1986a) or cutting –off irrigation well before harvest (Howell et al., 1987). 2.8.9 Other Irrigation creates a more humid environment which can favour the survival and spread of some pests and diseases, in particular Cercospora with overhead irrigation, and extra control measures may be needed. Sugar beet growth is not affected when the depth to the water table is 1 m, however water-logging at 0.5 m severely affected growth (Benz et al., 1985). Sugar beet can tolerate salinity better than most crops with sugar yield unaffected by a soil-paste conductivity value of 7 dS/m, however germination of sugar beet seed is sensitive to salinity (Rhoades and Loveday, 1990). 2.9 Plant spacing and light interception For radiation interception to be maximised it is critical that plant population and spacing are optimal. Scott (1964) showed that when 75 000 and 37 000 plants/ha had reached maximum crop cover the higher population was intercepting 89% of incident radiation, the lower population only 75%. Both converted intercepted biomass at the same efficiency (1.6 g/MJ) but the differences in final yields were directly related to intercepted radiation. Many experiments have shown that plant populations of about 75 000/ha are required for maximum sugar yield although total biomass yield (mainly of foliage) tends to increase with higher populations.
12
The failure of higher populations to give extra yield arises because over-lapping of leaves from adjacent plants occurs early and, as this becomes more extensive, individual plants trap less light and consequently produce less dry matter (Scott and Jaggard, 1993). The row and plant spacings used to obtain the target 75 000 plants/ha can vary. Jaggard (1979) found that yield was reduced when row spacing exceeded 51 cm and with rows set at 51 cm when plant spacing exceeded 40 cm. In most sugar beet growing areas of the world row spacings are 50 cm or less. Plant row and seed spacing also needs to take into account operations such as cultivation and harvesting and so there is a ‘practical’ seed space of 10-20 cm. At 50 cm row spacings seed spacing should be about 26 cm to get the 75 000 plants/ha population required for maximum yield. 2.10 Modelling sugar beet growth Forecasting of yield began in the UK in the 1940’s to aid processing companies in making decisions on labour and raw material requirements and was based on digging samples of plants from randomly selected fields (Scott and Jaggard, 1993). As understanding of the processes involved in sugar beet growth such as leaf and root growth, dry matter partitioning and sucrose accumulation grew it became possible to more accurately construct a ‘model' of sugar beet growth and sugar production. As more is understood the complexity of the model describing a process or event can become greater as does the precision in any predictions made using it. There have been quite a few ‘models’ developed to explain various aspects of sugar beet growth: Fick et al. (1973) developed a fairly complex and detailed model to describe sugar beet growth – SUBGRO; Day (1986) used a simple model to describe the variation between years in early sugar beet growth; Spitters et al. (1990) developed a weather – based yield - forecasting model; Kropff et al. (1991) used a simple model to explain crop loss due to weed competition in sugar beet; Burke (1992) developed a physiological growth model for yield forecast while Chocola and Radek (1992) designed a computer model “EKONOM” to study the costs of sugar beet growing. More recently Smit et al. (1995) developed and evaluated (1996) a production model ‘PIEteR’ designed to improve advice given to sugar beet farmers in the Netherlands. It focuses on N-fertilisation and plant density and on harvest and delivery dates to predict root and sugar yields from which sugar content is calculated as well as juice purity and operating receipts. The model predicts these parameters every day during the growing season. In the UK a system is now used (Sugar Beet yield prediction and management) to provide estimates of sugar yields per processing factory area. It uses satellite, soil and meteorological data and a sugar beet growth model to predict sugar and derived animal feed yields several months ahead of harvest. For the 1994 and 1995 growing seasons national yield predictions made 3 months before harvest were within 0.1 tonnes per hectare of the actual yield (Stott et al. 1998).
13
2.11 Economics of sugar beet production Sugar beet is considered a high value crop and plays an important role in the crop rotation cycle where it is grown. Most of the main sugar beet growing regions regularly report on the economics of sugar beet production (Vierling and Zeddies, 1996) while in the USA the costs of production of both sugar cane and sugar beet are compared and reported (McElroy and Ali, 1995, 1996). Christenson et al. (1995) reported on the net returns from 12 cropping systems containing sugar beet and navy beans and found that systems with the greatest proportion of sugar beet and also including navy beans had the highest annual net return. Locally, there are many reports on the economics of production for a wide range of crops including sugar cane (Hinton, 1999), navy beans (Hinton, 1997), peanuts (Norman, 1994) and tobacco (Hinton, 1997). The costs of production and returns expected for sugar beet grown on the Atherton Tableland are reported. Some of the inputs such as seed and harvesting costs are difficult to estimate due to unknown costs of these on a commercial scale however reasonable estimates can be made on most of the other input costs and likely returns.

14
3. Objectives The objective of this project was to assess the commercial potential of sugar beet on the Atherton Tableland as a sugar source for the Queensland Sugar Industry. This assessment was made by first reviewing current overseas literature on all aspects of sugar beet production as there was little data available on sugar beet grown in Queensland (and Australia). This collection of research information was to provide a reference source for the field trials. Field trials were conducted to provide actual sugar yield data from sugar beet grown under local conditions as well as information on costs of production. This information could then be used in the economic study on the commercial potential of sugar beet.
15
4. Methodology 4.1 1998 field trials 4.1.1 Site details SRS 98 This trial was conducted at Southedge Research Station (16º58'S, 145º20'E; elevation 450 m) approximately 10 kilometres north west of Mareeba in north Queensland. Southedge is within the Mareeba - Dimbulah Irrigation Area (MDIA) which is considered to be part of the northern end of the Atherton Tableland. Southedge has an annual rainfall of 1,110 mm, predominantly in the November - March period and is described as dry tropical. Mean monthly rainfall, temperature, evaporation and radiation data are given in Appendix 2. The soil is a red earth of granitic origin, known locally as a Morganbury sandy loam and described by Isbell (1996) as a Red Kandosol. The site was within a fenced area that had grown Rhodes grass (Chloris gayana) pasture in the previous two years (1996/97) and was roughly rectangular 75 X 35 m. Pre - trial soil sampling gave the following analysis (0 - 20 cms) pH (1:5 water) 6.0 : electrical conductivity (uS/cm) 40 : exchangeable cations (me/100g) : sodium 0.03; potassium 0.40; calcium 1.56; magnesium 0.43 : DTPA ions (mg/kg): copper 0.1 ; zinc 0.3 ; manganese 29 ; iron 10 : phosphorous (Bicarb mg/kg) 10 (Colwell, 1963). 4.1.2 Trial design and management The trial design was a randomised complete block with treatments the nine varieties to be tested. There were 5 replicates. Varieties used, companies from which the seed was sourced and a brief description are given in Appendix 1. The site was ripped, disced (2X) and rotary hoed and planting rows (1.2 m centres) marked at the same time ethylene dibromide (EDB - 12.5 L/ha equivalent) was applied for nematode control. Plots (25 m) were marked and just prior to planting lime (1.5 t/ha equivalent) and fertiliser Nitrophoska Blue TE™ (500 kg/ha equivalent ) were hand spread over the rows and rotary hoed into the top 10 cms. Sugar beet seed was planted on 23/4/98 using an adapted vacuum planter in two rows 40 cms apart and at a seed spacing to give 10 plants per meter of row (about 80,000 plants/ha). Seed was planted at a depth of 25 - 30 mm. A number of guard rows were planted on the outside of the trial and alongside each of the irrigation lines to counter any edge and irrigation effects. The irrigation system consisted of 50 mm aluminium pipes with sprinklers on 1 m risers every 9 m with a measured output of 4.2 mm/hr. The trial was watered for two hours after planting and then for 1 - 2 hours every 1 - 2 days. Water applied totalled 456 mm (414 mm of irrigation and 42 mm of rainfall). Totals of irrigation water applied and rainfall are given in Table 11. Germination was fairly uniform and complete by 12 DAP with some plots thinned to give accurate plant numbers. Further nitrogen was applied (NaNO3 at 40 DAP and KNO3 at 78 DAP) to give a total of 105 kg/ha of applied nitrogen. Weeds were controlled using a combination of 5 L/ha Betanal™ (phenmedipham) and 5 L/ha Tramat™ (ethofumesate) sprayed at 21 DAP.
16
Helothion™ (sulprophos) at 3.6 L/ha and Lannate™ (methomyl) at 1 L/ha were alternated and sprayed weekly from 12 DAP for insect control. Foliar applications of Boron at 2kg/ha were made at 25 and 35 DAP. A small outbreak of Cercospora was controlled with two sprays of Benlate™ (300 gms/ha) at 90 and 98 DAP. 4.1.3 Canopy growth, harvest and sugar analysis Canopy growth was measured weekly from 28 DAP to 98 DAP using a grid held over the top of the rows and leaf area covered counted (Anon, 1986). Three measurements were made per plot and the results averaged. At harvest (153 - 154 DAP) a uniform 20 m section of each plot was marked out, tops removed and the roots hand dug and weighed. From the sugar beets harvested 10 were selected at random after weighing and frozen for sugar analysis. Thawed sugar beets were processed at South Johnstone sugar mill. The sample was macerated and the subsequent material compressed so the juice (about 400 mls) was expressed through a fine - gauze mesh. The amount of sucrose was estimated by measuring the Pol and Brix of each sample where sucrose percentage (Pol %) equals the Pol reading divided by the Pol factor. Sugar yield was calculated as the fresh root yield multiplied by the percentage Pol. CCS was estimated using the procedures outlined in the Laboratory Manual for Queensland Sugar Mills (BSES, 1991). The fibre percentage used in calculations (4.5) was the average of all samples analysed by Morgan et al (1995). Treatment means were calculated and subjected to an analysis of variance (ANOVA) using the GENSTAT® 5 statistical program (1996). 4.2 1999 field trials 4.2.1 Site details SRS 99A This site was alongside that as described in 4.1.1. 4.2.2 Trial design and management The trial design was a latinised alpha design with 3 rows and 3 columns per block. It contained the same nine varieties as studied in 1998. Site preparation and management was similar to that in 1998 without the liming treatment. Planting occurred on 30/4/99 with germination less uniform than in 1998. Total water applied to the trial was 484 mm (401 mm of irrigation and 83 mm rainfall - Table 8).
17
4.2.3 Canopy growth, harvest and sugar analysis Canopy growth was monitored as in 4.1.3. In an extension of the 1998 trial a sample of sugar beets (5) were randomly selected from each plot at 126, 140, 146 and 161 DAP to monitor sugar accumulation. At harvest (150 DAP) a 5m uniform section of each plot was marked out, tops removed and roots hand-dug and weighed for yield. A random sample (5) were selected for sugar analysis. All samples were processed for juice extraction at Southedge Research Station, frozen, then transported to South Johnstone sugar mill for analysis as described in 4.1.3. Data were analysed as in 4.1.3 with the design treated as a complete block. For the sucrose measurements over time an analysis of repeated measures was performed. This is similar to a split - plot design where the sub - plot was time and whole - plot variety. 4.3 1999 field trials 4.3.1 Site details SRS 99B This trial was conducted at Southedge Research Station as described in 4.1.1. The site was within a fenced area that had grown signal grass (Brachyaria decumbens) pasture in the previous two years (1997/98). Pre - trial soil sampling gave the following analysis (0 - 20 cms) pH (1:5 water) 5.7 : electrical conductivity (uS/cm) 30 : exchangeable cations (me/100g) : sodium <0.01; potassium 0.26; calcium 0.84; magnesium 0.34 : DTPA ions (mg/kg): copper 0.18 ; zinc 0.56; manganese 37 ; iron 7 : phosphorous (Bicarb mg/kg) 14 (Colwell, 1963). 4.3.2 Trial design and management The trial design was a randomised complete block with twelve treatments. These consisted of 3 total nitrogen rates (60, 120 and 180 kg/ha), 2 population levels (75 and 100,000 plants/ha) and 2 irrigation amounts (5.5 and 7.3 mm/hr). Treatments were replicated three times. The site was ripped, disced (2X) and rotary hoed and plots marked. Planting fertiliser consisted of Nitrophoska Blue TE™ (160 kg/ha equivalent), Trifos™ (100 kg/ha equivalent) and muriate of potash (200 kg/ha equivalent) hand spread over the plots and lightly cultivated into the top 10 cm. This gave an initial fertiliser application of 19 N, 23 P and 122 K plus trace elements. The trial was planted on 17/5/99 using the variety F 734. Each plot consisted of 4 rows at 50 cm spacings with the two inner rows used for sampling and the two outer used as guards. Plots were 7 m long with a 2 m buffer between plots. Seed was planted at the 100,000 plants/ha (5 plants per meter of row) rate for all plots and then thinned after germination to the 75,000 plants/ha (4 plants per meter of row) where necessary. Over - head sprinklers were used initially but once germination was complete (11 DAP) Netafim™ T-tape was laid out along each row with the two different outputs cut and set for each individual plot. A system of control valves kept a constant pressure of 100 kPa which gave water output from the two different sized tapes of 5.5 and 7.3 mm/hr. An estimate of 22 kg/ha of available soil nitrate N in the top 30 cms was made using an adapted method of Waring (1965). The different nitrogen amounts (38, 98 and 158 kg/ha) were made up using
18
urea dissolved in 5 L of water and applied with a watering can along each side of the 4 rows in each plot. The urea treatments were split into two equal applications and applied at 45 and 52 DAP. Weeds and insects were controlled as described 4.1.2 with a foliar application of boron (2 kg/ha equivalent) at 60 DAP. 4.3.3 Canopy growth, harvest and sugar analysis Canopy growth was measured weekly from 31 DAP to 143 DAP as described in 4.1.3. At harvest a uniform 1 m section of either of the two inner rows was selected by coin toss and the sugar beets (4 for 75,000 and 5 for 100,000 plants/ha) were hand dug and weighed for yield. Three sugar beets from the row opposite that not selected for yield were dug and used for sugar analysis. The sugar beets selected for yield measurements had the tops removed just below the lowest leaf scar (tops plus crown) so that the root yield equated more to that found in commercial crops. Sugar beets selected for sugar analysis were processed and analysed as described in 4.2.3. 4.4 Economic analysis 4.4.1 System used Gross margin analysis was used as the basis for studying a sugar beet enterprise with the analysis presented based on costs per hectare to grow sugar beet using centre pivot irrigation, the recommended type of irrigation system used locally for sugar cane production. They typically irrigate an area of 20 - 30 hectares. A gross margin is the difference between the gross returns and the variable or direct sowing costs of an enterprise. The variable costs for sugar beet production included outlays for machinery operations, fertilisers, herbicides, insecticides, fungicides, irrigation, levies, harvesting and transport. The gross margin does not take into account fixed costs such as depreciation, rates, electricity/fuel, insurances, registrations, living allowances and interest. These costs should be taken into account when whole farm budgeting is undertaken (Hinton, 1999). The economics of sugar beet production were studied using an analysis of real on - farm costs where possible. 4.4.2 Assumptions Root yield (65 t/ha) is based on the yield from the variety F 734 from the trial conducted at Southedge Research Station in 1999 (SRS 99B) when inputs were considered optimum. Sugar content is based on the average CCS level of this variety in the corresponding trial (17.8 %). CCS is used as the sugar content in economic analyses as it includes a number of assumptions in terms of milling efficiency and effects of impurities. It gives a more realistic idea of likely grower returns. Sugar yield (11.5 t/ha) is calculated as the root yield multiplied by the CCS content. Sugar price used ($350 per tonne) represents the long-term price derived from historical sugar prices (Appendix 3) with the sugar cane price ($/tonne) paid to growers calculated as the sugar price x 0.009 x [(Farm CCS x 100) - 4] + 0.578 (Hinton, 1999). It is difficult to suggest the method of payment to growers where sugar beet is mixed in with sugar cane for processing and so the gross income for sugar beet has been calculated as sugar yield per hectare multiplied by the sugar price.

19
Many of the input costs (machinery operations, harvesting, freight and levies) have been calculated by using those quoted by Hinton (1999) gathered from the BSES, Queensland Canegrowers, local growers and local input suppliers. The commercial cost of seed has been estimated from costs to growers in both the UK and California. The gross margin is based on 1999 dollar values with the sugar beet grown by a family unit using sound management practices. 4.4.3 Comparison to other crops The gross margin for sugar beet is compared to a range of other crops grown on the Atherton Tableland as an indication of its potential in the area (Table 7).

20
5. Results 5.1 1998 field research 5.1.1 Canopy growth Canopy growth measured weekly for each of the nine varieties from day 28 to 98 showed no major differences in rate of growth. Comparing the two varieties giving the highest and lowest sugar yields (Fig. 1) shows that the variety F 734 grew more rapidly and maintained a greater area of canopy compared to the lowest yielding variety Beta 8450. Canopy growth was virtually linear between 28 and 63 DAP and reached a maximum (about 95%) at 98 DAP.
Figure 1. Comparison in canopy growth between the highest sugar yielding variety F 734 (—υ—) and the lowest Beta 8450 (—ν—). All other varieties had canopy growth similar to these. 5.1.2 Root and sugar yields There were no significant differences between varieties for root yield, sugar content and sugar yield (Table 1). The hybrid F 734 gave the highest root yield and sugar content (Pol %) and hence sugar yield and is one of the newer varieties developed for warmer climates. DS 4004 is a variety used in Europe from Danisco Seeds which has some Cercospora tolerance while Beta 4776R is a variety from Betaseeds Inc. and is grown in California.
0102030405060708090
100
28 35 42 49 56 63 70 77 84 91 98
Days afte r p lan ting
% C
anop
y co
ver
21
Table 1. Root yield (t/ha), sugar content (Pol %) and sugar yield (t/ha) for 9 sugar beet varieties tested at Southedge Research Station 1998. Varieties ranked according to sugar yield.
Variety Root yield t/ha
Sugar content Pol %
Sugar yield t/ha
F 734 60.4 19.5 11.69
DS 4004 59.6 18.6 11.13 Beta 4776R 59.0 18.4 10.72
RH 1995 53.9 19.1 10.20 Beta 4035R 57.9 17.7 10.15 Beta 8757 54.1 18.6 10.03 Aztec Bulk 54.7 18.3 9.97 Beta 4454 52.6 18.3 9.61 Beta 8450 48.1 19.3 9.25
Mean 55.6 18.6 10.31
s.e mean 3.41 0.57 0.51 CV % 13.7 6.8 11.1
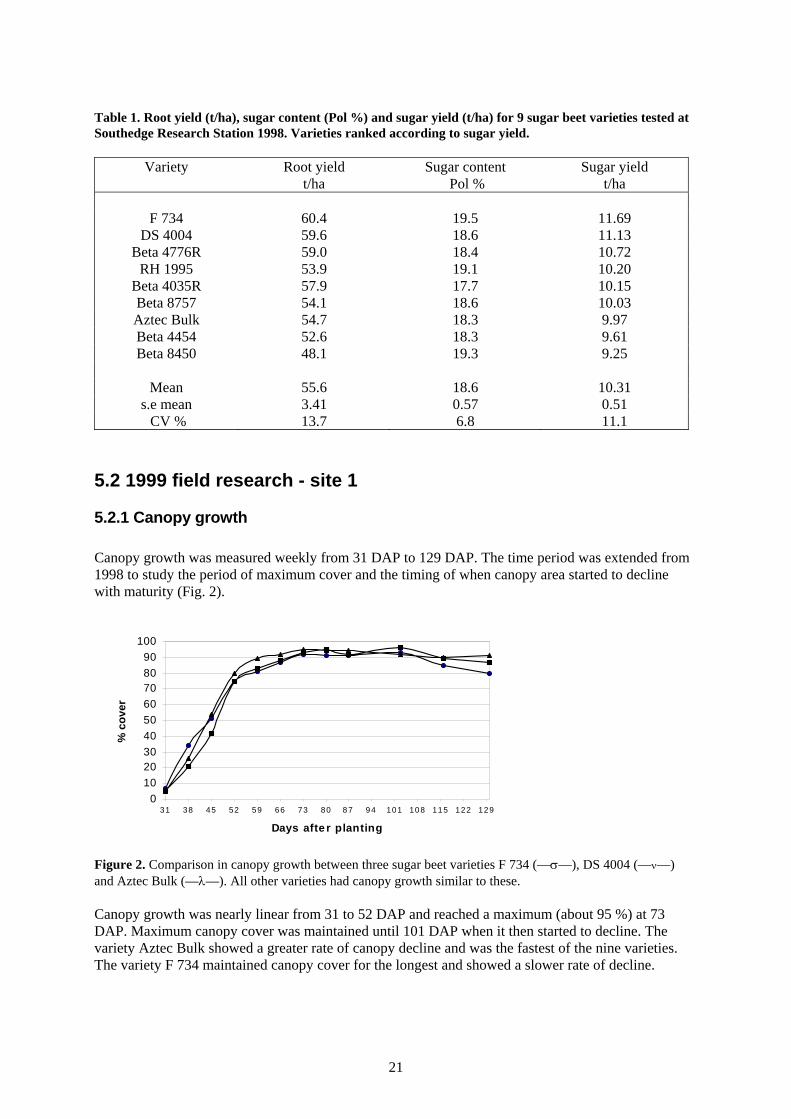
5.2 1999 field research - site 1 5.2.1 Canopy growth Canopy growth was measured weekly from 31 DAP to 129 DAP. The time period was extended from 1998 to study the period of maximum cover and the timing of when canopy area started to decline with maturity (Fig. 2).
Figure 2. Comparison in canopy growth between three sugar beet varieties F 734 (—σ—), DS 4004 (—ν—) and Aztec Bulk (—λ—). All other varieties had canopy growth similar to these. Canopy growth was nearly linear from 31 to 52 DAP and reached a maximum (about 95 %) at 73 DAP. Maximum canopy cover was maintained until 101 DAP when it then started to decline. The variety Aztec Bulk showed a greater rate of canopy decline and was the fastest of the nine varieties. The variety F 734 maintained canopy cover for the longest and showed a slower rate of decline.
0102030405060708090
100
31 38 45 52 59 66 73 80 87 94 101 108 115 122 129
Days afte r planting
% c
over

22
5.2.2 Root and sugar yields
Root yield, sugar content and sugar yields for each variety planted in 1999 were not significantly different and are shown in Table 2. Generally, root yields were about the same as those achieved in 1998 for the top 4 varieties with the overall mean yield about 10 % lower. Although sugar contents were similar sugar yield was decreased due to the lower root yields. Variety performance in terms of sugar production was similar to that in 1998 with a similar order of ranking of varieties. The exception was DS 4004, which had a much lower root yield than in 1998 and consequently a much lower sugar yield. Table 2. Root yield (t/ha), sugar content (Pol %) and sugar yield (t/ha) for 9 sugar beet varieties tested at Southedge Research Station 1999. Varieties ranked according to sugar yield.
Variety Root yield t/ha
Sugar content Pol %
Sugar yield t/ha
Beta 4776R 59.8 18.4 11.01 Beta 4035R 56.3 18.8 10.58
F 734 53.5 18.5 9.91 Beta 8450 48.4 19.0 9.10 RH 1995 47.5 18.8 8.99 Beta 8757 48.4 18.3 8.97 Aztec Bulk 50.0 17.4 8.74 Beta 4454 45.1 18.8 8.49 DS 4004 41.0 18.0 7.35
Mean 50.0 18.4 9.24
s.e mean 4.8 0.55 0.87 CV % 16.6 5.1 16.4
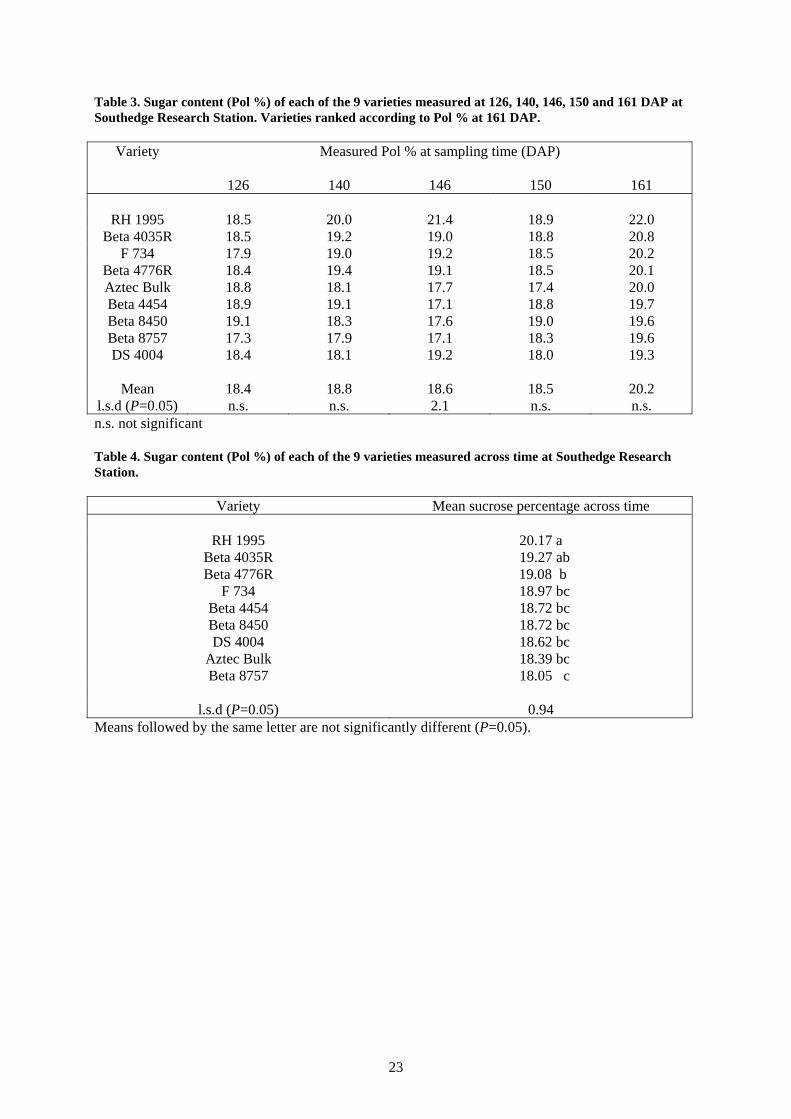
5.2.3 Sugar accumulation The measurement of sucrose over time in each of the sugar beet varieties is shown in Table 3. Within each of the sampling periods sugar content did not significantly differ between varieties except at the 146 DAP sample. At this time the variety RH 1995 had a significantly higher sucrose level (P<0.05) than all the other varieties and tended to have the highest level at the other sampling times as well. At final harvest (150 DAP) sugar contents were not significantly different between varieties however when left another 11 days after final harvest (161 DAP) sugar contents rose in all varieties. When sucrose levels were analysed across time there was a significant variety effect (P<0.05) as well as a significant time effect (P<0.01) which indicated that the mean values for each variety across time were different. Also the analysis showed that there was a common pattern of change across time applicable to all varieties. Table 4 shows the mean values across time for each variety.
23
Table 3. Sugar content (Pol %) of each of the 9 varieties measured at 126, 140, 146, 150 and 161 DAP at Southedge Research Station. Varieties ranked according to Pol % at 161 DAP.
Variety Measured Pol % at sampling time (DAP)
126 140 146 150 161
RH 1995 18.5 20.0 21.4 18.9 22.0 Beta 4035R 18.5 19.2 19.0 18.8 20.8
F 734 17.9 19.0 19.2 18.5 20.2 Beta 4776R 18.4 19.4 19.1 18.5 20.1 Aztec Bulk 18.8 18.1 17.7 17.4 20.0 Beta 4454 18.9 19.1 17.1 18.8 19.7 Beta 8450 19.1 18.3 17.6 19.0 19.6 Beta 8757 17.3 17.9 17.1 18.3 19.6 DS 4004 18.4 18.1 19.2 18.0 19.3
Mean 18.4 18.8 18.6 18.5 20.2
l.s.d (P=0.05) n.s. n.s. 2.1 n.s. n.s. n.s. not significant Table 4. Sugar content (Pol %) of each of the 9 varieties measured across time at Southedge Research Station.
Variety Mean sucrose percentage across time
RH 1995 20.17 a Beta 4035R 19.27 ab Beta 4776R 19.08 b
F 734 18.97 bc Beta 4454 18.72 bc Beta 8450 18.72 bc DS 4004 18.62 bc
Aztec Bulk 18.39 bc Beta 8757 18.05 c
l.s.d (P=0.05) 0.94
Means followed by the same letter are not significantly different (P=0.05).
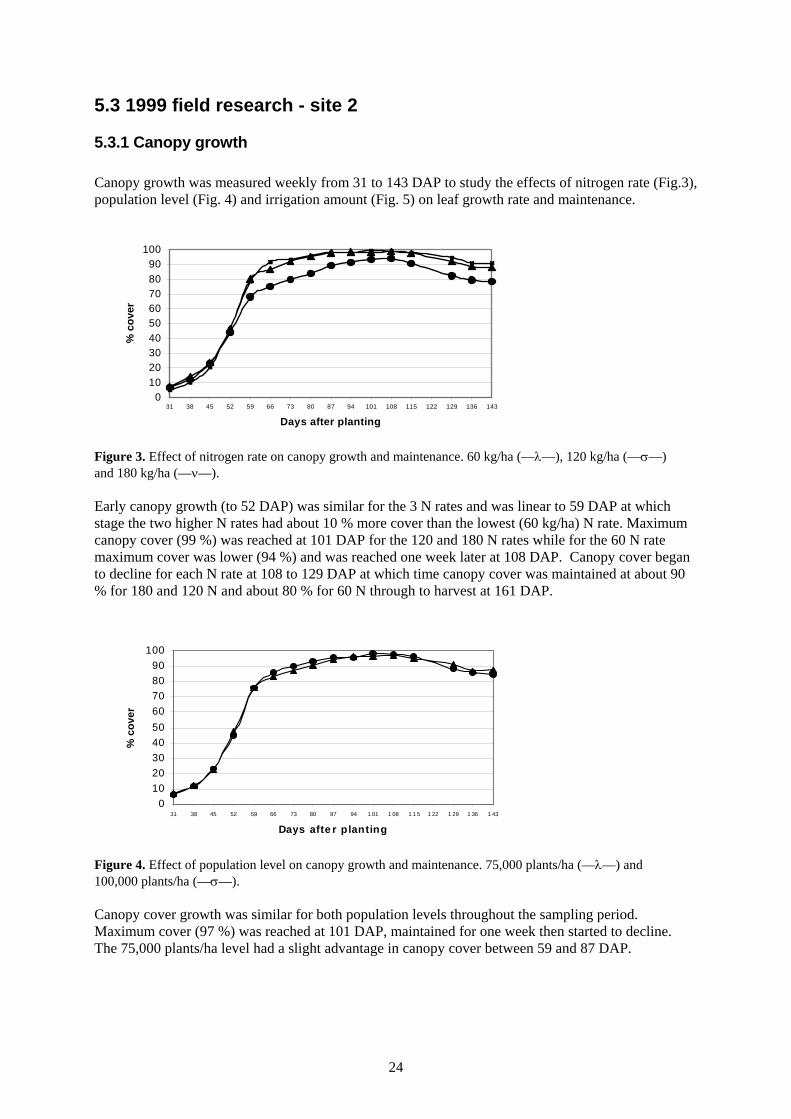
24
5.3 1999 field research - site 2 5.3.1 Canopy growth Canopy growth was measured weekly from 31 to 143 DAP to study the effects of nitrogen rate (Fig.3), population level (Fig. 4) and irrigation amount (Fig. 5) on leaf growth rate and maintenance.
Figure 3. Effect of nitrogen rate on canopy growth and maintenance. 60 kg/ha (—λ—), 120 kg/ha (—σ—) and 180 kg/ha (—ν—). Early canopy growth (to 52 DAP) was similar for the 3 N rates and was linear to 59 DAP at which stage the two higher N rates had about 10 % more cover than the lowest (60 kg/ha) N rate. Maximum canopy cover (99 %) was reached at 101 DAP for the 120 and 180 N rates while for the 60 N rate maximum cover was lower (94 %) and was reached one week later at 108 DAP. Canopy cover began to decline for each N rate at 108 to 129 DAP at which time canopy cover was maintained at about 90 % for 180 and 120 N and about 80 % for 60 N through to harvest at 161 DAP.
Figure 4. Effect of population level on canopy growth and maintenance. 75,000 plants/ha (—λ—) and 100,000 plants/ha (—σ—). Canopy cover growth was similar for both population levels throughout the sampling period. Maximum cover (97 %) was reached at 101 DAP, maintained for one week then started to decline. The 75,000 plants/ha level had a slight advantage in canopy cover between 59 and 87 DAP.
0102030405060708090
100
31 38 45 52 59 66 73 80 87 94 101 108 115 122 129 136 143
Days after planting
% c
over
0102030405060708090
100
31 38 45 52 59 66 73 80 87 94 1 01 1 08 1 1 5 1 22 1 29 1 36 1 43
Days afte r planting
% c
over

25
Figure 5. Effect of irrigation amount on canopy growth and maintenance. 5.5 mm/hr (—λ—) and7.3 mm/hr (—σ—). Different amounts of irrigation water had little effect on the rate of canopy growth and maintenance. The lower rate showed a slight advantage (about 5 %) early on but by 59 DAP both amounts had a similar amount of cover. After 115 DAP, when canopy cover is declining, the higher irrigation amount showed a slower rate of decline. 5.3.2 Root and sugar yields Table 5. Root yield (t/ha), sugar content (Pol %) and sugar yield (t/ha) for each interaction of 3 N rates (60, 120 and 180 kg/ha), 2 irrigation amounts I1 (5.5 mm/ha) and I2 (7.3 mm/hr) and 2 population levels P1 (75,000 plants/ha) and P2 (100,000 plants/ha).
Treatment Root Yield t/ha
Sugar content Pol %
Sugar Yield t/ha
60N I1 P1 42.8 21.8 9.25 60N I1 P2 59.0 21.5 12.68 60N I2 P1 53.7 20.7 11.12 60N I2 P2 53.6 20.3 10.87
120N I1 P1 58.5 21.9 12.81 120N I1 P2 61.2 22.0 13.47 120N I2 P1 59.7 20.6 12.30 120N I2 P2 70.9 21.1 14.96
180N I1 P1 65.6 21.3 14.22 180N I1 P2 62.5 21.4 13.38 180N I2 P1 70.8 20.3 14.37 180N I2 P2 69.5 19.5 13.55
Mean 60.6 21.0 12.75
s.e mean 8.7 0.29 1.9 CV % 24.9 2.4 25.6
There were no significant interaction effects between any of the treatments studied. As well there were no significant nitrogen, irrigation or population effects on the parameters root yield and sugar yield however nitrogen rate and irrigation amount did have a significant (P<0.05) effect on sucrose percentage.
0102030405060708090
100
31 38 45 52 59 66 73 80 87 94 1 01 1 08 1 1 5 1 22 1 29 1 36 1 43
Days afte r p lan tin g
% c
over
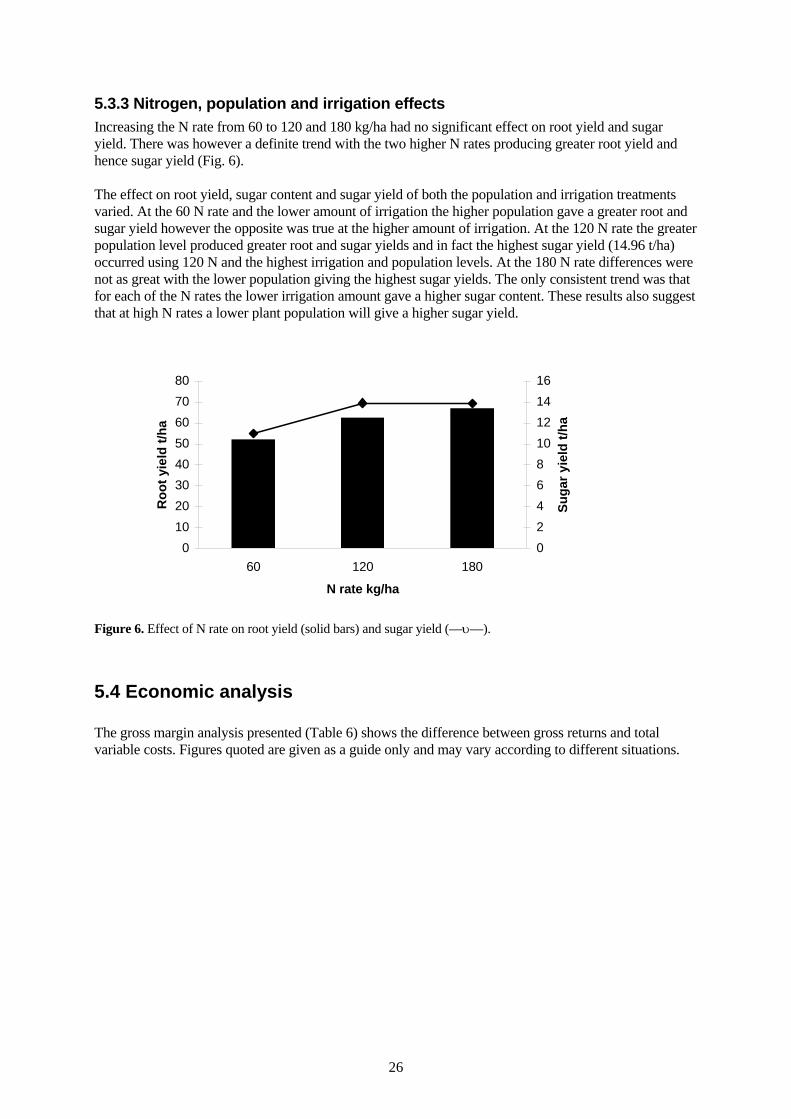
26
5.3.3 Nitrogen, population and irrigation effects Increasing the N rate from 60 to 120 and 180 kg/ha had no significant effect on root yield and sugar yield. There was however a definite trend with the two higher N rates producing greater root yield and hence sugar yield (Fig. 6). The effect on root yield, sugar content and sugar yield of both the population and irrigation treatments varied. At the 60 N rate and the lower amount of irrigation the higher population gave a greater root and sugar yield however the opposite was true at the higher amount of irrigation. At the 120 N rate the greater population level produced greater root and sugar yields and in fact the highest sugar yield (14.96 t/ha) occurred using 120 N and the highest irrigation and population levels. At the 180 N rate differences were not as great with the lower population giving the highest sugar yields. The only consistent trend was that for each of the N rates the lower irrigation amount gave a higher sugar content. These results also suggest that at high N rates a lower plant population will give a higher sugar yield.
Figure 6. Effect of N rate on root yield (solid bars) and sugar yield (—υ—).
5.4 Economic analysis The gross margin analysis presented (Table 6) shows the difference between gross returns and total variable costs. Figures quoted are given as a guide only and may vary according to different situations.
01020304050607080
60 120 180
N rate kg/ha
Roo
t yie
ld t/
ha
0246810121416
Suga
r yie
ld t/
ha
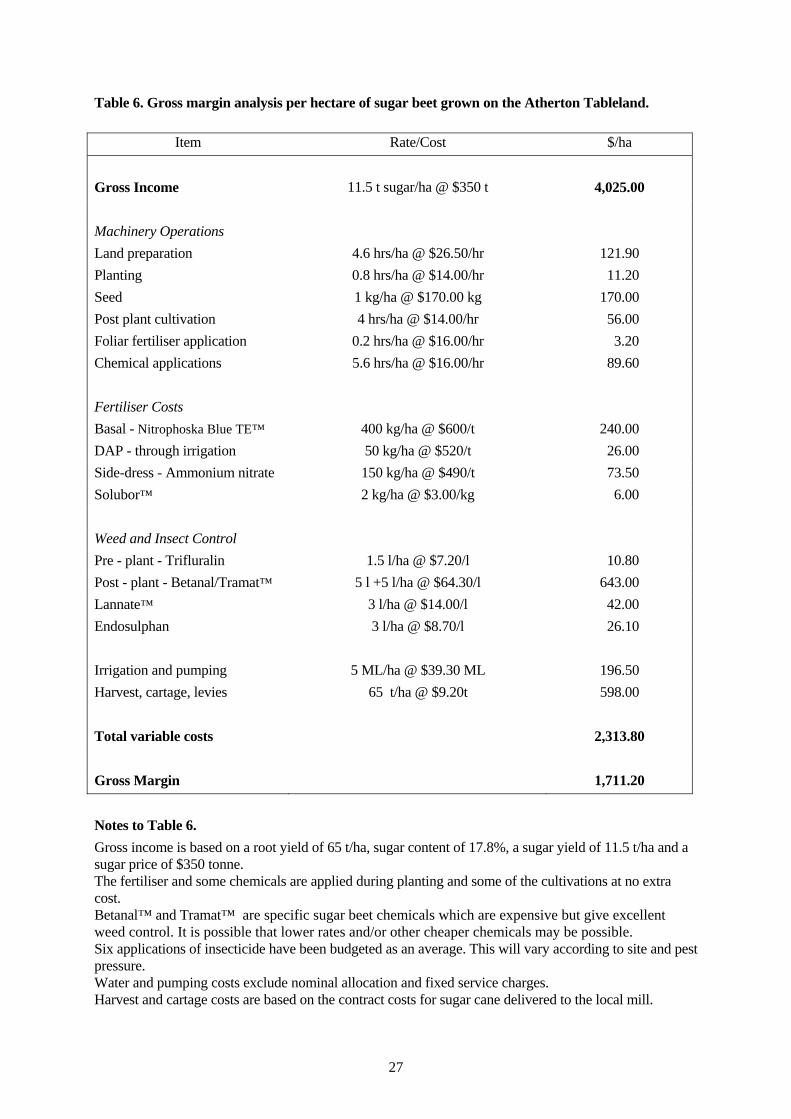
27
Table 6. Gross margin analysis per hectare of sugar beet grown on the Atherton Tableland.
Item Rate/Cost $/ha Gross Income 11.5 t sugar/ha @ $350 t 4,025.00 Machinery Operations Land preparation 4.6 hrs/ha @ $26.50/hr 121.90 Planting 0.8 hrs/ha @ $14.00/hr 11.20 Seed 1 kg/ha @ $170.00 kg 170.00 Post plant cultivation 4 hrs/ha @ $14.00/hr 56.00 Foliar fertiliser application 0.2 hrs/ha @ $16.00/hr 3.20 Chemical applications 5.6 hrs/ha @ $16.00/hr 89.60 Fertiliser Costs Basal - Nitrophoska Blue TE™ 400 kg/ha @ $600/t 240.00 DAP - through irrigation 50 kg/ha @ $520/t 26.00 Side-dress - Ammonium nitrate 150 kg/ha @ $490/t 73.50 Solubor™ 2 kg/ha @ $3.00/kg 6.00 Weed and Insect Control Pre - plant - Trifluralin 1.5 l/ha @ $7.20/l 10.80 Post - plant - Betanal/Tramat™ 5 l +5 l/ha @ $64.30/l 643.00 Lannate™ 3 l/ha @ $14.00/l 42.00 Endosulphan 3 l/ha @ $8.70/l 26.10 Irrigation and pumping 5 ML/ha @ $39.30 ML 196.50 Harvest, cartage, levies 65 t/ha @ $9.20t 598.00 Total variable costs 2,313.80 Gross Margin 1,711.20
Notes to Table 6. Gross income is based on a root yield of 65 t/ha, sugar content of 17.8%, a sugar yield of 11.5 t/ha and a sugar price of $350 tonne. The fertiliser and some chemicals are applied during planting and some of the cultivations at no extra cost. Betanal™ and Tramat™ are specific sugar beet chemicals which are expensive but give excellent weed control. It is possible that lower rates and/or other cheaper chemicals may be possible. Six applications of insecticide have been budgeted as an average. This will vary according to site and pest pressure. Water and pumping costs exclude nominal allocation and fixed service charges. Harvest and cartage costs are based on the contract costs for sugar cane delivered to the local mill.
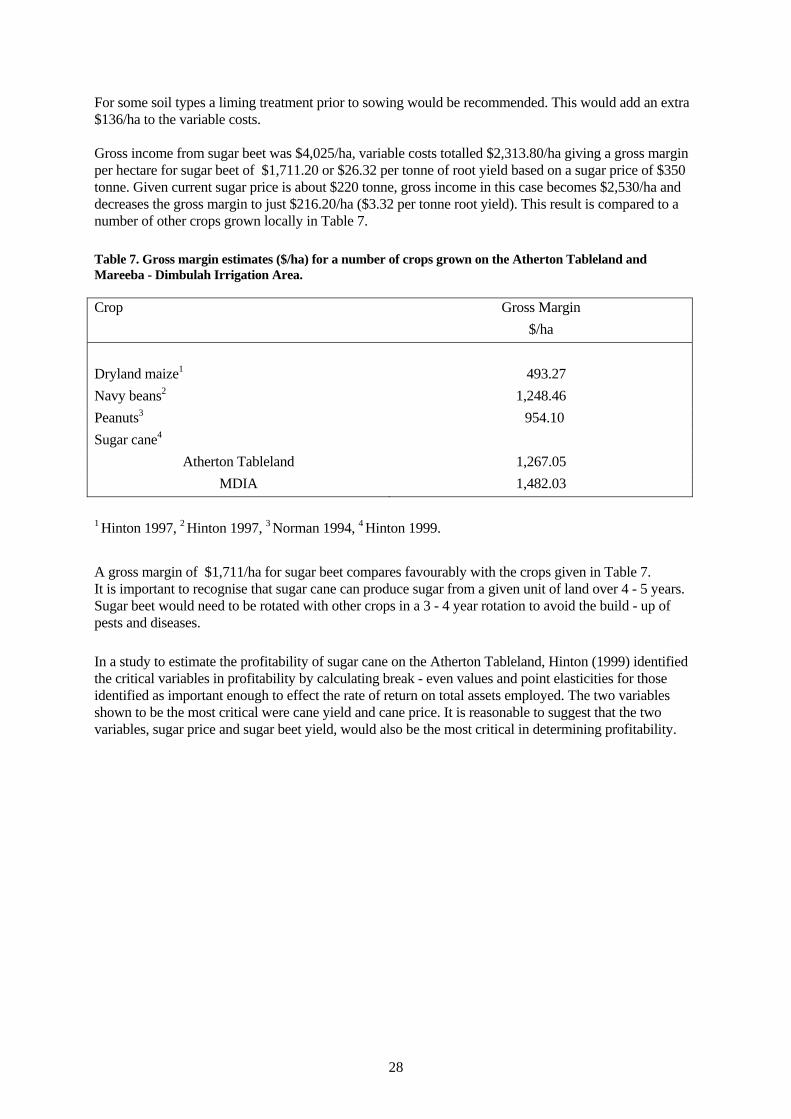
28
For some soil types a liming treatment prior to sowing would be recommended. This would add an extra $136/ha to the variable costs. Gross income from sugar beet was $4,025/ha, variable costs totalled $2,313.80/ha giving a gross margin per hectare for sugar beet of $1,711.20 or $26.32 per tonne of root yield based on a sugar price of $350 tonne. Given current sugar price is about $220 tonne, gross income in this case becomes $2,530/ha and decreases the gross margin to just $216.20/ha ($3.32 per tonne root yield). This result is compared to a number of other crops grown locally in Table 7. Table 7. Gross margin estimates ($/ha) for a number of crops grown on the Atherton Tableland and Mareeba - Dimbulah Irrigation Area. Crop Gross Margin
$/ha Dryland maize1 493.27 Navy beans2 1,248.46 Peanuts3 954.10 Sugar cane4
Atherton Tableland 1,267.05 MDIA 1,482.03
1 Hinton 1997, 2 Hinton 1997, 3 Norman 1994, 4 Hinton 1999. A gross margin of $1,711/ha for sugar beet compares favourably with the crops given in Table 7. It is important to recognise that sugar cane can produce sugar from a given unit of land over 4 - 5 years. Sugar beet would need to be rotated with other crops in a 3 - 4 year rotation to avoid the build - up of pests and diseases. In a study to estimate the profitability of sugar cane on the Atherton Tableland, Hinton (1999) identified the critical variables in profitability by calculating break - even values and point elasticities for those identified as important enough to effect the rate of return on total assets employed. The two variables shown to be the most critical were cane yield and cane price. It is reasonable to suggest that the two variables, sugar price and sugar beet yield, would also be the most critical in determining profitability.

29
Table 8. Sugar yield estimates (t/ha) for a range of sugar contents (CCS) and sugar beet root yields (t/ha). Sugar Content Sugar beet Root Yield (t/ha)
(CCS) 30 40 50 60 70 80
15 (4.5) (6.0) 7.5 9.0 10.5 12.0 16 (4.8) (6.4) 8.0 9.6 11.2 12.8 17 (5.1) 6.8 8.5 10.2 11.9 13.6 18 (5.4) 7.2 9.0 10.8 12.6 14.4 19 (5.7) 7.6 9.5 11.4 13.3 15.2 20 (6.0) 8.0 10.0 12.0 14.0 16.0 21 (6.3) 8.4 10.5 12.6 14.7 16.8 22 (6.6) 8.8 11.0 13.2 15.4 17.6
At $350 per tonne for sugar, figures in brackets denote a negative gross margin. Table 9. Gross margin ($/ha) with variations in sugar price ($/t) and sugar yields (t/ha). Sugar Price Sugar Yield (t/ha) ($/tonne) 7 8 9 10 11 12
200 (1400) (1600) (1800) (2000) (2200) 2400 220 (1540) (1760) (1980) (2200) 2420 2640 240 (1680) (1920) (2160) 2400 2640 2880 260 (1820) (2080) 2340 2600 2860 3120 280 (1960) (2240) 2520 2800 3080 3360 300 (2100) 2400 2700 3000 3300 3600 320 (2240) 2560 2880 3200 3520 3840 340 2380 2720 3060 3400 3740 4080 360 2520 2880 3240 3600 3960 4320 380 2660 3040 3420 3800 4180 4560 400 2800 3200 3600 4000 4400 4800
Figures in brackets denote a negative gross margin when using costs estimated in Table 6.
30
6. Discussion
6.1 1998 results 6.1.1 Canopy growth The rate of canopy growth is an important consideration for sugar beet grown in temperate climates. Early growth and leaf expansion of sugar beet in the UK for example is limited primarily by temperature however later on there is a switch from dependence on temperature to one on solar radiation. Yield is directly proportional to solar radiation with leaf area determining the fraction of radiation intercepted (Werker, 1993). The aim in the UK then is to plant sugar beet as early as possible (mid March) so that maximum canopy cover coincides with the months of highest solar radiation (May - August) to maximise yields. Many studies have shown that maximum leaf cover (>85 %) occurs when accumulated day degrees (above 3° C) reach about 800° C from sowing (about 90 DAP). In comparison to the UK, results from this study show that leaf cover reached this amount (85 %) at about 70 days and reached 95 % as a maximum. In terms of accumulated day degrees, 814° C was reached in 34 DAP, a much shorter time than the 90 DAP found in the UK. In areas closer to the equator where solar radiation is more intense, canopies can become light - saturated and so the relationship between yield and radiation intercepted is not so consistent. In these areas, especially if irrigation is required (Imperial Valley in California for example) yield is more closely related to the amount of available water and uptake of nutrients. In the Imperial Valley canopy cover (> 75 %) is reached at about 70 DAP with a crop factor (Kc) of 1.15 and an estimated evapotranspiration (ET) of 7 -8 mm/day. Results from this study were fairly similar in terms of days to maximum canopy cover and highlight the rapid canopy growth when radiation received is not limiting. In the northern hemisphere the effect of rapid canopy growth is not reflected in a shortening of the crop length as the crop is maturing into the cooler autumn and winter months which slows growth. This is not the case for crops grown in sub - tropical climates. In the southern hemisphere crops planted in April/May are maturing into the warmer months of September/October while in the northern hemisphere (Punjab region in India for example) crops in October/November are maturing into the warmer April/May period. The importance of this quicker canopy growth is that crop length may be shortened which means that it is more flexible and can be fitted into a cropping system more readily. At this stage, with processing through a sugar cane mill a requirement, sugar beet crops need to be ready for harvest from about June to October. Given a shortened crop length of say 120 days, gives a much greater range of planting times to fit in with the sugar cane harvest. It also means that another short term crop such as navy beans may be able to be incorporated into the rotation. There was little difference between each of the 9 varieties studied in rate of canopy growth even though the varieties were sourced from a number of seed companies. Although not a great difference the rate of canopy growth for the highest sugar yielding variety (F 734) was maintained right from 28 DAP at about 6 - 7 % over the lowest sugar yielding variety (Beta 8450). All other varieties fell within these two varieties. These results suggest that radiation intercepted is not a main determinant of yield and so a wider range of planting times is possible however varieties that can get to full canopy cover in the shortest time should have the shortest crop length. Although not significantly better it appears that varieties developed for warmer climates (F 734, Beta 4776R and Beta 4035R) gave higher sugar yields under local conditions.
31
6.1.2 Root and sugar yields Although not significant there was more than a 12 t/ha difference in root yield between the highest yielding variety (F 734) and the lowest (Beta 8450). Sugar content (% Pol) was fairly equal and averaged 18.6 %, sugar yield showed a difference of about 2.4 t/ha between the highest yielding (F 734) and the lowest (Beta 8450). The yield of the best performing variety was very similar to results in the UK where an analysis of 13 years of sugar beet yields (1978 - 1990) gave an average root yield of 64.4 t/ha, sugar concentration of 18.1 % and sugar yield of 11.66 t/ha (Scott and Jaggard, 1995). In sugar beet variety trials at Oregon State University (USA) Shock (1999) reported much higher sugar yields from two varieties studied in this trial – Beta 4035R at 14.8 t/ha and Beta 8757 at 14.1 t/ha. The USDA (1999) reported that the US national average sugar beet root yield was 49.4 t/ha and sugar yield was 6.9 t/ha. In commercial crops root yield would be expected to be slightly lower due to machine harvesting losses, missing plants and possible losses to pests and disease. 6.2 1999 field research - site 1 6.2.1 Canopy growth The repeat of the 1998 trial showed a fairly similar pattern of canopy growth rate in the early stages (about 50% cover at 45 DAP). From this stage however varieties in this trial grew more rapidly so that canopy cover was about 10 days ahead of what occurred in 1998 (60 versus 70 DAP for 90% cover). Temperatures during crop growth for the two years of study were very similar (Appendix 2) and do not explain the differences. It is possible that radiation receipts were greater during this period in 1999 and promoted more rapid canopy growth. The extension of times sampled enabled a better documentation of sugar beet canopy growth under local conditions. Early growth is slow (about 5% at 28 DAP), a period of linear growth to 80 % at 50 - 60 DAP, a slowing of growth to a maximum of about 90 - 95 % at 75 DAP, maintenance of a full canopy to about 100 DAP then a gradual decline down to harvest where canopy is estimated at about 75 % at 150 DAP. The importance of studying canopy growth rate is that it highlights any differences between varieties bred specifically for warmer climates and those for temperate climates. Any future sugar beet research on variety evaluation will have an important comparison for testing. Also knowing the timing and period of most rapid growth enables more accurate timing of irrigation and nutrition to maximise yields. 6.2.2 Root and sugar yields As in 1998 there were no significant differences between root yield, sugar content and sugar yield between the varieties studied. Root yields for some varieties varied by as much as 30 t/ha and spatial analysis of the yield data (not reported) showed a lower yielding area in the middle plots of the trial possibly due to an irrigation problem. Average root yields were about 10% lower in 1999 than in 1998, sugar content was very similar and so sugar yield was about 10% lower as well. The reason for the lower root yield is difficult to explain. It was felt that with the experience gained in 1998 crop management was better in 1999 however germination was less uniform and it is recognised that preparation of a good seed bed and planting depth are critical in producing uniform seedlings. As well, the trial in 1999 was not limed and it would appear that sugar beet grown on soils with a pH of 6 or less will benefit (about a 10% yield increase) from liming. Sugar beet requires a soil pH of about 7 for maximum yield.
32
In the only other sugar beet trials conducted in Queensland, Morgan et al (1995) studied 24 varieties at a number of sites in the Mackay and Burdekin areas of north Queensland. The trials (7 in total) were conducted on a range of soil types including one where sugar cane does not grow due to a high exchangeable sodium content and another very fertile soil used for vegetable production. On sites where soil type was adequate and no major pest and/or disease problems occurred root yield averaged 61.0 t/ha, sugar content 14.77% and sugar yield 8.92 t/ha. In comparison, average yields from the two variety trials in this study were 52.8 t/ha, 18.57% and 9.77 t/ha respectively. There was only one variety used in both studies - Beta 4454. In the 1995 study this variety averaged 63.7 t/ha root yield, 15.8% sugar content and 10.05 t/ha sugar yield (average of 2 sites). In this study this variety averaged 48.8 t/ha root yield, 18.57% sugar and 9.05 t/ha sugar yield. Overall, root yields were higher, sugar contents were lower and sugar yields slightly lower in the Mackay/Burdekin trials compared to this study. 6.2.3 Sugar accumulation There is currently no evidence that sugar beets go through a ‘ripening stage’ as such where sugar accumulates rapidly towards harvest. This factor is used in the UK to manipulate harvest time where growers harvest sections of their crop on a rotation basis. Generally the earlier the harvest the lower the sugar content and vice versa however harvest would not commence until sugar levels were over 14%. Judgement of when to harvest is an important consideration for both sugar beet and cane farmers. In commercial situations farmers are unable to harvest their entire crop at the time that maximises sugar yield (given sugar yield is a product of yield and sugar content). When harvest occurs on a rotational basis farmers must accept an ‘average’ sugar yield over time. Given this it is useful to know which varieties, if any, have a higher mean sugar content over time. This study showed there were significant differences (P=0.05) in average sucrose contents across time for the varieties studied and that percentage sucrose changed similarly across time for all varieties. Harvest was predetermined to be at 150 DAP however when sampled at 161 DAP all varieties had higher sucrose levels. Sample size of the beets taken for sugar analysis (5) was considered too small for any yield estimation and so it was not possible to tell if sugar yield would have been higher if harvest had occurred later. This is an area for further research. 6.3 1999 field research - site 2 6.3.1 Canopy growth Early canopy growth (up to 45% cover) was similar for the 3 N rates at which stage the lowest rate (60 N) fell below the 2 higher rates (Figure 3). There was no advantage in having the highest rate (180 N) and so the recommendation for sugar beet grown locally in terms of maximising and maintaining canopy growth and cover would be about 120 - 150 kg/ha total N. There was no advantage in terms of more rapid canopy cover between having 75,000 or 100,000 plants/ha (Figure 4). In temperate climates where rapid canopy growth is the aim to maximise radiation interception many experiments have shown that sugar yields normally don’t increase with plant populations above 75,000/ha. This is due to leaves of adjacent plants overlapping at an early stage and not providing any extra area for radiation interception (Scott and Jaggard, 1993). Locally there appears to be no reason, in terms of canopy growth, to exceed the recommended plant population of 75,000/ha. There was little difference in the rate of canopy growth in applying either irrigation amounts (Figure 5). During rapid canopy growth (45 - 60 DAP) a total of 41.9 mm (7.3 mm/hr) and 31.6 (5.5 mm/hr) were

33
applied to the two different irrigation regimes. During this period pan evaporation totalled 37.7 mm. Ghariani (1981) reported that crop leaf cover increases more slowly and declines faster in stressed crops. Results from this study indicate that a watering schedule that replaces pan evaporation during rapid canopy growth should be sufficient in supplying adequate water. 6.3.2 Root yield, sugar content and sugar yields The lack of significant differences between the N treatments (Table 10) or interactions (Table 5) for root yield or sugar yield was surprising. Nitrogen is considered the single most important nutrient in sugar beet production and overseas research indicates a positive response on root yield and hence sugar yield to applied fertiliser nitrogen up to about 120 kg/ha depending on soil type. Rates above 120 kg/ha tend to have limited yield increases and have a negative effect on sucrose levels and so sugar yield is decreased. The significant negative effect of nitrogen rate on sucrose levels has been reported widely and was confirmed in this study. Although non - significant there seemed to be a trend for increasing the N rate from 60 to 120 kg/ha to increase root yield and sugar yield (Table 10, Figure 6) with little effect on increasing the rate to 180 kg/ha. Based on one year’s results it is possible that a repeat of the trial may confirm a significant response to nitrogen. Analysis of soil test results (data not presented) indicated about 33 kg/ha of nitrate N and 30 kg/ha of potentially mineralisable N in the top 30 cms of soil (Keeney, 1982). These levels may have been enough to mask the effects between the lower N rates. Table 10. Root yield (t/ha), sugar content (Pol %) and sugar yield (t/ha) means for each of 3 N rates (60, 120 and 180 kg/ha), 2 irrigation amounts I1 (5.5 mm/ha) and I2 (7.3 mm/hr) and 2 population levels P1 (75,000 plants/ha) and P2 (100,000 plants/ha).
Treatment Root yield t/ha
Sugar content Pol %
Sugar yield t/ha
60 N 52.25 21.08 10.98 120 N 62.58 21.40 13.92 180 N 67.10 20.62 13.88
l.s.d. (P=0.05) n.s. 0.42 n.s.
I1 58.52 21.66 12.70 I2 62.77 20.42 13.15
l.s.d. (P=0.05) n.s. 0.34 n.s.
P1 58.28 21.11 12.99 P2 63.02 20.97 12.86
l.s.d. (P=0.05) n.s. n.s. n.s. n.s. not significant It was thought that the lower irrigation amount (5.5 mm/hr) might not provide adequate water for the successful growth of sugar beet given the high evaporative demands during the growth period. Total irrigation applied for the two treatments was 356 mm (I1) and 472 mm (I2) with 81 mm of rainfall and total evaporation of 626 mm. Sugar yield for the higher irrigation regime (I2) showed a slight advantage over I1 due to the higher root yield which may have been caused by I2 maintaining a higher percentage leaf cover late in the growth period (Figure 5). However the significantly higher (P=0.05) sucrose level in

34
I1 compared to I2 may indicate that in fact the beets were stressed under the lower irrigation amount, an effect similar to that reported by Hang and Miller (1986a). Although giving a higher root yield, 100,000 plants/ha (P2) did not translate into extra sugar production due to a lower sugar content. As mentioned, overseas work where the aim is to maximise radiation interception, has shown that 75,000 plants/ha is the ideal plant population to maximise sugar yield. In tropical/sub - tropical climates radiation receipts are greater and the possibility this can be exploited by having more plants per hectare may be possible. A plant population of 100,000/ha may be too high given the lower sugar content in this study however somewhere in the range 80 - 90,000 plants/ha may give an increase in yield while maintaining > 21% sugar. An adequate fertiliser and irrigation program would need to be provided to capture any yield increases. 6.4 Irrigation and sugar production Water application to crops and yields produced are an important consideration for agriculture. Given the dry winters experienced locally irrigation is an essential requirement for crops grown during this period. Morgan et al (1995) found that sugar produced from sugar beet per megalitre of water applied ranged from 1.5 to 3.7 t/ha whereas sugar cane produced about 1.7 tonnes of sugar per megalitre applied. Table 11 outlines the irrigation applied, rainfall received and sugar produced for each trial in this study. Table 11. Irrigation applied (ML/ha), rainfall (ML/ha), sugar yield (t/ha) and sugar ratio produced (t/ML) for each trial conducted at Southedge Research Station 1998 - 99.
Site Irrigation Rainfall Total water Sugar yield Sugar ratio ML/ha ML/ha ML/ha t/ha t/ML total
SRS 98 4.14 0.42 4.56 10.31 2.26 SRS 99 4.01 0.83 4.84 9.24 1.91
SRS 99 I1 3.56 0.81 4.37 12.70 2.91 SRS 99 I2 4.72 0.81 5.23 13.15 2.51
Sugar cane crops locally apply about 9 ML/ha of irrigation during a crop cycle of 12 - 14 months for a sugar yield of about 15 t/ha giving a sugar yield of 1.7 t/ML which is similar to that reported by Morgan et al. It should be noted that sugar production from sugar beet takes much less time (5 - 6 months) than that for cane however sugar cane is ratooned 4 - 5 times and so sugar production per hectare is higher for cane than sugar beet. The expansion of sugar cane locally has put pressure on irrigation resources to cope and the ability of sugar beet to produce sugar with less water is an important consideration. In California, where irrigation is a requirement for sugar beet production, researchers have developed crop factors (Kc) to aid irrigation management. The system applies a range of crop factors related to planting time (or canopy cover) to estimate evapotranspiration (ET) and hence irrigation requirements where ET = Kc * pan evaporation. Typically ET is in the range of 7 - 8 mm/day for a crop at full canopy and Kc values of 1.1 to 1.3 are used during this period. From the study of canopy growth reported earlier (Figures 1 and 2) suggested crop factors for sugar beet grown locally would be 0.2 from planting until 10% shading, during the rapid growth phase from 10% shading until full cover (90%) the crop factor would increase linearly from 0.2 to 1.0 (about 75 DAP), maintained at 1.0 during full canopy cover (75 - 105 DAP) and then decline to 0.8 for the remainder of the crop. This program is similar to that reported by Hang and Miller (1986a).

35
6.5 Weed control, pests and diseases Weed control was effective in each year using the combination of Betanal™ (phenmedipham) and Tramat™ (ethofumesate) sprayed at 21 DAP. These two chemicals control a wide range of grass and broad - leaf weeds and virtually kill everything except the sugar beet. They are currently registered for use on beetroots in Australia. Helothion™ (sulprophos) and Lannate™ (methomyl) were alternated and sprayed weekly from 12 to 82 DAP then as required for insect control. Beet webworm (Hymenia recurvalis) is the main defoliating insect that causes problems in sugar beet in tropical areas and was one of the main insect problems encountered by Morgan et al (1995). The spray regime used successfully controlled them in early growth with some damage tolerated towards the end of the crop. No other major pest problems were encountered. In the 1998 trial some plants died from the soil - borne fungus Rhizoctonia. It causes root and crown rot and is the most serious root disease of sugar beet in the USA and occurs where - ever sugar beet is grown in hot climates (Duffus and Ruppel, 1995). There are no recommended chemical controls for this disease and cultural practices and rotations are recommended for control. In subsequent trials soil was kept slightly drier during the early growth stages and no further problems were encountered. There are several commercial varieties available with resistance to Rhizoctonia. A small outbreak of Cercospora was controlled with two sprays of Benlate™ at 90 and 98 DAP. Cercospora leaf spot is one of the most destructive and widespread foliar diseases of sugar beet worldwide. Infection favours day temperatures of 27 - 32°C, night temperatures above 16°C and relative humidity above 60% for at least 15 - 18 hours each day (Pool and Mackay, 1916) . These conditions are common locally and control will require an integrated approach combining rotations and chemicals as well as resistant varieties which are available. In the trial it was noted that the infection was mainly confined to the US variety Beta 4776R. 6.6 Nutrition As mentioned nitrogen is the most important nutrient for sugar beet. On soil types with low residual N it is recommended that between 100 - 150 kg/ha of fertiliser N is applied. On more fertile soils, or after legume crops, this should be adjusted downwards. It is suggested that for application of other nutrients such as phosphorus and potassium a soil analysis is undertaken and soil levels of these used as a guide for fertiliser application. In this study (SRS 98, SRS 99A) soil levels were considered adequate and so only replacement levels of these two nutrients were applied (26 and 110 kg/ha) respectively. Sugar beet has a high sodium requirement and in many countries salt (NaCl) is applied as a fertiliser. In these trials sodium nitrate (NaNO3) was used as one of the nitrogen sources which applied 54 kg/ha of sodium. The fertiliser used, (Nitrophoska Blue TE™), also contained small amounts of trace elements which was adequate to supply these nutrients except for boron. Sugar beet also has a higher than normal requirement for this nutrient and on soils low in boron two foliar sprays at 2 kg/ha is recommended. The other fertiliser which may be important is lime. It is recommended that on soils with a pH (1:5 water) less than about 6.5 lime is applied to bring the pH to near 7.
36
6.7 Sugar beet economics The gross margin analysis studied for sugar beet showed that it compared favourably with other crops (including sugar cane) grown on the Tableland when a sugar price of $350 tonne is used. At the current very low sugar prices ($200 - 220/tonne) however sugar beet production is at about ‘break-even’ level and commercial production would not be an option. It is unfortunate that this study has been conducted at a time of historically very low sugar prices with no improvement in the short to medium term forecast. In a recent article (Canegrowers, 2000) ABARE identified four major factors contributing to the paradox of low world sugar prices and rising world sugar production. Firstly, the highly regulated market systems in the European Union (EU) and the USA maintain an internal price above world market levels and protect growers from change. Secondly, as 70% of the worlds sugar production is from sugar cane (a perennial crop) there is about a two-year lag period before production drops due to low world prices. Thirdly, favourable weather conditions throughout the EU have resulted in greater yields despite a reduction in area planted to sugar beet in 1999/2000. And finally the continued relative profitability of sugar in Brazil after its currency devaluation in 1999 has enabled the country to maintain sugar production despite low world prices. World raw sugar production is forecast to drop 6 % in 2000 - 01 to 124.4 million metric tonnes (mt), (USDA, 2000) with most of drop due to lower production in Brazil. In addition, it is forecast that 61 % of the crop will be used for ethanol production in 2000 - 01, up from 53 % in 1999 - 2000. The sensitivity analysis of root yield and sugar content (Table 8) showed that at relatively low root yields (40 tonne/ha) and sugar content (17 %) sugar yield was profitable as long as sugar price was at the average $350 tonne. Overseas yields of sugar beet of 60 - 70 t/ha are not uncommon and given an average sugar content of say 18 % sugar yields of 11 - 12 tonnes/ha should be expected. The analysis of gross margin estimates given a range of sugar prices and sugar yields (Table 9) showed a break - even sugar yield of about 7 tonnes/ha when sugar is priced at $350 tonne. At the current low sugar price sugar yields in excess of 10 tonnes/ha are required to cover costs of production and as stated previously commercial production under current sugar prices would not be an option. Another area for consideration is the ability of the processing mill to differentiate the sugar content of sugar cane and sugar beet when processed together for payment purposes. 6.8 Potential production areas There are about 80,000 hectares of agricultural land within the Atherton Tableland region which includes about 43,600 hectares in the MDIA. Currently this region has about 9,500 hectares producing sugar cane with the rest used for cropping (peanuts, maize, potatoes, tobacco), horticulture (mangoes, avocadoes, macadamia nuts), pastures for dairying and beef production and other crops such as tea - tree and vegetable production. The majority of sugar cane production is in the MDIA (6,500 ha) supplying cane to the Tableland sugar mill. All cane grown in the region is irrigated to some extent, mainly by overhead systems such as centre pivots although on some soil types furrow irrigation is possible. The use of more efficient water application systems is being promoted with new producers entering the industry required to have approved water management procedures in place, which include management of run - off water, prior to allocation of cane quota. As well, annual cropping during the winter period (potatoes, tobacco and vegetables) requires at least some supplementary irrigation. These crops typically use a system of aluminium pipes with sprays on risers that irrigate an area of 5 - 10 hectares.

37
Sugar beet is a potential crop in these areas where irrigation is available. Dryland production would be limited to the cooler, wetter southern area of the Atherton Tableland although even here supplementary irrigation may be required during the period July - September where rainfall averages about 25mm / month. Growing sugar beet during the ‘wet’ would present difficult pest and disease control problems, harvesting difficulties and would not coincide with the sugar cane harvest for processing. Potentially then there are about 3,000 hectares available each year for irrigated sugar beet production given that sugar beet is used as a rotation in between sugar cane crops every 4 - 5 years (2,000 ha) and 1,000 hectares available in rotation with current annual crops or unused. At a sugar yield of 11 t/ha this equates to 33,000 tonnes of sugar valued conservatively at about $10M. This compares with the value of other cropping industries in the region - horticulture $55M, sugar cane $33M, tobacco $18M, potatoes $10M, peanuts $9M and maize $4.5M (Anon, 2000). Other potential production regions would require arable land with irrigation water available and close enough to sugar processing infrastructure for milling. The irrigation area around Emerald in Central Queensland is one such region.

38
7. Conclusions The main conclusions are: 1. Sugar beet establishment is the most critical stage in crop growth. Seed should be coated and precision sown into a well-prepared seedbed. 2. Given good plant establishment, adequate fertiliser and irrigation, good weed, pest and disease control and an average sugar price sugar beet grown during the April - October months should be an economic proposition for local producers. 3. Results from field trials showed sugar production form sugar beet grown locally was similar to that achieved commercially overseas. Manipulation of inputs such as nitrogen and irrigation showed potential for further gains in sugar yield. 4. Sugar yield per amount of irrigation applied is greater for sugar beet than sugar cane. 5. There are a number of seed companies that develop many new sugar beet varieties each year. The best performing varieties in this study (F 734, Beta 4035R, Beta 4776R) have probably been superseded by higher yielding varieties with better disease resistance. 6. The development of a sugar beet industry would require purchase of specialised planting and harvest equipment. These two operations would be carried out under a contract system similar to what operates in the sugar cane industry. 7. The development of sugar beet as an economic crop is totally dependent on the support of the local sugar cane industry, specifically the processing mill.
39
8. Recommendations The main recommendations are: 1. Involvement of one of the local sugar mills in a study where sugar beet can be processed through the mill. This would require the growing of a larger area of sugar beet (about 1 hectare) and the development of some small plot harvesting equipment. 2. Establish a variety testing program for the tropics that tests a small number (6 -8) each year of the latest released varieties. 3. Study the potential of sugar beet in rotation with other crops such as navy beans and peanuts. 4. Further investigate nutrition and irrigation requirements and the effects these inputs have on sugar accumulation under local environmental conditions. 5. Study the performance of sugar beet in other areas such as Emerald in central Queensland. 6. Consider the role of sugar beet in any developing ethanol production schemes. Given average sugar yields it is estimated that 1 hectare of sugar beet would produce 4 - 5,000 litres of ethanol.
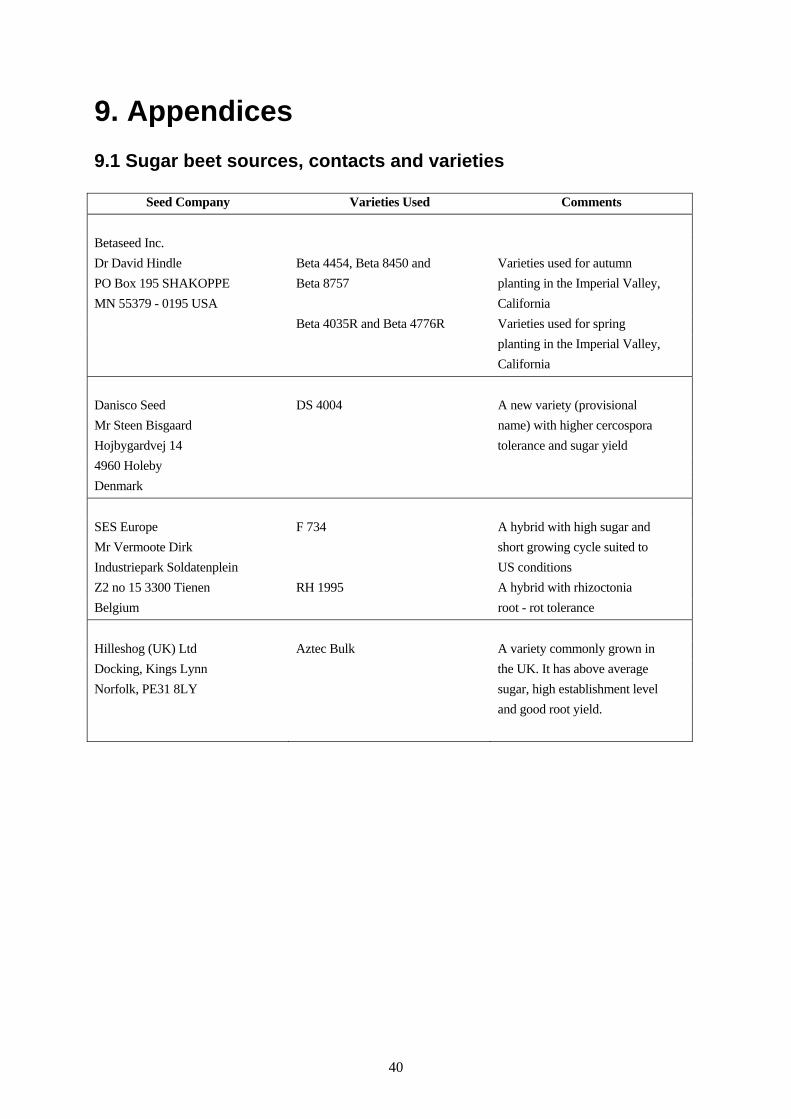
40
9. Appendices
9.1 Sugar beet sources, contacts and varieties
Seed Company Varieties Used Comments
Betaseed Inc. Dr David Hindle Beta 4454, Beta 8450 and Varieties used for autumn PO Box 195 SHAKOPPE Beta 8757 planting in the Imperial Valley, MN 55379 - 0195 USA California
Beta 4035R and Beta 4776R Varieties used for spring planting in the Imperial Valley, California Danisco Seed DS 4004 A new variety (provisional Mr Steen Bisgaard name) with higher cercospora Hojbygardvej 14 tolerance and sugar yield 4960 Holeby Denmark SES Europe F 734 A hybrid with high sugar and Mr Vermoote Dirk short growing cycle suited to Industriepark Soldatenplein US conditions Z2 no 15 3300 Tienen RH 1995 A hybrid with rhizoctonia Belgium root - rot tolerance Hilleshog (UK) Ltd Aztec Bulk A variety commonly grown in Docking, Kings Lynn the UK. It has above average Norfolk, PE31 8LY sugar, high establishment level and good root yield.
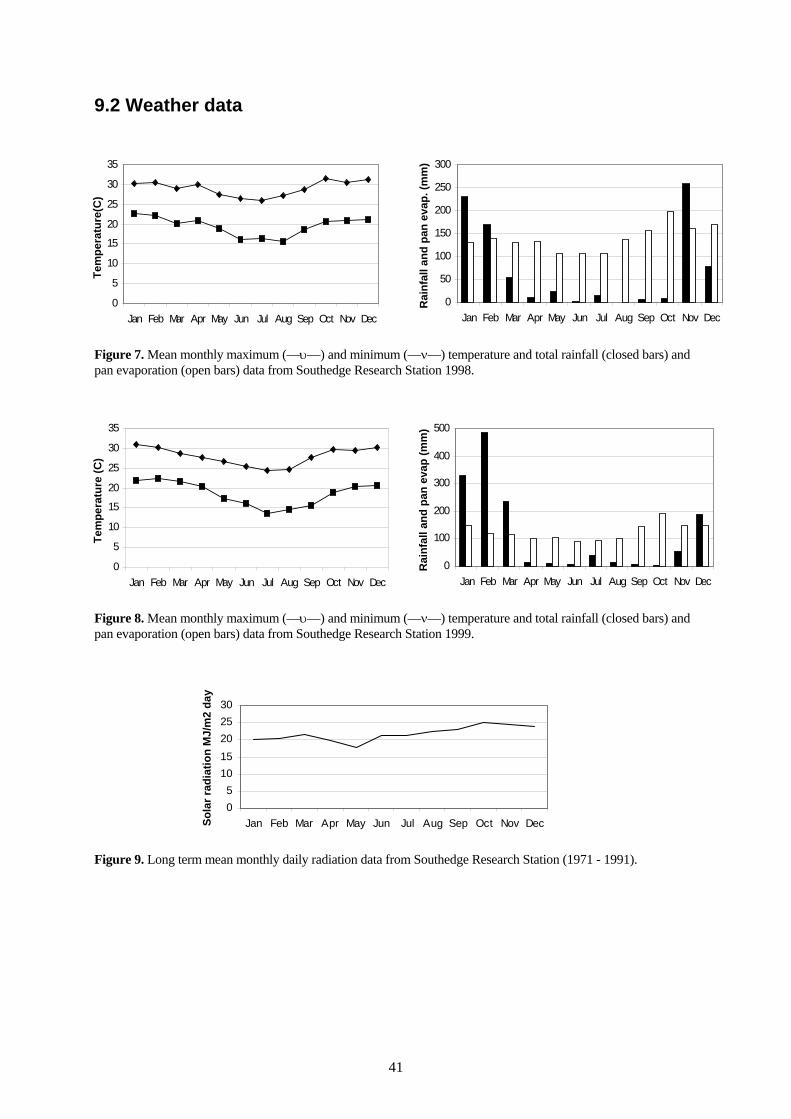
41
9.2 Weather data
Figure 7. Mean monthly maximum (—υ—) and minimum (—ν—) temperature and total rainfall (closed bars) and pan evaporation (open bars) data from Southedge Research Station 1998.
Figure 8. Mean monthly maximum (—υ—) and minimum (—ν—) temperature and total rainfall (closed bars) and pan evaporation (open bars) data from Southedge Research Station 1999.
Figure 9. Long term mean monthly daily radiation data from Southedge Research Station (1971 - 1991).
0
5
10
15
20
25
30
35
Jan Feb Mar Apr May Jun Jul Aug Sep Oct Nov Dec
Tem
pera
ture
(C)
0
50
100
150
200
250
300
Jan Feb Mar Apr May Jun Jul Aug Sep Oct Nov Dec
Rai
nfal
l and
pan
eva
p. (m
m)
0
5
10
15
20
25
30
35
Jan Feb Mar Apr May Jun Jul Aug Sep Oct Nov Dec
Tem
pera
ture
(C)
0
100
200
300
400
500
Jan Feb Mar Apr May Jun Jul Aug Sep Oct Nov Dec
Rai
nfal
l and
pan
eva
p (m
m)
05
1015202530
Jan Feb Mar Apr May Jun Jul Aug Sep Oct Nov DecSola
r rad
iatio
n M
J/m
2 da
y
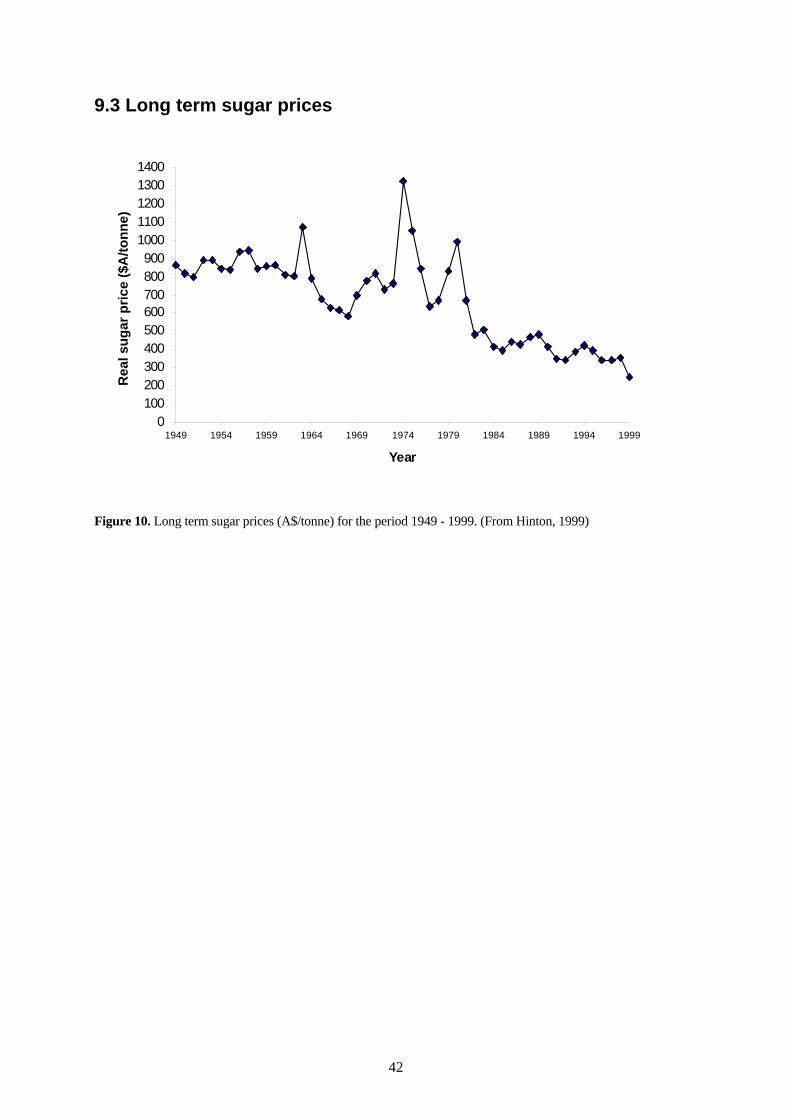
42
9.3 Long term sugar prices
Figure 10. Long term sugar prices (A$/tonne) for the period 1949 - 1999. (From Hinton, 1999)
0100200300400500600700800900
10001100120013001400
1949 1954 1959 1964 1969 1974 1979 1984 1989 1994 1999
Year
Rea
l sug
ar p
rice
($A
/tonn
e)

43
10. References ABARE (2000). Four ways to make world sugar turn sour. In Australian Canegrower, 22,No.11, p5. Adams, R.M., Farris, P.J., and Halvorson, A.D. (1983). Sugar beet N fertilisation and economic
optima: Recoverable sucrose vs root yield. Agronomy Journal, 75, 173 – 6. Anderson, F.N and Peterson, G.A. (1988). Effect of incrementing nitrogen applications on sucrose
yield in sugar beet. Agronomy Journal, 80, 709-12. Anon. (1986). A simple method for interpreting potato crop growth and yield. A research brief from
the International Potato Centre, Lima, Peru. Anon. (2000). An agricultural profile of the Atherton Tablelands. An information pamphlet produced
by QDPI Directions initiative. Armstrong, M. J., Milford, G.F.J., Biscoe, P.V. and Last, P.J. (1983). Influences of nitrogen on
physiological aspects of sugar beet productivity. International Institute for Sugar Beet Research. Symposium ‘Nitrogen and sugar beet’, pp. 53-61.
Armstrong, M. J., Milford, G.F.J., Pocock, T.O., Last, P.J. and Day, W. (1986). The dynamics of
nitrogen uptake and its remobilisation during the growth of sugar beet. Journal of Agricultural Science, Cambridge, 107, 145-54.
Benz, L.C., Doering, E.J. and Reichman, D.A. (1985). Water-table and irrigation effects on corn and
sugar beet. Transactions of the American Society of Agricultural Engineers, 28, 1951-6. Broeshart, H. (1983). 15N tracer techniques for the determination of active root distribution and
nitrogen uptake by sugar beets. International Institute for Sugar Beet Research. Symposium ‘Nitrogen and sugar beet’, pp. 121-4.
Brown, K.F. and Biscoe, P.V. (1985). Fibrous root growth and water use of sugar beet. Journal of
Agricultural Science, Cambridge, 105, 679-91. Brown, K.F. and Dunham, R.J. (1989). Recent progress on the fibrous root system of sugar beet. In
World Sugar and Sweetener Yearbook 1989. F.O Licht GmbH, Ratzburg, pp. F5-F13. Brown, K.F., McGowan, M. and Armstrong, M.J. (1987a). Response of the components of sugar beet
leaf water potential to a drying soil profile. Journal of Agricultural Science, Cambridge, 109, 437-44.
Brown, K.F., Messem, A.B., Dunham, R.J. and Biscoe, P.V. (1987b). Effect of drought on growth and
water use of sugar beet. Journal of Agricultural Science, Cambridge, 109, 421-35. Bureau of Sugar Experiment Stations. (1991). The standard laboratory manual for Australian sugar
mills. Vol. 2, Analytical Methods and Tables. Brisbane . Australia. Burke, J.I. (1992). A physiological growth model for forecasting sugar beet yield in Ireland.
Proceedings of the 55th Winter Congress of the International Institute for Sugar Beet Research. Carter, J.N., Westermann, D.T. and Jensen, M.E. (1976). Sugar beet yield and quality as affected by
nitrogen level. Agronomy Journal. 68, 49-55.

44
Cassel, D.K. and Bauer, A. (1976). Irrigation schedules for sugar beets on medium and coarse textured soils in the Northern Great Plains. Agronomy Journal, 68, 45-8.
Chocola, J. and Radek, J. (1992). Computer modelling of the costs of sugar beet production. Listy
Cukrovarnicke, 108, 5-8. Christenson, D.R., Gallagher, R.S., Harrigan, T.M. and Black, J.R. (1995). Net returns from 12
cropping systems containing sugar beet and navy bean. Journal of production Agriculture, 8 (2), 276-81.
Colwell, J.D. (1963). The estimation of the phosphorus fertiliser requirements of wheat in southern
New South Wales by soil analysis. Aust. J. Exp. Agric. Anim. Husb. 3, 190-8. Day, W. (1986). A simple model to describe variation between years in the early growth of sugar beet.
Field Crops Research, 14, 213-20. Doorenbos, J. and Pruitt, W.O. (1984). Crop Water Requirements. FAO Irrigation and Drainage Paper
24. Food and Agriculture Organization, Rome. 144 pp. Draycott, A.P. (1993). Nutrition. In The Sugar Beet Crop: Science into practice. (ed. D.A. Cooke and
R.K. Scott), Chapman and Hall, pp 239-278. Draycott, A.P. and Durrant, M.J. (1971). Effects of nitrogen fertiliser, plant population and irrigation
on sugar beet. II. Nutrient concentration and uptake. Journal of Agricultural Science, Cambridge, 76, 269-75.
Draycott, A.P. and Messem, A.M. (1977). Response of sugar beet to irrigation,1965-75. Journal of
Agricultural Science, Cambridge, 89, 481-93. Draycott, A.P. and Webb, D.J. (1971). Effects of nitrogen fertiliser, plant population and irrigation on
sugar beet. 1. Yields. Journal of Agricultural Science, Cambridge, 76, 261-7. Duffus, J.E. and Ruppel, E.G. (1993). Diseases. In The Sugar Beet Crop: Science into practice. (ed.
D.A. Cooke and R.K. Scott), Chapman and Hall, p 387. Dunham, R.J. (1989). Irrigating sugar beet in the United Kingdom. In Proceedings of the 2nd
Northwest European Irrigation Conference, Silsoe, 1987. United Kingdom Irrigation Association and Cranfield Press, pp. 109-29.
Dunham, R.J. (1993). Water use and irrigation. In The Sugar Beet Crop: Science into practice. (ed.
D.A. Cooke and R.K. Scott), Chapman and Hall, pp 279-309. Dutton, J. and Bowler, G. (1984). Money is still being wasted on nitrogen fertiliser. British Sugar Beet
Review, 52 (4), 75-7. Fick, G.W., Loomis, R.S. and Williams, W.A. (1975). Sugar beet. In Crop Physiology – some case
histories. (ed. L.T Evans), Cambridge University Press, pp 259-95. Ghariani, S.A. (1981). Impact of variable irrigation water supply on yield-determining parameters and
seasonal water-use efficiency of sugar beets. PhD Thesis, University of California, Davis. Giaquinta, R.T. (1979). Phloem loading of sucrose: involvement of membrane ATPase and proton
transport. Plant Physiology, 63, 744-8.
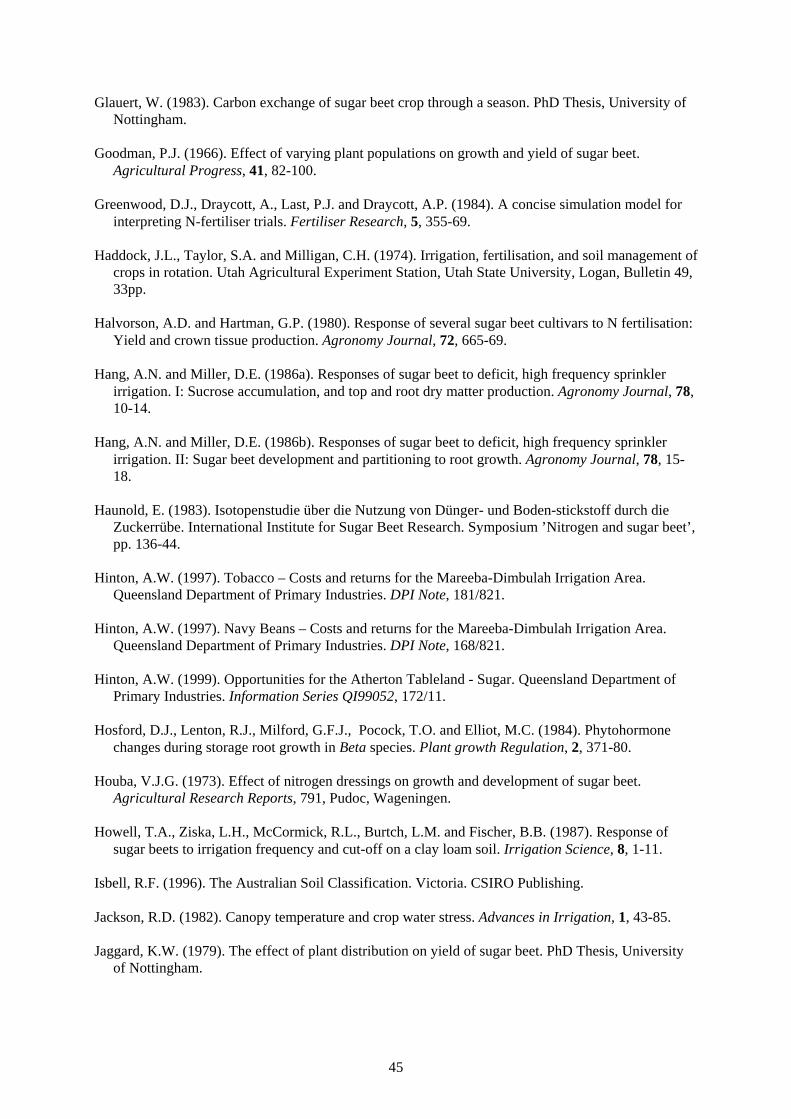
45
Glauert, W. (1983). Carbon exchange of sugar beet crop through a season. PhD Thesis, University of Nottingham.
Goodman, P.J. (1966). Effect of varying plant populations on growth and yield of sugar beet.
Agricultural Progress, 41, 82-100. Greenwood, D.J., Draycott, A., Last, P.J. and Draycott, A.P. (1984). A concise simulation model for
interpreting N-fertiliser trials. Fertiliser Research, 5, 355-69. Haddock, J.L., Taylor, S.A. and Milligan, C.H. (1974). Irrigation, fertilisation, and soil management of
crops in rotation. Utah Agricultural Experiment Station, Utah State University, Logan, Bulletin 49, 33pp.
Halvorson, A.D. and Hartman, G.P. (1980). Response of several sugar beet cultivars to N fertilisation:
Yield and crown tissue production. Agronomy Journal, 72, 665-69. Hang, A.N. and Miller, D.E. (1986a). Responses of sugar beet to deficit, high frequency sprinkler
irrigation. I: Sucrose accumulation, and top and root dry matter production. Agronomy Journal, 78, 10-14.
Hang, A.N. and Miller, D.E. (1986b). Responses of sugar beet to deficit, high frequency sprinkler
irrigation. II: Sugar beet development and partitioning to root growth. Agronomy Journal, 78, 15-18.
Haunold, E. (1983). Isotopenstudie über die Nutzung von Dünger- und Boden-stickstoff durch die
Zuckerrübe. International Institute for Sugar Beet Research. Symposium ’Nitrogen and sugar beet’, pp. 136-44.
Hinton, A.W. (1997). Tobacco – Costs and returns for the Mareeba-Dimbulah Irrigation Area.
Queensland Department of Primary Industries. DPI Note, 181/821. Hinton, A.W. (1997). Navy Beans – Costs and returns for the Mareeba-Dimbulah Irrigation Area.
Queensland Department of Primary Industries. DPI Note, 168/821. Hinton, A.W. (1999). Opportunities for the Atherton Tableland - Sugar. Queensland Department of
Primary Industries. Information Series QI99052, 172/11. Hosford, D.J., Lenton, R.J., Milford, G.F.J., Pocock, T.O. and Elliot, M.C. (1984). Phytohormone
changes during storage root growth in Beta species. Plant growth Regulation, 2, 371-80. Houba, V.J.G. (1973). Effect of nitrogen dressings on growth and development of sugar beet.
Agricultural Research Reports, 791, Pudoc, Wageningen. Howell, T.A., Ziska, L.H., McCormick, R.L., Burtch, L.M. and Fischer, B.B. (1987). Response of
sugar beets to irrigation frequency and cut-off on a clay loam soil. Irrigation Science, 8, 1-11. Isbell, R.F. (1996). The Australian Soil Classification. Victoria. CSIRO Publishing. Jackson, R.D. (1982). Canopy temperature and crop water stress. Advances in Irrigation, 1, 43-85. Jaggard, K.W. (1979). The effect of plant distribution on yield of sugar beet. PhD Thesis, University
of Nottingham.

46
Keeney, D.R. (1982). Nitrogen - Availability Indices. In A.L Page et al. (Eds.) Methods of soil analysis, Part 2, 2nd edition, Agronomy monograph 9 (ASA and SSSA: Madison, WI.).
Kropff, M.J. and Spitters, C.J.C. (1991). A simple model of crop loss by weed competition from early
observation on relative leaf area of the weeds. Weed Research, 31, 97-105. Lansford, V.D., Winter, S.R. and Harman, W.L. (1989). Irrigated sugar beet root yield response in the
Texas High Plains. Journal of Sugar Beet Research, 26,50-62. Last, P.J., Draycott, A.P., Messem, A.B. and Webb, D.J. (1983). Effects of nitrogen fertiliser and
irrigation on sugar beet at Broom’s Barn 1973-8. Journal of Agricultural Science, Cambridge, 101, 185-205.
Lawes Agricultural Trust. (1996). ‘Genstat Release 5 statistical system’. Rothamsted Experimental
Station, UK. Lenton, J.R. and Milford, G.F.J (1977). Plant growth regulators and the physiological limitations to
yield in sugar beet. Pesticide Science, 8, 224-9. Lindemann, Y., Guiraud, G., Chabouis, C., Christmann, J. and Mariotti, A. (1983). Cinq anèees
d’utilisation de l’isotope 15 de l’azote sur betteraves sucrières en plein champ. International Institute for Sugar Beet Research. Symposium ’Nitrogen and sugar beet’, pp. 99-115.
McElroy, R.G. and Ali, M. (1995). U.S. sugar beet and sugarcane per-acre costs of production:
revisions to 1992, and new 1993 and 1994 crop estimates. Sugar and Sweetener, 20(3), 28-34. McElroy, R.G. and Ali, M. (1996). Costs of producing 1995 sugar crops. Sugar and Sweetener, 21(3),
15-20. Milford,G.F.J. (1973). The growth and development of the storage root of sugar beet. Annals of
Applied Biology, 75, 427-38. Milford,G.F.J. and Thorne G.N. (1973). The effect of light and temperature late in the season on the
growth of sugar beet. Annals of Applied Biology, 73, 419-425 Milford, G.F.J and Watson, D.J. (1971). The effect of nitrogen on the growth and sugar content of
sugar beet. Annals of Botany, 35, 287-300. Milford,G.F.J., Pocock, T.O., Jaggard, K.W., Biscoe, P.V., Armstrong, M.J., Last, P.J. and Goodman,
P.J. (1985a). An analysis of leaf growth in sugar beet. IV: The expansion of the leaf canopy in relation to temperature and nitrogen. Annals of Applied Biology, 107, 335-47.
Milford,G.F.J., Pocock, T.O. and Riley, J. (1985b). An analysis of leaf growth in sugar beet. II: Leaf
appearance in field crops. Annals of Applied Biology, 106, 163-72. Milford,G.F.J., Pocock, T.O. and Riley, J. (1985c). An analysis of leaf growth in sugar beet. I: Leaf
appearance and expansion in relation to temperature under controlled conditions. Annals of Applied Biology, 106, 173-85.
Milford,G.F.J., Pocock, T.O. and Riley, J. and Messem, A.B. (1985d). An analysis of leaf growth in
sugar beet. III: Leaf expansion in field crops. Annals of Applied Biology, 106, 187-203.
47
Morgan, T.E., Chapman, L.S., Elliot, S.J and Royal, A.J. (1995). The selection of sugarbeet varieties suitable for commercial cropping and milling on marginal soils in the Burdekin and Mackay sugarcane growing areas. Final Report RIRDC/SRDC. ISBN 0-646-24321-7
Neeteson, J.J and Smilde, K.W. (1983). Correlative methods of estimating the optimum nitrogen
fertiliser rate for sugar beet as based on soil mineral nitrogen at the end of the winter period. International Institute for Sugar Beet Research. Symposium ’Nitrogen and sugar beet’, pp. 409-21.
Norman, K. (1994). Peanuts in the Mareeba – Dimbulah Irrigation Area. Queensland Department of
Primary Industries. Choices Seminar Series, 2, 18-25. Pool, V.W and McKay, M.B. (1916). Climatic conditions as related to Cercospora beticola. Journal of
Agricultural Science, Cambridge, 6, 21-60. Pruitt, W.O., Lourence, F.J. and von Oettingen, S. (1972). Water use by crops as affected by climate
and plant factors. Californian Agriculture, October 1972, 10-14. Rhoades, J.D. and Loveday, J. (1990). Salinity in irrigated agriculture. In Irrigation of Agricultural
Crops. Agronomy Monograph no. 30 (eds B.A Stewart and D.R Nielsen), American Society of Agronomy Inc., Madison, pp. 1089-1142.
Scott, R.K. (1964). The relationship between leaf growth and yield of sugar beet. PhD Thesis,
University of Nottingham. Scott, R.K., English, S.D., Wood, D.W. and Unsworth, M.H. (1973). The yield of sugar beet in
relation to weather and length of growing season. Journal of Agricultural Science, Cambridge, 81, 339-47.
Scott, R.K., Harper, F., Wood, D.W. and Jaggard, K.W. (1974). Effect of seed size on growth,
development and yield of monogerm sugar beet. Journal of Agricultural Science, Cambridge, 82, 517-30.
Scott, R.K and Jaggard, K.W. (1993). Crop Physiology and Agronomy. In The Sugar Beet Crop:
Science into practice. (ed. D.A. Cooke and R.K. Scott), Chapman and Hall, pp 179-233. Sharma, M.L. (1985). Estimating evapotranspiration. Advances in Irrigation, 3, 213-81. Sheldon, B. (1980). Turning sugar beets into fuel economically. Rural Research, 108, 4-6. Shock, C.C., Eldredge E.P and Saunders, M. (1999). 1999 sugar beet variety trial results. A research
report from Oregon State University, Ontario. Oregon. Smit, A.B., Muijs, G.J.W., Struik, P.C., and van Niejenhuis, J.H. (1996). Evaluation of a model for
sugar beet production by comparing field measurements with computer predictions. Computers and Electronics in Agriculture. 16, 69-85.
Smit, A.B., van Niejenhuis, J.H., and Renkema, J.A. (1997). A farm economic module for tactical
decisions on sugar beet area. Netherlands Journal of Agricultural Science. 45, 381-92. Spitters, C.J.T., Kiewiet, B. and Schiphouwer, T. (1990). A weather-based yield-forecasting model for
sugar beet. Netherlands Journal of Agricultural Science. 48, 731-5. Stegman, E.C. and Bauer, A. (1977). Sugar beet response to water stress in sandy soils. Transactions
of the American Society of Agricultural Engineering, 20, 469-77.
48
Stott, Z., Prince, J., Steven, M, and Jaggard, K. (1998). Sugar Beet Yield Prediction and Management.
A demonstration case study (Ref: 647751). EWES. Tanner, C.B. and Sinclair, T.R. (1983). Efficient water use in crop production: research or re-search?
In Limitations to efficient Water Use in Crop Production (eds H.M Taylor, W.R Jordan and T.R Sinclair), American Society of Agronomy, Inc., Madison, pp. 1-27.
USDA (1998). World sugar production estimates. Sugar and Sweetener, 224. USDA (1999). Annual US sugar beet production figures, 1999. In Sugar and Sweetener, Sept. 1999. USDA (2000). Sugar: World markets and trade. In Australian Canegrower, 22, No. 11, p 12. Vierling, G. and Zeddies, J. (1996). Costs of sugar beet production – Comparison of selected EU-
regions. Zuckerind. (121) 8, 635-39. Waring, S.A. (1965). Procedure for determination of ammonia and nitrate. PhD Thesis - Department
of Agriculture, University of Queensland. Werker, R. (1993). Modelling the growth of sugar beet. British Sugar Beet Review. 61 - 2, 42 - 45. Winter, S.R. (1988). Influence of seasonal irrigation amount on sugar beet yield and quality. Journal
of Sugar Beet Research, 25, 1-9. Winter, S.R. (1990). Sugar beet response to nitrogen as affected by seasonal irrigation. Agronomy
Journal, 82, 984-8. Witter, S.H. and Hansen, C.M. (1952). Proceedings of the 7th General Meeting of American Society of
Sugar Beet Technologists, 1952, p. 90. Other material Video - ‘More sugar from better growing practice’. From Vanderhave Seed Company, The
Netherlands. Report - ‘Preliminary studies into the potential of sugar beet as a source of dairy fodder’.
R.G Walker and B.A Silver. A report initiated by the Dairy Research and Development Coporporation’s Sub-tropical Dairy Program.