Embed Size (px)
Citation preview
Potential Impact of the New Medicare Prospective PaymentSystem on Reimbursement for Traumatic Brain InjuryInpatient RehabilitationJeanne M. Hoffman, PhD, Jason N. Doctor, PhD, Leighton Chan, MD, MPH, John Whyte, MD, PhD,Amit Jha, MD, MPH, Sureyya Dikmen, PhD
ABSTRACT. Hoffman JM, Doctor JN, Chan L, Whyte J,Jha A, Dikmen S. Potential impact of the new Medicareprospective payment system on reimbursement for traumaticbrain injury inpatient rehabilitation. Arch Phys Med Rehabil2003;84:1165-72.
Objective: To evaluate the potential impact of the newMedicare prospective payment system (PPS) on traumaticbrain injury (TBI) rehabilitation.
Design: Retrospective cohort study of patients with TBI.Patients were assigned to their appropriate case-mix group(CMG) based on Medicare criteria.
Setting: Fourteen urban rehabilitation facilities throughoutthe United States.
Participants: Patients with TBI admitted to inpatient reha-bilitation and enrolled in the Traumatic Brain Injury ModelSystems from 1998 to 2001 (N�1807).
Interventions: Not applicable.Main Outcome Measures: Cost of inpatient rehabilitation
admission, length of stay (LOS), and functional outcomes.Results: The median cost of inpatient rehabilitation for
patients with TBI exceeded median PPS payments for all TBICMGs by 16%. Only 3 of the 14 hospitals received reimburse-ment under PPS that exceeded costs for their TBI patients.
Conclusions: Compared with current costs, the new Medi-care payment system may reimburse facilities significantly lessthan their costs for the treatment of TBI. To maintain theircurrent financial status, facilities may have to reduce LOSand/or reduce resource use. With a decreased LOS, inpatientrehabilitation services will have to improve FIM efficiency ordischarge patients with lower discharge FIM scores.
Key Words: Brain injuries; Health care economics and orga-nizations; Medicare; Prospective payment system; Rehabilitation.
© 2003 by the American Congress of Rehabilitation Medicineand the American Academy of Physical Medicine andRehabilitation
ON JANUARY 1, 2002, the Centers for Medicare andMedicaid Services (CMS) implemented a prospective
payment system (PPS) for inpatient rehabilitation facilities.1The rehabilitation PPS now provides a single payment for allhospital services including room and board, nursing care, ther-apy, radiology, medications, and laboratory billing.
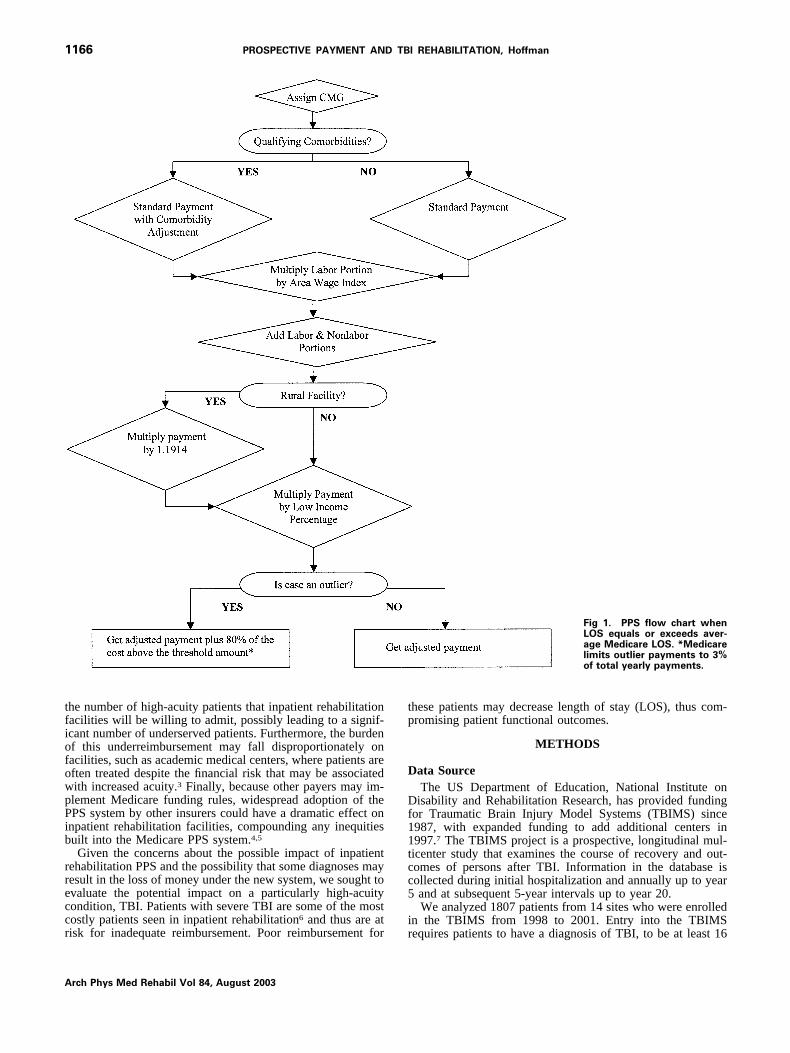
The new rehabilitation PPS is based on case-mix groups(CMGs) that provide payment to facilities for individual patientstays based on the principal rehabilitation diagnosis, functionalstatus as measured by the FIMTM instrument, and age. Eachrehabilitation patient is classified into a CMG at the time ofadmission based on these 3 variables. There are 95 separateCMGs, with 5 for traumatic brain injury (TBI). The 5 CMGsfor TBI vary depending on the patient’s motor and cognitivefunctioning levels. Each CMG is assigned a relative weight thatreflects the level of resources required to treat that class ofpatient. Those patients with more functional deficits who needmore rehabilitation will receive higher weights. The weightsare then multiplied by a conversion factor ($11,838 for 2002)to obtain a base payment for the patient. The base payment isthen adjusted for the patient’s most severe qualifying comorbidcondition (fig 1). Finally, each facility adjusts its reimburse-ment by 4 additional factors: (1) the wage rates in its region, (2)percentage of low-income patients, (3) rural adjustment ifapplicable, and (4) high-cost outlier payments.
The adjustment for wage rates for each facility reflects thevarying wage levels in different parts of the United States andis related to the labor-related share of the PPS payment. Thelow-income payment adjustment reflects the increase in costsof treating low-income patients and is based on the percentageof individuals served by the rehabilitation facility who are onMedicaid. In development of the PPS, CMS research indicatedthat rural facilities had significantly higher costs per case;therefore, a rural adjustment was also included. Finally, aspecial “outlier” payment above the PPS was developed toprotect facilities from extremely high cost cases. For thosecases in which costs exceed an adjusted threshold amount, apayment of 80% of the amount above the threshold is paid inaddition to the CMG payment. However, CMS limits theseoutlier payments to 3% of total payments for each year.
Concerns have been raised that the new PPS system will notcompensate appropriately for cases in higher acuity CMGsbased on CMS assigning insufficient weights to these groups.2Inappropriate underweighting for higher acuity CMGs, such aspatients recovering from severe trauma, could lead to under-compensation for these cases. Poor compensation may reduce
From the Departments of Rehabilitation Medicine (Hoffman, Doctor, Chan, Dik-men), Medical Education and Biomedical Informatics (Doctor), Health Services(Doctor), Neurosurgery (Dikmen), and Psychiatry and Behavioral Sciences (Dikmen),University of Washington, Seattle, WA; Moss Rehabilitation Research Institute(Whyte) and Department of Rehabilitation Medicine, Thomas Jefferson University(Whyte), Philadelphia, PA; Craig Hospital, Englewood, CO (Jha); University ofColorado, Denver, CO (Jha).
Supported by the National Center for Medical Rehabilitation Research (grant no.T32 HD07424) and National Institute on Disability and Rehabilitation Researchthrough the Traumatic Brain Injury Model Systems project. The views expressedherein are those of the authors and not necessarily of the University of Washington,Moss Rehabilitation Research Institute, or Craig Hospital.
No commercial party having a direct financial interest in the results of the researchsupporting this article has or will confer a benefit upon the author(s) or upon anyorganization with which the author(s) is/are associated.
Correspondence to Jeanne M. Hoffman, PhD, Dept of Rehabilitation Medi-cine, University of Washington, Box 356490, Seattle, WA 98195-6490, e-mail:[email protected]. Reprints are not available.
0003-9993/03/8408-7820$30.00/0doi:10.1016/S0003-9993(03)00232-6
1165
Arch Phys Med Rehabil Vol 84, August 2003
the number of high-acuity patients that inpatient rehabilitationfacilities will be willing to admit, possibly leading to a signif-icant number of underserved patients. Furthermore, the burdenof this underreimbursement may fall disproportionately onfacilities, such as academic medical centers, where patients areoften treated despite the financial risk that may be associatedwith increased acuity.3 Finally, because other payers may im-plement Medicare funding rules, widespread adoption of thePPS system by other insurers could have a dramatic effect oninpatient rehabilitation facilities, compounding any inequitiesbuilt into the Medicare PPS system.4,5
Given the concerns about the possible impact of inpatientrehabilitation PPS and the possibility that some diagnoses mayresult in the loss of money under the new system, we sought toevaluate the potential impact on a particularly high-acuitycondition, TBI. Patients with severe TBI are some of the mostcostly patients seen in inpatient rehabilitation6 and thus are atrisk for inadequate reimbursement. Poor reimbursement for
these patients may decrease length of stay (LOS), thus com-promising patient functional outcomes.
METHODS
Data SourceThe US Department of Education, National Institute on
Disability and Rehabilitation Research, has provided fundingfor Traumatic Brain Injury Model Systems (TBIMS) since1987, with expanded funding to add additional centers in1997.7 The TBIMS project is a prospective, longitudinal mul-ticenter study that examines the course of recovery and out-comes of persons after TBI. Information in the database iscollected during initial hospitalization and annually up to year5 and at subsequent 5-year intervals up to year 20.
We analyzed 1807 patients from 14 sites who were enrolledin the TBIMS from 1998 to 2001. Entry into the TBIMSrequires patients to have a diagnosis of TBI, to be at least 16
Fig 1. PPS flow chart whenLOS equals or exceeds aver-age Medicare LOS. *Medicarelimits outlier payments to 3%of total yearly payments.
1166 PROSPECTIVE PAYMENT AND TBI REHABILITATION, Hoffman
Arch Phys Med Rehabil Vol 84, August 2003
years of age, to arrive at the acute care hospital within 24 hoursof injury, to be admitted from acute care directly to inpatientrehabilitation, and to provide informed consent.
Analyses were conducted to compare the 152 patients whowere at or over the age of 65 years to those under age 65(n�1655) to determine if they differed significantly. No dif-ferences were found between these 2 groups in assignment toCMG, cost, or LOS. Therefore, only aggregate results arepresented.
MeasuresTBIMS database. The TBIMS collect information on each
patient enrolled, including the actual amount charged for eachpatient’s inpatient rehabilitation stay, the actual LOS for eachpatient, and the FIM at admission and discharge. The FIMincludes assessment of basic activities of daily living in motorand cognitive functioning. Eighteen items from 6 domains,including self-care, sphincter control, mobility, locomotion,communication, and social cognition, are scored based on thepatient’s level of independence or dependence in each area.Ratings are made on a scale from 1 to 7, with 1 being com-pletely dependent to 7 being independent.8 In the new assess-ment tool for inpatient rehabilitation PPS, the same FIM in-strument is used. Transfer to tub or shower is scored but notused in the determination of the CMG.
Facility data. Estimated low-income patient percentageand Medicare cost-to-charge data were collected directly fromeach inpatient rehabilitation facility in the study. Informationon low-income patient percentages was calculated from hospi-tal disproportionate share hospital values (DSH). Dispropor-tionate share hospital values are calculated by the followingformula:
DSH�Medicare SSI Days
Total Medicare Days
�Medicaid Non-Medicare Days
Total Days(1)
where SSI is Supplemental Security Income. The low-incomepatient percentage (LIP) is then calculated:
LIP�(1�DSH).4838 (2)
For those facilities in our study, low-income patient percentagevalues ranged from 1.029 to 1.147.
The Medicare cost-to-charge ratios were obtained from eachfacility and were specific to inpatient rehabilitation units. Cost-to-charge ratios were gathered from Medicare cost reportswhere the ratio is the total yearly costs to the total yearlycharges for rehabilitation. The cost-to-charge ratio is computedfrom total patient costs and total patient charges. However,because the number of cases drops out of the ratio, it alsorepresents a ratio of average patient costs to average patientcharges. Hence, cost-to-charge ratios can be used to estimatethe facility cost associated with any patient, xi, when only theactual individual charges are available by using the followingequation:
Estimated Patient Cost (xi)�Costs
Charges�Charges(xi) (3)
Summing across all TBI patients treated gives the estimatedcost of TBI care. Even though only estimates of individualcosts can be calculated, this method improves on the biasesfound when using only hospital charges.9 One facility (facility7) did not provide their Medicare cost-to-charge ratio; there-
fore, an average of all other facilities’ data was substituted forthat rehabilitation unit.
Comorbidity data. Under the PPS, additional diagnosesthat require treatment during inpatient rehabilitation and in-crease the cost of rehabilitation are defined as comorbidities.The full list of diagnoses allowed under the new system ispublished in the Final Rule.1 In the current study, 3 of the 14facilities provided detailed information on comorbid diagnosestreated during each patient’s rehabilitation stay. In addition tothe information from the 3 facilities, an estimate of the fre-quency of comorbidities in patients with TBI was taken from aMedicare billing database of 2046 patients treated for TBI.These patients represent all Medicare beneficiaries admitted toan inpatient rehabilitation freestanding hospital from 1987 to1994 in the United States for treatment of a TBI.6
Area wage and rural adjustments. Area wage indexes foreach facility were taken from the published list in CMS’s FinalRule.1 Wage indexes range from a high of 1.4483 for NewYork City, a 45% increase, to a low of 0.4651 for Puerto Rico,a 46% reduction. The area wage adjustment applies to the laborportion of the payment, which has been determined to be72.395% of the CMG payment. Multiplying the area wageindex by the labor portion of the payment gives the adjustment.
In addition to the area wage adjustments, facilities are di-vided into urban versus rural locations. Urban locations aredefined as metropolitan statistical areas or counties in whichthere is a city with a population greater than 50,000. Rurallocations are everywhere else. Facilities that are rural receivean additional rural adjustment that increases the total CMGpayment by 19%. None of the 14 TBIMS sites was consideredrural.
Assignment of CMGs and Comorbidity TieringPatients were assigned to 1 of the 5 CMGs for TBI based on
their admission FIM score. Comorbidity tiers (0, none; 1,severe/high cost; 2, moderate/medium cost; 3, mild/low cost)were randomly assigned to individual patients based on theestimated percentage of occurrence of each tier from the actualdata collected from 3 sites. Random assignment to patients waschosen based on the lack of pattern for frequency or severity oftiers to CMGs in these data. The Medicare average LOS (theamount of time that Medicare estimates the patient should stayin inpatient rehabilitation) and payment were then adjustedbased on the tier assigned. The standard payment for eachCMG was then adjusted for area wage index and percentage oflow-income patients to determine the final PPS payment.
In addition to randomly assigning tiers based on data fromthe 3 TBIMS sites, we also used 2 other methods to assess theimpact of comorbid illnesses. First, the tiers were randomlyassigned based on the percentages calculated on the 1987–94data from Medicare patients with TBI. The distribution of thecomorbidities in this group differed significantly from thoseadmitted to the TBIMS, and the results represent anotherreference point in our analysis.
Finally, it is possible that coding of comorbidities will in-crease with the new system, because payment was not contin-gent on regular coding of additional comorbid diagnoses priorto the PPS.10 Therefore, we conducted a sensitivity analysis totest the financial impact of 20% to 70% increases in comor-bidities. This was done by increasing the 3 levels of comorbiddiagnoses based on their frequency of occurrence from thecomorbidity data provided by the 3 Model Systems. For ex-ample, in this data, 1% of patients had tier 1 diagnoses, 19%had tier 2 diagnoses, 10% had tier 3 diagnoses, and 70% had nocomorbid diagnoses. With a 20% increase in comorbidities,
1167PROSPECTIVE PAYMENT AND TBI REHABILITATION, Hoffman
Arch Phys Med Rehabil Vol 84, August 2003
1.8% of patients were then randomly assigned to tier 1, 31.6%were then assigned to tier 2, 16.6% were then assigned to tier3, and 50% were then assigned to tier 0.
Cost of Cases and OutliersWe applied the facility-specific cost-to-charge ratio to the
total inpatient rehabilitation charges to calculate the cost ofeach case. The difference between this cost and the new PPSpayment was calculated.
We identified outliers and calculated payment according tothe method defined by CMS.1 In its simplest form, outliers aredefined as cases that exceed a threshold amount (the PPS CMGpayment plus $11,211), adjusted for area wage index andlow-income patient percentage. The final payment is then cal-culated as the CMG payment plus 80% of the cost beyond thethreshold amount.
Cost-to-Charge AnalysesOur sensitivity analysis of cost-to-charge ratios involves the
systematic variation of the structural assumptions within thecost estimation model to determine at what point hospitalsbegin to lose money. We conducted a sensitivity analysis oncost-to-charge ratios because these values change over timeand are estimates of actual cost of rehabilitation for all diag-noses and not specifically for TBI rehabilitation. Cost-to-charge ratios used in the sensitivity analysis represented therange of values collected from the set of facilities. These valueswere then multiplied by the actual charges for rehabilitationand divided by the actual LOS for each patient to create a costper day for each patient. These values were then compared withthe average payment per day under PPS for all TBI CMGs.
RESULTS
Demographics
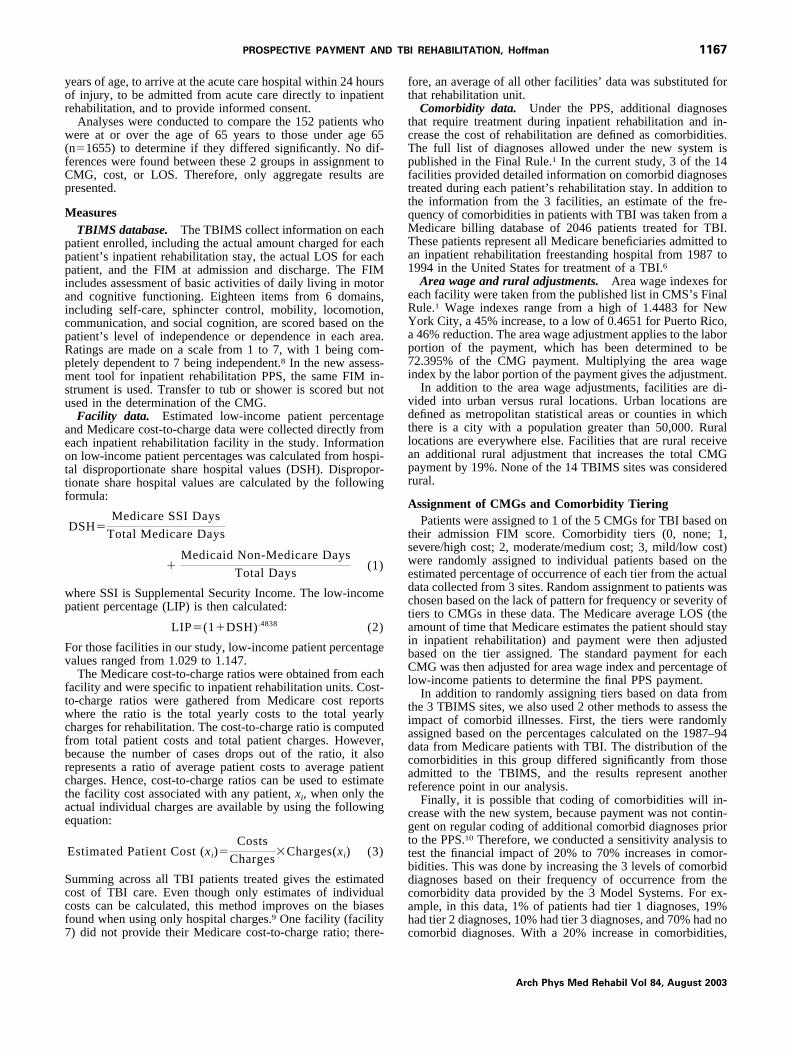
Demographic data for the entire sample are presented intable 1. The percentage of patients assigned to each CMG andsample sizes for the entire sample and by site is displayed intable 2. Data are presented from the highest (CMG�5) to thelowest (CMG�1) level of independence.
Potential Financial ImpactTable 3 shows the difference between the median cost per
case and the PPS payment for each facility. The expectedpayment from PPS will not cover the cost of rehabilitation forTBI patients, with losses ranging from 5% to 41% of costs. Ofthe 14 sites, 3 have PPS payments that exceed their median costper case.
When the differences between the cost and PPS payment arebroken down by individual CMG, the median cost and PPSpayment are equal for those patients in CMG 3. However, thedifferences for the more severely injured patients (CMGs of 4and 5) are large (16% to 27% loss), whereas the differences forthe less severely injured patients (CMGs of 1 and 2) are smaller(both approximately 7% loss).
Length of StayThe difference between the actual LOS for each patient was
compared with the LOS necessary to break even. This “break-
Table 1: Demographics for Entire Sample
Age (y) 37.5�16.8Injury severity (lowest GCS motor score) 3.6�2.0FIM (range, 17–119)Admission 53.9�23.9Discharge 89.0�21.4Male (%) 74.0White (%) 65.8Level of education (%)
� High school 32.8High school 30.4� High school 32.9
Mechanism of injury (%)Motor vehicle crash 59.7Fall 16.5Assault 13.7Other 10.1
NOTE. Values are mean � standard deviation or as otherwise indi-cated.Abbreviation: GCS, Glasgow Coma Scale.
Table 2: Percentage in Each CMG
CMG* 5 4 3 2 1n (% ofsample)
Facility 13 63 13 15 6 2 82 (5)Facility 1 49 13 27 4 7 238 (13)Facility 6 48 21 25 3 3 119 (7)Facility 4 46 17 13 14 10 156 (9)Facility 9 46 13 26 5 9 99 (5)Facility 7 45 20 19 3 12 118 (6)Facility 8 45 13 37 0 5 106 (6)Facility 5 37 12 40 3 9 140 (8)Facility 2 34 19 35 2 10 222 (12)Facility 11 32 17 34 3 14 88 (5)Facility 14 31 8 43 10 8 49 (3)Facility 10 25 17 33 12 13 89 (5)Facility 12 23 22 34 10 12 83 (5)Facility 3 8 12 47 8 24 201 (11)All facilities 38 16 31 6 10 1790
*Values are rounded and may exceed 100%.
Table 3: Difference Between Median Cost Per Caseand PPS Payment
Cost ($)PPS Payment
($)Loss per Case ($)*
(% of cost)
Facility 4 25,583 15,066 10,517 (�41)Facility 5 23,578 16,887 6691 (�28)Facility 9 23,274 16,886 6388 (�27)Facility 8 23,729 17,593 6136 (�26)Facility 6 25,441 20,018 5423 (�21)Facility 3 17,906 14,906 3209 (�18)Facility 7 20,415 18,100 2315 (�11)Facility 2 18,551 16,470 2081 (�11)Facility 14 15,941 14,474 1467 (�9)Facility 10 16,345 15,347 998 (�6)Facility 12 17,455 16,540 915 (�5)Facility 13 31,150 31,693 �543 (�2)Facility 11 16,400 17,204 �804 (�5)Facility 1 15,434 19,854 �4420 (�29)All facilities 19,949 16,837 3112 (�16)
*Negative values indicate gain with PPS payment.
1168 PROSPECTIVE PAYMENT AND TBI REHABILITATION, Hoffman
Arch Phys Med Rehabil Vol 84, August 2003
even” LOS was calculated by dividing the PPS payment by theratio of the cost to the actual LOS. Assuming no change in thecost per day, results indicate that the median LOS required tobreak even was on average 2.7 days less (13.5%) than themedian actual LOS (table 4). In other words, facilities wouldneed to shorten their LOS by almost 3 days to maintain theircurrent financial status for patients with TBI. Results brokendown across the 5 CMGs are similar to those found whenanalyzing cost. Those patients in CMG 3 have a LOS thatmatches the break-even LOS. All other CMGs have an actualLOS that exceeds the break-even LOS, ranging from 1 to 7days (7% to 24% difference).
The PPS includes the Medicare average LOS that corre-sponds to each CMG and is also adjusted based on tiering.These Medicare average LOSs are used to determine whethera facility will receive their full payment under the PPS or a perdiem payment. If a patient is discharged to another facility (eg,hospital, skilled nursing facility, other rehabilitation) beforereaching his/her Medicare average LOS, the facility will re-ceive a per diem payment. If the patient is discharged after theMedicare average LOS to another facility, the rehabilitationfacility will receive the entire payment under the PPS. In ourstudy, these Medicare average LOSs are similar to the actualLOS (except for the most severely injured patients) and aregreater than the LOS required to break even.
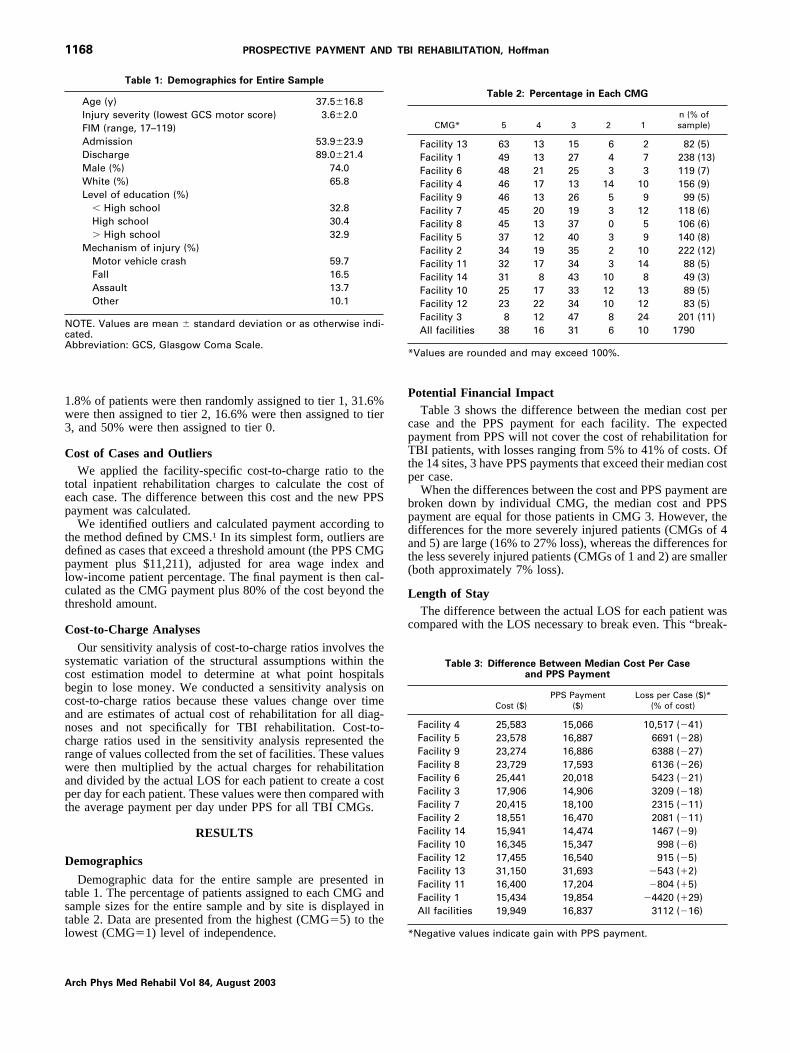
ComorbiditiesThe impact of comorbidities on payment and LOS was
evaluated by comparing the separate methods of tiering. Thefirst method is described earlier by using percentages based ondata collected from 3 TBIMS sites. The second is based onpercentages from Medicare patients with TBI. The final meth-ods are based on a sensitivity analysis with incremental in-creases from 20% to 70% upcoding from the first method oftiering. Our results indicate that the assignment of comorbidi-ties had only a minor effect on overall reimbursement. Evenwhen all patients have some type of comorbid diagnosis (70%increase), the cost of rehabilitation still exceeds PPS paymentby 8% (fig 2).
Functional OutcomesThe impact of the PPS on functional improvement was
evaluated assuming that attempts are made to achieve the same
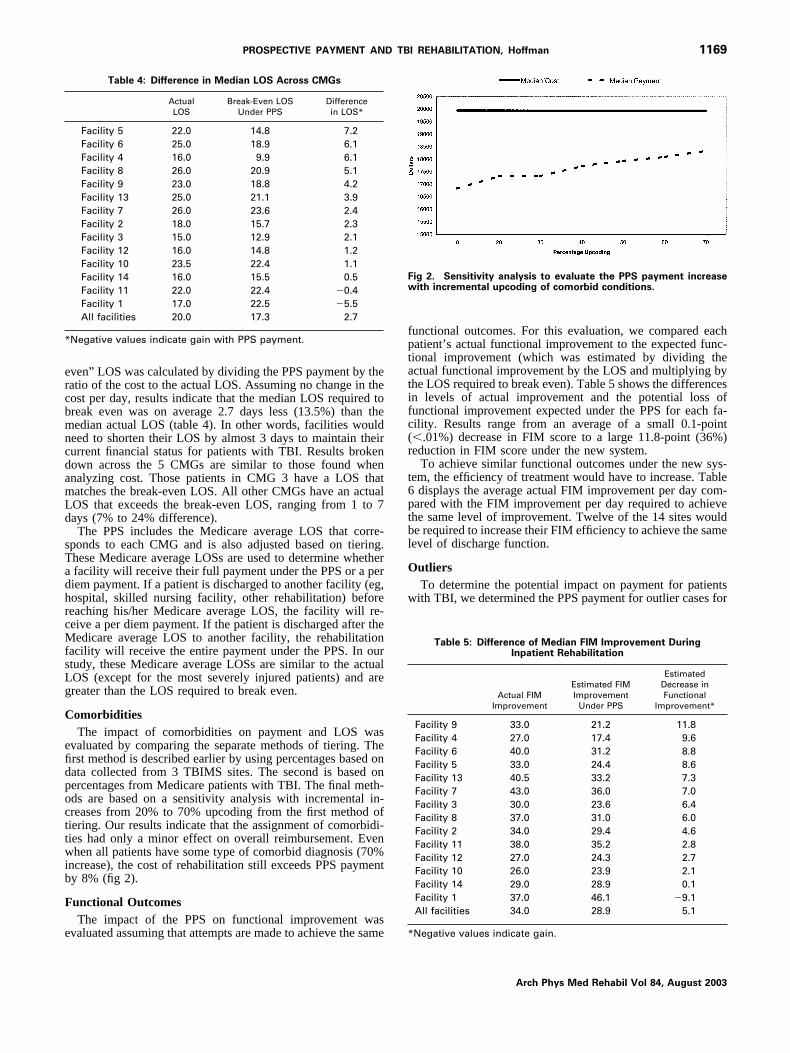
functional outcomes. For this evaluation, we compared eachpatient’s actual functional improvement to the expected func-tional improvement (which was estimated by dividing theactual functional improvement by the LOS and multiplying bythe LOS required to break even). Table 5 shows the differencesin levels of actual improvement and the potential loss offunctional improvement expected under the PPS for each fa-cility. Results range from an average of a small 0.1-point(�.01%) decrease in FIM score to a large 11.8-point (36%)reduction in FIM score under the new system.
To achieve similar functional outcomes under the new sys-tem, the efficiency of treatment would have to increase. Table6 displays the average actual FIM improvement per day com-pared with the FIM improvement per day required to achievethe same level of improvement. Twelve of the 14 sites wouldbe required to increase their FIM efficiency to achieve the samelevel of discharge function.
OutliersTo determine the potential impact on payment for patients
with TBI, we determined the PPS payment for outlier cases for
Table 4: Difference in Median LOS Across CMGs
ActualLOS
Break-Even LOSUnder PPS
Differencein LOS*
Facility 5 22.0 14.8 7.2Facility 6 25.0 18.9 6.1Facility 4 16.0 9.9 6.1Facility 8 26.0 20.9 5.1Facility 9 23.0 18.8 4.2Facility 13 25.0 21.1 3.9Facility 7 26.0 23.6 2.4Facility 2 18.0 15.7 2.3Facility 3 15.0 12.9 2.1Facility 12 16.0 14.8 1.2Facility 10 23.5 22.4 1.1Facility 14 16.0 15.5 0.5Facility 11 22.0 22.4 �0.4Facility 1 17.0 22.5 �5.5All facilities 20.0 17.3 2.7
*Negative values indicate gain with PPS payment.
Fig 2. Sensitivity analysis to evaluate the PPS payment increasewith incremental upcoding of comorbid conditions.
Table 5: Difference of Median FIM Improvement DuringInpatient Rehabilitation
Actual FIMImprovement
Estimated FIMImprovement
Under PPS
EstimatedDecrease inFunctional
Improvement*
Facility 9 33.0 21.2 11.8Facility 4 27.0 17.4 9.6Facility 6 40.0 31.2 8.8Facility 5 33.0 24.4 8.6Facility 13 40.5 33.2 7.3Facility 7 43.0 36.0 7.0Facility 3 30.0 23.6 6.4Facility 8 37.0 31.0 6.0Facility 2 34.0 29.4 4.6Facility 11 38.0 35.2 2.8Facility 12 27.0 24.3 2.7Facility 10 26.0 23.9 2.1Facility 14 29.0 28.9 0.1Facility 1 37.0 46.1 �9.1All facilities 34.0 28.9 5.1
*Negative values indicate gain.
1169PROSPECTIVE PAYMENT AND TBI REHABILITATION, Hoffman
Arch Phys Med Rehabil Vol 84, August 2003
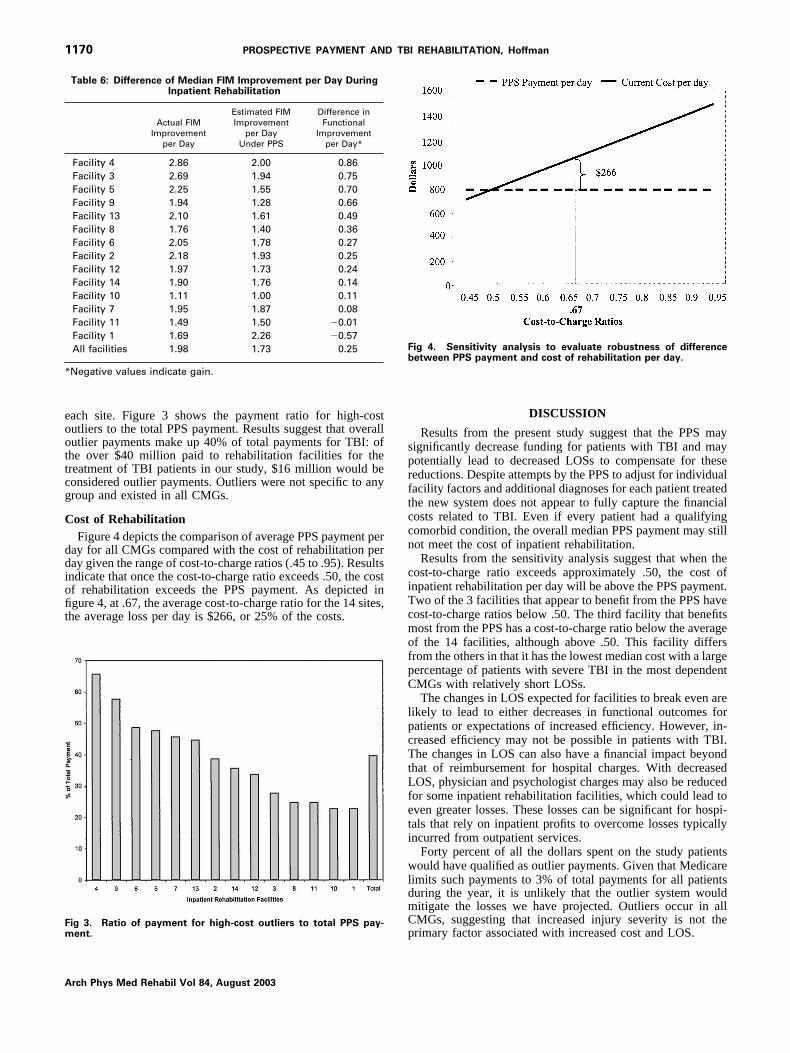
each site. Figure 3 shows the payment ratio for high-costoutliers to the total PPS payment. Results suggest that overalloutlier payments make up 40% of total payments for TBI: ofthe over $40 million paid to rehabilitation facilities for thetreatment of TBI patients in our study, $16 million would beconsidered outlier payments. Outliers were not specific to anygroup and existed in all CMGs.
Cost of RehabilitationFigure 4 depicts the comparison of average PPS payment per
day for all CMGs compared with the cost of rehabilitation perday given the range of cost-to-charge ratios (.45 to .95). Resultsindicate that once the cost-to-charge ratio exceeds .50, the costof rehabilitation exceeds the PPS payment. As depicted infigure 4, at .67, the average cost-to-charge ratio for the 14 sites,the average loss per day is $266, or 25% of the costs.
DISCUSSION
Results from the present study suggest that the PPS maysignificantly decrease funding for patients with TBI and maypotentially lead to decreased LOSs to compensate for thesereductions. Despite attempts by the PPS to adjust for individualfacility factors and additional diagnoses for each patient treatedthe new system does not appear to fully capture the financialcosts related to TBI. Even if every patient had a qualifyingcomorbid condition, the overall median PPS payment may stillnot meet the cost of inpatient rehabilitation.
Results from the sensitivity analysis suggest that when thecost-to-charge ratio exceeds approximately .50, the cost ofinpatient rehabilitation per day will be above the PPS payment.Two of the 3 facilities that appear to benefit from the PPS havecost-to-charge ratios below .50. The third facility that benefitsmost from the PPS has a cost-to-charge ratio below the averageof the 14 facilities, although above .50. This facility differsfrom the others in that it has the lowest median cost with a largepercentage of patients with severe TBI in the most dependentCMGs with relatively short LOSs.
The changes in LOS expected for facilities to break even arelikely to lead to either decreases in functional outcomes forpatients or expectations of increased efficiency. However, in-creased efficiency may not be possible in patients with TBI.The changes in LOS can also have a financial impact beyondthat of reimbursement for hospital charges. With decreasedLOS, physician and psychologist charges may also be reducedfor some inpatient rehabilitation facilities, which could lead toeven greater losses. These losses can be significant for hospi-tals that rely on inpatient profits to overcome losses typicallyincurred from outpatient services.
Forty percent of all the dollars spent on the study patientswould have qualified as outlier payments. Given that Medicarelimits such payments to 3% of total payments for all patientsduring the year, it is unlikely that the outlier system wouldmitigate the losses we have projected. Outliers occur in allCMGs, suggesting that increased injury severity is not theprimary factor associated with increased cost and LOS.
Table 6: Difference of Median FIM Improvement per Day DuringInpatient Rehabilitation
Actual FIMImprovement
per Day
Estimated FIMImprovement
per DayUnder PPS
Difference inFunctional
Improvementper Day*
Facility 4 2.86 2.00 0.86Facility 3 2.69 1.94 0.75Facility 5 2.25 1.55 0.70Facility 9 1.94 1.28 0.66Facility 13 2.10 1.61 0.49Facility 8 1.76 1.40 0.36Facility 6 2.05 1.78 0.27Facility 2 2.18 1.93 0.25Facility 12 1.97 1.73 0.24Facility 14 1.90 1.76 0.14Facility 10 1.11 1.00 0.11Facility 7 1.95 1.87 0.08Facility 11 1.49 1.50 �0.01Facility 1 1.69 2.26 �0.57All facilities 1.98 1.73 0.25
*Negative values indicate gain.
Fig 3. Ratio of payment for high-cost outliers to total PPS pay-ment.
Fig 4. Sensitivity analysis to evaluate robustness of differencebetween PPS payment and cost of rehabilitation per day.
1170 PROSPECTIVE PAYMENT AND TBI REHABILITATION, Hoffman
Arch Phys Med Rehabil Vol 84, August 2003
Limitations
The current study has several limitations. First, the results ofthe present study apply only to the CMGs for patients withTBI. Thus, it is possible that other rehabilitation diagnoses mayfit more accurately with the PPS system and may compensatefor any losses incurred for patients with TBI. Furthermore, theTBIMS facilities are all associated with academic medicalcenters, and the impact of the PPS for TBI in other facilitiesmay differ, especially those in rural areas.
Besides TBI being a diagnosis that may lead to losses underthe PPS, it may also be a diagnosis with a high rate of outliers.Other CMGs may have few or no outliers under the newpayment system and the 3% limit, which is based on alldischarges and is not CMG specific, may be appropriate. How-ever, given the large number of outliers, up to 45% for 1facility (accounting for 66% of total payments), it is unlikelythat the rates would not be above the 3% limit.
FIM improvement and efficiency was calculated per day forthe purposes of the current study. Although recovery in TBI isunlikely to be linear and stable, the FIM is only completed atadmission and discharge and daily fluctuations are not avail-able.
Although a minority of patients with TBI are funded byMedicare, we believe that these results are relevant becauseother payers are likely to follow the PPS as they have followedimplementation of the inpatient hospital PPS.4 Further evi-dence suggesting that the patients funded by Medicare havelevels of injury, cost, and LOS similar to those of persons notfunded by Medicare comes from analyses we conducted com-paring patients age 65 years or older with those under age 65.Results suggest that no differences between groups exist inCMG assignment or in the impact of the PPS leading todecreased reimbursement or LOS.
Possible Solutions
Several solutions may have to be considered to reduce thenegative financial impact of the PPS on patients with TBI.Theoretically, 1 possibility is to increase the efficiency ofrehabilitation to decrease LOS. This would require the use ofrehabilitation methods that would not dramatically increasecosts. Attempts to increase the number of hours of rehabilita-tion per day may lead to increased staff costs and may not bebeneficial to patients who may not be able to benefit fromincreased intensity of rehabilitation. On the other hand, im-proving services on the weekend might be cost effective.
A second possible option is to select different patients forrehabilitation and admit only those patients who can benefitfrom short rehabilitation stays or who have less severe injuriesor comorbidities that would increase payment but not LOS.The number and length of admissions to rehabilitation in-creased when the PPS was enacted for acute care inpatienthospitalization,2 suggesting that patients came to rehabilitationearlier and often were sicker. With the PPS for inpatientrehabilitation, there will likely be a change in referral patternsfor inpatient rehabilitation. Decisions will have to be madeweighing the cost of sending patients to rehabilitation com-pared with lengthening their acute inpatient stay. Rehabilitationfacilities will also need to balance the cost of early dischargesto other facilities where they would receive per diem paymentsagainst keeping patients who may exceed their PPS payment.
In addition to selection of patients, facility selection mayalso be an avenue for reducing cost. Facilities with a lower costbase may be able to provide treatment that would result in
similar outcomes without decreasing LOS or intensity of treat-ment.
Other options that should be considered include preparingpatients and their families early in the admission process for ashort LOS if they are admitted directly from inpatient hospi-talization, or to defer rehabilitation until patients can benefitmaximally for rehabilitation. Delaying admission to inpatientrehabilitation or considering more than 1 admission to addressdifferent rehabilitation issues may also need consideration.
To protect small facilities from the financial cost of outliers,facilities may consider investing in reinsurance,11 which is amethod of managing financial risk without institutions beingrequired to maintain a reserve to assure financial solvency.Under the PPS, outlier payments are limited; therefore, facili-ties may avoid treating costly patients or may transfer cases toproviders who cannot avoid treating such patients, which canlead to cost variations not accounted for in PPS. Voluntaryreinsurance, therefore, would allow those facilities with moreoutliers, facilities that are required to treat patients despite thefinancial risk, to manage the risk and maintain solvency.
Rehabilitation for TBI would benefit from the developmentof new, efficient, and efficacious rehabilitation methods thatdecrease the cost of inpatient rehabilitation and the LOS re-quired. In addition, with the continuing decrease in LOS thathas been occurring over the years and the fact that TBI isassociated with long-term deficits, more aggressive efforts arenecessary to develop effective community interventions andsupport for patients with TBI.
It is likely that modification will have to be made to thecurrent inpatient rehabilitation PPS. The CMG weights for TBImay have to be increased, and the adjustment for other factors,such as rural status, may have to be refined. Those who devel-oped the comorbidity tiering system suggest that more severelyinjured patients may have multiple comorbid conditions thatmay significantly increase cost and suggest that further re-search is needed to address how comorbidities are weighted.12
The current list of comorbid diagnoses may not include alldiagnoses that lead to increased costs in rehabilitation popula-tions. Such diagnoses, including depression and substanceabuse, may influence the LOS and course of rehabilitation,especially in patients with TBI, which would lead to increasingcosts.
CONCLUSIONS
The new Medicare payment system may lead to significantunderreimbursement for patients with TBI. These paymentreductions could have a profound, negative effect on the treat-ment of this type of patient. Many rehabilitation facilities willhave to become more efficient when treating these patients orrisk financial losses. Also, Medicare should monitor its pay-ments for patients with TBI and should modify its reimburse-ment patterns to ensure access to inpatient rehabilitation forthose patients who might benefit from it.
Acknowledgments: We are indebted to Anthony Stringer, PhD,Georgia Model Brain Injury System, Emory University, Atlanta, GA,and Tom Novack, PhD, Spain Rehabilitation Center, University ofAlabama, Birmingham, AL, for assisting with the project.
References1. Department of Health and Human Services Center for Medicare
and Medicaid Services. 66 Federal Register 41316 (2001).2. Reynolds M. Final inpatient rehabilitation PPS rule improves on
proposed rule. Healthc Financ Manage 2001;55(10):68-70.
1171PROSPECTIVE PAYMENT AND TBI REHABILITATION, Hoffman
Arch Phys Med Rehabil Vol 84, August 2003
3. Taheri PA, Butz DA, Dechert R, Greenfield LJ. How DRGs hurt aca-demic health systems. J Am Coll Surg 2001;193:1-8; discussion 8-11.
4. Scheffler RM, Clement DG, Sullivan SD, Hu TW, Sung HY. Thehospital response to Medicare’s Prospective Payment System: aneconometric model of Blue Cross and Blue Shield plans. MedCare 1994;32:471-85.
5. Rosenberg M, Browne M. The impact of the inpatient prospectivepayment system and diagnosis-related groups: a survey of theliterature. North Am Actuarial J 2001;5:84-94.
6. Chan L, Koepsell TD, Deyo RA, et al. The effect of Medicare’spayment system for rehabilitation hospitals on length of stay,charges, and total payments. N Engl J Med 1997;337:978-85.
7. TBI Model System Grants. J Head Trauma Rehabil 1999;14(2):189-200.
8. Hamilton BB, Granger CV, Sherwin FS, Zielezny M, Tashman JS.A uniform national data system for medical rehabilitation. In:Fuhrer MJ, editor. Rehabilitation outcomes: analysis and measure-ment. Baltimore: Brookes; 1987. p 137-47.
9. Drummond M, O’Brien B, Stoddart G, Torrance G. Method forthe economic evaluation of health care programmes. 2nd ed.Oxford: Oxford Univ Pr; 1997.
10. Grimaldi P. Inpatient rehabilitation facilities are now paid pro-spective rates. J Health Care Finance 2002;28(3):32-4.
11. Dada M, White W. Evaluating financial risk in the Medicareprospective payment system. Manage Sci 1999;45:316-29.
12. Carter G, Beeuwkes Buntin M, Hayden O, et al. Analyses for theinitial implementation of Medicare’s inpatient rehabilitation pro-spective payment system. Santa Monica: RAND; 2001.
1172 PROSPECTIVE PAYMENT AND TBI REHABILITATION, Hoffman
Arch Phys Med Rehabil Vol 84, August 2003