Embed Size (px)
Citation preview
-1-
Washington State Medicaid Inpatient Reimbursement System Study
Phase 2 Study Methodology Redesign Update
September 26, 2006
-2-
Section 1 » Follow-up On Issues Raised At August 30, 2006 Meeting
Section 2 » Changes To Estimated Medicaid Costs And Updated Preliminary Relative Weights
Section 3 » Analysis Of Cost Per Discharge And Cost Per Day
Section 4 » Conceptual Design Of Proposed Payment Methodology And Preliminary Fiscal Impact Modeling
-3-
Follow-up on Issues Raised at
August 30, 2006 Meeting

-4-
Follow-up on Issues Raised at August 30, 2006 Meeting
Key Issues From Matrix:
• Removing Statistical Outliers
• Treatment of Revenue Code 172 – Intermediate Care
• Chemical Using Pregnant Women Program
• Use of RCC-Based Method/Alternatives for Per Diem Payments
• Psychiatric and Rehabilitation Cases
• Outliers – Fixed Stop Loss v. Multiple of DRG
• Annual Updates to System
-5-
Changes to Estimated Medicaid Costs and Relative
Weights
-6-
Changes to Estimated Medicaid Costs And RWs
Revisions to Treatment of Revenue Code 172:
• Some providers’ reported intermediate nursery as NICU on Medicare cost report
— Neonates with Revenue Code 172 are in these units
— Appropriate to map 172 to NICU in these instances
• Some providers also have 172 in “intensive” NICUs
— Neonate may enter as 174 or 173, then move to 172, but remain in NICU
— Appropriate to map 172 to NICU in these instances

-7-
Changes to Estimated Medicaid Costs and RWs
Provider-Specific Revisions Mapping Revenue Codes For 172:
• Contacted all hospitals with NICUs reported on Medicare cost report
• Contacted most hospitals with Revenue Code 172 that did not report NICU
• Adjusted Revenue Code Crosswalk on facility-specific basis to reflect appropriate matching for Revenue Code 172
-8-
Changes to Estimated Medicaid Costs
Adjustments For Revenue Code 172:• Recalculated relative weights
— Revenue Code 172 changes are only changes affecting new weights
— As expected, only significant changes were to neonatal relative weights
— One new AP-DRG became stable• Also revised cost per discharge and cost per day
amounts to reflect mapping changes
-9-
Analysis of Cost Per Discharge and Cost Per
Day
-10-
Analysis of Cost Per Discharge and Cost Per Day
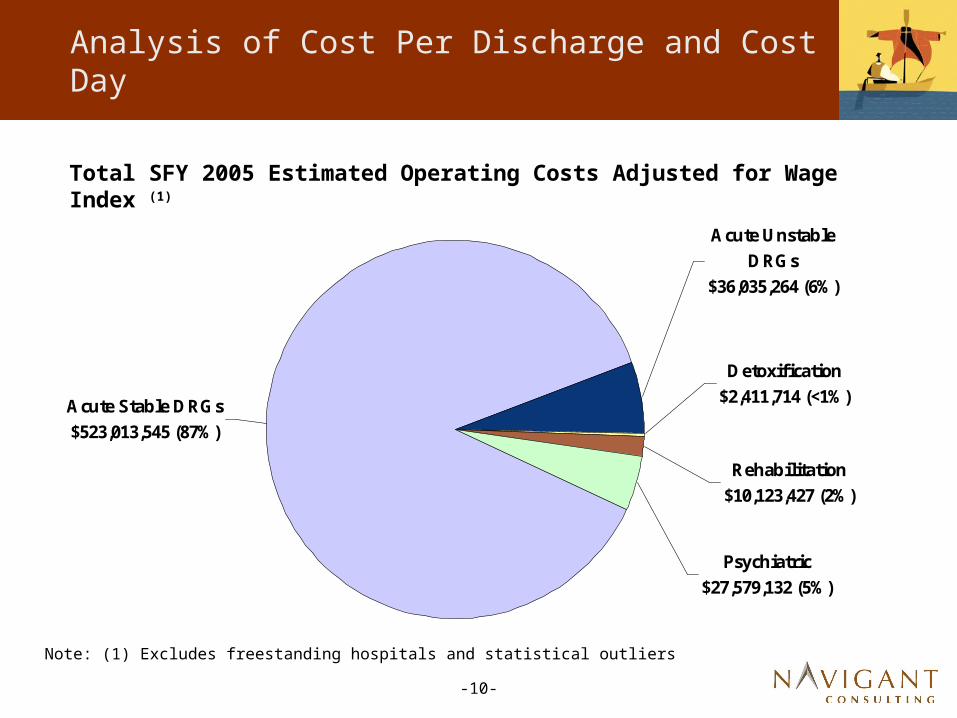
Total SFY 2005 Estimated Operating Costs Adjusted for Wage Index (1)
Acute Stable DRGs $523,013,545 (87%)
Acute Unstable DRGs
$36,035,264 (6%)
Rehabilitation $10,123,427 (2%)
Psychiatric $27,579,132 (5%)
Detoxification $2,411,714 (<1%)
Note: (1) Excludes freestanding hospitals and statistical outliers
-11-
Analysis of Cost Per Discharge and Cost Per Day
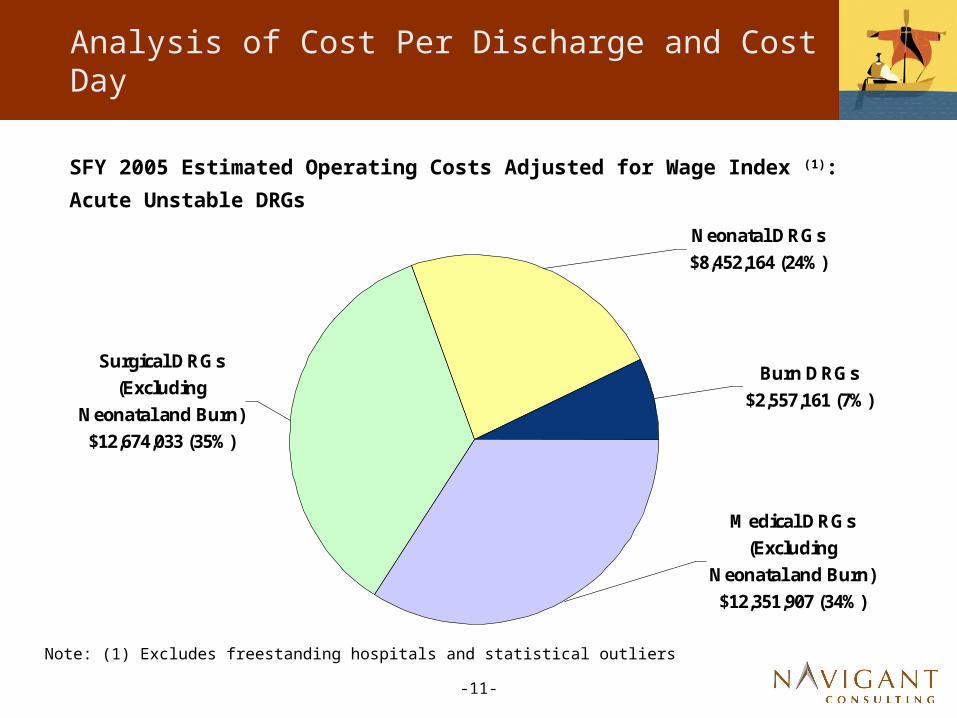
SFY 2005 Estimated Operating Costs Adjusted for Wage Index (1):
Acute Unstable DRGs
Medical DRGs (Excluding
Neonatal and Burn) $12,351,907 (34%)
Burn DRGs $2,557,161 (7%)
Neonatal DRGs $8,452,164 (24%)
Surgical DRGs (Excluding
Neonatal and Burn) $12,674,033 (35%)
Note: (1) Excludes freestanding hospitals and statistical outliers
-12-
Analysis of Cost Per Discharge and Cost Per Day
Acute Stable DRG Cost Per Discharge
• Will serve as basis for DRG conversion factors
• Based on SFY 2005 acute claims from stable DRGs
• Excludes claims determined to be statistical outliers during the DRG relative weight calculation
• Includes FFS and HO claims from in-state acute hospitals and DPUs, excluding Critical Access Hospital and Medicare crossover claims
• Operating costs adjusted for Wage Index, Case Mix Index, and Indirect Medical Education Factor
• Capital costs adjusted for Case Mix Index and Indirect Medical Education
Note: Based on same FFS and HO claims from SFY 2005 that were used for stable relative weight calculations
-13-
Analysis of Cost Per Discharge and Cost Per Day
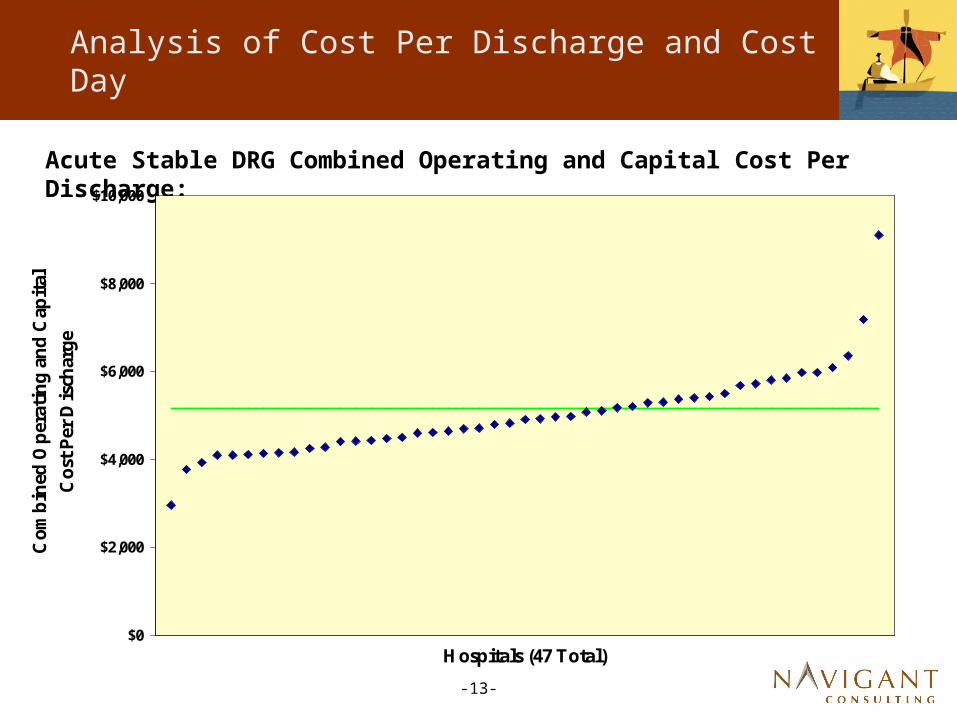
Acute Stable DRG Combined Operating and Capital Cost Per Discharge:
$0
$2,000
$4,000
$6,000
$8,000
$10,000
Hospitals (47 Total)
Com
bin
ed O
per
atin
g an
d C
apital
Cos
t Per
Dis
char
ge
Weighted Average: $5,160.47

-14-
Analysis of Cost Per Discharge and Cost Per Day
Analysis of Claims in Acute Unstable AP-DRGs
• Input from Panel suggested more definition
• Conducted additional analysis of:
— Neonatal
— Burn
— Cranial
— MDC
— Medical AP-DRGs
— Surgical AP-DRGs
— Unstable v. low volume (less than 10 cases)
-15-
Analysis of Cost Per Discharge and Cost Per Day
Analysis of Claims in Acute Unstable AP-DRGs (Con’t)
• Analysis based on SFY 2005 FFS and HO claims from in-state acute hospitals and DPUs, excluding and Critical Access Hospital and Medicare crossover claims
• Claims exclude statistical outliers based on average cost per day (preliminary exclusion was based on cost per discharge, per AP-DRG)
• Operating costs adjusted for Wage Index and Indirect Medical Education Factor
• Capital costs adjusted for Indirect Medical Education Factor
-16-
Analysis of Cost Per Discharge and Cost Per Day
Analysis of Claims in Unstable Neonatal AP-DRGs
• Identified as claims in unstable AP-DRGs in MDC 15
• Total of 113 claims, 3,857 days, ALOS of 34.1 days (FFS and HO)
• 3,805 (99 percent) in 6 hospitals (total of 21 hospitals have claims)
— Children’s, Deaconess, Sacred Heart, Swedish, Tacoma General and University of Washington
• Weighted average cost per day (operating and capital) is $2,072
— Weighted average is $2,068 for the 6 hospitals providing majority of services
— Weighted average of all unstable claims is $1,956

-17-
Analysis of Cost Per Discharge and Cost Per Day
Analysis of Claims in Unstable Burn AP-DRGs
• Identified as claims in unstable AP-DRGs in MDC 22
• Total of 67 claims, 1,130 days, ALOS of 16.9 days (FFS and HO)
• 1,062 (94 percent) at Harborview (total of 13 hospitals have claims)
• Weighted average cost per day (operating and capital) is $1,882
— Harborview cost per day is slightly higher
— Weighted average of all unstable claims is $1,956

-18-
Analysis of Cost Per Discharge and Cost Per Day
Analysis of Claims in Unstable Cranial AP-DRGs
• Identified as claims in AP-DRGs 730, 764 and 765
• Total of 24 claims, 215 days, ALOS of 9.0 days (FFS and HO)
• Claims at 9 different hospitals (10 claims at Harborview)
• Weighted average cost per day (operating and capital) is $2,380
— Harborview cost per day is slightly lower
— Weighted average of all unstable claims is $1,956

-19-
Analysis of Cost Per Discharge and Cost Per Day
Analysis of Claims in Unstable Medical and Surgical AP-DRGs
• Medical AP-DRGs
— Total of 1,010 claims, 6,917 days, ALOS of 6.8 days
— Average cost per day $1,696
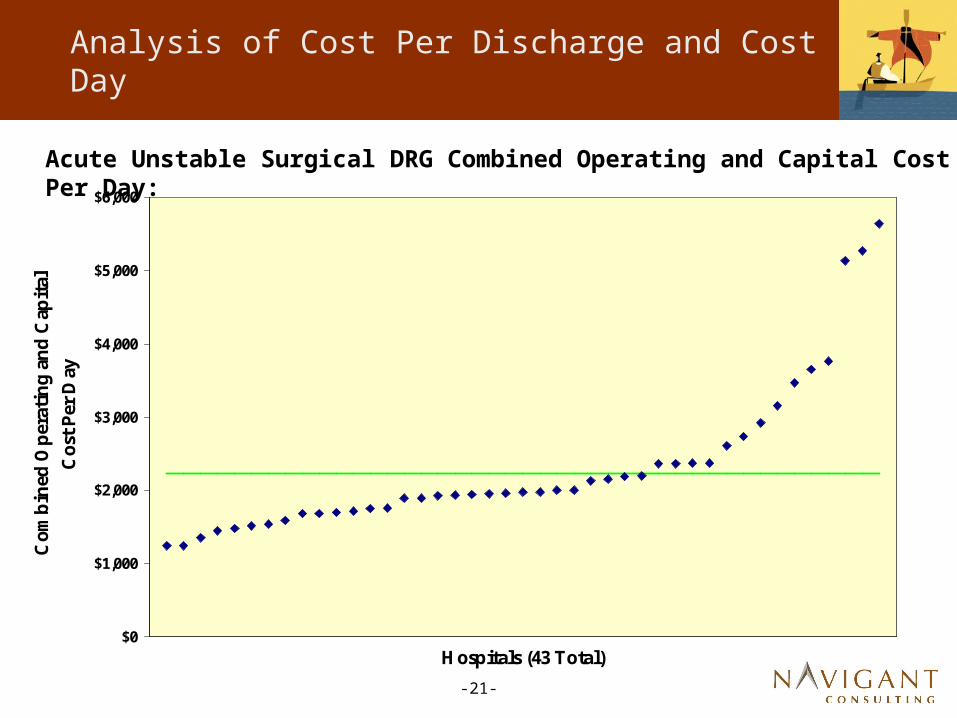
• Surgical AP-DRGs
— Total of 603 claims, 5,264 days, ALOS of 8.7 days
— Average cost per day $2,228
• Above amounts based on FFS and HO claims
• Weighted average of all unstable claims is $1,956

-20-
Analysis of Cost Per Discharge and Cost Per Day
Acute Unstable Medical DRG Combined Operating and Capital Cost Per Day:
$0
$1,000
$2,000
$3,000
$4,000
$5,000
$6,000
Hospitals (47 Total)
Com
bin
ed O
per
atin
g an
d C
apital
Cos
t Per
Day
Weighted Average: $1,695.57
-21-
Analysis of Cost Per Discharge and Cost Per Day
$0
$1,000
$2,000
$3,000
$4,000
$5,000
$6,000
Hospitals (43 Total)
Com
bin
ed O
per
atin
g an
d C
apital
Cos
t Per
Day
Weighted Average: $2,228.25
Acute Unstable Surgical DRG Combined Operating and Capital Cost Per Day:

-22-
Analysis of Cost Per Discharge and Cost Per Day
Psychiatric, Rehabilitation and Detoxification Cost Per Day Amounts
• Will serve as basis for psychiatric payment per diems
• Based on SFY 2005 psychiatric claims
— Psychiatric – AP-DRGs 424 through 432
— Rehabilitation – AP-DRG 462
— Detoxification – AP-DRGs 743 through 751
• Includes FFS and HO claims from in-state acute hospitals and DPUs, excluding Critical Access Hospital and Medicare crossover claims
• Operating costs adjusted for Wage Index and Indirect Medical Education Factor
• Capital costs adjusted for Indirect Medical Education Factor
-23-
Analysis of Cost Per Discharge and Cost Per Day
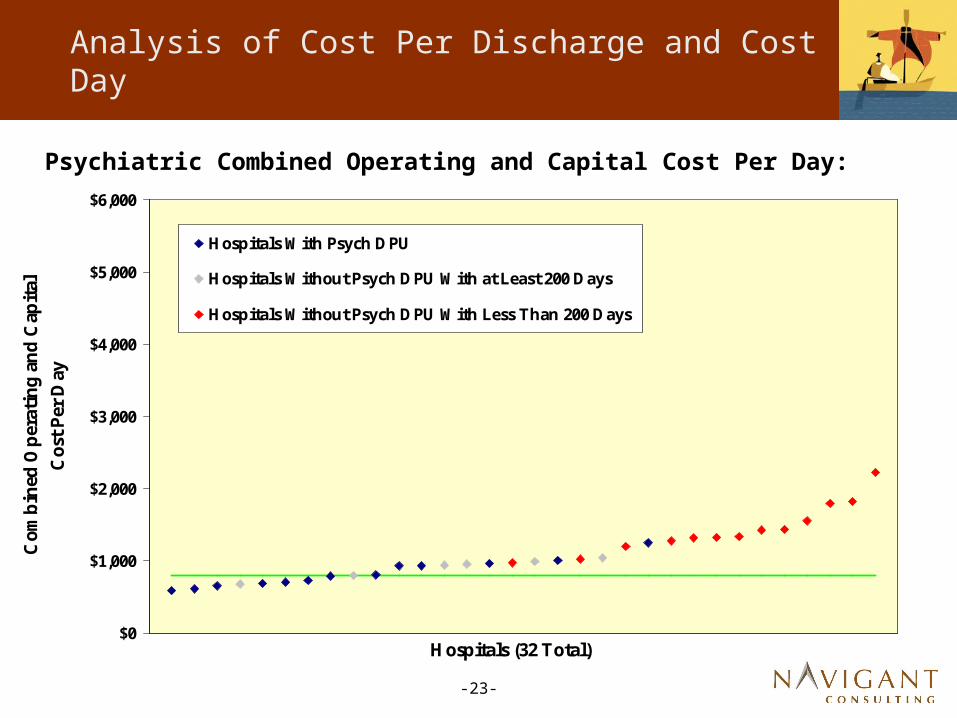
Psychiatric Combined Operating and Capital Cost Per Day:
$0
$1,000
$2,000
$3,000
$4,000
$5,000
$6,000
Hospitals (32 Total)
Com
bin
ed O
per
atin
g an
d C
apital
C
ost Per
Day
Hospitals With Psych DPU
Hospitals Without Psych DPU With at Least 200 Days
Hospitals Without Psych DPU With Less Than 200 Days
Weighted Average: $800.02
-24-
Analysis of Cost Per Discharge and Cost Per Day
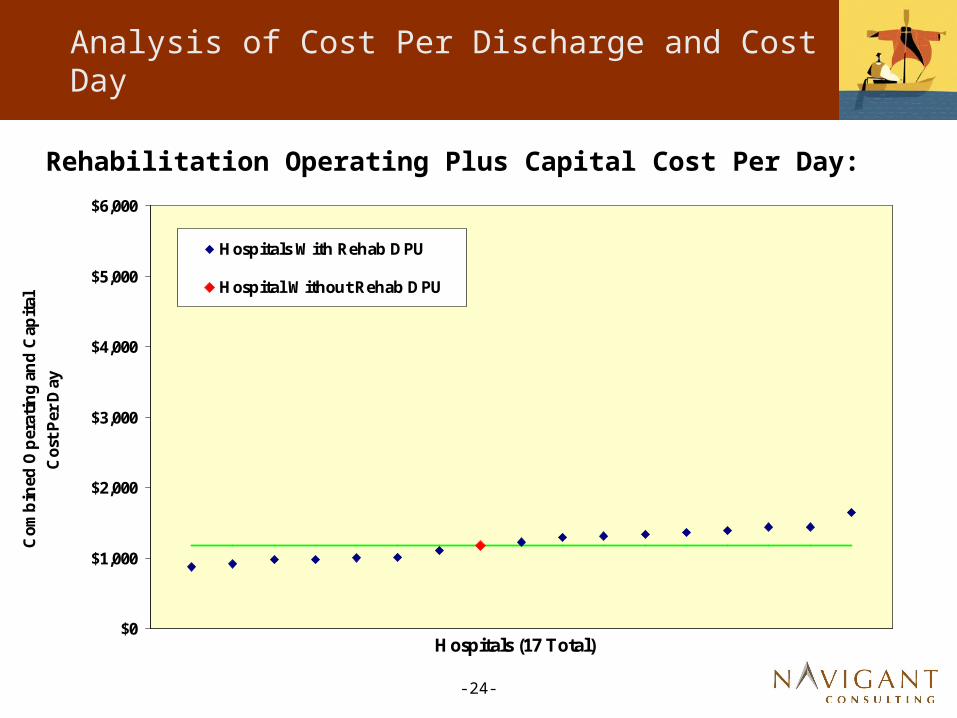
Rehabilitation Operating Plus Capital Cost Per Day:
$0
$1,000
$2,000
$3,000
$4,000
$5,000
$6,000
Hospitals (17 Total)
Com
bin
ed O
per
atin
g an
d C
apital
C
ost Per
Day
Hospitals With Rehab DPU
Hospital Without Rehab DPU
Weighted Average: $1,178.65
-25-
Analysis of Cost Per Discharge and Cost Per Day
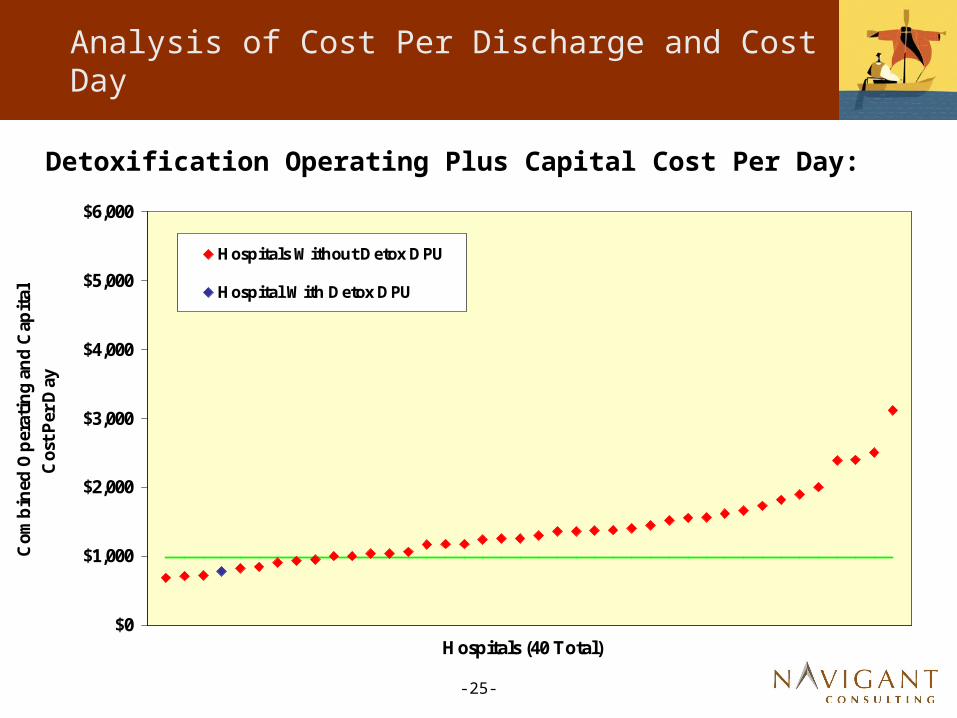
Detoxification Operating Plus Capital Cost Per Day:
$0
$1,000
$2,000
$3,000
$4,000
$5,000
$6,000
Hospitals (40 Total)
Com
bin
ed O
per
atin
g an
d C
apital
C
ost P
er D
ay
Hospitals Without Detox DPU
Hospital With Detox DPU
Weighted Average: $974.15
-26-
Conceptual Design And Discussion Of Preliminary Impact Modeling Process
-27-
Conceptual Design
Key Elements
• AP-DRG Payments
• Per Diem Payments
• Outlier Payments
• Transfer Cases
• Payments For Specialty Cases
• Budget Neutrality
• Periodic Updates

-28-
Conceptual Design
AP-DRG Payments
• Cost-based Relative Weights – Based On SFY04/05 FFS And HO Data
• Statewide Operating/Capital Conversion Factor
— Based On Costs Of SFY 2005 FFS and HO Claims That Comprise Stable DRGs
— Weighted Average Cost Per Discharge
— Costs Adjusted For CMI, Regional Wage Differences And Indirect Medical Education
• Facility-Specific Adjustments To Statewide Conversion Factor
— Wage Adjustment
— Indirect And Direct Medical Education
— Inflation To Midpoint Of SFY 2008

-29-
Conceptual Design
Per Diem Payments
• Unstable Neonatal – Statewide Weighted Average
• Unstable Burns – Harborview Cost Per Diem
• Unstable Medical AP-DRG – Statewide Weighted Average
• Unstable Surgical AP-DRG Statewide – Weighted Average
-30-
Conceptual Design
Per Diem Payments (Continued)
• Psychiatric – Facility Specific For:
— All Claims In Free-Standing Psychiatric Hospitals
— All Psychiatric Claims For Hospitals With Psychiatric DPUs, Or More Than 200 Psychiatric Days In 2005
— Other Psychiatric Claims – Statewide Weighted Average Of Above Hospitals
• Medical Rehabilitation – Statewide Weighted Average
— Free-Standing Rehab – Facility Specific Rate
• Detoxification – Statewide Weighted Average
-31-
Conceptual Design
Per Diem Payments (Continued)
• Revised Cost Per Day Calculations Exclude Statistical Outliers (3 Standard Deviations) Based On Cost Per Day, For Each Category (Psychiatric, Rehabilitation, Neonatal, Etc.)
• All Statewide Weighted Average Amounts Based On SFY 2005 Costs, Adjusted For Wages And Indirect Medical Education
• Per Diem Rates Will Reflect Facility-Specific Wage Adjustments And Indirect And Direct Medical Education
-32-
Conceptual Design
Outlier Payments – AP-DRG Cases
• Outlier Threshold Is AP-DRG Payment Plus Stop Loss Threshold Amount (Preliminary Impacts Use $25,000 And $35,000)
• Outlier Payments Are 80% Of Estimated Costs Exceeding Outlier Threshold (90% For Burns)
• Estimated Costs Are Based On CCR Calculated From SFY2005 Medicaid Claims
-33-
Conceptual Design
Outlier Payments – Per Diem Cases
• Outlier Threshold Is Per Diem Payment Amount Plus Stop Loss Threshold (Preliminary Analyses Uses $25,000)
• Outlier Payment Is 80% Of Estimated Costs Exceeding Outlier Threshold (90% For Burns)
• Estimated Costs Is Based On CCR Calculated From SFY 2005 Medicaid Claims

-34-
Conceptual Design
AP-DRG Transfer Cases
• Will Follow Medicare Methodology For Transfers – Adding One Day To Per Diem Calculation
• Will Not Follow Post Acute Transfer Policy
-35-
Conceptual Design
Periodic Updates To Rates
• Recommend Annual Evaluation And Update
— Consider Increase In Rates For Inflation - CMS PPS Input Price Index
— Modify Outlier Thresholds, If Necessary
— Other Considerations (State Budget Constraints, Legislative Action, etc.)
• Recommend Rebasing Every Three Years
— Update Rates And Relative Weights Using New Cost And Claims Data
— Consider Modifications To Methodology, If Necessary

-36-
Fiscal Impact Modeling and
Budget Neutrality

-37-
Fiscal Impact Modeling and Budget Neutrality
Fiscal Impact Modeling
• Impact model incorporates preliminary relative weights, conversion factors and per diem rates to project DRG and per diem payments with outlier provisions
• SFY 2005 FFS claims from in-state hospitals, excluding Critical Access Hospital and Medicare crossover claims
• Provides individual hospital and state aggregate payments and estimated costs

-38-
Fiscal Impact Modeling and Budget Neutrality
Budget Neutrality
• Budget neutrality is a legislative requirement
• State aggregate payments under the proposed payment methodology must be equal to state aggregate SFY 2005 FFS payments trended forward to SFY 2008 based on the Forecast Trend Factor
• Forecast Trend Factor to be developed by HRSA Forecast Office staff and reviewed by other state agency staff from the DSHS Budget Office, Office of Finance Management and the legislative staff
-39-
Preliminary Impact Model
Assumptions:
• Estimated Budget Forecast Increase From 2005 to 2008 is 16%, Based On Our Review Of Increases In Phase 1 Analysis
— Actual Number To Come From HRSA Forecast Office In October
• Inflation Applied To Estimated Costs For Same Period Based On CMS Input Price Index:
— Operating – 11.2%
— Capital – 2.8%
• Resulting Estimated Cost Coverage, In Aggregate (And Target For Each Component) Is 95%

-40-
Preliminary Impact Model
Preliminary Results For DRG Payment
• Assuming Outlier Stop Loss At $25,000
— Standardized Operating Conversion Factor - $4,215
— Standardized Capital Rate - $383
— Combined Conversion Factor - $4,598
— Budget Neutrality Factor – 89.1%
— Outlier Payments Estimated To Be 13.7% Of DRG-Based Payments

-41-
Preliminary Impact Model
Preliminary Results For DRG Payment (Con’t)
• Assuming Outlier Stop Loss At $35,000
— Standardized Operating Conversion Factor - $4,319
— Standardized Capital Rate - $393
— Combined Conversion Factor - $4,712
— Budget Neutrality Factor – 92%
— Outlier Payments Estimated To Be 9.6% Of DRG-Based Payments

-42-
Preliminary Impact Model
Open Items To Be Addressed
• Treatment For Seattle Cancer Care Alliance
• Case Rates For Transplant Services
• Case Rates For Bariatric Surgery Cases

-43-
Questions?