Embed Size (px)
Citation preview
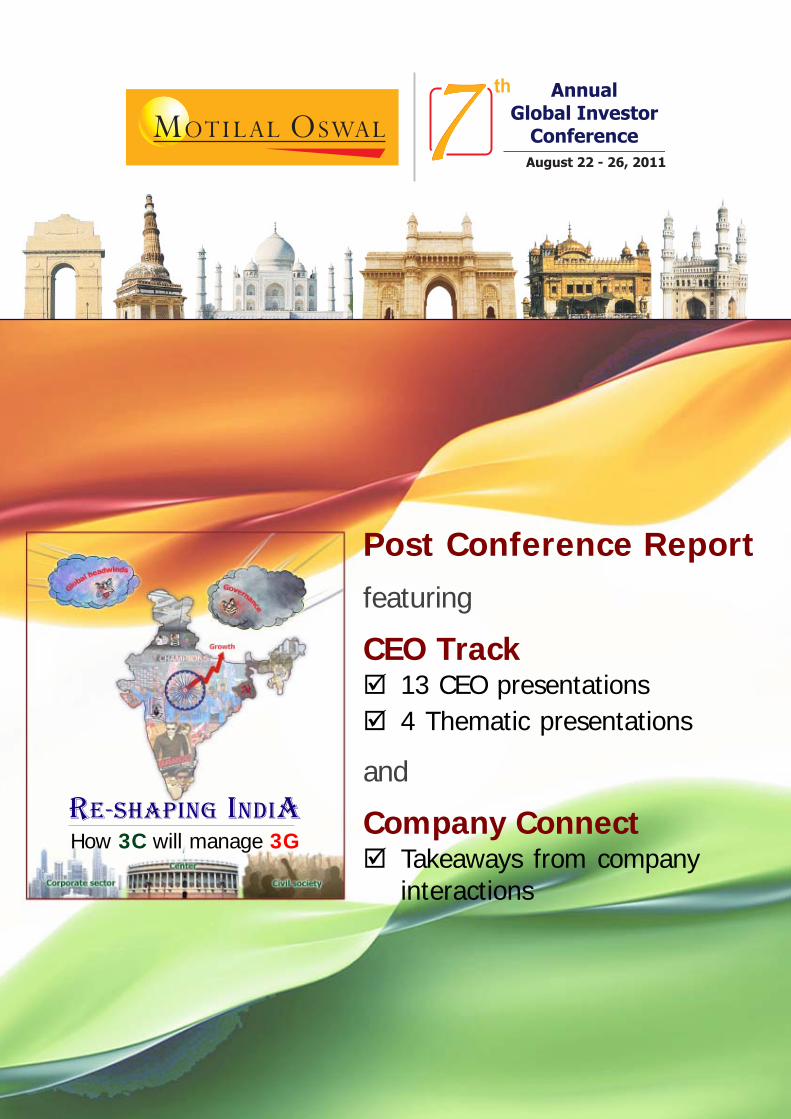
Post Conference Reportfeaturing
CEO Track 13 CEO presentations 4 Thematic presentations
and
Company Connect Takeaways from company
interactions
RE-SHAPING INDIAHow 3C will manage 3G
7th Annual Global Investor Conference
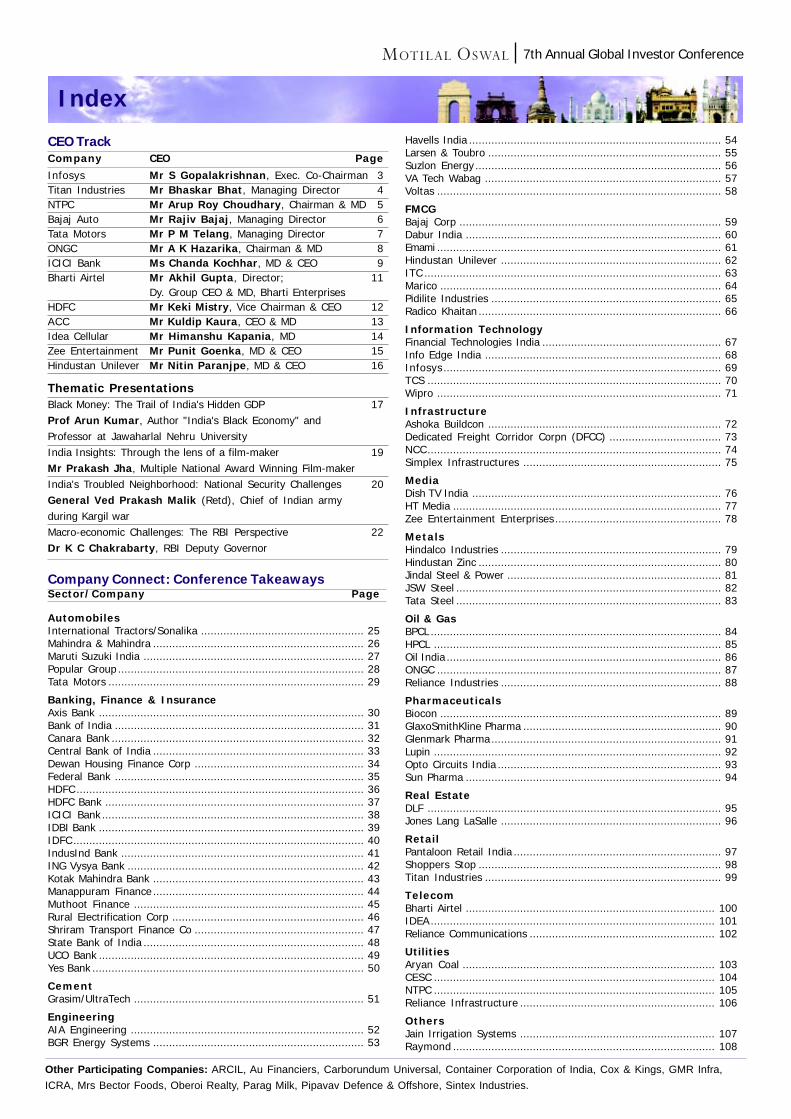
Index
CEO TrackCompany CEO Page
Infosys Mr S Gopalakrishnan, Exec. Co-Chairman 3Titan Industries Mr Bhaskar Bhat, Managing Director 4NTPC Mr Arup Roy Choudhary, Chairman & MD 5Bajaj Auto Mr Rajiv Bajaj, Managing Director 6Tata Motors Mr P M Telang, Managing Director 7ONGC Mr A K Hazarika, Chairman & MD 8ICICI Bank Ms Chanda Kochhar, MD & CEO 9Bharti Airtel Mr Akhil Gupta, Director; 11
Dy. Group CEO & MD, Bharti EnterprisesHDFC Mr Keki Mistry, Vice Chairman & CEO 12ACC Mr Kuldip Kaura, CEO & MD 13Idea Cellular Mr Himanshu Kapania, MD 14Zee Entertainment Mr Punit Goenka, MD & CEO 15Hindustan Unilever Mr Nitin Paranjpe, MD & CEO 16
Thematic PresentationsBlack Money: The Trail of India's Hidden GDP 17Prof Arun Kumar, Author "India's Black Economy" andProfessor at Jawaharlal Nehru UniversityIndia Insights: Through the lens of a film-maker 19Mr Prakash Jha, Multiple National Award Winning Film-makerIndia's Troubled Neighborhood: National Security Challenges 20General Ved Prakash Malik (Retd), Chief of Indian armyduring Kargil warMacro-economic Challenges: The RBI Perspective 22Dr K C Chakrabarty, RBI Deputy Governor
Company Connect: Conference TakeawaysSector/Company Page
AutomobilesInternational Tractors/Sonalika ................................................... 25Mahindra & Mahindra .................................................................. 26Maruti Suzuki India ..................................................................... 27Popular Group ............................................................................. 28Tata Motors ................................................................................ 29
Banking, Finance & InsuranceAxis Bank ................................................................................... 30Bank of India .............................................................................. 31Canara Bank ............................................................................... 32Central Bank of India .................................................................. 33Dewan Housing Finance Corp ..................................................... 34Federal Bank .............................................................................. 35HDFC .......................................................................................... 36HDFC Bank ................................................................................. 37ICICI Bank .................................................................................. 38IDBI Bank ................................................................................... 39IDFC ........................................................................................... 40IndusInd Bank ............................................................................ 41ING Vysya Bank .......................................................................... 42Kotak Mahindra Bank .................................................................. 43Manappuram Finance .................................................................. 44Muthoot Finance ........................................................................ 45Rural Electrification Corp ............................................................ 46Shriram Transport Finance Co ..................................................... 47State Bank of India ..................................................................... 48UCO Bank ................................................................................... 49Yes Bank ..................................................................................... 50
CementGrasim/UltraTech ........................................................................ 51
EngineeringAIA Engineering ......................................................................... 52BGR Energy Systems .................................................................. 53
Havells India ............................................................................... 54Larsen & Toubro ......................................................................... 55Suzlon Energy ............................................................................. 56VA Tech Wabag .......................................................................... 57Voltas ......................................................................................... 58
FMCGBajaj Corp .................................................................................. 59Dabur India ................................................................................ 60Emami ......................................................................................... 61Hindustan Unilever ..................................................................... 62ITC ............................................................................................. 63Marico ........................................................................................ 64Pidilite Industries ........................................................................ 65Radico Khaitan ............................................................................ 66
Information TechnologyFinancial Technologies India ........................................................ 67Info Edge India .......................................................................... 68Infosys ....................................................................................... 69TCS ............................................................................................ 70Wipro ......................................................................................... 71
InfrastructureAshoka Buildcon ......................................................................... 72Dedicated Freight Corridor Corpn (DFCC) ................................... 73NCC............................................................................................ 74Simplex Infrastructures .............................................................. 75
MediaDish TV India .............................................................................. 76HT Media .................................................................................... 77Zee Entertainment Enterprises .................................................... 78
MetalsHindalco Industries ..................................................................... 79Hindustan Zinc ............................................................................ 80Jindal Steel & Power ................................................................... 81JSW Steel ................................................................................... 82Tata Steel ................................................................................... 83
Oil & GasBPCL ........................................................................................... 84HPCL .......................................................................................... 85Oil India ...................................................................................... 86ONGC ......................................................................................... 87Reliance Industries ..................................................................... 88
PharmaceuticalsBiocon ........................................................................................ 89GlaxoSmithKline Pharma .............................................................. 90Glenmark Pharma........................................................................ 91Lupin .......................................................................................... 92Opto Circuits India ...................................................................... 93Sun Pharma ................................................................................ 94
Real EstateDLF ............................................................................................ 95Jones Lang LaSalle ..................................................................... 96
RetailPantaloon Retail India ................................................................. 97Shoppers Stop ............................................................................ 98Titan Industries .......................................................................... 99
TelecomBharti Airtel .............................................................................. 100IDEA ......................................................................................... 101Reliance Communications .......................................................... 102
UtilitiesAryan Coal ............................................................................... 103CESC ........................................................................................ 104NTPC ........................................................................................ 105Reliance Infrastructure ............................................................. 106
OthersJain Irrigation Systems ............................................................. 107Raymond .................................................................................. 108
Other Participating Companies: ARCIL, Au Financiers, Carborundum Universal, Container Corporation of India, Cox & Kings, GMR Infra,
ICRA, Mrs Bector Foods, Oberoi Realty, Parag Milk, Pipavav Defence & Offshore, Sintex Industries.
7th Annual Global Investor Conference
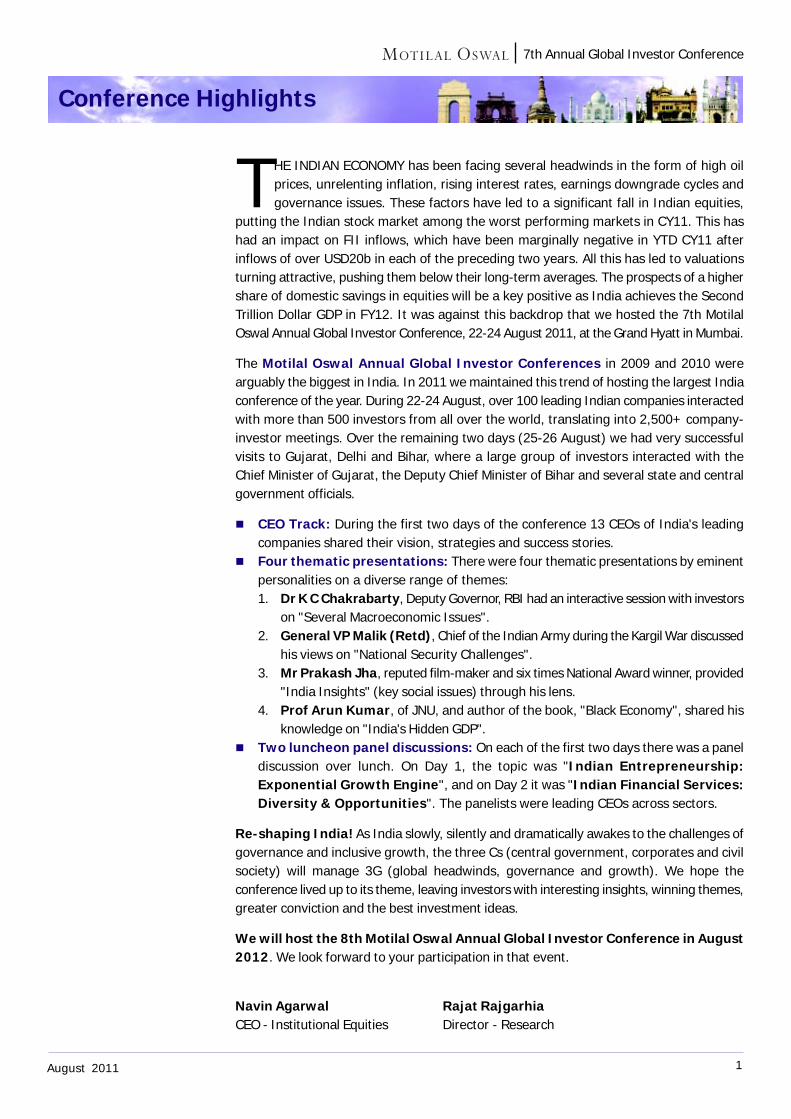
THE INDIAN ECONOMY has been facing several headwinds in the form of high oilprices, unrelenting inflation, rising interest rates, earnings downgrade cycles andgovernance issues. These factors have led to a significant fall in Indian equities,
putting the Indian stock market among the worst performing markets in CY11. This hashad an impact on FII inflows, which have been marginally negative in YTD CY11 afterinflows of over USD20b in each of the preceding two years. All this has led to valuationsturning attractive, pushing them below their long-term averages. The prospects of a highershare of domestic savings in equities will be a key positive as India achieves the SecondTrillion Dollar GDP in FY12. It was against this backdrop that we hosted the 7th MotilalOswal Annual Global Investor Conference, 22-24 August 2011, at the Grand Hyatt in Mumbai.
The Motilal Oswal Annual Global Investor Conferences in 2009 and 2010 werearguably the biggest in India. In 2011 we maintained this trend of hosting the largest Indiaconference of the year. During 22-24 August, over 100 leading Indian companies interactedwith more than 500 investors from all over the world, translating into 2,500+ company-investor meetings. Over the remaining two days (25-26 August) we had very successfulvisits to Gujarat, Delhi and Bihar, where a large group of investors interacted with theChief Minister of Gujarat, the Deputy Chief Minister of Bihar and several state and centralgovernment officials.
CEO Track: During the first two days of the conference 13 CEOs of India's leadingcompanies shared their vision, strategies and success stories.
Four thematic presentations: There were four thematic presentations by eminentpersonalities on a diverse range of themes:1. Dr K C Chakrabarty, Deputy Governor, RBI had an interactive session with investors
on "Several Macroeconomic Issues".2. General VP Malik (Retd), Chief of the Indian Army during the Kargil War discussed
his views on "National Security Challenges".3. Mr Prakash Jha, reputed film-maker and six times National Award winner, provided
"India Insights" (key social issues) through his lens.4. Prof Arun Kumar, of JNU, and author of the book, "Black Economy", shared his
knowledge on "India's Hidden GDP". Two luncheon panel discussions: On each of the first two days there was a panel
discussion over lunch. On Day 1, the topic was "Indian Entrepreneurship:Exponential Growth Engine", and on Day 2 it was "Indian Financial Services:Diversity & Opportunities". The panelists were leading CEOs across sectors.
Re-shaping India! As India slowly, silently and dramatically awakes to the challenges ofgovernance and inclusive growth, the three Cs (central government, corporates and civilsociety) will manage 3G (global headwinds, governance and growth). We hope theconference lived up to its theme, leaving investors with interesting insights, winning themes,greater conviction and the best investment ideas.
We will host the 8th Motilal Oswal Annual Global Investor Conference in August2012. We look forward to your participation in that event.
Navin Agarwal Rajat RajgarhiaCEO - Institutional Equities Director - Research
Conference Highlights
1August 2011
7th Annual Global Investor Conference
CEO Track
2August 2011
Company/Thematic presentations
Company/CEO
Infosys Mr S Gopalakrishnan, Executive Co-Chairman
Titan Industries Mr Bhaskar Bhat, Managing Director
NTPC Mr Arup Roy Choudhary, Chairman & Managing Director
Bajaj Auto Mr Rajiv Bajaj, Managing Director
Tata Motors Mr P M Telang, Managing Director
ONGC Mr A K Hazarika, Chairman & Managing Director
ICICI Bank Ms Chanda Kochhar, MD & CEO
Bharti Airtel Mr Akhil Gupta, Director;
Deputy Group CEO & MD, Bharti Enterprises
HDFC Mr Keki Mistry, Vice Chairman & CEO
ACC Mr Kuldip Kaura, CEO & Managing Director
Idea Cellular Mr Himanshu Kapania, Managing Director
Zee Entertainment Mr Punit Goenka, MD & CEO
Hindustan Unilever Mr Nitin Paranjpe, MD & CEO
Thematic presentations
Black Money: The Trail of India's Hidden GDPProf Arun Kumar, Author "India's Black Economy"and Professor at Jawaharlal Nehru University
India Insights: Through the lens of a film-makerMr Prakash Jha, Multiple National Award Winning Film-maker
India's Troubled Neighborhood: How Much to WorryGeneral Ved Prakash Malik (Retd), Chief of Indian army during Kargil war
Macro-economic Challenges: The RBI PerspectiveDr K C Chakrabarty, RBI Deputy Governor
3August 2011
7th Annual Global Investor Conference
Infosys
Key Takeaways
Core essence: Any impact of global headwinds on the industry will only persist in theshort run; growth rates are likely to sustain over the medium to long term.
Industry insights Compared to 2008, businesses are better prepared now to respond to any global
meltdown. Companies had already braced themselves for a slow, gradual recoveryrather than a quick turnaround. Macro-led impact on business will be short-lived.The long-term picture is positive, given new areas of opportunity.
The industry will continue to witness double-digit growth over the medium to longterm, given multiple levers around new markets and new solutions.
Company vision and strategy Focus to return to clients after restructuring: Infosys is prepared to cater to
the next wave of growth in the industry. With the restructuring process behind,focus will be fully channelized to the clients.
To be more relevant to clients: The company will look to be more relevant toclients in trying to help them build tomorrow's enterprises by focusing on themesaround which the clients will seek growth: [1] emerging markets, [2] sustainability,[3] mobility, [4] healthcare, and [5] social networking.
Focus on Consulting and Non-linear growth: Infosys intends to continue focusingon the Consulting/SI segment (~30% of revenue) and growth in the Non-linearsegment will be a thrust area. Revenue from platform-based/Cloud streams maybe small to start with, but afford greater visibility over the long run. The companycurrently derives ~8.5% of its revenue from the Non-linear segment.
Productivity improvement to be the focus in Operations segment: Theglobal delivery model offers little scope for differentiation. Business IT Services(ADM, BPO, IMS; ~61% of revenue), will struggle to see higher growth in rates.Here, Infosys will try to leverage technology to increase revenue productivity.
Key triggers/milestones/challenges ~25% of Infosys' clients and ~50% of its top-50 accounts engage with the company
in Consulting/SI services. Infosys' SI component involves very little pass-throughs,differentiating it from competition and helping it to achieve superior revenue quality.
As employee costs continue to grow by 8-12% every year, Infosys will need to de-link its revenue growth from employee growth, by focusing on non-linear revenues.
The company continues to expand its global delivery network by penetrating intocountries like China, Germany, France, Mexico, Brazil and Costa Rica.
While Infosys will be hiring more employees onsite, lower utilization at onsite couldimpact its margins. It will seek to achieve this by increasing the Consulting/SIengagements onsite, where utilization is typically lower.
Mr S Gopalakrishnan is theExecutive Co-Chairman of Infosys.Before assuming his current office inJuly 2007, he served as Infosys' ChiefOperating Officer, President andJoint Managing Director, responsiblefor customer services, technology,investments and acquisitions.
One of the founders of the company,Mr Gopalakrishnan served as Director(Technical) and his initialresponsibil it ies included themanagement of design,development, implementation, andsupport of information systems forclients in the consumer productsindustry in the US.
Mr Gopalakrishnan has representedInfosys and India in internationalforums such as: The Indo-US CEOCouncil, President's Council of NewYork Academy of Sciences, andMember of UNESCO High Level Panelon Women's Empowerment andGender Equity. He is Chairman of TheBusiness Action for SustainableDevelopment 2012 (BASD), acoalition of international businessgroups committed to sustainabledevelopment. In January 2011, theGovernment of India awarded MrGopalakrishnan the Padma Bhushan,India's third highest civilian honor.
Covering Analyst(s):Ashish Chopra+91 22 3982 [email protected]
CEO Track
Mr S GopalakrishnanExecutive Co-ChairmanInfosys
4August 2011
7th Annual Global Investor Conference
Key Takeaways
Core essence: Titan Industries is best placed to capture the growing demand in theIndian lifestyle consumption space, led by rising income levels and demographic dividend. Industry insights There are nearly 25 luxury watch brands in India, but only a few brands in the mid
segment are highly profitable. India does not have any large established jewelry brands as against quite a few in
China. This increases the attractiveness of the Indian market. The Eyewear business offers huge opportunity to change in a large and under-
serviced market. In Jewelry, Titan has ~5% market share, led by migration from small and local
players; 60% of its customers are repeat customers. Company vision and strategy Sales likely to touch INR140b by FY15; Jewelry sales likely to be INR100b. Helios is likely to be a key growth driver in Watches; being the only format by any
brand owner globally, selling watches of other brands. Titan plans to have 100stores in two years and lead the development of the premium and luxury watchmarket in India.
Titan plans to play across the value chain, from manufacturing to branding to retailing,so as to capture the value at every end.
Titan has 177 Eyewear stores and plans to increase these to 300 in another twoyears. Its long-term plan is to take the number of its stores to levels similar to USeyewear retailers that have even 1,500 stores.
The company does not have any plans to sell watches in developed markets due tolow growth and profitability.
Key triggers/milestones/challenges Titan is cautious on near-term demand due to rising interest rates - while demand
growth in Jewelry is intact, demand for watches might suffer. Overall growth ratesin 2Q are lower, post unprecedented high growth in 1QFY12.
The company is positive on demand in the premium end, as LTL sales growth ofwatches in departmental stores has increased by 26%.
The company plans to end the current year with sales exceeding INR1b for PrecisionEngineering, with positive bottomline contribution.
Titan Industries
Mr Bhaskar Bhat is the ManagingDirector of Titan Industries. He hasbeen associated with the Tata WatchProject, which later became TitanWatches Limited, and is now TitanIndustries Limited, since 1983.
He is a BTech (MechanicalEngineering) from IIT Madras (1976)and completed his Post GraduateDiploma in Management from IIMAhmedabad (1978). Most of hisworking experience has been in sales& marketing. He started work as aManagement Trainee at Godrej &Boyce in 1978. After spending fiveyears there, he joined the TataWatch Project, which was initiatedat Tata Press Limited. He has handledsales & marketing, HR, internationalbusiness and general managerialassignments at Titan, and becameManaging Director in April 2002.
Mr Bhat is a member of the GoverningCouncil at the TA Pai ManagementInstitute, Manipal and the SDMInstitute of Management andDevelopment, Mysore. He wasappointed Chairperson of the Boardof Governors at the NationalInstitute of Technology establishedin Uttarakhand. He is also Directorat Virgin Mobile India Limited, a jointventure of Tata Teleservices and theVirgin Group, UK.
CEO Track
Covering Analyst(s):Amnish Aggarwal+91 22 3982 [email protected]
Harit Kapoor+91 22 3029 [email protected]
Mr Bhaskar BhatManaging DirectorTitan Industries
5August 2011
7th Annual Global Investor Conference
NTPC
Key Takeaways
Core essence: Converting challenges into opportunities; capacity addition of 93GWover the next 20 years v/s 35GW in the past 35 years.
Industry insights Energy demand in India has grown at a CAGR of 5.5%, vs average GDP growth of
7% over FY03-11. Over FY11-17E, demand grow expected at 7.5%. The Transmission and Distribution (T&D) sector needs high focus, given ~28.5% of
AT&C losses, limited open access, and high SEB losses. India produced 490mtpa of coal, with proved reserves of 106b tons v/s 2761mtpa
production by China, with proved reserves of 110b tons. Financing of new projects, equipment supplies (lead time) and statutory clearances
are key execution bottlenecks
Company vision and strategy 93GW addition over next 20 years, 30GW in next 5 years: NTPC plans to
attain capacity of 128GW by 2032, an addition of 93GW over the next 20 years v/s35GW in the past 35 years. Target to reach 67GW of installed capacity by FY17(30GW in 5 years). 40GW of projects are under various stages of execution.
Multi-pronged approach to overcome challenges: Key initiatives taken include:(a) bulk tendering, (b) delegation of power to enable quick decision, (c) projectmonitoring cell at corporate office, (d) limited notice to proceed to project constructionadopted, and (e) land acquisition cell established at the corporate center.
Insulating fuel risk: FY12 coal requirement of 164m tons will be met from domesticlinkages (135m tons), bilateral contracts (5m tons) and imports (23m tons), indicatingblending of 14%. Long-term coal supply is being augmented by (a) pursuing linkagesfor new projects, (b) developing captive coal mines - target to produce 47mtpa byFY17, and (c) acquisition of coal blocks overseas /LT imports.
Key triggers/milestones/challenges Bulk tendering: Plans to conclude ordering by end FY12 would help improve visibility
on 12th Plan period capacity addition. Captive coal block: NTPC is pursuing restoration of de-allocated coal blocks with
the help of Ministry of Power and continuing development on blocks. Plans to produce2.3m tons of coal from Pakri Barwadih mines in FY13.
Payment security high: NTPC has been receiving 100% of dues from the customerfor eight successive years, as it is covered under tri-partite agreement till 2016.
Capacity to drive efficiency/profitability: Man/MW ratio has gone down from0.89x in FY07 to 0.77x in FY11, while PAT/employee has improved from INR29m inFY07 to INR38m in FY11. Man/MW ratio would further decline to 0.5x.
Covering Analyst(s):Satyam Agarwal+91 22 3982 [email protected]
Nalin Bhatt+91 22 3982 5429Nalin [email protected]
Vishal Periwal+91 22 3982 [email protected]
Mr Arup Roy Choudhury isChairman and Managing Director ofNTPC. Since he assumed this officeon 1 September 2010, he has takenseveral steps to make NTPC a world-class organization. Mr RoyChoudhury has worked in prominentpublic and private sector companiessince 1979. He became the youngestCEO of a Central Public SectorEnterprise (CPSE) at the age of 44years when he joined NationalBuildings Construction CorporationLimited on 3 April 2001 as Chairmanand Managing Director. He is agraduate in Civil Engineering fromBirla Institute of Technology, Mesraand a Post Graduate in Managementand Systems from IIT Delhi.
Mr Roy Choudhury is Chairman, forthe second consecutive term,commencing April 2011, of theStanding Conference of PublicEnterprises, the apex forum of theCentral Public Sector Enterprises inIndia and a permanent invitee on theBoard of Reconstruction of PublicSector Enterprises, a forum engagedin turning around underperformingCPSEs.
CEO TrackMr Arup Roy ChoudhuryChairman & Managing DirectorNTPC
6August 2011
7th Annual Global Investor Conference
Bajaj Auto
Key Takeaways
Core essence: Create a market position, rather than chase a slice of the existingmarket. Lead with the right brand and the brand will lead you.
Industry insightsFocus on 4P's: The motorcycle industry can be understood on 4Ps - Position, Product,Performance and Price. Product differentiation can be limited, performance is a given,and market drives pricing. Thus, only controlable factor is positioning of the product.On new competition: Difficult to comment till Honda's product launch plans are known.However, as media reports suggest, its probability of success would be limited if theirlow cost 100cc bike targets existing products. Honda's past launches of 4-5 motorcycleswere not successful (except Honda Shine), as targeted towards existing segment.
Company vision and strategyContinued focus on segment creation in domestic market: It continues to focuson creating new segments in the domestic market, based on the principle that curiosityexcites and not familiarity. Its to-be-launched Boxer 150cc is aimed at creating a newsegment in rural markets, with high performance but plain looks and a very competitiveprice of ~INR42,000 as very few parts are different from its existing product.Adaptation and specialization: It believes in adaptation. It has adapted to an evolvingmarket, where it lost its dominance in scooters, by specializing in motorcycles andsacrificing its plant and retrenching people. It spent ~INR10b to close the plant andoffer VRS. Its specialization in motorcycles has enabled it to align its back-end andfront-end to leverage its product platform, driving smart recovery in performance.Region-specific export strategy: It started with exports to neighboring marketsthat were similar to India, like the ASEAN market and then explored similar markets likeIndonesia, which were more competitive. In Indonesia, it tied up with Kawasaki toleverage its distribution network to sell Pulsar and Discover. For the African market,where it faces Chinese competition, it is engaging an offense strategy of creating brandsand selling at premium, which has enabled it to become the market leader. To penetratemore evolved market like Brazil, it plans to use KTM's brand and network.
Key triggers/milestones/challengesFour-wheeler launch in FY13; not focused on cars: Its four-wheeler project, whichstarted as an ultra-low cost car in partnership with Renault-Nissan, has evolved fromthe skill sets and cost structure of a two/three-wheeler maker. While it did not discloseits strategy for four-wheelers, it plans to to evolve its three-wheelers to four-wheelers.Leveraging KTM investment: It plans to align KTM's frontend and Bajaj's backend topenetrate Brazil & other developed markets. It has initiated production of KTM 125cc inIndia and plans to export ~12,000 units in FY12.
Covering Analyst(s):Jinesh K Gandhi+91 22 3982 [email protected]
Mansi Varma+91 22 3982 [email protected]
Mr Rajiv Bajaj, Managing Directorof Bajaj Auto, graduated first in class,with distinction, in MechanicalEngineering from the University ofPune in 1988, and then completedhis masters in ManufacturingSystems Engineering, withdistinction, from the University ofWarwick in 1990.
He has since worked at Bajaj Auto inthe areas of manufacturing andsupply chain (1990-95), R&D andengineering (1995-2000), marketingand sales (2000-05) and has beenits Managing Director since April2005.
His current priority is the applicationof the scientific principles ofhomoeopathy to the task of buildinga brand centered strategy at BajajAuto with the objective of achievingits vision of being one of the world'sleading motorcycle manufacturers.
Mr Bajaj has been on the Board ofBajaj Auto since March 2002. He isalso on the Boards of Bajaj AutoFinance and Bajaj Auto Holdings.
CEO TrackMr Rajiv BajajManaging DirectorBajaj Auto
7August 2011
7th Annual Global Investor Conference
Tata Motors
Mr Prakash TelangManaging DirectorTata Motors
Key Takeaways
Core essence: For the CV industry, CY10 marks an inflection point, with marketspoised for recovery after recession. The Indian passenger car industry is likely to witnessstrong growth over the next 10 years.
Industry insights The growth drivers supporting automobile demand, namely (a) increasing
urbanization, (b) growing working population, (c) growth in GDP and rise in disposableincomes, (d) improvement in road infrastructure, remain in place and should sustain.
For the CV industry, even if economic conditions worsen, an FY09-10-like volumedecline is unlikely. This is because unlike FY09-10, availability of finance is gooddespite increase in interest rates, which is critical for CV demand.
Improvement in road infrastructure and establishment of hub-and-spoke model wouldensure strong demand for M&HCVs and LCVs.
Commercial vehicles The CV industry in India is likely to continue its strong growth in the high volume
segments, with a CAGR of 11% over FY10-15. There would be a shift towards higher tonnage tractors and multi-axle trucks; tippers
would continue to contribute significantly towards total sales. The small CV industry should see volume CAGR of 8% over FY11-15 to 0.29m units,
with the contribution of micro-trucks increasing from 17% in FY11 to 40% in FY15.
Passenger cars The Indian passenger car market is likely to grow faster than the top-5 global
markets, at a CAGR of 12-15% to 7m-9m units. Hatchbacks will continue to dominate the market in 2020. Volumes in this segment
are likely to grow, driven by increased offerings by international OEMs complementedby a growing middle-class population.
SUV sales are likely to increase from 0.2m units in FY10 to 0.57m-0.62m units byFY21 and MPV sales from 0.17m to 0.8m-0.9m units, driven by the mid-end segmentsfor UVs and MPVs.Entry UVs currently cater to rural customers; however, there isgrowing demand for smaller trendy SUVs for the urban youth.
While the entry-level MPVs are the biggest segment (expected to reach ~0.4m unitsby FY21), the mid-price MPVs are likely to grow faster due to higher urban demand.
The rural market is likely to grow at a CAGR of 16% primarily due to increase in thenumber of households and 2.5x growth in consumption levels. While tier 2-3 citiesare would grow at 12% CAGR, the metros and tier-I cities would grow at 11% CAGRover FY10-21.
Mr Prakash Telang is ManagingDirector of Tata Motors' Indiaoperations. He was ExecutiveDirector (Commercial Vehicles) sinceMay 2007, and he assumed hiscurrent role on 2 June 2009.
He joined the Tatas through theprestigious TAS (Tata AdministrativeService) cadre, after spending thefirst three years of his career withLarsen & Toubro. Ever since, he hasbeen with the group. He isresponsible for productdevelopment, manufacturing, salesand marketing of the strategicbusiness unit of light and smallcommercial vehicles.
Mr Telang holds a Bachelor's inMechanical Engineering and is anMBA from IIM, Ahmedabad. He hasover three decades of functionalexpertise in the automobile industryand machinery manufacturing.
Covering Analyst(s):Jinesh K Gandhi+91 22 3982 [email protected]
Mansi Varma+91 22 3982 [email protected]
CEO Track
8August 2011
7th Annual Global Investor Conference
ONGC
Key Takeaways
Core essence Positive on government policy changes, which will be favorable to the sector and
the company, primarily due to increased awareness of negative impact of ad-hocsubsidy burden.
Expects the government to limit upstream subsidy sharing at 33%. Current global economic uncertainty could weaken oil price, which would be good
from the under-recovery perspective.
Industry insights Global oil demand growth of 2.4% in 2010 was the second highest in the last 30
years, primarily led by emerging markets. Domestic oil production increase in FY11 limited the increase in oil imports.
Nevertheless, import dependency remains high at ~77%.
Company vision and strategy Increasing E&P expenditure in its large domestic acreage. Continued IOR/EOR activities to sustain current production. ONGC has a commendable
record of maintaining production as against 9% decline witnessed in mature non-OPEC fields.
Looking at increase in oil and gas production through marginal field development,which will become economically feasible at higher oil and gas prices.
Key triggers/milestones/challenges Likely subsidy rationalization by government. Expect one-time gain post resolution of royalty issue with Cairn India. APM gas price hike in the medium to long term.
Mr Ajit Kumar Hazarika,Chairman and Managing Director ofOil and Natural Gas Corporation(ONGC), has over three-and-a-halfdecades' experience in the upstreamoil and gas business. A MechanicalEngineer, he joined ONGC in 1976and joined the ONGC Board asDirector (Onshore) in September2004. He assumed his current officeon 1 February 2011 in addition tothe responsibil it ies of Director(Onshore).
He is also Chairman of ONGC VideshLimited (OVL), Mangalore Refinery& Petrochemicals Limited (MRPL) andsix other ONGC Group companies(OPaL, OMPL, MSEZ, OTPC, OMELand OTBL).
Mr Hazarika, Chairman of PetrotechSociety, is also a member of theGoverning Council of Petrofed. He isChairman of the Working Group forUCG (Underground CoalGasification) constituted by theoffice of Principal Scientific Advisor,Government of India and Indianrepresentative of the Oil & Gas Sub-committee of International M2M(Methane to Market) partnershipunder the United StatesEnvironment Protection Agency,nominated by the Ministry ofPetroleum & Natural Gas.
Covering Analyst(s):Harshad Borawake+91 22 3982 [email protected]
Mr Ajit Kumar HazarikaChairman & Managing DirectorONGC CEO Track
9August 2011
7th Annual Global Investor Conference
ICICI Bank
Ms Chanda KochharManaging Director & CEOICICI Bank
Key Takeaways
Core essence To accelerate growth, with focus on 5Cs (Credit growth, CASA ratio, Cost efficiency,
Credit quality and Customer centricity). To enhance RoA from current level of 1.4% on the back of improved liability structure
and leverage capital better by resuming growth; standalone RoE to increase to 14-15% in FY13.
Targets 14-15% consolidated RoE in FY12.
Industry insights Inflationary pressures still persist in the economy, with manufacturing inflation also
moving up. ICICI Bank expects inflation to decline from October on the back of afavorable base. Interest rates are near the peak and the bank expects some stabilitynow.
New sanctions have come down due to various macroeconomic factors. However,the current level of sanctions will drive growth at least for the next 12-18 months.
Asset quality remains largely stable and no significant stress is seen so far. Retailasset quality remains strong and large corporate loans are doing well, though theremight have been some segment-specific issues in SME loans. Corporates have amuch larger scale of operations as compared to the 1990s and are better positionedto take higher interest rates. Project-specific modalities will have to be looked at tojudge infrastructure asset quality and it may not be correct to take a generalizedview.
Focus on efficiency, superior customer service and quality growth will remain thekeys to success. Large private sector banks will continue to have an advantage.
If the savings rate is deregulated, the management expects other charges also tobe deregulated, which will keep profitability intact.
Company vision and strategy Focused 5Cs strategy and quality growth: ICICI Bank will continue to focus on
its 5Cs strategy and quality growth. The management mentioned that at currentRoA of 1.4%, there is some room for improvement from margins, opex and lowerprovisions.
Credit growth: Balance sheet growth is likely to be ~18%, with equal contributionfrom domestic and overseas business. Within the domestic business, corporateloans (project finance, working capital financing) and secured retail loans (auto andhome loans) remain areas of focus. High domestic interest rates are leading tohigher arbitrage on the international front, which is fuelling international loan growth.
Covering Analyst(s):Alpesh Mehta+91 22 3982 [email protected]
Sohail Halai+91 22 3982 [email protected]
Ms Chanda Kochhar is theManaging Director and CEO of ICICIBank. She began her career withICICI as a Management Trainee in1984 and has risen through theranks, handling multidimensionalassignments and heading all themajor functions in the bank.
She is widely recognized for her rolein shaping India's retail bankingsector and for her leadership of theICICI Group. She took on thechallenge of building the nascentretail business, with strong focus ontechnology, innovation, processreengineering and expansion ofdistribution and scale.
Ms Kochhar led ICICI Bank'scorporate and international bankingbusinesses during a period ofheightened activity and globalexpansion by Indian companies. Shewas the Joint Managing Director &Chief Financial Officer during a criticalperiod of rapid change in the globalfinancial landscape.
Ms Kochhar is a member of the PrimeMinister's Counci l on Trade &Industry, US-India CEO Forum andUK-India CEO Forum. She wasconferred with the Padma Bhushanin 2011.
CEO Track
10August 2011
7th Annual Global Investor Conference
Cost efficiency: Operating expenses are likely to grow 20% due to (a) increase inheadcount from 43,000 to 60,000 employees, (b) wage increase of 11% in FY11, (c)increase in branch network to 2,500+ (up 25%+). Overall, ICICI Bank expects to maintaincost to average assets at 1.7% and cost to income ratio at 40-42% on long-term basis.
CASA: Focus remains on retail liability driven growth strategy. CASA deposits are likelyto grow in line with overall growth. The bank expects to maintain CASA ratio at 40% forthe long term.
Credit quality: Credit quality is gradually improving, with net accretion to NPAs comingdown and the management does not expect any issues in the near future. About 60% ofits power exposure is to entities with own coal mines and the rest 40% is to entities thathave coal linkages in place. Restructured loans declined to INR19.7b from INR37.4b YoY.The management continues to guide credit cost of 80bp for FY12 and expects to maintainthis over the long term.
Customer centricity: Focusing on enhancing customer service capability and leveragingon branch network to acquire new customers.
Focused on de-risking the portfolio ICICI Bank, UK has scaled down investments in bonds/notes of financial institutions
from USD2.1b as of 1QFY10 to USD640m as of 1QFY12. It does not have any exposureto peripheral European countries.
Credit derivative exposure (including off balance sheet) has been scaled down toINR21.3b from INR54.1b. In case of derivative exposure, the underlying comprises ofIndian corporates.
Domestic subsidiaries impacted by regulatory changes: Regulatory headwinds coupledwith tough market conditions impacted Insurance, Asset Management and Securitiesbusinesses. ICICI Bank remains committed to building the franchise in various businesses tocapitalize its long-term growth potential. Consolidation of operations remains a mantra foroverseas subsidiaries in view of changing regulations.
Other highlights Overseas margins are likely to improve from 90bp as of 1QFY12 to 125bp by the end of
the year, led by re-pricing on the liability side. The management expects domesticmargins to remain at current levels. However, there remains an upward bias in FY13,led by fall in securitization losses. For FY12, it expects NIM of 2.6%.
Fee income growth is likely to remain in line with asset growth, with focus on transactionbanking, forex/derivatives and remittance fees. However, growth in corporate fees woulddepend on movement in new project announcements and financial closures.
Key triggers/ milestones/challenges Managing quality growth is a key challenge in the current uncertain macroeconomic
scenario. There would be no immediate unlocking of value from Insurance business, considering
change in regulatory environment. Further, as the Insurance business is profitable, itdoes not need fresh capital.
ICICI Bank (continued)
11August 2011
7th Annual Global Investor Conference
Bharti Enterprises
Mr Akhil Gupta,Dy Group CEO & Managing DirectorBharti Enterprises
Key Takeaways
Core essence: The Indian telecom sector is at a turning point, with increasing rationalityin competition, sustainable voice growth (led by the rural market), large data opportunity,and peak investments already behind. The best in the Africa business is yet to come.
Industry insights Increasing rationality in competitive activity as underscored by recent pricing actions,
focus on paying customers as well as sales and distribution cost management. Real wireless subscribers in India are estimated at ~600m, with actual rural
penetration at just 20-22%. Non-voice revenue at 13.5% for the industry has significant room for improvement.
However, the industry will need to work hard to achieve the full potential of dataopportunity.
Africa market penetration in Bharti's footprint is relatively low at ~30%. Telecom operators are keenly looking at the New Telecom Policy 2011 (NTP 2011).
Bharti expects the policy to (1) be comprehensive, (2) provide exit opportunities tounviable operators, and (3) provide a level-playing field.
Company vision and strategy Bharti is best positioned to capture rural and data opportunities. The company has demonstrated its leadership in the market, with initiatives like
passive infrastructure sharing and recent tariff corrections. Relentless focus on efficiency improvement, as underscored by the recent organization
restructuring. Focus on continued execution in the Africa business. The business delivery model
has been aligned similar to India. Bharti would be looking to expand the Africafootprint in the long-term.
Key triggers/milestones/challenges NTP 2011 would be a key event to watch for. Bharti aims to bring down its net debt/EBITDA ratio to 2x over the next one year
v/s 2.6x currently.
Covering Analyst(s):Shobhit Khare+91 22 3982 [email protected]
Mr Akhil Gupta is Deputy GroupCEO and Managing Director of BhartiEnterprises and a Director at BhartiAirtel. He spearheaded the group'stransformational initiatives includingoutsourcing deals in the areas ofinformation technology (IT) with IBM,network management with Ericssonand Nokia and outsourcing of callcenter management to leadinginternational BPOs. Heconceptualized and implemented theseparation of passive mobileinfrastructure and formed IndusTowers, a JV with Vodafone andIdea, the largest tower company inthe world.
In June 2010, Mr Gupta wasinstrumental in executing theacquisition of the Zain Group's mobileoperations in 15 countries in Africafor an enterprise valuation ofUSD10.7b, the second largestoutbound deal by an Indiancompany. For this, he was awardedthe Asia Corporate DealmakerAward at the Asia-Pacific M&A AtlasAwards in September 2010.
He led the formation of partnershipsfor Bharti with leading internationaloperators l ike British Telecom,Singapore Telecom and most recentlyVodafone, besides the induction offinancial investors like WarburgPincus, Asia Infrastructure Fund andNew York Life.
CEO Track
12August 2011
7th Annual Global Investor Conference
HDFC
Mr Keki MistryVice Chairman & CEOHDFC
Key Takeaways
Core essence:The housing finance business is likely to grow at a CAGR of 20-25%over the next 10 years; RoE would improve by at least 100bp every year. Subsidiarieswill contribute significantly to growth now.
Industry insights Inflation remains high. RBI is likely to increase rates by at least 25bp. Growth continues
to be strong in rural areas and metros (except Mumbai). HDFC remains optimistic about demand for housing finance. India's mortgage to
GDP ratio is 9% as against 80%+ in other developed countries like UK and USA. The key growth drivers are: (1) higher affordability due to increase in disposable
income - the average house value has declined from 22x annual income in 1995 to4.8x in 2011, (2) rising urbanization - to increase from ~31% in 2011 to 40% by2030, and (3) favorable demographics - average age of home buyers is 35 years,and currently, ~60% of India's population is below the age of 30 years.
Government statistics place current housing shortage in India at 25m units (14munits in rural and 10.6m in urban areas).
Company vision and strategy HDFC maintains standard of income based lending, thereby cancelling out exposure
to volatility in real estate prices. On AUM basis, company will keep individual loans to corporate loans ratio at 70:30.
Owned branches and affiliates will continue to be a dominant source for loan growth(currently contributing 92%).
HDFC will continue to maintain flexibility on the borrowing side. In a rising interestrate and tight liquidity scenario, retail deposits remain a key funding source. Flexibilityin funding sources helps HDFC to maintain spreads in a band of 2.15-2.35%.
HDFC plans to improve RoE by ~100bp every year.
Key triggers/milestones/challenges Improving profitability from asset management and insurance businesses will be
key to long-term profitability. Listing of insurance arm is an important trigger to unlock value, though this is unlikely
in the near term. Margins will sustain in the traditional range of 2.15-2.25%. While standalone earnings will continue to grow at around 20%, consolidated
earnings growth will be even higher.
Covering Analyst(s):Alpesh Mehta+91 22 3982 [email protected]
Sohail Halai+91 22 3982 [email protected]
Mr Keki M Mistry is Vice Chairmanand CEO of Housing Developmentand Finance Corporation (HDFC).
Mr Mistry began his career withIndian Hotels Company Limited, andjoined HDFC in 1981. He wasinducted on to the board of directorsof HDFC as Executive Director in1993 and elevated to ManagingDirector from November 2000. InOctober 2007, Mr Mistry wasappointed Vice Chairman &Managing Director of HDFC andbecame Vice Chairman & CEO inJanuary 2010.
Mr Mistry obtained a bachelorsdegree in Commerce from BombayUniversity. A qualified CharteredAccountant and Fellow Member ofthe Institute of CharteredAccountants of India, Mr Mistry isalso a member of the MichiganAssociation of Certified PublicAccountants, USA.
Mr Mistry is a director on the boardsof several Indian companies.
CEO Track

13August 2011
7th Annual Global Investor Conference
ACC
Mr Kuldip K Kaura,CEO & Managing DirectorACC
Key Takeaways
Core essence: Long-term growth drivers intact to drive 9-10% volume CAGR, as ~70%of cement demand is driven by individual demand for real estate development.
Industry insights Long-term cement demand is likely to grow at a CAGR of 9-10% despite short-term
aberrations, as key demand drivers are intact. Infrastructure activity should pick up,resulting in 15% CAGR in cement consumption by the infrastructure segment.
While current demand is ~230mt, current capacity is ~300mt. ACC is not overtlyconcerned about excess capacities, as the industry would require ~25mt incrementalproduction to meet demand growth. Against demand CAGR of ~9%, it expectscapacity CAGR of ~7% over CY09-15.
No significant increase in RMC share (~7% penetration currently) is likely over thenext 5-10 years, but the share of bulk cement sales is likely to increase vis-à-visbagged cement sales.
ACC expects cost pressure to persist, impacted by decline in linkage coal and volatiledomestic coal prices. However, cement price increases should cover cost inflation,as the industry would need to earn reasonable EBITDA/ton to support new capacities.
Company vision and strategy Gathering limestone mines for future capacity addition: ACC has been
acquiring limestone mines on continuous basis for greenfield capacity addition. Ithas ~5mt of capacity addition at drawing board stage, which it is likely to finalizeover the next six months.
Securing energy security: ACC has four coal blocks in JVs, with two blockswhere it has complete operational control. These two coal blocks have reserves of~200mt. It expects supply from one of these coal blocks to start from 2HCY12.While it may not result in savings, as it would be paying 'facilitation fee' of INR2,600/ton (for B & C grade coal), it would ensure stable quality and quantity of coal supply.Overall, it plans to have 20-25% of coal requirement from captive coal blocks.
Increased usage of alternate fuels: ACC continues to focus on usage of alternatefuels to dilute of impact of energy cost inflation. In CY10, it saved INR470m fromusage of alternate fuels. It expects savings to increase from USD1/ton of coal usageto USD3/ton over the medium term.
Key triggers/milestones/challenges Logistics: Logistics issues could constrain demand growth, as moving material to
the market and meeting demand would be a challenge. ACC is relatively betterplaced due to better rail-road mix of 55:45.
Covering Analyst(s):Jinesh K Gandhi+91 22 3982 [email protected]
Mr Kuldip K Kaura is CEO andManaging Director of ACC.
He has rich experience and a deepappreciation of the national andinternational business environment.He has had the benefit ofmanagement education from reputedinstitutions like London BusinessSchool and Swedish Institute ofManagement. He did his BE (Honors)in Mechanical Engineering from BirlaInstitute of Technology & Science,Pilani in 1968.
Mr Kaura worked with VedantaResources Plc for seven years,initially as the Managing Director ofHindustan Zinc and thereafter asChief Executive Officer of VedantaResources until 2008 and played asignificant role in the transformationand rapid growth of its groupcompanies. Prior to this, he had an18-year stint with ABB India, anengineering company. During thisperiod, he grew through various keypositions and was Managing Directorfrom 1998 to 2001.
He has served as Member ofNational Council of theConfederation of Indian Industriesand is an office bearer of other suchprofessional bodies.
CEO Track
14August 2011
7th Annual Global Investor Conference
Idea Cellular
Mr Himanshu KapaniaManaging DirectorIdea Cellular
Key Takeaways
Core essence: Significant opportunity available in the Indian voice as well as datamarkets over the medium term. Current focus only on tariff hikes, tower deals, etccould be misplaced.
Industry insights Penetration of voice services in India is still relatively low at ~50% v/s the 80-90%
benchmark. Virtual consolidation in the industry is evident from increase in revenue market
share of top-three operators from ~55% to ~65% in the last 3-4 years despitehyper-competition.
Wireless is a heterogeneous sector, with different operators having leadership indifferent circles.
The share of non-voice services in revenue is set to increase, as most subscriberswill upgrade their handsets over the next few years and eco-system for 3G is beingdeveloped.
While incremental operating cost for 3G is only a fraction of the current operatingcosts, amortization and finance costs related to 3G spectrum will negatively impactthe bottomline of all operators.
Company vision and strategy Idea has a strategy of over-investing in its established circles, which drives its
leadership in these operations. Idea is focused on deepening its coverage and driving rural growth. 67% of net
subscriber additions for Idea come from rural markets. Focus is on building scale, with 1.2b minutes/day. Idea is the eighth-largest operator
globally in terms of traffic. Enhancing revenue market share, driven by (1) focus on quality of subscribers, (2)
cash profits to sustain investments, and (3) higher-than-industry traffic growth. Idea is expanding its 3G reach and is rolling-out 3G services in 10 towns/day, as
significant growth is expected from wireless broadband on the handsets.
Key triggers/milestones/challenges NTP 2011 would be a key event to watch for. Continued overcapacity in the industry remains a challenge. Potential exit of unviable operators could be an important milestone for the industry. Increase in smart-phone penetration to drive data revenue.
Covering Analyst(s):Shobhit Khare+91 22 3982 [email protected]
Mr Himanshu Kapania isManaging Director of Idea Cellular.Before he took up this office on 1April 2011, he was Deputy ManagingDirector.
He joined Idea in September 2006,with over 21 years' industryexperience. He has served thecompany as Chief Operating Officer,Corporate and Director ofOperations.
Mr Kapania has worked with RelianceInfocomm as Chief Executive Officerfor Northern Operations, withNetwork Limited as Deputy GeneralManager - Marketing, with ShriramHonda as Manager - Marketing, andwith DCM Toyota.
He is a BE (Electrical & Electronics)from Birla Institute of Technology,Ranchi and a postgraduate from theIndian Institute of Management,Bangalore.
CEO Track
15August 2011
7th Annual Global Investor Conference
Zee Entertainment Enterprises
Key Takeaways
Core essence: Despite near-term sluggishness in the ad environment, medium tolong-term opportunity remains attractive, led by consumption growth and efforts toimprove subscription revenue.
Industry insights Increasing regionalization and fragmentation of content remain dominant themes in
the Indian broadcasting space. General entertainment and movies remain the dominant genres in India, accounting
for ~67% of total viewership. Sports is a loss-making proposition due to lack of subscription revenue and majority
(~75%) of viewership and revenue coming from cricket. Digitization would lead to (1) greater fragmentation, (2) better monetization of
niche genres and sports content, and (3) higher subscription revenue, reducing thecyclicality associated with ad revenue.
Indian broadcasting industry revenue is likely to grow at ~16% CAGR over the nextfour years.
Company vision and strategy With its diversified network, Zee remains the leading broadcaster of Indian content
globally. Media Pro, the recent distribution JV between Zee Turner and Star Den, is aimed at
getting the rightful share of pay revenue from LCOs. The company will maintain its cost discipline and refrain from going after high-cost
GRPs, which do not generate adequate returns.
Key triggers/milestones/challenges Lack of profitability in the sports genre and sluggish ad revenue environment remain
the key challenges. Mandatory sunset for analog signals would be a significant milestone for the sector.
Covering Analyst(s):Shobhit Khare+91 22 3982 [email protected]
Mr Punit Goenka is ManagingDirector and CEO of ZeeEntertainment Enterprises. Hisstrong work ethics and hands-onapproach have been instrumental insteering the Zee Empire to newfrontiers of success. Under hisleadership, Zee TV has emerged aleader among General EntertainmentChannels in India.
Mr Goenka has grown up the ranks,handling various responsibilitiesacross the Essel conglomerate forover 14 years. He started his careerwith Zee TV in 1995 as head of theMusic division and went on toshoulder additional responsibilitiesacross Essel Group Companies. Heserves as a Director of other publiclimited companies such as: EsselInfraprojects, Essel TelecomHoldings, Rochan (India), ZeeSports, Agrani Wireless Services,Agrani Satellite Services, ASC MobileCommunication, and Diligent MediaCorporation.
Mr Goenka is a great mentor. He hasshared his experiences andknowledge at managementeducation programs such as YoungManagers Program at INSEAD,France, and 'Birthing of Giants' byYoung Entrepreneurs' Organizationand MIT Enterprise Forum, Inc,Boston, USA.
Mr Punit GoenkaManaging Director & CEOZee Entertainment CEO Track
16August 2011
7th Annual Global Investor Conference
Hindustan Unilever
Mr Nitin ParanjpeCEO & Managing DirectorHindustan Unilever
Key Takeaways
Core essence: HUL is investing in categories and channels of tomorrow, to gain fromchanging consumption patterns and demographic dividend. Industry insights The Indian consumer has come of age. Media explosion, rising income levels and
increasing role of women in the decision making will increase demand for personalcare and processed foods.
Rural India offers huge opportunity and HUL has increased its distribution by 0.6moutlets to cater to rising demand in rural India.
As far as urban demand is concerned, there is an upgradation wave in urban Indiaand new products are gaining acceptance at a fast rate.
Modern trade offers huge opportunity for players like HUL to launch new productsand garner higher share.
Company vision and strategy Focus on new products for tomorrow, like fabric softeners, hair conditioners,
deodorants in personal care, and creamy spread, soy juice, Knorr Soupy and KissanNutrismart.
Channels of tomorrow: strength in modern trade, higher share and profitability. Capabilities of tomorrow: capture premiumization, portfolio approach with
products across the pyramid. Sustainability: looking to add 1b consumers globally, with environment friendly
approach. Gain market share in existing categories and create new categories for the long
term. Offer high quality products at right prices and strong execution in the field with
better service. Key triggers/milestones/challenges Product pricing: competitive pricing with high quality New launches: to focus on personal care and food products Competitive intensity: to grow ahead of competition with competitive pricing Increase in share of higher margin personal care in total sales.
Covering Analyst(s):Amnish Aggarwal+91 22 3982 [email protected]
Harit Kapoor+91 22 3029 [email protected]
Mr Nitin Paranjpe was appointedEVP South Asia and CEO HindustanUnilever, India in April 2008. He isCEO & MD of Unilever's Indianbusiness.
He joined Hindustan Lever as amanagement trainee in 1987 andworked in several sales andmarketing roles. In 1996 he wasappointed Branch Manager for thesouth region and in 1999 he becamea member of the Project MillenniumTeam.
In 2000, Mr. Paranjpe moved toLondon and was involved in a reviewof the organisational structure. In2001 he was Assistant to the UnileverChairman & Executive Committee inLondon. On return to India in 2002,he became Category Head-FabricWash & Regional Brand Director(Asia) for some laundry andhousehold cleaning brands. In 2004he became Vice President - HomeCare (Laundry & Household Care)India.
Mr. Paranjpe holds a BE Mechanicaldegree from the College ofEngineering Pune, India and an MBAin Marketing from Jamnalal BajajInstitute of Management Studies,Mumbai.
CEO Track
17August 2011
7th Annual Global Investor Conference
The Black Economy
Key Takeaways
Core essence: The cost of India's black economy is 5% GDP growth sacrifice everyyear since mid-70s. But for this, India's size of the economy would have been ~USD9trillion.
Black economy: the conceptual issues Black economy v/s black money: Black economy is much wider than black income
and black money and corruption. Black money is only a tiny part of the black incomethat is saved in cash. Black savings can also take the form of non-cash assets,inventories, flight of capital, investments in legal and illegal activities, etc.
Corruption and black economy: Black economy is much larger than corruption(which is mainly bribes), and includes illegal activities like hawala (money laundering),drug trafficking, smuggling, etc.
Two to tango: The black economy involves both public and private sector. Size does matter: If the black economy is say 50% of the economy, can we just
add 50% to the white economy to get the size of the potential economy? The answeris 'NO'. In many ways, the black economy has disproportionate impact on variousaspects of the economy.
The impact is severe Loss in growth and potential: The rates of growth are less than the potential
rate by 5% since mid-seventies. But for the black economy, Indian economy couldhave been nine times its present size i.e. ~USD9 trillion. In other words, India couldhave migrated from the poorest 30 countries of the world to middle income countryby now.
Policy failures: Black economy leads to policy failures and reduces its effectivenessleading to a sense of a failing state amongst citizens.
Macroeconomic implications: Black economy raises black savings, but at thesame time it lowers investment rates, increases input output ratio and ICOR. Itlowers the employment potential, raises inflation, adversely affects the fiscal situation,leads to flight of capital and balance of payments difficulties - thus, economicdevelopment gets adversely affected.
Monetary sector: Informal money market remains strong, thus a whole lot ofblack liquidity remains outside the central banks calculus. This leads to volatility inmoney multiplier and velocity of circulation defeating RBI's attempt to fight inflationby raising rates.
Broader implications: Black economy leads to governance deficit, criminalizationof society, wastage (activity without production), deterioration of norms (the usualbecomes unusual and unusual becomes usual), criminalization and weakening ruleof law.
Professor Arun Kumar is theChairperson of the Center forEconomic Studies and Planning,Jawaharlal Nehru University (JNU).He has been teaching Economics atthe Center since 1984.
He went to Princeton University inthe US for a PhD in Physics but in1977 switched to a PhD in Economicsat the Jawaharlal Nehru University.He completed BSc (Physics) from StStephens College, India in 1970. Heis a gold medalist of the Delhi HigherSecondary Board and DelhiUniversity. He has had visitingassignments in Pavia University, Italyand Humboldt and LeipzigUniversities, Germany.
His PhD thesis was on Inflation andTerms of Trade, which gave a newunderstanding of the role of tradeand government in inflation in India.He specialized in DevelopmentEconomics, Public Finance and PublicPolicy and Macroeconomics, andpublished articles in these areas. Hisbook, The Black Economy in India,published by Penguin, broke newground in thinking about the Indianeconomy and its development. Hepublished a book, Challenges FacingIndian Universities, and wroteextensively on issues pertaining tohigher education in India.
Prof Arun KumarChairpersonCenter for Economic Studies, JNU"Black Money: The Trail of India'sHidden GDP"
ThematicPresentation
Covering Analyst(s):Dipankar Mitra+91 22 3982 [email protected]
Jawaharlal Nehru University
18August 2011
7th Annual Global Investor Conference
Inequality: Black income is concentrated in 3% of households, but 97% of the peopleare affected. The segment gaining from the black economy (i.e., the upper 3%) alsoloses due to lost growth opportunities, uncivilized conditions, pollution, etc. However,this 3% of the population is larger than many large size European countries, and theirspending of their black income feeds into the notion of India shining in terms of consumerboom, etc.
Size is 50% of economy now According to Prof Kumar's estimates, the size of the black money has grown from 5% in
1955 to 50% now. The black economy encompasses all sectors of the economy but is concentrated most in
the tertiary sector. Therefore, the structure of the economy is different from what isrevealed by the white economy.
Number of scams and their size has increased exponentially since the 1950s, with nearlyone scam breaking out every week now.
The reason for black money - The Triad Three pillars of the triad - Black economy is both systematic and systemic. The black
economy triad consists of the business, politician and the executive. Ineffectiveness of redressal mechanism - Now the public delivery mechanism is largely
ineffective. In 1984 all commissioners of income tax said 95% of their department iscorrupt. Similarly in 2002, Municipal Commission of Delhi (MCD) said in Delhi High Courtthat no honest engineer in Public Works Department (PWD).
Spirit unwilling - The triad leads to weakening of law, loopholes and resultant complexity.As the spirit was unwilling, this has led to corruption cases knowingly being scuttled(Hasan Ali, Liechtenstein disc, 2G, etc.). A large amount of cases are waiting to comeout of closet based on the private information with the Government but used selectivelyfor political end.
The solution Committees and suggestions: There have been many committees since independence
to look into the aspects of the black economy and made thousands of suggestions. Butthe implementation has not been successful.
Narrow technical solutions don't work: Also technical solutions like reducing taxrates, reduced control, voluntary disclosure scheme, property acquisition, etc, have notworked. This is because the nature of the problem is actually political and cannot betackled without strong will.
Strong RTI and accountability: A strong RTI and accountability at all levels is aminimum imperative.
Competition: New parties and politics need to come up. Lack of democracy withinparty also does not augur well.
An ideal Lokpal structure: An ideal Lokpal structure would perhaps be to include thetop echelons of the executive and the judiciary. If accountability is ensured at the top,then they would in turn demand accountability down-the-line. However, a very elaborateLokpal with large bureaucracy would be bound by the same weakness of corruption andinefficiencies that the current system is susceptible to.
Public pressure critical: The movement by Anna Hazare has rekindled hope that theturning point may be coming. However, sustenance of the movement depends upon thecontinuance of public pressure.
The Black Economy (continued)
19August 2011
7th Annual Global Investor Conference
India Insights
Key Takeaways
Core essence: There are two Indias within India (i.e. the one that is more commonlyvisible, and the other, which is behind the scenes, but has equal if not more powerfulinfluence on the Indian psyche).
Insights Mr Prakash Jha mainly drew a parallel between his movies and the socio-politico-
cultural trends and aspirations in India. Damul (meaning 'bonded to death') - Released in 1984, this was Mr Jha's first
socio-political film (and his second after Hip Hip Hurray, 1983). The story isabout a bonded laborer who is forced to steal for his landlord, to whom he isbonded until death. Set in rural Bihar of 1984, the film focuses on caste-basedpolitics and the oppression of the lower castes in the region through bondedlabor.
Mrityudand (meaning 'death penalty') - Released in 1997, the movie captures(1) the decline of the zamindar (landlord) the emergence of the thekedar(contractor), and (2) religious fanaticism.
Gangaajal (meaning water of river Ganga, a euphemism in the movie for acidused to gouge criminals' eyes) - Released in 2003, the movie (1) highlightsrising criminalization in society, and (2) explores the relationship of society andpolice.
Apaharan (meaning 'kidnapping') - Released in 2005, the film reflects howkidnapping almost gained the status of an industry in certain parts of India,mainly the Hindi heartland. It also captured manipulation of democracy, andhow the rich and the powerful exploited the aspirations of the young to becomesuccessful.
Rajneeti (meaning 'politics') - Released in June 2010, Rajneeti is a larger-than-life portrayal of political aspirations of India's youth.
Aarakshan (meaning 'reservation') - This recently released film talks openlyabout India's caste system where almost half the seats for higher educationand jobs are reserved for certain backward castes and classes. It also dwellson the commercialization of education, which is of high concern today.
Mr Jha himself was born in a Brahmin family in Champaran, Bihar. His movies capturethemes which he has personally witness to since childhood.
He concluded by stating how growth in Bihar had been neglected due to historicreasons, and how under the reign of Chief Minister Mr Nitish Kumar, the scene hasdramatically improved after a long time.
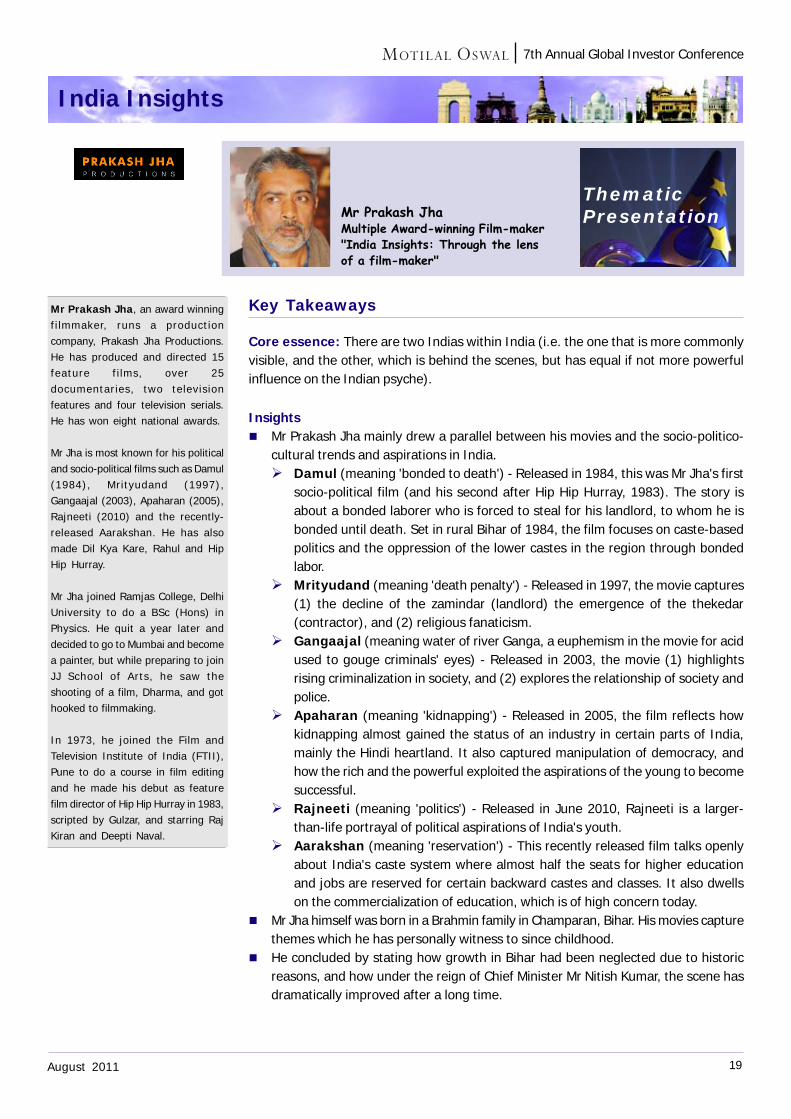
Mr Prakash Jha, an award winningfi lmmaker, runs a productioncompany, Prakash Jha Productions.He has produced and directed 15feature fi lms, over 25documentaries, two televisionfeatures and four television serials.He has won eight national awards.
Mr Jha is most known for his politicaland socio-political films such as Damul(1984), Mrityudand (1997),Gangaajal (2003), Apaharan (2005),Rajneeti (2010) and the recently-released Aarakshan. He has alsomade Dil Kya Kare, Rahul and HipHip Hurray.
Mr Jha joined Ramjas College, DelhiUniversity to do a BSc (Hons) inPhysics. He quit a year later anddecided to go to Mumbai and becomea painter, but while preparing to joinJJ School of Arts, he saw theshooting of a film, Dharma, and gothooked to filmmaking.
In 1973, he joined the Film andTelevision Institute of India (FTII),Pune to do a course in film editingand he made his debut as featurefilm director of Hip Hip Hurray in 1983,scripted by Gulzar, and starring RajKiran and Deepti Naval.
Mr Prakash JhaMultiple Award-winning Film-maker"India Insights: Through the lensof a film-maker"
ThematicPresentation
20August 2011
7th Annual Global Investor Conference
ThematicPresentation
India's Troubled Neighborhood
Key Takeaways
Core essence: There are is a complementary and reflexive relationship between nationalsecurity and economic development.
What is national security?Unlike the past, modern-day countries are unlikely to wage war with other countries forterritorial expansion, as they will not be accepted by the "conquered" people. In thiscontext, national security has three implications -1. It does not only mean defending territorial integrity and preserving the nation's
sovereignty;2. It also means development of trade and commerce with the rest of the world; and3. It is necessary to be an important actor in international affairs.
National security can be mainly analyzed as (1) External and (2) Internal.
India's external security position Geopolitically, India is bordered mainly by small nations ex China - Pakistan,
Afghanistan, Nepal, Bhutan, Bangladesh and Sri Lanka. Security equation with Pakistan: Pakistan has several major internal problems
on hand - economic, political, sectarian - and hence, in no position to wage anymajor attack on India. So, the threat is mainly that of cross-border terrorism, whichmay continue for some time. Still, the security equation is in India's favor and thegap is only increasing.
Security equation with China: Unlike Pakistan, the security equation with Chinais increasing in the latter's favor. China has created more pressure points, both onthe ground and in international diplomacy. Also, it sells weapons to all neighboringcountries like Myanmar, Nepal, Sri Lanka, etc. However, one need not expect anymajor war with China.
Other nations: The other nations are too small to be of any security worry toIndia. On the other hand, any security trouble in India will have repercussions forthese nations and the entire ASEAN region.
Internal security issuesIn modern-day geopolitics, internal security assumes more importance than external.The major issues here are -1. Perception more adverse than reality: The popular perception is that internal
security in India is worsening e.g. rising spread Maoism in east and north-eastIndia. However, the reality is that casualties on account of internal hostilities areactually coming down every successive year for the past several years.
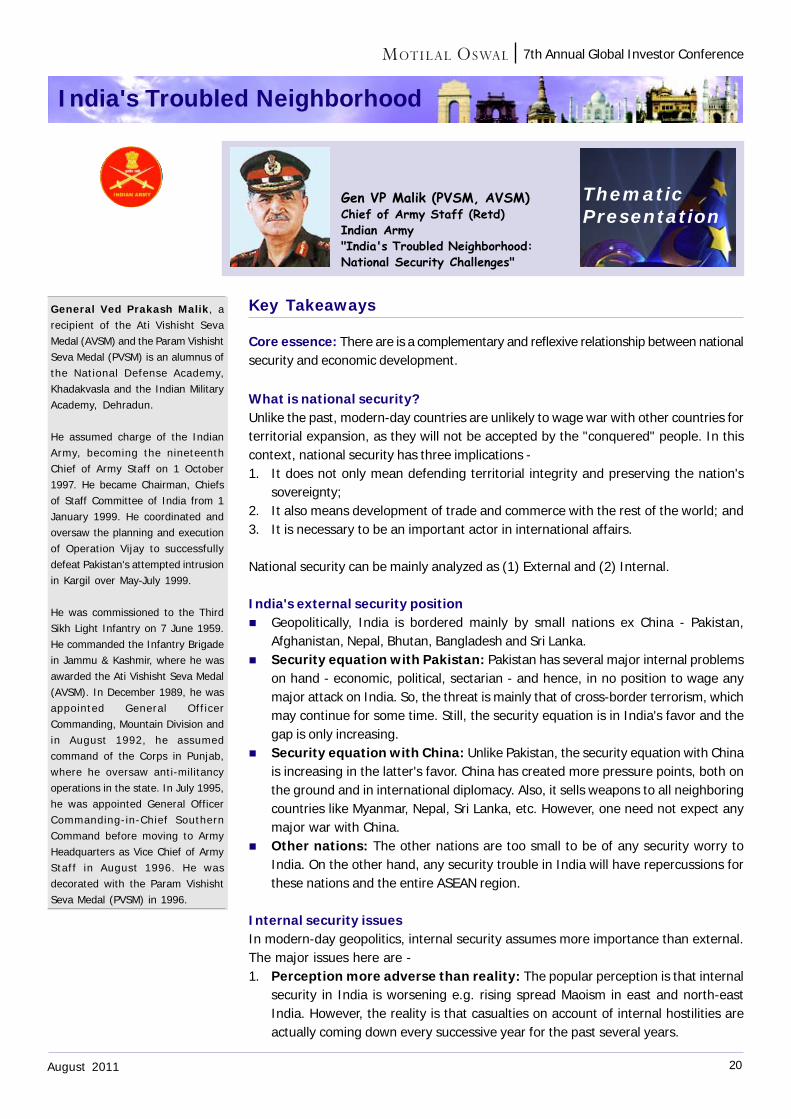
General Ved Prakash Malik, arecipient of the Ati Vishisht SevaMedal (AVSM) and the Param VishishtSeva Medal (PVSM) is an alumnus ofthe National Defense Academy,Khadakvasla and the Indian MilitaryAcademy, Dehradun.
He assumed charge of the IndianArmy, becoming the nineteenthChief of Army Staff on 1 October1997. He became Chairman, Chiefsof Staff Committee of India from 1January 1999. He coordinated andoversaw the planning and executionof Operation Vijay to successfullydefeat Pakistan's attempted intrusionin Kargil over May-July 1999.
He was commissioned to the ThirdSikh Light Infantry on 7 June 1959.He commanded the Infantry Brigadein Jammu & Kashmir, where he wasawarded the Ati Vishisht Seva Medal(AVSM). In December 1989, he wasappointed General OfficerCommanding, Mountain Division andin August 1992, he assumedcommand of the Corps in Punjab,where he oversaw anti-militancyoperations in the state. In July 1995,he was appointed General OfficerCommanding-in-Chief SouthernCommand before moving to ArmyHeadquarters as Vice Chief of ArmyStaff in August 1996. He wasdecorated with the Param VishishtSeva Medal (PVSM) in 1996.
Gen VP Malik (PVSM, AVSM)Chief of Army Staff (Retd)Indian Army"India's Troubled Neighborhood:National Security Challenges"
21August 2011
7th Annual Global Investor Conference
2. Police and Policy: A strong police is a key factor in maintaining internal law and order.However, increasingly, the local policemen are being used for VVIP security. Also, policehuman resources are underdeveloped ("the man behind the gun is more important thanthe gun"). There is also need for significant improvement in the intelligence system. Onpolicy, there is a high correlation between governance and security. Poor governance islikely to trigger civil disobedience movements (e.g. the ongoing protest by Anna Hazareand his supporters), which anti-social elements can take advantage of and create threatsto security and law & order.
Other issues India's import dependence for weapons: 70% of India's weapons are imported.
This is not a healthy situation to be in, as in times of need, the required weapons maynot be available or may need to be procured at exorbitant cost. Hence, there is need tocreate a level-playing field for the private sector in defense equipment business.
Silo-ism at the Center: Various security-related arms of the government need towork in closer co-ordination with each other.
The bottomlineBased on Genl Malik's experience at Kargil, he is convinced that the typical Indian soldier isan extraordinary human being. And so long as he is there, Indians can rest assured thatthere will be no major threat to national security.
India's Troubled Neighborhood (contd)
22August 2011
7th Annual Global Investor Conference
ThematicPresentation
Macro-economic Challenges
Key Takeaways
Core essence: Interest rates will remain a function of inflation. Even if FY12 growthslows down a bit, there would be no major adverse impact on corporate profitabilityand investment climate.
On global risk India cannot be decoupled from the world economy and global downturn would
affect us. However, nobody knows its full impact or shape of things to come as thesecrisis happens once in many decades.
On inflation and growth Inflation to come down: Inflation would need to come down on its own as per
the trajectory given by RBI in this regard. Improved productivity and removal ofsupply-side constraints are the only enduring solutions to control inflation.
Rising rates to protect savings: RBI's anti-inflationary measures do not implythat it takes growth for granted. However, as long as inflation remains high, RBIwould need to take appropriate measures. The real interest rates should be highenough to attract the savers to park their funds into deposits rather than otherforms of saving. In an inflationary environment banks would start raising rates evenif RBI does not.
Growth outlook: Growth should be 8% in FY12 and is achievable; but even if it isa bit lower, there would be no adverse impact on corporate profitability and investmentclimate.
On monetary transmission International experience: Worldwide, monetary transmission has been found to
have worked imperfectly, depending upon the environment. Indian lag: In India the response at the shorter end of the market has been found
to be immediate. It is also believed that the longer end responds with a lag of 3-6months.
Asymmetric response from banks: However, the response of the banks havebeen found to be asymmetric in the two situations of rising and falling interestrates. While banks have been prompt in their response in a rising interest ratescenario, the lag is more in case of falling interest rate.
On exchange rate No target: RBI does not have any target for Rupee and intervenes only to curb
volatility in the exchange rate market.
Dr K C Chakrabarty is the DeputyGovernor of Reserve Bank of India(RBI). He is a seasoned banker, withan accomplished banking careerspanning over three decades. DrChakrabarty has earlier graced theseat of Chairman & ManagingDirector (CMD) for Punjab NationalBank and before that, for IndianBank. He has had a long anddistinguished career of 26 years atthe Bank of Baroda in variouscapacities. He has also been theChairman of the Indian Banks'Association (IBA) for a brief period.
Dr Chakrabarty's currentassignments include guiding andoverseeing the areas pertaining toRural and Urban Cooperative Banks,Information Technology, Paymentand Settlement Systems, CustomerServices, Human Resource andPersonnel Management at theReserve Bank of India. Herepresents India in the Committeeof Payment and Settlement Systems(CPSS) constituted by Bank forInternational Settlements (BIS) as aMember. Dr Chakrabarty is also theRBI Nominee on the Board ofDirectors of NABARD and theChairman of the Institute forDevelopment and Research inBanking Technology (IDRBT).
Dr K C ChakrabartyDeputy GovernorReserve Bank of India"Macro-economic Challenges:The RBI Perspective"
23August 2011
7th Annual Global Investor Conference
No micro management: Isolated events, e.g., oil price movement, payments to Iran,etc. do not shape exchange rate policy.
On data issues There are several data issues that affect policy making, mainly inflation data and trade
data. CPI v/s WPI: As far as issues between WPI and CPI is concerned, there are multiple
CPI indices that are available and over a longer period there is a convergence. Trade data: Similarly, data related to exports and imports need to be taken as an input
for policy even if it deviates from trend after six months.
On savings rate de-regulation Desirable: Deregulation is being discussed to protect the interest of depositors. Not much impact: Interest rates, and even more so average cost of deposits may not
go up very significantly as a result of deregulation.
On securitization and priority sector lending KYC: If the bank is buying a portfolio from an NBFC, they must demonstrate that KYC is
in place and that the portfolio is for priority sector lending. Pricing: Pricing of the securitized portfolio should largely be similar to the existing
portfolio of priority sector. Various other conditions should also be considered like truesale, maturity of the asset, etc.
New guidelines: RBI expects to release new guidelines on securitization and prioritysector shortly.
On asset quality Not a concern: Asset quality is not a great concern till GDP growth is 7.5%+. Various measures to ensure financial stability: RBI will ensure financial stability
and consider various regulations from time to time. 70% PCR requirement, increasedprovisioning requirement in various buckets of NPAs are some of such examples.
Farm waiver and moral hazard: Dr Chakrabarty specifically denied that farm waiverscheme has led to moral hazard as (1) the design of the scheme was targeted, and (2)the failure to repay had arisen out of extraordinary conditions.
Competition and bank licensing Necessary …: Competition in the banking sector would enhance customer service. … but based on proper criteria: However, fit and proper criteria are critical for
issuing new bank licenses.
Macro-economic Challenges (contd)
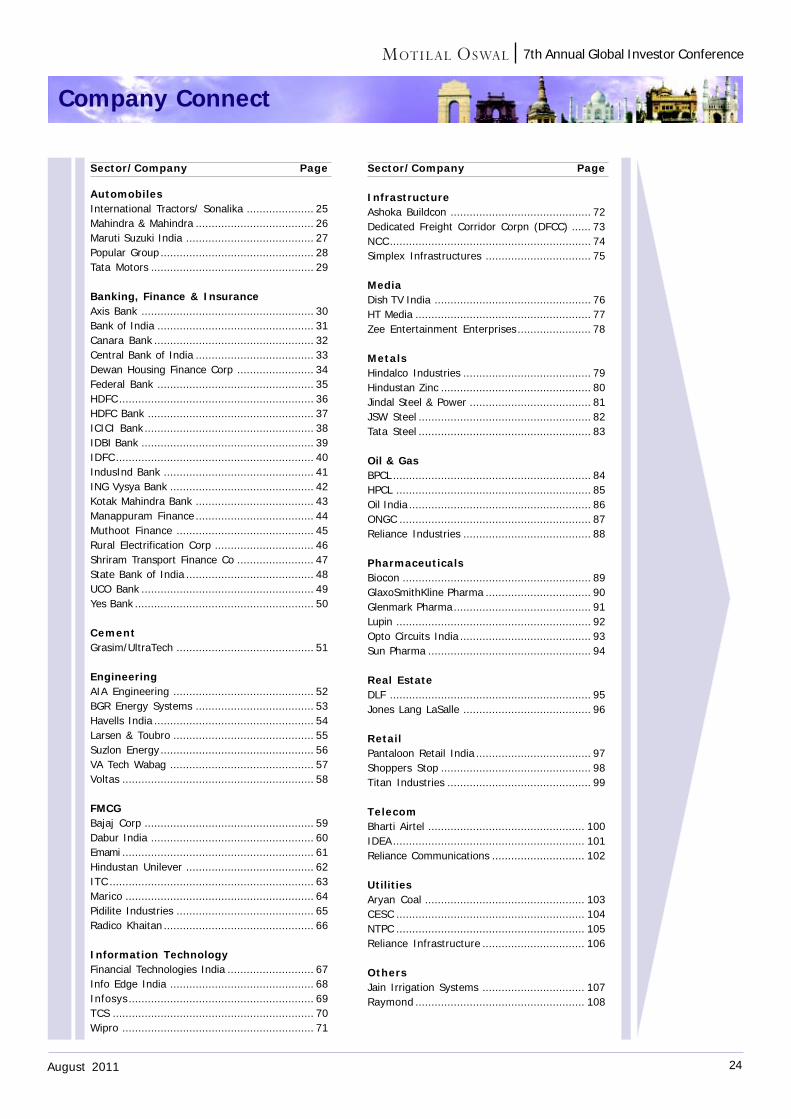
24August 2011
7th Annual Global Investor Conference
Company Connect
Sector/Company Page
AutomobilesInternational Tractors/ Sonalika ..................... 25Mahindra & Mahindra ..................................... 26Maruti Suzuki India ........................................ 27Popular Group ................................................ 28Tata Motors ................................................... 29
Banking, Finance & InsuranceAxis Bank ...................................................... 30Bank of India ................................................. 31Canara Bank .................................................. 32Central Bank of India ..................................... 33Dewan Housing Finance Corp ........................ 34Federal Bank ................................................. 35HDFC ............................................................. 36HDFC Bank .................................................... 37ICICI Bank ..................................................... 38IDBI Bank ...................................................... 39IDFC .............................................................. 40IndusInd Bank ............................................... 41ING Vysya Bank ............................................. 42Kotak Mahindra Bank ..................................... 43Manappuram Finance ..................................... 44Muthoot Finance ........................................... 45Rural Electrification Corp ............................... 46Shriram Transport Finance Co ........................ 47State Bank of India ........................................ 48UCO Bank ...................................................... 49Yes Bank ........................................................ 50
CementGrasim/UltraTech ........................................... 51
EngineeringAIA Engineering ............................................ 52BGR Energy Systems ..................................... 53Havells India .................................................. 54Larsen & Toubro ............................................ 55Suzlon Energy ................................................ 56VA Tech Wabag ............................................. 57Voltas ............................................................ 58
FMCGBajaj Corp ..................................................... 59Dabur India ................................................... 60Emami ............................................................ 61Hindustan Unilever ........................................ 62ITC ................................................................ 63Marico ........................................................... 64Pidilite Industries ........................................... 65Radico Khaitan ............................................... 66
Information TechnologyFinancial Technologies India ........................... 67Info Edge India ............................................. 68Infosys .......................................................... 69TCS ............................................................... 70Wipro ............................................................ 71
Sector/Company Page
InfrastructureAshoka Buildcon ............................................ 72Dedicated Freight Corridor Corpn (DFCC) ...... 73NCC............................................................... 74Simplex Infrastructures ................................. 75
MediaDish TV India ................................................. 76HT Media ....................................................... 77Zee Entertainment Enterprises ....................... 78
MetalsHindalco Industries ........................................ 79Hindustan Zinc ............................................... 80Jindal Steel & Power ...................................... 81JSW Steel ...................................................... 82Tata Steel ...................................................... 83
Oil & GasBPCL .............................................................. 84HPCL ............................................................. 85Oil India ......................................................... 86ONGC ............................................................ 87Reliance Industries ........................................ 88
PharmaceuticalsBiocon ........................................................... 89GlaxoSmithKline Pharma ................................. 90Glenmark Pharma........................................... 91Lupin ............................................................. 92Opto Circuits India ......................................... 93Sun Pharma ................................................... 94
Real EstateDLF ............................................................... 95Jones Lang LaSalle ........................................ 96
RetailPantaloon Retail India .................................... 97Shoppers Stop ............................................... 98Titan Industries ............................................. 99
TelecomBharti Airtel ................................................. 100IDEA ............................................................ 101Reliance Communications ............................. 102
UtilitiesAryan Coal .................................................. 103CESC ........................................................... 104NTPC ........................................................... 105Reliance Infrastructure ................................ 106
OthersJain Irrigation Systems ................................ 107Raymond ..................................................... 108
25August 2011
7th Annual Global Investor Conference
International Tractors
Covering Analyst(s):Jinesh K Gandhi+91 22 3982 [email protected]
Mansi Varma+91 22 3982 [email protected]
Sector: Automobiles
Key Takeaways
Fourth-largest tractor manufacturer in IndiaInternational Tractors is the fourth largest tractor manufacturer in India. It provides acomplete product line, including tractors, multi-utility vehicles, engines, farm machineryattachments, diesel gensets, auto components, and pick & carry cranes. It has tractormanufacturing facilities in Punjab, with total capacity of 70,000 units. Majority of itstractor exports are to North African and SAARC countries.
Expects 18-20% CAGR (FY11-15) for the industry The management expects the size of the Indian tractor industry to reach 0.54m
units by FY12 (~13% growth) and ~1m units by FY15 (CAGR of 18-20%), driven by: Global food shortage driving up crop yields and prices Low tractor penetration levels (especially in the southern region) Government support by higher allocation of expenditure to agriculture Higher non-farm income (NREGA, etc) Rising labor cost and lower availability of labor Increasing access to finance through banks and NBFCs Emergence of corporate farming
Regionally broad-based growth, with West and East growing rapidly (over 50%), asagainst higher dependence on the northern states, earlier.
40-50HP segment is gaining traction, driven by additional non-farm applications.
Capacity expansion endorses robust growth estimates The company will be investing INR2.5b over 2-3 years for capacity expansion from
45,000 units in FY11 to 120,000 units in FY14. It is looking at ~28% volume CAGR (FY11-15) to ~120,000 units and aspires to gain
15% market share in the domestic markets (from 8% currently). While it is very strong in higher HP tractors, International Tractors plans to launch
an 18HP tractor focused on export markets as well as the domestic market. The management anticipates strong growth in the exports market and expects exports
to grow at 38% CAGR over FY11-15 to 25,000 units. The company has strong presence in the North and West (Punjab, Haryana, Western
UP, Gujarat, Chhattisgarh). It is now expanding in the East and the South. It isdoubling its presence in the southern region by adding dealers. It plans to add ~105dealers across the country, taking total dealers to 817.
EBITDA margin to improve from FY11 levels It enjoys above industry average EBITDA margin at ~20%, despite offering better
dealer margins. Higher margins are a result of (a) better product mix, with largercontribution from higher HP tractors, (b) higher operating leverage, (c) focus oncost reduction and value engineering initiatives, (d) higher volumes from tax-freezone, and (e) retention of partial benefit due to lowering of excise duty on components.
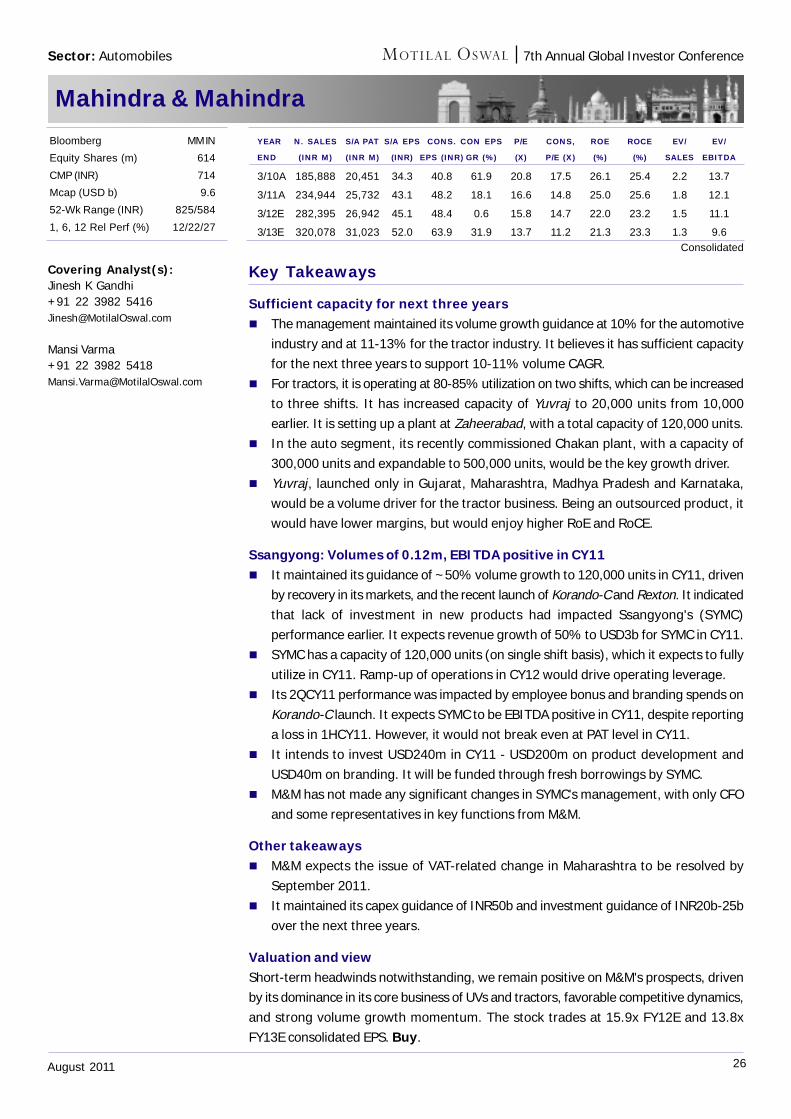
26August 2011
7th Annual Global Investor Conference
Mahindra & Mahindra
Key Takeaways
Sufficient capacity for next three years The management maintained its volume growth guidance at 10% for the automotive
industry and at 11-13% for the tractor industry. It believes it has sufficient capacityfor the next three years to support 10-11% volume CAGR.
For tractors, it is operating at 80-85% utilization on two shifts, which can be increasedto three shifts. It has increased capacity of Yuvraj to 20,000 units from 10,000earlier. It is setting up a plant at Zaheerabad, with a total capacity of 120,000 units.
In the auto segment, its recently commissioned Chakan plant, with a capacity of300,000 units and expandable to 500,000 units, would be the key growth driver.
Yuvraj, launched only in Gujarat, Maharashtra, Madhya Pradesh and Karnataka,would be a volume driver for the tractor business. Being an outsourced product, itwould have lower margins, but would enjoy higher RoE and RoCE.
Ssangyong: Volumes of 0.12m, EBITDA positive in CY11 It maintained its guidance of ~50% volume growth to 120,000 units in CY11, driven
by recovery in its markets, and the recent launch of Korando-C and Rexton. It indicatedthat lack of investment in new products had impacted Ssangyong's (SYMC)performance earlier. It expects revenue growth of 50% to USD3b for SYMC in CY11.
SYMC has a capacity of 120,000 units (on single shift basis), which it expects to fullyutilize in CY11. Ramp-up of operations in CY12 would drive operating leverage.
Its 2QCY11 performance was impacted by employee bonus and branding spends onKorando-C launch. It expects SYMC to be EBITDA positive in CY11, despite reportinga loss in 1HCY11. However, it would not break even at PAT level in CY11.
It intends to invest USD240m in CY11 - USD200m on product development andUSD40m on branding. It will be funded through fresh borrowings by SYMC.
M&M has not made any significant changes in SYMC's management, with only CFOand some representatives in key functions from M&M.
Other takeaways M&M expects the issue of VAT-related change in Maharashtra to be resolved by
September 2011. It maintained its capex guidance of INR50b and investment guidance of INR20b-25b
over the next three years.
Valuation and viewShort-term headwinds notwithstanding, we remain positive on M&M's prospects, drivenby its dominance in its core business of UVs and tractors, favorable competitive dynamics,and strong volume growth momentum. The stock trades at 15.9x FY12E and 13.8xFY13E consolidated EPS. Buy.
Covering Analyst(s):Jinesh K Gandhi+91 22 3982 [email protected]
Mansi Varma+91 22 3982 [email protected]
YEAR N. SALES S/A PAT S/A EPS CONS. CON EPS P/E CONS, ROE ROCE EV/ EV/
END (INR M) (INR M) (INR) EPS (INR) GR (%) (X) P/E (X) (%) (%) SALES EBITDA
3/10A 185,888 20,451 34.3 40.8 61.9 20.8 17.5 26.1 25.4 2.2 13.7
3/11A 234,944 25,732 43.1 48.2 18.1 16.6 14.8 25.0 25.6 1.8 12.1
3/12E 282,395 26,942 45.1 48.4 0.6 15.8 14.7 22.0 23.2 1.5 11.1
3/13E 320,078 31,023 52.0 63.9 31.9 13.7 11.2 21.3 23.3 1.3 9.6
Bloomberg MM IN
Equity Shares (m) 614
CMP (INR) 714
Mcap (USD b) 9.6
52-Wk Range (INR) 825/584
1, 6, 12 Rel Perf (%) 12/22/27
Consolidated
Sector: Automobiles
27August 2011
7th Annual Global Investor Conference
Popular Group
Key Takeaways
One of the largest automobile dealership chains in IndiaThe Popular Group has been in the automobile industry for the last seven decades. It isone of the largest automobile dealership chains in India, with dealerships of MarutiSuzuki (second-largest dealer in India), Honda (cars), Tata Motors (CVs) and Jaguar. Ithas a combined turnover of over INR20b, a workforce of over 6,500, and a network ofover 200 units in Kerala, Chennai and Bangalore.Demand muted, but 6% growth likely in FY12; 15-20% CAGR over 4-5 years It expects its Maruti dealership to grow by 6% in FY12, despite a flat FY12 YTD,
driven by new Swift and pick-up in festive season. While current walk-ins andconversions have declined, it expects demand pick-up during the festive season (17Aug to 17 Sep). Its inventory has increased to ~35 days (from 20-22 days).
It believes that a pause in further rate hikes by RBI would trigger demand recovery. While discount levels are lower in South India, Popular is of the view that current
higher discounts are for pushing non-fast selling models through discounts. It is currently witnessing replacement demand of 35-40% (with ~25% replacement
through exchange program), as against 90-95% replacement demand in developedcountries. Its experience suggests a replacement cycle of 4-5 years.
Spares & Service - key profit driver for the dealer & big opportunity for OEs Spares & Service is a key driver for any dealer, as margins on new car sales are
very low (<5%), whereas profitability on spare sales and service is high (15-20%). For every new car sold, a dealer services 8-10 cars a year (12-13 for Popular), with
normal servicing cycle of once in six months. Non-dealer authorized service centersservice a similar number, taking total cars serviced through OEM-authorized centersto 16-20 cars for every new car sold.
Increasing sophistication and implementation of BS-IV and BS-V would drive outlocal garages for servicing. Further, higher car penetration would drive demand forgenuine spares. Maruti's genuine spares are competitively-priced and the OEM isfocused on reducing usage of spurious spares. Even for OEMs, spare sales (18-20%margins) offer a big opportunity, as all spare supplies to authorized service centers(including dealer) are by the OEM.
Other takeaways The Popular Group, which is also a dealer for Honda cars, has not yet witnessed any
impact of the aggressively-priced Honda Jazz on Swift sales. Being a dealer for both Maruti and Honda, it can differentiate between business
practices of OEMs - dealer friendliness, feedback systems, accessibility to seniorexecutives, etc. It believes Maruti is way ahead of its competitors.
Popular believes that Maruti is improving its quality and value for money (e.g. newSwift), whereas its competitors are going the other way (except Hyundai).
Covering Analyst(s):Jinesh K Gandhi+91 22 3982 [email protected]
Sector: Automobiles
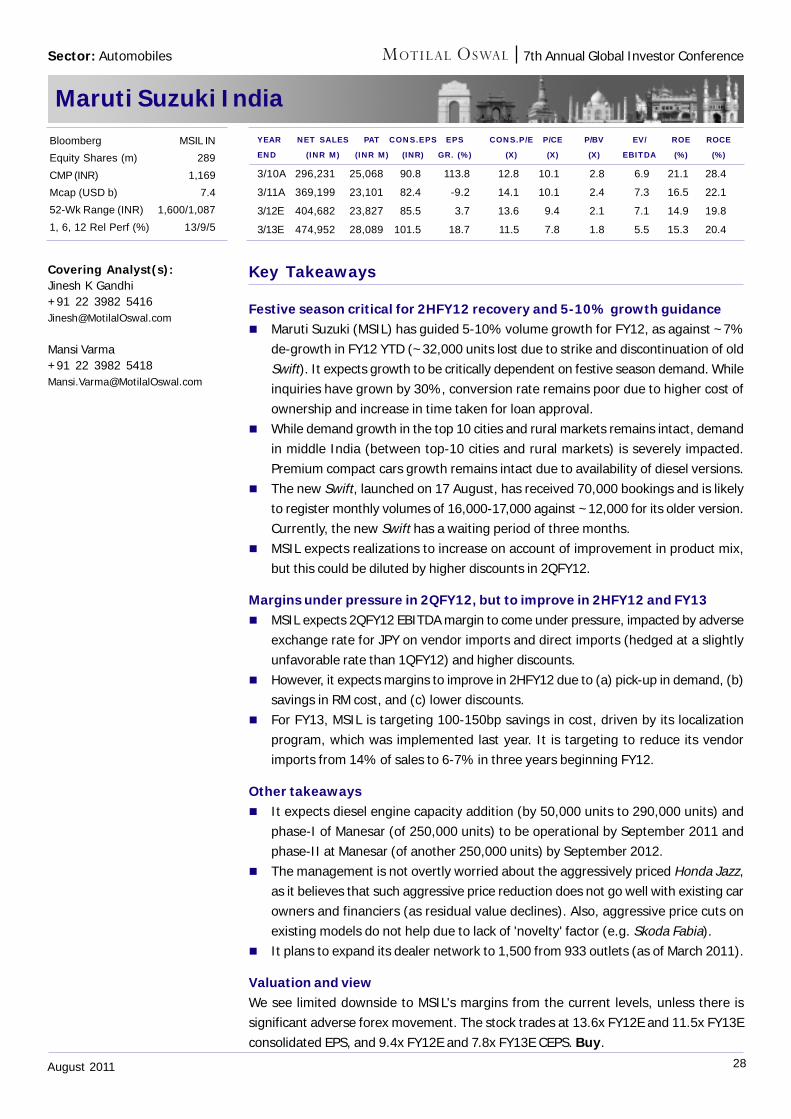
28August 2011
7th Annual Global Investor Conference
Maruti Suzuki India
Key Takeaways
Festive season critical for 2HFY12 recovery and 5-10% growth guidance Maruti Suzuki (MSIL) has guided 5-10% volume growth for FY12, as against ~7%
de-growth in FY12 YTD (~32,000 units lost due to strike and discontinuation of oldSwift). It expects growth to be critically dependent on festive season demand. Whileinquiries have grown by 30%, conversion rate remains poor due to higher cost ofownership and increase in time taken for loan approval.
While demand growth in the top 10 cities and rural markets remains intact, demandin middle India (between top-10 cities and rural markets) is severely impacted.Premium compact cars growth remains intact due to availability of diesel versions.
The new Swift, launched on 17 August, has received 70,000 bookings and is likelyto register monthly volumes of 16,000-17,000 against ~12,000 for its older version.Currently, the new Swift has a waiting period of three months.
MSIL expects realizations to increase on account of improvement in product mix,but this could be diluted by higher discounts in 2QFY12.
Margins under pressure in 2QFY12, but to improve in 2HFY12 and FY13 MSIL expects 2QFY12 EBITDA margin to come under pressure, impacted by adverse
exchange rate for JPY on vendor imports and direct imports (hedged at a slightlyunfavorable rate than 1QFY12) and higher discounts.
However, it expects margins to improve in 2HFY12 due to (a) pick-up in demand, (b)savings in RM cost, and (c) lower discounts.
For FY13, MSIL is targeting 100-150bp savings in cost, driven by its localizationprogram, which was implemented last year. It is targeting to reduce its vendorimports from 14% of sales to 6-7% in three years beginning FY12.
Other takeaways It expects diesel engine capacity addition (by 50,000 units to 290,000 units) and
phase-I of Manesar (of 250,000 units) to be operational by September 2011 andphase-II at Manesar (of another 250,000 units) by September 2012.
The management is not overtly worried about the aggressively priced Honda Jazz,as it believes that such aggressive price reduction does not go well with existing carowners and financiers (as residual value declines). Also, aggressive price cuts onexisting models do not help due to lack of 'novelty' factor (e.g. Skoda Fabia).
It plans to expand its dealer network to 1,500 from 933 outlets (as of March 2011).
Valuation and viewWe see limited downside to MSIL's margins from the current levels, unless there issignificant adverse forex movement. The stock trades at 13.6x FY12E and 11.5x FY13Econsolidated EPS, and 9.4x FY12E and 7.8x FY13E CEPS. Buy.
Covering Analyst(s):Jinesh K Gandhi+91 22 3982 [email protected]
Mansi Varma+91 22 3982 [email protected]
YEAR NET SALES PAT CONS.EPS EPS CONS.P/E P/CE P/BV EV/ ROE ROCE
END (INR M) (INR M) (INR) GR. (%) (X) (X) (X) EBITDA (%) (%)
3/10A 296,231 25,068 90.8 113.8 12.8 10.1 2.8 6.9 21.1 28.4
3/11A 369,199 23,101 82.4 -9.2 14.1 10.1 2.4 7.3 16.5 22.1
3/12E 404,682 23,827 85.5 3.7 13.6 9.4 2.1 7.1 14.9 19.8
3/13E 474,952 28,089 101.5 18.7 11.5 7.8 1.8 5.5 15.3 20.4
Bloomberg MSIL IN
Equity Shares (m) 289
CMP (INR) 1,169
Mcap (USD b) 7.4
52-Wk Range (INR) 1,600/1,087
1, 6, 12 Rel Perf (%) 13/9/5
Sector: Automobiles
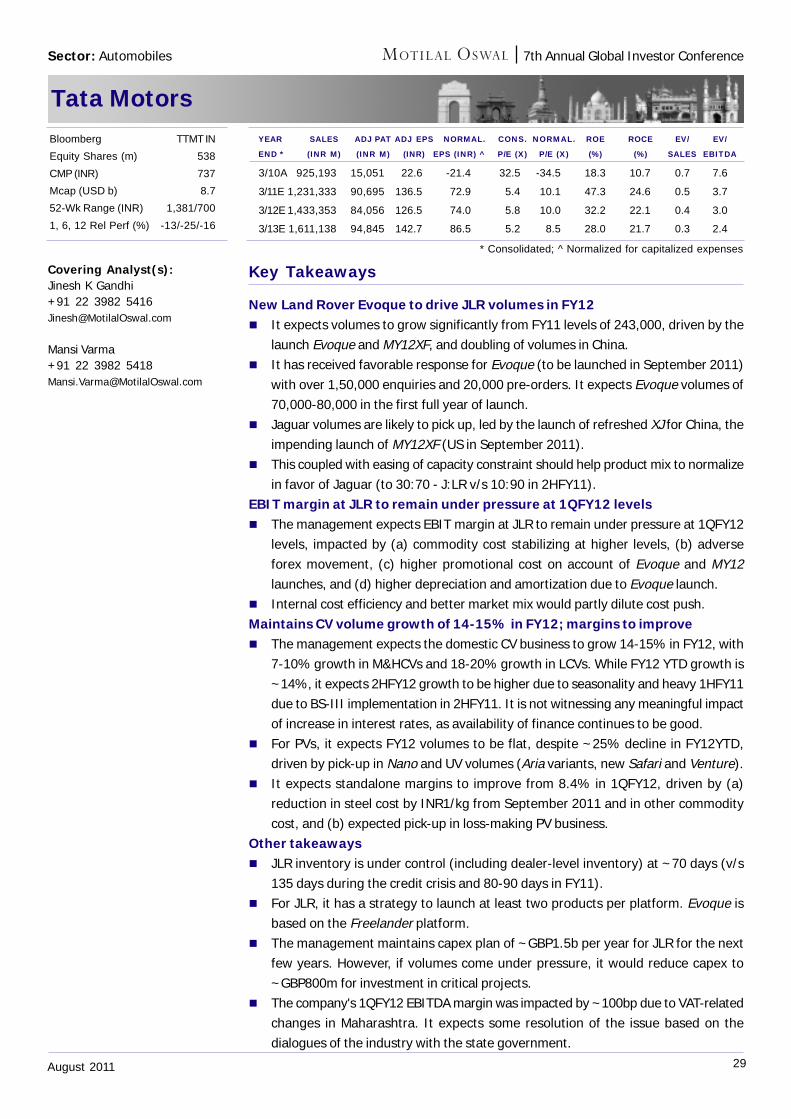
29August 2011
7th Annual Global Investor Conference
Tata Motors
Key Takeaways
New Land Rover Evoque to drive JLR volumes in FY12 It expects volumes to grow significantly from FY11 levels of 243,000, driven by the
launch Evoque and MY12XF, and doubling of volumes in China. It has received favorable response for Evoque (to be launched in September 2011)
with over 1,50,000 enquiries and 20,000 pre-orders. It expects Evoque volumes of70,000-80,000 in the first full year of launch.
Jaguar volumes are likely to pick up, led by the launch of refreshed XJ for China, theimpending launch of MY12XF (US in September 2011).
This coupled with easing of capacity constraint should help product mix to normalizein favor of Jaguar (to 30:70 - J:LR v/s 10:90 in 2HFY11).
EBIT margin at JLR to remain under pressure at 1QFY12 levels The management expects EBIT margin at JLR to remain under pressure at 1QFY12
levels, impacted by (a) commodity cost stabilizing at higher levels, (b) adverseforex movement, (c) higher promotional cost on account of Evoque and MY12launches, and (d) higher depreciation and amortization due to Evoque launch.
Internal cost efficiency and better market mix would partly dilute cost push.Maintains CV volume growth of 14-15% in FY12; margins to improve The management expects the domestic CV business to grow 14-15% in FY12, with
7-10% growth in M&HCVs and 18-20% growth in LCVs. While FY12 YTD growth is~14%, it expects 2HFY12 growth to be higher due to seasonality and heavy 1HFY11due to BS-III implementation in 2HFY11. It is not witnessing any meaningful impactof increase in interest rates, as availability of finance continues to be good.
For PVs, it expects FY12 volumes to be flat, despite ~25% decline in FY12YTD,driven by pick-up in Nano and UV volumes (Aria variants, new Safari and Venture).
It expects standalone margins to improve from 8.4% in 1QFY12, driven by (a)reduction in steel cost by INR1/kg from September 2011 and in other commoditycost, and (b) expected pick-up in loss-making PV business.
Other takeaways JLR inventory is under control (including dealer-level inventory) at ~70 days (v/s
135 days during the credit crisis and 80-90 days in FY11). For JLR, it has a strategy to launch at least two products per platform. Evoque is
based on the Freelander platform. The management maintains capex plan of ~GBP1.5b per year for JLR for the next
few years. However, if volumes come under pressure, it would reduce capex to~GBP800m for investment in critical projects.
The company's 1QFY12 EBITDA margin was impacted by ~100bp due to VAT-relatedchanges in Maharashtra. It expects some resolution of the issue based on thedialogues of the industry with the state government.
Covering Analyst(s):Jinesh K Gandhi+91 22 3982 [email protected]
Mansi Varma+91 22 3982 [email protected]
YEAR SALES ADJ PAT ADJ EPS NORMAL. CONS. NORMAL. ROE ROCE EV/ EV/
END * (INR M) (INR M) (INR) EPS (INR) ^ P/E (X) P/E (X) (%) (%) SALES EBITDA
3/10A 925,193 15,051 22.6 -21.4 32.5 -34.5 18.3 10.7 0.7 7.6
3/11E 1,231,333 90,695 136.5 72.9 5.4 10.1 47.3 24.6 0.5 3.7
3/12E 1,433,353 84,056 126.5 74.0 5.8 10.0 32.2 22.1 0.4 3.0
3/13E 1,611,138 94,845 142.7 86.5 5.2 8.5 28.0 21.7 0.3 2.4
Bloomberg TTMT IN
Equity Shares (m) 538
CMP (INR) 737
Mcap (USD b) 8.7
52-Wk Range (INR) 1,381/700
1, 6, 12 Rel Perf (%) -13/-25/-16
Sector: Automobiles
* Consolidated; ^ Normalized for capitalized expenses
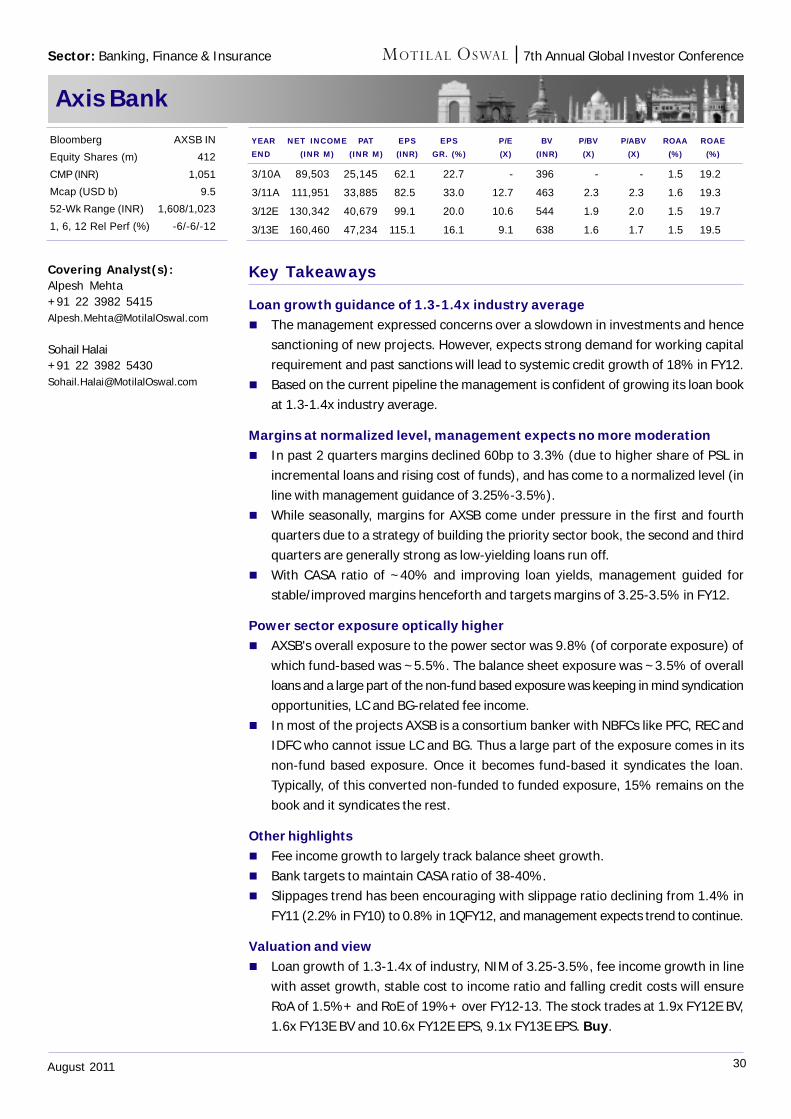
30August 2011
7th Annual Global Investor Conference
Axis Bank
Key Takeaways
Loan growth guidance of 1.3-1.4x industry average The management expressed concerns over a slowdown in investments and hence
sanctioning of new projects. However, expects strong demand for working capitalrequirement and past sanctions will lead to systemic credit growth of 18% in FY12.
Based on the current pipeline the management is confident of growing its loan bookat 1.3-1.4x industry average.
Margins at normalized level, management expects no more moderation In past 2 quarters margins declined 60bp to 3.3% (due to higher share of PSL in
incremental loans and rising cost of funds), and has come to a normalized level (inline with management guidance of 3.25%-3.5%).
While seasonally, margins for AXSB come under pressure in the first and fourthquarters due to a strategy of building the priority sector book, the second and thirdquarters are generally strong as low-yielding loans run off.
With CASA ratio of ~40% and improving loan yields, management guided forstable/improved margins henceforth and targets margins of 3.25-3.5% in FY12.
Power sector exposure optically higher AXSB's overall exposure to the power sector was 9.8% (of corporate exposure) of
which fund-based was ~5.5%. The balance sheet exposure was ~3.5% of overallloans and a large part of the non-fund based exposure was keeping in mind syndicationopportunities, LC and BG-related fee income.
In most of the projects AXSB is a consortium banker with NBFCs like PFC, REC andIDFC who cannot issue LC and BG. Thus a large part of the exposure comes in itsnon-fund based exposure. Once it becomes fund-based it syndicates the loan.Typically, of this converted non-funded to funded exposure, 15% remains on thebook and it syndicates the rest.
Other highlights Fee income growth to largely track balance sheet growth. Bank targets to maintain CASA ratio of 38-40%. Slippages trend has been encouraging with slippage ratio declining from 1.4% in
FY11 (2.2% in FY10) to 0.8% in 1QFY12, and management expects trend to continue.
Valuation and view Loan growth of 1.3-1.4x of industry, NIM of 3.25-3.5%, fee income growth in line
with asset growth, stable cost to income ratio and falling credit costs will ensureRoA of 1.5%+ and RoE of 19%+ over FY12-13. The stock trades at 1.9x FY12E BV,1.6x FY13E BV and 10.6x FY12E EPS, 9.1x FY13E EPS. Buy.
Covering Analyst(s):Alpesh Mehta+91 22 3982 [email protected]
Sohail Halai+91 22 3982 [email protected]
Bloomberg AXSB IN
Equity Shares (m) 412
CMP (INR) 1,051
Mcap (USD b) 9.5
52-Wk Range (INR) 1,608/1,023
1, 6, 12 Rel Perf (%) -6/-6/-12
YEAR NET INCOME PAT EPS EPS P/E BV P/BV P/ABV ROAA ROAEEND (INR M) (INR M) (INR) GR. (%) (X) (INR) (X) (X) (%) (%)
3/10A 89,503 25,145 62.1 22.7 - 396 - - 1.5 19.2
3/11A 111,951 33,885 82.5 33.0 12.7 463 2.3 2.3 1.6 19.3
3/12E 130,342 40,679 99.1 20.0 10.6 544 1.9 2.0 1.5 19.7
3/13E 160,460 47,234 115.1 16.1 9.1 638 1.6 1.7 1.5 19.5
Sector: Banking, Finance & Insurance
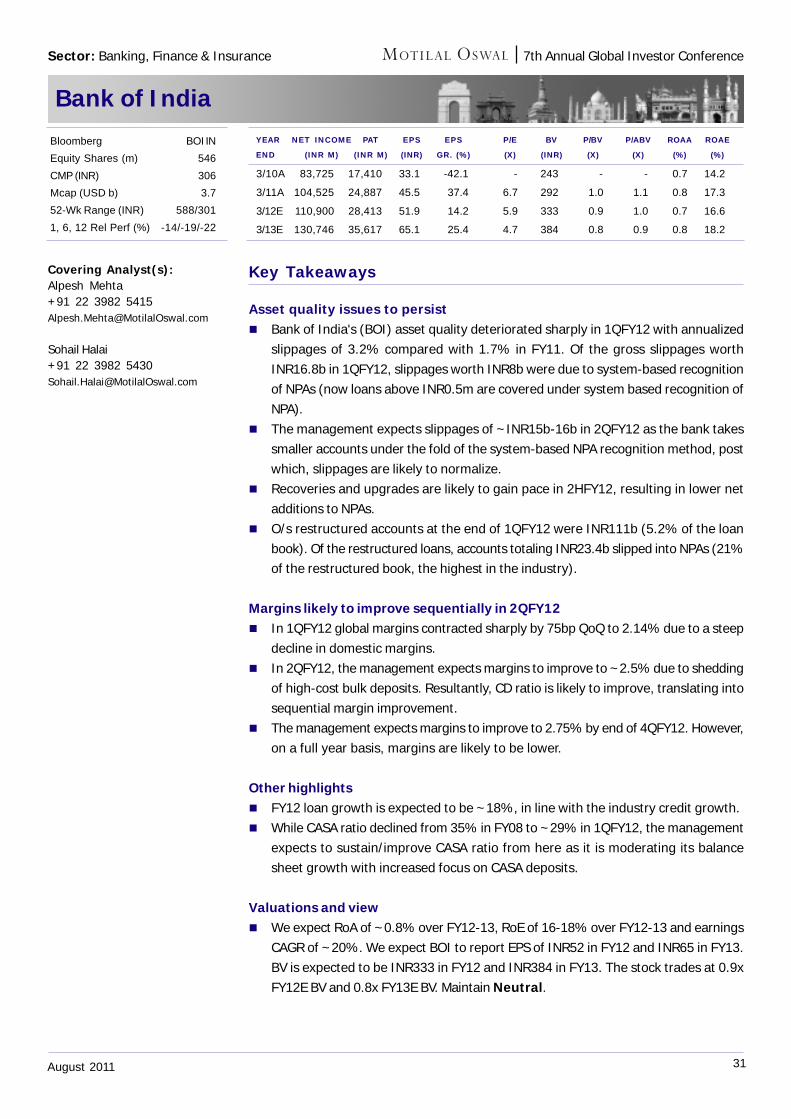
31August 2011
7th Annual Global Investor Conference
Bank of India
Key Takeaways
Asset quality issues to persist Bank of India's (BOI) asset quality deteriorated sharply in 1QFY12 with annualized
slippages of 3.2% compared with 1.7% in FY11. Of the gross slippages worthINR16.8b in 1QFY12, slippages worth INR8b were due to system-based recognitionof NPAs (now loans above INR0.5m are covered under system based recognition ofNPA).
The management expects slippages of ~INR15b-16b in 2QFY12 as the bank takessmaller accounts under the fold of the system-based NPA recognition method, postwhich, slippages are likely to normalize.
Recoveries and upgrades are likely to gain pace in 2HFY12, resulting in lower netadditions to NPAs.
O/s restructured accounts at the end of 1QFY12 were INR111b (5.2% of the loanbook). Of the restructured loans, accounts totaling INR23.4b slipped into NPAs (21%of the restructured book, the highest in the industry).
Margins likely to improve sequentially in 2QFY12 In 1QFY12 global margins contracted sharply by 75bp QoQ to 2.14% due to a steep
decline in domestic margins. In 2QFY12, the management expects margins to improve to ~2.5% due to shedding
of high-cost bulk deposits. Resultantly, CD ratio is likely to improve, translating intosequential margin improvement.
The management expects margins to improve to 2.75% by end of 4QFY12. However,on a full year basis, margins are likely to be lower.
Other highlights FY12 loan growth is expected to be ~18%, in line with the industry credit growth. While CASA ratio declined from 35% in FY08 to ~29% in 1QFY12, the management
expects to sustain/improve CASA ratio from here as it is moderating its balancesheet growth with increased focus on CASA deposits.
Valuations and view We expect RoA of ~0.8% over FY12-13, RoE of 16-18% over FY12-13 and earnings
CAGR of ~20%. We expect BOI to report EPS of INR52 in FY12 and INR65 in FY13.BV is expected to be INR333 in FY12 and INR384 in FY13. The stock trades at 0.9xFY12E BV and 0.8x FY13E BV. Maintain Neutral.
Covering Analyst(s):Alpesh Mehta+91 22 3982 [email protected]
Sohail Halai+91 22 3982 [email protected]
YEAR NET INCOME PAT EPS EPS P/E BV P/BV P/ABV ROAA ROAE
END (INR M) (INR M) (INR) GR. (%) (X) (INR) (X) (X) (%) (%)
3/10A 83,725 17,410 33.1 -42.1 - 243 - - 0.7 14.2
3/11A 104,525 24,887 45.5 37.4 6.7 292 1.0 1.1 0.8 17.3
3/12E 110,900 28,413 51.9 14.2 5.9 333 0.9 1.0 0.7 16.6
3/13E 130,746 35,617 65.1 25.4 4.7 384 0.8 0.9 0.8 18.2
Bloomberg BOI IN
Equity Shares (m) 546
CMP (INR) 306
Mcap (USD b) 3.7
52-Wk Range (INR) 588/301
1, 6, 12 Rel Perf (%) -14/-19/-22
Sector: Banking, Finance & Insurance
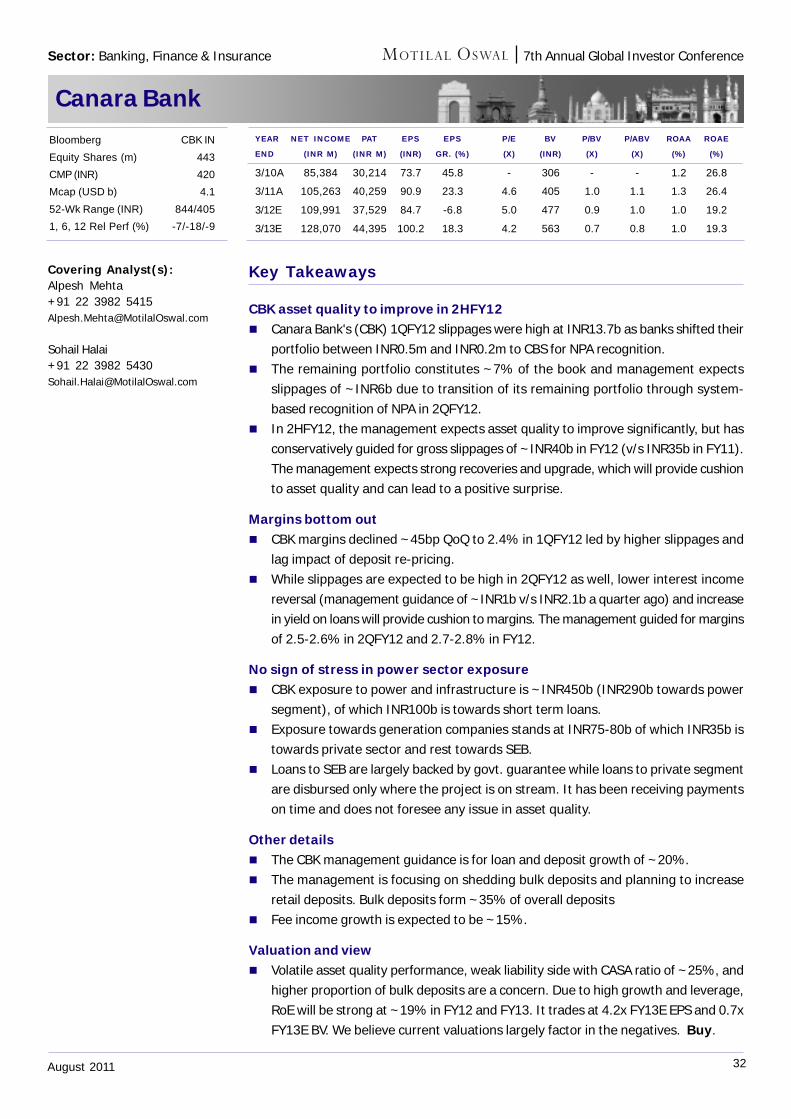
32August 2011
7th Annual Global Investor Conference
Canara Bank
Key Takeaways
CBK asset quality to improve in 2HFY12 Canara Bank's (CBK) 1QFY12 slippages were high at INR13.7b as banks shifted their
portfolio between INR0.5m and INR0.2m to CBS for NPA recognition. The remaining portfolio constitutes ~7% of the book and management expects
slippages of ~INR6b due to transition of its remaining portfolio through system-based recognition of NPA in 2QFY12.
In 2HFY12, the management expects asset quality to improve significantly, but hasconservatively guided for gross slippages of ~INR40b in FY12 (v/s INR35b in FY11).The management expects strong recoveries and upgrade, which will provide cushionto asset quality and can lead to a positive surprise.
Margins bottom out CBK margins declined ~45bp QoQ to 2.4% in 1QFY12 led by higher slippages and
lag impact of deposit re-pricing. While slippages are expected to be high in 2QFY12 as well, lower interest income
reversal (management guidance of ~INR1b v/s INR2.1b a quarter ago) and increasein yield on loans will provide cushion to margins. The management guided for marginsof 2.5-2.6% in 2QFY12 and 2.7-2.8% in FY12.
No sign of stress in power sector exposure CBK exposure to power and infrastructure is ~INR450b (INR290b towards power
segment), of which INR100b is towards short term loans. Exposure towards generation companies stands at INR75-80b of which INR35b is
towards private sector and rest towards SEB. Loans to SEB are largely backed by govt. guarantee while loans to private segment
are disbursed only where the project is on stream. It has been receiving paymentson time and does not foresee any issue in asset quality.
Other details The CBK management guidance is for loan and deposit growth of ~20%. The management is focusing on shedding bulk deposits and planning to increase
retail deposits. Bulk deposits form ~35% of overall deposits Fee income growth is expected to be ~15%.
Valuation and view Volatile asset quality performance, weak liability side with CASA ratio of ~25%, and
higher proportion of bulk deposits are a concern. Due to high growth and leverage,RoE will be strong at ~19% in FY12 and FY13. It trades at 4.2x FY13E EPS and 0.7xFY13E BV. We believe current valuations largely factor in the negatives. Buy.
Covering Analyst(s):Alpesh Mehta+91 22 3982 [email protected]
Sohail Halai+91 22 3982 [email protected]
YEAR NET INCOME PAT EPS EPS P/E BV P/BV P/ABV ROAA ROAE
END (INR M) (INR M) (INR) GR. (%) (X) (INR) (X) (X) (%) (%)
3/10A 85,384 30,214 73.7 45.8 - 306 - - 1.2 26.8
3/11A 105,263 40,259 90.9 23.3 4.6 405 1.0 1.1 1.3 26.4
3/12E 109,991 37,529 84.7 -6.8 5.0 477 0.9 1.0 1.0 19.2
3/13E 128,070 44,395 100.2 18.3 4.2 563 0.7 0.8 1.0 19.3
Bloomberg CBK IN
Equity Shares (m) 443
CMP (INR) 420
Mcap (USD b) 4.1
52-Wk Range (INR) 844/405
1, 6, 12 Rel Perf (%) -7/-18/-9
Sector: Banking, Finance & Insurance
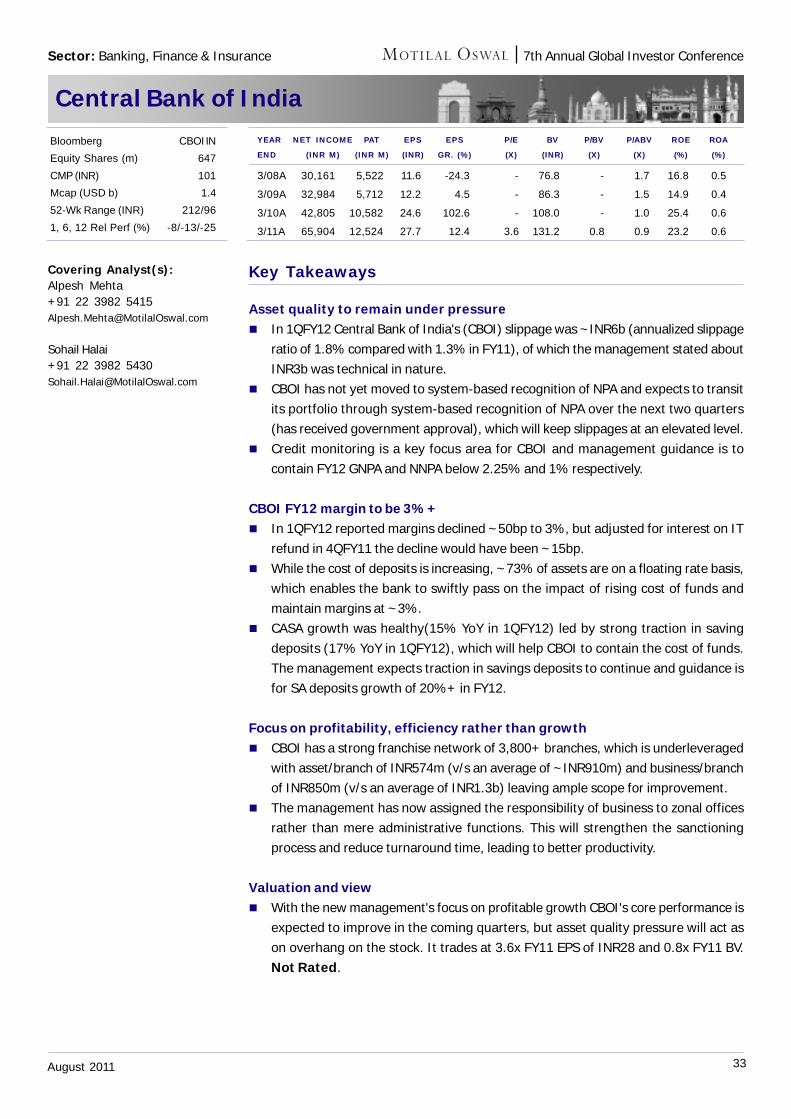
33August 2011
7th Annual Global Investor Conference
Central Bank of India
Key Takeaways
Asset quality to remain under pressure In 1QFY12 Central Bank of India's (CBOI) slippage was ~INR6b (annualized slippage
ratio of 1.8% compared with 1.3% in FY11), of which the management stated aboutINR3b was technical in nature.
CBOI has not yet moved to system-based recognition of NPA and expects to transitits portfolio through system-based recognition of NPA over the next two quarters(has received government approval), which will keep slippages at an elevated level.
Credit monitoring is a key focus area for CBOI and management guidance is tocontain FY12 GNPA and NNPA below 2.25% and 1% respectively.
CBOI FY12 margin to be 3%+ In 1QFY12 reported margins declined ~50bp to 3%, but adjusted for interest on IT
refund in 4QFY11 the decline would have been ~15bp. While the cost of deposits is increasing, ~73% of assets are on a floating rate basis,
which enables the bank to swiftly pass on the impact of rising cost of funds andmaintain margins at ~3%.
CASA growth was healthy(15% YoY in 1QFY12) led by strong traction in savingdeposits (17% YoY in 1QFY12), which will help CBOI to contain the cost of funds.The management expects traction in savings deposits to continue and guidance isfor SA deposits growth of 20%+ in FY12.
Focus on profitability, efficiency rather than growth CBOI has a strong franchise network of 3,800+ branches, which is underleveraged
with asset/branch of INR574m (v/s an average of ~INR910m) and business/branchof INR850m (v/s an average of INR1.3b) leaving ample scope for improvement.
The management has now assigned the responsibility of business to zonal officesrather than mere administrative functions. This will strengthen the sanctioningprocess and reduce turnaround time, leading to better productivity.
Valuation and view With the new management's focus on profitable growth CBOI's core performance is
expected to improve in the coming quarters, but asset quality pressure will act ason overhang on the stock. It trades at 3.6x FY11 EPS of INR28 and 0.8x FY11 BV.Not Rated.
Covering Analyst(s):Alpesh Mehta+91 22 3982 [email protected]
Sohail Halai+91 22 3982 [email protected]
YEAR NET INCOME PAT EPS EPS P/E BV P/BV P/ABV ROE ROA
END (INR M) (INR M) (INR) GR. (%) (X) (INR) (X) (X) (%) (%)
3/08A 30,161 5,522 11.6 -24.3 - 76.8 - 1.7 16.8 0.5
3/09A 32,984 5,712 12.2 4.5 - 86.3 - 1.5 14.9 0.4
3/10A 42,805 10,582 24.6 102.6 - 108.0 - 1.0 25.4 0.6
3/11A 65,904 12,524 27.7 12.4 3.6 131.2 0.8 0.9 23.2 0.6
Bloomberg CBOI IN
Equity Shares (m) 647
CMP (INR) 101
Mcap (USD b) 1.4
52-Wk Range (INR) 212/96
1, 6, 12 Rel Perf (%) -8/-13/-25
Sector: Banking, Finance & Insurance
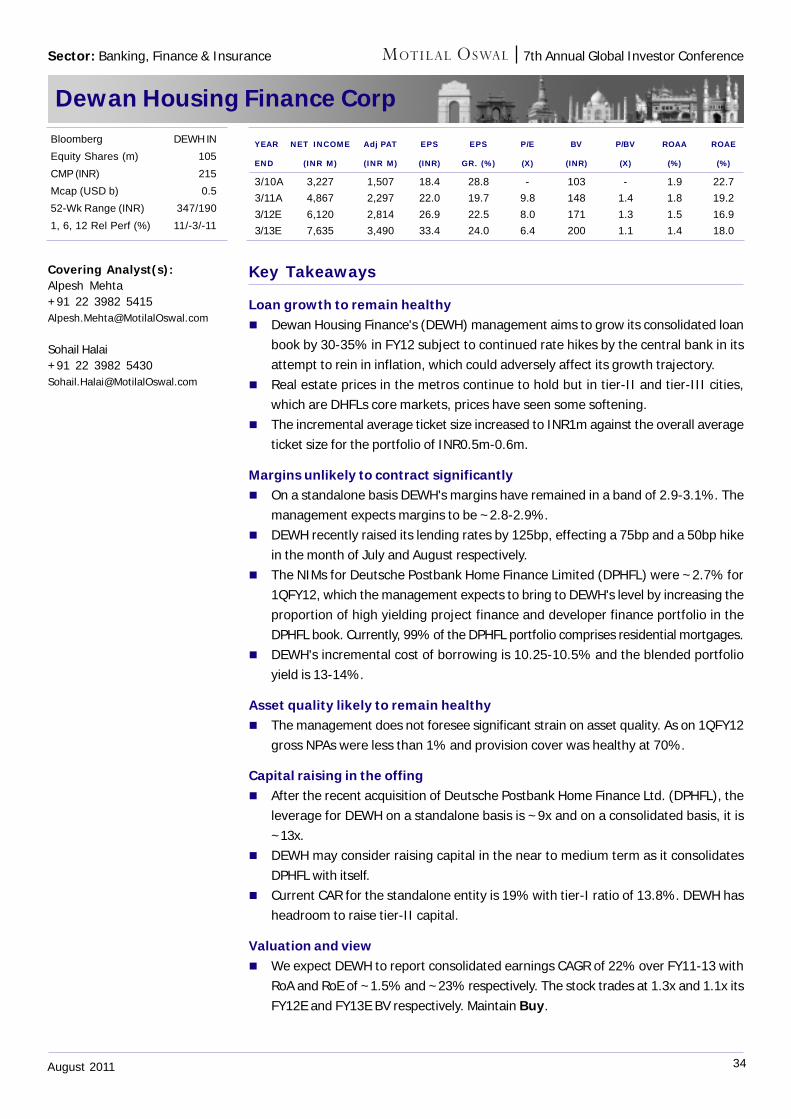
34August 2011
7th Annual Global Investor Conference
Dewan Housing Finance Corp
Key Takeaways
Loan growth to remain healthy Dewan Housing Finance's (DEWH) management aims to grow its consolidated loan
book by 30-35% in FY12 subject to continued rate hikes by the central bank in itsattempt to rein in inflation, which could adversely affect its growth trajectory.
Real estate prices in the metros continue to hold but in tier-II and tier-III cities,which are DHFLs core markets, prices have seen some softening.
The incremental average ticket size increased to INR1m against the overall averageticket size for the portfolio of INR0.5m-0.6m.
Margins unlikely to contract significantly On a standalone basis DEWH's margins have remained in a band of 2.9-3.1%. The
management expects margins to be ~2.8-2.9%. DEWH recently raised its lending rates by 125bp, effecting a 75bp and a 50bp hike
in the month of July and August respectively. The NIMs for Deutsche Postbank Home Finance Limited (DPHFL) were ~2.7% for
1QFY12, which the management expects to bring to DEWH's level by increasing theproportion of high yielding project finance and developer finance portfolio in theDPHFL book. Currently, 99% of the DPHFL portfolio comprises residential mortgages.
DEWH's incremental cost of borrowing is 10.25-10.5% and the blended portfolioyield is 13-14%.
Asset quality likely to remain healthy The management does not foresee significant strain on asset quality. As on 1QFY12
gross NPAs were less than 1% and provision cover was healthy at 70%.
Capital raising in the offing After the recent acquisition of Deutsche Postbank Home Finance Ltd. (DPHFL), the
leverage for DEWH on a standalone basis is ~9x and on a consolidated basis, it is~13x.
DEWH may consider raising capital in the near to medium term as it consolidatesDPHFL with itself.
Current CAR for the standalone entity is 19% with tier-I ratio of 13.8%. DEWH hasheadroom to raise tier-II capital.
Valuation and view We expect DEWH to report consolidated earnings CAGR of 22% over FY11-13 with
RoA and RoE of ~1.5% and ~23% respectively. The stock trades at 1.3x and 1.1x itsFY12E and FY13E BV respectively. Maintain Buy.
Covering Analyst(s):Alpesh Mehta+91 22 3982 [email protected]
Sohail Halai+91 22 3982 [email protected]
Bloomberg DEWH IN
Equity Shares (m) 105
CMP (INR) 215
Mcap (USD b) 0.5
52-Wk Range (INR) 347/190
1, 6, 12 Rel Perf (%) 11/-3/-11
YEAR NET INCOME Adj PAT EPS EPS P/E BV P/BV ROAA ROAE
END (INR M) (INR M) (INR) GR. (%) (X) (INR) (X) (%) (%)
3/10A 3,227 1,507 18.4 28.8 - 103 - 1.9 22.7
3/11A 4,867 2,297 22.0 19.7 9.8 148 1.4 1.8 19.2
3/12E 6,120 2,814 26.9 22.5 8.0 171 1.3 1.5 16.9
3/13E 7,635 3,490 33.4 24.0 6.4 200 1.1 1.4 18.0
Sector: Banking, Finance & Insurance
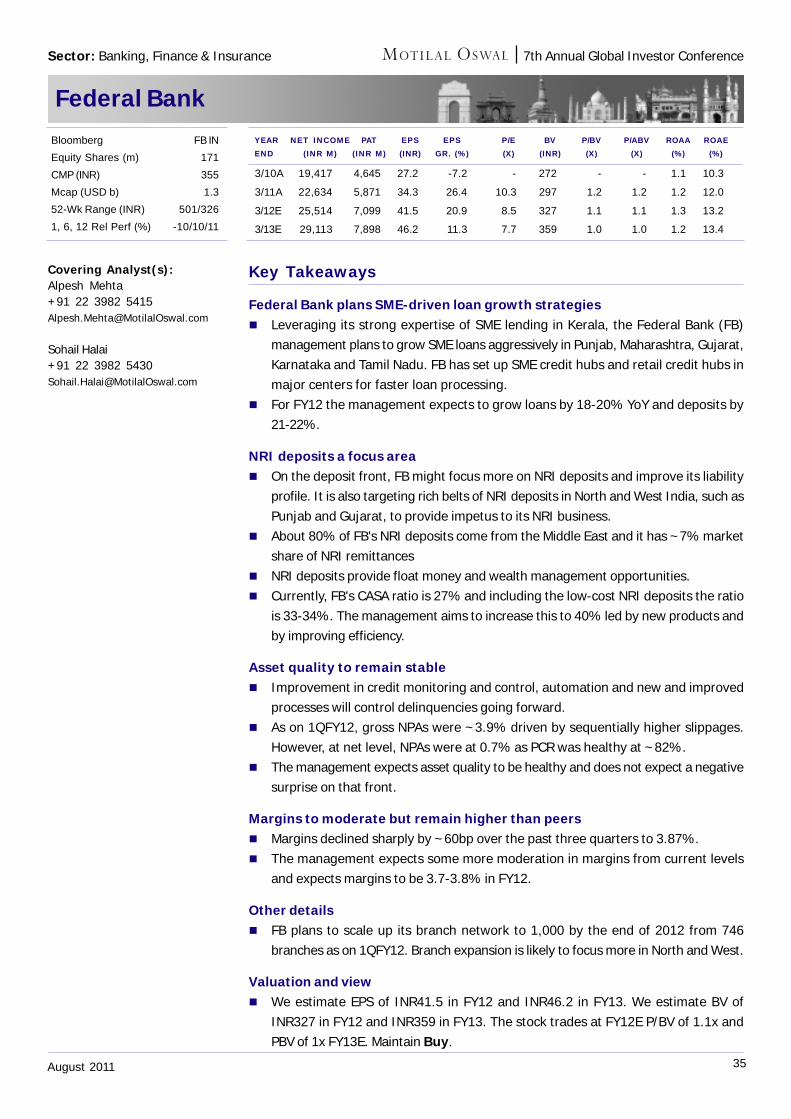
35August 2011
7th Annual Global Investor Conference
Federal Bank
Key Takeaways
Federal Bank plans SME-driven loan growth strategies Leveraging its strong expertise of SME lending in Kerala, the Federal Bank (FB)
management plans to grow SME loans aggressively in Punjab, Maharashtra, Gujarat,Karnataka and Tamil Nadu. FB has set up SME credit hubs and retail credit hubs inmajor centers for faster loan processing.
For FY12 the management expects to grow loans by 18-20% YoY and deposits by21-22%.
NRI deposits a focus area On the deposit front, FB might focus more on NRI deposits and improve its liability
profile. It is also targeting rich belts of NRI deposits in North and West India, such asPunjab and Gujarat, to provide impetus to its NRI business.
About 80% of FB's NRI deposits come from the Middle East and it has ~7% marketshare of NRI remittances
NRI deposits provide float money and wealth management opportunities. Currently, FB's CASA ratio is 27% and including the low-cost NRI deposits the ratio
is 33-34%. The management aims to increase this to 40% led by new products andby improving efficiency.
Asset quality to remain stable Improvement in credit monitoring and control, automation and new and improved
processes will control delinquencies going forward. As on 1QFY12, gross NPAs were ~3.9% driven by sequentially higher slippages.
However, at net level, NPAs were at 0.7% as PCR was healthy at ~82%. The management expects asset quality to be healthy and does not expect a negative
surprise on that front.
Margins to moderate but remain higher than peers Margins declined sharply by ~60bp over the past three quarters to 3.87%. The management expects some more moderation in margins from current levels
and expects margins to be 3.7-3.8% in FY12.
Other details FB plans to scale up its branch network to 1,000 by the end of 2012 from 746
branches as on 1QFY12. Branch expansion is likely to focus more in North and West.
Valuation and view We estimate EPS of INR41.5 in FY12 and INR46.2 in FY13. We estimate BV of
INR327 in FY12 and INR359 in FY13. The stock trades at FY12E P/BV of 1.1x andPBV of 1x FY13E. Maintain Buy.
Covering Analyst(s):Alpesh Mehta+91 22 3982 [email protected]
Sohail Halai+91 22 3982 [email protected]
Bloomberg FB IN
Equity Shares (m) 171
CMP (INR) 355
Mcap (USD b) 1.3
52-Wk Range (INR) 501/326
1, 6, 12 Rel Perf (%) -10/10/11
YEAR NET INCOME PAT EPS EPS P/E BV P/BV P/ABV ROAA ROAEEND (INR M) (INR M) (INR) GR. (%) (X) (INR) (X) (X) (%) (%)
3/10A 19,417 4,645 27.2 -7.2 - 272 - - 1.1 10.3
3/11A 22,634 5,871 34.3 26.4 10.3 297 1.2 1.2 1.2 12.0
3/12E 25,514 7,099 41.5 20.9 8.5 327 1.1 1.1 1.3 13.2
3/13E 29,113 7,898 46.2 11.3 7.7 359 1.0 1.0 1.2 13.4
Sector: Banking, Finance & Insurance
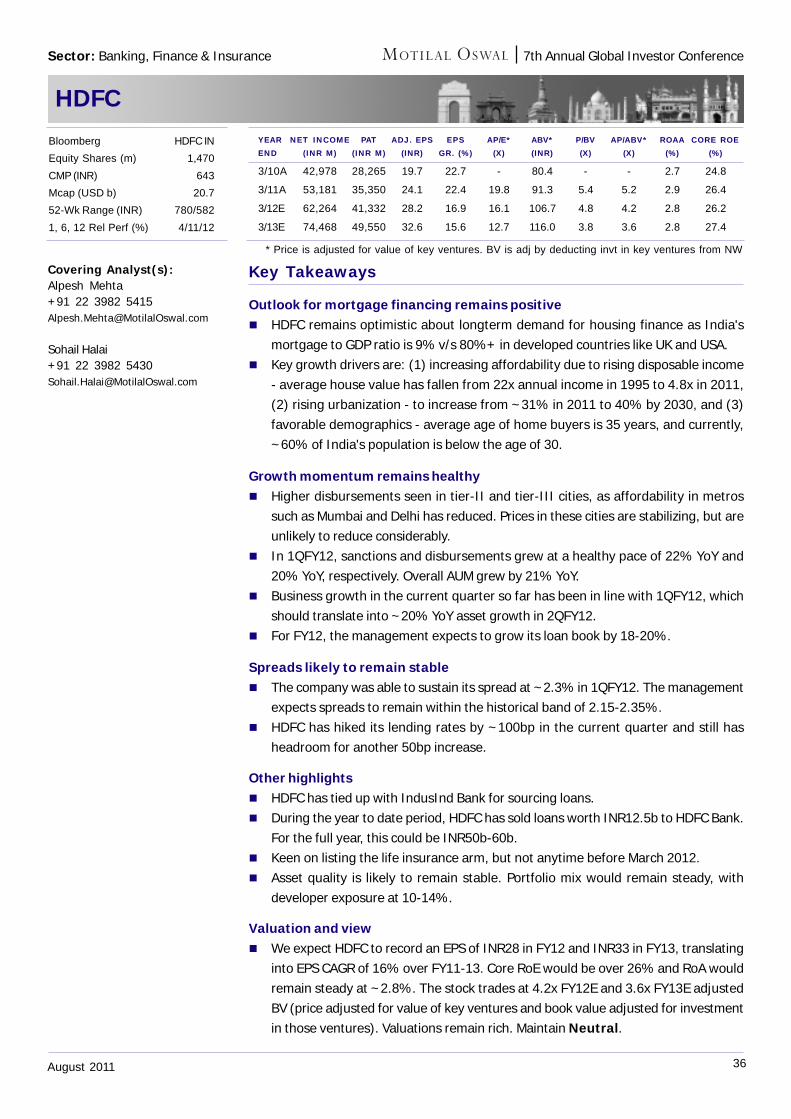
36August 2011
7th Annual Global Investor Conference
HDFC
Key Takeaways
Outlook for mortgage financing remains positive HDFC remains optimistic about longterm demand for housing finance as India's
mortgage to GDP ratio is 9% v/s 80%+ in developed countries like UK and USA. Key growth drivers are: (1) increasing affordability due to rising disposable income
- average house value has fallen from 22x annual income in 1995 to 4.8x in 2011,(2) rising urbanization - to increase from ~31% in 2011 to 40% by 2030, and (3)favorable demographics - average age of home buyers is 35 years, and currently,~60% of India's population is below the age of 30.
Growth momentum remains healthy Higher disbursements seen in tier-II and tier-III cities, as affordability in metros
such as Mumbai and Delhi has reduced. Prices in these cities are stabilizing, but areunlikely to reduce considerably.
In 1QFY12, sanctions and disbursements grew at a healthy pace of 22% YoY and20% YoY, respectively. Overall AUM grew by 21% YoY.
Business growth in the current quarter so far has been in line with 1QFY12, whichshould translate into ~20% YoY asset growth in 2QFY12.
For FY12, the management expects to grow its loan book by 18-20%.
Spreads likely to remain stable The company was able to sustain its spread at ~2.3% in 1QFY12. The management
expects spreads to remain within the historical band of 2.15-2.35%. HDFC has hiked its lending rates by ~100bp in the current quarter and still has
headroom for another 50bp increase.
Other highlights HDFC has tied up with IndusInd Bank for sourcing loans. During the year to date period, HDFC has sold loans worth INR12.5b to HDFC Bank.
For the full year, this could be INR50b-60b. Keen on listing the life insurance arm, but not anytime before March 2012. Asset quality is likely to remain stable. Portfolio mix would remain steady, with
developer exposure at 10-14%.
Valuation and view We expect HDFC to record an EPS of INR28 in FY12 and INR33 in FY13, translating
into EPS CAGR of 16% over FY11-13. Core RoE would be over 26% and RoA wouldremain steady at ~2.8%. The stock trades at 4.2x FY12E and 3.6x FY13E adjustedBV (price adjusted for value of key ventures and book value adjusted for investmentin those ventures). Valuations remain rich. Maintain Neutral.
Covering Analyst(s):Alpesh Mehta+91 22 3982 [email protected]
Sohail Halai+91 22 3982 [email protected]
YEAR NET INCOME PAT ADJ. EPS EPS AP/E* ABV* P/BV AP/ABV* ROAA CORE ROEEND (INR M) (INR M) (INR) GR. (%) (X) (INR) (X) (X) (%) (%)
3/10A 42,978 28,265 19.7 22.7 - 80.4 - - 2.7 24.8
3/11A 53,181 35,350 24.1 22.4 19.8 91.3 5.4 5.2 2.9 26.4
3/12E 62,264 41,332 28.2 16.9 16.1 106.7 4.8 4.2 2.8 26.2
3/13E 74,468 49,550 32.6 15.6 12.7 116.0 3.8 3.6 2.8 27.4
Bloomberg HDFC IN
Equity Shares (m) 1,470
CMP (INR) 643
Mcap (USD b) 20.7
52-Wk Range (INR) 780/582
1, 6, 12 Rel Perf (%) 4/11/12
Sector: Banking, Finance & Insurance
* Price is adjusted for value of key ventures. BV is adj by deducting invt in key ventures from NW
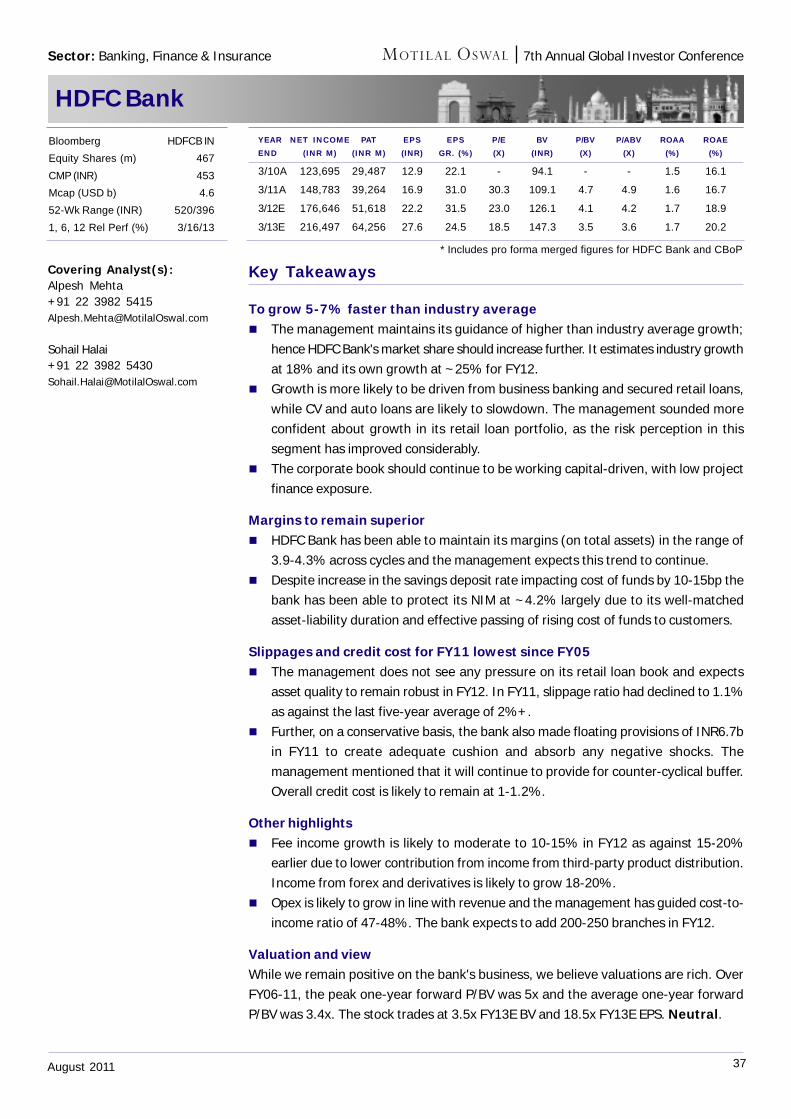
37August 2011
7th Annual Global Investor Conference
HDFC Bank
Key Takeaways
To grow 5-7% faster than industry average The management maintains its guidance of higher than industry average growth;
hence HDFC Bank's market share should increase further. It estimates industry growthat 18% and its own growth at ~25% for FY12.
Growth is more likely to be driven from business banking and secured retail loans,while CV and auto loans are likely to slowdown. The management sounded moreconfident about growth in its retail loan portfolio, as the risk perception in thissegment has improved considerably.
The corporate book should continue to be working capital-driven, with low projectfinance exposure.
Margins to remain superior HDFC Bank has been able to maintain its margins (on total assets) in the range of
3.9-4.3% across cycles and the management expects this trend to continue. Despite increase in the savings deposit rate impacting cost of funds by 10-15bp the
bank has been able to protect its NIM at ~4.2% largely due to its well-matchedasset-liability duration and effective passing of rising cost of funds to customers.
Slippages and credit cost for FY11 lowest since FY05 The management does not see any pressure on its retail loan book and expects
asset quality to remain robust in FY12. In FY11, slippage ratio had declined to 1.1%as against the last five-year average of 2%+.
Further, on a conservative basis, the bank also made floating provisions of INR6.7bin FY11 to create adequate cushion and absorb any negative shocks. Themanagement mentioned that it will continue to provide for counter-cyclical buffer.Overall credit cost is likely to remain at 1-1.2%.
Other highlights Fee income growth is likely to moderate to 10-15% in FY12 as against 15-20%
earlier due to lower contribution from income from third-party product distribution.Income from forex and derivatives is likely to grow 18-20%.
Opex is likely to grow in line with revenue and the management has guided cost-to-income ratio of 47-48%. The bank expects to add 200-250 branches in FY12.
Valuation and viewWhile we remain positive on the bank's business, we believe valuations are rich. OverFY06-11, the peak one-year forward P/BV was 5x and the average one-year forwardP/BV was 3.4x. The stock trades at 3.5x FY13E BV and 18.5x FY13E EPS. Neutral.
Covering Analyst(s):Alpesh Mehta+91 22 3982 [email protected]
Sohail Halai+91 22 3982 [email protected]
Sector: Banking, Finance & Insurance
YEAR NET INCOME PAT EPS EPS P/E BV P/BV P/ABV ROAA ROAEEND (INR M) (INR M) (INR) GR. (%) (X) (INR) (X) (X) (%) (%)
3/10A 123,695 29,487 12.9 22.1 - 94.1 - - 1.5 16.1
3/11A 148,783 39,264 16.9 31.0 30.3 109.1 4.7 4.9 1.6 16.7
3/12E 176,646 51,618 22.2 31.5 23.0 126.1 4.1 4.2 1.7 18.9
3/13E 216,497 64,256 27.6 24.5 18.5 147.3 3.5 3.6 1.7 20.2
Bloomberg HDFCB IN
Equity Shares (m) 467
CMP (INR) 453
Mcap (USD b) 4.6
52-Wk Range (INR) 520/396
1, 6, 12 Rel Perf (%) 3/16/13
* Includes pro forma merged figures for HDFC Bank and CBoP
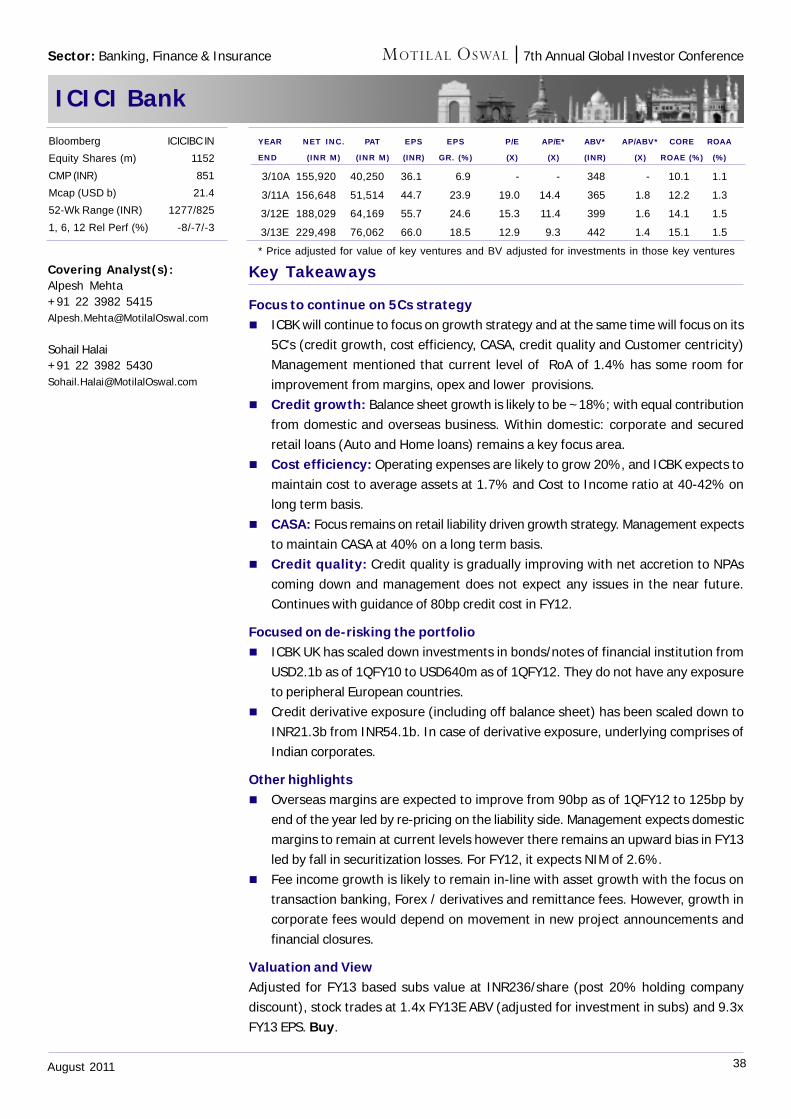
38August 2011
7th Annual Global Investor Conference
ICICI Bank
Key Takeaways
Focus to continue on 5Cs strategy ICBK will continue to focus on growth strategy and at the same time will focus on its
5C's (credit growth, cost efficiency, CASA, credit quality and Customer centricity)Management mentioned that current level of RoA of 1.4% has some room forimprovement from margins, opex and lower provisions.
Credit growth: Balance sheet growth is likely to be ~18%; with equal contributionfrom domestic and overseas business. Within domestic: corporate and securedretail loans (Auto and Home loans) remains a key focus area.
Cost efficiency: Operating expenses are likely to grow 20%, and ICBK expects tomaintain cost to average assets at 1.7% and Cost to Income ratio at 40-42% onlong term basis.
CASA: Focus remains on retail liability driven growth strategy. Management expectsto maintain CASA at 40% on a long term basis.
Credit quality: Credit quality is gradually improving with net accretion to NPAscoming down and management does not expect any issues in the near future.Continues with guidance of 80bp credit cost in FY12.
Focused on de-risking the portfolio ICBK UK has scaled down investments in bonds/notes of financial institution from
USD2.1b as of 1QFY10 to USD640m as of 1QFY12. They do not have any exposureto peripheral European countries.
Credit derivative exposure (including off balance sheet) has been scaled down toINR21.3b from INR54.1b. In case of derivative exposure, underlying comprises ofIndian corporates.
Other highlights Overseas margins are expected to improve from 90bp as of 1QFY12 to 125bp by
end of the year led by re-pricing on the liability side. Management expects domesticmargins to remain at current levels however there remains an upward bias in FY13led by fall in securitization losses. For FY12, it expects NIM of 2.6%.
Fee income growth is likely to remain in-line with asset growth with the focus ontransaction banking, Forex / derivatives and remittance fees. However, growth incorporate fees would depend on movement in new project announcements andfinancial closures.
Valuation and ViewAdjusted for FY13 based subs value at INR236/share (post 20% holding companydiscount), stock trades at 1.4x FY13E ABV (adjusted for investment in subs) and 9.3xFY13 EPS. Buy.
Covering Analyst(s):Alpesh Mehta+91 22 3982 [email protected]
Sohail Halai+91 22 3982 [email protected]
YEAR NET INC. PAT EPS EPS P/E AP/E* ABV* AP/ABV* CORE ROAA
END (INR M) (INR M) (INR) GR. (%) (X) (X) (INR) (X) ROAE (%) (%)
3/10A 155,920 40,250 36.1 6.9 - - 348 - 10.1 1.1
3/11A 156,648 51,514 44.7 23.9 19.0 14.4 365 1.8 12.2 1.3
3/12E 188,029 64,169 55.7 24.6 15.3 11.4 399 1.6 14.1 1.5
3/13E 229,498 76,062 66.0 18.5 12.9 9.3 442 1.4 15.1 1.5
* Price adjusted for value of key ventures and BV adjusted for investments in those key ventures
Bloomberg ICICIBC IN
Equity Shares (m) 1152
CMP (INR) 851
Mcap (USD b) 21.4
52-Wk Range (INR) 1277/825
1, 6, 12 Rel Perf (%) -8/-7/-3
Sector: Banking, Finance & Insurance
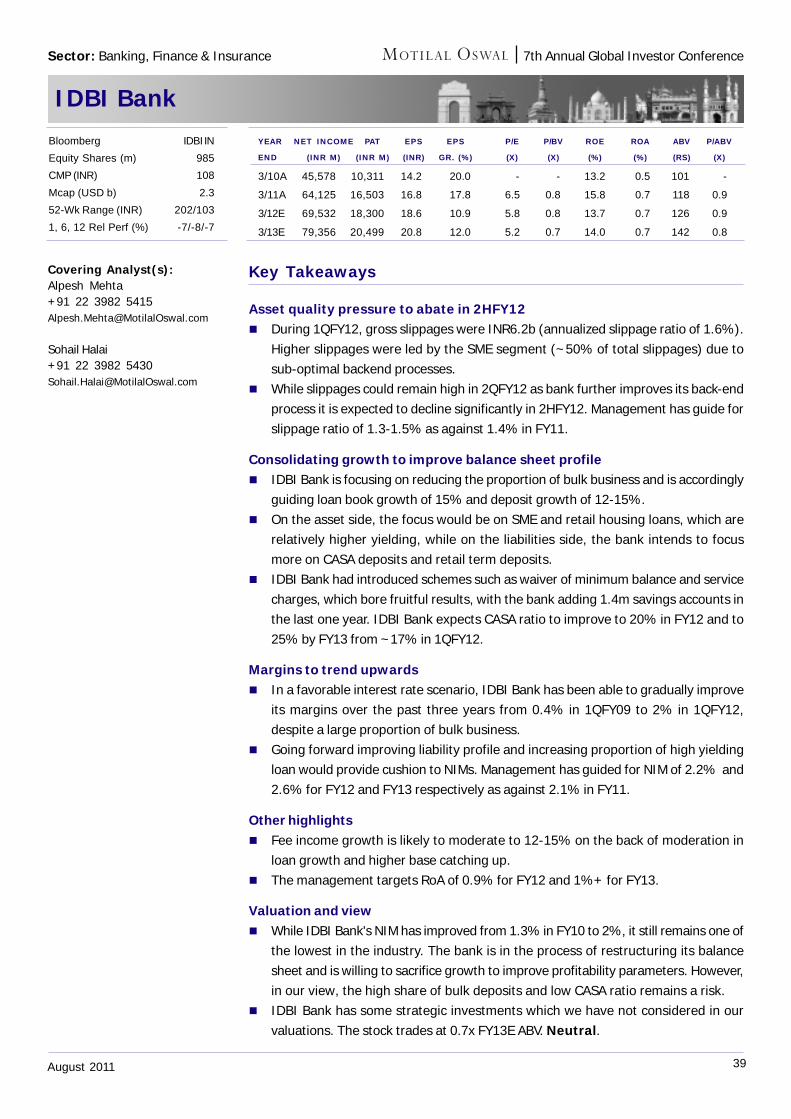
39August 2011
7th Annual Global Investor Conference
IDBI Bank
Key Takeaways
Asset quality pressure to abate in 2HFY12 During 1QFY12, gross slippages were INR6.2b (annualized slippage ratio of 1.6%).
Higher slippages were led by the SME segment (~50% of total slippages) due tosub-optimal backend processes.
While slippages could remain high in 2QFY12 as bank further improves its back-endprocess it is expected to decline significantly in 2HFY12. Management has guide forslippage ratio of 1.3-1.5% as against 1.4% in FY11.
Consolidating growth to improve balance sheet profile IDBI Bank is focusing on reducing the proportion of bulk business and is accordingly
guiding loan book growth of 15% and deposit growth of 12-15%. On the asset side, the focus would be on SME and retail housing loans, which are
relatively higher yielding, while on the liabilities side, the bank intends to focusmore on CASA deposits and retail term deposits.
IDBI Bank had introduced schemes such as waiver of minimum balance and servicecharges, which bore fruitful results, with the bank adding 1.4m savings accounts inthe last one year. IDBI Bank expects CASA ratio to improve to 20% in FY12 and to25% by FY13 from ~17% in 1QFY12.
Margins to trend upwards In a favorable interest rate scenario, IDBI Bank has been able to gradually improve
its margins over the past three years from 0.4% in 1QFY09 to 2% in 1QFY12,despite a large proportion of bulk business.
Going forward improving liability profile and increasing proportion of high yieldingloan would provide cushion to NIMs. Management has guided for NIM of 2.2% and2.6% for FY12 and FY13 respectively as against 2.1% in FY11.
Other highlights Fee income growth is likely to moderate to 12-15% on the back of moderation in
loan growth and higher base catching up. The management targets RoA of 0.9% for FY12 and 1%+ for FY13.
Valuation and view While IDBI Bank's NIM has improved from 1.3% in FY10 to 2%, it still remains one of
the lowest in the industry. The bank is in the process of restructuring its balancesheet and is willing to sacrifice growth to improve profitability parameters. However,in our view, the high share of bulk deposits and low CASA ratio remains a risk.
IDBI Bank has some strategic investments which we have not considered in ourvaluations. The stock trades at 0.7x FY13E ABV. Neutral.
Covering Analyst(s):Alpesh Mehta+91 22 3982 [email protected]
Sohail Halai+91 22 3982 [email protected]
YEAR NET INCOME PAT EPS EPS P/E P/BV ROE ROA ABV P/ABV
END (INR M) (INR M) (INR) GR. (%) (X) (X) (%) (%) (RS) (X)
3/10A 45,578 10,311 14.2 20.0 - - 13.2 0.5 101 -
3/11A 64,125 16,503 16.8 17.8 6.5 0.8 15.8 0.7 118 0.9
3/12E 69,532 18,300 18.6 10.9 5.8 0.8 13.7 0.7 126 0.9
3/13E 79,356 20,499 20.8 12.0 5.2 0.7 14.0 0.7 142 0.8
Bloomberg IDBI IN
Equity Shares (m) 985
CMP (INR) 108
Mcap (USD b) 2.3
52-Wk Range (INR) 202/103
1, 6, 12 Rel Perf (%) -7/-8/-7
Sector: Banking, Finance & Insurance
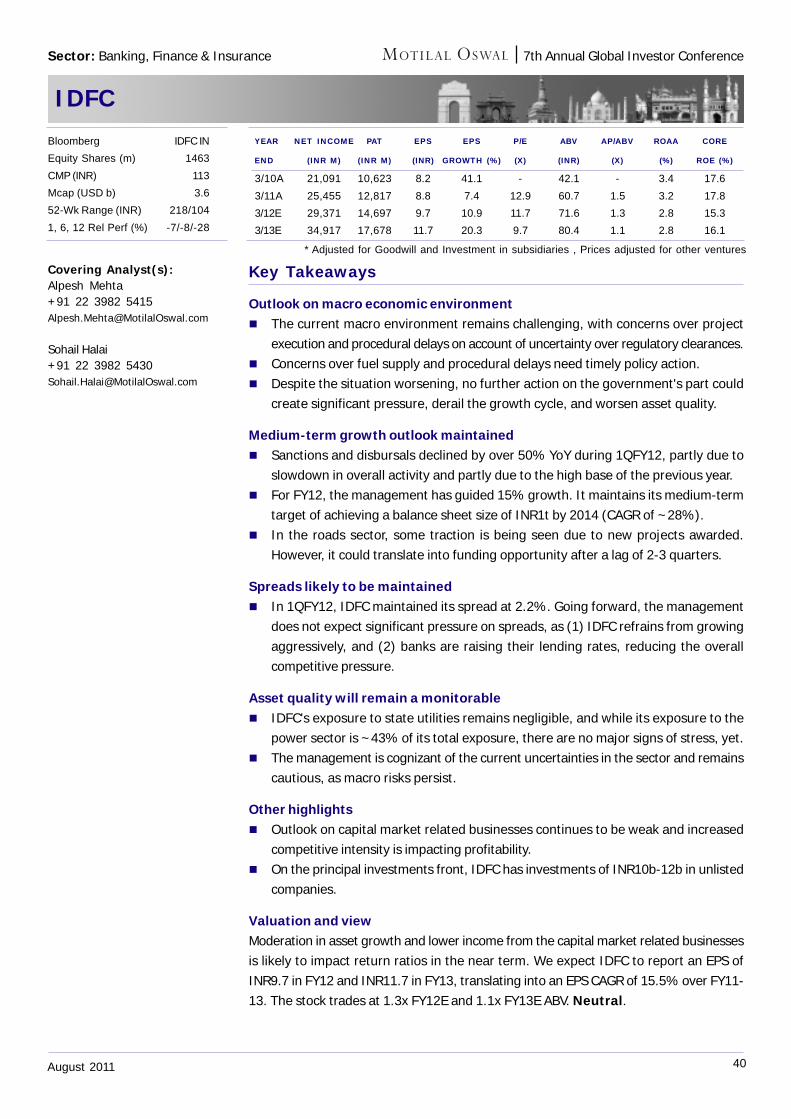
40August 2011
7th Annual Global Investor Conference
IDFC
Key Takeaways
Outlook on macro economic environment The current macro environment remains challenging, with concerns over project
execution and procedural delays on account of uncertainty over regulatory clearances. Concerns over fuel supply and procedural delays need timely policy action. Despite the situation worsening, no further action on the government's part could
create significant pressure, derail the growth cycle, and worsen asset quality.
Medium-term growth outlook maintained Sanctions and disbursals declined by over 50% YoY during 1QFY12, partly due to
slowdown in overall activity and partly due to the high base of the previous year. For FY12, the management has guided 15% growth. It maintains its medium-term
target of achieving a balance sheet size of INR1t by 2014 (CAGR of ~28%). In the roads sector, some traction is being seen due to new projects awarded.
However, it could translate into funding opportunity after a lag of 2-3 quarters.
Spreads likely to be maintained In 1QFY12, IDFC maintained its spread at 2.2%. Going forward, the management
does not expect significant pressure on spreads, as (1) IDFC refrains from growingaggressively, and (2) banks are raising their lending rates, reducing the overallcompetitive pressure.
Asset quality will remain a monitorable IDFC's exposure to state utilities remains negligible, and while its exposure to the
power sector is ~43% of its total exposure, there are no major signs of stress, yet. The management is cognizant of the current uncertainties in the sector and remains
cautious, as macro risks persist.
Other highlights Outlook on capital market related businesses continues to be weak and increased
competitive intensity is impacting profitability. On the principal investments front, IDFC has investments of INR10b-12b in unlisted
companies.
Valuation and viewModeration in asset growth and lower income from the capital market related businessesis likely to impact return ratios in the near term. We expect IDFC to report an EPS ofINR9.7 in FY12 and INR11.7 in FY13, translating into an EPS CAGR of 15.5% over FY11-13. The stock trades at 1.3x FY12E and 1.1x FY13E ABV. Neutral.
Covering Analyst(s):Alpesh Mehta+91 22 3982 [email protected]
Sohail Halai+91 22 3982 [email protected]
Bloomberg IDFC IN
Equity Shares (m) 1463
CMP (INR) 113
Mcap (USD b) 3.6
52-Wk Range (INR) 218/104
1, 6, 12 Rel Perf (%) -7/-8/-28
YEAR NET INCOME PAT EPS EPS P/E ABV AP/ABV ROAA CORE
END (INR M) (INR M) (INR) GROWTH (%) (X) (INR) (X) (%) ROE (%)
3/10A 21,091 10,623 8.2 41.1 - 42.1 - 3.4 17.6
3/11A 25,455 12,817 8.8 7.4 12.9 60.7 1.5 3.2 17.8
3/12E 29,371 14,697 9.7 10.9 11.7 71.6 1.3 2.8 15.3
3/13E 34,917 17,678 11.7 20.3 9.7 80.4 1.1 2.8 16.1
Sector: Banking, Finance & Insurance
* Adjusted for Goodwill and Investment in subsidiaries , Prices adjusted for other ventures
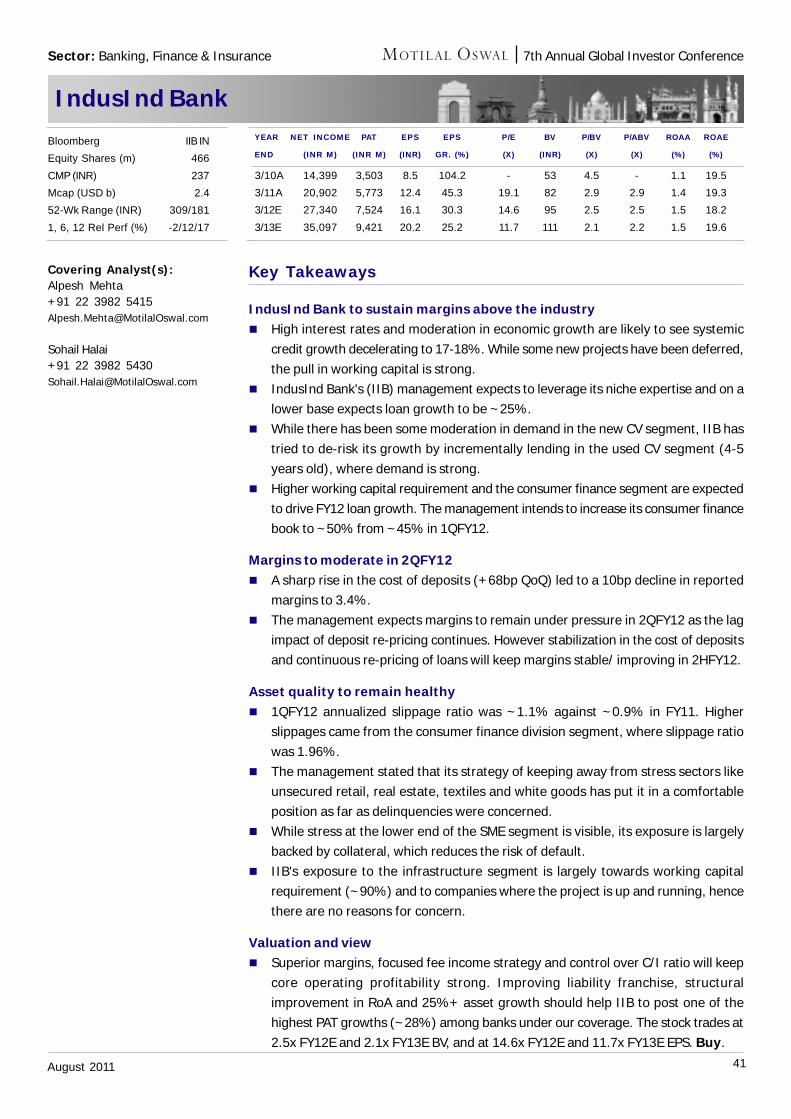
41August 2011
7th Annual Global Investor Conference
IndusInd Bank
Key Takeaways
IndusInd Bank to sustain margins above the industry High interest rates and moderation in economic growth are likely to see systemic
credit growth decelerating to 17-18%. While some new projects have been deferred,the pull in working capital is strong.
IndusInd Bank's (IIB) management expects to leverage its niche expertise and on alower base expects loan growth to be ~25%.
While there has been some moderation in demand in the new CV segment, IIB hastried to de-risk its growth by incrementally lending in the used CV segment (4-5years old), where demand is strong.
Higher working capital requirement and the consumer finance segment are expectedto drive FY12 loan growth. The management intends to increase its consumer financebook to ~50% from ~45% in 1QFY12.
Margins to moderate in 2QFY12 A sharp rise in the cost of deposits (+68bp QoQ) led to a 10bp decline in reported
margins to 3.4%. The management expects margins to remain under pressure in 2QFY12 as the lag
impact of deposit re-pricing continues. However stabilization in the cost of depositsand continuous re-pricing of loans will keep margins stable/ improving in 2HFY12.
Asset quality to remain healthy 1QFY12 annualized slippage ratio was ~1.1% against ~0.9% in FY11. Higher
slippages came from the consumer finance division segment, where slippage ratiowas 1.96%.
The management stated that its strategy of keeping away from stress sectors likeunsecured retail, real estate, textiles and white goods has put it in a comfortableposition as far as delinquencies were concerned.
While stress at the lower end of the SME segment is visible, its exposure is largelybacked by collateral, which reduces the risk of default.
IIB's exposure to the infrastructure segment is largely towards working capitalrequirement (~90%) and to companies where the project is up and running, hencethere are no reasons for concern.
Valuation and view Superior margins, focused fee income strategy and control over C/I ratio will keep
core operating profitability strong. Improving liability franchise, structuralimprovement in RoA and 25%+ asset growth should help IIB to post one of thehighest PAT growths (~28%) among banks under our coverage. The stock trades at2.5x FY12E and 2.1x FY13E BV, and at 14.6x FY12E and 11.7x FY13E EPS. Buy.
Covering Analyst(s):Alpesh Mehta+91 22 3982 [email protected]
Sohail Halai+91 22 3982 [email protected]
Bloomberg IIB IN
Equity Shares (m) 466
CMP (INR) 237
Mcap (USD b) 2.4
52-Wk Range (INR) 309/181
1, 6, 12 Rel Perf (%) -2/12/17
YEAR NET INCOME PAT EPS EPS P/E BV P/BV P/ABV ROAA ROAE
END (INR M) (INR M) (INR) GR. (%) (X) (INR) (X) (X) (%) (%)
3/10A 14,399 3,503 8.5 104.2 - 53 4.5 - 1.1 19.5
3/11A 20,902 5,773 12.4 45.3 19.1 82 2.9 2.9 1.4 19.3
3/12E 27,340 7,524 16.1 30.3 14.6 95 2.5 2.5 1.5 18.2
3/13E 35,097 9,421 20.2 25.2 11.7 111 2.1 2.2 1.5 19.6
Sector: Banking, Finance & Insurance
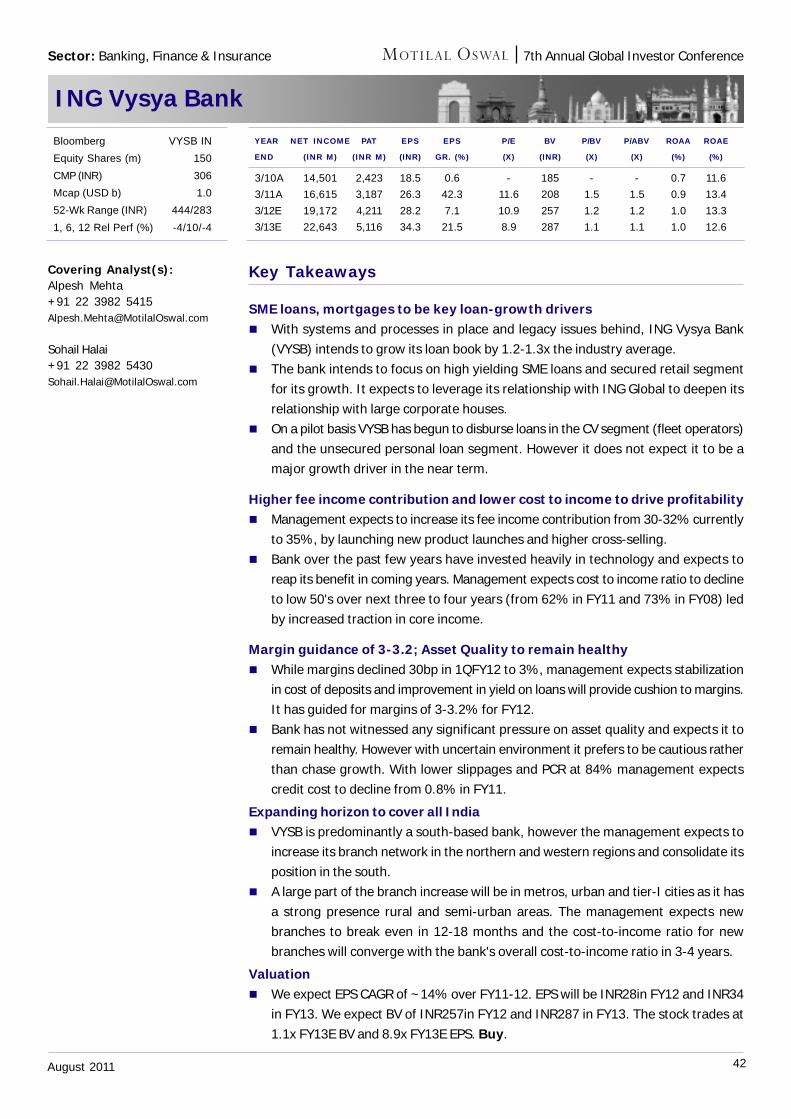
42August 2011
7th Annual Global Investor Conference
ING Vysya Bank
Key Takeaways
SME loans, mortgages to be key loan-growth drivers With systems and processes in place and legacy issues behind, ING Vysya Bank
(VYSB) intends to grow its loan book by 1.2-1.3x the industry average. The bank intends to focus on high yielding SME loans and secured retail segment
for its growth. It expects to leverage its relationship with ING Global to deepen itsrelationship with large corporate houses.
On a pilot basis VYSB has begun to disburse loans in the CV segment (fleet operators)and the unsecured personal loan segment. However it does not expect it to be amajor growth driver in the near term.
Higher fee income contribution and lower cost to income to drive profitability Management expects to increase its fee income contribution from 30-32% currently
to 35%, by launching new product launches and higher cross-selling. Bank over the past few years have invested heavily in technology and expects to
reap its benefit in coming years. Management expects cost to income ratio to declineto low 50's over next three to four years (from 62% in FY11 and 73% in FY08) ledby increased traction in core income.
Margin guidance of 3-3.2; Asset Quality to remain healthy While margins declined 30bp in 1QFY12 to 3%, management expects stabilization
in cost of deposits and improvement in yield on loans will provide cushion to margins.It has guided for margins of 3-3.2% for FY12.
Bank has not witnessed any significant pressure on asset quality and expects it toremain healthy. However with uncertain environment it prefers to be cautious ratherthan chase growth. With lower slippages and PCR at 84% management expectscredit cost to decline from 0.8% in FY11.
Expanding horizon to cover all India VYSB is predominantly a south-based bank, however the management expects to
increase its branch network in the northern and western regions and consolidate itsposition in the south.
A large part of the branch increase will be in metros, urban and tier-I cities as it hasa strong presence rural and semi-urban areas. The management expects newbranches to break even in 12-18 months and the cost-to-income ratio for newbranches will converge with the bank's overall cost-to-income ratio in 3-4 years.
Valuation We expect EPS CAGR of ~14% over FY11-12. EPS will be INR28in FY12 and INR34
in FY13. We expect BV of INR257in FY12 and INR287 in FY13. The stock trades at1.1x FY13E BV and 8.9x FY13E EPS. Buy.
Covering Analyst(s):Alpesh Mehta+91 22 3982 [email protected]
Sohail Halai+91 22 3982 [email protected]
Bloomberg VYSB IN
Equity Shares (m) 150
CMP (INR) 306
Mcap (USD b) 1.0
52-Wk Range (INR) 444/283
1, 6, 12 Rel Perf (%) -4/10/-4
YEAR NET INCOME PAT EPS EPS P/E BV P/BV P/ABV ROAA ROAE
END (INR M) (INR M) (INR) GR. (%) (X) (INR) (X) (X) (%) (%)
3/10A 14,501 2,423 18.5 0.6 - 185 - - 0.7 11.6
3/11A 16,615 3,187 26.3 42.3 11.6 208 1.5 1.5 0.9 13.4
3/12E 19,172 4,211 28.2 7.1 10.9 257 1.2 1.2 1.0 13.3
3/13E 22,643 5,116 34.3 21.5 8.9 287 1.1 1.1 1.0 12.6
Sector: Banking, Finance & Insurance
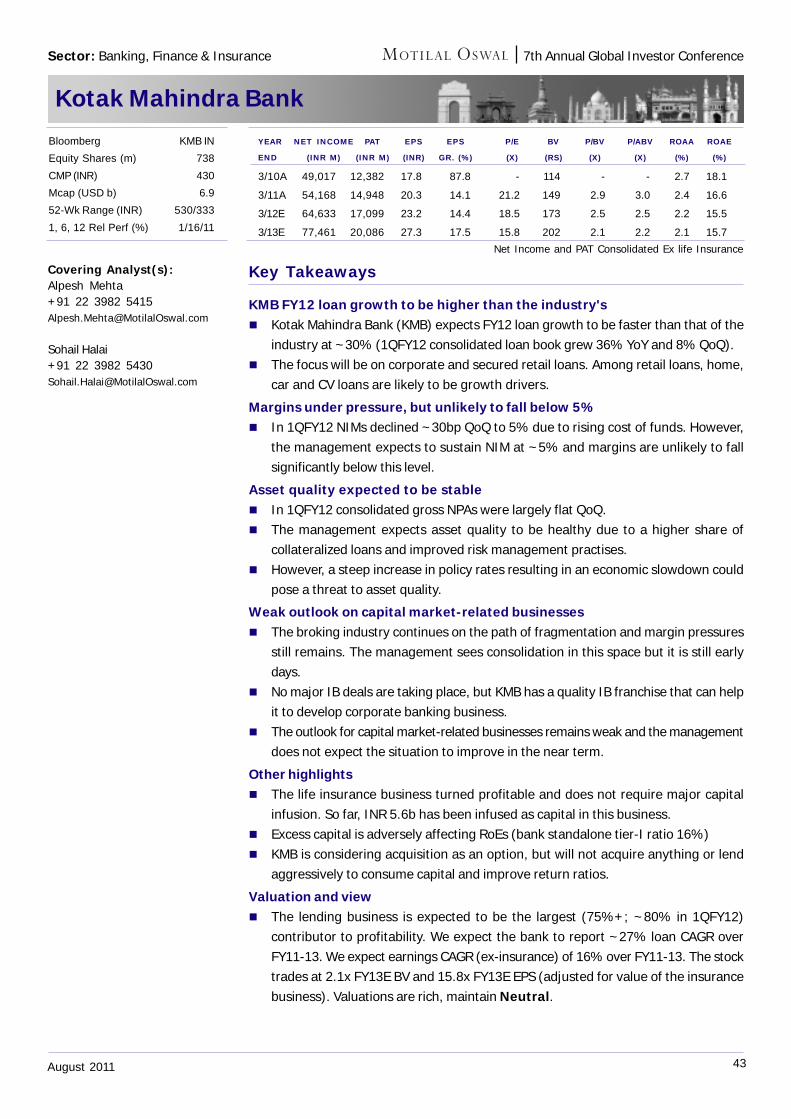
43August 2011
7th Annual Global Investor Conference
Kotak Mahindra Bank
Key Takeaways
KMB FY12 loan growth to be higher than the industry's Kotak Mahindra Bank (KMB) expects FY12 loan growth to be faster than that of the
industry at ~30% (1QFY12 consolidated loan book grew 36% YoY and 8% QoQ). The focus will be on corporate and secured retail loans. Among retail loans, home,
car and CV loans are likely to be growth drivers.
Margins under pressure, but unlikely to fall below 5% In 1QFY12 NIMs declined ~30bp QoQ to 5% due to rising cost of funds. However,
the management expects to sustain NIM at ~5% and margins are unlikely to fallsignificantly below this level.
Asset quality expected to be stable In 1QFY12 consolidated gross NPAs were largely flat QoQ. The management expects asset quality to be healthy due to a higher share of
collateralized loans and improved risk management practises. However, a steep increase in policy rates resulting in an economic slowdown could
pose a threat to asset quality.
Weak outlook on capital market-related businesses The broking industry continues on the path of fragmentation and margin pressures
still remains. The management sees consolidation in this space but it is still earlydays.
No major IB deals are taking place, but KMB has a quality IB franchise that can helpit to develop corporate banking business.
The outlook for capital market-related businesses remains weak and the managementdoes not expect the situation to improve in the near term.
Other highlights The life insurance business turned profitable and does not require major capital
infusion. So far, INR 5.6b has been infused as capital in this business. Excess capital is adversely affecting RoEs (bank standalone tier-I ratio 16%) KMB is considering acquisition as an option, but will not acquire anything or lend
aggressively to consume capital and improve return ratios.
Valuation and view The lending business is expected to be the largest (75%+; ~80% in 1QFY12)
contributor to profitability. We expect the bank to report ~27% loan CAGR overFY11-13. We expect earnings CAGR (ex-insurance) of 16% over FY11-13. The stocktrades at 2.1x FY13E BV and 15.8x FY13E EPS (adjusted for value of the insurancebusiness). Valuations are rich, maintain Neutral.
Covering Analyst(s):Alpesh Mehta+91 22 3982 [email protected]
Sohail Halai+91 22 3982 [email protected]
Sector: Banking, Finance & Insurance
YEAR NET INCOME PAT EPS EPS P/E BV P/BV P/ABV ROAA ROAE
END (INR M) (INR M) (INR) GR. (%) (X) (RS) (X) (X) (%) (%)
3/10A 49,017 12,382 17.8 87.8 - 114 - - 2.7 18.1
3/11A 54,168 14,948 20.3 14.1 21.2 149 2.9 3.0 2.4 16.6
3/12E 64,633 17,099 23.2 14.4 18.5 173 2.5 2.5 2.2 15.5
3/13E 77,461 20,086 27.3 17.5 15.8 202 2.1 2.2 2.1 15.7
Bloomberg KMB IN
Equity Shares (m) 738
CMP (INR) 430
Mcap (USD b) 6.9
52-Wk Range (INR) 530/333
1, 6, 12 Rel Perf (%) 1/16/11
Net Income and PAT Consolidated Ex life Insurance
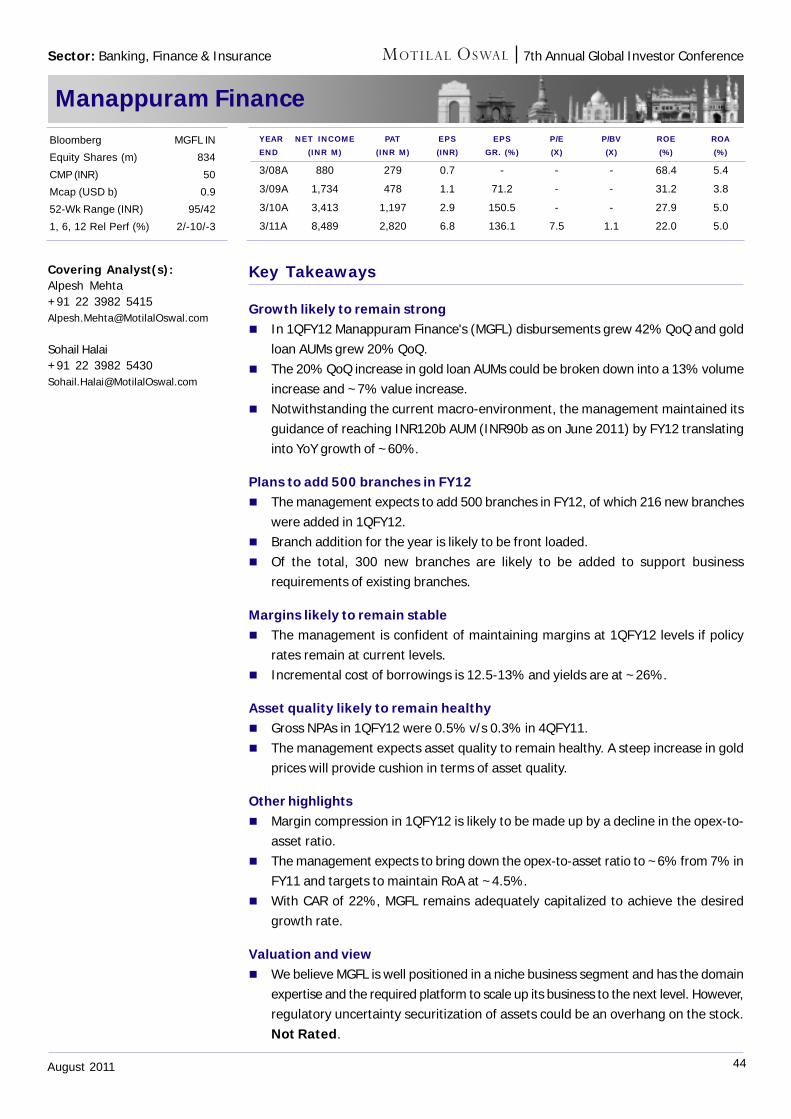
44August 2011
7th Annual Global Investor Conference
Manappuram Finance
Key Takeaways
Growth likely to remain strong In 1QFY12 Manappuram Finance's (MGFL) disbursements grew 42% QoQ and gold
loan AUMs grew 20% QoQ. The 20% QoQ increase in gold loan AUMs could be broken down into a 13% volume
increase and ~7% value increase. Notwithstanding the current macro-environment, the management maintained its
guidance of reaching INR120b AUM (INR90b as on June 2011) by FY12 translatinginto YoY growth of ~60%.
Plans to add 500 branches in FY12 The management expects to add 500 branches in FY12, of which 216 new branches
were added in 1QFY12. Branch addition for the year is likely to be front loaded. Of the total, 300 new branches are likely to be added to support business
requirements of existing branches.
Margins likely to remain stable The management is confident of maintaining margins at 1QFY12 levels if policy
rates remain at current levels. Incremental cost of borrowings is 12.5-13% and yields are at ~26%.
Asset quality likely to remain healthy Gross NPAs in 1QFY12 were 0.5% v/s 0.3% in 4QFY11. The management expects asset quality to remain healthy. A steep increase in gold
prices will provide cushion in terms of asset quality.
Other highlights Margin compression in 1QFY12 is likely to be made up by a decline in the opex-to-
asset ratio. The management expects to bring down the opex-to-asset ratio to ~6% from 7% in
FY11 and targets to maintain RoA at ~4.5%. With CAR of 22%, MGFL remains adequately capitalized to achieve the desired
growth rate.
Valuation and view We believe MGFL is well positioned in a niche business segment and has the domain
expertise and the required platform to scale up its business to the next level. However,regulatory uncertainty securitization of assets could be an overhang on the stock.Not Rated.
Covering Analyst(s):Alpesh Mehta+91 22 3982 [email protected]
Sohail Halai+91 22 3982 [email protected]
YEAR NET INCOME PAT EPS EPS P/E P/BV ROE ROAEND (INR M) (INR M) (INR) GR. (%) (X) (X) (%) (%)
3/08A 880 279 0.7 - - - 68.4 5.4
3/09A 1,734 478 1.1 71.2 - - 31.2 3.8
3/10A 3,413 1,197 2.9 150.5 - - 27.9 5.0
3/11A 8,489 2,820 6.8 136.1 7.5 1.1 22.0 5.0
Bloomberg MGFL IN
Equity Shares (m) 834
CMP (INR) 50
Mcap (USD b) 0.9
52-Wk Range (INR) 95/42
1, 6, 12 Rel Perf (%) 2/-10/-3
Sector: Banking, Finance & Insurance
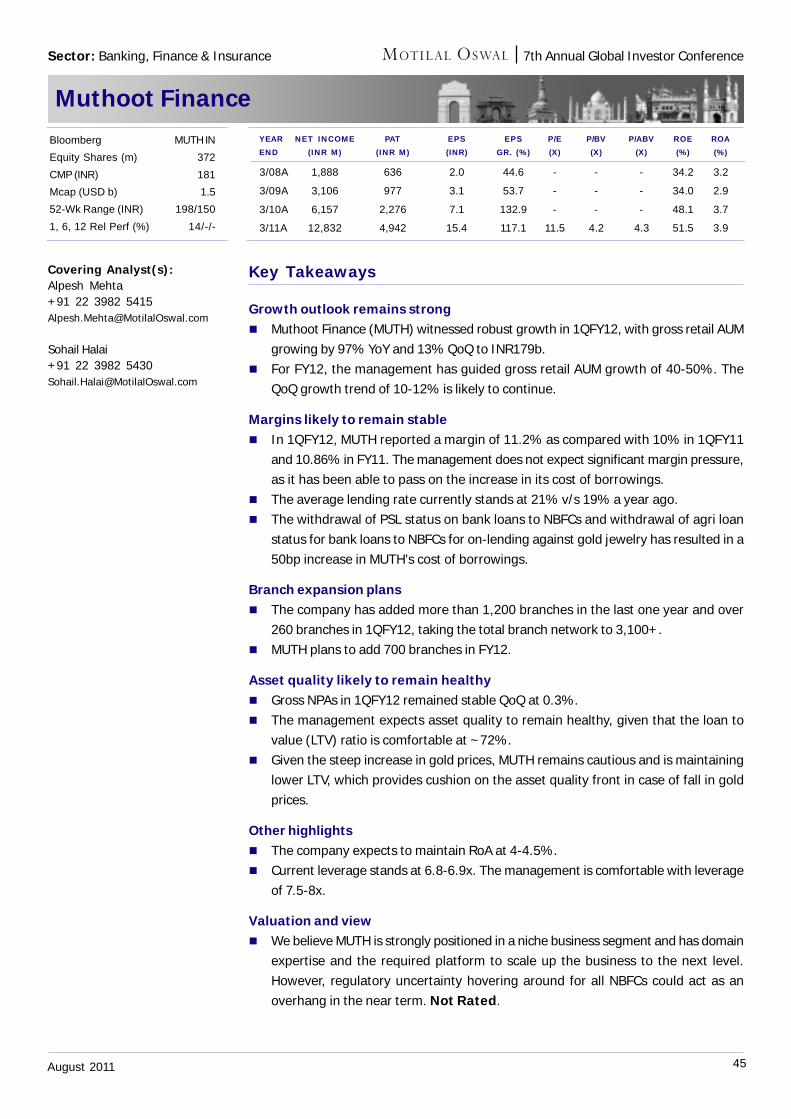
45August 2011
7th Annual Global Investor Conference
Muthoot Finance
Key Takeaways
Growth outlook remains strong Muthoot Finance (MUTH) witnessed robust growth in 1QFY12, with gross retail AUM
growing by 97% YoY and 13% QoQ to INR179b. For FY12, the management has guided gross retail AUM growth of 40-50%. The
QoQ growth trend of 10-12% is likely to continue.
Margins likely to remain stable In 1QFY12, MUTH reported a margin of 11.2% as compared with 10% in 1QFY11
and 10.86% in FY11. The management does not expect significant margin pressure,as it has been able to pass on the increase in its cost of borrowings.
The average lending rate currently stands at 21% v/s 19% a year ago. The withdrawal of PSL status on bank loans to NBFCs and withdrawal of agri loan
status for bank loans to NBFCs for on-lending against gold jewelry has resulted in a50bp increase in MUTH's cost of borrowings.
Branch expansion plans The company has added more than 1,200 branches in the last one year and over
260 branches in 1QFY12, taking the total branch network to 3,100+. MUTH plans to add 700 branches in FY12.
Asset quality likely to remain healthy Gross NPAs in 1QFY12 remained stable QoQ at 0.3%. The management expects asset quality to remain healthy, given that the loan to
value (LTV) ratio is comfortable at ~72%. Given the steep increase in gold prices, MUTH remains cautious and is maintaining
lower LTV, which provides cushion on the asset quality front in case of fall in goldprices.
Other highlights The company expects to maintain RoA at 4-4.5%. Current leverage stands at 6.8-6.9x. The management is comfortable with leverage
of 7.5-8x.
Valuation and view We believe MUTH is strongly positioned in a niche business segment and has domain
expertise and the required platform to scale up the business to the next level.However, regulatory uncertainty hovering around for all NBFCs could act as anoverhang in the near term. Not Rated.
Covering Analyst(s):Alpesh Mehta+91 22 3982 [email protected]
Sohail Halai+91 22 3982 [email protected]
Sector: Banking, Finance & Insurance
YEAR NET INCOME PAT EPS EPS P/E P/BV P/ABV ROE ROAEND (INR M) (INR M) (INR) GR. (%) (X) (X) (X) (%) (%)
3/08A 1,888 636 2.0 44.6 - - - 34.2 3.2
3/09A 3,106 977 3.1 53.7 - - - 34.0 2.9
3/10A 6,157 2,276 7.1 132.9 - - - 48.1 3.7
3/11A 12,832 4,942 15.4 117.1 11.5 4.2 4.3 51.5 3.9
Bloomberg MUTH IN
Equity Shares (m) 372
CMP (INR) 181
Mcap (USD b) 1.5
52-Wk Range (INR) 198/150
1, 6, 12 Rel Perf (%) 14/-/-
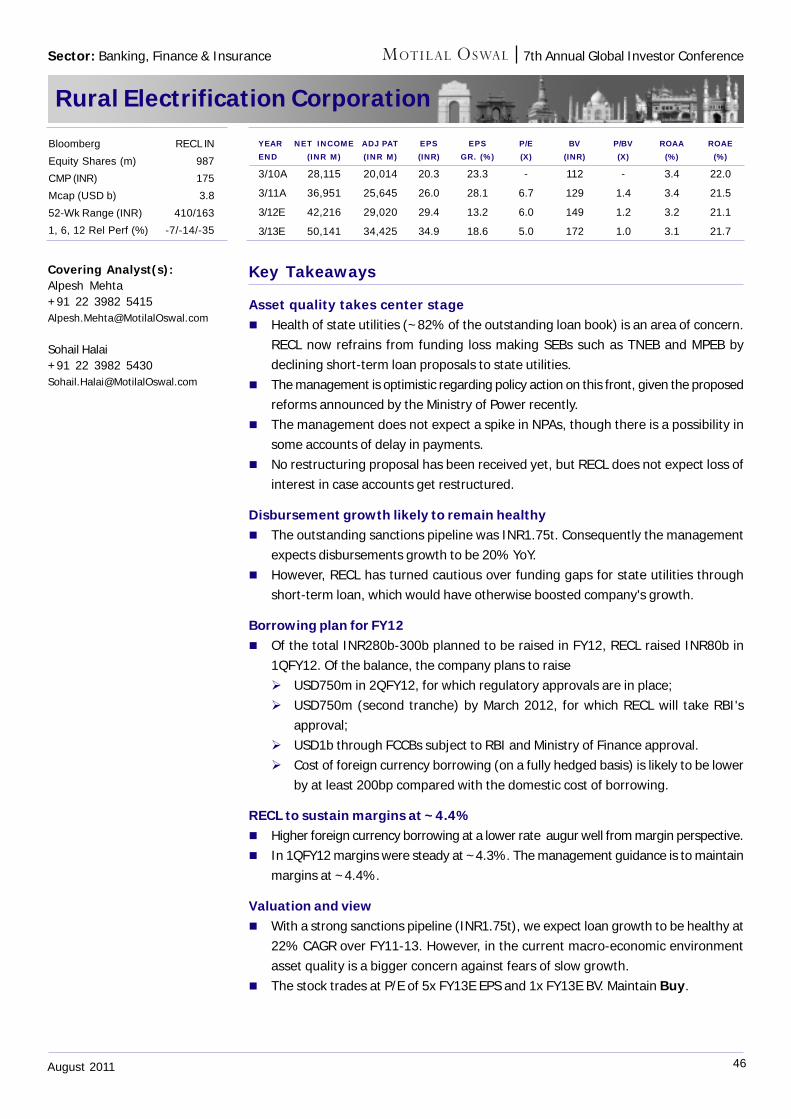
46August 2011
7th Annual Global Investor Conference
Rural Electrification Corporation
Key Takeaways
Asset quality takes center stage Health of state utilities (~82% of the outstanding loan book) is an area of concern.
RECL now refrains from funding loss making SEBs such as TNEB and MPEB bydeclining short-term loan proposals to state utilities.
The management is optimistic regarding policy action on this front, given the proposedreforms announced by the Ministry of Power recently.
The management does not expect a spike in NPAs, though there is a possibility insome accounts of delay in payments.
No restructuring proposal has been received yet, but RECL does not expect loss ofinterest in case accounts get restructured.
Disbursement growth likely to remain healthy The outstanding sanctions pipeline was INR1.75t. Consequently the management
expects disbursements growth to be 20% YoY. However, RECL has turned cautious over funding gaps for state utilities through
short-term loan, which would have otherwise boosted company's growth.
Borrowing plan for FY12 Of the total INR280b-300b planned to be raised in FY12, RECL raised INR80b in
1QFY12. Of the balance, the company plans to raise USD750m in 2QFY12, for which regulatory approvals are in place; USD750m (second tranche) by March 2012, for which RECL will take RBI's
approval; USD1b through FCCBs subject to RBI and Ministry of Finance approval. Cost of foreign currency borrowing (on a fully hedged basis) is likely to be lower
by at least 200bp compared with the domestic cost of borrowing.
RECL to sustain margins at ~4.4% Higher foreign currency borrowing at a lower rate augur well from margin perspective. In 1QFY12 margins were steady at ~4.3%. The management guidance is to maintain
margins at ~4.4%.
Valuation and view With a strong sanctions pipeline (INR1.75t), we expect loan growth to be healthy at
22% CAGR over FY11-13. However, in the current macro-economic environmentasset quality is a bigger concern against fears of slow growth.
The stock trades at P/E of 5x FY13E EPS and 1x FY13E BV. Maintain Buy.
Covering Analyst(s):Alpesh Mehta+91 22 3982 [email protected]
Sohail Halai+91 22 3982 [email protected]
YEAR NET INCOME ADJ PAT EPS EPS P/E BV P/BV ROAA ROAEEND (INR M) (INR M) (INR) GR. (%) (X) (INR) (X) (%) (%)
3/10A 28,115 20,014 20.3 23.3 - 112 - 3.4 22.0
3/11A 36,951 25,645 26.0 28.1 6.7 129 1.4 3.4 21.5
3/12E 42,216 29,020 29.4 13.2 6.0 149 1.2 3.2 21.1
3/13E 50,141 34,425 34.9 18.6 5.0 172 1.0 3.1 21.7
Bloomberg RECL IN
Equity Shares (m) 987
CMP (INR) 175
Mcap (USD b) 3.8
52-Wk Range (INR) 410/163
1, 6, 12 Rel Perf (%) -7/-14/-35
Sector: Banking, Finance & Insurance
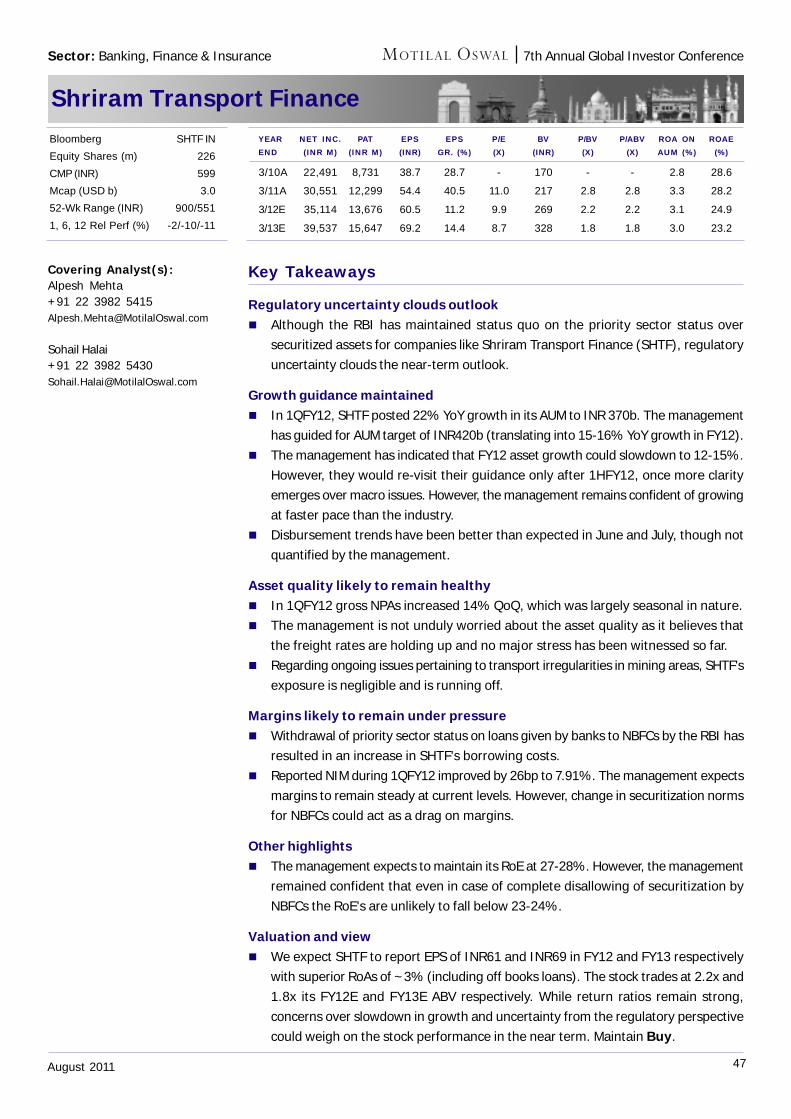
47August 2011
7th Annual Global Investor Conference
Shriram Transport Finance
Key Takeaways
Regulatory uncertainty clouds outlook Although the RBI has maintained status quo on the priority sector status over
securitized assets for companies like Shriram Transport Finance (SHTF), regulatoryuncertainty clouds the near-term outlook.
Growth guidance maintained In 1QFY12, SHTF posted 22% YoY growth in its AUM to INR 370b. The management
has guided for AUM target of INR420b (translating into 15-16% YoY growth in FY12). The management has indicated that FY12 asset growth could slowdown to 12-15%.
However, they would re-visit their guidance only after 1HFY12, once more clarityemerges over macro issues. However, the management remains confident of growingat faster pace than the industry.
Disbursement trends have been better than expected in June and July, though notquantified by the management.
Asset quality likely to remain healthy In 1QFY12 gross NPAs increased 14% QoQ, which was largely seasonal in nature. The management is not unduly worried about the asset quality as it believes that
the freight rates are holding up and no major stress has been witnessed so far. Regarding ongoing issues pertaining to transport irregularities in mining areas, SHTF's
exposure is negligible and is running off.
Margins likely to remain under pressure Withdrawal of priority sector status on loans given by banks to NBFCs by the RBI has
resulted in an increase in SHTF's borrowing costs. Reported NIM during 1QFY12 improved by 26bp to 7.91%. The management expects
margins to remain steady at current levels. However, change in securitization normsfor NBFCs could act as a drag on margins.
Other highlights The management expects to maintain its RoE at 27-28%. However, the management
remained confident that even in case of complete disallowing of securitization byNBFCs the RoE's are unlikely to fall below 23-24%.
Valuation and view We expect SHTF to report EPS of INR61 and INR69 in FY12 and FY13 respectively
with superior RoAs of ~3% (including off books loans). The stock trades at 2.2x and1.8x its FY12E and FY13E ABV respectively. While return ratios remain strong,concerns over slowdown in growth and uncertainty from the regulatory perspectivecould weigh on the stock performance in the near term. Maintain Buy.
Covering Analyst(s):Alpesh Mehta+91 22 3982 [email protected]
Sohail Halai+91 22 3982 [email protected]
YEAR NET INC. PAT EPS EPS P/E BV P/BV P/ABV ROA ON ROAEEND (INR M) (INR M) (INR) GR. (%) (X) (INR) (X) (X) AUM (%) (%)
3/10A 22,491 8,731 38.7 28.7 - 170 - - 2.8 28.6
3/11A 30,551 12,299 54.4 40.5 11.0 217 2.8 2.8 3.3 28.2
3/12E 35,114 13,676 60.5 11.2 9.9 269 2.2 2.2 3.1 24.9
3/13E 39,537 15,647 69.2 14.4 8.7 328 1.8 1.8 3.0 23.2
Bloomberg SHTF IN
Equity Shares (m) 226
CMP (INR) 599
Mcap (USD b) 3.0
52-Wk Range (INR) 900/551
1, 6, 12 Rel Perf (%) -2/-10/-11
Sector: Banking, Finance & Insurance
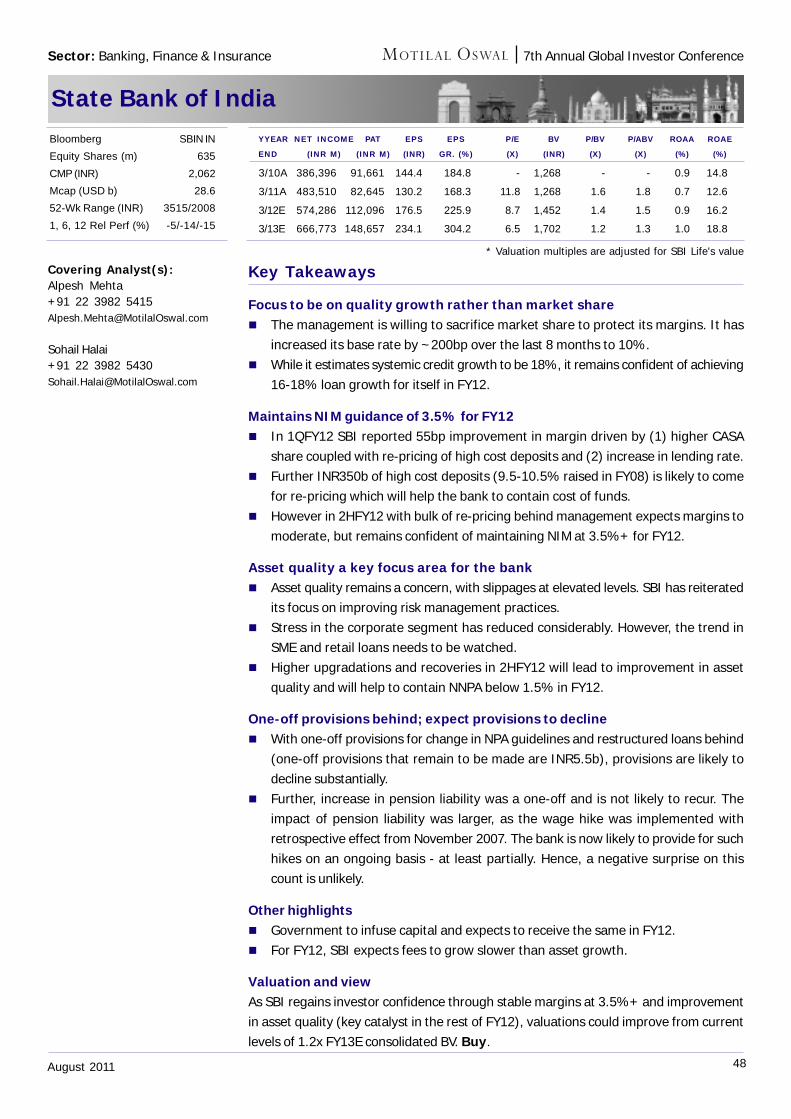
48August 2011
7th Annual Global Investor Conference
State Bank of India
Key Takeaways
Focus to be on quality growth rather than market share The management is willing to sacrifice market share to protect its margins. It has
increased its base rate by ~200bp over the last 8 months to 10%. While it estimates systemic credit growth to be 18%, it remains confident of achieving
16-18% loan growth for itself in FY12.
Maintains NIM guidance of 3.5% for FY12 In 1QFY12 SBI reported 55bp improvement in margin driven by (1) higher CASA
share coupled with re-pricing of high cost deposits and (2) increase in lending rate. Further INR350b of high cost deposits (9.5-10.5% raised in FY08) is likely to come
for re-pricing which will help the bank to contain cost of funds. However in 2HFY12 with bulk of re-pricing behind management expects margins to
moderate, but remains confident of maintaining NIM at 3.5%+ for FY12.
Asset quality a key focus area for the bank Asset quality remains a concern, with slippages at elevated levels. SBI has reiterated
its focus on improving risk management practices. Stress in the corporate segment has reduced considerably. However, the trend in
SME and retail loans needs to be watched. Higher upgradations and recoveries in 2HFY12 will lead to improvement in asset
quality and will help to contain NNPA below 1.5% in FY12.
One-off provisions behind; expect provisions to decline With one-off provisions for change in NPA guidelines and restructured loans behind
(one-off provisions that remain to be made are INR5.5b), provisions are likely todecline substantially.
Further, increase in pension liability was a one-off and is not likely to recur. Theimpact of pension liability was larger, as the wage hike was implemented withretrospective effect from November 2007. The bank is now likely to provide for suchhikes on an ongoing basis - at least partially. Hence, a negative surprise on thiscount is unlikely.
Other highlights Government to infuse capital and expects to receive the same in FY12. For FY12, SBI expects fees to grow slower than asset growth.
Valuation and viewAs SBI regains investor confidence through stable margins at 3.5%+ and improvementin asset quality (key catalyst in the rest of FY12), valuations could improve from currentlevels of 1.2x FY13E consolidated BV. Buy.
Covering Analyst(s):Alpesh Mehta+91 22 3982 [email protected]
Sohail Halai+91 22 3982 [email protected]
YYEAR NET INCOME PAT EPS EPS P/E BV P/BV P/ABV ROAA ROAE
END (INR M) (INR M) (INR) GR. (%) (X) (INR) (X) (X) (%) (%)
3/10A 386,396 91,661 144.4 184.8 - 1,268 - - 0.9 14.8
3/11A 483,510 82,645 130.2 168.3 11.8 1,268 1.6 1.8 0.7 12.6
3/12E 574,286 112,096 176.5 225.9 8.7 1,452 1.4 1.5 0.9 16.2
3/13E 666,773 148,657 234.1 304.2 6.5 1,702 1.2 1.3 1.0 18.8
Bloomberg SBIN IN
Equity Shares (m) 635
CMP (INR) 2,062
Mcap (USD b) 28.6
52-Wk Range (INR) 3515/2008
1, 6, 12 Rel Perf (%) -5/-14/-15
Sector: Banking, Finance & Insurance
* Valuation multiples are adjusted for SBI Life's value
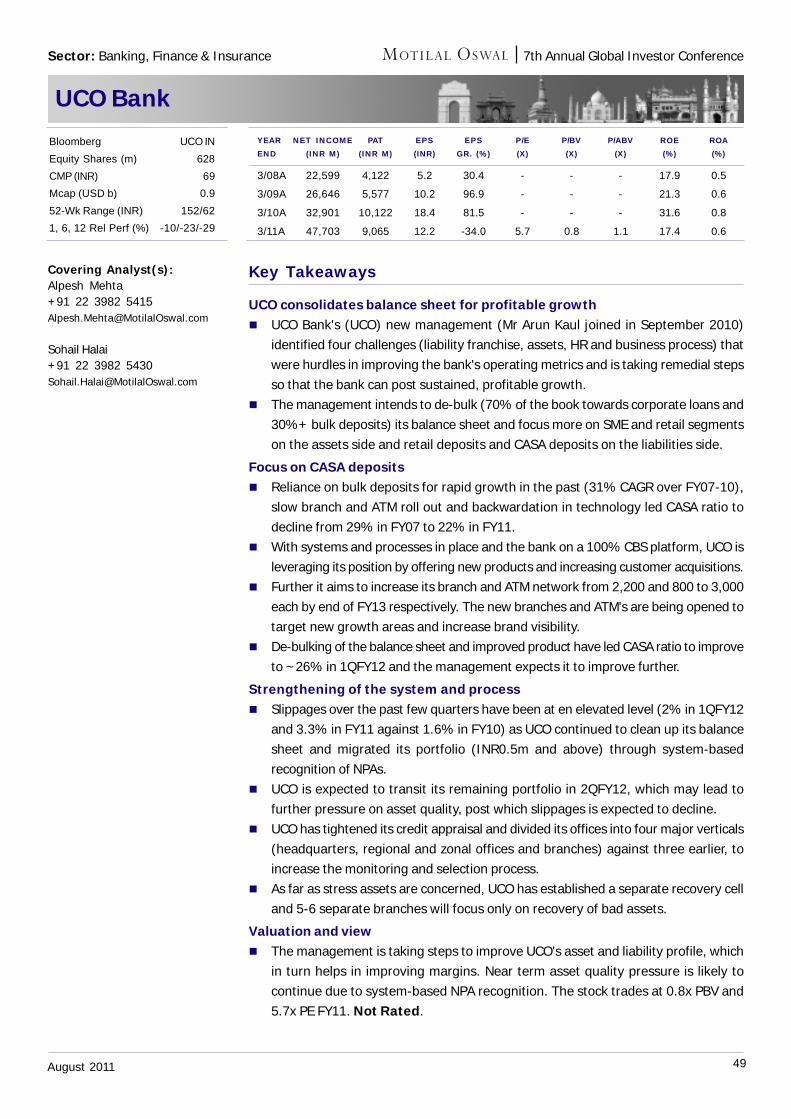
49August 2011
7th Annual Global Investor Conference
UCO Bank
Key Takeaways
UCO consolidates balance sheet for profitable growth UCO Bank's (UCO) new management (Mr Arun Kaul joined in September 2010)
identified four challenges (liability franchise, assets, HR and business process) thatwere hurdles in improving the bank's operating metrics and is taking remedial stepsso that the bank can post sustained, profitable growth.
The management intends to de-bulk (70% of the book towards corporate loans and30%+ bulk deposits) its balance sheet and focus more on SME and retail segmentson the assets side and retail deposits and CASA deposits on the liabilities side.
Focus on CASA deposits Reliance on bulk deposits for rapid growth in the past (31% CAGR over FY07-10),
slow branch and ATM roll out and backwardation in technology led CASA ratio todecline from 29% in FY07 to 22% in FY11.
With systems and processes in place and the bank on a 100% CBS platform, UCO isleveraging its position by offering new products and increasing customer acquisitions.
Further it aims to increase its branch and ATM network from 2,200 and 800 to 3,000each by end of FY13 respectively. The new branches and ATM's are being opened totarget new growth areas and increase brand visibility.
De-bulking of the balance sheet and improved product have led CASA ratio to improveto ~26% in 1QFY12 and the management expects it to improve further.
Strengthening of the system and process Slippages over the past few quarters have been at en elevated level (2% in 1QFY12
and 3.3% in FY11 against 1.6% in FY10) as UCO continued to clean up its balancesheet and migrated its portfolio (INR0.5m and above) through system-basedrecognition of NPAs.
UCO is expected to transit its remaining portfolio in 2QFY12, which may lead tofurther pressure on asset quality, post which slippages is expected to decline.
UCO has tightened its credit appraisal and divided its offices into four major verticals(headquarters, regional and zonal offices and branches) against three earlier, toincrease the monitoring and selection process.
As far as stress assets are concerned, UCO has established a separate recovery celland 5-6 separate branches will focus only on recovery of bad assets.
Valuation and view The management is taking steps to improve UCO's asset and liability profile, which
in turn helps in improving margins. Near term asset quality pressure is likely tocontinue due to system-based NPA recognition. The stock trades at 0.8x PBV and5.7x PE FY11. Not Rated.
Covering Analyst(s):Alpesh Mehta+91 22 3982 [email protected]
Sohail Halai+91 22 3982 [email protected]
YEAR NET INCOME PAT EPS EPS P/E P/BV P/ABV ROE ROAEND (INR M) (INR M) (INR) GR. (%) (X) (X) (X) (%) (%)
3/08A 22,599 4,122 5.2 30.4 - - - 17.9 0.5
3/09A 26,646 5,577 10.2 96.9 - - - 21.3 0.6
3/10A 32,901 10,122 18.4 81.5 - - - 31.6 0.8
3/11A 47,703 9,065 12.2 -34.0 5.7 0.8 1.1 17.4 0.6
Bloomberg UCO IN
Equity Shares (m) 628
CMP (INR) 69
Mcap (USD b) 0.9
52-Wk Range (INR) 152/62
1, 6, 12 Rel Perf (%) -10/-23/-29
Sector: Banking, Finance & Insurance
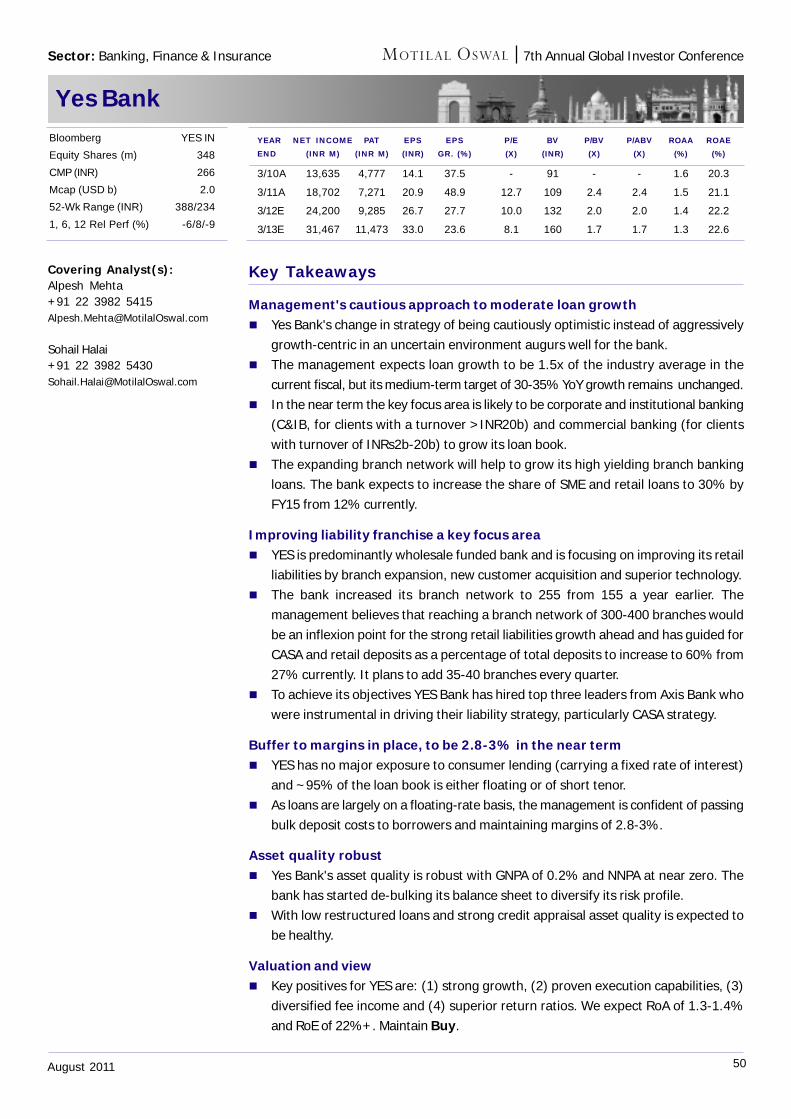
50August 2011
7th Annual Global Investor Conference
Yes Bank
Key Takeaways
Management's cautious approach to moderate loan growth Yes Bank's change in strategy of being cautiously optimistic instead of aggressively
growth-centric in an uncertain environment augurs well for the bank. The management expects loan growth to be 1.5x of the industry average in the
current fiscal, but its medium-term target of 30-35% YoY growth remains unchanged. In the near term the key focus area is likely to be corporate and institutional banking
(C&IB, for clients with a turnover >INR20b) and commercial banking (for clientswith turnover of INRs2b-20b) to grow its loan book.
The expanding branch network will help to grow its high yielding branch bankingloans. The bank expects to increase the share of SME and retail loans to 30% byFY15 from 12% currently.
Improving liability franchise a key focus area YES is predominantly wholesale funded bank and is focusing on improving its retail
liabilities by branch expansion, new customer acquisition and superior technology. The bank increased its branch network to 255 from 155 a year earlier. The
management believes that reaching a branch network of 300-400 branches wouldbe an inflexion point for the strong retail liabilities growth ahead and has guided forCASA and retail deposits as a percentage of total deposits to increase to 60% from27% currently. It plans to add 35-40 branches every quarter.
To achieve its objectives YES Bank has hired top three leaders from Axis Bank whowere instrumental in driving their liability strategy, particularly CASA strategy.
Buffer to margins in place, to be 2.8-3% in the near term YES has no major exposure to consumer lending (carrying a fixed rate of interest)
and ~95% of the loan book is either floating or of short tenor. As loans are largely on a floating-rate basis, the management is confident of passing
bulk deposit costs to borrowers and maintaining margins of 2.8-3%.
Asset quality robust Yes Bank's asset quality is robust with GNPA of 0.2% and NNPA at near zero. The
bank has started de-bulking its balance sheet to diversify its risk profile. With low restructured loans and strong credit appraisal asset quality is expected to
be healthy.
Valuation and view Key positives for YES are: (1) strong growth, (2) proven execution capabilities, (3)
diversified fee income and (4) superior return ratios. We expect RoA of 1.3-1.4%and RoE of 22%+. Maintain Buy.
Covering Analyst(s):Alpesh Mehta+91 22 3982 [email protected]
Sohail Halai+91 22 3982 [email protected]
YEAR NET INCOME PAT EPS EPS P/E BV P/BV P/ABV ROAA ROAEEND (INR M) (INR M) (INR) GR. (%) (X) (INR) (X) (X) (%) (%)
3/10A 13,635 4,777 14.1 37.5 - 91 - - 1.6 20.3
3/11A 18,702 7,271 20.9 48.9 12.7 109 2.4 2.4 1.5 21.1
3/12E 24,200 9,285 26.7 27.7 10.0 132 2.0 2.0 1.4 22.2
3/13E 31,467 11,473 33.0 23.6 8.1 160 1.7 1.7 1.3 22.6
Bloomberg YES IN
Equity Shares (m) 348
CMP (INR) 266
Mcap (USD b) 2.0
52-Wk Range (INR) 388/234
1, 6, 12 Rel Perf (%) -6/8/-9
Sector: Banking, Finance & Insurance
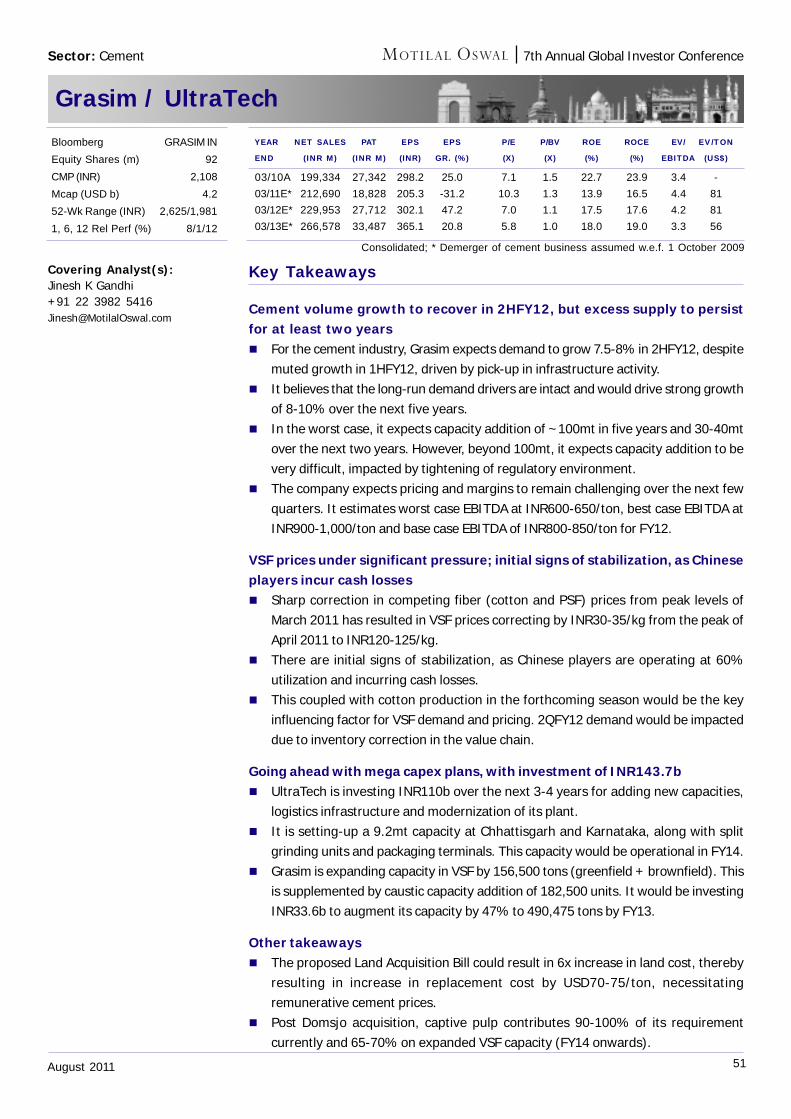
51August 2011
7th Annual Global Investor Conference
Grasim / UltraTech
Key Takeaways
Cement volume growth to recover in 2HFY12, but excess supply to persistfor at least two years For the cement industry, Grasim expects demand to grow 7.5-8% in 2HFY12, despite
muted growth in 1HFY12, driven by pick-up in infrastructure activity. It believes that the long-run demand drivers are intact and would drive strong growth
of 8-10% over the next five years. In the worst case, it expects capacity addition of ~100mt in five years and 30-40mt
over the next two years. However, beyond 100mt, it expects capacity addition to bevery difficult, impacted by tightening of regulatory environment.
The company expects pricing and margins to remain challenging over the next fewquarters. It estimates worst case EBITDA at INR600-650/ton, best case EBITDA atINR900-1,000/ton and base case EBITDA of INR800-850/ton for FY12.
VSF prices under significant pressure; initial signs of stabilization, as Chineseplayers incur cash losses Sharp correction in competing fiber (cotton and PSF) prices from peak levels of
March 2011 has resulted in VSF prices correcting by INR30-35/kg from the peak ofApril 2011 to INR120-125/kg.
There are initial signs of stabilization, as Chinese players are operating at 60%utilization and incurring cash losses.
This coupled with cotton production in the forthcoming season would be the keyinfluencing factor for VSF demand and pricing. 2QFY12 demand would be impacteddue to inventory correction in the value chain.
Going ahead with mega capex plans, with investment of INR143.7b UltraTech is investing INR110b over the next 3-4 years for adding new capacities,
logistics infrastructure and modernization of its plant. It is setting-up a 9.2mt capacity at Chhattisgarh and Karnataka, along with split
grinding units and packaging terminals. This capacity would be operational in FY14. Grasim is expanding capacity in VSF by 156,500 tons (greenfield + brownfield). This
is supplemented by caustic capacity addition of 182,500 units. It would be investingINR33.6b to augment its capacity by 47% to 490,475 tons by FY13.
Other takeaways The proposed Land Acquisition Bill could result in 6x increase in land cost, thereby
resulting in increase in replacement cost by USD70-75/ton, necessitatingremunerative cement prices.
Post Domsjo acquisition, captive pulp contributes 90-100% of its requirementcurrently and 65-70% on expanded VSF capacity (FY14 onwards).
Covering Analyst(s):Jinesh K Gandhi+91 22 3982 [email protected]
Bloomberg GRASIM IN
Equity Shares (m) 92
CMP (INR) 2,108
Mcap (USD b) 4.2
52-Wk Range (INR) 2,625/1,981
1, 6, 12 Rel Perf (%) 8/1/12
YEAR NET SALES PAT EPS EPS P/E P/BV ROE ROCE EV/ EV/TON
END (INR M) (INR M) (INR) GR. (%) (X) (X) (%) (%) EBITDA (US$)
03/10A 199,334 27,342 298.2 25.0 7.1 1.5 22.7 23.9 3.4 -
03/11E* 212,690 18,828 205.3 -31.2 10.3 1.3 13.9 16.5 4.4 81
03/12E* 229,953 27,712 302.1 47.2 7.0 1.1 17.5 17.6 4.2 81
03/13E* 266,578 33,487 365.1 20.8 5.8 1.0 18.0 19.0 3.3 56
Sector: Cement
Consolidated; * Demerger of cement business assumed w.e.f. 1 October 2009
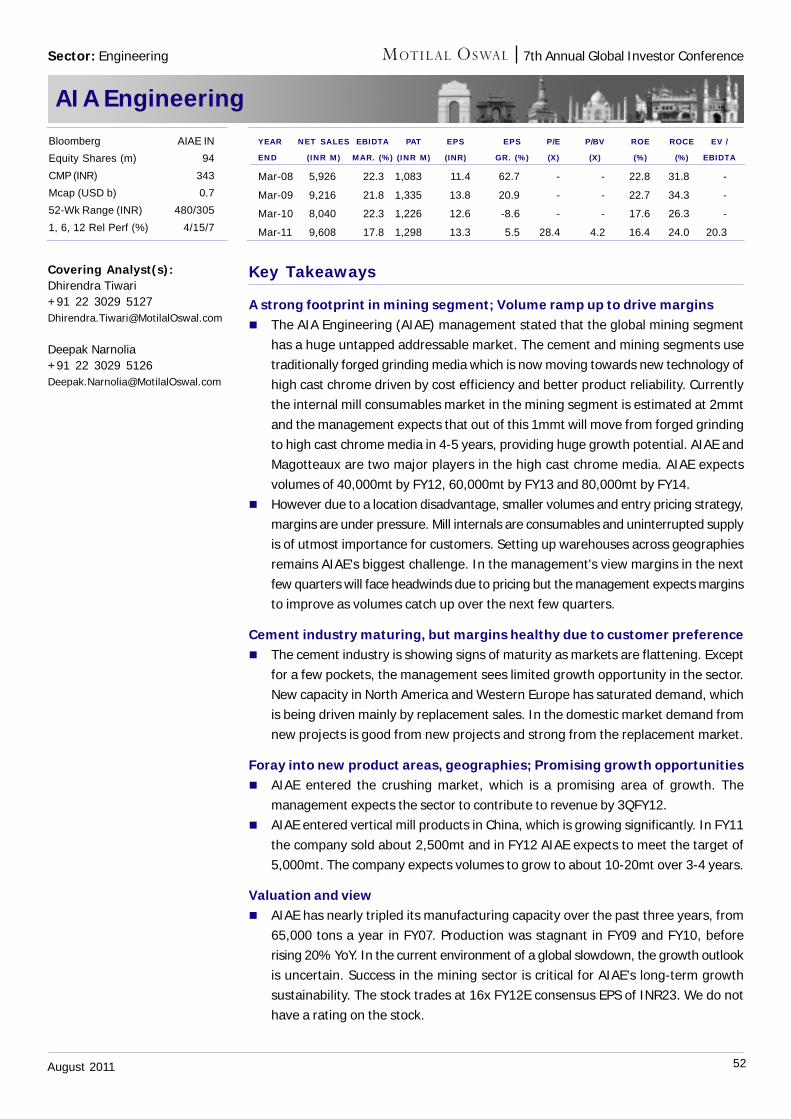
52August 2011
7th Annual Global Investor Conference
AIA Engineering
Key Takeaways
A strong footprint in mining segment; Volume ramp up to drive margins The AIA Engineering (AIAE) management stated that the global mining segment
has a huge untapped addressable market. The cement and mining segments usetraditionally forged grinding media which is now moving towards new technology ofhigh cast chrome driven by cost efficiency and better product reliability. Currentlythe internal mill consumables market in the mining segment is estimated at 2mmtand the management expects that out of this 1mmt will move from forged grindingto high cast chrome media in 4-5 years, providing huge growth potential. AIAE andMagotteaux are two major players in the high cast chrome media. AIAE expectsvolumes of 40,000mt by FY12, 60,000mt by FY13 and 80,000mt by FY14.
However due to a location disadvantage, smaller volumes and entry pricing strategy,margins are under pressure. Mill internals are consumables and uninterrupted supplyis of utmost importance for customers. Setting up warehouses across geographiesremains AIAE's biggest challenge. In the management's view margins in the nextfew quarters will face headwinds due to pricing but the management expects marginsto improve as volumes catch up over the next few quarters.
Cement industry maturing, but margins healthy due to customer preference The cement industry is showing signs of maturity as markets are flattening. Except
for a few pockets, the management sees limited growth opportunity in the sector.New capacity in North America and Western Europe has saturated demand, whichis being driven mainly by replacement sales. In the domestic market demand fromnew projects is good from new projects and strong from the replacement market.
Foray into new product areas, geographies; Promising growth opportunities AIAE entered the crushing market, which is a promising area of growth. The
management expects the sector to contribute to revenue by 3QFY12. AIAE entered vertical mill products in China, which is growing significantly. In FY11
the company sold about 2,500mt and in FY12 AIAE expects to meet the target of5,000mt. The company expects volumes to grow to about 10-20mt over 3-4 years.
Valuation and view AIAE has nearly tripled its manufacturing capacity over the past three years, from
65,000 tons a year in FY07. Production was stagnant in FY09 and FY10, beforerising 20% YoY. In the current environment of a global slowdown, the growth outlookis uncertain. Success in the mining sector is critical for AIAE's long-term growthsustainability. The stock trades at 16x FY12E consensus EPS of INR23. We do nothave a rating on the stock.
Covering Analyst(s):Dhirendra Tiwari+91 22 3029 [email protected]
Deepak Narnolia+91 22 3029 [email protected]
YEAR NET SALES EBIDTA PAT EPS EPS P/E P/BV ROE ROCE EV /
END (INR M) MAR. (%) (INR M) (INR) GR. (%) (X) (X) (%) (%) EBIDTA
Mar-08 5,926 22.3 1,083 11.4 62.7 - - 22.8 31.8 -
Mar-09 9,216 21.8 1,335 13.8 20.9 - - 22.7 34.3 -
Mar-10 8,040 22.3 1,226 12.6 -8.6 - - 17.6 26.3 -
Mar-11 9,608 17.8 1,298 13.3 5.5 28.4 4.2 16.4 24.0 20.3
Bloomberg AIAE IN
Equity Shares (m) 94
CMP (INR) 343
Mcap (USD b) 0.7
52-Wk Range (INR) 480/305
1, 6, 12 Rel Perf (%) 4/15/7
Sector: Engineering
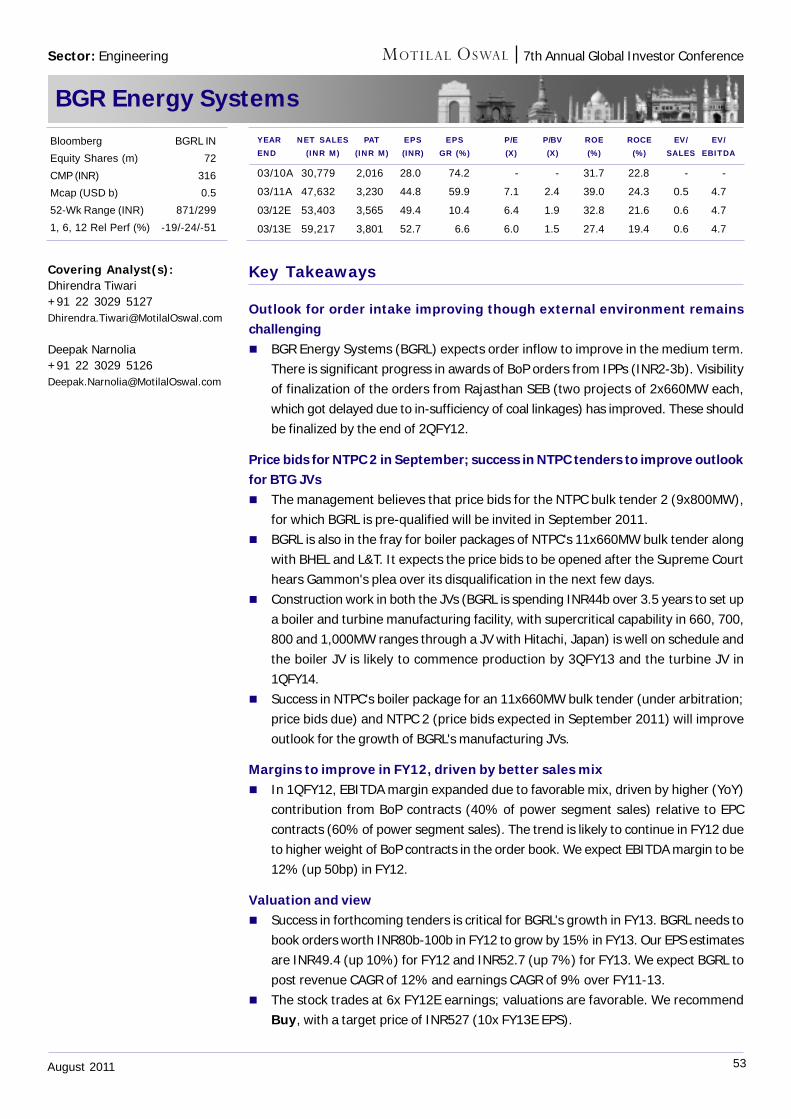
53August 2011
7th Annual Global Investor Conference
BGR Energy Systems
Key Takeaways
Outlook for order intake improving though external environment remainschallenging BGR Energy Systems (BGRL) expects order inflow to improve in the medium term.
There is significant progress in awards of BoP orders from IPPs (INR2-3b). Visibilityof finalization of the orders from Rajasthan SEB (two projects of 2x660MW each,which got delayed due to in-sufficiency of coal linkages) has improved. These shouldbe finalized by the end of 2QFY12.
Price bids for NTPC 2 in September; success in NTPC tenders to improve outlookfor BTG JVs The management believes that price bids for the NTPC bulk tender 2 (9x800MW),
for which BGRL is pre-qualified will be invited in September 2011. BGRL is also in the fray for boiler packages of NTPC's 11x660MW bulk tender along
with BHEL and L&T. It expects the price bids to be opened after the Supreme Courthears Gammon's plea over its disqualification in the next few days.
Construction work in both the JVs (BGRL is spending INR44b over 3.5 years to set upa boiler and turbine manufacturing facility, with supercritical capability in 660, 700,800 and 1,000MW ranges through a JV with Hitachi, Japan) is well on schedule andthe boiler JV is likely to commence production by 3QFY13 and the turbine JV in1QFY14.
Success in NTPC's boiler package for an 11x660MW bulk tender (under arbitration;price bids due) and NTPC 2 (price bids expected in September 2011) will improveoutlook for the growth of BGRL's manufacturing JVs.
Margins to improve in FY12, driven by better sales mix In 1QFY12, EBITDA margin expanded due to favorable mix, driven by higher (YoY)
contribution from BoP contracts (40% of power segment sales) relative to EPCcontracts (60% of power segment sales). The trend is likely to continue in FY12 dueto higher weight of BoP contracts in the order book. We expect EBITDA margin to be12% (up 50bp) in FY12.
Valuation and view Success in forthcoming tenders is critical for BGRL's growth in FY13. BGRL needs to
book orders worth INR80b-100b in FY12 to grow by 15% in FY13. Our EPS estimatesare INR49.4 (up 10%) for FY12 and INR52.7 (up 7%) for FY13. We expect BGRL topost revenue CAGR of 12% and earnings CAGR of 9% over FY11-13.
The stock trades at 6x FY12E earnings; valuations are favorable. We recommendBuy, with a target price of INR527 (10x FY13E EPS).
Covering Analyst(s):Dhirendra Tiwari+91 22 3029 [email protected]
Deepak Narnolia+91 22 3029 [email protected]
YEAR NET SALES PAT EPS EPS P/E P/BV ROE ROCE EV/ EV/END (INR M) (INR M) (INR) GR (%) (X) (X) (%) (%) SALES EBITDA
03/10A 30,779 2,016 28.0 74.2 - - 31.7 22.8 - -
03/11A 47,632 3,230 44.8 59.9 7.1 2.4 39.0 24.3 0.5 4.7
03/12E 53,403 3,565 49.4 10.4 6.4 1.9 32.8 21.6 0.6 4.7
03/13E 59,217 3,801 52.7 6.6 6.0 1.5 27.4 19.4 0.6 4.7
Bloomberg BGRL IN
Equity Shares (m) 72
CMP (INR) 316
Mcap (USD b) 0.5
52-Wk Range (INR) 871/299
1, 6, 12 Rel Perf (%) -19/-24/-51
Sector: Engineering
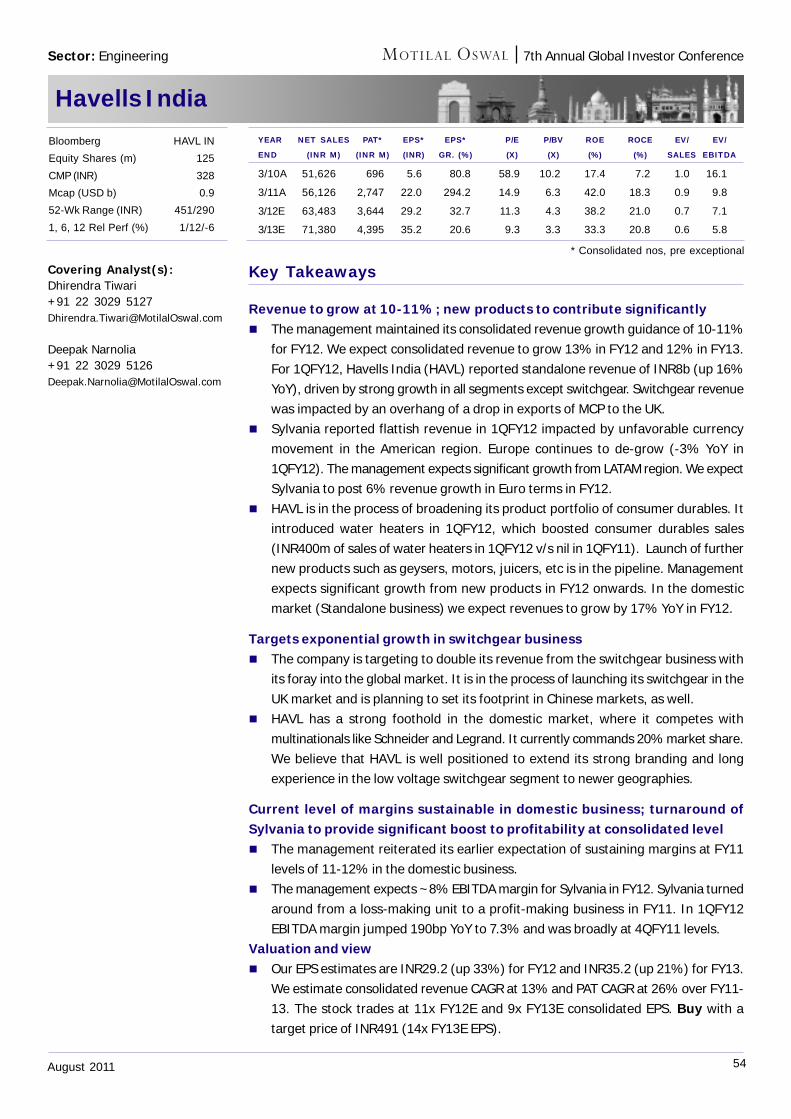
54August 2011
7th Annual Global Investor Conference
Havells India
Key Takeaways
Revenue to grow at 10-11%; new products to contribute significantly The management maintained its consolidated revenue growth guidance of 10-11%
for FY12. We expect consolidated revenue to grow 13% in FY12 and 12% in FY13.For 1QFY12, Havells India (HAVL) reported standalone revenue of INR8b (up 16%YoY), driven by strong growth in all segments except switchgear. Switchgear revenuewas impacted by an overhang of a drop in exports of MCP to the UK.
Sylvania reported flattish revenue in 1QFY12 impacted by unfavorable currencymovement in the American region. Europe continues to de-grow (-3% YoY in1QFY12). The management expects significant growth from LATAM region. We expectSylvania to post 6% revenue growth in Euro terms in FY12.
HAVL is in the process of broadening its product portfolio of consumer durables. Itintroduced water heaters in 1QFY12, which boosted consumer durables sales(INR400m of sales of water heaters in 1QFY12 v/s nil in 1QFY11). Launch of furthernew products such as geysers, motors, juicers, etc is in the pipeline. Managementexpects significant growth from new products in FY12 onwards. In the domesticmarket (Standalone business) we expect revenues to grow by 17% YoY in FY12.
Targets exponential growth in switchgear business The company is targeting to double its revenue from the switchgear business with
its foray into the global market. It is in the process of launching its switchgear in theUK market and is planning to set its footprint in Chinese markets, as well.
HAVL has a strong foothold in the domestic market, where it competes withmultinationals like Schneider and Legrand. It currently commands 20% market share.We believe that HAVL is well positioned to extend its strong branding and longexperience in the low voltage switchgear segment to newer geographies.
Current level of margins sustainable in domestic business; turnaround ofSylvania to provide significant boost to profitability at consolidated level The management reiterated its earlier expectation of sustaining margins at FY11
levels of 11-12% in the domestic business. The management expects ~8% EBITDA margin for Sylvania in FY12. Sylvania turned
around from a loss-making unit to a profit-making business in FY11. In 1QFY12EBITDA margin jumped 190bp YoY to 7.3% and was broadly at 4QFY11 levels.
Valuation and view Our EPS estimates are INR29.2 (up 33%) for FY12 and INR35.2 (up 21%) for FY13.
We estimate consolidated revenue CAGR at 13% and PAT CAGR at 26% over FY11-13. The stock trades at 11x FY12E and 9x FY13E consolidated EPS. Buy with atarget price of INR491 (14x FY13E EPS).
Covering Analyst(s):Dhirendra Tiwari+91 22 3029 [email protected]
Deepak Narnolia+91 22 3029 [email protected]
YEAR NET SALES PAT* EPS* EPS* P/E P/BV ROE ROCE EV/ EV/
END (INR M) (INR M) (INR) GR. (%) (X) (X) (%) (%) SALES EBITDA
3/10A 51,626 696 5.6 80.8 58.9 10.2 17.4 7.2 1.0 16.1
3/11A 56,126 2,747 22.0 294.2 14.9 6.3 42.0 18.3 0.9 9.8
3/12E 63,483 3,644 29.2 32.7 11.3 4.3 38.2 21.0 0.7 7.1
3/13E 71,380 4,395 35.2 20.6 9.3 3.3 33.3 20.8 0.6 5.8
Bloomberg HAVL IN
Equity Shares (m) 125
CMP (INR) 328
Mcap (USD b) 0.9
52-Wk Range (INR) 451/290
1, 6, 12 Rel Perf (%) 1/12/-6
Sector: Engineering
* Consolidated nos, pre exceptional
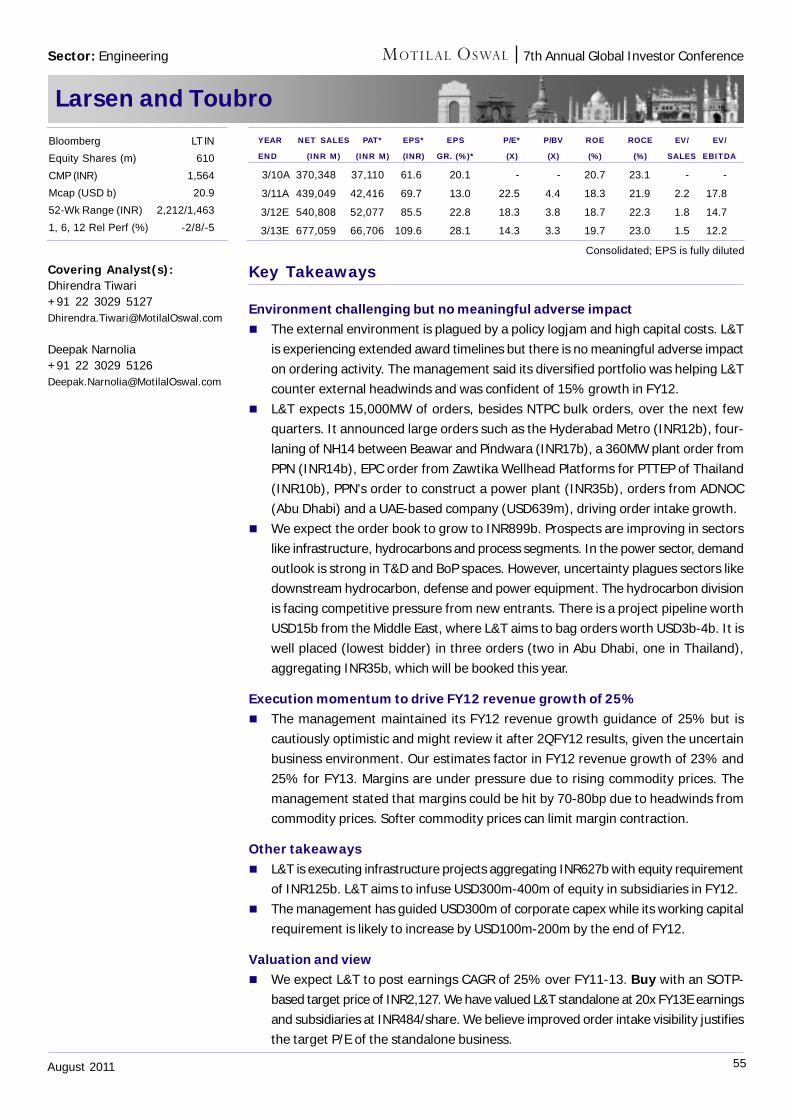
55August 2011
7th Annual Global Investor Conference
Larsen and Toubro
Key Takeaways
Environment challenging but no meaningful adverse impact The external environment is plagued by a policy logjam and high capital costs. L&T
is experiencing extended award timelines but there is no meaningful adverse impacton ordering activity. The management said its diversified portfolio was helping L&Tcounter external headwinds and was confident of 15% growth in FY12.
L&T expects 15,000MW of orders, besides NTPC bulk orders, over the next fewquarters. It announced large orders such as the Hyderabad Metro (INR12b), four-laning of NH14 between Beawar and Pindwara (INR17b), a 360MW plant order fromPPN (INR14b), EPC order from Zawtika Wellhead Platforms for PTTEP of Thailand(INR10b), PPN's order to construct a power plant (INR35b), orders from ADNOC(Abu Dhabi) and a UAE-based company (USD639m), driving order intake growth.
We expect the order book to grow to INR899b. Prospects are improving in sectorslike infrastructure, hydrocarbons and process segments. In the power sector, demandoutlook is strong in T&D and BoP spaces. However, uncertainty plagues sectors likedownstream hydrocarbon, defense and power equipment. The hydrocarbon divisionis facing competitive pressure from new entrants. There is a project pipeline worthUSD15b from the Middle East, where L&T aims to bag orders worth USD3b-4b. It iswell placed (lowest bidder) in three orders (two in Abu Dhabi, one in Thailand),aggregating INR35b, which will be booked this year.
Execution momentum to drive FY12 revenue growth of 25% The management maintained its FY12 revenue growth guidance of 25% but is
cautiously optimistic and might review it after 2QFY12 results, given the uncertainbusiness environment. Our estimates factor in FY12 revenue growth of 23% and25% for FY13. Margins are under pressure due to rising commodity prices. Themanagement stated that margins could be hit by 70-80bp due to headwinds fromcommodity prices. Softer commodity prices can limit margin contraction.
Other takeaways L&T is executing infrastructure projects aggregating INR627b with equity requirement
of INR125b. L&T aims to infuse USD300m-400m of equity in subsidiaries in FY12. The management has guided USD300m of corporate capex while its working capital
requirement is likely to increase by USD100m-200m by the end of FY12.
Valuation and view We expect L&T to post earnings CAGR of 25% over FY11-13. Buy with an SOTP-
based target price of INR2,127. We have valued L&T standalone at 20x FY13E earningsand subsidiaries at INR484/share. We believe improved order intake visibility justifiesthe target P/E of the standalone business.
Covering Analyst(s):Dhirendra Tiwari+91 22 3029 [email protected]
Deepak Narnolia+91 22 3029 [email protected]
YEAR NET SALES PAT* EPS* EPS P/E* P/BV ROE ROCE EV/ EV/
END (INR M) (INR M) (INR) GR. (%)* (X) (X) (%) (%) SALES EBITDA
3/10A 370,348 37,110 61.6 20.1 - - 20.7 23.1 - -
3/11A 439,049 42,416 69.7 13.0 22.5 4.4 18.3 21.9 2.2 17.8
3/12E 540,808 52,077 85.5 22.8 18.3 3.8 18.7 22.3 1.8 14.7
3/13E 677,059 66,706 109.6 28.1 14.3 3.3 19.7 23.0 1.5 12.2
Bloomberg LT IN
Equity Shares (m) 610
CMP (INR) 1,564
Mcap (USD b) 20.9
52-Wk Range (INR) 2,212/1,463
1, 6, 12 Rel Perf (%) -2/8/-5
Sector: Engineering
Consolidated; EPS is fully diluted
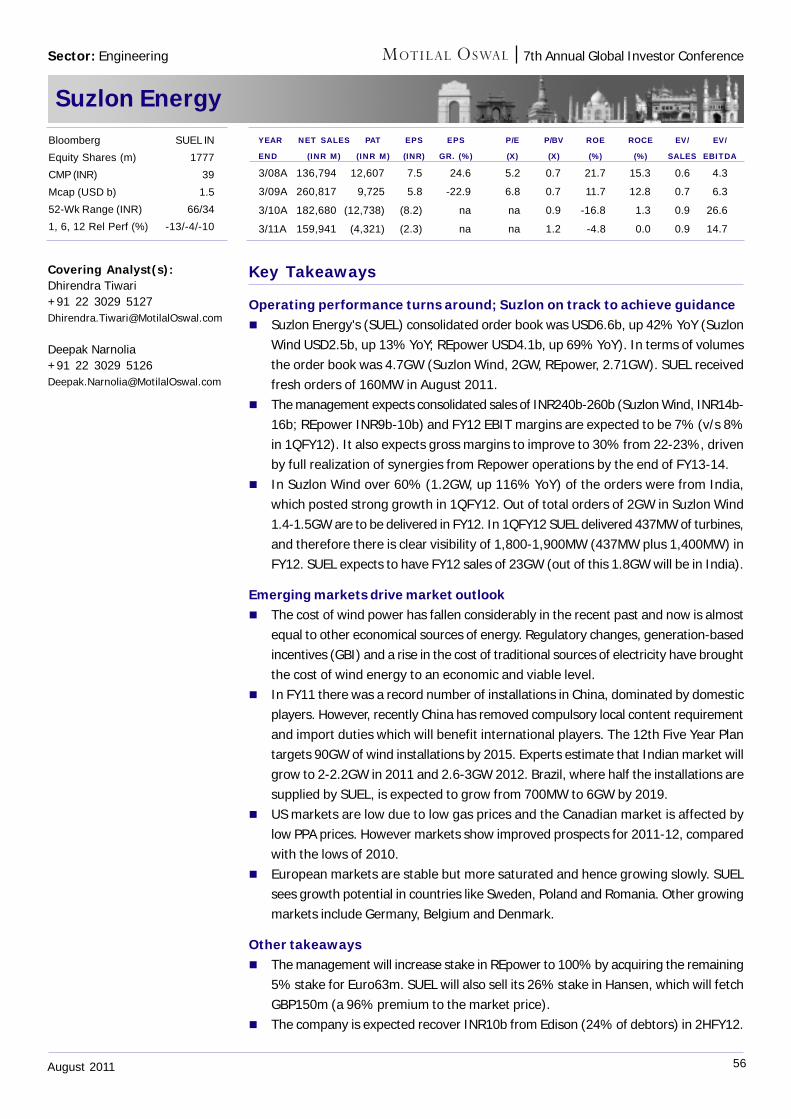
56August 2011
7th Annual Global Investor Conference
Suzlon Energy
Key Takeaways
Operating performance turns around; Suzlon on track to achieve guidance Suzlon Energy's (SUEL) consolidated order book was USD6.6b, up 42% YoY (Suzlon
Wind USD2.5b, up 13% YoY; REpower USD4.1b, up 69% YoY). In terms of volumesthe order book was 4.7GW (Suzlon Wind, 2GW, REpower, 2.71GW). SUEL receivedfresh orders of 160MW in August 2011.
The management expects consolidated sales of INR240b-260b (Suzlon Wind, INR14b-16b; REpower INR9b-10b) and FY12 EBIT margins are expected to be 7% (v/s 8%in 1QFY12). It also expects gross margins to improve to 30% from 22-23%, drivenby full realization of synergies from Repower operations by the end of FY13-14.
In Suzlon Wind over 60% (1.2GW, up 116% YoY) of the orders were from India,which posted strong growth in 1QFY12. Out of total orders of 2GW in Suzlon Wind1.4-1.5GW are to be delivered in FY12. In 1QFY12 SUEL delivered 437MW of turbines,and therefore there is clear visibility of 1,800-1,900MW (437MW plus 1,400MW) inFY12. SUEL expects to have FY12 sales of 23GW (out of this 1.8GW will be in India).
Emerging markets drive market outlook The cost of wind power has fallen considerably in the recent past and now is almost
equal to other economical sources of energy. Regulatory changes, generation-basedincentives (GBI) and a rise in the cost of traditional sources of electricity have broughtthe cost of wind energy to an economic and viable level.
In FY11 there was a record number of installations in China, dominated by domesticplayers. However, recently China has removed compulsory local content requirementand import duties which will benefit international players. The 12th Five Year Plantargets 90GW of wind installations by 2015. Experts estimate that Indian market willgrow to 2-2.2GW in 2011 and 2.6-3GW 2012. Brazil, where half the installations aresupplied by SUEL, is expected to grow from 700MW to 6GW by 2019.
US markets are low due to low gas prices and the Canadian market is affected bylow PPA prices. However markets show improved prospects for 2011-12, comparedwith the lows of 2010.
European markets are stable but more saturated and hence growing slowly. SUELsees growth potential in countries like Sweden, Poland and Romania. Other growingmarkets include Germany, Belgium and Denmark.
Other takeaways The management will increase stake in REpower to 100% by acquiring the remaining
5% stake for Euro63m. SUEL will also sell its 26% stake in Hansen, which will fetchGBP150m (a 96% premium to the market price).
The company is expected recover INR10b from Edison (24% of debtors) in 2HFY12.
Covering Analyst(s):Dhirendra Tiwari+91 22 3029 [email protected]
Deepak Narnolia+91 22 3029 [email protected]
YEAR NET SALES PAT EPS EPS P/E P/BV ROE ROCE EV/ EV/
END (INR M) (INR M) (INR) GR. (%) (X) (X) (%) (%) SALES EBITDA
3/08A 136,794 12,607 7.5 24.6 5.2 0.7 21.7 15.3 0.6 4.3
3/09A 260,817 9,725 5.8 -22.9 6.8 0.7 11.7 12.8 0.7 6.3
3/10A 182,680 (12,738) (8.2) na na 0.9 -16.8 1.3 0.9 26.6
3/11A 159,941 (4,321) (2.3) na na 1.2 -4.8 0.0 0.9 14.7
Bloomberg SUEL IN
Equity Shares (m) 1777
CMP (INR) 39
Mcap (USD b) 1.5
52-Wk Range (INR) 66/34
1, 6, 12 Rel Perf (%) -13/-4/-10
Sector: Engineering
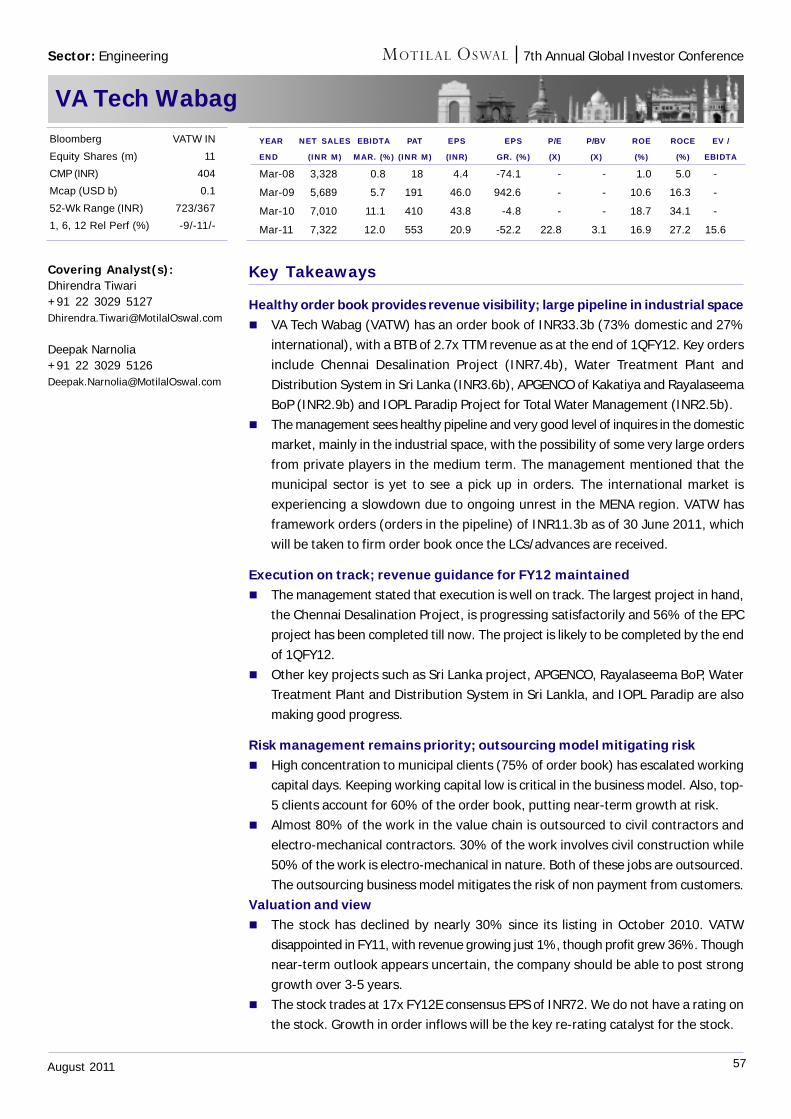
57August 2011
7th Annual Global Investor Conference
VA Tech Wabag
Key Takeaways
Healthy order book provides revenue visibility; large pipeline in industrial space VA Tech Wabag (VATW) has an order book of INR33.3b (73% domestic and 27%
international), with a BTB of 2.7x TTM revenue as at the end of 1QFY12. Key ordersinclude Chennai Desalination Project (INR7.4b), Water Treatment Plant andDistribution System in Sri Lanka (INR3.6b), APGENCO of Kakatiya and RayalaseemaBoP (INR2.9b) and IOPL Paradip Project for Total Water Management (INR2.5b).
The management sees healthy pipeline and very good level of inquires in the domesticmarket, mainly in the industrial space, with the possibility of some very large ordersfrom private players in the medium term. The management mentioned that themunicipal sector is yet to see a pick up in orders. The international market isexperiencing a slowdown due to ongoing unrest in the MENA region. VATW hasframework orders (orders in the pipeline) of INR11.3b as of 30 June 2011, whichwill be taken to firm order book once the LCs/advances are received.
Execution on track; revenue guidance for FY12 maintained The management stated that execution is well on track. The largest project in hand,
the Chennai Desalination Project, is progressing satisfactorily and 56% of the EPCproject has been completed till now. The project is likely to be completed by the endof 1QFY12.
Other key projects such as Sri Lanka project, APGENCO, Rayalaseema BoP, WaterTreatment Plant and Distribution System in Sri Lankla, and IOPL Paradip are alsomaking good progress.
Risk management remains priority; outsourcing model mitigating risk High concentration to municipal clients (75% of order book) has escalated working
capital days. Keeping working capital low is critical in the business model. Also, top-5 clients account for 60% of the order book, putting near-term growth at risk.
Almost 80% of the work in the value chain is outsourced to civil contractors andelectro-mechanical contractors. 30% of the work involves civil construction while50% of the work is electro-mechanical in nature. Both of these jobs are outsourced.The outsourcing business model mitigates the risk of non payment from customers.
Valuation and view The stock has declined by nearly 30% since its listing in October 2010. VATW
disappointed in FY11, with revenue growing just 1%, though profit grew 36%. Thoughnear-term outlook appears uncertain, the company should be able to post stronggrowth over 3-5 years.
The stock trades at 17x FY12E consensus EPS of INR72. We do not have a rating onthe stock. Growth in order inflows will be the key re-rating catalyst for the stock.
Covering Analyst(s):Dhirendra Tiwari+91 22 3029 [email protected]
Deepak Narnolia+91 22 3029 [email protected]
YEAR NET SALES EBIDTA PAT EPS EPS P/E P/BV ROE ROCE EV /
END (INR M) MAR. (%) (INR M) (INR) GR. (%) (X) (X) (%) (%) EBIDTA
Mar-08 3,328 0.8 18 4.4 -74.1 - - 1.0 5.0 -
Mar-09 5,689 5.7 191 46.0 942.6 - - 10.6 16.3 -
Mar-10 7,010 11.1 410 43.8 -4.8 - - 18.7 34.1 -
Mar-11 7,322 12.0 553 20.9 -52.2 22.8 3.1 16.9 27.2 15.6
Bloomberg VATW IN
Equity Shares (m) 11
CMP (INR) 404
Mcap (USD b) 0.1
52-Wk Range (INR) 723/367
1, 6, 12 Rel Perf (%) -9/-11/-
Sector: Engineering
58August 2011
7th Annual Global Investor Conference
Voltas
Key Takeaways
Environment challenging; increased project size in construction a positive Despite concerns in the near term, the domestic MEP business is showing good
traction. The increasing size of construction projects in the domestic market(especially in IT parks) is also boosting order inflows.
Voltas (VOLT) has a domestic order book of ~INR19.5b as at 1QFY12 end, however,margins remain compressed because MEP projects now being finalized throughmain contractors. Incremental orders are also witnessing margin pressure due toincreasing competitive intensity.
In the international space, competitive intensity is increasing resulting in pressureon margins. The two large projects in Qatar (~INR15b in order book), are facingmargin pressure due to accelerated execution. The orders should be completed bymid-FY13. VOLT expects long term EBIT margin of 7% for the international business.
VOLT plans to bid for large projects in partnership with other strong players and thecompany also entered into two new joint ventures (administrative partner to facilitatelocal ordering process in the Middle East) in the Kingdom of Saudi Arabia and Oman,and in the Far East which should help boost order intake in the region.
The management reiterated that RIE would break even in FY12. Most of the low/nilmargin legacy orders are complete and new orders have adequate margins.
EMP segment: Healthy growth in Textile Machinery; Mining & Equipmentconstrained by regulatory environment Management highlighted that many mills that had procured raw material at high
prices face a cash loss situation. VOLT has a healthy order book, but this needs tobe watched for changing business sentiment.
The mining and construction equipment business is challenged, as several clientcompanies are facing delays in obtaining environment and forest clearances.
Gains share in unitary cooling, though market getting increasingly fragmented The market is increasingly getting fragmented, with the top 3 players accounting for
60% of the market v/s 65% a few months ago. However, VOLT gained market sharein recent quarters and has now number 2 position (after LG) in the domestic market.
According to management margin pressures are unavoidable in the segment. Theindustry as a whole faces the problem of high inventory levels which could result inhigher discounting to liquidate unsold stock. VOLT expects its inventory to liquidateby the end of December 2011.
Valuation and view The stock trades at 12x FY12E consensus earnings. With 10-12% growth in core
earnings likely, VOLT is attractively priced. Success in a few large contracts in Indiaor the Middle East will be the key catalyst. We do not have a rating on the stock.
Covering Analyst(s):Dhirendra Tiwari+91 22 3029 [email protected]
Deepak Narnolia+91 22 3029 [email protected]
Bloomberg VOLT IN
Equity Shares (m) 331
CMP (INR) 116
Mcap (USD b) 0.8
52-Wk Range (INR) 263/109
1, 6, 12 Rel Perf (%) -8/-21/-32
Sector: Engineering
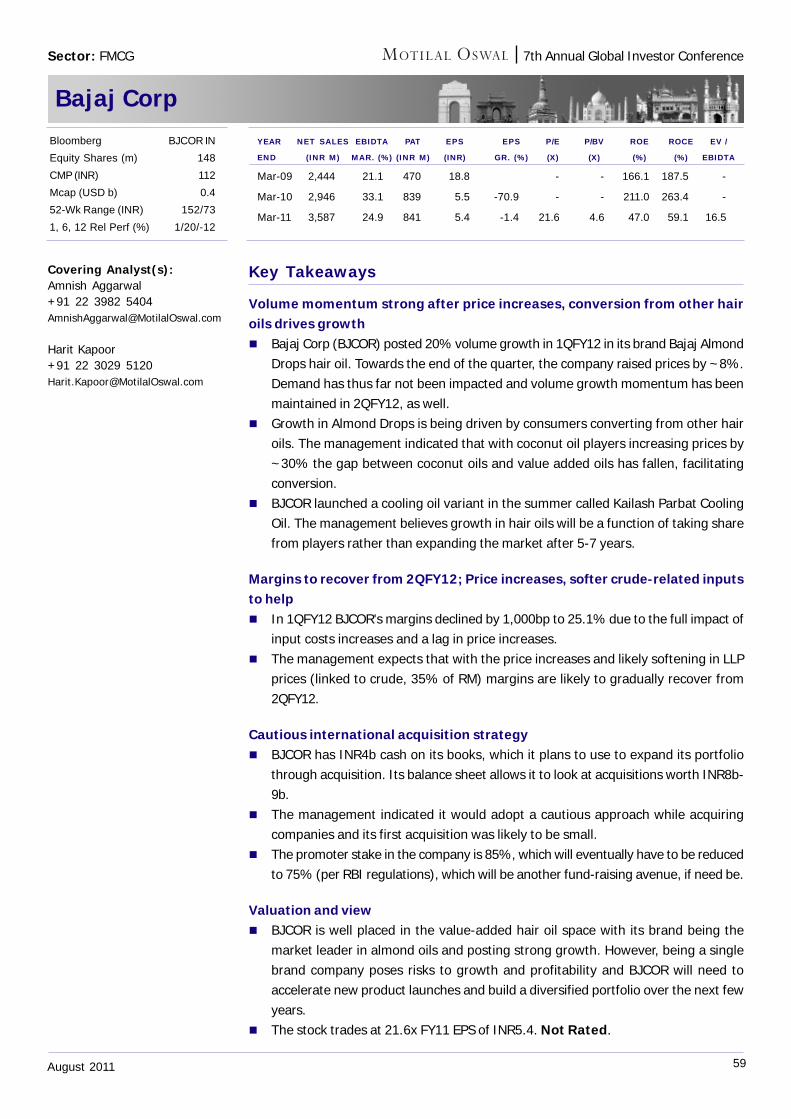
59August 2011
7th Annual Global Investor Conference
Bajaj Corp
Key Takeaways
Volume momentum strong after price increases, conversion from other hairoils drives growth Bajaj Corp (BJCOR) posted 20% volume growth in 1QFY12 in its brand Bajaj Almond
Drops hair oil. Towards the end of the quarter, the company raised prices by ~8%.Demand has thus far not been impacted and volume growth momentum has beenmaintained in 2QFY12, as well.
Growth in Almond Drops is being driven by consumers converting from other hairoils. The management indicated that with coconut oil players increasing prices by~30% the gap between coconut oils and value added oils has fallen, facilitatingconversion.
BJCOR launched a cooling oil variant in the summer called Kailash Parbat CoolingOil. The management believes growth in hair oils will be a function of taking sharefrom players rather than expanding the market after 5-7 years.
Margins to recover from 2QFY12; Price increases, softer crude-related inputsto help In 1QFY12 BJCOR's margins declined by 1,000bp to 25.1% due to the full impact of
input costs increases and a lag in price increases. The management expects that with the price increases and likely softening in LLP
prices (linked to crude, 35% of RM) margins are likely to gradually recover from2QFY12.
Cautious international acquisition strategy BJCOR has INR4b cash on its books, which it plans to use to expand its portfolio
through acquisition. Its balance sheet allows it to look at acquisitions worth INR8b-9b.
The management indicated it would adopt a cautious approach while acquiringcompanies and its first acquisition was likely to be small.
The promoter stake in the company is 85%, which will eventually have to be reducedto 75% (per RBI regulations), which will be another fund-raising avenue, if need be.
Valuation and view BJCOR is well placed in the value-added hair oil space with its brand being the
market leader in almond oils and posting strong growth. However, being a singlebrand company poses risks to growth and profitability and BJCOR will need toaccelerate new product launches and build a diversified portfolio over the next fewyears.
The stock trades at 21.6x FY11 EPS of INR5.4. Not Rated.
Covering Analyst(s):Amnish Aggarwal+91 22 3982 [email protected]
Harit Kapoor+91 22 3029 [email protected]
YEAR NET SALES EBIDTA PAT EPS EPS P/E P/BV ROE ROCE EV /
END (INR M) MAR. (%) (INR M) (INR) GR. (%) (X) (X) (%) (%) EBIDTA
Mar-09 2,444 21.1 470 18.8 - - 166.1 187.5 -
Mar-10 2,946 33.1 839 5.5 -70.9 - - 211.0 263.4 -
Mar-11 3,587 24.9 841 5.4 -1.4 21.6 4.6 47.0 59.1 16.5
Bloomberg BJCOR IN
Equity Shares (m) 148
CMP (INR) 112
Mcap (USD b) 0.4
52-Wk Range (INR) 152/73
1, 6, 12 Rel Perf (%) 1/20/-12
Sector: FMCG
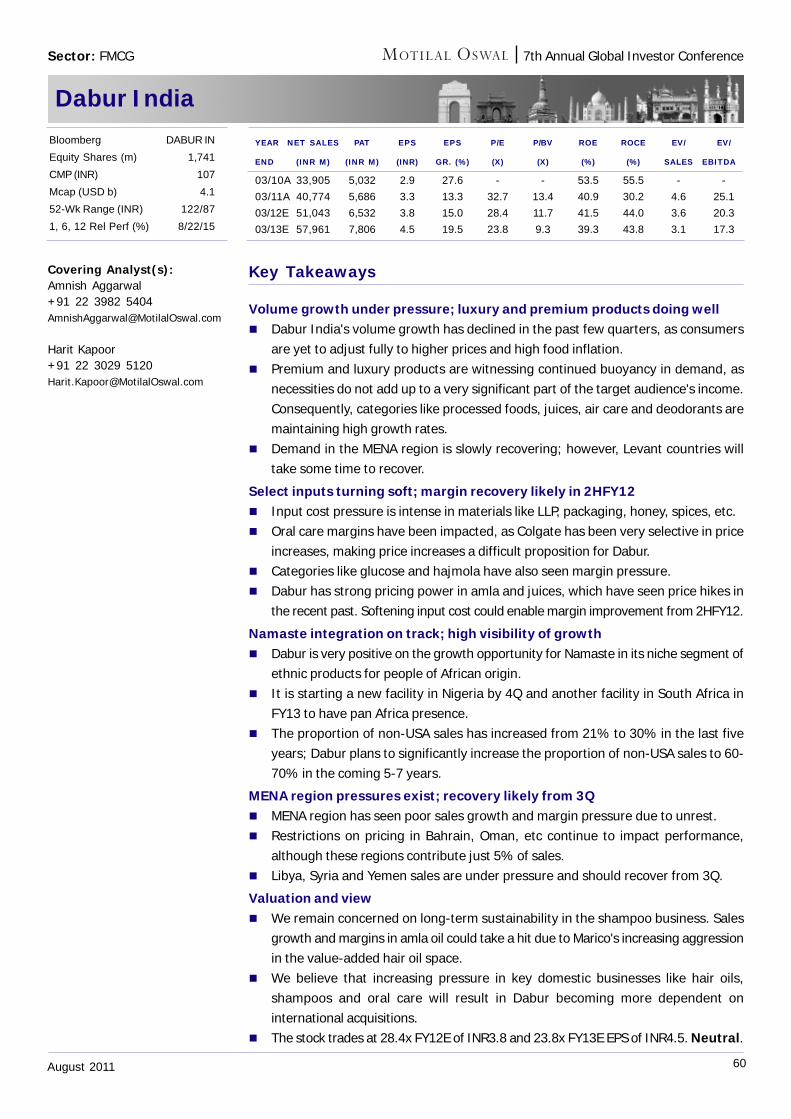
60August 2011
7th Annual Global Investor Conference
Dabur India
Key Takeaways
Volume growth under pressure; luxury and premium products doing well Dabur India's volume growth has declined in the past few quarters, as consumers
are yet to adjust fully to higher prices and high food inflation. Premium and luxury products are witnessing continued buoyancy in demand, as
necessities do not add up to a very significant part of the target audience's income.Consequently, categories like processed foods, juices, air care and deodorants aremaintaining high growth rates.
Demand in the MENA region is slowly recovering; however, Levant countries willtake some time to recover.
Select inputs turning soft; margin recovery likely in 2HFY12 Input cost pressure is intense in materials like LLP, packaging, honey, spices, etc. Oral care margins have been impacted, as Colgate has been very selective in price
increases, making price increases a difficult proposition for Dabur. Categories like glucose and hajmola have also seen margin pressure. Dabur has strong pricing power in amla and juices, which have seen price hikes in
the recent past. Softening input cost could enable margin improvement from 2HFY12.
Namaste integration on track; high visibility of growth Dabur is very positive on the growth opportunity for Namaste in its niche segment of
ethnic products for people of African origin. It is starting a new facility in Nigeria by 4Q and another facility in South Africa in
FY13 to have pan Africa presence. The proportion of non-USA sales has increased from 21% to 30% in the last five
years; Dabur plans to significantly increase the proportion of non-USA sales to 60-70% in the coming 5-7 years.
MENA region pressures exist; recovery likely from 3Q MENA region has seen poor sales growth and margin pressure due to unrest. Restrictions on pricing in Bahrain, Oman, etc continue to impact performance,
although these regions contribute just 5% of sales. Libya, Syria and Yemen sales are under pressure and should recover from 3Q.
Valuation and view We remain concerned on long-term sustainability in the shampoo business. Sales
growth and margins in amla oil could take a hit due to Marico's increasing aggressionin the value-added hair oil space.
We believe that increasing pressure in key domestic businesses like hair oils,shampoos and oral care will result in Dabur becoming more dependent oninternational acquisitions.
The stock trades at 28.4x FY12E of INR3.8 and 23.8x FY13E EPS of INR4.5. Neutral.
Covering Analyst(s):Amnish Aggarwal+91 22 3982 [email protected]
Harit Kapoor+91 22 3029 [email protected]
YEAR NET SALES PAT EPS EPS P/E P/BV ROE ROCE EV/ EV/
END (INR M) (INR M) (INR) GR. (%) (X) (X) (%) (%) SALES EBITDA
03/10A 33,905 5,032 2.9 27.6 - - 53.5 55.5 - -
03/11A 40,774 5,686 3.3 13.3 32.7 13.4 40.9 30.2 4.6 25.1
03/12E 51,043 6,532 3.8 15.0 28.4 11.7 41.5 44.0 3.6 20.3
03/13E 57,961 7,806 4.5 19.5 23.8 9.3 39.3 43.8 3.1 17.3
Bloomberg DABUR IN
Equity Shares (m) 1,741
CMP (INR) 107
Mcap (USD b) 4.1
52-Wk Range (INR) 122/87
1, 6, 12 Rel Perf (%) 8/22/15
Sector: FMCG
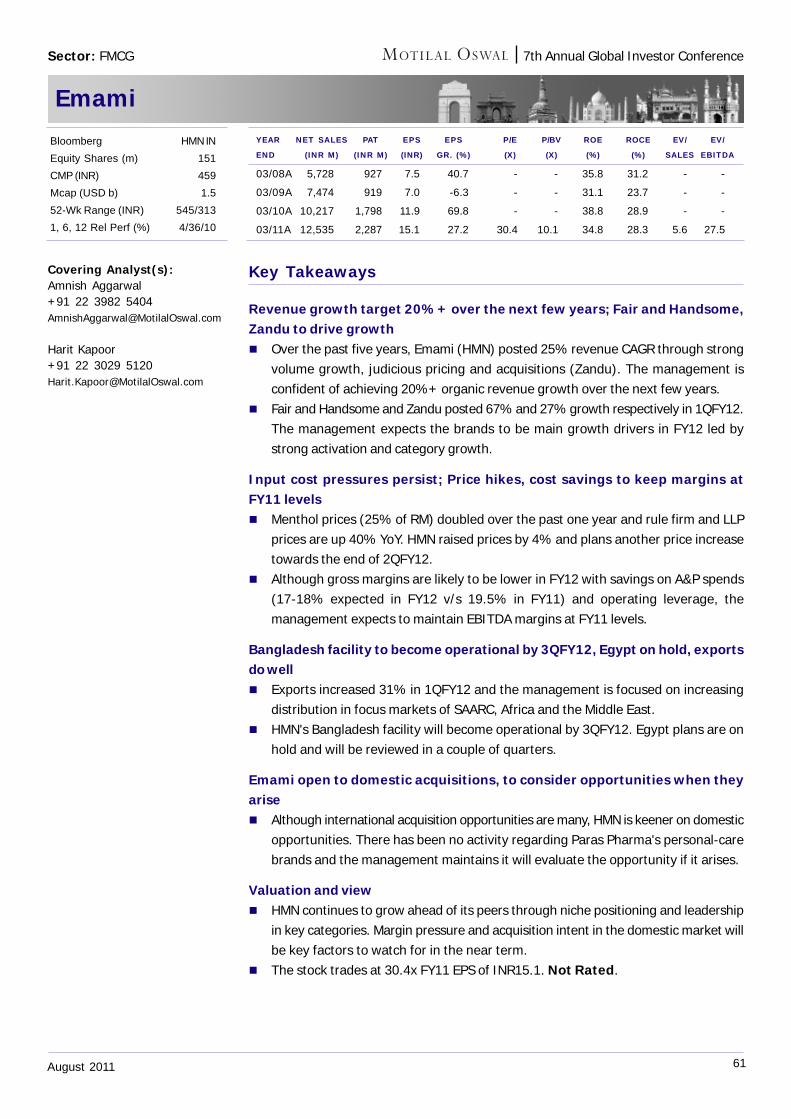
61August 2011
7th Annual Global Investor Conference
Emami
Key Takeaways
Revenue growth target 20%+ over the next few years; Fair and Handsome,Zandu to drive growth Over the past five years, Emami (HMN) posted 25% revenue CAGR through strong
volume growth, judicious pricing and acquisitions (Zandu). The management isconfident of achieving 20%+ organic revenue growth over the next few years.
Fair and Handsome and Zandu posted 67% and 27% growth respectively in 1QFY12.The management expects the brands to be main growth drivers in FY12 led bystrong activation and category growth.
Input cost pressures persist; Price hikes, cost savings to keep margins atFY11 levels Menthol prices (25% of RM) doubled over the past one year and rule firm and LLP
prices are up 40% YoY. HMN raised prices by 4% and plans another price increasetowards the end of 2QFY12.
Although gross margins are likely to be lower in FY12 with savings on A&P spends(17-18% expected in FY12 v/s 19.5% in FY11) and operating leverage, themanagement expects to maintain EBITDA margins at FY11 levels.
Bangladesh facility to become operational by 3QFY12, Egypt on hold, exportsdo well Exports increased 31% in 1QFY12 and the management is focused on increasing
distribution in focus markets of SAARC, Africa and the Middle East. HMN's Bangladesh facility will become operational by 3QFY12. Egypt plans are on
hold and will be reviewed in a couple of quarters.
Emami open to domestic acquisitions, to consider opportunities when theyarise Although international acquisition opportunities are many, HMN is keener on domestic
opportunities. There has been no activity regarding Paras Pharma's personal-carebrands and the management maintains it will evaluate the opportunity if it arises.
Valuation and view HMN continues to grow ahead of its peers through niche positioning and leadership
in key categories. Margin pressure and acquisition intent in the domestic market willbe key factors to watch for in the near term.
The stock trades at 30.4x FY11 EPS of INR15.1. Not Rated.
Covering Analyst(s):Amnish Aggarwal+91 22 3982 [email protected]
Harit Kapoor+91 22 3029 [email protected]
YEAR NET SALES PAT EPS EPS P/E P/BV ROE ROCE EV/ EV/
END (INR M) (INR M) (INR) GR. (%) (X) (X) (%) (%) SALES EBITDA
03/08A 5,728 927 7.5 40.7 - - 35.8 31.2 - -
03/09A 7,474 919 7.0 -6.3 - - 31.1 23.7 - -
03/10A 10,217 1,798 11.9 69.8 - - 38.8 28.9 - -
03/11A 12,535 2,287 15.1 27.2 30.4 10.1 34.8 28.3 5.6 27.5
Bloomberg HMN IN
Equity Shares (m) 151
CMP (INR) 459
Mcap (USD b) 1.5
52-Wk Range (INR) 545/313
1, 6, 12 Rel Perf (%) 4/36/10
Sector: FMCG
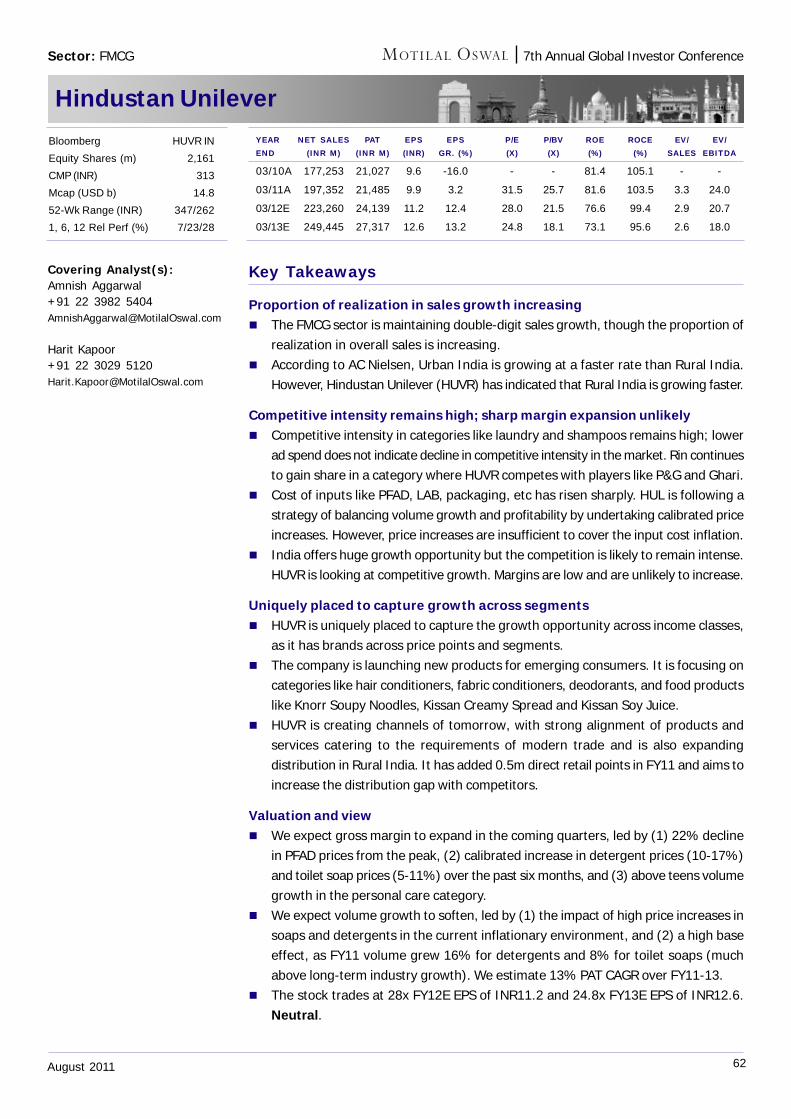
62August 2011
7th Annual Global Investor Conference
Hindustan Unilever
Key Takeaways
Proportion of realization in sales growth increasing The FMCG sector is maintaining double-digit sales growth, though the proportion of
realization in overall sales is increasing. According to AC Nielsen, Urban India is growing at a faster rate than Rural India.
However, Hindustan Unilever (HUVR) has indicated that Rural India is growing faster.
Competitive intensity remains high; sharp margin expansion unlikely Competitive intensity in categories like laundry and shampoos remains high; lower
ad spend does not indicate decline in competitive intensity in the market. Rin continuesto gain share in a category where HUVR competes with players like P&G and Ghari.
Cost of inputs like PFAD, LAB, packaging, etc has risen sharply. HUL is following astrategy of balancing volume growth and profitability by undertaking calibrated priceincreases. However, price increases are insufficient to cover the input cost inflation.
India offers huge growth opportunity but the competition is likely to remain intense.HUVR is looking at competitive growth. Margins are low and are unlikely to increase.
Uniquely placed to capture growth across segments HUVR is uniquely placed to capture the growth opportunity across income classes,
as it has brands across price points and segments. The company is launching new products for emerging consumers. It is focusing on
categories like hair conditioners, fabric conditioners, deodorants, and food productslike Knorr Soupy Noodles, Kissan Creamy Spread and Kissan Soy Juice.
HUVR is creating channels of tomorrow, with strong alignment of products andservices catering to the requirements of modern trade and is also expandingdistribution in Rural India. It has added 0.5m direct retail points in FY11 and aims toincrease the distribution gap with competitors.
Valuation and view We expect gross margin to expand in the coming quarters, led by (1) 22% decline
in PFAD prices from the peak, (2) calibrated increase in detergent prices (10-17%)and toilet soap prices (5-11%) over the past six months, and (3) above teens volumegrowth in the personal care category.
We expect volume growth to soften, led by (1) the impact of high price increases insoaps and detergents in the current inflationary environment, and (2) a high baseeffect, as FY11 volume grew 16% for detergents and 8% for toilet soaps (muchabove long-term industry growth). We estimate 13% PAT CAGR over FY11-13.
The stock trades at 28x FY12E EPS of INR11.2 and 24.8x FY13E EPS of INR12.6.Neutral.
Covering Analyst(s):Amnish Aggarwal+91 22 3982 [email protected]
Harit Kapoor+91 22 3029 [email protected]
YEAR NET SALES PAT EPS EPS P/E P/BV ROE ROCE EV/ EV/END (INR M) (INR M) (INR) GR. (%) (X) (X) (%) (%) SALES EBITDA
03/10A 177,253 21,027 9.6 -16.0 - - 81.4 105.1 - -
03/11A 197,352 21,485 9.9 3.2 31.5 25.7 81.6 103.5 3.3 24.0
03/12E 223,260 24,139 11.2 12.4 28.0 21.5 76.6 99.4 2.9 20.7
03/13E 249,445 27,317 12.6 13.2 24.8 18.1 73.1 95.6 2.6 18.0
Bloomberg HUVR IN
Equity Shares (m) 2,161
CMP (INR) 313
Mcap (USD b) 14.8
52-Wk Range (INR) 347/262
1, 6, 12 Rel Perf (%) 7/23/28
Sector: FMCG
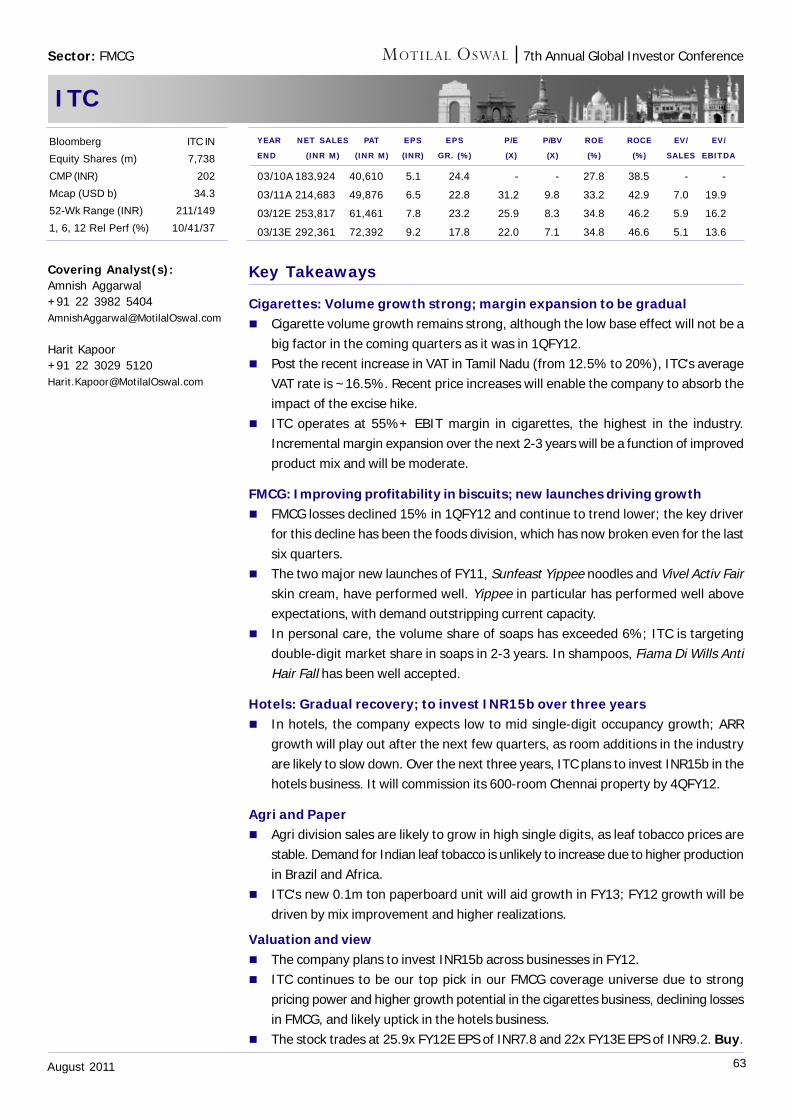
63August 2011
7th Annual Global Investor Conference
ITC
Key Takeaways
Cigarettes: Volume growth strong; margin expansion to be gradual Cigarette volume growth remains strong, although the low base effect will not be a
big factor in the coming quarters as it was in 1QFY12. Post the recent increase in VAT in Tamil Nadu (from 12.5% to 20%), ITC's average
VAT rate is ~16.5%. Recent price increases will enable the company to absorb theimpact of the excise hike.
ITC operates at 55%+ EBIT margin in cigarettes, the highest in the industry.Incremental margin expansion over the next 2-3 years will be a function of improvedproduct mix and will be moderate.
FMCG: Improving profitability in biscuits; new launches driving growth FMCG losses declined 15% in 1QFY12 and continue to trend lower; the key driver
for this decline has been the foods division, which has now broken even for the lastsix quarters.
The two major new launches of FY11, Sunfeast Yippee noodles and Vivel Activ Fairskin cream, have performed well. Yippee in particular has performed well aboveexpectations, with demand outstripping current capacity.
In personal care, the volume share of soaps has exceeded 6%; ITC is targetingdouble-digit market share in soaps in 2-3 years. In shampoos, Fiama Di Wills AntiHair Fall has been well accepted.
Hotels: Gradual recovery; to invest INR15b over three years In hotels, the company expects low to mid single-digit occupancy growth; ARR
growth will play out after the next few quarters, as room additions in the industryare likely to slow down. Over the next three years, ITC plans to invest INR15b in thehotels business. It will commission its 600-room Chennai property by 4QFY12.
Agri and Paper Agri division sales are likely to grow in high single digits, as leaf tobacco prices are
stable. Demand for Indian leaf tobacco is unlikely to increase due to higher productionin Brazil and Africa.
ITC's new 0.1m ton paperboard unit will aid growth in FY13; FY12 growth will bedriven by mix improvement and higher realizations.
Valuation and view The company plans to invest INR15b across businesses in FY12. ITC continues to be our top pick in our FMCG coverage universe due to strong
pricing power and higher growth potential in the cigarettes business, declining lossesin FMCG, and likely uptick in the hotels business.
The stock trades at 25.9x FY12E EPS of INR7.8 and 22x FY13E EPS of INR9.2. Buy.
Covering Analyst(s):Amnish Aggarwal+91 22 3982 [email protected]
Harit Kapoor+91 22 3029 [email protected]
YEAR NET SALES PAT EPS EPS P/E P/BV ROE ROCE EV/ EV/
END (INR M) (INR M) (INR) GR. (%) (X) (X) (%) (%) SALES EBITDA
03/10A 183,924 40,610 5.1 24.4 - - 27.8 38.5 - -
03/11A 214,683 49,876 6.5 22.8 31.2 9.8 33.2 42.9 7.0 19.9
03/12E 253,817 61,461 7.8 23.2 25.9 8.3 34.8 46.2 5.9 16.2
03/13E 292,361 72,392 9.2 17.8 22.0 7.1 34.8 46.6 5.1 13.6
Bloomberg ITC IN
Equity Shares (m) 7,738
CMP (INR) 202
Mcap (USD b) 34.3
52-Wk Range (INR) 211/149
1, 6, 12 Rel Perf (%) 10/41/37
Sector: FMCG
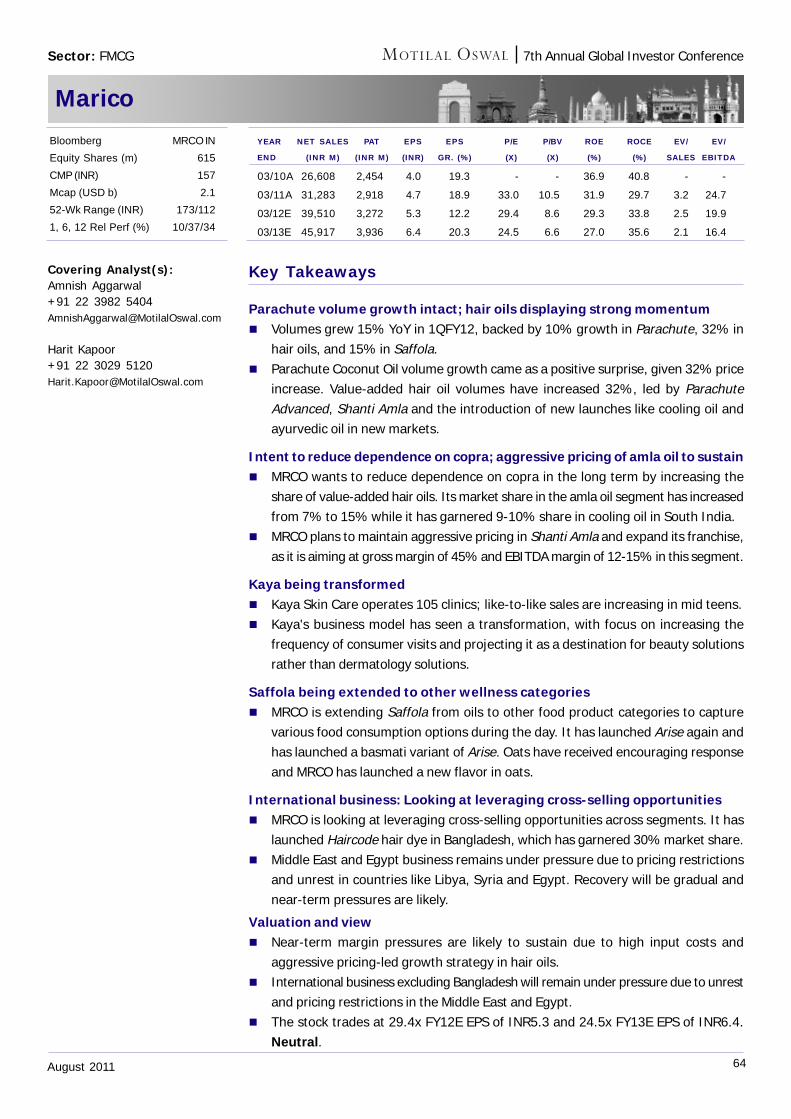
64August 2011
7th Annual Global Investor Conference
Marico
Key Takeaways
Parachute volume growth intact; hair oils displaying strong momentum Volumes grew 15% YoY in 1QFY12, backed by 10% growth in Parachute, 32% in
hair oils, and 15% in Saffola. Parachute Coconut Oil volume growth came as a positive surprise, given 32% price
increase. Value-added hair oil volumes have increased 32%, led by ParachuteAdvanced, Shanti Amla and the introduction of new launches like cooling oil andayurvedic oil in new markets.
Intent to reduce dependence on copra; aggressive pricing of amla oil to sustain MRCO wants to reduce dependence on copra in the long term by increasing the
share of value-added hair oils. Its market share in the amla oil segment has increasedfrom 7% to 15% while it has garnered 9-10% share in cooling oil in South India.
MRCO plans to maintain aggressive pricing in Shanti Amla and expand its franchise,as it is aiming at gross margin of 45% and EBITDA margin of 12-15% in this segment.
Kaya being transformed Kaya Skin Care operates 105 clinics; like-to-like sales are increasing in mid teens. Kaya's business model has seen a transformation, with focus on increasing the
frequency of consumer visits and projecting it as a destination for beauty solutionsrather than dermatology solutions.
Saffola being extended to other wellness categories MRCO is extending Saffola from oils to other food product categories to capture
various food consumption options during the day. It has launched Arise again andhas launched a basmati variant of Arise. Oats have received encouraging responseand MRCO has launched a new flavor in oats.
International business: Looking at leveraging cross-selling opportunities MRCO is looking at leveraging cross-selling opportunities across segments. It has
launched Haircode hair dye in Bangladesh, which has garnered 30% market share. Middle East and Egypt business remains under pressure due to pricing restrictions
and unrest in countries like Libya, Syria and Egypt. Recovery will be gradual andnear-term pressures are likely.
Valuation and view Near-term margin pressures are likely to sustain due to high input costs and
aggressive pricing-led growth strategy in hair oils. International business excluding Bangladesh will remain under pressure due to unrest
and pricing restrictions in the Middle East and Egypt. The stock trades at 29.4x FY12E EPS of INR5.3 and 24.5x FY13E EPS of INR6.4.
Neutral.
Covering Analyst(s):Amnish Aggarwal+91 22 3982 [email protected]
Harit Kapoor+91 22 3029 [email protected]
YEAR NET SALES PAT EPS EPS P/E P/BV ROE ROCE EV/ EV/
END (INR M) (INR M) (INR) GR. (%) (X) (X) (%) (%) SALES EBITDA
03/10A 26,608 2,454 4.0 19.3 - - 36.9 40.8 - -
03/11A 31,283 2,918 4.7 18.9 33.0 10.5 31.9 29.7 3.2 24.7
03/12E 39,510 3,272 5.3 12.2 29.4 8.6 29.3 33.8 2.5 19.9
03/13E 45,917 3,936 6.4 20.3 24.5 6.6 27.0 35.6 2.1 16.4
Bloomberg MRCO IN
Equity Shares (m) 615
CMP (INR) 157
Mcap (USD b) 2.1
52-Wk Range (INR) 173/112
1, 6, 12 Rel Perf (%) 10/37/34
Sector: FMCG
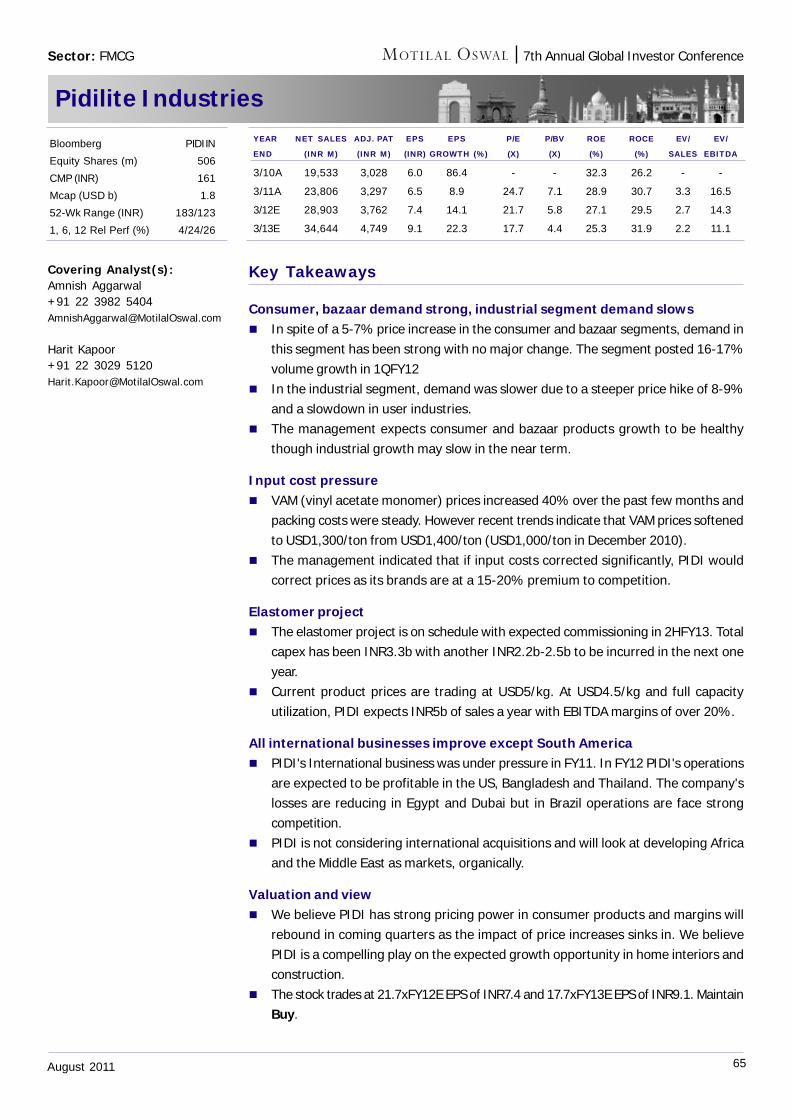
65August 2011
7th Annual Global Investor Conference
Pidilite Industries
Key Takeaways
Consumer, bazaar demand strong, industrial segment demand slows In spite of a 5-7% price increase in the consumer and bazaar segments, demand in
this segment has been strong with no major change. The segment posted 16-17%volume growth in 1QFY12
In the industrial segment, demand was slower due to a steeper price hike of 8-9%and a slowdown in user industries.
The management expects consumer and bazaar products growth to be healthythough industrial growth may slow in the near term.
Input cost pressure VAM (vinyl acetate monomer) prices increased 40% over the past few months and
packing costs were steady. However recent trends indicate that VAM prices softenedto USD1,300/ton from USD1,400/ton (USD1,000/ton in December 2010).
The management indicated that if input costs corrected significantly, PIDI wouldcorrect prices as its brands are at a 15-20% premium to competition.
Elastomer project The elastomer project is on schedule with expected commissioning in 2HFY13. Total
capex has been INR3.3b with another INR2.2b-2.5b to be incurred in the next oneyear.
Current product prices are trading at USD5/kg. At USD4.5/kg and full capacityutilization, PIDI expects INR5b of sales a year with EBITDA margins of over 20%.
All international businesses improve except South America PIDI's International business was under pressure in FY11. In FY12 PIDI's operations
are expected to be profitable in the US, Bangladesh and Thailand. The company'slosses are reducing in Egypt and Dubai but in Brazil operations are face strongcompetition.
PIDI is not considering international acquisitions and will look at developing Africaand the Middle East as markets, organically.
Valuation and view We believe PIDI has strong pricing power in consumer products and margins will
rebound in coming quarters as the impact of price increases sinks in. We believePIDI is a compelling play on the expected growth opportunity in home interiors andconstruction.
The stock trades at 21.7xFY12E EPS of INR7.4 and 17.7xFY13E EPS of INR9.1. MaintainBuy.
Covering Analyst(s):Amnish Aggarwal+91 22 3982 [email protected]
Harit Kapoor+91 22 3029 [email protected]
YEAR NET SALES ADJ. PAT EPS EPS P/E P/BV ROE ROCE EV/ EV/
END (INR M) (INR M) (INR) GROWTH (%) (X) (X) (%) (%) SALES EBITDA
3/10A 19,533 3,028 6.0 86.4 - - 32.3 26.2 - -
3/11A 23,806 3,297 6.5 8.9 24.7 7.1 28.9 30.7 3.3 16.5
3/12E 28,903 3,762 7.4 14.1 21.7 5.8 27.1 29.5 2.7 14.3
3/13E 34,644 4,749 9.1 22.3 17.7 4.4 25.3 31.9 2.2 11.1
Bloomberg PIDI IN
Equity Shares (m) 506
CMP (INR) 161
Mcap (USD b) 1.8
52-Wk Range (INR) 183/123
1, 6, 12 Rel Perf (%) 4/24/26
Sector: FMCG
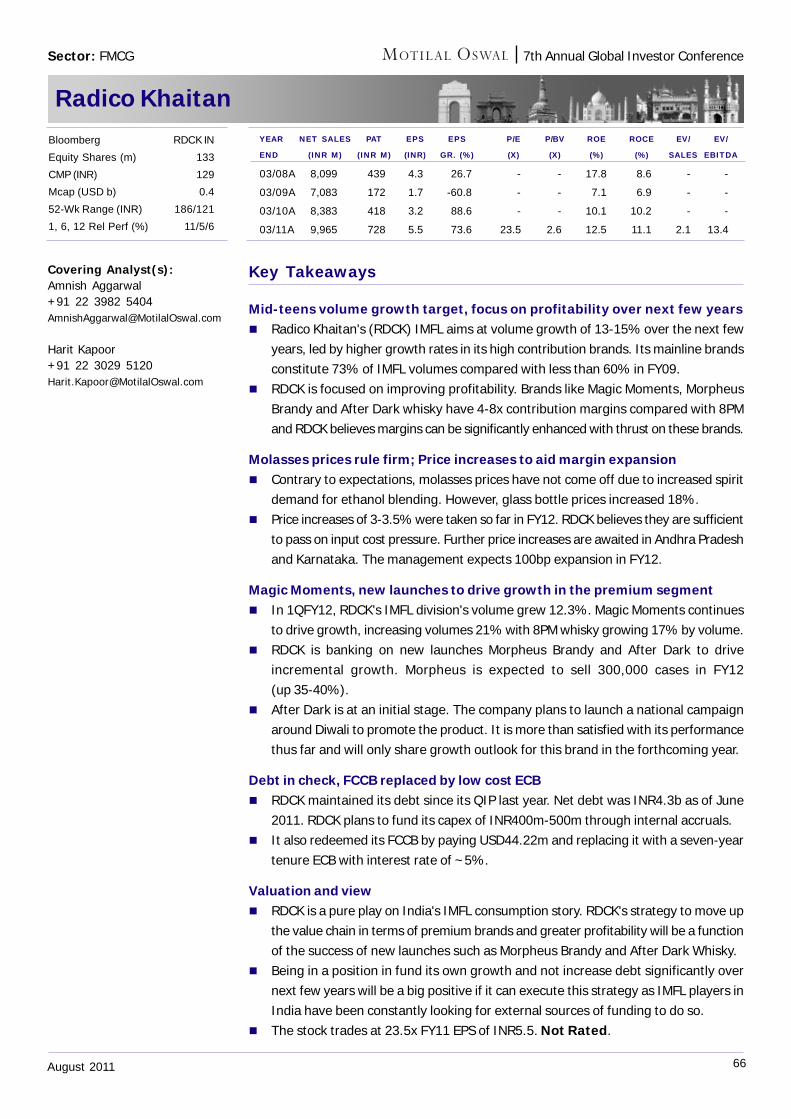
66August 2011
7th Annual Global Investor Conference
Radico Khaitan
Key Takeaways
Mid-teens volume growth target, focus on profitability over next few years Radico Khaitan's (RDCK) IMFL aims at volume growth of 13-15% over the next few
years, led by higher growth rates in its high contribution brands. Its mainline brandsconstitute 73% of IMFL volumes compared with less than 60% in FY09.
RDCK is focused on improving profitability. Brands like Magic Moments, MorpheusBrandy and After Dark whisky have 4-8x contribution margins compared with 8PMand RDCK believes margins can be significantly enhanced with thrust on these brands.
Molasses prices rule firm; Price increases to aid margin expansion Contrary to expectations, molasses prices have not come off due to increased spirit
demand for ethanol blending. However, glass bottle prices increased 18%. Price increases of 3-3.5% were taken so far in FY12. RDCK believes they are sufficient
to pass on input cost pressure. Further price increases are awaited in Andhra Pradeshand Karnataka. The management expects 100bp expansion in FY12.
Magic Moments, new launches to drive growth in the premium segment In 1QFY12, RDCK's IMFL division's volume grew 12.3%. Magic Moments continues
to drive growth, increasing volumes 21% with 8PM whisky growing 17% by volume. RDCK is banking on new launches Morpheus Brandy and After Dark to drive
incremental growth. Morpheus is expected to sell 300,000 cases in FY12(up 35-40%).
After Dark is at an initial stage. The company plans to launch a national campaignaround Diwali to promote the product. It is more than satisfied with its performancethus far and will only share growth outlook for this brand in the forthcoming year.
Debt in check, FCCB replaced by low cost ECB RDCK maintained its debt since its QIP last year. Net debt was INR4.3b as of June
2011. RDCK plans to fund its capex of INR400m-500m through internal accruals. It also redeemed its FCCB by paying USD44.22m and replacing it with a seven-year
tenure ECB with interest rate of ~5%.
Valuation and view RDCK is a pure play on India's IMFL consumption story. RDCK's strategy to move up
the value chain in terms of premium brands and greater profitability will be a functionof the success of new launches such as Morpheus Brandy and After Dark Whisky.
Being in a position in fund its own growth and not increase debt significantly overnext few years will be a big positive if it can execute this strategy as IMFL players inIndia have been constantly looking for external sources of funding to do so.
The stock trades at 23.5x FY11 EPS of INR5.5. Not Rated.
Covering Analyst(s):Amnish Aggarwal+91 22 3982 [email protected]
Harit Kapoor+91 22 3029 [email protected]
YEAR NET SALES PAT EPS EPS P/E P/BV ROE ROCE EV/ EV/
END (INR M) (INR M) (INR) GR. (%) (X) (X) (%) (%) SALES EBITDA
03/08A 8,099 439 4.3 26.7 - - 17.8 8.6 - -
03/09A 7,083 172 1.7 -60.8 - - 7.1 6.9 - -
03/10A 8,383 418 3.2 88.6 - - 10.1 10.2 - -
03/11A 9,965 728 5.5 73.6 23.5 2.6 12.5 11.1 2.1 13.4
Bloomberg RDCK IN
Equity Shares (m) 133
CMP (INR) 129
Mcap (USD b) 0.4
52-Wk Range (INR) 186/121
1, 6, 12 Rel Perf (%) 11/5/6
Sector: FMCG
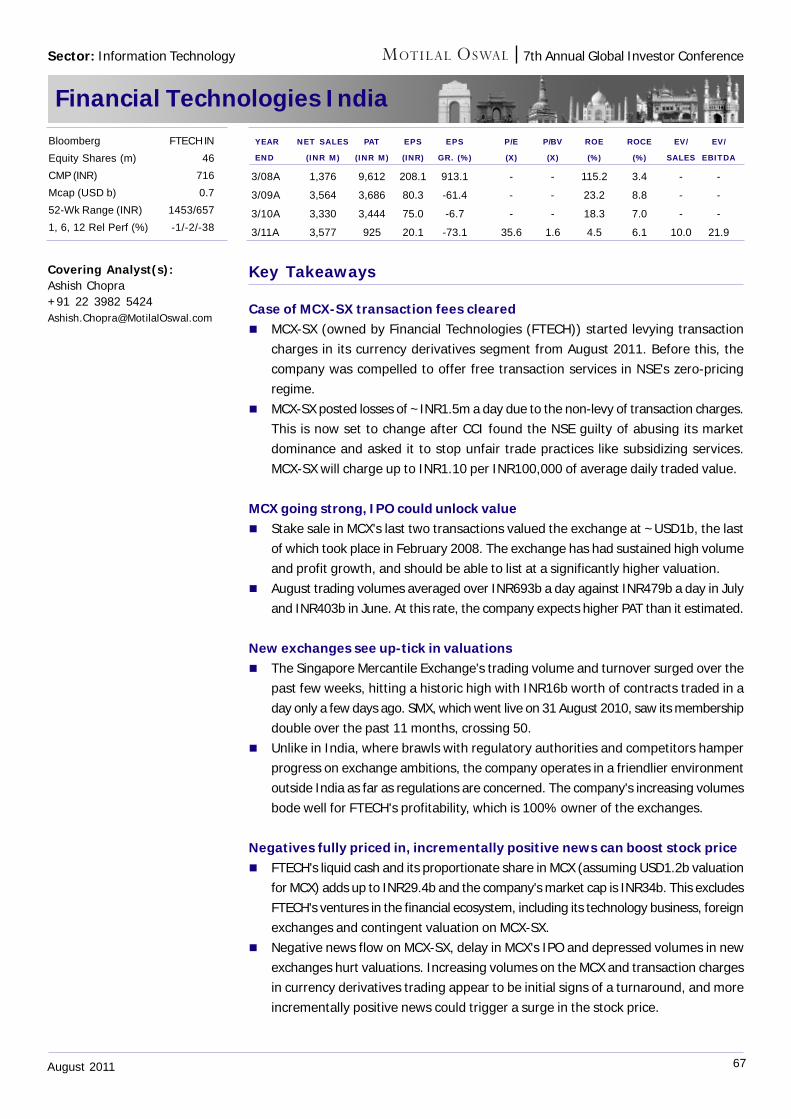
67August 2011
7th Annual Global Investor Conference
Financial Technologies India
Key Takeaways
Case of MCX-SX transaction fees cleared MCX-SX (owned by Financial Technologies (FTECH)) started levying transaction
charges in its currency derivatives segment from August 2011. Before this, thecompany was compelled to offer free transaction services in NSE's zero-pricingregime.
MCX-SX posted losses of ~INR1.5m a day due to the non-levy of transaction charges.This is now set to change after CCI found the NSE guilty of abusing its marketdominance and asked it to stop unfair trade practices like subsidizing services.MCX-SX will charge up to INR1.10 per INR100,000 of average daily traded value.
MCX going strong, IPO could unlock value Stake sale in MCX's last two transactions valued the exchange at ~USD1b, the last
of which took place in February 2008. The exchange has had sustained high volumeand profit growth, and should be able to list at a significantly higher valuation.
August trading volumes averaged over INR693b a day against INR479b a day in Julyand INR403b in June. At this rate, the company expects higher PAT than it estimated.
New exchanges see up-tick in valuations The Singapore Mercantile Exchange's trading volume and turnover surged over the
past few weeks, hitting a historic high with INR16b worth of contracts traded in aday only a few days ago. SMX, which went live on 31 August 2010, saw its membershipdouble over the past 11 months, crossing 50.
Unlike in India, where brawls with regulatory authorities and competitors hamperprogress on exchange ambitions, the company operates in a friendlier environmentoutside India as far as regulations are concerned. The company's increasing volumesbode well for FTECH's profitability, which is 100% owner of the exchanges.
Negatives fully priced in, incrementally positive news can boost stock price FTECH's liquid cash and its proportionate share in MCX (assuming USD1.2b valuation
for MCX) adds up to INR29.4b and the company's market cap is INR34b. This excludesFTECH's ventures in the financial ecosystem, including its technology business, foreignexchanges and contingent valuation on MCX-SX.
Negative news flow on MCX-SX, delay in MCX's IPO and depressed volumes in newexchanges hurt valuations. Increasing volumes on the MCX and transaction chargesin currency derivatives trading appear to be initial signs of a turnaround, and moreincrementally positive news could trigger a surge in the stock price.
Covering Analyst(s):Ashish Chopra+91 22 3982 [email protected]
YEAR NET SALES PAT EPS EPS P/E P/BV ROE ROCE EV/ EV/
END (INR M) (INR M) (INR) GR. (%) (X) (X) (%) (%) SALES EBITDA
3/08A 1,376 9,612 208.1 913.1 - - 115.2 3.4 - -
3/09A 3,564 3,686 80.3 -61.4 - - 23.2 8.8 - -
3/10A 3,330 3,444 75.0 -6.7 - - 18.3 7.0 - -
3/11A 3,577 925 20.1 -73.1 35.6 1.6 4.5 6.1 10.0 21.9
Bloomberg FTECH IN
Equity Shares (m) 46
CMP (INR) 716
Mcap (USD b) 0.7
52-Wk Range (INR) 1453/657
1, 6, 12 Rel Perf (%) -1/-2/-38
Sector: Information Technology
68August 2011
7th Annual Global Investor Conference
Info Edge India
Key Takeaways
Scalability in unique user additions not an issue, Info Edge sees no competitionaffecting it yet Info Edge (INFOE) does not see a problem in scaling up its number of unique
customers, which totaled over 42,000 in FY11. A healthy growth environment willsee organizations scale up, which should facilitate the additions of new customers.
LinkedIn has established an active sales team in India, and INFOE will watch thespace for effects on its Naukri business. The company does not anticipate a significantimpact from this as they operate in different segments. LinkedIn offers a passiveenvironment vis-à-vis the active job-seeking environment at Naukri.com. However,the fact remains that it would be able to tap resources, especially at the seniorlevel, which would be out of Naukri's reach.
Positive on getting price increases despite being the price-master INFOE does not see a problem in attaining a 5-7% pricing increase in its Naukri
solutions. While the company has a wide array of pricing, based on a mix of serviceson a like-to-like basis, Naukri would command a higher price than peers.
Naukri's virtuous cycle of self-sustenance also plays a part in facilitating this,compounded by the fact that talent will be in hot demand if the growth story holdsout, directly benefiting its business.
Seeing a dip in IT hiring, vo lume dip in real estate could hurt 99acres INFOE cited a decline in IT hiring trend in the past month, going by hiring data at
Naukri. However, this is not alarming because Naukri caters largely to lateral additionsin the IT space. Compared with freshers, lateral additions are seasonally high in theAMJ quarter, before freshers start joining in large numbers.
99acres.com, INFOE's other portal, has been on a high growth trajectory, albeit ona lower base. However, rising interest rates and relatively firm realty prices, especiallyin regions like Noida, may impact volumes, which are expected to have a directbearing on the portal's performance.
Spending on ad vertising to pick up to increase visibility across new ventures INFOE has had a reactionary stance in advertising spends in its fiercely contested
spaces, Naukri, Jeevansaathi and 99acres. However, the advertisement spends arelikely to be higher given that INFOE announced a promotion roll out for Shiksha.comand will also need to increase visibility in some of its acquired ventures.
We would prefer INFOE to take a more proactive stance towards these spends andtry to aggressively win traffic share, especially given several new online ventures,such as Zomato.com, Shiksha.com, Brijj.com and Meritnation.com, are still in theearly phase of development,.
Fundamentals strong, valuations look rich While fundamentals are strong, current valuations do not provide a margin of safety.
INFOE has high sensitivity to macroeconomic outlook, which is mired in uncertainty. We expect INFOE to post revenue CAGR of 25.3% and EPS CAGR of 23.7% over
FY11-13. Not Rated.
Covering Analyst(s):Ashish Chopra+91 22 3982 [email protected]
Sector: Information TechnologySector: Information Technology
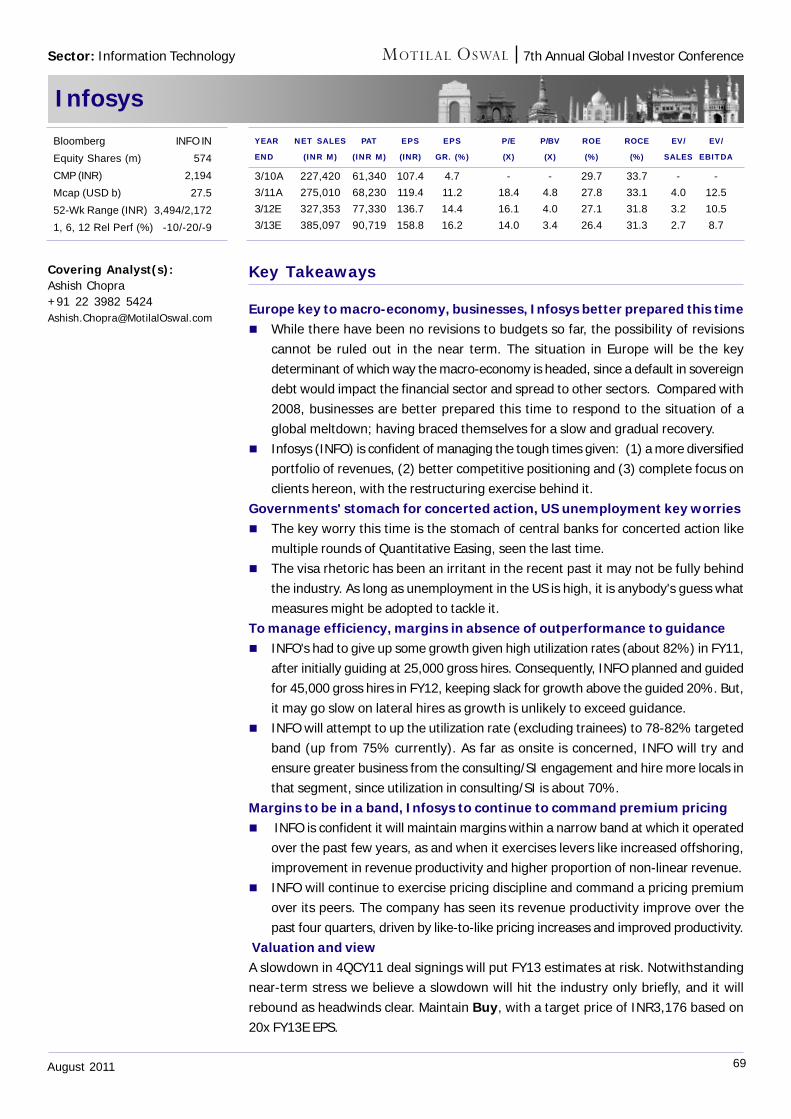
69August 2011
7th Annual Global Investor Conference
Infosys
Key Takeaways
Europe key to macro-economy, businesses, Infosys better prepared this time While there have been no revisions to budgets so far, the possibility of revisions
cannot be ruled out in the near term. The situation in Europe will be the keydeterminant of which way the macro-economy is headed, since a default in sovereigndebt would impact the financial sector and spread to other sectors. Compared with2008, businesses are better prepared this time to respond to the situation of aglobal meltdown; having braced themselves for a slow and gradual recovery.
Infosys (INFO) is confident of managing the tough times given: (1) a more diversifiedportfolio of revenues, (2) better competitive positioning and (3) complete focus onclients hereon, with the restructuring exercise behind it.
Governments' stomach for concerted action, US unemployment key worries The key worry this time is the stomach of central banks for concerted action like
multiple rounds of Quantitative Easing, seen the last time. The visa rhetoric has been an irritant in the recent past it may not be fully behind
the industry. As long as unemployment in the US is high, it is anybody's guess whatmeasures might be adopted to tackle it.
To manage efficiency, margins in absence of outperformance to guidance INFO's had to give up some growth given high utilization rates (about 82%) in FY11,
after initially guiding at 25,000 gross hires. Consequently, INFO planned and guidedfor 45,000 gross hires in FY12, keeping slack for growth above the guided 20%. But,it may go slow on lateral hires as growth is unlikely to exceed guidance.
INFO will attempt to up the utilization rate (excluding trainees) to 78-82% targetedband (up from 75% currently). As far as onsite is concerned, INFO will try andensure greater business from the consulting/SI engagement and hire more locals inthat segment, since utilization in consulting/SI is about 70%.
Margins to be in a band, Infosys to continue to command premium pricing INFO is confident it will maintain margins within a narrow band at which it operated
over the past few years, as and when it exercises levers like increased offshoring,improvement in revenue productivity and higher proportion of non-linear revenue.
INFO will continue to exercise pricing discipline and command a pricing premiumover its peers. The company has seen its revenue productivity improve over thepast four quarters, driven by like-to-like pricing increases and improved productivity.
Valuation and viewA slowdown in 4QCY11 deal signings will put FY13 estimates at risk. Notwithstandingnear-term stress we believe a slowdown will hit the industry only briefly, and it willrebound as headwinds clear. Maintain Buy, with a target price of INR3,176 based on20x FY13E EPS.
Covering Analyst(s):Ashish Chopra+91 22 3982 [email protected]
Bloomberg INFO IN
Equity Shares (m) 574
CMP (INR) 2,194
Mcap (USD b) 27.5
52-Wk Range (INR) 3,494/2,172
1, 6, 12 Rel Perf (%) -10/-20/-9
YEAR NET SALES PAT EPS EPS P/E P/BV ROE ROCE EV/ EV/
END (INR M) (INR M) (INR) GR. (%) (X) (X) (%) (%) SALES EBITDA
3/10A 227,420 61,340 107.4 4.7 - - 29.7 33.7 - -
3/11A 275,010 68,230 119.4 11.2 18.4 4.8 27.8 33.1 4.0 12.5
3/12E 327,353 77,330 136.7 14.4 16.1 4.0 27.1 31.8 3.2 10.5
3/13E 385,097 90,719 158.8 16.2 14.0 3.4 26.4 31.3 2.7 8.7
Sector: Information Technology
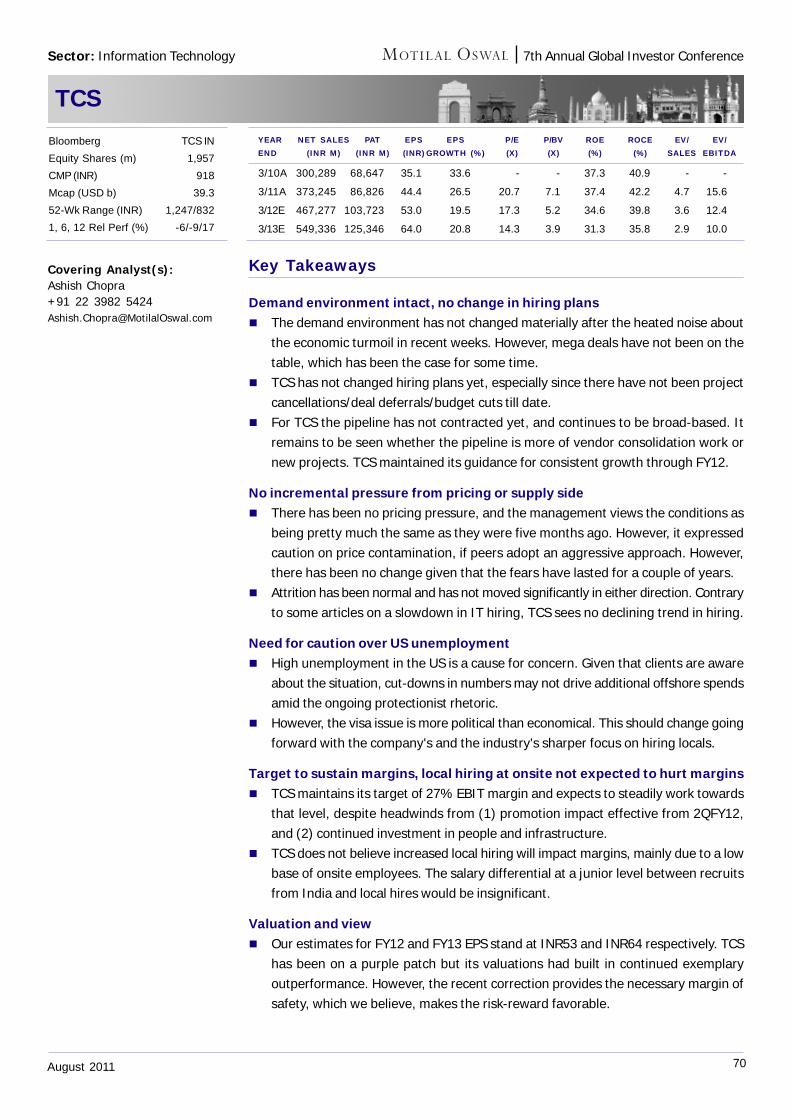
70August 2011
7th Annual Global Investor Conference
TCS
Key Takeaways
Demand environment intact, no change in hiring plans The demand environment has not changed materially after the heated noise about
the economic turmoil in recent weeks. However, mega deals have not been on thetable, which has been the case for some time.
TCS has not changed hiring plans yet, especially since there have not been projectcancellations/deal deferrals/budget cuts till date.
For TCS the pipeline has not contracted yet, and continues to be broad-based. Itremains to be seen whether the pipeline is more of vendor consolidation work ornew projects. TCS maintained its guidance for consistent growth through FY12.
No incremental pressure from pricing or supply side There has been no pricing pressure, and the management views the conditions as
being pretty much the same as they were five months ago. However, it expressedcaution on price contamination, if peers adopt an aggressive approach. However,there has been no change given that the fears have lasted for a couple of years.
Attrition has been normal and has not moved significantly in either direction. Contraryto some articles on a slowdown in IT hiring, TCS sees no declining trend in hiring.
Need for caution over US unemployment High unemployment in the US is a cause for concern. Given that clients are aware
about the situation, cut-downs in numbers may not drive additional offshore spendsamid the ongoing protectionist rhetoric.
However, the visa issue is more political than economical. This should change goingforward with the company's and the industry's sharper focus on hiring locals.
Target to sustain margins, local hiring at onsite not expected to hurt margins TCS maintains its target of 27% EBIT margin and expects to steadily work towards
that level, despite headwinds from (1) promotion impact effective from 2QFY12,and (2) continued investment in people and infrastructure.
TCS does not believe increased local hiring will impact margins, mainly due to a lowbase of onsite employees. The salary differential at a junior level between recruitsfrom India and local hires would be insignificant.
Valuation and view Our estimates for FY12 and FY13 EPS stand at INR53 and INR64 respectively. TCS
has been on a purple patch but its valuations had built in continued exemplaryoutperformance. However, the recent correction provides the necessary margin ofsafety, which we believe, makes the risk-reward favorable.
Covering Analyst(s):Ashish Chopra+91 22 3982 [email protected]
YEAR NET SALES PAT EPS EPS P/E P/BV ROE ROCE EV/ EV/END (INR M) (INR M) (INR) GROWTH (%) (X) (X) (%) (%) SALES EBITDA
3/10A 300,289 68,647 35.1 33.6 - - 37.3 40.9 - -
3/11A 373,245 86,826 44.4 26.5 20.7 7.1 37.4 42.2 4.7 15.6
3/12E 467,277 103,723 53.0 19.5 17.3 5.2 34.6 39.8 3.6 12.4
3/13E 549,336 125,346 64.0 20.8 14.3 3.9 31.3 35.8 2.9 10.0
Bloomberg TCS IN
Equity Shares (m) 1,957
CMP (INR) 918
Mcap (USD b) 39.3
52-Wk Range (INR) 1,247/832
1, 6, 12 Rel Perf (%) -6/-9/17
Sector: Information Technology
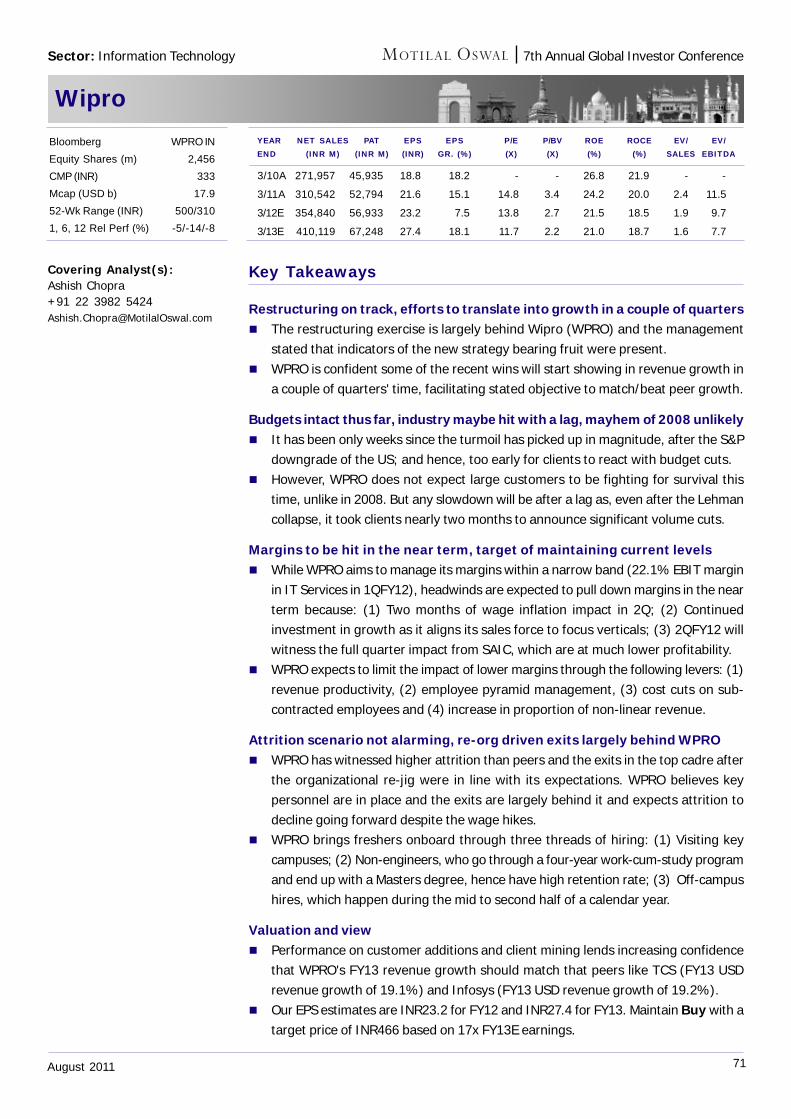
71August 2011
7th Annual Global Investor Conference
Wipro
Key Takeaways
Restructuring on track, efforts to translate into growth in a couple of quarters The restructuring exercise is largely behind Wipro (WPRO) and the management
stated that indicators of the new strategy bearing fruit were present. WPRO is confident some of the recent wins will start showing in revenue growth in
a couple of quarters' time, facilitating stated objective to match/beat peer growth.
Budgets intact thus far, industry maybe hit with a lag, mayhem of 2008 unlikely It has been only weeks since the turmoil has picked up in magnitude, after the S&P
downgrade of the US; and hence, too early for clients to react with budget cuts. However, WPRO does not expect large customers to be fighting for survival this
time, unlike in 2008. But any slowdown will be after a lag as, even after the Lehmancollapse, it took clients nearly two months to announce significant volume cuts.
Margins to be hit in the near term, target of maintaining current levels While WPRO aims to manage its margins within a narrow band (22.1% EBIT margin
in IT Services in 1QFY12), headwinds are expected to pull down margins in the nearterm because: (1) Two months of wage inflation impact in 2Q; (2) Continuedinvestment in growth as it aligns its sales force to focus verticals; (3) 2QFY12 willwitness the full quarter impact from SAIC, which are at much lower profitability.
WPRO expects to limit the impact of lower margins through the following levers: (1)revenue productivity, (2) employee pyramid management, (3) cost cuts on sub-contracted employees and (4) increase in proportion of non-linear revenue.
Attrition scenario not alarming, re-org driven exits largely behind WPRO WPRO has witnessed higher attrition than peers and the exits in the top cadre after
the organizational re-jig were in line with its expectations. WPRO believes keypersonnel are in place and the exits are largely behind it and expects attrition todecline going forward despite the wage hikes.
WPRO brings freshers onboard through three threads of hiring: (1) Visiting keycampuses; (2) Non-engineers, who go through a four-year work-cum-study programand end up with a Masters degree, hence have high retention rate; (3) Off-campushires, which happen during the mid to second half of a calendar year.
Valuation and view Performance on customer additions and client mining lends increasing confidence
that WPRO's FY13 revenue growth should match that peers like TCS (FY13 USDrevenue growth of 19.1%) and Infosys (FY13 USD revenue growth of 19.2%).
Our EPS estimates are INR23.2 for FY12 and INR27.4 for FY13. Maintain Buy with atarget price of INR466 based on 17x FY13E earnings.
Covering Analyst(s):Ashish Chopra+91 22 3982 [email protected]
YEAR NET SALES PAT EPS EPS P/E P/BV ROE ROCE EV/ EV/END (INR M) (INR M) (INR) GR. (%) (X) (X) (%) (%) SALES EBITDA
3/10A 271,957 45,935 18.8 18.2 - - 26.8 21.9 - -
3/11A 310,542 52,794 21.6 15.1 14.8 3.4 24.2 20.0 2.4 11.5
3/12E 354,840 56,933 23.2 7.5 13.8 2.7 21.5 18.5 1.9 9.7
3/13E 410,119 67,248 27.4 18.1 11.7 2.2 21.0 18.7 1.6 7.7
Bloomberg WPRO IN
Equity Shares (m) 2,456
CMP (INR) 333
Mcap (USD b) 17.9
52-Wk Range (INR) 500/310
1, 6, 12 Rel Perf (%) -5/-14/-8
Sector: Information Technology
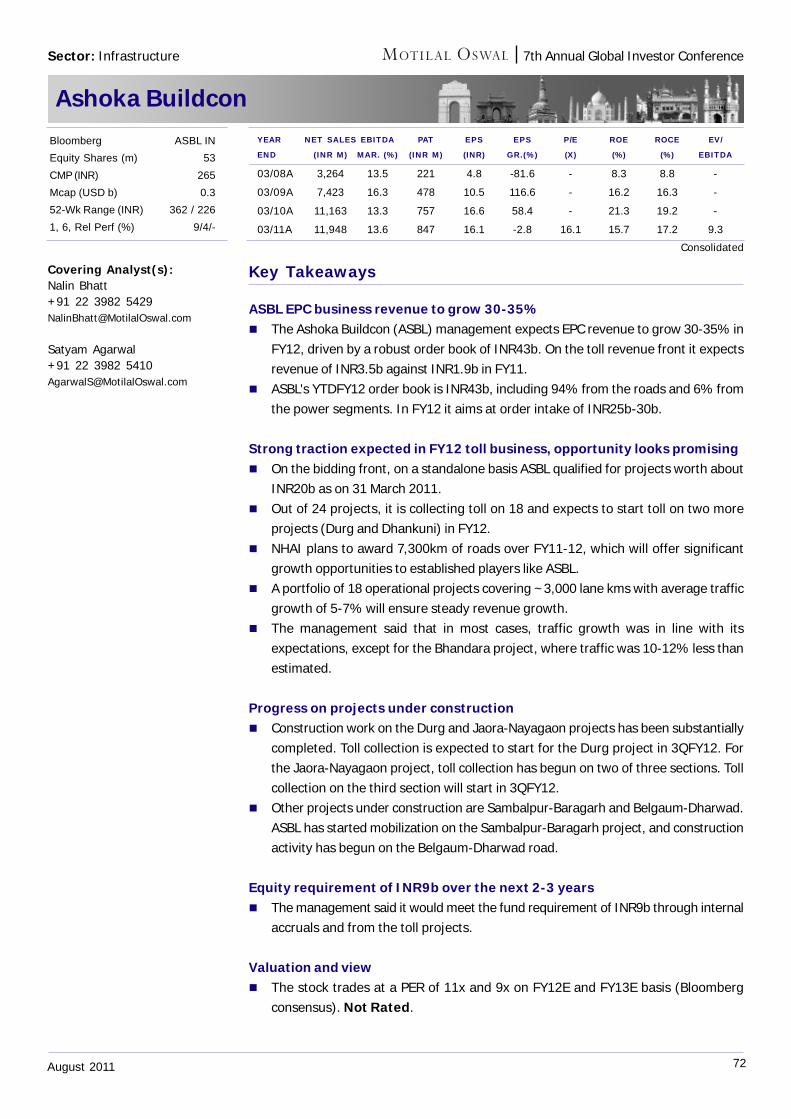
72August 2011
7th Annual Global Investor Conference
Ashoka Buildcon
Key Takeaways
ASBL EPC business revenue to grow 30-35% The Ashoka Buildcon (ASBL) management expects EPC revenue to grow 30-35% in
FY12, driven by a robust order book of INR43b. On the toll revenue front it expectsrevenue of INR3.5b against INR1.9b in FY11.
ASBL's YTDFY12 order book is INR43b, including 94% from the roads and 6% fromthe power segments. In FY12 it aims at order intake of INR25b-30b.
Strong traction expected in FY12 toll business, opportunity looks promising On the bidding front, on a standalone basis ASBL qualified for projects worth about
INR20b as on 31 March 2011. Out of 24 projects, it is collecting toll on 18 and expects to start toll on two more
projects (Durg and Dhankuni) in FY12. NHAI plans to award 7,300km of roads over FY11-12, which will offer significant
growth opportunities to established players like ASBL. A portfolio of 18 operational projects covering ~3,000 lane kms with average traffic
growth of 5-7% will ensure steady revenue growth. The management said that in most cases, traffic growth was in line with its
expectations, except for the Bhandara project, where traffic was 10-12% less thanestimated.
Progress on projects under construction Construction work on the Durg and Jaora-Nayagaon projects has been substantially
completed. Toll collection is expected to start for the Durg project in 3QFY12. Forthe Jaora-Nayagaon project, toll collection has begun on two of three sections. Tollcollection on the third section will start in 3QFY12.
Other projects under construction are Sambalpur-Baragarh and Belgaum-Dharwad.ASBL has started mobilization on the Sambalpur-Baragarh project, and constructionactivity has begun on the Belgaum-Dharwad road.
Equity requirement of INR9b over the next 2-3 years The management said it would meet the fund requirement of INR9b through internal
accruals and from the toll projects.
Valuation and view The stock trades at a PER of 11x and 9x on FY12E and FY13E basis (Bloomberg
consensus). Not Rated.
Covering Analyst(s):Nalin Bhatt+91 22 3982 [email protected]
Satyam Agarwal+91 22 3982 [email protected]
YEAR NET SALES EBITDA PAT EPS EPS P/E ROE ROCE EV/
END (INR M) MAR. (%) (INR M) (INR) GR.(%) (X) (%) (%) EBITDA
03/08A 3,264 13.5 221 4.8 -81.6 - 8.3 8.8 -
03/09A 7,423 16.3 478 10.5 116.6 - 16.2 16.3 -
03/10A 11,163 13.3 757 16.6 58.4 - 21.3 19.2 -
03/11A 11,948 13.6 847 16.1 -2.8 16.1 15.7 17.2 9.3
Bloomberg ASBL IN
Equity Shares (m) 53
CMP (INR) 265
Mcap (USD b) 0.3
52-Wk Range (INR) 362 / 226
1, 6, Rel Perf (%) 9/4/-
Consolidated
Sector: Infrastructure
73August 2011
7th Annual Global Investor Conference
Dedicated Freight Corridor
Key Takeaways
Move to tackle growing cargo traffic through a dedicated route Dedicated Freight Corridor Corp (DFCC), a special purpose vehicle, was set up to
plan and develop, construct, maintain and operate a dedicated freight corridor fortransport of cargo, to save time and cost.
The golden quadrilateral, connecting India's four major metro cities is saturated,operating at 110-150% of capacity. Growth in demand for coal in the power sectorand rapid industrialization calls for dedicated freight transport facilities. A feasibilitystudy was carried out by RITES, which found a dedicated freight corridorremunerative.
Eastern/western corridor work initiated, to be operational in December 2016 DFCC initiated work on two corridors, approved by railway ministry. Work on the
eastern corridor (from Dankuni in West Bengal to Ludhiana in Punjab) and thewestern corridor (from JNPT to Dadri) has commenced or is in the process of beingawarded.
DFCC plans to commission a 66km double-line track in the Mughalsarai-Sonnagarsection, (cost INR8.5b) by December 2014 on the eastern corridor.
It plans to finalize project awards for the stretch on both corridors by mid-FY13, toachieve the stated timeline of project completion by December 2016.
The government of Japan will provide a special economic partnership loan of 679byen to finance construction of the western corridor and procurement of locomotives.The loan will be extended on soft terms for 40 years with a moratorium of 10 years.
The remaining cost will be borne by the Ministry of Railways in the form of equity toDFCC. The first tranche of the loan for 90b yen for construction between Rewariand Vadodara has been signed. Another 274b yen funding for Phase II (Vadodara-JNPT) is under negotiation and expected to be finalized by March 2012.
For the eastern corridor, the section from Ludhiana to Mughalsarai will be funded bya USD2.7b World Bank loan and the section from Mughalsarai to Sonnagar will befunded by the government of India. Sonnagar to Dankuni will be on a public-private-partnership basis.
Project cost INR780b, packages to include civil/electrical contracts DFCC's project cost had been originally envisaged at INR280b, as estimated by
RITES in 2006. This has gone up due to: (1) a change in alignment at few junctions,(2) increase in commodity prices, execution timelines and (3) increase in interestduring construction (IDC, INR100b+) and thus, project cost has been revised toINR780b.
Of this however, IDC is a soft cost (payable with debt, only once the project isoperational). Therefore, the funding is required for ~INR650b+.
DFCC indicated that the packages could be broadly divided into the length for boththe corridors and the scope of civil work would be ~60% (including laying tracks),and signaling/electrical works will be ~30%. The rest is IDC ~10%.
Covering Analyst(s):Nalin Bhatt+91 22 3982 [email protected]
Satyam Agarwal+91 22 3982 [email protected]
Sector: Infrastructure
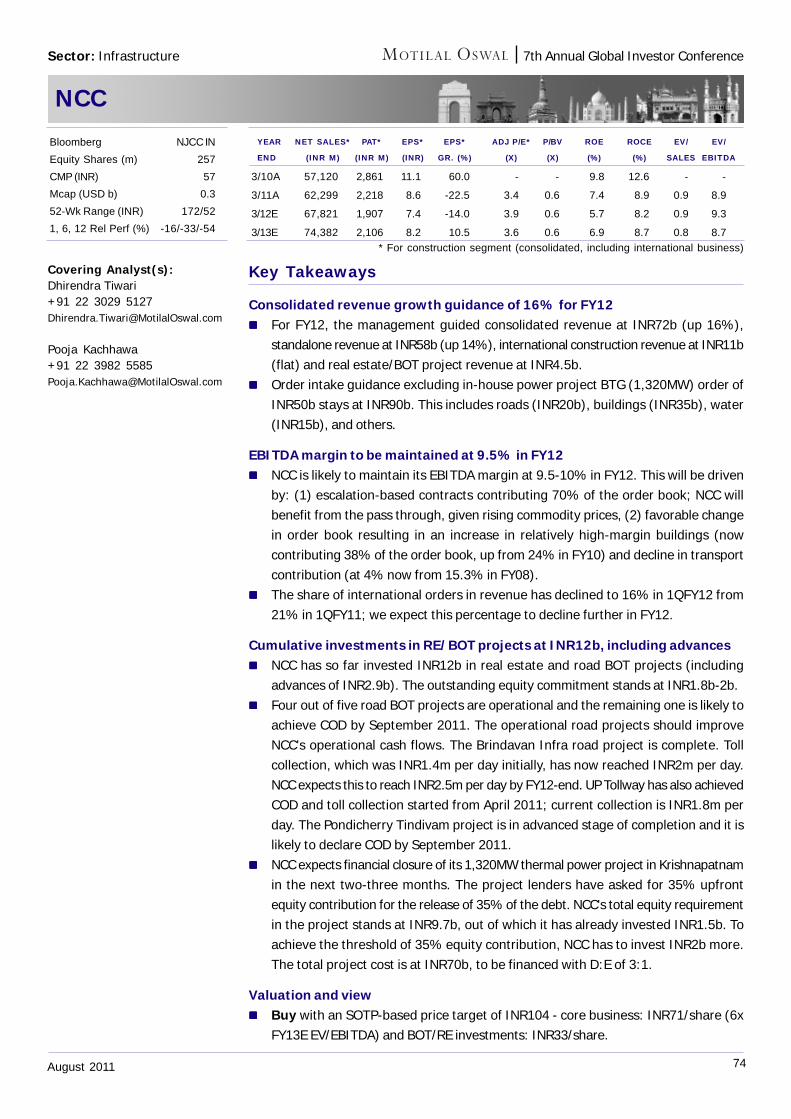
74August 2011
7th Annual Global Investor Conference
NCC
Key Takeaways
Consolidated revenue growth guidance of 16% for FY12 For FY12, the management guided consolidated revenue at INR72b (up 16%),
standalone revenue at INR58b (up 14%), international construction revenue at INR11b(flat) and real estate/BOT project revenue at INR4.5b.
Order intake guidance excluding in-house power project BTG (1,320MW) order ofINR50b stays at INR90b. This includes roads (INR20b), buildings (INR35b), water(INR15b), and others.
EBITDA margin to be maintained at 9.5% in FY12 NCC is likely to maintain its EBITDA margin at 9.5-10% in FY12. This will be driven
by: (1) escalation-based contracts contributing 70% of the order book; NCC willbenefit from the pass through, given rising commodity prices, (2) favorable changein order book resulting in an increase in relatively high-margin buildings (nowcontributing 38% of the order book, up from 24% in FY10) and decline in transportcontribution (at 4% now from 15.3% in FY08).
The share of international orders in revenue has declined to 16% in 1QFY12 from21% in 1QFY11; we expect this percentage to decline further in FY12.
Cumulative investments in RE/BOT projects at INR12b, including advances NCC has so far invested INR12b in real estate and road BOT projects (including
advances of INR2.9b). The outstanding equity commitment stands at INR1.8b-2b. Four out of five road BOT projects are operational and the remaining one is likely to
achieve COD by September 2011. The operational road projects should improveNCC's operational cash flows. The Brindavan Infra road project is complete. Tollcollection, which was INR1.4m per day initially, has now reached INR2m per day.NCC expects this to reach INR2.5m per day by FY12-end. UP Tollway has also achievedCOD and toll collection started from April 2011; current collection is INR1.8m perday. The Pondicherry Tindivam project is in advanced stage of completion and it islikely to declare COD by September 2011.
NCC expects financial closure of its 1,320MW thermal power project in Krishnapatnamin the next two-three months. The project lenders have asked for 35% upfrontequity contribution for the release of 35% of the debt. NCC's total equity requirementin the project stands at INR9.7b, out of which it has already invested INR1.5b. Toachieve the threshold of 35% equity contribution, NCC has to invest INR2b more.The total project cost is at INR70b, to be financed with D:E of 3:1.
Valuation and view Buy with an SOTP-based price target of INR104 - core business: INR71/share (6x
FY13E EV/EBITDA) and BOT/RE investments: INR33/share.
Covering Analyst(s):Dhirendra Tiwari+91 22 3029 [email protected]
Pooja Kachhawa+91 22 3982 [email protected]
YEAR NET SALES* PAT* EPS* EPS* ADJ P/E* P/BV ROE ROCE EV/ EV/
END (INR M) (INR M) (INR) GR. (%) (X) (X) (%) (%) SALES EBITDA
3/10A 57,120 2,861 11.1 60.0 - - 9.8 12.6 - -
3/11A 62,299 2,218 8.6 -22.5 3.4 0.6 7.4 8.9 0.9 8.9
3/12E 67,821 1,907 7.4 -14.0 3.9 0.6 5.7 8.2 0.9 9.3
3/13E 74,382 2,106 8.2 10.5 3.6 0.6 6.9 8.7 0.8 8.7
Bloomberg NJCC IN
Equity Shares (m) 257
CMP (INR) 57
Mcap (USD b) 0.3
52-Wk Range (INR) 172/52
1, 6, 12 Rel Perf (%) -16/-33/-54
* For construction segment (consolidated, including international business)
Sector: Infrastructure
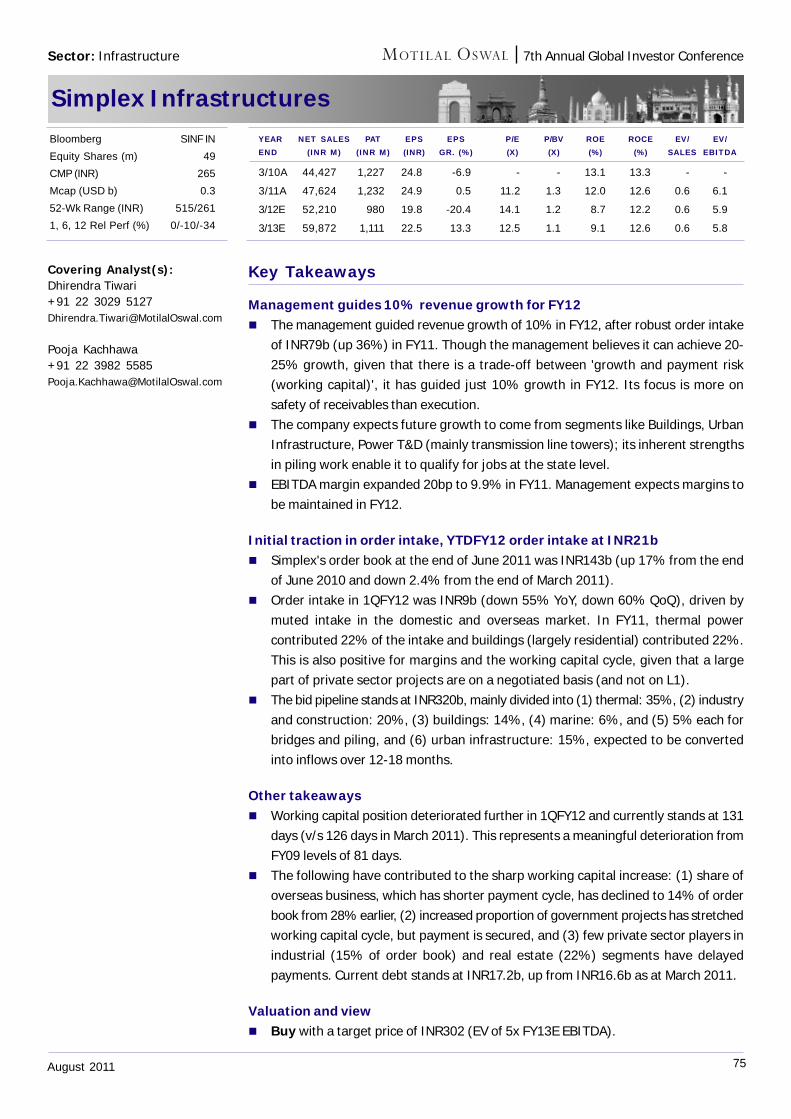
75August 2011
7th Annual Global Investor Conference
Simplex Infrastructures
Key Takeaways
Management guides 10% revenue growth for FY12 The management guided revenue growth of 10% in FY12, after robust order intake
of INR79b (up 36%) in FY11. Though the management believes it can achieve 20-25% growth, given that there is a trade-off between 'growth and payment risk(working capital)', it has guided just 10% growth in FY12. Its focus is more onsafety of receivables than execution.
The company expects future growth to come from segments like Buildings, UrbanInfrastructure, Power T&D (mainly transmission line towers); its inherent strengthsin piling work enable it to qualify for jobs at the state level.
EBITDA margin expanded 20bp to 9.9% in FY11. Management expects margins tobe maintained in FY12.
Initial traction in order intake, YTDFY12 order intake at INR21b Simplex's order book at the end of June 2011 was INR143b (up 17% from the end
of June 2010 and down 2.4% from the end of March 2011). Order intake in 1QFY12 was INR9b (down 55% YoY, down 60% QoQ), driven by
muted intake in the domestic and overseas market. In FY11, thermal powercontributed 22% of the intake and buildings (largely residential) contributed 22%.This is also positive for margins and the working capital cycle, given that a largepart of private sector projects are on a negotiated basis (and not on L1).
The bid pipeline stands at INR320b, mainly divided into (1) thermal: 35%, (2) industryand construction: 20%, (3) buildings: 14%, (4) marine: 6%, and (5) 5% each forbridges and piling, and (6) urban infrastructure: 15%, expected to be convertedinto inflows over 12-18 months.
Other takeaways Working capital position deteriorated further in 1QFY12 and currently stands at 131
days (v/s 126 days in March 2011). This represents a meaningful deterioration fromFY09 levels of 81 days.
The following have contributed to the sharp working capital increase: (1) share ofoverseas business, which has shorter payment cycle, has declined to 14% of orderbook from 28% earlier, (2) increased proportion of government projects has stretchedworking capital cycle, but payment is secured, and (3) few private sector players inindustrial (15% of order book) and real estate (22%) segments have delayedpayments. Current debt stands at INR17.2b, up from INR16.6b as at March 2011.
Valuation and view Buy with a target price of INR302 (EV of 5x FY13E EBITDA).
Covering Analyst(s):Dhirendra Tiwari+91 22 3029 [email protected]
Pooja Kachhawa+91 22 3982 [email protected]
YEAR NET SALES PAT EPS EPS P/E P/BV ROE ROCE EV/ EV/END (INR M) (INR M) (INR) GR. (%) (X) (X) (%) (%) SALES EBITDA
3/10A 44,427 1,227 24.8 -6.9 - - 13.1 13.3 - -
3/11A 47,624 1,232 24.9 0.5 11.2 1.3 12.0 12.6 0.6 6.1
3/12E 52,210 980 19.8 -20.4 14.1 1.2 8.7 12.2 0.6 5.9
3/13E 59,872 1,111 22.5 13.3 12.5 1.1 9.1 12.6 0.6 5.8
Bloomberg SINF IN
Equity Shares (m) 49
CMP (INR) 265
Mcap (USD b) 0.3
52-Wk Range (INR) 515/261
1, 6, 12 Rel Perf (%) 0/-10/-34
Sector: Infrastructure
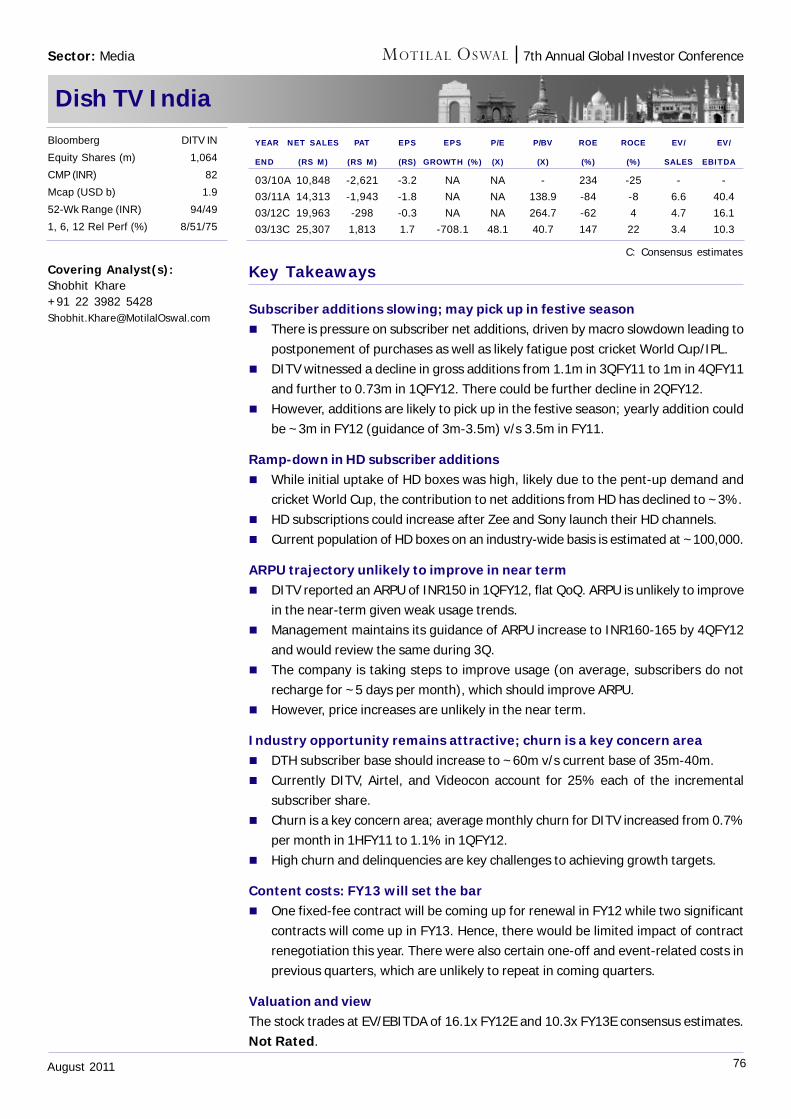
76August 2011
7th Annual Global Investor Conference
Dish TV India
Key Takeaways
Subscriber additions slowing; may pick up in festive season There is pressure on subscriber net additions, driven by macro slowdown leading to
postponement of purchases as well as likely fatigue post cricket World Cup/IPL. DITV witnessed a decline in gross additions from 1.1m in 3QFY11 to 1m in 4QFY11
and further to 0.73m in 1QFY12. There could be further decline in 2QFY12. However, additions are likely to pick up in the festive season; yearly addition could
be ~3m in FY12 (guidance of 3m-3.5m) v/s 3.5m in FY11.
Ramp-down in HD subscriber additions While initial uptake of HD boxes was high, likely due to the pent-up demand and
cricket World Cup, the contribution to net additions from HD has declined to ~3%. HD subscriptions could increase after Zee and Sony launch their HD channels. Current population of HD boxes on an industry-wide basis is estimated at ~100,000.
ARPU trajectory unlikely to improve in near term DITV reported an ARPU of INR150 in 1QFY12, flat QoQ. ARPU is unlikely to improve
in the near-term given weak usage trends. Management maintains its guidance of ARPU increase to INR160-165 by 4QFY12
and would review the same during 3Q. The company is taking steps to improve usage (on average, subscribers do not
recharge for ~5 days per month), which should improve ARPU. However, price increases are unlikely in the near term.
Industry opportunity remains attractive; churn is a key concern area DTH subscriber base should increase to ~60m v/s current base of 35m-40m. Currently DITV, Airtel, and Videocon account for 25% each of the incremental
subscriber share. Churn is a key concern area; average monthly churn for DITV increased from 0.7%
per month in 1HFY11 to 1.1% in 1QFY12. High churn and delinquencies are key challenges to achieving growth targets.
Content costs: FY13 will set the bar One fixed-fee contract will be coming up for renewal in FY12 while two significant
contracts will come up in FY13. Hence, there would be limited impact of contractrenegotiation this year. There were also certain one-off and event-related costs inprevious quarters, which are unlikely to repeat in coming quarters.
Valuation and viewThe stock trades at EV/EBITDA of 16.1x FY12E and 10.3x FY13E consensus estimates.Not Rated.
Covering Analyst(s):Shobhit Khare+91 22 3982 [email protected]
Bloomberg DITV IN
Equity Shares (m) 1,064
CMP (INR) 82
Mcap (USD b) 1.9
52-Wk Range (INR) 94/49
1, 6, 12 Rel Perf (%) 8/51/75
Sector: Media
YEAR NET SALES PAT EPS EPS P/E P/BV ROE ROCE EV/ EV/
END (RS M) (RS M) (RS) GROWTH (%) (X) (X) (%) (%) SALES EBITDA
03/10A 10,848 -2,621 -3.2 NA NA - 234 -25 - -
03/11A 14,313 -1,943 -1.8 NA NA 138.9 -84 -8 6.6 40.4
03/12C 19,963 -298 -0.3 NA NA 264.7 -62 4 4.7 16.1
03/13C 25,307 1,813 1.7 -708.1 48.1 40.7 147 22 3.4 10.3
C: Consensus estimates
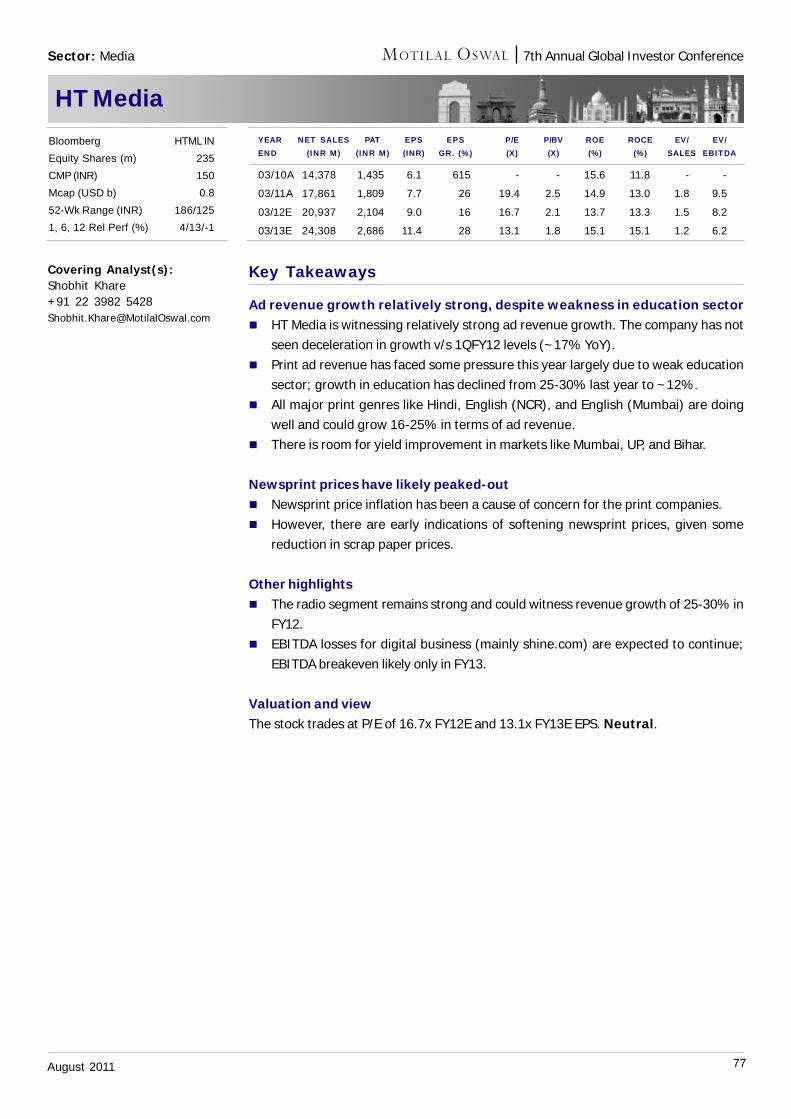
77August 2011
7th Annual Global Investor Conference
HT Media
Key Takeaways
Ad revenue growth relatively strong, despite weakness in education sector HT Media is witnessing relatively strong ad revenue growth. The company has not
seen deceleration in growth v/s 1QFY12 levels (~17% YoY). Print ad revenue has faced some pressure this year largely due to weak education
sector; growth in education has declined from 25-30% last year to ~12%. All major print genres like Hindi, English (NCR), and English (Mumbai) are doing
well and could grow 16-25% in terms of ad revenue. There is room for yield improvement in markets like Mumbai, UP, and Bihar.
Newsprint prices have likely peaked-out Newsprint price inflation has been a cause of concern for the print companies. However, there are early indications of softening newsprint prices, given some
reduction in scrap paper prices.
Other highlights The radio segment remains strong and could witness revenue growth of 25-30% in
FY12. EBITDA losses for digital business (mainly shine.com) are expected to continue;
EBITDA breakeven likely only in FY13.
Valuation and viewThe stock trades at P/E of 16.7x FY12E and 13.1x FY13E EPS. Neutral.
Covering Analyst(s):Shobhit Khare+91 22 3982 [email protected]
YEAR NET SALES PAT EPS EPS P/E P/BV ROE ROCE EV/ EV/END (INR M) (INR M) (INR) GR. (%) (X) (X) (%) (%) SALES EBITDA
03/10A 14,378 1,435 6.1 615 - - 15.6 11.8 - -
03/11A 17,861 1,809 7.7 26 19.4 2.5 14.9 13.0 1.8 9.5
03/12E 20,937 2,104 9.0 16 16.7 2.1 13.7 13.3 1.5 8.2
03/13E 24,308 2,686 11.4 28 13.1 1.8 15.1 15.1 1.2 6.2
Bloomberg HTML IN
Equity Shares (m) 235
CMP (INR) 150
Mcap (USD b) 0.8
52-Wk Range (INR) 186/125
1, 6, 12 Rel Perf (%) 4/13/-1
Sector: Media
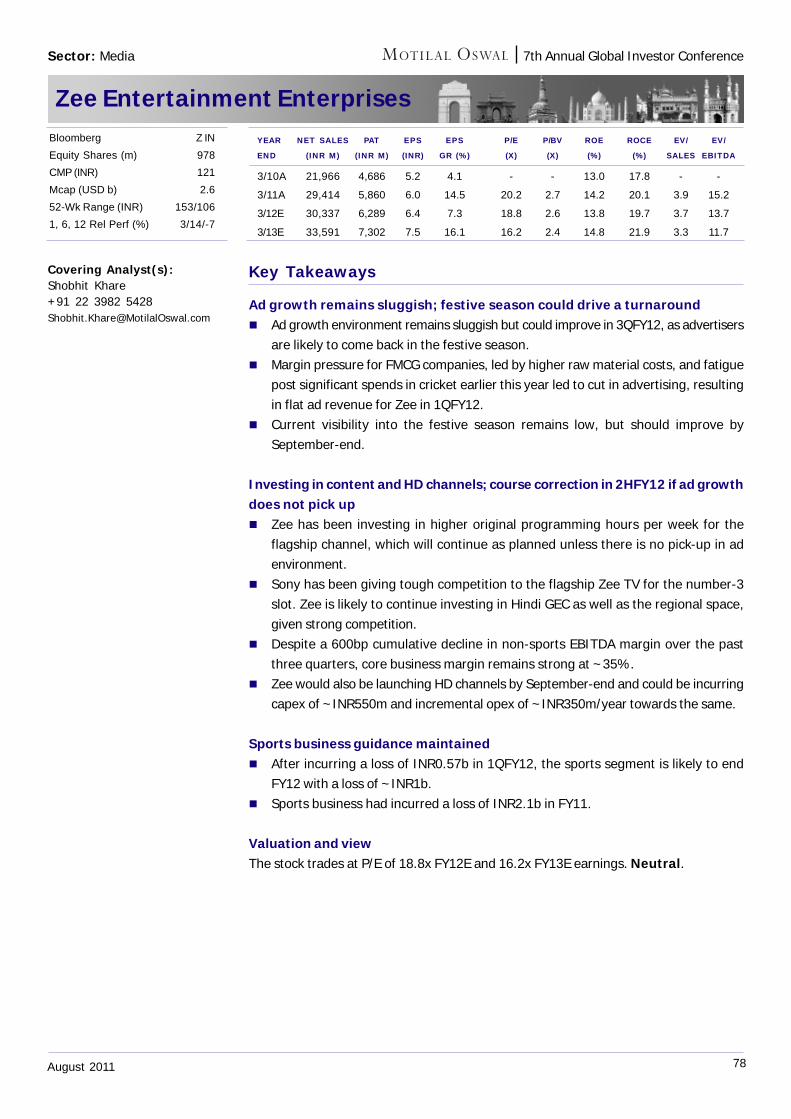
78August 2011
7th Annual Global Investor Conference
Zee Entertainment Enterprises
Key Takeaways
Ad growth remains sluggish; festive season could drive a turnaround Ad growth environment remains sluggish but could improve in 3QFY12, as advertisers
are likely to come back in the festive season. Margin pressure for FMCG companies, led by higher raw material costs, and fatigue
post significant spends in cricket earlier this year led to cut in advertising, resultingin flat ad revenue for Zee in 1QFY12.
Current visibility into the festive season remains low, but should improve bySeptember-end.
Investing in content and HD channels; course correction in 2HFY12 if ad growthdoes not pick up Zee has been investing in higher original programming hours per week for the
flagship channel, which will continue as planned unless there is no pick-up in adenvironment.
Sony has been giving tough competition to the flagship Zee TV for the number-3slot. Zee is likely to continue investing in Hindi GEC as well as the regional space,given strong competition.
Despite a 600bp cumulative decline in non-sports EBITDA margin over the pastthree quarters, core business margin remains strong at ~35%.
Zee would also be launching HD channels by September-end and could be incurringcapex of ~INR550m and incremental opex of ~INR350m/year towards the same.
Sports business guidance maintained After incurring a loss of INR0.57b in 1QFY12, the sports segment is likely to end
FY12 with a loss of ~INR1b. Sports business had incurred a loss of INR2.1b in FY11.
Valuation and viewThe stock trades at P/E of 18.8x FY12E and 16.2x FY13E earnings. Neutral.
Covering Analyst(s):Shobhit Khare+91 22 3982 [email protected]
YEAR NET SALES PAT EPS EPS P/E P/BV ROE ROCE EV/ EV/
END (INR M) (INR M) (INR) GR (%) (X) (X) (%) (%) SALES EBITDA
3/10A 21,966 4,686 5.2 4.1 - - 13.0 17.8 - -
3/11A 29,414 5,860 6.0 14.5 20.2 2.7 14.2 20.1 3.9 15.2
3/12E 30,337 6,289 6.4 7.3 18.8 2.6 13.8 19.7 3.7 13.7
3/13E 33,591 7,302 7.5 16.1 16.2 2.4 14.8 21.9 3.3 11.7
Bloomberg Z IN
Equity Shares (m) 978
CMP (INR) 121
Mcap (USD b) 2.6
52-Wk Range (INR) 153/106
1, 6, 12 Rel Perf (%) 3/14/-7
Sector: Media
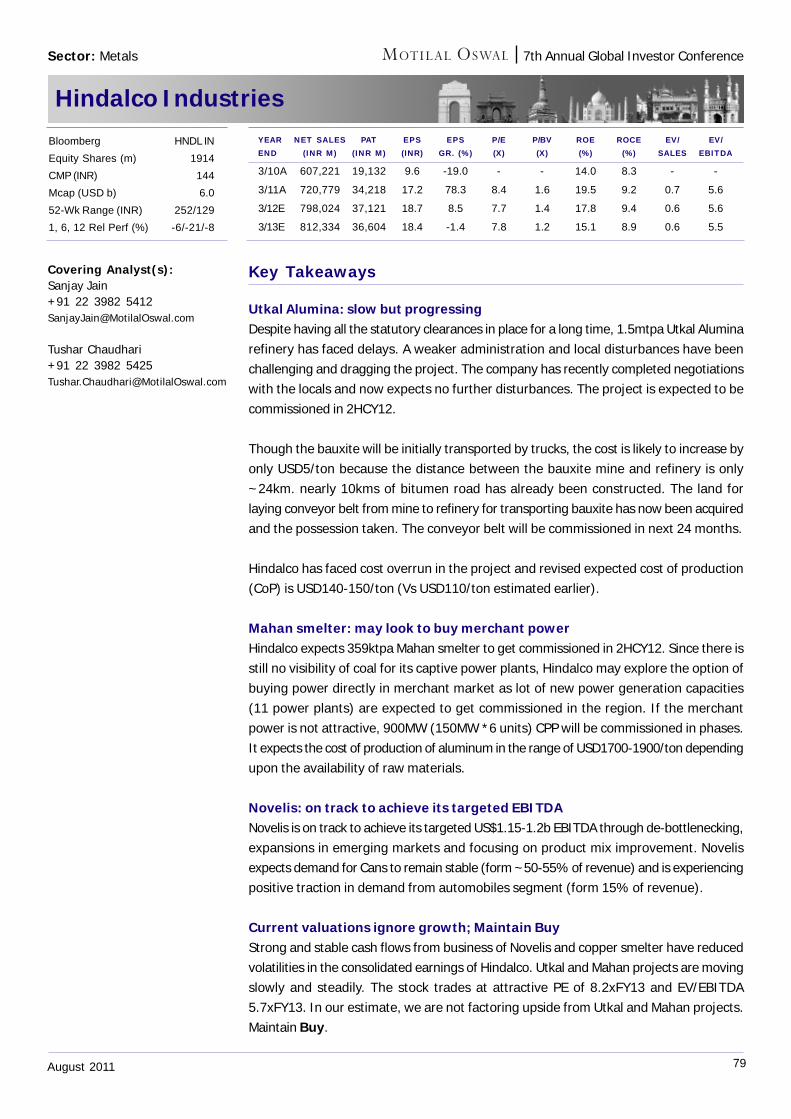
79August 2011
7th Annual Global Investor Conference
Hindalco Industries
Key Takeaways
Utkal Alumina: slow but progressingDespite having all the statutory clearances in place for a long time, 1.5mtpa Utkal Aluminarefinery has faced delays. A weaker administration and local disturbances have beenchallenging and dragging the project. The company has recently completed negotiationswith the locals and now expects no further disturbances. The project is expected to becommissioned in 2HCY12.
Though the bauxite will be initially transported by trucks, the cost is likely to increase byonly USD5/ton because the distance between the bauxite mine and refinery is only~24km. nearly 10kms of bitumen road has already been constructed. The land forlaying conveyor belt from mine to refinery for transporting bauxite has now been acquiredand the possession taken. The conveyor belt will be commissioned in next 24 months.
Hindalco has faced cost overrun in the project and revised expected cost of production(CoP) is USD140-150/ton (Vs USD110/ton estimated earlier).
Mahan smelter: may look to buy merchant powerHindalco expects 359ktpa Mahan smelter to get commissioned in 2HCY12. Since there isstill no visibility of coal for its captive power plants, Hindalco may explore the option ofbuying power directly in merchant market as lot of new power generation capacities(11 power plants) are expected to get commissioned in the region. If the merchantpower is not attractive, 900MW (150MW *6 units) CPP will be commissioned in phases.It expects the cost of production of aluminum in the range of USD1700-1900/ton dependingupon the availability of raw materials.
Novelis: on track to achieve its targeted EBITDANovelis is on track to achieve its targeted US$1.15-1.2b EBITDA through de-bottlenecking,expansions in emerging markets and focusing on product mix improvement. Novelisexpects demand for Cans to remain stable (form ~50-55% of revenue) and is experiencingpositive traction in demand from automobiles segment (form 15% of revenue).
Current valuations ignore growth; Maintain BuyStrong and stable cash flows from business of Novelis and copper smelter have reducedvolatilities in the consolidated earnings of Hindalco. Utkal and Mahan projects are movingslowly and steadily. The stock trades at attractive PE of 8.2xFY13 and EV/EBITDA5.7xFY13. In our estimate, we are not factoring upside from Utkal and Mahan projects.Maintain Buy.
Covering Analyst(s):Sanjay Jain+91 22 3982 [email protected]
Tushar Chaudhari+91 22 3982 [email protected]
Sector: Metals
YEAR NET SALES PAT EPS EPS P/E P/BV ROE ROCE EV/ EV/END (INR M) (INR M) (INR) GR. (%) (X) (X) (%) (%) SALES EBITDA
3/10A 607,221 19,132 9.6 -19.0 - - 14.0 8.3 - -
3/11A 720,779 34,218 17.2 78.3 8.4 1.6 19.5 9.2 0.7 5.6
3/12E 798,024 37,121 18.7 8.5 7.7 1.4 17.8 9.4 0.6 5.6
3/13E 812,334 36,604 18.4 -1.4 7.8 1.2 15.1 8.9 0.6 5.5
Bloomberg HNDL IN
Equity Shares (m) 1914
CMP (INR) 144
Mcap (USD b) 6.0
52-Wk Range (INR) 252/129
1, 6, 12 Rel Perf (%) -6/-21/-8
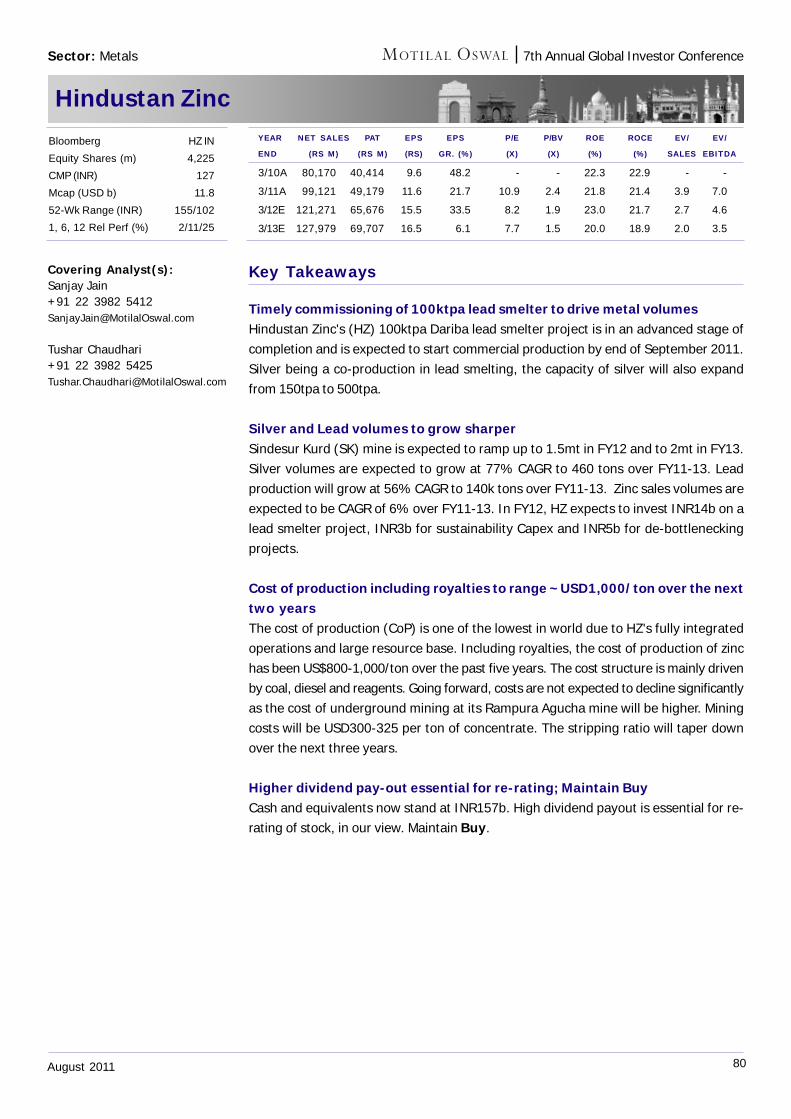
80August 2011
7th Annual Global Investor Conference
Hindustan Zinc
Key Takeaways
Timely commissioning of 100ktpa lead smelter to drive metal volumesHindustan Zinc's (HZ) 100ktpa Dariba lead smelter project is in an advanced stage ofcompletion and is expected to start commercial production by end of September 2011.Silver being a co-production in lead smelting, the capacity of silver will also expandfrom 150tpa to 500tpa.
Silver and Lead volumes to grow sharperSindesur Kurd (SK) mine is expected to ramp up to 1.5mt in FY12 and to 2mt in FY13.Silver volumes are expected to grow at 77% CAGR to 460 tons over FY11-13. Leadproduction will grow at 56% CAGR to 140k tons over FY11-13. Zinc sales volumes areexpected to be CAGR of 6% over FY11-13. In FY12, HZ expects to invest INR14b on alead smelter project, INR3b for sustainability Capex and INR5b for de-bottleneckingprojects.
Cost of production including royalties to range ~USD1,000/ton over the nexttwo yearsThe cost of production (CoP) is one of the lowest in world due to HZ's fully integratedoperations and large resource base. Including royalties, the cost of production of zinchas been US$800-1,000/ton over the past five years. The cost structure is mainly drivenby coal, diesel and reagents. Going forward, costs are not expected to decline significantlyas the cost of underground mining at its Rampura Agucha mine will be higher. Miningcosts will be USD300-325 per ton of concentrate. The stripping ratio will taper downover the next three years.
Higher dividend pay-out essential for re-rating; Maintain BuyCash and equivalents now stand at INR157b. High dividend payout is essential for re-rating of stock, in our view. Maintain Buy.
Covering Analyst(s):Sanjay Jain+91 22 3982 [email protected]
Tushar Chaudhari+91 22 3982 [email protected]
YEAR NET SALES PAT EPS EPS P/E P/BV ROE ROCE EV/ EV/
END (RS M) (RS M) (RS) GR. (%) (X) (X) (%) (%) SALES EBITDA
3/10A 80,170 40,414 9.6 48.2 - - 22.3 22.9 - -
3/11A 99,121 49,179 11.6 21.7 10.9 2.4 21.8 21.4 3.9 7.0
3/12E 121,271 65,676 15.5 33.5 8.2 1.9 23.0 21.7 2.7 4.6
3/13E 127,979 69,707 16.5 6.1 7.7 1.5 20.0 18.9 2.0 3.5
Bloomberg HZ IN
Equity Shares (m) 4,225
CMP (INR) 127
Mcap (USD b) 11.8
52-Wk Range (INR) 155/102
1, 6, 12 Rel Perf (%) 2/11/25
Sector: Metals
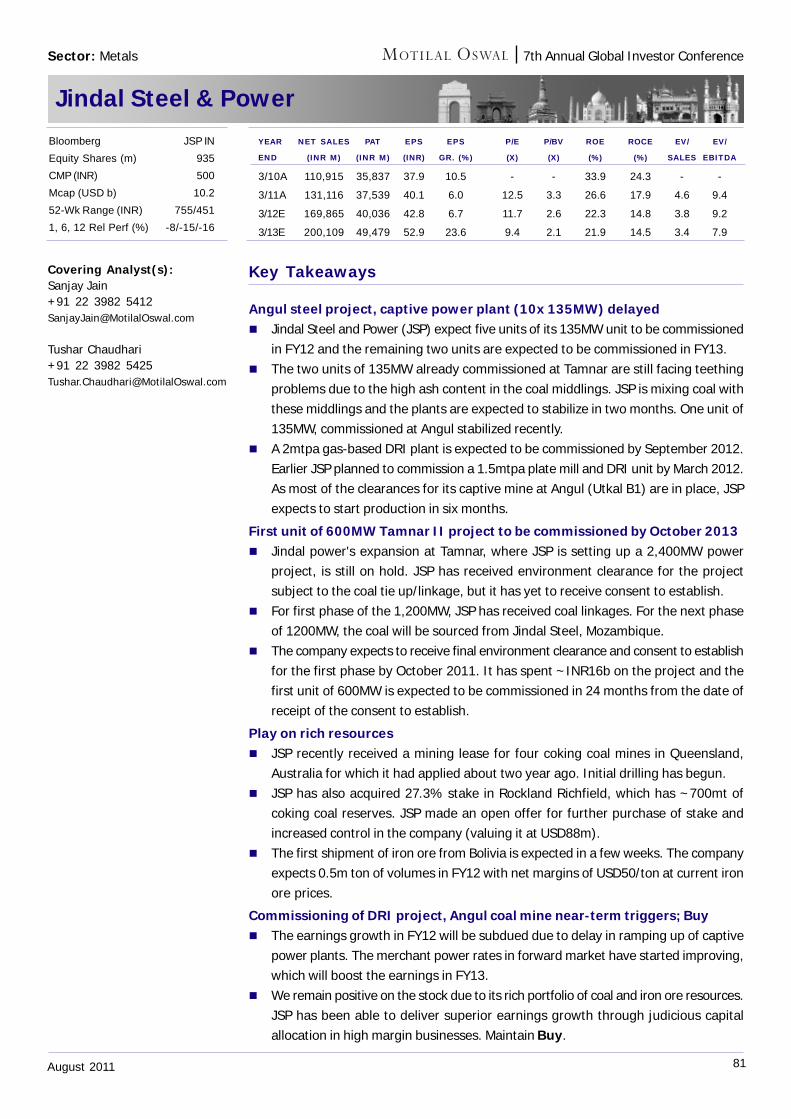
81August 2011
7th Annual Global Investor Conference
Jindal Steel & Power
Key Takeaways
Angul steel project, captive power plant (10x 135MW) delayed Jindal Steel and Power (JSP) expect five units of its 135MW unit to be commissioned
in FY12 and the remaining two units are expected to be commissioned in FY13. The two units of 135MW already commissioned at Tamnar are still facing teething
problems due to the high ash content in the coal middlings. JSP is mixing coal withthese middlings and the plants are expected to stabilize in two months. One unit of135MW, commissioned at Angul stabilized recently.
A 2mtpa gas-based DRI plant is expected to be commissioned by September 2012.Earlier JSP planned to commission a 1.5mtpa plate mill and DRI unit by March 2012.As most of the clearances for its captive mine at Angul (Utkal B1) are in place, JSPexpects to start production in six months.
First unit of 600MW Tamnar II project to be commissioned by October 2013 Jindal power's expansion at Tamnar, where JSP is setting up a 2,400MW power
project, is still on hold. JSP has received environment clearance for the projectsubject to the coal tie up/linkage, but it has yet to receive consent to establish.
For first phase of the 1,200MW, JSP has received coal linkages. For the next phaseof 1200MW, the coal will be sourced from Jindal Steel, Mozambique.
The company expects to receive final environment clearance and consent to establishfor the first phase by October 2011. It has spent ~INR16b on the project and thefirst unit of 600MW is expected to be commissioned in 24 months from the date ofreceipt of the consent to establish.
Play on rich resources JSP recently received a mining lease for four coking coal mines in Queensland,
Australia for which it had applied about two year ago. Initial drilling has begun. JSP has also acquired 27.3% stake in Rockland Richfield, which has ~700mt of
coking coal reserves. JSP made an open offer for further purchase of stake andincreased control in the company (valuing it at USD88m).
The first shipment of iron ore from Bolivia is expected in a few weeks. The companyexpects 0.5m ton of volumes in FY12 with net margins of USD50/ton at current ironore prices.
Commissioning of DRI project, Angul coal mine near-term triggers; Buy The earnings growth in FY12 will be subdued due to delay in ramping up of captive
power plants. The merchant power rates in forward market have started improving,which will boost the earnings in FY13.
We remain positive on the stock due to its rich portfolio of coal and iron ore resources.JSP has been able to deliver superior earnings growth through judicious capitalallocation in high margin businesses. Maintain Buy.
Covering Analyst(s):Sanjay Jain+91 22 3982 [email protected]
Tushar Chaudhari+91 22 3982 [email protected]
YEAR NET SALES PAT EPS EPS P/E P/BV ROE ROCE EV/ EV/
END (INR M) (INR M) (INR) GR. (%) (X) (X) (%) (%) SALES EBITDA
3/10A 110,915 35,837 37.9 10.5 - - 33.9 24.3 - -
3/11A 131,116 37,539 40.1 6.0 12.5 3.3 26.6 17.9 4.6 9.4
3/12E 169,865 40,036 42.8 6.7 11.7 2.6 22.3 14.8 3.8 9.2
3/13E 200,109 49,479 52.9 23.6 9.4 2.1 21.9 14.5 3.4 7.9
Bloomberg JSP IN
Equity Shares (m) 935
CMP (INR) 500
Mcap (USD b) 10.2
52-Wk Range (INR) 755/451
1, 6, 12 Rel Perf (%) -8/-15/-16
Sector: Metals
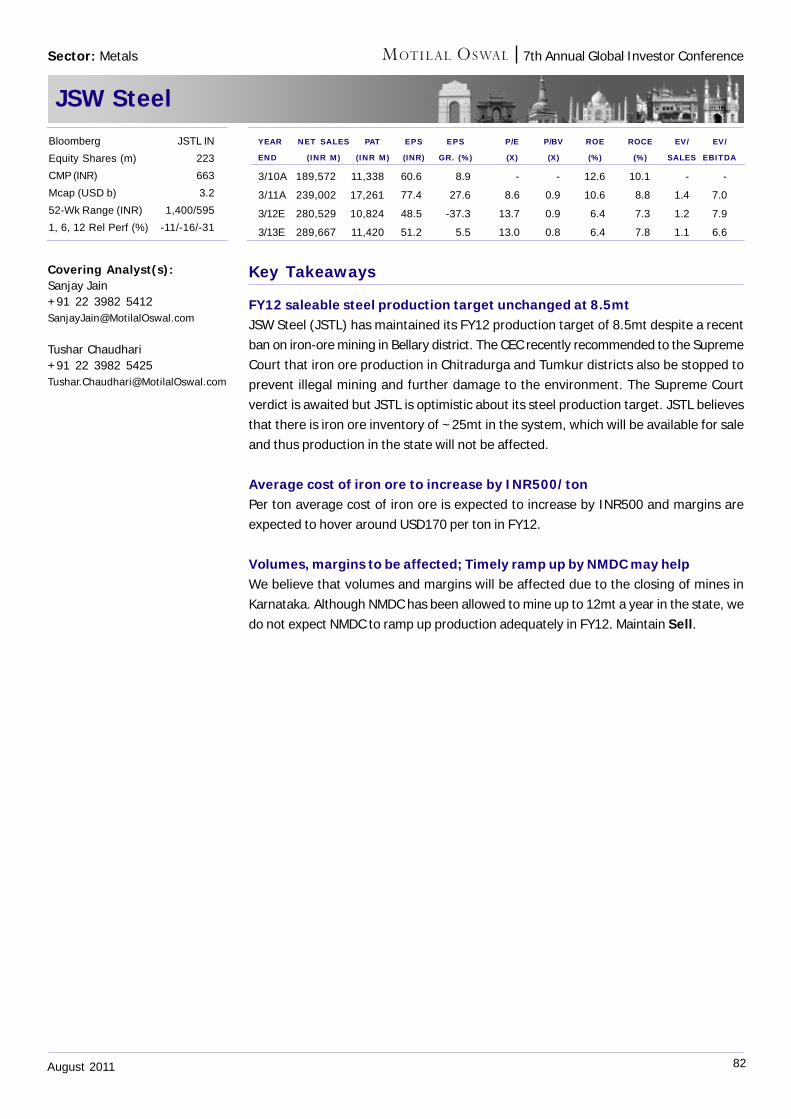
82August 2011
7th Annual Global Investor Conference
JSW Steel
Key Takeaways
FY12 saleable steel production target unchanged at 8.5mtJSW Steel (JSTL) has maintained its FY12 production target of 8.5mt despite a recentban on iron-ore mining in Bellary district. The CEC recently recommended to the SupremeCourt that iron ore production in Chitradurga and Tumkur districts also be stopped toprevent illegal mining and further damage to the environment. The Supreme Courtverdict is awaited but JSTL is optimistic about its steel production target. JSTL believesthat there is iron ore inventory of ~25mt in the system, which will be available for saleand thus production in the state will not be affected.
Average cost of iron ore to increase by INR500/tonPer ton average cost of iron ore is expected to increase by INR500 and margins areexpected to hover around USD170 per ton in FY12.
Volumes, margins to be affected; Timely ramp up by NMDC may helpWe believe that volumes and margins will be affected due to the closing of mines inKarnataka. Although NMDC has been allowed to mine up to 12mt a year in the state, wedo not expect NMDC to ramp up production adequately in FY12. Maintain Sell.
Covering Analyst(s):Sanjay Jain+91 22 3982 [email protected]
Tushar Chaudhari+91 22 3982 [email protected]
YEAR NET SALES PAT EPS EPS P/E P/BV ROE ROCE EV/ EV/
END (INR M) (INR M) (INR) GR. (%) (X) (X) (%) (%) SALES EBITDA
3/10A 189,572 11,338 60.6 8.9 - - 12.6 10.1 - -
3/11A 239,002 17,261 77.4 27.6 8.6 0.9 10.6 8.8 1.4 7.0
3/12E 280,529 10,824 48.5 -37.3 13.7 0.9 6.4 7.3 1.2 7.9
3/13E 289,667 11,420 51.2 5.5 13.0 0.8 6.4 7.8 1.1 6.6
Bloomberg JSTL IN
Equity Shares (m) 223
CMP (INR) 663
Mcap (USD b) 3.2
52-Wk Range (INR) 1,400/595
1, 6, 12 Rel Perf (%) -11/-16/-31
Sector: Metals
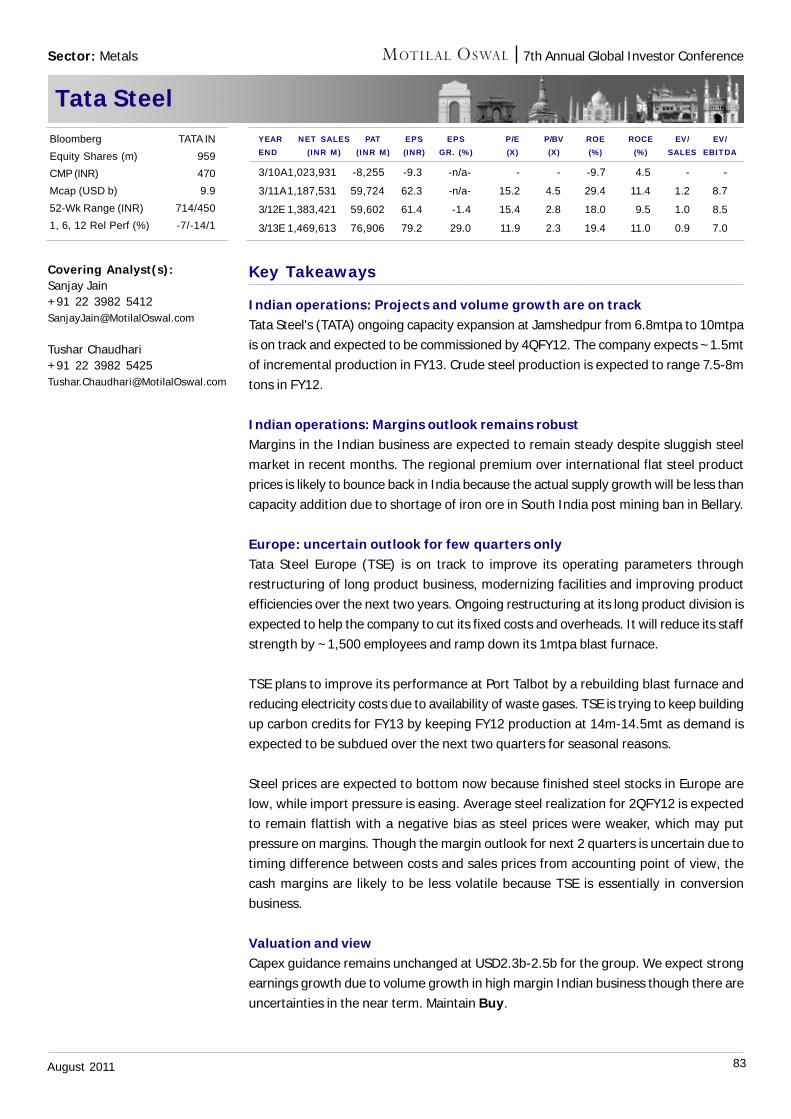
83August 2011
7th Annual Global Investor Conference
Tata Steel
Key Takeaways
Indian operations: Projects and volume growth are on trackTata Steel's (TATA) ongoing capacity expansion at Jamshedpur from 6.8mtpa to 10mtpais on track and expected to be commissioned by 4QFY12. The company expects ~1.5mtof incremental production in FY13. Crude steel production is expected to range 7.5-8mtons in FY12.
Indian operations: Margins outlook remains robustMargins in the Indian business are expected to remain steady despite sluggish steelmarket in recent months. The regional premium over international flat steel productprices is likely to bounce back in India because the actual supply growth will be less thancapacity addition due to shortage of iron ore in South India post mining ban in Bellary.
Europe: uncertain outlook for few quarters onlyTata Steel Europe (TSE) is on track to improve its operating parameters throughrestructuring of long product business, modernizing facilities and improving productefficiencies over the next two years. Ongoing restructuring at its long product division isexpected to help the company to cut its fixed costs and overheads. It will reduce its staffstrength by ~1,500 employees and ramp down its 1mtpa blast furnace.
TSE plans to improve its performance at Port Talbot by a rebuilding blast furnace andreducing electricity costs due to availability of waste gases. TSE is trying to keep buildingup carbon credits for FY13 by keeping FY12 production at 14m-14.5mt as demand isexpected to be subdued over the next two quarters for seasonal reasons.
Steel prices are expected to bottom now because finished steel stocks in Europe arelow, while import pressure is easing. Average steel realization for 2QFY12 is expectedto remain flattish with a negative bias as steel prices were weaker, which may putpressure on margins. Though the margin outlook for next 2 quarters is uncertain due totiming difference between costs and sales prices from accounting point of view, thecash margins are likely to be less volatile because TSE is essentially in conversionbusiness.
Valuation and viewCapex guidance remains unchanged at USD2.3b-2.5b for the group. We expect strongearnings growth due to volume growth in high margin Indian business though there areuncertainties in the near term. Maintain Buy.
Covering Analyst(s):Sanjay Jain+91 22 3982 [email protected]
Tushar Chaudhari+91 22 3982 [email protected]
YEAR NET SALES PAT EPS EPS P/E P/BV ROE ROCE EV/ EV/END (INR M) (INR M) (INR) GR. (%) (X) (X) (%) (%) SALES EBITDA
3/10A1,023,931 -8,255 -9.3 -n/a- - - -9.7 4.5 - -
3/11A1,187,531 59,724 62.3 -n/a- 15.2 4.5 29.4 11.4 1.2 8.7
3/12E 1,383,421 59,602 61.4 -1.4 15.4 2.8 18.0 9.5 1.0 8.5
3/13E 1,469,613 76,906 79.2 29.0 11.9 2.3 19.4 11.0 0.9 7.0
Bloomberg TATA IN
Equity Shares (m) 959
CMP (INR) 470
Mcap (USD b) 9.9
52-Wk Range (INR) 714/450
1, 6, 12 Rel Perf (%) -7/-14/1
Sector: Metals
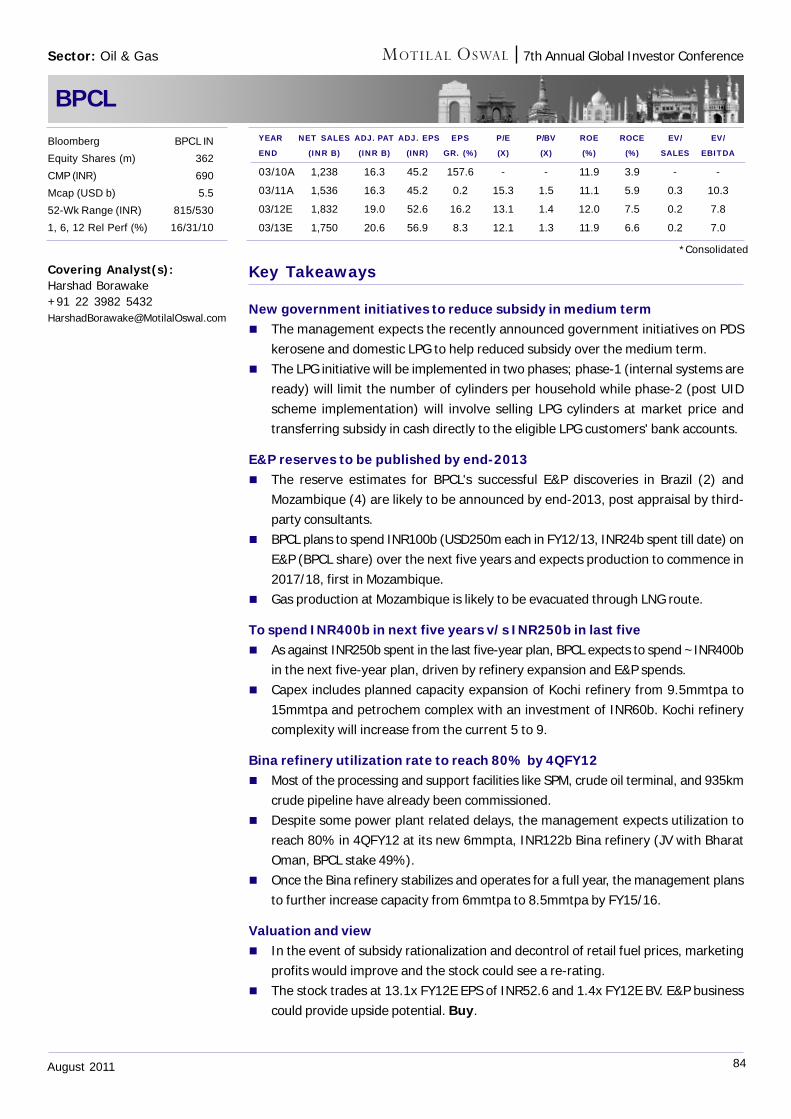
84August 2011
7th Annual Global Investor Conference
BPCL
Key Takeaways
New government initiatives to reduce subsidy in medium term The management expects the recently announced government initiatives on PDS
kerosene and domestic LPG to help reduced subsidy over the medium term. The LPG initiative will be implemented in two phases; phase-1 (internal systems are
ready) will limit the number of cylinders per household while phase-2 (post UIDscheme implementation) will involve selling LPG cylinders at market price andtransferring subsidy in cash directly to the eligible LPG customers' bank accounts.
E&P reserves to be published by end-2013 The reserve estimates for BPCL's successful E&P discoveries in Brazil (2) and
Mozambique (4) are likely to be announced by end-2013, post appraisal by third-party consultants.
BPCL plans to spend INR100b (USD250m each in FY12/13, INR24b spent till date) onE&P (BPCL share) over the next five years and expects production to commence in2017/18, first in Mozambique.
Gas production at Mozambique is likely to be evacuated through LNG route.
To spend INR400b in next five years v/s INR250b in last five As against INR250b spent in the last five-year plan, BPCL expects to spend ~INR400b
in the next five-year plan, driven by refinery expansion and E&P spends. Capex includes planned capacity expansion of Kochi refinery from 9.5mmtpa to
15mmtpa and petrochem complex with an investment of INR60b. Kochi refinerycomplexity will increase from the current 5 to 9.
Bina refinery utilization rate to reach 80% by 4QFY12 Most of the processing and support facilities like SPM, crude oil terminal, and 935km
crude pipeline have already been commissioned. Despite some power plant related delays, the management expects utilization to
reach 80% in 4QFY12 at its new 6mmpta, INR122b Bina refinery (JV with BharatOman, BPCL stake 49%).
Once the Bina refinery stabilizes and operates for a full year, the management plansto further increase capacity from 6mmtpa to 8.5mmtpa by FY15/16.
Valuation and view In the event of subsidy rationalization and decontrol of retail fuel prices, marketing
profits would improve and the stock could see a re-rating. The stock trades at 13.1x FY12E EPS of INR52.6 and 1.4x FY12E BV. E&P business
could provide upside potential. Buy.
Covering Analyst(s):Harshad Borawake+91 22 3982 [email protected]
YEAR NET SALES ADJ. PAT ADJ. EPS EPS P/E P/BV ROE ROCE EV/ EV/
END (INR B) (INR B) (INR) GR. (%) (X) (X) (%) (%) SALES EBITDA
03/10A 1,238 16.3 45.2 157.6 - - 11.9 3.9 - -
03/11A 1,536 16.3 45.2 0.2 15.3 1.5 11.1 5.9 0.3 10.3
03/12E 1,832 19.0 52.6 16.2 13.1 1.4 12.0 7.5 0.2 7.8
03/13E 1,750 20.6 56.9 8.3 12.1 1.3 11.9 6.6 0.2 7.0
Bloomberg BPCL IN
Equity Shares (m) 362
CMP (INR) 690
Mcap (USD b) 5.5
52-Wk Range (INR) 815/530
1, 6, 12 Rel Perf (%) 16/31/10
Sector: Oil & Gas
*Consolidated
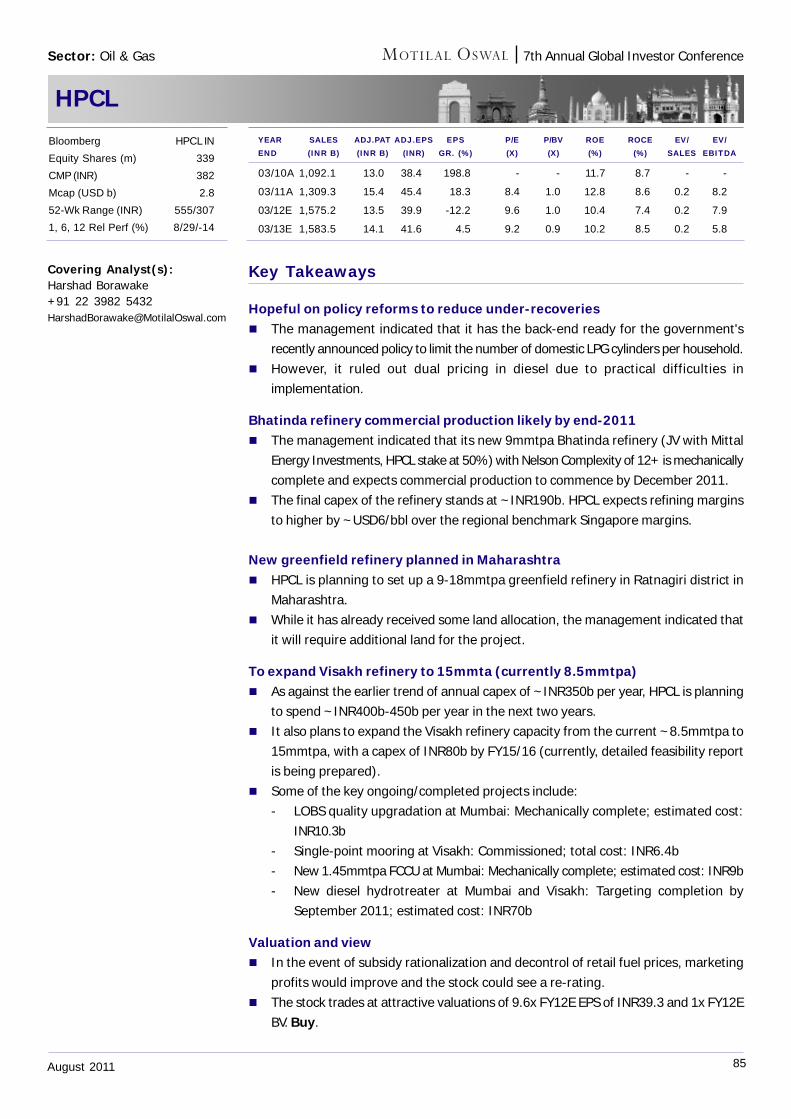
85August 2011
7th Annual Global Investor Conference
HPCL
Key Takeaways
Hopeful on policy reforms to reduce under-recoveries The management indicated that it has the back-end ready for the government's
recently announced policy to limit the number of domestic LPG cylinders per household. However, it ruled out dual pricing in diesel due to practical difficulties in
implementation.
Bhatinda refinery commercial production likely by end-2011 The management indicated that its new 9mmtpa Bhatinda refinery (JV with Mittal
Energy Investments, HPCL stake at 50%) with Nelson Complexity of 12+ is mechanicallycomplete and expects commercial production to commence by December 2011.
The final capex of the refinery stands at ~INR190b. HPCL expects refining marginsto higher by ~USD6/bbl over the regional benchmark Singapore margins.
New greenfield refinery planned in Maharashtra HPCL is planning to set up a 9-18mmtpa greenfield refinery in Ratnagiri district in
Maharashtra. While it has already received some land allocation, the management indicated that
it will require additional land for the project.
To expand Visakh refinery to 15mmta (currently 8.5mmtpa) As against the earlier trend of annual capex of ~INR350b per year, HPCL is planning
to spend ~INR400b-450b per year in the next two years. It also plans to expand the Visakh refinery capacity from the current ~8.5mmtpa to
15mmtpa, with a capex of INR80b by FY15/16 (currently, detailed feasibility reportis being prepared).
Some of the key ongoing/completed projects include:- LOBS quality upgradation at Mumbai: Mechanically complete; estimated cost:
INR10.3b- Single-point mooring at Visakh: Commissioned; total cost: INR6.4b- New 1.45mmtpa FCCU at Mumbai: Mechanically complete; estimated cost: INR9b- New diesel hydrotreater at Mumbai and Visakh: Targeting completion by
September 2011; estimated cost: INR70b
Valuation and view In the event of subsidy rationalization and decontrol of retail fuel prices, marketing
profits would improve and the stock could see a re-rating. The stock trades at attractive valuations of 9.6x FY12E EPS of INR39.3 and 1x FY12E
BV. Buy.
Covering Analyst(s):Harshad Borawake+91 22 3982 [email protected]
Sector: Oil & Gas
YEAR SALES ADJ.PAT ADJ.EPS EPS P/E P/BV ROE ROCE EV/ EV/END (INR B) (INR B) (INR) GR. (%) (X) (X) (%) (%) SALES EBITDA
03/10A 1,092.1 13.0 38.4 198.8 - - 11.7 8.7 - -
03/11A 1,309.3 15.4 45.4 18.3 8.4 1.0 12.8 8.6 0.2 8.2
03/12E 1,575.2 13.5 39.9 -12.2 9.6 1.0 10.4 7.4 0.2 7.9
03/13E 1,583.5 14.1 41.6 4.5 9.2 0.9 10.2 8.5 0.2 5.8
Bloomberg HPCL IN
Equity Shares (m) 339
CMP (INR) 382
Mcap (USD b) 2.8
52-Wk Range (INR) 555/307
1, 6, 12 Rel Perf (%) 8/29/-14
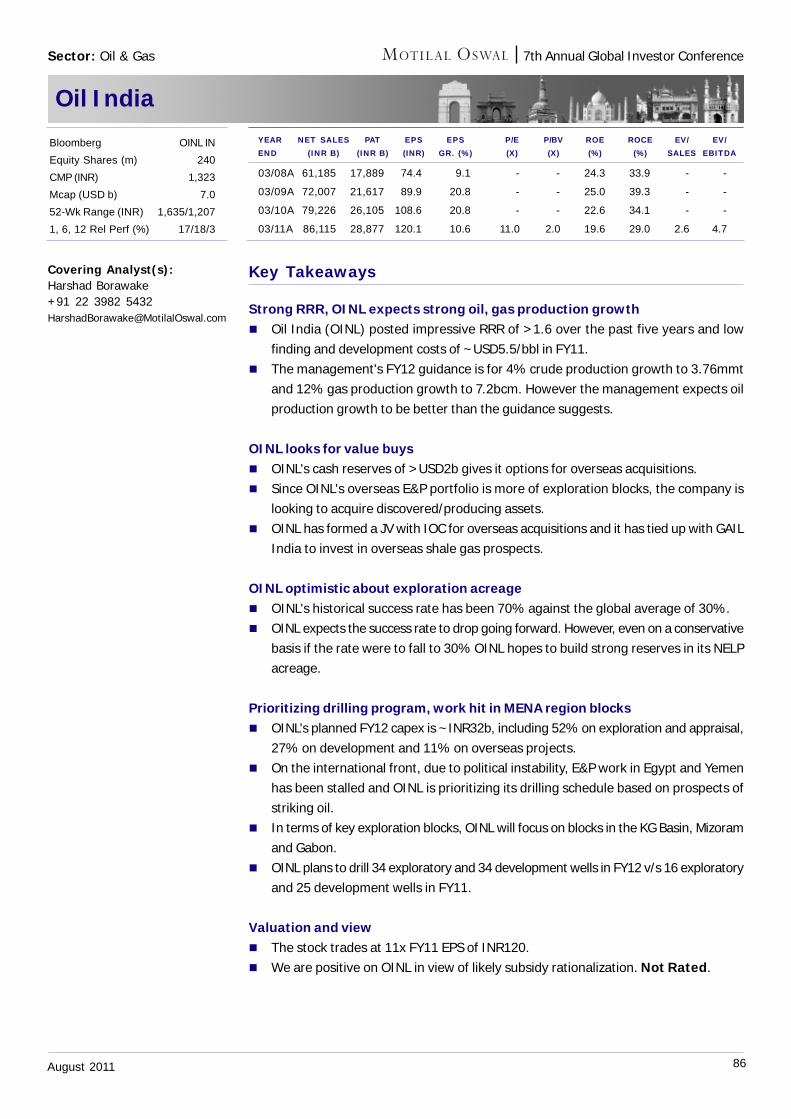
86August 2011
7th Annual Global Investor Conference
Oil India
Key Takeaways
Strong RRR, OINL expects strong oil, gas production growth Oil India (OINL) posted impressive RRR of >1.6 over the past five years and low
finding and development costs of ~USD5.5/bbl in FY11. The management's FY12 guidance is for 4% crude production growth to 3.76mmt
and 12% gas production growth to 7.2bcm. However the management expects oilproduction growth to be better than the guidance suggests.
OINL looks for value buys OINL's cash reserves of >USD2b gives it options for overseas acquisitions. Since OINL's overseas E&P portfolio is more of exploration blocks, the company is
looking to acquire discovered/producing assets. OINL has formed a JV with IOC for overseas acquisitions and it has tied up with GAIL
India to invest in overseas shale gas prospects.
OINL optimistic about exploration acreage OINL's historical success rate has been 70% against the global average of 30%. OINL expects the success rate to drop going forward. However, even on a conservative
basis if the rate were to fall to 30% OINL hopes to build strong reserves in its NELPacreage.
Prioritizing drilling program, work hit in MENA region blocks OINL's planned FY12 capex is ~INR32b, including 52% on exploration and appraisal,
27% on development and 11% on overseas projects. On the international front, due to political instability, E&P work in Egypt and Yemen
has been stalled and OINL is prioritizing its drilling schedule based on prospects ofstriking oil.
In terms of key exploration blocks, OINL will focus on blocks in the KG Basin, Mizoramand Gabon.
OINL plans to drill 34 exploratory and 34 development wells in FY12 v/s 16 exploratoryand 25 development wells in FY11.
Valuation and view The stock trades at 11x FY11 EPS of INR120. We are positive on OINL in view of likely subsidy rationalization. Not Rated.
Covering Analyst(s):Harshad Borawake+91 22 3982 [email protected]
Bloomberg OINL IN
Equity Shares (m) 240
CMP (INR) 1,323
Mcap (USD b) 7.0
52-Wk Range (INR) 1,635/1,207
1, 6, 12 Rel Perf (%) 17/18/3
Sector: Oil & Gas
YEAR NET SALES PAT EPS EPS P/E P/BV ROE ROCE EV/ EV/END (INR B) (INR B) (INR) GR. (%) (X) (X) (%) (%) SALES EBITDA
03/08A 61,185 17,889 74.4 9.1 - - 24.3 33.9 - -
03/09A 72,007 21,617 89.9 20.8 - - 25.0 39.3 - -
03/10A 79,226 26,105 108.6 20.8 - - 22.6 34.1 - -
03/11A 86,115 28,877 120.1 10.6 11.0 2.0 19.6 29.0 2.6 4.7
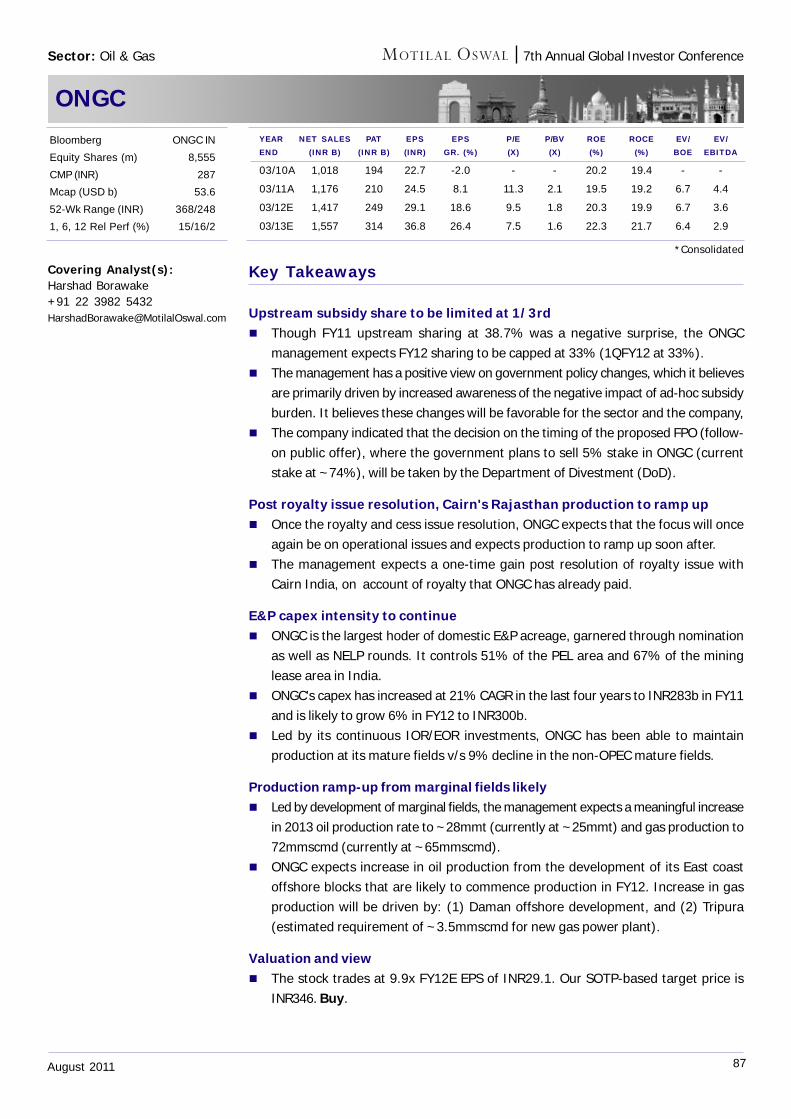
87August 2011
7th Annual Global Investor Conference
Key Takeaways
Upstream subsidy share to be limited at 1/3rd Though FY11 upstream sharing at 38.7% was a negative surprise, the ONGC
management expects FY12 sharing to be capped at 33% (1QFY12 at 33%). The management has a positive view on government policy changes, which it believes
are primarily driven by increased awareness of the negative impact of ad-hoc subsidyburden. It believes these changes will be favorable for the sector and the company,
The company indicated that the decision on the timing of the proposed FPO (follow-on public offer), where the government plans to sell 5% stake in ONGC (currentstake at ~74%), will be taken by the Department of Divestment (DoD).
Post royalty issue resolution, Cairn's Rajasthan production to ramp up Once the royalty and cess issue resolution, ONGC expects that the focus will once
again be on operational issues and expects production to ramp up soon after. The management expects a one-time gain post resolution of royalty issue with
Cairn India, on account of royalty that ONGC has already paid.
E&P capex intensity to continue ONGC is the largest hoder of domestic E&P acreage, garnered through nomination
as well as NELP rounds. It controls 51% of the PEL area and 67% of the mininglease area in India.
ONGC's capex has increased at 21% CAGR in the last four years to INR283b in FY11and is likely to grow 6% in FY12 to INR300b.
Led by its continuous IOR/EOR investments, ONGC has been able to maintainproduction at its mature fields v/s 9% decline in the non-OPEC mature fields.
Production ramp-up from marginal fields likely Led by development of marginal fields, the management expects a meaningful increase
in 2013 oil production rate to ~28mmt (currently at ~25mmt) and gas production to72mmscmd (currently at ~65mmscmd).
ONGC expects increase in oil production from the development of its East coastoffshore blocks that are likely to commence production in FY12. Increase in gasproduction will be driven by: (1) Daman offshore development, and (2) Tripura(estimated requirement of ~3.5mmscmd for new gas power plant).
Valuation and view The stock trades at 9.9x FY12E EPS of INR29.1. Our SOTP-based target price is
INR346. Buy.
ONGC
Covering Analyst(s):Harshad Borawake+91 22 3982 [email protected]
YEAR NET SALES PAT EPS EPS P/E P/BV ROE ROCE EV/ EV/END (INR B) (INR B) (INR) GR. (%) (X) (X) (%) (%) BOE EBITDA
03/10A 1,018 194 22.7 -2.0 - - 20.2 19.4 - -
03/11A 1,176 210 24.5 8.1 11.3 2.1 19.5 19.2 6.7 4.4
03/12E 1,417 249 29.1 18.6 9.5 1.8 20.3 19.9 6.7 3.6
03/13E 1,557 314 36.8 26.4 7.5 1.6 22.3 21.7 6.4 2.9
Bloomberg ONGC IN
Equity Shares (m) 8,555
CMP (INR) 287
Mcap (USD b) 53.6
52-Wk Range (INR) 368/248
1, 6, 12 Rel Perf (%) 15/16/2
Sector: Oil & Gas
*Consolidated
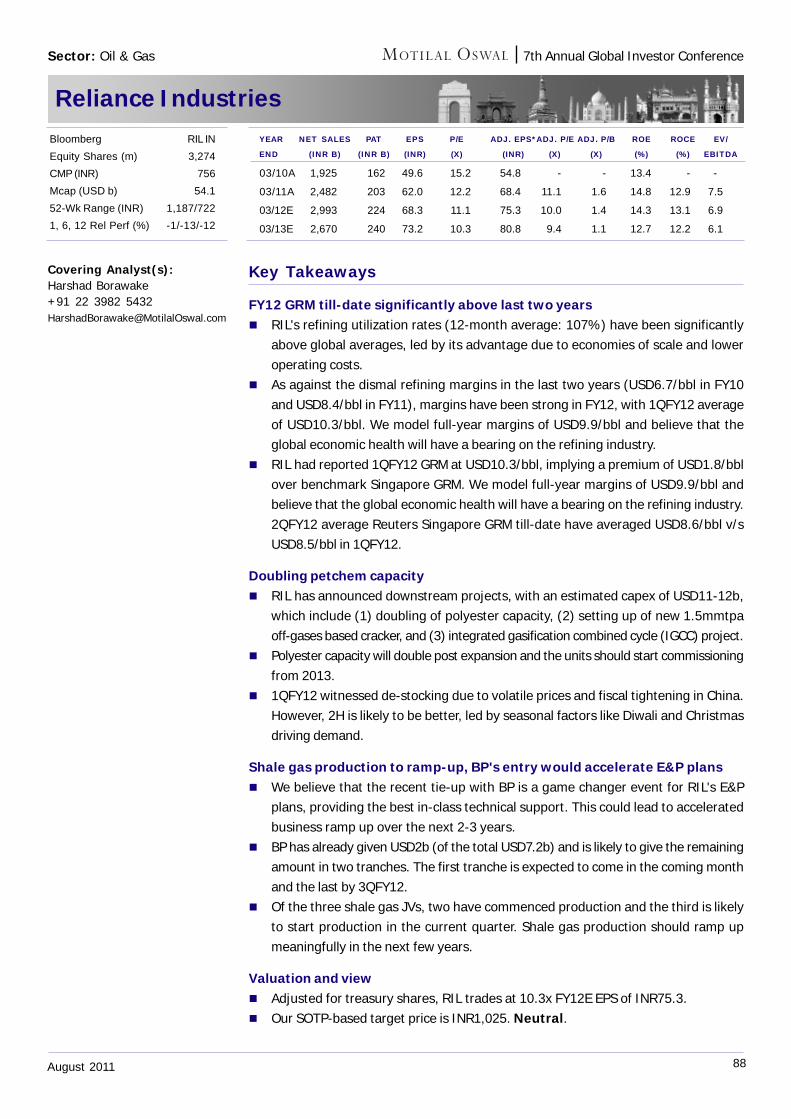
88August 2011
7th Annual Global Investor Conference
Reliance Industries
Key Takeaways
FY12 GRM till-date significantly above last two years RIL's refining utilization rates (12-month average: 107%) have been significantly
above global averages, led by its advantage due to economies of scale and loweroperating costs.
As against the dismal refining margins in the last two years (USD6.7/bbl in FY10and USD8.4/bbl in FY11), margins have been strong in FY12, with 1QFY12 averageof USD10.3/bbl. We model full-year margins of USD9.9/bbl and believe that theglobal economic health will have a bearing on the refining industry.
RIL had reported 1QFY12 GRM at USD10.3/bbl, implying a premium of USD1.8/bblover benchmark Singapore GRM. We model full-year margins of USD9.9/bbl andbelieve that the global economic health will have a bearing on the refining industry.2QFY12 average Reuters Singapore GRM till-date have averaged USD8.6/bbl v/sUSD8.5/bbl in 1QFY12.
Doubling petchem capacity RIL has announced downstream projects, with an estimated capex of USD11-12b,
which include (1) doubling of polyester capacity, (2) setting up of new 1.5mmtpaoff-gases based cracker, and (3) integrated gasification combined cycle (IGCC) project.
Polyester capacity will double post expansion and the units should start commissioningfrom 2013.
1QFY12 witnessed de-stocking due to volatile prices and fiscal tightening in China.However, 2H is likely to be better, led by seasonal factors like Diwali and Christmasdriving demand.
Shale gas production to ramp-up, BP's entry would accelerate E&P plans We believe that the recent tie-up with BP is a game changer event for RIL's E&P
plans, providing the best in-class technical support. This could lead to acceleratedbusiness ramp up over the next 2-3 years.
BP has already given USD2b (of the total USD7.2b) and is likely to give the remainingamount in two tranches. The first tranche is expected to come in the coming monthand the last by 3QFY12.
Of the three shale gas JVs, two have commenced production and the third is likelyto start production in the current quarter. Shale gas production should ramp upmeaningfully in the next few years.
Valuation and view Adjusted for treasury shares, RIL trades at 10.3x FY12E EPS of INR75.3. Our SOTP-based target price is INR1,025. Neutral.
Covering Analyst(s):Harshad Borawake+91 22 3982 [email protected]
YEAR NET SALES PAT EPS P/E ADJ. EPS*ADJ. P/E ADJ. P/B ROE ROCE EV/
END (INR B) (INR B) (INR) (X) (INR) (X) (X) (%) (%) EBITDA
03/10A 1,925 162 49.6 15.2 54.8 - - 13.4 - -
03/11A 2,482 203 62.0 12.2 68.4 11.1 1.6 14.8 12.9 7.5
03/12E 2,993 224 68.3 11.1 75.3 10.0 1.4 14.3 13.1 6.9
03/13E 2,670 240 73.2 10.3 80.8 9.4 1.1 12.7 12.2 6.1
Bloomberg RIL IN
Equity Shares (m) 3,274
CMP (INR) 756
Mcap (USD b) 54.1
52-Wk Range (INR) 1,187/722
1, 6, 12 Rel Perf (%) -1/-13/-12
Sector: Oil & Gas
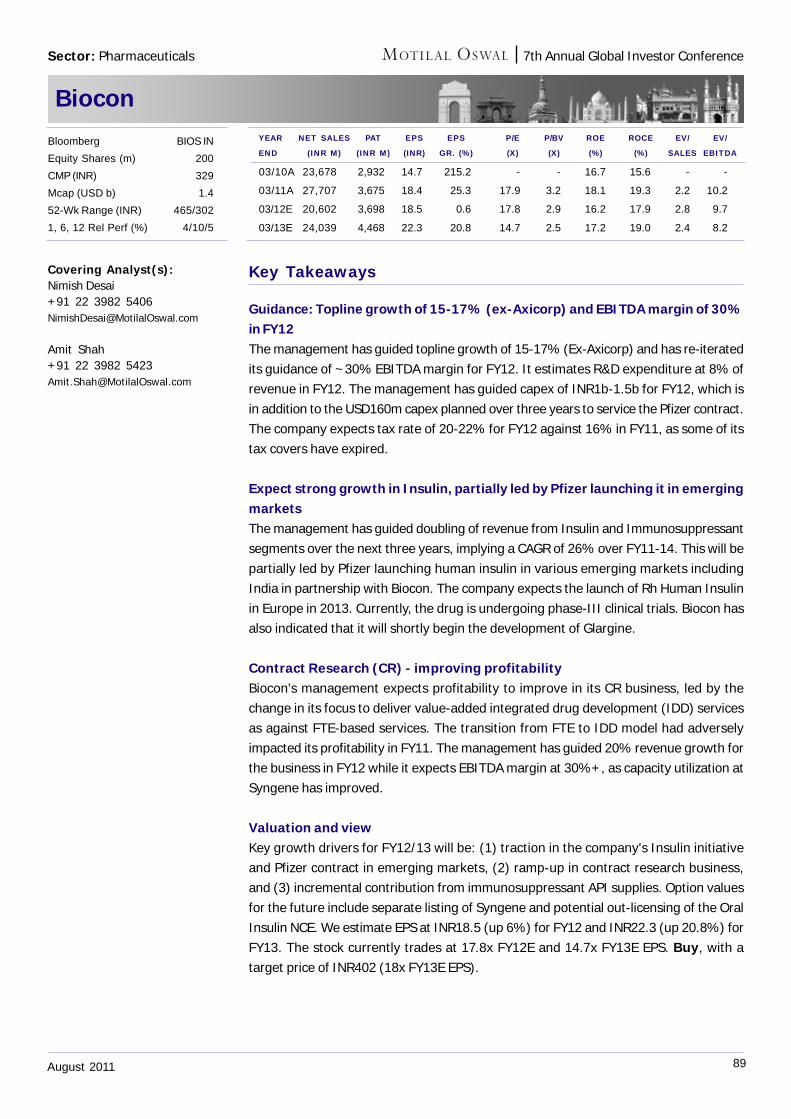
89August 2011
7th Annual Global Investor Conference
Biocon
Key Takeaways
Guidance: Topline growth of 15-17% (ex-Axicorp) and EBITDA margin of 30%in FY12The management has guided topline growth of 15-17% (Ex-Axicorp) and has re-iteratedits guidance of ~30% EBITDA margin for FY12. It estimates R&D expenditure at 8% ofrevenue in FY12. The management has guided capex of INR1b-1.5b for FY12, which isin addition to the USD160m capex planned over three years to service the Pfizer contract.The company expects tax rate of 20-22% for FY12 against 16% in FY11, as some of itstax covers have expired.
Expect strong growth in Insulin, partially led by Pfizer launching it in emergingmarketsThe management has guided doubling of revenue from Insulin and Immunosuppressantsegments over the next three years, implying a CAGR of 26% over FY11-14. This will bepartially led by Pfizer launching human insulin in various emerging markets includingIndia in partnership with Biocon. The company expects the launch of Rh Human Insulinin Europe in 2013. Currently, the drug is undergoing phase-III clinical trials. Biocon hasalso indicated that it will shortly begin the development of Glargine.
Contract Research (CR) - improving profitabilityBiocon's management expects profitability to improve in its CR business, led by thechange in its focus to deliver value-added integrated drug development (IDD) servicesas against FTE-based services. The transition from FTE to IDD model had adverselyimpacted its profitability in FY11. The management has guided 20% revenue growth forthe business in FY12 while it expects EBITDA margin at 30%+, as capacity utilization atSyngene has improved.
Valuation and viewKey growth drivers for FY12/13 will be: (1) traction in the company's Insulin initiativeand Pfizer contract in emerging markets, (2) ramp-up in contract research business,and (3) incremental contribution from immunosuppressant API supplies. Option valuesfor the future include separate listing of Syngene and potential out-licensing of the OralInsulin NCE. We estimate EPS at INR18.5 (up 6%) for FY12 and INR22.3 (up 20.8%) forFY13. The stock currently trades at 17.8x FY12E and 14.7x FY13E EPS. Buy, with atarget price of INR402 (18x FY13E EPS).
Covering Analyst(s):Nimish Desai+91 22 3982 [email protected]
Amit Shah+91 22 3982 [email protected]
YEAR NET SALES PAT EPS EPS P/E P/BV ROE ROCE EV/ EV/
END (INR M) (INR M) (INR) GR. (%) (X) (X) (%) (%) SALES EBITDA
03/10A 23,678 2,932 14.7 215.2 - - 16.7 15.6 - -
03/11A 27,707 3,675 18.4 25.3 17.9 3.2 18.1 19.3 2.2 10.2
03/12E 20,602 3,698 18.5 0.6 17.8 2.9 16.2 17.9 2.8 9.7
03/13E 24,039 4,468 22.3 20.8 14.7 2.5 17.2 19.0 2.4 8.2
Bloomberg BIOS IN
Equity Shares (m) 200
CMP (INR) 329
Mcap (USD b) 1.4
52-Wk Range (INR) 465/302
1, 6, 12 Rel Perf (%) 4/10/5
Sector: Pharmaceuticals
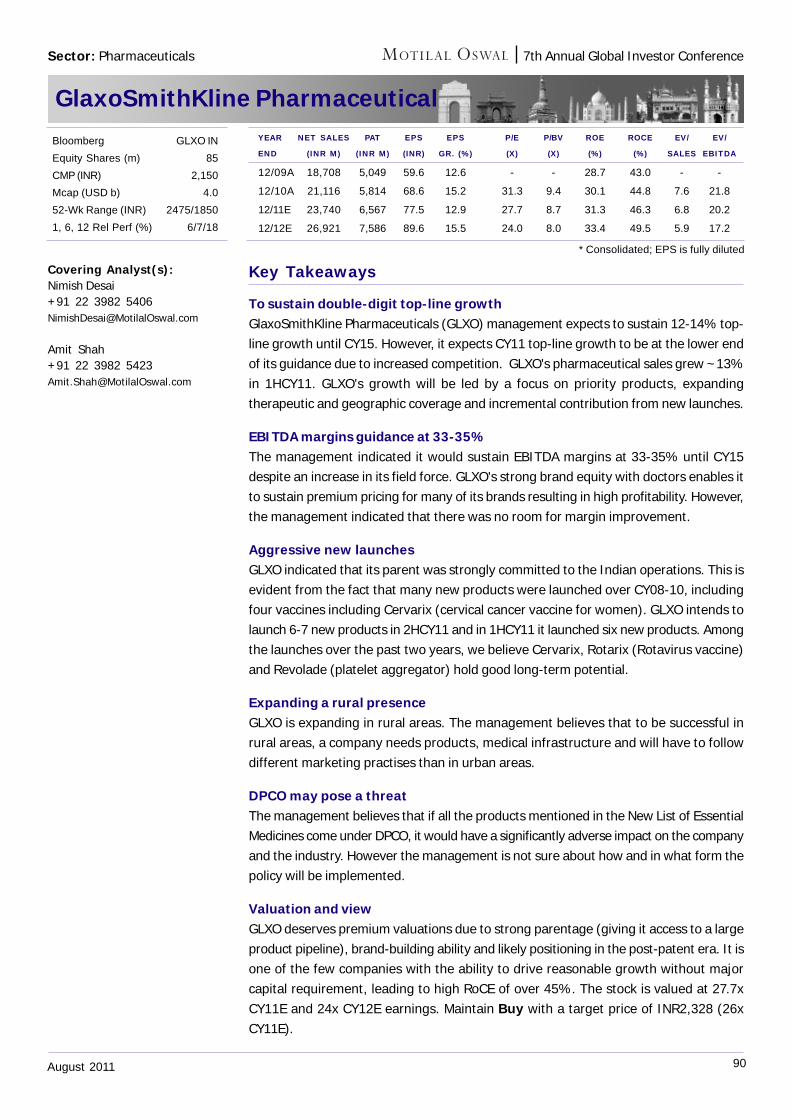
90August 2011
7th Annual Global Investor Conference
GlaxoSmithKline Pharmaceutical
Key Takeaways
To sustain double-digit top-line growthGlaxoSmithKline Pharmaceuticals (GLXO) management expects to sustain 12-14% top-line growth until CY15. However, it expects CY11 top-line growth to be at the lower endof its guidance due to increased competition. GLXO's pharmaceutical sales grew ~13%in 1HCY11. GLXO's growth will be led by a focus on priority products, expandingtherapeutic and geographic coverage and incremental contribution from new launches.
EBITDA margins guidance at 33-35%The management indicated it would sustain EBITDA margins at 33-35% until CY15despite an increase in its field force. GLXO's strong brand equity with doctors enables itto sustain premium pricing for many of its brands resulting in high profitability. However,the management indicated that there was no room for margin improvement.
Aggressive new launchesGLXO indicated that its parent was strongly committed to the Indian operations. This isevident from the fact that many new products were launched over CY08-10, includingfour vaccines including Cervarix (cervical cancer vaccine for women). GLXO intends tolaunch 6-7 new products in 2HCY11 and in 1HCY11 it launched six new products. Amongthe launches over the past two years, we believe Cervarix, Rotarix (Rotavirus vaccine)and Revolade (platelet aggregator) hold good long-term potential.
Expanding a rural presenceGLXO is expanding in rural areas. The management believes that to be successful inrural areas, a company needs products, medical infrastructure and will have to followdifferent marketing practises than in urban areas.
DPCO may pose a threatThe management believes that if all the products mentioned in the New List of EssentialMedicines come under DPCO, it would have a significantly adverse impact on the companyand the industry. However the management is not sure about how and in what form thepolicy will be implemented.
Valuation and viewGLXO deserves premium valuations due to strong parentage (giving it access to a largeproduct pipeline), brand-building ability and likely positioning in the post-patent era. It isone of the few companies with the ability to drive reasonable growth without majorcapital requirement, leading to high RoCE of over 45%. The stock is valued at 27.7xCY11E and 24x CY12E earnings. Maintain Buy with a target price of INR2,328 (26xCY11E).
Covering Analyst(s):Nimish Desai+91 22 3982 [email protected]
Amit Shah+91 22 3982 [email protected]
YEAR NET SALES PAT EPS EPS P/E P/BV ROE ROCE EV/ EV/
END (INR M) (INR M) (INR) GR. (%) (X) (X) (%) (%) SALES EBITDA
12/09A 18,708 5,049 59.6 12.6 - - 28.7 43.0 - -
12/10A 21,116 5,814 68.6 15.2 31.3 9.4 30.1 44.8 7.6 21.8
12/11E 23,740 6,567 77.5 12.9 27.7 8.7 31.3 46.3 6.8 20.2
12/12E 26,921 7,586 89.6 15.5 24.0 8.0 33.4 49.5 5.9 17.2
Bloomberg GLXO IN
Equity Shares (m) 85
CMP (INR) 2,150
Mcap (USD b) 4.0
52-Wk Range (INR) 2475/1850
1, 6, 12 Rel Perf (%) 6/7/18
* Consolidated; EPS is fully diluted
Sector: Pharmaceuticals
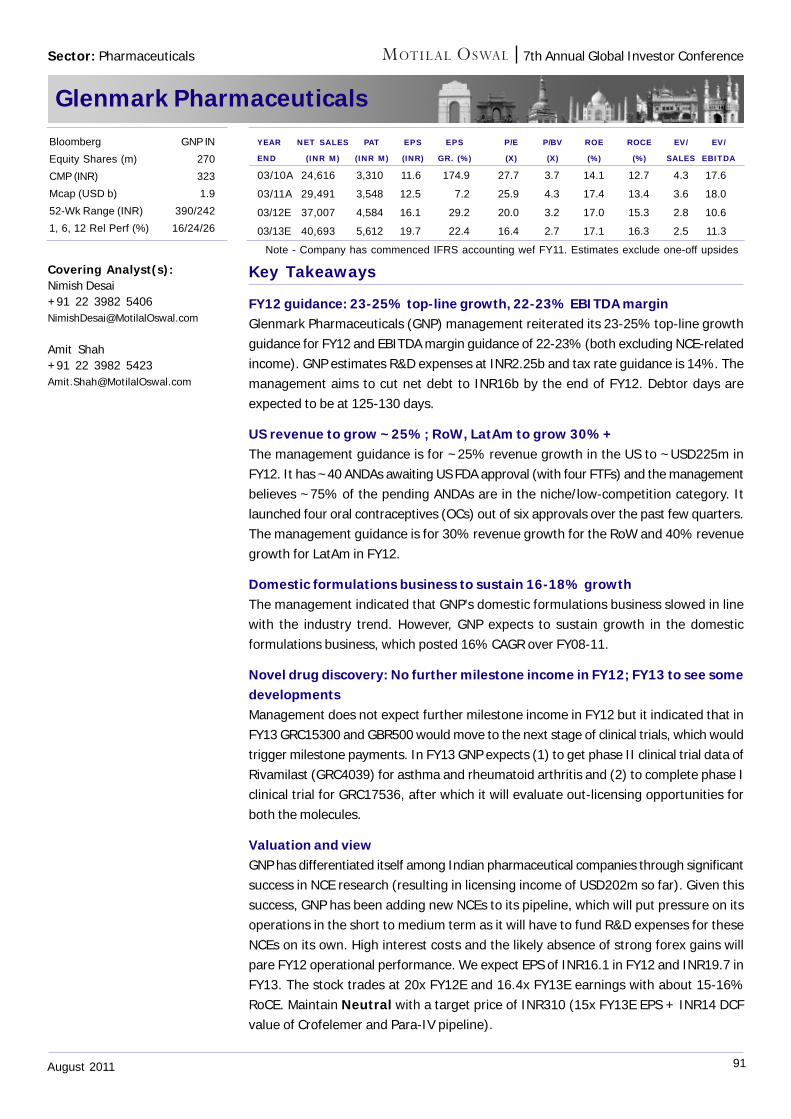
91August 2011
7th Annual Global Investor Conference
Glenmark Pharmaceuticals
Key Takeaways
FY12 guidance: 23-25% top-line growth, 22-23% EBITDA marginGlenmark Pharmaceuticals (GNP) management reiterated its 23-25% top-line growthguidance for FY12 and EBITDA margin guidance of 22-23% (both excluding NCE-relatedincome). GNP estimates R&D expenses at INR2.25b and tax rate guidance is 14%. Themanagement aims to cut net debt to INR16b by the end of FY12. Debtor days areexpected to be at 125-130 days.
US revenue to grow ~25%; RoW, LatAm to grow 30%+The management guidance is for ~25% revenue growth in the US to ~USD225m inFY12. It has ~40 ANDAs awaiting US FDA approval (with four FTFs) and the managementbelieves ~75% of the pending ANDAs are in the niche/low-competition category. Itlaunched four oral contraceptives (OCs) out of six approvals over the past few quarters.The management guidance is for 30% revenue growth for the RoW and 40% revenuegrowth for LatAm in FY12.
Domestic formulations business to sustain 16-18% growthThe management indicated that GNP's domestic formulations business slowed in linewith the industry trend. However, GNP expects to sustain growth in the domesticformulations business, which posted 16% CAGR over FY08-11.
Novel drug discovery: No further milestone income in FY12; FY13 to see somedevelopmentsManagement does not expect further milestone income in FY12 but it indicated that inFY13 GRC15300 and GBR500 would move to the next stage of clinical trials, which wouldtrigger milestone payments. In FY13 GNP expects (1) to get phase II clinical trial data ofRivamilast (GRC4039) for asthma and rheumatoid arthritis and (2) to complete phase Iclinical trial for GRC17536, after which it will evaluate out-licensing opportunities forboth the molecules.
Valuation and viewGNP has differentiated itself among Indian pharmaceutical companies through significantsuccess in NCE research (resulting in licensing income of USD202m so far). Given thissuccess, GNP has been adding new NCEs to its pipeline, which will put pressure on itsoperations in the short to medium term as it will have to fund R&D expenses for theseNCEs on its own. High interest costs and the likely absence of strong forex gains willpare FY12 operational performance. We expect EPS of INR16.1 in FY12 and INR19.7 inFY13. The stock trades at 20x FY12E and 16.4x FY13E earnings with about 15-16%RoCE. Maintain Neutral with a target price of INR310 (15x FY13E EPS + INR14 DCFvalue of Crofelemer and Para-IV pipeline).
Covering Analyst(s):Nimish Desai+91 22 3982 [email protected]
Amit Shah+91 22 3982 [email protected]
YEAR NET SALES PAT EPS EPS P/E P/BV ROE ROCE EV/ EV/
END (INR M) (INR M) (INR) GR. (%) (X) (X) (%) (%) SALES EBITDA
03/10A 24,616 3,310 11.6 174.9 27.7 3.7 14.1 12.7 4.3 17.6
03/11A 29,491 3,548 12.5 7.2 25.9 4.3 17.4 13.4 3.6 18.0
03/12E 37,007 4,584 16.1 29.2 20.0 3.2 17.0 15.3 2.8 10.6
03/13E 40,693 5,612 19.7 22.4 16.4 2.7 17.1 16.3 2.5 11.3
Note - Company has commenced IFRS accounting wef FY11. Estimates exclude one-off upsides
Bloomberg GNP IN
Equity Shares (m) 270
CMP (INR) 323
Mcap (USD b) 1.9
52-Wk Range (INR) 390/242
1, 6, 12 Rel Perf (%) 16/24/26
Sector: Pharmaceuticals
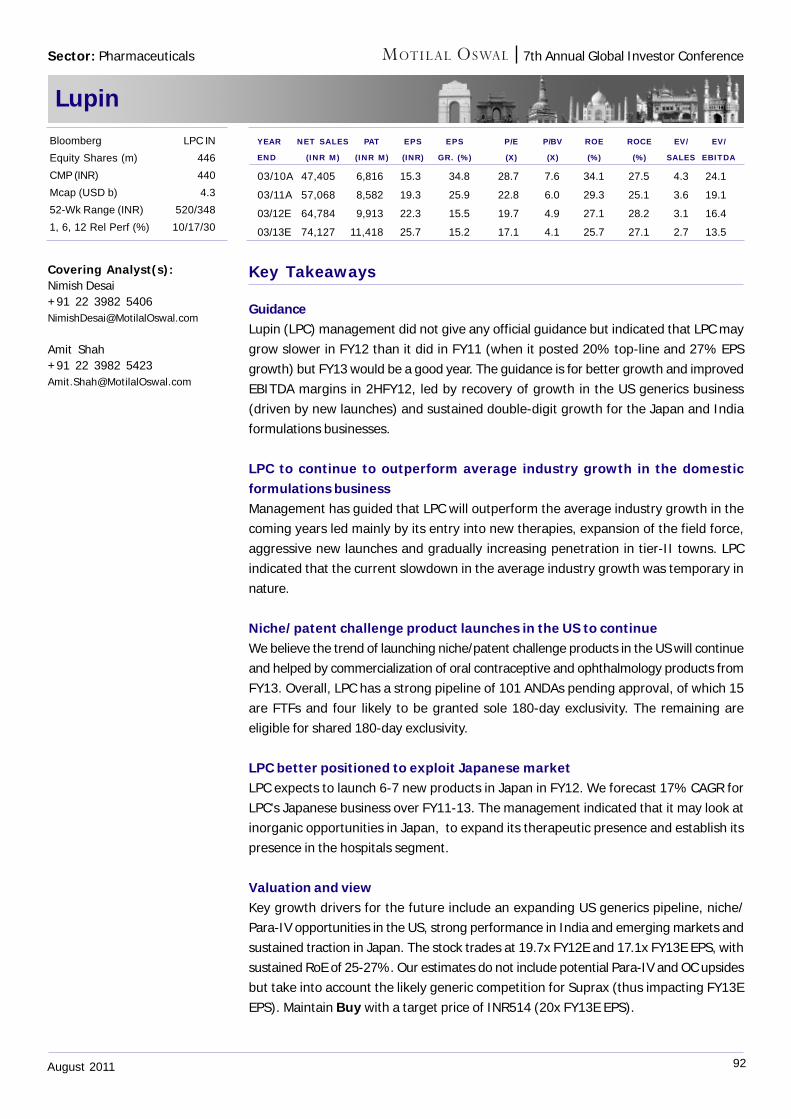
92August 2011
7th Annual Global Investor Conference
Lupin
Key Takeaways
GuidanceLupin (LPC) management did not give any official guidance but indicated that LPC maygrow slower in FY12 than it did in FY11 (when it posted 20% top-line and 27% EPSgrowth) but FY13 would be a good year. The guidance is for better growth and improvedEBITDA margins in 2HFY12, led by recovery of growth in the US generics business(driven by new launches) and sustained double-digit growth for the Japan and Indiaformulations businesses.
LPC to continue to outperform average industry growth in the domesticformulations businessManagement has guided that LPC will outperform the average industry growth in thecoming years led mainly by its entry into new therapies, expansion of the field force,aggressive new launches and gradually increasing penetration in tier-II towns. LPCindicated that the current slowdown in the average industry growth was temporary innature.
Niche/patent challenge product launches in the US to continueWe believe the trend of launching niche/patent challenge products in the US will continueand helped by commercialization of oral contraceptive and ophthalmology products fromFY13. Overall, LPC has a strong pipeline of 101 ANDAs pending approval, of which 15are FTFs and four likely to be granted sole 180-day exclusivity. The remaining areeligible for shared 180-day exclusivity.
LPC better positioned to exploit Japanese marketLPC expects to launch 6-7 new products in Japan in FY12. We forecast 17% CAGR forLPC's Japanese business over FY11-13. The management indicated that it may look atinorganic opportunities in Japan, to expand its therapeutic presence and establish itspresence in the hospitals segment.
Valuation and viewKey growth drivers for the future include an expanding US generics pipeline, niche/Para-IV opportunities in the US, strong performance in India and emerging markets andsustained traction in Japan. The stock trades at 19.7x FY12E and 17.1x FY13E EPS, withsustained RoE of 25-27%. Our estimates do not include potential Para-IV and OC upsidesbut take into account the likely generic competition for Suprax (thus impacting FY13EEPS). Maintain Buy with a target price of INR514 (20x FY13E EPS).
Covering Analyst(s):Nimish Desai+91 22 3982 [email protected]
Amit Shah+91 22 3982 [email protected]
YEAR NET SALES PAT EPS EPS P/E P/BV ROE ROCE EV/ EV/
END (INR M) (INR M) (INR) GR. (%) (X) (X) (%) (%) SALES EBITDA
03/10A 47,405 6,816 15.3 34.8 28.7 7.6 34.1 27.5 4.3 24.1
03/11A 57,068 8,582 19.3 25.9 22.8 6.0 29.3 25.1 3.6 19.1
03/12E 64,784 9,913 22.3 15.5 19.7 4.9 27.1 28.2 3.1 16.4
03/13E 74,127 11,418 25.7 15.2 17.1 4.1 25.7 27.1 2.7 13.5
Bloomberg LPC IN
Equity Shares (m) 446
CMP (INR) 440
Mcap (USD b) 4.3
52-Wk Range (INR) 520/348
1, 6, 12 Rel Perf (%) 10/17/30
Sector: Pharmaceuticals
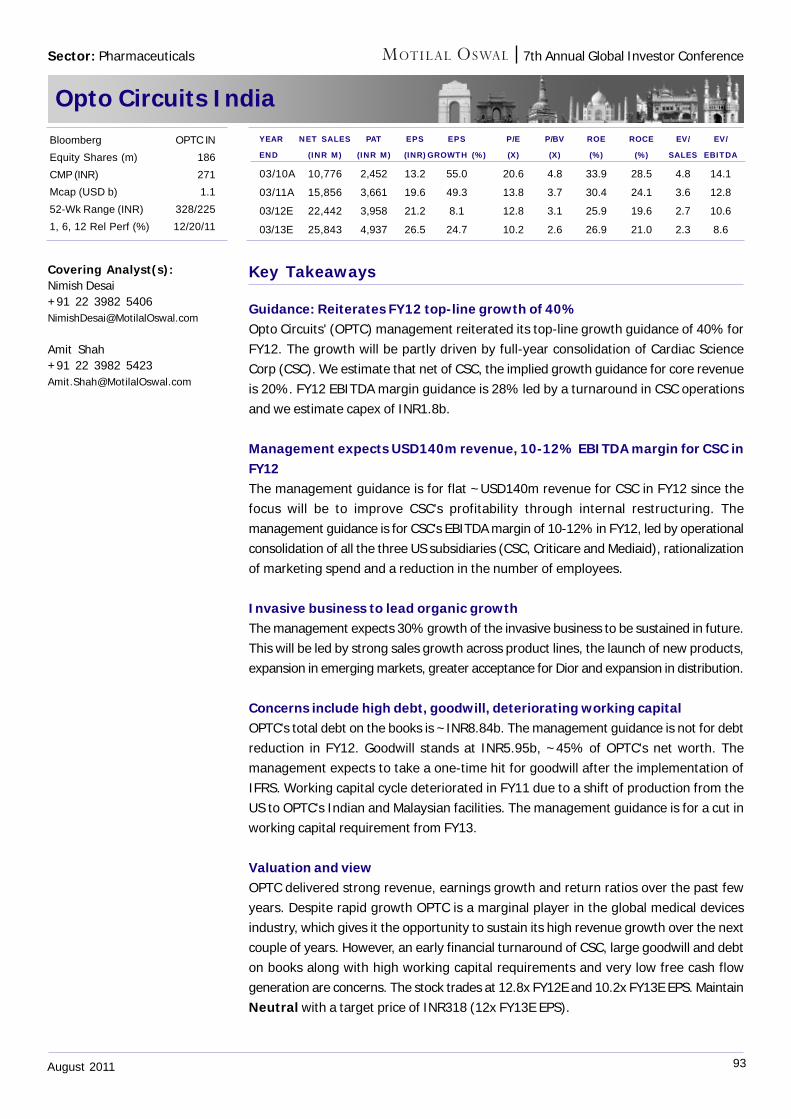
93August 2011
7th Annual Global Investor Conference
Opto Circuits India
Key Takeaways
Guidance: Reiterates FY12 top-line growth of 40%Opto Circuits' (OPTC) management reiterated its top-line growth guidance of 40% forFY12. The growth will be partly driven by full-year consolidation of Cardiac ScienceCorp (CSC). We estimate that net of CSC, the implied growth guidance for core revenueis 20%. FY12 EBITDA margin guidance is 28% led by a turnaround in CSC operationsand we estimate capex of INR1.8b.
Management expects USD140m revenue, 10-12% EBITDA margin for CSC inFY12The management guidance is for flat ~USD140m revenue for CSC in FY12 since thefocus will be to improve CSC's profitability through internal restructuring. Themanagement guidance is for CSC's EBITDA margin of 10-12% in FY12, led by operationalconsolidation of all the three US subsidiaries (CSC, Criticare and Mediaid), rationalizationof marketing spend and a reduction in the number of employees.
Invasive business to lead organic growthThe management expects 30% growth of the invasive business to be sustained in future.This will be led by strong sales growth across product lines, the launch of new products,expansion in emerging markets, greater acceptance for Dior and expansion in distribution.
Concerns include high debt, goodwill, deteriorating working capitalOPTC's total debt on the books is ~INR8.84b. The management guidance is not for debtreduction in FY12. Goodwill stands at INR5.95b, ~45% of OPTC's net worth. Themanagement expects to take a one-time hit for goodwill after the implementation ofIFRS. Working capital cycle deteriorated in FY11 due to a shift of production from theUS to OPTC's Indian and Malaysian facilities. The management guidance is for a cut inworking capital requirement from FY13.
Valuation and viewOPTC delivered strong revenue, earnings growth and return ratios over the past fewyears. Despite rapid growth OPTC is a marginal player in the global medical devicesindustry, which gives it the opportunity to sustain its high revenue growth over the nextcouple of years. However, an early financial turnaround of CSC, large goodwill and debton books along with high working capital requirements and very low free cash flowgeneration are concerns. The stock trades at 12.8x FY12E and 10.2x FY13E EPS. MaintainNeutral with a target price of INR318 (12x FY13E EPS).
Covering Analyst(s):Nimish Desai+91 22 3982 [email protected]
Amit Shah+91 22 3982 [email protected]
YEAR NET SALES PAT EPS EPS P/E P/BV ROE ROCE EV/ EV/
END (INR M) (INR M) (INR) GROWTH (%) (X) (X) (%) (%) SALES EBITDA
03/10A 10,776 2,452 13.2 55.0 20.6 4.8 33.9 28.5 4.8 14.1
03/11A 15,856 3,661 19.6 49.3 13.8 3.7 30.4 24.1 3.6 12.8
03/12E 22,442 3,958 21.2 8.1 12.8 3.1 25.9 19.6 2.7 10.6
03/13E 25,843 4,937 26.5 24.7 10.2 2.6 26.9 21.0 2.3 8.6
Bloomberg OPTC IN
Equity Shares (m) 186
CMP (INR) 271
Mcap (USD b) 1.1
52-Wk Range (INR) 328/225
1, 6, 12 Rel Perf (%) 12/20/11
Sector: Pharmaceuticals
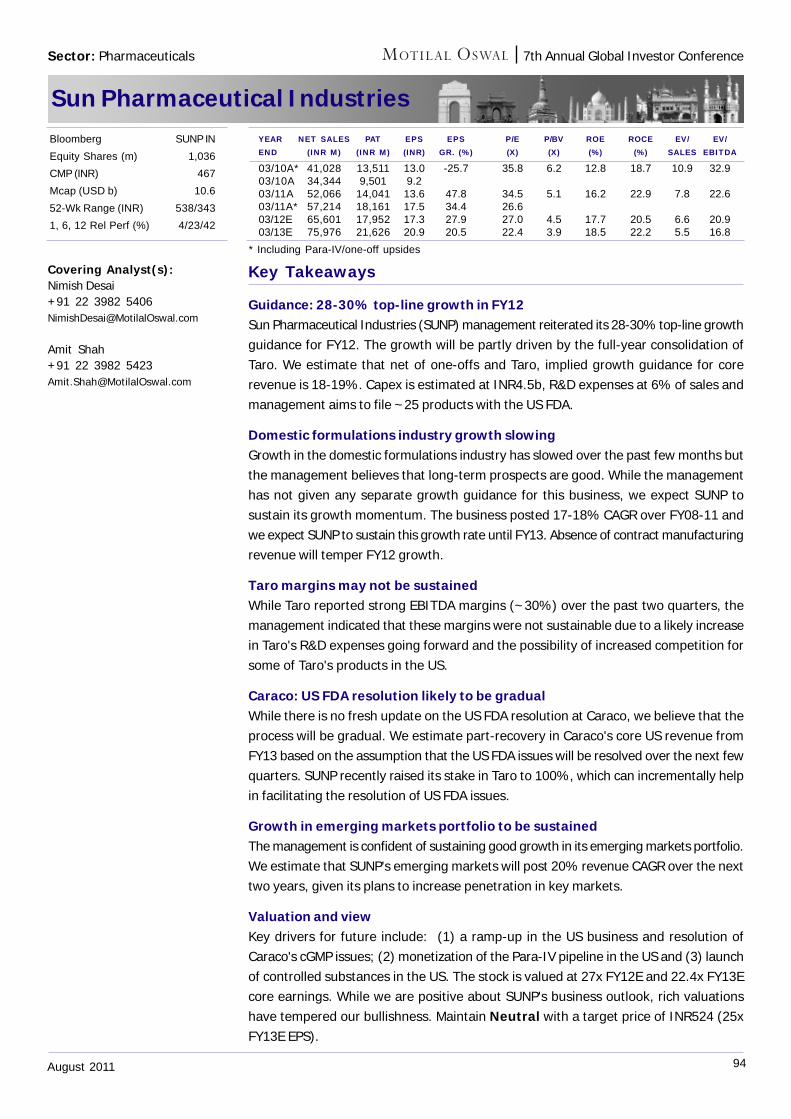
94August 2011
7th Annual Global Investor Conference
Sun Pharmaceutical Industries
Key Takeaways
Guidance: 28-30% top-line growth in FY12Sun Pharmaceutical Industries (SUNP) management reiterated its 28-30% top-line growthguidance for FY12. The growth will be partly driven by the full-year consolidation ofTaro. We estimate that net of one-offs and Taro, implied growth guidance for corerevenue is 18-19%. Capex is estimated at INR4.5b, R&D expenses at 6% of sales andmanagement aims to file ~25 products with the US FDA.
Domestic formulations industry growth slowingGrowth in the domestic formulations industry has slowed over the past few months butthe management believes that long-term prospects are good. While the managementhas not given any separate growth guidance for this business, we expect SUNP tosustain its growth momentum. The business posted 17-18% CAGR over FY08-11 andwe expect SUNP to sustain this growth rate until FY13. Absence of contract manufacturingrevenue will temper FY12 growth.
Taro margins may not be sustainedWhile Taro reported strong EBITDA margins (~30%) over the past two quarters, themanagement indicated that these margins were not sustainable due to a likely increasein Taro's R&D expenses going forward and the possibility of increased competition forsome of Taro's products in the US.
Caraco: US FDA resolution likely to be gradualWhile there is no fresh update on the US FDA resolution at Caraco, we believe that theprocess will be gradual. We estimate part-recovery in Caraco's core US revenue fromFY13 based on the assumption that the US FDA issues will be resolved over the next fewquarters. SUNP recently raised its stake in Taro to 100%, which can incrementally helpin facilitating the resolution of US FDA issues.
Growth in emerging markets portfolio to be sustainedThe management is confident of sustaining good growth in its emerging markets portfolio.We estimate that SUNP's emerging markets will post 20% revenue CAGR over the nexttwo years, given its plans to increase penetration in key markets.
Valuation and viewKey drivers for future include: (1) a ramp-up in the US business and resolution ofCaraco's cGMP issues; (2) monetization of the Para-IV pipeline in the US and (3) launchof controlled substances in the US. The stock is valued at 27x FY12E and 22.4x FY13Ecore earnings. While we are positive about SUNP's business outlook, rich valuationshave tempered our bullishness. Maintain Neutral with a target price of INR524 (25xFY13E EPS).
Covering Analyst(s):Nimish Desai+91 22 3982 [email protected]
Amit Shah+91 22 3982 [email protected]
YEAR NET SALES PAT EPS EPS P/E P/BV ROE ROCE EV/ EV/END (INR M) (INR M) (INR) GR. (%) (X) (X) (%) (%) SALES EBITDA
03/10A* 41,028 13,511 13.0 -25.7 35.8 6.2 12.8 18.7 10.9 32.903/10A 34,344 9,501 9.203/11A 52,066 14,041 13.6 47.8 34.5 5.1 16.2 22.9 7.8 22.603/11A* 57,214 18,161 17.5 34.4 26.603/12E 65,601 17,952 17.3 27.9 27.0 4.5 17.7 20.5 6.6 20.903/13E 75,976 21,626 20.9 20.5 22.4 3.9 18.5 22.2 5.5 16.8
Bloomberg SUNP IN
Equity Shares (m) 1,036
CMP (INR) 467
Mcap (USD b) 10.6
52-Wk Range (INR) 538/343
1, 6, 12 Rel Perf (%) 4/23/42
Sector: Pharmaceuticals
* Including Para-IV/one-off upsides
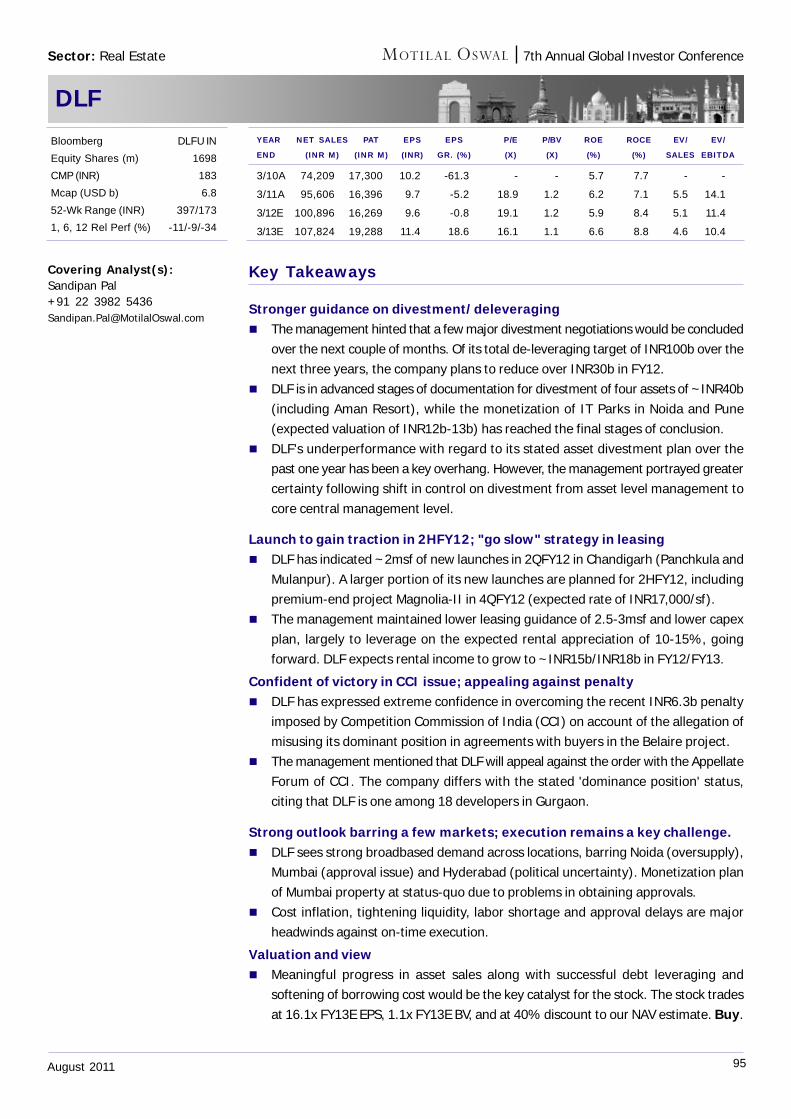
95August 2011
7th Annual Global Investor Conference
DLF
Key Takeaways
Stronger guidance on divestment/deleveraging The management hinted that a few major divestment negotiations would be concluded
over the next couple of months. Of its total de-leveraging target of INR100b over thenext three years, the company plans to reduce over INR30b in FY12.
DLF is in advanced stages of documentation for divestment of four assets of ~INR40b(including Aman Resort), while the monetization of IT Parks in Noida and Pune(expected valuation of INR12b-13b) has reached the final stages of conclusion.
DLF's underperformance with regard to its stated asset divestment plan over thepast one year has been a key overhang. However, the management portrayed greatercertainty following shift in control on divestment from asset level management tocore central management level.
Launch to gain traction in 2HFY12; "go slow" strategy in leasing DLF has indicated ~2msf of new launches in 2QFY12 in Chandigarh (Panchkula and
Mulanpur). A larger portion of its new launches are planned for 2HFY12, includingpremium-end project Magnolia-II in 4QFY12 (expected rate of INR17,000/sf).
The management maintained lower leasing guidance of 2.5-3msf and lower capexplan, largely to leverage on the expected rental appreciation of 10-15%, goingforward. DLF expects rental income to grow to ~INR15b/INR18b in FY12/FY13.
Confident of victory in CCI issue; appealing against penalty DLF has expressed extreme confidence in overcoming the recent INR6.3b penalty
imposed by Competition Commission of India (CCI) on account of the allegation ofmisusing its dominant position in agreements with buyers in the Belaire project.
The management mentioned that DLF will appeal against the order with the AppellateForum of CCI. The company differs with the stated 'dominance position' status,citing that DLF is one among 18 developers in Gurgaon.
Strong outlook barring a few markets; execution remains a key challenge. DLF sees strong broadbased demand across locations, barring Noida (oversupply),
Mumbai (approval issue) and Hyderabad (political uncertainty). Monetization planof Mumbai property at status-quo due to problems in obtaining approvals.
Cost inflation, tightening liquidity, labor shortage and approval delays are majorheadwinds against on-time execution.
Valuation and view Meaningful progress in asset sales along with successful debt leveraging and
softening of borrowing cost would be the key catalyst for the stock. The stock tradesat 16.1x FY13E EPS, 1.1x FY13E BV, and at 40% discount to our NAV estimate. Buy.
Covering Analyst(s):Sandipan Pal+91 22 3982 [email protected]
YEAR NET SALES PAT EPS EPS P/E P/BV ROE ROCE EV/ EV/
END (INR M) (INR M) (INR) GR. (%) (X) (X) (%) (%) SALES EBITDA
3/10A 74,209 17,300 10.2 -61.3 - - 5.7 7.7 - -
3/11A 95,606 16,396 9.7 -5.2 18.9 1.2 6.2 7.1 5.5 14.1
3/12E 100,896 16,269 9.6 -0.8 19.1 1.2 5.9 8.4 5.1 11.4
3/13E 107,824 19,288 11.4 18.6 16.1 1.1 6.6 8.8 4.6 10.4
Bloomberg DLFU IN
Equity Shares (m) 1698
CMP (INR) 183
Mcap (USD b) 6.8
52-Wk Range (INR) 397/173
1, 6, 12 Rel Perf (%) -11/-9/-34
Sector: Real Estate
96August 2011
7th Annual Global Investor Conference
Jones Lang LaSalle
Key Takeaways
Long term macro story intact amid headwinds; JLL expects demand for industryregulator to gain ground Strong outlook of Indian economy with real GDP growth rate of 8-8.5% over the
next five years is the biggest demand driver of the real estate sector in India. The staggering growth potential is also evident from the fact that the value of
investments made in real estate under construction crossed USD100b, ~66% devotedto the residential vertical, ~25% to the commercial and rest to the retail vertical.
However there are operational and regulatory hurdles such as (a) infrastructuredelays, (b) cost inflation, (c) lack of mechanization and skilled labor to supporttimely execution of plans, (c) absence of proper regulatory framework, and (d)spiraling liquidity pressure. Apathy among government and institutional lenders anddelayed approvals have been other recent headwinds.
Residential sales, new launches slow; no major price correction expectedRising residential property prices led to the stabilization of overall absorption rates
from 17.5% in 1QFY11 to 14.6% in 2QFY11. With several delays in approval andplummeting sales, the momentum in new launches has also declined, with Chennaibeing the only city to register a rise in new launches in 2QFY11.
Pune and NCR-Delhi led cities in terms of absorption rate recorded in 2QFY11,followed by Chennai and Kolkata. Mumbai recorded the lowest absorption rate.
Key metros are unlikely to witness a major price correction. Buyer interest willresume in Mumbai with moderate price correction for a brief period.
Commercial revival evident in metros; Occupier's market on supply overhang Demand of office space is gradually improving with opportunistic tenants taking up
space at lower rentals. Net absorption to grow from 31msf in 2010, to 36msf and41msf in 2011 and 2012. CBDs of key metros witnessed moderate rental up-tick.
Despite improving demand, vacancies are rising in the short term due to infusion ofoffice space, indicating ~50msf of unsold stock by the end of 2011. The vacancy isexpected to rise to 22.9% by the end of 2012 and then fall in 2013. NCR and Mumbaiwill witness maximum supply, while Bangalore will witness lowest vacancy of 13%.
The IT/ITES sector is the biggest demand driver followed by the manufacturing andBFSI sectors, which together account for 60-70% of office demand.
The recorded spread of 70-80bp between rental yields in CBDs and those of SBDsand suburbs exists due to risks of a huge supply overhang expected in secondaryand suburban locations.
Oversupply, poor planning, inferior location lead to higher vacancies Inferior floor planning, poor execution and location choice resulted in a dearth of
quality supply in the retail space. Therefore, while absorption has picked up in city-centric, well executed projects, a supply overhang will keep its natural vacancylevel under pressure at over 25%.
Annual absorption is expected to increase to 12msf (4.7msf absorbed in 1H11 andanother 4.2msf pre-committed) against 4msf in 2010.
Supply is expected to witness strong rationalization after 2013 with several developersplanning to exit the retail vertical due to the complexity of execution and management.
Covering Analyst(s):Sandipan Pal+91 22 3982 [email protected]
Sector: Real Estate
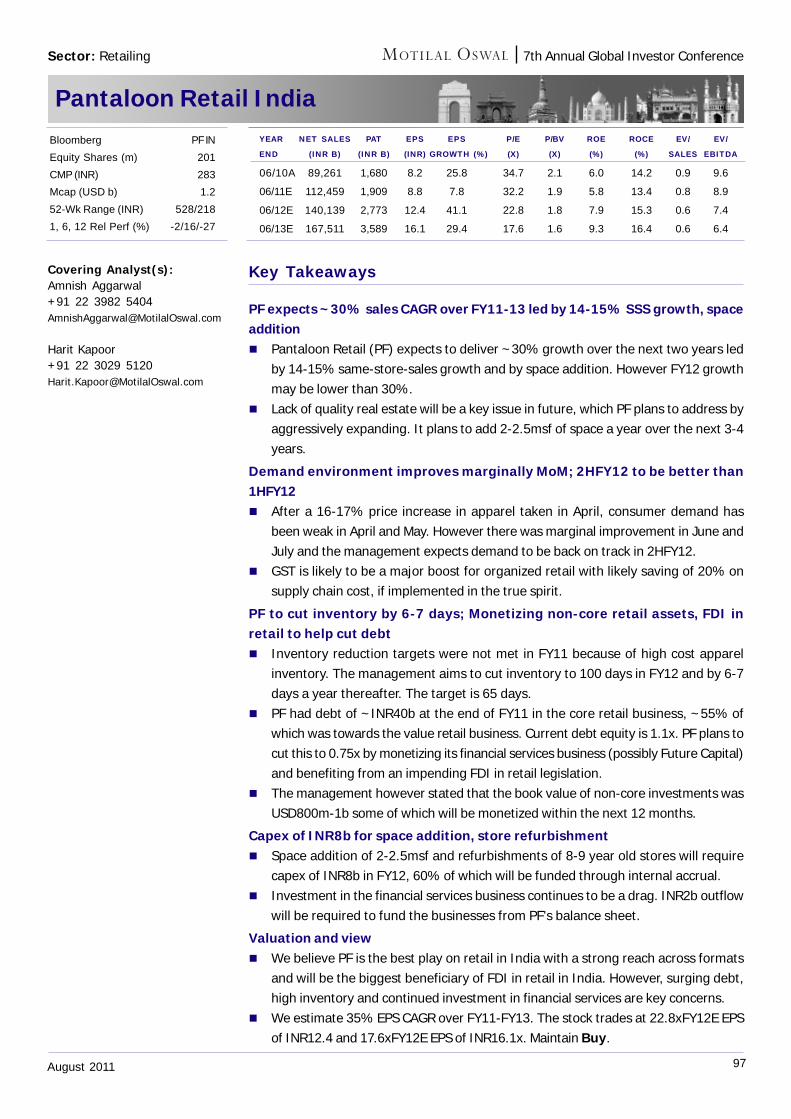
97August 2011
7th Annual Global Investor Conference
Pantaloon Retail India
Key Takeaways
PF expects ~30% sales CAGR over FY11-13 led by 14-15% SSS growth, spaceaddition Pantaloon Retail (PF) expects to deliver ~30% growth over the next two years led
by 14-15% same-store-sales growth and by space addition. However FY12 growthmay be lower than 30%.
Lack of quality real estate will be a key issue in future, which PF plans to address byaggressively expanding. It plans to add 2-2.5msf of space a year over the next 3-4years.
Demand environment improves marginally MoM; 2HFY12 to be better than1HFY12 After a 16-17% price increase in apparel taken in April, consumer demand has
been weak in April and May. However there was marginal improvement in June andJuly and the management expects demand to be back on track in 2HFY12.
GST is likely to be a major boost for organized retail with likely saving of 20% onsupply chain cost, if implemented in the true spirit.
PF to cut inventory by 6-7 days; Monetizing non-core retail assets, FDI inretail to help cut debt Inventory reduction targets were not met in FY11 because of high cost apparel
inventory. The management aims to cut inventory to 100 days in FY12 and by 6-7days a year thereafter. The target is 65 days.
PF had debt of ~INR40b at the end of FY11 in the core retail business, ~55% ofwhich was towards the value retail business. Current debt equity is 1.1x. PF plans tocut this to 0.75x by monetizing its financial services business (possibly Future Capital)and benefiting from an impending FDI in retail legislation.
The management however stated that the book value of non-core investments wasUSD800m-1b some of which will be monetized within the next 12 months.
Capex of INR8b for space addition, store refurbishment Space addition of 2-2.5msf and refurbishments of 8-9 year old stores will require
capex of INR8b in FY12, 60% of which will be funded through internal accrual. Investment in the financial services business continues to be a drag. INR2b outflow
will be required to fund the businesses from PF's balance sheet.
Valuation and view We believe PF is the best play on retail in India with a strong reach across formats
and will be the biggest beneficiary of FDI in retail in India. However, surging debt,high inventory and continued investment in financial services are key concerns.
We estimate 35% EPS CAGR over FY11-FY13. The stock trades at 22.8xFY12E EPSof INR12.4 and 17.6xFY12E EPS of INR16.1x. Maintain Buy.
Covering Analyst(s):Amnish Aggarwal+91 22 3982 [email protected]
Harit Kapoor+91 22 3029 [email protected]
Bloomberg PF IN
Equity Shares (m) 201
CMP (INR) 283
Mcap (USD b) 1.2
52-Wk Range (INR) 528/218
1, 6, 12 Rel Perf (%) -2/16/-27
Sector: Retailing
YEAR NET SALES PAT EPS EPS P/E P/BV ROE ROCE EV/ EV/
END (INR B) (INR B) (INR) GROWTH (%) (X) (X) (%) (%) SALES EBITDA
06/10A 89,261 1,680 8.2 25.8 34.7 2.1 6.0 14.2 0.9 9.6
06/11E 112,459 1,909 8.8 7.8 32.2 1.9 5.8 13.4 0.8 8.9
06/12E 140,139 2,773 12.4 41.1 22.8 1.8 7.9 15.3 0.6 7.4
06/13E 167,511 3,589 16.1 29.4 17.6 1.6 9.3 16.4 0.6 6.4
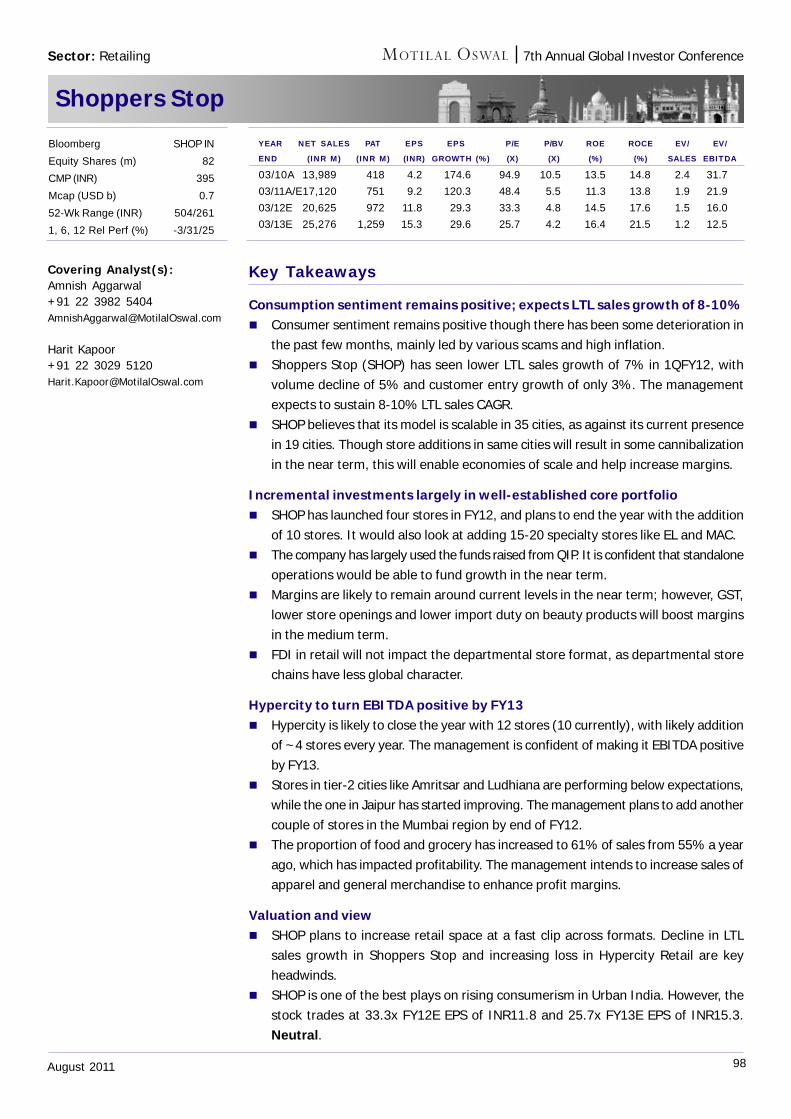
98August 2011
7th Annual Global Investor Conference
Shoppers Stop
Key Takeaways
Consumption sentiment remains positive; expects LTL sales growth of 8-10% Consumer sentiment remains positive though there has been some deterioration in
the past few months, mainly led by various scams and high inflation. Shoppers Stop (SHOP) has seen lower LTL sales growth of 7% in 1QFY12, with
volume decline of 5% and customer entry growth of only 3%. The managementexpects to sustain 8-10% LTL sales CAGR.
SHOP believes that its model is scalable in 35 cities, as against its current presencein 19 cities. Though store additions in same cities will result in some cannibalizationin the near term, this will enable economies of scale and help increase margins.
Incremental investments largely in well-established core portfolio SHOP has launched four stores in FY12, and plans to end the year with the addition
of 10 stores. It would also look at adding 15-20 specialty stores like EL and MAC. The company has largely used the funds raised from QIP. It is confident that standalone
operations would be able to fund growth in the near term. Margins are likely to remain around current levels in the near term; however, GST,
lower store openings and lower import duty on beauty products will boost marginsin the medium term.
FDI in retail will not impact the departmental store format, as departmental storechains have less global character.
Hypercity to turn EBITDA positive by FY13 Hypercity is likely to close the year with 12 stores (10 currently), with likely addition
of ~4 stores every year. The management is confident of making it EBITDA positiveby FY13.
Stores in tier-2 cities like Amritsar and Ludhiana are performing below expectations,while the one in Jaipur has started improving. The management plans to add anothercouple of stores in the Mumbai region by end of FY12.
The proportion of food and grocery has increased to 61% of sales from 55% a yearago, which has impacted profitability. The management intends to increase sales ofapparel and general merchandise to enhance profit margins.
Valuation and view SHOP plans to increase retail space at a fast clip across formats. Decline in LTL
sales growth in Shoppers Stop and increasing loss in Hypercity Retail are keyheadwinds.
SHOP is one of the best plays on rising consumerism in Urban India. However, thestock trades at 33.3x FY12E EPS of INR11.8 and 25.7x FY13E EPS of INR15.3.Neutral.
Covering Analyst(s):Amnish Aggarwal+91 22 3982 [email protected]
Harit Kapoor+91 22 3029 [email protected]
YEAR NET SALES PAT EPS EPS P/E P/BV ROE ROCE EV/ EV/
END (INR M) (INR M) (INR) GROWTH (%) (X) (X) (%) (%) SALES EBITDA
03/10A 13,989 418 4.2 174.6 94.9 10.5 13.5 14.8 2.4 31.7
03/11A/E17,120 751 9.2 120.3 48.4 5.5 11.3 13.8 1.9 21.9
03/12E 20,625 972 11.8 29.3 33.3 4.8 14.5 17.6 1.5 16.0
03/13E 25,276 1,259 15.3 29.6 25.7 4.2 16.4 21.5 1.2 12.5
Bloomberg SHOP IN
Equity Shares (m) 82
CMP (INR) 395
Mcap (USD b) 0.7
52-Wk Range (INR) 504/261
1, 6, 12 Rel Perf (%) -3/31/25
Sector: Retailing
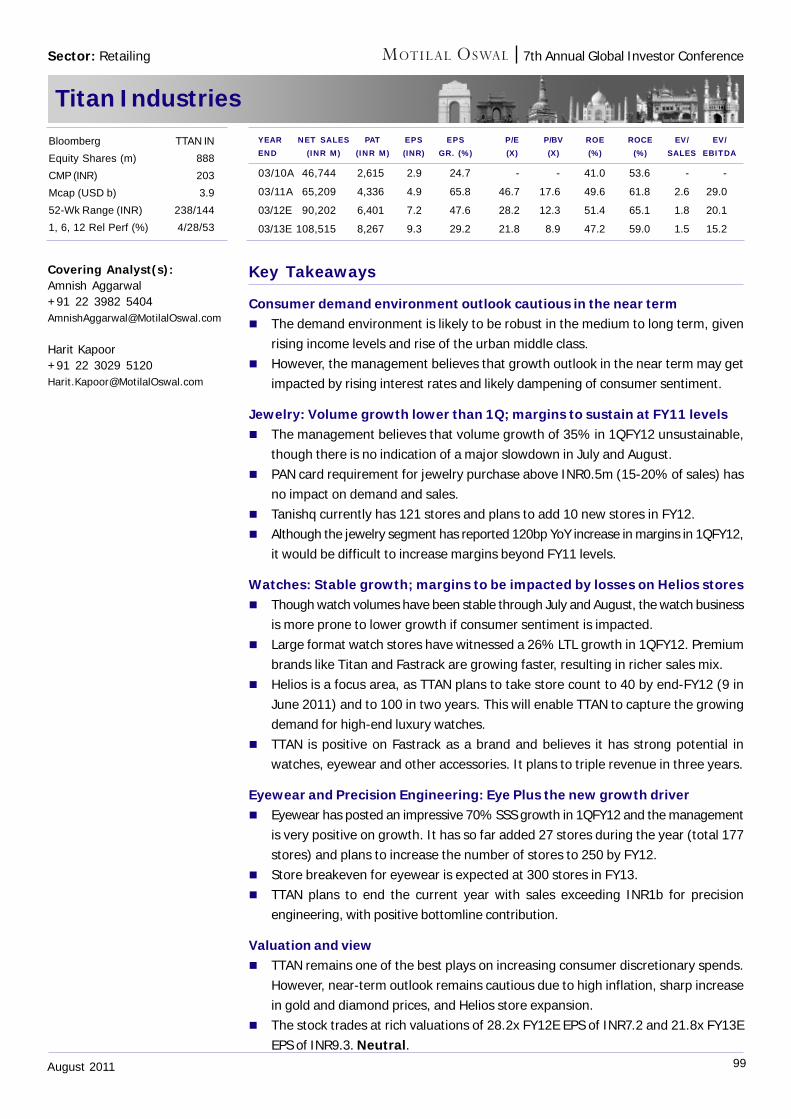
99August 2011
7th Annual Global Investor Conference
Titan Industries
Covering Analyst(s):Amnish Aggarwal+91 22 3982 [email protected]
Harit Kapoor+91 22 3029 [email protected]
YEAR NET SALES PAT EPS EPS P/E P/BV ROE ROCE EV/ EV/END (INR M) (INR M) (INR) GR. (%) (X) (X) (%) (%) SALES EBITDA
03/10A 46,744 2,615 2.9 24.7 - - 41.0 53.6 - -
03/11A 65,209 4,336 4.9 65.8 46.7 17.6 49.6 61.8 2.6 29.0
03/12E 90,202 6,401 7.2 47.6 28.2 12.3 51.4 65.1 1.8 20.1
03/13E 108,515 8,267 9.3 29.2 21.8 8.9 47.2 59.0 1.5 15.2
Bloomberg TTAN IN
Equity Shares (m) 888
CMP (INR) 203
Mcap (USD b) 3.9
52-Wk Range (INR) 238/144
1, 6, 12 Rel Perf (%) 4/28/53
Sector: Retailing
Key Takeaways
Consumer demand environment outlook cautious in the near term The demand environment is likely to be robust in the medium to long term, given
rising income levels and rise of the urban middle class. However, the management believes that growth outlook in the near term may get
impacted by rising interest rates and likely dampening of consumer sentiment.
Jewelry: Volume growth lower than 1Q; margins to sustain at FY11 levels The management believes that volume growth of 35% in 1QFY12 unsustainable,
though there is no indication of a major slowdown in July and August. PAN card requirement for jewelry purchase above INR0.5m (15-20% of sales) has
no impact on demand and sales. Tanishq currently has 121 stores and plans to add 10 new stores in FY12. Although the jewelry segment has reported 120bp YoY increase in margins in 1QFY12,
it would be difficult to increase margins beyond FY11 levels.
Watches: Stable growth; margins to be impacted by losses on Helios stores Though watch volumes have been stable through July and August, the watch business
is more prone to lower growth if consumer sentiment is impacted. Large format watch stores have witnessed a 26% LTL growth in 1QFY12. Premium
brands like Titan and Fastrack are growing faster, resulting in richer sales mix. Helios is a focus area, as TTAN plans to take store count to 40 by end-FY12 (9 in
June 2011) and to 100 in two years. This will enable TTAN to capture the growingdemand for high-end luxury watches.
TTAN is positive on Fastrack as a brand and believes it has strong potential inwatches, eyewear and other accessories. It plans to triple revenue in three years.
Eyewear and Precision Engineering: Eye Plus the new growth driver Eyewear has posted an impressive 70% SSS growth in 1QFY12 and the management
is very positive on growth. It has so far added 27 stores during the year (total 177stores) and plans to increase the number of stores to 250 by FY12.
Store breakeven for eyewear is expected at 300 stores in FY13. TTAN plans to end the current year with sales exceeding INR1b for precision
engineering, with positive bottomline contribution.
Valuation and view TTAN remains one of the best plays on increasing consumer discretionary spends.
However, near-term outlook remains cautious due to high inflation, sharp increasein gold and diamond prices, and Helios store expansion.
The stock trades at rich valuations of 28.2x FY12E EPS of INR7.2 and 21.8x FY13EEPS of INR9.3. Neutral.
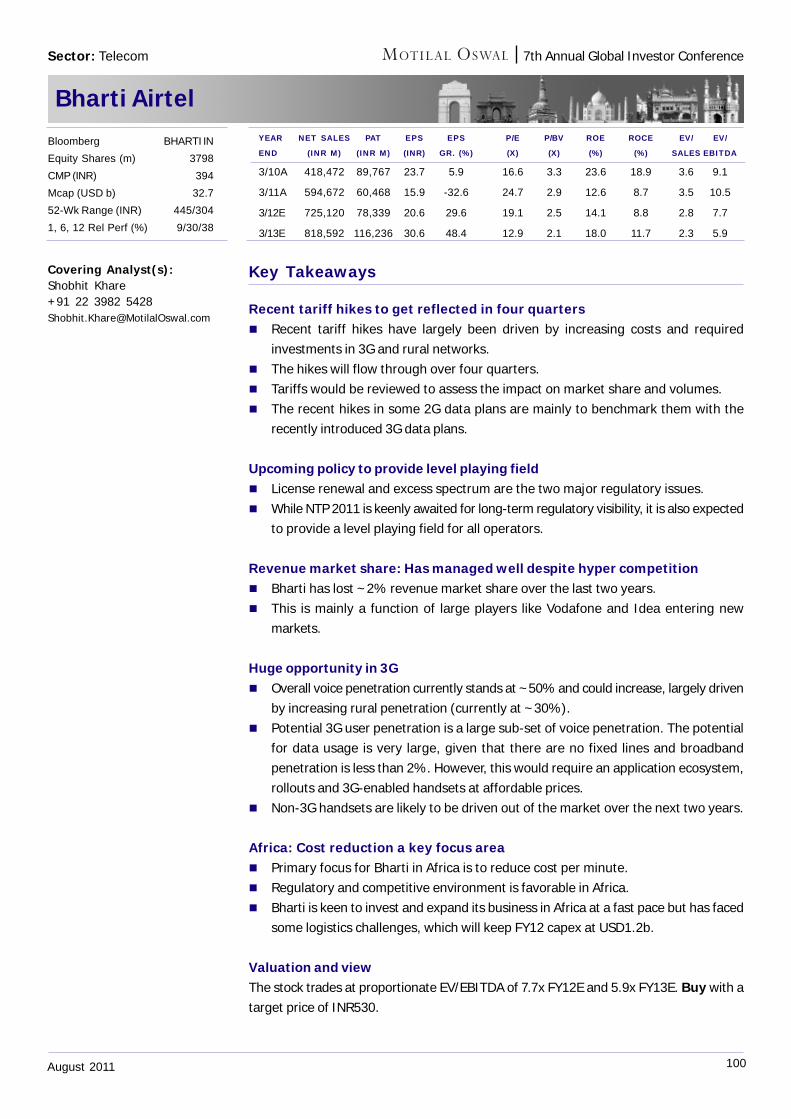
100August 2011
7th Annual Global Investor Conference
Bharti Airtel
Key Takeaways
Recent tariff hikes to get reflected in four quarters Recent tariff hikes have largely been driven by increasing costs and required
investments in 3G and rural networks. The hikes will flow through over four quarters. Tariffs would be reviewed to assess the impact on market share and volumes. The recent hikes in some 2G data plans are mainly to benchmark them with the
recently introduced 3G data plans.
Upcoming policy to provide level playing field License renewal and excess spectrum are the two major regulatory issues. While NTP 2011 is keenly awaited for long-term regulatory visibility, it is also expected
to provide a level playing field for all operators.
Revenue market share: Has managed well despite hyper competition Bharti has lost ~2% revenue market share over the last two years. This is mainly a function of large players like Vodafone and Idea entering new
markets.
Huge opportunity in 3G Overall voice penetration currently stands at ~50% and could increase, largely driven
by increasing rural penetration (currently at ~30%). Potential 3G user penetration is a large sub-set of voice penetration. The potential
for data usage is very large, given that there are no fixed lines and broadbandpenetration is less than 2%. However, this would require an application ecosystem,rollouts and 3G-enabled handsets at affordable prices.
Non-3G handsets are likely to be driven out of the market over the next two years.
Africa: Cost reduction a key focus area Primary focus for Bharti in Africa is to reduce cost per minute. Regulatory and competitive environment is favorable in Africa. Bharti is keen to invest and expand its business in Africa at a fast pace but has faced
some logistics challenges, which will keep FY12 capex at USD1.2b.
Valuation and viewThe stock trades at proportionate EV/EBITDA of 7.7x FY12E and 5.9x FY13E. Buy with atarget price of INR530.
Covering Analyst(s):Shobhit Khare+91 22 3982 [email protected]
YEAR NET SALES PAT EPS EPS P/E P/BV ROE ROCE EV/ EV/
END (INR M) (INR M) (INR) GR. (%) (X) (X) (%) (%) SALES EBITDA
3/10A 418,472 89,767 23.7 5.9 16.6 3.3 23.6 18.9 3.6 9.1
3/11A 594,672 60,468 15.9 -32.6 24.7 2.9 12.6 8.7 3.5 10.5
3/12E 725,120 78,339 20.6 29.6 19.1 2.5 14.1 8.8 2.8 7.7
3/13E 818,592 116,236 30.6 48.4 12.9 2.1 18.0 11.7 2.3 5.9
Bloomberg BHARTI IN
Equity Shares (m) 3798
CMP (INR) 394
Mcap (USD b) 32.7
52-Wk Range (INR) 445/304
1, 6, 12 Rel Perf (%) 9/30/38
Sector: Telecom
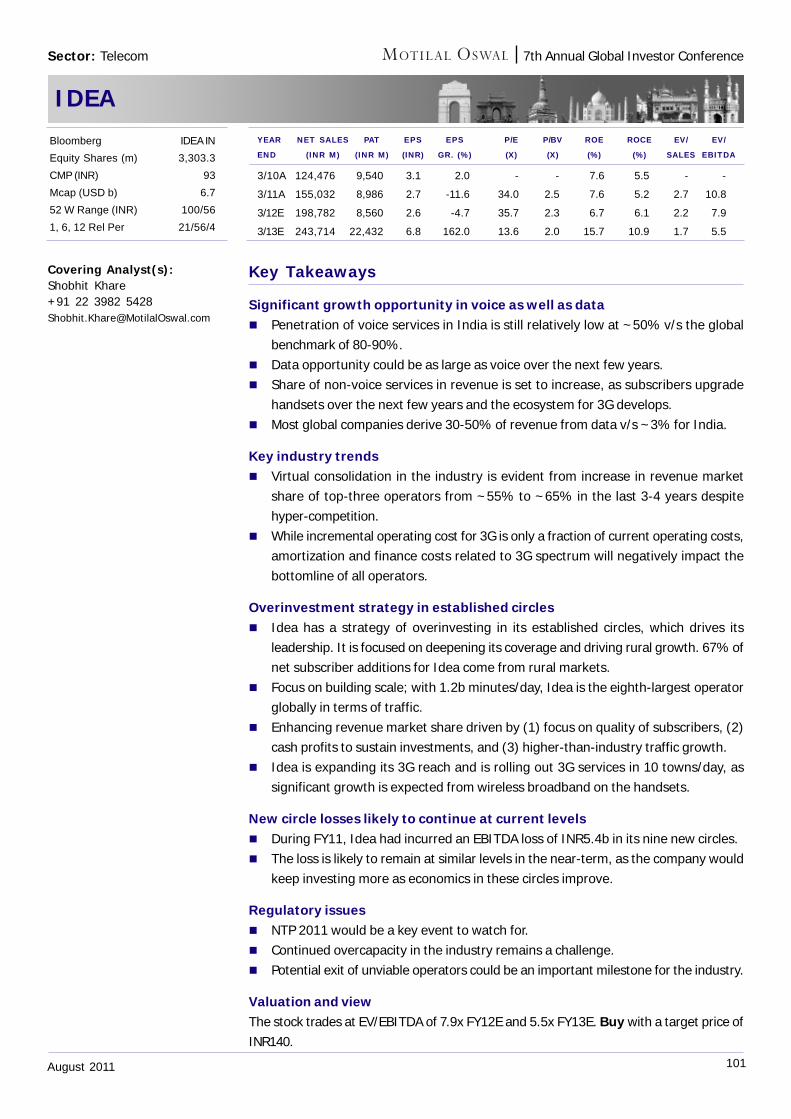
101August 2011
7th Annual Global Investor Conference
IDEA
Key Takeaways
Significant growth opportunity in voice as well as data Penetration of voice services in India is still relatively low at ~50% v/s the global
benchmark of 80-90%. Data opportunity could be as large as voice over the next few years. Share of non-voice services in revenue is set to increase, as subscribers upgrade
handsets over the next few years and the ecosystem for 3G develops. Most global companies derive 30-50% of revenue from data v/s ~3% for India.
Key industry trends Virtual consolidation in the industry is evident from increase in revenue market
share of top-three operators from ~55% to ~65% in the last 3-4 years despitehyper-competition.
While incremental operating cost for 3G is only a fraction of current operating costs,amortization and finance costs related to 3G spectrum will negatively impact thebottomline of all operators.
Overinvestment strategy in established circles Idea has a strategy of overinvesting in its established circles, which drives its
leadership. It is focused on deepening its coverage and driving rural growth. 67% ofnet subscriber additions for Idea come from rural markets.
Focus on building scale; with 1.2b minutes/day, Idea is the eighth-largest operatorglobally in terms of traffic.
Enhancing revenue market share driven by (1) focus on quality of subscribers, (2)cash profits to sustain investments, and (3) higher-than-industry traffic growth.
Idea is expanding its 3G reach and is rolling out 3G services in 10 towns/day, assignificant growth is expected from wireless broadband on the handsets.
New circle losses likely to continue at current levels During FY11, Idea had incurred an EBITDA loss of INR5.4b in its nine new circles. The loss is likely to remain at similar levels in the near-term, as the company would
keep investing more as economics in these circles improve.
Regulatory issues NTP 2011 would be a key event to watch for. Continued overcapacity in the industry remains a challenge. Potential exit of unviable operators could be an important milestone for the industry.
Valuation and viewThe stock trades at EV/EBITDA of 7.9x FY12E and 5.5x FY13E. Buy with a target price ofINR140.
Covering Analyst(s):Shobhit Khare+91 22 3982 [email protected]
YEAR NET SALES PAT EPS EPS P/E P/BV ROE ROCE EV/ EV/
END (INR M) (INR M) (INR) GR. (%) (X) (X) (%) (%) SALES EBITDA
3/10A 124,476 9,540 3.1 2.0 - - 7.6 5.5 - -
3/11A 155,032 8,986 2.7 -11.6 34.0 2.5 7.6 5.2 2.7 10.8
3/12E 198,782 8,560 2.6 -4.7 35.7 2.3 6.7 6.1 2.2 7.9
3/13E 243,714 22,432 6.8 162.0 13.6 2.0 15.7 10.9 1.7 5.5
Bloomberg IDEA IN
Equity Shares (m) 3,303.3
CMP (INR) 93
Mcap (USD b) 6.7
52 W Range (INR) 100/56
1, 6, 12 Rel Per 21/56/4
Sector: Telecom
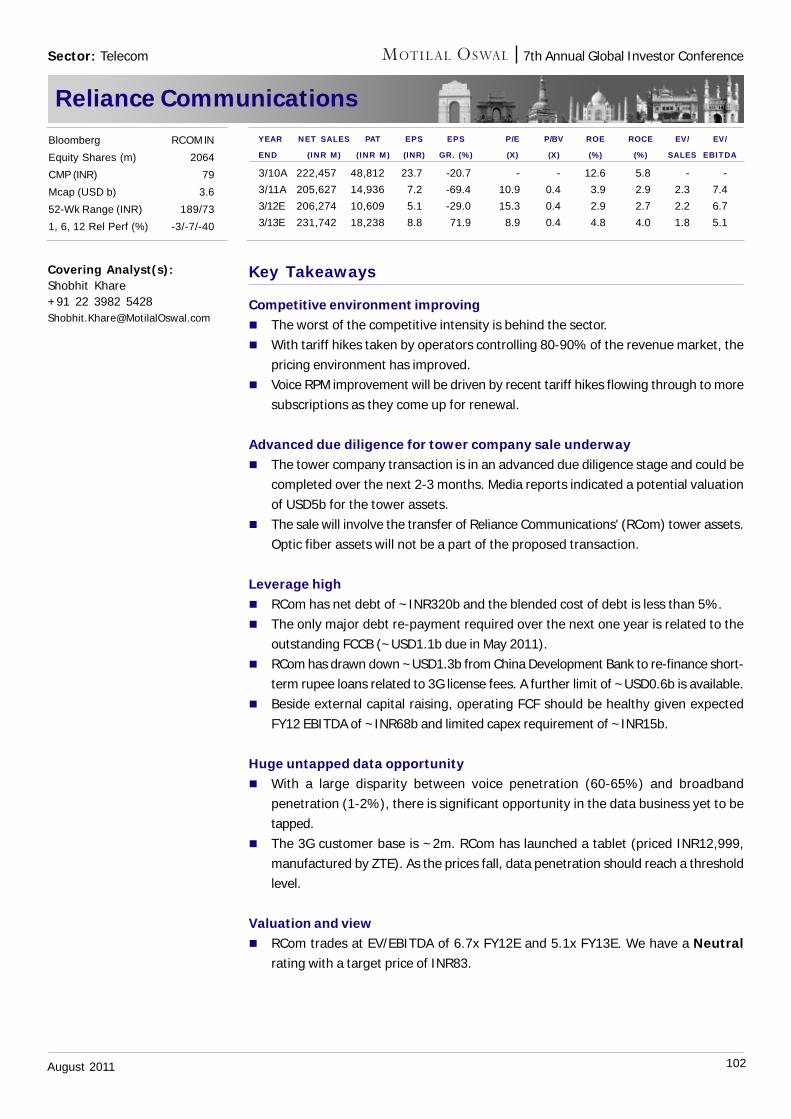
102August 2011
7th Annual Global Investor Conference
Reliance Communications
Key Takeaways
Competitive environment improving The worst of the competitive intensity is behind the sector. With tariff hikes taken by operators controlling 80-90% of the revenue market, the
pricing environment has improved. Voice RPM improvement will be driven by recent tariff hikes flowing through to more
subscriptions as they come up for renewal.
Advanced due diligence for tower company sale underway The tower company transaction is in an advanced due diligence stage and could be
completed over the next 2-3 months. Media reports indicated a potential valuationof USD5b for the tower assets.
The sale will involve the transfer of Reliance Communications' (RCom) tower assets.Optic fiber assets will not be a part of the proposed transaction.
Leverage high RCom has net debt of ~INR320b and the blended cost of debt is less than 5%. The only major debt re-payment required over the next one year is related to the
outstanding FCCB (~USD1.1b due in May 2011). RCom has drawn down ~USD1.3b from China Development Bank to re-finance short-
term rupee loans related to 3G license fees. A further limit of ~USD0.6b is available. Beside external capital raising, operating FCF should be healthy given expected
FY12 EBITDA of ~INR68b and limited capex requirement of ~INR15b.
Huge untapped data opportunity With a large disparity between voice penetration (60-65%) and broadband
penetration (1-2%), there is significant opportunity in the data business yet to betapped.
The 3G customer base is ~2m. RCom has launched a tablet (priced INR12,999,manufactured by ZTE). As the prices fall, data penetration should reach a thresholdlevel.
Valuation and view RCom trades at EV/EBITDA of 6.7x FY12E and 5.1x FY13E. We have a Neutral
rating with a target price of INR83.
Covering Analyst(s):Shobhit Khare+91 22 3982 [email protected]
YEAR NET SALES PAT EPS EPS P/E P/BV ROE ROCE EV/ EV/
END (INR M) (INR M) (INR) GR. (%) (X) (X) (%) (%) SALES EBITDA
3/10A 222,457 48,812 23.7 -20.7 - - 12.6 5.8 - -
3/11A 205,627 14,936 7.2 -69.4 10.9 0.4 3.9 2.9 2.3 7.4
3/12E 206,274 10,609 5.1 -29.0 15.3 0.4 2.9 2.7 2.2 6.7
3/13E 231,742 18,238 8.8 71.9 8.9 0.4 4.8 4.0 1.8 5.1
Bloomberg RCOM IN
Equity Shares (m) 2064
CMP (INR) 79
Mcap (USD b) 3.6
52-Wk Range (INR) 189/73
1, 6, 12 Rel Perf (%) -3/-7/-40
Sector: Telecom
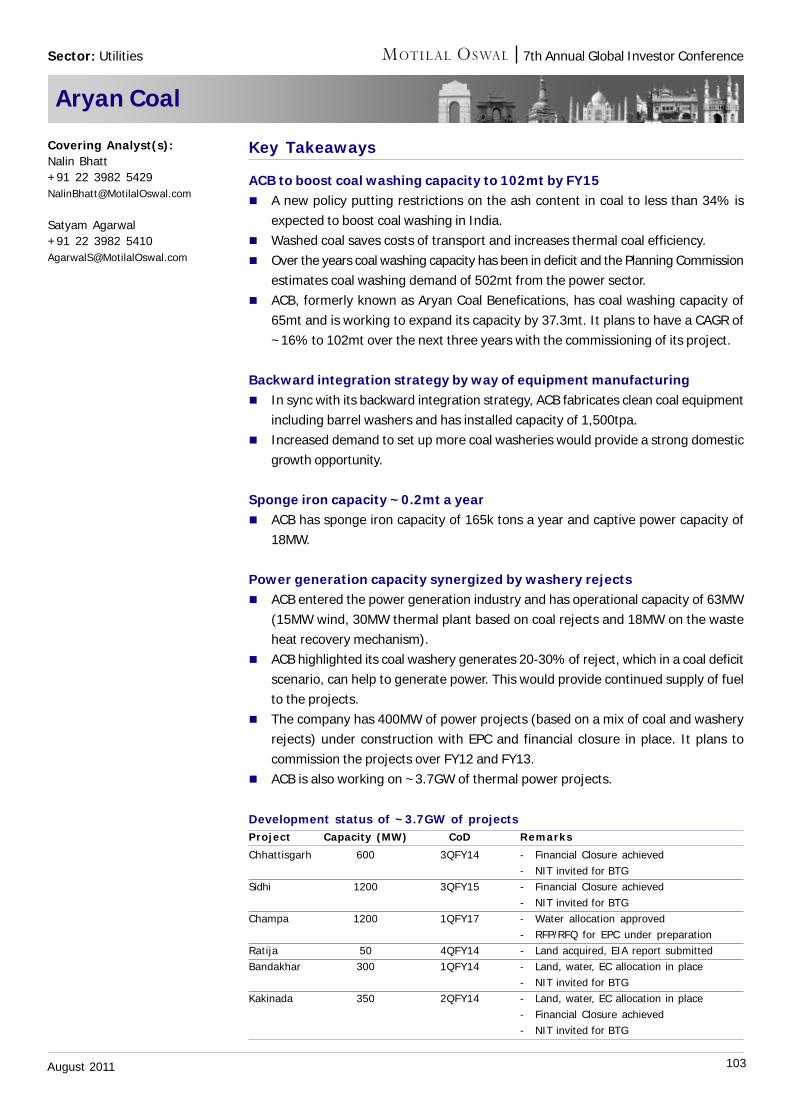
103August 2011
7th Annual Global Investor Conference
Aryan Coal
Key Takeaways
ACB to boost coal washing capacity to 102mt by FY15 A new policy putting restrictions on the ash content in coal to less than 34% is
expected to boost coal washing in India. Washed coal saves costs of transport and increases thermal coal efficiency. Over the years coal washing capacity has been in deficit and the Planning Commission
estimates coal washing demand of 502mt from the power sector. ACB, formerly known as Aryan Coal Benefications, has coal washing capacity of
65mt and is working to expand its capacity by 37.3mt. It plans to have a CAGR of~16% to 102mt over the next three years with the commissioning of its project.
Backward integration strategy by way of equipment manufacturing In sync with its backward integration strategy, ACB fabricates clean coal equipment
including barrel washers and has installed capacity of 1,500tpa. Increased demand to set up more coal washeries would provide a strong domestic
growth opportunity.
Sponge iron capacity ~0.2mt a year ACB has sponge iron capacity of 165k tons a year and captive power capacity of
18MW.
Power generation capacity synergized by washery rejects ACB entered the power generation industry and has operational capacity of 63MW
(15MW wind, 30MW thermal plant based on coal rejects and 18MW on the wasteheat recovery mechanism).
ACB highlighted its coal washery generates 20-30% of reject, which in a coal deficitscenario, can help to generate power. This would provide continued supply of fuelto the projects.
The company has 400MW of power projects (based on a mix of coal and washeryrejects) under construction with EPC and financial closure in place. It plans tocommission the projects over FY12 and FY13.
ACB is also working on ~3.7GW of thermal power projects.
Development status of ~3.7GW of projectsProject Capacity (MW) CoD Remarks
Chhattisgarh 600 3QFY14 - Financial Closure achieved- NIT invited for BTG
Sidhi 1200 3QFY15 - Financial Closure achieved- NIT invited for BTG
Champa 1200 1QFY17 - Water allocation approved- RFP/RFQ for EPC under preparation
Ratija 50 4QFY14 - Land acquired, EIA report submittedBandakhar 300 1QFY14 - Land, water, EC allocation in place
- NIT invited for BTGKakinada 350 2QFY14 - Land, water, EC allocation in place
- Financial Closure achieved- NIT invited for BTG
Covering Analyst(s):Nalin Bhatt+91 22 3982 [email protected]
Satyam Agarwal+91 22 3982 [email protected]
Sector: Utilities
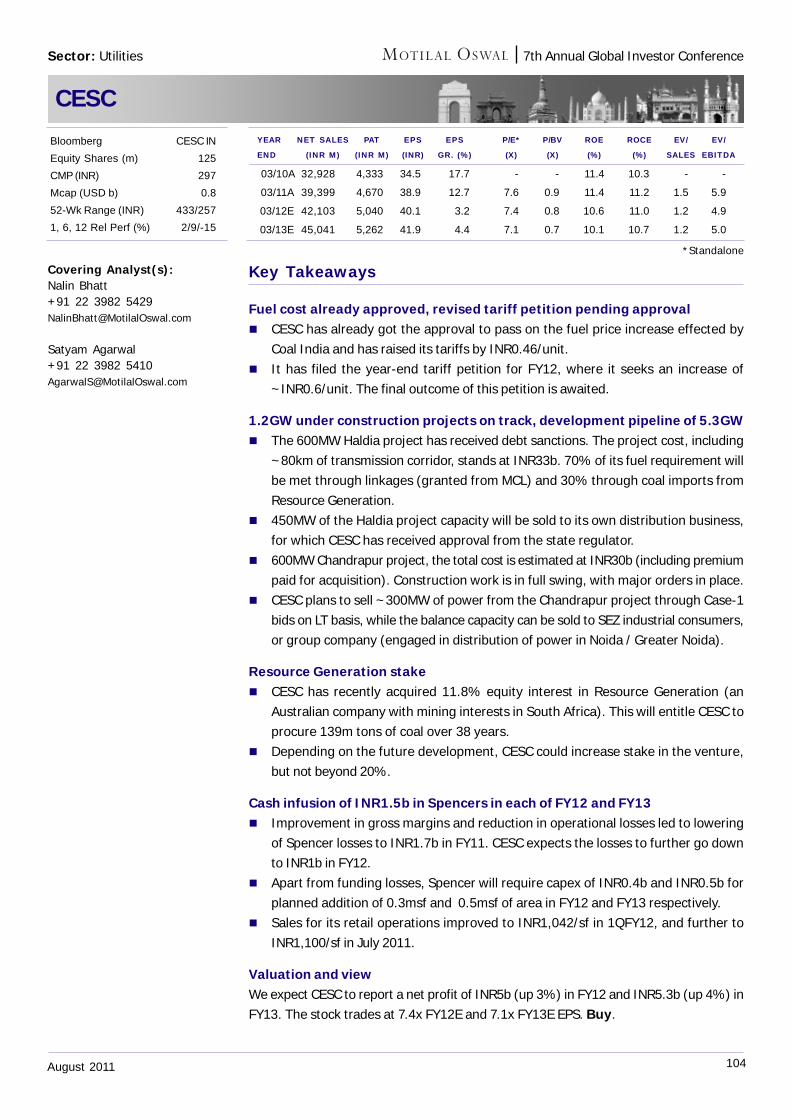
104August 2011
7th Annual Global Investor Conference
CESC
Key Takeaways
Fuel cost already approved, revised tariff petition pending approval CESC has already got the approval to pass on the fuel price increase effected by
Coal India and has raised its tariffs by INR0.46/unit. It has filed the year-end tariff petition for FY12, where it seeks an increase of
~INR0.6/unit. The final outcome of this petition is awaited.
1.2GW under construction projects on track, development pipeline of 5.3GW The 600MW Haldia project has received debt sanctions. The project cost, including
~80km of transmission corridor, stands at INR33b. 70% of its fuel requirement willbe met through linkages (granted from MCL) and 30% through coal imports fromResource Generation.
450MW of the Haldia project capacity will be sold to its own distribution business,for which CESC has received approval from the state regulator.
600MW Chandrapur project, the total cost is estimated at INR30b (including premiumpaid for acquisition). Construction work is in full swing, with major orders in place.
CESC plans to sell ~300MW of power from the Chandrapur project through Case-1bids on LT basis, while the balance capacity can be sold to SEZ industrial consumers,or group company (engaged in distribution of power in Noida / Greater Noida).
Resource Generation stake CESC has recently acquired 11.8% equity interest in Resource Generation (an
Australian company with mining interests in South Africa). This will entitle CESC toprocure 139m tons of coal over 38 years.
Depending on the future development, CESC could increase stake in the venture,but not beyond 20%.
Cash infusion of INR1.5b in Spencers in each of FY12 and FY13 Improvement in gross margins and reduction in operational losses led to lowering
of Spencer losses to INR1.7b in FY11. CESC expects the losses to further go downto INR1b in FY12.
Apart from funding losses, Spencer will require capex of INR0.4b and INR0.5b forplanned addition of 0.3msf and 0.5msf of area in FY12 and FY13 respectively.
Sales for its retail operations improved to INR1,042/sf in 1QFY12, and further toINR1,100/sf in July 2011.
Valuation and viewWe expect CESC to report a net profit of INR5b (up 3%) in FY12 and INR5.3b (up 4%) inFY13. The stock trades at 7.4x FY12E and 7.1x FY13E EPS. Buy.
Covering Analyst(s):Nalin Bhatt+91 22 3982 [email protected]
Satyam Agarwal+91 22 3982 [email protected]
YEAR NET SALES PAT EPS EPS P/E* P/BV ROE ROCE EV/ EV/
END (INR M) (INR M) (INR) GR. (%) (X) (X) (%) (%) SALES EBITDA
03/10A 32,928 4,333 34.5 17.7 - - 11.4 10.3 - -
03/11A 39,399 4,670 38.9 12.7 7.6 0.9 11.4 11.2 1.5 5.9
03/12E 42,103 5,040 40.1 3.2 7.4 0.8 10.6 11.0 1.2 4.9
03/13E 45,041 5,262 41.9 4.4 7.1 0.7 10.1 10.7 1.2 5.0
Bloomberg CESC IN
Equity Shares (m) 125
CMP (INR) 297
Mcap (USD b) 0.8
52-Wk Range (INR) 433/257
1, 6, 12 Rel Perf (%) 2/9/-15
Sector: Utilities
*Standalone
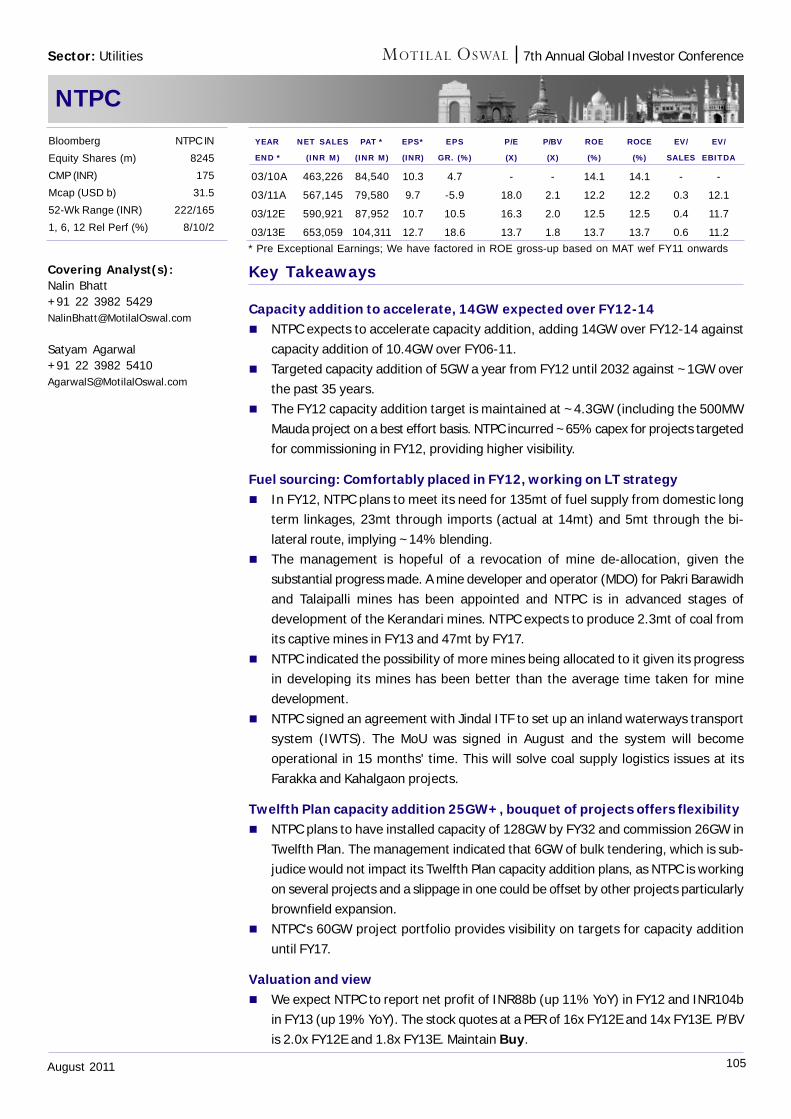
105August 2011
7th Annual Global Investor Conference
NTPC
Key Takeaways
Capacity addition to accelerate, 14GW expected over FY12-14 NTPC expects to accelerate capacity addition, adding 14GW over FY12-14 against
capacity addition of 10.4GW over FY06-11. Targeted capacity addition of 5GW a year from FY12 until 2032 against ~1GW over
the past 35 years. The FY12 capacity addition target is maintained at ~4.3GW (including the 500MW
Mauda project on a best effort basis. NTPC incurred ~65% capex for projects targetedfor commissioning in FY12, providing higher visibility.
Fuel sourcing: Comfortably placed in FY12, working on LT strategy In FY12, NTPC plans to meet its need for 135mt of fuel supply from domestic long
term linkages, 23mt through imports (actual at 14mt) and 5mt through the bi-lateral route, implying ~14% blending.
The management is hopeful of a revocation of mine de-allocation, given thesubstantial progress made. A mine developer and operator (MDO) for Pakri Barawidhand Talaipalli mines has been appointed and NTPC is in advanced stages ofdevelopment of the Kerandari mines. NTPC expects to produce 2.3mt of coal fromits captive mines in FY13 and 47mt by FY17.
NTPC indicated the possibility of more mines being allocated to it given its progressin developing its mines has been better than the average time taken for minedevelopment.
NTPC signed an agreement with Jindal ITF to set up an inland waterways transportsystem (IWTS). The MoU was signed in August and the system will becomeoperational in 15 months' time. This will solve coal supply logistics issues at itsFarakka and Kahalgaon projects.
Twelfth Plan capacity addition 25GW+, bouquet of projects offers flexibility NTPC plans to have installed capacity of 128GW by FY32 and commission 26GW in
Twelfth Plan. The management indicated that 6GW of bulk tendering, which is sub-judice would not impact its Twelfth Plan capacity addition plans, as NTPC is workingon several projects and a slippage in one could be offset by other projects particularlybrownfield expansion.
NTPC's 60GW project portfolio provides visibility on targets for capacity additionuntil FY17.
Valuation and view We expect NTPC to report net profit of INR88b (up 11% YoY) in FY12 and INR104b
in FY13 (up 19% YoY). The stock quotes at a PER of 16x FY12E and 14x FY13E. P/BVis 2.0x FY12E and 1.8x FY13E. Maintain Buy.
Covering Analyst(s):Nalin Bhatt+91 22 3982 [email protected]
Satyam Agarwal+91 22 3982 [email protected]
YEAR NET SALES PAT * EPS* EPS P/E P/BV ROE ROCE EV/ EV/
END * (INR M) (INR M) (INR) GR. (%) (X) (X) (%) (%) SALES EBITDA
03/10A 463,226 84,540 10.3 4.7 - - 14.1 14.1 - -
03/11A 567,145 79,580 9.7 -5.9 18.0 2.1 12.2 12.2 0.3 12.1
03/12E 590,921 87,952 10.7 10.5 16.3 2.0 12.5 12.5 0.4 11.7
03/13E 653,059 104,311 12.7 18.6 13.7 1.8 13.7 13.7 0.6 11.2
Bloomberg NTPC IN
Equity Shares (m) 8245
CMP (INR) 175
Mcap (USD b) 31.5
52-Wk Range (INR) 222/165
1, 6, 12 Rel Perf (%) 8/10/2
* Pre Exceptional Earnings; We have factored in ROE gross-up based on MAT wef FY11 onwards
Sector: Utilities
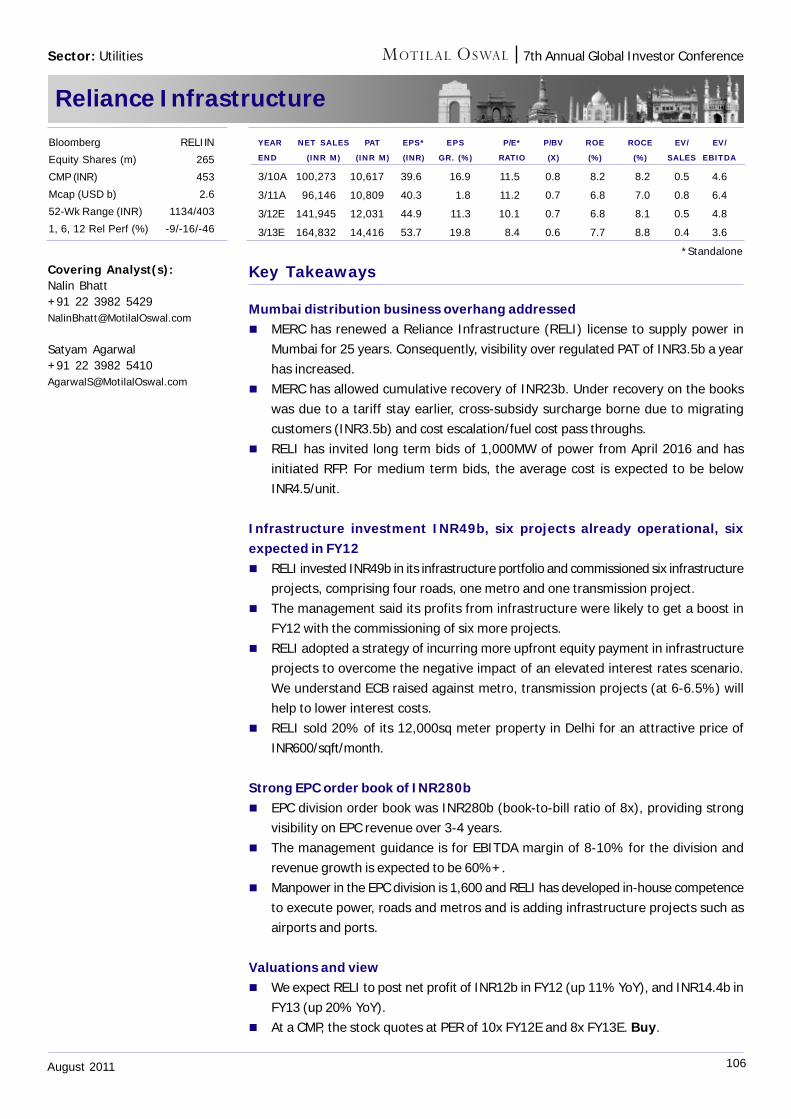
106August 2011
7th Annual Global Investor Conference
Reliance Infrastructure
Key Takeaways
Mumbai distribution business overhang addressed MERC has renewed a Reliance Infrastructure (RELI) license to supply power in
Mumbai for 25 years. Consequently, visibility over regulated PAT of INR3.5b a yearhas increased.
MERC has allowed cumulative recovery of INR23b. Under recovery on the bookswas due to a tariff stay earlier, cross-subsidy surcharge borne due to migratingcustomers (INR3.5b) and cost escalation/fuel cost pass throughs.
RELI has invited long term bids of 1,000MW of power from April 2016 and hasinitiated RFP. For medium term bids, the average cost is expected to be belowINR4.5/unit.
Infrastructure investment INR49b, six projects already operational, sixexpected in FY12 RELI invested INR49b in its infrastructure portfolio and commissioned six infrastructure
projects, comprising four roads, one metro and one transmission project. The management said its profits from infrastructure were likely to get a boost in
FY12 with the commissioning of six more projects. RELI adopted a strategy of incurring more upfront equity payment in infrastructure
projects to overcome the negative impact of an elevated interest rates scenario.We understand ECB raised against metro, transmission projects (at 6-6.5%) willhelp to lower interest costs.
RELI sold 20% of its 12,000sq meter property in Delhi for an attractive price ofINR600/sqft/month.
Strong EPC order book of INR280b EPC division order book was INR280b (book-to-bill ratio of 8x), providing strong
visibility on EPC revenue over 3-4 years. The management guidance is for EBITDA margin of 8-10% for the division and
revenue growth is expected to be 60%+. Manpower in the EPC division is 1,600 and RELI has developed in-house competence
to execute power, roads and metros and is adding infrastructure projects such asairports and ports.
Valuations and view We expect RELI to post net profit of INR12b in FY12 (up 11% YoY), and INR14.4b in
FY13 (up 20% YoY). At a CMP, the stock quotes at PER of 10x FY12E and 8x FY13E. Buy.
Covering Analyst(s):Nalin Bhatt+91 22 3982 [email protected]
Satyam Agarwal+91 22 3982 [email protected]
YEAR NET SALES PAT EPS* EPS P/E* P/BV ROE ROCE EV/ EV/
END (INR M) (INR M) (INR) GR. (%) RATIO (X) (%) (%) SALES EBITDA
3/10A 100,273 10,617 39.6 16.9 11.5 0.8 8.2 8.2 0.5 4.6
3/11A 96,146 10,809 40.3 1.8 11.2 0.7 6.8 7.0 0.8 6.4
3/12E 141,945 12,031 44.9 11.3 10.1 0.7 6.8 8.1 0.5 4.8
3/13E 164,832 14,416 53.7 19.8 8.4 0.6 7.7 8.8 0.4 3.6
Bloomberg RELI IN
Equity Shares (m) 265
CMP (INR) 453
Mcap (USD b) 2.6
52-Wk Range (INR) 1134/403
1, 6, 12 Rel Perf (%) -9/-16/-46
Sector: Utilities
*Standalone
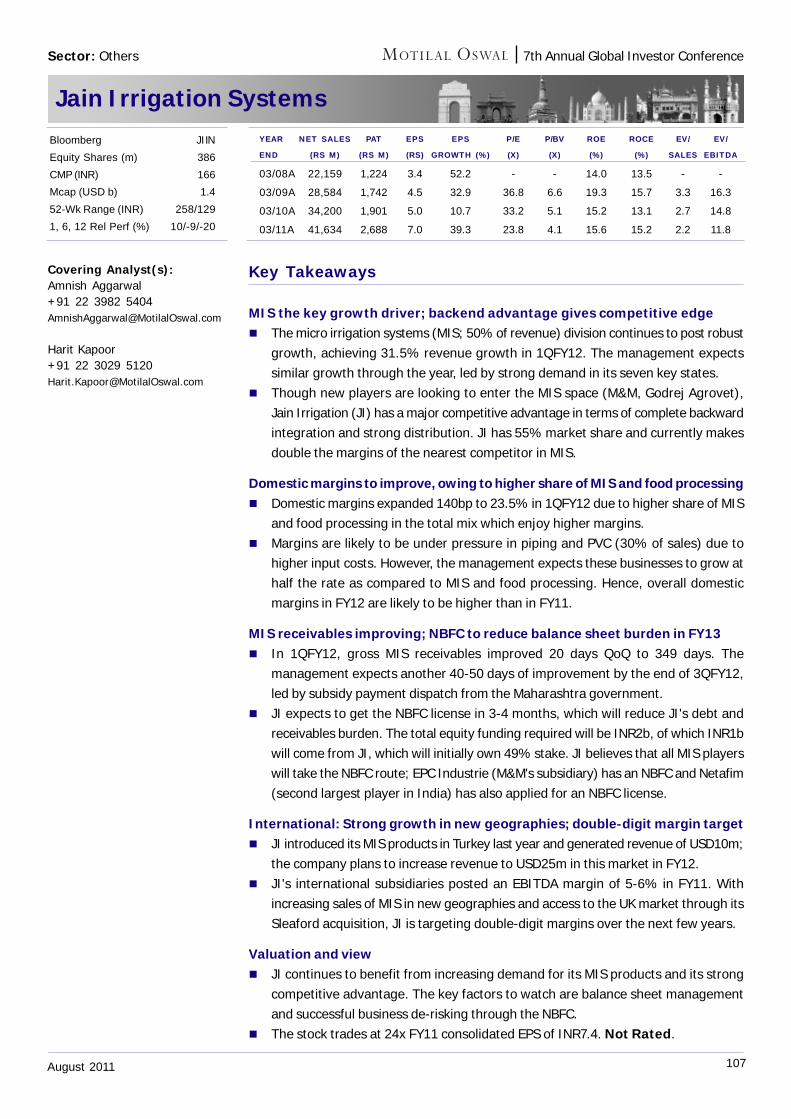
107August 2011
7th Annual Global Investor Conference
Jain Irrigation Systems
Key Takeaways
MIS the key growth driver; backend advantage gives competitive edge The micro irrigation systems (MIS; 50% of revenue) division continues to post robust
growth, achieving 31.5% revenue growth in 1QFY12. The management expectssimilar growth through the year, led by strong demand in its seven key states.
Though new players are looking to enter the MIS space (M&M, Godrej Agrovet),Jain Irrigation (JI) has a major competitive advantage in terms of complete backwardintegration and strong distribution. JI has 55% market share and currently makesdouble the margins of the nearest competitor in MIS.
Domestic margins to improve, owing to higher share of MIS and food processing Domestic margins expanded 140bp to 23.5% in 1QFY12 due to higher share of MIS
and food processing in the total mix which enjoy higher margins. Margins are likely to be under pressure in piping and PVC (30% of sales) due to
higher input costs. However, the management expects these businesses to grow athalf the rate as compared to MIS and food processing. Hence, overall domesticmargins in FY12 are likely to be higher than in FY11.
MIS receivables improving; NBFC to reduce balance sheet burden in FY13 In 1QFY12, gross MIS receivables improved 20 days QoQ to 349 days. The
management expects another 40-50 days of improvement by the end of 3QFY12,led by subsidy payment dispatch from the Maharashtra government.
JI expects to get the NBFC license in 3-4 months, which will reduce JI's debt andreceivables burden. The total equity funding required will be INR2b, of which INR1bwill come from JI, which will initially own 49% stake. JI believes that all MIS playerswill take the NBFC route; EPC Industrie (M&M's subsidiary) has an NBFC and Netafim(second largest player in India) has also applied for an NBFC license.
International: Strong growth in new geographies; double-digit margin target JI introduced its MIS products in Turkey last year and generated revenue of USD10m;
the company plans to increase revenue to USD25m in this market in FY12. JI's international subsidiaries posted an EBITDA margin of 5-6% in FY11. With
increasing sales of MIS in new geographies and access to the UK market through itsSleaford acquisition, JI is targeting double-digit margins over the next few years.
Valuation and view JI continues to benefit from increasing demand for its MIS products and its strong
competitive advantage. The key factors to watch are balance sheet managementand successful business de-risking through the NBFC.
The stock trades at 24x FY11 consolidated EPS of INR7.4. Not Rated.
Covering Analyst(s):Amnish Aggarwal+91 22 3982 [email protected]
Harit Kapoor+91 22 3029 [email protected]
YEAR NET SALES PAT EPS EPS P/E P/BV ROE ROCE EV/ EV/
END (RS M) (RS M) (RS) GROWTH (%) (X) (X) (%) (%) SALES EBITDA
03/08A 22,159 1,224 3.4 52.2 - - 14.0 13.5 - -
03/09A 28,584 1,742 4.5 32.9 36.8 6.6 19.3 15.7 3.3 16.3
03/10A 34,200 1,901 5.0 10.7 33.2 5.1 15.2 13.1 2.7 14.8
03/11A 41,634 2,688 7.0 39.3 23.8 4.1 15.6 15.2 2.2 11.8
Bloomberg JI IN
Equity Shares (m) 386
CMP (INR) 166
Mcap (USD b) 1.4
52-Wk Range (INR) 258/129
1, 6, 12 Rel Perf (%) 10/-9/-20
Sector: Others
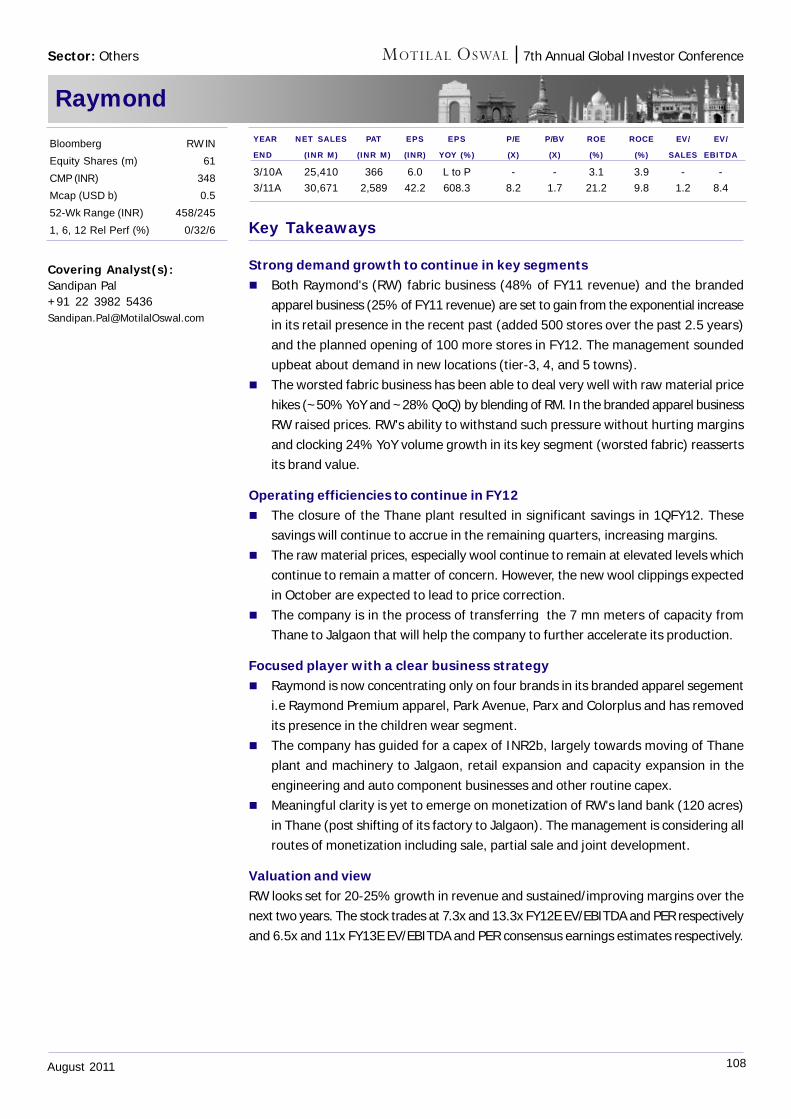
108August 2011
7th Annual Global Investor Conference
Raymond
Key Takeaways
Strong demand growth to continue in key segments Both Raymond's (RW) fabric business (48% of FY11 revenue) and the branded
apparel business (25% of FY11 revenue) are set to gain from the exponential increasein its retail presence in the recent past (added 500 stores over the past 2.5 years)and the planned opening of 100 more stores in FY12. The management soundedupbeat about demand in new locations (tier-3, 4, and 5 towns).
The worsted fabric business has been able to deal very well with raw material pricehikes (~50% YoY and ~28% QoQ) by blending of RM. In the branded apparel businessRW raised prices. RW's ability to withstand such pressure without hurting marginsand clocking 24% YoY volume growth in its key segment (worsted fabric) reassertsits brand value.
Operating efficiencies to continue in FY12 The closure of the Thane plant resulted in significant savings in 1QFY12. These
savings will continue to accrue in the remaining quarters, increasing margins. The raw material prices, especially wool continue to remain at elevated levels which
continue to remain a matter of concern. However, the new wool clippings expectedin October are expected to lead to price correction.
The company is in the process of transferring the 7 mn meters of capacity fromThane to Jalgaon that will help the company to further accelerate its production.
Focused player with a clear business strategy Raymond is now concentrating only on four brands in its branded apparel segement
i.e Raymond Premium apparel, Park Avenue, Parx and Colorplus and has removedits presence in the children wear segment.
The company has guided for a capex of INR2b, largely towards moving of Thaneplant and machinery to Jalgaon, retail expansion and capacity expansion in theengineering and auto component businesses and other routine capex.
Meaningful clarity is yet to emerge on monetization of RW's land bank (120 acres)in Thane (post shifting of its factory to Jalgaon). The management is considering allroutes of monetization including sale, partial sale and joint development.
Valuation and viewRW looks set for 20-25% growth in revenue and sustained/improving margins over thenext two years. The stock trades at 7.3x and 13.3x FY12E EV/EBITDA and PER respectivelyand 6.5x and 11x FY13E EV/EBITDA and PER consensus earnings estimates respectively.
Covering Analyst(s):Sandipan Pal+91 22 3982 [email protected]
YEAR NET SALES PAT EPS EPS P/E P/BV ROE ROCE EV/ EV/
END (INR M) (INR M) (INR) YOY (%) (X) (X) (%) (%) SALES EBITDA
3/10A 25,410 366 6.0 L to P - - 3.1 3.9 - -
3/11A 30,671 2,589 42.2 608.3 8.2 1.7 21.2 9.8 1.2 8.4
Bloomberg RW IN
Equity Shares (m) 61
CMP (INR) 348
Mcap (USD b) 0.5
52-Wk Range (INR) 458/245
1, 6, 12 Rel Perf (%) 0/32/6
Sector: Others

7th Annual Global Investor Conference
109August 2011
Notes

7th Annual Global Investor Conference
110August 2011
Notes
DisclosuresThis report is for personal information of the authorized recipient and does not construe to be any investment, legal or taxation advice to you. This research report does not constitute an offer, invitation or inducementto invest in securities or other investments and Motilal Oswal Securities Limited (hereinafter referred as MOSt) is not soliciting any action based upon it. This report is not for public distribution and has beenfurnished to you solely for your information and should not be reproduced or redistributed to any other person in any form.
Unauthorized disclosure, use, dissemination or copying (either whole or partial) of this information, is prohibited. The person accessing this information specifically agrees to exempt MOSt or any of its affiliatesor employees from, any and all responsibility/liability arising from such misuse and agrees not to hold MOSt or any of its affiliates or employees responsible for any such misuse and further agrees to hold MOStor any of its affiliates or employees free and harmless from all losses, costs, damages, expenses that may be suffered by the person accessing this information due to any errors and delays.
The information contained herein is based on publicly available data or other sources believed to be reliable. While we would endeavour to update the information herein on reasonable basis, MOSt and/or itsaffiliates are under no obligation to update the information. Also there may be regulatory, compliance, or other reasons that may prevent MOSt and/or its affiliates from doing so. MOSt or any of its affiliates oremployees shall not be in any way responsible and liable for any loss or damage that may arise to any person from any inadvertent error in the information contained in this report . MOSt or any of its affiliatesor employees do not provide, at any time, any express or implied warranty of any kind, regarding any matter pertaining to this report, including without limitation the implied warranties of merchantability, fitnessfor a particular purpose, and non-infringement. The recipients of this report should rely on their own investigations.
This report is intended for distribution to institutional investors. Recipients who are not institutional investors should seek advice of their independent financial advisor prior to taking any investment decisionbased on this report or for any necessary explanation of its contents.
MOSt and/or its affiliates and/or employees may have interests/positions, financial or otherwise in the securities mentioned in this report. To enhance transparency, MOSt has incorporated a Disclosure of InterestStatement in this document. This should, however, not be treated as endorsement of the views expressed in the report.
Disclosure of Interest StatementThe MOSt group and its Directors own shares in the following companies covered in this report: Bharti Airtel, GSK Pharma, IDFC, Marico, State Bank, Tata Steel
MOSt has broking relationships with a few of the companies covered in this report.
MOSt is engaged in providing investment-banking services in the following companies covered in this report: Nil
Analyst CertificationThe views expressed in this research report accurately reflect the personal views of the analyst(s) about the subject securities or issues, and no part of the compensation of the research analyst(s) was, is, orwill be directly or indirectly related to the specific recommendations and views expressed by research analyst(s) in this report. The research analysts, strategists, or research associates principally responsiblefor preparation of MOSt research receive compensation based upon various factors, including quality of research, investor client feedback, stock picking, competitive factors and firm revenues.
Regional Disclosures (outside India)This report is not directed or intended for distribution to or use by any person or entity resident in a state, country or any jurisdiction, where such distribution, publication, availability or use would be contrary tolaw, regulation or which would subject MOSt & its group companies to registration or licensing requirements within such jurisdictions.
For U.K.This report is intended for distribution only to persons having professional experience in matters relating to investments as described in Article 19 of the Financial Services and Markets Act 2000 (FinancialPromotion) Order 2005 (referred to as "investment professionals"). This document must not be acted on or relied on by persons who are not investment professionals. Any investment or investment activity towhich this document relates is only available to investment professionals and will be engaged in only with such persons.
For U.S.MOSt is not a registered broker-dealer in the United States (U.S.) and, therefore, is not subject to U.S. rules. In reliance on the exemption from registration provided by Rule 15a-6 of the U.S. Securities ExchangeAct of 1934, as amended (the "Exchange Act") and interpretations thereof by the U.S. Securities and Exchange Commission ("SEC") in order to conduct business with Institutional Investors based in the U.S.,Motilal Oswal has entered into a chaperoning agreement with a U.S. registered broker-dealer, Marco Polo Securities Inc. ("Marco Polo").
This report is intended for distribution only to "Major Institutional Investors" as defined by Rule 15a-6(b)(4) of the Exchange Act and interpretations thereof by SEC (henceforth referred to as "major institutionalinvestors"). This document must not be acted on or relied on by persons who are not major institutional investors. Any investment or investment activity to which this document relates is only available to majorinstitutional investors and will be engaged in only with major institutional investors.
The Research Analysts contributing to the report may not be registered /qualified as research analyst with FINRA. Such research analyst may not be associated persons of the U.S. registered broker-dealer, MarcoPolo and therefore, may not be subject to NASD rule 2711 and NYSE Rule 472 restrictions on communication with a subject company, public appearances and trading securities held by a research analyst account.
Motilal Oswal Securities Ltd3rd Floor, Hoechst House, Nariman Point, Mumbai 400 021
Phone: (91-22) 39825500 Fax: (91-22) 22885038. E-mail: [email protected]

Motilal Oswal Company Gallery

Motilal Oswal Sector Gallery

Motilal Oswal India Strategy Gallery


![ING Vysya AMBAT Auto Saved]](https://img.pdfslide.us/doc/110x75/577d367b1a28ab3a6b9336f7/ing-vysya-ambat-auto-saved.jpg)