Embed Size (px)
Citation preview
An export market assessment of
the Greater Portland region
December 2015
Prepared for:
The City of Portland Economic Development Department and
the Greater Portland Community Chamber of Commerce
Prepared by:
Ryan Wallace, Principal Investigator
Laura M. Yeitz, Graduate Research Assistant
Christopher Hopkins, Graduate Research Assistant
Maine Center for Business and Economic Research
University of Southern Maine
1
EXECUTIVE SUMMARY
At the request of the City of Portland Economic Development Department and the Greater Portland
Community Chamber of Commerce, this report sets out to describe the current conditions in the
Greater Portland region related to export opportunities and investments related to the Port of Portland.
Given the nature of international trade logistics, Portland will best be served by focusing on niche
market segments that leverage existing strengths and capacities. The report identifies key regional
industry and export specializations, import trends in Eimskip service areas, and discusses opportunities
to link export strengths and industry specializations with recent infrastructure developments related to
cold storage requirements. This data is not prescriptive but provides a foundation for understanding the
current state of the region’s industry and export capacity and is a first step towards developing a longer
term strategy to leverage port developments and infrastructure investments in Portland. The key
findings of this assessment are summarized as follows.
Regional output is stagnant, state output is declining
Real output, measured by gross metropolitan product, in the Portland region has grown minimally since
pre-2008 recession levels, while state level real output has decreased over this period. This has
significant implications for overall economic prospects in other areas of the state, but also bolsters the
argument for an export based strategy.
Exports from Portland have jumped with the arrival of Eimskip, New England exports lag the nation
Exports originating trade journeys in Portland, have increased significantly since 2012 with the beginning
of Eimskip service to the port. Exports in New England have grown slightly over the last decade, but well
below national growth rates. However, part of this discrepancy has to do with strong growth in the
energy sector elsewhere in the country.
Exports support a significant number of jobs in the Portland region, but a small share of overall
employment
The Brookings Institute estimates that exports of manufactured goods and agriculture related products
supported upwards of 6,500 jobs in the Portland Metropolitan area in 2014; 2,900 of which are directly
supported by exporting industries. Based on estimates from the Brookings Institute, increasing exports
by $1,000,000 will support another 5 jobs in the region.
Industry employment and industry trade specializations are in related industries
Key goods producing industry employment specializations in the Portland region are in seafood
processing, pharmaceutical and medicine manufacturing, pulp, paper, and other forestry related
products, beverage manufacturing, sugar and confectionary manufacturing, among others. Industry
growth in pharmaceuticals and medicines is projected to increase in the coming years, some of which
require temperature controlled shipment and storage. Export concentrations (industry level data is
statewide) reflect these specializations.
2
Food product export specializations are concentrated to a few specialized categories
Key food product specializations are in leguminous products, crustaceans (lobsters), grapes, apples, and
a variety of prepared products. Most all of the core food export products have some level of value-add
with few raw commodities on the list, such as corn. Similarly, a vast majority of top exports from
Portland are destined for northern EU countries, with the exception of seafood products, which are
shared with both the Eimskip countries and exports elsewhere.
Strong growth in export markets along Eimskip service areas
Import markets in Eimskip service area countries are healthy. Top import product categories that relate
to Portland and Maine export capacity have shown strong growth since 2010, growing on average
between 30 and 60 percent. The most obvious commonality of imports to exports relates to medical
oriented products, such as medical and surgical instruments, medicaments, and a product category that
includes blood and vaccine related products. Other common products are automatic data process
machines and in the taps, cocks, valves for pipes category. In general, the greatest level of overlap is
with Iceland, unsurprisingly, followed by Denmark and Sweden. Food product category concentrations
include seafood products, chocolate, fruit and nuts prepared of preserved, sauces, fresh apples, and
bread and pastry products.
Products with cold storage requirements and export specializations in Portland and Maine
Specific product categories exported from the Portland region that may require refrigerated storage
include fish, fresh, chilled or frozen and other marine products; seafood products prepared, canned and
packaged; fruit and vegetable preserves or specialty foods; farmed fish and related products; meat
products and meat packaging products; and pharmaceuticals and medicines. Of particular interest are
the potential opportunities in pharmaceuticals and medicines.
3
Table of Contents EXECUTIVE SUMMARY .................................................................................................................................. 1
I. Introduction: the Port of Portland as an economic development engine ................................................. 4
II. Port of Portland in context ........................................................................................................................ 5
III. The Greater Portland regional economy and industrial specializations .................................................. 8
IV. Export specializations by industry and product codes .......................................................................... 12
V. Import markets in Eimskip service areas ................................................................................................ 17
VI. Opportunities for cold storage and transport logistics ......................................................................... 20
VII. Conclusions ........................................................................................................................................... 24
4
I. Introduction: the Port of Portland as an economic development engine
At the request of the City of Portland Economic Development Department and the Greater Portland
Community Chamber of Commerce, this report sets out to describe the current conditions in the
Greater Portland region related to infrastructure developments and export opportunities at the Port of
Portland. Exports are an important driver of the regional economy. The Brookings Institute estimates
that exports of manufactured goods and agriculture related products supported upwards of 6,500 jobs
in the Portland Metropolitan area in 2014; 2,900 of which are directly supported by exporting industries.
Brookings estimates suggest that increasing exports by just $1,000,000 will support another 5 jobs in the
region.1
A number of recent developments at the Port of Portland have positioned the region to capitalize on
increased trade activity. Investments in the International Marine Terminal (IMT) have facilitated the
location of the international shipping company Eimskip to the port, establishing trade linkages along the
Scandinavian corridor and northern Europe. Further developments in cold storage capacity and freight
rail logistics will further enhance the Port’s competitiveness. These developments provide direct access
for regional firms to new market opportunities, while acting as a catalyst for attracting new firms and
investment to the area that bolster the region’s competitiveness and economic development prospects.
However, the landscape of international trade has become increasingly concentrated in space; a
result of technological advances in trade logistics and the advantages to scale. International waterborne
trade in New England is concentrated in the metropolitan Boston region, as well as services at the ports
of New York and New Jersey to the south. It is of course, unrealistic for Portland to compete on such
scales. Rather, the Port of Portland and the region will draw advantages from a focus on strategic niche
market segments, as well as leveraging its role in the regional port system. The development of niche
strengths will in part be built upon what the region and state already do well and the assets that are of
value to new firms.
As such, any successful export strategy should be informed by regional strength’s and assets. In line
with this, this report provides a baseline of knowledge of the current industry and export trends
relevant to the Port of Portland and broader region of Maine. While the focus of this analysis is on the
Portland region, successful economic development related to the port will be dependent upon activities
in the Port’s market area or ‘Port District’ and the state of Maine.2 This report also provides an overview
of regional export strengths in relation to market opportunities along Eimskip’s service areas, as well as
identifies potential export product markets for cold storage requirements.
1 The Brookings study methodology includes all exports made in the region whether foreign or domestic, which differs from other export measures, such as the US Census which counts trade data based on origin of movement, which may not necessarily be where the product was produced. 2 Port District definitions for the Portland Port District can be found in the appendices in Table 1A. Port Districts are defined by the US Census and reported in the international trade statistics. Port Districts are essentially the market area inclusive of a products movement of origin.
5
II. Port of Portland in context
Portland is the northernmost major Eastern US port and several sea shipping days closer to
destinations in northern Europe and other parts of the world.3 Efforts to develop the Port of Portland
into a thriving international port are well underway. Since 2010, city, state, and national contributions
have accelerated the reorganization of the Port of Portland into a promising point of processing,
distribution, and logistics for the north Atlantic. In 2010, Maine was a recipient of the federal
Transportation Investment Generating Economic Recovery (TIGER) grant. This investment accelerated
Maine’s ‘Three-port Strategy,’ developed in 1978 to concentrate state investment in deep-water port
facilities. In 2011, Portland began to reconfigure the port’s terminals. Cruise and municipal service was
designated to the east side, commercial fishing, landings, and recreation in the central waterfront zone,
and commercial and industrial operations located at the western-most end. Construction was also
started on expansion and upgrades at the International Marine Terminal (IMT) pier.
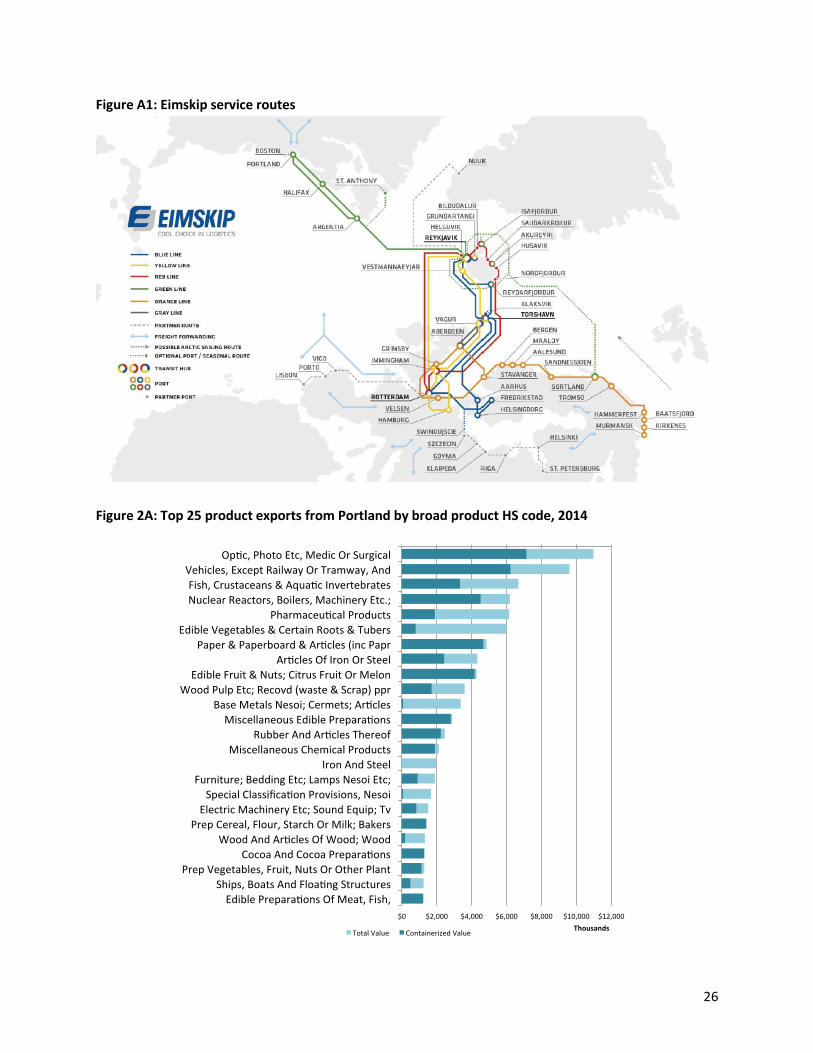
The arrival of Eimskip
In 2013, the Icelandic shipping company Eimskip moved its North American hub to the Port of
Portland from Norfolk, Virginia, marking the first time in decades that Maine and the Port of Portland
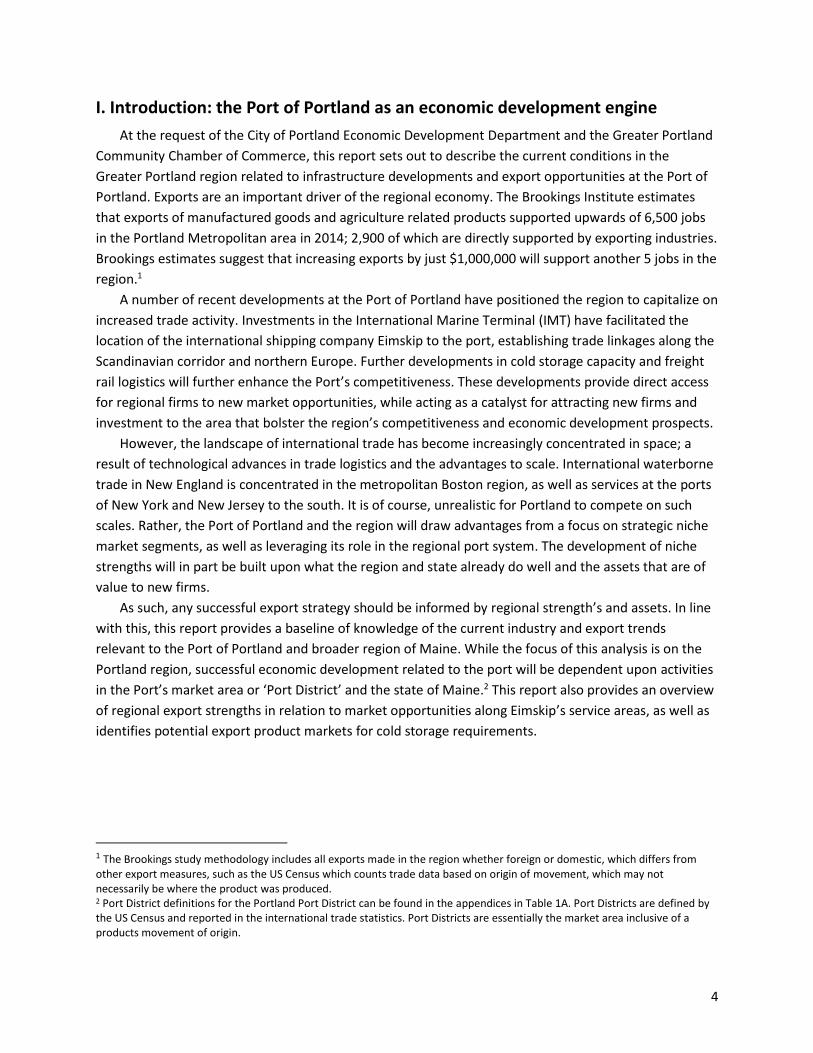
have had a major trade linkage established with international markets on a consistent schedule. Calling
on Portland once every 1-2 weeks, the region is now directly connected with routine trade service to
Maritime Canada, Iceland, and northern European countries via Eimskip’s “Greenline” service (see
Figure 1) with 11 ports of call within the North Atlantic Sea.4 Eimskip also provides feeder services to a
number of additional points, including Spain, Poland, and Russia.
Part of Eimskip’s core business service is through refrigerated containerized shipping, or
“reefers”. As a strategic investment, the port is seeking to build a 120,000 square feet cold storage
warehouse with 12 truck bays and the capacity to provide variable refrigerated zones at varying
temperatures to deep freeze as low as -20 to -30 degrees. The planned warehouse is directly adjacent to
the IMT and is being linked to rail service with the extension of the existing rail line that connects with
the New England network. Americold Storage was recently awarded the contract to build and operate
the freezer storage facility that will accommodate the demands for a variety of goods and produce
storage facilities.
3 See Table 2A in the Appendices to view distances from the Port of Portland to comparative locations. 4 Detailed Eimskip route map can be found in Appendices Figure A1.
6
Figure 1: Eimskip Green Line shipping route connecting Portland to Iceland and transit hubs
Source: Eimskip
Export trends in the region
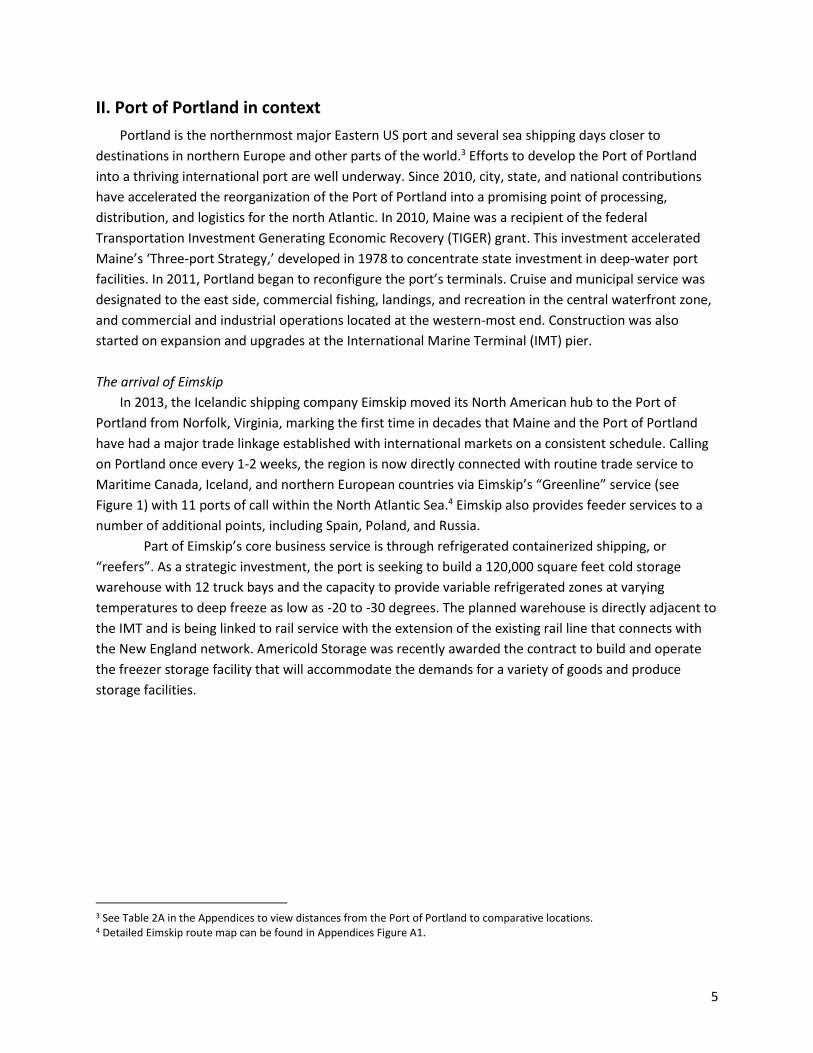
US global exports have risen by over 225 percent over the last decade (Figure 2), driven by
significant production of energy deposits and increased trade with emerging markets in Brazil, Asia, and
elsewhere. Maine and New England have captured a much smaller share of this growth increasing by
only 25% over 2003 levels. New England exports peaked in 2008 followed by a sharp decline during the
Great Recession and have yet to regain pre-recession peak export levels. Nationally, Maine ranks 47th by
export value, while neighboring Massachusetts ranked 16th, the highest of New England states.
Figure 2: Global export trend index for New England and the United States, 2003-2014
Source: US Census Foreign Trade Statistics; MCBER calculations; Base period 2003 = 1
In general, trade across US regions is highly concentrated to a select group of major port
regions, such as Los Angeles, New York/New Jersey, and Chicago. According to the U.S. Department of
7
Transportation, out of 63 international ports, Portland ranked 36th in total metric tons with 62,667 in
2014, while other major northeastern ports such as Boston, ranked 21st with 1,611,271 metric tons and
New York/New Jersey ranked 3rd with 35,080,658 metric tons.
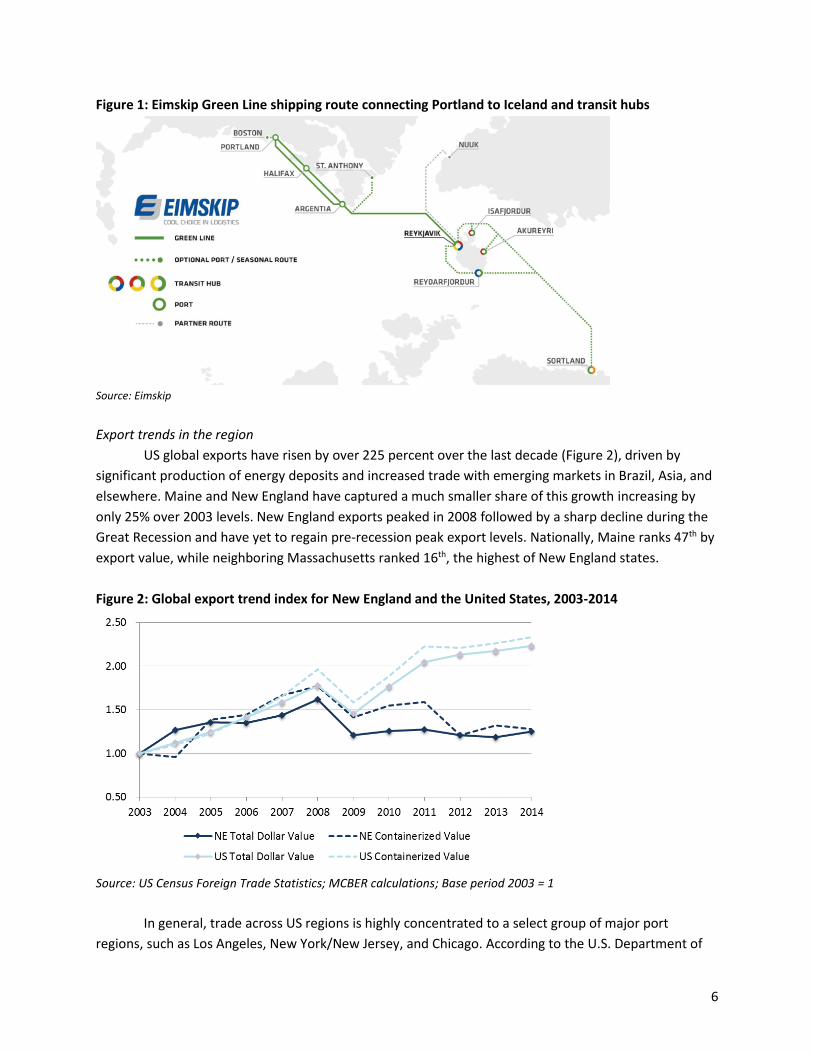
Exports originating from the Port of Portland have been largely dependent upon the presence of
freighter services and flows of oil (Figure 3). Following a spike in 2004, exports had a sharp drop-off in
2005 and have remained relatively low through 2013. However, there is a notable increase in export
value beginning in 2014 that coincides with the first full year of service Eimskip called on the Port of
Portland, in which year exports totaled $228 million. In terms of domestic regional trading partners,
Portland is most connected with its nearest neighbors, as one might expect. In 2008, 63 percent of trade
by weight was traded between New England and the Mid-Atlantic regions. The largest trading partners
are Massachusetts (7.5 million tons and $62 billion), New York (5.8 million tons and $ 6.2 billion) and
New Hampshire (3 million tons and $1.8 billion). Canada also serves as a very valuable trade partner for
Maine as well.
Figure 3: Total exports from Portland to World, 2003 to 2014 (in nominal dollars)
Source: US Census Foreign Trade Statistics; MCBER calculations
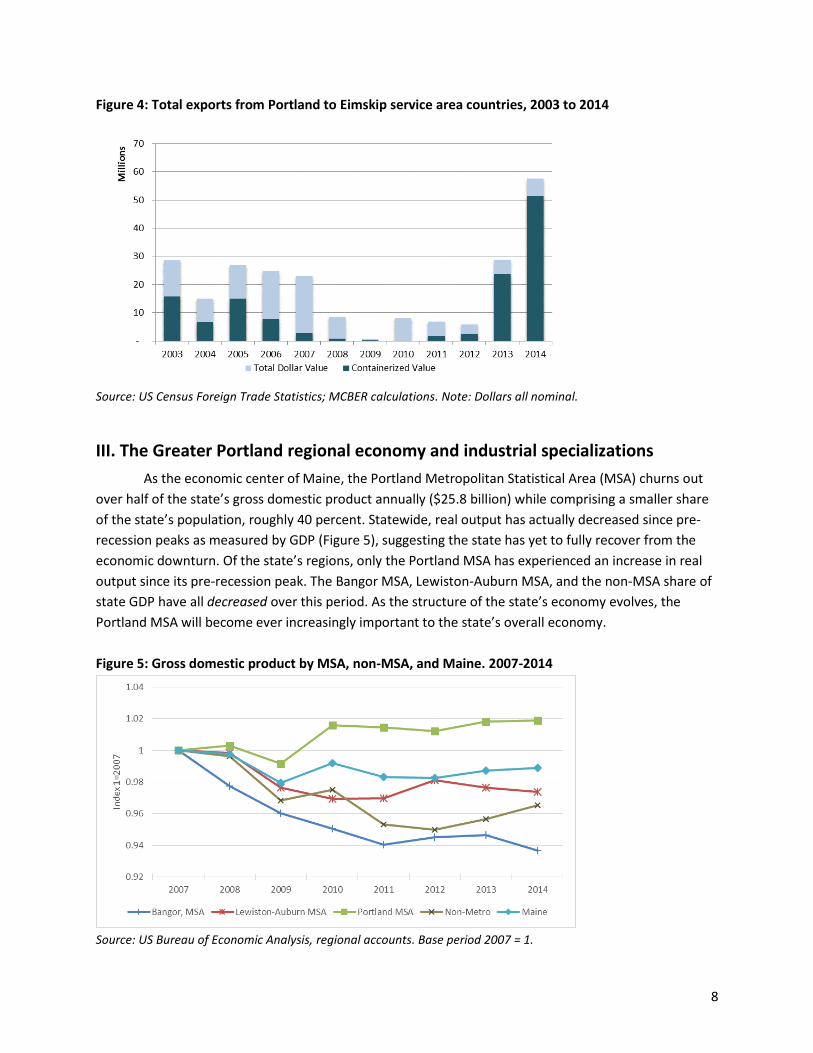
Figure 4 below shows export trends from Portland to Eimskip service area markets5 in northern
Europe. Over the past 10 years, trade with these countries has been quite variable with a pre-2014 peak
of about $29 million. However, corresponding with the beginning of Eimskip’s Portland based service,
exports from Portland to these countries have doubled since 2013 and continue to trend upwards
through 2015.6
5 The Eimskip service area is defined as the countries along Eimskip’s shipping routes shown in Figure A1 in the Appendices. These include the countries Iceland, Sweden, Norway, Denmark, Finland, Germany, the Netherlands, and the United Kingdom. 6 Comparable annual trade data for 2015 was not yet available at the time of this writing.
8
Figure 4: Total exports from Portland to Eimskip service area countries, 2003 to 2014
Source: US Census Foreign Trade Statistics; MCBER calculations. Note: Dollars all nominal.
III. The Greater Portland regional economy and industrial specializations
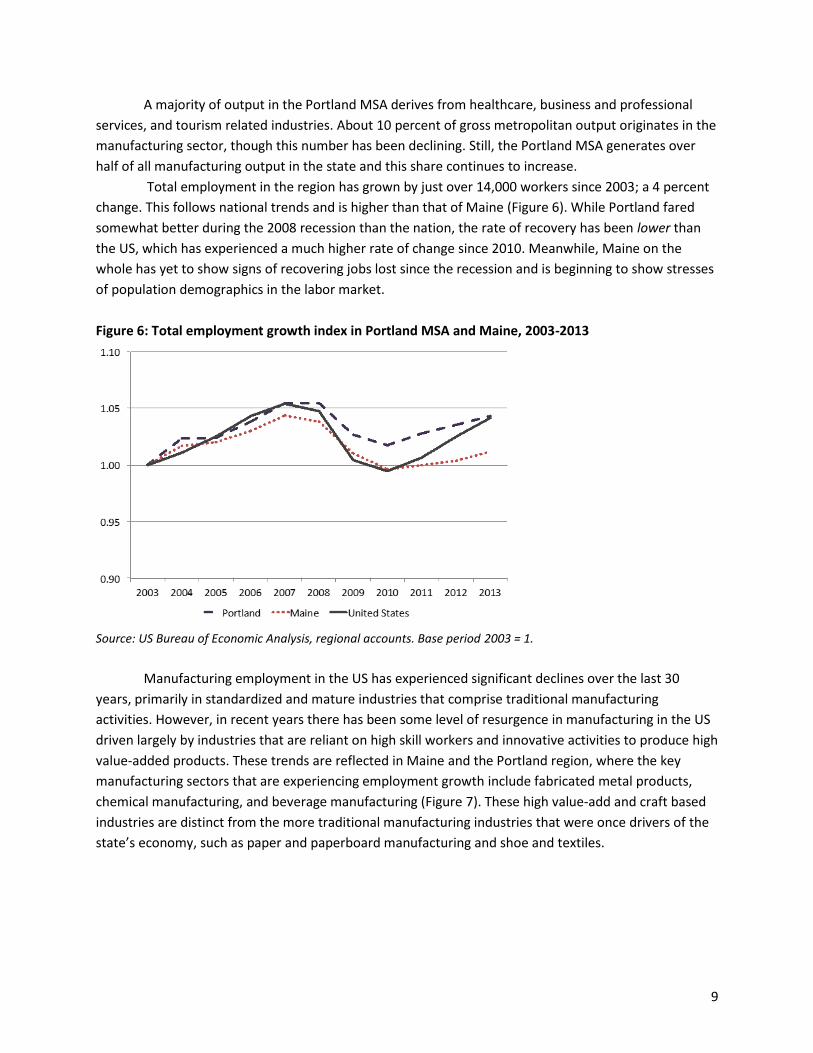
As the economic center of Maine, the Portland Metropolitan Statistical Area (MSA) churns out
over half of the state’s gross domestic product annually ($25.8 billion) while comprising a smaller share
of the state’s population, roughly 40 percent. Statewide, real output has actually decreased since pre-
recession peaks as measured by GDP (Figure 5), suggesting the state has yet to fully recover from the
economic downturn. Of the state’s regions, only the Portland MSA has experienced an increase in real
output since its pre-recession peak. The Bangor MSA, Lewiston-Auburn MSA, and the non-MSA share of
state GDP have all decreased over this period. As the structure of the state’s economy evolves, the
Portland MSA will become ever increasingly important to the state’s overall economy.
Figure 5: Gross domestic product by MSA, non-MSA, and Maine. 2007-2014
Source: US Bureau of Economic Analysis, regional accounts. Base period 2007 = 1.
9
A majority of output in the Portland MSA derives from healthcare, business and professional
services, and tourism related industries. About 10 percent of gross metropolitan output originates in the
manufacturing sector, though this number has been declining. Still, the Portland MSA generates over
half of all manufacturing output in the state and this share continues to increase.
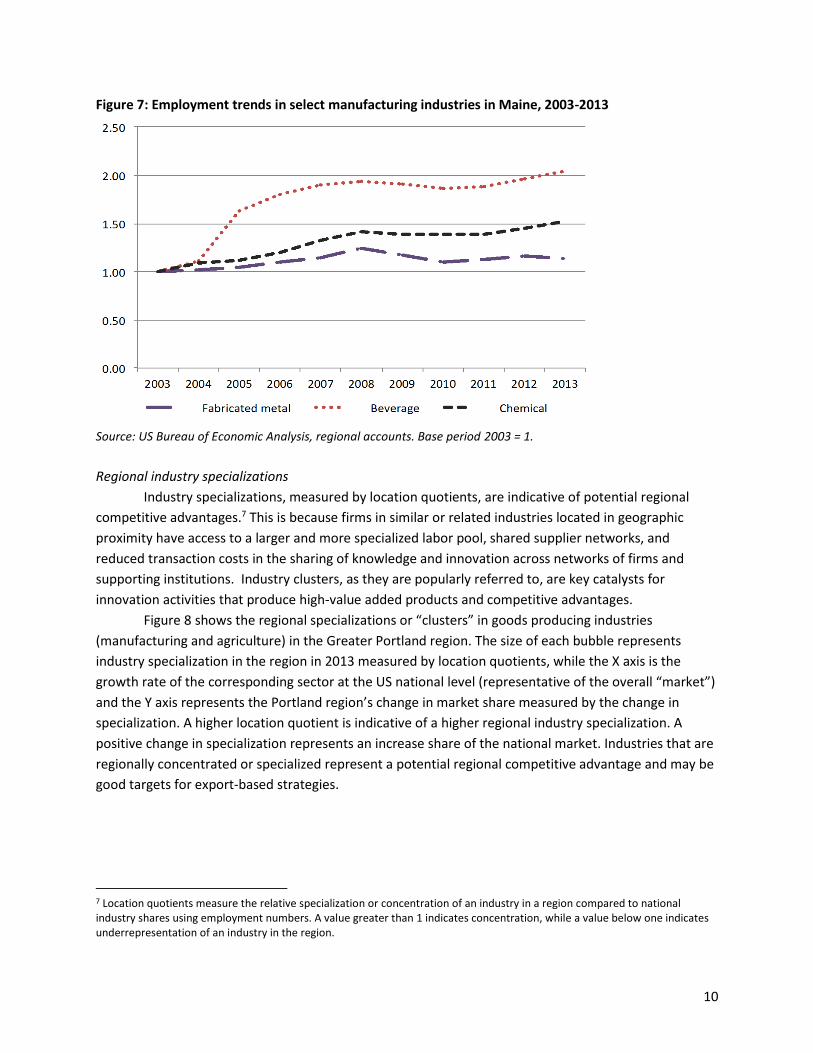
Total employment in the region has grown by just over 14,000 workers since 2003; a 4 percent
change. This follows national trends and is higher than that of Maine (Figure 6). While Portland fared
somewhat better during the 2008 recession than the nation, the rate of recovery has been lower than
the US, which has experienced a much higher rate of change since 2010. Meanwhile, Maine on the
whole has yet to show signs of recovering jobs lost since the recession and is beginning to show stresses
of population demographics in the labor market.
Figure 6: Total employment growth index in Portland MSA and Maine, 2003-2013
Source: US Bureau of Economic Analysis, regional accounts. Base period 2003 = 1.
Manufacturing employment in the US has experienced significant declines over the last 30
years, primarily in standardized and mature industries that comprise traditional manufacturing
activities. However, in recent years there has been some level of resurgence in manufacturing in the US
driven largely by industries that are reliant on high skill workers and innovative activities to produce high
value-added products. These trends are reflected in Maine and the Portland region, where the key
manufacturing sectors that are experiencing employment growth include fabricated metal products,
chemical manufacturing, and beverage manufacturing (Figure 7). These high value-add and craft based
industries are distinct from the more traditional manufacturing industries that were once drivers of the
state’s economy, such as paper and paperboard manufacturing and shoe and textiles.
10
Figure 7: Employment trends in select manufacturing industries in Maine, 2003-2013
Source: US Bureau of Economic Analysis, regional accounts. Base period 2003 = 1.
Regional industry specializations
Industry specializations, measured by location quotients, are indicative of potential regional
competitive advantages.7 This is because firms in similar or related industries located in geographic
proximity have access to a larger and more specialized labor pool, shared supplier networks, and
reduced transaction costs in the sharing of knowledge and innovation across networks of firms and
supporting institutions. Industry clusters, as they are popularly referred to, are key catalysts for
innovation activities that produce high-value added products and competitive advantages.
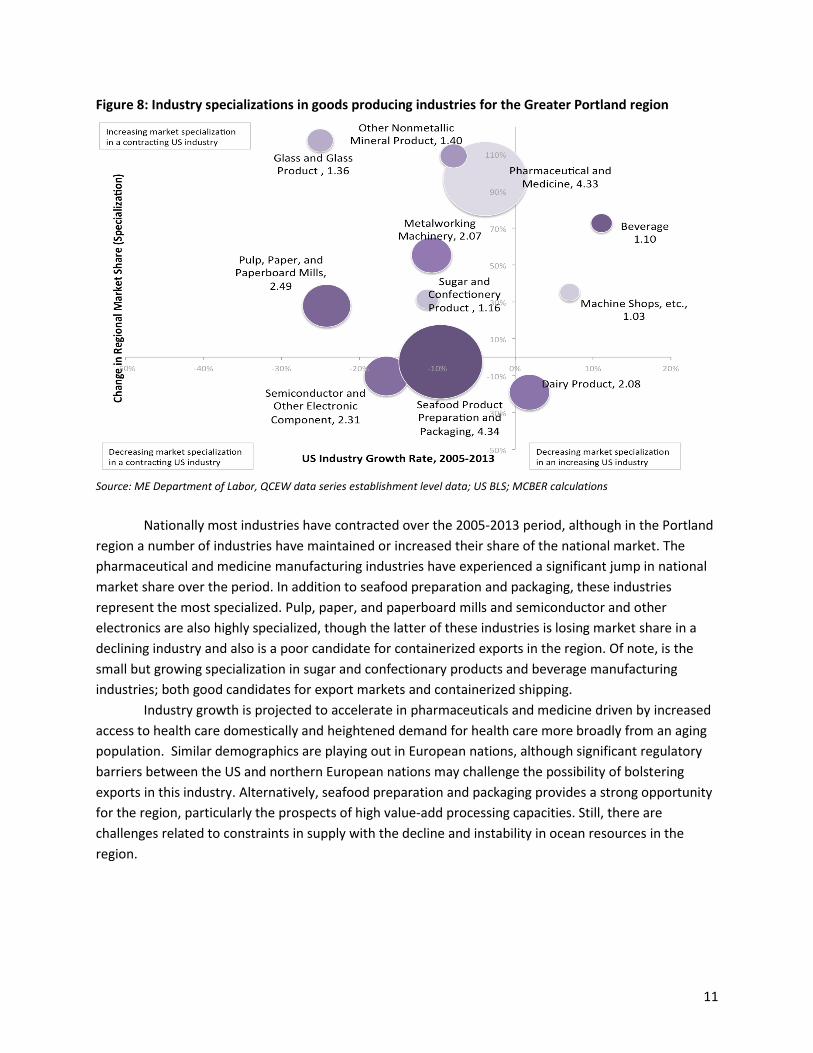
Figure 8 shows the regional specializations or “clusters” in goods producing industries
(manufacturing and agriculture) in the Greater Portland region. The size of each bubble represents
industry specialization in the region in 2013 measured by location quotients, while the X axis is the
growth rate of the corresponding sector at the US national level (representative of the overall “market”)
and the Y axis represents the Portland region’s change in market share measured by the change in
specialization. A higher location quotient is indicative of a higher regional industry specialization. A
positive change in specialization represents an increase share of the national market. Industries that are
regionally concentrated or specialized represent a potential regional competitive advantage and may be
good targets for export-based strategies.
7 Location quotients measure the relative specialization or concentration of an industry in a region compared to national industry shares using employment numbers. A value greater than 1 indicates concentration, while a value below one indicates underrepresentation of an industry in the region.
11
Figure 8: Industry specializations in goods producing industries for the Greater Portland region
Source: ME Department of Labor, QCEW data series establishment level data; US BLS; MCBER calculations
Nationally most industries have contracted over the 2005-2013 period, although in the Portland
region a number of industries have maintained or increased their share of the national market. The
pharmaceutical and medicine manufacturing industries have experienced a significant jump in national
market share over the period. In addition to seafood preparation and packaging, these industries
represent the most specialized. Pulp, paper, and paperboard mills and semiconductor and other
electronics are also highly specialized, though the latter of these industries is losing market share in a
declining industry and also is a poor candidate for containerized exports in the region. Of note, is the
small but growing specialization in sugar and confectionary products and beverage manufacturing
industries; both good candidates for export markets and containerized shipping.
Industry growth is projected to accelerate in pharmaceuticals and medicine driven by increased
access to health care domestically and heightened demand for health care more broadly from an aging
population. Similar demographics are playing out in European nations, although significant regulatory
barriers between the US and northern European nations may challenge the possibility of bolstering
exports in this industry. Alternatively, seafood preparation and packaging provides a strong opportunity
for the region, particularly the prospects of high value-add processing capacities. Still, there are
challenges related to constraints in supply with the decline and instability in ocean resources in the
region.
12
Regional firms in key industries
Using NAICS codes associated with the greater Portland region’s top goods producing industries,
a list of businesses were compiled using Reference USA and publicly available data sources. A detailed
list is included in an excel file that accompanies this report which includes firms, available contact
information, and in some cases approximate details of firm operations. While no means exhaustive, this
list includes the largest and most well established firms in the region and provide a good sample of the
potential exporting firms that currently exist in the Portland MSA region.
IV. Export specializations by industry and product codes
In this section, we focus on industry export specialization for goods producing industries in the
food production and manufacturing sectors. Trade data by industry NAICS is limited to the state level
and not available at a more detailed geography, such as the Portland MSA. Still, Maine is a relevant
geography to draw connections between employment specializations and export trends in key
industries.
Global exports by NAICS industry
Trade data is reported by the US Census Bureau for industries using the North American
Industrial Classification System (NAICS) for selected geographies down to the state and Port District
level.8 9 Table 1 below shows the top exports from Maine relative to New England by total dollar value
(TDV) and for containerized vessel value (CVV) both in nominal dollars.10 Average annual exports from
Maine between 2012 and 2014 amounted to about $2.8 billion per year, which comprised just 5 percent
of all exports originating in New England. Between 2005 and 2014, the nominal dollar value of exports
grew from $2.3 billion to $2.7 billion dollars – an increase of 16 percent, well below national growth but
on par with New England.
Like most regional export hubs, exports are highly specialized in specific industries in specific
regions. This is particularly true for smaller, regional hubs relative to the major ports such as New
York/New Jersey or Los Angeles. For instance, the top 20 exports from Maine make up roughly 83
percent of all exports from the state and more than half (52 percent) of global exports are from
industries with a high to very high location quotient (specialization) relative to New England (Table 1). In
general, these exports reflect the state’s assets in natural resource based industries in agriculture and
forest products. However, there are key export strengths that are high value added industries.
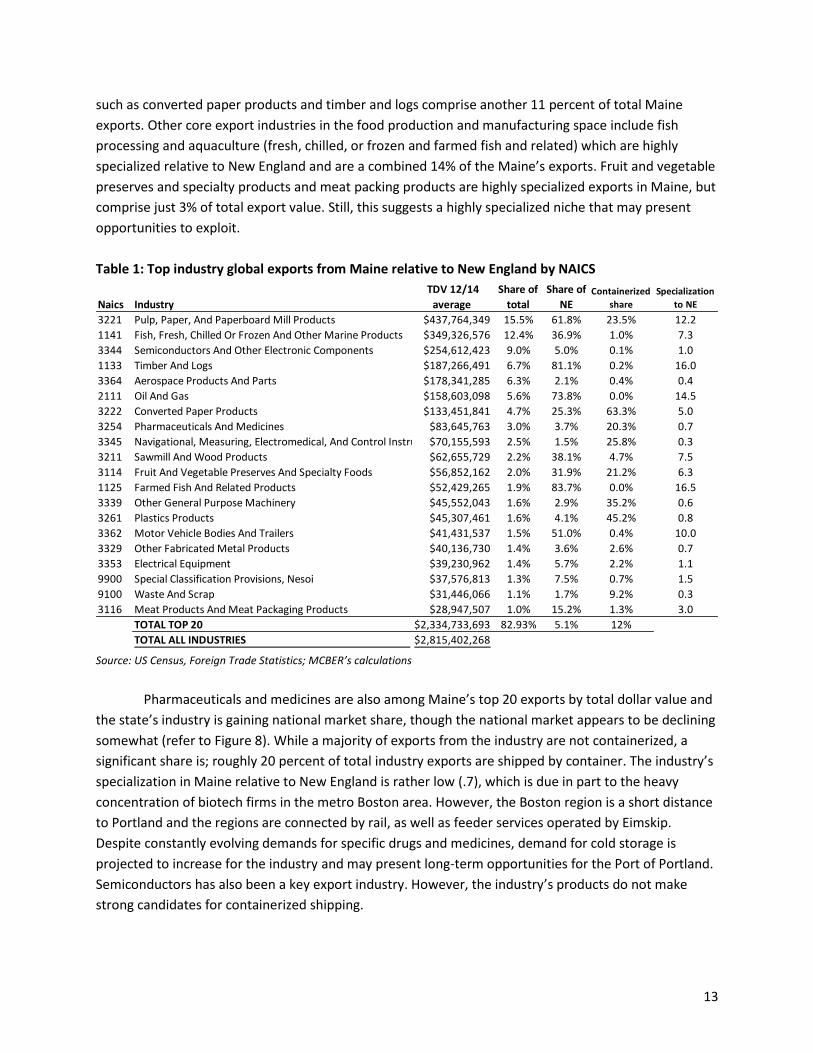
Pulp, paper, and paperboard mill products and seafood processing, are among Maine’s top
industry exports (by total dollar value) with high specializations relative to New England, (12.2 and 7.3
respectively). Annual dollar average of pulp, paper, and paperboard mill product exports were roughly
$438 million, comprising 62 percent share of exports in New England, while related export industries
8 The Portland Port District is defined as inclusive of all ports in Maine, as well as Portsmouth, NH, Lebanon, NH, and Manchester Airport, NH. A list is included in the appendices. 9 Port specific trade data is not reported using the NAICS, but port specific trade data is available by Harmonized Product code, which is discussed in the next section. 10 To address volatility in levels from year to year, an average of years 2012-2014 were calculated to smooth one time spikes in annual exports which may distort the overall picture (such as aerospace).
13
such as converted paper products and timber and logs comprise another 11 percent of total Maine
exports. Other core export industries in the food production and manufacturing space include fish
processing and aquaculture (fresh, chilled, or frozen and farmed fish and related) which are highly
specialized relative to New England and are a combined 14% of the Maine’s exports. Fruit and vegetable
preserves and specialty products and meat packing products are highly specialized exports in Maine, but
comprise just 3% of total export value. Still, this suggests a highly specialized niche that may present
opportunities to exploit.
Table 1: Top industry global exports from Maine relative to New England by NAICS
Source: US Census, Foreign Trade Statistics; MCBER’s calculations
Pharmaceuticals and medicines are also among Maine’s top 20 exports by total dollar value and
the state’s industry is gaining national market share, though the national market appears to be declining
somewhat (refer to Figure 8). While a majority of exports from the industry are not containerized, a
significant share is; roughly 20 percent of total industry exports are shipped by container. The industry’s
specialization in Maine relative to New England is rather low (.7), which is due in part to the heavy
concentration of biotech firms in the metro Boston area. However, the Boston region is a short distance
to Portland and the regions are connected by rail, as well as feeder services operated by Eimskip.
Despite constantly evolving demands for specific drugs and medicines, demand for cold storage is
projected to increase for the industry and may present long-term opportunities for the Port of Portland.
Semiconductors has also been a key export industry. However, the industry’s products do not make
strong candidates for containerized shipping.
Naics Industry
TDV 12/14
average
Share of
total
Share of
NEContainerized
share
Specialization
to NE
3221 Pulp, Paper, And Paperboard Mill Products $437,764,349 15.5% 61.8% 23.5% 12.2
1141 Fish, Fresh, Chilled Or Frozen And Other Marine Products $349,326,576 12.4% 36.9% 1.0% 7.3
3344 Semiconductors And Other Electronic Components $254,612,423 9.0% 5.0% 0.1% 1.0
1133 Timber And Logs $187,266,491 6.7% 81.1% 0.2% 16.0
3364 Aerospace Products And Parts $178,341,285 6.3% 2.1% 0.4% 0.4
2111 Oil And Gas $158,603,098 5.6% 73.8% 0.0% 14.5
3222 Converted Paper Products $133,451,841 4.7% 25.3% 63.3% 5.0
3254 Pharmaceuticals And Medicines $83,645,763 3.0% 3.7% 20.3% 0.7
3345 Navigational, Measuring, Electromedical, And Control Instruments$70,155,593 2.5% 1.5% 25.8% 0.3
3211 Sawmill And Wood Products $62,655,729 2.2% 38.1% 4.7% 7.5
3114 Fruit And Vegetable Preserves And Specialty Foods $56,852,162 2.0% 31.9% 21.2% 6.3
1125 Farmed Fish And Related Products $52,429,265 1.9% 83.7% 0.0% 16.5
3339 Other General Purpose Machinery $45,552,043 1.6% 2.9% 35.2% 0.6
3261 Plastics Products $45,307,461 1.6% 4.1% 45.2% 0.8
3362 Motor Vehicle Bodies And Trailers $41,431,537 1.5% 51.0% 0.4% 10.0
3329 Other Fabricated Metal Products $40,136,730 1.4% 3.6% 2.6% 0.7
3353 Electrical Equipment $39,230,962 1.4% 5.7% 2.2% 1.1
9900 Special Classification Provisions, Nesoi $37,576,813 1.3% 7.5% 0.7% 1.5
9100 Waste And Scrap $31,446,066 1.1% 1.7% 9.2% 0.3
3116 Meat Products And Meat Packaging Products $28,947,507 1.0% 15.2% 1.3% 3.0
TOTAL TOP 20 $2,334,733,693 82.93% 5.1% 12%
TOTAL ALL INDUSTRIES $2,815,402,268
14
Table 1 shows containerized value as a percent of total dollar value (TDV) for Portland’s top 25
global product exports. Average annual containerized exports of converted paper products accounted
for 63 percent of exports (by value) from Maine between 2012 and 2014, roughly $84.5 million worth.
By far the most concentrated in containerized shipping among Maine’s top 25 industry global exports.
The percentage of plastic products containerized exports makes up is roughly 45 percent of that
commodities TDV, meaning slightly less than half of this product was exported via waterborne
containership. Other notable containerized exports are other general purpose machine (35 percent),
navigational, measuring, electromedical, and control instruments (26 percent), pulp, paper, and paper
board mill products (24 percent), pharmaceuticals (20 percent), and fruit and vegetable preserves and
specialty foods (21 percent).
Exports by product category (Harmonized System codes)
While most products are likely produced and distributed by the same industry, a look at the
types of products being exported from the region provides another dimension of information not
necessarily captured in the industry export data. Data are based on the Harmonized System (HS) two-
digit and four-digit product codes.11
Food product exports
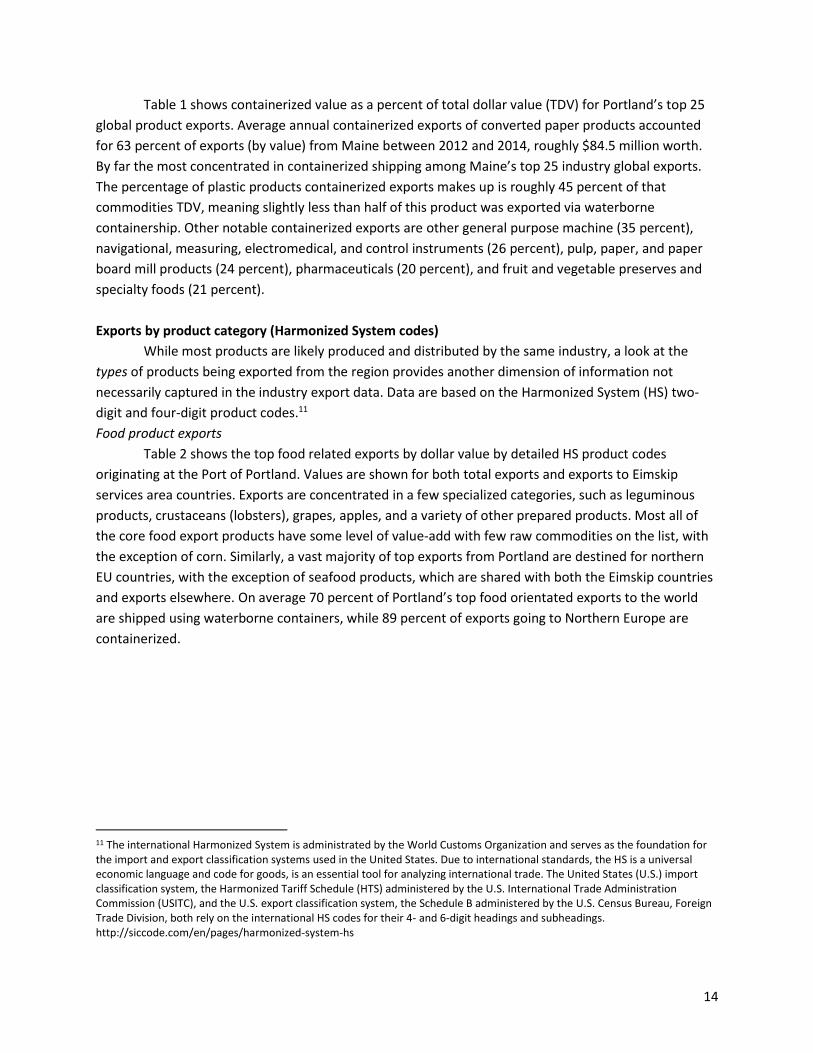
Table 2 shows the top food related exports by dollar value by detailed HS product codes
originating at the Port of Portland. Values are shown for both total exports and exports to Eimskip
services area countries. Exports are concentrated in a few specialized categories, such as leguminous
products, crustaceans (lobsters), grapes, apples, and a variety of other prepared products. Most all of
the core food export products have some level of value-add with few raw commodities on the list, with
the exception of corn. Similarly, a vast majority of top exports from Portland are destined for northern
EU countries, with the exception of seafood products, which are shared with both the Eimskip countries
and exports elsewhere. On average 70 percent of Portland’s top food orientated exports to the world
are shipped using waterborne containers, while 89 percent of exports going to Northern Europe are
containerized.
11 The international Harmonized System is administrated by the World Customs Organization and serves as the foundation for the import and export classification systems used in the United States. Due to international standards, the HS is a universal economic language and code for goods, is an essential tool for analyzing international trade. The United States (U.S.) import classification system, the Harmonized Tariff Schedule (HTS) administered by the U.S. International Trade Administration Commission (USITC), and the U.S. export classification system, the Schedule B administered by the U.S. Census Bureau, Foreign Trade Division, both rely on the international HS codes for their 4- and 6-digit headings and subheadings. http://siccode.com/en/pages/harmonized-system-hs
15
Table 2: Top 25 food oriented exports from Portland by detailed product HS code (4-digit), 2014
Source: US Census, Foreign Trade Statistics; MCBER’s calculations. Note: Northern Europe refers to the countries in Eimskip’s
service area.
Manufacturing product exports
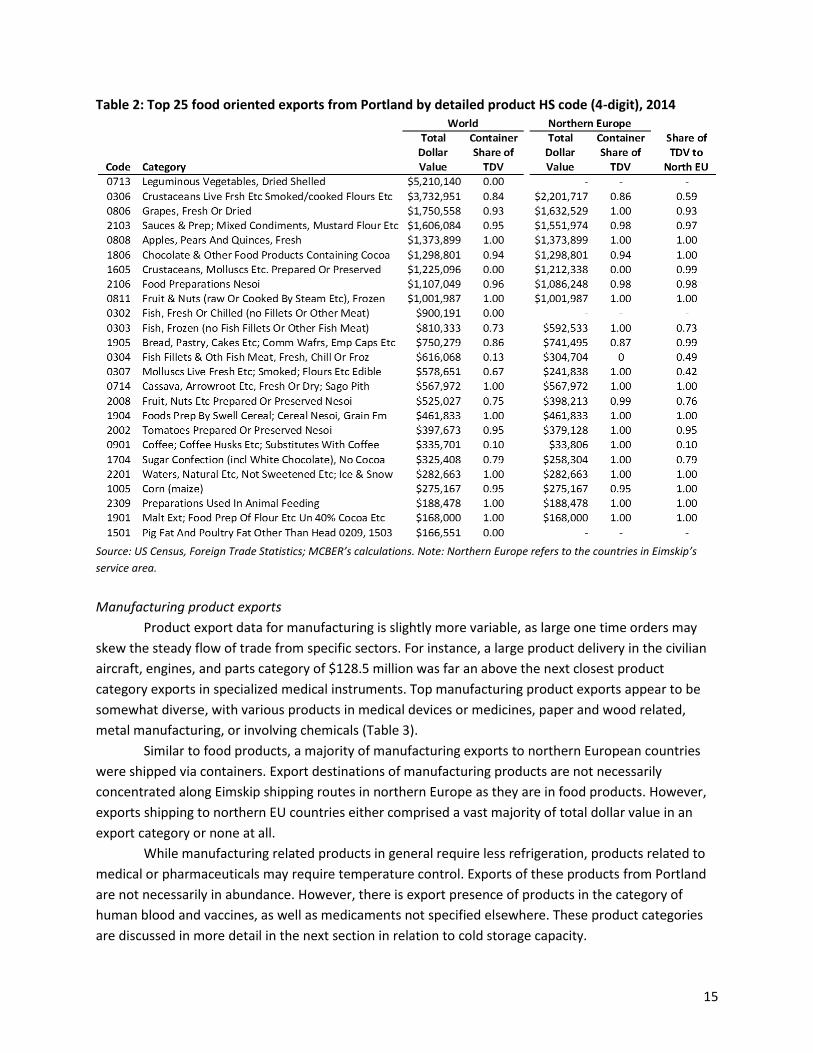
Product export data for manufacturing is slightly more variable, as large one time orders may
skew the steady flow of trade from specific sectors. For instance, a large product delivery in the civilian
aircraft, engines, and parts category of $128.5 million was far an above the next closest product
category exports in specialized medical instruments. Top manufacturing product exports appear to be
somewhat diverse, with various products in medical devices or medicines, paper and wood related,
metal manufacturing, or involving chemicals (Table 3).
Similar to food products, a majority of manufacturing exports to northern European countries
were shipped via containers. Export destinations of manufacturing products are not necessarily
concentrated along Eimskip shipping routes in northern Europe as they are in food products. However,
exports shipping to northern EU countries either comprised a vast majority of total dollar value in an
export category or none at all.
While manufacturing related products in general require less refrigeration, products related to
medical or pharmaceuticals may require temperature control. Exports of these products from Portland
are not necessarily in abundance. However, there is export presence of products in the category of
human blood and vaccines, as well as medicaments not specified elsewhere. These product categories
are discussed in more detail in the next section in relation to cold storage capacity.
16
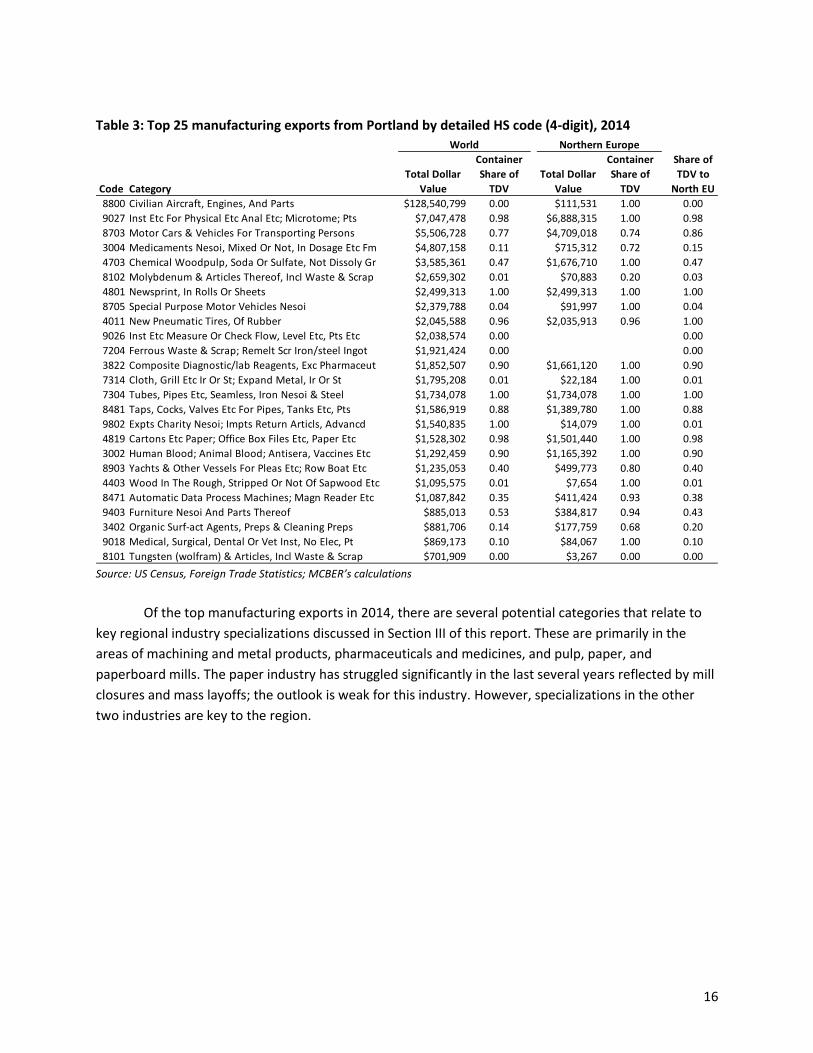
Table 3: Top 25 manufacturing exports from Portland by detailed HS code (4-digit), 2014
Source: US Census, Foreign Trade Statistics; MCBER’s calculations
Of the top manufacturing exports in 2014, there are several potential categories that relate to
key regional industry specializations discussed in Section III of this report. These are primarily in the
areas of machining and metal products, pharmaceuticals and medicines, and pulp, paper, and
paperboard mills. The paper industry has struggled significantly in the last several years reflected by mill
closures and mass layoffs; the outlook is weak for this industry. However, specializations in the other
two industries are key to the region.
Code Category
Total Dollar
Value
Container
Share of
TDV
Total Dollar
Value
Container
Share of
TDV
Share of
TDV to
North EU
8800 Civilian Aircraft, Engines, And Parts $128,540,799 0.00 $111,531 1.00 0.00
9027 Inst Etc For Physical Etc Anal Etc; Microtome; Pts $7,047,478 0.98 $6,888,315 1.00 0.98
8703 Motor Cars & Vehicles For Transporting Persons $5,506,728 0.77 $4,709,018 0.74 0.86
3004 Medicaments Nesoi, Mixed Or Not, In Dosage Etc Fm $4,807,158 0.11 $715,312 0.72 0.15
4703 Chemical Woodpulp, Soda Or Sulfate, Not Dissoly Gr $3,585,361 0.47 $1,676,710 1.00 0.47
8102 Molybdenum & Articles Thereof, Incl Waste & Scrap $2,659,302 0.01 $70,883 0.20 0.03
4801 Newsprint, In Rolls Or Sheets $2,499,313 1.00 $2,499,313 1.00 1.00
8705 Special Purpose Motor Vehicles Nesoi $2,379,788 0.04 $91,997 1.00 0.04
4011 New Pneumatic Tires, Of Rubber $2,045,588 0.96 $2,035,913 0.96 1.00
9026 Inst Etc Measure Or Check Flow, Level Etc, Pts Etc $2,038,574 0.00 0.00
7204 Ferrous Waste & Scrap; Remelt Scr Iron/steel Ingot $1,921,424 0.00 0.00
3822 Composite Diagnostic/lab Reagents, Exc Pharmaceut $1,852,507 0.90 $1,661,120 1.00 0.90
7314 Cloth, Grill Etc Ir Or St; Expand Metal, Ir Or St $1,795,208 0.01 $22,184 1.00 0.01
7304 Tubes, Pipes Etc, Seamless, Iron Nesoi & Steel $1,734,078 1.00 $1,734,078 1.00 1.00
8481 Taps, Cocks, Valves Etc For Pipes, Tanks Etc, Pts $1,586,919 0.88 $1,389,780 1.00 0.88
9802 Expts Charity Nesoi; Impts Return Articls, Advancd $1,540,835 1.00 $14,079 1.00 0.01
4819 Cartons Etc Paper; Office Box Files Etc, Paper Etc $1,528,302 0.98 $1,501,440 1.00 0.98
3002 Human Blood; Animal Blood; Antisera, Vaccines Etc $1,292,459 0.90 $1,165,392 1.00 0.90
8903 Yachts & Other Vessels For Pleas Etc; Row Boat Etc $1,235,053 0.40 $499,773 0.80 0.40
4403 Wood In The Rough, Stripped Or Not Of Sapwood Etc $1,095,575 0.01 $7,654 1.00 0.01
8471 Automatic Data Process Machines; Magn Reader Etc $1,087,842 0.35 $411,424 0.93 0.38
9403 Furniture Nesoi And Parts Thereof $885,013 0.53 $384,817 0.94 0.43
3402 Organic Surf-act Agents, Preps & Cleaning Preps $881,706 0.14 $177,759 0.68 0.20
9018 Medical, Surgical, Dental Or Vet Inst, No Elec, Pt $869,173 0.10 $84,067 1.00 0.10
8101 Tungsten (wolfram) & Articles, Incl Waste & Scrap $701,909 0.00 $3,267 0.00 0.00
World Northern Europe
17
V. Import markets in Eimskip service areas
Maritime trade connections brought about through Eimskip trade routes present new market
opportunities for regional firms to access northern European markets. In light of this, it is important to
have not only an understanding of the current export patterns from regional firms and exports but also
the import patterns in countries on the newly established trade linkages through Eimskip. We
summarize by comparing key imports in countries relative to export strengths originating from Portland.
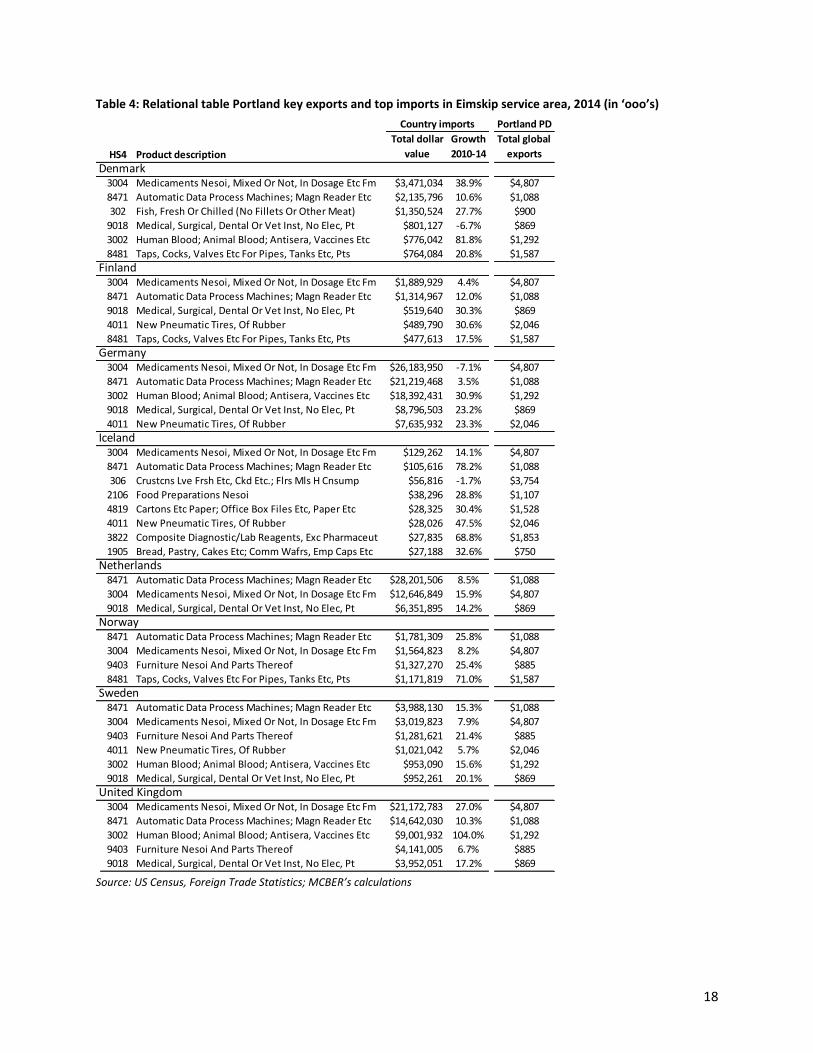
Top import product categories with Portland export strength
Table 4 shows top global imports across all product categories and the corresponding level of
global exports originating in the Port of Portland in 2014. The most obvious commonality of imports to
exports relates to medical oriented products, such as medical and surgical instruments, medicaments,
and a product category that includes blood and vaccine related products. Other common products are
automatic data process machines and in the taps, cocks, valves for pipes category. In general, the
greatest level of overlap is with Iceland, unsurprisingly, followed by Denmark and Sweden. Virtually all
top imports identified here have grown in total dollar value since 2010, in most cases significantly. The
relative size of Port of Portland exports is quite small. Still, these measures provide a broad sense of the
types of product export capacity and their alignment with Eimskip service areas.
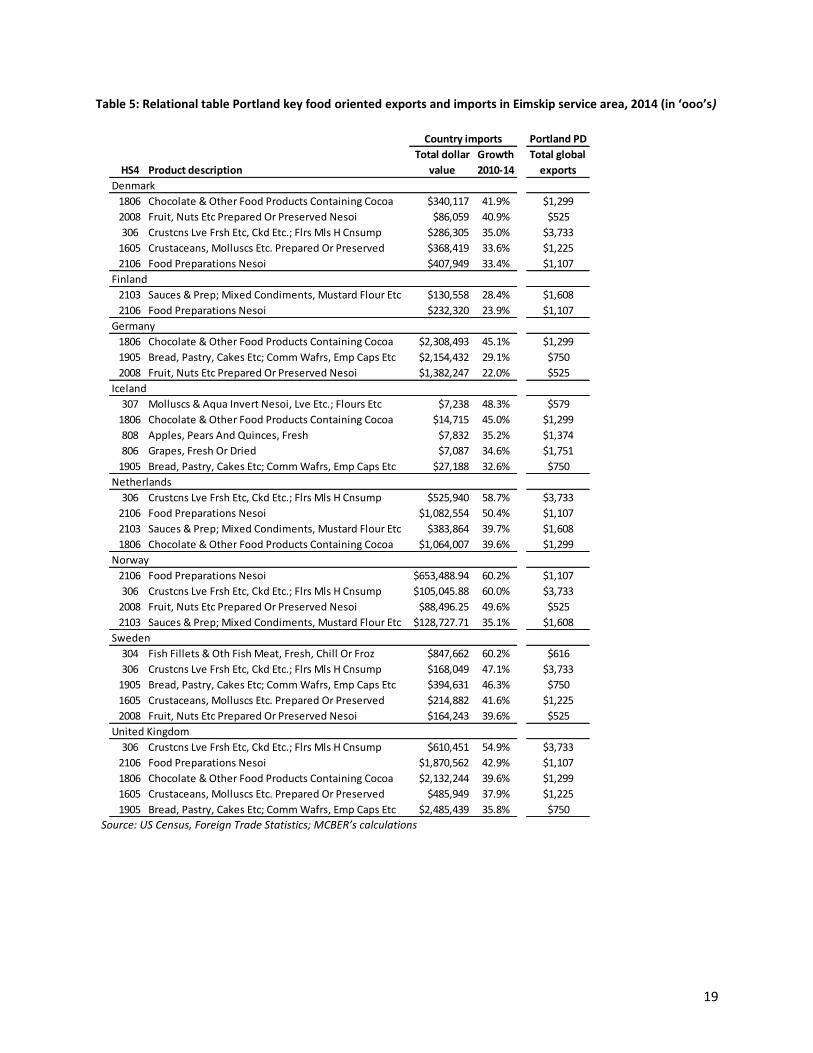
Looking specifically at food products in Table 5, we find similar product concentrations in such
categories as seafood products, chocolate, fruit and nuts prepared of preserved, sauces, fresh apples,
and bread and pastry products. There has been significant growth in total dollar value of imports across
all top product categories since 2010. This suggests healthy markets and prospective opportunities for
export placement.
18
Table 4: Relational table Portland key exports and top imports in Eimskip service area, 2014 (in ‘ooo’s)
Source: US Census, Foreign Trade Statistics; MCBER’s calculations
Portland PD
HS4 Product description
Total dollar
value
Growth
2010-14
Total global
exports
Denmark3004 Medicaments Nesoi, Mixed Or Not, In Dosage Etc Fm $3,471,034 38.9% $4,807
8471 Automatic Data Process Machines; Magn Reader Etc $2,135,796 10.6% $1,088
302 Fish, Fresh Or Chilled (No Fillets Or Other Meat) $1,350,524 27.7% $900
9018 Medical, Surgical, Dental Or Vet Inst, No Elec, Pt $801,127 -6.7% $869
3002 Human Blood; Animal Blood; Antisera, Vaccines Etc $776,042 81.8% $1,292
8481 Taps, Cocks, Valves Etc For Pipes, Tanks Etc, Pts $764,084 20.8% $1,587
Finland3004 Medicaments Nesoi, Mixed Or Not, In Dosage Etc Fm $1,889,929 4.4% $4,807
8471 Automatic Data Process Machines; Magn Reader Etc $1,314,967 12.0% $1,088
9018 Medical, Surgical, Dental Or Vet Inst, No Elec, Pt $519,640 30.3% $869
4011 New Pneumatic Tires, Of Rubber $489,790 30.6% $2,046
8481 Taps, Cocks, Valves Etc For Pipes, Tanks Etc, Pts $477,613 17.5% $1,587
Germany3004 Medicaments Nesoi, Mixed Or Not, In Dosage Etc Fm $26,183,950 -7.1% $4,807
8471 Automatic Data Process Machines; Magn Reader Etc $21,219,468 3.5% $1,088
3002 Human Blood; Animal Blood; Antisera, Vaccines Etc $18,392,431 30.9% $1,292
9018 Medical, Surgical, Dental Or Vet Inst, No Elec, Pt $8,796,503 23.2% $869
4011 New Pneumatic Tires, Of Rubber $7,635,932 23.3% $2,046
Iceland3004 Medicaments Nesoi, Mixed Or Not, In Dosage Etc Fm $129,262 14.1% $4,807
8471 Automatic Data Process Machines; Magn Reader Etc $105,616 78.2% $1,088
306 Crustcns Lve Frsh Etc, Ckd Etc.; Flrs Mls H Cnsump $56,816 -1.7% $3,754
2106 Food Preparations Nesoi $38,296 28.8% $1,107
4819 Cartons Etc Paper; Office Box Files Etc, Paper Etc $28,325 30.4% $1,528
4011 New Pneumatic Tires, Of Rubber $28,026 47.5% $2,046
3822 Composite Diagnostic/Lab Reagents, Exc Pharmaceut $27,835 68.8% $1,853
1905 Bread, Pastry, Cakes Etc; Comm Wafrs, Emp Caps Etc $27,188 32.6% $750
Netherlands8471 Automatic Data Process Machines; Magn Reader Etc $28,201,506 8.5% $1,088
3004 Medicaments Nesoi, Mixed Or Not, In Dosage Etc Fm $12,646,849 15.9% $4,807
9018 Medical, Surgical, Dental Or Vet Inst, No Elec, Pt $6,351,895 14.2% $869
Norway8471 Automatic Data Process Machines; Magn Reader Etc $1,781,309 25.8% $1,088
3004 Medicaments Nesoi, Mixed Or Not, In Dosage Etc Fm $1,564,823 8.2% $4,807
9403 Furniture Nesoi And Parts Thereof $1,327,270 25.4% $885
8481 Taps, Cocks, Valves Etc For Pipes, Tanks Etc, Pts $1,171,819 71.0% $1,587
Sweden8471 Automatic Data Process Machines; Magn Reader Etc $3,988,130 15.3% $1,088
3004 Medicaments Nesoi, Mixed Or Not, In Dosage Etc Fm $3,019,823 7.9% $4,807
9403 Furniture Nesoi And Parts Thereof $1,281,621 21.4% $885
4011 New Pneumatic Tires, Of Rubber $1,021,042 5.7% $2,046
3002 Human Blood; Animal Blood; Antisera, Vaccines Etc $953,090 15.6% $1,292
9018 Medical, Surgical, Dental Or Vet Inst, No Elec, Pt $952,261 20.1% $869
United Kingdom3004 Medicaments Nesoi, Mixed Or Not, In Dosage Etc Fm $21,172,783 27.0% $4,807
8471 Automatic Data Process Machines; Magn Reader Etc $14,642,030 10.3% $1,088
3002 Human Blood; Animal Blood; Antisera, Vaccines Etc $9,001,932 104.0% $1,292
9403 Furniture Nesoi And Parts Thereof $4,141,005 6.7% $885
9018 Medical, Surgical, Dental Or Vet Inst, No Elec, Pt $3,952,051 17.2% $869
Country imports
19
Portland PD
HS4 Product description
Total dollar
value
Growth
2010-14
Total global
exports
Denmark
1806 Chocolate & Other Food Products Containing Cocoa $340,117 41.9% $1,299
2008 Fruit, Nuts Etc Prepared Or Preserved Nesoi $86,059 40.9% $525
306 Crustcns Lve Frsh Etc, Ckd Etc.; Flrs Mls H Cnsump $286,305 35.0% $3,733
1605 Crustaceans, Molluscs Etc. Prepared Or Preserved $368,419 33.6% $1,225
2106 Food Preparations Nesoi $407,949 33.4% $1,107
Finland
2103 Sauces & Prep; Mixed Condiments, Mustard Flour Etc $130,558 28.4% $1,608
2106 Food Preparations Nesoi $232,320 23.9% $1,107
Germany
1806 Chocolate & Other Food Products Containing Cocoa $2,308,493 45.1% $1,299
1905 Bread, Pastry, Cakes Etc; Comm Wafrs, Emp Caps Etc $2,154,432 29.1% $750
2008 Fruit, Nuts Etc Prepared Or Preserved Nesoi $1,382,247 22.0% $525
Iceland
307 Molluscs & Aqua Invert Nesoi, Lve Etc.; Flours Etc $7,238 48.3% $579
1806 Chocolate & Other Food Products Containing Cocoa $14,715 45.0% $1,299
808 Apples, Pears And Quinces, Fresh $7,832 35.2% $1,374
806 Grapes, Fresh Or Dried $7,087 34.6% $1,751
1905 Bread, Pastry, Cakes Etc; Comm Wafrs, Emp Caps Etc $27,188 32.6% $750
Netherlands
306 Crustcns Lve Frsh Etc, Ckd Etc.; Flrs Mls H Cnsump $525,940 58.7% $3,733
2106 Food Preparations Nesoi $1,082,554 50.4% $1,107
2103 Sauces & Prep; Mixed Condiments, Mustard Flour Etc $383,864 39.7% $1,608
1806 Chocolate & Other Food Products Containing Cocoa $1,064,007 39.6% $1,299
Norway
2106 Food Preparations Nesoi $653,488.94 60.2% $1,107
306 Crustcns Lve Frsh Etc, Ckd Etc.; Flrs Mls H Cnsump $105,045.88 60.0% $3,733
2008 Fruit, Nuts Etc Prepared Or Preserved Nesoi $88,496.25 49.6% $525
2103 Sauces & Prep; Mixed Condiments, Mustard Flour Etc $128,727.71 35.1% $1,608
Sweden
304 Fish Fillets & Oth Fish Meat, Fresh, Chill Or Froz $847,662 60.2% $616
306 Crustcns Lve Frsh Etc, Ckd Etc.; Flrs Mls H Cnsump $168,049 47.1% $3,733
1905 Bread, Pastry, Cakes Etc; Comm Wafrs, Emp Caps Etc $394,631 46.3% $750
1605 Crustaceans, Molluscs Etc. Prepared Or Preserved $214,882 41.6% $1,225
2008 Fruit, Nuts Etc Prepared Or Preserved Nesoi $164,243 39.6% $525
United Kingdom
306 Crustcns Lve Frsh Etc, Ckd Etc.; Flrs Mls H Cnsump $610,451 54.9% $3,733
2106 Food Preparations Nesoi $1,870,562 42.9% $1,107
1806 Chocolate & Other Food Products Containing Cocoa $2,132,244 39.6% $1,299
1605 Crustaceans, Molluscs Etc. Prepared Or Preserved $485,949 37.9% $1,225
1905 Bread, Pastry, Cakes Etc; Comm Wafrs, Emp Caps Etc $2,485,439 35.8% $750
Country imports
Table 5: Relational table Portland key food oriented exports and imports in Eimskip service area, 2014 (in ‘ooo’s)
Source: US Census, Foreign Trade Statistics; MCBER’s calculations
20
VI. Opportunities for cold storage and transport logistics
As discussed in the opening sections of this report, two key strategic developments are taking shape
at the International Marine Terminal (IMT) at the Port of Portland that provide transportation and
logistical infrastructure to containerized movement of goods. These include the extension of a Pan Am
freight rail line to the IMT and the siting of a cold storage facility adjacent to the both the IMT and the
freight rail line. Both developments will increase the competitiveness and services the Port is able to
provide and will help directly facilitate increased trade at the IMT.
The market for cold storage infrastructure and logistics
A refrigerated warehouse is an important segment of the supply chain that involves the storage of
temperature-sensitive goods. Temperature controlled services include blast freezing and tempering.
Refrigerated storage helps in storage of perishable goods during cold chain supply. Based on
temperature ranges maintained, refrigerated warehouses can be segmented into two categories: Cold
storage (coolers) and frozen storage (freezers). Cold storage areas usually maintain temperatures
between 0-10 °C (32-50°F), while frozen storage areas maintain temperatures lower than 0°C (32°F). The
market has witnessed an evolutionary change over the last few years. It has shifted from mere storage
of food products in cold storage warehouses and their refrigerated transportation to the provision of
value-added services to customers. Some of these value-added services include disaster recovery
services, specialized services for specific customers, and web interfaces that improve the customer
interface with suppliers as it enables them to track shipments throughout the supply chain.
Demand for refrigerated and frozen storage is concentrated among food products, which
account for 88 percent of capacity, while the remaining 12 percent is mainly comprised of
pharmaceuticals, floral and fur products that are subject to spoilage if not maintained at a suitable
temperature. Major market segmentation broken down by industry is distributed among food
manufacturers (33 percent), food wholesalers (33 percent), retailers (22 percent), pharmaceuticals,
floral, and fur products (12 percent). Much of the demand for cold storage is for domestic consumption.
Demand from the food manufactures and food retailers segments are expected to decline as more
retailers bypass wholesalers and purchase goods directly from manufacturers.12 The share of industry
revenue will remain low as many food retailers continue to operate their own refrigerated warehouses
(IBISWorld, 2015).
Alternatively, food wholesalers and pharmaceuticals, floral, and fur product market segments
have grown significantly over the past fifteen years as downstream customers have increasingly
outsourced warehousing and distribution functions in order to improve operating efficiencies.
Pharmaceutical companies built inventories to meet an expected increase in demand during the past
five years, boosting demand for refrigerated storage from this segment. Sales of fur products in the
United States have decreased over the past decade, with the recession and warmer weather
12 Wholesale bypass is a phenomena in which retailers purchase goods directly from manufacturers, leaving wholesalers out of the supply chain.
21
accelerating the decline. However, demand for refrigerated storage from producers of fur has increased
over the past five years as exports have increased with growing demand from East Asian countries.
The extent of this expansion has been somewhat limited by the proliferation of “just-in-time”
inventory management, which has made it easier for manufacturers to ship products to market faster,
thereby reducing the need for warehousing. The level of trade in perishable goods also has a strong
effect on industry demand, as the long distance transport of these products usually necessitates their
temporary storage in refrigerated storage facilities. The market for specialized cold storage facilities is
expected to grow with consumer demand for specialty, health conscious food products, such all-natural
and organic foods that are niche oriented and require small-batch handling. In Maine and the New
England region, the number of organic farms has increased dramatically over the last 10 years and
continues to trend upwards. The industry’s services are also tied the demand for medicines and other
pharmaceutical products requiring refrigeration. This is expected to be the case as large cohorts of baby
boomer population move into retirement ages.
Specific product groupings exported from the Portland region that may require refrigerated
storage, include the following:
fish, fresh, chilled or frozen and other marine products;
seafood products prepared, canned and packaged
fruit and vegetable preserves or specialty foods
farmed fish and related products
meat products and meat packaging products
pharmaceuticals and medicines
One challenge of these products is the regulatory and inspection compliance requirements of both
US and import countries. Currently, there does not exist an on-site USDA inspection facility in proximity
to the Port of Portland. However, Americold Storage also operates cold storage facilities in the Boston
region with access to FDA inspection facilities providing an efficient logistical.
New England capacity and competitive landscape
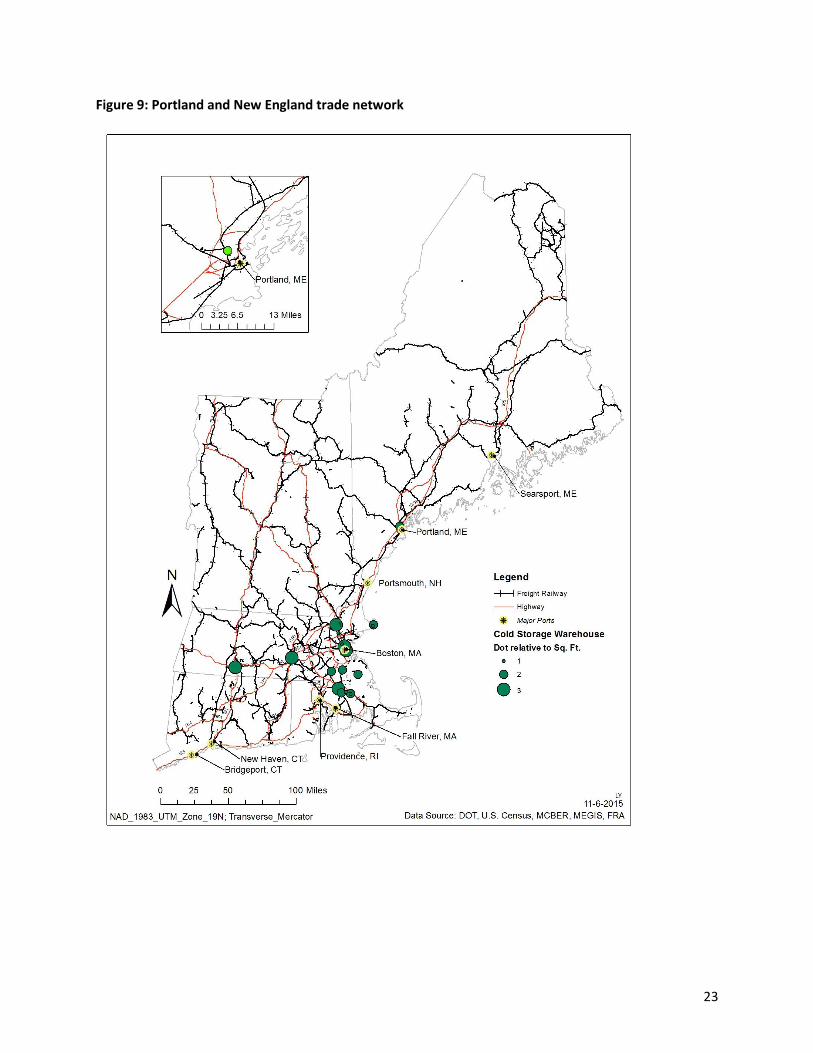
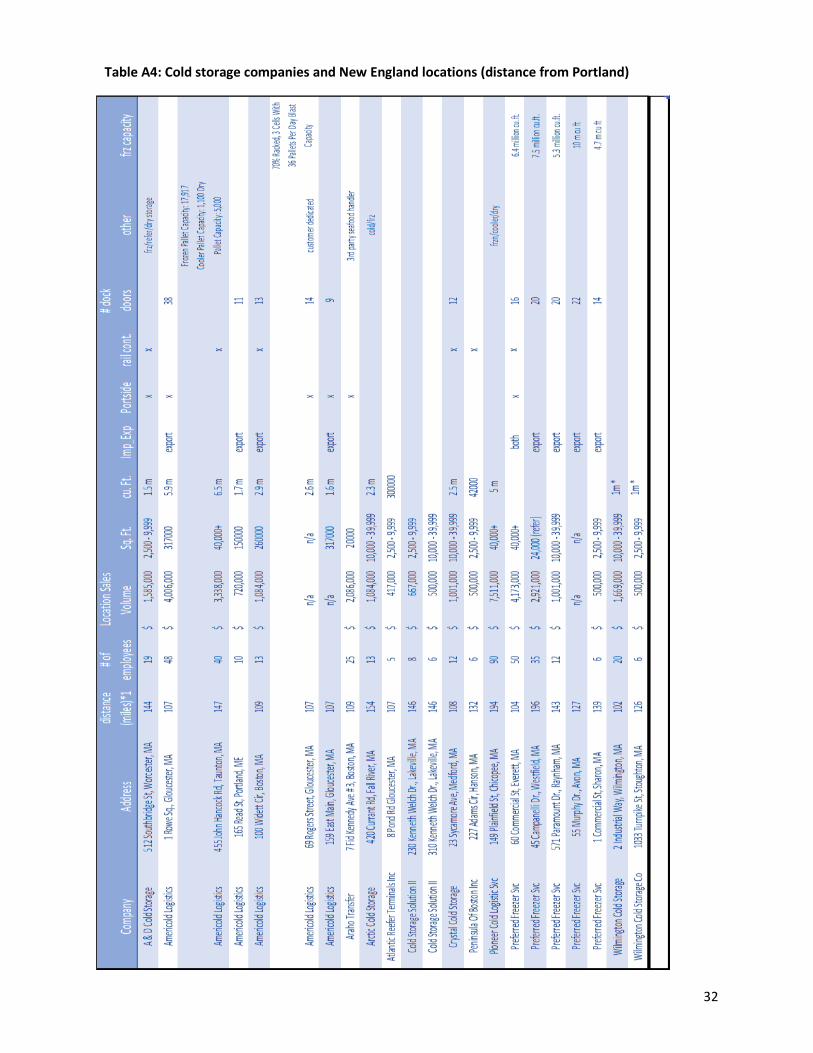
Gross refrigerated storage capacity in New England totaled 121 million cubic feet as of 2013,
while approximately 100 million of that space was usable refrigerated storage capacity. A majority of
cold storage warehouses in New England are located between 100 and 146 miles from Portland, with an
average distance of 131 miles (refer to Figure 9 and Table A4 in Appendices). About half of all New
England locations have a square footage between 10,000 and 39,999, while another half of facilitates
carry storage capacity of between 2,500 and 9,999 sq. ft. Most locations offer a variety of services such
as value added services or exports. Six locations are connected to rail, while another six are located
aside port facilities. Americold Storage, who is to develop the facility in Portland, operates several
locations around greater Boston which house USDA Inspection Services and bonded warehouses. A list
of cold storage facilities and specifications can be found in Table 3 of the Appendices.
22
Challenges with transport logistics
When looking at domestic transportation of international trade freight, 36 percent by tonnage
and 61 percent by value was moved by truck in 2007. Federal Highway Administration (FHWA) estimates
of domestic transport of international trade by truck are expected to rise by upwards of 60 percent.
Without an increase to the capacity of our interstate highway systems and clean renewable fuels to
power the vehicles on them, the cost of over-the-road freight transport will inevitably increase and the
competitiveness of associated firms will decrease. It may be helpful and strategic for metros, firms, and
state agencies alike to seek alternative intermodal sources for freight transport to over the road
transport. For Maine, this may include rail and articulated tug barge feeder systems, both of which have
a density cost advantage over tractor-trailer trucks and aviation. Container shipping has a density cost
advantage over railcar, trailer, and aviation—making high-density, low margin commodities such as
pulp, paper, single serving non-alcoholic bottle beverages, and others ideal products for rail systems.13
Maine and much of New England is serviced by Class II and III regional freight rail service with
limited access to Class I14. In general, the Class II and III lines that are accessible across Maine limit the
weight of products that can be shipped at a time, thereby a relative cost disadvantage over Class I.
Figure 9 shows the freight and transportation network connecting the Port of Portland with the rest of
New England and key distribution centers in Boston and northern Maine. Maine relies on freight
facilities located outside of the state. For example, the ports of Halifax and St. John to the east provide
marine and/or rail links, including Class I freight rail, while Boston to the south has connections to ports
and Class I rail. Recent expansion of the rail line to the IMT at the Port of Portland and the adjacent cold
storage warehouse are obvious advantages in linking multi-modal transportation with Eimskip
capacities.
Maine’s railroad infrastructure has been downsized over the last 40 years. Historically, rail in
Maine has serviced the potato industry and more recently the pulp and paper industry. Though declines
in the pulp and paper industry have reduced services for rail shipment. Lack of investment in
infrastructure has followed the dispersion of freight generating business away from traditional rail
served locations to new locations along the interstate highway system. None of the seven
transcontinental Class I railroads traverse Maine, New Hampshire or Vermont. Maine’s railroad system
is composed of Class II and III rails and face weight and cost-benefit restrictions. Furthermore, the
proliferation of just-in-time inventory demands timely product transport. Rail is impractical for these
types of inventory and supplier management systems. However, these management systems are
generally reserved for specific types of manufacturing industries and are much less intensive in food
production.
13 A majority of this information is sourced from the New England Marine Highway Project Service Design, October 15, 2013 report. 14 Rail networks depicted in Figure 10 do not distinguish between rail Class types. However, there are only a handful of Class I
rail that run services in New England, primarily located in Massachusetts.
23
Figure 9: Portland and New England trade network
24
VII. Conclusions
The new developments at the Port of Portland offer significant opportunities to bolster
economic development and prosperity in the region and statewide through increased trade and foreign
investment. In order for an export strategy to be successful, initiatives will need to understand and
exploit niche opportunities, as well as act in a supportive role to the larger New England ports. This
market assessment was an attempt to understand the key industry and export strengths in the greater
Portland region (and state of Maine) which may help lay the foundation for initiatives aimed at
identifying niche opportunities. There are several broad findings that are important to consider related
to the Port of Portland’s export capacity.
Industry employment specializations are reflective of export specializations in the state of
Maine. This suggests that the key competitive industries in the region are already exporting their
products. These include seafood processing, pharmaceuticals and medicines, and paper and other
timber related products. In addition, a number of other food related goods are key exports in the region
that likely require temperature controlled environments to ship products.
Another key opportunity to consider, is the existing specialization in medical related products
and the Portland region’s proximity to the route 128 corridor in greater Boston. Just 100 miles from the
Port of Portland and home to hundreds of biomedical and pharmaceutical manufacturing companies,
costs along the 128 corridor continue to rise in both labor and real estate in the region. As production
becomes more standardized for certain drugs and medical equipment due to patent expirations and
other market changes, Portland offers many attractive locational advantages. These include such
attractors as lower wages for workers relative to Boston metro wages, cold storage capacity, and more
direct access to northern European markets. We suggest further exploring the viability of a niche in
medicines and pharmaceutical exports, particularly as they relate to cold storage requirements.
Any export strategy must remember that quick jobs should not be the priority. Rather strategy
should strive to enhance the competitiveness of the region by bolstering supplier networks, resilience,
and innovation. This starts with focusing on the industries and firms that already exist in the region that
are strengths to help build clusters that provide differentiation in international markets. However, the
artisanal nature of many small businesses in Portland, particularly related to the food space may prove
challenging to export markets, because of the lack of scalable nature of these businesses which runs
counter to traditional trade arrangements that are based on volume and consistent, standardized nature
of products. However, fostering working relationships across both public and private sector stakeholders
offers the greatest opportunity for rewards. Central to this is the alignment of goals among
stakeholders.
25
Appendices
Table A1: Definitions of Portland Port District
Source: US Census
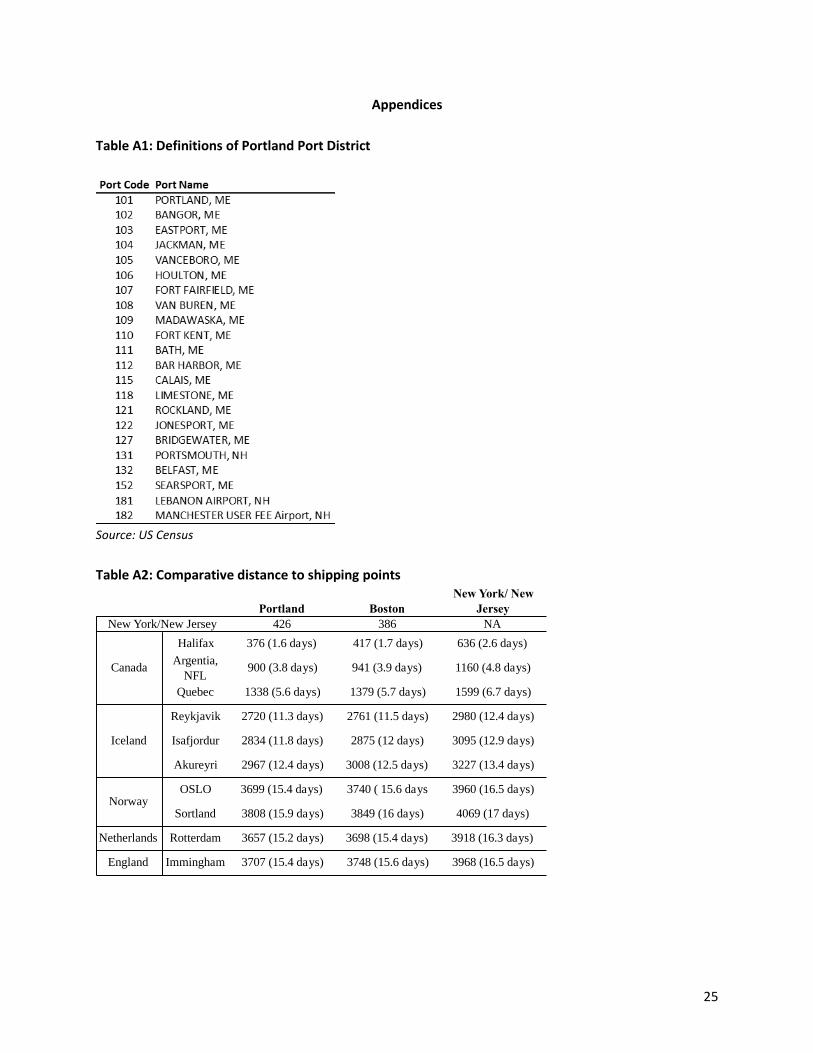
Table A2: Comparative distance to shipping points
Portland Boston
New York/ New
Jersey
426 386 NA
Halifax 376 (1.6 days) 417 (1.7 days) 636 (2.6 days)
Argentia,
NFL 900 (3.8 days) 941 (3.9 days) 1160 (4.8 days)
Quebec 1338 (5.6 days) 1379 (5.7 days) 1599 (6.7 days)
Reykjavik 2720 (11.3 days) 2761 (11.5 days) 2980 (12.4 days)
Isafjordur 2834 (11.8 days) 2875 (12 days) 3095 (12.9 days)
Akureyri 2967 (12.4 days) 3008 (12.5 days) 3227 (13.4 days)
OSLO 3699 (15.4 days) 3740 ( 15.6 days 3960 (16.5 days)
Sortland 3808 (15.9 days) 3849 (16 days) 4069 (17 days)
Netherlands Rotterdam 3657 (15.2 days) 3698 (15.4 days) 3918 (16.3 days)
England Immingham 3707 (15.4 days) 3748 (15.6 days) 3968 (16.5 days)
Iceland
Norway
New York/New Jersey
Canada
26
Figure A1: Eimskip service routes
Figure 2A: Top 25 product exports from Portland by broad product HS code, 2014
27
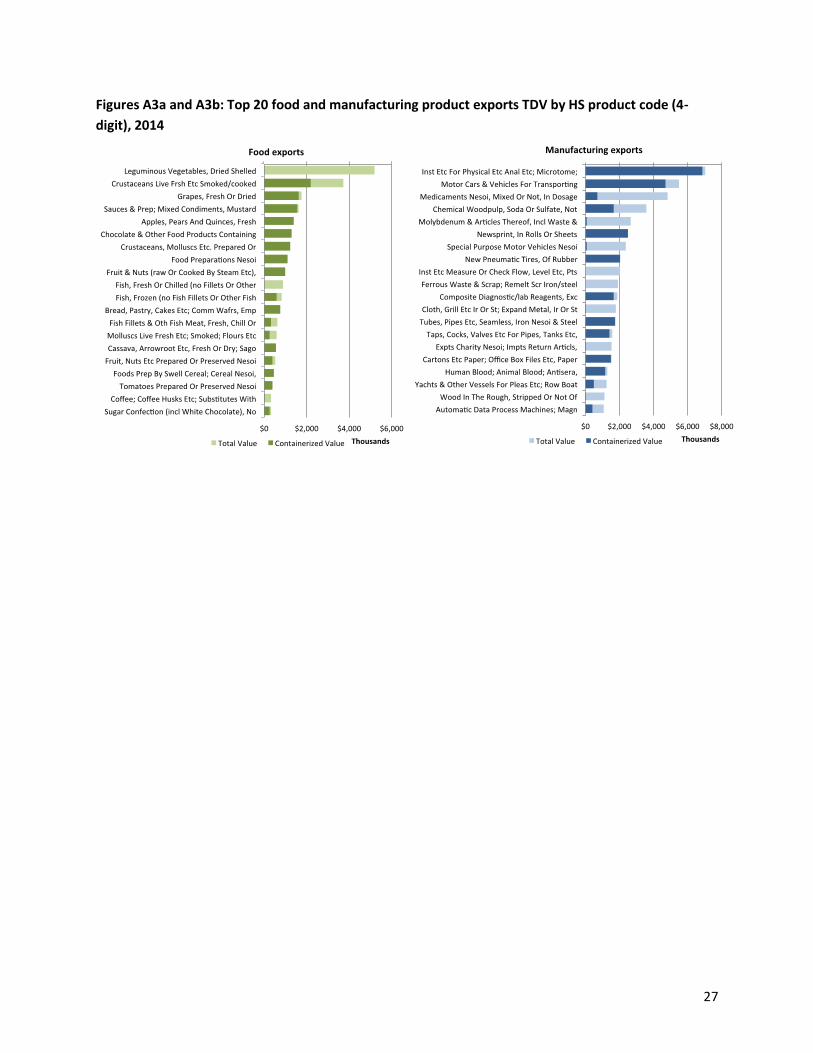
Figures A3a and A3b: Top 20 food and manufacturing product exports TDV by HS product code (4-
digit), 2014
28
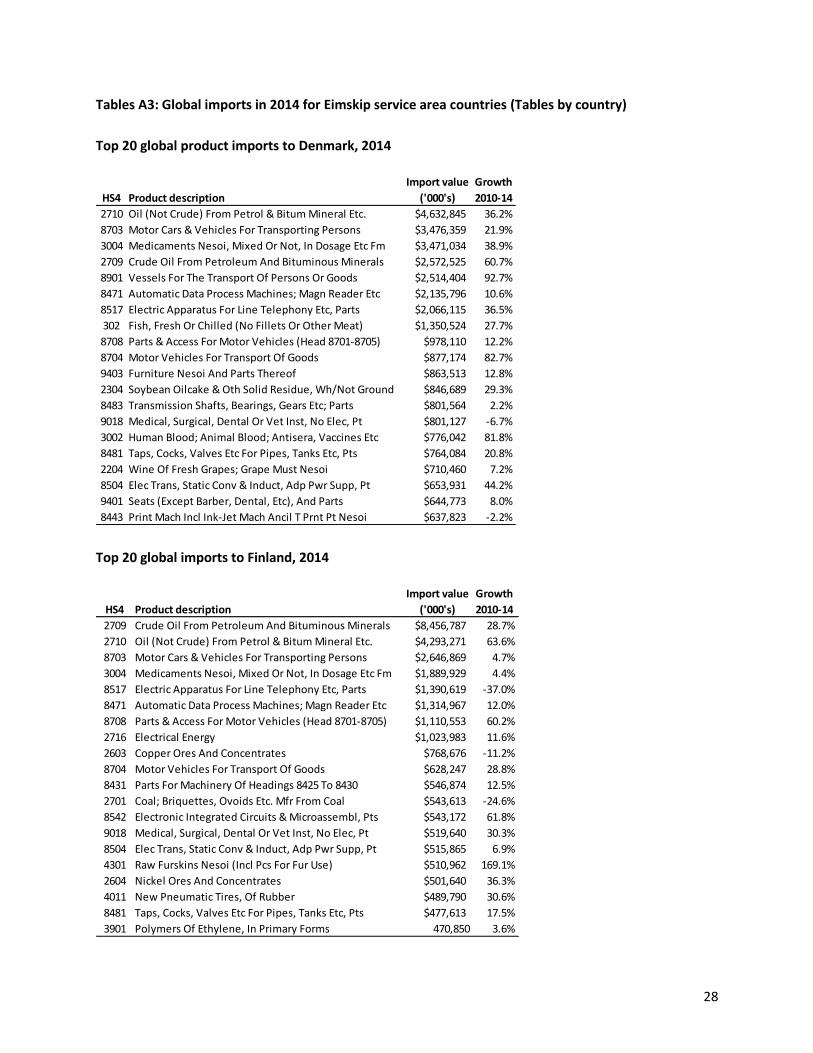
Tables A3: Global imports in 2014 for Eimskip service area countries (Tables by country)
Top 20 global product imports to Denmark, 2014
Top 20 global imports to Finland, 2014
HS4 Product description
Import value
('000's)
Growth
2010-14
2710 Oil (Not Crude) From Petrol & Bitum Mineral Etc. $4,632,845 36.2%
8703 Motor Cars & Vehicles For Transporting Persons $3,476,359 21.9%
3004 Medicaments Nesoi, Mixed Or Not, In Dosage Etc Fm $3,471,034 38.9%
2709 Crude Oil From Petroleum And Bituminous Minerals $2,572,525 60.7%
8901 Vessels For The Transport Of Persons Or Goods $2,514,404 92.7%
8471 Automatic Data Process Machines; Magn Reader Etc $2,135,796 10.6%
8517 Electric Apparatus For Line Telephony Etc, Parts $2,066,115 36.5%
302 Fish, Fresh Or Chilled (No Fillets Or Other Meat) $1,350,524 27.7%
8708 Parts & Access For Motor Vehicles (Head 8701-8705) $978,110 12.2%
8704 Motor Vehicles For Transport Of Goods $877,174 82.7%
9403 Furniture Nesoi And Parts Thereof $863,513 12.8%
2304 Soybean Oilcake & Oth Solid Residue, Wh/Not Ground $846,689 29.3%
8483 Transmission Shafts, Bearings, Gears Etc; Parts $801,564 2.2%
9018 Medical, Surgical, Dental Or Vet Inst, No Elec, Pt $801,127 -6.7%
3002 Human Blood; Animal Blood; Antisera, Vaccines Etc $776,042 81.8%
8481 Taps, Cocks, Valves Etc For Pipes, Tanks Etc, Pts $764,084 20.8%
2204 Wine Of Fresh Grapes; Grape Must Nesoi $710,460 7.2%
8504 Elec Trans, Static Conv & Induct, Adp Pwr Supp, Pt $653,931 44.2%
9401 Seats (Except Barber, Dental, Etc), And Parts $644,773 8.0%
8443 Print Mach Incl Ink-Jet Mach Ancil T Prnt Pt Nesoi $637,823 -2.2%
HS4 Product description
Import value
('000's)
Growth
2010-14
2709 Crude Oil From Petroleum And Bituminous Minerals $8,456,787 28.7%
2710 Oil (Not Crude) From Petrol & Bitum Mineral Etc. $4,293,271 63.6%
8703 Motor Cars & Vehicles For Transporting Persons $2,646,869 4.7%
3004 Medicaments Nesoi, Mixed Or Not, In Dosage Etc Fm $1,889,929 4.4%
8517 Electric Apparatus For Line Telephony Etc, Parts $1,390,619 -37.0%
8471 Automatic Data Process Machines; Magn Reader Etc $1,314,967 12.0%
8708 Parts & Access For Motor Vehicles (Head 8701-8705) $1,110,553 60.2%
2716 Electrical Energy $1,023,983 11.6%
2603 Copper Ores And Concentrates $768,676 -11.2%
8704 Motor Vehicles For Transport Of Goods $628,247 28.8%
8431 Parts For Machinery Of Headings 8425 To 8430 $546,874 12.5%
2701 Coal; Briquettes, Ovoids Etc. Mfr From Coal $543,613 -24.6%
8542 Electronic Integrated Circuits & Microassembl, Pts $543,172 61.8%
9018 Medical, Surgical, Dental Or Vet Inst, No Elec, Pt $519,640 30.3%
8504 Elec Trans, Static Conv & Induct, Adp Pwr Supp, Pt $515,865 6.9%
4301 Raw Furskins Nesoi (Incl Pcs For Fur Use) $510,962 169.1%
2604 Nickel Ores And Concentrates $501,640 36.3%
4011 New Pneumatic Tires, Of Rubber $489,790 30.6%
8481 Taps, Cocks, Valves Etc For Pipes, Tanks Etc, Pts $477,613 17.5%
3901 Polymers Of Ethylene, In Primary Forms 470,850 3.6%
29
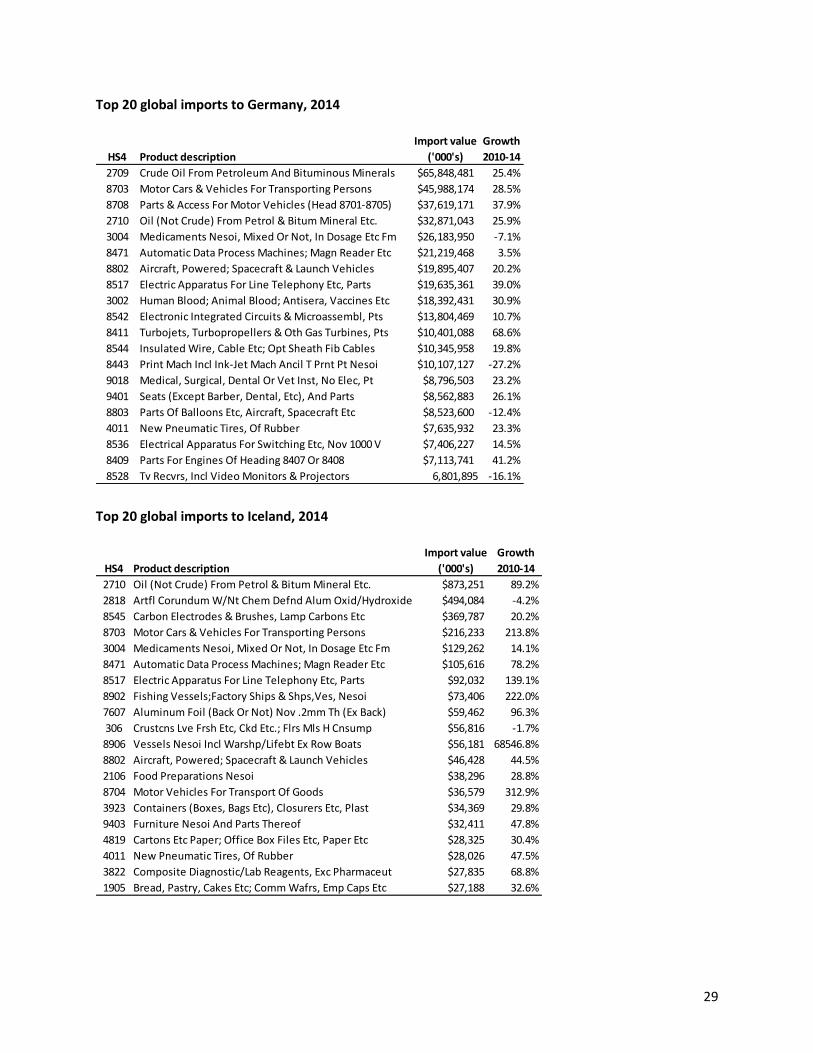
Top 20 global imports to Germany, 2014
Top 20 global imports to Iceland, 2014
HS4 Product description
Import value
('000's)
Growth
2010-14
2709 Crude Oil From Petroleum And Bituminous Minerals $65,848,481 25.4%
8703 Motor Cars & Vehicles For Transporting Persons $45,988,174 28.5%
8708 Parts & Access For Motor Vehicles (Head 8701-8705) $37,619,171 37.9%
2710 Oil (Not Crude) From Petrol & Bitum Mineral Etc. $32,871,043 25.9%
3004 Medicaments Nesoi, Mixed Or Not, In Dosage Etc Fm $26,183,950 -7.1%
8471 Automatic Data Process Machines; Magn Reader Etc $21,219,468 3.5%
8802 Aircraft, Powered; Spacecraft & Launch Vehicles $19,895,407 20.2%
8517 Electric Apparatus For Line Telephony Etc, Parts $19,635,361 39.0%
3002 Human Blood; Animal Blood; Antisera, Vaccines Etc $18,392,431 30.9%
8542 Electronic Integrated Circuits & Microassembl, Pts $13,804,469 10.7%
8411 Turbojets, Turbopropellers & Oth Gas Turbines, Pts $10,401,088 68.6%
8544 Insulated Wire, Cable Etc; Opt Sheath Fib Cables $10,345,958 19.8%
8443 Print Mach Incl Ink-Jet Mach Ancil T Prnt Pt Nesoi $10,107,127 -27.2%
9018 Medical, Surgical, Dental Or Vet Inst, No Elec, Pt $8,796,503 23.2%
9401 Seats (Except Barber, Dental, Etc), And Parts $8,562,883 26.1%
8803 Parts Of Balloons Etc, Aircraft, Spacecraft Etc $8,523,600 -12.4%
4011 New Pneumatic Tires, Of Rubber $7,635,932 23.3%
8536 Electrical Apparatus For Switching Etc, Nov 1000 V $7,406,227 14.5%
8409 Parts For Engines Of Heading 8407 Or 8408 $7,113,741 41.2%
8528 Tv Recvrs, Incl Video Monitors & Projectors 6,801,895 -16.1%
HS4 Product description
Import value
('000's)
Growth
2010-14
2710 Oil (Not Crude) From Petrol & Bitum Mineral Etc. $873,251 89.2%
2818 Artfl Corundum W/Nt Chem Defnd Alum Oxid/Hydroxide $494,084 -4.2%
8545 Carbon Electrodes & Brushes, Lamp Carbons Etc $369,787 20.2%
8703 Motor Cars & Vehicles For Transporting Persons $216,233 213.8%
3004 Medicaments Nesoi, Mixed Or Not, In Dosage Etc Fm $129,262 14.1%
8471 Automatic Data Process Machines; Magn Reader Etc $105,616 78.2%
8517 Electric Apparatus For Line Telephony Etc, Parts $92,032 139.1%
8902 Fishing Vessels;Factory Ships & Shps,Ves, Nesoi $73,406 222.0%
7607 Aluminum Foil (Back Or Not) Nov .2mm Th (Ex Back) $59,462 96.3%
306 Crustcns Lve Frsh Etc, Ckd Etc.; Flrs Mls H Cnsump $56,816 -1.7%
8906 Vessels Nesoi Incl Warshp/Lifebt Ex Row Boats $56,181 68546.8%
8802 Aircraft, Powered; Spacecraft & Launch Vehicles $46,428 44.5%
2106 Food Preparations Nesoi $38,296 28.8%
8704 Motor Vehicles For Transport Of Goods $36,579 312.9%
3923 Containers (Boxes, Bags Etc), Closurers Etc, Plast $34,369 29.8%
9403 Furniture Nesoi And Parts Thereof $32,411 47.8%
4819 Cartons Etc Paper; Office Box Files Etc, Paper Etc $28,325 30.4%
4011 New Pneumatic Tires, Of Rubber $28,026 47.5%
3822 Composite Diagnostic/Lab Reagents, Exc Pharmaceut $27,835 68.8%
1905 Bread, Pastry, Cakes Etc; Comm Wafrs, Emp Caps Etc $27,188 32.6%
30
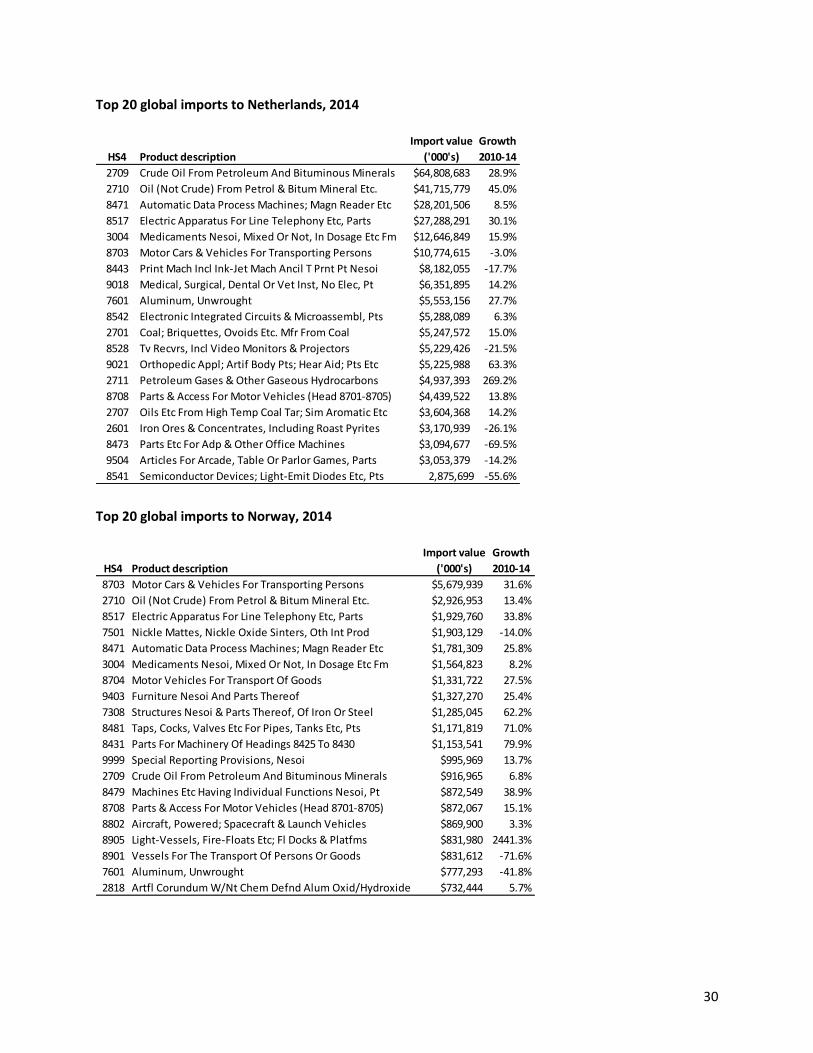
Top 20 global imports to Netherlands, 2014
Top 20 global imports to Norway, 2014
HS4 Product description
Import value
('000's)
Growth
2010-14
2709 Crude Oil From Petroleum And Bituminous Minerals $64,808,683 28.9%
2710 Oil (Not Crude) From Petrol & Bitum Mineral Etc. $41,715,779 45.0%
8471 Automatic Data Process Machines; Magn Reader Etc $28,201,506 8.5%
8517 Electric Apparatus For Line Telephony Etc, Parts $27,288,291 30.1%
3004 Medicaments Nesoi, Mixed Or Not, In Dosage Etc Fm $12,646,849 15.9%
8703 Motor Cars & Vehicles For Transporting Persons $10,774,615 -3.0%
8443 Print Mach Incl Ink-Jet Mach Ancil T Prnt Pt Nesoi $8,182,055 -17.7%
9018 Medical, Surgical, Dental Or Vet Inst, No Elec, Pt $6,351,895 14.2%
7601 Aluminum, Unwrought $5,553,156 27.7%
8542 Electronic Integrated Circuits & Microassembl, Pts $5,288,089 6.3%
2701 Coal; Briquettes, Ovoids Etc. Mfr From Coal $5,247,572 15.0%
8528 Tv Recvrs, Incl Video Monitors & Projectors $5,229,426 -21.5%
9021 Orthopedic Appl; Artif Body Pts; Hear Aid; Pts Etc $5,225,988 63.3%
2711 Petroleum Gases & Other Gaseous Hydrocarbons $4,937,393 269.2%
8708 Parts & Access For Motor Vehicles (Head 8701-8705) $4,439,522 13.8%
2707 Oils Etc From High Temp Coal Tar; Sim Aromatic Etc $3,604,368 14.2%
2601 Iron Ores & Concentrates, Including Roast Pyrites $3,170,939 -26.1%
8473 Parts Etc For Adp & Other Office Machines $3,094,677 -69.5%
9504 Articles For Arcade, Table Or Parlor Games, Parts $3,053,379 -14.2%
8541 Semiconductor Devices; Light-Emit Diodes Etc, Pts 2,875,699 -55.6%
HS4 Product description
Import value
('000's)
Growth
2010-14
8703 Motor Cars & Vehicles For Transporting Persons $5,679,939 31.6%
2710 Oil (Not Crude) From Petrol & Bitum Mineral Etc. $2,926,953 13.4%
8517 Electric Apparatus For Line Telephony Etc, Parts $1,929,760 33.8%
7501 Nickle Mattes, Nickle Oxide Sinters, Oth Int Prod $1,903,129 -14.0%
8471 Automatic Data Process Machines; Magn Reader Etc $1,781,309 25.8%
3004 Medicaments Nesoi, Mixed Or Not, In Dosage Etc Fm $1,564,823 8.2%
8704 Motor Vehicles For Transport Of Goods $1,331,722 27.5%
9403 Furniture Nesoi And Parts Thereof $1,327,270 25.4%
7308 Structures Nesoi & Parts Thereof, Of Iron Or Steel $1,285,045 62.2%
8481 Taps, Cocks, Valves Etc For Pipes, Tanks Etc, Pts $1,171,819 71.0%
8431 Parts For Machinery Of Headings 8425 To 8430 $1,153,541 79.9%
9999 Special Reporting Provisions, Nesoi $995,969 13.7%
2709 Crude Oil From Petroleum And Bituminous Minerals $916,965 6.8%
8479 Machines Etc Having Individual Functions Nesoi, Pt $872,549 38.9%
8708 Parts & Access For Motor Vehicles (Head 8701-8705) $872,067 15.1%
8802 Aircraft, Powered; Spacecraft & Launch Vehicles $869,900 3.3%
8905 Light-Vessels, Fire-Floats Etc; Fl Docks & Platfms $831,980 2441.3%
8901 Vessels For The Transport Of Persons Or Goods $831,612 -71.6%
7601 Aluminum, Unwrought $777,293 -41.8%
2818 Artfl Corundum W/Nt Chem Defnd Alum Oxid/Hydroxide $732,444 5.7%
31
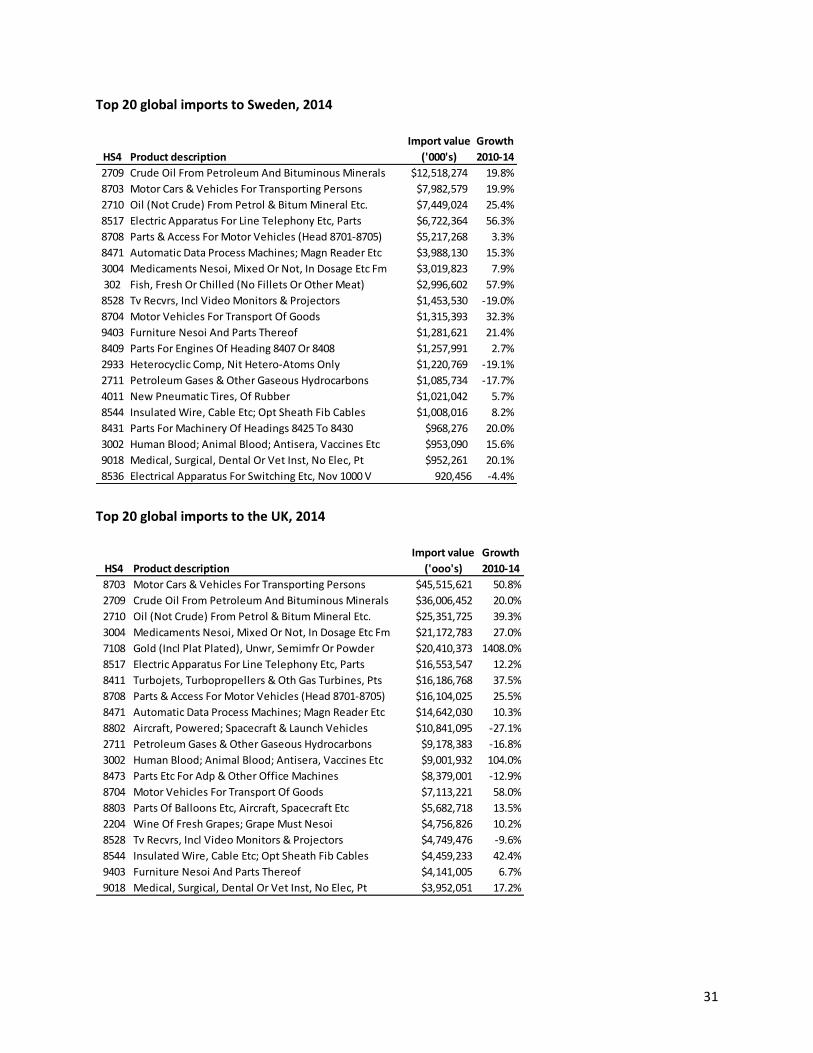
Top 20 global imports to Sweden, 2014
Top 20 global imports to the UK, 2014
HS4 Product description
Import value
('000's)
Growth
2010-14
2709 Crude Oil From Petroleum And Bituminous Minerals $12,518,274 19.8%
8703 Motor Cars & Vehicles For Transporting Persons $7,982,579 19.9%
2710 Oil (Not Crude) From Petrol & Bitum Mineral Etc. $7,449,024 25.4%
8517 Electric Apparatus For Line Telephony Etc, Parts $6,722,364 56.3%
8708 Parts & Access For Motor Vehicles (Head 8701-8705) $5,217,268 3.3%
8471 Automatic Data Process Machines; Magn Reader Etc $3,988,130 15.3%
3004 Medicaments Nesoi, Mixed Or Not, In Dosage Etc Fm $3,019,823 7.9%
302 Fish, Fresh Or Chilled (No Fillets Or Other Meat) $2,996,602 57.9%
8528 Tv Recvrs, Incl Video Monitors & Projectors $1,453,530 -19.0%
8704 Motor Vehicles For Transport Of Goods $1,315,393 32.3%
9403 Furniture Nesoi And Parts Thereof $1,281,621 21.4%
8409 Parts For Engines Of Heading 8407 Or 8408 $1,257,991 2.7%
2933 Heterocyclic Comp, Nit Hetero-Atoms Only $1,220,769 -19.1%
2711 Petroleum Gases & Other Gaseous Hydrocarbons $1,085,734 -17.7%
4011 New Pneumatic Tires, Of Rubber $1,021,042 5.7%
8544 Insulated Wire, Cable Etc; Opt Sheath Fib Cables $1,008,016 8.2%
8431 Parts For Machinery Of Headings 8425 To 8430 $968,276 20.0%
3002 Human Blood; Animal Blood; Antisera, Vaccines Etc $953,090 15.6%
9018 Medical, Surgical, Dental Or Vet Inst, No Elec, Pt $952,261 20.1%
8536 Electrical Apparatus For Switching Etc, Nov 1000 V 920,456 -4.4%
HS4 Product description
Import value
('ooo's)
Growth
2010-14
8703 Motor Cars & Vehicles For Transporting Persons $45,515,621 50.8%
2709 Crude Oil From Petroleum And Bituminous Minerals $36,006,452 20.0%
2710 Oil (Not Crude) From Petrol & Bitum Mineral Etc. $25,351,725 39.3%
3004 Medicaments Nesoi, Mixed Or Not, In Dosage Etc Fm $21,172,783 27.0%
7108 Gold (Incl Plat Plated), Unwr, Semimfr Or Powder $20,410,373 1408.0%
8517 Electric Apparatus For Line Telephony Etc, Parts $16,553,547 12.2%
8411 Turbojets, Turbopropellers & Oth Gas Turbines, Pts $16,186,768 37.5%
8708 Parts & Access For Motor Vehicles (Head 8701-8705) $16,104,025 25.5%
8471 Automatic Data Process Machines; Magn Reader Etc $14,642,030 10.3%
8802 Aircraft, Powered; Spacecraft & Launch Vehicles $10,841,095 -27.1%
2711 Petroleum Gases & Other Gaseous Hydrocarbons $9,178,383 -16.8%
3002 Human Blood; Animal Blood; Antisera, Vaccines Etc $9,001,932 104.0%
8473 Parts Etc For Adp & Other Office Machines $8,379,001 -12.9%
8704 Motor Vehicles For Transport Of Goods $7,113,221 58.0%
8803 Parts Of Balloons Etc, Aircraft, Spacecraft Etc $5,682,718 13.5%
2204 Wine Of Fresh Grapes; Grape Must Nesoi $4,756,826 10.2%
8528 Tv Recvrs, Incl Video Monitors & Projectors $4,749,476 -9.6%
8544 Insulated Wire, Cable Etc; Opt Sheath Fib Cables $4,459,233 42.4%
9403 Furniture Nesoi And Parts Thereof $4,141,005 6.7%
9018 Medical, Surgical, Dental Or Vet Inst, No Elec, Pt $3,952,051 17.2%
32
Table A4: Cold storage companies and New England locations (distance from Portland)