Embed Size (px)
Citation preview

PORTFOLIO ADDITIONAL ESTIMATES STATEMENTS
2007-08
FOREIGN AFFAIRS AND TRADE PORTFOLIO

© Commonwealth of Australia 2008
ISBN 978-1-921244-62-9
This work is copyright. Apart from any use as permitted under the Copyright Act 1968, no part may be reproduced by any process without prior written permission from the Commonwealth. Requests and enquiries concerning reproduction and rights should be addressed to the:
Commonwealth Copyright Administration Attorney-General’s Department Robert Garran Offices National Circuit BARTON ACT 2600
Or posted at Website: www.ag.gov.au/cca
Printed by CanPrint Communications Pty Ltd

Signed letter to be inserted here by printer.


TABLE OF CONTENTS
User Guide .................................................................................................................... ix Introduction........................................................................................................ ix Structure of the Portfolio Additional Estimates Statements ............................... x Styles and conventions used ............................................................................ xi
Portfolio Overview ........................................................................................................3 Additional estimates and variations — Portfolio level ........................................3
Agency Additional Estimates Statements ..................................................................7
Department of Foreign Affairs and Trade (DFAT)..............................................9 Australian Trade Commission (Austrade) ........................................................57 AusAID (Australian Agency for International Development) ............................83 Australian Centre for International Agricultural Research (ACIAR) ...............109
Glossary .....................................................................................................................131


USER GUIDE TO THE
PORTFOLIO ADDITIONAL ESTIMATES STATEMENTS


ix
USER GUIDE INTRODUCTION
The purpose of the Portfolio Additional Estimates Statements (PAES), like that of the Portfolio Budget Statements, is to inform Senators and Members of Parliament and the public of the proposed allocation of resources to government outcomes by agencies within the portfolio. However, unlike the Portfolio Budget Statements, the PAES summarise only the changes in resourcing by outcome since the Budget, that is, they do not include a complete resourcing table for the agency. The PAES include new Measures, summarise the changes by Appropriation Bill, and, where relevant, by Special Appropriation and Special Account. The 2007-08 PAES also cover any significant changes to the portfolio which may have arisen from the change in government and the subsequent Administrative Arrangements Orders of 3 December 2007 and 25 January 2008.
The PAES facilitate understanding of the proposed appropriations in Appropriation Bills (No. 3 and No. 4) 2007-08. In this sense the PAES are declared by the Additional Estimates Appropriation Bills to be a ‘relevant document’ to the interpretation of the Bills according to section 15AB of the Acts Interpretation Act 1901.
Whereas the Mid-Year Economic and Fiscal Outlook 2007-08 is a mid-year budget report which provides updated information to allow the assessment of the Government’s fiscal performance against its fiscal strategy, the PAES update the most recent budget appropriations for agencies within the portfolio.

User Guide
x
STRUCTURE OF THE PORTFOLIO ADDITIONAL ESTIMATES STATEMENTS
The PAES are presented in three parts with subsections.
User guide
Provides an introduction explaining the purpose of the PAES as well as information in relation to the styles and conventions used.
Portfolio overview
Provides an overview of the portfolio, including a chart that outlines the outcomes for agencies in the portfolio.
Agency additional estimates statements
A statement (under the name of the agency) for each agency affected by Additional Estimates.
Section 1: Agency overview, variations and measures
This section details the link between the resources appropriated, the impact of any post-Budget measures, and their application to the outputs and administered items (usually programmes) that contribute to the achievement of outcomes. This section also reports changes to receipts from independent sources; changes to estimates of expenses from Special Appropriations; and changes to estimated Special Account flows.
Section 2: Revisions to outcomes, administered items and outputs
This section details changes to planned Government outcomes and / or to the contributing administered items and agency outputs.
Section 3: Budgeted financial statements
This section contains revisions to the budgeted financial statements in accrual format covering Budget year, previous year and the three out-years for each agency.
Glossary Explains key terms.

User Guide
xi
STYLES AND CONVENTIONS USED
(a) The following notations may be used:
NEC/nec not elsewhere classified
AEST Australian Eastern Standard Time
- nil
.. not zero, but rounded to zero
na not applicable (unless otherwise specified)
nfp not for publication
$m $ million
(b) Figures in tables and in the text may be rounded. Discrepancies in tables between totals and sums of components are due to rounding.
ENQUIRIES
Should you have any enquiries regarding this publication please contact Ann Thorpe, Chief Finance Officer, Department of Foreign Affairs and Trade on (02) 6261 1240.
A copy of this document can be located on the Australian Government Budget website at: http://www.budget.gov.au.


PORTFOLIO OVERVIEW

3
PORTFOLIO OVERVIEW
There have been no changes to the structure of the portfolio since the Portfolio Budget Statements 2007-08. The Minister for Foreign Affairs and the Minister for Trade remain the two portfolio Ministers. Following the change in government, the portfolio now has three Parliamentary Secretaries with responsibilities for Trade, Pacific Island Affairs and International Development Assistance.
The Foreign Affairs and Trade portfolio responsibilities did not change in the Administrative Arrangements Orders of 3 December 2007 or of 25 January 2008. However, Part 4 of the Administrative Arrangements Order of 3 December 2007 allocated, for the first time, separate responsibility for international climate change policy and negotiations to the Department of Climate Change which will result in a movement of resources under section 32 of the Financial Management and Accountability Act 1997 from the Department of Foreign Affairs and Trade to the Department of Climate Change.
The Government has also decided to transfer the ‘investment promotion’ function currently being undertaken by the Department of Innovation, Industry, Science and Research to the Australian Trade Commission. This is yet to be reflected in the Administrative Arrangements Order.
ADDITIONAL ESTIMATES AND VARIATIONS — PORTFOLIO LEVEL
The portfolio is seeking a net increase of $237.901 million in resourcing for 2007-08 as listed below. This includes Bill No. 3 and Bill No. 4 appropriations (Departmental and Administered). Further details are provided in each agency’s additional estimates statements.
Department of Foreign Affairs and Trade (DFAT) - $32.449 million
Departmental Items
• ($1.292m) revision to measure - Australia on the World Stage - enhancement;
• ($2.064m) revision to measure - Australia-China Free Trade Agreement - continuation of negotiations;
• ($0.500m) revision to measure - Department of Foreign Affairs and Trade - budget sustainability;
• ($3.693m) one-off Efficiency Dividend of two per cent;
• ($0.145m) off-setting costs for establishment of Office of National Security;
• $25.539m adjustment to passport funding due to the higher than expected number of passports issued;

Portfolio Overview
4
• $1.866m adjustment for VAT refunds;
• ($4.543m) adjustment for foreign exchange movements; and
• $2.756m adjustment for overseas inflation. Administered Items
• $1.250m supporting Australia’s involvement in the Asia Pacific Economic Cooperation (APEC) forum;
• $3.000m donation to Hellenic Red Cross to support relief efforts following 2007 Greek forest fires;
• $0.500m grant to support activities of Australians working overseas to promote Australia’s interests;
• $4.601m adjustment for contributions to international organisations;
• $4.000m adjustment for Export Finance and Insurance Corporation (EFIC) National Interest Account;
• $0.500m adjustment for other EFIC National Interest Account related payments; and
• $0.674m adjustment for passport refunds. Australian Trade Commission (Austrade) – ($2.223 million)
Departmental Items
• ($0.584m) foreign exchange adjustments;
• ($0.059m) adjustment for overseas inflation;
• ($2.049m) adjustment to goods and services revenue; and
• $2.869m adjustment to depreciation funding.
Administered Items
• ($2.400m) between-year movement of funds from 2007-08 to 2006-07 within Austrade as a result of higher than estimated grant payments in the Export Market Development Grants (EMDG) scheme.
AusAID (Australian Agency for International Development) – $208.596 million
Departmental Items
• ($0.410m) one-off Efficiency Dividend of two per cent.

Portfolio Overview
5
Administered Items
• $210.894m contribution to the fifteenth replenishment of the International Development Association; and
• ($1.888m) transfer of funds to the Department of the Environment, Water, Heritage and the Arts (DEWHA) for implementation of the Kokoda Track initiative.
Australian Centre for International Agricultural Research (ACIAR) - ($0.237) million
Departmental Items
• ($0.237m) one-off Efficiency Dividend of two per cent. Australian Secret Intelligence Service (ASIS) - $(0.684) million
Departmental Items
• ($0.684m) one-off Efficiency Dividend of two per cent.
PORTFOLIO AGENCIES ONLY AFFECTED BY MEASURE RELATING TO ELECTION COMMITMENT SAVINGS: TWO PER CENT EFFICIENCY DIVIDEND
One portfolio agency, the Australian Secret Intelligence Service (ASIS), is affected by the one-off two per cent Efficiency Dividend only.
Table P.1: Portfolio Agencies only affected by Measure relating to Election Commitment Savings: 2 per cent Efficiency Dividend
2007-08 2008-09 2009-10 2010-11($'000) ($'000) ($'000) ($'000)
Agency DetailsAustralian Secret Intellegence Service (ASIS) (684) (3,283) (3,520) (3,617)

Portfolio Overview
6
Figure 1: Portfolio structure and outcomes Minister for Foreign AffairsThe Hon. Stephen Smith MP
Parliamentary Secretary for International Development Assistance
The Hon. Bob McMullan MP
Parliamentary Secretary for Pacific Island Affairs The Hon. Duncan Kerr MP
Minister for TradeThe Hon. Simon Crean MP
Parliamentary Secretary to the Minister for Trade
The Hon. John Murphy MP
Australian Secret Intelligence Service
Director General, Mr David Irvine, AO
Outcome 1: Enhance government understanding of the overseas environment affecting Australia's vital interests and take
appropriate action, consistent with applicable legislation, to protect particular identified
interests
AusAID Director General, Mr Bruce Davis
Outcome 1: To assist developing countries to reduce poverty and achieve sustainable
development, in line with Australia's national interest
Outcome 2: Australia's national interest advanced by implementing a partnership
between Australia and Indonesia for reconstruction and development
Department of Foreign Affairs and Trade Secretary, Mr Michael L'Estrange, AO
Outcome 1: Australia's national interests protected and advanced through contributions to international
security, national economic and trade performance and global cooperation
Outcome 2: Australians informed about and provided access to consular and passport services in Australia
and overseas
Outcome 3: Public understanding in Australia and overseas of Australia's foreign and trade policy and a
positive image of Australia internationally
Outcome 4: Efficient management of the Commonwealth overseas owned estate
Australian Centre for International Agricultural Research
Chief Executive Officer, Mr Peter Core
Outcome 1: Agriculture in developing countries and Australia is more productive
and sustainable as a result of better technologies, practices, policies and systems
Australian Trade Commission Chief Executive Officer,
Mr Peter O'Byrne
Outcome 1: Australians succeeding in international business with widespread
community support
Outcome 2: Australians informed about and provided access to consular, passport and immigration services in specific locations
overseas
3

7
AGENCY ADDITIONAL ESTIMATES STATEMENTS
Department of Foreign Affairs and Trade (DFAT)......................................................9 Australian Trade Commission (Austrade) ................................................................57 AusAID (Australian Agency for International Development)..................................83 Australian Centre for International Agricultural Research (ACIAR) ....................109


9
DEPARTMENT OF FOREIGN AFFAIRS AND TRADE (DFAT)
Section 1: Agency overview and resources; variations and measures ...............11 Overview ..........................................................................................................11 Additional estimates and variations to outcomes.............................................15 Measures — Agency summary........................................................................18 Breakdown of additional estimates by appropriation bill ..................................19 Summary of staffing changes...........................................................................21 Other receipts available to be used .................................................................22 Estimates of expenses from special appropriations.........................................22 Estimates of special account flows ..................................................................23
Section 2: Revisions to agency outcomes ..............................................................24
Outcomes, administered items and outputs.....................................................24 Section 3: Budgeted financial statements...............................................................37
Notes to the financial statements.....................................................................54


11
DEPARTMENT OF FOREIGN AFFAIRS AND TRADE Section 1: Agency overview and resources; variations and measures
OVERVIEW
As indicated in the Portfolio Budget Statements 2007-08, the Department of Foreign Affairs and Trade works towards achieving four outcomes:
1. Australia’s national interests protected and advanced through contributions to international security, national economic and trade performance and global cooperation;
2. Australians informed about and provided access to consular and passport
services in Australia and overseas; 3. public understanding in Australia and overseas of Australia’s foreign and
trade policy and a positive image of Australia internationally; and
4. efficient management of the Commonwealth overseas owned estate. Staff serving in Canberra, in a network of overseas diplomatic posts, and in state and territory capitals and regional centres work to achieve these outcomes.
The department is implementing the Government’s savings commitments, specifically: the partial reversal of funding provided in the 2006-07 Budget for the measure Department of Foreign Affairs and Trade – budget sustainability; the reversal of additional funding provided in the 2007-08 Budget for the measure Australia-China Free Trade Agreement – continuation of negotiations; the reversal of funding provided in the 2007-08 Budget for the measure Australia on the World Stage – enhancement; and a one-off additional Efficiency Dividend of two per cent.
Separately, the department will contribute funding to meet the Government’s commitment to establish an Office of National Security in the Department of the Prime Minister and Cabinet in the interests of greater whole-of-government coordination on national security matters.
As a result of the allocation of responsibility for international climate change policy and negotiations to the Department of Climate Change under Part 4 of the Administrative Arrangements Order of 3 December 2007, the department will transfer resources under Section 32 of the Financial Management and Accountability (FMA) Act 1997 to support this function. This resource transfer is the subject of negotiations and is therefore not included in the additional estimates for the Department of Foreign Affairs and Trade.

Agency Additional Estimates Statements – DFAT
12
In the interests of international cooperation and assistance, the Government through the Department of Foreign Affairs and Trade made a donation to the Hellenic Red Cross to support bushfire relief efforts following the severe forest fires in Greece in August 2007. This donation is being appropriated to the department through Additional Estimates in administered funding.
In support of Australia’s objectives to enhance the Asia-Pacific Economic Cooperation (APEC) forum the Government agreed to additional administered resources for an increase in Australia’s APEC membership contribution and for the establishment of a Policy Support Unit within the APEC Secretariat in Singapore. This funding is being appropriated to the department through Additional Estimates.
The Government is providing administered funding to support expatriate Australians to undertake activities in support of Australia’s foreign and trade policies.

Agency Additional Estimates Statements – DFAT
13
Table 1.1: Agency outcomes and output groups Outcome Description Output groupsOutcome 1Australia's national To enhance Australia's security, to Output 1.1 - Protection and advocacyinterests protected and contribute to growth in Australia's of Australia's international interestsadvanced through economy, employment and standard through the provision of policy advicecontributions to of living, and to strengthen global to ministers and overseas diplomaticinternational security, cooperation in ways that advance activitynational economic and Australia's intereststrade performance and Output 1.2 - Secure government global cooperation communications and security of
overseas missions
Output 1.3 - Services to otheragencies in Australia and overseas(including Parliament, state representatives, business andother organisations)
Output 1.4 Services to diplomaticand consular representatives inAustralia
Outcome 2Australians informed To assist Australian travellers Output 2.1 - Consular and passportabout and provided and Australians overseas servicesaccess to consular andpassport services inAustralia and overseas
Outcome 3Public understanding in To foster public understanding of Output 3.1 - Public information Australia and overseas Australia's foreign and trade policy services and public diplomacyof Australia's foreign and and to project a positive image oftrade policy and a Australia internationallypositive image ofAustralia internationally
Outcome 4Efficient management of To manage efficiently the Output 4.1 - Property managementthe Commonwealth Commonwealth's overseasoverseas owned owned estate Output 4.2 - Contract managementestate

Agency Additional Estimates Statements – DFAT
14
Table 1.1a: Outcomes / functions transferred from Department of Foreign Affairs and Trade
Outcome / Functions Agency / DepartmentDevelopment and co-ordination of international climate change policy Department of Climate Change
International climate change negotiations Department of Climate Change

Agency Additional Estimates Statements – DFAT
15
ADDITIONAL ESTIMATES AND VARIATIONS TO OUTCOMES
The Department of Foreign Affairs and Trade is seeking an increase of $32.449 million in appropriations in 2007-08, comprising a decrease of $2.944 million for ten new measures and an increase of $35.393 million in other variations.
Table 1.2: Additional estimates and variations to outcomes – measures 2007-08 2008-09 2009-10 2010-11
($'000) ($'000) ($'000) ($'000)Measures - All Outcomes
Increase in administered appropriations
ExpensesOutcome 1Asia-Pacific Economic Cooperation forum - supporting Australia's involvement 1,250 3,927 3,927 1,949
Outcome 3Fires in Greece - donation 3,000 - - -
Working with Australians overseas to promote Australia's interests 500 200 200
CapitalNil - - - -
Decrease in departmental appropriations
ExpensesRevision to measure - Australia on the World Stage - enhancement (1,292) (4,008) (6,828) (6,932)
Revision to measure - Australia-China Free Trade Agreement - continuation of negotiations* (2,064) (4,079) - -
Revision to measure - Department of Foreign Affairs and Trade - budget sustainability (500) (8,900) (11,300) (11,300)
Election Commitment Savings: 2 per cent Efficiency Dividend (3,693) (16,216) (16,316) (16,166)
Efficiency dividend - increase in the rate from 1 per cent to 1.25 per cent - (2,069) (4,144) (6,196)
Revision to measure - Australia-Japan Free Trade Agreement - commencement of negotiations* - - - -
Off-setting costs for establishment of Office of National Security* (145) (205) (310) (314)
CapitalNil - - - - * Figures are for the DFAT component of the measure only.

Agency Additional Estimates Statements – DFAT
16
Table 1.3: Additional estimates and variations to outcomes 2007-08 2008-09 2009-10 2010-11
($'000) ($'000) ($'000) ($'000)Variations - All Outcomes
Variations in administered appropriations
Outcome 1
Adjustment for International Organisations Payments 4,601 4,601 4,601 4,601 Adjustment for EFIC National Interest Account 4,000 3,800 3,500 (1,000) Adjustment for other EFIC NIA Related Payments 500 500 500 800 Adjustment to Payments to Suppliers - Parameter Adjustments - 4 6 6
Outcome 2
Adjustment for Passport Refunds 674 - - -Adjustment for Travellers Emergency Loans - - 300 300
Variations in departmental appropriations
Adjustment for VAT refunds 2006-07 1,866 - - - Adjustment to passport funding due to higher than expected number of passports issued 25,539 - - -
Adjustment for foreign exchange rebasing (4,543) (4,543) (4,543) (4,543) Adjustment for domestic inflation in 2007-08 - 1,872 2,871 2,935 Adjustment for overseas inflation rebasing 2,756 2,756 2,756 2,756

Agency Additional Estimates Statements – DFAT
17
Foreign exchange (forex) funding adjustments The Government’s forex risk management policy operates on a “no win, no loss” basis, such that DFAT’s departmental funding is adjusted for losses or gains due to fluctuations in foreign exchange rates. Adjustments are based on the Budget Exchange Rates (BER) issued annually by the Department of Finance and Deregulation.
Within this policy framework there are two types of funding adjustments:
Between year forex rebasing Between year forex rebasing maintains the foreign currency spending power by adjusting the department’s funding for movements in the BER from one year to the next. For example, if the BER falls, funding is increased, whereas funding is reduced when the BER rises between years.
Within year forex adjustments Within year forex adjustments adjust the department’s funding for the difference between the BER and the actual exchange rate of the transaction. For example, if the actual exchange rate is less than the BER, funding is increased whereas funding is reduced when the actual exchange rate is greater than the BER.
Passports funding adjustments Under the passport funding agreement the actual level of funding for DFAT is adjusted at Additional Estimates each year for actual total passports issued in the previous year. Funding is also adjusted to reflect updated passport projections for the current year.

Agency A
dditional Estimates Statem
ents — D
FAT
18
MEASURES — AGENCY SUMMARY
Table 1.4: Summary of measures since the 2007-08 Budget Measure Outcome Output
groups 2007-08 2008-09 2009-10 2010-11affected $'000 $'000 $'000 $'000
Admin Dept Admin Dept Admin Dept Admin Deptexpenses outputs Total expenses outputs Total expenses outputs Total expenses outputs Total
Expense Measures
1.1
Capital Measures
* Figures are for the DFAT component of the measure only.
- - - 200 - 200 200 Working with Australians overseas to promote Australia's interests 3 3.1 500
Asia-Pacific Economic Cooperation forum - supporting Australia's involvement 1 1,250 -
1.1, 1.3 - -
1,250
Total of all Measures 4,750
- Total Capital Measures - - - - - - - -
4,127 4,127 (31,350) (38,898) (34,771)
Off-setting costs for establishment of Office of National Security* 1 1.1, 1.3 -
-
-
- -
1,949 (40,908)
-
(38,959)
(34,771) 1,949 (40,908) (38,959)
- -
(11,300) (11,300)
- - - - - - -
(11,300)
(7,694)
3,000
(35,477)
(2,944) 4,127 (35,477)
-
(2,944)
-
(8,900) -
3,927
(8,900)
- (205)
3,927
(16,216) -
(2,069)
Revision to measure - Department of Foreign Affairs and Trade - budget sustainability 1 1.1, 1.3,
1.4 - (11,300) -
-
-
3,927 1,949
-
-
(205)
(31,350)
200 -
-
- -
4,127 (38,898)
-
(314) (310) (310)
1,949
- -
(314)
-
Revision to measure - Australia-China Free Trade Agreement - continuation of negotiations* 1 1.1, 1.3 - (2,064) (2,064) -
(500) (500) -
(6,932) (6,932)
(4,079) - - - - - -
- (6,828) (6,828) - Revision to measure - Australia on the World Stage - enhancement - (1,292) (1,292) 3 3.1 - (4,008) (4,008)
(4,079)
4,750 (7,694)
-
-
3,927
(145) (145)
500
Total Expenses Measures
Revision to measure - Australia-Japan Free Trade Agreement - commencement of negotiations*
Fires in Greece - donation 3 3.1 3,000
1
Election Commitment Savings: 2 per cent Efficiency Dividend 1, 2, 3 - (3,693) (3,693) - (16,216) (16,166) (16,316) (16,316) - (16,166)
Efficiency dividend - increase in the rate from 1 per cent to 1.25 per cent 1, 2, 3 - - - - (2,069) (6,196) (6,196) - (4,144) (4,144) -

Agency Additional Estimates Statements — DFAT
19
BREAKDOWN OF ADDITIONAL ESTIMATES BY APPROPRIATION BILL
Table 1.5: Appropriation Bill (No. 3) 2007-08 2006-07 2007-08 2007-08 Additional Reduced
available Budget revised estimates estimates($'000) ($'000) ($'000) ($'000) ($'000)
ADMINISTERED ITEMSOutcome 1Australia's national interests protected and advanced through contributions to international security, national economic and trade performance and global cooperation
216,117 220,029 230,380 10,351 -
Outcome 2
Australians informed about and provided access to consular and passport services in Australia and overseas
500 500 500 - -
Outcome 3Public understanding in Australia and overseas of Australia's foreign and trade policy and a positive image of Australia internationally
22,720 24,778 28,278 3,500 -
Total 239,337 245,307 259,158 13,851 -
DEPARTMENTAL OUTPUTSOutcome 1Australia's national interests protected and advanced through contributions to international security, national economic and trade performance and global cooperation
562,861 542,854 534,476 - (8,378)
Outcome 2
Australians informed about and provided access to consular and passport services in Australia and overseas
212,836 211,521 229,209 17,688 -
Outcome 3Public understanding in Australia and overseas of Australia's foreign and trade policy and a positive image of Australia internationally
56,027 53,993 53,563 - (430)
Outcome 4Efficient management of the Commonwealth overseas owned estate - - - - -
Total 831,724 808,368 817,248 17,688 (8,808)
Total administered and departmental 1,071,061 1,053,675 1,076,406 31,539 (8,808)
Note: 2006-07 available appropriation is included to allow a comparison of this year's appropriation with what was made available for use in the previous year. Available appropriation is the amount available to be drawn down, and is equal to: Budget Appropriation + Additional Estimates Appropriation + DIAB + AFM - Savings - Rephasings - Other Reductions +/- Section 32.
Note: No appropriation is provided in Appropriation Bill No. 3 for the agency where the total funding change across outcomes for departmental outputs is negative.

Agency Additional Estimates Statements — DFAT
20
Table 1.6: Appropriation Bill (No. 4) 2007-08 2006-07 2007-08 2007-08 Additional Reduced
available Budget revised Estimates estimates($'000) ($'000) ($'000) ($'000) ($'000)
Non-operatingEquity injections 49,236 11,632 11,632 - - Loans - - - - - Previous years' outputs 10,482 2,057 11,100 9,043 - Administered assets and liabilities - - - - -
Total non-operating 59,718 13,689 22,732 9,043 - Department of Foreign Affairs and TradeTotal 59,718 13,689 22,732 9,043 -
Note: 2006-07 available appropriation is included to allow a comparison of this year's appropriationwith what was made available for use in the previous year. Available appropriation is the amount available to be drawn down and is equal to:Budget Appropriation + Additional Estimates Appropriation + DIAB + AFM - Savings - Rephasings - Other Reductions +/- Section 32.

Agency Additional Estimates Statements — DFAT
21
SUMMARY OF STAFFING CHANGES
Table 1.7: Average Staffing Level (ASL) 2007-08 2007-08Budget Revised Variation
Outcome 1Australia's national interests protected and advanced through contributions to international security, national economic and trade performance and global cooperation
2,313 2,346 33
Outcome 2Australians informed about and provided access to consular and passport services in Australia and overseas
844 859 15
Outcome 3Public understanding in Australia and overseas of Australia's foreign and trade policy and a positive image of Australia internationally
219 226 7
Outcome 4Efficient management of the Commonwealth overseas owned estate 24 24 -
Total 3,400 3,455 55 Average Staffing Levels are expressed as Full Time Equivalent (FTE) staff. The table shows total estimated FTE movement. The department uses an activity-based costing model to allocate resources to outcomes. Staffing numbers, including corporate support staff, are attributed to outcomes following the same methodology.
There is an estimated overall increase of 55 staff between the 2007-08 Budget and the Revised Estimates. The 2007-08 Budget figures of 3,400 comprised 1,986 Australia-based (A-based) staff and 1,414 locally-engaged staff (LES). The 2007-08 Revised estimate comprises 2,013 A-based and 1,442 LES.

Agency Additional Estimates Statements — DFAT
22
OTHER RECEIPTS AVAILABLE TO BE USED
Table 1.8 provides details of other receipts available to be used and includes FMA Act .31 receipts, CAC body receipts that are available to be spent, special accounts (non-appropriation receipts) and resources received free of charge.
Table 1.8: Other receipts available to be used Budget Revised
estimate estimate2007-08 2007-08
($'000) ($'000)Departmental other receipts
Sales of goods and services 97,732 97,732Resources received free of charge 390 390Other 1,100 1,100
Total departmental other receipts available to be used 99,222 99,222
Administered other receiptsSponsorship (FMA Act s.31) - -
Total administered other receipts available to be used - -
ESTIMATES OF EXPENSES FROM SPECIAL APPROPRIATIONS
Table 1.9: Estimates of expenses from special appropriations Outcome Budget Revised
No estimate estimate2007-08 2007-08
($'000) ($'000)Estimated expenses
Special Appropriation FMA Act, 1997 s28 (A) (1) 2 500 1,174
Total estimated expenses 500 1,174A = Administered
Acts Glossary: Financial Management and Accountability Act 1997 = FMA Act, 1997
Note 1: The department refunds passports and consular fees, under s28 of the FMA Act "Refund ofRevenue". This amount is treated as an expense in the income statement. The amount of refunds varies from year to year depending on passport demand and the level of consular services provided.
D = Departmental

Agency A
dditional Estimates Statem
ents — D
FAT
23
ESTIMATES OF SPECIAL ACCOUNT FLOWS
Table 1.10: Estimates of special account flows Outcome Opening Receipts Payments Adjustments Closing
No. Balance Balance2007-08(1) 2007-08 2007-08 2007-08 2007-08
2006-07 (1) 2006-07 2006-07 2006-07 2006-07($'000) ($'000) ($'000) ($'000) ($'000)
Australia-China Council Special Account - FMA Act 1997 s20 (A) 3 38 750 788 0 01 829 792 0 38
Australia-France Endowment Special Account - FMA Act 1997 s20 (A) 1 7 53 60 0 029 53 75 0 7
Australia-India Council Special Account - FMA Act 1997 s20 (A) 3 308 750 1,058 0 0328 805 825 0 308
Australia-Indonesia Institute Special Account - FMA Act 1997 s20 (A) 3 59 750 809 0 01 945 887 0 59
Australia-Korea Foundation Special Account - FMA Act 1997 s20 (A) 3 3 750 753 0 08 795 800 0 3
Consular Services Special Account - FMA Act 1997 s20 (A) 2 42 200 242 0 043 317 318 0 42
Australia-Japan Foundation Special Account - FMA Act 1997 s20 (A) 3 956 1,000 1,956 0 00 1,316 360 0 956
Services for Other Governments & Non-Agency Bodies Account - FMA Act 1997 s20 (A) 1,2,3 1,392 2,000 3,392 0 01,040 1,053 701 0 1,392
Other Trust Monies Account - FMA Act 1997 s20 (A) 1,2,3 305 800 1,105 0 0527 826 1,048 0 305
Administered Payments and Receipts for Other Entities Special Account - FMA Act 1997 s20 (A) 1,2,3 5,000 230,000 230,000 0 5,0005,000 161,893 161,893 0 5,000
Overseas Property Account - Finance Determination 2002-01 (D) 4 190,825 173,779 165,850 0 198,754131,181 159,912 100,268 0 190,825
Total special accounts 198,935 410,832 406,013 - 203,754
Acts Glossary: Financial Management and Accountability Act 1997 = FMA Act, 1997
Note 1 The revised Opening Balance for 2007-08 is the same as the final closing balance for 2006-07. This balance may have changedfrom that shown in the 2007-08 PB Statements as the actual for 2006-07 may have been updated to reflect the final budget outcomefor that year.
A = AdministeredD = Departmental

Agency Additional Estimates Statements — DFAT
24
Section 2: Revisions to agency outcomes
OUTCOMES, ADMINISTERED ITEMS AND OUTPUTS
Table 1.1 ‘Agency outcomes and outputs groups’ lists the outcome statements and output groups for the Department of Foreign Affairs and Trade.
There has been no change to Agency outcomes and outputs groups.
The price of all of the DFAT outputs, except in Outcome 4, will change as a result of Additional Estimates. Information on these changes is provided below under each outcome.
Output cost attribution The department allocates resources to outputs based on its activity-based costing model. Allocations for the Additional Estimates update have been calculated based on internal budget distribution and the model. The Overseas Property Office costs are excluded from the department’s model as all of its activities are accounted for separately and allocated directly to Outcome 4 (Output 4.1).

Agency A
dditional Estimates Statem
ents — D
FAT
25
Figure 2: Outcome and output structure
Outcome 1
Australia's national interests protected and advanced through contributions to international
security, national economic and trade performance and global cooperation
Total price $580.276m (down by $8.378 m)Dept outputs approp $534.476m
(down by $8.378 m)Admin expenses $230.380 m (up by $10.351m)
Outcome 2
Australians informed about and provided access to consular and passport services in Australia and
overseas
Total price $229.209m (up by $17.688 m)Dept outputs approp $229.209 m
(up by $17.688 m)Admin expenses $1.674m (up by $0.674 m)
Department of Foreign Affairs and Trade Secretary: Mr Michael L'Estrange
Total Price of Outputs $916.470 million (up by $8.880 million)Departmental Outcomes Appropriation $817.248 million
(up by $8.880 million)Total Admin Expenses $260.332 million (up by $14.525 milion)
Outcome 4*
Efficient management of the Commonwealth Overseas Owned Estate
Total price $158.894 mDept outputs approp $0 m
Admin expenses $0 m
Outcome 3
Public understanding in Australia and overseas of Australia's foreign and trade policy and a positive
image of Australia internationally
Total price $54.260 m (down by $0.430 m)Dept outputs approp $53.563 m (down by $0.430
m)Admin expenses $28.278 m (up by $3.5 m)
*Price of outputs shown under this outcome includes an amount of $106.169 m for inter-entity transactions, being rent paid by DFAT to the Overseas Property Office for services provided to DFAT's overseas diplomatic network. The contribution of this outcome to DFAT's total price of outputs is $52.725 m.
Output 1.1
Protection and advocacy of Australia's international interests through the provision of policy advice to
Ministers and overseas diplomatic activity
Total price $ 352.397m (down by $5.207 m)Approp $332.208 m (down by $5.207 m)
Output 1.2
Secure government communications and security of overseas missions
Total price $123.944 m (down by $1.779 m)Approp $113.500 m (down by $1.779 m)
Output 2.1
Consular and Passport Services
Total price $229.209 m (up by $17.688 m)Approp $229.209 m (up by $17.688 m)
Output 1.3
Services to other agencies in Australia and overseas (including Parliament, state representatives,
business and other organisations)
Total price $99.803 m (down by $1.329 m)Approp $84.808 m (down by $1.329 m)
Output 1.4
Services to diplomatic and consular representatives in Australia
Total price $4.132 m (down by $0.062 m)Approp $3.960 m (down by $0.062 m)
Output 3.1
Public information services and public diplomacy
Total price $54.260 m (down by $0.430 m)Approp $53.563 m (down by $0.430 m)
Output 4.2
Contract Management
Total price $0 mApprop $0 m
Output 4.1
Property Management
Total price $158.894 mApprop $0 m
Agency Additional Estimates Statements — DFAT
26
Outcome 1 Variations include a proportionate share (based on the Outcome/Outputs share of the department’s overall budget) of the following items: savings measures, overseas inflation, foreign exchange movements and rebasing; and VAT refunds. These variations have affected the price of outputs under Outcome 1.
The administered appropriation will increase by $10.351 million as a result of an increase in $5.851 million in the estimated cost of contributions to international organisations including the APEC measure and $4.500 million in the net expenses relating to the EFIC National Interest Account.
Revised performance information — 2007-08 The performance information that the Department of Foreign Affairs and Trade will use to assess the level of its achievement against Outcome 1 during 2007-08 is shown at Tables 2.1 and 2.2. The general effectiveness indicators for Outcome 1 are unchanged from the Portfolio Budget Statements 2007-08. The price of all outputs has changed as a result of Additional Estimates.

Agency Additional Estimates Statements — DFAT
27
Table 2.1: Performance information for outputs affected by additional estimates: Outcome 1 Output Performance information Performance information
2007-08 Budget 2007-08 revised
Output 1.1 Quality: Quality:Satisfaction of portfolio ministers with the department’s policy advice, analysis, speeches and briefings, including the department's contribution to the development of policies of other Australian Government agencies which have an international dimension.
No change
Satisfaction of portfolio ministers with the protection and advancement of Australia's international interests, including the conduct and timeliness of bilateral and multilateral negotiations, effective advocacy and representations, post reporting and the organisation of official programs.
Strong capacity to assess, analyse and advise on responses to international developments.
Quantity: Quantity: Scope and composition of the DFAT-managed diplomatic network.
No change
Number of units of policy advice delivered, including ministerial and cabinet submissions, ministerial correspondence, and speeches and briefings including parliamentary briefings.
Number of consultations conducted with other Australian Government agencies, state and territory governments, business and non-government organisations in the context of the department's development of foreign and trade policy advice.
Number of representations made to other governments and international organisations in support of Australia's international interests.
Number of international meetings or negotiations attended, including on behalf of other Australian Government agencies.
Protection and advocacy of Australia’s international interests through the provision of policy advice to ministers and overseas diplomatic activity

Agency Additional Estimates Statements — DFAT
28
Table 2.1: Performance information for outputs affected by additional estimates: Outcome 1 (continued) Output Performance information Performance information
2007-08 Budget 2007-08 revised
Number of official programs prepared for portfolio ministers and senior officials.
Number of official programs prepared for the Prime Minister, other Australian Government ministers and senior officials.
Number of reporting cables produced by our overseas posts.
Number of occasions on which the department has contributed to the development of policies by other Australian Government agencies.
Number of Foreign Affairs Council and Trade Policy Advisory Council meetings organised.
Price: $357.604 million Price: $352.397 millionOutput 1.2 Quality: Quality:
Client satisfaction with the secure communications network and secure telecommunications infrastructure.
No change
Availability to clients, and reliability, of communications through the secure network (including cable delivery).
Client satisfaction with the level of physical security at overseas chanceries and residences, including responsiveness to unexpected events.
Quantity: Quantity: Number of posts and Australian Government entities with access to the secure communications network and secure telecommunications infrastructure.
No change
Number of clients serviced, types of services provided and volume of traffic handled.
Number of visits to overseas missions to address protcetive security issues.
Number of security clearances and reviews processed.
Price: $125.723 million Price: $123.944 million
Secure government communications and security of overseas missions

Agency Additional Estimates Statements — DFAT
29
Table 2.1: Performance information for outputs affected by additional estimates: Outcome 1 (continued) Output Performance information Performance information
2007-08 Budget 2007-08 revisedOutput 1.3 Quality: Quality:
Client satisfaction with briefing, administrative, visit facilitation, communications and other services provided.
No change
Quantity: Quantity: Scope and composition of administrative services provided to other agencies overseas.
No change
Number of official programs organised for members of the Australian Parliament (excluding the Prime Minister or ministers) and parliamentary delegations.
Number of services provided to parliamentary committees.
Number of overseas visits by representatives of state or territory governments, and by state and territory parliamentarians, supported by the department.
Number of Australian companies supported by the department with advice on market conditions, access to government and private sector contacts, and through representations directly connected with their particular interests.
Price: $101.132 million Price: $99.803 millionOutput 1.4 Quality: Quality:
Client satisfaction with the provision of services to diplomatic and consular representatives.
No change
Quantity: Quantity: Number of diplomatic and consular representatives for whom the department provides services.
No change
Number and category of services provided.
Price: $4.195 million Price: $4.132 million
Services to other agencies in Australia and overseas (including Parliament, state representatives, business and other organisations)
Services to diplomatic and consular representatives in Australia

Agency Additional Estimates Statements — DFAT
30
Table 2.2 - Performance information for outputs affected by additional estimates: Outcome 1 Administered items Output Performance information Performance information
2007-08 Budget 2007-08 revised
Quality: Quality: Efficiency and timeliness of administration of contributions paid in accordance with the requirements of relevant organisations
No change
Quantity: Quantity: Number of international organisations to which Australia contributes
No change
Price: $208.620 million Price: $214.471 millionQuality: Quality: National interest payments and receipts managed in accordance with the national interest provisions of the Export Finance and Insurance Corporation Act 1991
No change
Quantity: Quantity: Value of exports supported by EFIC's National Interest Account; value of claims paid on National Interest Account business
No change
Price: $8.200 million Price: $12.700 millionQuality: Quality: Efficiency and timeliness of case management, where necessary
No change
Quantity: Quantity: Where necessary, number of cases successfully managed
No change
Price: $0.054 million Price: No change
Contributions to international organisations
Compensation for detriment caused by defective administration
Export Finance and Insurance Corporation National Interest Account

Agency Additional Estimates Statements — DFAT
31
Outcome 2 Variations include a proportionate share (based on the Outcome/Outputs share of the department’s overall budget) of the following items: savings measures, funding for higher levels of passport production, overseas inflation, foreign exchange variations and rebasing; and VAT refunds. These variations have affected the price of outputs under Outcome 2.
The department will receive an additional Special Appropriation under s28 of the FMA Act (Refund of Revenue) for Administered Outcome 2 - Passports Fee Refunds of $0.674 million. This variation is due to an increase in passport fee refunds made in July 2007. Special Appropriations for passport fee refunds do not appear in Table 1.5 as they are distinct from the other Administered appropriations.
Revised performance information — 2007-08 The performance information that the Department of Foreign Affairs and Trade will use to assess the level of its achievement against Outcome 2 during 2007-08 is shown at Tables 2.3 and 2.4. The general effectiveness indicators for Outcome 2 are unchanged from the Portfolio Budget Statements 2007-08. The price of the output has changed as a result of Additional Estimates.

Agency Additional Estimates Statements — DFAT
32
Table 2.3 - Performance information for outputs affected by additional estimates: Outcome 2 Output Performance information Performance information
2007-08 Budget 2007-08 revised
Output 2.1: Consular and passport servicesConsular services Quality: Quality:
Satisfaction of the public and travel industry with consular services.
No change
Extent to which highly developed crisis management procedures are in place and tested.
Client satisfaction with the suitability and effectiveness of contingency plans at overseas posts.
Response time to consular issues.Quantity: Quantity: Number of Australians assisted overseas, including the number of public inquiries handled, notarial acts performed and travel advisories issued.
No change
Number of unexpected events or crises handled by the department, number of associated Emergency Task Force meetings held, and the duration of Crisis Centre operations.
Passport services Quality: Quality: Satisfaction of the public and travel industry with passport services.
No change
Turnaround time for passport issue, including urgent issues.Quantity: Quantity: Number of passport inquiries handled by the Australian Passport Information Service.
No change
Number of travel documents issued, including urgent issues.
Price: $211.521 million Price: $229.209 million
Agency Additional Estimates Statements — DFAT
33
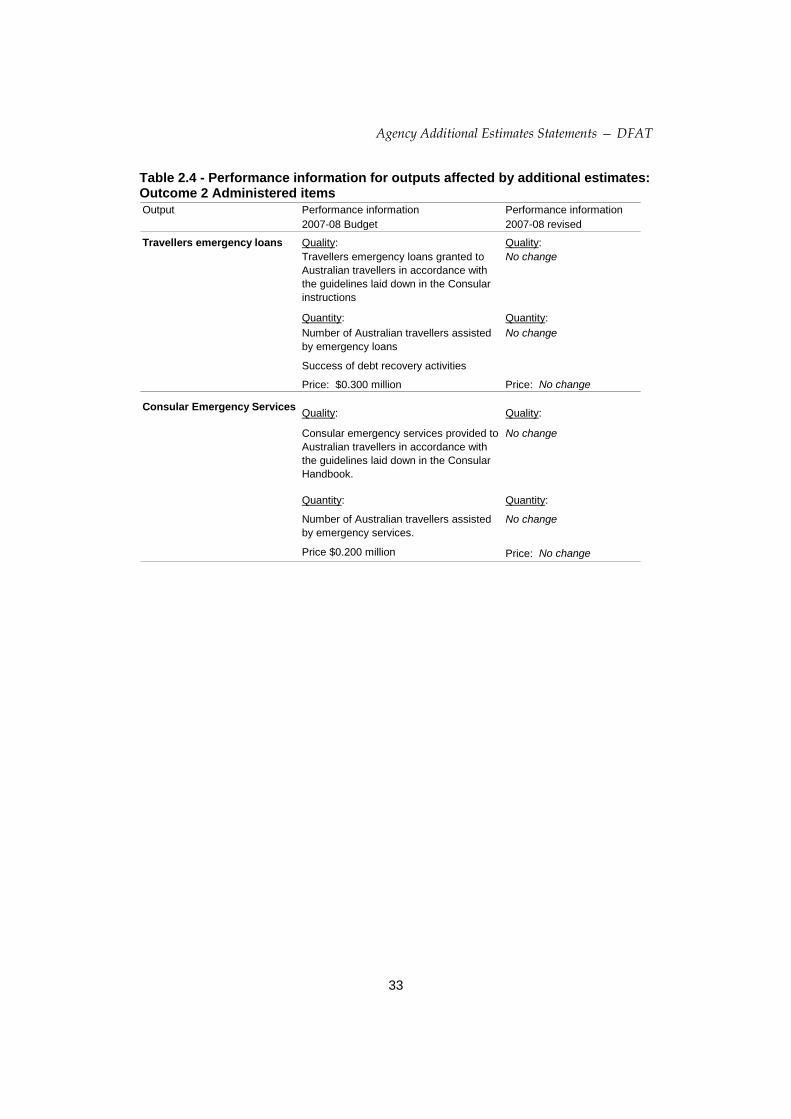
Table 2.4 - Performance information for outputs affected by additional estimates: Outcome 2 Administered items Output Performance information Performance information
2007-08 Budget 2007-08 revised
Quality: Quality: Travellers emergency loans granted to Australian travellers in accordance with the guidelines laid down in the Consular instructions
No change
Quantity: Quantity: Number of Australian travellers assisted by emergency loans
No change
Success of debt recovery activities
Price: $0.300 million Price: No change
Consular Emergency Services Quality: Quality:
Consular emergency services provided to Australian travellers in accordance with the guidelines laid down in the Consular Handbook.
No change
Quantity: Quantity:
Number of Australian travellers assisted by emergency services.
No change
Price $0.200 million Price: No change
Travellers emergency loans

Agency Additional Estimates Statements — DFAT
34
Outcome 3 Variations include a proportionate share (based on the Outcome/Outputs share of the department’s overall budget) of the following items: savings measures, overseas inflation, foreign exchange variations and rebasing; and VAT refunds. These variations have affected the price of outputs under Outcome 3.
The administered appropriation will increase by $3.500 million as a result of the donation to the Hellenic Red Cross and a grant to support activities of Australians working overseas to promote Australia’s interests.
Revised performance information — 2007-08 The performance information that the Department of Foreign Affairs and Trade will use to assess the level of its achievement against Outcome 3 during 2007-08 is shown at Tables 2.5 and 2.6. The general effectiveness indicators for Outcome 3 are unchanged from the Portfolio Budget Statements 2007-08. The price of the output has changed as a result of Additional Estimates.

Agency Additional Estimates Statements — DFAT
35
Table 2.5 - Performance information for outputs affected by additional estimates: Outcome 3 Output Performance information Performance information
2007-08 Budget 2007-08 revised
Output 3.1 Quality: Quality: Public information services and public diplomacy
Satisfaction, particularly of ministers, with the provision and impact of public diplomacy and information activities in Australia and the degree to which a positive image of Australia is projected internationally and Australia's profile raised.
No change
Timeliness and relevance of cultural and media activities and publications.
Number of departmentally processed Freedom of Information and Archives requests not subject to requests for review and appeal.
Quantity: Quantity: Number of Australian performing groups, artists, exhibitors and other cultural visitors supported.
No change
Number of public briefings given by departmental staff in Australia and overseas.
Number of other public diplomacy/cultural activities organised.
Number of media-related inquiries handled by the media liaison section.
Number of visits organised under the International Media and Special Visits Programs and the International Cultural Visits program.
Number of publications produced and number of copies distributed.
Number of statistical services provided to external clients.
Number of treaties maintained on, and added to, the international treaties database.
Number of Freedom of Information requests processed.
Number of records assessed for international relations sensitivities before release under the Archives Act 1983 and number of completed requests for archival information.
Price: $54.690 million Price: $54.260 million

Agency Additional Estimates Statements — DFAT
36
Table 2.6 - Performance information for outputs affected by additional estimates: Outcome 3 Administered items Output Performance information Performance information
2007-08 Budget 2007-08 revised
Grants Quality: Quality:Grants administered in accordance with Government guidelines on the administration of the Discretionary Grants Programme.
No change
Quantity Quantity: Number of grants. No changePrice: $4.541 million Price: $5.041 million
Asia Pacific television service Quality: Quality: - Australia Network ABC to meet its contractual obligations
with the department in regard to the quality, coverage and management of the Asia Pacific television service - Australia Network
No change
Quantity: Quantity: Performance of the television service measured by tests and assessments prescribed in the contract
No change
Price: $18.737 million Price: No change
Shanghai World Expo 2010 Quality: Quantity: Planning and design Stakeholder satisfaction with design and
other plans produced.No change
Quantity Quantity: Number of planning and design options produced.
No change
Price: $1.500 million Price: No change

Agency Additional Estimates Statements — DFAT
37
Section 3: Budgeted financial statements The Budgeted Financial Statements for DFAT presented in this section will form the basis of the financial statements that will appear in the department’s 2007-08 Annual Report and the basis for the input into the whole of government accounts.
The budgeted financial statements are prepared in accordance with the Australian Equivalents to International Financial Reporting Standards (AEIRFS).
Budgeted departmental income statement This statement provides a picture of the actual 2006-07 financial results and the expected financial results for 2007-08 and forward years for the department by identifying full accrual expenses and revenues. This provides an assessment as to whether the department is operating at a sustainable level.
The department has budgeted for a surplus of $83.7 million in 2007-08 of which $72.6 million relates to the Overseas Property Office. The overall DFAT budget position is break-even. The DFAT budgeted operating surplus includes appropriation revenues of $11 million for prior year outputs. Appropriation for prior year outputs includes VAT refunds, funding for higher levels of passport production, the integration of the Australia-Japan Foundation and security related rent supplementation.
The department’s appropriation has changed since the Portfolio Budget Statements 2007-08 due to reductions arising from savings measures including: a two per cent one-off Efficiency Dividend; additional funding for higher levels of passport production; variations for overseas inflation and foreign exchange movements and rebasing and VAT refunds.
Expenses have increased due to passports funding.
Budgeted departmental balance sheet This statement shows the financial position of the department. It helps decision-makers to track the management of the department’s assets and liabilities.
This statement has been revised since the publication of the Portfolio Budget Statements 2007-08 to reflect the reassessment of expected closing balances based on actual results and performance in 2006-07. Receivables have increased as a result of adjustments to reflect 2006-07 actual results. Inventories have decreased due to a decrease in passport inventory balance in 2006-07. Assets have changed due to the rephasing of a number of security works in overseas missions. Liabilities have increased as a result of adjustments to reflect 2006-07 actual results.

Agency Additional Estimates Statements — DFAT
38
Budgeted departmental statement of cash flows Budgeted cash flows, as reflected in the statement of cash flows, provide important information on the extent and nature of cash flows by categorising them into expected cash flows from operating, investing and financial activities.
This statement has been revised since the publication of the Portfolio Budget Statements 2007-08 to reflect the reassessment and change in the expected closing balances in the budgeted departmental income statement and the budgeted departmental balance sheet.
The Overseas Property Office has a special account. It funds new projects from existing resources which impacts on the amount to be paid as a dividend.
Departmental statement of changes in equity — summary of movement This schedule discloses details of movements in departmental equity.
Departmental capital budget statement This statement shows all planned departmental capital expenditure (non-financial assets), whether funded through capital appropriations for additional equity or borrowings, or from funds from internal sources.
Departmental property, plant, equipment and intangibles — summary of movement This schedule discloses details in movements in departmental non-financial assets.
Schedule of administered activity Details of transactions administered by the agency on behalf of the Commonwealth are shown in the following schedules to the financial statements:
Schedule of budgeted income and expenses administered on behalf of government This schedule identifies the main revenues and expenses administered on behalf of the Government.
Administered revenues have been budgeted at $312.234 million in 2007-08. Total revenue is estimated to increase by $35.146 million since the Portfolio Budget Statements 2007-08, primarily due to increases in the projected passport revenue and dividend received from the Export Finance and Insurance Corporation (EFIC). In the forward years, goods and services revenue is impacted by the expectation that passport revenue will continue to increase.
Total expenses administered on behalf of the Government are budgeted at $264.053 million in 2007-08. Total estimated expenses have increased by $14.525 million since the Portfolio Budget Statements 2007-08, due to payments associated with an increase to international organisations totalling $5.851 million, EFIC National Interest Account

Agency Additional Estimates Statements — DFAT
39
expenses of $4.500 million, grants of $3.500 million and passport refunds of $0.674 million.
Schedule of budgeted assets and liabilities administered on behalf of government This schedule shows the assets and liabilities administered on behalf of the Government.
This statement has been revised since the publication of the Portfolio Budget Statements 2007-08 to reflect the final actual closing balances in 2006-07, including fair value adjustments required under the new Australian Equivalents to International Financial Reporting Standards (AEIFRS).
Schedule of budgeted administered cash flows This schedule shows cash flows administered on behalf of the Government.
Administered cash received moves in line with the administered revenue, with the exception of AEIFRS-related fair value revenue which has no cash impact, and is returned to the Consolidated Revenue Fund. Total cash received is expected to increase by $20.621 million since the Portfolio Budget Statements 2007-08, primarily due to increased projected passport revenue. Administered cash used moves according to estimated expenses incurred on behalf of Government, with the exception of AEIFRS fair value related expense which has no cash impact. Cash used is funded by an annual appropriation.

Agency Additional Estimates Statements — DFAT
40
Table 3.1: Budgeted departmental income statement (for the period ended 30 June 2008)
Actual Revised Forward Forward Forwardbudget estimate estimate estimate
2006-07 2007-08 2008-09 2009-10 2010-11$'000 $'000 $'000 $'000 $'000
INCOMERevenue
Revenues from Government 832,941 828,348 792,396 794,192 784,869 Goods and services 102,644 97,732 97,184 85,725 87,872 Interest - - - - - Dividends - - - - - Rents - - - - - Royalties - - - - - Other 3,253 1,100 1,100 1,521 1,911
Total revenue 938,838 927,180 890,680 881,438 874,652
GainsNet foreign exchange gains 839 - - - - Reversals of previous asset
write-downs - - - - - Net gains from sale of assets - 523 - - - Other 1,600 390 390 390 390
Total gains 2,439 913 390 390 390
Total income 941,277 928,093 891,070 881,828 875,042
EXPENSEEmployees 340,888 369,896 358,272 366,982 323,205 Suppliers 390,698 369,290 354,515 365,895 403,461 Grants 957 900 900 900 900 Subsidies - - - - - Depreciation and amortisation 67,698 75,668 78,844 87,317 89,135 Finance costs 987 649 624 457 400 Write-down of assets and
impairment of assets 1,672 28,004 3,360 - - Net losses from sale of assets 2,691 - 910 4 - Net foreign exchange losses - - - - - Other 48 - - - -
Total expenses 805,639 844,407 797,425 821,555 817,101
Share of operating results of associates and joint ventures accounted for using the equitymethod - - - - -
Operating result before Income TaxIncome Tax expense - - - - -
Net operating result 135,638 83,686 93,645 60,273 57,941

Agency Additional Estimates Statements — DFAT
41
Table 3.1: Budgeted departmental income statement (for the period ended 30 June 2008) (continued)
Actual Revised Forward Forward Forwardbudget estimate estimate estimate
2006-07 2007-08 2008-09 2009-10 2010-11$'000 $'000 $'000 $'000 $'000
Operating result from continuingoperations 135,638 83,686 93,645 60,273 57,941 Operating result from discontinued
operations - - - - - Gain (loss) on remeasuring
discontinued operations - - - - -
Operating resultMinority interest in net surplus
or (deficit) - - - - -
Net surplus or (deficit) attributable to the Australian Government 135,638 83,686 93,645 60,273 57,941

Agency Additional Estimates Statements — DFAT
42
Table 3.2: Budgeted departmental balance sheet (as at 30 June 2008) Actual Revised Forward Forward Forward
budget estimate estimate estimate2006-07 2007-08 2008-09 2009-10 2010-11
$'000 $'000 $'000 $'000 $'000ASSETSFinancial assets
Cash and cash equivalents 49,088 31,268 28,933 32,757 32,786 Receivables 494,470 552,619 564,525 635,623 609,069 Investments accounted for under
the equity method - - - - - Investments (s.39 FMA Act;
s.18 CAC Act; s.19 CAC Act) - - - - - Other investments - - - - - Tax assets - - - - - Accrued revenues 3,895 3,895 3,895 3,895 3,895 Other financial assets - - - - -
Total financial assets 547,453 587,782 597,353 672,275 645,750
Non-financial assetsLand and buildings 1,623,869 1,714,061 1,717,861 1,709,754 1,773,096 Infrastructure, plant and equipment 92,644 78,251 85,986 135,756 124,146 Investment properties - - - - - Heritage and cultural assets - - - - - Inventories 16,397 16,397 16,397 16,396 16,396 Intangibles 8,177 18,902 17,107 11,734 21,691 Deferred tax asset - - - - - Biological assets - - - - - Assets held for sale 14,485 123 123 123 123 Other non-financial assets 106,577 77,569 96,235 136,526 153,375
Total non-financial assets 1,862,149 1,905,303 1,933,709 2,010,289 2,088,827 Total assets 2,409,602 2,493,085 2,531,062 2,682,564 2,734,577
LIABILITIESPayables
Suppliers 78,387 86,179 86,170 76,364 76,354 Grants - - - - - Dividends - - - - - Financing costs - - - - - Other payables 11,052 11,744 12,451 12,994 12,994
Total payables 89,439 97,923 98,621 89,358 89,348
Interest bearing liabilitiesLoans - - - - - Leases 2,214 1,459 648 - - Deposits - - - - - Overdraft - - - - - Other interest bearing liabilities - - - - -
Total interest bearing liabilities 2,214 1,459 648 - -
ProvisionsEmployees 110,403 110,113 110,157 110,298 110,317 Other provisions 8,485 8,485 8,485 8,485 8,485
Total provisions 118,888 118,598 118,642 118,783 118,802
Liabilities included in disposalgroups held for sale
Total liabilities 210,541 217,980 217,911 208,141 208,150

Agency Additional Estimates Statements — DFAT
43
Table 3.2: Budgeted departmental balance sheet (as at 30 June 2008) (continued) Actual Revised Forward Forward Forward
budget estimate estimate estimate2006-07 2007-08 2008-09 2009-10 2010-11
$'000 $'000 $'000 $'000 $'000EQUITY*Parent entity interest
Contributed equity 1,491,463 1,503,096 1,533,071 1,628,007 1,628,007 Reserves 365,168 377,767 379,187 385,319 379,382 Retained surpluses or
accumulated deficits 342,430 394,242 400,893 461,097 519,038 Total parent entity interest 2,199,061 2,275,105 2,313,151 2,474,423 2,526,427
Minority interestContributed equity - - - - - Reserves - - - - - Statutory funds - - - - - Retained surpluses or
accumulated deficits - - - - - Total minority interest - - - - - Total equity 2,199,061 2,275,105 2,313,151 2,474,423 2,526,427
Current assets 594,066 604,302 613,873 688,794 662,269 Non-current assets 1,815,536 1,888,783 1,917,189 1,993,770 2,072,308 Current liabilities 194,584 197,751 196,975 186,662 186,671 Non-current liabilities 15,958 20,229 20,936 21,479 21,479
*Note: 'equity' is the residual interest in assets after deduction of liabilities.

Agency Additional Estimates Statements — DFAT
44
Table 3.3: Budgeted departmental statement of cash flows (for the period ended 30 June 2008)
Actual Revised Forward Forward Forwardbudget estimate estimate estimate
2006-07 2007-08 2008-09 2009-10 2010-11$'000 $'000 $'000 $'000 $'000
OPERATING ACTIVITIESCash received
Goods and services 110,528 97,040 96,476 85,184 87,872 Appropriations 763,301 791,685 756,367 722,703 785,040 Interest - - - - - Dividends - - - - - Net GST received 24,810 19,362 19,362 19,362 19,362 Other cash received - 1,479 1,116 1,931 1,931
Total cash received 898,639 909,566 873,321 829,180 894,205
Cash usedEmployees 335,115 371,038 360,005 367,922 324,671 Suppliers 369,857 353,410 353,387 351,114 405,041 Grants 957 900 900 900 900 Financing costs - - 20 20 400 Net GST paid 24,625 19,637 19,362 19,362 19,362 Other cash used - 20 20 20 -
Total cash used 730,554 745,005 733,694 739,338 750,374 Net cash from or (used by)
operating activities 168,085 164,561 139,627 89,842 143,831
INVESTING ACTIVITIESCash received
Proceeds from sales of property,plant and equipment 3,549 17,246 4,769 4,570 -
Proceeds from sales of financialinstruments - - - - -
Bills of exchange and promissory notes - - - - - Repayments of loans made - - - - - Investments (s.39 FMA Act;
s.18 CAC Act; s.19 CAC Act) - - - - - Other cash received - - - - -
Total cash received 3,549 17,246 4,769 4,570 -
Cash usedPurchase of property, plant
and equipment 134,495 118,562 62,357 114,282 98,059 Purchase of financial instruments - - - - - Bills of exchange and promissory notes - - - - - Loans made - - - - - Investments (s.39 FMA Act;
s.18 CAC Act; s.19 CAC Act) - - - - - Other cash used 60,051 52,878 49,408 75,306 75,551
Total cash used 194,546 171,440 111,765 189,588 173,610 Net cash from or (used by)
investing activities (190,997) (154,194) (106,996) (185,018) (173,610)

Agency Additional Estimates Statements — DFAT
45
Table 3.3: Budgeted departmental statement of cash flows (for the period ended 30 June 2008) (continued)
Actual Revised Forward Forward Forwardbudget estimate estimate estimate
2006-07 2007-08 2008-09 2009-10 2010-11$'000 $'000 $'000 $'000 $'000
FINANCING ACTIVITIESCash received
Appropriations - contributed equity 71,350 11,633 29,975 94,936 - Proceeds from issuing financial
instruments - - - - - Proceeds from loans - - - - - Other cash received - (7,946) 22,053 4,133 29,808
Total cash received 71,350 3,687 52,028 99,069 29,808
Cash usedRepayments of debt
(including finance lease principal) - - - - - Dividends paid 27,284 17,512 84,731 - - Other cash used 1,618 14,362 2,263 69 -
Total cash used 28,902 31,874 86,994 69 - Net cash from or (used by)
financing activities 42,448 (28,187) (34,966) 99,000 29,808 Net increase or (decrease)
in cash held 19,536 (17,820) (2,335) 3,824 29 Cash at the beginning of
the reporting period 28,713 49,088 31,268 28,933 32,757 Effect of exchange rate movements
on cash at the beginning of 839 - - - - reporting period
Asset/Liability Transfers - - - - - Net Effect - - - - -
Cash at the end of the reporting period 49,088 31,268 28,933 32,757 32,786

Agency Additional Estimates Statements — DFAT
46
Table 3.4: Departmental statement of changes in equity — summary of movement (Budget 2007-08)
Accumulated Asset Other Contributed Totalresults revaluation reserves equity/ equity
reserve capital$'000 $'000 $'000 $'000 $'000
Opening balance as at 1 July 2007Balance carried forward from
previous period 342,430 365,168 - 1,491,463 2,199,061 Adjustment for changes in
accounting policiesAdjusted opening balance 342,430 365,168 - 1,491,463 2,199,061
Income and expenseIncome and expenses recognised
directly in equity: - - - - - Gain/loss on revaluation of
property - 12,599 - - 12,599 Sub-total income and expenserecognised directly in equity - 12,599 - - 12,599
Net operating result 83,686 - - - 83,686
Total income and expenses 83,686 12,599 - - 96,285 Transactions with owners
Distributions to ownersReturns on capital
Dividends (17,512) - - - (17,512) Returns of capital
Restructuring - - - - - Other:
Contribution by ownersAppropriation (equity injection) - - - 11,633 11,633 Other:
Restructuring - - - - - Sub-total transactions with owners (17,512) - - 11,633 (5,879)
Amount (to)/from OPA - AgencyCash transfers to OPA (14,362) - - - (14,362)
Transfers between equitycomponents - - - - -
Other movements - - - - - Estimated closing balance
as at 30 June 2008 394,242 377,767 - 1,503,096 2,275,105

Agency Additional Estimates Statements — DFAT
47
Table 3.5: Departmental capital budget statement Actual Revised Forward Forward Forward
budget estimate estimate estimate2006-07 2007-08 2008-09 2009-10 2010-11
$'000 $'000 $'000 $'000 $'000CAPITAL APPROPRIATIONS
Total equity injections 49,236 11,632 29,976 94,935 - Appropriation of Previous Year Accrued Revenue 10,482 11,100 - - -
Total capital appropriations 59,718 22,732 29,976 94,935 -
Represented by:Purchase of non-financial assets 49,236 11,632 29,976 94,935 - Other 10,482 11,100 - - -
Total represented by 59,718 22,732 29,976 94,935 -
PURCHASE OF NON-FINANCIAL ASSETS
Funded by capital appropriation 60,654 11,632 29,976 94,935 - Funded internally by
Departmental resources 87,700 168,326 66,082 31,610 156,761 Total 148,354 179,958 96,058 126,545 156,761

Agency A
dditional Estimates Statem
ents — D
FAT 48
Table 3.6: Departmental property, plant, equipment and intangibles — summary of movement (Budget year 2007-08) Land Investment Buildings Specialist Other Heritage Computer Other Total
property military infrastructure and cultural software intangiblesequipment plant and assets
equipment$'000 $'000 $'000 $'000 $'000 $'000 $'000 $'000 $'000
As at 1 July 2007Gross book value 864,235 - 781,651 - 135,248 - 39,463 - 1,820,597 Accumulated depreciation - - (22,017) - (42,604) - (31,286) (95,907)
Opening net book value 864,235 - 759,634 - 92,644 - 8,177 - 1,724,690
Additions:by purchase 50,033 - 96,941 - 13,591 - 19,393 - 179,958 by finance lease - - - - - - - - - internally developed - - - - - - - - - from acquisitions of entities or
operations (including restructuring) - - - - - - - - - -
Revaluations and impairment throughequity 12,574 - (28,004) - 25 - - - (15,405)
ReclassificationsDepreciation/amortisation expense - - (41,352) - (25,648) - (8,668) - (75,668) Impairments recognised in operating
result - - - - - - - - - Other movements - - - - - - - - -
Disposals:from disposal of entities or
operations (including restructuring) - - - - - - - - - other disposals - - - - (2,361) - - - (2,361)
As at 30 June 2008Gross book value 926,842 - 850,588 - 146,503 - 58,856 - 1,982,789 Accumulated depreciation - - (63,369) - (68,252) - (39,954) - (171,575)
Estimated closing net book value 926,842 - 787,219 - 78,251 - 18,902 - 1,811,214

Agency Additional Estimates Statements – DFAT
49
Schedule of administered activity Table 3.7: Schedule of budgeted income and expenses administered on behalf of government (for the period ended 30 June 2008)
Actual Revised Forward Forward Forwardbudget estimate estimate estimate
2006-07 2007-08 2008-09 2009-10 2010-11$'000 $'000 $'000 $'000 $'000
INCOME ADMINISTERED ONBEHALF OF GOVERNMENT
RevenueTaxation
Income tax - - - - - Indirect tax - - - - - Other taxes, fees and fines - - - - -
Total taxation - - - - -
Non-taxationGoods and services 241,027 274,974 296,463 321,656 329,362 Interest 12,369 6,900 6,600 6,100 5,500 Dividends 14,362 20,400 9,600 9,600 9,600 Other sources of non-taxation 82,907 9,960 9,160 8,960 8,660
revenuesRents - - - - - Royalties - - - - -
Total non-taxation 350,665 312,234 321,823 346,316 353,122 Total revenues administered
on behalf of Government 350,665 312,234 321,823 346,316 353,122
GainsNet foreign exchange gains 3,629 - - - - Net gains from sale of assets - - - - - Other gains - - - - -
Total gains administeredon behalf of Government 3,629 - - - -
Total income administeredon behalf of Government 354,294 312,234 321,823 346,316 353,122
EXPENSES ADMINISTERED ONBEHALF OF GOVERNMENTGrants 205,121 222,712 222,089 222,089 221,762 Subsidies - - - - - Personal benefits 4,750 2,200 1,950 1,950 1,700 Employees - - - - - Suppliers 16,652 22,441 20,389 20,873 20,962 Depreciation and amortisation - - - - - Write down and impairment of assets 92 - - - - Interest - 12,600 12,000 11,300 6,600 Other 29,614 4,100 3,500 3,000 2,500
LossesNet foreign exchange losses - - - - - Net loss from sale of assets - - - - - Other losses - - - - -
Total expenses administeredon behalf of Government 256,229 264,053 259,928 259,212 253,524

Agency Additional Estimates Statements — DFAT
50
Table 3.8: Schedule of budgeted assets and liabilities administered on behalf of government (as at 30 June 2008)
Actual Revised Forward Forward Forwardbudget estimate estimate estimate
2006-07 2007-08 2008-09 2009-10 2010-11$'000 $'000 $'000 $'000 $'000
ASSETS ADMINISTERED ON BEHALF OF GOVERNMENT
Financial assetsCash and cash equivalents 5,187 5,187 5,187 5,187 5,187
[this can include investmentsincluding s.39 FMA Act]
Receivables 20,654 19,738 20,038 20,338 20,638 Investments (s.39 FMA Act) 359,800 359,800 359,800 359,800 359,800 Accrued revenues - 1,216 1,216 1,216 1,216 Other financial assets -
Total financial assets 385,641 385,941 386,241 386,541 386,841
Non-financial assetsLand and buildings - - - - - Infrastructure, plant and equipment - - - - - Investment properties - - - - - Heritage and cultural assets - - - - - Inventories - - - - - Intangibles - - - - - Biological assets - - - - - Assets held for sale - - - - - Other 1,539 1,539 1,539 1,539 1,539
Total non-financial assets 1,539 1,539 1,539 1,539 1,539 Total assets administered
on behalf of Government 387,180 387,480 387,780 388,080 388,380
LIABILITIES ADMINISTERED ON BEHALF OF GOVERNMENT
Interest bearing liabilitiesAustralian Government securities - - - - - Loans - - - - - Leases - - - - - Deposits - - - - - Overdraft - - - - - Other - - - - -
Total interest bearing liabilities - - - - -
ProvisionsEmployees - - - - - Taxation refunds provided - - - - - Australian currency on issue - - - - - Other provisions - - - - -
Total provisions - - - - -

Agency Additional Estimates Statements – DFAT
51
Table 3.8: Schedule of budgeted assets and liabilities administered on behalf of government (as at 30 June 2008) (continued)
Actual Revised Forward Forward Forwardbudget estimate estimate estimate
2006-07 2007-08 2008-09 2009-10 2010-11$'000 $'000 $'000 $'000 $'000
PayablesSuppliers 344 344 344 344 344 Grants and subsidies - - - - - Dividends - - - - - Borrowing costs - - - - - Personal benefits payable - - - - - Taxation refunds due - - - - - Other payables 109,297 105,597 102,697 100,397 99,097
Total payables 109,641 105,941 103,041 100,741 99,441
Liabilities included in disposalgroups held for sale - - - - -
Total liabilities administeredon behalf of Government 109,641 105,941 103,041 100,741 99,441

Agency Additional Estimates Statements — DFAT
52
Table 3.9: Schedule of budgeted administered cash flows (for the period ended 30 June 2008)
Actual Revised Forward Forward Forwardbudget estimate estimate estimate
2006-07 2007-08 2008-09 2009-10 2010-11$'000 $'000 $'000 $'000 $'000
OPERATING ACTIVITIESCash received
Income tax - - - - - Indirect tax - - - - - Other taxes, fees and fines - - - - - Sales of goods 242,205 274,974 296,463 321,656 329,362 Rendering of services - - - - - Interest 113,018 100 100 100 100 Dividends 14,362 20,400 9,600 9,600 9,600 Net GST received 1,829 - - - - Other 17,030 6,660 6,560 6,660 6,760
Total cash received 388,444 302,134 312,723 338,016 345,822
Cash usedBorrowing costs - - - - - Employees - - - - - Grant payments 204,831 223,012 222,389 222,389 222,062 Interest paid 18,205 8,600 8,000 7,300 6,600 Subsidies paid - - - - - Personal benefits 2,101 2,200 1,950 1,950 1,700 Suppliers 18,192 22,441 20,389 20,873 20,962 Net GST paid 1,828 - - - - Other 875 4,079 3,448 2,932 2,511
Total cash used 246,032 260,332 256,176 255,444 253,835 Net cash from
operating activities 142,412 41,802 56,547 82,572 91,987
INVESTING ACTIVITIESCash received
Proceeds from sales ofproperty, plant and equipmentand intangibles - - - - -
Proceeds from sales ofequity instruments - - - - -
Proceeds from sales of investments - - - - - Repayments of advances - - - - - Transfers from other entities - - - - - Investments (s.39 FMA Act) - - - - - Other - - - - -
Total cash received - - - - -

Agency Additional Estimates Statements – DFAT
53
Table 3.9: Schedule of budgeted administered cash flows (for the period ended 30 June 2008) (continued)
Actual Revised Forward Forward Forwardbudget estimate estimate estimate
2006-07 2007-08 2008-09 2009-10 2010-11$'000 $'000 $'000 $'000 $'000
Cash usedPurchase of property, plant
and equipment and intangibles - - - - - Purchase of equity instruments - - - - - Advances and loans made - - - - - Transfers to other entities - - - - - Investments (s.39 FMA Act) - - - - - Other - - - - -
Total cash used - - - - - Net cash from
investing activities - - - - -
FINANCING ACTIVITIESCash received
Proceeds from borrowing - - - - - Cash from Official Public Account 240,847 260,332 256,176 255,444 253,835 Other - - - - -
Total cash received 240,847 260,332 256,176 255,444 253,835
Cash usedNet repayment of borrowings - - - - - Dividends paid - - - - - Cash to Official Public Account 383,292 302,134 312,723 338,016 345,822 Other - - - - -
Total cash used 383,292 302,134 312,723 338,016 345,822 Net cash from
financing activities (142,445) (41,802) (56,547) (82,572) (91,987)
Net increase or (decrease) in cash held (33) - - - - Cash at beginning of reporting period 5,220 5,187 5,187 5,187 5,187 Cash from Official Public Account for:
- appropriations - - - - - - special accounts - - - - -
Transfers from other entities(Finance - Whole of Government) - - - - -
Cash to Official Public Account for:- appropriations - - - - - - special accounts - - - - -
Transfers to other entities(Finance - Whole of Government) - - - - -
Effect of exchange rate movements on cash at beginning of reporting period - - - - -
Cash at end of reporting period 5,187 5,187 5,187 5,187 5,187

Agency Additional Estimates Statements — DFAT
54
NOTES TO THE FINANCIAL STATEMENTS
Under the Australian Government’s accrual-based budgeting framework, and consistent with Australian Accounting Standards, transactions that agencies control (departmental transactions) are budgeted for and reported separately from transactions over which agencies do not have control (Administered transactions). This ensures that agencies are only held fully accountable for the transactions over which they have control.
• Departmental items are those assets, liabilities, revenues and expenses in relation to an agency or authority that are controlled by the agency. Departmental expenses include employee and supplier expenses and other administrative costs, which are incurred by the agency in providing its goods and services.
• Administered items are revenues, expenses, assets and liabilities that are managed by an agency or authority on behalf of the Government according to set Government directions. Administered expenses include subsidies, grants and personal benefit payments. Administered revenues include taxes, fees, fines and excises.
Special appropriations fund the majority of payments from the Consolidated Revenue Fund (especially those that are entitlement-driven or involve transfers to State governments).
Departmental Under the Commonwealth’s accrual budgeting framework, separate annual appropriations are provided for:
• Departmental price of outputs appropriations: representing the Government’s purchase of outputs from agencies; and
• Departmental capital appropriations: for investments by the Government for either additional equity or loans in agencies.
Administered Under the Commonwealth’s accrual budgeting framework, separate annual appropriations are provided for:
• Administered expense appropriations: for the estimated Administered expenses relating to an existing outcome, a new outcome or a Specific Purpose Payment to the states; and
• Administered capital appropriations: for increases in Administered equity through funding non-expense Administered payments.

Agency Additional Estimates Statements – DFAT
55
Administered investments in controlled entities Each Commonwealth Department is required to show an Administered investment in each Commonwealth Authority and Company Act 1997 (CAC) entity within its portfolio. The department has one administered investment in the Export Finance and Insurance Corporation. This Administered investment is valued at the Commonwealth’s ownership interest in the net assets of the CAC entity.
Asset Revaluation Australian Government agencies and authorities are required to measure property, plant and equipment (except for specialist military equipment) at up-to-date fair value. Fair value is market value unless there is no market-based evidence of fair value. In such cases, fair value is estimated using depreciated replacement cost. Revaluations will be conducted with such regularity as to ensure that the carrying value of assets at the reporting date is not materially different from fair value. Software is not considered to be property, plant and equipment and is measured at cost.

57
AUSTRALIAN TRADE COMMISSION (AUSTRADE) Section 1: Agency overview and resources; variations and measures ...............59
Overview ..........................................................................................................59 Additional estimates and variations to outcomes.............................................61 Measures — Agency summary........................................................................63 Breakdown of additional estimates by appropriation bill ..................................64 Summary of staffing changes...........................................................................65 Other receipts available to be used .................................................................65 Estimates of expenses from special appropriations.........................................65 Estimates of special account flows ..................................................................66
Section 2: Revisions to agency outcomes ..............................................................67 Outcomes, administered items and outputs.....................................................67
Section 3: Budgeted financial statements...............................................................72
Analysis of budgeted financial statements.......................................................72 Budgeted financial statements.........................................................................74 Notes to the financial statements.....................................................................82


59
AUSTRALIAN TRADE COMMISSION Section 1: Agency overview and resources; variations and measures
OVERVIEW
Austrade’s role, operating framework, outcomes and outputs as reported in the Portfolio Budget Statements 2007-08 remain unchanged as a result of Additional Estimates.
The Government's decision to transfer the 'investment promotion' function currently being undertaken by the Department of Innovation, Industry, Science and Research to the Australian Trade Commission has yet to be reflected in the Administrative Arrangements Order. Arrangements are subject to ongoing negotiation between agencies. The impact on resources is therefore not reflected in the Commission's revised estimates. Total resourcing for Austrade has decreased by $2.2 million since the 2007-08 Budget. This reduction is mainly due to the movement of administered funds within Austrade from 2007-08 to 2006-07 and a reduction in revenue from the provision of goods and services. This reduction is partially offset by an increase in depreciation.

Agency Additional Estimates Statements — Austrade
60
Table 1.1: Agency outcomes and output groups Outcome Description Output groupsOutcome 1Australians succeeding in international business with widespread community support.
Austrade focuses its effort and resources on delivering: - International business opportunities to Australians; - Export and investment services; - Access to the Export Market Development Grants scheme as an incentive and support for Australian SMEs to enter export markets and become sustainable exporters; - Programmes designed to improve community awareness of, and commitment to, trade and international investment; - Advice to the Australian Government about, and coordination of, its export and international business facilitation activities
Output 1.1 - Awareness raising: Community commitment to trade and investment; understanding of the Australian Government's export assistance programme and a positive image of Australia overseasOutput 1.2 - Government advice and coordination: Advice to the Australian Government and coordination of Australia's export activitiesOutput 1.3 - Services and Opportunities: Export and investment services and opportunities for Australians through a national and global networkOutput 1.4 - Austrade Administered: Export Market Development Grants for small to medium sized businesses
Outcome 2Australians informed about and provided access to consular, passport and immigration services in specific locations overseas.
Consular, passport and immigration services in designated locations.
Output 2.1 - Consular, passport and immigration services

Agency Additional Estimates Statements — Austrade
61
ADDITIONAL ESTIMATES AND VARIATIONS TO OUTCOMES
Table 1.2: Additional estimates and variations to outcomes – measures 2007-08 2008-09 2009-10 2010-11
($'000) ($'000) ($'000) ($'000)Outcome 1Decrease in estimates (departmental)Efficiency dividend - increase in the rate from 1 per cent to 1.25 per cent (32) (528) (1,038)
Table 1.3: Additional estimates and variations to outcomes – other variations 2007-08 2008-09 2009-10 2010-11
($'000) ($'000) ($'000) ($'000)Outcome 1Variations (administered)Movement of funds between years (2,400) - - -
Variations (departmental)Forex Adjustments Within Year (650) - - - Between Year 66 66 66 66 Price Deflators (59) (85) (90) (99) Goods and Services (s. 31 FMA Act) (2,049) (1,849) (1,849) (1,849) Depreciation 2,869 3,919 3,807 3,637 Total variations to outcomes (2,223) 2,051 1,934 1,755
Glossary:FMA Act = Financial Management and Accountability Act,1997
Explanation of variations
Movement of funds between years The movement of funds to 2006-07 of $2.4 million is a result of the higher than estimated grant payments in the Export Market Development Grants (EMDG) scheme for 2006-07. Foreign Exchange (forex) adjustment The Government’s foreign exchange risk management policy operates so that Austrade’s purchasing power overseas is maintained and funding is adjusted for gains or losses due to fluctuations in exchange rates. Adjustments are based on Budget Exchange Rates (BER) provided annually by the Department of Finance and Deregulation.

Agency Additional Estimates Statements — Austrade
62
There are two types of foreign exchange funding adjustments:
Within year forex adjustments Within year forex adjustments adjust Austrade’s funding for the difference between the BER and the actual exchange rate of transactions. If the actual exchange rate is less than the BER, funding is increased whereas funding is reduced when the actual exchange rate is greater than BER.
Between year forex adjustments Between year forex rebasing maintains the foreign currency spending power by adjusting Austrade’s funding for movements in the BER from one year to the next. If the BER falls funding is increased whereas funding is reduced when the BER rises between years.
Price Deflators Austrade’s funding has decreased by $0.06 million in 2007-08 to reflect updated economic parameters.
Goods and Services The decrease to goods and services revenue of $2.0 million in 2007-08 is the result of a reduction in estimated revenue from external sources. Depreciation An increase in depreciation funding of $2.9 million for 2007-08 is a result of revised estimates based on the current asset base and planned capital expenditure.

Agency A
dditional Estimates Statem
ents — A
ustrade
63
MEASURES — AGENCY SUMMARY
Table 1.4: Summary of measures since the 2007-08 Budget
Measure Outcome Outputgroups
affectedAdmin Dept Admin Dept Admin Dept Admin Deptitems outputs Total items outputs Total items outputs Total items outputs Total
Expense MeasuresEfficiency dividend - increase in the rate from 1 per cent to 1.25 per cent 1 1.3 - - - - (32) (32) - (528) (528) - (1,038) (1,038)
Total Expense Measures - - - - (32) (32) - (528) (528) - (1,038) (1,038)
2007-08($'000)
2008-09($'000)
2009-10($'000)
2010-11($'000)

Agency Additional Estimates Statements — Austrade
64
BREAKDOWN OF ADDITIONAL ESTIMATES BY APPROPRIATION BILL
Table 1.5: Appropriation Bill (No. 3) 2007-08 2006-07 2007-08 2007-08 Additional Reduced
available Budget revised estimates estimates($'000) ($'000) ($'000) ($'000) ($'000)
ADMINISTERED ITEMSOutcome 1 - Output Group 1.4Export Market Development Grants for small to medium sized businesses 153,920 159,280 156,880 - (2,400)
Total 153,920 159,280 156,880 - (2,400) DEPARTMENTAL OUTPUTSOutcome 1 - Output Groups 1.1 - 1.3Australians succeeding in international business with widespread community support
163,659 160,637 162,863 2,226 -
Outcome 2 - Output Group 2.1Australians informed about and provided access to consular, passport and immigration services in specific locations overseas
9,783 9,706 9,706 -
Total 173,442 170,343 172,569 2,226 - Total administered and
departmental 327,362 329,623 329,449 2,226 (2,400)
Note: 2006-07 available appropriation is included to allow a comparison of this year's appropriationwith what was made available for use in the previous year. Available appropriation is the amount available to be drawn down, and is equal to:Budget Appropriation + Additional Estimates Appropriation + DIAB + AFM - Savings - Rephasings - Other Reductions +/- Section 32

Agency Additional Estimates Statements — Austrade
65
SUMMARY OF STAFFING CHANGES
Table 1.7: Average Staffing Level (ASL) 2007-08 2007-08Budget Revised Variation
Outcome 1Australians succeeding in international business with widespread community support 986 985 (1)
Outcome 2Australians informed about and provided access to consular, passport and immigration services in specific locations overseas
51 50 (1)
Total 1,037 1,035 (2)
OTHER RECEIPTS AVAILABLE TO BE USED
Table 1.8 provides details of other receipts available to be used and includes FMA Act s.31 receipts, CAC body receipts that are available to be spent, special accounts (non-appropriation receipts) and resources received free of charge.
Table 1.8: Other receipts available to be used Budget Revised
estimate estimate2007-08 2007-08
($'000) ($'000)Departmental other receipts Sale of Goods and Services (s31 FMA Act) 29,479 27,430 Other (s31 FMA Act) 3,677 3,677 Total departmental other receipts available to be used 33,156 31,107
Glossary: FMA Act = Financial Management and Accountability Act,1997
ESTIMATES OF EXPENSES FROM SPECIAL APPROPRIATIONS
Not applicable to Austrade.

Agency Additional Estimates Statements — Austrade
66
ESTIMATES OF SPECIAL ACCOUNT FLOWS
Table 1.10: Estimates of special account flows Outcome Opening Receipts Payments Adjustments Closing
No. Balance Balance2007-08 2007-08 2007-08 2007-08 2007-082006-07 2006-07 2006-07 2006-07 2006-07
($'000) ($'000) ($'000) ($'000) ($'000)Admin Payments and Receipts 1 100 7,900 7,900 - 100 for Other Entities - s20 FMA Act (A) - 7,670 7,570 100Other Trust Moneys (D) 1 77 700 700 - 77
- 781 704 77Total special accounts 177 8,600 8,600 - 177
Glossary: FMA Act = Financial Management and Accountability Act,1997
A = AdministeredD = Departmental
Agency Additional Estimates Statements — Austrade
67
Section 2: Revisions to agency outcomes
OUTCOMES, ADMINISTERED ITEMS AND OUTPUTS
Table 1.1 ‘Agency outcomes and outputs groups’ lists the outcome statements and output groups for the Australian Trade Commission.
The outcomes and outputs framework for Austrade remains unchanged to that reported in the Portfolio Budget Statements 2007-08. However, an overall decrease to resources since the 2007-08 Budget has changed the price of outputs.

Agency Additional Estimates Statements — Austrade
68
Figure 2: Outcome and output structure for Austrade
Australian Trade CommissionChief Executive Officer, Mr Peter O'Byrne
Total Price of Outputs $360.556 millionDepartmental Outcomes Appropriation $172.569 million
Total Admin Expenses $156.880 million
Output Group 1.3Services and Opportunities: Export and investment services and opportunities for Australians through a national and
global network
Total price $161.487 millionApprop $133.602 million
Output Group 1.4Austrade Administered: Export Market
Development Grants for small to medium sized businesses
Total price $156.880 millionAdmin exp $156.880 million
Output Group 1.2Government advice and coordination:
Advice to the Australian Government and coordination of Australia's export
activities
Total price $11.157 millionApprop $10.965 million
Outcome 1Australians succeeding in international business with widespread community
support
Total price $348.319 millionApprop $162.863 million
Admin exp $156.880 million
Output Group 2.1Consular, passport and immigration
services
Total price $12.237 millionApprop $9.706 million
Outcome 2Australians informed about and provided
access to consular, passport and immigration services in specific
locations overseas
Total price $12.237 millionApprop $9.706 million
Output Group 1.1Awareness raising: Community
commitment to trade and investment; understanding of the Australian Government's export assistance
programme and a positive image of Australia overseas
Total price $18.795 millionApprop $18.296 million

Agency Additional Estimates Statements — Austrade
69
Outcome 1
Explanation of variations There is an overall increase in Departmental resources of $0.2m for Outcome 1. This is due to increased funding for depreciation ($2.9m), offset by a reduction in goods and services revenue ($2.0m), foreign exchange variations ($0.6m) and onshore and offshore inflation ($0.1m). This is reflected in an adjustment to Output 1.3.
There is a reduction to the Administered appropriation for Outcome 1 of $2.4 million resulting from the movement of funds to 2006-07 after the 2007-08 Budget. This is reflected in an adjustment to Output 1.4.
Revised performance information — 2007-08 Other than the changes to the price of Outputs 1.3 and 1.4, the performance information for Austrade remains unchanged to that reported in the 2007-08 Portfolio Budget Statements.

Agency Additional Estimates Statements — Austrade
70
Table 2.1: Performance information for outputs affected by additional estimates — outcome 1 Output Performance information Performance information
2007-08 Budget 2007-08 revisedOutput 1.3
Quality: Client satisfaction (85%) Quality: No change
Quantity: Number of clients achieving export success with Austrade's assistance (5,500) (1)
Number of new and irregular exporter clients achieving export success with Austrade's assistance (1,900) (1)
Number of established clients achieving export success with Austrade's assistance (3,600) (1)
Dollar value of those export successes achieved by clients with acknowledged assistance from Austrade ($18.00b)(1)
Total number of clients achieving outward investment success with Austrade assistance (170) (2)
Total number of businesses achieving export success indirectly through Austrade (1,000) (2)
Total number of clients receiving services from Austrade (16,000) (2)
Quantity: No change
Price: $161.310m Price: $161.487mOutput Performance information Performance information
2007-08 Budget 2007-08 revisedOutput 1.4
Quantity: Total number of grant applicants (4,150) (2)
Total number of grant recipients (3,840) (2)
Number of first-time grant applicants (1,245) (2)
Number of first-time grant recipients (1,150) (2)
Quantity: No change
Price: $159.280m Price: $156.880m
Notes:(1) Target is a quantity based on planned levels of activity(2) Estimate is a quantity based on historical performance
Austrade Administered: Export Market Development Grants for small to medium sized businesses
Services and Opportunities: Export and investment services and opportunities for Australians through a national and global network

Agency Additional Estimates Statements — Austrade
71
Outcome 2
Explanation of variations There are no variations to Outcome 2 since the 2007-08 Budget.
Revised performance information – 2007-08 The performance information for Outcome 2 remains unchanged to that reported in the 2007-08 Portfolio Budget Statements.

Agency Additional Estimates Statements — Austrade
72
Section 3: Budgeted financial statements
ANALYSIS OF BUDGETED FINANCIAL STATEMENTS
An analysis of Austrade’s budgeted financial statements, as reflected in the Departmental financial statements and Administered schedules, is provided below.
Departmental financial statements Budgeted departmental income statement This statement provides actual financial results for 2006-07 and the estimated revenue and expenses for 2007-08 and forward years.
Total revenue in 2007-08 is estimated to be $203.7 million which represents an increase of $0.2 million from Budget. This is a result of the increased funding for depreciation offset by a reduction in revenue from the provision of goods and services revenue, foreign exchange variations and onshore and offshore inflation.
Total expenses for 2007-08 have also increased by $0.2 million to reflect the increase in revenue.
Budgeted departmental balance sheet This statement discloses the estimated end of year financial position for Austrade.
The Commission’s net asset position of $59.5 million represents an increase of $3.2 million from the 2007-08 Budget. The increase is predominantly due to the 2006-07 asset revaluations and the flow on effect of the 2006-07 actual results impacting the budgeted financial position.
Budgeted departmental statement of cash flows This statement shows the extent and nature of cash flows as a result of Austrade’s operating, investing and financing activities.
The Commission’s cash balance at the end of 2007-08 is estimated to be $5.5 million.
Departmental statement of changes in equity — summary of movement This statement discloses movements in the Commission’s equity for 2007-08.
The Commission will receive an equity injection of $4.9 million for 2007-08 increasing Austrade’s total equity to $59.5 million.

Agency Additional Estimates Statements — Austrade
73
Departmental capital budget statement This statement shows all planned Departmental capital expenditure on non-financial assets, whether funded through capital appropriations, additional equity, borrowings or funds from internal sources.
Austrade has reduced its estimated capital expenditure on non-financial assets in 2007-08 by $1.0m since the 2007-08 Budget.
Departmental property, plant, equipment and intangibles — summary of movement This statement shows the movements in departmental non-financial assets for the budget year.
Schedule of administered activity Details of transactions administered by Austrade on behalf of the Commonwealth are shown in the following schedules to the financial statements:
Schedule of budgeted income and expenses administered on behalf of Government This schedule discloses the revenue and expenses administered on behalf of the Government.
Administered expenses of $156.9 million have decreased by $2.4m since the 2007-08 Budget as a result of a movement of funds to 2006-07 after the 2007-08 Budget.
Schedule of budgeted assets and liabilities administered on behalf of Government This schedule identifies the assets and liabilities administered on behalf of the Government.
Total administered assets and liabilities for 2007-08 are estimated at $0.5 million and $3.4 million respectively. The Commission’s liabilities have increased by $1.4 million since the 2007-08 Budget. This is predominantly a result of the flow on effect of the grants payable from 2006-07 impacting the budgeted financial position.
Schedule of budgeted administered cash flows This schedule discloses the cash flows administered on behalf of the Government.

Agency Additional Estimates Statements — Austrade
74
BUDGETED FINANCIAL STATEMENTS
Departmental financial statements Table 3.1: Budgeted departmental income statement (for the period ended 30 June 2008)
Actual Revised Forward Forward Forwardbudget estimate estimate estimate
2006-07 2007-08 2008-09 2009-10 2010-11$'000 $'000 $'000 $'000 $'000
INCOMERevenue
Revenues from Government 171,951 172,569 174,850 175,883 176,872 Goods and services 28,797 27,430 27,630 27,630 27,630 Other 2,139 3,427 3,227 3,227 3,227
Total revenue 202,887 203,426 205,707 206,740 207,729 Gains
Net foreign exchange gains 723 - - - - Net gains from sale of assets 110 250 250 250 250
Total gains 833 250 250 250 250 Total income 203,720 203,676 205,957 206,990 207,979 EXPENSE
Employees 101,714 96,282 97,921 98,055 98,742 Suppliers 91,936 90,994 90,342 91,353 91,825 Depreciation and amortisation 12,978 16,000 17,294 17,182 17,012 Write-down of assets and
impairment of assets 45 200 200 200 200 Net losses from sale of assets - 200 200 200 200
Total expenses 206,673 203,676 205,957 206,990 207,979 Operating result before Income Tax (2,953) - - - -
Income Tax expense - - - - -
Net surplus or (deficit) attributable to the Australian Government (2,953) - - - -

Agency Additional Estimates Statements — Austrade
75
Table 3.2: Budgeted departmental balance sheet (as at 30 June 2008) Actual Revised Forward Forward Forward
budget estimate estimate estimate2006-07 2007-08 2008-09 2009-10 2010-11
$'000 $'000 $'000 $'000 $'000ASSETSFinancial assets
Cash and cash equivalents 2,915 5,500 5,500 5,500 5,500 Receivables 36,965 30,393 31,561 32,618 34,730
Total financial assets 39,880 35,893 37,061 38,118 40,230
Non-financial assets(1)
Land and buildings 23,747 28,274 26,252 24,632 23,267 Infrastructure, plant and equipment 12,496 15,483 16,299 16,870 17,104 Intangibles 11,654 13,374 13,899 14,266 14,385 Other 10,101 10,101 10,101 10,101 10,101
Total non-financial assets 57,998 67,232 66,551 65,869 64,857 Total assets 97,878 103,125 103,612 103,987 105,087 LIABILITIESPayables
Suppliers 10,969 10,151 9,333 8,515 8,515 Other payables 9,854 9,546 9,238 8,930 8,930
Total payables 20,823 19,697 18,571 17,445 17,445
ProvisionsEmployees 21,197 22,697 24,197 25,698 27,198 Other provisions 1,270 1,270 1,270 1,270 1,270
Total provisions 22,467 23,967 25,467 26,968 28,468 Total liabilities 43,290 43,664 44,038 44,413 45,913
EQUITY(2)
Parent entity interestContributed equity 8,281 13,154 13,267 13,267 13,267 Reserves 59,322 59,322 59,322 59,322 59,322 Retained surpluses or
accumulated deficits (13,015) (13,015) (13,015) (13,015) (13,015) Total parent entity interest 54,588 59,461 59,574 59,574 59,574
Total equity 54,588 59,461 59,574 59,574 59,574
Current assets 48,334 50,925 51,166 51,351 51,894 Non-current assets 49,544 52,200 52,446 52,636 53,193 Current liabilities 38,649 38,983 39,317 39,652 40,991 Non-current liabilities 4,641 4,681 4,721 4,761 4,922
Notes:
2. 'Equity' is the residual interest in assets after deduction of liabilities.
1. Non-financial assets have been reclassified since the 2007-08 Budget. Land and Buildings which were previously classified as Infrastructure, Plant & Equipment are now separately identified.

Agency Additional Estimates Statements — Austrade
76
Table 3.3: Budgeted departmental statement of cash flows (for the period ended 30 June 2008)
Actual Revised Forward Forward Forwardbudget estimate estimate estimate
2006-07 2007-08 2008-09 2009-10 2010-11$'000 $'000 $'000 $'000 $'000
OPERATING ACTIVITIESCash received
Goods and services 28,053 27,430 27,630 27,630 27,630 Appropriations 174,685 179,141 173,682 174,826 174,360 Net GST received 4,498 4,864 4,864 4,820 4,892 Other cash received 3,219 3,427 3,227 3,227 3,227
Total cash received 210,455 214,862 209,403 210,503 210,109 Cash used
Employees 100,573 94,782 96,421 96,555 97,242 Suppliers 94,625 92,120 91,468 92,478 91,825 Cash to the Official Public Account 27,500 - - - - Net GST paid 4,885 4,864 4,864 4,820 4,892
Total cash used 227,583 191,766 192,753 193,853 193,959 Net cash from or (used by)
operating activities (17,128) 23,096 16,650 16,650 16,150 INVESTING ACTIVITIESCash received
Proceeds from sales of property,plant and equipment and intangibles 607 250 250 250 250
Total cash received 607 250 250 250 250 Cash used
Purchase of property, plant and equipment 17,007 25,634 17,013 16,900 16,400
Total cash used 17,007 25,634 17,013 16,900 16,400 Net cash from or (used by)
investing activities (16,400) (25,384) (16,763) (16,650) (16,150)
FINANCING ACTIVITIESCash received
Appropriations - contributed equity 4,511 4,873 113 - - Total cash received 4,511 4,873 113 - -
Cash usedTotal cash used - - - - - Net cash from or (used by)
financing activities 4,511 4,873 113 - - Net increase or (decrease)
in cash held (29,017) 2,585 - - - Cash at the beginning of
the reporting period 31,932 2,915 5,500 5,500 5,500 Cash at the end of the
reporting period 2,915 5,500 5,500 5,500 5,500

Agency Additional Estimates Statements — Austrade
77
Table 3.4: Departmental statement of changes in equity — summary of movement (Budget Year 2007-08)
Accumulated Asset Other Contributed Totalresults revaluation reserves equity/ equity
reserve capital$'000 $'000 $'000 $'000 $'000
Opening balance as at 1 July 2007Balance carried forward from
previous period (13,015) 21,532 37,790 8,281 54,588 Adjustment for changes in
accounting policies - - - - - Adjusted opening balance (13,015) 21,532 37,790 8,281 54,588 Income and expense
Net operating result - - - - -
Total income and expenses - - - - - Transactions with owners
Contribution by ownersAppropriation (equity injection) - - - 4,873 4,873
Sub-total transactions with owners - - - 4,873 4,873 Estimated closing balance
as at 30 June 2008 (13,015) 21,532 37,790 13,154 59,461
Table 3.5: Departmental capital budget statement (Budget Year 2007-08) Actual Revised Forward Forward Forward
budget estimate estimate estimate2006-07 2007-08 2008-09 2009-10 2010-11
$'000 $'000 $'000 $'000 $'000CAPITAL APPROPRIATIONS
Total equity injections 8,281 4,873 113 - - Appropriation of Previous Year Accrued Revenue - - - - -
Total capital appropriations 8,281 4,873 113 - - Represented by:
Purchase of non-financial assets 8,281 4,873 113 - - Other - - - - -
Total represented by 8,281 4,873 113 - - PURCHASE OF NON-FINANCIAL ASSETS
Funded by capital appropriation 8,281 4,873 113 - - Funded internally by
Departmental resources 8,726 20,761 16,900 16,900 16,400 Total 17,007 25,634 17,013 16,900 16,400

Agency Additional Estimates Statements — Austrade
78
Table 3.6: Departmental property, plant, equipment and intangibles — summary of movement (Budget year 2007-08)
Buildings Other Computer Totalinfrastructure software
plant andequipment
$'000 $'000 $'000 $'000As at 1 July 2007
Gross book value 34,258 26,875 27,934 89,067 Accumulated depreciation 10,511 14,379 16,280 41,170
Opening net book value 23,747 12,496 11,654 47,897 Additions:
by purchase 11,527 7,887 6,220 25,634 Depreciation/amortisation expense 7,000 4,500 4,500 16,000 Other movements - (400) - (400)
As at 30 June 2008Gross book value 45,785 34,762 34,154 114,701 Accumulated depreciation 17,511 19,279 20,780 57,570
Estimated closing net book value 28,274 15,483 13,374 57,131

Agency Additional Estimates Statements — Austrade
79
Table 3.7: Schedule of budgeted income and expenses administered on behalf of government (for the period ended 30 June 2008)
Actual Revised Forward Forward Forwardbudget estimate estimate estimate
2006-07 2007-08 2008-09 2009-10 2010-11$'000 $'000 $'000 $'000 $'000
INCOME ADMINISTERED ONBEHALF OF GOVERNMENT
RevenueNon-taxation
Goods and services 1 - - - - Other sources of non-taxation
revenues 93 - - - - Total non-taxation 94 - - - - Total revenues administered
on behalf of Government 94 - - - -
Total income administeredon behalf of Government 94 - - - -
EXPENSES ADMINISTERED ONBEHALF OF GOVERNMENTGrants 146,569 148,916 142,880 142,880 142,880 Employees 5,790 5,680 5,350 5,350 5,350 Suppliers 2,119 2,284 2,170 2,170 2,170
Total expenses administeredon behalf of Government 154,478 156,880 150,400 150,400 150,400

Agency Additional Estimates Statements — Austrade
80
Table 3.8: Schedule of budgeted assets and liabilities administered on behalf of government (as at 30 June 2008)
Actual Revised Forward Forward Forwardbudget estimate estimate estimate
2006-07 2007-08 2008-09 2009-10 2010-11$'000 $'000 $'000 $'000 $'000
ASSETS ADMINISTERED ON BEHALF OF GOVERNMENT
Financial assetsCash and cash equivalents 10 - - - - Receivables 532 532 532 532 532
Total financial assets 542 532 532 532 532 Total assets administered
on behalf of Government 542 532 532 532 532 LIABILITIES ADMINISTERED ON
BEHALF OF GOVERNMENTProvisions
Employees 1,799 1,799 1,799 1,799 1,799 Total provisions 1,799 1,799 1,799 1,799 1,799
PayablesSuppliers 106 106 106 106 106 Grants payable 1,430 1,430 1,430 1,430 1,430 Other payables 90 90 90 90 90
Total payables 1,626 1,626 1,626 1,626 1,626
Total liabilities administeredon behalf of Government 3,425 3,425 3,425 3,425 3,425

Agency Additional Estimates Statements — Austrade
81
Table 3.9: Schedule of budgeted administered cash flows (for the period ended 30 June 2008)
Actual Revised Forward Forward Forwardbudget estimate estimate estimate
2006-07 2007-08 2008-09 2009-10 2010-11$'000 $'000 $'000 $'000 $'000
OPERATING ACTIVITIESCash received
Net GST received 200 195 195 195 195 Other 94 - - - -
Total cash received 294 195 195 195 195 Cash used
Employees 5,852 5,680 5,350 5,350 5,350 Grant payments 145,140 148,916 142,880 142,880 142,880 Suppliers 2,081 2,284 2,170 2,170 2,170 Net GST paid 200 195 195 195 195
Total cash used 153,273 157,075 150,595 150,595 150,595 Net cash from
operating activities (152,979) (156,880) (150,400) (150,400) (150,400) INVESTING ACTIVITIESNet cash from
investing activities - - - - -
FINANCING ACTIVITIESNet cash from
financing activities - - - - -
Net increase or (decrease) in cash held (152,979) (156,880) (150,400) (150,400) (150,400) Cash at beginning of reporting period 7,040 10 - - - Cash from Official Public Account for:
- appropriations 153,357 156,880 150,400 150,400 150,400 Cash to Official Public Account for:
- other (7,408) (10) - - -
Cash at end of reporting period 10 - - - -

Agency Additional Estimates Statements — Austrade
82
NOTES TO THE FINANCIAL STATEMENTS
The Commission budgeted statements are prepared on an Australian Equivalents to International Financial Standards (AEIFRS) basis.
Under the Australian Government’s accrual budgeting framework, transactions that agencies control (Departmental transactions) are separately budgeted for and reported on from transactions that agencies do not have control over (Administered transactions). This ensures that agencies are only held fully accountable for the transactions over which they have control.
Departmental Departmental assets, liabilities, revenues and expenses in relation to an agency or authority are those which are controlled by the agency. Departmental expenses include employee and supplier expenses and other administrative costs which are incurred by the agency in providing its goods and services.
Administered Administered items are revenues, expenses, assets and liabilities which are managed by an agency or authority on behalf of the Government according to set Government directions. Administered expenses include subsidies, grants and personal benefit payments and administered revenues include taxes, fees, fines and excises.

83
AUSAID (AUSTRALIAN AGENCY FOR INTERNATIONAL
DEVELOPMENT)
Section 1: Agency overview and resources; variations and measures ...............85 Overview ..........................................................................................................85 Additional estimates and variations to outcomes.............................................86 Measures — Agency summary........................................................................87 Breakdown of additional estimates by appropriation bill ..................................88 Summary of staffing changes...........................................................................89 Other receipts available to be used .................................................................89 Estimates of expenses from special appropriations.........................................90 Estimates of special account flows ..................................................................90
Section 2: Revisions to agency outcomes ..............................................................91 Outcomes, administered items and outputs.....................................................91
Section 3: Budgeted financial statements...............................................................96 Budgeted financial statements.........................................................................96


85
AUSAID Section 1: Agency overview and resources; variations and measures
OVERVIEW
Through the 2007-08 Portfolio Additional Estimates, AusAID will receive an additional $211 million to enable the Australian Government to increase its contribution to the fifteenth replenishment of the International Development Association.
To implement the Government’s election commitments, AusAID has applied the two per cent Efficiency Dividend to its current and forward estimates.
There have been no changes to AusAID’s role, outcome and outputs, and/or its evaluation, competitive tendering and contracting and purchaser provider practices as a result of Additional Estimates.
Table 1.1: Agency outcomes and output groups Outcome Description OutputOutcome 1To assist developing countries to reduce poverty and achieve sustainable development, in line with Australia's national interest
Promotion of sustainable development and poverty reduction in developing countries, particularly in the Asia-Pacific region.
Output 1.1 Policy Output 1.2 Programme Management
Outcome 2Australia's national interest advanced by implementing a partnership between Australia and Indonesia for reconstruction and development
To support Indonesia's reconstruction and development efforts, both in and beyond tsunami affected areas, through long-term cooperation, focused on assistance for economic and social development projects and Indonesia's programmes of reform and democratisation.
Output 2.1 Australia-Indonesia Partnership for Reconstruction and Development Management

Agency Additional Estimates Statements — AusAID
86
ADDITIONAL ESTIMATES AND VARIATIONS TO OUTCOMES
Table 1.2: Additional estimates and variations to outcomes – measures 2007-08 2008-09 2009-10 2010-11
($'000) ($'000) ($'000) ($'000)Outcome 1Increase in estimates (administered)Afghanistan and Pakistan - assistance - 50,687 - -
Global Fund - contribution - 46,500 46,500 -
International Development Association 15 replenishment - contribution 210,894 - - -
Humanitarian assistance - Darfur - - - -
Orang-utan conservation in Indonesia - funding - - - -
Emergency and humanitarian relief - contributions - - - -
Increase in estimates (departmental)Afghanistan and Pakistan - assistance - 15,657 - -
Decrease in estimates (departmental)Election commitment Savings: 2 per cent Efficiency Dividend (380) (2,103) (1,957) (1,961)
Efficiency dividend - increase in the rate from 1 per cent to 1.25 percent - (180) (363) (551)
Outcome 2Decrease in estimates (departmental)Election commitment Savings: 2 per cent Efficiency Dividend (30) (132) (123) (107)
Table 1.3: Additional estimates and variations to outcomes – other variations 2007-08 2008-09 2009-10 2010-11
($'000) ($'000) ($'000) ($'000)Outcome 1Resources available at Budget - administeredTransfer of funds to the Department of the Environment, Water, Heritage and the Arts (DEWHA) for implementation of the Kokoda Track initiative (refer to 2007-08 PEFO for further detail)
(1,888) - - -
Resources available at Additional Estimates (1,888) - - -

87
Agency A
dditional Estimates Statem
ents — A
usAID
MEASURES — AGENCY SUMMARY
Table 1.4: Summary of measures since the 2007-08 Budget Measure Outcome Outputs
AffectedAdmin Dept Admin Dept Admin Dept Admin Deptitems outputs Total items outputs Total items outputs Total items outputs Total
Expense MeasuresAfghanistan and Pakistan - assistance1 1 1.1 & 1.2 - - - 50,687 15,657 66,344 - - - - - -
Global Fund - contribution 1 - - - 46,500 - 46,500 46,500 - 46,500 - - -International Development Association 15 replenishment - contribution
1 42,200 - 42,200 - - - - - - - - -
Election Commitment Savings: 2 per cent Efficiency Dividend 1 & 2 1.1, 1.2 ,
2.1 - (410) (410) - (2,235) (2,235) - (2,080) (2,080) - (2,068) (2,068)
Efficiency dividend - increase in rate from 1 per cent to 1.25 per cent 1 1.1 & 1.2 - - - - (180) (180) - (363) (363) - (551) (551)
Humanitarian assistance - Darfur2 1 - - - - - - - - - - - -
Orang-utan conservation in Indonesia - funding2 1 - - - - - - - - - - - -
Emergency and humanitarian relief -contributions2 1 - - - - - - - - - - - -
Total ExpenseMeasures 42,200 (410) 41,790 97,187 13,152 110,339 46,500 (2,443) 44,057 - (2,641) (2,641)
Capital MeasuresInternational Development Association 15 replenishment - contribution
1 168,664 - 168,664 - - - - - - - - -
Total CapitalMeasures 168,664 - 168,664 - - - - - - - - -
Total of All Measures 210,864 (410) 210,454 97,187 13,152 110,339 46,500 (2,443) 44,057 - (2,641) (2,641)
2009-10($'000)
2010-11($'000)
2007-08($'000)
2008-09($'000)
1. This measure includes $48.6 million absorbed in 2007-08. 2. This measure has been absorbed from within the Aid Budget.

Agency Additional Estimates Statements — AusAID
88
BREAKDOWN OF ADDITIONAL ESTIMATES BY APPROPRIATION BILL
Table 1.5: Appropriation Bill (No. 3) 2007-08 2006-07 2007-08 2007-08 Additional Reduced
available Budget revised estimates estimates($'000) ($'000) ($'000) ($'000) ($'000)
ADMINISTERED ITEMSOutcome 1To assist developing countries to reduce poverty and achieve sustainable development, in line with Australia's national interest
1,761,820 2,483,918 2,226,495 0 257,423
Outcome 2Australia's national interest advanced by implementing a partnership between Australia and Indonesia for reconstruction and development
3,370 4,482 4,482 0 0
Total 1,765,190 2,488,400 2,230,977 0 257,423DEPARTMENTAL OUTPUTSOutcome 1To assist developing countries to reduce poverty and achieve sustainable development, in line with Australia's national interest
87,440 102,386 102,006 0 380
Outcome 2Australia's national interest advanced by implementing a partnership between Australia and Indonesia for reconstruction and development
5,722 6,518 6,488 0 30
Total 93,162 108,904 108,494 0 410Total administered and
departmental 1,858,352 2,597,304 2,339,471 0 257,833Note: 2006-07 available appropriation is included to allow a comparison of this year's appropriationwith what was made available for use in the previous year. Available appropriation is the amount available to be drawn down, and is equal to:Budget Appropriation + Additional Estimates Appropriation + DIAB + AFM - Savings - Rephasings - Other Reductions +/- Section 32
Note: No appropriation is provided in Appropriation Bill 3 for the agency where the total fundingchange across outcomes for departmental outputs is negative.
The reduction in Departmental Outputs for Outcome 1 and Outcome 2 relates to the application of the one off 2 per cent efficiency dividend. Note: The decrease in administered items relates to a change in the accounting treatment for the funding for the International Development Association. The original funding of $255 million provided in Bill 1 of the 2007-08 Budget, will be returned to the Budget as the investment component of this replenishments is being funded through Bill 4. AusAID’s overall appropriation has increased by $210.6 million in 2007-08. Note: The balance of the decrease relates to the transfer of administered appropriation to DEWHA (refer to Table 1.3 for details).
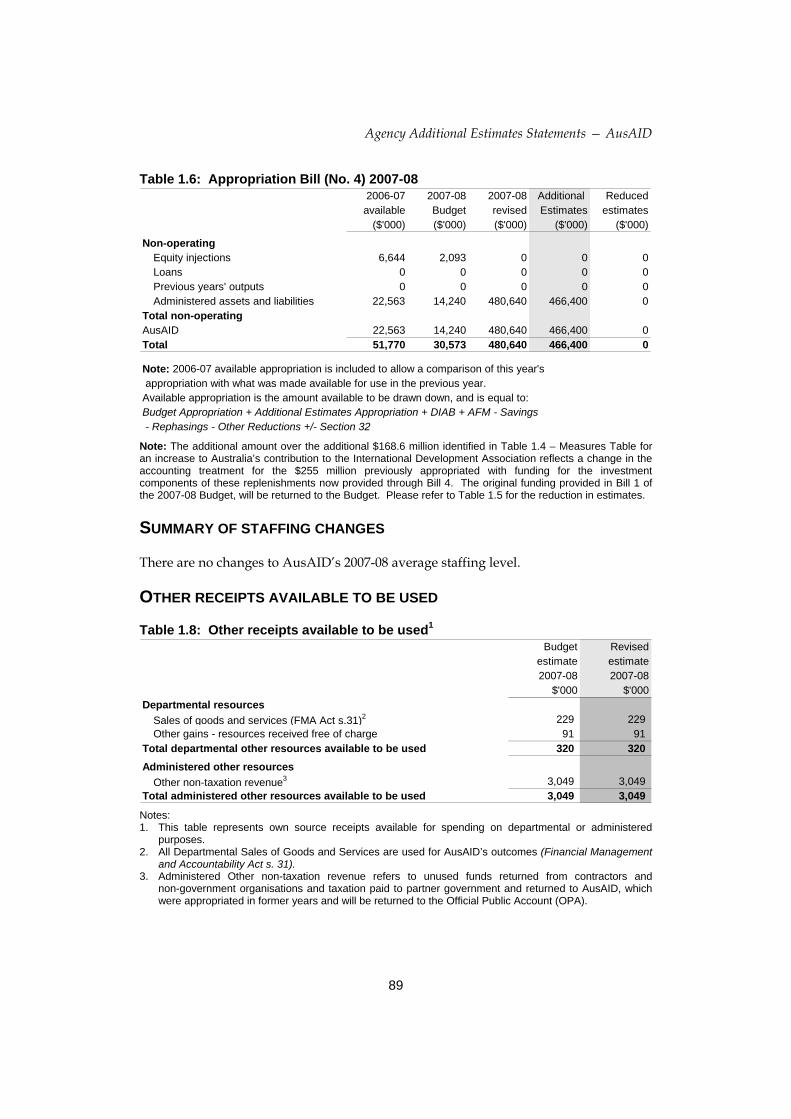
Agency Additional Estimates Statements — AusAID
89
Table 1.6: Appropriation Bill (No. 4) 2007-08 2006-07 2007-08 2007-08 Additional Reduced
available Budget revised Estimates estimates($'000) ($'000) ($'000) ($'000) ($'000)
Non-operatingEquity injections 6,644 2,093 0 0 0Loans 0 0 0 0 0Previous years' outputs 0 0 0 0 0Administered assets and liabilities 22,563 14,240 480,640 466,400 0
Total non-operatingAusAID 22,563 14,240 480,640 466,400 0Total 51,770 30,573 480,640 466,400 0
Note: 2006-07 available appropriation is included to allow a comparison of this year's appropriation with what was made available for use in the previous year. Available appropriation is the amount available to be drawn down, and is equal to:Budget Appropriation + Additional Estimates Appropriation + DIAB + AFM - Savings - Rephasings - Other Reductions +/- Section 32 Note: The additional amount over the additional $168.6 million identified in Table 1.4 – Measures Table for an increase to Australia’s contribution to the International Development Association reflects a change in the accounting treatment for the $255 million previously appropriated with funding for the investment components of these replenishments now provided through Bill 4. The original funding provided in Bill 1 of the 2007-08 Budget, will be returned to the Budget. Please refer to Table 1.5 for the reduction in estimates.
SUMMARY OF STAFFING CHANGES
There are no changes to AusAID’s 2007-08 average staffing level.
OTHER RECEIPTS AVAILABLE TO BE USED
Table 1.8: Other receipts available to be used1 Budget Revised
estimate estimate2007-08 2007-08
$'000 $'000Departmental resources
Sales of goods and services (FMA Act s.31)2 229 229 Other gains - resources received free of charge 91 91
Total departmental other resources available to be used 320 320 Administered other resources
Other non-taxation revenue3 3,049 3,049 Total administered other resources available to be used 3,049 3,049 Notes: 1. This table represents own source receipts available for spending on departmental or administered
purposes. 2. All Departmental Sales of Goods and Services are used for AusAID’s outcomes (Financial Management
and Accountability Act s. 31). 3. Administered Other non-taxation revenue refers to unused funds returned from contractors and
non-government organisations and taxation paid to partner government and returned to AusAID, which were appropriated in former years and will be returned to the Official Public Account (OPA).

Agency Additional Estimates Statements — AusAID
90
ESTIMATES OF EXPENSES FROM SPECIAL APPROPRIATIONS
AusAID has no expenses or cash drawdown associated with special appropriations.
ESTIMATES OF SPECIAL ACCOUNT FLOWS
Opening Closingbalance Receipts Payments Adjustments balance2007-08 2007-08 2007-08 2007-08 2007-082006-07 2006-07 2006-07 2006-07 2006-07
Outcome $'000 $'000 $'000 $'000 $'000Services for Other Government and Non-Agency Bodies (A) 1 3,681 14,000 14,000 0 3,681
Financial Management and Accountability Act 1997 s.20 2,154 7,967 6,439 0 3,681
Australia-Indonesia Partnership for Reconstruction and Development (Grants) Special Account (A)
2 288,290 0 130,000 0 158,290
Financial Management and Accountability Act 1997 s.20 395,738 0 107,448 0 288,290
Australia-Indonesia Partnership for Reconstruction and Development (Loans) Special Account (A)
2 442,754 0 98,000 0 344,754
Financial Management and Accountability Act 1997 s.20 500,000 0 57,246 0 442,754
Total special accounts 2007-08 Budget estimate 734,725 14,000 242,000 0 506,725
Total special accounts2006-07 estimated actual 897,892 7,967 171,133 0 734,725
(A) = Administered (D) = Departmental
Note: The two special accounts for the Australia-Indonesia Partnership for Reconstruction and Development were created to hold the $1 billion grants and loans appropriation through the 2004-05 Portfolio Supplementary Additional Estimates Statements tabled in March 2005.

Agency Additional Estimates Statements — AusAID
91
Section 2: Revisions to agency outcomes
OUTCOMES, ADMINISTERED ITEMS AND OUTPUTS
Table 1.1 ‘Agency outcomes and outputs groups’ lists the outcome statements and outputs for AusAID.

Agency Additional Estimates Statements — AusAID
92
Figure 2: Outcome and Output structure for AusAID
Outcome 1To assist developing countries to reduce
poverty and achieve sustainable development, in line with Australia's
national interest
Total price: $102.006mDept outcome approp: $102.326m
Total admin appropriation: $2,226.495mTotal admin expenses: $2,602.894m
AusAIDDirector General: Bruce Davis
Total price of outputs: $108.814mTotal departmental outcomes appropriation: $108.723m
Total administered appropriation: $2,230.977mTotal administered expenses: $2,820.676m
Outcome 2Australia's national interest advanced by
implementing a partnership between Australia and Indonesia for
reconstruction and development
Total price: $6.448mDept outcome approp: $6.448m
Total admin appropriation: $4.482mTotal admin expenses: $217.782m
Output 1.1Policy
Total price: $19.687mDept output approp: $19.749m
Output 1.2
Programme ManagementTotal price: $82.319m
Dept output approp: $82.577mCapital injection (cash): $2.093m
Output 2.1Australia-Indonesia Partnership for Reconstruction and Development
Management
Total price: $6.448mDept output approp: $6.448m
Administered ItemsAustralia's Aid Programme
Appropriation: $2,226.495mExpenses: $2,602.894m
Capital injection (cash:) $480.640m
Administered ItemsAustralia-Indonesia Partnership
Programme
Appropriation: $4.482mLoans: $98.000m
Expenses: $217.782m

Agency Additional Estimates Statements — AusAID
93
Outcome 1
Agency Measure Summary
Afghanistan – Pakistan – assistance The Government will provide $114.9 million over two years for new and expanded assistance programmes in Afghanistan and Pakistan. Funding of $48.6 million in 2007-08 will be met from within existing resources (refer to the 2007-08 Mid Year Economic Fiscal Outlook for further detail).
International Development Association 15 replenishment - contribution The Government will provide a contribution to the current replenishment of the International Development Association (IDA) – the concessional lending arm of the World Bank. This measure includes $211.0 million in additional funding, with the remainder to be met from within existing resources (refer to the 2007-08 Mid Year Economic Fiscal Outlook for further detail).
Global Fund contribution The Government will provide $93.0 million over two years from 2008-09 to the Global Fund to Fight HIV/AIDS, Tuberculosis and Malaria (the Global Fund). This funding is in addition to the $42.0 million provided in 2007-08 and will bring Australia’s contribution to the Global Fund to $135.0 million over three years (refer to the 2007-08 Mid Year Economic Fiscal Outlook for further detail).
Humanitarian Assistance to Darfur The Government will provide an additional $20 million in humanitarian assistance to the Darfur region of Sudan in 2007-08. The cost of this measure has been met from within existing resources (refer to the 2007-08 Mid Year Economic Fiscal Outlook for further detail).
Emergency and Humanitarian relief – contributions The Government has provided $43.8 million since the 2007-08 Budget for emergency and humanitarian relief efforts. The funding has been provided through various international agencies, such as the United Nations Children’s Fund, the World Food Organisation and the World Health Organisation. The cost of this measure has been met from within existing resources (refer to 2007-08 Mid Year Economic Fiscal Outlook for further detail).
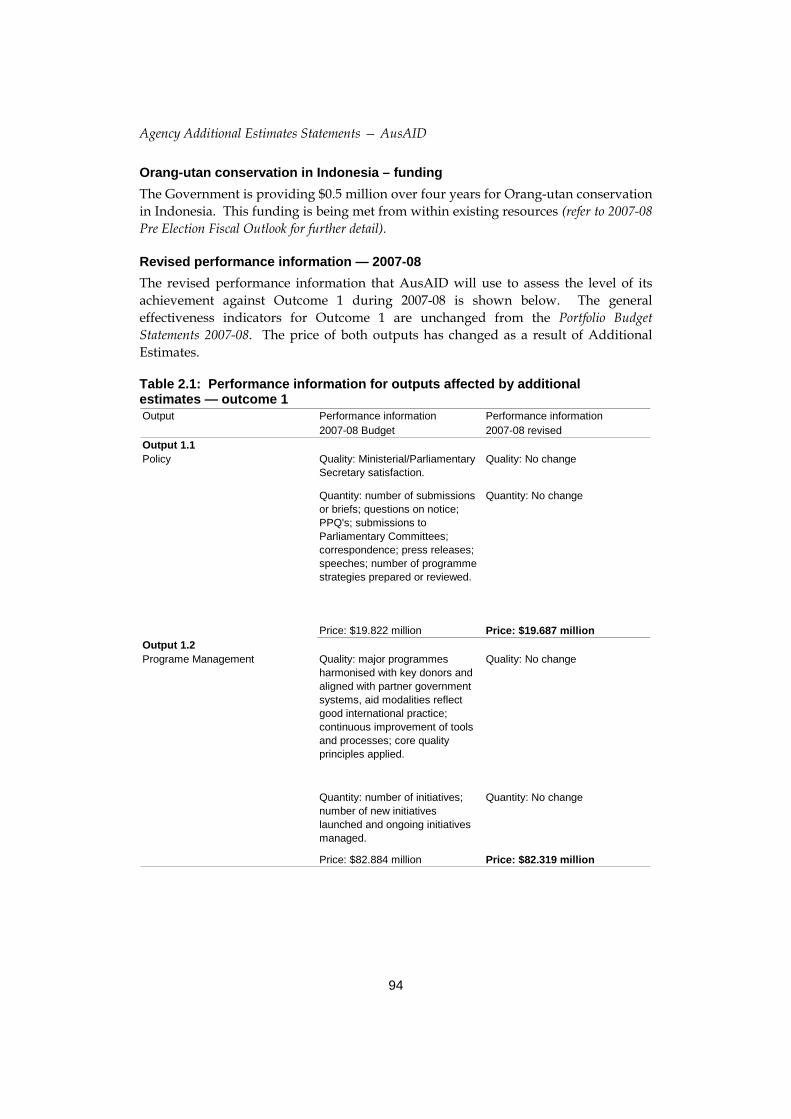
Agency Additional Estimates Statements — AusAID
94
Orang-utan conservation in Indonesia – funding The Government is providing $0.5 million over four years for Orang-utan conservation in Indonesia. This funding is being met from within existing resources (refer to 2007-08 Pre Election Fiscal Outlook for further detail).
Revised performance information — 2007-08 The revised performance information that AusAID will use to assess the level of its achievement against Outcome 1 during 2007-08 is shown below. The general effectiveness indicators for Outcome 1 are unchanged from the Portfolio Budget Statements 2007-08. The price of both outputs has changed as a result of Additional Estimates.
Table 2.1: Performance information for outputs affected by additional estimates — outcome 1 Output Performance information Performance information
2007-08 Budget 2007-08 revisedOutput 1.1Policy Quality: Ministerial/Parliamentary
Secretary satisfaction.Quality: No change
Quantity: number of submissions or briefs; questions on notice; PPQ's; submissions to Parliamentary Committees; correspondence; press releases; speeches; number of programme strategies prepared or reviewed.
Quantity: No change
Price: $19.822 million Price: $19.687 millionOutput 1.2Programe Management Quality: major programmes
harmonised with key donors and aligned with partner government systems, aid modalities reflect good international practice; continuous improvement of tools and processes; core quality principles applied.
Quality: No change
Quantity: number of initiatives; number of new initiatives launched and ongoing initiatives managed.
Quantity: No change
Price: $82.884 million Price: $82.319 million

Agency Additional Estimates Statements — AusAID
95
Outcome 2
Revised performance information — 2007-08 The revised performance information that AusAID will use to assess the level of its achievement against Outcome 2 during 2007-08 is shown below. The general effectiveness indicators for Outcome 2 are unchanged from the Portfolio Budget Statements 2007-08. The price of the output has changed as a result of Additional Estimates.
Table 2.1: Performance information for outputs affected by additional estimates — outcome 2 Output Performance information Performance information
2007-08 Budget 2007-08 revisedOutput 2.1Australia-Indonesia Partnership for Reconstruction and Development Management
Quality: major programmes harmonised with key donors and aligned with partner government systems, aid modalities reflect good international practice; continuous improvement of tools and processes; core quality principles applied.
Quality: No change
Quantity: number of initiatives; number of new initiatives launched and ongoing initiatives managed.
Quantity: No change
Price: $6.518 million Price: $6.448 million

Agency Additional Estimates Statements — AusAID
96
Section 3: Budgeted financial statements
BUDGETED FINANCIAL STATEMENTS
The budgeted financial statements for AusAID, presented in this section, form the basis of both the financial statements that will appear in AusAID’s 2007-08 Annual Report and input into the Whole-of-Government Accounts.
Departmental financial statements
Budgeted departmental income statement This statement provides a picture of the expected financial results for AusAID by identifying full accrual expenses and revenues.
Budgeted departmental balance sheet This statement was previously titled “Statement of Financial Position”. This statement shows the expected financial position of AusAID. It enables decision makers to track the management of AusAID’s assets and liabilities.
Budgeted departmental statement of cash flows This statement shows budgeted cash flows, as reflected in the statement of cash flows, providing important information on the extent and nature of cash flows by categorising them into expected cash flows from operating activities, investing activities and financing activities.
Departmental statement of changes in equity — summary of movement This statement shows movement in the agency’s equity.
Departmental capital budget statement This statement shows all planned capital expenditure on non-financial assets funded either through capital appropriation for additional equity or borrowings, or from funds from internal sources.
Departmental property, plant, equipment and intangibles — summary of movement This statement shows budgeted acquisitions and disposals of non-financial assets during the Budget year.

Agency Additional Estimates Statements — AusAID
97
Schedule of administered activity Details of transactions administered by AusAID on behalf of the Commonwealth are shown in the following schedules to the financial statements:
Schedule of budgeted income and expenses administered on behalf of government This schedule identifies the main revenues and expenses relating to the Australian Government’s Official Overseas Aid Programme administered by AusAID.
Schedule of budgeted assets and liabilities administered on behalf of government This schedule shows the assets and liabilities administered on behalf of the Government.
Schedule of budgeted administered cash flows This schedule shows cash flows administered on behalf of the Government.
Schedule of administered capital budget This schedule shows details of planned administered capital expenditure.
Schedule of administered property, plant, equipment and intangibles — summary of movement This schedule discloses details of movements in administered non-financial assets during the budget year.

Agency Additional Estimates Statements — AusAID
98
Departmental financial statements Table 3.1: Budgeted departmental income statement (for the period ended 30 June 2008)
Actual Revised Forward Forward Forwardbudget estimate estimate estimate
2006-07 2007-08 2008-09 2009-10 2010-11$'000 $'000 $'000 $'000 $'000
INCOMERevenue
Revenues from Government 93,162 108,494 125,196 121,175 120,997 Goods and services 277 229 231 231 231 Other -
Total revenue 93,439 108,723 125,427 121,406 121,228
GainsOther 235 91 91 91 91
Total gains 235 91 91 91 91
Total income 93,674 108,814 125,518 121,497 121,319
EXPENSEEmployees 58,128 73,750 82,043 79,460 78,731 Suppliers 30,303 31,604 40,254 38,910 39,460 Depreciation and amortisation 3,232 3,385 3,138 3,041 3,042 Finance costs 1,767 Write-down of assets and
impairment of assets 8 75 83 86 86 Net losses from sale of assets 12 - - - - Other -
Total expenses 93,450 108,814 125,518 121,497 121,319
Net surplus or (deficit) attributable to the Australian Government 224 - - - -

Agency Additional Estimates Statements — AusAID
99
Table 3.2: Budgeted departmental balance sheet (as at 30 June 2008) Actual Revised Forward Forward Forward
budget estimate estimate estimate2006-07 2007-08 2008-09 2009-10 2010-11
$'000 $'000 $'000 $'000 $'000ASSETSFinancial assets
Cash and cash equivalents 920 1,530 2,252 2,252 2,252 Receivables 18,386 22,099 25,618 26,647 27,265 Other financial assets - - - - -
Total financial assets 19,306 23,629 27,870 28,899 29,517 Non-financial assets
Leasehold improvements 12,669 12,954 12,874 12,892 12,910 Infrastructure, plant and equipment 5,523 4,615 3,583 2,548 1,513 Intangibles 4,923 3,900 3,061 3,461 3,860 Other 447 466 486 486 486
Total non-financial assets 23,562 21,935 20,004 19,387 18,769 Total assets 42,868 45,564 47,874 48,286 48,286 LIABILITIESPayables
Suppliers 4,926 4,783 5,550 5,550 5,550 Other payables 4,322 4,322 4,322 4,322 4,322
Total payables 9,248 9,105 9,872 9,872 9,872 Provisions
Employees 15,544 16,290 16,912 17,324 17,324 Total provisions 15,544 16,290 16,912 17,324 17,324 Total liabilities 24,792 25,395 26,784 27,196 27,196 EQUITY*Parent entity interest
Contributed equity 17,013 19,106 20,027 20,027 20,027 Reserves 374 374 374 374 374 Retained surpluses or
accumulated deficits 689 689 689 689 689 Total parent entity interest 18,076 20,169 21,090 21,090 21,090 Total equity 18,076 20,169 21,090 21,090 21,090 Current assets 19,753 19,177 23,438 24,467 25,085 Non-current assets 23,115 15,422 13,471 12,854 12,236 Current liabilities 19,434 5,112 6,335 6,382 6,382 Non-current liabilities 5,358 7,857 8,113 8,219 8,219
* Note: 'equity' is the residual interest in assets after deduction of liabilities.

Agency Additional Estimates Statements — AusAID
100
Table 3.3: Budgeted departmental statement of cash flows (for the period ended 30 June 2008)
Actual Revised Forward Forward Forwardbudget estimate estimate estimate
2006-07 2007-08 2008-09 2009-10 2010-11$'000 $'000 $'000 $'000 $'000
OPERATING ACTIVITIESCash received
Goods and services 902 229 231 231 231 Appropriations 81,584 104,872 121,768 120,237 120,470 Other cash received - 997 1,011 1,012 1,013
Total cash received 82,486 106,098 123,010 121,480 121,714 Cash used
Employees 56,156 73,004 81,421 79,048 78,731 Suppliers 24,141 31,766 39,507 38,910 39,460 Net GST paid 96 997 1,011 1,012 1,013 Other cash used - - - - -
Total cash used 80,393 105,767 121,939 118,970 119,204 Net cash from or (used by)
operating activities 2,093 331 1,071 2,510 2,510 INVESTING ACTIVITIESCash received
Other cash received - - - - - Total cash received - - - - - Cash used
Purchase of infrastructure, plant and equipment 16,509 1,684 1,140 2,380 1,140
Other cash used - 130 130 130 1,370 Total cash used 16,509 1,814 1,270 2,510 2,510 Net cash from or (used by)
investing activities (16,509) (1,814) (1,270) (2,510) (2,510) FINANCING ACTIVITIESCash received
Appropriations - contributed equity 6,644 2,093 921 - - Total cash received 6,644 2,093 921 - - Cash used
Other cash used - - - - - Total cash used - - - - - Net cash from or (used by)
financing activities 6,644 2,093 921 - - Net increase or (decrease)
in cash held (7,772) 610 722 - - Cash at the beginning of
the reporting period 8,692 920 1,530 2,252 2,252 Cash at the end of the
reporting period 920 1,530 2,252 2,252 2,252

Agency Additional Estimates Statements — AusAID
101
Table 3.4: Departmental statement of changes in equity — summary of movement (Budget 2007-08)
Accumulated Asset Other Contributed Totalresults revaluation reserves equity/ equity
reserve capital$'000 $'000 $'000 $'000 $'000
Opening balance as at 1 July 2007Balance carried forward from
previous period 689 374 - 17,013 18,076 Adjustment for changes in
accounting policies - - - - - Adjusted opening balance 689 374 - 17,013 18,076 Income and expense
Income and expenses recogniseddirectly in equity: - - - - -
Sub-total income and expenserecognised directly in equity - - - - -
Net operating result - - - - -
Total income and expenses - - - - - Sub-total income and expense
attributable to AustralianGovernmentattributable to minority interest - - - - -
Transactions with ownersDistributions to owners
Returns on capitalDividends - - - - -
Returns of capitalRestructuring - - - - - Other: - - - - -
Contribution by ownersAppropriation (equity injection) - - - 2,093 - Other:
Sub-total transactions with ownersTransfers between equity
components - - - - - Closing balance less minority
interests 689 374 - 17,013 18,076 Estimated closing balance
as at 30 June 2008 689 374 - 19,106 20,169
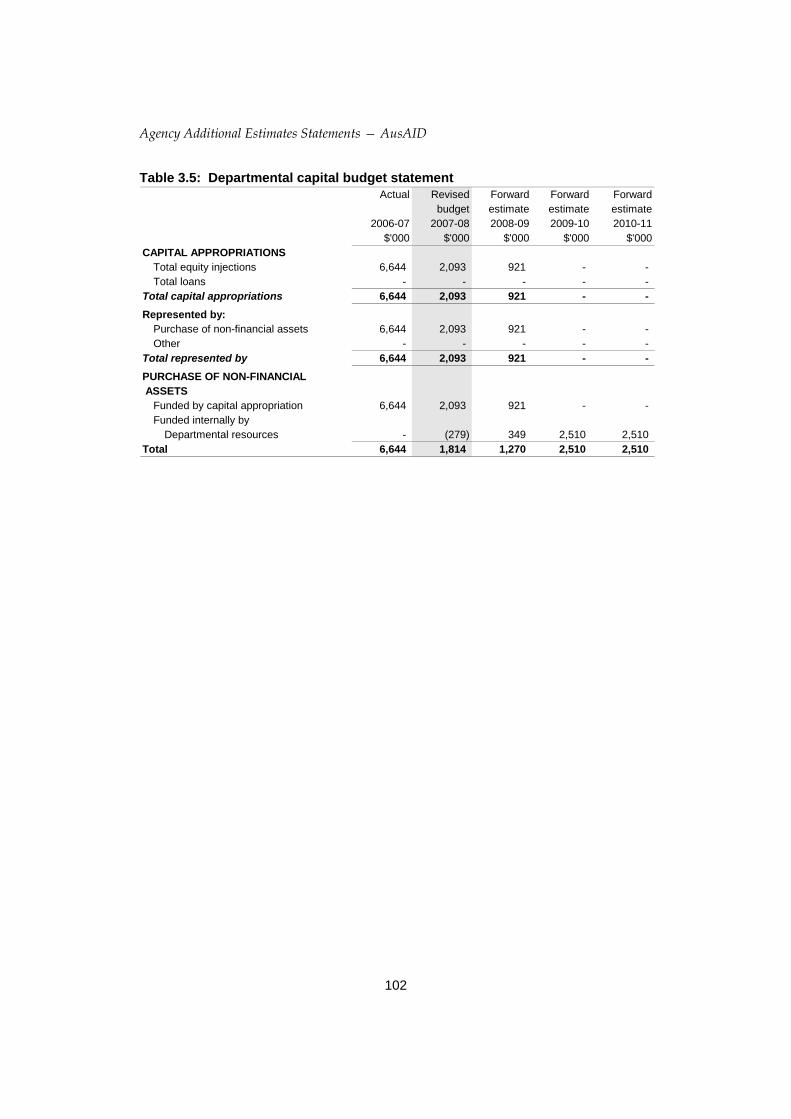
Agency Additional Estimates Statements — AusAID
102
Table 3.5: Departmental capital budget statement Actual Revised Forward Forward Forward
budget estimate estimate estimate2006-07 2007-08 2008-09 2009-10 2010-11
$'000 $'000 $'000 $'000 $'000CAPITAL APPROPRIATIONS
Total equity injections 6,644 2,093 921 - - Total loans - - - - -
Total capital appropriations 6,644 2,093 921 - - Represented by:
Purchase of non-financial assets 6,644 2,093 921 - - Other - - - - -
Total represented by 6,644 2,093 921 - - PURCHASE OF NON-FINANCIAL ASSETS
Funded by capital appropriation 6,644 2,093 921 - - Funded internally by
Departmental resources - (279) 349 2,510 2,510 Total 6,644 1,814 1,270 2,510 2,510

103
Agency A
dditional Estimates Statem
ents — A
usAID
Table 3.6: Departmental property, plant, equipment and intangibles — summary of movement (Budget year 2007-08)
Land Investment Buildings Specialist Other Heritage Computer Other Totalproperty military infrastructure and cultural software intangibles
equipment plant and assetsequipment
$'000 $'000 $'000 $'000 $'000 $'000 $'000 $'000 $'000As at 1 July 2007
Gross book value - - 14,065 - 8,846 - 4,249 4,812 31,972 Accumulated depreciation - - (1,396) - (3,323) - (2,910) (1,228) (8,857)
Opening net book value - - 12,669 - 5,523 - 1,339 3,584 23,115 -
Additions: - by purchase - - 953 - 731 - 110 20 1,814 by finance lease - - - - - - - - - internally developed - - - - - - - - - from acquisitions of entities or -
operations (including restructuring) - - - - - - - - - -
Revaluations and impairment through - equity - - - - - - - - -
Reclassifications - - - - - - - - - Depreciation/amortisation expense (668) (1,564) (753) (400) (3,385) Impairments recognised in operating -
result - - - - (75) - - - (75) Other movements -
-Disposals: -
from disposal of entities or - operations (including restructuring) - - - - - - - - -
other disposals - - - - - - - - - -
As at 30 June 2008 - Gross book value - - 15,018 - 9,502 - 4,359 4,832 33,711 Accumulated depreciation - - (2,064) - (4,887) - (3,663) (1,628) (12,242)
Estimated closing net book value - - 12,954 - 4,615 - 696 3,204 21,469
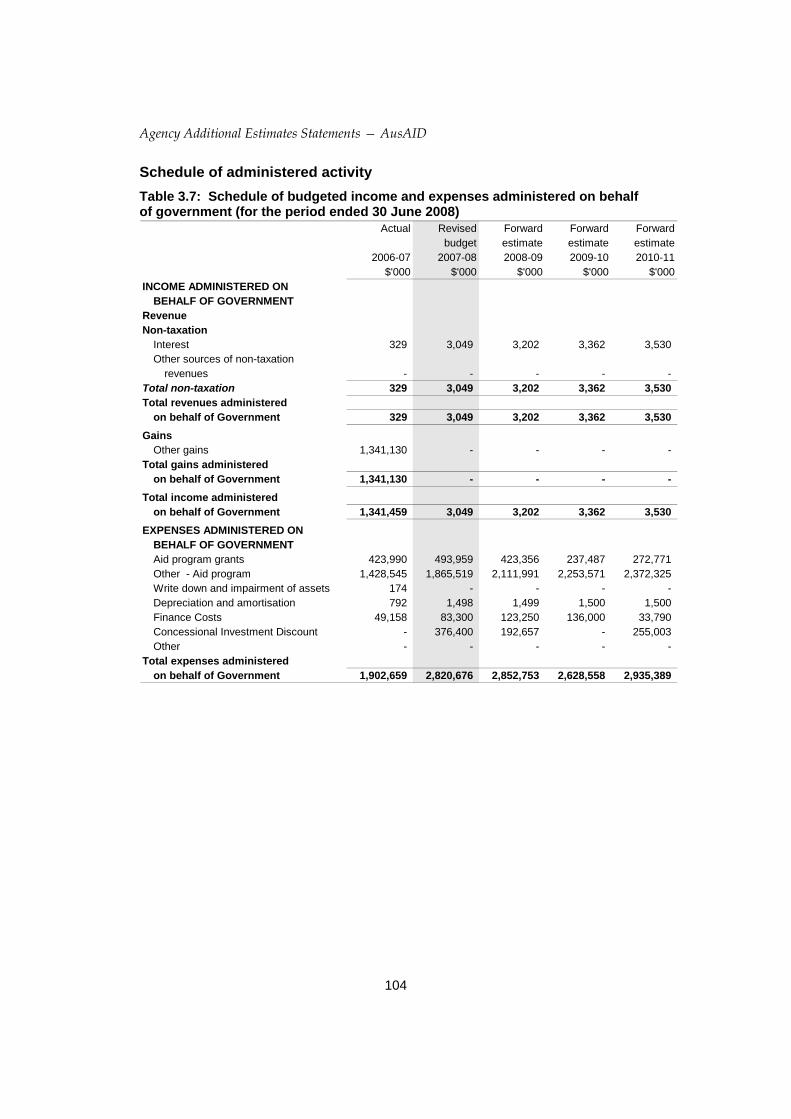
Agency Additional Estimates Statements — AusAID
104
Schedule of administered activity Table 3.7: Schedule of budgeted income and expenses administered on behalf of government (for the period ended 30 June 2008)
Actual Revised Forward Forward Forwardbudget estimate estimate estimate
2006-07 2007-08 2008-09 2009-10 2010-11$'000 $'000 $'000 $'000 $'000
INCOME ADMINISTERED ONBEHALF OF GOVERNMENT
RevenueNon-taxation
Interest 329 3,049 3,202 3,362 3,530 Other sources of non-taxation
revenues - - - - - Total non-taxation 329 3,049 3,202 3,362 3,530 Total revenues administered
on behalf of Government 329 3,049 3,202 3,362 3,530 Gains
Other gains 1,341,130 - - - - Total gains administered
on behalf of Government 1,341,130 - - - - Total income administered
on behalf of Government 1,341,459 3,049 3,202 3,362 3,530 EXPENSES ADMINISTERED ON
BEHALF OF GOVERNMENTAid program grants 423,990 493,959 423,356 237,487 272,771 Other - Aid program 1,428,545 1,865,519 2,111,991 2,253,571 2,372,325 Write down and impairment of assets 174 - - - - Depreciation and amortisation 792 1,498 1,499 1,500 1,500 Finance Costs 49,158 83,300 123,250 136,000 33,790 Concessional Investment Discount - 376,400 192,657 - 255,003 Other - - - - -
Total expenses administeredon behalf of Government 1,902,659 2,820,676 2,852,753 2,628,558 2,935,389

Agency Additional Estimates Statements — AusAID
105
Table 3.8: Schedule of budgeted assets and liabilities administered on behalf of government (as at 30 June 2008)
Actual Revised Forward Forward Forwardbudget estimate estimate estimate
2006-07 2007-08 2008-09 2009-10 2010-11$'000 $'000 $'000 $'000 $'000
ASSETS ADMINISTERED ON BEHALF OF GOVERNMENT
Financial assetsCash and cash equivalents 21,903 21,903 21,903 21,903 21,903 AIPRD Loans Receivables 8,576 23,276 45,026 69,026 75,236 IDA/ADF Investments 1,188,000 1,278,000 1,318,000 1,318,000 1,377,999 Receivables 10,585 1,863,237 1,828,567 1,416,104 1,593,125 Other financial assets - - - - -
Total financial assets 1,229,064 3,186,416 3,213,496 2,825,033 3,068,263 Non-financial assets
Leasehold improvements 2,745 2,152 1,558 963 368 Infrastructure, plant and equipment 2,798 2,473 1,848 1,231 615 Intangibles 61 156 251 346 441 Other 746 746 746 746 746
Total non-financial assets 6,350 5,527 4,403 3,286 2,170 Total assets administered
on behalf of Government 1,235,414 3,191,943 3,217,899 2,828,319 3,070,433 LIABILITIES ADMINISTERED ON
BEHALF OF GOVERNMENTInterest bearing liabilities
Loans - 879 1,844 2,220 2,532 Total interest bearing liabilities - 879 1,844 2,220 2,532 Provisions
Other provisions 3,681 3,681 3,681 3,681 3,681 Total provisions 3,681 3,681 3,681 3,681 3,681 Payables
Suppliers 691,293 91,107 94,223 95,403 96,510 Grants and subsidies 271,090 505,732 542,243 422,861 401,823 IDA/ADF investment payable - 852,100 988,834 855,960 1,010,164
Total payables 962,383 1,448,939 1,625,300 1,374,224 1,508,497 Liabilities included in disposal
groups held for sale - - - - - Total liabilities administered
on behalf of Government 966,064 1,453,499 1,630,825 1,380,125 1,514,710

Agency Additional Estimates Statements — AusAID
106
Table 3.9: Schedule of budgeted administered cash flows (for the period ended 30 June 2008)
Actual Revised Forward Forward Forwardbudget estimate estimate estimate
2006-07 2007-08 2008-09 2009-10 2010-11$'000 $'000 $'000 $'000 $'000
OPERATING ACTIVITIESCash received
Net GST received 59,571 61,270 66,993 71,854 76,418 Other 544 3,049 3,202 3,362 3,530
Total cash received 60,115 64,319 70,195 75,216 79,948 Cash used
Finance costs 49,115 - - - - Grant payments 422,866 522,265 353,520 414,522 400,785 Aid program 1,566,782 2,101,511 2,360,966 2,465,373 2,372,324 Net GST paid 53,256 62,377 67,674 72,248 76,748 Other - - - - -
Total cash used 2,092,019 2,686,153 2,782,160 2,952,143 2,849,857 Net cash from
operating activities (2,031,904) (2,621,834) (2,711,965) (2,876,927) (2,769,909) INVESTING ACTIVITIESCash used
Purchase of property, plantand equipment and intangibles 4,338 675 375 383 384
Purchase of financial assets 8,247 Other - - - - -
Total cash used 12,585 675 375 383 384 Net cash from
investing activities (12,585) (675) (375) (383) (384) FINANCING ACTIVITIESCash received
Proceeds from borrowing - Cash from Capital injections 22,563 480,640 239,709 6,234 318,684
Total cash received 22,563 480,640 239,709 6,234 318,684 Cash used
Net repayment of borrowings 62,192 61,270 67,232 71,867 76,373 Other - - - - -
Total cash used 62,192 61,270 67,232 71,867 76,373 Net cash from
financing activities (39,629) (61,270) (67,232) (71,867) (76,373) Net increase or (decrease) in
cash heldCash at beginning of reporting period 69,563 21,903 21,903 21,903 21,903 Cash from Official Public Account for:
- appropriations 2,036,458 2,382,211 2,462,808 2,668,306 2,732,456 - special accounts 230,154 247,154 207,893 56,959
Cash at end of reporting period 21,903 21,903 21,903 21,903 21,903
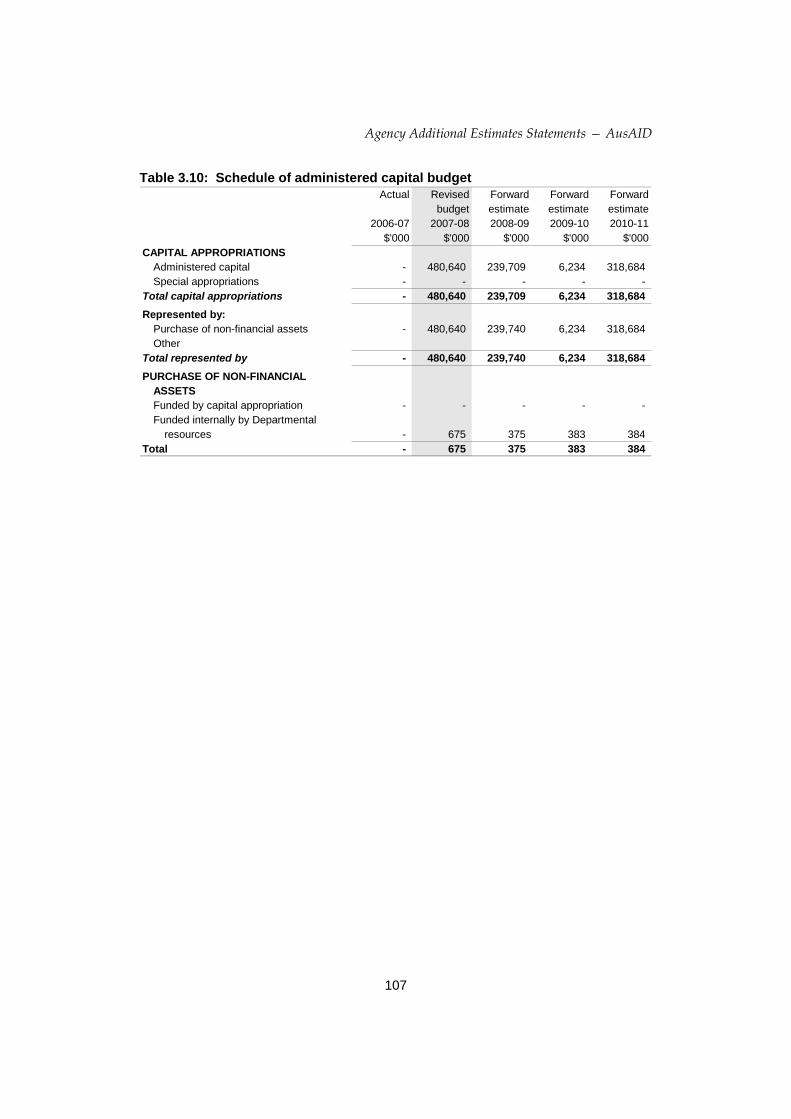
Agency Additional Estimates Statements — AusAID
107
Table 3.10: Schedule of administered capital budget Actual Revised Forward Forward Forward
budget estimate estimate estimate2006-07 2007-08 2008-09 2009-10 2010-11
$'000 $'000 $'000 $'000 $'000CAPITAL APPROPRIATIONS
Administered capital - 480,640 239,709 6,234 318,684 Special appropriations - - - - -
Total capital appropriations - 480,640 239,709 6,234 318,684 Represented by:
Purchase of non-financial assets - 480,640 239,740 6,234 318,684 Other
Total represented by - 480,640 239,740 6,234 318,684 PURCHASE OF NON-FINANCIAL
ASSETSFunded by capital appropriation - - - - - Funded internally by Departmental
resources - 675 375 383 384 Total - 675 375 383 384
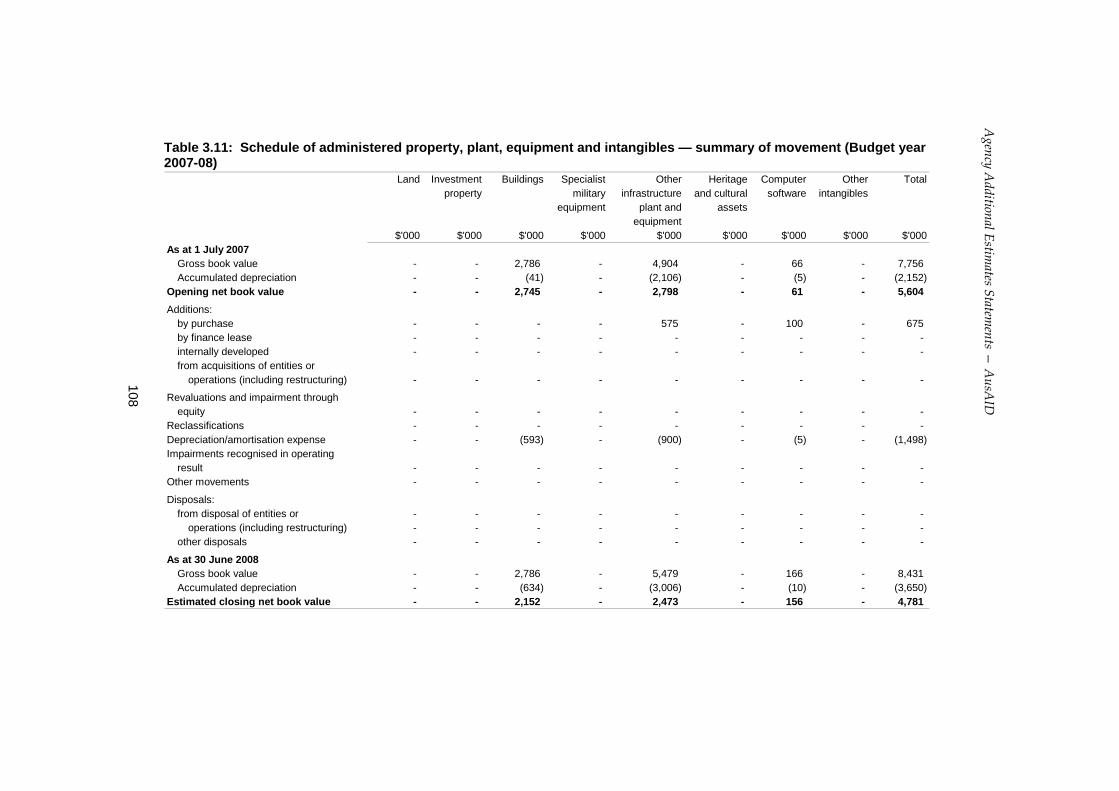
108
Agency A
dditional Estimates Statem
ents — A
usAID
Table 3.11: Schedule of administered property, plant, equipment and intangibles — summary of movement (Budget year 2007-08)
Land Investment Buildings Specialist Other Heritage Computer Other Totalproperty military infrastructure and cultural software intangibles
equipment plant and assetsequipment
$'000 $'000 $'000 $'000 $'000 $'000 $'000 $'000 $'000As at 1 July 2007
Gross book value - - 2,786 - 4,904 - 66 - 7,756 Accumulated depreciation - - (41) - (2,106) - (5) - (2,152)
Opening net book value - - 2,745 - 2,798 - 61 - 5,604 Additions:
by purchase - - - - 575 - 100 - 675 by finance lease - - - - - - - - - internally developed - - - - - - - - - from acquisitions of entities or
operations (including restructuring) - - - - - - - - -
Revaluations and impairment throughequity - - - - - - - - -
Reclassifications - - - - - - - - - Depreciation/amortisation expense - - (593) - (900) - (5) - (1,498) Impairments recognised in operating
result - - - - - - - - - Other movements - - - - - - - - -
Disposals:from disposal of entities or - - - - - - - - -
operations (including restructuring) - - - - - - - - - other disposals - - - - - - - - -
As at 30 June 2008Gross book value - - 2,786 - 5,479 - 166 - 8,431 Accumulated depreciation - - (634) - (3,006) - (10) - (3,650)
Estimated closing net book value - - 2,152 - 2,473 - 156 - 4,781

109
AUSTRALIAN CENTRE FOR INTERNATIONAL AGRICULTURAL RESEARCH (ACIAR)
Section 1: Agency overview and resources; variations and measures .............111
Overview ........................................................................................................111 Additional estimates and variations to outcomes...........................................112 Measures — Agency summary......................................................................113 Breakdown of additional estimates by appropriation bill ................................114 Summary of staffing changes.........................................................................114 Other receipts available to be used ...............................................................115 Estimates of special account flows ................................................................116
Section 2: Revisions to agency outcomes ............................................................117 Outcomes, administered items and outputs...................................................117
Section 3: Budgeted financial statements.............................................................119
Analysis of budgeted financial statements.....................................................119 Budgeted financial statements.......................................................................119 Notes to the financial statements...................................................................130


111
AUSTRALIAN CENTRE FOR INTERNATIONAL AGRICULTURAL RESEARCH
Section 1: Agency overview and resources; variations and measures
OVERVIEW
There has been no change to the ACIAR mission, outcomes and outputs as advised in the Portfolio Budget Statements 2007-08.
Table 1.2 and Table 1.4 show the financial effect on resources available to ACIAR of the application of the additional one-off two per cent Efficiency Dividend and the increase in the rate of the ongoing Efficiency Dividend from 1 to 1.25 per cent.
Reductions in ACIAR’s appropriation have been shared proportionately between operational costs and grant expenditure. These changes are reflected in Table 3.1 and Table 3.3.
Table 1.1: Agency outcomes and output groups
Outcome Description Output groupsOutcome 1 Agriculture in developing countries
and Australia is more productive and sustainable as a result of better technologies, practices, policies and systems
Output 1.1 Collaborative research that addresses agricultural and natural resource management problems of developing countries and Australia
Output 1.2 Training researchers in developing countries and Australia

Agency Additional Estimates Statements — ACIAR
112
ADDITIONAL ESTIMATES AND VARIATIONS TO OUTCOMES
Table 1.2: Additional estimates and variations to outcomes – measures 2007-08 2008-09 2009-10 2010-11
($'000) ($'000) ($'000) ($'000)Outcome 1Decrease in estimates (departmental)Election Commitment Savings: 2 per cent Efficiency Dividend (237) (1,038) (1,042) (1,056)
Efficiency dividend - increase in the rate from 1 per cent to 1.25 per cent - (259) (391) (526)

Agency A
dditional Estimates Statem
ents - ACIA
R
113
MEASURES — AGENCY SUMMARY
Table 1.4: Summary of measures since the 2007-08 Budget Measure Outcome Output
groupsaffected
Admin Dept Admin Dept Admin Dept Admin Deptitems outputs Total items outputs Total items outputs Total items outputs Total
Total ExpenseMeasures
Total CapitalMeasures
Revenue MeasuresElection Commitment Savings: 2 per cent Efficiency Dividend 1 1.1 - (237) (237) - (1,038) (1,038) - (1,042) (1,042) - (1,056) (1,056) Efficiency dividend - increase in the rate from 1 per cent to 1.25 per cent 1 1.1 - - - - (259) (259) - (391) (391) - (526) (526)
Total RevenueMeasures - (237) (237) - (1,297) (1,297) - (1,433) (1,433) - (1,582) (1,582)
Total of All Measures - (237) (237) - (1,297) (1,297) - (1,433) (1,433) - (1,582) (1,582)
2009-10($'000)
2010-11($'000)
2007-08($'000)
2008-09($'000)

Agency Additional Estimates Statements — ACIAR
114
BREAKDOWN OF ADDITIONAL ESTIMATES BY APPROPRIATION BILL
Table 1.5: Appropriation Bill (No. 3) 2007-08
SUMMARY OF STAFFING CHANGES
Table 1.7: Average Staffing Level (ASL)
Note: Average Staffing Levels are expressed as Full-Time Equivalent (FTE) staff employed under the Australian Public Service Act (44.5 FTE) and include locally engaged staff in overseas posts (20.5 FTE).
2006-07 2007-08 2007-08 Additional Reducedavailable Budget revised estimates estimates
($'000) ($'000) ($'000) ($'000) ($'000)DEPARTMENTAL OUTPUTSOutcome 1Agriculture in developing countries and Australia is more productive and sustainable as a result of better technologies, practices, policies and systems 50,362 51,479 51,242 - 237 Total departmental 50,362 51,479 51,242 - 237
Notes to the table:Note 1: 2006-07 available appropriation is included to allow a comparison of this year's appropriationw ith w hat w as made available for use in the previous year. Available appropriation is the amount available to be draw n dow n, and is equal to:Budget Appropriation + Additional Estimates Appropriation + DIAB + AFM - Savings - Rephasings - Other Reductions +/- Section 32
Note 2: No appropriation is provided in Appropriation Bill 3 for the agency w here the total fundingchange across outcomes for departmental outputs is negative.
2007-08 2007-08Budget Revised Variation
Outcome 1Agriculture in developing countries and Australia is more productive and sustainable as a result of better technologies, practices, policies and systems 65 65 - Total 65 65 -

Agency Additional Estimates Statements — ACIAR
115
OTHER RECEIPTS AVAILABLE TO BE USED
Table 1.8 provides details of other receipts available to be used and includes FMA Act s.31 receipts, CAC body receipts that are available to be spent, special accounts (non-appropriation receipts) and resources received free of charge.
Table 1.8: Other receipts available to be used Budget Revised
estimate estimate2007-08 2007-08($'000) ($'000)
Departmental other receiptsResources received free of charge 24 24
Sales of goods and services 10 10 Other 10 10
External Funds (e.g AusAID) 7,535 12,300 Total departmental other receipts available to be used 7,579 12,344
Administered other receiptsFMA Act s.31 receipts - -
Other - - Total administered other receipts available to be used - -

Agency Additional Estimates Statements — ACIAR
116
ESTIMATES OF SPECIAL ACCOUNT FLOWS These estimates have been revised since the publication of the Portfolio Budget Statements 2007-08 to reflect the changed usage of the ACIAR Special Account, within the Official Public Account, which was established under the ACIAR Act 1982, during 2006-07. The Special Account has been used to hold cash received from AusAID and the Australian Greenhouse Office in advance of project expenditure.
Advice was received from the Department of Finance and Deregulation that this was the proper use of the Account and that this approach avoided exceeding ACIAR’s working cash limit in our operational bank account. In 2005-06 the opening balance of cash held was reported as part of appropriation receivable. This amount totalled $3.329 million. As at 30 June 2007 cash balance of $4.435 million is reported under cash. For further detail refer to Table 1.10.
Table 1.10: Estimates of special account flows Outcome Opening Receipts Payments Adjustments(2) Closing
No. Balance Balance2007-08(1) 2007-08 2007-08 2007-08 2007-08
2006-07 (1) 2006-07 2006-07 2006-07 2006-07($'000) ($'000) ($'000) ($'000) ($'000)
Australian Centre for International Agricultural Research Account - s20 FMA Act (Departmental) 1 4,435 12,300 12,300 - 4,435
3,329 13,875 12,769 - 4,435 Other Trust Moneys Account - s20 FMA Act (Departmental) - - - - -
Services for Other Governments and Non-Agency Bodies Account - s20 FMA Act (Departmental) - - - - -
Total special accounts 4,435 12,300 12,300 - 4,435
FMA Act = Financial Management and Accountability Act,1997
Note 1 The Opening Balance for 2007-08 is the same as the closing balance for 2006-07

Agency Additional Estimates Statements — ACIAR
117
Section 2: Revisions to agency outcomes
OUTCOMES, ADMINISTERED ITEMS AND OUTPUTS
There has been no change in the definition of ACIAR’s Outcome.
Figure 2: Outcome and output structure for ACIAR
AUSTRALIAN CENTRE FOR INTERNATIONAL AGRICULTURAL RESEARCH
Mr Peter CoreChief Executive Officer
Total price of outputs $63.617 millionDepartmental outcomes appropriation $51.242 million
Total administered expenses $Nil
Outcome 1Agriculture in developing countries and Australia is more productive and
sustainable as a result of better technologies, practices, policies and systemsTotal price $63.617 million
Departmental outcome appropriation $51.242 millionTotal Admin Expenses $Nil
Output 1.1Collaborative research that addresses
agricultural and natural resource management problems of developing
countries and AustraliaTotal price $58.849 million
Departmental outputs appropriation $46.474 million
Output 1.2Trained researchers in developing
countries and AustraliaTotal price $4.768 million
Departmental outputs appropriation $4.768 million
Outcome 1 There is a $0.237 million decrease in the Departmental appropriation as a result of the application of the additional one-off two per cent Efficiency Dividend. This is reflected in an adjustment to Output 1.1.
Revised performance information — 2007-08 Variations to performance information as a result of Additional Estimates are shown in Table 2.1.
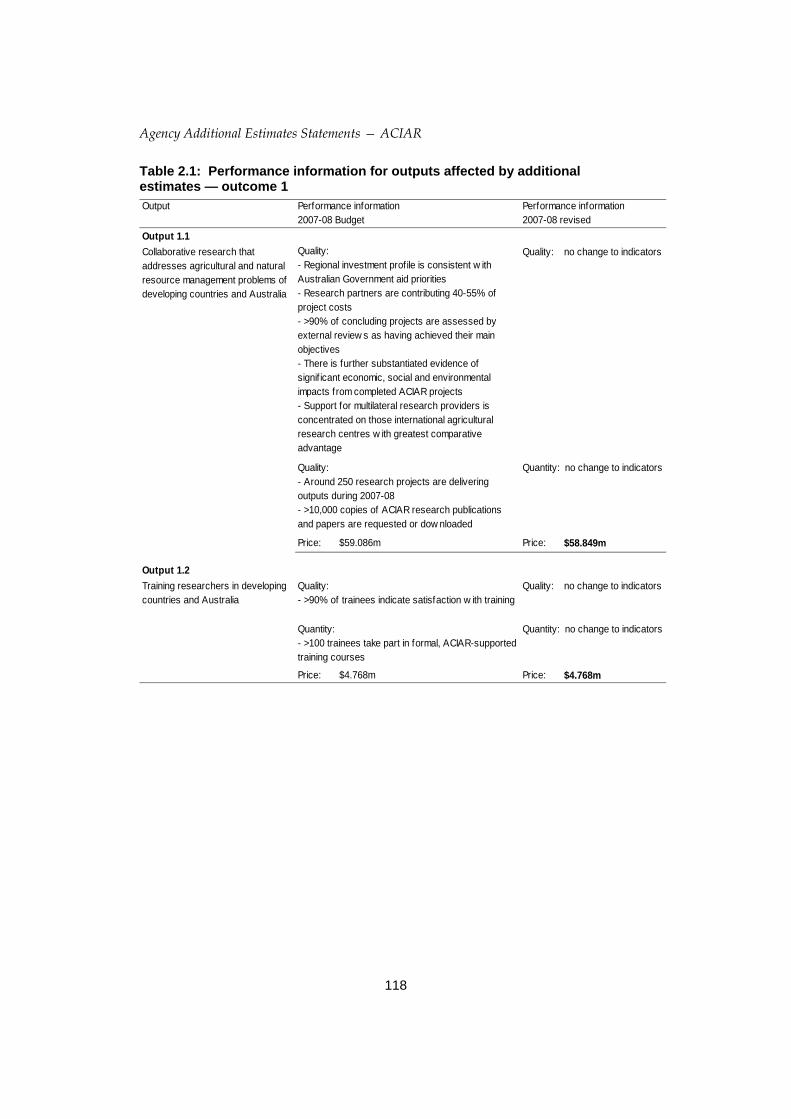
Agency Additional Estimates Statements — ACIAR
118
Table 2.1: Performance information for outputs affected by additional estimates — outcome 1
Output Performance information Performance information2007-08 Budget 2007-08 revised
Output 1.1Quality: - Regional investment profile is consistent w ith Australian Government aid priorities- Research partners are contributing 40-55% of project costs- >90% of concluding projects are assessed by external review s as having achieved their main objectives- There is further substantiated evidence of signif icant economic, social and environmental impacts from completed ACIAR projects- Support for multilateral research providers is concentrated on those international agricultural research centres w ith greatest comparative advantage
Quality: no change to indicators
Quality: - Around 250 research projects are delivering outputs during 2007-08- >10,000 copies of ACIAR research publications and papers are requested or dow nloaded
Quantity: no change to indicators
Price: $59.086m Price: $58.849m
Output 1.2Quality:- >90% of trainees indicate satisfaction w ith training
Quality: no change to indicators
Quantity: - >100 trainees take part in formal, ACIAR-supported training courses
Quantity: no change to indicators
Price: $4.768m Price: $4.768m
Collaborative research that addresses agricultural and natural resource management problems of developing countries and Australia
Training researchers in developing countries and Australia

Agency Additional Estimates Statements — ACIAR
119
Section 3: Budgeted financial statements
ANALYSIS OF BUDGETED FINANCIAL STATEMENTS
An analysis of ACIAR’s budgeted financial statements, as reflected in the budgeted Departmental financial statements for 2007-08 is provided below.
BUDGETED FINANCIAL STATEMENTS
Departmental financial statements
Budgeted departmental income statement This statement provides a picture of the expected financial results for ACIAR by identifying full accrual income and expenditure, which highlights whether ACIAR is operating at a sustainable level.
This statement has been revised since the publication of the Portfolio Budget Statements 2007-08 to reflect the savings from the one-off two per cent of Efficiency Dividend from 2007-08 and forward years (a pro-rata 0.46 per cent Efficiency Dividend is used for 2007-08) and the increase in the rate of the ongoing Efficiency Dividend from 1 to 1.25 per cent.
Budgeted departmental balance sheet This statement shows the financial position of ACIAR. It helps decision makers to track the management of ACIAR’s assets and liabilities. There is no significant change since the publication of the Portfolio Budget Statements 2007-08.
Budgeted departmental statement of cash flows Budgeted cash flows, as reflected in the statement of cash flows, provide important information on the extent and nature of cash flows by categorising them into expected cash flows from operating activities, investing activities and financing activities.
This statement has been revised since the publication of the Portfolio Budget Statements 2007-08 to reflect the savings from the one-off two per cent of Efficiency Dividend from 2007-08 and forward years (a pro-rata 0.46 per cent Efficiency Dividend is used for 2007-08) and the increase in the rate of the ongoing Efficiency Dividend from 1 to 1.25 per cent.
Departmental Statement of changes in equity – summary of movement This statement shows the movement in equity. There is no significant change since the publication of the Portfolio Budget Statements 2007-08.

Agency Additional Estimates Statements — ACIAR
120
Departmental capital budget statement Shows all planned capital acquisitions that are funded from internal sources.
Departmental property, plant, equipment and intangibles – summary of movement Shows budgeted acquisitions and disposals of non-financial assets during the budget year. There is no significant change since the publication of the Portfolio Budget Statements 2007-08.

Agency Additional Estimates Statements — ACIAR
121
Table 3.1: Budgeted departmental income statement (for the period ended 30 June 2008)
Actual Revised Forw ard Forw ard Forw ardbudget estimate estimate estimate
2006-07 2007-08 2008-09 2009-10 2010-11$'000 $'000 $'000 $'000 $'000
INCOMERevenue
Revenues from Government 50,362 51,242 50,595 50,640 51,186 Goods and services 13 10 10 10 10 Interest - - - - - Dividends - - - - - Rents - - - - - Royalties - - - - - Grants 10,422 12,301 13,300 13,300 13,300 Other 64 40 40 40 40
Total revenue 60,861 63,593 63,945 63,990 64,536
GainsNet foreign exchange gains - - - - - Reversals of previous asset
w rite-dow ns - - - - - Net gains from sale of assets 14 - - - - Other 23 24 24 24 24
Total gains 37 24 24 24 24
Total income 60,898 63,617 63,969 64,014 64,560
EXPENSEEmployees 5,327 5,250 5,340 5,400 5,500 Suppliers 3,903 3,958 3,796 3,852 3,892 Grants 44,924 47,659 47,083 47,012 47,388 Subsidies - - - - - Depreciation and amortisation 307 295 295 295 325 Finance costs - - - - - Write-dow n of assets and
impairment of assets - - - - - Net losses from sale of assets 10 10 10 10 Net foreign exchange losses - - - - - Other 6,382 6,445 7,445 7,445 7,445
Total expenses 60,843 63,617 63,969 64,014 64,560
Share of operating results of associates and joint ventures accounted for using the equity - - - - - method
Operating result before Income TaxIncome Tax expense - - - - -
Net operating result 55 - - - -

Agency Additional Estimates Statements — ACIAR
122
Table 3.1: Budgeted departmental income statement (for the period ended 30 June 2008) (continued)
Actual Revised Forw ard Forw ard Forw ardbudget estimate estimate estimate
2006-07 2007-08 2008-09 2009-10 2010-11$'000 $'000 $'000 $'000 $'000
Operating result from continuingoperationsOperating result from discontinued
operations - - - - - Gain (loss) on remeasuring
discontinued operations - - - - -
Operating resultMinority interest in net surplus
or (deficit) - - - - -
Net surplus or (deficit) attributable to the Australian Government 55 - - - -

Agency Additional Estimates Statements — ACIAR
123
Table 3.2: Budgeted departmental balance sheet (as at 30 June 2008) Actual Revised Forw ard Forw ard Forw ard
budget estimate estimate estimate2006-07 2007-08 2008-09 2009-10 2010-11
$'000 $'000 $'000 $'000 $'000ASSETSFinancial assets
Cash and cash equivalents 4,932 4,932 4,932 4,932 4,932 Receivables 2,389 2,489 2,589 2,689 2,789 Investments accounted for under
the equity method - - - - - Investments (s.39 FMA Act; - - - - -
s.18 CAC Act; s.19 CAC Act) - - - - - Other investments - - - - - Tax assets - - - - - Accrued revenuesOther f inancial assets
Total financial assets 7,321 7,421 7,521 7,621 7,721
Non-financial assetsLand and buildings - - - - Infrastructure, plant and equipment 808 808 808 942 1,112 Investment properties - - - - - Heritage and cultural assets - - - - - Inventories - - - - - Intangibles 169 169 169 169 169 Deferred tax asset - - - - - Biological assets - - - - -
Other 346 346 346 346 346 Assets held for sale - - - - -
Total non-financial assets 1,323 1,323 1,323 1,457 1,627 Total assets 8,644 8,744 8,844 9,078 9,348
LIABILITIESPayables
Suppliers 315 315 315 315 315 Grants 1,820 1,820 1,820 1,820 1,820 Dividends - - - - - Financing costs - - - - - Tax liabilities - - - - - Deferred tax liabilities - - - - - Other payables 4,399 4,399 4,399 4,399 4,399
Total payables 6,534 6,534 6,534 6,534 6,534
Interest bearing liabilitiesLoans - - - - - Leases - - - - - Deposits - - - - - Overdraft - - - - - Other interest bearing liabilities - - - - -
Total interest bearing liabilities - - - - -
ProvisionsEmployees 1,227 1,327 1,427 1,527 1,627 Other provisions - - - - -
Total provisions 1,227 1,327 1,427 1,527 1,627
Liabilities included in disposalgroups held for sale - - - - -
Total liabilities 7,761 7,861 7,961 8,061 8,161

Agency Additional Estimates Statements — ACIAR
124
Table 3.2: Budgeted departmental balance sheet (as at 30 June 2008) (continued)
Actual Revised Forw ard Forw ard Forw ardbudget estimate estimate estimate
2006-07 2007-08 2008-09 2009-10 2010-11$'000 $'000 $'000 $'000 $'000
EQUITY*Parent entity interest
Contributed equity - - - 134 304 Reserves 325 325 325 325 325 Statutory funds - - - - - Retained surpluses or
accumulated deficits 558 558 558 558 558 Total parent entity interest 883 883 883 1,017 1,187
Minority interestContributed equity - - - - - Reserves - - - - - Statutory funds - - - - - Retained surpluses or
accumulated deficits - - - - - Total minority interest - - - - - Total equity 883 883 883 1,017 1,187
Current assets 7,667 7,767 7,867 7,967 8,067 Non-current assets 977 977 977 1,111 1,281 Current liabilities 7,644 7,744 7,844 7,944 8,044 Non-current liabilities 117 117 117 117 117
*Note: 'equity' is the residual interest in assets after deduction of liabilities.

Agency Additional Estimates Statements — ACIAR
125
Table 3.3: Budgeted departmental statement of cash flows (for the period ended 30 June 2008)
Actual Revised Forw ard Forw ard Forw ardbudget estimate estimate estimate
2006-07 2007-08 2008-09 2009-10 2010-11$'000 $'000 $'000 $'000 $'000
OPERATING ACTIVITIESCash received
Goods and services 16 15 15 15 15 Appropriations 48,777 51,242 50,595 50,640 51,186 Interest - - - - - Dividends - - - - - Net GST received - - - - Other cash received 20,777 13,700 14,700 14,700 14,700
Total cash received 69,570 64,957 65,310 65,355 65,901
Cash usedEmployees 5,416 5,350 5,450 5,550 5,650 Suppliers 3,749 4,323 4,136 4,198 4,310 Grants 47,394 47,499 46,939 46,822 47,156 Financing costs - - - - - Net GST paid - - - - Other cash used 8,279 7,500 8,500 8,500 8,500
Total cash used 64,838 64,672 65,025 65,070 65,616 Net cash from or (used by)
operating activities 4,732 285 285 285 285
INVESTING ACTIVITIESCash received
Proceeds from sales of property,plant and equipment 11 10 10 10 10
Proceeds from sales of f inancialinstruments - - - - -
Bills of exchange and promissory notes - - - - - Repayments of loans made - - - - - Investments (s.39 FMA Act;
s.18 CAC Act; s.19 CAC Act) - - - - - Other cash received
Total cash received 11 10 10 10 10
Cash usedPurchase of property, plant
and equipment 281 295 295 429 465 Purchase of f inancial instruments - - - - - Bills of exchange and promissory notes - - - - - Loans made - - - - - Investments (s.39 FMA Act;
s.18 CAC Act; s.19 CAC Act) - - - - - Other cash used - - - - -
Total cash used 281 295 295 429 465 Net cash from or (used by)
investing activities (270) (285) (285) (419) (455) .

Agency Additional Estimates Statements — ACIAR
126
Table 3.3: Budgeted departmental statement of cash flows (for the period ended 30 June 2008) (continued)
Actual Revised Forw ard Forw ard Forw ardbudget estimate estimate estimate
2006-07 2007-08 2008-09 2009-10 2010-11$'000 $'000 $'000 $'000 $'000
FINANCING ACTIVITIESCash received
Appropriations - contributed equity - - - 134 170 Proceeds from issuing financial
instruments - - - - - Proceeds from loans - - - - - Other cash received - - - - -
Total cash received - - - 134 170
Cash usedRepayments of debt - - - - -
(including f inance lease principal) - - - - - Dividends paid - - - - - Other cash used - - - - -
Total cash used - - - - - Net cash from or (used by)
financing activities - - - 134 170 Net increase or (decrease)
in cash held 4,462 - - - - Cash at the beginning of
the reporting period 470 4,932 4,932 4,932 4,932 Effect of exchange rate movements
on cash at the beginning of reporting period 4,462 - - - -
Cash at the end of the reporting period 4,932 4,932 4,932 4,932 4,932

Agency Additional Estimates Statements — ACIAR
127
Table 3.4: Departmental statement of changes in equity — summary of movement (Budget 2007-08)
Accumulated Asset Other Contributed Totalresults revaluation reserves equity/ equity
reserve capital$'000 $'000 $'000 $'000 $'000
Opening balance as at 1 July 2007Balance carried forw ard from
previous period 558 325 - - 883 Adjustment for changes in
accounting policies - - - - - Adjusted opening balance 558 325 - - 883
Income and expenseIncome and expenses recognised
directly in equity:[list each item, example follow s]
Gain/loss on revaluation ofproperty - - - - -
Sub-total income and expenserecognised directly in equity - - - - -
Net operating result - - - - -
Total income and expenses - - - - - Sub-total income and expense
attributable to AustralianGovernmentattributable to minority interest - - - - -
Transactions w ith ownersDistributions to owners
Returns on capitalDividends - - - - -
Returns of capitalRestructuring - - - - - Other: [provide details] - - - - -
Contribution by ownersAppropriation (equity injection) - - - - - Other: [provide details, example follow s]
Restructuring - - - - - Sub-total transactions w ith owners - - - - -
Transfers betw een equitycomponents - - - - -
Closing balance less minority 558 325 - - 883 interests
Estimated closing balanceas at 30 June 2008 558 325 - - 883

Agency Additional Estimates Statements — ACIAR
128
Table 3.5: Departmental capital budget statement
Actual Revised Forw ard Forw ard Forw ardbudget estimate estimate estimate
2006-07 2007-08 2008-09 2009-10 2010-11$'000 $'000 $'000 $'000 $'000
CAPITAL APPROPRIATIONSTotal equity injections - - - 134 170 Total loans - - - - -
Total capital appropriations - - - 134 170
Represented by:Purchase of non-financial assets - - - 134 170 Other - - - - -
Total represented by - - - 134 170
PURCHASE OF NON-FINANCIAL ASSETS
Funded by capital appropriation - - - 134 170 Funded internally by
Departmental resources 295 295 295 295 325 Total 295 295 295 429 495

129 Agency A
dditional Estimates Statem
ents — A
CIAR
Table 3.6: Departmental property, plant, equipment and intangibles — summary of movement (Budget year 2007-08) Land Investment Buildings Specialist Other Heritage Computer Other Total
property military infrastructure and cultural software intangiblesequipment plant and assets
equipment$'000 $'000 $'000 $'000 $'000 $'000 $'000 $'000 $'000
As at 1 July 2007Gross book value - - - - 1,550 - 580 - 2,130 Accumulated depreciation - - - - 742 - 411 - 1,153
Opening net book value - - - - 808 - 169 - 977
Additions:by purchase - - - - 220 - 85 - 305 by finance lease - - - - - - - - - internally developed - - - - - - - - - from acquisitions of entities or
operations (including restructuring) - - - - - - - - -
Revaluations and impairment throughequity - - - - - - - - -
Reclassifications - - - - - - - - - Depreciation/amortisation expense - - - - 210 - 85 - 295 Impairments recognised in operating
result - - - - - - - - - Other movements - - - - - - - - -
Disposals:from disposal of entities or
operations (including restructuring) - - - - - - - - - other disposals - - - - 10 - - - 10
As at 30 June 2008Gross book value - - - - 1,760 - 665 - 2,425 Accumulated depreciation - - - - 952 - 496 - 1,448
Estimated closing net book value - - - - 808 - 169 - 977 [option: can present computer software, other intangibles separately]

Agency Additional Estimates Statements — ACIAR
130
NOTES TO THE FINANCIAL STATEMENTS
Departmental Financial Statements and Notes Under the Australian Government’s accrual budgeting framework, and consistent with Australian Accounting Standards, transactions that agencies control (departmental transactions) are separately budgeted for and reported on from transactions agencies do not have control over (Administered transactions). This ensures that agencies are only held fully accountable for the transactions over which they have control.
Departmental items are those assets, liabilities, revenues and expenses in relation to an agency or authority that are controlled by the agency. Departmental expenses include employee and supplier expenses and other administrative costs, which are incurred by the agency in providing its goods and services.
Administered items are revenues, expenses, assets and liabilities that are managed by an agency or authority on behalf of the Government according to set Government directions. Administered expenses include subsidies, grants and personal benefit payments and Administered revenues include taxes, fees, fines and excises.
ACIAR’s financial statements are required by section 49 of the Financial Management and Accountability Act 1997 and are prepared in accordance with the Financial Management and Accountability (FMA) Orders.
Appropriations in the Accrual Budgeting Framework Under the Australian Government’s accrual budgeting framework, annual appropriations are provided for Departmental price of outputs representing the Government’s purchase of outputs from agencies.
Asset valuation From 30 June 2003 Property, Plant and Equipment have been valued on a fair value basis. Fair value essentially reflects the current market value of an asset.

131
GLOSSARY Accrual Accounting System of accounting where items are brought to
account and included in the financial statements as they are earned or incurred, rather than as they are received or paid.
Accumulated Depreciation The aggregate depreciation recorded for a particular depreciating asset.
Administered Items Expenses, revenues, assets or liabilities managed by agencies on behalf of the Commonwealth. Agencies do not control administered items. Administered expenses include grants, subsidies and benefits. In many cases, administered expenses fund the delivery of third party outputs.
Additional estimates Where amounts appropriated at Budget time are insufficient, Parliament may appropriate more funds to portfolios through the Additional Estimates Acts.
AEIFRS Australian Equivalents to International Financial Reporting Standards which were issued by the Australian Accounting Standards Board in July 2004.
Appropriation An authorisation by Parliament to spend moneys from the Consolidated Revenue Fund for a particular purpose.
Annual Appropriation Acts of Parliament, which provide appropriation for the government's activities during a specific financial year. Three appropriation Bills are introduced into Parliament in May and comprise the Budget. Further supplementary Bills are introduced later in the financial year as part of the Additional Estimates process. The Parliamentary Departments have their own appropriation Bills.

Glossary
132
Capital expenditure Expenditure by an agency on capital projects, for example purchasing a building.
Consolidated Revenue Fund Section 81 of the Constitution stipulates that all revenue raised or money received by the Commonwealth forms the one consolidated revenue fund (CRF). The CRF is not a bank account. The Official Public Account reflects most of the operations of the CRF.
Departmental items Assets, liabilities, revenues and expenses that are controlled by the agency to produce outputs. Departmental items would generally include computers, plant and equipment assets used by agencies in providing goods and services and most employee expenses, supplier costs and other administrative expenses incurred.
Depreciation Apportionment of an asset’s capital value as an expense over its estimated useful life to take account of normal usage, obsolescence, or the passage of time.
Effectiveness indicators Indicators to assess the degree of success in achieving outcomes. As outcomes are generally long-term in nature, effectiveness indicators often relate to intermediate outcomes (shorter-term impacts) below the planned outcomes specified.
Efficiency indicators Measures the adequacy of an agency's management of its outputs (and where applicable, administered items). Includes Price, Quality and Quantity indicators. The interrelationship between the three efficiency indicators of any one output should be considered when judging efficiency.
Equity or net assets Residual interest in the assets of an entity after deduction of its liabilities.

Glossary
133
Expense Expenses represent the full costs of an activity, that is, the total value of all the resources consumed in producing goods and services or the loss of future economic benefits in the form of reductions in assets or increases in liabilities of the entity. Expenses include cash items such as salary payments as well as expenses that have been incurred, such as accruing employee entitlements that will be paid in the future.
Fair value Valuation methodology: The amount for which an asset could be exchanged or a liability settled between knowledgeable, willing parties in an arm's length transaction. Australian Government entities will move to this method incrementally by 30 June 2006 for valuing most infrastructure, plant and equipment.
Intermediate outcomes More specific medium-term impacts (eg. trend data, targets or milestones) below the level of the planned outcomes specified in the Budget. A combination of several intermediate outcomes can at times be considered as a proxy for determining the achievement of outcomes or progress towards outcomes. (See outcomes)
Operating result Equals revenue less expenses.
Outcomes The Government's objectives in each portfolio area. Outcomes are desired results, impacts or consequences for the Australian community as influenced by the actions of the Australian Government. Actual outcomes are assessments of the end-results or impacts actually achieved.
Output Groups A logical aggregation of agency outputs, where useful, and based either on homogeneity, type of product, business line or beneficiary target group. Aggregation of outputs may also be needed for the provision of adequate information for performance monitoring, or based on a materiality test.

Glossary
134
Outputs The goods and services produced by agencies on behalf of government for external organisations or individuals. Outputs also include goods and services for other areas of government external to the agency.
Price One of the three key efficiency indicators. The amount the government or the community pays for the delivery of agreed outputs.
Quality One of the three key efficiency indicators. Relates to the characteristics by which customers or stakeholders judge an organisation, product or service. Assessment of quality involves use of information gathered from interested parties to identify differences between user's expectations and experiences.
Quantity One of the three key efficiency indicators. Examples include: the size of an output; count or volume measures; how many or how much.
Revenue Total value of resources earned or received to cover the production of goods and services.
Special Account Balances existing within the Consolidated Revenue Fund (CRF) that are supported by standing appropriations (Financial Management and Accountability (FMA) Act 1997, ss.20 and 21). Special accounts allow money in the CRF to be acknowledged as set-aside (hypothecated) for a particular purpose. Amounts credited to a Special Account may only be spent for the purposes of the Special Account. Special Accounts can only be established by a written determination of the Finance Minister (s.20 FMA Act) or through an Act of Parliament (referred to in s.21 of the FMA Act).

Glossary
135
Special Appropriations (including Standing Appropriations)
An amount of money appropriated by a particular Act of Parliament for a specific purpose and number of years. For special appropriations the authority to withdraw funds from the Consolidated Revenue Fund does not generally cease at the end of the financial year.
Standing appropriations are a sub-category consisting of ongoing special appropriations — the amount appropriated will depend on circumstances specified in the legislation.