Embed Size (px)
Citation preview
Portage County
Community
Health Needs
Assessment
1/8/15 DRAFT B
By: The Portage County Community Health
Assessment Partnership
With assistance from
Center for Public Policy and Health College of Public Health
Kent State University
Copyright Reserved

1
ACKNOWLEDGEMENTS
This Community Health Assessment was possible thanks to the collaboration of
numerous members of Portage County communities, local organizations, and health
departments. Their contributions of expertise and time enabled crucial input
necessary for this assessment. Acknowledgement is also necessary for Kent State
University, specifically the College of Public Health and the Center for Public Policy
and Health, for facilitating the partnership and writing this report documenting the
findings of the 2014 Community Health Assessment Partnership of Portage County.
Portage County Community Health Assessment Partnership
Mindy Gusz, Robinson Memorial Hospital
Carole Beaty, Family and Community Services
Sandy Myers, Coleman Professional Services
Joe Hickman, Windham Renaissance Family Center
Catherine Schoenewald, Hiram College
Kris Drummond, AxessPointe Community Health Center
Frank Hairston, Portage Area Regional Transportation Authority
Brian Duchon, United Way of Portage County
Joel Mowrey, Mental Health and Recovery Board of Portage County
Mary McCracken, Children’s Advantage
Gene Wenninger, Kent Environmental Council
Sue Whitehurst, Town Hall II
Denise Lucas, Planned Parenthood
Dennis Missimi, Portage County Sheriff’s Department
Amy Lee, Northeast Ohio Medical University
Angela DeJulius, Kent State University Health Services
Dan Derreberry, Atwater Township
Jeff Neistadt, Kent Health Department
DuWayne Porter, Karen Towne, & Becky Lehman, Portage County Health Department
Robert Howard, Portage County Board of Health
Kelly Engelhart, City of Ravenna Health District
Kent State University and the Center for Public Policy and Health
Joshua Filla, MPA
Adam Oakerson, MPH
Nishikant Kamble, MPH
Kathryn Bland, BS
Matthew Stefanak, MPH
Heather Beaird, PhD
John Hoornbeek, PhD, MPA

2
We would also like to acknowledge the valuable assistance and funding support provided by
the Center for Sharing Public Health Services at the Kansas Health Institute. They
administered a Robert Wood Johnson Foundation (RWJF) grant to Portage County that made
much of this work possible. Ohio’s Local Government Innovation Fund (LGIF) provided
support for local health department consolidation assistance and public health improvement
planning that also contributed positively to this work.
Source: Aurora Farms Premium Outlets
- Aurora Farms Premium Outlets ( Aurora, Ohio)
Source: AP
-Portage County Randolph Fair ( Randolph, Ohio)
Source: AP
-City of Kent (Kent, Ohio)
3
EXECUTIVE SUMMARY
This report presents the results of Portage County’s collaborative community health
assessment (CHA). Its purposes are to: (1) help create a shared understanding of
health needs in Portage County and the local public health system’s future
information collection needs and (2) create a foundation for future public health
improvements by informing a Community Health Improvement Planning (CHIP)
process and enabling a continuing quality improvement process for the local public
health system.
The public health stakeholders participating in the Partnership came from the private,
non-profit, and public sectors. They included representatives of the three local health
departments in Portage County – the Portage County Health Department (PCHD), the
Kent Health Department (KHD), and the Ravenna Health Department (RHD), as well
as multiple private and non-profit sector organizations (See Acknowledgements).
The CHA process benefited from three previously completed countywide community
health needs assessments (CHNAs). While the unifying purpose of these assessments
was ultimately to identify health needs of the residents of Portage County, each
CHNA represented a unique effort. The previously conducted assessments were:
(1) Hospital System Collaborative Community Health Needs Assessment (2013);
(2) Child and Family Health Services Maternal and Child Health Assessment (2013), and;
(3) Local Health Departments Community Health Needs Assessment (2014)
Sources of data and information used in these three assessments included the
University of Wisconsin’s County Health Rankings, Community Health Status
Indicators, Healthy People 2020, Maternal and Child Health data sources, Census
data, and focus groups and phone interviews with community leaders and health
stakeholders.
The Partnership developed a process for assessing and analyzing information from
these sources to arrive at a list of accepted health needs to help guide future public
health improvement efforts. The process: (1) addressed data quality issues; (3)
combined similar specific health needs into broader health need statements to enable
more effective communication and management, and; (3) included substantiation
4
processes that were based on both “good” data and health needs “perceived” by
expert Partnership members.
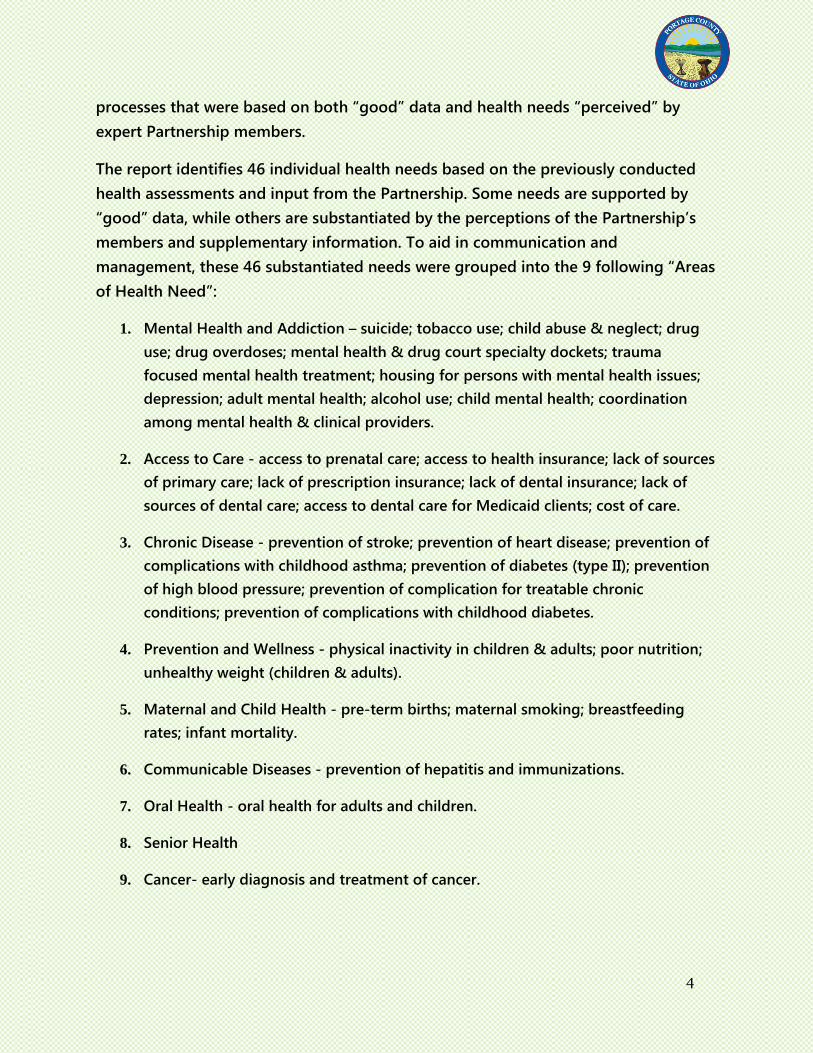
The report identifies 46 individual health needs based on the previously conducted
health assessments and input from the Partnership. Some needs are supported by
“good” data, while others are substantiated by the perceptions of the Partnership’s
members and supplementary information. To aid in communication and
management, these 46 substantiated needs were grouped into the 9 following “Areas
of Health Need”:
1. Mental Health and Addiction – suicide; tobacco use; child abuse & neglect; drug
use; drug overdoses; mental health & drug court specialty dockets; trauma
focused mental health treatment; housing for persons with mental health issues;
depression; adult mental health; alcohol use; child mental health; coordination
among mental health & clinical providers.
2. Access to Care - access to prenatal care; access to health insurance; lack of sources
of primary care; lack of prescription insurance; lack of dental insurance; lack of
sources of dental care; access to dental care for Medicaid clients; cost of care.
3. Chronic Disease - prevention of stroke; prevention of heart disease; prevention of
complications with childhood asthma; prevention of diabetes (type II); prevention
of high blood pressure; prevention of complication for treatable chronic
conditions; prevention of complications with childhood diabetes.
4. Prevention and Wellness - physical inactivity in children & adults; poor nutrition;
unhealthy weight (children & adults).
5. Maternal and Child Health - pre-term births; maternal smoking; breastfeeding
rates; infant mortality.
6. Communicable Diseases - prevention of hepatitis and immunizations.
7. Oral Health - oral health for adults and children.
8. Senior Health
9. Cancer- early diagnosis and treatment of cancer.
5
The report also includes demographic information to support analyses of social
determinants of health, evidence summaries for the identified health needs, and
identification of public health capacities in Portage County that can be used to
address the health needs that are identified.
Following public review and finalization of this assessment, both the local health
departments and the Partnership envision development of a Community Health
Improvement Plan (CHIP) to develop strategies for addressing priority health needs in
Portage County. It is envisioned that a group of stakeholders will be brought
together to carry out the CHIP. The CHA Partnership also wanted to provide
additional input to the CHIP process, and made the following recommendation in this
regard:
The Portage County Community Health Assessment Partnership encourages the CHIP
Partnership to incorporate data collection, management, and utilization strategies
into the Portage County Community Health Improvement Plan.
In summary, stakeholders from a variety of sectors and health specialties coordinated
together to participate in this comprehensive CHA for Portage County. The CHA
Partnership was able to benefit from the work done in targeted health assessment
efforts completed in the county over the past year or two. The Partnership developed
a process of incorporating and assessing data from three previously completed
community health assessments. The result is a final list of 46 substantiated health
needs in 9 broad areas within Portage County, and an identification of potential
strategies for improving data collection to inform future health assessment rounds.
This information is designed to inform the CHIP process, which is likely to involve
community stakeholders working to identify priority health needs, targets for
intervention, and mechanisms for evaluating progress.
The work underlying the report was supported by the Robert Wood Johnson
Foundation and the State of Ohio’s Local Government Innovation Fund (LGIF), as well
as the organizations involved.
6
TABLE OF CONTENTS
I. Acknowledgements .............................................................................................................................. 1
II. Executive Summary .............................................................................................................................. 3
III. Introduction ........................................................................................................................................... 8
IV. Background: Recent Health and Capacity Assessment Work in Portage County ........................ 11 Previous Health Assessments ....................................................................................... 11
Hospital System Collaborative Community Health Needs Assessment ........................................................................................... 11
Child and Family Health Services Maternal and Child Health Assessment ........................................................................................... 13
Local Health Departments Community Health Needs Assessment .. 15 Assessing and Mapping and Public Health System Capacities in Portage County .. 16
V. Preparing the Community Health Assessment: Processes, Methods and Data ............................ 17
Establishing the CHA Partnership and Defining the Health Assessment Process .... 17 Compiling Data and Information to Support the Assessment ..................................... 18 Assessing and Analyzing Data and Information ........................................................... 21
Assessing Data Quality ......................................................................... 22 Substantiating Health Needs ................................................................ 24 Enabling effective management efforts to address substantiated
health needs .......................................................................................... 28 Establishing Findings and Writing the Report .............................................................. 28 Collecting Public Input on the CHA and Finalizing the Report .................................... 29
VI. Findings................................................................................................................................... ............. 30
Demographic Information on Portage County .............................................................. 30 Areas of Public Health Need ........................................................................................... 36
Mental Health and Addiction ................................................................ 36 Access to Care ...................................................................................... 40 Chronic Disease .................................................................................... 43 Prevention and Wellness ...................................................................... 45 Maternal and Child Health .................................................................... 47 Communicable Diseases ...................................................................... 49 Oral Health ............................................................................................. 50 Senior Health ......................................................................................... 51 Cancer .................................................................................................... 52
7
Social Determinants of Health and Challenges for Specific Populations in Portage County .............................................................................................................................. 53
Poverty ................................................................................................... 53 Racial and Ethnic Composition ............................................................ 54 Age.......................................................................................................... 54 Education ............................................................................................... 55 Healthcare Access ................................................................................. 56 Commute to Work .................................................................................. 56
VII. Future Information Collection Efforts................................................................................................ 57
VIII. Input for the Community Health Improvement Plan (CHIP) Partnership ........................................ 60
Future Information and Data Collection ........................................................................ 60 CHA Partnership Evaluations of Perceived Health Needs in Portage County .......... 60
IX. Conclusions......................................................................................................................................... 62
X. References ........................................................................................................................................... 63
XI. Appendices ......................................................................................................................................... 66
I. The Mobilizing Action through Planning and Partnerships (MAPP) Model: A
Short description II. Summary of Portage County National Public Health Performance Standards
Program (NPHPSP) Assessment Results III. Robert Wood Johnson Foundation (RWJF) Strategy and Action Plan
Workgroup: Asset Map of Health Service Providers IV. Services Provided by Local Health Departments in Portage County V. Portage County Demographic Data, by Geographic Cluster
VI. Data Quality Rating Procedures used by the CHA Partnership: A Summary VII. CHA Partnerships Survey Results
VIII. Evidence Summary for Substantiated Health Needs/Indicators Figures
I. Figure 1: Community Health Improvement Cycle (CHIC) ................................................................ 13
II. Figure 2: Partnership Approved Criteria for Data Quality ............................................................... 23
III. Figure 3: Health Needs Substantiation Process ............................................................................... 25
IV. Figure 4: Overview of Demographic Data ......................................................................................... 35
8
INTRODUCTION
A Community Health Assessment (CHA) “is a process that uses quantitative and
qualitative methods to systematically collect and analyze data to understand health
within a specific community” (NACCHO, 2014). It serves as a foundation for efforts to
understand, promote, and improve the health of residents in a local community. This
CHA report seeks to provide this kind of foundation for public health improvement in
Portage County, Ohio.
The CHA process results presented in this report are the culmination of efforts by
community stakeholders throughout Portage County. These stakeholders have come
from the private, non-profit, and public sectors. They include representatives of the
three local health departments that have provided services in Portage County for a
number of years – the Portage County Health Department (PCHD), the Kent Health
Department (KHD), and the Ravenna Health Department (RHD), as well as a number
of other important health-related organizations in Portage County. In 2011, a group
of these stakeholders came together to form a Task Force for Improving Public
Health in Portage County, and the work of this Task Force has enabled multiple
efforts to better understand and improve public health in Portage County.
One result of these stakeholders’ efforts was a successful grant application to the
Center for Sharing Public Health Services and the Robert Wood Johnson Foundation
(RWJF), and the receipt of this grant enabled the establishment of several
workgroups to facilitate collaborative progress toward public health improvement in
Portage County.1 One important recommendation emanating from one of these
RWJF workgroups was that the health departments in Portage County should work
together with their partnering agencies on a collaborative CHA. That
recommendation was subsequently adopted by the PCHD, the KHD, and the RHD,
and the Health Commissioners from these health districts played central roles in
establishing and contributing to the work of a CHA Partnership comprised of multiple
health-related stakeholders in Portage County.
Much like the broader RWJF partnership, a key objective of the CHA Partnership has
been to establish continuing processes of collaboration across health organizations in
Portage County. Another key objective has been to guide a process to assess relevant
health and data collection needs to support future public health planning processes
1These three RWJF Workgroups are: 1) the Strategy and Action Plan Workgroup; 2) the Evaluation Workgroup, and; 3) the Education Workgroup.
9
and interventions within the community. Thus, the CHA Partnership’s role has been
to:
Help guide the compilation of data to substantiate health needs;
Provide expert input on health needs in Portage County, and;
Provide input on the CHA report, and appropriate follow up efforts relating to
it.
A number of important health-related stakeholders in Portage County have joined in
the CHA effort, and they have enabled successful efforts on the part of the CHA
Partnership in carrying out these roles. These organizations include:
Robinson Memorial Hospital;
Portage County Mental Health and Recovery Board;
United Way of Portage County;
Children’s Advantage;
The Consortium of Eastern Ohio Master of Public Health, Northeast Ohio
Medical University;
Townhall II;
Planned Parenthood of Greater Ohio;
Hiram College;
Kent State University’s Health Services;
Portage County Transportation Authority;
Coleman Professional Services;
Portage County Sheriff’s Department;
Family and Community Services;
AxessPointe Medical Center, and;
Windham Renaissance Family Center.
The work of these CHA Partnership members in fulfilling their roles has enabled the
compilation of this report. The purposes of the report are to: 1) help create a shared
understanding of health needs in Portage County and the local public health system’s
future information collection needs, and; 2) create a foundation for future public
health improvements by informing a Community Health Improvement Planning
(CHIP) process and enabling a continuing quality improvement process for the local
public health system.
It is worth noting that in the summer of 2014, as the CHA process was unfolding, the
City of Ravenna (preceded by authorizing action from the Portage County Health
District Advisory Council) adopted legislation to formally merge its health district
with the Portage County Health District. While future public health endeavors
regarding the RHD are likely to eventually fall under the auspices of the Portage
10
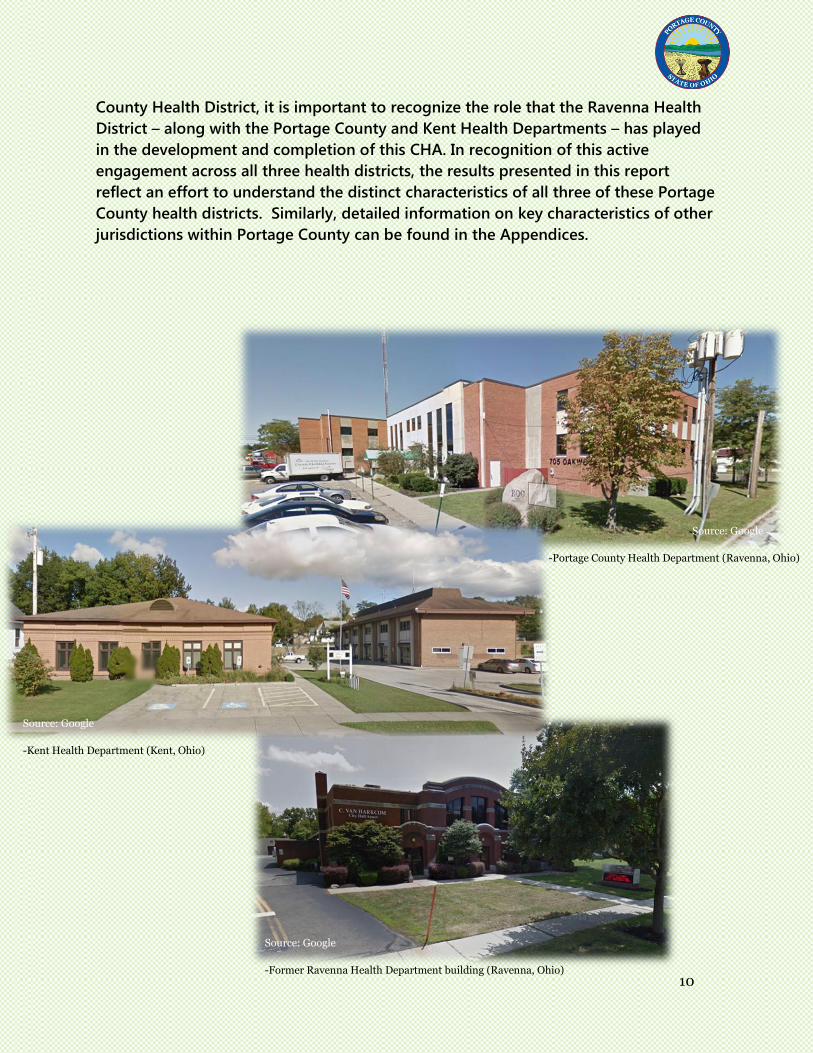
County Health District, it is important to recognize the role that the Ravenna Health
District – along with the Portage County and Kent Health Departments – has played
in the development and completion of this CHA. In recognition of this active
engagement across all three health districts, the results presented in this report
reflect an effort to understand the distinct characteristics of all three of these Portage
County health districts. Similarly, detailed information on key characteristics of other
jurisdictions within Portage County can be found in the Appendices.
Source: Google
-Portage County Health Department (Ravenna, Ohio)
Source: Google
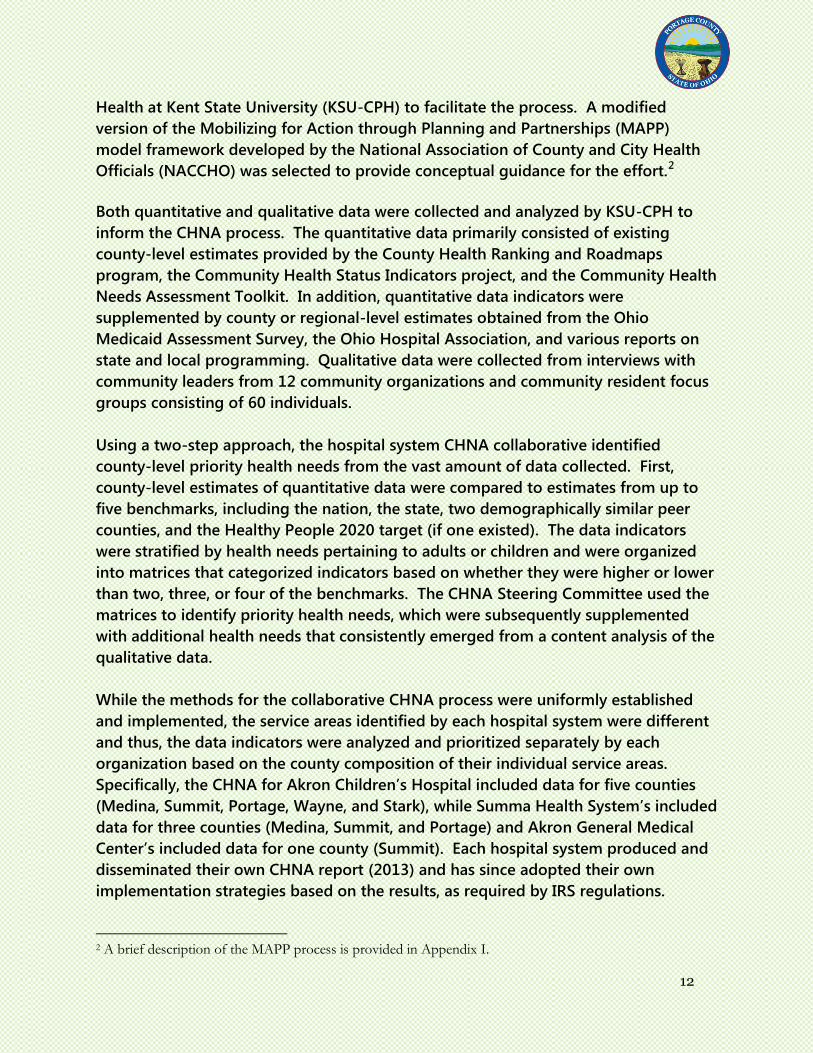
-Kent Health Department (Kent, Ohio)
Source: Google
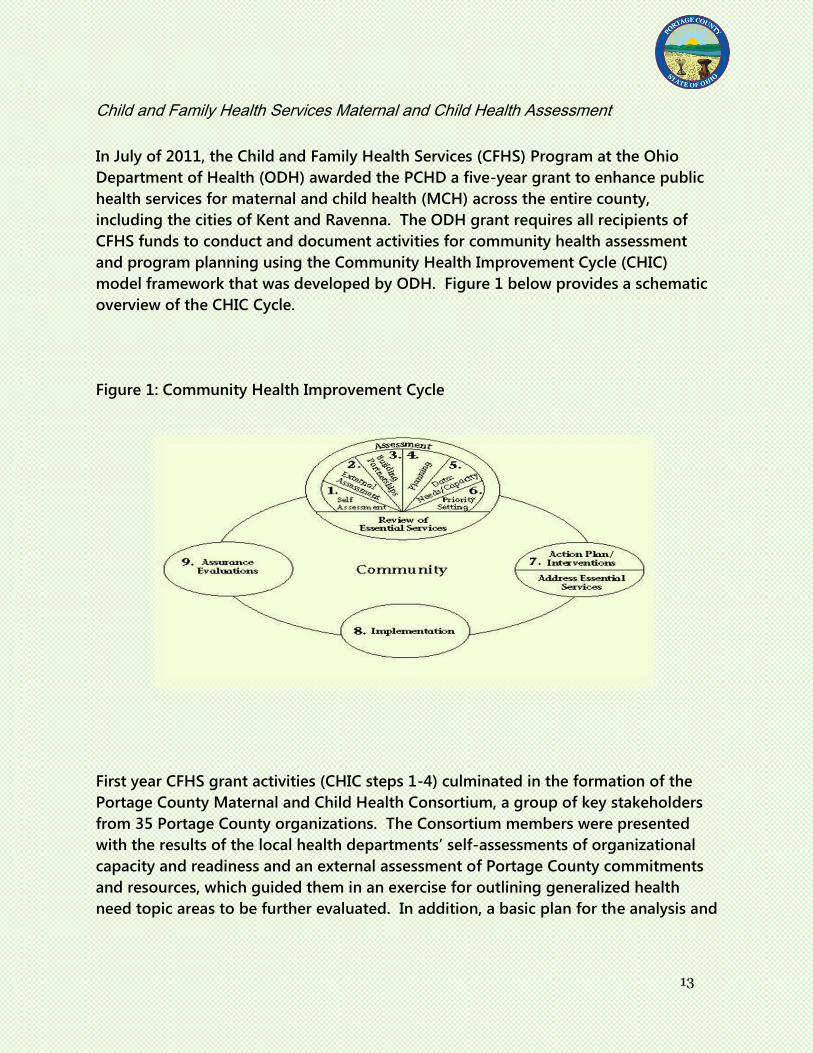
-Former Ravenna Health Department building (Ravenna, Ohio)

11
BACKGROUND: RECENT HEALTH AND CAPACITY
ASSESSMENT WORK IN PORTAGE COUNTY
The CHA process has benefited from previously completed health assessment work
conducted in Portage County. Indeed, the CHA processes documented in this report
have been developed and managed in part to integrate data and data collection
activities undertaken through three recently completed assessments in order to build
a widely shared understanding of community health needs in Portage County. This
section briefly describes these three previously completed health assessments, and
provides a brief summary of recent work done to assess public health system
capacities in Portage County (this brief summary of recent public health system
capacity work is supplemented by additional information in the Appendices). The
section is followed by a discussion of the processes, methods, and data used to
compile the demographic information and areas of community health need that are
highlighted in the Findings section of this report.
Health Needs Assessments
Over the past year or two, three countywide community health needs assessments
(CHNAs) have been conducted and presented to the Portage County community.
While the unifying purpose of these assessments was ultimately to identify health
needs of the residents of Portage County, each CHNA represented a unique effort.
The three health assessments are described briefly below.
Hospital System Collaborative Community Health Needs Assessment
The enactment of the Affordable Care Act (ACA) in 2010 produced new requirements
that charitable hospitals must satisfy to remain non-profit 501(c)(3) organizations.
Enforced by Internal Revenue Service (IRS) regulations, the ACA requires each
charitable hospital to “conduct a community health needs assessment (CHNA) and
adopt an implementation strategy at least once every three years,” effective for tax
years beginning after March 23, 2012.
In follow up to these requirements, the three major local non-profit hospital systems
in Summit County, Ohio (Akron Children’s Hospital, Summa Health System, and
Akron General Medical Center) began a collaborative effort to conduct a CHNA in
2012 for the purposes of meeting the newly established IRS regulations for the
upcoming tax year and assisting in community efforts intended to improve public
health locally. As a group, these hospitals contracted with the College of Public
12
Health at Kent State University (KSU-CPH) to facilitate the process. A modified
version of the Mobilizing for Action through Planning and Partnerships (MAPP)
model framework developed by the National Association of County and City Health
Officials (NACCHO) was selected to provide conceptual guidance for the effort.2
Both quantitative and qualitative data were collected and analyzed by KSU-CPH to
inform the CHNA process. The quantitative data primarily consisted of existing
county-level estimates provided by the County Health Ranking and Roadmaps
program, the Community Health Status Indicators project, and the Community Health
Needs Assessment Toolkit. In addition, quantitative data indicators were
supplemented by county or regional-level estimates obtained from the Ohio
Medicaid Assessment Survey, the Ohio Hospital Association, and various reports on
state and local programming. Qualitative data were collected from interviews with
community leaders from 12 community organizations and community resident focus
groups consisting of 60 individuals.
Using a two-step approach, the hospital system CHNA collaborative identified
county-level priority health needs from the vast amount of data collected. First,
county-level estimates of quantitative data were compared to estimates from up to
five benchmarks, including the nation, the state, two demographically similar peer
counties, and the Healthy People 2020 target (if one existed). The data indicators
were stratified by health needs pertaining to adults or children and were organized
into matrices that categorized indicators based on whether they were higher or lower
than two, three, or four of the benchmarks. The CHNA Steering Committee used the
matrices to identify priority health needs, which were subsequently supplemented
with additional health needs that consistently emerged from a content analysis of the
qualitative data.
While the methods for the collaborative CHNA process were uniformly established
and implemented, the service areas identified by each hospital system were different
and thus, the data indicators were analyzed and prioritized separately by each
organization based on the county composition of their individual service areas.
Specifically, the CHNA for Akron Children’s Hospital included data for five counties
(Medina, Summit, Portage, Wayne, and Stark), while Summa Health System’s included
data for three counties (Medina, Summit, and Portage) and Akron General Medical
Center’s included data for one county (Summit). Each hospital system produced and
disseminated their own CHNA report (2013) and has since adopted their own
implementation strategies based on the results, as required by IRS regulations.
2 A brief description of the MAPP process is provided in Appendix I.
13
Child and Family Health Services Maternal and Child Health Assessment
In July of 2011, the Child and Family Health Services (CFHS) Program at the Ohio
Department of Health (ODH) awarded the PCHD a five-year grant to enhance public
health services for maternal and child health (MCH) across the entire county,
including the cities of Kent and Ravenna. The ODH grant requires all recipients of
CFHS funds to conduct and document activities for community health assessment
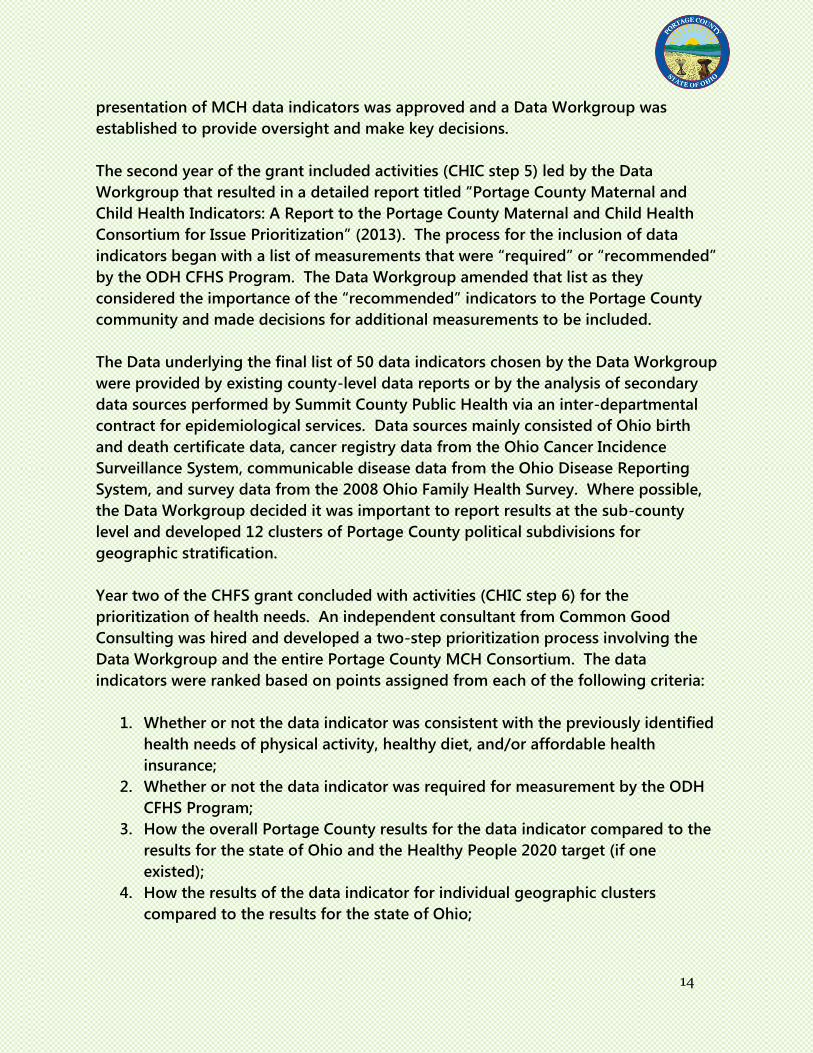
and program planning using the Community Health Improvement Cycle (CHIC)
model framework that was developed by ODH. Figure 1 below provides a schematic
overview of the CHIC Cycle.
Figure 1: Community Health Improvement Cycle
First year CFHS grant activities (CHIC steps 1-4) culminated in the formation of the
Portage County Maternal and Child Health Consortium, a group of key stakeholders
from 35 Portage County organizations. The Consortium members were presented
with the results of the local health departments’ self-assessments of organizational
capacity and readiness and an external assessment of Portage County commitments
and resources, which guided them in an exercise for outlining generalized health
need topic areas to be further evaluated. In addition, a basic plan for the analysis and
14
presentation of MCH data indicators was approved and a Data Workgroup was
established to provide oversight and make key decisions.
The second year of the grant included activities (CHIC step 5) led by the Data
Workgroup that resulted in a detailed report titled “Portage County Maternal and
Child Health Indicators: A Report to the Portage County Maternal and Child Health
Consortium for Issue Prioritization” (2013). The process for the inclusion of data
indicators began with a list of measurements that were “required” or “recommended”
by the ODH CFHS Program. The Data Workgroup amended that list as they
considered the importance of the “recommended” indicators to the Portage County
community and made decisions for additional measurements to be included.
The Data underlying the final list of 50 data indicators chosen by the Data Workgroup
were provided by existing county-level data reports or by the analysis of secondary
data sources performed by Summit County Public Health via an inter-departmental
contract for epidemiological services. Data sources mainly consisted of Ohio birth
and death certificate data, cancer registry data from the Ohio Cancer Incidence
Surveillance System, communicable disease data from the Ohio Disease Reporting
System, and survey data from the 2008 Ohio Family Health Survey. Where possible,
the Data Workgroup decided it was important to report results at the sub-county
level and developed 12 clusters of Portage County political subdivisions for
geographic stratification.
Year two of the CHFS grant concluded with activities (CHIC step 6) for the
prioritization of health needs. An independent consultant from Common Good
Consulting was hired and developed a two-step prioritization process involving the
Data Workgroup and the entire Portage County MCH Consortium. The data
indicators were ranked based on points assigned from each of the following criteria:
1. Whether or not the data indicator was consistent with the previously identified
health needs of physical activity, healthy diet, and/or affordable health
insurance;
2. Whether or not the data indicator was required for measurement by the ODH
CFHS Program;
3. How the overall Portage County results for the data indicator compared to the
results for the state of Ohio and the Healthy People 2020 target (if one
existed);
4. How the results of the data indicator for individual geographic clusters
compared to the results for the state of Ohio;
15
5. Assessment of the county’s capacity to initiate or expand an intervention that
would change the results of the data indicator;
6. Assessment of other factors that could influence an intervention that would
change the results of the data indicator.
The Data Workgroup in the first step of the prioritization process assessed criteria 1-
4, while the entire Portage County MCH Consortium assessed criteria 5-6 in the
second step. A list of 20 ranked priority data indicators resulted from the process
and is currently being used to inform a community-wide interventions plan that will
be implemented and evaluated over the remainder of the five-year CFHS grant cycle
(CHIC steps 7-9). The CHFS assessment process is now being rolled into the
comprehensive CHA and CHIP processes underway in the county.
Local Health Departments Community Health Needs Assessment
In February of 2012, the Task Force to Improve Public Health in Portage County
recommended that the three local health departments pursue accreditation through
the Public Health Accreditation Board (PHAB) to be completed within the following
five years. Given that an application for PHAB accreditation requires the completion
of a comprehensive CHNA, the Portage County, Kent City, and Ravenna City Health
Departments began a collaborative effort to produce an assessment that would not
only move them toward meeting PHAB criteria, but also support local decision-
making and improve public health across the county. To this end, the three health
departments collectively contracted with the Center for Public Policy and Health
(CPPH) in the College of Public Health at Kent State University to assist them in
preparing a broad county-wide health assessment (James, et al., 2014) to help
facilitate this process.
The methods implemented in this process involved the collection of both quantitative
and qualitative information to identify a comprehensive set of health needs in
Portage County, which included community perceived needs that were not
measurable by data indicators. On a quantitative level, the data included county-
level estimates of 80 data indicators provided by the County Health Ranking and
Roadmaps program and the Community Health Status Indicators project. Qualitative
data were collected from key informant interviews of board of health members, city
council members, and township trustees.
An initial set of Portage County priority health needs were identified from among the
80 quantitative measures by implementing a ranking system that categorized the
data indicators as first tier, second tier, or third tier based on their comparisons with
16
four benchmarks, including the nation, the state, and two peer counties (Greene and
Wood). First tier data indicators were identified as those where Portage County
estimates compared unfavorably to all four of the benchmarks. Similarly, second and
third tier data indicators were those where Portage County estimates were
unfavorable compared to three or two of the benchmarks, respectively. In addition,
the process was supplemented by the identification of perceived health needs
obtained from the key informant interviews, some of which were newly identified,
while others were consistent with the quantitative data analysis.
Ultimately, the collaborative needs assessment effort of the three local health
departments in Portage County resulted in a report titled “Portage County
Community Health Needs Assessment” (James et al., 2014). The process identified
eight first tier data indicators, six second tier data indicators, and 18 third tier data
indicators that highlight the health needs of residents in Portage County. In addition,
the process identified multiple perceived health needs that were not measurable or
measured to inform subsequent discussions.
Assessing and Mapping Public Health System Capacities in Portage County
Over the past several years, efforts have also been made to assess public health
system performance and capacities in Portage County and “map” current services.
These efforts included a Local Public Health System Performance Assessment, an
inventory of Portage County public health-related service providers, and a description
of public health services provided individually and collaboratively by local health
departments in Portage County. We describe these efforts and the information
flowing from them in Appendices II, III, and IV, respectively.
Source: Streetsboro Police Department
-Streetsboro Police Department. (Streetsboro, Ohio)
Source: AP
-Brimfield Fire Department (Brimfield, Ohio)
17
PREPARING THE COMMUNITY HEALTH
ASSESSMENT: PROCESSES, METHODS, AND DATA
To arrive at the findings specified in this report, the CHA Partnership’s work
proceeded in five major steps. These major steps are as follows:
1) Establish the CHA Partnership and define the health assessment process;
2) Compile data and information to support the assessment;
3) Assess and analyze data and information;
4) Establish findings and write report;
5) Collect public input on the CHA and finalize the report.
In the subsections that follow, we briefly discuss the CHA Partnership’s work in each
of these areas.
Establishing the CHA Partnership and Defining the Health Assessment Process
To begin the CHA process, representatives of the three health districts asked the
RWJF Education Workgroup to compile a list of health stakeholders in Portage
County. From a list of 74 stakeholders generated by the RWJF Education Workgroup,
the representatives selected 21 individuals from organizations that they believed
were particularly knowledgeable and aware of health needs in Portage County. In
early June 2014, letters from the three health commissioners were sent to 21 key
stakeholders across Portage County inviting them to participate in the CHA process.
The Stakeholders who participated in the process are listed in the Acknowledgements
above. The stakeholders invited came from a variety of sectors, including but not
limited to:
Local Government
Public Transportation
Local Hospitals
Emergency Services
Mental Health agencies
In addition, the Health Commissioners also kept information on the other individuals
and organizations identified by the RWJF Workgroup, so they could be engaged in
the CHA and CHIP efforts at subsequent stages of the process.
18
At the initial meeting, the partnership agreed that its specific role was to:
Help guide the compilation of existing data to substantiate health needs;
Provide expert input on health needs in Portage County, and;
Provide input on the CHA assessment report and appropriate follow up efforts
relating to it.
The CHA Partnership also formally adopted the Community Health Improvement
Cycle (CHIC) as the planning model going forward (see figure 1 above). This is the
same planning model used by the Maternal and Child Health Assessment process in
Portage County. It was determined that because health officials in the county were
familiar with the process, and that it is a product of the Ohio Health Department
(ODH), it would serve the county well in this situation. In addition, previously
undertaken processes relating to the first four stages of the CHIC process were
described, and the group agreed to participate in continuation of those assessment,
partnership, and planning efforts through the comprehensive CHA Partnership effort.
The CHA Partnership held 5 full Partnership meetings in 2014, and engaged in a
number of other sub-committee meetings and other activities. Whenever possible,
full Partnership meetings were video-taped so those unable to attend could catch up
on the activities that they had missed.
Compiling Data and Information to Support the Assessment
The CHA Partnership and the KSU-CPPH staff and affiliated personnel identified data
from a range of sources to support the assessments. The data collected and analyzed
in the previously mentioned assessments (Hospital System Collaborative, CFHS
Maternal and Child Health, Local Health Department CHNA) provided a foundation of
data and information, and these data were supplemented by information from other
sources. These other sources included the Census and American Community Survey,
which provides baseline demographic information on Portage County and its
jurisdictions. In addition, individual CHA partners also brought data, information,
and multiple insights to the full Partnership’s discussions.
While the assessment process relied on data from multiple sources, information was
collected from Partnership Members in the form of internal surveys of their expert
perceptions on the health needs affecting the county, as well as primary data
provided by their agencies. Major sources of primary and secondary data compiled
and considered include:
19
Primary Data Sources:
Key Informant Interviews
We conducted key informant interviews to gather information and perceptions
regarding health needs in Portage County, Ravenna and Kent. These key informant
interviews are documented in the Local Health Departments (2014) health assessment
referenced above.
Focus Groups
The Hospital System CHNA used focus groups to collect primary perceptual data
related to health needs in the community from key stakeholders. This information
was used to supplement data and information collected from secondary sources.
Agency Data
Another form of primary data used in this assessment is data collected by community
health agencies that were provided by Partnership Members during the CHA Process.
Data from behavioral health and clinical health agencies in the county have been
used to supplement other data sources used in this assessment.
Contributions of CHA Partnership Members
The CHA Partnership included 21 individuals with substantial expertise on health
needs and issues in Portage County. These individuals provided information
throughout the CHA process that contributed to the findings presented. At the
beginning of the process, in early summer of 2014, they contributed a list of health
needs that they perceived to exist in Portage County, and these needs were included
in an initial list of needs that was compiled for analysis and consideration by the
Partnership as a whole. They also contributed expertise, primary agency data (as
noted above), additional secondary data, and insights at subsequent stages of the
assessment process, including a survey of Partnership Members on their feelings
toward the list of health needs being evaluated (See Appendix VII for information on
this survey).
20
Secondary Data Sources:
Maternal Child and Health Data Sources
Data indicators were obtained through American Community Survey Data,
Guttmacher Institute, Health Resources and Service Administration, Office of Policy,
Research and Strategic Planning, Ohio Birth Certificate Data and Ohio Cancer
Incidence Surveillance System.
County Health Rankings
According to their website, the County Health Rankings report ranks the health of
nearly every county in the nation and includes indicators that measure many of the
factors that impact health status in the community. The Rankings also confirm the
critical role that factors such as education, jobs, income, and environment play in
influencing the health of populations.
Community Health Status Indicators
According to the Community Health Status Indicators (CHSI) website, the goal of this
dataset is to provide an overview of key health indicators for local communities and
to encourage dialogue about actions that can be taken to improve a community’s
health. The CHSI report was designed not only for public health professionals but also
for members of the community who are interested in the health of their community.
The CHSI report provides a tool for community advocates to see, react, and act to
create a healthier community. The report can serve as a starting point for community
assessment of needs, quantification of vulnerable populations, and measurement of
preventable diseases, disabilities, and deaths.
Healthy People 2020
Healthy People 2020 provide science-based, 10-year national objectives for
improving the health of all Americans. For three decades, Healthy People has
established benchmarks and monitored progress over time in order to: encourage
collaborations across communities and sectors, empower individuals toward making
informed health decisions and measure the impact of prevention activities
21
Census and American Community Survey
Demographic data were collected for Portage County and its political subdivisions
using US Census and American Community Survey data via the American Fact Finder
database. The county’s subdivisions were grouped into geographic clusters using the
same methodology used in the Portage County Maternal and Child Health
assessment (See Appendix V).
Assessing and Analyzing Data and Information
The process of assessing and analyzing information began with the compilation of
health needs identified by both the three previously conducted health needs
assessments (see Background Section above) and the CHA Partnership members.
Combined, these sources of identified health need produced an initial list of 155
identified health needs.
However, with a broad range of data and information available to it, the CHA
Partnership faced challenges in assessing and analyzing this existing information to
arrive at a list of accepted health needs to help guide future public health
improvement efforts. At least three specific challenges presented themselves:
1. The data quality challenge: Information and data from the sources described
above were assessed and considered, and this resulted in the compilation of
multiple health needs indicators (138) from all three previously conducted
Portage County needs assessments. However, the CHA Partnership found that
data from differing sources underlying these assessments varied along
multiple dimensions that might affect its quality. As a result, the CHA
Partnership determined that it needed to evaluate the data upon which the
health need statements were based to determine whether it was of a quality
that could be relied on – in and of itself – to substantiate a health need in
Portage County.
2. Substantiating legitimate health needs that are not supported by “good” data:
Some health needs were well-documented by strong existing data, but the
group was concerned that there were multiple important health needs that
were not particularly well-documented by existing data and information
sources. This raised questions about how to substantiate important health
needs that needed to be addressed, but were backed by weaker data than the
Partnership was comfortable with and/or only by the experiences of the expert
members of the group.

22
3. Enabling effective communication and management of multiple specific health
needs: The pure volume of specific health needs identified in the previous
assessments and by Partnership members made analysis and prioritization of
needs difficult. For this reason, the Partnership suggested that there would be
value in grouping specific needs in ways that enhanced comprehension and
communication, while also making subsequent intervention efforts more
feasible.
The following subsections address how the Partnership chose to address these
challenges.
Assessing Data Quality
The CHA Partnership’s initial list of 138 identified health needs came from a number
of different sources, and some of them were well established sources of community
health information. However, the Partnership found that data from these differing
sources varied in ways that might affect its quality. Even data reported for Portage
County from well-known and widely used sources such as the County Health
Rankings could be some years old or dependent on information gleaned from
outside Portage County. As a result, the Partnership chose to build a data quality
assessment effort explicitly into its health assessment process.
At the Partnership’s second meeting, it established a Data Quality Workgroup,
supported by Dr. Heather Beaird, an Epidemiologist serving Summit and Portage
Counties, as well as KSU’s College of Public Health. The group consisted of 6
workgroup members, and it met several times to establish data quality criteria and to
evaluate the health need indicators according to those criteria.
The group reviewed identified “data driven” health indicators from the three Portage
County Health Needs Assessments described above. Multiple perceived health needs
were also provided by stakeholders participating in the partnership, but they were
not included in the data quality assessment. After the “data driven” health indicators
were condensed into one list, the result was an initial list of data-driven health
indicators for evaluation. 3
4 The indicators that were not “data-driven” included perceived needs offered by CHA Partnership members and needs growing from the previous health assessments that surfaced through means other than identified data (interviews, focus groups, etc.).
23
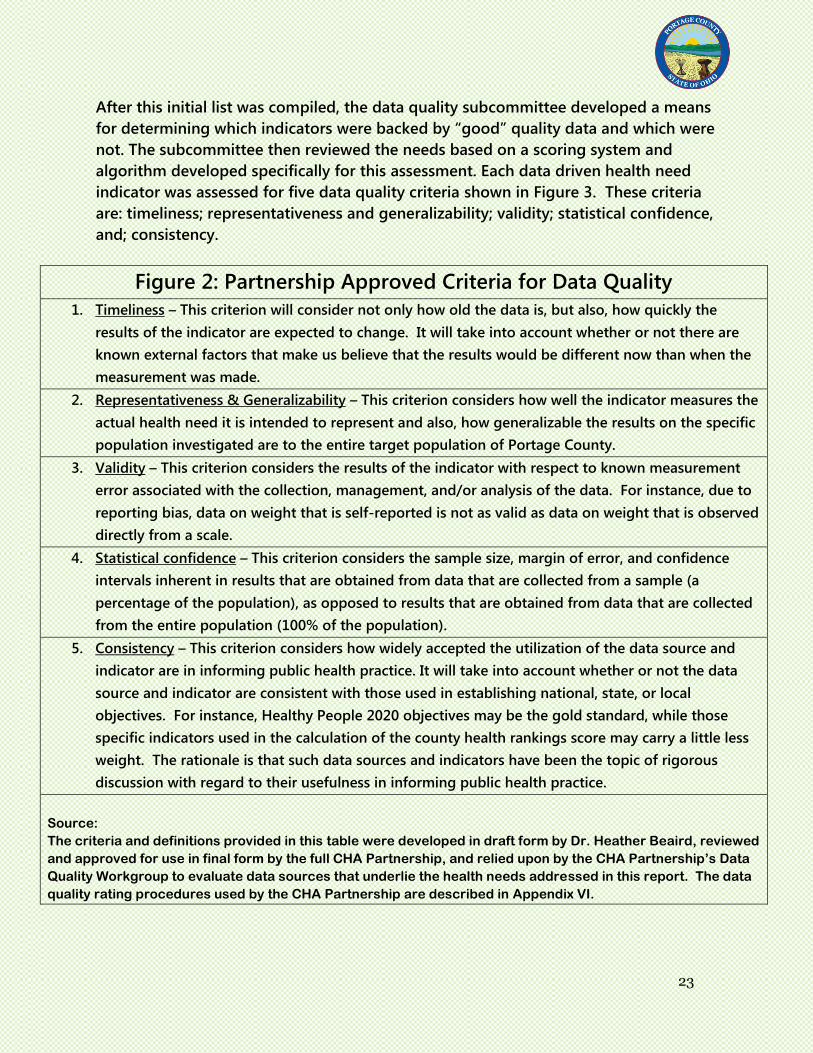
After this initial list was compiled, the data quality subcommittee developed a means
for determining which indicators were backed by “good” quality data and which were
not. The subcommittee then reviewed the needs based on a scoring system and
algorithm developed specifically for this assessment. Each data driven health need
indicator was assessed for five data quality criteria shown in Figure 3. These criteria
are: timeliness; representativeness and generalizability; validity; statistical confidence,
and; consistency.
Figure 2: Partnership Approved Criteria for Data Quality
1. Timeliness – This criterion will consider not only how old the data is, but also, how quickly the
results of the indicator are expected to change. It will take into account whether or not there are
known external factors that make us believe that the results would be different now than when the
measurement was made.
2. Representativeness & Generalizability – This criterion considers how well the indicator measures the
actual health need it is intended to represent and also, how generalizable the results on the specific
population investigated are to the entire target population of Portage County.
3. Validity – This criterion considers the results of the indicator with respect to known measurement
error associated with the collection, management, and/or analysis of the data. For instance, due to
reporting bias, data on weight that is self-reported is not as valid as data on weight that is observed
directly from a scale.
4. Statistical confidence – This criterion considers the sample size, margin of error, and confidence
intervals inherent in results that are obtained from data that are collected from a sample (a
percentage of the population), as opposed to results that are obtained from data that are collected
from the entire population (100% of the population).
5. Consistency – This criterion considers how widely accepted the utilization of the data source and
indicator are in informing public health practice. It will take into account whether or not the data
source and indicator are consistent with those used in establishing national, state, or local
objectives. For instance, Healthy People 2020 objectives may be the gold standard, while those
specific indicators used in the calculation of the county health rankings score may carry a little less
weight. The rationale is that such data sources and indicators have been the topic of rigorous
discussion with regard to their usefulness in informing public health practice.
Source:
The criteria and definitions provided in this table were developed in draft form by Dr. Heather Beaird, reviewed
and approved for use in final form by the full CHA Partnership, and relied upon by the CHA Partnership’s Data
Quality Workgroup to evaluate data sources that underlie the health needs addressed in this report. The data
quality rating procedures used by the CHA Partnership are described in Appendix VI.
24
Substantiating Health Needs
As is noted above, the CHA Partnership benefited from the documentation of health
needs that was provided by the previously conducted health needs assessments for
Portage County. It also benefited from insights on perceived needs provided by
Partnership members at the outset of the process. The overall process used to
substantiate needs from these sources is summarized in Figure 2 below.
These two sources of identified health needs resulted in a preliminary list of 155
potential health needs/indicators. Of these needs/indicators, 138 were identified
through the three previous health needs assessments described above and 17 unique
needs were identified by members of the Partnership in late June of 2014. These
numbers are summarized in Box A of Figure 2.
To deal with this long list of identified health need indicators, the Partnership
determined that a process for substantiating health needs based on data quality
criteria, the expertise of the Partnership as it relates to perceived needs, and
supplemental data and information was needed. As a result, at its second and third
meetings, CHA Partnership members – with the assistance of KSU-CPPH staff and
affiliates -- developed a process for substantiating health needs identified through
the previous needs assessments and the perceived health needs identified by the
CHA Partnership’s members, and through other sources.
Source: AP
-Kent State University Library (Kent, Ohio) Source: AP
-Kent Free Library (Kent, Ohio)
25
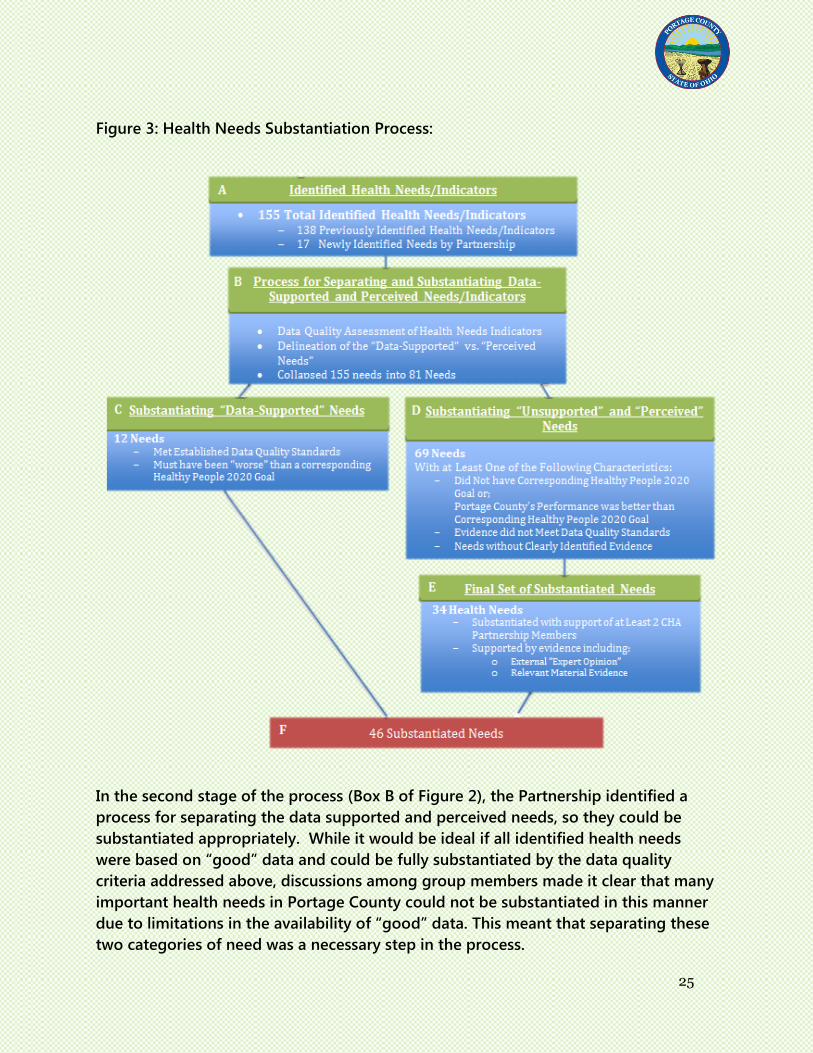
Figure 3: Health Needs Substantiation Process:
In the second stage of the process (Box B of Figure 2), the Partnership identified a
process for separating the data supported and perceived needs, so they could be
substantiated appropriately. While it would be ideal if all identified health needs
were based on “good” data and could be fully substantiated by the data quality
criteria addressed above, discussions among group members made it clear that many
important health needs in Portage County could not be substantiated in this manner
due to limitations in the availability of “good” data. This meant that separating these
two categories of need was a necessary step in the process.
26
As a result, the health indicators with reference data identified in the previous reports
were subjected to the data quality assessment process described in the subsection
above, while alternative procedures for substantiating “perceived” and non-data
supported needs were also developed.
In addition, in this second stage of the process, the Data Quality Workgroup took the
155 initially identified health needs/indicators through a review process that
ultimately condensed the list to 81 unique health need indicators derived from both
the previously conducted Portage County needs assessments and the health needs
identified by CHA Workgroup members.
These 81 unique health need indicators were then divided into two categories. The
first category includes 12 data driven needs that were:
1. Backed by “good” quality data, which met the data quality standards as
determined by the CHA Partnership’s Data Quality Workgroup, and;
2. Comparable to a parallel Health People 2020 goal that documents Portage
County performance that is “worse” than that national goal.
This element of the Partnership’s work is depicted in Box C of Figure 1.
The second category includes “perceived” health needs that are comprised of all of
the remaining identified health need indicators that did not meet the quality data-
driven criteria. The process for substantiating these needs is depicted in Box D of
Figure 2. The 69 identified health need indicators in this category included:
1. Perceived needs forwarded by CHA Partnership members;
2. Data driven health needs drawn from the three previously conducted Portage
County needs assessments that did not have a Healthy People 2020 goal, or for
which Portage County’s performance was better than the corresponding goal,
and;
3. Data driven health needs that were determined by the CHA Partnership’s Data
Quality Subcommittee to be based on data and information that did not meet
its thresholds for adequate quality (see Appendix VI for more information).
In the next stage of the process (Box E in Figure 2), the CHA Partnership conducted a
process to substantiate these latter 69 health needs identified in Box D. As is noted
above, the CHA Partnership believed that many of these needs were important ones
that should be recognized in order to enable continuing public health improvements
in Portage County. At the same time, however, the Partnership members felt that it
27
was important to substantiate these health needs in some fashion. To accomplish
this purpose, the Partnership established criteria suggesting that these health needs
could be substantiated by:
1. Concurrence from at least two CHA Partnership members, and;
2. The presentation of some data or evidence substantiating the views of these
two Partnership members.
A total of 34 of these perceived health needs were legitimately substantiated in this
fashion.4
After identifying these health needs, the Partnership also sought to differentiate
further among them, based on their experiences as public health professionals in
Portage County. They sought to do so by conducting an anonymous survey of CHA
Partnership members to rate and rank the importance of these needs in Portage
County. Prior to this process, CHA Partnership members were also given an
opportunity to offer further evidence of the importance of the perceived health
needs in Portage County. Once available evidence was assembled, participants were
also given evidence summaries for each of the health needs to reference if necessary
while taking the survey.
While the survey was intended to further differentiate the perceived health needs
based on the expert opinions of the CHA Partnership members, the results revealed
that virtually all of the perceived and unsupported needs in this category were
viewed by CHA Partnership members as important to residents of the County. While
there was some differentiation among the health need indicators presented, all of
them were rated at the midpoint in a seven point Likert survey scale of health need
importance or above. During its final meeting, the CHA Partnership agreed that the
prioritization survey reinforced the results of the original processes described above
and retained all 34 legitimately substantiated needs in the survey. More detailed
information on the prioritization survey and its results are provided in the Findings
section and in Appendix VII.
In the next stage of the process (Box F in Figure 2), the Partnership combined these
two set of substantiated needs (12 “Data-Supported” and 34 “Perceived” needs) into
one category, and this led to the identification of 46 substantiated health need
indicators in Portage County.
4 The initial number of “health needs” established was 40. However, subsequent investigation revealed that some of these forty needs were not legitimately substantiated as “health needs”. These “needs” were subsequently combined and/or omitted, and this left 34 substantiated “health needs”.
28
Enabling effective management efforts to address substantiated health needs
While the data quality assessment and substantiation processes identified above were
successful in narrowing the number of health need indicators identified for Portage
County significantly, 46 health need indicators still seemed like a large number to
understand and address by multiple stakeholders. For this reason, at its last meeting,
the CHA Partnership chose to condense the 46 specific needs identified into 9 areas
of health need that shared common characteristics and/or were likely to be positively
impacted by the same or similar intervention strategies. It is these 9 areas of need
that are used to organize the discussion of health needs in the Findings section of
this report.
While the CHA Partnership believes that its efforts to address significant challenges
associated with assessing health needs in Portage County have resulted in the
identification of multiple areas of legitimate health need in Portage County, its
members also acknowledge that the processes, methods, and data used in this
assessment do have limitations. These limitations include reliance on secondary data
to supplement primary data collected through focus groups, key informant
interviews, and agency data. In some cases this secondary data may be older than
would be optimal to measure time sensitive issues such as, health insurance coverage
and unemployment. Another limitation is the geographic scope of the secondary
data. While the secondary data sources used in this assessment are routinely used by
health departments and researchers to do assessment work and other research
activities, collecting additional primary data specific to Portage County and its
subdivisions may be helpful in future health assessment activities. As noted above, a
goal of the assessment process is to identify data collection needs for future CHA
processes, and the Partnership believes that efforts to further substantiate and
measure progress in addressing the health needs identified in this assessment are
appropriate.
Establishing Findings and Writing the Report
At its last meeting in October 2014, the CHA Partnership defined the areas of health
need that had grown out of its work, discussed additional recommendations that it
would like to make, and authorized the staff of the Center for Public Policy and
Health at KSU to draft the report for its review prior to the public input process. In
the Findings section, the report summarizes the areas of health need that CHA
Partnership has identified, and discusses demographic characteristics of Portage
County and their implications for specific sub-populations in the county. It also offers
29
recommendations for consideration by future health leaders in Portage County, and
suggests ideas that might be considered through the CHIP process that is likely to
follow. After review by the CHA Partnership and its various members, changes in this
draft report were made as appropriate in response to that review and this final draft
report was prepared.
Collecting Public Input on the CHA and Finalizing the Report
A key aspect of the CHA process is to share its findings with the general citizenry to
collect additional input and to facilitate discussion about community health needs.
To address this aspect of the CHA process, members of the Partnership will conduct a
public briefing for each of the Boards of Health in the county (Ravenna, Kent, and
Portage County), and they will also seek feedback from the Task Force for Improving
Public Health in Portage County. In addition, it is envisioned that this report will be
posted publicly on the websites of the PCHD, the KHD, and the Kent State University
College of Public Health as a means to invite comments from the public. Feedback
received from these efforts will then be considered and addressed as appropriate in
the final version of the report.
Source: Sunbeau Valley Farm
-Ravenna Balloon A-Fair ( Ravenna, Ohio)
Source: Kent State University School of Music
-Kent Marching Band ( Kent, Ohio)
30
FINDINGS
The findings presented in this section address demographic information, health
needs substantiated through the CHA processes described above, and social
determinants of health in Portage County and the health disparities associated with
them. After presenting findings in these areas, we also offer ideas growing from the
CHA Partnership’s work about future data collection efforts, as well as input that the
CHA Partnership would like to provide for consideration through the CHIP process.
These findings and ideas for further consideration seek to enable those working to
foster population health in Portage County to build common understandings that will
help them coordinate and focus their work to the benefit of the county’s citizens.
They also provide a useful starting point for a Community Health Improvement
Planning (CHIP) process that holds the potential to enable coordinated management
and intervention strategies to address health needs over time.
Demographic Information on Portage County
The demographic data and information presented below come from two main
sources: the 2010 Census and the 2008-2012 American Community Survey. For more
detailed information on the particular source for data presented below please see
Appendix V.
Portage County is comprised of multiple communities and jurisdictions. The county
as a whole has a population of 161,419 people as of 2010. Below we provide an
overview of key data that characterize Portage County’s population as a whole, as
well as the populations of the City of Kent and the City of Ravenna. A more complete
summary of demographic information for other geographic areas throughout
Portage County, organized by community/geographic cluster, is presented in
Appendix V.
The City of Kent has a population of 28,904, as of 2010, and over 27, 500 graduate
and undergraduate students attend school at the Kent State University campus (Kent
State, 2014). The City of Ravenna is the county seat of Portage County, and it has a
population of 11,724, as of 2010. Figure 4 below compares the demographic
information for Portage County as a whole, the City of Kent, and the City of Ravenna.
31
Household Characteristics
In Portage County, there are 62,222 households. Almost 17% (10,288) of these
households are in the City of Kent, whereas the City of Ravenna has around 8%
(5,055) of these households. The County as a whole has 31,165 households with a
husband and wife, 2,830 with a male-householder, 6,762 with a female householder,
15,803 nonfamily households with a householder living alone, and 5,662 nonfamily
households with a householder not living alone (Census, 2010). Of the City of Kent’s
10,288 households, 2,827 are family households with a husband and wife, 392 with a
male-householder, and 1,282 with a female householder, and the remaining
households are non-family households. Of the City of Ravenna’s 5,055 households,
1,858 are family households with a husband and wife, 256 with a male-householder,
and 746 with female householder, and the remaining households are non-family
households.
Housing Units
The majority of Portage County’s housing units are owner occupied, while a smaller
percentage is renter occupied, and about 8% of the units are vacant. The City of Kent
has a majority of its units serving as renter occupied units. About 8% of the housing
units in Kent are vacant. The City of Ravenna has 5,566 housing units that are almost
split evening between owner-occupied and renter-occupied units. About 9% of the
units are vacant in Ravenna. Kent has more renter occupied units than any other
cluster in the county, due in large part to the presence of Kent State University.
Income and Poverty
The median household income of Portage County is $52,337, while the median
income for the City of Kent and City of Ravenna are $28,623 and $35,980,
respectively. The federal government has established $11,670 as the current poverty
line (for a household of one individual). About 15% of the county’s population is
living below the poverty line, while 33% of the City of Kent’s and 23% of City of
Ravenna’s population is living in poverty. Portage County has 19% of county
residents under the age of 18 living below the poverty line. In the City of Kent, 32% of
residents 18 and under are living below the poverty line. And, in the City of Ravenna,
39% of residents 18 and under are living below the poverty line.
32
Racial and Ethnic Composition
Portage County has the following racial and ethnic breakdown: 92% is White, 4% is
Black or African American, 2% is Asian, and 1 % is Hispanic. About 1% of the
population identified themselves as “other”. Kent’s racial composition is: 83% White,
10% Black or African American, 4% Asian, 2% Hispanic and 1% identified with another
race. Ravenna’s racial composition is: 90% White, 5.6% Black or African American,
0.5% Asian, 1.5% Hispanic and 3% identified with another race.
Age
About 21% of Portage County’s population is under the age of 18 and 12.9% of the
population is over the age of 65. In Kent, 14% of the population is under the age of
18 and 7% of the population is over the age of 65. In Ravenna, 22.5% of the
population is under the age of 18 and 15% of the population is over the age of 65.
Portage County has 16% of its population between the ages of 5 and 17 years of age.
In Kent, 10% of the population is within the same age group, whereas 16% of
Ravenna’s population is within this age group. The 18 to 24 years age group makes
up 15.6% of the county’s population as a whole, and 44% and 9.5% of Kent and
Ravenna’s populations, respectively. The 25 to 44 years age group makes up 23% of
the county’s population, 19% of Kent’s population, and 26.6% of Ravenna’s
population. The 45 to 65 age group makes up 27.5% of the county’s population,
15.5% of Kent’s population, and 26.5% of Ravenna’s population. Finally, 13% of the
county’s population is over 65, while 8% of Kent’s population is above 65 years old.
In Ravenna, 15% of the population is in this older age group.
Employment
Information on employment and unemployment, as well as unemployment rates, for
Portage County, the City of Kent, and City of Ravenna are available for 2012 from the
American Community Survey. There were 79,975 members of the Portage County
population who were employed and there were 9,624 members of the Portage
County population who were unemployed at that time. There were 14,910 members
of the City of Kent’s population, age 16 and older, who were employed and 2,265
members of the City of Kent’s population, age 16 and older, who were unemployed.
There were 5,286 members of the City of Ravenna’s population, age 16 and older,
who were employed and 999 members of the City of Ravenna’s population age 16
and older, were unemployed. Overall, Portage County had an unemployment rate of
33
11%, while the unemployment rate in the City of Kent and City of Ravenna were 13%
and 16% respectively.
Education
In Portage County, 9.65% of the population (above the age of 25) is without a High
School Diploma, 38.39% have completed High School only, and 15.7% possess a
Bachelor’s Degree. Almost 9% of the county’s population has completed a
professional or graduate degree. In Kent, 9% of the population (above the age of 25)
is without a High School Diploma, 23% have completed High School only, and 46%
possess an Associate’s degree or higher. In Kent, 91% of persons completed high
school or higher and 40% completed a bachelor’s or higher. In Ravenna, 17.6% of the
population (above the age of 25) is without a High School Diploma, 42% have
completed High School only, and around 7% possess an Associate’s degree. In
Ravenna, 82% of persons have completed High School or higher and around 13%
have completed a bachelor’s or higher.
Healthcare Access
In Portage County, according to 2012 figures, about 11% of the population did not
have health insurance coverage. By contrast, 75% had Private Health Insurance
Coverage and 26% had Public Health Insurance Coverage (Medicare, Medicaid, and
Veterans Affairs Coverage).5 In Kent, 74.5% of had Private Health Insurance Coverage
and 22% had Public Health Insurance Coverage. Roughly 12% had no Health
Insurance Coverage. In Ravenna, according to these 2012 figures, 58% had Private
Health Insurance Coverage and around 40% had Public Health Insurance Coverage.
Roughly 13% had no Health Insurance Coverage.
It is likely that the recent efforts to implement the Affordable Care Act are now
affecting these figures as the data resulting in the figures above were collected from
2008-2012. Future health assessment rounds may be able to better understand how
the new law affects insurance coverage in the Portage County.
5Public and Private health insurance coverage are not mutually exclusive. People can have more than one type of coverage at the same time (ACS, 2012). The result is the percent of people covered under private and public insurance, and the percent of uninsured residents adds to more than 100% for not only Portage County, but the cities of Kent and Ravenna as well.
34
Immigration
Immigrants make up 2.8% of the total Portage County population. They represent
more than 5% of the City of Kent’s population and only 1.2% of City of Ravenna’s
population.
Population with Disabilities
In Portage County, about 12% of residents (Civilian Non-Institutionalized Population
(CNP)) have a disability. For those over 65 in Portage County, about 34% have a
disability. In the City of Kent, 9.2% of the population (CNP) has a disability, and
about 38% of Kent residents over the age of 65 have a disability. In the City of
Ravenna, 20.7% of the population (CNP) has a disability and about 44% of Ravenna’s
residents over the age of 65 have a disability.
Commute to Work
On average, Portage County residents spend 25.1 minutes traveling to work (ACS,
2013). For Kent and Ravenna residents, the average travel times to work are 21.1 and
22.8 minutes, respectively (ACS, 2012).
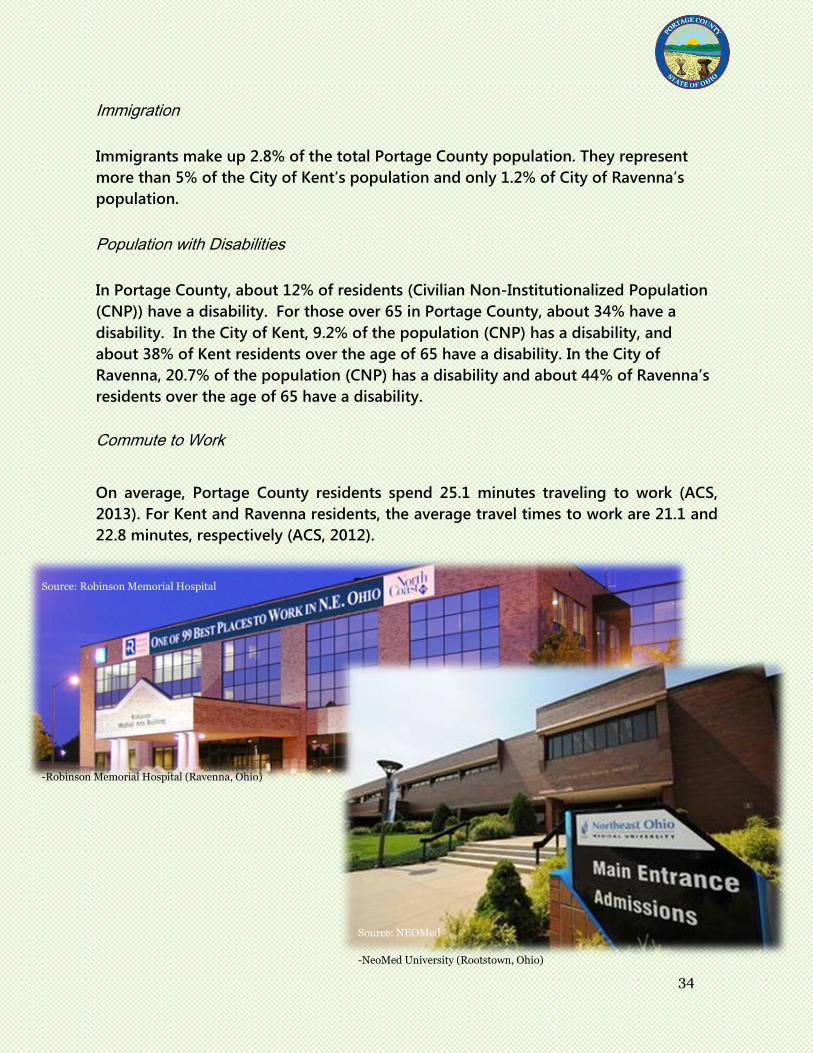
Source: Robinson Memorial Hospital
-Robinson Memorial Hospital (Ravenna, Ohio)
Source: NEOMed
-NeoMed University (Rootstown, Ohio)
35
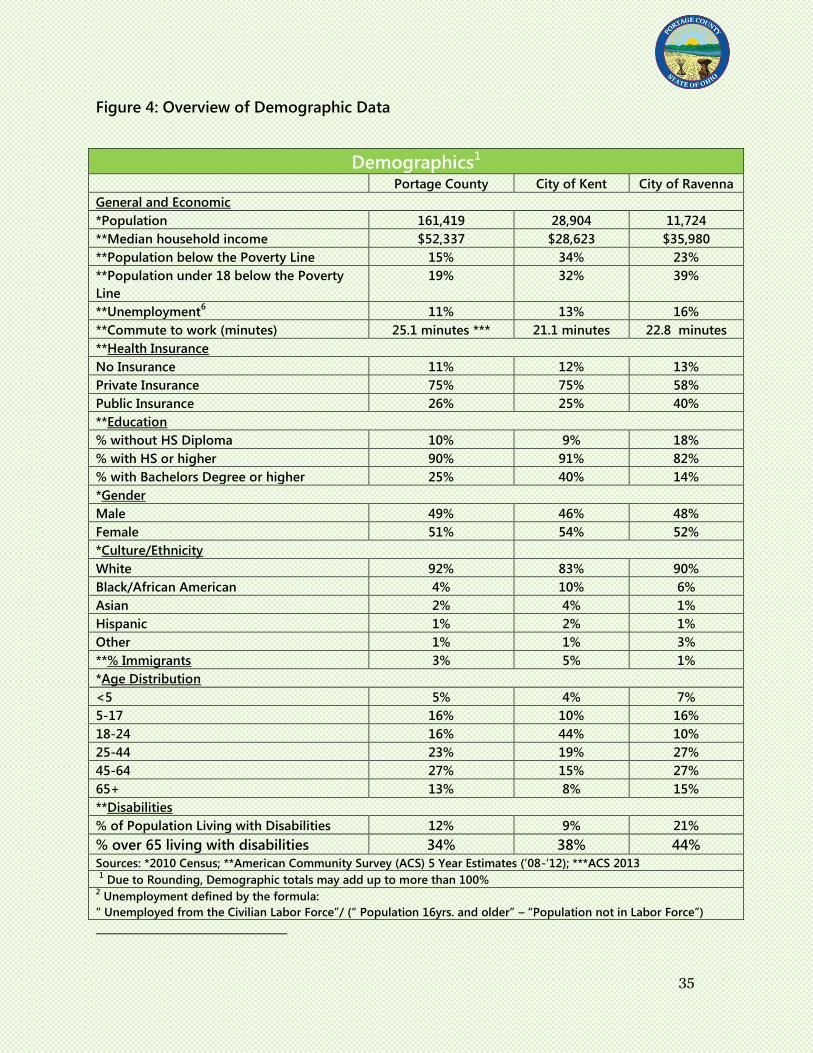
Figure 4: Overview of Demographic Data
Demographics1 Portage County City of Kent City of Ravenna
General and Economic
*Population 161,419 28,904 11,724
**Median household income $52,337 $28,623 $35,980
**Population below the Poverty Line 15% 34% 23%
**Population under 18 below the Poverty
Line
19% 32% 39%
**Unemployment6 11% 13% 16%
**Commute to work (minutes) 25.1 minutes *** 21.1 minutes 22.8 minutes
**Health Insurance
No Insurance 11% 12% 13%
Private Insurance 75% 75% 58%
Public Insurance 26% 25% 40%
**Education
% without HS Diploma 10% 9% 18%
% with HS or higher 90% 91% 82%
% with Bachelors Degree or higher 25% 40% 14%
*Gender
Male 49% 46% 48%
Female 51% 54% 52%
*Culture/Ethnicity
White 92% 83% 90%
Black/African American 4% 10% 6%
Asian 2% 4% 1%
Hispanic 1% 2% 1%
Other 1% 1% 3%
**% Immigrants 3% 5% 1%
*Age Distribution
<5 5% 4% 7%
5-17 16% 10% 16%
18-24 16% 44% 10%
25-44 23% 19% 27%
45-64 27% 15% 27%
65+ 13% 8% 15%
**Disabilities
% of Population Living with Disabilities 12% 9% 21%
% over 65 living with disabilities 34% 38% 44%
Sources: *2010 Census; **American Community Survey (ACS) 5 Year Estimates (’08-’12); ***ACS 2013
1 Due to Rounding, Demographic totals may add up to more than 100%
2 Unemployment defined by the formula:
“ Unemployed from the Civilian Labor Force”/ (“ Population 16yrs. and older” – “Population not in Labor Force”)
Areas of Public Health Need
The CHA Partnership substantiated 46 specific health needs during the course of its
work in the latter half of 2014. It also found that indicators of these health needs –
when combined – contribute to needs in 9 broad areas of public health. In this
section, we review our findings in these 9 areas of public health need, and the 46
specific health need indicators that comprise them. The broad areas of health need
identified are: 1) Mental Health and Addiction; 2) Access to Care; 3) Chronic Disease;
4) Prevention and Wellness; 5) Maternal and Child Health; 6) Communicable Disease;
7) Oral Health; 8) Senior Health, and; 9) Cancer.
For each of these areas of need, we provide a description of its scope, a list of the
substantiated health needs/indicators comprising it, and a brief summary of evidence
supporting those needs. Furthermore, to provide a sense of the level of confidence
that readers may have in the individual health needs indicators presented, we
delineate the needs within each area that are “data-supported” based on the criteria
developed by the CHA Partnership’s Data Quality Subcommittee and adopted by the
CHA Partnership. This allows readers to determine if the health needs indicator was
substantiated primarily by evaluated data or through expertise of CHA Partnership
members with supplementary evidence. And finally, potential community assets in
Portage County that are available to help address each Area of Need are also
provided.
The areas of need have been arranged so that the areas that have the highest number
of substantiated health needs indicators within them are listed first and the Areas of
Need with fewer health needs are listed later. This does not necessarily reflect the
importance of the need; rather, it reflects the extent to which past needs assessments
and CHA Partnership members have identified differing points of concern that enable
them to substantiate needs in these broad areas.
Mental Health and Addiction
Mental Health refers to the successful performance of mental and cognitive function.
This can include biological performance function as well as other productive
functions like forming positive relationships, the ability to adapt and cope, and other
essential social functions. Addiction is associated with the abuse of substances that
alter the mind and/or body. Such substances can lead to, or exponentially increase,
mental health issues among those directly using or present with those addicted.
37
The specific health needs substantiated in this Area of Health Need include:
Data-Supported Health Needs
Suicide
Suicide was identified by Portage County’s Rate of Suicide Mortality,
which was 10.7 persons per 100,000 (Summa, 2013). Evidence was also
provided MHRB’s assessment, Townhall II, the National Vital Statistics
System and by Coleman Professional Services.
Tobacco Use
The Percent of People Smoking Cigarettes in Portage County is 28%.
Evidence provided by the BRFSS (James et al, 2014).
AxessPointe Medical Center data shows 1920 tobacco related cases from
January 2013 through May 2014.
Perceived Health Needs
Child Abuse and Neglect
Within Portage County, Child Abuse and Neglect was identified by the
rate of children placed in foster care by a public agency (582 per
100,000) and rate of substantiated reports of child abuse and neglect
(1,155 per 100,000). Data were provided by the Children's Defense Fund.
(Summa, 2013)
Drug Use
Evidence was provided by AxessPointe Health Center, where data show
155 Alcohol and Drug related cases from January 2013 to May 2014. In
addition, the Portage County Mental Health and Recovery Board
Assessment, the annual report from the Ohio Substance Abuse
Monitoring Network Family, Community Services Program Managers
and Directors, and Townhall II also concurred that drug use is an area of
health need in Portage County.
Mental Health and Drug Court Specialty Dockets
There is a need to process mental health and drug related cases outside
of the criminal justice system (PCMHRB, 2013)
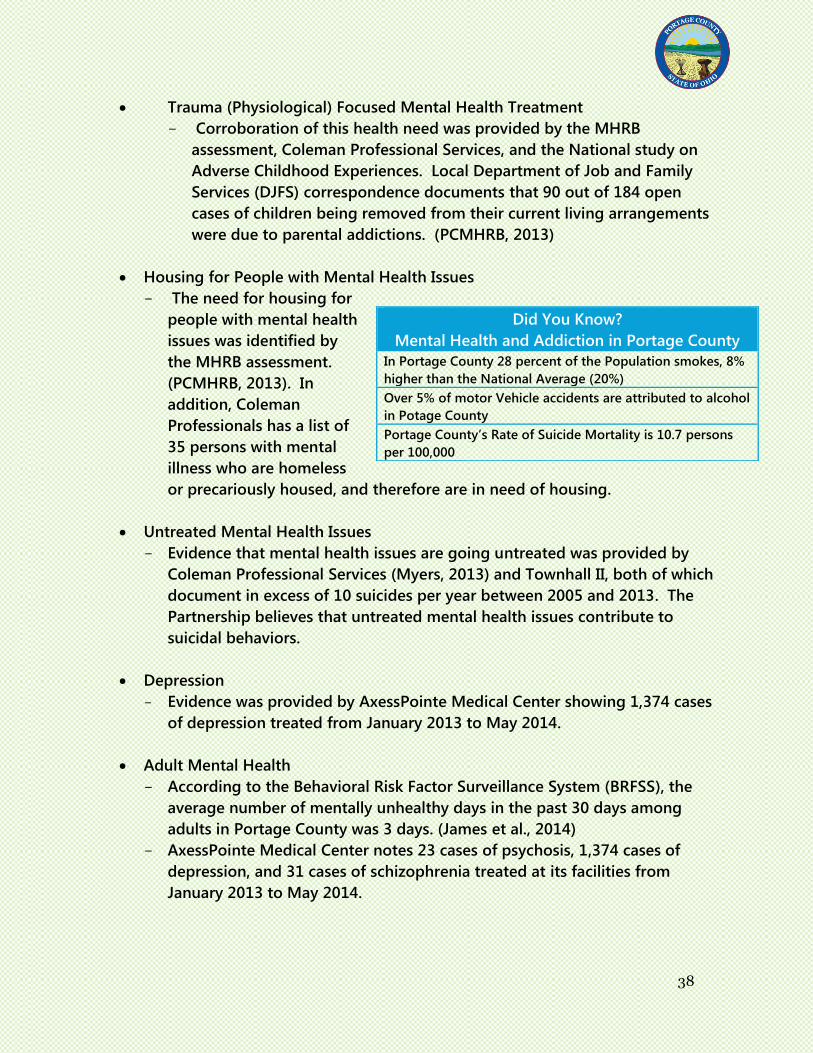
38
Trauma (Physiological) Focused Mental Health Treatment
Corroboration of this health need was provided by the MHRB
assessment, Coleman Professional Services, and the National study on
Adverse Childhood Experiences. Local Department of Job and Family
Services (DJFS) correspondence documents that 90 out of 184 open
cases of children being removed from their current living arrangements
were due to parental addictions. (PCMHRB, 2013)
Housing for People with Mental Health Issues
The need for housing for
people with mental health
issues was identified by
the MHRB assessment.
(PCMHRB, 2013). In
addition, Coleman
Professionals has a list of
35 persons with mental
illness who are homeless
or precariously housed, and therefore are in need of housing.
Untreated Mental Health Issues
Evidence that mental health issues are going untreated was provided by
Coleman Professional Services (Myers, 2013) and Townhall II, both of which
document in excess of 10 suicides per year between 2005 and 2013. The
Partnership believes that untreated mental health issues contribute to
suicidal behaviors.
Depression
Evidence was provided by AxessPointe Medical Center showing 1,374 cases
of depression treated from January 2013 to May 2014.
Adult Mental Health
According to the Behavioral Risk Factor Surveillance System (BRFSS), the
average number of mentally unhealthy days in the past 30 days among
adults in Portage County was 3 days. (James et al., 2014)
AxessPointe Medical Center notes 23 cases of psychosis, 1,374 cases of
depression, and 31 cases of schizophrenia treated at its facilities from
January 2013 to May 2014.
Did You Know?
Mental Health and Addiction in Portage County
In Portage County 28 percent of the Population smokes, 8%
higher than the National Average (20%)
Over 5% of motor Vehicle accidents are attributed to alcohol
in Potage County
Portage County’s Rate of Suicide Mortality is 10.7 persons
per 100,000

39
Alcohol Use
Within Portage County, alcohol use issues are evidenced by: 1) percent of
adults who are binge or heavy drinkers (14%); 2) percent of motor vehicle
accidents due to alcohol (5.2%), and; 3) a prevalence of beer, wine, and
liquor stores (7.4 per 100,000 persons). These data were provided by the
Ohio Department of Public Safety and the U.S. Census. (Summa, 2013)
Child Mental Health
- Within Portage County, Child Mental Health needs were identified by: 1)
percent of children with any kind of emotional, developmental, or
behavioral problem for which they needed treatment or counseling (11%);
2) percent of children with any kind of emotional, developmental, or
behavioral problem that lasted or is expected to last 12 months or longer
(59%) and; 3) rate of hospital discharge for child mental health issues
(253.58 per 100,000 children). Support provided by the Ohio Medicaid
Assessment Survey (OMAS). (Summa, 2013)
Coordination among Mental Health/Clinical Providers and Referral to other
Specialized Services
This need was corroborated by the MHRB Assessment (PCMHRB, 2013)
and was ranked highly among CHA Partnership members in their informal
survey (see Appendix VII).
Drug Overdoses
This health need was
corroborated by multiple
sources, including Townhall II
and the MHRB. According to
the MHRB and Townhall II, the
Portage County Coroner
reported 22 cases of fatal
overdose in 2013.
Assets for Mental Health and
Addiction in Portage County Mental Health and Addiction :
Coleman Professional Services
Mental Health and Recovery Board of
Portage County (funding and planning)
Town hall II
Children’s Advantage
Family and Community Services
Robinson Memorial Hospital
AxessPointe Community Health Center
PCHD/KCHD
Kent State University Health Services
40
Access to Care
Access to Care is a broad term used to describe the availability, acceptability,
affordability, and accessibility of health care systems and providers. Among both
adults and children, access to care includes the availability of immunizations, as well
as screenings and clinician visits necessary to reduce the risk for disease and to
promote the good health among the population.
The specific health needs indicators substantiated in this Area of Health Need include:
Data-Supported Health Needs
Access to Prenatal Care
Within Portage County, 31.52% of births are paid for by Medicaid. Also,
22.25% of pregnant women are not receiving 1st trimester care. Such
indicators help to identify prenatal care as a need. Evidence is based on
birth certificate data. (Maternal and Child Health Consortium, 2013)
Access to Health Insurance (Adults)7
Within Portage County, 13% of adults 18-64 years of age are without
health insurance (Summa, 2013), and 12.31% of adults 18 years of age
and older are without health insurance within Portage County (Maternal
and Child Health Consortium, 2013). These data were provided by the
U.S. Census. (Maternal and Child Health Consortium, 2013)
Access to Health Insurance (Children)8
Within Portage County, 4.4% of children 17 years of age and younger
are without health insurance. Another assessment indicates 5.1% of
Children 1-17 years of age are without health insurance. This evidence is
provided by birth certificate and Portage county WIC data. (Summa,
2013)
7During the data-review process, Partnership Members expressed concern that the results for this indicator did not account for currently expanding coverage due to Affordable Care Act (ACA) implementation (via Medicaid, etc.), as this may change this situation in significant ways. Additional information on this Area of Need may need to be collected before major actions to address it are developed. 9 The concerns noted in the footnote above relating to insurance coverage for adults also apply to children.
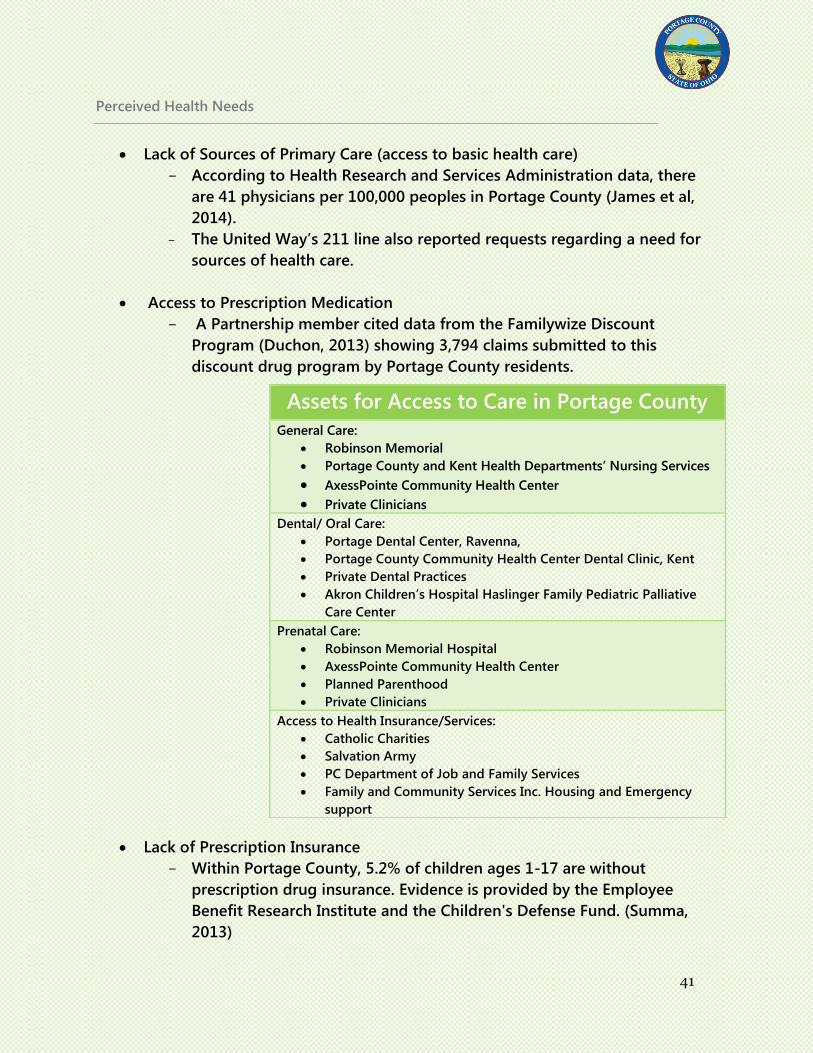
41
Perceived Health Needs
Lack of Sources of Primary Care (access to basic health care)
According to Health Research and Services Administration data, there
are 41 physicians per 100,000 peoples in Portage County (James et al,
2014).
The United Way’s 211 line also reported requests regarding a need for
sources of health care.
Access to Prescription Medication
A Partnership member cited data from the Familywize Discount
Program (Duchon, 2013) showing 3,794 claims submitted to this
discount drug program by Portage County residents.
Lack of Prescription Insurance
Within Portage County, 5.2% of children ages 1-17 are without
prescription drug insurance. Evidence is provided by the Employee
Benefit Research Institute and the Children's Defense Fund. (Summa,
2013)
Assets for Access to Care in Portage County
General Care:
Robinson Memorial
Portage County and Kent Health Departments’ Nursing Services
AxessPointe Community Health Center
Private Clinicians
Dental/ Oral Care:
Portage Dental Center, Ravenna,
Portage County Community Health Center Dental Clinic, Kent
Private Dental Practices
Akron Children’s Hospital Haslinger Family Pediatric Palliative
Care Center
Prenatal Care:
Robinson Memorial Hospital
AxessPointe Community Health Center
Planned Parenthood
Private Clinicians
Access to Health Insurance/Services:
Catholic Charities
Salvation Army
PC Department of Job and Family Services
Family and Community Services Inc. Housing and Emergency
support
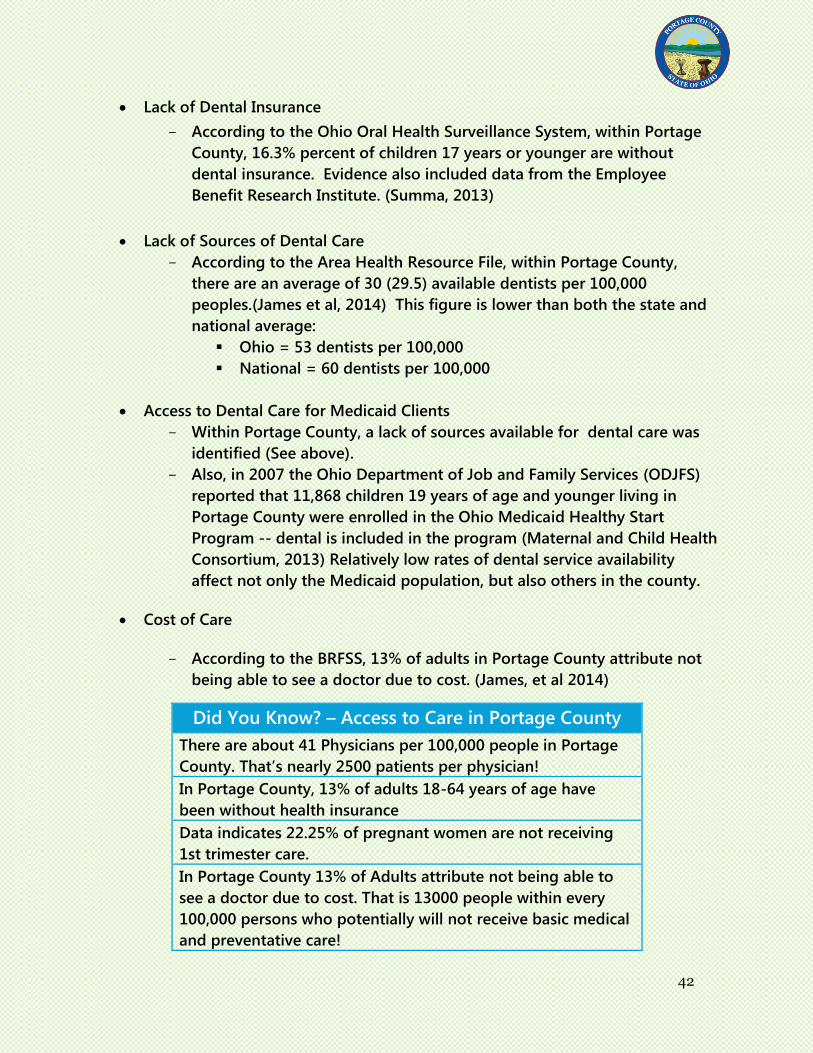
42
Lack of Dental Insurance
According to the Ohio Oral Health Surveillance System, within Portage
County, 16.3% percent of children 17 years or younger are without
dental insurance. Evidence also included data from the Employee
Benefit Research Institute. (Summa, 2013)
Lack of Sources of Dental Care
According to the Area Health Resource File, within Portage County,
there are an average of 30 (29.5) available dentists per 100,000
peoples.(James et al, 2014) This figure is lower than both the state and
national average:
Ohio = 53 dentists per 100,000
National = 60 dentists per 100,000
Access to Dental Care for Medicaid Clients
Within Portage County, a lack of sources available for dental care was
identified (See above).
Also, in 2007 the Ohio Department of Job and Family Services (ODJFS)
reported that 11,868 children 19 years of age and younger living in
Portage County were enrolled in the Ohio Medicaid Healthy Start
Program -- dental is included in the program (Maternal and Child Health
Consortium, 2013) Relatively low rates of dental service availability
affect not only the Medicaid population, but also others in the county.
Cost of Care
According to the BRFSS, 13% of adults in Portage County attribute not
being able to see a doctor due to cost. (James, et al 2014)
Did You Know? – Access to Care in Portage County
There are about 41 Physicians per 100,000 people in Portage
County. That’s nearly 2500 patients per physician!
In Portage County, 13% of adults 18-64 years of age have
been without health insurance
Data indicates 22.25% of pregnant women are not receiving
1st trimester care.
In Portage County 13% of Adults attribute not being able to
see a doctor due to cost. That is 13000 people within every
100,000 persons who potentially will not receive basic medical
and preventative care!
43
Chronic Disease
Chronic Disease pertains to any disease that affects a person for extended periods of
time. Such diseases are often manageable with consistent provider visits for
monitoring and treatment. The health needs in this area include the prevention of
specific chronic diseases and the reduction of chronic disease risk.
The specific health needs indicators substantiated in this Area of Need include:
Data-Supported Health Needs
Prevention of Stroke
Portage County’s overall Stroke Mortality Rate indicates 34.8 deaths
per 100,000 people according to the National Vital Statistics System
(NVSS). (James et al, 2014)
Prevention of Heart Disease
Portage County’s overall Coronary Heart Disease Mortality Rate
indicates 166.1 deaths per 100,000 people, almost 30 deaths per
100,000 higher than the national average. Evidence provided by
National Vital Statistics System (NVSS). (Summa, 2013)
Prevention of Complications with Childhood Asthma
Portage County’s overall rate of emergency department visits for
childhood asthma was 1005.1, visits per 100,000 children. Its rate of
hospital discharge for child asthma was 100.82 per 100,000 children.
The Ohio Hospital Association provided evidence for both indicators.
(Summa, 2013)
Perceived Health Needs
Prevention of Adult Diabetes
Within Portage County 4.6% of adults have diabetes according to
BRFSS data. (Summa, 2013)
AxessPointe Medical Center reports 517 cases of diabetes between
January 2013 and May 2014.
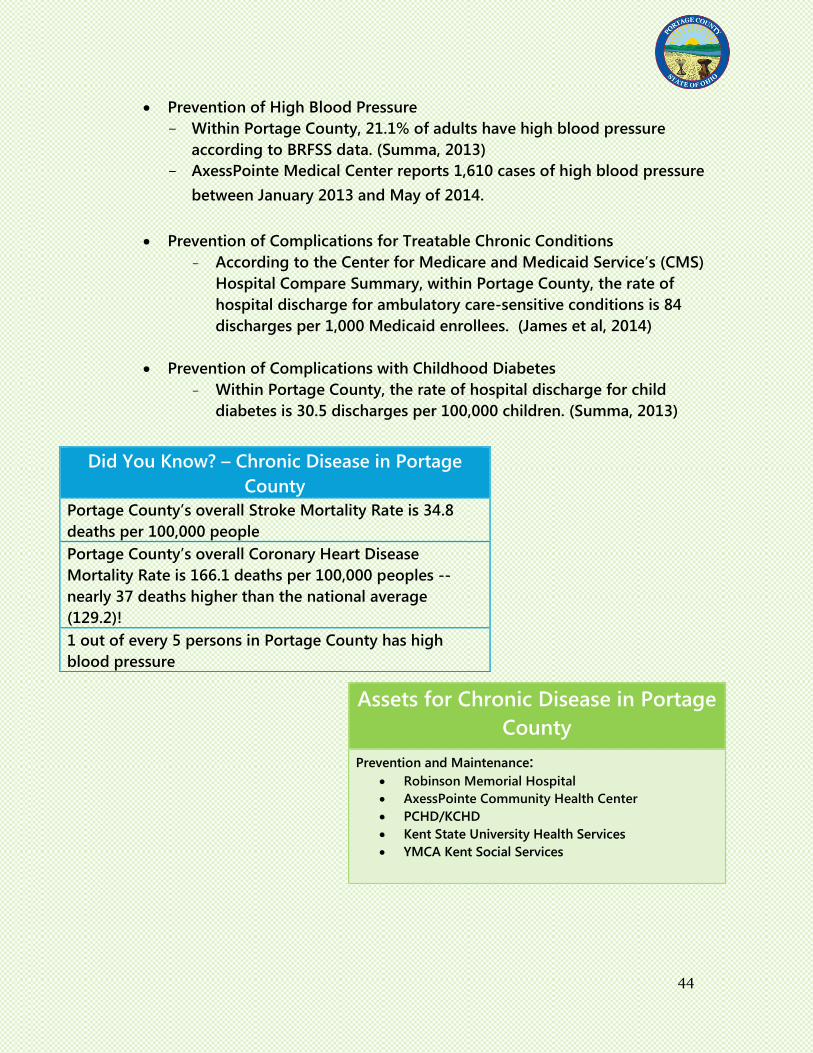
44
Prevention of High Blood Pressure
Within Portage County, 21.1% of adults have high blood pressure
according to BRFSS data. (Summa, 2013)
AxessPointe Medical Center reports 1,610 cases of high blood pressure
between January 2013 and May of 2014.
Prevention of Complications for Treatable Chronic Conditions
According to the Center for Medicare and Medicaid Service’s (CMS)
Hospital Compare Summary, within Portage County, the rate of
hospital discharge for ambulatory care-sensitive conditions is 84
discharges per 1,000 Medicaid enrollees. (James et al, 2014)
Prevention of Complications with Childhood Diabetes
Within Portage County, the rate of hospital discharge for child
diabetes is 30.5 discharges per 100,000 children. (Summa, 2013)
Did You Know? – Chronic Disease in Portage
County
Portage County’s overall Stroke Mortality Rate is 34.8
deaths per 100,000 people
Portage County’s overall Coronary Heart Disease
Mortality Rate is 166.1 deaths per 100,000 peoples --
nearly 37 deaths higher than the national average
(129.2)!
1 out of every 5 persons in Portage County has high
blood pressure
Assets for Chronic Disease in Portage
County
Prevention and Maintenance: Robinson Memorial Hospital
AxessPointe Community Health Center
PCHD/KCHD
Kent State University Health Services
YMCA Kent Social Services
45
Prevention and Wellness
Prevention and wellness can be described as anything that is done to prevent the loss
of health while maintaining a high standard of living. Such activities include being
active, regular exercise, and getting the proper nutrition in one’s diet. Prevention and
wellness needs are crucial for obtaining a healthy lifestyle and can lead to health
benefits for those with chronic diseases, as well as enhanced quality of life.
The specific health needs indicators substantiated in this Area of Health Need include:
Perceived Health Needs
Physical Inactivity in Children
In Portage County, 24% percent of children exercised, played a sport, or
participated in physical activity every day of the past week for at least 20
minutes and 58% of children had 2 hours or less of screen time on an
average weekday, according to the Ohio Medicaid Assessment Survey
(OMAS). (Summa, 2013)
Physical Inactivity in Adults
Within Portage County, 29% of the adult population (>18) are
considered physically inactive according to BRFSS survey data. (James
et al, 2014)
Did You Know? – Prevention and Wellness in Portage County
Data suggests that about 75 percent of children in Portage County did not
participate in physical activity for at least 20 minutes a day in the past
week.
In Portage County, nearly 39 percent of adults are considered overweight,
and almost 22% are considered obese. That’s over half the Population
with a BMI of 25 or greater!
8.6 percent of people in Portage Country live in a food Desert; the CDC
states a food desert as “Areas that lack access to affordable fruits,
vegetables, whole grains, and other foods that make up the full range of a
healthy diet.”
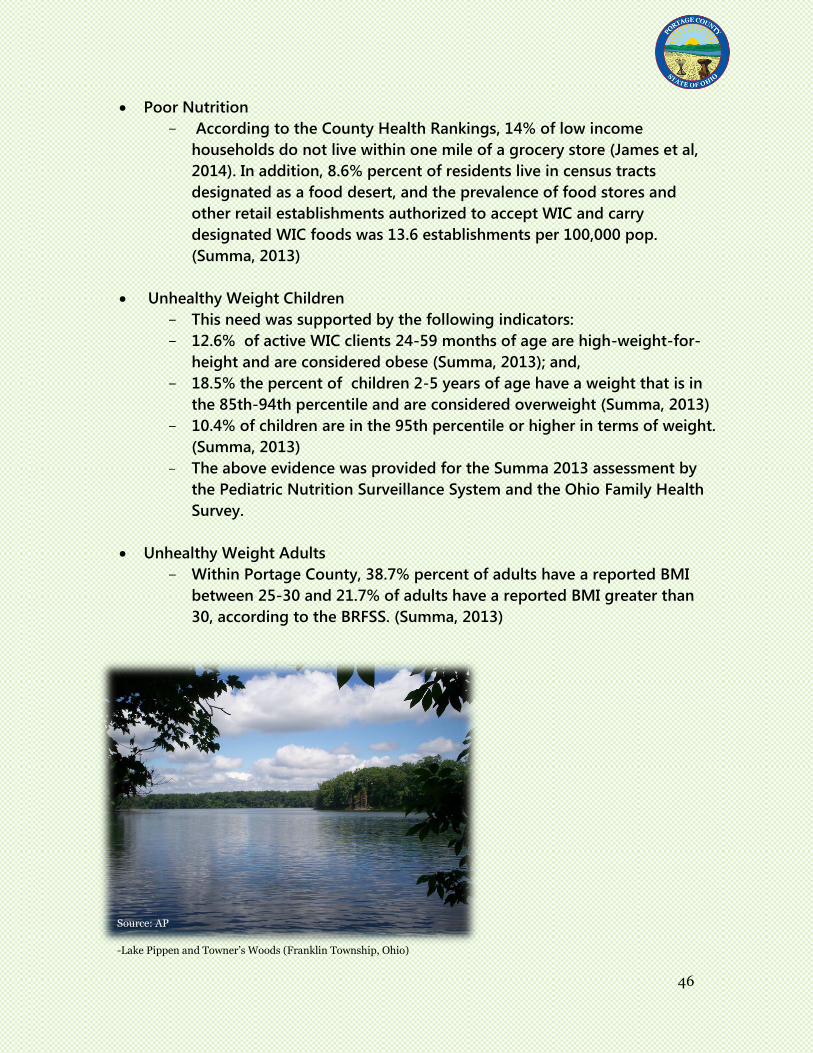
46
Poor Nutrition
According to the County Health Rankings, 14% of low income
households do not live within one mile of a grocery store (James et al,
2014). In addition, 8.6% percent of residents live in census tracts
designated as a food desert, and the prevalence of food stores and
other retail establishments authorized to accept WIC and carry
designated WIC foods was 13.6 establishments per 100,000 pop.
(Summa, 2013)
Unhealthy Weight Children
This need was supported by the following indicators:
12.6% of active WIC clients 24-59 months of age are high-weight-for-
height and are considered obese (Summa, 2013); and,
18.5% the percent of children 2-5 years of age have a weight that is in
the 85th-94th percentile and are considered overweight (Summa, 2013)
10.4% of children are in the 95th percentile or higher in terms of weight.
(Summa, 2013)
The above evidence was provided for the Summa 2013 assessment by
the Pediatric Nutrition Surveillance System and the Ohio Family Health
Survey.
Unhealthy Weight Adults
Within Portage County, 38.7% percent of adults have a reported BMI
between 25-30 and 21.7% of adults have a reported BMI greater than
30, according to the BRFSS. (Summa, 2013)
Source: AP
-Lake Pippen and Towner’s Woods (Franklin Township, Ohio)
47
Maternal and Child Health
Maternal and child health describes a broad category of factors that affect
pregnancy, childbirth, and child health. Health needs can also include post-natal
factors, and even early motherhood and childhood factors.
The specific health needs indicators substantiated in this Area of Health Need include:
Data-Supported Health Needs
Preterm Births
Portage County’s rate of births that are preterm, with less than 37 weeks
gestation, was 11.84%. Also the rate of births that are considered very
preterm, less than 32 weeks gestation, was 1.8%. This evidence was
drawn from birth certificate data. (Maternal and Child Health
Consortium, 2013)
Assets for Prevention/Wellness in Portage County Unhealthy Weight:
Robinson Memorial Hospital
AxessPointe Community Health Center
Portage County Obesity Prevention Plan Implementation
PCHD/KCHD
Kent State University
Physical Inactivity: YMCA
Kent State University’s Recreation Center
Kent department of Parks and Recreation
Portage Parks District
Ravenna Athletic Center
Poor Nutrition: Kent Social Services
Health Departments
Family and Community Services Inc. (Christian Cupboard)
Salvation Army
Community Action Council
48
Maternal Smoking
The maternal smoking rate was 21.83%, a figure that is based on birth
certificate data. (Maternal and Child Health Consortium, 2013)
Breastfeeding Rates
Portage County’s percent of infants who were not breastfeeding at
hospital discharge was 27.63%.
The percentage of active WIC clients, 12-59 months of age, who were
never breastfed was 47.92%.
The percentage of active WIC clients, 12-59 months of age, who were
not breastfeeding at 24 weeks of age was 87.58%).
The evidence above was based on birth certificate and WIC data.
(Maternal and Child Health Consortium, 2013)
Perceived Health Needs
Infant Mortality
Within Portage County, the rate of: 1) infant mortality in the first 12
months of life per 1,000 live births is 4.5; neonatal mortality in the first
28 days of life per 1,000 live births is 3, and; 3) post-neonatal mortality
between 29 days and the first year of life per 1,000 live births is 1.4
(Summa, 2013). The National Vital Statistics System (NVSS) provided
data for these indicators.
Assets for Maternal and Child Health in Portage
County Maternal and Child Health :
Robinson Memorial Hospital
AxessPointe Community Health Center
Health Departments
Kent State University Health Services
Planned Parenthood
Kent Social Services
Portage County Job and Family Services
Akron Children’s Hospital Haslinger Family Pediatric Palliative
49
Communicable Diseases
The term communicable disease refers to any disease capable of spreading via person
to person or animal to person contact. Such disease can be transferred in numerous
ways including by air, water, or bodily fluids. It is important to not only identify the
communicable diseases affecting the public, but to understand the means to prevent
them. In many cases, needs pertaining to communicable diseases like the flu, or
hepatitis relate to proper monitoring, awareness, and immunizations.
The specific health needs indicators substantiated in this Area of Health Need include:
Perceived Health Needs
Prevention of Hepatitis B
CDC data , specifically from the National Notifiable Diseases Surveillance
System and the Ohio Department of Health indicates there were 7
identified cases of Hepatitis B in Portage County in 2007 (James et al,
2014).
Immunization
Portage County Health Department has been assessing immunization
rates (coverage levels) since 2000. In 2000, the rate was 65% of children
in Portage County between 19-35 months of age meeting the
recommended coverage levels. In 2005, the rate increased to 67% of
children in the county 19-35 months met the coverage levels. In 2010,
the rate increased to 70% of children up to 24 months old. (Portage
County Health Department, 2014) The CDC target immunization rate is
90% for children 35 months of age. The Maternal and Child Health
Assessment (2013) shows that Portage County’s rates are favorable in
comparison to Ohio, but it still appears as though they are likely to be
lower than the CDC target.
Assets for Communicable Disease in Portage County Prevention and immunizations:
Robinson Memorial Hospital
AxessPointe Community Health Center
Health Departments
Kent State University Health Services
Free Medical Clinic of Greater Cleveland
Department of Veteran Affairs
50
Oral Health
Oral health includes the general oral health of both adult and child populations.
Factors present can include oral health education, prevention, and access to oral
health providers.
The specific health needs indicators substantiated in this Area of Health Need include:
Perceived Health Needs
Adult Oral Health
According to the BRFSS, within Portage County, 17.2% percent of adults
report having 6 or more teeth removed due to tooth decay, gum
disease, or infection. (Summa, 2013).
Childhood Oral Health
22.7% of 3rd grade students with untreated dental decay. This data was
drawn from the Ohio Oral Health Surveillance System data. (Summa,
2013).
Assets for Oral Health in Portage County Oral Health
Portage County Community Health Center Dental Clinic, Kent
AxessPointe Community Health Center
Private Dental Practices
Akron Children’s Hospital Haslinger Family Pediatric Palliative Care Center
Free Medical Clinic of Greater Cleveland
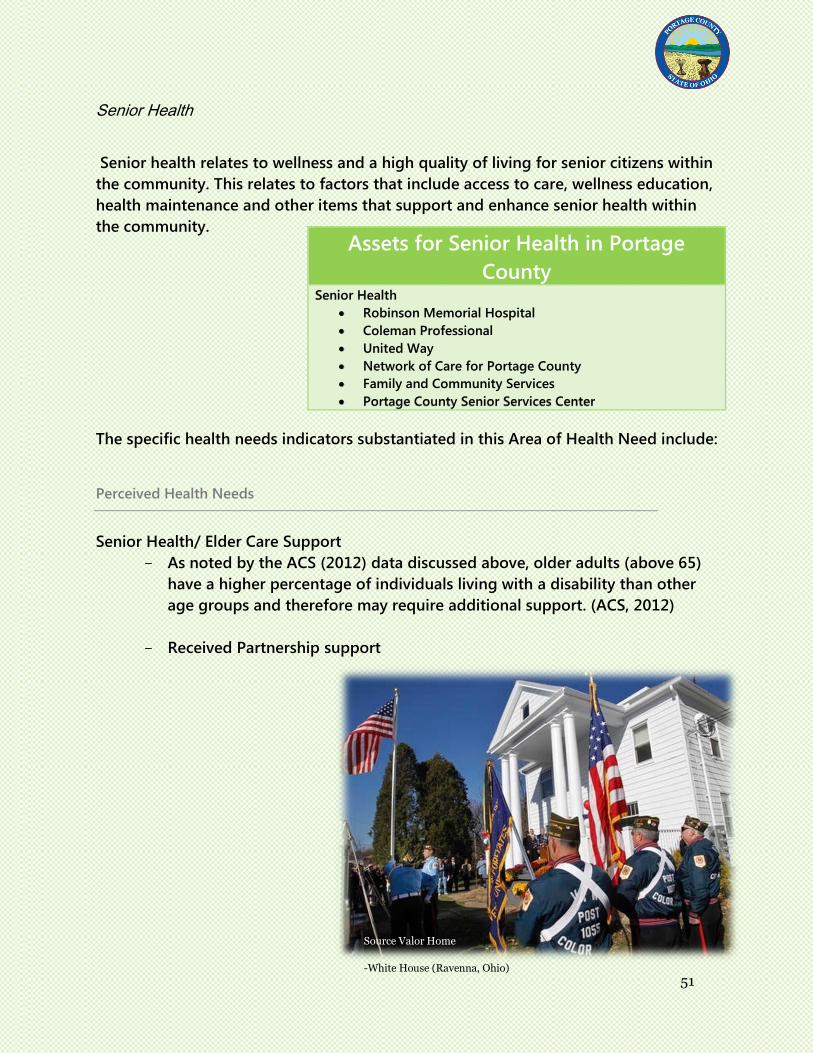
51
Senior Health
Senior health relates to wellness and a high quality of living for senior citizens within
the community. This relates to factors that include access to care, wellness education,
health maintenance and other items that support and enhance senior health within
the community.
The specific health needs indicators substantiated in this Area of Health Need include:
Perceived Health Needs
Senior Health/ Elder Care Support
As noted by the ACS (2012) data discussed above, older adults (above 65)
have a higher percentage of individuals living with a disability than other
age groups and therefore may require additional support. (ACS, 2012)
Received Partnership support
Assets for Senior Health in Portage
County Senior Health
Robinson Memorial Hospital
Coleman Professional
United Way
Network of Care for Portage County
Family and Community Services
Portage County Senior Services Center
Source Valor Home
-White House (Ravenna, Ohio)
52
Cancer
This category encompasses needs that relate to any type of cancer. While there are
numerous types of cancer, the needs identified include general prevention, early
diagnosis and treatment of cancer overall and specifically Breast, Lung, and Colon
cancers.
The specific health needs indicator substantiated in in this Area of Health Need
include:
Data-Supported Health Need
Early Diagnosis and Treatment of Cancer
Portage County’s overall Cancer Mortality Rate is 161.4 deaths per
100,000 people. Breast Cancer mortality was listed at 104.7 deaths per
100,000 women. Lung Cancer Mortality was identified to be 53.7 per
100,000 peoples and Colon Cancer mortality rates were 21.1 deaths per
100,000 peoples. Evidence was provided by the National Vital Statistics
System (NVSS), the Ohio Cancer Incidence Surveillance System (OCISS),
and the State Cancer Profiles. (Summa, 2013).
Assets for Cancer in Portage County Prevention and immunizations:
Robinson Memorial Hospi
AxessPointe Community Health Center
Health Departments
Kent State University Health Services
Family and Community Services Inc.
Planned Parenthood
53
SOCIAL DETERMINANTS OF HEALTH AND CHALLENGES
FOR SPECIFIC POPULATIONS IN PORTAGE COUNTY
The demographic findings presented above enable public health officials to
understand the populations in the county that are affected by various “social
determinants of health”. The Centers for Disease Control and Prevention (CDC)
defines social determinants of health as a set of factors that affect a person’s current
state of health (CDC, 2013). These factors are biological, social, physical, and
individualistic in nature. Biological factors include one’s age and sex. Social factors
include discrimination and relative income. Physical factors include where a person
lives and the environment surrounding them. Lastly, individualist factors may relate
to drug use, tobacco use, and excessive drinking (CDC, 2013).
The CDC states that these social determinants of health are shaped by factors such as
power, wealth and achievement, all of which are derived from one’s educational
attainment. Education is linked to a higher life expectancy and an overall healthier
life-style with health promoting behavior (CDC, 2013). Another factor, socioeconomic
status, entails economic, social, and work statuses. Economic status is measured by
income, social status is measured by education, and work status is measured by
occupation level. Each status is considered an indicator of, and a factor that
influences, health. Below, a number of population groups are identified based on the
demographic information discussed above. A brief discussion of the health risks
associated with each group is included.
Poverty
The CDC indicates that poverty means a lack of essential needs, and families that
make below a certain income threshold are deemed as being impoverished (CDC,
2013). According to the County Health Rankings (CHR) project (University of
Wisconsin Population Health Institute; Robert Wood Johnson Foundation), “Poverty
can result in an increased risk of mortality, prevalence of medical conditions and
disease incidence, depression, intimate partner violence, and poor health behaviors”
(CHR, 2014). The Health Rankings also note that children living in poverty experience
greater morbidity and mortality than adults due to risks associated with accidental
injuries and lack of health care access (CHR, 2014). According to Healthy People
2020, low socioeconomic status is associated with a higher risk for diseases such as
cardiovascular disease, arthritis, diabetes, chronic respiratory diseases, cervical cancer,
and mental health issues (Healthy People, 2014).
54
The Portage County demographic data presented in the Demographics table above
suggests that 15% of the county’s population lives in poverty, and there are some
specific geographic areas where the reported poverty rates are notably higher –
including the City of Kent (34%) and the City of Ravenna (23%) (ACS, 2012).
Racial and Ethnic Composition
The CDC states that burden of disease is disproportionally placed on minorities
compared to non-minorities, thus leading to lower life-expectancy rates and higher
rates of infant mortality. In particular, African Americans are at higher risk for
preventable diseases, death and disability (CDC, 2013). African-Americans and
Hispanics are also more likely to be unemployed compared to their white and Asian
or Pacific Islander counterparts (Healthy People, 2014). Low-income minorities spend
more time traveling to work and other activities than low-income whites because
they have fewer private vehicles and use public transit and car pools more frequently
(Healthy People, 2014).
While racial and ethnic minorities are reported in the Demographics Table above to
comprise only 8% of Portage County’s population, they appear to represent a higher
proportion of the population in some areas of the county – including the City of Kent
(17%) (Census, 2010). In the City of Ravenna, 10% of the population is reported to be
made up of racial and ethnic minorities (Census, 2010).
Age
Age is another determinant of health (Healthy People, 2014). A person’s childhood
provides the physical, cognitive, and social-emotional foundation for their life
(Healthy People, 2014). Exposure to negative experiences in childhood, such as
violence and maltreatment is associated with high-risk behaviors and health
problems such as obesity, diabetes, heart disease, sexually transmitted diseases, and
suicides (Healthy People, 2014). The built environment also impacts the health of
children. For example, exposure to lead-based paint hazards and pests negatively
affect the health and development of children (Healthy People, 2014).
Healthy People 2020 notes that adolescents are sensitive to environmental factors
such as family, peer groups, school and neighborhood policies, and societal cues.
Adolescents who grow up in areas characterized by poverty are more likely to be
victims of violence, engage in high risk behaviors, and experience health challenges
(Healthy People, 2014).
55
As noted by the ACS (2012) data discussed above, older adults (above 65) have a
higher percentage of individuals living with a disability than other age groups and
therefore may require additional support (ACS, 2012). In addition, “Studies have
shown that increased levels of social support [for seniors] are associated with a lower
risk for physical disease, mental illness, and death (Healthy People, 2014).”
Overall, the figures reported for Portage County in the Demographics Table (Figure 4
above) suggest that about 21% of the population is reported to be under age 18 and
about 13% of the population is over 65 years of age (Census, 2010). Specific areas of
the county have proportions of these populations that vary from these figures. In the
City of Kent, for example, 14% of residents are reported to be under 18 and 8% of the
population is reported to be over 65 years of age (Census, 2010). In the City of
Ravenna, 23% of residents are reported to be under 18, and 15% are reported to be
65 or older (Census, 2010).
Unemployment
The CDC states that determinants of health are shaped by the distribution of money,
power, and resources throughout local communities, nations, and the world.
Populations with high unemployment are more likely to have issues with access to
care, chronic disease, mental health and addiction, and other areas of need (CDC,
2013). The County Health rankings note, “Unemployed populations experience worse
health and higher mortality rates than the employed population (CHR, 2014).” As
mentioned previously, “low socioeconomic status” is associated with an increased risk
for many diseases and mental health issues (Healthy People, 2014).
The county-wide unemployment rate reported in the Demographics Table above for
Portage County as a whole is 11% (ACS, 2012). However, other areas of the county
appear to have higher unemployment rates. The City of Kent, for example, is
reported to have had an unemployment rate of 13% in 2012, while the City of
Ravenna’s unemployment rate at that time is reported to be 16% (ACS, 2012).
Education
According to Healthy People 2020, with higher level of education comes higher life
expectancy, better health, healthier behaviors, regular physical activity, not smoking,
and having regular doctor check-ups (Healthy People, 2014). In addition, a person’s
educational level has multigenerational implications: “Parents’ level of education
affects their children’s health directly through resources available to the children, and
also indirectly through the quality of schools that children attend (CHR, 2014).” A

56
person’s education level also impacts social and psychological factors through an
individual’s self-perception of his/her sense of personal control and social standing –
both of which have been shown to have a positive impact on health status (CHR,
2014).
Overall, according to the information in the Demographic Table above, about 90% of
Portage County residents have a high school diploma, and about 25% have a college
degree (ACS, 2012). There is some variation in these figures geographically. In the
City of Kent, for example, 40% of residents are reported to have a Bachelor’s degree
or higher and 14% of Ravenna residents are reported to have achieved that level of
education (ACS, 2012).
Healthcare Access
Healthcare Access is a key determinant of health status (Healthy People, 2020). Lack
of health insurance is a significant barrier to accessing needed health care (CHR,
2014). Access to healthcare leads to an ability to receive crucial clinical and preventive
care as well as the utilization of hospital wellness programs. People without health
insurance are more likely to go without care because of cost compared to those with
private insurance coverage (CHR, 2014).
In Portage County, 11% of residents are reported in the Demographics Table above
not to have insurance (ACS, 2012). This figure is similar to the 12% figure reported for
the City of Kent and the 13% figure reported for the City of Ravenna (ACS, 2012).
Commute to Work
How much time a person spends driving in a car is influenced by the built
environment. For example, it could be assumed that as more residential development
in rural areas in the county moves forward, and individuals are still working in the
region’s urban centers, commute times would increase. An individual’s commute can
impact their health. People with longer commutes are at risk for higher blood
pressure and body mass index (CHR, 2014). According to the County Health Rankings
(2014), there is a relationship between the time spent in a car per day and an increase
in the likelihood of obesity (CHR, 2014). In Portage County, the typical commute to
work is reported to be about 25 minutes (ACS, 2013), while the typical commutes for
Kent and Ravenna residents are 21.1 and 22.8 minutes, respectively (ACS, 2012).

57
FUTURE INFORMATION COLLECTION EFFORTS
While the work of the CHA Partnership has resulted in the collection of a large
amount of information to assess health needs in Portage County, it has not yet
produced the kind of complete information base that is likely to be needed to
minimize public health burdens over the long term. Only a dozen of the health needs
evaluated through this effort met the standards established by the CHA Partnership’s
Data Quality Workgroup. At the same time, the supportive evidence gathered to
buttress the case for the perceived health needs identified by the CHA Workgroup’s
expert members is of variable quality. This evidene is also located in a multitude of
different places. This brief section of the report offers some preliminary thoughts for
the local health departments, the Community Health Improvement Planning (CHIP)
Workgroup, public health stakeholders, and others to consider ways they can
improve the information base supporting public health improvement efforts in
Portage County.
First, while secondary data are certainly helpful, they are collected and compiled for a
range of purposes and may not always be optimal for assessing health needs in
Portage County, nor – perhaps – for tracking progress in addressing priority health
needs that may be identified by the CHIP process or by the individual organizations
that play ongoing roles in improving public health in the county. For these reasons,
future efforts to more fully evaluate existing data sources in relation to their
usefulness for priority setting and tracking health improvement progress in Portage
County seems warranted.
Second, to the extent that existing data sources are not adequate or appropriate for
identifying Portage County health needs and/or tracking progress toward health
improvement in the county, future efforts to devise more robust efforts to compile
and collect secondary and/or primary data within Portage County and its various
jurisdictions may be appropriate. Options for future primary data collection efforts
could include surveys of local populations to learn more about health status and
behavior, citizen awareness of healthy practices and resources, and patterns of health
service utilization. Options for secondary information include sources like American
Community Survey and Network of Care. While more robust data collection efforts
may prove time-consuming and costly, they may also enable establishment of a
smarter and more effective public health system in Portage County.
Third, during the course of the CHA Partnership’s work, it became apparent that there
are multiple agencies and organizations in Portage County that collect health-related
58
information and data. The findings contained in this report offer a glimpse of some
of the kinds of information that are currently being collected and compiled by
individual organizations within the county. However, it also seems clear that efforts
to compile and disseminate information collected among and across health related
organizations in the county are not yet as well developed as they could be. While this
report -- and recent efforts to analyze public health system services in Portage
County -- begins to address this issue, this is just the beginning of what could be
done to enhance understandings of public health needs and improvement efforts in
Portage County. Further coordination of Portage County health agency information
collection and dissemination efforts should therefore be considered.
Fourth, the CHA Partnership’s efforts have made it clear that Portage County faces
multiple public health challenges, and information collection activities to support
efforts to address them are appropriate. While the challenges are multiple, further
information collection efforts to address information needs in several areas appeared
as a result of discussions undertaken during the CHA process. One health need
identified above relates to access to health insurance for Portage County citizens.
While this need appears to be well documented in comparison to many of the other
needs identified, the impacts associated with rapid changes occurring as a result of
ACA implementation should be assessed and considered in any effort to improve
citizen access to health insurance. Another area where additional assessment may be
appropriate relates to the impacts of hydraulic fracturing activities in Portage County
on health and the environment. CHA Partnership members discussed this area of
potential concern, but did not have time to assess or compile evidence regarding
specific needs in this area. And finally, the Partnership also discussed geographic
variations in health needs and risks, and noted that geographically coded information
on health needs and risks is not available in all cases. While the Maternal and Child
Health Consortium needs assessment made significant and valuable progress in this
area, further efforts to bring geographic resolution to health needs information
should be considered. The geographically clustered information in Appendix V
represents an initial step toward moving in this direction, but – over time – more
efforts in this area are likely to be of assistance in targeting public health
interventions toward geographic areas where they would be most helpful.
And finally, it is important for the community to come together on a regular basis to
continue the assessment and planning processes undertaken through this CHA effort.
It is valuable for community health stakeholders to go through a systematic process
of data collection, analysis, and planning to support interventions to address health
needs and to identify improvements in data collection efforts among health-related
organizations.
59
As noted above, the health assessment, improvement planning, and evaluation
efforts outlined by the CHIC model represent a continuous process that allows
stakeholders to improve data and information collection as their efforts progress.
Given that this health assessment – along with the three assessments that recently
preceded it -- represents one of the early collaborative and comprehensive health
assessment efforts undertaken that focuses specifically and uniquely on Portage
County, there are limitations associated with the methods and processes that have
been used. However, in spite these limitations, the effort has also provided an
opportunity to identify ways in which public health stakeholders in Portage County
and improve the information base underlying their efforts over time.
Source: Main Street Kent
-Adopt- a- Spot Event (Kent, Ohio)
Source: Record – Courier
-Summerfest 5k Run & Walk for Cancer (Garrettsville, Ohio)
60
INPUT FOR THE COMMUNITY HEALTH IMPROVEMENT
PLANNING (CHIP) PARTNERSHIP
The CHA Partnership recognizes that its work is just the first stage in a longer process
of continuous public health improvement for Portage County. The next stage – as
mentioned previously – is the CHIP process. While the CHA Partnership recognizes
that this group has yet to be identified and that it must make its own judgments
regarding how to pursue its work, its members have gained knowledge and
information that they would like to share with the CHIP membership.
Future Information and Data Collection
The CHA Partnership makes the following recommendation related to improving data
collection efforts in Portage County:
The Portage County Community Health Assessment Partnership encourages the
Community Health Improvement Plan Partnership to incorporate data collection,
management, and utilization strategies into the Portage County Community Health
Improvement Plan.
CHA Partnership Evaluations of Perceived Health Needs in Portage County
As is mentioned above, the CHA Partnership conducted an internal survey to get a
better sense of the magnitude of concern among its members regarding perceived
needs that had support from individual Partnership members. The internal survey did
not address the data-driven needs which met the Data Quality Workgroup’s criteria
for “good” data. It did, however, seek to gain an overall sense of the CHA Partnership
group’s views regarding the importance of various perceived health needs in the
county, while also seeking to identify specifically the top five needs that the
individual CHA Partnership members thought should be given high priority for
consideration by the CHIP Partnership after it is established. These two elements of
the internal survey relating to perceived needs produced insights that the CHIP
Partnership may want to consider as it pursues its work.
One element of the survey presented perceived needs, along with any evidence
compiled to support them, and asked CHA Partnership members to rate the
importance of the need based on a Likert scale. The results of this internal survey are
provided in Appendix VII, and provide a means for assessing the overall “sense of the
group” in relation to their perceptions of the importance of the various perceived
61
needs that were identified. The five most highly ranked perceived needs resulting
from this process were:
Unhealthy weight children
Untreated mental health issues
Drug overdoses
Drug use
Child abuse and neglect
Another part of the survey asked members to rank what they felt to be the top 5
health needs from among all of the perceived needs identified. The purpose of this
exercise was to provide the CHIP Partnership with a sense of what the CHA
Partnership felt were the most pressing of the perceived needs identified. The
following health needs scored the highest in this exercise:
Poor nutrition
Prevention of complications for treatable chronic diseases
Unhealthy weight among children
Lack of sources of primary care (access to basic health care)
Coordination among mental health and clinical providers and referral to other
specialized services
While the CHA Partnership members believe that the CHIP Partnership must exercise
its own judgment in identifying priority needs and strategies to address them, they
offer the results of their internal survey effort to inform the overall CHIP effort.
Source: AP
-Martin Commons, Hiram College (Hiram, Ohio)
62
CONCLUSION
Stakeholders from a variety of sectors and health specialties coordinated together to
participate in this comprehensive CHA for Portage County. The CHA Partnership was
able to benefit from the work done in targeted health assessment efforts completed
in the county over the past few years that utilized both secondary and primary data
sources. The Partnership developed a process for incorporating and assessing data
from the three previously completed community health assessments and partnership
members to arrive at a final list of substantiated health needs. This information can
feed the next step in the Community Health Improvement Cycle, the Community
Health Improvement Plan (CHIP).
The Partnership identified 155 identified health indicators and needs from the three
assessments and its members. It formed a Data Quality Workgroup to assess the
quality of the data underlying the previously identified health indicators and health
needs. The workgroup developed criteria for scoring and evaluating the data. In the
end, the data had to meet the workgroup’s minimum data quality score and have a
Healthy People 2020 target that showed Portage County’s performance in a particular
area to be worse than the national target. Those needs that did not meet these data
quality criteria were considered perceived needs. The twelve needs that met the
criteria were considered substantiated health needs with data support.
The Partnership went through a process of determining which of the perceived needs
had Partnership support, identifying the evidence supporting each health need, and
determining the level of priority of each health need. In the end, 34 perceived health
needs were identified to have Partnership support, and joined the 12 data-supported
health needs to make the list of substantiated health needs for Portage County. The
individual health needs were grouped into 9 broad areas of health need.
The result of this process is a final list of 46 substantiated health needs in 9 broad
areas within Portage County and an identification of potential strategies for
improving data collection to inform future health assessment rounds. This
information is designed to inform the CHIP process, which will involve community
stakeholders working to identify priority health needs, targets for intervention, and
mechanisms for evaluating progress.
63
REFERENCES
American Community Survey (ACS). (2008-2012). 2008-2012 5-year Estimates . (2012,
January 1). Retrieved November 3, 2014, from
http://factfinder2.census.gov/faces/nav/jsf/pages/index.xhtml
Beaty. (2014). Portage County Community Health Assessment Prioritization Survey
Responses. Portage County: Prepared by the Center for Public Policy and Health.
Census. (2010). Census Figures. Retrieved November 3, 2014, from
http://factfinder2.census.gov/faces/nav/jsf/pages/index.xhtml
Center for Disease Control (CDC). (2013). CDC Health Disparities and Inequities Report:
Morbidity and Mortality Weekly Report., 62(3).
County Health Rankings (CHR). (2014). County Health Rankings & Roadmaps. Retrieved
November 18, 2014, from
http://www.countyhealthrankings.org/app/ohio/2014/rankings/portage/county/outcomes
/overall/snapshot
Drummond. (2014). Data Risk Factors Report ( 01/01/2013 - 05-26-2014). Portage County:
AxessPointe Health Center.
Drummond. (2014). Portage County Community Health Assessment Prioritization Survey
Responses. Portage County: Prepared by the Center for Public Policy and Health.
Duchon. (2013). Familywize Community Savings Chart and CoPay Figures. Portage
County: United Way.
Duchon. (2014). Portage County Community Health Assessment Prioritization Survey
Responses. Portage County: Prepared by the Center for Public Policy and Health.
64
Health and Human Services (HHS). (2014). 2014 Poverty Guidelines. (2014, January 1).
Retrieved November 17, 2014, from http://aspe.hhs.gov/poverty/14poverty.cfm
Healthy People. (2014). Social Determinants. Retrieved September 15, 2014, from
http://www.healthypeople.gov/2020/leading-health-indicators/2020-lhi-topics/Social-
Determinants/determinants?tab=determinants
James, E., Slenkovich, K., Hoornbeek, D., & Filla, J. (2014). Portage County Community
Health Needs Assessment. Portage County.
Kent State. (2014). Facts & Figures | Kent State University. Retrieved January 6, 2015, from
http://www.kent.edu/facts-figures
Maternal and Child Health Consortium. (2013). Portage County Maternal and Child Health
Indicators: A Report to the Portage County Maternal and Child Health Consortium for
Issue Prioritization. Portage County.
Mowery. (2014). Portage County Community Health Assessment Prioritization Survey
Responses. Portage County: Prepared by the Center for Public Policy and Health.
Myers. (2014). Portage County Community Health Assessment Prioritization Survey
Responses. Portage County: Prepared by the Center for Public Policy and Health.
National Association of County and City Health Officials (NACCHO). (2014). Definitions of
Community Health Assessments and Community Health Improvement Plans. (2014).
Retrieved July 1, 2014, from http://www.naccho.org/topics/infrastructure/community-
health-assessment-and-improvement-planning/upload/Definitions.pdf
National Association of County and City Health Officials (NACCHO). (2013). A Strategic
Approach to Community Health Improvement . Retrieved July 1, 2014, from
http://www.naccho.org/topics/infrastructure/mapp/upload/mapp_field_guide2.pdf
65
Portage County Evaluation Workgroup. (2013). Draft Evaluation Workgroup Report.
Portage County. Prepared by the Center for Public Policy and Health.
Portage County Health Department. (2012). Local Public Health System Performance
Assessment – Report of Results. Portage County: PCHD.
Portage County Mental Health and Recovery Board (PCMHRB). (2013). Mental Health &
Recovery Board of Portage County: Qualitative Needs Assessment Process for Portage
County. Portage County: Mental Health & Recovery Board of Portage County.
Schoenwald. (2014). Portage County Community Health Assessment Prioritization Survey
Responses. Prepared by the Center for Public Policy and Health.
Sherba, Gersper, Martt, & Cummins. (2014). Drug Abuse Trends in Akron-Canton
Region.The Ohio Substance Abuse Monitoring Network Drug Report, 19-38.
Shonkoff, J. (2000). From Neurons to Neighborhoods: The Science of Early Child
Development. Washington, D.C.: National Academy Press.
Summa Health Care Systems. (2013). Community Health Needs Assessment. Akron: Summa
Health Care Systems.
Whitehurst. (2014). Portage County Community Health Assessment Prioritization Survey
Responses. Portage County: Prepared by the Center for Public Policy and Health.