Embed Size (px)
Citation preview
Transp Porous Med (2015) 110:345–367DOI 10.1007/s11242-015-0546-1
Pore-Network Modeling of Solute Transport and BiofilmGrowth in Porous Media
Chao-Zhong Qin1 · S. Majid Hassanizadeh1
Received: 22 March 2015 / Accepted: 6 July 2015 / Published online: 5 September 2015© The Author(s) 2015. This article is published with open access at Springerlink.com
Abstract In this work, a pore-network (PN)model for solute transport and biofilm growth inporous media was developed. Compared to previous studies of biofilm growth, it has two newfeatures. First, the constructed pore network gives a better representation of a porousmedium.Second, instead of using a constant mass exchange coefficient for solute transport betweenwater phase and biofilm, a variable coefficient as a function of biofilm volume fraction andDamköhler numberwas employed. This PNmodel was verified against direction simulations.Then, a number of case studies were conducted, in order to illustrate the temporal evolutionsof medium permeability and biomass content under different operating conditions. Finally,we explored the effects of biofilm morphology and permeability on biofilm growth, as wellas non-unique relationship between medium permeability reduction and its porosity change.
Keywords Pore-network (PN) modeling · Biofilm growth and clogging · Permeabilityreduction · Non-equilibrium mass exchange · Numerical simulation
1 Introduction
In many natural and engineered porous media, biofilm may present under both saturatedand unsaturated conditions. When nutrients are continuously available, biofilm keeps grow-ing on solid walls. This would finally lead to the condition of bioclogging in porous media(Baveye et al. 1998; Pintelon et al. 2009). Up to now, there have been many applicationsby using biofilm such as biobarriers, microbial-enhanced oil recovery (Afrapoli et al. 2011),and bioremediation. In wastewater treatment, biofilm plays a major role in biological aer-ated filters for removing carbon and nitrogen (Boltz et al. 2010). In in situ bioremediation,biofilm breaks down contaminants into less toxic or non-toxic substances (Cunningham andMendoza-Sanchez 2006). In subsurface CO2 storage, engineered biofilm is used to plug CO2
B Chao-Zhong [email protected]; [email protected]
1 Department of Earth Sciences, Faculty of Geosciences, University of Utrecht,Budapestlaan 4, P. O. Box 80021, 3584 CD Utrecht, The Netherlands
123
346 C.-Z. Qin, S. M. Hassanizadeh
leakage pathways (Ebigbo et al. 2010; Mitchell et al. 2009). Also, biofilm plays an importantrole in inhibiting the corrosion process of metallic structures such as sheet piles and oil pipes(Potekhina et al. 1999; Videla and Herrera 2009; Zuo 2007).
Much effort has been invested into understanding biodegradation and bioclogging inporous media (Baveye and Valocchi 1989; Dillon and Fauci 2000; Kapellos et al. 2007;Rittmann 1993; Rosenzweig et al. 2009; Taylor et al. 1990; Van Noorden et al. 2010). Todescribe these processes at theREVscale,macroscalemodelswere formulated by the volume-averaging technique (Taylor and Jaffe 1990; Vandevivere et al. 1995). In such models, anumber of effective parameters are commonly needed, which are determined by the pore-scale information. For tracking solute transport in porous media with biofilm, one-equationmodels have been developed under both equilibrium and non-equilibrium conditions. Then,effective parameters such as dispersivity and effectiveness factor (representing the observedreaction rate versus the maximal reaction rate) were obtained by solving pore-scale closureproblems (Davit et al. 2010; Golfier et al. 2009; Orgogozo et al. 2010). Also, CunninghamandMendoza-Sanchez (2006) mathematically determined the conditions under which a sim-ple one-equation model was equivalent to a complex biofilm model (MarDonald et al. 1999).Alternatively, under non-equilibrium conditions, a two-equationmodelwaswidely used (e.g.,Cherblanc et al. 2007; Ebigbo et al. 2010, 2012). In this approach, two transport equationsof solute in water phase and biofilm are coupled by an empirical first-order kinetic model.But, it is difficult to characterize the mass exchange coefficient appearing in the kinetic massexchange model (see Dykaar and Kitanidis 1996; Qin and Hassanizadeh 2015). Therefore,an assumed constant mass exchange coefficient has been used in most previous studies (e.g.,Ebigbo et al. 2010, 2012;Kim andCorapcioglu 1997; Thullner et al. 2002; Zysset et al. 1994).To release this assumption, a reliable and efficient pore-scale model needs to be developed,which is the main objective of this work.
For obtaining constitutive equations for macroscale models and gaining insights into flowand transport processes in porous media with biofilm, pore-scale studies have received muchattention (e.g.,Dupin et al. 2001; Pintelon et al. 2012; Suchomel et al. 1998a, b;Xuet al. 2011).Fabricated micromodels were used to study biomass evolution and its effect on permeability(e.g., Cunningham et al. 1991; Dunsmore et al. 2004; Kim and Fogler 2000). Recently,Iltis et al. (2011) visualized 3D biofilm structures in a glass bead pack using synchrotron-based X-ray computed microtomography. In numerical studies, several pore-scale modelshave been widely used, such as pore-network (PN) model and Lattice–Boltzmann (LB)model. Graf von der Schulenburg et al. (2009) developed a LB model for biofilm growth inporous media, in which biofilm evolution was tracked by an individual-based biofilm model(IBM). Later, Pintelon et al. (2012) further developed the LB model to study the effect ofbiofilm permeability on bioclogging. Bottero et al. (2013) conducted 2D direct simulationsof biofilm growth and the dynamics of preferential flow paths in porous media. However,it is worth noting that these direct simulations including LB modeling are computationallyexpensive.
PN models have been extensively used in modeling flow and transport in porous media(Blunt 2001; Budek and Szymczak 2012; Li et al. 2006; Raoof et al. 2012). There are alsomany studies of bioclogging using PNmodels. Kim and Fogler (2000) developed a PNmodelfor tracking biofilm evolution under starvation conditions. They showed that with a propercritical shear stress, simulations were in qualitative agreement with the experimental results.Thullner et al. (2002) developed a 2D lattice-based PN model for predicting the relationshipbetween biomass content and permeability of porous medium. Later, Thullner and Baveye(2008) extended the 2D model to a 3D regular lattice-based PN model. They showed thatbiofilm permeability had a large impact on the temporal evolution and distribution pattern of
123
Pore-Network Modeling of Solute Transport and Biofilm Growth... 347
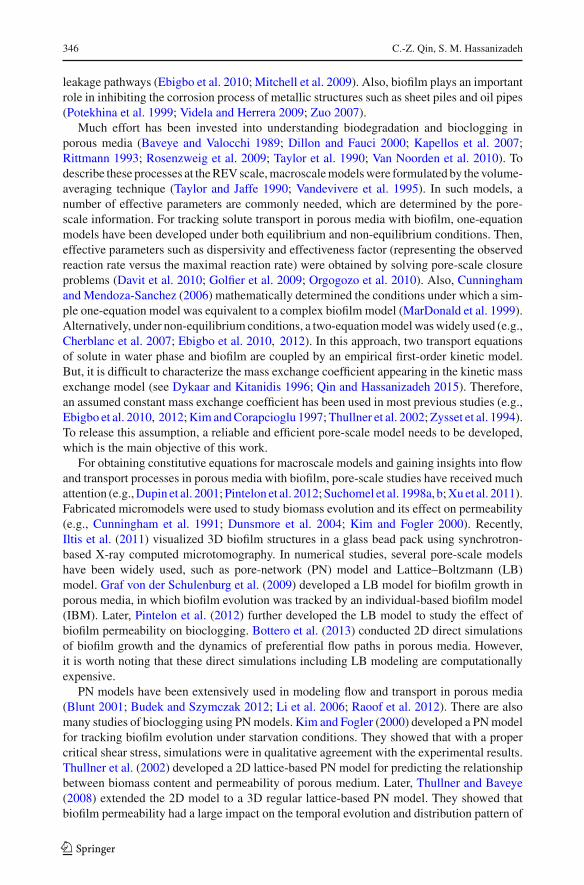
Fig. 1 a Distribution of the pore-body sizes in the pore network; b the generated 16× 16× 16 pore networkcolored according to the pore size
biofilm. Recently, Ezeuko et al. (2011) developed a PNmodel with a so-called dual-diffusionmass exchange model.
Despite these advances, there exist several deficiencieswith previous PNmodels of biofilmgrowth. First, a porous medium has been usually simplified by a network of cylindrical tubesconnected by volumeless nodes. Second, either a constantmass exchange coefficient ormass-equilibrium assumption has been employed (e.g., Thullner and Baveye 2008; Ezeuko et al.2011). This assumption would give rise to an incorrect prediction of the temporal evolutionof biofilm under non-equilibrium conditions. The main objective of this work is to developa PN model for solute transport in porous media and the associated biofilm growth, which isdevoid of the two above-mentioned deficiencies.
2 Pore-Network Generation
Many geological and industrial porous media can be adequately represented by a networkof pore bodies and throats. Usually, pore bodies of proper shapes are used to representlarge pore spaces in a porous medium, while pore throats are used to represent narrowregions which connect two neighboring pore bodies. Pore throats are the main contributorsto flow resistance, particularly in the case of saturated flow. In the literature, there have beenseveral approaches to generating a pore network which needs to be calibrated in terms ofmaterial properties such as porosity, permeability, capillary pressure curve, and pore sizeand coordinate number distributions. This can be applied to a regular lattice-based networkor a stochastically generated network (Raoof and Hassanizadeh 2010; Jiang et al. 2012).Furthermore, a more realistic pore network may be directly extracted frommicro-CT imagesof a porous medium (Al-Kharusi and Blunt 2007).
In this work, with the purpose of a general study of solute transport and biofilm growth, aregular lattice-based pore network was generated to represent the representative elementaryvolume (REV) of sandstone. The pore-body size is approximated by a truncated lognormaldistribution (Al-Kharusi and Blunt 2007) as shown in Fig. 1a. The size of a pore throat isdetermined by the smaller connected pore body by assuming a constant aspect ratio (AR) ofthe pore-throat radius to the pore-body radius (see Sect. 3.3).
Figure 1b shows the generated 16 × 16 × 16 pore network colored according to thesizes of pore bodies and throats. Each pore body has a coordinate number of six, except forthose at inlet, outlet, and side boundaries. For saturated flow in porous media, the pore shapedistribution is not as important as in unsaturated flow in which corner flow plays an important
123
348 C.-Z. Qin, S. M. Hassanizadeh
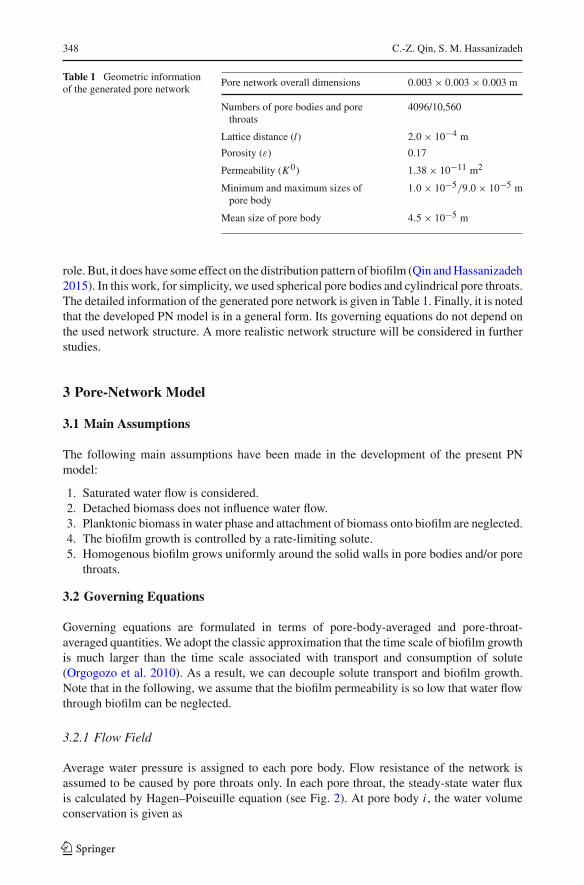
Table 1 Geometric informationof the generated pore network
Pore network overall dimensions 0.003 × 0.003 × 0.003 m
Numbers of pore bodies and porethroats
4096/10,560
Lattice distance (l) 2.0 × 10⁻⁴ m
Porosity (ε) 0.17
Permeability (K 0) 1.38 × 10⁻¹¹ m2
Minimum and maximum sizes ofpore body
1.0 × 10⁻⁵/9.0 × 10−5 m
Mean size of pore body 4.5 × 10⁻⁵ m
role. But, it does have some effect on the distribution pattern of biofilm (Qin andHassanizadeh2015). In this work, for simplicity, we used spherical pore bodies and cylindrical pore throats.The detailed information of the generated pore network is given in Table 1. Finally, it is notedthat the developed PN model is in a general form. Its governing equations do not depend onthe used network structure. A more realistic network structure will be considered in furtherstudies.
3 Pore-Network Model
3.1 Main Assumptions
The following main assumptions have been made in the development of the present PNmodel:
1. Saturated water flow is considered.2. Detached biomass does not influence water flow.3. Planktonic biomass in water phase and attachment of biomass onto biofilm are neglected.4. The biofilm growth is controlled by a rate-limiting solute.5. Homogenous biofilm grows uniformly around the solid walls in pore bodies and/or pore
throats.
3.2 Governing Equations
Governing equations are formulated in terms of pore-body-averaged and pore-throat-averaged quantities. We adopt the classic approximation that the time scale of biofilm growthis much larger than the time scale associated with transport and consumption of solute(Orgogozo et al. 2010). As a result, we can decouple solute transport and biofilm growth.Note that in the following, we assume that the biofilm permeability is so low that water flowthrough biofilm can be neglected.
3.2.1 Flow Field
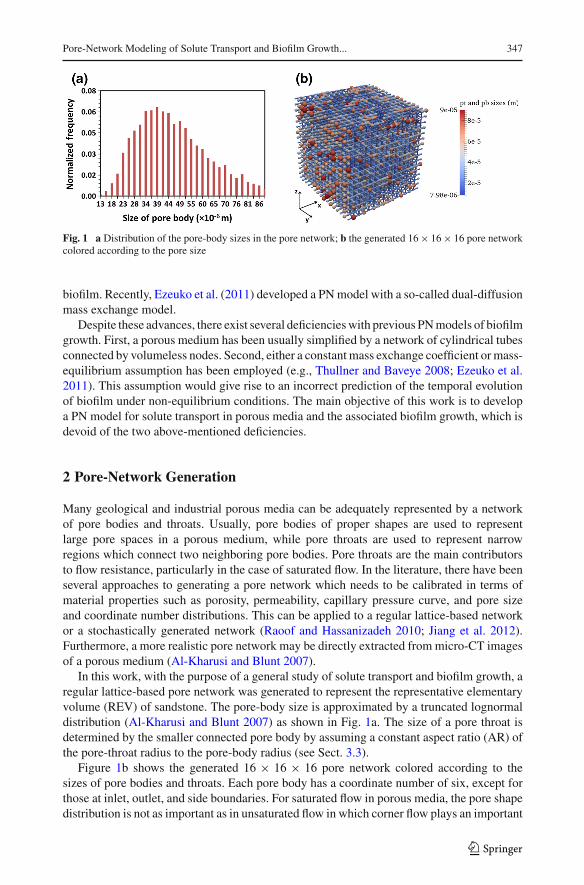
Average water pressure is assigned to each pore body. Flow resistance of the network isassumed to be caused by pore throats only. In each pore throat, the steady-state water fluxis calculated by Hagen–Poiseuille equation (see Fig. 2). At pore body i , the water volumeconservation is given as
123
Pore-Network Modeling of Solute Transport and Biofilm Growth... 349
Fig. 2 Schematic representation of a pore network connectivity
Ni∑
j
Qi j =Ni∑
j
Gi j
(pi − p j
)
Li j= 0 (1)
where the index j denotes a neighboring pore body, Ni is the coordinate number of porebody i , Qi j [L3/T] is the volumetric flow rate of water from pore body i to j , Gi j [L5T/M]is the conductivity of pore throat ij, Li j is the length of pore throat, and p [M/LT2] is thewater pressure at pore body.
3.2.2 Transport of a Rate-Limiting Solute
For modeling solute transport in the pore network, average concentrations of solute areassigned to water phase and biofilm at pore bodies and throats. Transport processes includ-ing advection, dispersion, and mass exchange between water phase and biofilm, as well asbioreaction in biofilm, are taken in account. It is assumed that the consumption of solutein biofilm can be modeled with Monod-type kinetics (Cunningham and Mendoza-Sanchez2006).
For a rate-limiting solute, the mass conservations in water phase and biofilm in pore bodyi can be given, respectively, as
V 0i εwi
dCwi
dt= −Cw
i
Ni∑
j
max(Qi j , 0) −Ni∑
j
Cwi j min(Qi j , 0) −
Ni∑
j
Dwi j A
wi j
Cwi − Cw
i j
Li j/2
−V 0i
DwDb
Dw + Dbγiξi
(Cwi − Cb
i
)(2)
V 0i εbi
dCbi
dt= −
Ni∑
j
DbAbi j
Cbi − Cb
i j
Li j/2+ V 0
iDwDb
Dw + Dbγiξi
(Cwi − Cb
i
)
−V 0i εbi k
Cbi
Ks + Cbi
ρb (3)
where the superscripts w and b refer to the water phase and biofilm, respectively, V 0i [L3] is
the volume of pore body i in the absence of biofilm, εwi and εbi are the volume fractions ofwater phase and biofilm, respectively, subject to the restriction εwi + εbi = 1, C [M/L3] is the
123
350 C.-Z. Qin, S. M. Hassanizadeh
average mass concentration of solute, Di j [L2/T] is the dispersion coefficient for transport inthe pore throat ij, Aw
i j [L2] is the cross-sectional area for water flow, Abi j is the cross-sectional
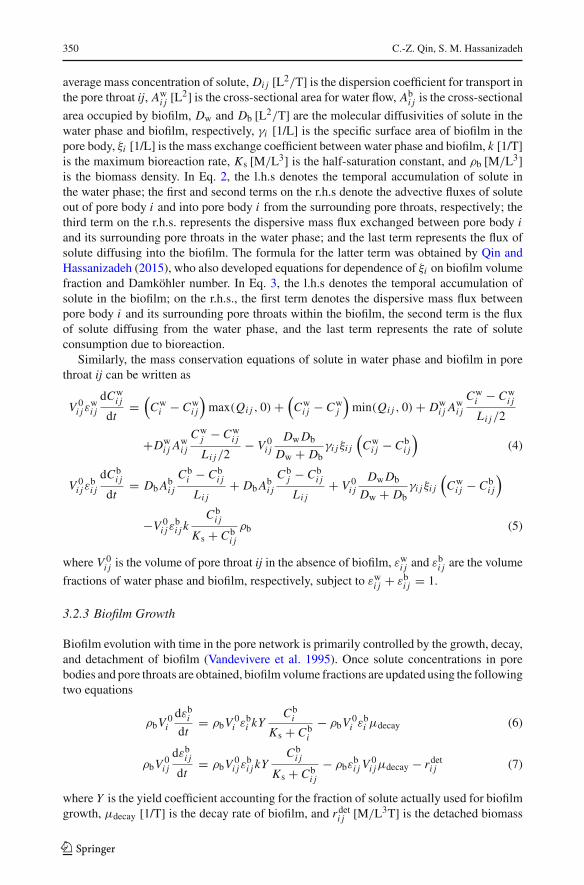
area occupied by biofilm, Dw and Db [L2/T] are the molecular diffusivities of solute in thewater phase and biofilm, respectively, γi [1/L] is the specific surface area of biofilm in thepore body, ξi [1/L] is the mass exchange coefficient between water phase and biofilm, k [1/T]is the maximum bioreaction rate, Ks [M/L3] is the half-saturation constant, and ρb [M/L3]is the biomass density. In Eq. 2, the l.h.s denotes the temporal accumulation of solute inthe water phase; the first and second terms on the r.h.s denote the advective fluxes of soluteout of pore body i and into pore body i from the surrounding pore throats, respectively; thethird term on the r.h.s. represents the dispersive mass flux exchanged between pore body iand its surrounding pore throats in the water phase; and the last term represents the flux ofsolute diffusing into the biofilm. The formula for the latter term was obtained by Qin andHassanizadeh (2015), who also developed equations for dependence of ξi on biofilm volumefraction and Damköhler number. In Eq. 3, the l.h.s denotes the temporal accumulation ofsolute in the biofilm; on the r.h.s., the first term denotes the dispersive mass flux betweenpore body i and its surrounding pore throats within the biofilm, the second term is the fluxof solute diffusing from the water phase, and the last term represents the rate of soluteconsumption due to bioreaction.
Similarly, the mass conservation equations of solute in water phase and biofilm in porethroat ij can be written as
V 0i jε
wi j
dCwi j
dt=
(Cwi − Cw
i j
)max(Qi j , 0) +
(Cwi j − Cw
j
)min(Qi j , 0) + Dw
i j Awi j
Cwi − Cw
i j
Li j/2
+Dwi j A
wi j
Cwj − Cw
i j
Li j/2− V 0
i jDwDb
Dw + Dbγi jξi j
(Cwi j − Cb
i j
)(4)
V 0i jε
bi j
dCbi j
dt= DbA
bi j
Cbi − Cb
i j
Li j+ DbA
bi j
Cbj − Cb
i j
Li j+ V 0
i jDwDb
Dw + Dbγi jξi j
(Cwi j − Cb
i j
)
−V 0i jε
bi j k
Cbi j
Ks + Cbi j
ρb (5)
where V 0i j is the volume of pore throat ij in the absence of biofilm, εwi j and εbi j are the volume
fractions of water phase and biofilm, respectively, subject to εwi j + εbi j = 1.
3.2.3 Biofilm Growth
Biofilm evolution with time in the pore network is primarily controlled by the growth, decay,and detachment of biofilm (Vandevivere et al. 1995). Once solute concentrations in porebodies and pore throats are obtained, biofilmvolume fractions are updated using the followingtwo equations
ρbV0idεbidt
= ρbV0i εbi kY
Cbi
Ks + Cbi
− ρbV0i εbi μdecay (6)
ρbV0i j
dεbi jdt
= ρbV0i jε
bi j kY
Cbi j
Ks + Cbi j
− ρbεbi j V
0i jμdecay − rdeti j (7)
where Y is the yield coefficient accounting for the fraction of solute actually used for biofilmgrowth, μdecay [1/T] is the decay rate of biofilm, and rdeti j [M/L3T] is the detached biomass
123
Pore-Network Modeling of Solute Transport and Biofilm Growth... 351
mainly due to the water shear force. Note that the detachment is neglected in pore bodies dueto relatively small water shear force there.
3.3 Auxiliary Equations
The conductivity of a pore throat for water flow that was introduced in Eq. 1 may change withtime due to biofilm growth. For cylindrical pores, the following equation can be obtained
Gi j =π
(r0i j
)4
8μ
(1 − εbi j
)2(8)
where μ [M/LT] is the dynamic viscosity of water and r0i j [L] is the radius of pore throat ij in
the absence of biofilm. The length of pore throat ij is calculated as Li j = l − r0i − r0j , and its
radius is determined by r0i j = 0.7×min(r0i , r0j ). The volumes of pore body i and pore throat
ij are, respectively, given as V 0i = 4π
(r0i
)3/3 and V 0
i j = π(r0i j
)2Li j . The cross-sectional
areas for water flow and biofilm are, respectively, calculated as Awi j = π
(r0i j
)2 (1 − εbi j
)
and Abi j = π
(r0i j
)2εbi j . The specific surface areas of biofilm in pore body i and pore throat ij
are calculated, respectively, as γi = 3(1 − εbi
)2/3/r0i and γi j = 2
(1 − εbi j
)1/2/r0i j . In pore
throat ij, when the water shear force on the biofilm exceeds a critical value τc, the biofilmstarts to be detached (Chambless and Steward 2007; Stewart and Kim 2004). The rate ofbiomass detachment is assumed to be proportional to the water shear force such that the sinkterm rdet is given as
rdeti j = V 0i jρbμdet
(1 − εbi j
) Qi j
Ki jwhen r0i j
√1 − εb
∣∣pi − p j∣∣/2Li j > τc (9)
where μdet (1/T) is the detachment rate. It is worth noting that biomass detachment is acomplicated process which is mainly in the form of erosion or sloughing. For more detail,one can refer to the Introduction in Pintelon et al. (2009).
In pore throat ij, the dispersivity of solute in the water phase is approximated by Taylor–Aris dispersion formula (Aris 1956)
Dwi j = Dw
(1 + Pe2
192
)(10)
where Pe = 2Qi j/πr0i j√1 − εbDw is Péclet number for water flow in the pore throat.
Finally, we need to provide constitutive equations for the mass exchange coefficients ξiand ξi j , appearing in Eqs. (2–5), which depend on a number of variables, such as biofilmvolume fraction and Damköhler number. More detail is given in the next subsection.
3.4 Mass Exchange Coefficient ξ
Most recently, Qin and Hassanizadeh (2015) studied the mass exchange of a solute betweenwater phase and biofilm in a single pore. The aim of that study was to investigate the rela-tionship between mass exchange rate and prevailing conditions. Results were upscaled fora single pore in order to obtain the tube-scale mass exchange coefficients. It was found that
the coefficient depends on Damköhler number, Da = kρb(2r0i j
)2/KsDw, biofilm volume
123
352 C.-Z. Qin, S. M. Hassanizadeh
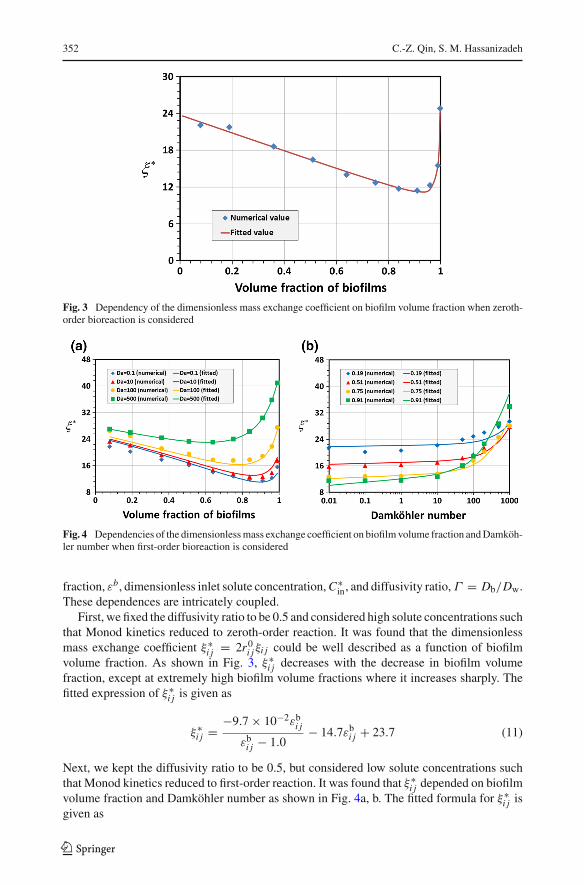
Fig. 3 Dependency of the dimensionless mass exchange coefficient on biofilm volume fraction when zeroth-order bioreaction is considered
Fig. 4 Dependencies of the dimensionlessmass exchange coefficient on biofilmvolume fraction andDamköh-ler number when first-order bioreaction is considered
fraction, εb, dimensionless inlet solute concentration,C∗in, and diffusivity ratio,Γ = Db/Dw.
These dependences are intricately coupled.First, we fixed the diffusivity ratio to be 0.5 and considered high solute concentrations such
that Monod kinetics reduced to zeroth-order reaction. It was found that the dimensionlessmass exchange coefficient ξ∗
i j = 2r0i jξi j could be well described as a function of biofilmvolume fraction. As shown in Fig. 3, ξ∗
i j decreases with the decrease in biofilm volumefraction, except at extremely high biofilm volume fractions where it increases sharply. Thefitted expression of ξ∗
i j is given as
ξ∗i j = −9.7 × 10⁻²εbi j
εbi j − 1.0− 14.7εbi j + 23.7 (11)
Next, we kept the diffusivity ratio to be 0.5, but considered low solute concentrations suchthat Monod kinetics reduced to first-order reaction. It was found that ξ∗
i j depended on biofilmvolume fraction and Damköhler number as shown in Fig. 4a, b. The fitted formula for ξ∗
i j isgiven as
123
Pore-Network Modeling of Solute Transport and Biofilm Growth... 353
ξ∗i j =
−52.2 + 6.23 × 10⁻² ln (Da) + 18.2 exp(εbi j
)
1 + 1.63 × 10⁻⁴Da − 0.94εbi j+ 58.9 (12)
Finally, it is assumed that the dimensionless mass exchange coefficient ξi has the samefunctional forms as Eqs. 11 and 12, with the Damköhler number in pore body i being defined
as Da = kρb(2r0i
)2/KsDw.
4 Description of Numerical Simulations
In Sect. 3.1, we have presented governing Eqs. (1–5) for a rate-limiting solute transport inthe pore network when considering impermeable biofilm. For permeable biofilm, governingequations are given in detail in Appendix 1. To solve solute transport in the pore network,a general numerical scheme presented in Appendix 2 was used. The employed boundaryconditions are as follows. For water flow, constant pressure values were assigned to theinlet and outlet pore bodies, respectively. For solving concentrations, a constant inlet soluteconcentration in thewaterwas assumed.Thediffusiveflux and thefluxof solutewithin biofilmat both inlet and outlet boundaries were set to zero. Finally, we employed the following initialconditions. Zero solute concentrations were assumed everywhere in the pore network, and aninitial biofilm volume fraction of εini = 0.01 was set, in order to support subsequent biofilmgrowth.
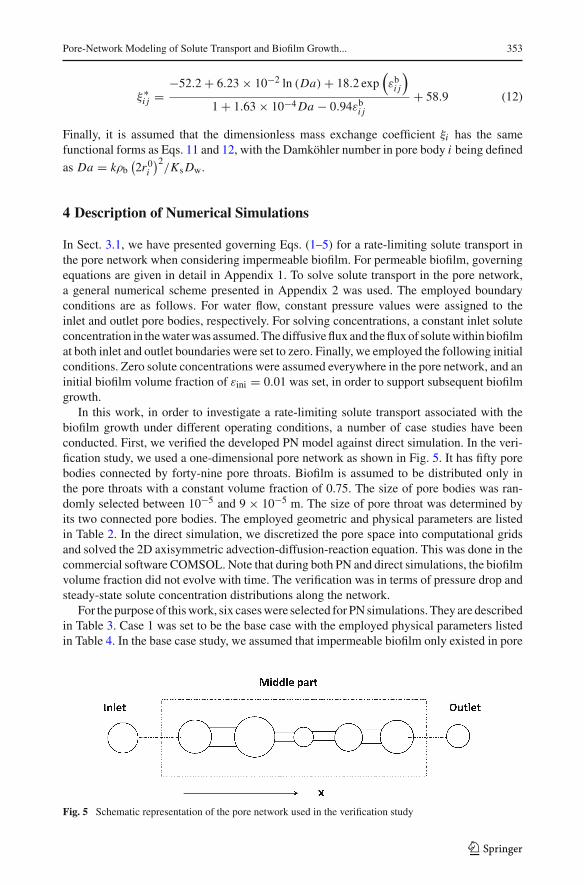
In this work, in order to investigate a rate-limiting solute transport associated with thebiofilm growth under different operating conditions, a number of case studies have beenconducted. First, we verified the developed PN model against direct simulation. In the veri-fication study, we used a one-dimensional pore network as shown in Fig. 5. It has fifty porebodies connected by forty-nine pore throats. Biofilm is assumed to be distributed only inthe pore throats with a constant volume fraction of 0.75. The size of pore bodies was ran-domly selected between 10−5 and 9 × 10⁻⁵ m. The size of pore throat was determined byits two connected pore bodies. The employed geometric and physical parameters are listedin Table 2. In the direct simulation, we discretized the pore space into computational gridsand solved the 2D axisymmetric advection-diffusion-reaction equation. This was done in thecommercial software COMSOL. Note that during both PN and direct simulations, the biofilmvolume fraction did not evolve with time. The verification was in terms of pressure drop andsteady-state solute concentration distributions along the network.
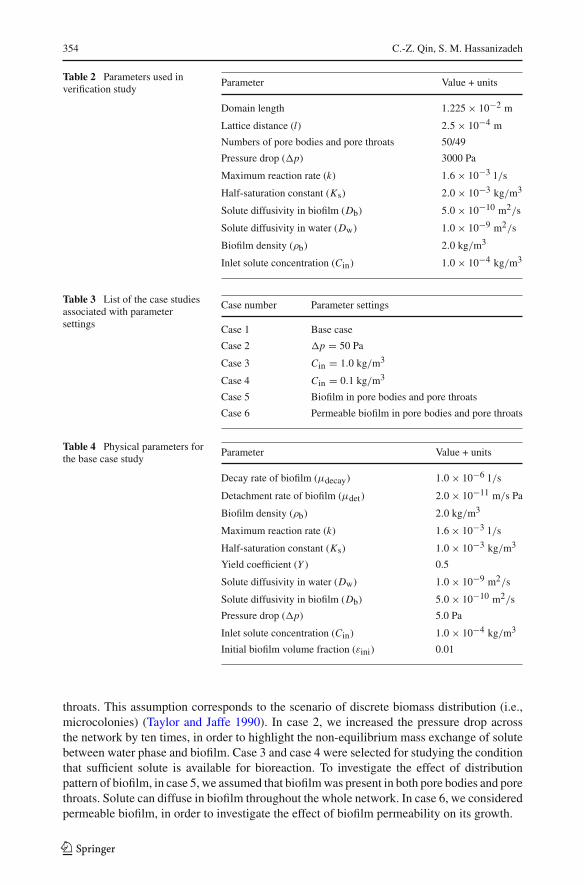
For the purpose of thiswork, six caseswere selected for PNsimulations. They are describedin Table 3. Case 1 was set to be the base case with the employed physical parameters listedin Table 4. In the base case study, we assumed that impermeable biofilm only existed in pore
Fig. 5 Schematic representation of the pore network used in the verification study
123
354 C.-Z. Qin, S. M. Hassanizadeh
Table 2 Parameters used inverification study
Parameter Value + units
Domain length 1.225 × 10⁻² m
Lattice distance (l) 2.5 × 10⁻⁴ m
Numbers of pore bodies and pore throats 50/49
Pressure drop (p) 3000 Pa
Maximum reaction rate (k) 1.6 × 10⁻³ 1/s
Half-saturation constant (Ks) 2.0 × 10⁻³ kg/m3
Solute diffusivity in biofilm (Db) 5.0 × 10⁻¹⁰ m2/s
Solute diffusivity in water (Dw) 1.0 × 10⁻⁹ m2/s
Biofilm density (ρb) 2.0 kg/m3
Inlet solute concentration (Cin) 1.0 × 10⁻⁴ kg/m3
Table 3 List of the case studiesassociated with parametersettings
Case number Parameter settings
Case 1 Base case
Case 2 p = 50 Pa
Case 3 Cin = 1.0 kg/m3
Case 4 Cin = 0.1 kg/m3
Case 5 Biofilm in pore bodies and pore throats
Case 6 Permeable biofilm in pore bodies and pore throats
Table 4 Physical parameters forthe base case study
Parameter Value + units
Decay rate of biofilm (μdecay) 1.0 × 10⁻⁶ 1/s
Detachment rate of biofilm (μdet) 2.0 × 10⁻¹¹ m/s Pa
Biofilm density (ρb) 2.0 kg/m3
Maximum reaction rate (k) 1.6 × 10⁻³ 1/s
Half-saturation constant (Ks) 1.0 × 10⁻³ kg/m3
Yield coefficient (Y ) 0.5
Solute diffusivity in water (Dw) 1.0 × 10⁻⁹ m2/s
Solute diffusivity in biofilm (Db) 5.0 × 10⁻¹⁰ m2/s
Pressure drop (p) 5.0 Pa
Inlet solute concentration (Cin) 1.0 × 10⁻⁴ kg/m3
Initial biofilm volume fraction (εini) 0.01
throats. This assumption corresponds to the scenario of discrete biomass distribution (i.e.,microcolonies) (Taylor and Jaffe 1990). In case 2, we increased the pressure drop acrossthe network by ten times, in order to highlight the non-equilibrium mass exchange of solutebetween water phase and biofilm. Case 3 and case 4 were selected for studying the conditionthat sufficient solute is available for bioreaction. To investigate the effect of distributionpattern of biofilm, in case 5, we assumed that biofilmwas present in both pore bodies and porethroats. Solute can diffuse in biofilm throughout the whole network. In case 6, we consideredpermeable biofilm, in order to investigate the effect of biofilm permeability on its growth.
123
Pore-Network Modeling of Solute Transport and Biofilm Growth... 355
5 Results and Discussion
5.1 Model Verification
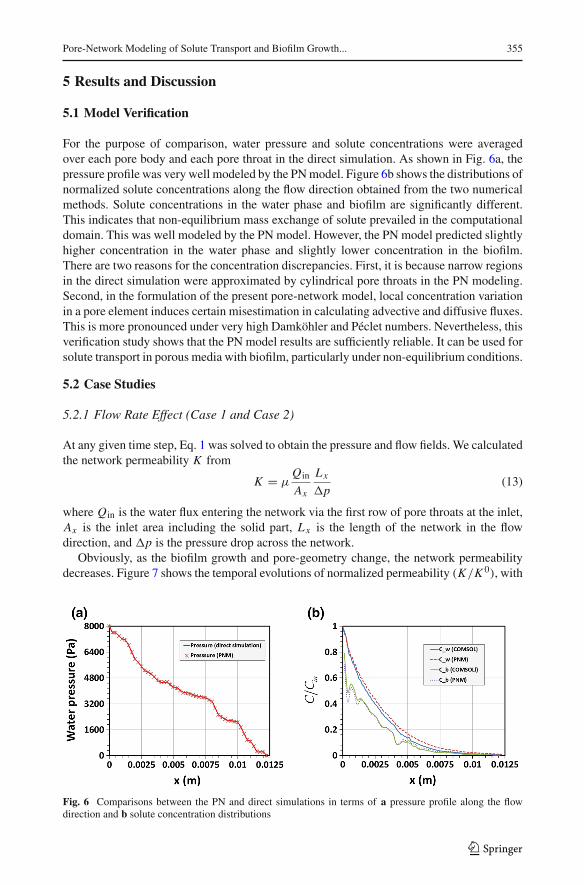
For the purpose of comparison, water pressure and solute concentrations were averagedover each pore body and each pore throat in the direct simulation. As shown in Fig. 6a, thepressure profile was very well modeled by the PNmodel. Figure 6b shows the distributions ofnormalized solute concentrations along the flow direction obtained from the two numericalmethods. Solute concentrations in the water phase and biofilm are significantly different.This indicates that non-equilibrium mass exchange of solute prevailed in the computationaldomain. This was well modeled by the PN model. However, the PN model predicted slightlyhigher concentration in the water phase and slightly lower concentration in the biofilm.There are two reasons for the concentration discrepancies. First, it is because narrow regionsin the direct simulation were approximated by cylindrical pore throats in the PN modeling.Second, in the formulation of the present pore-network model, local concentration variationin a pore element induces certain misestimation in calculating advective and diffusive fluxes.This is more pronounced under very high Damköhler and Péclet numbers. Nevertheless, thisverification study shows that the PN model results are sufficiently reliable. It can be used forsolute transport in porous media with biofilm, particularly under non-equilibrium conditions.
5.2 Case Studies
5.2.1 Flow Rate Effect (Case 1 and Case 2)
At any given time step, Eq. 1 was solved to obtain the pressure and flow fields. We calculatedthe network permeability K from
K = μQin
Ax
Lx
p(13)
where Qin is the water flux entering the network via the first row of pore throats at the inlet,Ax is the inlet area including the solid part, Lx is the length of the network in the flowdirection, and p is the pressure drop across the network.
Obviously, as the biofilm growth and pore-geometry change, the network permeabilitydecreases. Figure 7 shows the temporal evolutions of normalized permeability (K/K 0), with
Fig. 6 Comparisons between the PN and direct simulations in terms of a pressure profile along the flowdirection and b solute concentration distributions
123

356 C.-Z. Qin, S. M. Hassanizadeh
Fig. 7 Temporal evolutions of permeability and biomass content in the pore network in case 1 and case 2
Fig. 8 Distributions of cross-sectional averaged biofilm volume fraction along the flow direction at differenttimes in a case 1 and b case 2
K 0 being the initial permeability, and the absolute biomass content defined as the ratio of thevolume of all biofilm in the network to the volume of the REV. It is evident that, in responseto biofilm growth, the medium permeability in either case decreased first slowly, then sharplyto a constant value. At higher flow rate (case 2), there is a larger reduction in permeabilityto the order of 10−3. Comparing the temporal evolution of biomass content indicates thatincreasing flow rate gave rise to a much larger amount of biofilm in the network. In case2, after reaching a peak, the biomass content started to decrease. This indicates that decayof biofilm started to play a dominant role in the regions away from the inlet part due to thesolute mass transfer limitations. But, this decay did not significantly influence the evolutionof permeability.
Figure 8 shows the distributions of cross-sectional averaged biofilm volume fraction alongthe flow direction at different times. Note that the average was done over cross sections wherepore bodies are absent. In case 1, biofilm grew continuously with time close to the inlet. After2569min, severe clogging occurred at the inlet as shown in Fig. 8a. At the regions away fromthe inlet, no obvious growth of biofilm was observed mainly due to unavailability of nutrient.Increasing flow rate (case 2) considerably influenced the distribution of biofilm as shown
123
Pore-Network Modeling of Solute Transport and Biofilm Growth... 357
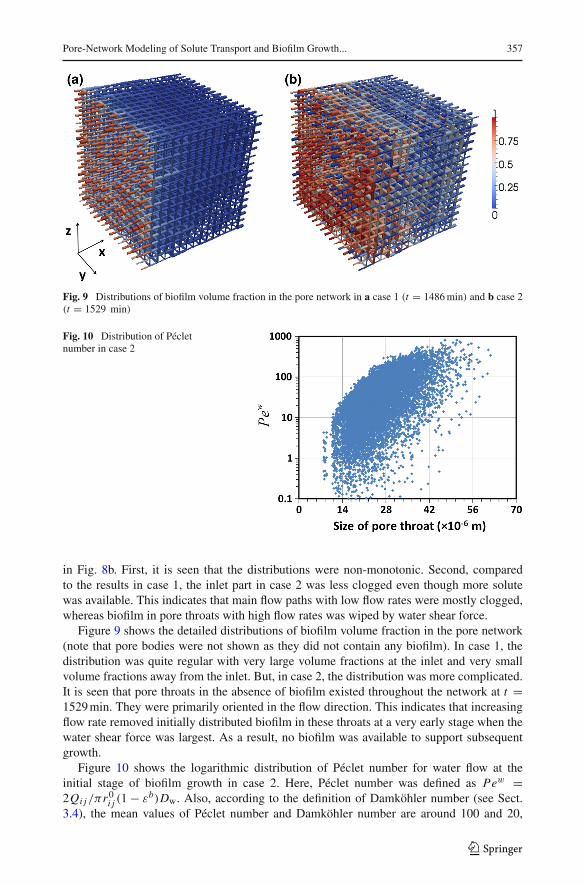
Fig. 9 Distributions of biofilm volume fraction in the pore network in a case 1 (t = 1486min) and b case 2(t = 1529 min)
Fig. 10 Distribution of Pécletnumber in case 2
in Fig. 8b. First, it is seen that the distributions were non-monotonic. Second, comparedto the results in case 1, the inlet part in case 2 was less clogged even though more solutewas available. This indicates that main flow paths with low flow rates were mostly clogged,whereas biofilm in pore throats with high flow rates was wiped by water shear force.
Figure 9 shows the detailed distributions of biofilm volume fraction in the pore network(note that pore bodies were not shown as they did not contain any biofilm). In case 1, thedistribution was quite regular with very large volume fractions at the inlet and very smallvolume fractions away from the inlet. But, in case 2, the distribution was more complicated.It is seen that pore throats in the absence of biofilm existed throughout the network at t =1529min. They were primarily oriented in the flow direction. This indicates that increasingflow rate removed initially distributed biofilm in these throats at a very early stage when thewater shear force was largest. As a result, no biofilm was available to support subsequentgrowth.
Figure 10 shows the logarithmic distribution of Péclet number for water flow at theinitial stage of biofilm growth in case 2. Here, Péclet number was defined as Pew =2Qi j/πr0i j (1 − εb)Dw. Also, according to the definition of Damköhler number (see Sect.3.4), the mean values of Péclet number and Damköhler number are around 100 and 20,
123

358 C.-Z. Qin, S. M. Hassanizadeh
Fig. 11 Distributions of solute concentrations in the water phase and biofilm at different times in a case 1and b case 2
respectively. Previous studies (Orgogozo et al. 2010) indicated that under such conditions,non-equilibrium mass exchange of solute between water phase and biofilm needed to betaken into account. This was checked by comparing distributions of normalized solute con-centrations (C/Cin) in the water phase and biofilm at different times in case 1 and case2. In case 1 (Fig. 11a), at early times (t = 752 min), local equilibrium was observed.But, at t = 1486 min, a significant difference in solute concentrations was found atthe inlet region where the biofilm volume fraction was around 0.8. In case 2 (Fig. 11b),non-equilibrium was observed even at early times (where there was small biofilm volumefraction), and it became much stronger at large volume fractions of biofilm. It is concludedthat high flow rate and large biofilm volume fraction both enhance non-equilibrium massexchange of solute between water phase and biofilm. Finally, it is noted that, in this work,we employed a relatively large bioreaction rate, in order to highlight the non-equilibriummass exchange of solute at a large Damköhler number. As a result, severe mass trans-fer limitation existed in the regions away from the inlet, and there only a small amountof biofilm was formed. Also, it can be expected that large Damköhler number and non-equilibrium condition prevail, when coarse porous medium like a pack of glass beads isunder consideration (see Pintelon et al. 2012). In general, under the condition of solutetransfer limitation, three parameters, namely Péclet number, Damköhler number, and biofilmvolume fraction, together determine how far solute mass exchange is away from local equi-librium.
5.2.2 Inlet Concentration Effect (Case 3 and Case 4)
In case 3 and case 4, inlet solute concentrations of 1 kg/m3 and 0.1 kg/m3, respectively, werespecified. These are much larger than the inlet concentration in case 1 (1.0 × 10⁻⁴ kg/m3)
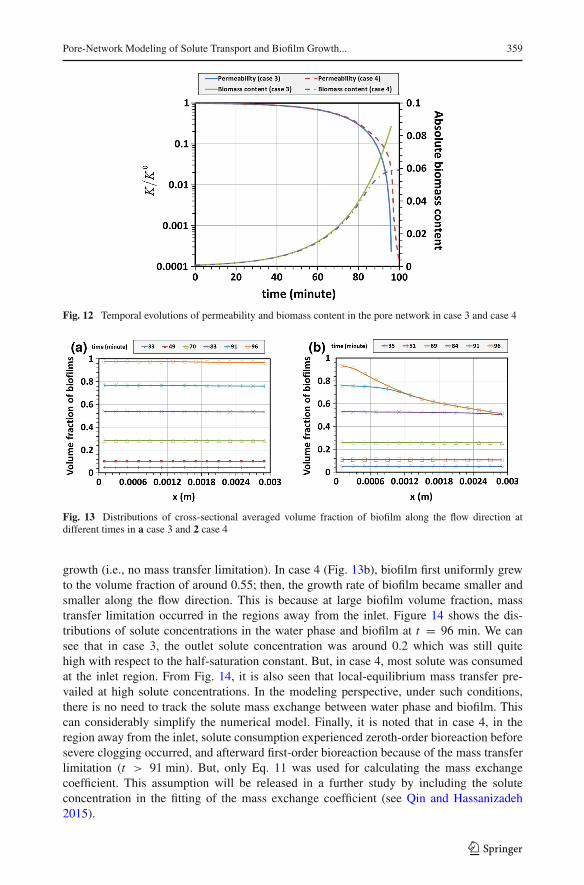
and also much larger than the half-saturation constant (0.001 kg/m3). As a result, Monodkinetics reduced to zeroth-order reaction. So, Eq. 11was used to prescribe the pore-scalemassexchange coefficient. Figure 12 shows the temporal evolutions of permeability and biomasscontent in the pore network. Compared to the results in case 1, medium permeability reducedto an extremely small value in a short time. Also, the temporal evolutions of biomass contentin the two cases indicate that the whole network was severely clogged with biofilm.
Figure 13 shows the distributions of cross-sectional averaged volume fraction of biofilmat different times. It is seen that in case 3 (Fig. 13a), biofilm grew uniformly in the wholenetwork. This is because sufficient solute was available during the whole process of biofilm
123
Pore-Network Modeling of Solute Transport and Biofilm Growth... 359
Fig. 12 Temporal evolutions of permeability and biomass content in the pore network in case 3 and case 4
Fig. 13 Distributions of cross-sectional averaged volume fraction of biofilm along the flow direction atdifferent times in a case 3 and 2 case 4
growth (i.e., no mass transfer limitation). In case 4 (Fig. 13b), biofilm first uniformly grewto the volume fraction of around 0.55; then, the growth rate of biofilm became smaller andsmaller along the flow direction. This is because at large biofilm volume fraction, masstransfer limitation occurred in the regions away from the inlet. Figure 14 shows the dis-tributions of solute concentrations in the water phase and biofilm at t = 96 min. We cansee that in case 3, the outlet solute concentration was around 0.2 which was still quitehigh with respect to the half-saturation constant. But, in case 4, most solute was consumedat the inlet region. From Fig. 14, it is also seen that local-equilibrium mass transfer pre-vailed at high solute concentrations. In the modeling perspective, under such conditions,there is no need to track the solute mass exchange between water phase and biofilm. Thiscan considerably simplify the numerical model. Finally, it is noted that in case 4, in theregion away from the inlet, solute consumption experienced zeroth-order bioreaction beforesevere clogging occurred, and afterward first-order bioreaction because of the mass transferlimitation (t > 91 min). But, only Eq. 11 was used for calculating the mass exchangecoefficient. This assumption will be released in a further study by including the soluteconcentration in the fitting of the mass exchange coefficient (see Qin and Hassanizadeh2015).
123

360 C.-Z. Qin, S. M. Hassanizadeh
Fig. 14 Distributions of solute concentrations in the water phase and biofilm at t=96min in case 3 (left axis)and case 4 (right axis)
Fig. 15 Temporal evolutions of permeability and biomass content in the pore network in case 1, case 5, andcase 6
5.2.3 Effects of Biofilm Morphology and Permeability (Case 5 and Case 6)
Figure 15 displays the temporal evolutions of permeability and biomass content in the porenetwork in case 1, case 5, and case 6. In cases 5 and 6, we assumed that the biofilm wasalso present in pore bodies. In case 6, nonzero permeability was assigned to the biofilm.Comparing case 1 and case 5 indicates that, under the operating condition given in Table 4,the assumption of continuous biofilm did not affect the temporal evolution of permeability.This is because here the permeability reduction was mainly caused by the clogging of porethroats near the inflow boundary. Also, as expected, the biomass content was approximatelydoubled in case 5. In case 6, governing equations for permeable biofilm given in Appendix1 were solved with the value of parameter X set to be 1000 (Thullner and Baveye 2008).Comparing case 5 and case 6 indicates that considering permeable biofilmdid not significantlyinfluence the temporal evolution of permeability. But, as expected, at the end, a little higher
123
Pore-Network Modeling of Solute Transport and Biofilm Growth... 361
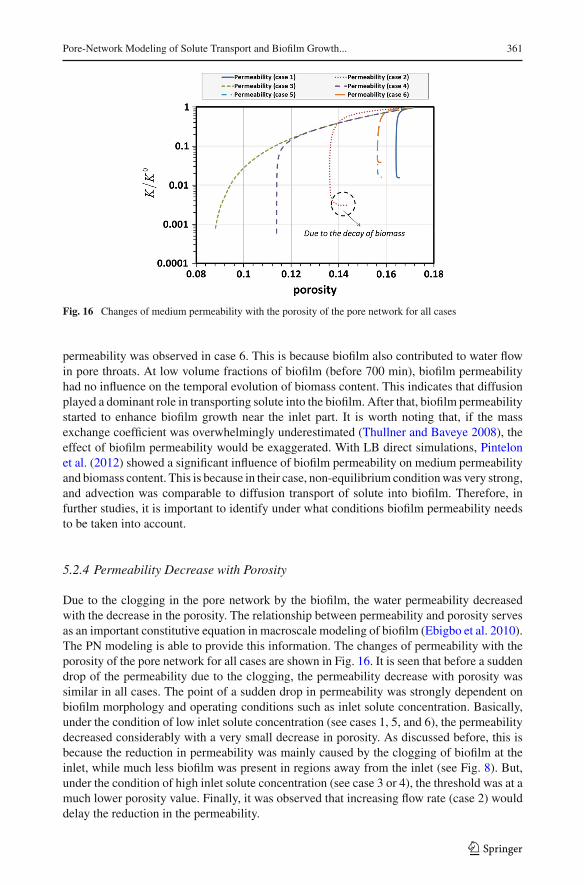
Fig. 16 Changes of medium permeability with the porosity of the pore network for all cases
permeability was observed in case 6. This is because biofilm also contributed to water flowin pore throats. At low volume fractions of biofilm (before 700 min), biofilm permeabilityhad no influence on the temporal evolution of biomass content. This indicates that diffusionplayed a dominant role in transporting solute into the biofilm. After that, biofilm permeabilitystarted to enhance biofilm growth near the inlet part. It is worth noting that, if the massexchange coefficient was overwhelmingly underestimated (Thullner and Baveye 2008), theeffect of biofilm permeability would be exaggerated. With LB direct simulations, Pintelonet al. (2012) showed a significant influence of biofilm permeability on medium permeabilityand biomass content. This is because in their case, non-equilibrium conditionwas very strong,and advection was comparable to diffusion transport of solute into biofilm. Therefore, infurther studies, it is important to identify under what conditions biofilm permeability needsto be taken into account.
5.2.4 Permeability Decrease with Porosity
Due to the clogging in the pore network by the biofilm, the water permeability decreasedwith the decrease in the porosity. The relationship between permeability and porosity servesas an important constitutive equation in macroscale modeling of biofilm (Ebigbo et al. 2010).The PN modeling is able to provide this information. The changes of permeability with theporosity of the pore network for all cases are shown in Fig. 16. It is seen that before a suddendrop of the permeability due to the clogging, the permeability decrease with porosity wassimilar in all cases. The point of a sudden drop in permeability was strongly dependent onbiofilm morphology and operating conditions such as inlet solute concentration. Basically,under the condition of low inlet solute concentration (see cases 1, 5, and 6), the permeabilitydecreased considerably with a very small decrease in porosity. As discussed before, this isbecause the reduction in permeability was mainly caused by the clogging of biofilm at theinlet, while much less biofilm was present in regions away from the inlet (see Fig. 8). But,under the condition of high inlet solute concentration (see case 3 or 4), the threshold was at amuch lower porosity value. Finally, it was observed that increasing flow rate (case 2) woulddelay the reduction in the permeability.
123
362 C.-Z. Qin, S. M. Hassanizadeh
6 Conclusions and Future Perspectives
In this work, we have developed a PNmodel for solute transport and biofilm growth in porousmedia. Compared to previous PN studies of biofilm growth, the present PN model holds twodistinctive features. First, a structure of pore networkwas used in which pore bodies representlarge pore spaces, while pore throats represent narrow regions connecting pore throats. Inthe modeling, we tracked solute concentrations in both pore bodies and pore throats. Second,a newly developed mass exchange term was implemented in the solute transport equations.Also, numerically fitted equations of mass exchange coefficient were provided. Based on anumber of case studies with the PN model, we obtained the following main conclusions.
1. Under the condition of insufficient solute supply (case 1), biofilm clogging occurred atthe inlet region. This resulted in the fast reduction in medium permeability. Increasingwater flow rate (case 2) would increase biofilm accumulation in the regions away fromthe inlet. Meanwhile, a patchy-type distribution pattern of biofilm was obtained, mainlybecause of the detachment of biofilm in some pore throats.
2. Under the condition of sufficient solute supply (case 3), biofilm grew uniformly through-out the network.
3. At high Péclet and Damköhler numbers, non-equilibrium mass exchange of solutebetween water phase and biofilm needed to be accounted for, particularly at large biofilmvolume fraction. But, equilibrium prevailed under the condition of sufficient solute sup-ply.
4. Under the operating conditions used in this work, the PN model predicted that biofilmmorphology had no significant influence on the temporal evolution of permeability. Atlow biofilm volume fractions, biofilm permeability had no influence on the temporalevolution of biomass content, because diffusion played a dominant role in transportingsolute into the biofilm. After that, biofilm permeability started to enhance biofilm growthnear the inlet part.
5. Finally, it was shown that no unique relationship between permeability and porosity wasobtained. It was strongly dependent on biofilm morphology and operating conditionssuch as the availability of solute for bioreaction.
In future studies, the following issues need to be addressed. First, instead of a regularlattice-based pore network, an irregular one with a distribution of coordinate numbers willbe generated stochastically or directly extracted from a porous medium of interest. Second,floating biomass in water phase should be accounted for. It can interact with immobile biofilmthrough attachment and detachment mechanisms. Finally, a more general equation of massexchange coefficient needs to be fitted, in order to cover a broad range of operating conditions.
Acknowledgments This research was supported by the Dutch Technology Foundation STW, which is partof the Netherlands Organisation for Scientific Research (NOW) and which is partly funded by the Ministry ofEconomic Affairs.
Open Access This article is distributed under the terms of the Creative Commons Attribution 4.0 Inter-national License (http://creativecommons.org/licenses/by/4.0/), which permits unrestricted use, distribution,and reproduction in any medium, provided you give appropriate credit to the original author(s) and the source,provide a link to the Creative Commons license, and indicate if changes were made.
123
Pore-Network Modeling of Solute Transport and Biofilm Growth... 363
Appendix 1: Governing Equations for Permeable Biofilm
When permeable biofilm is considered, following the idea used by Dupin et al. (2001);Thullner and Baveye (2008), the mass conservation of water at pore body i is
Ni∑
j
Qi j =Ni∑
j
π(r0i j
)4
8μ
⎡
⎢⎣(1 − εbi j
)2 +2εbi j −
(εbi j
)2
X
⎤
⎥⎦(pi − p j
)
Li j= 0 (14)
where Qi j is the total water flux through cylindrical pore throat ij with biofilm attachedaround solid walls and X is a parameter controlling the effect of biomass on water flow inthe biofilm. Once the pressure field is obtained, the water fluxes through the void space andbiofilm can be, respectively, calculated by
Qwi j =
π(r0i j
)4 (1 − εbi j
)2
8μ
⎡
⎣1 + 2εbi j
X(1 − εbi j
)
⎤
⎦(pi − p j
)
Li j(15)
Qbi j =
π(r0i j
)4
8μ
(εbi j
)2
X
(pi − p j
)
Li j(16)
The mass conservations of solute in water phase and biofilm at pore body i are given,respectively,
V 0i εwi
dCwi
dt= −Cw
i
Ni∑
j
max(Qwi j , 0) −
Ni∑
j
Cwi j min(Qw
i j , 0) −Ni∑
j
Dwi j A
wi j
Cwi − Cw
i j
Li j/2
−V 0i
DwDb
Dw + Dbγiξi
(Cwi − Cb
i
)(17)
V 0i εbi
dCbi
dt= −Cb
i
Ni∑
j
max(Qbi j , 0) −
Ni∑
j
Cbi j min(Qb
i j , 0) −Ni∑
j
Dbi j A
bi j
Cbi − Cb
i j
Li j/2
+V 0i
DwDb
Dw + Dbγiξi
(Cwi − Cb
i
) − V 0i εbi k
Cbi
Ks + Cbi
ρb (18)
Likewise, the mass conservations of solute in water phase and biofilm at pore throat ij aregiven, respectively,
V 0i jε
wi j
dCwi j
dt=
(Cwi − Cw
i j
)max(Qw
i j , 0) +(Cwi j − Cw
j
)min(Qw
i j , 0) + Dwi j A
wi j
Cwi − Cw
i j
Li j/2
+Dwi j A
wi j
Cwj − Cw
i j
Li j/2− V 0
i jDwDb
Dw + Dbγi jξi j
(Cwi j − Cb
i j
)(19)
V 0i jε
bi j
dCbi j
dt=
(Cbi − Cb
i j
)max(Qb
i j , 0) +(Cbi j − Cb
j
)min(Qb
i j , 0) + Dbi j A
bi j
Cbi − Cb
i j
Li j
+Dbi j A
bi j
Cbj − Cb
i j
Li j+ V 0
i jDwDb
Dw + Dbγi jξi j
(Cwi j − Cb
i j
)
−kCbi j
Ks + Cbi j
ρbV0i jε
bi j (20)
123
364 C.-Z. Qin, S. M. Hassanizadeh
Finally, with proper boundary conditions, Eqs. (14–20, 6–7) together with closure equa-tions provided in Sects. 3.2 and 3.3 can be solved for flow filed, solute concentrations, andbiofilm volume fractions in the pore network.
Appendix 2: Numerical Scheme for Solving Transport Equations of a Gen-eral Reactive Solute in a Pore Network
As to a general reactive solute, first, its mass conservation in pore body i is
VidCi
dt= −Ci
∑
j
max(Qi j , 0) −∑
j
Ci j min(Qi j , 0) −∑
j
Di j Ai jCi − Ci j
Li j/2
+ (S1i + S2i Ci
)Vi (21)
The last term on the r.h.s. represents a general sink/source term. Then, Eq. 21 can be implicitlydiscretized as
Ct+ti = −MiC
t+ti
∑
j
max(Qi j , 0) − Mi
∑
j
Ct+ti j min(Qi j , 0)
−Mi
∑
j
Bi j(Ct+ti − Ct+t
i j
)+
(S1i + S2i C
t+ti
)t + Ct
i (22)
where t is the time step, the superscripts t + t and t denote that the referred quantitiesare evaluated at current and previous time steps, respectively, Mi = t/Vi , and Bi j =2Di j Ai j/Li j .
The mass conservation of solute in pore throat ij is
Vi jdCi j
dt= (
Ci − Ci j)max(Qi j , 0) + (
Ci j − C j)min(Qi j , 0) + Bi j
(Ci − Ci j
)
+Bi j (C j − Ci j ) + (S1i j + S2i jCi j )Vi j (23)
where the last term on the r.h.s. represents a general sink/source term. Also, we implicitlydiscretize Eq. 23 to be the form
Ct+ti j = Ni j
(Ct+ti − Ct+t
i j
)max(Qi j , 0) + Ni j
(Ct+ti j − Ct+t
j
)min(Qi j , 0)
+Ni j Bi j(Ct+ti − Ct+t
i j
)+ Ni j Bi j
(Ct+t
j − Ct+ti j
)
+(S1i j + S2i jCt+ti j )t + Ct
i j (24)
123
Pore-Network Modeling of Solute Transport and Biofilm Growth... 365
where Ni j = t/Vi j . For the substitution of Eqs. 24 into 22 to eliminate Ct+ti j , we obtain
the following discretized equation for solute concentrations in pore bodies:⎡
⎣1 + Mi
∑
j
max(Qi j , 0
) + Mi
∑
j
Bi j − S2i t
−Mi
∑
j
Ni j Bi j(Bi j + ∣∣Qi j
∣∣)
1 + Ni j∣∣Qi j
∣∣ + 2Ni j Bi j − S2i jt
⎤
⎦Ct+ti
=⎡
⎣Mi
∑
j
Ni j(Bi j − min(Qi j , 0)
)2
1 + Ni j∣∣Qi j
∣∣ + 2Ni j Bi j − S2i jt
⎤
⎦Ct+tj + Ct
i + S1i t
+Mi
∑
j
(Bi j − min(Qi j , 0)
) (S1i jt + Ct
i j
)
1 + Ni j∣∣Qi j
∣∣ + 2Ni j Bi j − S2i jt(25)
Finally, with proper boundary conditions for inlet and outlet pore bodies, we solve forsolute concentrations in all pore bodies. Once Ct+t
i is obtained, Ct+ti j can be calculated
from Eq. 24.
References
Afrapoli, M.S., Alipour, S., Torsaeter, O.: Fundamental study of pore scale mechanisms in microbial improvedoil recovery processes. Transp. Porous Media 90, 949–964 (2011)
Al-Kharusi, A.S., Blunt, M.J.: Network extraction from sandstone and carbonate pore space images. J. Pet.Sci. Technol. 56, 219–231 (2007)
Aris, R.: On the dispersion of a solute in a fluid flowing through a tube. Proc. R. Soc. Lond. A (1956). doi:10.1098/rspa.1956.0065
Baveye, P., Valocchi, A.: An evaluation ofmathematical models of the transport of biologically reacting solutesin saturated soils and aquifers. Water Resour. Res. 25, 1413–1421 (1989)
Baveye, P., Vandevivere, P., Hoyle, B.L., DeLeo, P.C.: Sanchez de Lozada D.: Environmental impact andmechanisms of the biological clogging of saturated soils and aquifer materials. Crit. Rev. Environ. Sci.Technol. 28, 123–191 (1998)
Blunt, M.J.: Flow in porous media-pore-network models and multiphase flow. Curr. Opin. Colloid InterfaceSci. 6, 197–207 (2001)
Boltz, J.P., Morgenroth, E., Sen, D.: Mathematical modeling of biofilms and biofilm reactors for engineeringdesign. Water Sci. Technol. 62, 1821–36 (2010)
Bottero, S., Storck, T., Heimovaara, T.J., van Loosdrecht, M.C.M., Enzien, M.V., Picioreanu, C.: Biofilmdevelopment and the dynamics of preferential flow paths in porous media. Biofouling 29, 1069–1086(2013)
Budek, A., Szymczak, P.: Network models of dissolution of porous media. Phys. Rev. E 86, 056318 (2012)Cherblanc, F., Ahmadi, A., Quintard, M.: Two-domain description of solute transport in heterogeneous porous
media: comparison between theoretical predictions and numerical experiments. Adv. Water Resour. 30,1127–1143 (2007)
Cunningham, A.B., Characklis,W.G., Abedeen, F., Crawford, D.: Influence of biofilm accumulation on porousmedia hydrodynamics. Environ. Sci. Technol. 25, 1305–1311 (1991)
Cunningham, J.A., Mendoza-Sanchez, I.: Equivalence of two models for biodegradation during contaminanttransport in groundwater. Water Resour. Res. 42, W02416 (2006)
Chambless, J.D., Steward, P.S.: A three-dimensional computer model analysis of three hypothetical biofilmdetachment mechanisms. Biotechnol. Bioeng. 97, 1573–1584 (2007)
Dunsmore, B.C., Bass, C.J., Lappin-Scott, H.M.: A novel approach to investigate biofilm accumulation andbacterial transport in porous matrices. Environ. Microbiol. 6, 183–187 (2004)
Davit, Y., Debenest, G., Wood, B.D., Quintard, M.: Modeling non-equilibrium mass transport in biologicallyreactive porous media. Adv. Water Resour. 33, 1075–1093 (2010)
123

366 C.-Z. Qin, S. M. Hassanizadeh
Dillon, R., Fauci, L.: A microscale model of bacterial and biofilm dynamics in porous media. Biotechnol.Bioeng. 68, 536–547 (2000)
Dykaar, B., Kitanidis, P.K.: Macrotransport of a biologically reacting solute through porous media. WaterResour. Res. 32, 307–320 (1996)
Dupin, H.J., Kitanidis, P.K., McCarty, P.L.: Simulations of two-dimensional modeling of biomass aggregategrowth in network models. Water Resour. Res. 37, 2981–2994 (2001)
Ebigbo, A., Helmig, R., Cunningham, A.B., Class, H., Gerlach, R.: Modelling biofilm growth in the presenceof carbon dioxide and water flow in the subsurface. Adv. Water Resour. 33, 762–781 (2010)
Ebigbo, A., Phillips, A., Gerlach, R., Helmig, R., Cunningham, A.B., Class, H., Spangler, L.H.: Darcy-scalemodeling of microbially induced carbonate mineral precipitation in sand columns. Water Resour. Res.48, W07519 (2012)
Ezeuko, C.C., Sen, A., Grigoryan, A., Gates, I.D.: Pore-network modeling of biofilm evolution in porousmedia. Biotechnol. Bioeng. 108, 2413–2423 (2011)
Graf von der Schulenburg, D.A., Pintelon, T.R.R., Picioreanu, C., Van Loosdrecht, M.C.M., Johns, M.L.:Three-dimensional simulations of biofilm growth in porous media. AIChE J. 55, 494–504 (2009)
Golfier, F., Wood, B.D., Orgogozo, L., Quintard, M., Bues, M.: Biofilm in porous media: development ofmacroscopic transport equations via volume averagingwith closure for localmass equilibrium conditions.Adv. Water Resour. 32, 463–485 (2009)
Iltis, G.C., Armstrong, R.T., Jansik, D.P., Wood, B.D., Wildenschild, D.: Imaging biofilm architecture withinporous media using synchrotron-based X-ray computed microtomography. Water Resour. Res. 47,W02601 (2011)
Jiang, Z., van Dijke, M.I.J., Wu, K., Couples, G.D., Sorbie, K.S., Ma, J.: Stochastic pore network generationfrom 3D rock images. Transp. Porous Med. 94, 571–593 (2012)
Kapellos, G.E., Alexiou, T.S., Payatakes, A.C.: Hierarchical simulator of biofilm growth and dynamics ingranular porous materials. Adv. Water Resour. 30, 1648–1667 (2007)
Kim, S., Corapcioglu, M.Y.: The role of biofilm growth in bacteria-facilitated contaminant transport in porousmedia. Transp. Porous Media 26, 161–181 (1997)
Kim, D.S., Fogler, H.S.: Biomass evolution in porous media and its effect on permeability under starvationconditions. Biotechnol. Bioeng. 69, 47–56 (2000)
Li, L., Peters, C.A., Celia, M.A.: Upscaling geochemical reaction rates using pore-scale network modeling.Adv. Water Resour. 29, 1351–1370 (2006)
MarDonald, T.R., Kitanidis, P.K., McCarty, P.L., Roberts, P.V.: Mass-transfer limitations for macroscale biore-mediation modeling and implications on aquifer clogging. Ground Water 37, 523–531 (1999)
Mitchell, A.C., Phillips, A.J., Hiebert, R., Gerlach, R., Spangler, L.H., Cunningham, A.B.: Biofilm enhancedgeologic sequestration of supercritical CO2. Int. J. Greenh. Gas Control 3, 90–99 (2009)
Orgogozo, L., Golfier, F., Bues, M., Quintard, M.: Upscaling of transport processes in porous media withbiofilms in non-equilibrium conditions. Adv. Water Resour. 33, 585–600 (2010)
Pintelon, T.R.R., Graf von der Schulenburg, D.A., Johns, M.L.: Towards optimum permeability reduction inporous media using biofilm growth simulations. Biotechnol. Bioeng. 103, 767–779 (2009)
Pintelon, T.R.R., Picioreanu, C., van Loosdrecht, M.C.M.: The effect of biofilm permeability on bio-cloggingof porous media. Biotechnol. Bioeng. 109, 1031–1042 (2012)
Potekhina, J.S., Sherisheva, N.G., Povetkina, L.P., Pospelov, A.P., Rakitina, T.A.,Warnecke, F., Gottschalk, G.:Role ofmicroorganisms in corrosion inhibition ofmetals in aquatic habitats. Appl.Microbial. Biotechnol.52, 639–646 (1999)
Qin, C.Z., Hassanizadeh, S.M.: 2014 Solute mass exchange between water phase and biofilm for a single pore.Transp. Porous Media 109, 255–278 (2015)
Raoof, A., Hassanizadeh, S.M.: A new method for generating pore-network models of porous media. Transp.Porous Media 81, 391–407 (2010)
Raoof, A., Nick, H.M., Wolterbeek, T.K.T., Spiers, C.J.: Pore-scale modeling of reactive transport in wellborecement under CO2 storage conditions. Int. J. Greenh. Gas Control. 11, s67–s77 (2012)
Rittmann, B.E.: The significance of biofilms in porous media. Water Resour. Res. 29, 2195–2202 (1993)Rosenzweig, R., Shavit, U., Furman, A.: The influence of biofilm spatial distribution scenarios on hydraulic
conductivity of unsaturated soils. Vadose Zone J. 8, 1080–1084 (2009)Stewart, T.L., Kim, D.S.: Modeling of biomass-plug development and propagation in porous media. Biochem.
Eng. J. 17, 107–119 (2004)Suchomel, B.J., Chen, B., Allen, M.B.: Network model of flow, transport and biofilm effects in porous media.
Transp. Porous Media 30, 1–23 (1998a)Suchomel, B.J., Chen, B., Allen, M.B.: Macroscale properties of porous media from a network model of
biofilm processes. Transp. Porous Media 31, 39–66 (1998b)
123
Pore-Network Modeling of Solute Transport and Biofilm Growth... 367
Taylor, S.W., Jaffe, P.R.: Substrate and biomass transport in a porous medium. Water Resour. Res. 26, 2181–2194 (1990)
Taylor, S.W., Milly, P.C.D., Jaffe, P.R.: Biofilm growth and the related changes in the physical properties of aporous medium: 2. permeability. Water Resour. Res. 26, 2161–2169 (1990)
Thullner, M., Baveye, P.: Computational pore network modeling of the influence of biofilm permeability onbioclogging in porous media. Biotechnol. Bioeng. 99, 1337–1351 (2008)
Thullner,M., Zeyer, J., Kinzelbach,W.: Influence ofmicrobial growth on hydraulic properties of pore networks.Transp. Porous Media 49, 99–122 (2002)
Vandevivere, P., Baveye, P., Sanchez de Lozada, D., DeLeo, P.: Microbial clogging of saturated soils andaquifer materials: evaluation of mathematical models. Water Resour. Res. 31, 2173–2180 (1995)
Videla, H.A., Herrera, L.K.: Understanding microbial inhibition of corrosion: a comprehensive overview. Int.Biodeterior. Biodegrad. 63, 896–900 (2009)
Van Noorden, T.L., Pop, I.S., Ebigbo, A., Helmig, R.: An upscaled model for biofilm growth in a thin strip.Water Resour. Res. 46, W06505 (2010)
Xu, Z.J., Meakin, P., Tartakovsky, A., Scheibe, T.D.: Dissipative-particle-dynamics model of biofilm growth.Phys. Rev. E 83, 066702 (2011)
Zysset, A., Stauffer, F., Dracos, T.: Modeling of reactive groundwater transport governed by biodegradation.Water Resour. Res. 30, 2423–2434 (1994)
Zuo, R.J.: Biofilms: strategies for metal corrosion inhibition employing microorganisms. Appl. Microbial.Biotechnol. 76, 1245–1253 (2007)
123


![Lateral subsurface stormflow and solute transport in a ... · models to describe subsurface stormflow in forest soils [e.g., Weiler and McDonnell, 2007]. A number of two pore domain](https://img.pdfslide.us/doc/110x75/5f87997e49cbb21cb35ee959/lateral-subsurface-stormflow-and-solute-transport-in-a-models-to-describe-subsurface.jpg)