Embed Size (px)
Citation preview

Advances in Water Resources 29 (2006) 1351–1370
www.elsevier.com/locate/advwatres
Upscaling geochemical reaction rates using pore-scalenetwork modeling
Li Li, Catherine A. Peters *, Michael A. Celia
Department of Civil and Environmental Engineering, Princeton University, Princeton, NJ 08544, USA
Received 19 May 2005; received in revised form 14 October 2005; accepted 20 October 2005Available online 6 December 2005
Abstract
Geochemical reaction rate laws are often measured using crushed minerals in well-mixed laboratory systems that are designed toeliminate mass transport limitations. Such rate laws are often used directly in reactive transport models to predict the reaction andtransport of chemical species in consolidated porous media found in subsurface environments. Due to the inherent heterogeneities ofporous media, such use of lab-measured rate laws may introduce errors, leading to a need to develop methods for upscaling reactionrates. In this work, we present a methodology for using pore-scale network modeling to investigate scaling effects in geochemicalreaction rates. The reactive transport processes are simulated at the pore scale, accounting for heterogeneities of both physicaland mineral properties. Mass balance principles are then used to calculate reaction rates at the continuum scale. To examine thescaling behavior of reaction kinetics, these continuum-scale rates from the network model are compared to the rates calculatedby directly using laboratory-measured reaction rate laws and ignoring pore-scale heterogeneities. In this work, this methodologyis demonstrated by upscaling anorthite and kaolinite reaction rates under simulation conditions relevant to geological CO2 seques-tration. Simulation results show that under conditions with CO2 present at high concentrations, pore-scale concentrations of reac-tive species and reaction rates vary spatially by orders of magnitude, and the scaling effect is significant. With a much smaller CO2
concentration, the scaling effect is relatively small. These results indicate that the increased acidity associated with geological seques-tration can generate conditions for which proper scaling tools are yet to be developed. This work demonstrates the use of pore-scalenetwork modeling as a valuable research tool for examining upscaling of geochemical kinetics. The pore-scale model allows theeffects of pore-scale heterogeneities to be integrated into system behavior at multiple scales, thereby identifying important factorsthat contribute to the scaling effect.� 2005 Elsevier Ltd. All rights reserved.
Keywords: Pore-scale network modeling; Reactive transport modeling; Upscaling; Geochemical kinetics; Geological CO2 sequestration
1. Introduction
Geochemical modeling of reactive transport of chem-ical species in subsurface systems has been widelyapplied to improve our understanding of the complexprocesses involved in fluid–rock interactions [1–3], andto solve environmental problems related to groundwaterand subsurface contamination [4–7]. Reactive transport
0309-1708/$ - see front matter � 2005 Elsevier Ltd. All rights reserved.doi:10.1016/j.advwatres.2005.10.011
* Corresponding author. Tel.: +1 609 2585645; fax: +1 609 2582799.E-mail address: [email protected] (C.A. Peters).
modeling is generally classified into forward modelingand inverse modeling [8]. Forward modeling predictsthe transport and reaction of chemical species givenspecified geochemical reactions and reaction rate param-eters. Inverse modeling utilizes measured chemical com-positions to infer geochemical reactions that haveoccurred along flow paths. These two types of modelingapproaches serve as powerful tools to understand, pre-dict, and interpret reactive transport of chemical speciesin subsurface environments, and provide insights intopossible regulation and management strategies.

1352 L. Li et al. / Advances in Water Resources 29 (2006) 1351–1370
Because reactive transport modeling is typicallyapplied at large scales, it necessarily ignores spatial het-erogeneities at scales smaller than the size of model dis-cretization. For mineral dissolution and precipitation,there is a mismatch between the scale at which rate dataare needed (the scale of model discretization) and thescale for which rate data are available. Mineral dissolu-tion and precipitation is typically modeled using geo-chemical reaction kinetics measured in laboratorysystems that are very different from natural systems. Inthe laboratory, geochemical reaction rates are typicallymeasured in well-mixed systems using crushed mineralsuspensions [9]. These experiments are intentionallydesigned to homogenize mineral samples and to elimi-nate aqueous-phase mass transport limitations. Thisway the aqueous concentrations reflect reaction progressand can be used to determine the forms and parametersof reaction rate laws. Such rate laws accurately deter-mine the so-called surface-controlled reaction kinetics,but they provide limited information about reactionrates in consolidated porous media.
Natural porous media, such as sedimentary rocks andother geological media encountered in subsurface for-mations, are inherently heterogeneous [10]. They aremixtures of solid matrix and void space, with the latterconsisting of interconnected pores of different shapes,volumes, and surface areas. Furthermore, the mineralcomposition of surfaces may vary from pore to pore.These pore-to-pore heterogeneities, hereafter referredto as pore-scale heterogeneities, can produce variabili-ties in the transport and reaction processes that takeplace within a porous medium, and can result in spatialvariations in aqueous concentrations and reaction rates.In such heterogeneous systems, the laboratory-measuredgeochemical reaction kinetics may not be applicable atthe scale of intact porous media. Consequently, spatialheterogeneities at scales smaller than the scale of discret-ization may be important in determining mineral disso-lution and precipitation in reactive transport modeling.
Such scaling effects have been termed ‘‘non-classical’’behavior as they cannot be predicted by existing theoriesinferred from laboratory systems [11]. They may beamong the potential causes of the oft-cited and dis-cussed field-lab discrepancy, namely, the observedorder-of-magnitude differences between lab-measuredreaction rates and those derived from field measure-ments [12–16]. In particular, the scaling effect of geo-chemical reaction kinetics has been observed in severalstudies. For example, Szecsody et al. [17] observed thatfor reactions of CoII/IIIEDTA with Fe oxide-containingsediments, the reaction parameters measured in batchexperiments could not be applied directly to describethe reactive transport processes in column experiments,due to the pore-scale heterogeneity in adsorption sites.They found that stochastic modeling efforts that incor-porated pore-scale heterogeneity did reproduce the
observations. Lichtner and Tartakovsky [18] used vol-ume-averaging methods to upscale the reaction rate con-stants for quartz dissolution, incorporating theheterogeneity in mineral grain size. They found that,contrary to the usual modeling assumptions, theupscaled effective reaction rate constants varied as afunction of time, which is attributed to heterogeneousdistribution of grain sizes.
In this work, we present a methodology to exploreupscaling of geochemical reaction kinetics using pore-scale network modeling. A pore-scale network modelis one that discretizes the void space of a porous mediuminto a collection of pores within an interconnected net-work. Such models have been widely used to explore avariety of phenomena related to multiphase flow in por-ous media [19–21], including, for example, drying pro-cesses [22–25], moisture transport [26], and bubbletransport [27]. In recent years, pore-scale network mod-els have also been applied to examine problems concern-ing chemical and biological processes, such asdissolution of organic liquids [28–32], biomass growth[33–38], adsorption [39,40], and the formation of worm-holes in porous media [41]. However, this approach hasnever been used to address scaling questions associatedwith geochemical reaction kinetics. As such, this workpresents a novel application of pore-scale networkmodeling.
Within the pore network constructed for this work,the individual pores are considered to be homogeneoussystems. Reactive transport processes are simulated atthe pore scale, incorporating variations in chemicaland physical properties from pore to pore. Using massbalance principles, the continuum-scale reaction ratesare obtained from the network model and are comparedto continuum-scale rates calculated by ignoring pore-scale details and using laboratory-measured reactionkinetics directly. In addition, we use volume-averagingprinciples to quantify the errors that may occur whenfield measured concentrations are used in inverse model-ing. The differences between these continuum-scale ratesquantify the scaling effect of geochemical reactionkinetics.
This work focuses on the reaction kinetics of mineralsthat are considered to be important in the context ofgeological sequestration of CO2. In geological sequestra-tion, CO2 is injected into deep subsurface formationsand trapped by a variety of mechanisms [42–44]. Studieshave found that, for both geological sequestration andnatural long-term regulation of atmospheric CO2 levels,Ca- and Mg-rich feldspars provide the primary sinks forthe net consumption of CO2 [45–51]. In this work, wefocus on a Ca-rich feldspar, anorthite, as the model min-eral, with kaolinite as the coexisting reactive mineral.The reactions of interest are those that would occurunder the acidic conditions created when CO2 dissolvesin formation waters under high pressures. The reaction
L. Li et al. / Advances in Water Resources 29 (2006) 1351–1370 1353
system is an idealized case from the geochemical point ofview, but one which is illustrative in that it makes use ofthe typical nonlinear rates and equilibrium expressions.Application of the pore-scale network model is demon-strated by upscaling reaction kinetics of anorthite andkaolinite under simulation scenarios that are relevantto geological CO2 sequestration.
In the remainder of this paper, we first present thelaboratory-measured reaction rate laws for anorthiteand kaolinite. The methodology to simulate reactivetransport processes at the pore scale is then described,followed by construction of the network model. Afterthat we discuss the methodology to calculate the contin-uum-scale reaction rates. Two simulation scenarios rele-vant to CO2 sequestration are then described: oneinvolving high acidity and one involving moderate acid-ity. Finally, we present the simulation results, explainthe reasons for the observed scaling effects, and discusstheir implications for reactive transport modeling.
2. The reaction rate laws
2.1. Theory of reaction rate laws
Reaction rate laws are functions that relate mineraldissolution and precipitation rates to the concentrationsof aqueous species involved in the reactions (althoughsome rate laws have been described as functions of con-centrations of sorbed species [52,53]). Based on transi-tion state theory and the principle of detailedbalancing, reaction rate laws take the following generalnonlinear form [9]:
r ¼ kY
s
fsgns f ðDGÞ; ð1Þ
where r is the reaction rate (mol cm�2 s�1); k is the reac-tion rate constant; s represents a chemical species thathas catalytic or prohibitory effects on the reaction; {s}denotes the activity of species s, the product of the activ-ity coefficient and the aqueous concentration [s]; and ns
is a constant that describes the degree of rate depen-dence on {s}. The saturation state function f(DG) cap-tures the dependence on the activities of chemicalspecies that directly participate in the reaction.
For the expression of f(DG), the following practicalform is used in this work [9]:
f ðDGÞ ¼ 1� Xm; ð2Þwhere X is the saturation state, and m is a constant thatdescribes the dependence of rate on saturation state. Themagnitude of the saturation state X is an indicator ofhow far away the reaction is from equilibrium. Theoret-ically, it is equal to the ratio of the ionic activity prod-uct, IAP, to the equilibrium constant, Keq. As thevalue of X usually covers orders of magnitude, the satu-
ration index, SI = logX, is often used to quantify themagnitude of the saturation state. If X < 1, thenSI < 0, and the net reaction is dissolution; otherwise,the net reaction is precipitation. If X = 1 and SI = 0,the reaction is at equilibrium.
Mineral dissolution and precipitation reactions aregenerally driven by several different parallel mecha-nisms, with each catalyzed by a different chemical spe-cies, for instance, H+, H2O, and OH�. The rate lawfor each mechanism takes the same general form as inEq. (1):
rH ¼ kHfHþgnHð1� XmÞ; ð3ÞrH2O ¼ kH2Oð1� XmÞ; ð4ÞrOH ¼ kOHfOH�gnOHð1� XmÞ. ð5Þ
The total reaction rate is the sum of these three:
r ¼ rH þ rH2O þ rOH. ð6ÞThe value of rH dominates under acidic conditions, andrOH dominates under alkaline conditions. There may ormay not be neutral conditions where the rate is domi-nated by rH2O, depending on the relative magnitude ofthese rates. The full reaction rate law requires the fol-lowing kinetic parameters: the reaction rate constants,kH, kH2O and kOH; the degrees of rate dependence onpH, nH and nOH; and the degree of dependence on satu-ration state, m.
2.2. Anorthite and kaolinite reactions
In this section, we review the literature on anorthiteand kaolinite reaction rates and establish the rate lawsused in the present work. The anorthite reaction is asfollows:
CaAl2Si2O8(s) + 8Hþ�Ca2þ+ 2Al3þ+ 2H4SiO4.
It is well known that under conditions far from equilib-rium (i.e., X� 1), the anorthite dissolution rate dependson proton activity in acidic conditions [54]. Examinationof published experimental data of anorthite dissolutionkinetics suggests that the degree of dependence, nH, var-ies from 1 to 3 [55–57]. In this work, we use kineticparameters measured by Oelkers and Schott [57], whoobserved that at 25 �C the reaction order of anorthitedissolution with respect to {H+} is 1.5 under acidic con-ditions. For neutral conditions, we use the reported va-lue for kH2O of 10�15.6 mol cm�2 s�1 [55]; this value isnearly identical to that reported by Helgeson et al.[58]. For alkaline conditions, we use data from Bradyand Walther [56], who observed that the exponentdescribing rate dependence on {OH�} is 0.33. As anor-thite dissolution is thermodynamically favorable in mostenvironments and almost never reaches equilibrium,there are no data on the form of its saturation statefunction. For completeness we include a saturation state

Table 1Reaction kinetic parameters at 25 �C
logk (mol cm�2 s�1) nH nOH m Ea (kJ mol�1)
logkH log kH2O logkOH
Anorthite �7.32a �15.6b �17.5c 1.5a 0.33c 1.0 �18.4a
Kaolinite �14.8d – �19.7e 0.4d 0.3e 0.9f �29.3d
a Data from Oelkers and Schott [57], based on measurements for pH 2.4–3.2.b Data from Amrhein and Suarez [55] and Helgeson et al. [58], based on measurements for pH 5–9.c Data from Brady and Walther [56], based on compiled data from various measurements for pH 7–12.d Data from Ganor et al. [59], based on measurements for pH 2–4.2.e Data from Carrol and Walther [60], based on measurements for pH 7–12.f Data from Nagy et al. [61], based on measurements for pH around 3.
0 2 4 6 8 10 12 14
–18
–16
–14
–12
–10
–8
pH
log
10 r
(m
ol c
m–2
s–1
)
Anorthite
Kaolinite
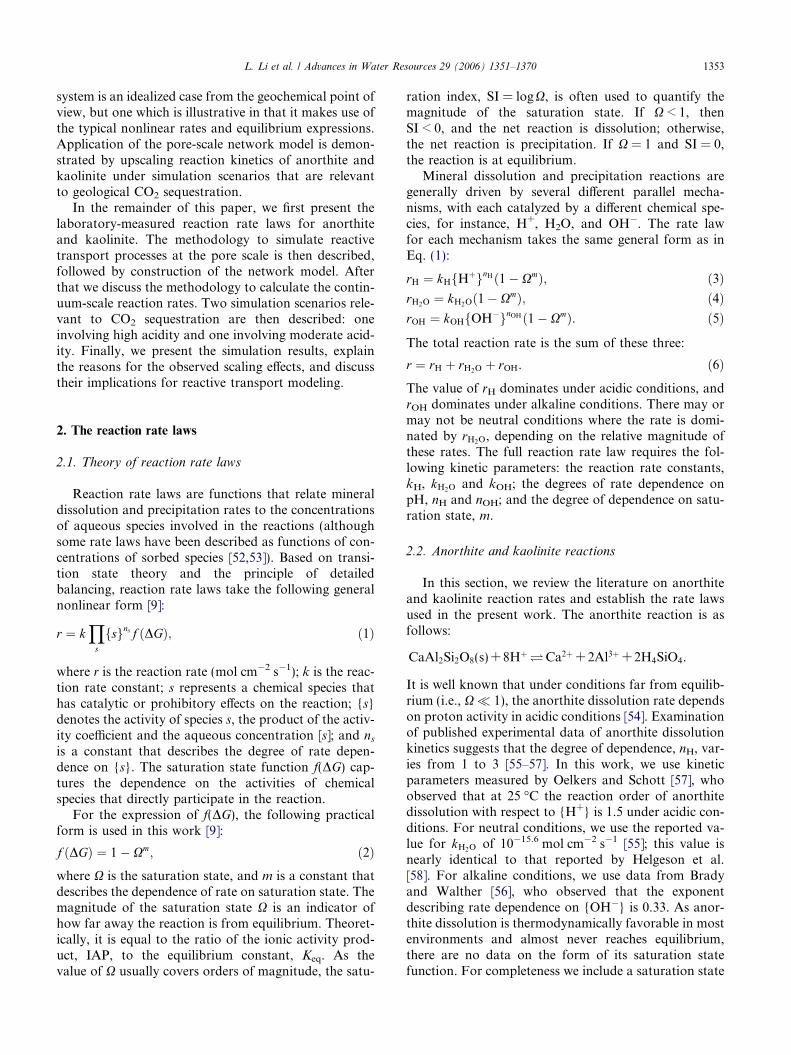
Fig. 1. Dissolution rates of anorthite and kaolinite as a function of pHunder conditions far from equilibrium using the parameters summa-rized in Table 1.
1354 L. Li et al. / Advances in Water Resources 29 (2006) 1351–1370
function, and use Eq. (2), assuming m = 1. Combiningall these parameters (summarized in Table 1), the anor-thite reaction rate law takes the following form:
rA ¼ ðkHfHþg1:5 þ kH2O þ kOHfOH�g0:33Þð1� XAÞ; ð7Þwith the expression for the saturation state for the anor-thite reaction as follows:
XA ¼fCa2þgfAl3þg2fH4SiO4g2
fHþg8Keq;A
; ð8Þ
where Keq,A is the equilibrium constant of anorthitereaction.
The kaolinite reaction is
Al2Si2O5(OH)4(s) + 6Hþ� 2Al3þ+ 2H4SiO4 + H2O.
Examination of kinetics for kaolinite dissolution farfrom equilibrium reveals that the kaolinite reaction ratedoes not have an obvious pH-independent region [60].Under acidic conditions, the kaolinite dissolution rateis reported to be proportional to {H+} raised to thepower of 0.35–0.40 [59,60]. In this work, a value of 0.4is used, based on data from Ganor et al. [59]. The liter-ature on the kaolinite dissolution rate under alkalineconditions suggests that the rate dependence on{OH�} is approximately 0.3 [60], which is the value usedin this work. Using the saturation state function fromNagy et al. [61] and assuming that the principle of de-tailed balancing applies, the overall reaction rate lawof kaolinite is as follows:
rK ¼ ðkHfHþg0:4 þ kOHfOH�g0:3Þð1� X0:9K Þ; ð9Þ
with the following expression for the saturation state forkaolinite reaction:
XK ¼fAl3þg2fH4SiO4g2
fHþg6Keq;K
; ð10Þ
where Keq,K is the kaolinite dissolution reaction equilib-rium constant. The values of all the kinetic parametersare listed in Table 1. The thermodynamic parametersare discussed in Section 5.
The dissolution rates of both minerals as a functionof pH at conditions far from equilibrium are shown in
Fig. 1. Of these two reactions, anorthite dissolutionhas the larger magnitude, leading to the fast release ofCa2+, Al3+, and H4SiO4. As a result, in a system wherethese two minerals coexist, the net reaction of kaoliniteis mainly precipitation, consuming the Al3+ and H4SiO4
released by anorthite dissolution.
3. Pore-scale network modeling
In pore-scale network modeling, the processes ofinterest are simulated in individual pores, and informa-tion at the pore scale is summed up and averagedover the network to obtain descriptions of processes atthe continuum scale. In this way a pore-scale networkmodel serves as a computational tool to upscale pro-cesses from the pore scale to the continuum scale. Thissection presents (i) the equations for reaction and trans-port at the pore scale, (ii) the construction of the porenetwork, including parameter specification for porousmedium properties, and (iii) the method for flow fieldcalculation.

L. Li et al. / Advances in Water Resources 29 (2006) 1351–1370 1355
3.1. Reactive transport processes at the pore scale
Within each pore, the mass of each species in theaqueous phase changes due to transport (advectionand diffusion) and reaction processes. The relevant reac-tions include aqueous reactions, which are considered tobe instantaneous, and mineral dissolution and precipita-tion reactions, which are described kinetically. Examina-tion of different aqueous reactions have shown thatthere are nine important instantaneous reactions,including the water dissociation reaction, and the speci-ation reactions of carbon-bearing species, silica-bearingspecies, and aluminum-bearing species. The two kineticreactions include the dissolution and precipitation ofanorthite and kaolinite. All reactions and their equilib-rium constants are listed in Table 2. In total 14 aqueousspecies are involved in these reactions: Ca2+; H+; OH�;the carbon-bearing species H2CO�3, HCO�3 , CO2�
3 ; thesilica-bearing species H4SiO4, H3SiO�4 , H2SiO2�
4 ; andthe aluminum-containing species Al3+, Al(OH)2+,AlðOHÞþ2 , Al(OH)3, AlðOHÞ�4 .
The aqueous concentrations are assumed to be spa-tially uniform on the scale of an individual pore. Thisassumption is justified by the calculation of a Damkoh-ler number, a dimensionless number which compares therelative rates of reaction and transport [62,1]. In thiscontext, the Damkohler number is defined as the ratioof the mineral surface reaction rate to the molecular dif-fusion rate in an average pore. The fastest reaction ofconcern is anorthite dissolution under the most acidiccondition. The reaction rate is calculated as the productof the area-normalized reaction rate and the averageanorthite surface area (3.0 · 10�2 cm2). At pH = 2.9the area-normalized anorthite dissolution rate usingEq. (7) is 10�11.6 mol cm�2 s�1 so the average anorthitedissolution rate is on the order of 10�13.3 mol s�1 perpore. The diffusion rate is estimated using the expressionD� Ac � DC
l , with D being the diffusion coefficient(approximately 10�4 cm�2 s�1 for hydrogen ion [9]), l
being the length of the pore (0.017 cm), Ac being the
Table 2Reactions of interest, and their equilibrium constants adjusted to current sim
Reactions
Kinetic reactions CaAl2Si2O8(s) + 8H+� C
Al2Si2O5(OH)4(s) + 6H+�
Instantaneous reactions H2O�H+ + OH�
H2CO�3�HCO�3 þHþ
HCO�3�CO2�3 þHþ
H4SiO4�H3SiO�4 þHþ
H3SiO�4�H2SiO2�4 þHþ
Al3+ + OH�� Al(OH)2+
AlðOHÞ2þ þOH��AlðOHAlðOHÞþ2 þOH��AlðOHAlðOHÞ3 þOH��AlðOH
a The method of adjustment is described in Section 5.
characteristic cross-sectional area for diffusion in a pore,conservatively estimated as l2, and DC (mol cm�3) beingthe difference in concentrations at the center of the poreand at locations close to the mineral surface. For hydro-gen ion, DC is approximately 10�5.9 mol cm�3 at pH of2.9, which leads to the diffusion rate of 10�11.6 mol s�1.This rate is approximately 1.7 orders of magnitude lar-ger than the reaction rate. This relatively fast diffusionrate, combined with the much faster advection rate, issufficient to eliminate the concentration gradient withinthe fluid in individual pores.
The mass balance equations describing the masschange of chemical species within individual pores weredeveloped following Lichtner�s systematic formulationfor multicomponent systems that involve both kineti-cally controlled and instantaneous reactions [63,64].We chose to develop the mass balance equations for fivekey components: Ca2+, CT, SiT, AlT, and HT, with CT
collectively representing all carbon-bearing species, SiTcollectively representing all silica-bearing species, AlTcollectively representing all aluminum-bearing species,and HT representing the total aqueous proton. The con-centration of HT is computed as ½HT� ¼ �½AlðOHÞ2þ��2½AlðOHÞþ2 � � 3½AlðOHÞ3� � 4½AlðOHÞ�4 � þ ½H4SiO4��½H2SiO2�
4 � þ ½H2CO�3� � ½CO2�3 � þ ½Hþ� � ½OH��. For this
system, five mass balance equations, together with thenine mass action laws corresponding to the nine instan-taneous reactions, are sufficient to describe the masschange in the aqueous phase.
The mass balance equation (expressed in molar units)for pore i takes the following general form:
V id½��idt¼XQij>0
Qij½��j þXQij<0
Qij½��i
þXnc
j¼1
D�ij;�aij
ð½��j � ½��iÞl
þ Si;�; ð11Þ
where [Æ] represents the molar concentration of one ofthe five key components; Vi is the volume of pore i; j
is the index for a pore that is connected to pore i; nc
ulation conditions (50 �C and 107 Pa)
logKeqa
a2+ + 2Al3+ + 2H4SiO4 21.72Al3+ + 2H4SiO4 + H2O 3.80
�13.2�6.15�10.0�9.2�12.4
8.76Þþ2 18.9Þ3 27.3Þ�4 33.2

1356 L. Li et al. / Advances in Water Resources 29 (2006) 1351–1370
is the total number of neighbor pores; Qij symbolizes theflow rate from pore j to i; D�ij;� is the effective diffusioncoefficient; aij is the cross-sectional area between poresi and j; l is the distance between the centroids of adjacentpores and is a constant for the regular-latticed network;and Si,Æ denotes the mass change rate due to kinetic reac-tions. On the right-hand side of the above equations, thefirst two terms take into account advective mass inflowand outflow rates, and the third term is the mass changerate due to diffusion between adjacent pores.
For each of the four components that is a collectiverepresentation of several species, its ‘‘effective’’ diffusioncoefficient D�ij;� is derived by writing the reactive trans-port equations for each constitutive species. Summationof these transport equations leads to a derived effectivediffusion coefficient that is essentially a weighted averageof the diffusion coefficients of involved species weightedby their concentration differences between pore i andpore j. Such a formulation is consistent with what isdone in reactive transport modeling [64]. For example,for CT,
D�ij;CT¼
DH2CO�3ð½H2CO�3�j � ½H2CO�3�iÞ þ DHCO�3
ð½HCO�3 �j � ½HCO�3 �iÞ þ DCO2�3ð½CO2�
3 �j � ½CO2�3 �iÞ
ð½H2CO�3�j � ½H2CO�3�iÞ þ ð½HCO�3 �j � ½HCO�3 �iÞ þ ð½CO2�3 �j � ½CO2�
3 �iÞ. ð12Þ
The diffusion coefficients for individual species aretaken from the literature [65,9]. Note that this formula-tion of mass balance equations leads to continuum-scaledispersion effects by taking into account fluctuations inlocal flow velocities. Hence, dispersion is not modeledexplicitly and the diffusion process is restricted topore-to-pore diffusion within the network.
The last term in Eq. (11), Si,Æ, represents the masschange rate due to kinetic reactions. It takes differentforms for different components, depending on the reac-tions involved (expressed in molar units):
Si;Ca2þ ¼ rA;iAA;i; ð13Þ
Si;CT¼ 0; ð14Þ
Si;SiT ¼ 2rA;iAA;i þ 2rK;iAK;i; ð15Þ
Si;AlT ¼ 2rA;iAA;i þ 2rK;iAK;i; ð16Þ
Si;HT¼ �6rA;iAA;i � 4rK;iAK;i; ð17Þ
where AA;i and AK;i are, respectively, the surface areasof anorthite and kaolinite in pore i. The two reactionrates, rA,i and rK,i, are calculated using the respectivereaction rate laws (Eqs. (7) and (9)) and the local con-centrations in pore i. The mass change rates due to ki-netic reactions depend on the amount of the reactivemineral in each pore. In this pore network model, twotypes of pores are identified with regard to the mineral-ogy of the solid phases: reactive pores, with their solid
phases containing both anorthite and kaolinite, andnon-reactive pores, with their solid phases being quartz.For non-reactive pores, as the reactive minerals are notpresent, the surface areas of anorthite and kaolinite arezero and the mass change rates due to reaction are equalto zero.
Such a representation of reactive pores is not a prob-lem for modeling dissolution, but could pose a problemfor modeling precipitation. Precipitation normally pro-ceeds in two steps: nucleation and crystal growth[9,66]. For many minerals, nucleation is the rate-limitingstep [43], because it has to overcome a surface freeenergy barrier and requires some degree of supersatura-tion. In the absence of a solid mineral phase, precipita-tion of that mineral requires both steps, while in thepresence of a solid mineral phase, precipitation of thatmineral can start as crystal growth. The large differencein these rates is the basis for our modeling assumptionthat precipitation can proceed only in so-called reactivepores.
3.2. Network construction
A 3D regular-lattice network model was constructedto represent a consolidated sandstone with reactive min-erals occupying approximately 10% of the solid phase,which is within the typical range of the percentage offeldspars and clay minerals in sandstones. The porosityof the network is 0.14, and the permeability is7.9 · 10�10 cm2, which falls in the typical range of con-solidated sandstone properties [67,68]. The size of thenetwork is 5.0 · 1.7 · 5.0 mm3, and the network con-tains 9000 pores (30 · 10 · 30 in x-, y-, z-directions,respectively). The bulk flow direction is in the z-direc-tion. This network has several characteristics that distin-guish it from network models that have beenconstructed for multiphase flow. First, pores do nothave prescribed geometries; they are defined only interms of surface area and volume. Second, pore throatsare not represented explicitly except to assign an effec-tive resistance to the flow and an effective cross-sectionalarea for diffusion. All void volume is contained in porebodies.
Solution of the pore-scale mass balance equationsrequires the following values for each pore i: volume;conductances at pore junctions (for the calculation offlow rates); effective cross-sectional areas at connectionsof adjacent pores (for the calculation of diffusion terms);and surface areas. These parameters characterize eachpore, while across the network they form statistical dis-

L. Li et al. / Advances in Water Resources 29 (2006) 1351–1370 1357
tributions. The parameters for each pore are randomlyassigned from their respective statistical distributions,as discussed in this section.
3.2.1. Pore volume
Based on literature data for a Fontainebleau sand-stone [69], pore volume is assumed to have a log-normaldistribution. The mean for the log-transformed porevolume (mm3) is �3.42, with the standard deviation ofthe log-transformed pore volume being 0.51. This corre-sponds to an arithmetic mean of pore volume being6.6 · 10�4 mm3.
3.2.2. Pore hydraulic conductanceFor the distribution of pore conductances, we have
made two assumptions: (1) the distribution follows alog-normal distribution; and (2) the conductancebetween pores is correlated to the sum of the logarithmof their pore volumes. Regarding the first assumption,although data on distributions of pore-scale conduc-tances generally do not exist, in the literature there isindirect evidence supporting the idea that the distribu-tion of the conductances should be related to the distri-bution of grain or pore size, which is usually log-normally distributed [70]. The second assumption isbased on observations for sandstones from experimentalstudies [71,72].
We define Cij (cm4 g Pa�1) as the conductancebetween two adjacent pores i and j. The log-transformedconductance Xij = lnCij has a normal distribution, withmean lX, and variance r2
X . The summation of the log-transformed volumes of adjacent pores, Yij = ln-Vi + lnVj, also takes a normal distribution, with meanlY = 2llnV and variance r2
Y ¼ 2r2ln V . Assuming Xij and
Yij are jointly Gaussian distributed, the mean and vari-ance of the log-transformed conductance for a pair ofconnected pores i and j, (lX)ij and ðr2
X Þij, are calculatedas follows [73]:
ðlX Þij ¼ lX þ qrX
rYðY ij � lY Þ; ð18Þ
ðr2X Þij ¼ r2
X ð1:0� q2Þ; ð19Þ
where q is the correlation coefficient. For the connectionbetween pores i and j, the conductance is sampled fromthe log-normal distribution with mean (lX)ij and vari-ance ðr2
X Þij, which depend on the log-volume summationYij. In this work, the value of lX and r2
X were chosen tobe �6.1 and 1.0 to be consistent with the permeabilityvalue (7.9 · 10�10 cm2), as described in the next section.The value of q is assumed to be 0.9 as we assume strongcorrelation between conductance and adjacent porevolumes.
3.2.3. Pore-to-pore cross-sectional area
The cross-sectional area between connected pores i
and j, aij, is required for the calculation of the mass
transport due to diffusion. Considering an ‘‘effective’’cylinder between pore i and j, with conductance Cij,and length l, the diameter of the cylinder dij can be cal-culated by rearranging Poiseuille�s law:
dij ¼128ml� Cij
p
� �14
; ð20Þ
with m being the viscosity of the flowing fluid. Corre-spondingly, the ‘‘effective’’ cross-sectional area aij ¼14pd2
ij. The arithmetic average of the cross-sectional areafor this network is about 1.02 · 10�4 mm2.
3.2.4. Surface area
Because there is no reliable literature data on thepore-scale distribution of surface area for consolidatedsandstone, we use the following procedure. The surfacearea of pore i is randomly sampled from an exponentialdistribution, with the restriction of not being less thanthe minimum surface area, which is calculated fromthe pore volume assuming a spherical pore. The valuesof surface areas of consolidated sandstones measuredby Brunauer–Emmet–Teller (BET) method, oftenreported as the surface-to-volume ratio, cover threeorders of magnitude, ranging from 103 to 105 cm�1
[74–76]. In this work, the mean of the pore surfacearea was chosen to be 6.0 mm2, which results in a sur-face-to-volume ratio for the entire network of 1.3 ·104 cm�1.
As described earlier, the solid surface for an individ-ual pore is modeled as either containing reactive miner-als or not. Within 9000 pores in total, 900 of themcontain reactive minerals, which is consistent with theassumption that 10% of the solid phase is reactive min-eral. We have chosen to randomly distribute the reactiveminerals in clusters of size 2 · 2 · 15 pores (in the x-, y-,z-directions, respectively), which is within the range ofthe spatial scale of feldspars distribution in sandstone[77]. In pores within the reactive clusters, 50% of the sur-face area is anorthite and 50% is kaolinite. The resultingdistributions of values of AA;i and AK;i for the networkinclude a large number of zeros for the non-reactivepores and a truncated exponential distribution for thesurface areas in reactive pores.
3.3. Determination of the steady-state flow field
To determine the steady-state flow field of the net-work, fixed fluid pressures are imposed at the bound-aries of the network in the z-direction, with no-flowboundary conditions applied in the other two direc-tions, resulting in macroscopically one-dimensionalflow. The flow rate between connected pores i and j
is proportional to the pressure difference through theconductance:
Qij ¼ CijðP i � P jÞ; ð21Þ

1358 L. Li et al. / Advances in Water Resources 29 (2006) 1351–1370
where Pi and Pj are fluid pressures in pore i and j,respectively. The inflows and outflows must balancefor each pore i:
Xnc
j¼1
Qij ¼ 0. ð22Þ
Combination of Eqs. (21) and (22) results in a linearalgebraic system for the unknown pressure field. Giventhe boundary pressures, this system is solved for thepressure in each pore, from which the steady-state flowfield is calculated.
At the continuum scale, the total flow rate followsDarcy�s law:
QT ¼jmK
DPL; ð23Þ
where QT (cm3 s�1) denotes the total flow rate throughthe network in the main flow direction, z; j is the intrin-sic permeability of the network (cm2); K represents thecross-sectional area of the network in the directionorthogonal to the main flow (cm2); DP symbolizes thepressure difference between the two boundaries in z-direction; and L is the length of the network in z-direc-tion (cm). By rearrangement of the above equation, thepermeability of the network can be calculated. The per-meability is thus a function of the mean and variance ofthe conductance field, lX and r2
X , and the correlationwith local volumes. As mentioned previously, theseparameters were chosen so that the permeability corre-sponds to a typical value for sandstone. An iterative ap-proach was used whereby the statistical parameters werevaried until a flow field was generated that resulted inthe desired permeability.
4. Continuum-scale reaction rates
4.1. The rates from the network model: RN
For a porous medium, the ‘‘true’’ reaction rate at thecontinuum scale is the total mass change rate due toreactions at every reactive surface, normalized by thetotal amount of surface area of reactive minerals. Thenetwork model allows us to estimate such a ‘‘true’’ reac-tion rate at the continuum scale. The pore-scale massbalance equations are used to simulate changes in aque-ous concentration over time in each pore. At each timestep, the sum of the mass change rates due to mineralreactions for the entire network, divided by the total sur-face area of reactive minerals, gives the ‘‘true’’ reactionrate for the network. For example, for anorthite, theeffective continuum-scale reaction rate for the networkmodel is as follows:
RN;A ¼Pn
i¼1AA;irA;iPni¼1AA;i
; ð24Þ
where n is the total number of pores. Expressed inmol cm�2 s�1, this rate is equivalent to the rate calcu-lated by summing the mass change rate of Ca2+ due toanorthite reaction across the network, and then dividingby the total anorthite surface area. An equation analo-gous to Eq. (24) is used to calculate the continuum-scalerate for kaolinite. The continuum-scale rates, RN,A andRN,K, depend on local reaction rates (rA,i and rK,i,respectively), as well as the coupling between the localrates and local surface area of reactive minerals. Fornon-reactive pores, as values of AA;i are zero, the termAA;irA;i is not counted in the calculation of RN. As such,concentrations in non-reactive pores are irrelevant to thereaction rates, although they enter indirectly via thetransport equations. The continuum-scale reaction ratesare dependent only on the concentrations in reactivepores.
4.2. The rates from the continuum model: RC
This section presents the methodology for calculat-ing continuum-scale reaction rates using a continuummodel, which is the fundamental building block of tradi-tional forward modeling. Forward modeling generallyemploys a continuum approach [63,64,78], in which por-ous media are characterized by spatially-averaged prop-erties at the scale of the grid block, thereby ignoringdetails at the sub-grid scale. It is common practice toapply reaction rate laws determined from well-mixedlaboratory systems to calculate the reaction rates forthe porous medium in an entire grid block. Further-more,the mathematical forms and parameters of theserate laws are assumed to hold at the grid block scaledespite possible nonlinearities in upscaling.
In a similar manner, the continuum model uses spa-tially-averaged values to represent system properties,assumes uniform concentrations in the aqueous phase,and applies lab-measured reaction rates directly at thecontinuum scale. In so doing, it ignores pore-scale heter-ogeneities a priori, and assumes no mass transport lim-itation from pore to pore. In the calculation thatfollows, the continuum model is constrained to havethe same hydrodynamic properties, total surface areaof reactive minerals, initial conditions and boundaryconditions as the network model.
Because the reactions and the species involved arethe same as in the network model, we follow thesame systematic formulation to develop mass balanceequations for the five components: Ca2+, CT, SiT, AlT,and HT. For each key component, the mass balanceequations take the following general form, appliedover the entire volume of the pore network definedearlier:
V T
d½��dt¼ QT½��in � QT½��C þ SC;�; ð25Þ

L. Li et al. / Advances in Water Resources 29 (2006) 1351–1370 1359
where VT is the total pore volume across the network,[Æ]in corresponds to the concentration at the inflowboundary, and [Æ]C is the uniform concentration in thecontinuum model. On the right side of the equation,the first two terms account for the mass change ratesdue to advection, and the last term, SC,Æ, represents themass change rate due to reaction, which takes differentforms for different components:
SC;Ca2þ ¼ RC;AAA;T; ð26ÞSC;CT
¼ 0; ð27ÞSC;SiT ¼ 2RC;AAA;T þ 2RC;KAK;T; ð28ÞSC;AlT ¼ 2RC;AAA;T þ 2RC;KAK;T; ð29ÞSC;HT
¼ �6RC;AAA;T � 4RC;KAK;T; ð30Þ
where RC,A and RC,K are the reaction rates of anorthiteand kaolinite, respectively, and AA;T and AK;T are thetotal surface areas of anorthite and kaolinite. Thesemass balance equations look similar to those writtenfor an individual pore in the network model, except thatat the continuum scale there is no diffusion term, and theparameters characterizing pore i are replaced by theparameters that describe the continuum-scale proper-ties. The reaction rates from the continuum model,RC,A and RC,K, are calculated using the uniform concen-trations (converted to activities), and by applying thereaction rate laws directly. For anorthite,
RC;A ¼ ðkHfHþg1:5C þ kH2O þ kOHfOH�g0:33
C Þð1� XC;AÞ;ð31Þ
where XC,A is calculated using uniform concentrationsas well. For kaolinite, the rate expression is similar, fol-lowing the reaction rate law shown in Eqs. (9) and (10).These rates represent the rates calculated in one gridblock in forward modeling, where the grid block is takento correspond to the entire network used in the networkmodel.
4.3. The rates from volume-averaged
concentrations: R0N
This section presents the methodology for calculatingcontinuum-scale rates, R0N, using volume-averaged con-centrations in reaction rate laws. The volume-averagedconcentrations are analogous to those measured infield sampling, where groundwater is pumped from awell, and water from a large number of pores is mixed.Concentrations measured in the sample represent spa-tially-averaged values. A typical application in inversemodeling is to use these measured concentrations in con-junction with laboratory-measured reaction rate laws orequilibrium relationships to infer which minerals are dis-solving, and which are precipitating [79].
The purpose of this calculation is not to develop amethod of volume-averaging, but to use the network
model to calculate the rates that resemble those esti-mated from field sampling. This allows us to examinethe extent to which volume-averaged concentrations,½��, provide accurate predictions of continuum-scalereaction rates. From the network model simulationresults, we compute the volume-averaged concentra-tions, such as that of hydrogen ion, as follows:
½Hþ� ¼Pn
i¼1V i½Hþ�iPni¼1V i
. ð32Þ
Since activity coefficients are constant throughout thenetwork (see Section 5), the value of the volume-aver-aged activity, fHþg, is the product of the activity coeffi-cient and the volume-averaged concentration. Then, forthe anorthite reaction, we use the averaged activities tocompute
R0N;A ¼ ðkHfHþg1:5þ kH2O þ kOHfOH�g0:33Þð1� X0N;AÞ;
ð33Þwhere
X0N;A ¼fCa2þgfAl3þg
2
fH4SiO4g2
fHþg8Keq;A
. ð34Þ
A similar rate law applies for kaolinite. In so doing, therate calculated from volume-averaged concentrationsignores pore-scale heterogeneities a posteriori. Thesereaction rates represent the rates that would be inferredfrom the measured concentrations via inverse modeling.
4.4. Comparison between continuum-scale reactionrates
We have defined three continuum-scale reactionrates: (1) RN, derived from explicit mass balance calcu-lation from the network model; (2) RC, derived fromuniform concentrations in the continuum model; and(3) R0N, derived from averaged concentrations from thenetwork model. Of these three upscaled reaction rates,we take RN to represent the ‘‘true’’ reaction rate, as itmost closely takes into account the effects of pore-scaleheterogeneities, and is consistent with the mass balanceof the network system. Both RC and R0N are based onspatially-averaged properties (either a priori or a poste-riori) and on reaction rate laws that were determined inthe laboratory. Comparisons of RC and R0N to RN pro-vide insights into how pore-scale heterogeneity influ-ences continuum-scale reaction rates, and how well theuse of average properties represents these heterogeneoussystems.
For the comparison of RC to RN, we define the ratio:
g � RC
RN
. ð35Þ
If g is close to unity, the differences between these tworates are not significant, which means that the effects

1360 L. Li et al. / Advances in Water Resources 29 (2006) 1351–1370
of pore-scale heterogeneities are not significant, and thatthe scaling effect is negligible. In such cases, the applica-tion of the lab-measured reaction kinetics at the con-tinuum scale is appropriate in forward modeling.Otherwise, pore-scale heterogeneities are importantand conventional forward modeling using continuummodeling may introduce significant errors.
For the comparison of R0N and RN, we define theratio:
b � R0NRN
. ð36Þ
If b is close to unity, these two rates are similar, whichmeans that volume-averaged concentrations are suffi-cient to describe the reaction rates and the scaling effectis negligible. Otherwise, it is not appropriate to calculatethe reaction rates using volume-averaged concentra-tions, such as those determined from field samplingand used in inverse modeling.
The deviation of g or b values from unity provides ameasure of the scaling effect of the reaction kinetics. Ifeither RC or R0N has a different sign from RN, then RC
or R0N predicts a different reaction direction as comparedto RN; that is, one is predicting dissolution while theother is predicting precipitation, or other wise.
5. Simulation conditions and numerical computation
5.1. Simulation conditions and parameter estimation
The application of pore-scale network modeling toupscale geochemical reaction rates is illustrated withtwo simulation scenarios relevant to geological CO2
sequestration. One scenario is that in which the networksystem is near the CO2 injection site so that the bound-ary aqueous phase is in equilibrium with CO2 of a typ-ical injection pressure, 107 Pa, and is highly acidic(referred to hereafter as case A). The other scenario isthat in which the network system is relatively far awayfrom the injection site so that the boundary aqueousphase has a much lower CO2 concentration. Here, wehave chosen to represent this as an aqueous phase inequilibrium with CO2 of a relatively low pressure,105 Pa (referred to hereafter as case B). The differencein CO2 concentrations generates different acidities inthe aqueous phases that flow into the network system.Except for this difference, the simulation conditionsare the same for the two cases.
In geological sequestration, CO2 would typically beinjected into subsurface formations at a depth of 1 kmor greater. To be consistent with this depth, the simula-tions were run at a temperature of 323 K and a pressureof 107 Pa. The brine is represented by saline water withtotal dissolved salinity (TDS = 0.45 mol L�1) that hastaken into account the contribution of all important
aqueous species in typical brine. Initially the brine isassumed to be in equilibrium with quartz and kaolinite,at pH 7.5. The electronic condition is satisfied withthe addition of Ca2+, which produces an initial concen-tration that is very small (7.9 · 10�6 mol L�1). Thereare no carbon-bearing species present in the brine. Thebrine at the inflowing boundary is assumed to have thesame [Ca2+] as in the initial aqueous phase withinthe network. The total carbon concentration and thusthe pH in the boundary brine is determined using thesemi-empirical relationship from Duan and Sun [80],based on equilibrium with separate phase carbon diox-ide at a given temperature, pressure, and salinity. In caseA, due to the large amount of CO2 dissolved in theboundary brine, the boundary pH is 2.9. In case B, theboundary pH is 4.1. We chose to run the simulationsfor a nominal value using the flow velocity, q = 5.8 ·10�3 cm s�1 [67].
The salinity is high enough that the activity coeffi-cients of the reactive species deviate considerably fromunity. These values were calculated using the Daviesequation [81]. Because the brine TDS is high, it isassumed that the dissolution and precipitation of reac-tive species does not change the TDS significantly, andthe activity coefficient of each species is considered con-stant both in time and space.
Equilibrium constants were taken from Morel andHering [81] and adjusted to the system temperatureand pressure using the software SUPCRT92 [82], aslisted in Table 2. The reaction rate constants wereadjusted to the given temperature using the Arrheniusequation [9], with the activation energies listed in Table1. The diffusion coefficients were obtained and adjustedto the system temperature and salinity [9,65]. The effectsof pressure on reaction rate constants and diffusion coef-ficients were considered insignificant, because the pres-sure effect on these parameters is relatively smallcompared to the effect of temperature [9].
Simulations were run within a limited time framesuch that the total amount of minerals reacted producedonly small porosity changes. Using empirical relation-ships between permeability and porosity [83–85], thepredicted porosity changes result in changes of perme-ability less than 5%. Therefore, the porosity and perme-ability of the porous medium are considered constantduring the simulation process. The system eventuallyreaches steady state, after which the concentrations ofthe aqueous species and the reaction rates do not varyas a function of time.
5.2. Numerical computations
For the network model, given initial and boundaryconditions, as well as the predetermined flow field, weuse the adaptive Runge–Kutta algorithm to simulta-neously solve the mass balance equations for the con-

5
10
15
20
25
30
x
L. Li et al. / Advances in Water Resources 29 (2006) 1351–1370 1361
centrations of the five components in each pore at eachtime step [86]. The values of these five concentrations,coupled with the nine laws of mass action correspondingto the nine instantaneous reactions, are then used to cal-culate concentrations of all 14 species iteratively using ahybrid algorithm combining both the Newton–Raphsonand bisection method. In this way we obtain the concen-trations of all 14 aqueous species in each pore at eachtime step. The concentrations of the aqueous species inthe continuum model are solved in the same way.
510
3020
100
yz
Fig. 2. Locations of reactive pores for the y = 5 plane and for thex = 18 plane. Reactive pores are shown in red color.
6. Results
In this section, we first present the results on the pore-scale heterogeneities of concentrations and reactionrates for case A, then briefly compare the pore-scale het-erogeneities in case A and case B. After that, the evolu-tion of the continuum-scale reaction rates are described,and the scaling effect is examined in the context ofcontinuum modeling and volume-averaging. Finally,the resulting concentrations in the network model areexamined with respect to network-scale equilibriumrelationships.
6.1. Pore-scale heterogeneities: case A
The locations of reactive pores for two orthogonalplanes in the network are shown in Fig. 2. For the sim-ulation conditions of case A, the steady-state concentra-tion fields of log[Ca2+] and pH for the y = 5 plane areshown in Fig. 3. In general, the Ca2+ concentrationsand pH values are lower in pores near the left boundarydue to the low calcium content and acidic condition ofthe inflowing water. As the inflowing water encounters
Fig. 3. For one layer of pores in the middle of the network (y = 5): steady-staleft (at z = 0).
reactive minerals, anorthite slowly dissolves and releasesCa2+. Correspondingly, there is an increase in pH due tothe increase in alkalinity. The concentrations of Ca2+
and the pH in reactive pores are generally higher thanthose in nearby non-reactive pores, as indicated by thesimilar patterns of high-concentration clusters and lowpH clusters (Fig. 3), to that of reactive pore clusters(Fig. 2). Non-reactive pores may also have elevatedCa2+ concentrations and pH if they are close to reactivepores. For example, near the inflow boundary where x isapproximately 17 or 18, the high [Ca2+] and pH are dueto the proximity of these pores to the reactive clusters inthe y = 3 and y = 4 layer.
The pore-scale concentrations vary considerably overthe network: the values of [Ca2+] cover 2.5 orders of mag-nitude, and hydrogen ion concentrations cover approxi-mately half an order of magnitude. The frequency
te profiles of log[Ca2+] (a) and pH (b). Boundary fluid flows in from the

−5 −4 −30
0.05
0.1
Fre
quen
cy a.
3 3.2 3.4 3.60
0.05
0.1b.0.15↑~~
−5 −4 −30
0.05
0.1
Fre
quen
cy c.
3 3.2 3.4 3.60
0.05
0.1d.0.15↑~~
−5 −4 −30
0.01
0.02
log [Ca 2+ ]i
Fre
quen
cy e.
3 3.2 3.4 3.60
0.01
0.02
pHi
f.
Fig. 4. Steady-state distributions of log[Ca2+] and pH in all pores (aand b); in non-reactive pores (c and d), and in reactive pores (e and f).The dot-dashed lines indicate the uniform concentrations from thecontinuum model. The dotted lines indicate the volume-averagedconcentrations.
1362 L. Li et al. / Advances in Water Resources 29 (2006) 1351–1370
distributions of log[Ca2+] and pH for pores in the entirenetwork are shown in Fig. 4a and b. Both distributionsare highly skewed. For Ca2+, approximately 9% of thepores have the minimum concentration values, which isequal to that of the inflowing boundary. Similarly,approximately 15% of the pores have the minimum valueof pH. Calcium concentration has a bimodal distribu-tion, in which a second peak arises at the large end ofthe concentration range.
For comparison, the distributions of log[Ca2+] andpH in non-reactive pores are shown in Fig. 4c and d.Because the non-reactive pores occupy 90% of the pores,their concentration distributions bear great similarity tothe distributions for all pores, except at the right end ofthe concentration range, where concentrations in reac-tive pores play an important role. The distributions ofconcentrations in reactive pores have very differentshapes from those for non-reactive pores, as shown inFig. 4e and f (Note the different scale of frequency axis).
−20 −15 −100
0.02
0.04
0.06
SIA,i
a.
Fre
qu
ency
Fig. 5. For anorthite: steady-state distributions of satura
They are less skewed, and have peaks that fall in thelarge ends of the concentration ranges, indicating therelatively high [Ca2+] and pH in reactive pores.
Also shown in Fig. 4a and b are the logarithm of vol-ume-averaged calcium concentration and the logarithmof volume-averaged hydrogen ion concentration (referredto hereafter as volume-averaged pH), as well as the loga-rithm of the uniform concentrations calculated from thecontinuum model. While both volume-averaged concen-trations lie in the mid-range of the distributions for theentire network, they fall in the tail region at the low endof the concentration range in reactive pores. For pH,more than 90% of the reactive pores have values largerthan the volume-averaged value. The uniform concentra-tions from the continuum model represent concentrationsin reactive pores better, as they are closer to the modes ofthe concentrations in reactive pores.
Due to the dependence of reaction rates on aqueousconcentrations, the pore-scale concentration heterogene-ities lead to spatial variations in saturation states, and inreaction rates. Fig. 5 shows the steady-state distribu-tions of saturation indexes (see Section 2.1) and reactionrates for anorthite. The saturation states cover approxi-mately 10 orders of magnitude. However, they are allorders of magnitude smaller than unity, and thereforeanorthite dissolution remains far from equilibrium inall pores. As such, anorthite dissolution rates are largelydetermined by inherent mineral reactivity and the activ-ities of catalytic species. That is, the value of 1 � XA inEq. (7) is approximately unity. In fact, at steady state, allthe pores in the network have acidic pH conditions suchthat the anorthite dissolution rate in each pore isapproximately:
rA;i ffi kHfHþg1:5i . ð37Þ
Thus, spatial variations in anorthite dissolution rates areentirely due to spatial variation in pH in reactive pores. Asis consistent with the exponent in Eq. (37), the variance inthe logarithm of rA,i is roughly twice that of pH (as ex-pected given that the square of 1.5 is 2.25). The hydrogenion concentrations span roughly 0.65 orders of magni-
−13 −12.5 −12 −11.50
0.02
0.04
0.06
log rA,i
b.
tion indexes (a) and logarithm of reaction rates (b).

–4 –2 0 2 40
0.02
0.04
0.06
0.08
0.1
SIK,i
Fre
qu
ency
Ω < 1 Ω > 1a.
–17 –17 –15 –13 –110
0.02
0.04
0.06
0.08
0.1b.
Dissolution Precipitation
–16log r
K,ilog (–r
K,i )
/ /
/ /
Fig. 6. For kaolinite reaction: steady-state distributions of saturation indexes (a) and logarithm of local reaction rates (b).
L. Li et al. / Advances in Water Resources 29 (2006) 1351–1370 1363
tude, and the anorthite dissolution rates cover approxi-mately one order of magnitude, as shown in Fig. 5b.
As shown in Fig. 6, for kaolinite, the saturationindexes include both positive and negative values, indi-cating that dissolution is occurring in some pores andprecipitation is occurring in others. As the values of sat-uration state are either in a similar order of magnitudeas unity, or orders of magnitude larger, the spatial var-iation of local rates depends not only on pH heterogene-ities, but also on concentration heterogeneities of Al3+
and H4SiO4, with the dependence on {H+} raised tothe power of approximately �5.0 (refer to Eqs. (9) and(10)). Such high dependence of rates on concentrationsresults in large spatial variations in kaolinite reactionrates, as illustrated in Fig. 6b. In about 6% of reactivepores, dissolution occurs and the rates span almosttwo orders of magnitude; in more than 90% of reactivepores, precipitation occurs, and the rates span approxi-mately 4.6 orders of magnitude. This is an interestingillustration of the effect of pore-scale heterogeneity.
6.2. Comparison of pore-scale heterogeneities
for case A and B
Case B is different from case A in that its boundaryfluid is much less acidic (with pH of 4.1, compared to
−14 −13.5 −13 −12.50
0.02
0.04
0.06
0.08
0.1
0.12
log rA,i
Fre
quen
cy
a.
Fig. 7. Steady state reaction rate distributions in case B: anorthi
2.9 in case A). Due to the sensitivity of anorthite disso-lution rate on hydrogen ion concentration, the reducedacidity results in smaller anorthite dissolution rates,and smaller differences in concentrations between reac-tive and non-reactive pores. As illustrated by Fig. 7a,the anorthite dissolution rates shift to smaller values,and cover a much narrower range, as compared to caseA (Fig. 5b). For kaolinite reaction (Fig. 7b), not only dothe rates cover a smaller range than in case A (Fig. 6b),but the reaction occurs only in the precipitation direc-tion. Such differences in pore-scale heterogeneitiesbetween the two cases are quantified by the differencesin the range of concentration and reaction rates in Table3.
6.3. Comparison between continuum-scale reaction rates
To illustrate the differences between the rates fromthe continuum model and the continuum-scale ratesfrom the network model, Fig. 8 shows RC and RN as afunction of time for the two reactive minerals in caseA. The anorthite dissolution rate increases with time,due to the gradual influx of highly acidic aqueous phasefrom the boundary. Eventually, the system reachessteady state, where the aqueous concentrations andreaction rates become constants. The release of Ca2+,
−16 −14 −120
0.02
0.04
0.06
0.08
0.1
0.12 b.
log (−rK,i
)
te dissolution rates (a) and kaolinite precipitation rates (b).

Table 3Comparison of pore-scale heterogeneities between the two simulationscenarios
[Ca2+] [H+] rA,i rK,i
Case A 2.6 0.65 1.1 4.6Case B 1.3 0.25 0.5 2.2
Values shown for each variable are the ranges in order of magnitude.
1364 L. Li et al. / Advances in Water Resources 29 (2006) 1351–1370
Al3+, and H4SiO4 from anorthite dissolution leads to theoversaturation of the aqueous phase with respect tokaolinite. As such, kaolinite precipitates, and theincrease in its precipitation rate parallels the increasein anorthite dissolution rate.
For each reactive mineral, the two models predictvery different evolutions of the reaction rates. The con-tinuum model overestimates the anorthite dissolutionrate for the duration of the simulation. At steady state,
0 100 200 300 4000
0.5
1
1.5x 10⁻¹²
time (s)
Rat
e (m
ol c
m–2
s–1
)
RC
RN
a.
Fig. 8. For case A: comparison of RC and RN ev
0 100 200 300 4000
0.5
1
1.5x 10⁻¹²
time (s)
Rat
e (m
ol c
m–2
s–1
)
R ′N
RN
a.
Fig. 9. For case A: comparison of R0N and RN ev
it overestimates the rate by 30%. For kaolinite, the con-tinuum model initially predicts its dissolution (although,these slightly positive values of RC are difficult to see inFig. 8b), which contradicts the prediction from the net-work model. Over time, the continuum model predictskaolinite precipitation, but with a much smaller rate.At steady state, it underestimates the kaolinite precipita-tion rate by almost two orders of magnitude (with theratio of RC over RN being 0.05). Overestimation of theanorthite dissolution rate and underestimation of kaoli-nite precipitation rate by the continuum model lead toan overestimation of the net dissolving rate of the solidphase by approximately a factor of 1.5 at steady state.
Fig. 9 shows a comparison of the time evolution ofthe rate calculated using volume-averaged concentra-tion, R0N, and the continuum-scale rate from the networkmodel, RN, for each mineral. The values of R0N;A under-estimate those of RN,A at the very start of the simula-
0 100 200 300 400–8
–7
–6
–5
–4
–3
–2
–1
0
1x 10–14
time (s)
b.
olution for anorthite (a) and kaolinite (b).
0 100 200 300 400–8
–7
–6
–5
–4
–3
–2
–1
0
1x 10–14
time (s)
b.
olution for anorthite (a) and kaolinite (b).

L. Li et al. / Advances in Water Resources 29 (2006) 1351–1370 1365
tion, and then significantly overestimate RN,A. At steadystate, the ratio of R0N;A over RN,A is 2.3. For kaolinite,R0N;K predicts its dissolution over the entire time period(although R0N;K is close to zero, it is actually positive),which is in contrast with the precipitation predicted bythe network model. At steady state the ratio of R0N;K overRN,K is �1.8 · 10�3. As such, values of R0N;K not onlypredict the wrong reaction rate, but also the wrong reac-tion direction.
Compared to those in case A, the differences betweencontinuum-scale rates are much smaller in case B. Table4 presents the differences between the continuum-scalerates for the two simulation scenarios, in terms of theratios between continuum-scale reaction rates. For caseB, these ratios are much closer to unity than in case A,which means that the scaling effect is much smaller. Forexample, the value of bK is positive in case B, indicatingthe correct prediction of reaction direction by using vol-ume-averaged concentrations. This smaller scaling effectis attributed to the less significant pore-scale variationsin concentrations and reaction rates.
6.4. Equilibrium relationships at the continuum scale
As a result of pore-scale concentration heterogene-ities, the equilibrium relationships for instantaneousreactions that are applicable at the pore scale may nothold at the continuum scale. For example, in aqueous
0 100 200 300 400–14
–13
–12
–11
–10
–9
time (s)
log
IAP
a.
Fig. 10. Evolution of logIAP for case A: (a) water dissociation reaction H2OThe dashed lines indicate the value of logKeq for each reaction.
Table 4Comparison of the ratios of continuum-scale reaction rates for the twosimulation scenarios
gA gK bA bK
Case A 1.3 0.046 2.3 �0.0018Case B 1.1 0.56 1.2 0.089
solutions under the temperature, pressure, and salinityconditions of these simulations, the product of the activ-ities of hydrogen ion and hydroxide ion equals the equi-librium constant 6.6 · 10�14. However, the ionic activityproduct (IAP) values calculated from volume-averagedactivities are not equal to their equilibrium constants.To illustrate this we show the temporal evolution oflogIAP in case A for the water dissociation reactionH2O� H+ + OH�, and Al3+ speciation reaction Al3þ þ4OH��AlðOHÞ�4 in Fig. 10. For both reactions, thedeviations of logIAP from logKeq are very large at anearly time period, where the IAP values are orders ofmagnitude different from the values of the equilibriumconstants. At steady state, the deviations reach constantvalues, IAP values 1.1 and 3.6 times their respective val-ues of equilibrium constants for water and aluminum. Incase B, the deviations of IAP values from equilibriumconstants are much smaller. For example, at steadystate, the IAP values are 1.0 and 1.2 times their res-pective values of equilibrium constants for water andaluminum.
7. Discussion
Simulation results have shown that under highlyacidic conditions relevant to geological CO2 sequestra-tion, heterogeneities in physical and mineral propertiescan lead to pore-scale heterogeneities in concentrationsand reaction rates, which results in scaling effects of reac-tion kinetics. With different boundary pH values, case Aand case B differ significantly in the extent of the scalingeffect. In both cases, the time scale of advection, calcu-lated as the ratio of the network length to average flowvelocity (L/q), is approximately 100 s. The diffusion timescale, calculated as the ratio of the square of the network
0 100 200 300 40022
24
26
28
30
32
34
36
time (s)
b.
= H+ + OH�; (b) Al3+ speciation reaction Al3þ þ 4OH� ¼ AlðOHÞ�4 .

1366 L. Li et al. / Advances in Water Resources 29 (2006) 1351–1370
length to the diffusion coefficient (L2/D), is about 103–104 s. The time scale of reaction, however, differs in caseA and B due to their different boundary pH values. Forpurpose of comparison, we estimate the time it wouldtake for reaction alone to effect a change in concentra-tion from the initial to the steady state condition. In caseA, the steady-state anorthite dissolution rate is in theorder of 10�10.6 mol s�1 (almost three orders of magni-tude larger than the average rate in individual poresdue to the much larger surface area of reactive mineralsat the network scale). Initially the anorthite dissolutionrate is orders of magnitude smaller because of the highinitial pH values. Therefore, on average, the anorthitedissolution rate is about 10�10.9 mol s�1. In case A, theconcentrations of calcium varied from the initial7.9 · 10�6 to 1.58 · 10�4 mol L�1 at steady state, whichcorresponds to a mass change of 8.9 · 10�10 mol. Assuch, the corresponding reaction time scale is 70 s,slightly smaller than the advection time scale. This meansthat the rates of advection and reaction are comparable,with none of them dominating. The comparable rates ofreaction and advection lead to large spatial variations inconcentrations, which results in relatively large scalingeffect. In case B, due to the much larger pH value, theaverage anorthite dissolution rate is in the order of10�12.7 mol s�1, corresponding to a reaction time scaleon the order of 103 s that is much larger than the advec-tion time scale. Compared to case A, the extent of spatialvariations in concentrations is much smaller, and thescaling effect is smaller.
With the same extent of spatial variations in concen-trations, spatial variations in reaction rates can vary fordifferent reactions, due to the difference in rate depen-dence on concentrations. In general, for a given rangeof spatial variation in concentration, the larger the ratedependence on concentration, the larger the spatial var-iation in local reaction rates. For the anorthite reaction,the very large range of calcium concentrations observedin case A has little effect on the spatial variation in rates,because in a system in which anorthite dissolution ishighly thermodynamically favorable and under acidicconditions, the anorthite dissolution rate is dependentonly on hydrogen ion concentration. Although the var-iation of hydrogen ion concentration in case A spansless than one order of magnitude, due to the nonlineardependence of the anorthite dissolution rate on thehydrogen ion activities, the values of rA,i cover morethan an order of magnitude. For case B, the nonlineardependence of reaction rate on {H+} also producesgreater variability in the reaction rate, but the effect ismuch less important than in case A. For kaolinite pre-cipitation, due to the high dependence of rates on hydro-gen ion activity (raised to the power of �5.0), the pHvariations lead to significant spatial variation in rates,spanning approximately five orders of magnitude incase A and two orders of magnitude in case B. Nonlin-
ear dependence on activities of chemical species, espe-cially on {H+}, is commonly observed for rate lawsfor mineral dissolution and precipitation reactions[9,87]. As such, we expect to see larger or smaller spatialvariation in local reaction rates than those in local con-centrations, depending on the mathematical form of therate laws.
The very large spatial variation in local concentra-tions has significant implications for the error producedby reaction rates estimated using volume-averaged con-centrations, as is analogous to what is done when inter-preting field measurements using inverse modeling. Theconsumption of hydrogen ions from anorthite dissolu-tion raises the pH such that the pH in reactive pores ishigher than the pH in the non-reactive pores. However,volume averaging is a non-discriminating calculationthat includes concentrations in both reactive and non-reactive pores. Because the reactive pores occupy only10% of the network, the volume-averaged pH is morerepresentative of pH in non-reactive pores, which under-estimates the pH in reactive pores. Because chemicalreaction rates depend only on concentrations in reactivepores, the concentrations in non-reactive pores play norole in driving or inhibiting the reaction rates in the por-ous medium (except indirectly via mass transport mech-anisms). Therefore, although volume averaging producesconcentrations that are true representations of the totalmass of a species per total fluid volume, these valuesdo not always serve as good indicators of the concentra-tions that drive the chemical reactions. Our work hasshown that when volume-averaged concentrations areused in the prediction of continuum-scale reaction rates,significant errors can result and the scaling effect is large,especially in case A where there exist significant differ-ences between concentrations in reactive and non-reac-tive pores. These errors led to the overestimation of theanorthite dissolution rate and the incorrect predictionof kaolinite reaction direction. In case B, with smallerdiscrepancies between concentrations in reactive andnon-reactive pores, the scaling effect is much smaller.
A discrepancy between the reaction rate from thecontinuum model and that from the network modelwas also observed, especially in case A. This differencewas less significant than the error produced from vol-ume-averaging. The difference between RC and RN
may appear to be small, however, this ‘‘small’’ differencein rates can lead to significant differences in predictionsof the dynamics of reactive transport processes for alonger time scale. Overestimation of mineral dissolutionrates by a factor of 2 will nominally lead to underestima-tion of reaction time scales by a factor of half. Further-more, in models that predict long-term reactionprogress, the overestimation of reaction rates will even-tually overestimate the rates of porosity change. Thestrong dependence of permeability on porosity, oftenraised to the power of 3, can magnify the effects of the
L. Li et al. / Advances in Water Resources 29 (2006) 1351–1370 1367
initial ‘‘small’’ difference in reaction rates to produce aconsiderable error in the predicted flow field. The over-estimated flow rates will further produce even largerreaction rates. Therefore, the error in rates can amplifyto a significant amount, and the continuum model mayultimately predict highly erroneous reactive transportdynamics relative to the true system.
The explanation for the discrepancy between RC andRN is slightly different than the explanation for the dif-ference between R0N and RN. Pore-scale heterogeneitiescreate concentration gradients that enhance the extentto which pore-to-pore mass transport of reactive speciesgoverns reaction kinetics. A continuum model, such as isused in forward modeling, is designed to ignore pore-scale heterogeneities, and mathematically representsthe entire system as if it is well mixed. At a given pointin time, the incoming fluid instantaneously comes incontact with all the reactive minerals in the system.Thus, the continuum model implicitly assumes no masstransport limitation at the pore scale. As such, it fails tocapture the extent of spatial variations in concentrationthat arises from the slow mass transport of reactive spe-cies from pore to pore, especially in case A. In case B,with relatively small spatial variations in concentrations,the scaling effect is much smaller.
The results presented here are consistent with theobservation of the lab-field discrepancy, that is, the directuse of reaction kinetics at scales larger than lab measure-ments often leads to the overestimation of reaction ratesunder natural conditions [12]. Although many factors,such as reaction duration, surface area and coating, havebeen considered as causes of such discrepancy [15], thiswork casts light on another potential factor: the spatialvariations in physical and mineral properties of naturalporous media. This work shows that spatial heterogene-ities in physical and chemical properties do affect large-scale reaction rates under natural conditions, and theextrapolation of lab-measured reaction kinetics may needto incorporate the effect of such spatial heterogeneities.
The fact that the equilibrium relationships that applyat the pore scale may not hold at the continuum scalehas potentially important implications for both forwardand inverse modeling. In forward modeling, equilibriumrelationships for instantaneous reactions are coupledwith reaction rate laws for kinetic reactions to describethe reactive processes. In inverse modeling, equilibriumrelationships are applied using measured aqueous con-centrations in groundwater samples to infer the mineralsthat are dissolving, and the minerals that are precipitat-ing. Both types of model can impose equilibrium rela-tionships that do not really exist at the continuum scale.
Equilibrium relationships are theoretically estab-lished to describe chemical speciation in spatially uni-form systems. If the pore-to-pore variations inconcentrations are sufficiently large, as in case A, equi-librium relationships may not hold for the spatially-
averaged concentrations used to describe continuum-scale phenomena in porous media. Such discrepancyhas been encountered in many reaction and transportphenomena in subsurface systems (see [11], and refer-ences therein), and calls for efforts incorporating effectsof porous medium heterogeneities in these relationships.This remains an open research question.
8. Summary and conclusions
This work establishes a novel methodology to usepore-scale network modeling to examine scaling effectsin geochemical reaction rates. Pore-scale network mod-els are constructed to represent the detailed physical andmineral properties of porous media. Reactive transportprocesses are simulated at the pore scale, and the contin-uum-scale reaction rate RN is calculated for the entirenetwork and is taken to be a measure of the ‘‘true’’ reac-tion rate. To explore the scaling effects, we also calculatetwo additional continuum-scale rates that ignore pore-scale heterogeneities and use the lab-measured reactionrates directly: RC, the rate obtained through continuummodeling, and R0N, the rate obtained using volume-aver-aged concentrations. Values of RC are compared to RN
to examine the extent to which the continuum approachused in forward modeling would lead to erroneous pre-diction of reaction rates in porous media. Values of R0Nare compared with RN to examine the extent to whichfield-measured concentrations, such as those used ininverse modeling, accurately predict the continuum-scale reaction rates.
The application of this method was illustrated with apore-scale network model that represents a consolidatedsandstone, with reactive minerals being anorthite andkaolinite occupying 10% of the pore space and gatheringin pore clusters of size 2 · 2 · 15. The network contains9000 pores, corresponding to the spatial scale of severalmillimeters in x-, y-, z-direction. Simulations were rununder conditions relevant to CO2 sequestration: onewith the boundary fluid in equilibrium with a high pres-sure of CO2 (case A), and the other with a less amountof CO2 (case B).
Simulation results have shown that in case A, the rel-atively large anorthite reaction rates arising from thehighly acidic boundary fluid leads to order-of-magnitudespatial variations in concentrations and reaction rates,which can be poorly represented by uniform or averagedconcentrations from models that ignore pore-scale heter-ogeneities. As such, the rates calculated from these sin-gle-valued concentrations in lab-measured reaction ratelaws would introduce large errors and the scaling effectsare significant. Under such conditions, the equilibriumrelationships that apply at the pore scale may not holdat the continuum scale, which suggests that commonpractice of reactive transport simulations may impose

1368 L. Li et al. / Advances in Water Resources 29 (2006) 1351–1370
equilibrium relationships that do not really exist at thecontinuum scale. In case B, with reduced acidity ofboundary fluid, the magnitude of the pore-scale hetero-geneities is much smaller than in case A, which eventu-ally leads to smaller scaling effects. The differences inthe scaling effects in the two cases suggest that elevatedCO2 concentrations can produce conditions under whichscaling effects are significant.
These findings have potentially significant implica-tions for reactive transport modeling. In general, the sig-nificance of pore-scale heterogeneity will depend on avariety of factors, including, for example, hydrodynamicconditions, and the total amount and spatial distribu-tions of reactive minerals. Although the observed signif-icance of the pore-scale heterogeneities and scaling effectare specific to our current network model and simula-tion conditions, the results imply that elevated CO2 con-centrations in deep aquifer systems can generateconditions under which scaling becomes important forreactive transport modeling. Under conditions wherespatial heterogeneities exist and scaling becomes impor-tant, geochemical modeling must be approached care-fully, and that general scaling laws incorporating theheterogeneity effect need to be developed.
Overall, pore-scale network modeling has proven tobe an effective research tool to upscale reactive transportprocesses from the pore scale to the continuum scale. Itallows for the investigation of details at the pore scalewhich cannot be done with traditional experimentalstudies, and thereby allows for identification of impor-tant pore-scale details that are essential to describe thereactive transport processes at the continuum scale. Thisnovel application of pore-scale network modeling maybe useful to study scaling issues associated with othergeochemical reactions in heterogeneous porous media,and therefore is likely to provide new perspectives forresolving the long-standing lab-field rate discrepancy.
Disclaimer
This report was prepared as an account of worksponsored by an agency of the United States Govern-ment. Neither the United States Government nor anyagency thereof, nor any of their employees, make anywarranty, express or implied, or assumes any legal liabil-ity or responsibility for the accuracy, completeness, orusefulness of any information, apparatus, product, orprocess disclosed, or represents that its use would notinfringe privately owned rights. Reference herein toany specific commercial product, process, or service bytrade name, trademark, manufacturer, or otherwise doesnot necessarily constitute or imply its endorsement, rec-ommendation, or favoring by the United States Govern-ment or any agency thereof. The views and opinions ofauthors expressed herein do not necessarily state or
reflect those of the United States Government or anyagency thereof.
Acknowledgements
This material is based upon work supported by theUS, Department of Energy under Award No. DE-FG02-05ER15636. The authors also acknowledge BPand Ford Motor Co. for their support of the CarbonMitigation Initiative at Princeton University.
Appendix A. Supplementary data
Supplementary data associated with this article canbe found, in the online version at doi:10.1016/j.advwatres.2005.10.011.
References
[1] Steefel CI, Lasaga AC. A coupled model for transport of multiplechemical species and kinetic precipitation/dissolution reactionswith application to reactive flow in single phase hydrothermalsystems. Am J Sci 1994;294:529–92.
[2] Le Gallo Y, Bildstein O, Brosse E. Coupled reaction-flowmodeling of diagenetic changes in reservoir permeability, porosityand mineral compositions. J Hydrol 1998;209(1–4):366–88.
[3] Bolton EW, Lasaga AC, Rye DM. Long-term flow/chemistryfeedback in a porous medium with heterogeneous permeability:kinetic control of dissolution and precipitation. Am J Sci 1999;299:1–68.
[4] Saunders JA, Toran LE. Modeling of radionuclide and heavymetal sorption around low- and high-pH waste disposal sites atOak Ridge, TN. Appl Geochem 1995;10(6):673–84.
[5] Xu TF, White SP, Pruess K, Brimhall GH. Modeling of pyriteoxidation in saturated and unsaturated subsurface flow systems.Transp Porous Media 2000;39(1):25–56.
[6] Mayer AS, Kelley CT, Miller CT. Optimal design for problemsinvolving flow and transport phenomena in saturated subsurfacesystems. Adv Water Resour 2002;25(8–12):1233–56.
[7] Metz V, Kienzler B, Schussler W. Geochemical evaluation ofdifferent groundwater–host rock systems for radioactive wastedisposal. J Contam Hydrol 2003;61(1–4):265–79.
[8] Parkhurst DL, Plummer LN. Geochemical models. In: Alley WM,editor. Regional groundwater quality. New York: Van NostrandReinhold; 1993. p. 199–225.
[9] Lasaga AC. Kinetic theory in the earth sciences, Princeton seriesin geochemistry. Princeton: Princeton University Press; 1998.
[10] Tompson AFB, Jackson KJ. Reactive transport in heteroge-neous systems: an overview. In: Lichtner PC, Steefel CI, OelkersEH, editors. Reactive transport in porous media. Reviews inmineralogy, vol. 34. Washington, DC: Mineralogical Society ofAmerica; 1996. p. 269–310.
[11] Bryant SL, Thompson KE. Theory, modeling and experiment inreactive transport in porous media. Curr Opin Colloid InterfaceSci 2001;6(3):217–22.
[12] White AF, Brantley SL. Chemical weathering rates of silicateminerals: an overview. In: White AF, Brantley SL, editors.Chemical weathering rates of silicate minerals. Reviews inmineralogy, vol. 31. Washington, DC: Mineralogical Society ofAmerica; 1995. p. 1–22.

L. Li et al. / Advances in Water Resources 29 (2006) 1351–1370 1369
[13] Murphy SF, Brantley SL, Blum AE, White AF, Dong HL.Chemical weathering in a tropical watershed, luquillo mountains,puerto rico: II. Rate and mechanism of biotite weathering.Geochim Cosmochim Acta 1998;62(2):227–43.
[14] Malmstrom ME, Destouni G, Banwart SA, Stromberg BHE.Resolving the scale-dependence of mineral weathering rates.Environ Sci Technol 2000;34(7):1375–8.
[15] White AF, Brantley SL. The effect of time on the wea-thering of silicate minerals: why do weathering rates differin the laboratory and field? Chem Geol 2003;202(3–4):479–506.
[16] Malmstrom ME, Destouni G, Martinet P. Modeling expectedsolute concentration in randomly heterogeneous flow systems withmulticomponent reactions. Environ Sci Technol 2004;38(9):2673–9.
[17] Szecsody JE, Zachara JM, Chilakapati A, Jardine PM, FerrencyAS. Importance of flow and particle-scale heterogeneity onCoII/IIIEDTA reactive transport. J Hydrol 1998;209(1–4):112–36.
[18] Lichtner PC, Tartakovsky DM. Stochastic analysis of effectiverate constant for heterogeneous reactions. Stochastic Environ ResRisk Assess 2003;17(6):419–29.
[19] Fatt I. The network model of porous media i. Capillarycharacteristics. Pet Trans AIME 1956;207:144–59.
[20] Celia MA, Reeves PC, Ferrand LA. Recent advances in pore scalemodels for multiphase flow in porous-media. Rev Geophys 1995;33:1049–57.
[21] Blunt MJ. Flow in porous media—pore-network models andmultiphase flow. Curr Opin Colloid Interface Sci 2001;6(3):197–207.
[22] Laurindo JB, Prat M. Numerical and experimental network studyof evaporation in capillary porous media. Phase distributions.Chem Eng Sci 1996;51(23):5171–85.
[23] Laurindo JB, Prat M. Numerical and experimental network studyof evaporation in capillary porous media. Drying rates. Chem EngSci 1998;53(12):2257–69.
[24] Tsimpanogiannis IN, Yortsos YC, Poulou S, Kanellopoulos N,Stubos AK. Scaling theory of drying in porous media. Phys Rev E1999;59(4):4353–65.
[25] Prat M. Recent advances in pore-scale models for drying ofporous media. Chem Eng J 2002;86(1–2):153–64.
[26] Carmeliet J, Descamps F, Houvenaghel G. A multiscale networkmodel for simulating moisture transfer properties of porousmedia. Transp Porous Media 1999;35(1):67–88.
[27] Stark J, Manga M. The motion of long bubbles in a network oftubes. Transp Porous Media 2000;40(2):201–18.
[28] Jia C, Shing K, Yortsos YC. Visualization and simulation of non-aqueous phase liquids solubilization in pore networks. J ContamHydrol 1999;35(4):363–87.
[29] Dillard LA, Blunt MJ. Development of a pore network simulationmodel to study nonaqueous phase liquid dissolution. WaterResour Res 2000;36(2):439–54.
[30] Zhou DG, Dillard LA, Blunt MJ. A physically based model ofdissolution of nonaqueous phase liquids in the saturated zone.Transp Porous Media 2000;39(2):227–55.
[31] Held RJ, Celia MA. Pore-scale modeling and upscaling ofnonaqueous phase liquid mass transfer. Water Resour Res 2001;37(3):539–49.
[32] Knutson CE, Werth CJ, Valocchi AJ. Pore-scale modeling ofdissolution from variably distributed nonaqueous phase liquidblobs. Water Resour Res 2001;37(12):2951–63.
[33] Suchomel BJ, Chen BM, Allen MB. Network model of flow,transport and biofilm effects in porous media. Transp PorousMedia 1998;30(1):1–23.
[34] Suchomel BJ, Chen BM, Allen MB. Macroscale properties ofporous media from a network model of biofilm processes. TranspPorous Media 1998;31(1):39–66.
[35] Kim D-S, Fogler H. Biomass evolution in porous media and itseffects on permeability under starvation conditions. BiotechnolBioeng 2000;69(1):47–56.
[36] Dupin HJ, Kitanidis PK, McCarty PL. Pore-scale modelingof biological clogging due to aggregate expansion: a materialmechanics approach. Water Resour Res 2001;37(12):2965–79.
[37] Dupin HJ, Kitanidis PK, McCarty PL. Simulations of two-dimensional modeling of biomass aggregate growth in networkmodels. Water Resour Res 2001;37(12):2981–94.
[38] Stewart T, Fogler H. Biomass plug development and propagationin porous media. Biotechnol Bioeng 2001;72(3):353–63.
[39] Sugita F, Gillham RW, Mase C. Pore scale variation inretardation factor as a cause of nonideal reactive breakthroughcurves. 2. Pore network analysis. Water Resour Res 1995;31(1):113–9.
[40] Acharya RC, Van der Zee S, Leijnse A. Transport modeling ofnonlinearly adsorbing solutes in physically heterogeneous porenetworks. Water Resour Res 2005;41(2):W02020. doi:10.1029/2004WR003500.
[41] Fredd C, Fogler H. Influence of transport and reaction onwormhole formation in porous media. AIChE J 1998;44(9):1933–49.
[42] Bachu S, Gunter WD, Perkins EH. Aquifer disposal of CO2:hydrodynamic and mineral trapping. Energy Convers Manage1994;35(4):269–79.
[43] Giammar DE, Bruant RG, Peters CA. Forsterite dissolution andmagnesite precipitation at conditions relevant for deep salineaquifer storage and sequestration of carbon dioxide. Chem Geol2005;217(3–4):257–76.
[44] Bruant J, Robert G, Celia MA, Guswa AJ, Peters CA. Safestorage of CO2 in deep saline aquifers. Environ Sci Technol 2002;36(11):240A–5A.
[45] Walker J, Hays PB, Kasting JF. A negative feedback mechanismfor the long term stabilization of earth�s surface temperatures. JGeophys Res-Solid Earth 1981;86:9776–82.
[46] Berner RA, Lasaga AC, Garrels RM. The carbonate–silicategeochemical cycle and its effect on atmospheric carbon dioxideover the past 100 million years. Am J Sci 1983;283:641–83.
[47] Brady PV. The effect of silicate weathering on global temperatureand atmospheric CO2. J Geophys Res-Solid Earth 1991;96(B11):18101–6.
[48] Gunter WD, Perkins EH, Hutcheon I. Aquifer disposal of acidgases: modelling of water–rock reactions for trapping of acidwastes. Appl Geochem 2000;15(8):1085–95.
[49] Xu T, Apps JA, Pruess K. Reactive geochemical transportsimulation to study mineral trapping for CO2 disposal in deeparenaceous formations. J Geophys Res-Solid Earth 2003;108(B2):2071.
[50] Johnson JW, Nitao JJ, Knauss KG. Reactive transport modelingof CO2 storage in saline aquifers to elucidate fundamentalprocesses, trapping mechanisms, and sequestration partitioning.In: Baines SJ, Worden RH, editors. Geological storage of carbondioxide. Special Publications, vol. 233. London: Geological Soci-ety of London; 2004. p. 107–28.
[51] Rochelle CA, Czernichowski-Lauriol I, Milodowski AE. Theimpact of chemical reactions on CO2 storage in geologicalformations: a brief review. In: Baines SJ, Worden RH, editors.Geological storage of carbon dioxide. Special Publication, vol.233. London: Geological Society of London; 2004. p. 87–106.
[52] Wieland E, Stumm W. Dissolution kinetics of kaolinite in acidicaqueous-solutions at 25-degrees-C. Geochim Cosmochim Acta1992;56(9):3339–55.
[53] Oelkers EH, Schott J, Devidal J-L. The effect of aluminum, pH,and chemical affinity on the rates of aluminosilicate dissolutionreactions. Geochim Cosmochim Acta 1994;58(9):2011–24.
[54] Blum AE, Stillings LL. Feldspar dissolution kinetics. In: WhiteAF, Brantley SL, editors. Chemical weathering rates of silicate

1370 L. Li et al. / Advances in Water Resources 29 (2006) 1351–1370
minerals. Reviews in mineralogy, vol. 31. Washington, DC: Min-eralogical Soc America; 1992. p. 291–351.
[55] Amrhein C, Suarez DL. The use of a surface complexation modelto describe the kinetics of ligand-promoted dissolution of anor-thite. Geochim Cosmochim Acta 1988;52(12):2785–93.
[56] Brady PV, Walther JV. Controls on silicate dissolution rates inneutral and basic pH solutions at 25-degrees-C. GeochimCosmochim Acta 1989;53(11):2823–30.
[57] Oelkers EH, Schott J. Experimental study of anorthite dissolutionand the relative mechanism of feldspar hydrolysis. GeochimCosmochim Acta 1995;59(24):5039–53.
[58] Helgeson HC, Murphy WM, Aagaard P. Thermodynamic andkinetic constraints on reaction-rates among minerals and aque-ous-solutions. 2. Rate constants, effective surface-area, and thehydrolysis of feldspar. Geochim Cosmochim Acta 1984;48(12):2405–32.
[59] Ganor J, Mogollon JL, Lasaga AC. The effect of pH on kaolinitedissolution rates and on activation-energy. Geochim CosmochimActa 1995;59(6):1037–52.
[60] Carroll SA, Walther JV. Kaolinite dissolution at 25-Degrees-C,60-Degrees-C, and 80-Degrees-C. Am J Sci 1990;290(7):797–810.
[61] Nagy KL, Blum AE, Lasaga AC. Dissolution and precipitationkinetics of kaolinite at 80-Degrees-C and pH 3—the dependenceon solution saturation state. Am J Sci 1991;291(7):649–86.
[62] Knapp RB. Spatial and temporal scales of local equilibrium indynamic fluid–rock systems. Geochim Cosmochim Acta 1989;53:1955–64.
[63] Lichtner PC. Continuum model for simultaneous chemical-reactions and mass-transport in hydrothermal systems. GeochimCosmochim Acta 1985;49(3):779–800.
[64] Lichtner PC. Continuum formulation of multicomponent–multi-phase reactive transport. In: Lichtner PC, Steefel CI, Oelkers EH,editors. Reactive transport in porous media. Reviews in miner-alogy, vol. 34. Washington, DC: Mineralogical society of Amer-ica; 1996. p. 1–81.
[65] Cussler EL. Diffusion: mass transfer in fluid systems. 2nd ed. Cam-bridge, United Kingdom: Cambridge University Press; 1997.
[66] Stumm W, Morgan JJ. Aquatic chemistry: chemical equilibria andrates in natural waters. 3rd ed. New York: EnvironmentalScience & Technology, Wiley; 1996.
[67] Freeze RA, Cherry JA. Groundwater. Upper Saddle River: -Prentice Hall, Inc.; 1979.
[68] Turcke MA, Kueper BH. Geostatistical analysis of the bordenaquifer hydraulic conductivity field. J Hydrol 1996;178(1–4):223–40.
[69] Lindquist WB, Venkatarangan A, Dunsmuir J, Wong TF. Poreand throat size distributions measured from synchrotron X-raytomographic images of fontainebleau sandstones. J Geophys Res-Solid Earth 2000;105(B9):21509–27.
[70] Freeze RA. A stochastic-conceptual analysis of one-dimensionalgroundwater flow in nonuniform homogeneous media. WaterResour Res 1975;11:725–41.
[71] Lymberopoulos DP, Payatakes AC. Derivation of topological,geometrical, and correlational properties of porous-media from
pore-chart analysis of serial section data. J Colloid Interface Sci1992;150(1):61–80.
[72] Wardlaw NC, Li Y, Forbes D. Pore-throat size correlation fromcapillary-pressure curves. Transp Porous Media 1987;2(6):597–614.
[73] Ross SM. Introduction to probability models. 7th ed. San Diego,CA: Academic Press; 2000.
[74] Sen PN, Straley C, Kenyon W, Wittingham MS. Surface-to-volume ratio, charge density, nuclear magnetic relaxation, andpermeability in clay-bearing sandstones. Geophysics 1990;55(1):61–9.
[75] Borgia GC, Brown RJS, Fantazzini P. Nuclear magnetic reso-nance relaxivity and surface-to-volume ratio in porous mediawith a wide distribution of pore sizes. J Appl Phys 1996;79(7):3656–64.
[76] Frosch GP, Tillich JE, Haselmeier R, Holz M, Althaus E. Probingthe pore space of geothermal reservoir sandstones by nuclearmagnetic resonance. Geothermics 2000;29(6):671–87.
[77] Blatt H. Sedimentary petrology. 2nd ed. New York: W.H.Freeman and company; 1992.
[78] Steefel CI, MacQuarrie KTB. Approaches to modeling of reactivetransport in porous media. In: Lichtner PC, Steefel CI, OelkersEH, editors. Reactive transport in porous media. Reviews inmineralogy, vol. 34. Washington, DC: The Mineralogical Societyof America; 1996. p. 83–130.
[79] Van der Hoven SJ, Solomon DK, Moline GR. Natural spatial andtemporal variations in groundwater chemistry in fractured,sedimentary rocks: scale and implications for solute transport.Appl Geochem 2005;20:861–73.
[80] Duan Z, Sun R. An improved model calculating CO2 solubility inpure water and aqueous NaCl solutions from 273 to 533 K andfrom 0 to 2000 bar. Chem Geol 2003;193(3–4):257–71.
[81] Morel F, Hering JG. Principles and applications of aquaticchemistry. New York: Wiley; 1993.
[82] Johnson JW, Oelkers EH, Helgeson HC. SUPCRT92: a softwarepackage for calculating the standard molal thermodynamicproperties of minerals, gases, aqueous species, and reactions from1 to 5000 bar and 0 to 1000 degC. Comput Geosci 1992;18(7):899–947.
[83] Bourbie T, Zinszner B. Hydraulic and acoustic properties as afunction of porosity in fontainebleau sandstone. J Geophys Res1985;90:11,524–32.
[84] Zhu W, David C, Wong T. Network modeling of permeabilityevolution during cementation and hot isostatic pressing. GeophysRes: Solid Earth 1995;100(B8):15,451–64.
[85] Zhu WL, Evans B, Bernabe Y. Densification and permeabilityreduction in hot-pressed calcite: a kinetic model. J Geophys Res-Solid Earth 1999;104(B11):25501–11.
[86] Press WH, Teukolsky SA, Vetterling WT, Flannery BP. Numer-ical recipes in FORTRAN. 2nd ed. Cambridge: CambridgeUniversity Press; 1992.
[87] Kump LR, Brantley SL, Arthur MA. Chemical weathering,atmospheric CO2, and climate. Annu Rev Earth Planet Sci 2000;28:611–67.