Embed Size (px)
Citation preview
© 2012 Population Reference Bureau (see notes, page 18) 2012 WORLD POPULATION DATA SHEET
1
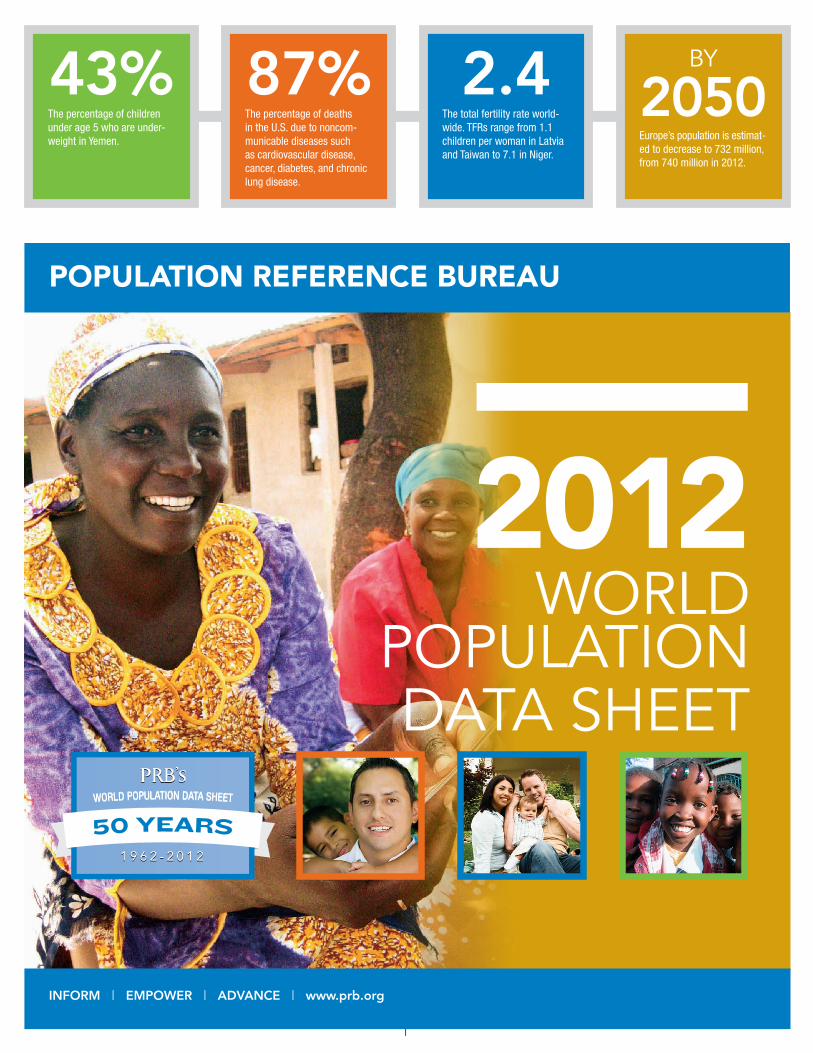
43%The percentage of children under age 5 who are underweight in Yemen.
87%The percentage of deaths in the U.S. due to noncommunicable diseases such as cardiovascular disease, cancer, diabetes, and chronic lung disease.
BY
2050Europe’s population is estimated to decrease to 732 million, from 740 million in 2012.
2.4The total fertility rate worldwide. TFRs range from 1.1 children per woman in Latvia and Taiwan to 7.1 in Niger.
2012World
PoPulation data Sheet
PoPulation RefeRence BuReau
INFORM | EMpOwER | AdvANcE | www.prb.org
1 9 6 2 - 2 0 1 21 9 6 2 - 2 0 1 2
2
© 2012 Population Reference Bureau 2012 WORLD POPULATION DATA SHEET
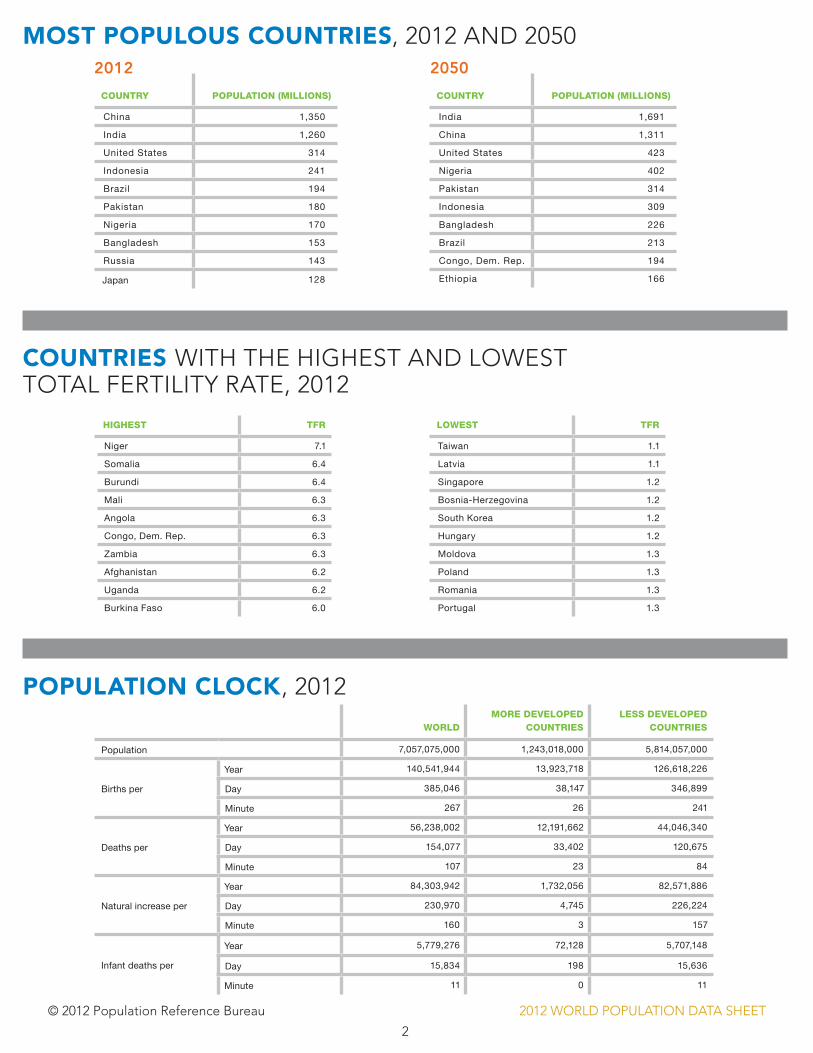
Most PoPulous countRies, 2012 AND 20502012 2050
Country PoPulation (millions)
India 1,691
China 1,311
United States 423
Nigeria 402
Pakistan 314
Indonesia 309
Bangladesh 226
Brazil 213
Congo, Dem. Rep. 194
Ethiopia 166
Country PoPulation (millions)
China 1,350
India 1,260
United States 314
Indonesia 241
Brazil 194
Pakistan 180
Nigeria 170
Bangladesh 153
Russia 143
Japan 128
countRies WITH THE HIGHEST AND LOWEST TOTAL FERTILITY RATE, 2012
HiGHEst tFr
Niger 7.1
Somalia 6.4
Burundi 6.4
Mali 6.3
Angola 6.3
Congo, Dem. Rep. 6.3
Zambia 6.3
Afghanistan 6.2
Uganda 6.2
Burkina Faso 6.0
PoPulation clock, 2012
WorlDmorE DEvEloPED
CountriEslEss DEvEloPED
CountriEs
Population 7,057,075,000 1,243,018,000 5,814,057,000
Births per
Year 140,541,944 13,923,718 126,618,226
Day 385,046 38,147 346,899
Minute 267 26 241
Deaths per
Year 56,238,002 12,191,662 44,046,340
Day 154,077 33,402 120,675
Minute 107 23 84
Natural increase per
Year 84,303,942 1,732,056 82,571,886
Day 230,970 4,745 226,224
Minute 160 3 157
Infant deaths per
Year 5,779,276 72,128 5,707,148
Day 15,834 198 15,636
Minute 11 0 11
loWEst tFr
Taiwan 1.1
Latvia 1.1
Singapore 1.2
Bosnia-Herzegovina 1.2
South Korea 1.2
Hungary 1.2
Moldova 1.3
Poland 1.3
Romania 1.3
Portugal 1.3
3
© 2012 Population Reference Bureau 2012 WORLD POPULATION DATA SHEET
W O R L D P O P U L A T I O N H I G H L I G H T SF o C U S o N N o N C o M M U N I C A B L E D I S E A S E S
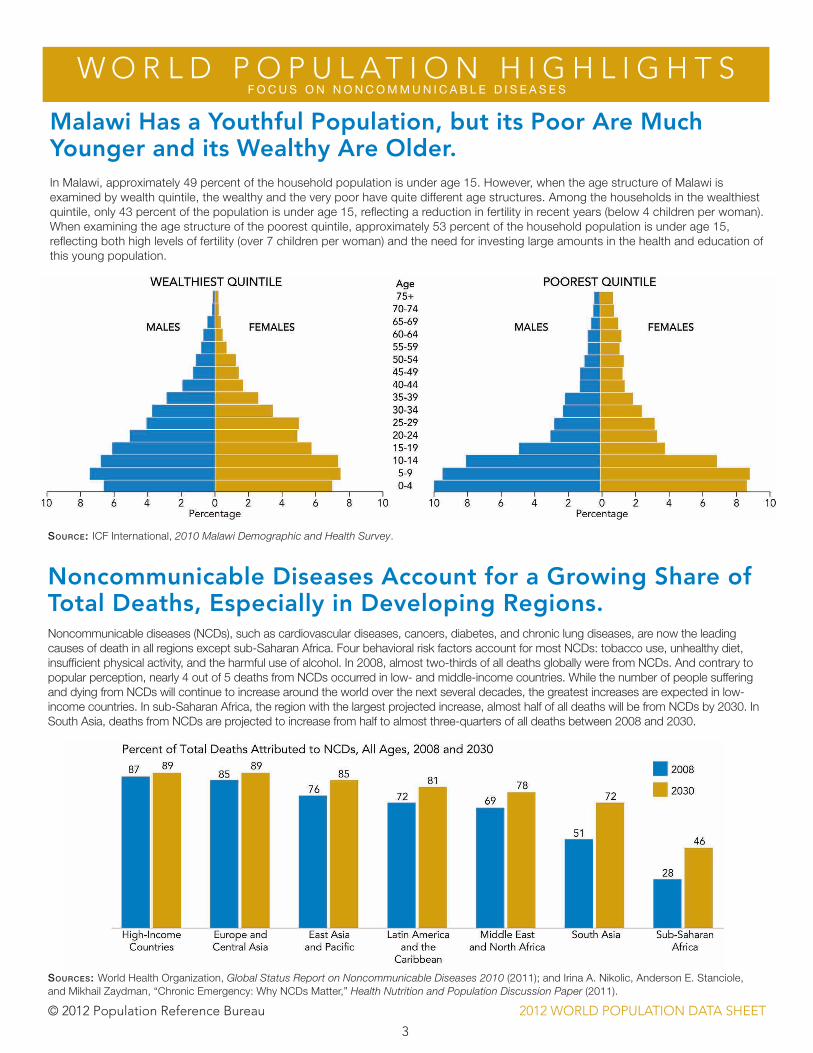
Noncommunicable diseases Account for a Growing Share of Total deaths, Especially in developing Regions. Noncommunicable diseases (NCDs), such as cardiovascular diseases, cancers, diabetes, and chronic lung diseases, are now the leading causes of death in all regions except sub-Saharan Africa. Four behavioral risk factors account for most NCDs: tobacco use, unhealthy diet, insufficient physical activity, and the harmful use of alcohol. In 2008, almost two-thirds of all deaths globally were from NCDs. And contrary to popular perception, nearly 4 out of 5 deaths from NCDs occurred in low- and middle-income countries. While the number of people suffering and dying from NCDs will continue to increase around the world over the next several decades, the greatest increases are expected in low-income countries. In sub-Saharan Africa, the region with the largest projected increase, almost half of all deaths will be from NCDs by 2030. In South Asia, deaths from NCDs are projected to increase from half to almost three-quarters of all deaths between 2008 and 2030.
SourceS: World Health Organization, Global Status Report on Noncommunicable Diseases 2010 (2011); and Irina A. Nikolic, Anderson E. Stanciole, and Mikhail Zaydman, “Chronic Emergency: Why NCDs Matter,” Health Nutrition and Population Discussion Paper (2011).
In Malawi, approximately 49 percent of the household population is under age 15. However, when the age structure of Malawi is examined by wealth quintile, the wealthy and the very poor have quite different age structures. Among the households in the wealthiest quintile, only 43 percent of the population is under age 15, reflecting a reduction in fertility in recent years (below 4 children per woman). When examining the age structure of the poorest quintile, approximately 53 percent of the household population is under age 15, reflecting both high levels of fertility (over 7 children per woman) and the need for investing large amounts in the health and education of this young population.
Malawi Has a Youthful population, but its poor Are Much Younger and its wealthy Are Older.
Source: ICF International, 2010 Malawi Demographic and Health Survey.
4
© 2012 Population Reference Bureau 2012 WORLD POPULATION DATA SHEET
W O R L D P O P U L A T I O N H I G H L I G H T SF o C U S o N N o N C o M M U N I C A B L E D I S E A S E S
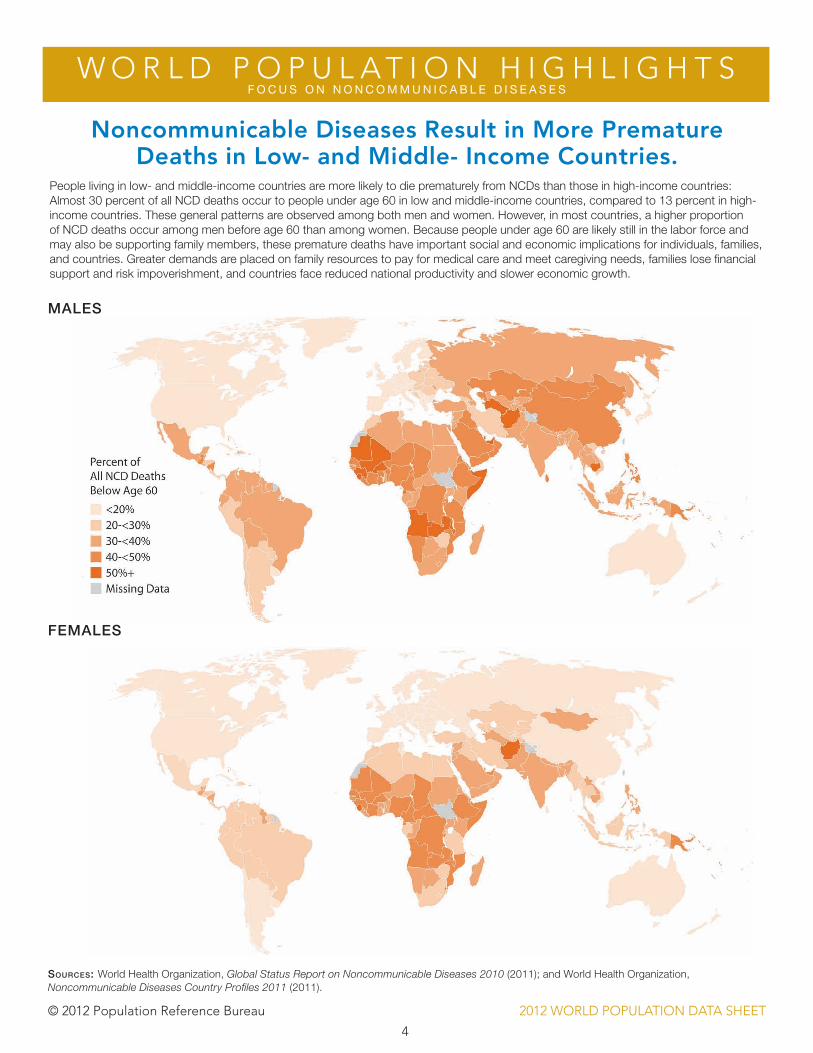
Males
Noncommunicable diseases Result in More premature deaths in Low- and Middle- Income countries.
SourceS: World Health Organization, Global Status Report on Noncommunicable Diseases 2010 (2011); and World Health Organization, Noncommunicable Diseases Country Profiles 2011 (2011).
People living in low- and middle-income countries are more likely to die prematurely from NCDs than those in high-income countries: Almost 30 percent of all NCD deaths occur to people under age 60 in low and middle-income countries, compared to 13 percent in high-income countries. These general patterns are observed among both men and women. However, in most countries, a higher proportion of NCD deaths occur among men before age 60 than among women. Because people under age 60 are likely still in the labor force and may also be supporting family members, these premature deaths have important social and economic implications for individuals, families, and countries. Greater demands are placed on family resources to pay for medical care and meet caregiving needs, families lose financial support and risk impoverishment, and countries face reduced national productivity and slower economic growth.
FeMales
5
© 2012 Population Reference Bureau 2012 WORLD POPULATION DATA SHEET
W O R L D P O P U L A T I O N H I G H L I G H T SF o C U S o N N o N C o M M U N I C A B L E D I S E A S E S
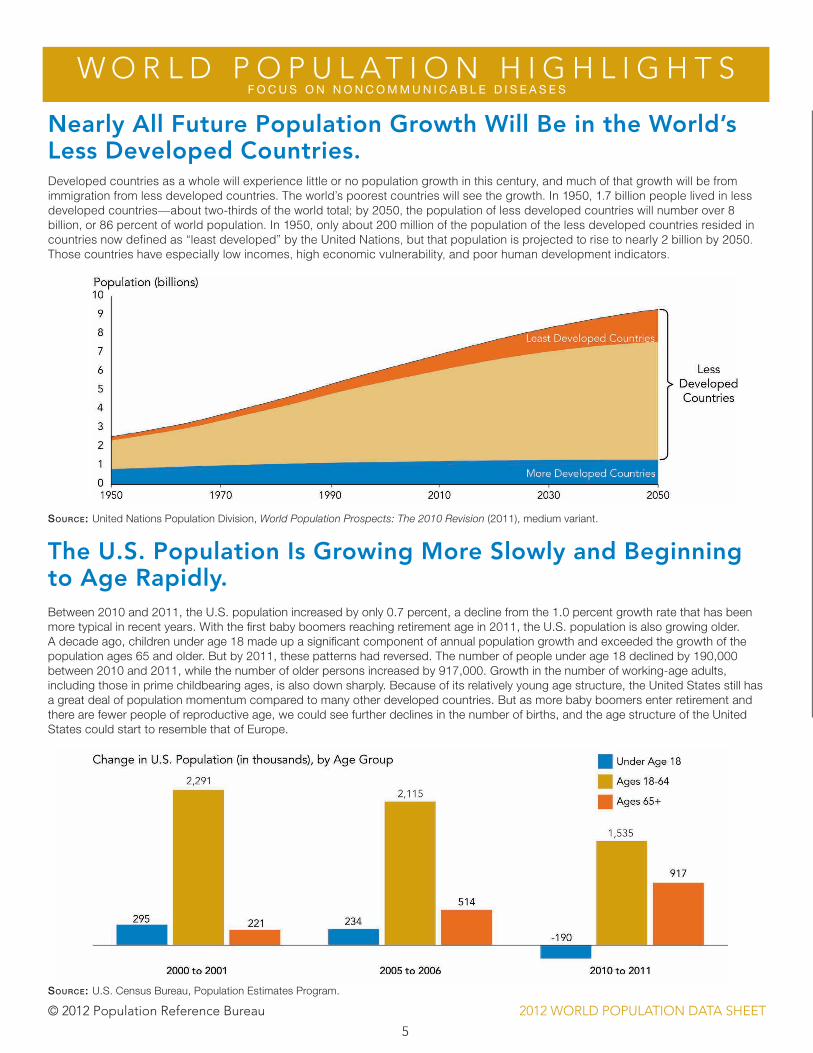
Between 2010 and 2011, the U.S. population increased by only 0.7 percent, a decline from the 1.0 percent growth rate that has been more typical in recent years. With the first baby boomers reaching retirement age in 2011, the U.S. population is also growing older. A decade ago, children under age 18 made up a significant component of annual population growth and exceeded the growth of the population ages 65 and older. But by 2011, these patterns had reversed. The number of people under age 18 declined by 190,000 between 2010 and 2011, while the number of older persons increased by 917,000. Growth in the number of working-age adults, including those in prime childbearing ages, is also down sharply. Because of its relatively young age structure, the United States still has a great deal of population momentum compared to many other developed countries. But as more baby boomers enter retirement and there are fewer people of reproductive age, we could see further declines in the number of births, and the age structure of the United States could start to resemble that of Europe.
The U.S. population Is Growing More Slowly and Beginning to Age Rapidly.
Nearly All Future population Growth will Be in the world’s Less developed countries.Developed countries as a whole will experience little or no population growth in this century, and much of that growth will be from immigration from less developed countries. The world’s poorest countries will see the growth. In 1950, 1.7 billion people lived in less developed countries—about two-thirds of the world total; by 2050, the population of less developed countries will number over 8 billion, or 86 percent of world population. In 1950, only about 200 million of the population of the less developed countries resided in countries now defined as “least developed” by the United Nations, but that population is projected to rise to nearly 2 billion by 2050. Those countries have especially low incomes, high economic vulnerability, and poor human development indicators.
Source: United Nations Population Division, World Population Prospects: The 2010 Revision (2011), medium variant.
Source: U.S. Census Bureau, Population Estimates Program.
© 2012 Population Reference Bureau (see notes, page 18) 2012 WORLD POPULATION DATA SHEET
6
InfantMortality
Ratea
Projected Population (millions)
wORLd 7,058 20 8 1.2 — 8,082 9,624 1.4 41 MORE dEvELOpEd 1,243 11 10 0.1 2 1,292 1,338 1.1 5 LESS dEvELOpEd 5,814 22 8 1.4 -1 6,789 8,286 1.4 45 LESS dEvELOpEd (Excl. china) 4,464 25 8 1.7 -1 5,387 6,975 1.6 49 LEAST dEvELOpEd 876 35 10 2.4 -1 1,185 1,899 2.2 72AFRIcA 1,072 36 11 2.5 -1 1,446 2,339 2.2 67SUB-SAHARAN AFRIcA 902 38 12 2.6 -1 1,245 2,092 2.3 72NORTHERN AFRIcA 213 26 6 2.0 -1 263 346 1.6 38
Algeria 37.4 25 4 2.0 -1 42.0 46.5 1.2 24 Egypt 82.3 25 5 2.0 -1 102.0 135.6 1.6 24 Libya 6.5 23 4 1.9 -5 7.5 8.8 1.4 14 Morocco 32.6 19 6 1.4 -4 36.9 41.4 1.3 30 South Sudan 9.4 42 14 2.8 6 14.6 25.1 2.7 101 Sudan 33.5 34 9 2.4 -2 46.8 74.1 2.2 67 Tunisia 10.8 19 6 1.3 -0 12.1 13.7 1.3 20
Western Saharad 0.6 22 6 1.7 18 0.8 0.9 1.6 40wESTERN AFRIcA 324 40 13 2.7 -1 450 774 2.4 76
Benin 9.4 40 12 2.9 -1 13.5 23.3 2.5 81 Burkina Faso 17.5 43 12 3.1 -1 25.5 46.7 2.7 65 Cape Verde 0.5 26 6 2.0 -2 0.6 0.7 1.4 24 Côte d'Ivoire 20.6 35 12 2.3 -2 28.1 46.1 2.2 73 Gambia 1.8 38 9 2.9 -2 2.5 4.0 2.2 70 Ghana 25.5 32 8 2.4 -0 33.4 49.1 1.9 47 Guinea 11.5 39 13 2.6 -3 14.3 23.0 2.0 89 Guinea-Bissau 1.6 38 17 2.2 -1 2.1 3.3 2.0 103 Liberia 4.2 40 11 2.9 -1 6.0 10.8 2.6 83 Mali 16.0 46 15 3.2 -2 23.7 45.3 2.8 97 Mauritania 3.6 34 10 2.4 -1 4.7 7.1 2.0 74 Niger 16.3 46 11 3.5 -1 25.6 54.2 3.3 81 Nigeria 170.1 40 14 2.6 -0 234.4 402.4 2.4 77 Senegal 13.1 38 9 2.9 -2 18.6 32.3 2.5 47 Sierra Leone 6.1 39 16 2.3 1 7.8 11.1 1.8 109
Togo 6.0 36 8 2.8 0 9.4 14.3 2.4 78EASTERN AFRIcA 342 38 11 2.7 -1 477 799 2.3 60
Burundi 10.6 42 10 3.2 4 15.5 27.1 2.6 63 Comoros 0.8 37 9 2.9 -3 1.0 1.7 2.2 68 Djibouti 0.9 29 10 1.9 0 1.2 1.6 1.8 79 Eritrea 5.6 36 8 2.8 2 7.6 11.6 2.1 51 Ethiopia 87.0 34 10 2.4 -1 115.0 166.5 1.9 59 Kenya 43.0 35 8 2.7 -0 53.2 70.8 1.6 47 Madagascar 21.9 35 7 2.9 -0 31.2 53.6 2.4 43 Malawi 15.9 43 15 2.8 -0 24.2 49.7 3.1 66 Mauritius 1.3 11 7 0.4 -0 1.4 1.3 1.0 12.9 Mayotte 0.2 41 3 3.8 -0 0.3 0.6 2.6 6 Mozambique 23.7 42 14 2.8 0 36.5 67.5 2.8 86 Reunion 0.9 17 5 1.2 0 1.0 1.1 1.2 8 Rwanda 10.8 33 10 2.2 0 14.3 20.6 1.9 50 Seychelles 0.1 18 8 1.0 2 0.1 0.1 1.1 12.6 Somalia 10.1 44 16 2.8 -12 13.3 22.6 2.2 107 Tanzania 47.7 41 11 3.0 -1 70.9 138.3 2.9 51 Uganda 35.6 45 12 3.3 -1 52.3 94.3 2.6 54 Zambia 13.7 46 16 3.0 -1 20.7 44.5 3.2 88
Zimbabwe 12.6 34 15 1.9 -9 17.7 25.6 2.0 57MIddLE AFRIcA 134 43 15 2.8 -0 193 352 2.6 98
Angola 20.9 44 12 3.2 1 32.2 63.2 3.0 64 Cameroon 20.9 41 14 2.7 -0 28.0 44.6 2.1 62 Central African Republic 4.6 35 16 1.9 0 5.9 8.4 1.8 101 Chad 11.8 45 16 2.8 -2 16.4 27.3 2.3 128 Congo 4.2 40 11 2.8 0 5.9 10.2 2.4 70 Congo, Dem. Rep. 69.1 45 17 2.8 -1 101.0 194.2 2.8 115 Equatorial Guinea 0.7 37 15 2.2 2 1.0 1.5 2.0 98
2050 Population
as a Multipleof 2012
Population mid-2012(millions)
Births per 1,000
Population
Deaths per 1,000
Population
Rate ofNatural
Increase%
Net Migration
Rateper 1,000 mid-2050mid-2025
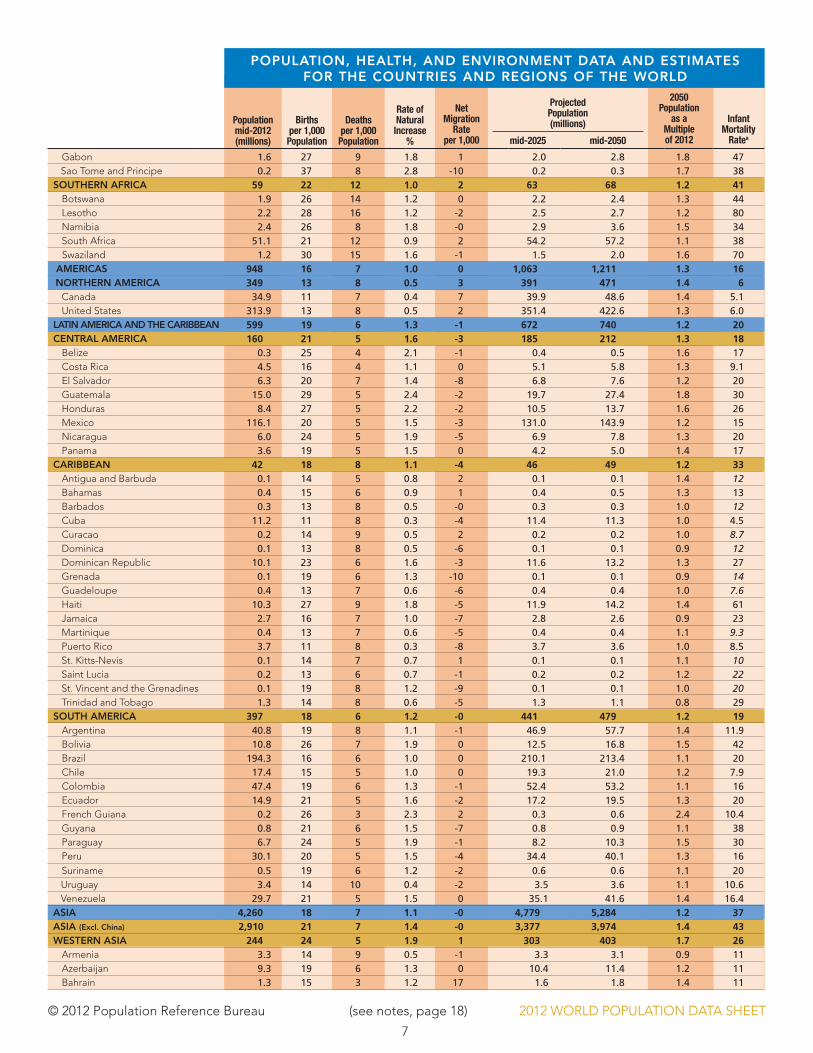
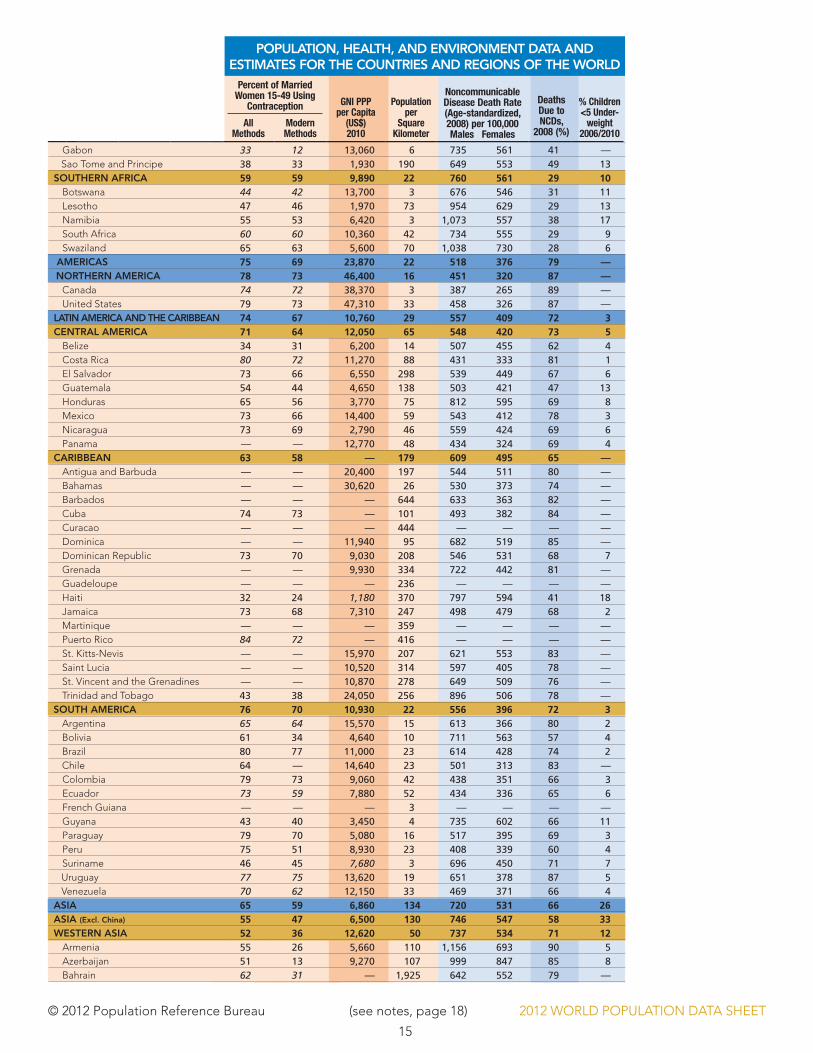
pOpULATION, HEALTH, ANd ENvIRONMENT dATA ANd ESTIMATES FOR THE cOUNTRIES ANd REGIONS OF THE wORLd
© 2012 Population Reference Bureau (see notes, page 18) 2012 WORLD POPULATION DATA SHEET
7
InfantMortality
Ratea
TotalFertilityRateb <15 65+
Both Sexes Males Females
Percent Urban Males Females
All Methods
Modern Methods
GNI PPP per Capita
(US$) 2010
Population per
Square Kilometer
Noncommunicable Disease Death Rate (Age-standardized, 2008) per 100,000 Males Females
% Children <5 Under-
weight 2006/2010
Projected Population (millions)
2050 Population
as a Multipleof 2012
Population mid-2012(millions)
Births per 1,000
Population
Deaths per 1,000
Population
Rate ofNatural
Increase%
Net Migration
Rateper 1,000 mid-2050mid-2025
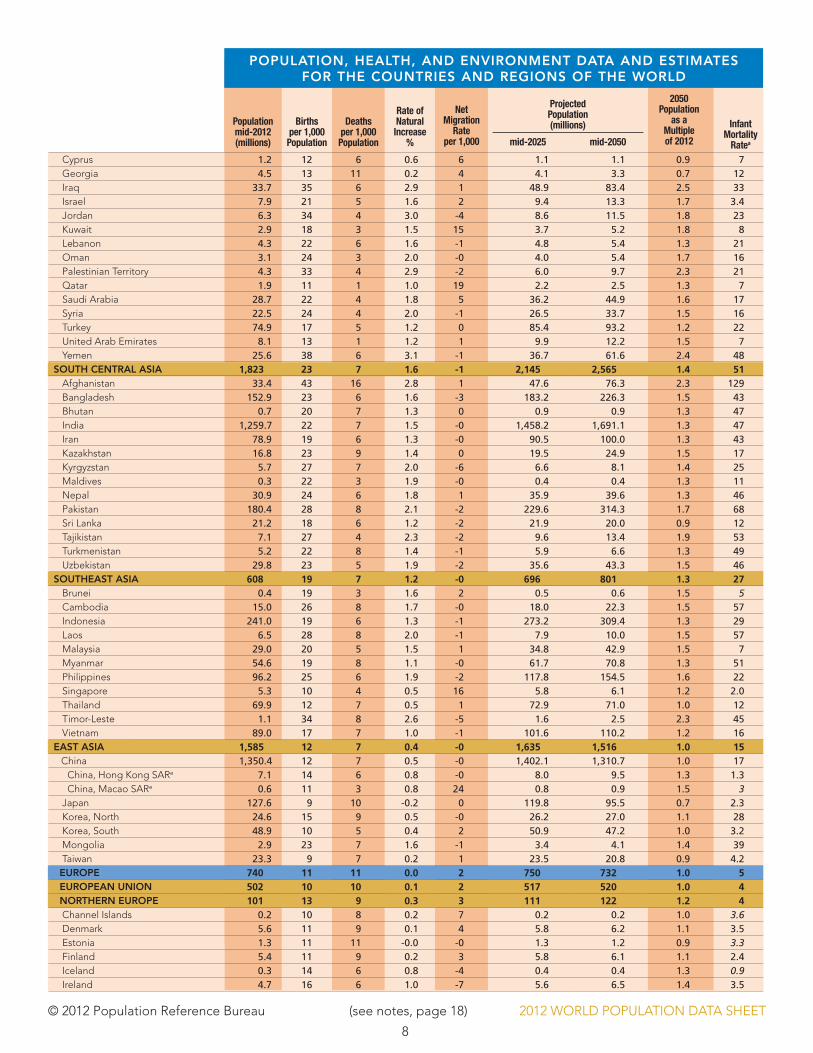
pOpULATION, HEALTH, ANd ENvIRONMENT dATA ANd ESTIMATES FOR THE cOUNTRIES ANd REGIONS OF THE wORLd
Gabon 1.6 27 9 1.8 1 2.0 2.8 1.8 47 Sao Tome and Principe 0.2 37 8 2.8 -10 0.2 0.3 1.7 38SOUTHERN AFRIcA 59 22 12 1.0 2 63 68 1.2 41
Botswana 1.9 26 14 1.2 0 2.2 2.4 1.3 44 Lesotho 2.2 28 16 1.2 -2 2.5 2.7 1.2 80 Namibia 2.4 26 8 1.8 -0 2.9 3.6 1.5 34 South Africa 51.1 21 12 0.9 2 54.2 57.2 1.1 38 Swaziland 1.2 30 15 1.6 -1 1.5 2.0 1.6 70
AMERIcAS 948 16 7 1.0 0 1,063 1,211 1.3 16NORTHERN AMERIcA 349 13 8 0.5 3 391 471 1.4 6 Canada 34.9 11 7 0.4 7 39.9 48.6 1.4 5.1 United States 313.9 13 8 0.5 2 351.4 422.6 1.3 6.0
LATIN AMERIcA ANd THE cARIBBEAN 599 19 6 1.3 -1 672 740 1.2 20cENTRAL AMERIcA 160 21 5 1.6 -3 185 212 1.3 18
Belize 0.3 25 4 2.1 -1 0.4 0.5 1.6 17 Costa Rica 4.5 16 4 1.1 0 5.1 5.8 1.3 9.1 El Salvador 6.3 20 7 1.4 -8 6.8 7.6 1.2 20 Guatemala 15.0 29 5 2.4 -2 19.7 27.4 1.8 30 Honduras 8.4 27 5 2.2 -2 10.5 13.7 1.6 26 Mexico 116.1 20 5 1.5 -3 131.0 143.9 1.2 15 Nicaragua 6.0 24 5 1.9 -5 6.9 7.8 1.3 20 Panama 3.6 19 5 1.5 0 4.2 5.0 1.4 17
cARIBBEAN 42 18 8 1.1 -4 46 49 1.2 33 Antigua and Barbuda 0.1 14 5 0.8 2 0.1 0.1 1.4 12 Bahamas 0.4 15 6 0.9 1 0.4 0.5 1.3 13 Barbados 0.3 13 8 0.5 -0 0.3 0.3 1.0 12 Cuba 11.2 11 8 0.3 -4 11.4 11.3 1.0 4.5 Curacao 0.2 14 9 0.5 2 0.2 0.2 1.0 8.7 Dominica 0.1 13 8 0.5 -6 0.1 0.1 0.9 12 Dominican Republic 10.1 23 6 1.6 -3 11.6 13.2 1.3 27 Grenada 0.1 19 6 1.3 -10 0.1 0.1 0.9 14 Guadeloupe 0.4 13 7 0.6 -6 0.4 0.4 1.0 7.6 Haiti 10.3 27 9 1.8 -5 11.9 14.2 1.4 61 Jamaica 2.7 16 7 1.0 -7 2.8 2.6 0.9 23 Martinique 0.4 13 7 0.6 -5 0.4 0.4 1.1 9.3 Puerto Rico 3.7 11 8 0.3 -8 3.7 3.6 1.0 8.5 St. Kitts-Nevis 0.1 14 7 0.7 1 0.1 0.1 1.1 10 Saint Lucia 0.2 13 6 0.7 -1 0.2 0.2 1.2 22 St. Vincent and the Grenadines 0.1 19 8 1.2 -9 0.1 0.1 1.0 20 Trinidad and Tobago 1.3 14 8 0.6 -5 1.3 1.1 0.8 29
SOUTH AMERIcA 397 18 6 1.2 -0 441 479 1.2 19 Argentina 40.8 19 8 1.1 -1 46.9 57.7 1.4 11.9 Bolivia 10.8 26 7 1.9 0 12.5 16.8 1.5 42 Brazil 194.3 16 6 1.0 0 210.1 213.4 1.1 20 Chile 17.4 15 5 1.0 0 19.3 21.0 1.2 7.9 Colombia 47.4 19 6 1.3 -1 52.4 53.2 1.1 16 Ecuador 14.9 21 5 1.6 -2 17.2 19.5 1.3 20 French Guiana 0.2 26 3 2.3 2 0.3 0.6 2.4 10.4 Guyana 0.8 21 6 1.5 -7 0.8 0.9 1.1 38 Paraguay 6.7 24 5 1.9 -1 8.2 10.3 1.5 30 Peru 30.1 20 5 1.5 -4 34.4 40.1 1.3 16 Suriname 0.5 19 6 1.2 -2 0.6 0.6 1.1 20
Uruguay 3.4 14 10 0.4 -2 3.5 3.6 1.1 10.6 Venezuela 29.7 21 5 1.5 0 35.1 41.6 1.4 16.4ASIA 4,260 18 7 1.1 -0 4,779 5,284 1.2 37ASIA (Excl. china) 2,910 21 7 1.4 -0 3,377 3,974 1.4 43wESTERN ASIA 244 24 5 1.9 1 303 403 1.7 26
Armenia 3.3 14 9 0.5 -1 3.3 3.1 0.9 11 Azerbaijan 9.3 19 6 1.3 0 10.4 11.4 1.2 11 Bahrain 1.3 15 3 1.2 17 1.6 1.8 1.4 11
© 2012 Population Reference Bureau (see notes, page 18) 2012 WORLD POPULATION DATA SHEET
8
Projected Population (millions)
2050 Population
as a Multipleof 2012
Population mid-2012(millions)
Births per 1,000
Population
Deaths per 1,000
Population
Rate ofNatural
Increase%
Net Migration
Rateper 1,000 mid-2050mid-2025
pOpULATION, HEALTH, ANd ENvIRONMENT dATA ANd ESTIMATES FOR THE cOUNTRIES ANd REGIONS OF THE wORLd
InfantMortality
Ratea
TotalFertilityRateb <15 65+
Both Sexes Males Females
Percent Urban Males Females
All Methods
Modern Methods
GNI PPP per Capita
(US$) 2010
Population per
Square Kilometer
Noncommunicable Disease Death Rate (Age-standardized, 2008) per 100,000 Males Females
% Children <5 Under-
weight 2006/2010
Cyprus 1.2 12 6 0.6 6 1.1 1.1 0.9 7 1.4 17 12 78 76 81 62 — — — — 30,890 127 417 282 90 — Georgia 4.5 13 11 0.2 4 4.1 3.3 0.7 12 1.7 17 14 74 70 79 53 0.1 0.1 47 27 4,990 65 858 491 91 1 Iraq 33.7 35 6 2.9 1 48.9 83.4 2.5 33 4.6 43 3 70 66 72 67 — — 51 33 3,370 77 780 593 44 6 Israel 7.9 21 5 1.6 2 9.4 13.3 1.7 3.4 3.0 28 10 82 80 83 92 0.2 0.1 — — 27,660 357 377 268 87 — Jordan 6.3 34 4 3.0 -4 8.6 11.5 1.8 23 3.8 37 3 73 72 74 83 — — 59 42 5,800 71 818 568 74 2 Kuwait 2.9 18 3 1.5 15 3.7 5.2 1.8 8 2.3 27 3 75 74 76 98 — — 58 34 — 162 395 394 76 — Lebanon 4.3 22 6 1.6 -1 4.8 5.4 1.3 21 1.9 25 7 72 70 75 87 0.2 0.1 58 34 14,090 414 717 465 84 — Oman 3.1 24 3 2.0 -0 4.0 5.4 1.7 16 2.9 32 3 74 72 76 73 0.1 <0.1 32 25 25,190 10 758 494 83 9 Palestinian Territory 4.3 33 4 2.9 -2 6.0 9.7 2.3 21 4.4 42 3 73 71 74 83 — — 50 39 — 709 — — — — Qatar 1.9 11 1 1.0 19 2.2 2.5 1.3 7 2.1 14 1 78 78 79 100 <0.1 <0.1 43 32 — 171 368 434 69 — Saudi Arabia 28.7 22 4 1.8 5 36.2 44.9 1.6 17 2.8 30 3 74 73 75 81 — — 24 — 22,750 13 753 510 71 — Syria 22.5 24 4 2.0 -1 26.5 33.7 1.5 16 3.0 36 4 74 71 77 54 — — 58 43 5,120 122 730 504 77 10 Turkey 74.9 17 5 1.2 0 85.4 93.2 1.2 22 2.0 26 7 73 71 76 77 <0.1 <0.1 73 46 15,530 96 708 475 85 2 United Arab Emirates 8.1 13 1 1.2 1 9.9 12.2 1.5 7 1.8 17 0 76 76 78 83 — — 28 24 50,580 97 448 340 67 — Yemen 25.6 38 6 3.1 -1 36.7 61.6 2.4 48 5.2 44 3 65 64 67 29 — — 28 19 2,500 48 887 721 45 43
SOUTH cENTRAL ASIA 1,823 23 7 1.6 -1 2,145 2,565 1.4 51 2.6 31 5 66 64 67 33 0.3 0.2 52 45 3,560 169 786 593 53 39 Afghanistan 33.4 43 16 2.8 1 47.6 76.3 2.3 129 6.2 46 2 49 48 49 23 — — 23 15 1,060 51 1,285 953 29 33 Bangladesh 152.9 23 6 1.6 -3 183.2 226.3 1.5 43 2.3 31 5 69 68 69 25 <0.1 <0.1 61 52 1,810 1,062 748 648 52 41 Bhutan 0.7 20 7 1.3 0 0.9 0.9 1.3 47 2.6 30 5 69 68 69 35 0.3 0.1 66 65 4,990 15 793 655 53 13 India 1,259.7 22 7 1.5 -0 1,458.2 1,691.1 1.3 47 2.5 31 5 65 64 67 31 0.4 0.3 54 47 3,400 383 782 571 53 43 Iran 78.9 19 6 1.3 -0 90.5 100.0 1.3 43 1.9 24 5 70 68 71 69 0.2 0.1 73 59 11,490 48 661 507 72 — Kazakhstan 16.8 23 9 1.4 0 19.5 24.9 1.5 17 2.6 25 7 69 64 74 55 0.1 0.2 51 49 10,770 6 1,270 772 78 4 Kyrgyzstan 5.7 27 7 2.0 -6 6.6 8.1 1.4 25 2.7 30 4 69 65 73 35 0.4 0.2 48 46 2,070 28 1,088 758 77 2 Maldives 0.3 22 3 1.9 -0 0.4 0.4 1.3 11 2.3 27 5 74 73 74 35 <0.1 <0.1 35 27 8,110 1,110 611 559 79 17 Nepal 30.9 24 6 1.8 1 35.9 39.6 1.3 46 2.6 36 4 68 68 69 17 0.5 0.3 50 43 1,210 210 706 536 50 39 Pakistan 180.4 28 8 2.1 -2 229.6 314.3 1.7 68 3.6 35 4 65 64 66 35 0.1 0.1 27 19 2,790 227 747 638 46 31 Sri Lanka 21.2 18 6 1.2 -2 21.9 20.0 0.9 12 2.2 25 8 75 72 78 15 <0.1 <0.1 68 53 5,010 323 746 461 65 21 Tajikistan 7.1 27 4 2.3 -2 9.6 13.4 1.9 53 3.3 37 3 73 70 75 26 0.3 0.1 37 32 2,140 49 678 759 59 15 Turkmenistan 5.2 22 8 1.4 -1 5.9 6.6 1.3 49 2.4 29 4 65 61 69 47 — — 62 45 7,490 11 1,182 873 73 8 Uzbekistan 29.8 23 5 1.9 -2 35.6 43.3 1.5 46 2.6 29 4 68 65 71 51 0.2 0.1 65 59 3,110 67 938 734 79 4
SOUTHEAST ASIA 608 19 7 1.2 -0 696 801 1.3 27 2.3 28 6 71 68 74 43 0.4 0.2 62 53 5,140 135 737 524 63 19 Brunei 0.4 19 3 1.6 2 0.5 0.6 1.5 5 2.0 26 4 78 76 80 72 — — — — 50,180 72 534 489 82 — Cambodia 15.0 26 8 1.7 -0 18.0 22.3 1.5 57 3.0 33 4 62 60 65 21 0.4 0.7 51 35 2,080 83 958 592 46 28 Indonesia 241.0 19 6 1.3 -1 273.2 309.4 1.3 29 2.3 27 6 72 70 74 43 0.3 0.1 61 57 4,200 127 757 538 64 18 Laos 6.5 28 8 2.0 -1 7.9 10.0 1.5 57 3.5 38 4 65 64 67 27 0.3 0.2 32 29 2,440 28 849 689 48 31 Malaysia 29.0 20 5 1.5 1 34.8 42.9 1.5 7 2.6 27 5 74 72 77 63 0.8 0.1 — — 14,220 88 606 437 67 13 Myanmar 54.6 19 8 1.1 -0 61.7 70.8 1.3 51 2.3 28 5 65 61 67 31 0.8 0.4 41 38 1,950 81 737 571 40 23 Philippines 96.2 25 6 1.9 -2 117.8 154.5 1.6 22 3.2 35 4 69 65 72 63 <0.1 <0.1 51 34 3,980 321 712 483 61 22 Singapore 5.3 10 4 0.5 16 5.8 6.1 1.2 2.0 1.2 17 9 82 79 84 100 0.1 0.1 62 55 55,790 7,751 372 239 79 — Thailand 69.9 12 7 0.5 1 72.9 71.0 1.0 12 1.6 21 9 74 71 77 34 — — 80 77 8,190 136 792 541 71 7 Timor-Leste 1.1 34 8 2.6 -5 1.6 2.5 2.3 45 5.7 42 3 62 61 63 30 — — 22 21 3,600 76 651 475 34 45 Vietnam 89.0 17 7 1.0 -1 101.6 110.2 1.2 16 2.0 24 7 73 70 76 31 0.6 0.3 78 60 3,070 268 687 508 75 20
EAST ASIA 1,585 12 7 0.4 -0 1,635 1,516 1.0 15 1.5 16 10 75 73 78 56 — — 82 80 10,430 135 633 459 82 4 China 1,350.4 12 7 0.5 -0 1,402.1 1,310.7 1.0 17 1.5 16 9 75 73 77 51 — — 85 84 7,640 141 665 495 83 4 China, Hong Kong SARe 7.1 14 6 0.8 -0 8.0 9.5 1.3 1.3 1.2 12 14 83 81 87 100 — — 80 75 47,480 6,487 — — — — China, Macao SARe 0.6 11 3 0.8 24 0.8 0.9 1.5 3 1.2 12 7 82 79 86 100 — — — — 45,220 21,825 — — — — Japan 127.6 9 10 -0.2 0 119.8 95.5 0.7 2.3 1.4 13 24 83 80 86 86 <0.1 <0.1 54 44 34,610 338 337 178 80 — Korea, North 24.6 15 9 0.5 -0 26.2 27.0 1.1 28 2.0 23 9 69 65 73 60 — — 69 58 — 204 652 467 65 19 Korea, South 48.9 10 5 0.4 2 50.9 47.2 1.0 3.2 1.2 16 11 81 77 84 82 <0.1 <0.1 80 70 29,110 491 465 247 82 — Mongolia 2.9 23 7 1.6 -1 3.4 4.1 1.4 39 2.5 27 4 68 64 72 63 <0.1 <0.1 66 61 3,670 2 868 569 72 5 Taiwan 23.3 9 7 0.2 1 23.5 20.8 0.9 4.2 1.1 15 11 79 76 83 78 — — 71 — — 646 — — — —
EUROpE 740 11 11 0.0 2 750 732 1.0 5 1.6 16 16 77 73 80 71 0.5 0.4 73 62 27,080 32 664 380 88 —EUROpEAN UNION 502 10 10 0.1 2 517 520 1.0 4 1.6 16 18 80 77 83 72 0.3 0.2 72 64 31,730 116 497 299 90 —NORTHERN EUROpE 101 13 9 0.3 3 111 122 1.2 4 1.9 17 17 80 78 82 77 0.3 0.2 80 78 36,290 56 464 310 88 — Channel Islands 0.2 10 8 0.2 7 0.2 0.2 1.0 3.6 1.6 16 15 79 77 82 31 — — — — — 804 — — — — Denmark 5.6 11 9 0.1 4 5.8 6.2 1.1 3.5 1.8 18 17 79 77 82 72 0.3 0.1 — — 41,100 130 494 338 90 — Estonia 1.3 11 11 -0.0 -0 1.3 1.2 0.9 3.3 1.5 16 17 76 71 81 69 1.7 0.8 70 56 19,810 30 824 391 90 — Finland 5.4 11 9 0.2 3 5.8 6.1 1.1 2.4 1.8 16 18 80 77 84 68 0.1 0.1 79 78 37,070 16 452 265 89 — Iceland 0.3 14 6 0.8 -4 0.4 0.4 1.3 0.9 2.0 21 12 82 80 84 94 0.4 0.2 — — 28,270 3 364 257 88 — Ireland 4.7 16 6 1.0 -7 5.6 6.5 1.4 3.5
© 2012 Population Reference Bureau (see notes, page 18) 2012 WORLD POPULATION DATA SHEET
9
Projected Population (millions)
2050 Population
as a Multipleof 2012
Population mid-2012(millions)
Births per 1,000
Population
Deaths per 1,000
Population
Rate ofNatural
Increase%
Net Migration
Rateper 1,000 mid-2050mid-2025
InfantMortality
Ratea
TotalFertilityRateb <15 65+
Both Sexes Males Females
Percent Urban Males Females
All Methods
Modern Methods
GNI PPP per Capita
(US$) 2010
Population per
Square Kilometer
Noncommunicable Disease Death Rate (Age-standardized, 2008) per 100,000 Males Females
% Children <5 Under-
weight 2006/2010
pOpULATION, HEALTH, ANd ENvIRONMENT dATA ANd ESTIMATES FOR THE cOUNTRIES ANd REGIONS OF THE wORLd
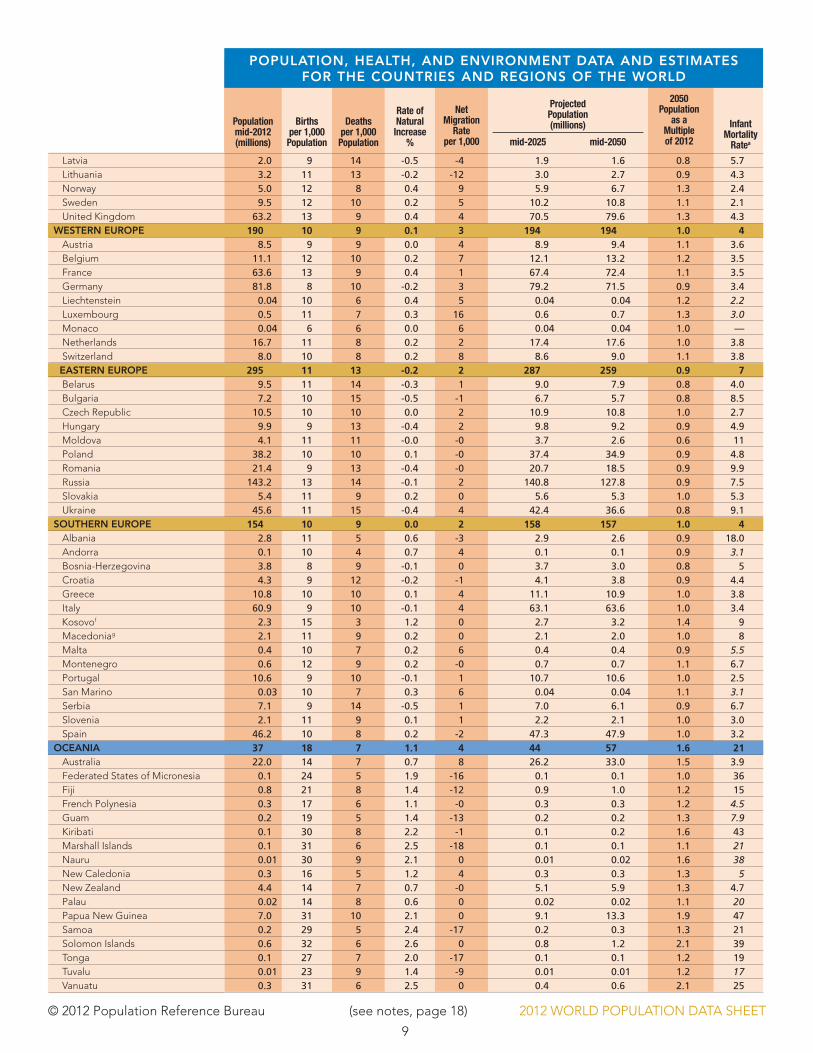
Latvia 2.0 9 14 -0.5 -4 1.9 1.6 0.8 5.7 1.1 14 17 74 69 78 68 0.9 0.4 68 56 16,320 32 921 459 90 — Lithuania 3.2 11 13 -0.2 -12 3.0 2.7 0.9 4.3 1.5 15 17 73 68 79 67 0.1 <0.1 51 33 17,840 49 876 438 86 — Norway 5.0 12 8 0.4 9 5.9 6.7 1.3 2.4 1.9 19 15 81 79 84 80 0.2 0.1 88 82 58,570 13 405 271 87 — Sweden 9.5 12 10 0.2 5 10.2 10.8 1.1 2.1 1.9 17 19 82 80 84 84 0.2 0.1 75 65 39,730 21 390 267 90 — United Kingdom 63.2 13 9 0.4 4 70.5 79.6 1.3 4.3 2.0 18 17 80 78 82 80 0.3 0.2 84 84 35,840 260 441 309 88 —
wESTERN EUROpE 190 10 9 0.1 3 194 194 1.0 4 1.6 16 18 81 78 83 75 0.3 0.2 72 69 37,940 172 437 264 90 — Austria 8.5 9 9 0.0 4 8.9 9.4 1.1 3.6 1.4 15 18 81 78 83 67 0.4 0.2 51 47 39,790 101 437 273 91 — Belgium 11.1 12 10 0.2 7 12.1 13.2 1.2 3.5 1.8 17 17 80 78 83 99 0.3 0.1 75 73 38,290 364 439 266 86 — France 63.6 13 9 0.4 1 67.4 72.4 1.1 3.5 2.0 19 17 82 78 85 78 0.5 0.3 77 75 34,750 115 419 225 87 — Germany 81.8 8 10 -0.2 3 79.2 71.5 0.9 3.4 1.4 13 21 80 78 83 73 0.2 0.1 70 66 38,100 229 460 290 92 — Liechtenstein 0.04 10 6 0.4 5 0.04 0.04 1.2 2.2 1.5 16 14 81 79 84 15 — — — — — 229 — — — — Luxembourg 0.5 11 7 0.3 16 0.6 0.7 1.3 3.0 1.5 18 14 80 78 83 83 0.4 0.2 — — 61,240 204 435 269 87 — Monaco 0.04 6 6 0.0 6 0.04 0.04 1.0 — 13 24 — — — 100 — — — — — 36,356 400 211 86 — Netherlands 16.7 11 8 0.2 2 17.4 17.6 1.0 3.8 1.7 17 16 81 79 83 66 0.3 0.1 69 67 41,810 403 425 291 89 — Switzerland 8.0 10 8 0.2 8 8.6 9.0 1.1 3.8 1.5 15 17 82 80 85 74 0.5 0.2 82 78 49,960 194 362 234 90 —EASTERN EUROpE 295 11 13 -0.2 2 287 259 0.9 7 1.5 15 14 71 66 76 69 0.7 0.8 75 58 16,590 16 991 522 85 — Belarus 9.5 11 14 -0.3 1 9.0 7.9 0.8 4.0 1.5 15 14 70 65 77 76 0.2 0.3 73 56 13,590 46 1,067 518 87 1 Bulgaria 7.2 10 15 -0.5 -1 6.7 5.7 0.8 8.5 1.5 13 19 74 70 77 73 0.1 <0.1 63 40 13,440 65 849 514 94 — Czech Republic 10.5 10 10 0.0 2 10.9 10.8 1.0 2.7 1.4 14 15 78 75 81 74 <0.1 <0.1 72 63 22,910 133 604 366 90 — Hungary 9.9 9 13 -0.4 2 9.8 9.2 0.9 4.9 1.2 15 17 74 71 78 69 0.1 <0.1 81 71 19,550 107 845 457 93 — Moldova 4.1 11 11 -0.0 -0 3.7 2.6 0.6 11 1.3 16 10 69 65 73 42 0.5 0.4 68 43 3,360 122 1,006 672 87 3 Poland 38.2 10 10 0.1 -0 37.4 34.9 0.9 4.8 1.3 15 14 76 72 81 61 0.1 0.1 — — 19,160 122 714 378 89 — Romania 21.4 9 13 -0.4 -0 20.7 18.5 0.9 9.9 1.3 15 15 73 70 77 55 0.2 0.1 70 38 14,290 90 789 483 91 4 Russia 143.2 13 14 -0.1 2 140.8 127.8 0.9 7.5 1.6 15 13 69 63 75 74 1.0 1.1 80 65 19,240 8 1,109 562 82 — Slovakia 5.4 11 9 0.2 0 5.6 5.3 1.0 5.3 1.4 15 13 75 72 79 54 <0.1 <0.1 80 66 22,980 110 768 425 90 — Ukraine 45.6 11 15 -0.4 4 42.4 36.6 0.8 9.1 1.5 14 15 70 65 76 69 1.1 1.2 67 48 6,620 75 1,122 583 86 —
SOUTHERN EUROpE 154 10 9 0.0 2 158 157 1.0 4 1.4 15 18 80 78 83 67 0.4 0.2 64 48 27,760 117 466 287 91 — Albania 2.8 11 5 0.6 -3 2.9 2.6 0.9 18.0 1.4 23 9 75 73 78 54 — — 69 10 8,520 99 755 623 89 5 Andorra 0.1 10 4 0.7 4 0.1 0.1 0.9 3.1 1.2 14 13 — — — 90 — — — — — 153 414 226 91 — Bosnia-Herzegovina 3.8 8 9 -0.1 0 3.7 3.0 0.8 5 1.2 15 14 76 73 78 46 — — 36 11 8,910 75 645 491 95 1 Croatia 4.3 9 12 -0.2 -1 4.1 3.8 0.9 4.4 1.5 15 17 77 74 80 56 <0.1 <0.1 — — 18,680 76 697 409 92 — Greece 10.8 10 10 0.1 4 11.1 10.9 1.0 3.8 1.5 14 19 80 78 82 73 0.2 0.1 76 46 27,630 82 445 289 91 — Italy 60.9 9 10 -0.1 4 63.1 63.6 1.0 3.4 1.4 14 21 82 79 85 68 0.3 0.2 63 41 31,810 202 400 245 92 —
Kosovof 2.3 15 3 1.2 0 2.7 3.2 1.4 9 2.0 28 7 69 67 71 — — — 44 18 — 210 — — — — Macedoniag 2.1 11 9 0.2 0 2.1 2.0 1.0 8 1.5 17 12 72 70 74 65 — — 14 10 11,070 80 756 579 95 2 Malta 0.4 10 7 0.2 6 0.4 0.4 0.9 5.5 1.4 15 16 81 79 83 100 0.1 0.1 86 46 24,820 1,262 441 303 90 — Montenegro 0.6 12 9 0.2 -0 0.7 0.7 1.1 6.7 1.6 19 13 74 72 77 64 — — 39 17 12,770 45 712 529 95 2 Portugal 10.6 9 10 -0.1 1 10.7 10.6 1.0 2.5 1.3 15 19 79 76 82 38 0.7 0.4 87 83 24,590 115 483 276 86 — San Marino 0.03 10 7 0.3 6 0.04 0.04 1.1 3.1 1.2 15 16 84 81 86 84 — — — — — 530 309 248 95 — Serbia 7.1 9 14 -0.5 1 7.0 6.1 0.9 6.7 1.3 15 17 74 71 77 59 0.2 0.1 41 19 11,090 92 804 578 95 1 Slovenia 2.1 11 9 0.1 1 2.2 2.1 1.0 3.0 1.5 14 17 80 76 83 50 0.1 <0.1 79 63 26,530 102 517 287 87 — Spain 46.2 10 8 0.2 -2 47.3 47.9 1.0 3.2 1.4 15 17 82 79 85 77 0.6 0.2 66 62 31,800 91 429 235 91 —
OcEANIA 37 18 7 1.1 4 44 57 1.6 21 2.5 24 11 77 75 79 66 0.3 0.3 63 60 26,560 4 493 351 77 — Australia 22.0 14 7 0.7 8 26.2 33.0 1.5 3.9 1.9 19 14 82 80 84 82 0.2 0.1 71 71 36,910 3 365 246 90 — Federated States of Micronesia 0.1 24 5 1.9 -16 0.1 0.1 1.0 36 3.5 31 6 68 67 68 22 — — — 70 3,490 152 754 623 67 — Fiji 0.8 21 8 1.4 -12 0.9 1.0 1.2 15 2.7 29 5 69 67 72 51 0.2 0.1 45 — 4,510 46 928 591 77 — French Polynesia 0.3 17 6 1.1 -0 0.3 0.3 1.2 4.5 2.1 25 6 75 73 78 51 — — — — — 69 — — — — Guam 0.2 19 5 1.4 -13 0.2 0.2 1.3 7.9 2.6 27 7 79 76 82 93 — — 67 58 — 291 — — — — Kiribati 0.1 30 8 2.2 -1 0.1 0.2 1.6 43 3.8 35 4 61 59 63 44 — — 22 13 3,520 145 832 548 69 — Marshall Islands 0.1 31 6 2.5 -18 0.1 0.1 1.1 21 4.3 42 2 68 64 67 68 — — 45 42 — 304 1,280 1316 73 — Nauru 0.01 30 9 2.1 0 0.01 0.02 1.6 38 3.3 35 1 56 55 57 100 — — 36 23 — 485 1,367 846 70 5 New Caledonia 0.3 16 5 1.2 4 0.3 0.3 1.3 5 2.2 26 7 77 74 81 58 — — — — — 14 — — — — New Zealand 4.4 14 7 0.7 -0 5.1 5.9 1.3 4.7 2.1 20 14 81 79 83 86 0.1 0.1 75 72 28,100 16 411 285 91 — Palau 0.02 14 8 0.6 0 0.02 0.02 1.1 20 2.0 20 6 69 66 72 77 — — 33 30 11,000 45 777 414 74 — Papua New Guinea 7.0 31 10 2.1 0 9.1 13.3 1.9 47 4.1 38 3 62 60 65 13 0.7 1.1 36 24 2,420 15 837 665 44 18 Samoa 0.2 29 5 2.4 -17 0.2 0.3 1.3 21 4.5 40 5 73 72 74 21 — — 29 27 4,250 66 772 583 70 — Solomon Islands 0.6 32 6 2.6 0 0.8 1.2 2.1 39 4.2 40 3 67 66 69 20 — — 35 27 2,220 19 710 524 60 12 Tonga 0.1 27 7 2.0 -17 0.1 0.1 1.2 19 3.8 38 6 70 67 73 23 — — — 23 4,580 138 649 673 74 — Tuvalu 0.01 23 9 1.4 -9 0.01 0.01 1.2 17 3.1 32 5 64 62 67 47 — — 31 22 — 433 992 992 73 2 Vanuatu 0.3 31 6 2.5 0 0.4 0.6 2.1 25 4.0 37 3 71 70 73 24 — — 38 37 4,310 21 768 577 70 —
© 2012 Population Reference Bureau (see notes, page 18) 2012 WORLD POPULATION DATA SHEET
10
pOpULATION, HEALTH, ANd ENvIRONMENT dATA ANd ESTIMATES FOR THE cOUNTRIES ANd REGIONS OF THE wORLd
TotalFertilityRateb <15 65+
Both Sexes Males Females
Percent Urban Males Females
All Methods
Modern Methods
GNI PPP per Capita
(US$) 2010
Population per
Square Kilometer
Noncommunicable Disease Death Rate (Age-standardized, 2008) per 100,000 Males Females
% Children <5 Under-
weight 2006/2010
Percent of Population
Ages
Life Expectancy at Birth (years)
Percent of Population With HIV/AIDS
15-49 2009/2011
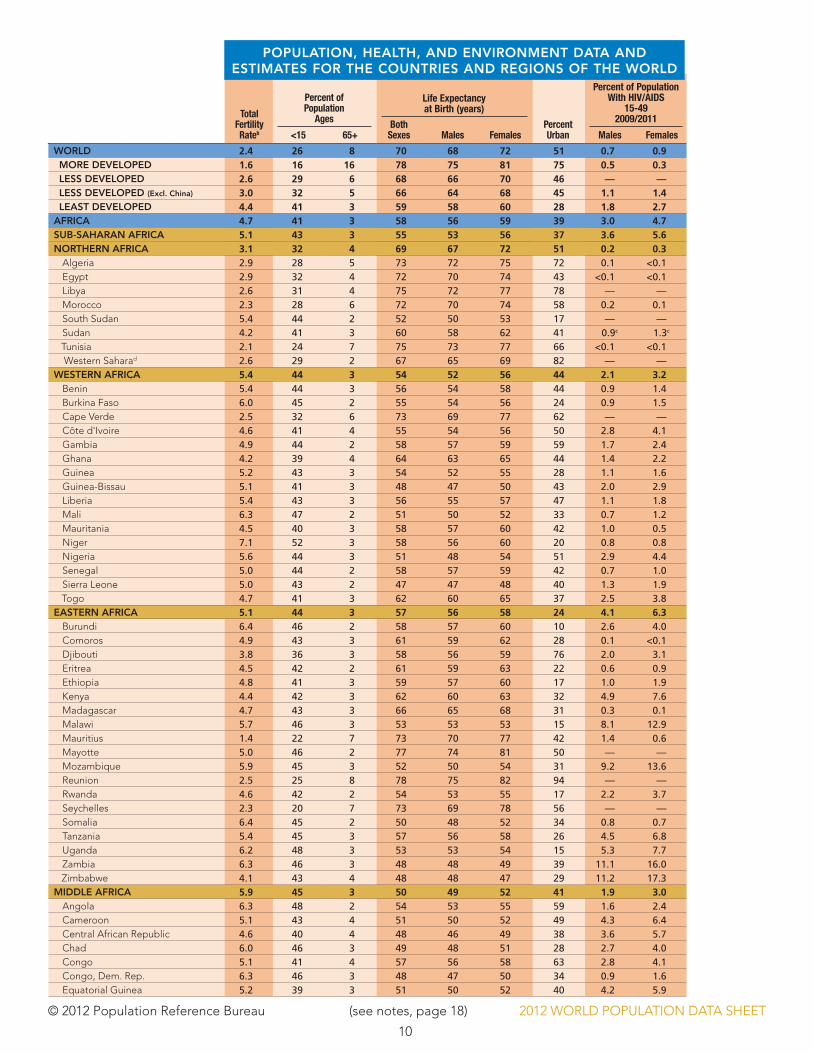
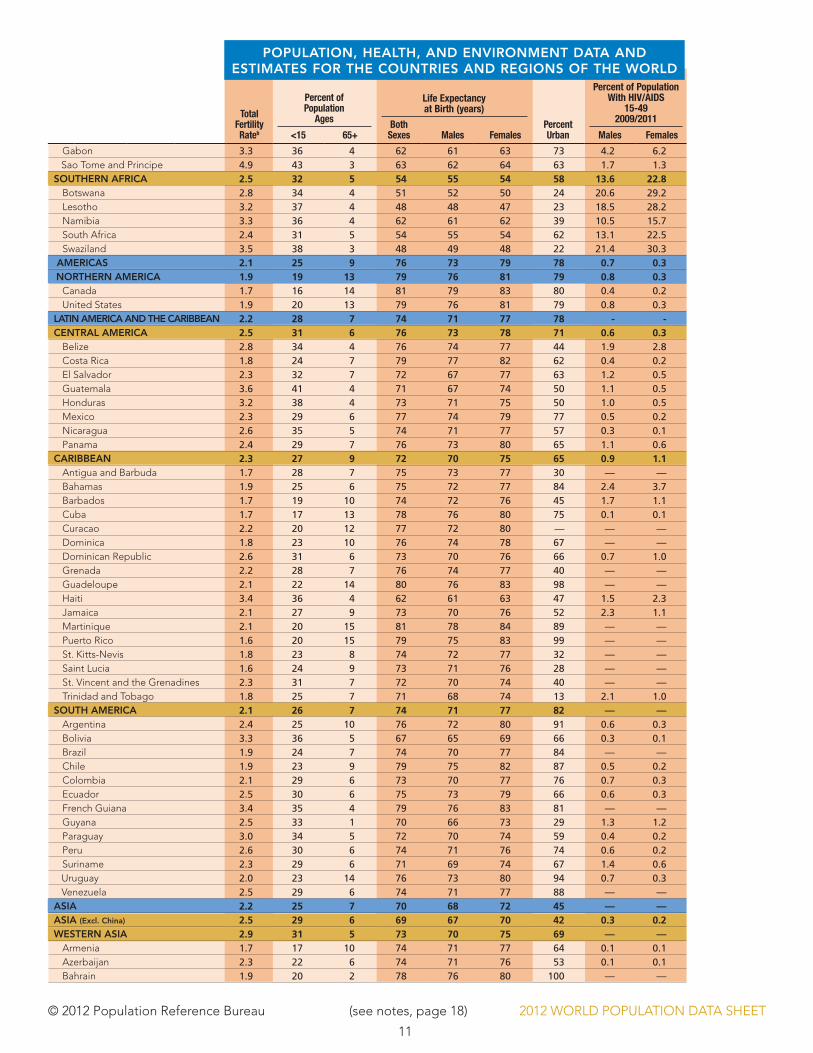
wORLd 2.4 26 8 70 68 72 51 0.7 0.9 62 56 10,760 52 705 520 63 — MORE dEvELOpEd 1.6 16 16 78 75 81 75 0.5 0.3 72 63 33,460 27 563 340 87 — LESS dEvELOpEd 2.6 29 6 68 66 70 46 — — 59 54 5,900 70 734 561 57 22 LESS dEvELOpEd (Excl. china) 3.0 32 5 66 64 68 45 1.1 1.4 52 44 5,380 61 756 581 49 25 LEAST dEvELOpEd 4.4 41 3 59 58 60 28 1.8 2.7 33 27 1,440 43 872 727 32 27AFRIcA 4.7 41 3 58 56 59 39 3.0 4.7 31 26 2,630 35 844 718 31 19SUB-SAHARAN AFRIcA 5.1 43 3 55 53 56 37 3.6 5.6 26 20 1,970 38 869 746 28 21NORTHERN AFRIcA 3.1 32 4 69 67 72 51 0.2 0.3 52 — 5,760 25 748 619 68 12
Algeria 2.9 28 5 73 72 75 72 0.1 <0.1 61 52 8,100 16 556 472 63 3 Egypt 2.9 32 4 72 70 74 43 <0.1 <0.1 60 58 6,060 82 830 660 82 6 Libya 2.6 31 4 75 72 77 78 — — 42 20 16,880 4 744 526 78 — Morocco 2.3 28 6 72 70 74 58 0.2 0.1 63 52 4,600 73 665 524 75 9 South Sudan 5.4 44 2 52 50 53 17 — — — — — 15 — — — — Sudan 4.2 41 3 60 58 62 41 0.9c 1.3c 9c — 2,030c 18 920c 860c 44c 27c
Tunisia 2.1 24 7 75 73 77 66 <0.1 <0.1 60 52 9,060 66 505 404 72 3 Western Saharad 2.6 29 2 67 65 69 82 — — — — — 2 — — — —wESTERN AFRIcA 5.4 44 3 54 52 56 44 2.1 3.2 14 9 1,810 53 832 755 27 22
Benin 5.4 44 3 56 54 58 44 0.9 1.4 17 6 1,590 83 886 731 33 18 Burkina Faso 6.0 45 2 55 54 56 24 0.9 1.5 16 15 1,250 64 956 713 21 26 Cape Verde 2.5 32 6 73 69 77 62 — — 61 57 3,710 126 650 455 58 — Côte d'Ivoire 4.6 41 4 55 54 56 50 2.8 4.1 13 8 1,810 64 1,013 859 33 16 Gambia 4.9 44 2 58 57 59 59 1.7 2.4 18 13 1,300 162 780 720 34 18 Ghana 4.2 39 4 64 63 65 44 1.4 2.2 24 17 1,620 107 817 595 39 14 Guinea 5.2 43 3 54 52 55 28 1.1 1.6 9 4 1,020 47 1,036 842 32 21 Guinea-Bissau 5.1 41 3 48 47 50 43 2.0 2.9 14 — 1,180 45 945 874 28 18 Liberia 5.4 43 3 56 55 57 47 1.1 1.8 11 10 340 38 791 747 28 15 Mali 6.3 47 2 51 50 52 33 0.7 1.2 8 6 1,030 13 814 684 20 27 Mauritania 4.5 40 3 58 57 60 42 1.0 0.5 9 8 2,410 4 788 734 32 15 Niger 7.1 52 3 58 56 60 20 0.8 0.8 11 5 720 13 649 669 16 40 Nigeria 5.6 44 3 51 48 54 51 2.9 4.4 15 8 2,240 184 818 793 27 23 Senegal 5.0 44 2 58 57 59 42 0.7 1.0 13 12 1,910 67 698 660 30 14 Sierra Leone 5.0 43 2 47 47 48 40 1.3 1.9 8 6 830 85 808 770 18 21
Togo 4.7 41 3 62 60 65 37 2.5 3.8 15 13 890 106 755 677 34 17EASTERN AFRIcA 5.1 44 3 57 56 58 24 4.1 6.3 34 28 1,150 54 915 731 29 21
Burundi 6.4 46 2 58 57 60 10 2.6 4.0 22 18 400 379 837 828 26 29 Comoros 4.9 43 3 61 59 62 28 0.1 <0.1 26 19 1,090 346 798 768 40 — Djibouti 3.8 36 3 58 56 59 76 2.0 3.1 18 17 2,460 40 878 749 42 23 Eritrea 4.5 42 2 61 59 63 22 0.6 0.9 8 5 540 47 759 600 40 35 Ethiopia 4.8 41 3 59 57 60 17 1.0 1.9 29 27 1,040 79 923 876 34 33 Kenya 4.4 42 3 62 60 63 32 4.9 7.6 46 39 1,640 74 780 575 28 16 Madagascar 4.7 43 3 66 65 68 31 0.3 0.1 40 28 960 37 751 648 42 - Malawi 5.7 46 3 53 53 53 15 8.1 12.9 46 42 860 134 1,208 812 28 13 Mauritius 1.4 22 7 73 70 77 42 1.4 0.6 76 39 13,980 633 816 498 87 — Mayotte 5.0 46 2 77 74 81 50 — — — — — 583 — — — — Mozambique 5.9 45 3 52 50 54 31 9.2 13.6 12 11 930 30 1,030 801 28 18 Reunion 2.5 25 8 78 75 82 94 — — 67 64 — 341 — — — — Rwanda 4.6 42 2 54 53 55 17 2.2 3.7 52 45 1,150 411 781 706 29 11 Seychelles 2.3 20 7 73 69 78 56 — — — — 21,090 204 774 417 75 — Somalia 6.4 45 2 50 48 52 34 0.8 0.7 15 1 — 16 997 933 27 32 Tanzania 5.4 45 3 57 56 58 26 4.5 6.8 34 26 1,440 50 874 614 27 16 Uganda 6.2 48 3 53 53 54 15 5.3 7.7 30 26 1,250 148 1,095 685 25 16 Zambia 6.3 46 3 48 48 49 39 11.1 16.0 41 27 1,380 18 1,075 808 27 15
Zimbabwe 4.1 43 4 48 48 47 29 11.2 17.3 59 57 — 32 698 533 21 10MIddLE AFRIcA 5.9 45 3 50 49 52 41 1.9 3.0 18 7 1,890 20 875 812 24 22
Angola 6.3 48 2 54 53 55 59 1.6 2.4 18 — 5,460 17 892 801 25 16 Cameroon 5.1 43 4 51 50 52 49 4.3 6.4 23 14 2,270 44 882 861 31 16 Central African Republic 4.6 40 4 48 46 49 38 3.6 5.7 19 9 790 7 882 847 27 24 Chad 6.0 46 3 49 48 51 28 2.7 4.0 3 2 1,220 9 894 843 21 30 Congo 5.1 41 4 57 56 58 63 2.8 4.1 45 20 3,190 12 892 715 33 11 Congo, Dem. Rep. 6.3 46 3 48 47 50 34 0.9 1.6 18 5 320 29 866 806 21 24 Equatorial Guinea 5.2 39 3 51 50 52 40 4.2 5.9 10 6 23,760 26 890 810 32 —
mid-2025
pOpULATION, HEALTH, ANd ENvIRONMENT dATA ANd ESTIMATES FOR THE cOUNTRIES ANd REGIONS OF THE wORLd
© 2012 Population Reference Bureau (see notes, page 18) 2012 WORLD POPULATION DATA SHEET
11
pOpULATION, HEALTH, ANd ENvIRONMENT dATA ANd ESTIMATES FOR THE cOUNTRIES ANd REGIONS OF THE wORLd
TotalFertilityRateb <15 65+
Both Sexes Males Females
Percent Urban Males Females
All Methods
Modern Methods
GNI PPP per Capita
(US$) 2010
Population per
Square Kilometer
Noncommunicable Disease Death Rate (Age-standardized, 2008) per 100,000 Males Females
% Children <5 Under-
weight 2006/2010
Percent of Population
Ages
Life Expectancy at Birth (years)
Percent of Population With HIV/AIDS
15-49 2009/2011
mid-2025 Gabon 3.3 36 4 62 61 63 73 4.2 6.2 62 56 10,760 52 705 520 63 —
Sao Tome and Principe 4.9 43 3 63 62 64 63 1.7 1.3 72 63 33,460 27 563 340 87 —SOUTHERN AFRIcA 2.5 32 5 54 55 54 58 13.6 22.8 59 54 5,900 70 734 561 57 22
Botswana 2.8 34 4 51 52 50 24 20.6 29.2 52 44 5,380 61 756 581 49 25 Lesotho 3.2 37 4 48 48 47 23 18.5 28.2 33 27 1,440 43 872 727 32 27 Namibia 3.3 36 4 62 61 62 39 10.5 15.7 31 26 2,630 35 844 718 31 19 South Africa 2.4 31 5 54 55 54 62 13.1 22.5 26 20 1,970 38 869 746 28 21 Swaziland 3.5 38 3 48 49 48 22 21.4 30.3 52 — 5,760 25 748 619 68 12
AMERIcAS 2.1 25 9 76 73 79 78 0.7 0.3 61 52 8,100 16 556 472 63 3NORTHERN AMERIcA 1.9 19 13 79 76 81 79 0.8 0.3 60 58 6,060 82 830 660 82 6 Canada 1.7 16 14 81 79 83 80 0.4 0.2 42 20 16,880 4 744 526 78 — United States 1.9 20 13 79 76 81 79 0.8 0.3 63 52 4,600 73 665 524 75 9
LATIN AMERIcA ANd THE cARIBBEAN 2.2 28 7 74 71 77 78 - - — — — 15 — — — —cENTRAL AMERIcA 2.5 31 6 76 73 78 71 0.6 0.3 9c — 2,030c 18 920c 860c 44c 27c
Belize 2.8 34 4 76 74 77 44 1.9 2.8 60 52 9,060 66 505 404 72 3 Costa Rica 1.8 24 7 79 77 82 62 0.4 0.2 — — — 2 — — — — El Salvador 2.3 32 7 72 67 77 63 1.2 0.5 14 9 1,810 53 832 755 27 22 Guatemala 3.6 41 4 71 67 74 50 1.1 0.5 17 6 1,590 83 886 731 33 18 Honduras 3.2 38 4 73 71 75 50 1.0 0.5 16 15 1,250 64 956 713 21 26 Mexico 2.3 29 6 77 74 79 77 0.5 0.2 61 57 3,710 126 650 455 58 — Nicaragua 2.6 35 5 74 71 77 57 0.3 0.1 13 8 1,810 64 1,013 859 33 16 Panama 2.4 29 7 76 73 80 65 1.1 0.6 18 13 1,300 162 780 720 34 18
cARIBBEAN 2.3 27 9 72 70 75 65 0.9 1.1 24 17 1,620 107 817 595 39 14 Antigua and Barbuda 1.7 28 7 75 73 77 30 — — 9 4 1,020 47 1,036 842 32 21 Bahamas 1.9 25 6 75 72 77 84 2.4 3.7 14 — 1,180 45 945 874 28 18 Barbados 1.7 19 10 74 72 76 45 1.7 1.1 11 10 340 38 791 747 28 15 Cuba 1.7 17 13 78 76 80 75 0.1 0.1 8 6 1,030 13 814 684 20 27 Curacao 2.2 20 12 77 72 80 — — — 9 8 2,410 4 788 734 32 15 Dominica 1.8 23 10 76 74 78 67 — — 11 5 720 13 649 669 16 40 Dominican Republic 2.6 31 6 73 70 76 66 0.7 1.0 15 8 2,240 184 818 793 27 23 Grenada 2.2 28 7 76 74 77 40 — — 13 12 1,910 67 698 660 30 14 Guadeloupe 2.1 22 14 80 76 83 98 — — 8 6 830 85 808 770 18 21 Haiti 3.4 36 4 62 61 63 47 1.5 2.3 15 13 890 106 755 677 34 17 Jamaica 2.1 27 9 73 70 76 52 2.3 1.1 34 28 1,150 54 915 731 29 21 Martinique 2.1 20 15 81 78 84 89 — — 22 18 400 379 837 828 26 29 Puerto Rico 1.6 20 15 79 75 83 99 — — 26 19 1,090 346 798 768 40 — St. Kitts-Nevis 1.8 23 8 74 72 77 32 — — 18 17 2,460 40 878 749 42 23 Saint Lucia 1.6 24 9 73 71 76 28 — — 8 5 540 47 759 600 40 35 St. Vincent and the Grenadines 2.3 31 7 72 70 74 40 — — 29 27 1,040 79 923 876 34 33 Trinidad and Tobago 1.8 25 7 71 68 74 13 2.1 1.0 46 39 1,640 74 780 575 28 16
SOUTH AMERIcA 2.1 26 7 74 71 77 82 — — 40 28 960 37 751 648 42 - Argentina 2.4 25 10 76 72 80 91 0.6 0.3 46 42 860 134 1,208 812 28 13 Bolivia 3.3 36 5 67 65 69 66 0.3 0.1 76 39 13,980 633 816 498 87 — Brazil 1.9 24 7 74 70 77 84 — — — — — 583 — — — — Chile 1.9 23 9 79 75 82 87 0.5 0.2 12 11 930 30 1,030 801 28 18 Colombia 2.1 29 6 73 70 77 76 0.7 0.3 67 64 — 341 — — — — Ecuador 2.5 30 6 75 73 79 66 0.6 0.3 52 45 1,150 411 781 706 29 11 French Guiana 3.4 35 4 79 76 83 81 — — — — 21,090 204 774 417 75 — Guyana 2.5 33 1 70 66 73 29 1.3 1.2 15 1 — 16 997 933 27 32 Paraguay 3.0 34 5 72 70 74 59 0.4 0.2 34 26 1,440 50 874 614 27 16 Peru 2.6 30 6 74 71 76 74 0.6 0.2 30 26 1,250 148 1,095 685 25 16 Suriname 2.3 29 6 71 69 74 67 1.4 0.6 41 27 1,380 18 1,075 808 27 15
Uruguay 2.0 23 14 76 73 80 94 0.7 0.3 59 57 — 32 698 533 21 10 Venezuela 2.5 29 6 74 71 77 88 — — 18 7 1,890 20 875 812 24 22ASIA 2.2 25 7 70 68 72 45 — — 18 — 5,460 17 892 801 25 16ASIA (Excl. china) 2.5 29 6 69 67 70 42 0.3 0.2 23 14 2,270 44 882 861 31 16wESTERN ASIA 2.9 31 5 73 70 75 69 — — 19 9 790 7 882 847 27 24
Armenia 1.7 17 10 74 71 77 64 0.1 0.1 3 2 1,220 9 894 843 21 30 Azerbaijan 2.3 22 6 74 71 76 53 0.1 0.1 45 20 3,190 12 892 715 33 11 Bahrain 1.9 20 2 78 76 80 100 — — 18 5 320 29 866 806 21 24
pOpULATION, HEALTH, ANd ENvIRONMENT dATA ANd ESTIMATES FOR THE cOUNTRIES ANd REGIONS OF THE wORLd
© 2012 Population Reference Bureau (see notes, page 18) 2012 WORLD POPULATION DATA SHEET
12
pOpULATION, HEALTH, ANd ENvIRONMENT dATA ANd ESTIMATES FOR THE cOUNTRIES ANd REGIONS OF THE wORLd
TotalFertilityRateb <15 65+
Both Sexes Males Females
Percent Urban Males Females
All Methods
Modern Methods
GNI PPP per Capita
(US$) 2010
Population per
Square Kilometer
Noncommunicable Disease Death Rate (Age-standardized, 2008) per 100,000 Males Females
% Children <5 Under-
weight 2006/2010
Percent of Population
Ages
Life Expectancy at Birth (years)
Percent of Population With HIV/AIDS
15-49 2009/2011
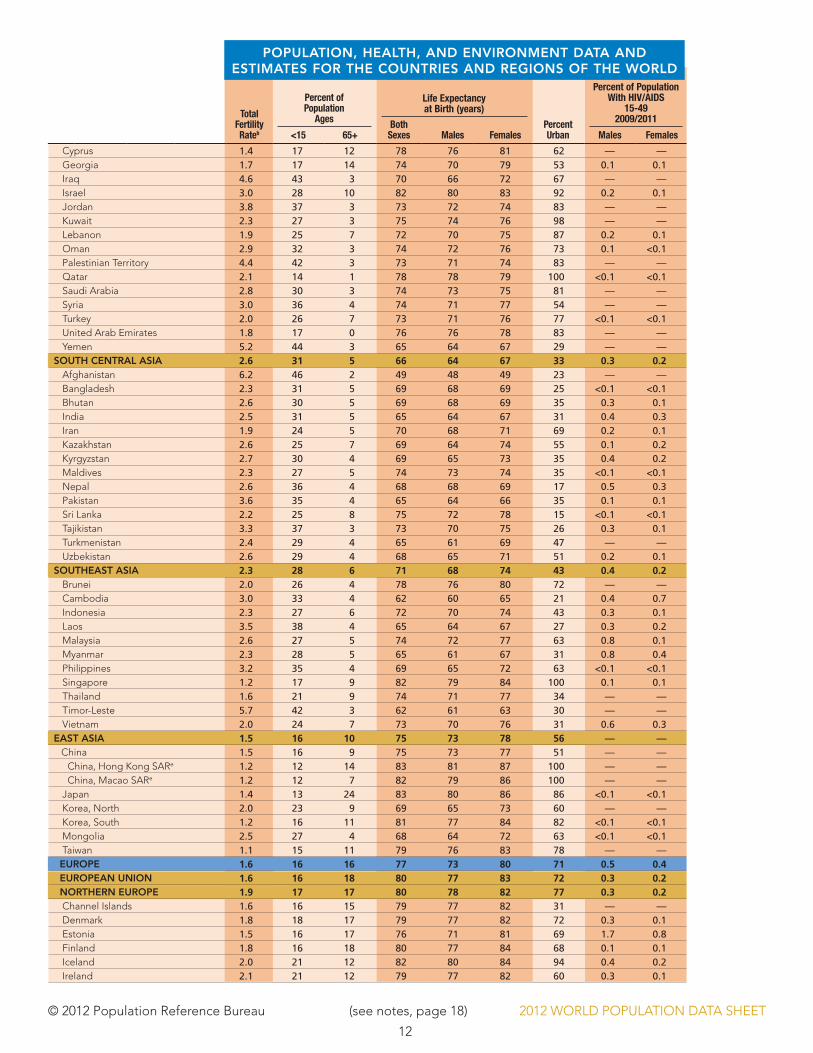
mid-2025 Cyprus 1.4 17 12 78 76 81 62 — — 62 56 10,760 52 705 520 63 — Georgia 1.7 17 14 74 70 79 53 0.1 0.1 72 63 33,460 27 563 340 87 — Iraq 4.6 43 3 70 66 72 67 — — 59 54 5,900 70 734 561 57 22 Israel 3.0 28 10 82 80 83 92 0.2 0.1 52 44 5,380 61 756 581 49 25 Jordan 3.8 37 3 73 72 74 83 — — 33 27 1,440 43 872 727 32 27 Kuwait 2.3 27 3 75 74 76 98 — — 31 26 2,630 35 844 718 31 19 Lebanon 1.9 25 7 72 70 75 87 0.2 0.1 26 20 1,970 38 869 746 28 21 Oman 2.9 32 3 74 72 76 73 0.1 <0.1 52 — 5,760 25 748 619 68 12 Palestinian Territory 4.4 42 3 73 71 74 83 — — 61 52 8,100 16 556 472 63 3 Qatar 2.1 14 1 78 78 79 100 <0.1 <0.1 60 58 6,060 82 830 660 82 6 Saudi Arabia 2.8 30 3 74 73 75 81 — — 42 20 16,880 4 744 526 78 — Syria 3.0 36 4 74 71 77 54 — — 63 52 4,600 73 665 524 75 9 Turkey 2.0 26 7 73 71 76 77 <0.1 <0.1 — — — 15 — — — — United Arab Emirates 1.8 17 0 76 76 78 83 — — 9c — 2,030c 18 920c 860c 44c 27c
Yemen 5.2 44 3 65 64 67 29 — — 60 52 9,060 66 505 404 72 3SOUTH cENTRAL ASIA 2.6 31 5 66 64 67 33 0.3 0.2 — — — 2 — — — —
Afghanistan 6.2 46 2 49 48 49 23 — — 14 9 1,810 53 832 755 27 22 Bangladesh 2.3 31 5 69 68 69 25 <0.1 <0.1 17 6 1,590 83 886 731 33 18 Bhutan 2.6 30 5 69 68 69 35 0.3 0.1 16 15 1,250 64 956 713 21 26 India 2.5 31 5 65 64 67 31 0.4 0.3 61 57 3,710 126 650 455 58 — Iran 1.9 24 5 70 68 71 69 0.2 0.1 13 8 1,810 64 1,013 859 33 16 Kazakhstan 2.6 25 7 69 64 74 55 0.1 0.2 18 13 1,300 162 780 720 34 18 Kyrgyzstan 2.7 30 4 69 65 73 35 0.4 0.2 24 17 1,620 107 817 595 39 14 Maldives 2.3 27 5 74 73 74 35 <0.1 <0.1 9 4 1,020 47 1,036 842 32 21 Nepal 2.6 36 4 68 68 69 17 0.5 0.3 14 — 1,180 45 945 874 28 18 Pakistan 3.6 35 4 65 64 66 35 0.1 0.1 11 10 340 38 791 747 28 15 Sri Lanka 2.2 25 8 75 72 78 15 <0.1 <0.1 8 6 1,030 13 814 684 20 27 Tajikistan 3.3 37 3 73 70 75 26 0.3 0.1 9 8 2,410 4 788 734 32 15 Turkmenistan 2.4 29 4 65 61 69 47 — — 11 5 720 13 649 669 16 40 Uzbekistan 2.6 29 4 68 65 71 51 0.2 0.1 15 8 2,240 184 818 793 27 23
SOUTHEAST ASIA 2.3 28 6 71 68 74 43 0.4 0.2 13 12 1,910 67 698 660 30 14 Brunei 2.0 26 4 78 76 80 72 — — 8 6 830 85 808 770 18 21 Cambodia 3.0 33 4 62 60 65 21 0.4 0.7 15 13 890 106 755 677 34 17 Indonesia 2.3 27 6 72 70 74 43 0.3 0.1 34 28 1,150 54 915 731 29 21 Laos 3.5 38 4 65 64 67 27 0.3 0.2 22 18 400 379 837 828 26 29 Malaysia 2.6 27 5 74 72 77 63 0.8 0.1 26 19 1,090 346 798 768 40 — Myanmar 2.3 28 5 65 61 67 31 0.8 0.4 18 17 2,460 40 878 749 42 23 Philippines 3.2 35 4 69 65 72 63 <0.1 <0.1 8 5 540 47 759 600 40 35 Singapore 1.2 17 9 82 79 84 100 0.1 0.1 29 27 1,040 79 923 876 34 33 Thailand 1.6 21 9 74 71 77 34 — — 46 39 1,640 74 780 575 28 16 Timor-Leste 5.7 42 3 62 61 63 30 — — 40 28 960 37 751 648 42 - Vietnam 2.0 24 7 73 70 76 31 0.6 0.3 46 42 860 134 1,208 812 28 13
EAST ASIA 1.5 16 10 75 73 78 56 — — 76 39 13,980 633 816 498 87 — China 1.5 16 9 75 73 77 51 — — — — — 583 — — — — China, Hong Kong SARe 1.2 12 14 83 81 87 100 — — 12 11 930 30 1,030 801 28 18 China, Macao SARe 1.2 12 7 82 79 86 100 — — 67 64 — 341 — — — — Japan 1.4 13 24 83 80 86 86 <0.1 <0.1 52 45 1,150 411 781 706 29 11 Korea, North 2.0 23 9 69 65 73 60 — — — — 21,090 204 774 417 75 — Korea, South 1.2 16 11 81 77 84 82 <0.1 <0.1 15 1 — 16 997 933 27 32 Mongolia 2.5 27 4 68 64 72 63 <0.1 <0.1 34 26 1,440 50 874 614 27 16 Taiwan 1.1 15 11 79 76 83 78 — — 30 26 1,250 148 1,095 685 25 16
EUROpE 1.6 16 16 77 73 80 71 0.5 0.4 41 27 1,380 18 1,075 808 27 15EUROpEAN UNION 1.6 16 18 80 77 83 72 0.3 0.2 59 57 — 32 698 533 21 10NORTHERN EUROpE 1.9 17 17 80 78 82 77 0.3 0.2 18 7 1,890 20 875 812 24 22 Channel Islands 1.6 16 15 79 77 82 31 — — 18 — 5,460 17 892 801 25 16 Denmark 1.8 18 17 79 77 82 72 0.3 0.1 23 14 2,270 44 882 861 31 16 Estonia 1.5 16 17 76 71 81 69 1.7 0.8 19 9 790 7 882 847 27 24 Finland 1.8 16 18 80 77 84 68 0.1 0.1 3 2 1,220 9 894 843 21 30 Iceland 2.0 21 12 82 80 84 94 0.4 0.2 45 20 3,190 12 892 715 33 11 Ireland 2.1 21 12 79 77 82 60 0.3 0.1 18 5 320 29 866 806 21 24
pOpULATION, HEALTH, ANd ENvIRONMENT dATA ANd ESTIMATES FOR THE cOUNTRIES ANd REGIONS OF THE wORLd
© 2012 Population Reference Bureau (see notes, page 18) 2012 WORLD POPULATION DATA SHEET
13
pOpULATION, HEALTH, ANd ENvIRONMENT dATA ANd ESTIMATES FOR THE cOUNTRIES ANd REGIONS OF THE wORLd
TotalFertilityRateb <15 65+
Both Sexes Males Females
Percent Urban Males Females
All Methods
Modern Methods
GNI PPP per Capita
(US$) 2010
Population per
Square Kilometer
Noncommunicable Disease Death Rate (Age-standardized, 2008) per 100,000 Males Females
% Children <5 Under-
weight 2006/2010
Percent of Population
Ages
Life Expectancy at Birth (years)
Percent of Population With HIV/AIDS
15-49 2009/2011
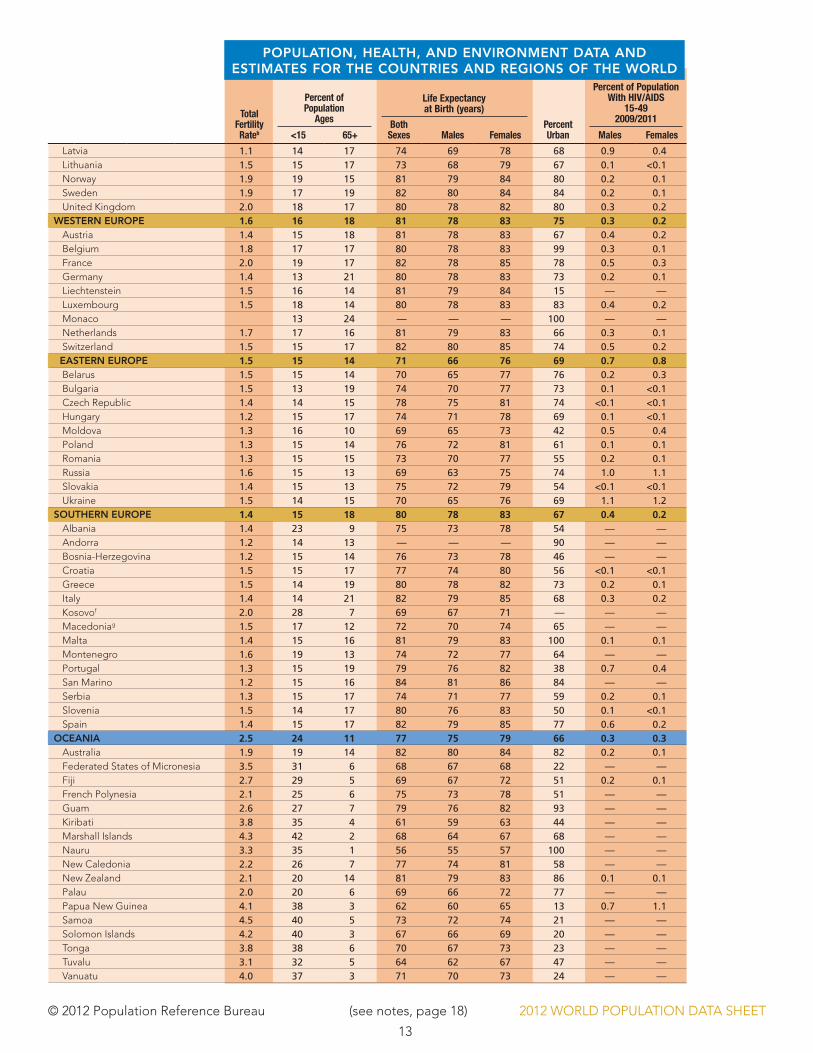
mid-2025 Latvia 1.1 14 17 74 69 78 68 0.9 0.4 62 56 10,760 52 705 520 63 — Lithuania 1.5 15 17 73 68 79 67 0.1 <0.1 72 63 33,460 27 563 340 87 — Norway 1.9 19 15 81 79 84 80 0.2 0.1 59 54 5,900 70 734 561 57 22 Sweden 1.9 17 19 82 80 84 84 0.2 0.1 52 44 5,380 61 756 581 49 25 United Kingdom 2.0 18 17 80 78 82 80 0.3 0.2 33 27 1,440 43 872 727 32 27
wESTERN EUROpE 1.6 16 18 81 78 83 75 0.3 0.2 31 26 2,630 35 844 718 31 19 Austria 1.4 15 18 81 78 83 67 0.4 0.2 26 20 1,970 38 869 746 28 21 Belgium 1.8 17 17 80 78 83 99 0.3 0.1 52 — 5,760 25 748 619 68 12 France 2.0 19 17 82 78 85 78 0.5 0.3 61 52 8,100 16 556 472 63 3 Germany 1.4 13 21 80 78 83 73 0.2 0.1 60 58 6,060 82 830 660 82 6 Liechtenstein 1.5 16 14 81 79 84 15 — — 42 20 16,880 4 744 526 78 — Luxembourg 1.5 18 14 80 78 83 83 0.4 0.2 63 52 4,600 73 665 524 75 9 Monaco 13 24 — — — 100 — — — — — 15 — — — — Netherlands 1.7 17 16 81 79 83 66 0.3 0.1 9c — 2,030c 18 920c 860c 44c 27c
Switzerland 1.5 15 17 82 80 85 74 0.5 0.2 60 52 9,060 66 505 404 72 3EASTERN EUROpE 1.5 15 14 71 66 76 69 0.7 0.8 — — — 2 — — — — Belarus 1.5 15 14 70 65 77 76 0.2 0.3 14 9 1,810 53 832 755 27 22 Bulgaria 1.5 13 19 74 70 77 73 0.1 <0.1 17 6 1,590 83 886 731 33 18 Czech Republic 1.4 14 15 78 75 81 74 <0.1 <0.1 16 15 1,250 64 956 713 21 26 Hungary 1.2 15 17 74 71 78 69 0.1 <0.1 61 57 3,710 126 650 455 58 — Moldova 1.3 16 10 69 65 73 42 0.5 0.4 13 8 1,810 64 1,013 859 33 16 Poland 1.3 15 14 76 72 81 61 0.1 0.1 18 13 1,300 162 780 720 34 18 Romania 1.3 15 15 73 70 77 55 0.2 0.1 24 17 1,620 107 817 595 39 14 Russia 1.6 15 13 69 63 75 74 1.0 1.1 9 4 1,020 47 1,036 842 32 21 Slovakia 1.4 15 13 75 72 79 54 <0.1 <0.1 14 — 1,180 45 945 874 28 18 Ukraine 1.5 14 15 70 65 76 69 1.1 1.2 11 10 340 38 791 747 28 15
SOUTHERN EUROpE 1.4 15 18 80 78 83 67 0.4 0.2 8 6 1,030 13 814 684 20 27 Albania 1.4 23 9 75 73 78 54 — — 9 8 2,410 4 788 734 32 15 Andorra 1.2 14 13 — — — 90 — — 11 5 720 13 649 669 16 40 Bosnia-Herzegovina 1.2 15 14 76 73 78 46 — — 15 8 2,240 184 818 793 27 23 Croatia 1.5 15 17 77 74 80 56 <0.1 <0.1 13 12 1,910 67 698 660 30 14 Greece 1.5 14 19 80 78 82 73 0.2 0.1 8 6 830 85 808 770 18 21 Italy 1.4 14 21 82 79 85 68 0.3 0.2 15 13 890 106 755 677 34 17
Kosovof 2.0 28 7 69 67 71 — — — 34 28 1,150 54 915 731 29 21 Macedoniag 1.5 17 12 72 70 74 65 — — 22 18 400 379 837 828 26 29 Malta 1.4 15 16 81 79 83 100 0.1 0.1 26 19 1,090 346 798 768 40 — Montenegro 1.6 19 13 74 72 77 64 — — 18 17 2,460 40 878 749 42 23 Portugal 1.3 15 19 79 76 82 38 0.7 0.4 8 5 540 47 759 600 40 35 San Marino 1.2 15 16 84 81 86 84 — — 29 27 1,040 79 923 876 34 33 Serbia 1.3 15 17 74 71 77 59 0.2 0.1 46 39 1,640 74 780 575 28 16 Slovenia 1.5 14 17 80 76 83 50 0.1 <0.1 40 28 960 37 751 648 42 - Spain 1.4 15 17 82 79 85 77 0.6 0.2 46 42 860 134 1,208 812 28 13
OcEANIA 2.5 24 11 77 75 79 66 0.3 0.3 76 39 13,980 633 816 498 87 — Australia 1.9 19 14 82 80 84 82 0.2 0.1 — — — 583 — — — — Federated States of Micronesia 3.5 31 6 68 67 68 22 — — 12 11 930 30 1,030 801 28 18 Fiji 2.7 29 5 69 67 72 51 0.2 0.1 67 64 — 341 — — — — French Polynesia 2.1 25 6 75 73 78 51 — — 52 45 1,150 411 781 706 29 11 Guam 2.6 27 7 79 76 82 93 — — — — 21,090 204 774 417 75 — Kiribati 3.8 35 4 61 59 63 44 — — 15 1 — 16 997 933 27 32 Marshall Islands 4.3 42 2 68 64 67 68 — — 34 26 1,440 50 874 614 27 16 Nauru 3.3 35 1 56 55 57 100 — — 30 26 1,250 148 1,095 685 25 16 New Caledonia 2.2 26 7 77 74 81 58 — — 41 27 1,380 18 1,075 808 27 15 New Zealand 2.1 20 14 81 79 83 86 0.1 0.1 59 57 — 32 698 533 21 10 Palau 2.0 20 6 69 66 72 77 — — 18 7 1,890 20 875 812 24 22 Papua New Guinea 4.1 38 3 62 60 65 13 0.7 1.1 18 — 5,460 17 892 801 25 16 Samoa 4.5 40 5 73 72 74 21 — — 23 14 2,270 44 882 861 31 16 Solomon Islands 4.2 40 3 67 66 69 20 — — 19 9 790 7 882 847 27 24 Tonga 3.8 38 6 70 67 73 23 — — 3 2 1,220 9 894 843 21 30 Tuvalu 3.1 32 5 64 62 67 47 — — 45 20 3,190 12 892 715 33 11 Vanuatu 4.0 37 3 71 70 73 24 — — 18 5 320 29 866 806 21 24
pOpULATION, HEALTH, ANd ENvIRONMENT dATA ANd ESTIMATES FOR THE cOUNTRIES ANd REGIONS OF THE wORLd
© 2012 Population Reference Bureau (see notes, page 18) 2012 WORLD POPULATION DATA SHEET
14
pOpULATION, HEALTH, ANd ENvIRONMENT dATA ANd ESTIMATES FOR THE cOUNTRIES ANd REGIONS OF THE wORLd
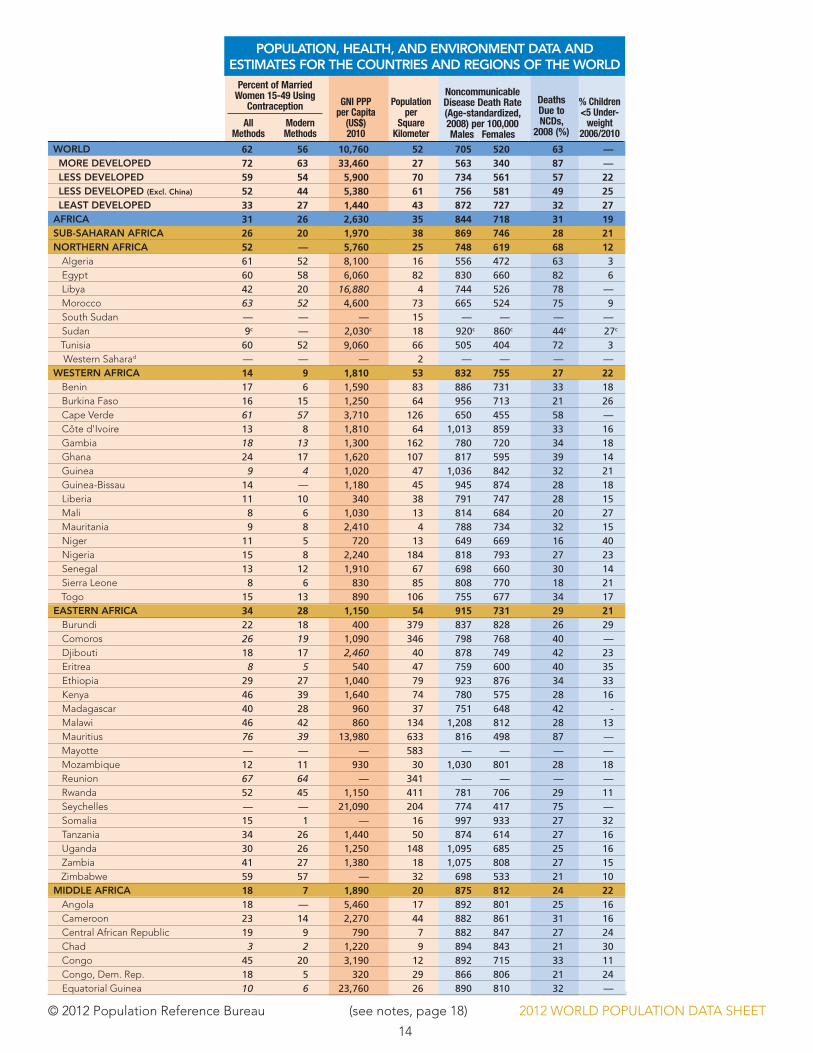
wORLd 62 56 10,760 52 705 520 63 — MORE dEvELOpEd 72 63 33,460 27 563 340 87 — LESS dEvELOpEd 59 54 5,900 70 734 561 57 22 LESS dEvELOpEd (Excl. china) 52 44 5,380 61 756 581 49 25 LEAST dEvELOpEd 33 27 1,440 43 872 727 32 27AFRIcA 31 26 2,630 35 844 718 31 19SUB-SAHARAN AFRIcA 26 20 1,970 38 869 746 28 21NORTHERN AFRIcA 52 — 5,760 25 748 619 68 12
Algeria 61 52 8,100 16 556 472 63 3 Egypt 60 58 6,060 82 830 660 82 6 Libya 42 20 16,880 4 744 526 78 — Morocco 63 52 4,600 73 665 524 75 9 South Sudan — — — 15 — — — — Sudan 9c — 2,030c 18 920c 860c 44c 27c
Tunisia 60 52 9,060 66 505 404 72 3 Western Saharad — — — 2 — — — —wESTERN AFRIcA 14 9 1,810 53 832 755 27 22
Benin 17 6 1,590 83 886 731 33 18 Burkina Faso 16 15 1,250 64 956 713 21 26 Cape Verde 61 57 3,710 126 650 455 58 — Côte d'Ivoire 13 8 1,810 64 1,013 859 33 16 Gambia 18 13 1,300 162 780 720 34 18 Ghana 24 17 1,620 107 817 595 39 14 Guinea 9 4 1,020 47 1,036 842 32 21 Guinea-Bissau 14 — 1,180 45 945 874 28 18 Liberia 11 10 340 38 791 747 28 15 Mali 8 6 1,030 13 814 684 20 27 Mauritania 9 8 2,410 4 788 734 32 15 Niger 11 5 720 13 649 669 16 40 Nigeria 15 8 2,240 184 818 793 27 23 Senegal 13 12 1,910 67 698 660 30 14 Sierra Leone 8 6 830 85 808 770 18 21
Togo 15 13 890 106 755 677 34 17EASTERN AFRIcA 34 28 1,150 54 915 731 29 21
Burundi 22 18 400 379 837 828 26 29 Comoros 26 19 1,090 346 798 768 40 — Djibouti 18 17 2,460 40 878 749 42 23 Eritrea 8 5 540 47 759 600 40 35 Ethiopia 29 27 1,040 79 923 876 34 33 Kenya 46 39 1,640 74 780 575 28 16 Madagascar 40 28 960 37 751 648 42 - Malawi 46 42 860 134 1,208 812 28 13 Mauritius 76 39 13,980 633 816 498 87 — Mayotte — — — 583 — — — — Mozambique 12 11 930 30 1,030 801 28 18 Reunion 67 64 — 341 — — — — Rwanda 52 45 1,150 411 781 706 29 11 Seychelles — — 21,090 204 774 417 75 — Somalia 15 1 — 16 997 933 27 32 Tanzania 34 26 1,440 50 874 614 27 16 Uganda 30 26 1,250 148 1,095 685 25 16 Zambia 41 27 1,380 18 1,075 808 27 15
Zimbabwe 59 57 — 32 698 533 21 10MIddLE AFRIcA 18 7 1,890 20 875 812 24 22
Angola 18 — 5,460 17 892 801 25 16 Cameroon 23 14 2,270 44 882 861 31 16 Central African Republic 19 9 790 7 882 847 27 24 Chad 3 2 1,220 9 894 843 21 30 Congo 45 20 3,190 12 892 715 33 11 Congo, Dem. Rep. 18 5 320 29 866 806 21 24 Equatorial Guinea 10 6 23,760 26 890 810 32 —
TotalFertilityRateb <15 65+
Both Sexes Males
All Methods
Modern Methods
GNI PPP per Capita
(US$) 2010
Population per
Square Kilometer
Noncommunicable Disease Death Rate (Age-standardized, 2008) per 100,000 Males Females
% Children <5 Under-
weight 2006/2010
Percent of Married Women 15-49 Using
ContraceptionDeaths Due to NCDs,
2008 (%)
© 2012 Population Reference Bureau (see notes, page 18) 2012 WORLD POPULATION DATA SHEET
15
pOpULATION, HEALTH, ANd ENvIRONMENT dATA ANd ESTIMATES FOR THE cOUNTRIES ANd REGIONS OF THE wORLd
TotalFertilityRateb <15 65+
Both Sexes Males
All Methods
Modern Methods
GNI PPP per Capita
(US$) 2010
Population per
Square Kilometer
Noncommunicable Disease Death Rate (Age-standardized, 2008) per 100,000 Males Females
% Children <5 Under-
weight 2006/2010
Percent of Married Women 15-49 Using
ContraceptionDeaths Due to NCDs,
2008 (%)
Gabon 33 12 13,060 6 735 561 41 — Sao Tome and Principe 38 33 1,930 190 649 553 49 13SOUTHERN AFRIcA 59 59 9,890 22 760 561 29 10
Botswana 44 42 13,700 3 676 546 31 11 Lesotho 47 46 1,970 73 954 629 29 13 Namibia 55 53 6,420 3 1,073 557 38 17 South Africa 60 60 10,360 42 734 555 29 9 Swaziland 65 63 5,600 70 1,038 730 28 6
AMERIcAS 75 69 23,870 22 518 376 79 —NORTHERN AMERIcA 78 73 46,400 16 451 320 87 — Canada 74 72 38,370 3 387 265 89 — United States 79 73 47,310 33 458 326 87 —
LATIN AMERIcA ANd THE cARIBBEAN 74 67 10,760 29 557 409 72 3cENTRAL AMERIcA 71 64 12,050 65 548 420 73 5
Belize 34 31 6,200 14 507 455 62 4 Costa Rica 80 72 11,270 88 431 333 81 1 El Salvador 73 66 6,550 298 539 449 67 6 Guatemala 54 44 4,650 138 503 421 47 13 Honduras 65 56 3,770 75 812 595 69 8 Mexico 73 66 14,400 59 543 412 78 3 Nicaragua 73 69 2,790 46 559 424 69 6 Panama — — 12,770 48 434 324 69 4
cARIBBEAN 63 58 — 179 609 495 65 — Antigua and Barbuda — — 20,400 197 544 511 80 — Bahamas — — 30,620 26 530 373 74 — Barbados — — — 644 633 363 82 — Cuba 74 73 — 101 493 382 84 — Curacao — — — 444 — — — — Dominica — — 11,940 95 682 519 85 — Dominican Republic 73 70 9,030 208 546 531 68 7 Grenada — — 9,930 334 722 442 81 — Guadeloupe — — — 236 — — — — Haiti 32 24 1,180 370 797 594 41 18 Jamaica 73 68 7,310 247 498 479 68 2 Martinique — — — 359 — — — — Puerto Rico 84 72 — 416 — — — — St. Kitts-Nevis — — 15,970 207 621 553 83 — Saint Lucia — — 10,520 314 597 405 78 — St. Vincent and the Grenadines — — 10,870 278 649 509 76 — Trinidad and Tobago 43 38 24,050 256 896 506 78 —
SOUTH AMERIcA 76 70 10,930 22 556 396 72 3 Argentina 65 64 15,570 15 613 366 80 2 Bolivia 61 34 4,640 10 711 563 57 4 Brazil 80 77 11,000 23 614 428 74 2 Chile 64 — 14,640 23 501 313 83 — Colombia 79 73 9,060 42 438 351 66 3 Ecuador 73 59 7,880 52 434 336 65 6 French Guiana — — — 3 — — — — Guyana 43 40 3,450 4 735 602 66 11 Paraguay 79 70 5,080 16 517 395 69 3 Peru 75 51 8,930 23 408 339 60 4 Suriname 46 45 7,680 3 696 450 71 7
Uruguay 77 75 13,620 19 651 378 87 5 Venezuela 70 62 12,150 33 469 371 66 4ASIA 65 59 6,860 134 720 531 66 26ASIA (Excl. china) 55 47 6,500 130 746 547 58 33wESTERN ASIA 52 36 12,620 50 737 534 71 12
Armenia 55 26 5,660 110 1,156 693 90 5 Azerbaijan 51 13 9,270 107 999 847 85 8 Bahrain 62 31 — 1,925 642 552 79 —
© 2012 Population Reference Bureau (see notes, page 18) 2012 WORLD POPULATION DATA SHEET
16
pOpULATION, HEALTH, ANd ENvIRONMENT dATA ANd ESTIMATES FOR THE cOUNTRIES ANd REGIONS OF THE wORLd
TotalFertilityRateb <15 65+
Both Sexes Males
All Methods
Modern Methods
GNI PPP per Capita
(US$) 2010
Population per
Square Kilometer
Noncommunicable Disease Death Rate (Age-standardized, 2008) per 100,000 Males Females
% Children <5 Under-
weight 2006/2010
Percent of Married Women 15-49 Using
ContraceptionDeaths Due to NCDs,
2008 (%)
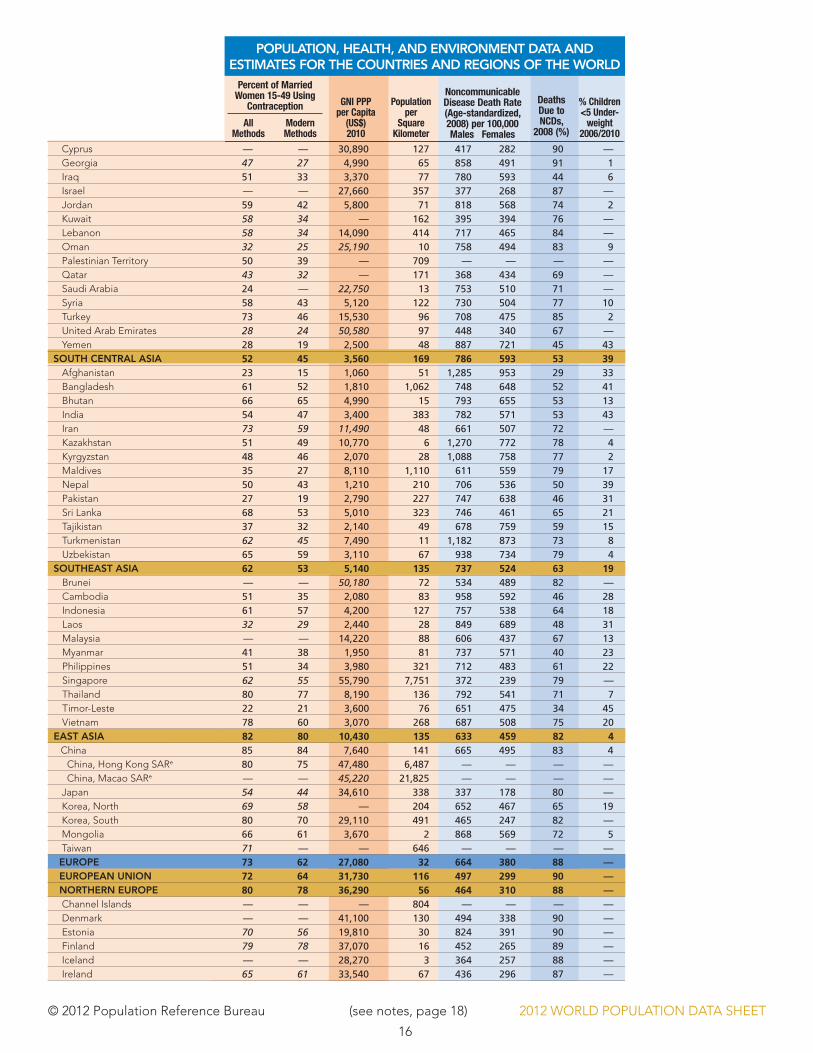
Cyprus — — 30,890 127 417 282 90 — Georgia 47 27 4,990 65 858 491 91 1 Iraq 51 33 3,370 77 780 593 44 6 Israel — — 27,660 357 377 268 87 — Jordan 59 42 5,800 71 818 568 74 2 Kuwait 58 34 — 162 395 394 76 — Lebanon 58 34 14,090 414 717 465 84 — Oman 32 25 25,190 10 758 494 83 9 Palestinian Territory 50 39 — 709 — — — — Qatar 43 32 — 171 368 434 69 — Saudi Arabia 24 — 22,750 13 753 510 71 — Syria 58 43 5,120 122 730 504 77 10 Turkey 73 46 15,530 96 708 475 85 2 United Arab Emirates 28 24 50,580 97 448 340 67 — Yemen 28 19 2,500 48 887 721 45 43
SOUTH cENTRAL ASIA 52 45 3,560 169 786 593 53 39 Afghanistan 23 15 1,060 51 1,285 953 29 33 Bangladesh 61 52 1,810 1,062 748 648 52 41 Bhutan 66 65 4,990 15 793 655 53 13 India 54 47 3,400 383 782 571 53 43 Iran 73 59 11,490 48 661 507 72 — Kazakhstan 51 49 10,770 6 1,270 772 78 4 Kyrgyzstan 48 46 2,070 28 1,088 758 77 2 Maldives 35 27 8,110 1,110 611 559 79 17 Nepal 50 43 1,210 210 706 536 50 39 Pakistan 27 19 2,790 227 747 638 46 31 Sri Lanka 68 53 5,010 323 746 461 65 21 Tajikistan 37 32 2,140 49 678 759 59 15 Turkmenistan 62 45 7,490 11 1,182 873 73 8 Uzbekistan 65 59 3,110 67 938 734 79 4
SOUTHEAST ASIA 62 53 5,140 135 737 524 63 19 Brunei — — 50,180 72 534 489 82 — Cambodia 51 35 2,080 83 958 592 46 28 Indonesia 61 57 4,200 127 757 538 64 18 Laos 32 29 2,440 28 849 689 48 31 Malaysia — — 14,220 88 606 437 67 13 Myanmar 41 38 1,950 81 737 571 40 23 Philippines 51 34 3,980 321 712 483 61 22 Singapore 62 55 55,790 7,751 372 239 79 — Thailand 80 77 8,190 136 792 541 71 7 Timor-Leste 22 21 3,600 76 651 475 34 45 Vietnam 78 60 3,070 268 687 508 75 20
EAST ASIA 82 80 10,430 135 633 459 82 4 China 85 84 7,640 141 665 495 83 4 China, Hong Kong SARe 80 75 47,480 6,487 — — — — China, Macao SARe — — 45,220 21,825 — — — — Japan 54 44 34,610 338 337 178 80 — Korea, North 69 58 — 204 652 467 65 19 Korea, South 80 70 29,110 491 465 247 82 — Mongolia 66 61 3,670 2 868 569 72 5 Taiwan 71 — — 646 — — — —
EUROpE 73 62 27,080 32 664 380 88 —EUROpEAN UNION 72 64 31,730 116 497 299 90 —NORTHERN EUROpE 80 78 36,290 56 464 310 88 — Channel Islands — — — 804 — — — — Denmark — — 41,100 130 494 338 90 — Estonia 70 56 19,810 30 824 391 90 — Finland 79 78 37,070 16 452 265 89 — Iceland — — 28,270 3 364 257 88 — Ireland 65 61 33,540 67 436 296 87 —
© 2012 Population Reference Bureau (see notes, page 18) 2012 WORLD POPULATION DATA SHEET
17
pOpULATION, HEALTH, ANd ENvIRONMENT dATA ANd ESTIMATES FOR THE cOUNTRIES ANd REGIONS OF THE wORLd
TotalFertilityRateb <15 65+
Both Sexes Males
All Methods
Modern Methods
GNI PPP per Capita
(US$) 2010
Population per
Square Kilometer
Noncommunicable Disease Death Rate (Age-standardized, 2008) per 100,000 Males Females
% Children <5 Under-
weight 2006/2010
Percent of Married Women 15-49 Using
ContraceptionDeaths Due to NCDs,
2008 (%)
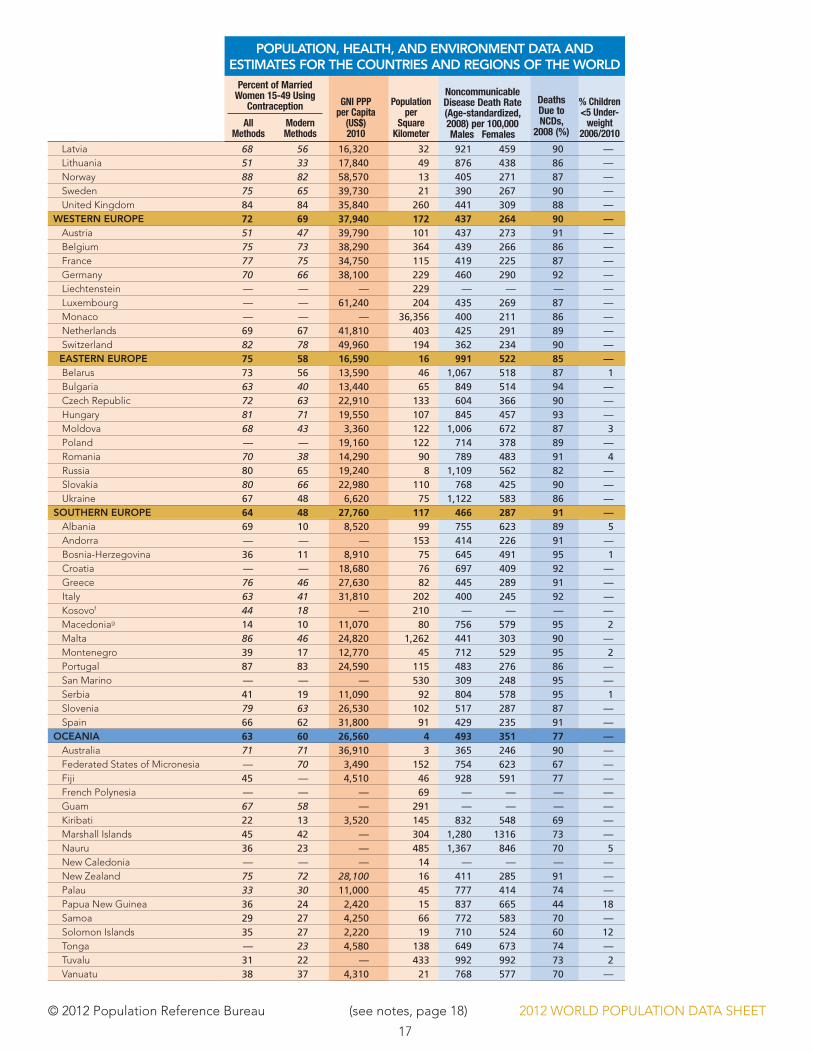
Latvia 68 56 16,320 32 921 459 90 — Lithuania 51 33 17,840 49 876 438 86 — Norway 88 82 58,570 13 405 271 87 — Sweden 75 65 39,730 21 390 267 90 — United Kingdom 84 84 35,840 260 441 309 88 —
wESTERN EUROpE 72 69 37,940 172 437 264 90 — Austria 51 47 39,790 101 437 273 91 — Belgium 75 73 38,290 364 439 266 86 — France 77 75 34,750 115 419 225 87 — Germany 70 66 38,100 229 460 290 92 — Liechtenstein — — — 229 — — — — Luxembourg — — 61,240 204 435 269 87 — Monaco — — — 36,356 400 211 86 — Netherlands 69 67 41,810 403 425 291 89 — Switzerland 82 78 49,960 194 362 234 90 —EASTERN EUROpE 75 58 16,590 16 991 522 85 — Belarus 73 56 13,590 46 1,067 518 87 1 Bulgaria 63 40 13,440 65 849 514 94 — Czech Republic 72 63 22,910 133 604 366 90 — Hungary 81 71 19,550 107 845 457 93 — Moldova 68 43 3,360 122 1,006 672 87 3 Poland — — 19,160 122 714 378 89 — Romania 70 38 14,290 90 789 483 91 4 Russia 80 65 19,240 8 1,109 562 82 — Slovakia 80 66 22,980 110 768 425 90 — Ukraine 67 48 6,620 75 1,122 583 86 —
SOUTHERN EUROpE 64 48 27,760 117 466 287 91 — Albania 69 10 8,520 99 755 623 89 5 Andorra — — — 153 414 226 91 — Bosnia-Herzegovina 36 11 8,910 75 645 491 95 1 Croatia — — 18,680 76 697 409 92 — Greece 76 46 27,630 82 445 289 91 — Italy 63 41 31,810 202 400 245 92 —
Kosovof 44 18 — 210 — — — — Macedoniag 14 10 11,070 80 756 579 95 2 Malta 86 46 24,820 1,262 441 303 90 — Montenegro 39 17 12,770 45 712 529 95 2 Portugal 87 83 24,590 115 483 276 86 — San Marino — — — 530 309 248 95 — Serbia 41 19 11,090 92 804 578 95 1 Slovenia 79 63 26,530 102 517 287 87 — Spain 66 62 31,800 91 429 235 91 —
OcEANIA 63 60 26,560 4 493 351 77 — Australia 71 71 36,910 3 365 246 90 — Federated States of Micronesia — 70 3,490 152 754 623 67 — Fiji 45 — 4,510 46 928 591 77 — French Polynesia — — — 69 — — — — Guam 67 58 — 291 — — — — Kiribati 22 13 3,520 145 832 548 69 — Marshall Islands 45 42 — 304 1,280 1316 73 — Nauru 36 23 — 485 1,367 846 70 5 New Caledonia — — — 14 — — — — New Zealand 75 72 28,100 16 411 285 91 — Palau 33 30 11,000 45 777 414 74 — Papua New Guinea 36 24 2,420 15 837 665 44 18 Samoa 29 27 4,250 66 772 583 70 — Solomon Islands 35 27 2,220 19 710 524 60 12 Tonga — 23 4,580 138 649 673 74 — Tuvalu 31 22 — 433 992 992 73 2 Vanuatu 38 37 4,310 21 768 577 70 —
18
© 2012 Population Reference Bureau 2012 WORLD POPULATION DATA SHEET
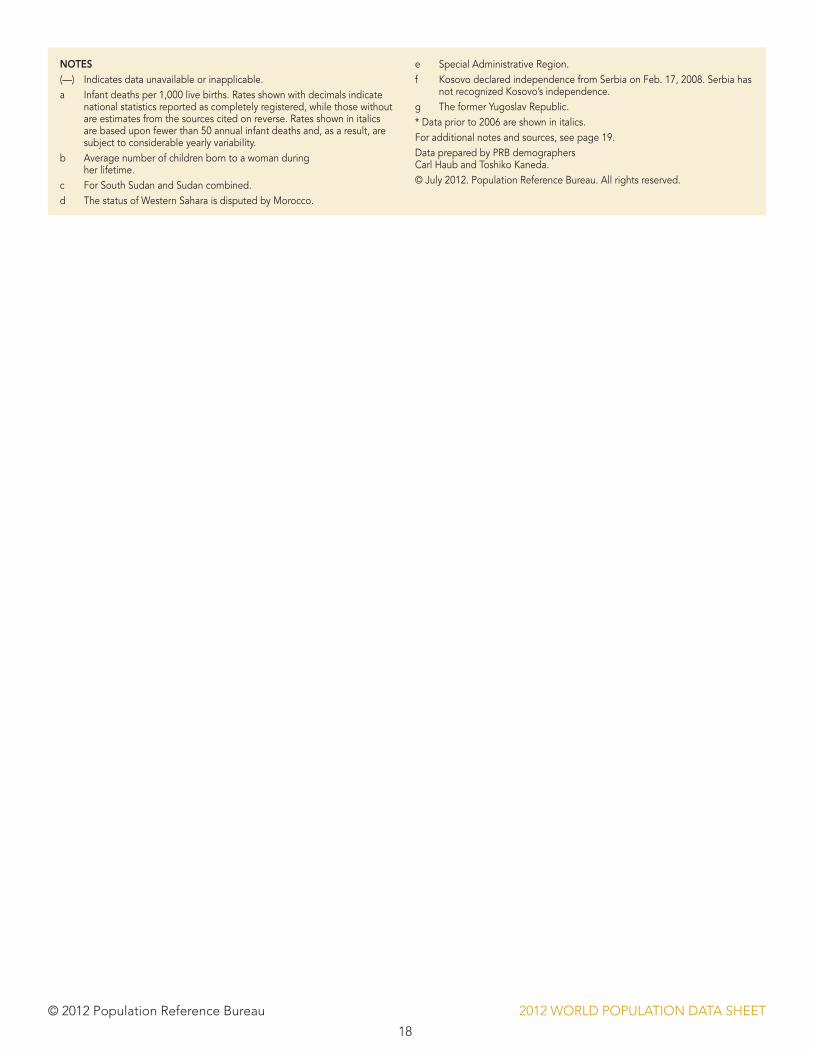
NOTES(—) indicates data unavailable or inapplicable.a infant deaths per 1,000 live births. rates shown with decimals indicate
national statistics reported as completely registered, while those without are estimates from the sources cited on reverse. rates shown in italics are based upon fewer than 50 annual infant deaths and, as a result, are subject to considerable yearly variability.
b average number of children born to a woman during her lifetime.
c For South Sudan and Sudan combined.d the status of Western Sahara is disputed by Morocco.
e Special administrative region.f Kosovo declared independence from Serbia on Feb. 17, 2008. Serbia has
not recognized Kosovo’s independence.g the former Yugoslav republic.* data prior to 2006 are shown in italics.For additional notes and sources, see page 19.data prepared by PrB demographers Carl haub and toshiko Kaneda. © July 2012. Population reference Bureau. all rights reserved.
19
© 2012 Population Reference Bureau 2012 WORLD POPULATION DATA SHEET
AckNOwLEdGMENTS
The authors gratefully acknowledge the valuable assistance of PRB staff members Donna Clifton and Amanda Roach; PRB interns Amy Chambliss, Carrie Fahey, Elaine Lydick, and Sarah Levy; staff of the International Programs Center of the U.S. Census Bureau; the United Nations (UN) Population Division; the Institut national d’etudes démographiques (INED), Paris; and the World Bank in the preparation of this year’s World Population Data Sheet. This publication is funded by the William and Flora Hewlett Foundation, the David and Lucile Packard Foundation, the U.S. Agency for International Development ( IDEA Project, No. AID-0AA-A-10-00009), and supporters. The contents are the responsibility of the Population Reference Bureau and do not necessarily reflect the views of USAID or the United States government.
NOTES
The Data Sheet lists all geopolitical entities with populations of 150,000 or more and all members of the UN. These include sovereign states, dependencies, overseas departments, and some territories whose status or boundaries may be undetermined or in dispute. More developed regions, following the UN classification, comprise all of Europe and North America, plus Australia, Japan, and New Zealand. All other regions and countries are classified as less developed. The least developed countries consist of 48 countries with especially low incomes, high economic vulnerability, and poor human development indicators; 33 of these countries are in sub-Saharan Africa, 14 in Asia, and one in the Caribbean. The criteria and list of countries, as defined by the United Nations, can be found at www.unohrlls.org/en/ldc/.
Sub-Saharan Africa: All countries of Africa except the northern African countries of Algeria, Egypt, Libya, Morocco, Tunisia, and Western Sahara.
World and Regional Totals: Regional population totals are independently rounded and include small countries or areas not shown. Regional and world rates and percentages are weighted averages of countries for which data are available; regional averages are shown when data or estimates are available for at least three-quarters of the region’s population.
World Population Data Sheets from different years should not be used as a time series. Fluctuations in values from year to year often reflect revisions based on new data or estimates rather than actual changes in levels. Additional information on likely trends and consistent time series can be obtained from PRB, and are also available from UN and U.S. Census Bureau publications and websites.
SOURcES
The rates and figures are primarily compiled from the following sources: official country statistical yearbooks, bulletins, and websites; the United Nations Demographic Yearbook, 2009-2010 and Population and Vital Statistics Report of the UN Statistics Division; World Population Prospects: The 2010 Revision of the UN Population Division; and the International Data Base of the International Programs Center, U.S. Census Bureau. Other sources include recent demographic surveys such as the Demographic and Health Surveys, Reproductive Health Surveys, special studies, and direct communication with demographers and statistical bureaus in the United States and abroad. Specific data sources may be obtained by contacting the authors of the 2012 World Population Data Sheet. For countries with complete registration of births and deaths, rates are those most recently reported. For more developed countries, nearly all vital rates refer to 2011 or 2010.
dEFINITIONS
Mid-2012 PopulationEstimates are based on a recent census, official national data, or PRB, UN, and U.S. Census Bureau projections. The effects of refugee movements, large numbers of foreign workers, and population shifts due to contemporary political events are taken into account to the extent possible.
Birth and Death RateThe annual number of births and deaths per 1,000 total population. These rates are often referred to as “crude rates” since they do not take a population’s age structure into account. Thus, crude death rates in more developed countries with a relatively large proportion of high-mortality older population are often higher than those in less developed countries with lower life expectancy.
Rate of Natural Increase (RNI)The birth rate minus the death rate, implying the annual rate of population growth without regard for migration. Expressed as a percentage.
Net MigrationThe estimated rate of net immigration (immigration minus emigration) per 1,000 population for a recent year based upon the official national rate or derived as a residual from estimated birth, death, and population growth rates. Migration rates can vary substantially from year to year for any particular country, as can the definition of an immigrant.
2050 Population as a Multiple of 2010Projected populations based upon reasonable assumptions on the future course of fertility, mortality, and migration. Projections are based upon official country projections, series issued by the UN or the U.S. Census Bureau, or PRB projections.
Infant Mortality RateThe annual number of deaths of infants under age 1 per 1,000 live births. Rates shown with decimals indicate national statistics reported as completely registered, while those without are estimates from the sources cited above. Rates shown in italics are based upon fewer than 50 annual infant deaths and, as a result, are subject to considerable yearly variability; rates shown for such countries are averages for a multiple-year period.
Total Fertility Rate (TFR)The average number of children a woman would have assuming that current age-specific birth rates remain constant throughout her childbearing years (usually considered to be ages 15 to 49).
Population Under age 15/age 65+The percentage of the total population in these ages, which are often considered the “dependent ages.”
life expectancy at BirthThe average number of years a newborn infant can expect to live under current mortality levels.
Percent UrbanPercentage of the total population living in areas termed “urban” by that country or by the UN. Countries define urban in many different ways, from population centers of 100 or more dwellings to only the population living in national and provincial capitals.
Prevalence of HIV/aIDsThe estimated percentage of adults, by sex, ages 15-49, living with HIV/AIDS. Figures are from UNAIDS’ 2010 Report on the Global AIDS Epidemic with updates from recent Demographic and Health Surveys. Some regional averages were calculated by PRB.
Contraceptive UseThe percentage of currently married or “in union” women of reproductive age who are currently using any form of contraception. “Modern” methods include clinic and supply methods such as the pill, IUD, condom, and sterilization. Data are from the most recently available national-level surveys, such as Demographic and Health Surveys, Reproductive Health Surveys, Multiple Indicator Cluster Surveys, regional survey programs, national surveys, and the UN Population Division World Contraceptive Use 2011. For more developed countries, data refer to some point in the 1990s and early 2000s. Data for less developed countries are primarily from a point in the mid-2000s. Data prior to 2006 are shown in italics.
GNI PPP per Capita, 2010 (Us$)GNI PPP per capita is gross national income in purchasing power parity (PPP) divided by mid-year population. GNI PPP refers to gross national income converted to “international” dollars using a purchasing power parity conversion factor. International dollars indicate the amount of goods and services one could buy in the United States with a given amount of money. Data are from the World Bank. Figures in italics are for 2009.
age-standardized Death Rate for all Noncommunicable Diseases (NCDs) The numbers of deaths due to noncommunicable diseases per 100,000 population estimated for 2008 by sex and adjusted for differences in population age distribution across countries. Estimates for many developing countries and some developed countries are less reliable since they are not based on national NCD mortality data. Data are from Noncommunicable Diseases Country Profiles 2011 by the World Health Organization (WHO). Regional averages were calculated by PRB.
Percent of all Deaths Due to NCDsThe estimated percentage of all deaths that occurred in 2008 that resulted from NCDs. Data are from WHO’s Noncommunicable Diseases Country Profiles 2011. Regional averages were calculated by PRB.
Prevalence of Underweight among Children Under age 5 The percentage of children ages 0-59 months who are moderately and severely underweight (below minus two standard deviations from median weight-for-age of the WHO Child Growth Standards). Data are from UNICEF’s State of the World’s Children 2012. Some regional averages were calculated by PRB.
Acknowledgments, Notes, Sources, and definitions
PRB’s 2012 World Population Data Sheet is available in English, French, and Spanish at www.prb.org. Also online:
• Interactiveworldmapillustratingkeydemo-graphic variables by country and region. Map can be embedded on other websites using simple coding.
• Factsheetsonworldpopulationtrends,unmetneed for family planning, noncommunicable diseases, and U.S. fertility decline.
• WebinarwithPRBdemographers,includingtheir PowerPoint presentations.
• Video:“NoncommunicableDiseases.”
• Worldpopulationclock,continuouslyupdat-ing world population total.
To order PRB publications (discounts available for bulk orders):
• Onlineatwww.prb.org.
• E-mail:[email protected].
• Calltoll-free:800-877-9881.
• Fax:202-328-3937.
• Mail:1875ConnecticutAve.,NW,Suite520,Washington, DC 20009.
Data prepared by PRB demographers Carl Haub and Toshiko Kaneda.
© July 2012. Population Reference Bureau. All rights reserved. ISSN 0085-8315
Photo credits, cover: Background photo, © 2006 Anna Gerrard, courtesy of Photoshare. Bottom row, left to right: © 2008 digitalskillet/iStockPhoto; ©2007JustinHorrocks,iStockPhoto;and©2003Sammy Ndwiga, courtesy of Photoshare. Photo credits, data side (left to right): © 2008 Pakistan Safe Drinking Water and Hygiene Promotion Project, courtesy of USAID; © 2008 FISH Project, Philippines, courtesyofUSAID;©2007BenBarber,courtesyofUSAID; and © 2011 Nikada, iStockphoto.
20
© 2012 Population Reference Bureau 2012 WORLD POPULATION DATA SHEET
The PoPulation RefeRence BuReau informs people around the
world about population, health, and the environment, and empowers them to
use that information to advance the well-being of current and future generations.
1875 Connecticut Ave., NW, Suite 520, Washington, DC 20009 USAtel. 202-483-1100 | fax 202-328-3937 | e-mail: [email protected] | website: www.prb.org
PRB on: @PRBdata
If you value PRB’s World Population Data Sheet and are among the tens of thousands of people who eagerly anticipate its publication each year, please consider making a contribution to PRB. Your donation will help ensure that PRB can maintain its commitment to keeping the Data Sheet as affordable as possible. Visit our website to donate now: www.prb.org.
INFORMPRB informs people around the world about issues related to population, health, and the environment. To do this, we transform technical data and research into accurate, easy-to-understand information.
innovativE tools. DataFinder is a searchable database of hundreds of indicators for thousands of places.
inFluEntial PuBliCations. PRB’s Population and Economic Development 2012 Data Sheet, with 21 indicators from 140 low- and middle-income countries, presents a complex picture of countries still struggling with economic challenges and inequalities, while others are making significant headway.
multimEDia. PRB has nearly 100 videos with leading experts on topics as wide-ranging as climate change, immigration, HIV/AIDS, and female genital mutilation. Many videos include PowerPoint presentations shown during seminars and press briefings. ENGAGE presentations feature the Trendalyzer software created by Hans Rosling.
onlinE rEsourCEs. PRB’s website offers full text of all PRB publications, including our respected Population Bulletins, and data and analysis on world issues ranging from gender to aging to family planning.
EMPOWERPRB empowers people—researchers, journalists, policymakers, and educators—to use information about population, health, and the environment to encourage action. Frequently, people have information but lack the tools needed to communicate effectively to decisionmakers. PRB builds coalitions and conducts trainings to share techniques to inform policy.
Journalist nEtWorks. PRB builds the capacity of journalists from developing countries through seminars and study tours. We organized several study tours for journalists in Uganda, Kenya, Tanzania, Indonesia, and Mali to visit projects and the people they affect.
PoliCy CommuniCation traininG. In the past decade, PRB has trained more than 800 professionals in Asia, Africa, and Latin America. Each year, we sponsored two workshops with Kenya’s National Council for Population and Development, training local and regional policymakers, program managers, and advocates.
Data WorksHoPs. PRB’s data workshops and online training assist the Annie E. Casey Foundation’s KIDS COUNT network in using vital data about the status of children in the United States. Participants take away the knowledge needed to access data about their particular state and communicate with policymakers.
ADVANCEPRB works to advance the well-being of current and future generations. Toward that end, we analyze data and research, disseminate information, and empower people to use that information to inform policymaking. While the numbers of publications created or workshops conducted are one way to measure PRB’s work, the creation of evidence-based policies, increased demand for health services, and active coalitions are better gauges of progress toward positive social change.
EviDEnCE-BasED PoliCiEs. PRB provides analysis for the KIDS COUNT Data Book, an annual report card on the well-being of children and families in the United States. The Data Book has helped promote the passage of several U.S. policies, including the State Children’s Health Insurance Program.
DEmanD For HEaltH sErviCEs. Articles written as part of a media training effort in child marriage in Senegal led to the Vice President of the National Assembly’s call for a study to understand and address this common and harmful practice.
aCtivE Coalitions. PRB works with the East Africa Population, Health, and Environment Network to increase information sharing across the region. The AFRICAPHE online discussion group improves access to information and capacity-building and funding opportunities.