Embed Size (px)
Citation preview
Prepared by CMCOG Staff—March 2018
Central Midlands Region Population Projection Report
2020-2050

CENTRAL MIDLANDS REGION POPULATION PROJECTIONS 2020-2050
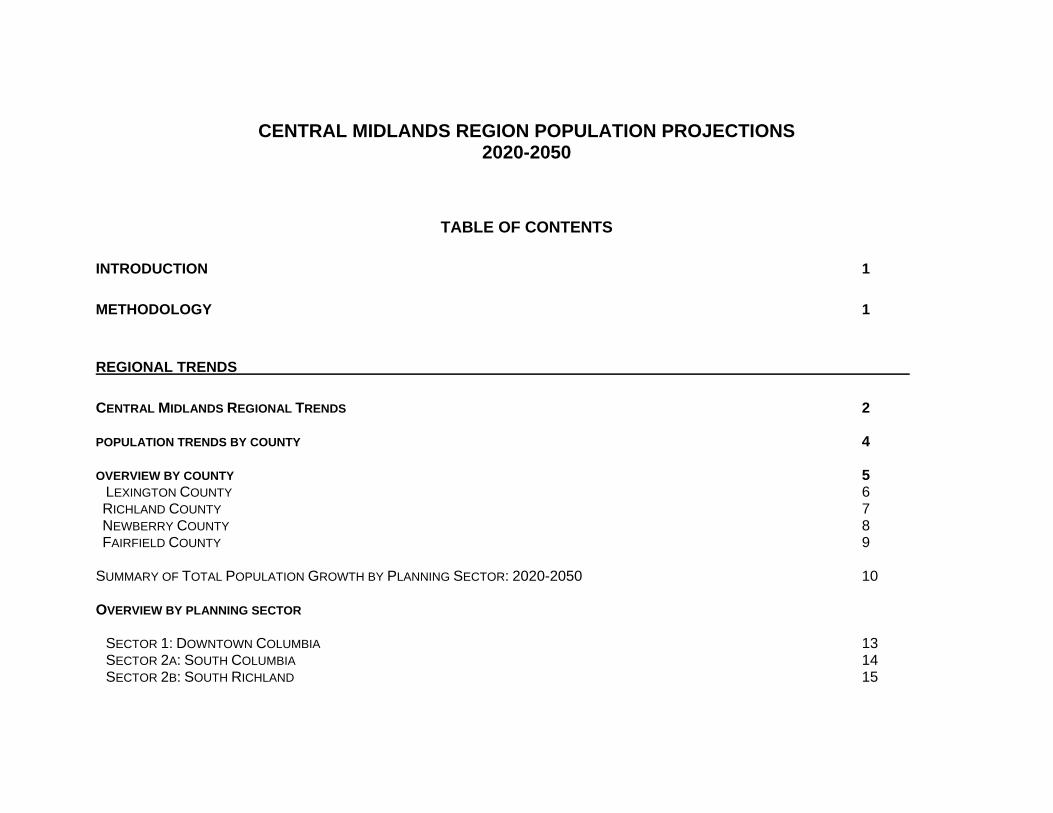
TABLE OF CONTENTS
INTRODUCTION 1
METHODOLOGY 1
REGIONAL TRENDS
CENTRAL MIDLANDS REGIONAL TRENDS 2 POPULATION TRENDS BY COUNTY 4 OVERVIEW BY COUNTY 5 LEXINGTON COUNTY 6 RICHLAND COUNTY 7 NEWBERRY COUNTY 8 FAIRFIELD COUNTY 9 SUMMARY OF TOTAL POPULATION GROWTH BY PLANNING SECTOR: 2020-2050 10 OVERVIEW BY PLANNING SECTOR SECTOR 1: DOWNTOWN COLUMBIA 13 SECTOR 2A: SOUTH COLUMBIA 14 SECTOR 2B: SOUTH RICHLAND 15
SECTOR 3A: EAST COLUMBIA 16 SECTOR 3B: DENTSVILLE/ARCADIA LAKES 17 SECTOR 4A: NORTH COLUMBIA 18 SECTOR 4B: CEDAR CREEK 19 SECTOR 5A: ST. ANDREWS (RICHLAND COUNTY) 20 SECTOR 5B: ST. ANDREWS (LEXINGTON COUNTY) 21 SECTOR 6A: WEST COLUMBIA/CAYCE 22 SECTOR 6B: SPRINGDALE 23 SECTOR 7A: SOUTHEAST RICHLAND COUNTY 24 SECTOR 6B: HOPKINS 25 SECTOR 7C: EAST RICHLAND 26 SECTOR 8: FORT JACKSON 27 SECTOR 9A: RICHLAND NORTHEAST 28 SECTOR 9B: BLYTHEWOOD 29 SECTOR 9C: NORTH RICHLAND 30 SECTOR 10A: IRMO 31 SECTOR 10B: DUTCH FORK 32 SECTOR 10C: CHAPIN 33 SECTOR 11: LEXINGTON 34 SECTOR 12A: SOUTH CONGAREE 35 SECTOR 12B: SWANSEA 36 SECTOR 12C: PELION 37 SECTOR 13A: GILBERT 38 SECTOR 13B: BATESBURG-LEESVILLE 39 SECTOR 14: WHITMIRE 40 SECTOR 15: CHAPPELLS 41 SECTOR 16: NEWBERRY 42 SECTOR 17: PROSPERITY/POMARIA 43 SECTOR 18: MONTICELLO 44 SECTOR 19: WINNSBORO 45 SECTOR 20: RIDGEWAY 46
LIST OF FIGURES
FIGURE 1: CENTRAL MIDLANDS REGIONAL POPULATION TRENDS: 2020-2050 3 FIGURE 2: CENTRAL MIDLANDS POPULATION TRENDS BY COUNTY: 2015-2050 4 FIGURE 3: POPULATION & PERCENT CHANGE BY COUNTY: 2020-2050 4 FIGURE 4: LEXINGTON COUNTY POPULATION TRENDS: 2020-2050 5 FIGURE 5: RICHLAND COUNTY POPULATION TRENDS: 2020-2050 6 FIGURE 6: NEWBERRY COUNTY POPULATION TRENDS: 2020-2050 7 FIGURE 7: FAIRFIELD COUNTY POPULATION TRENDS: 2020-2050 8 FIGURE 8: REGIONAL POPULATION GROWTH BY GROWTH PERCENTAGE 11 FIGURE 9: CENTRAL MIDLANDS PLANNING SECTOR MAP 12
APPENDICES
APPENDIX A: 2000-2050 POPULATION BY CENSUS TRACT 47 APPENDIX B: 2000-2050 POPULATION BY COUNTY BY CENSUS TRACT 63
1
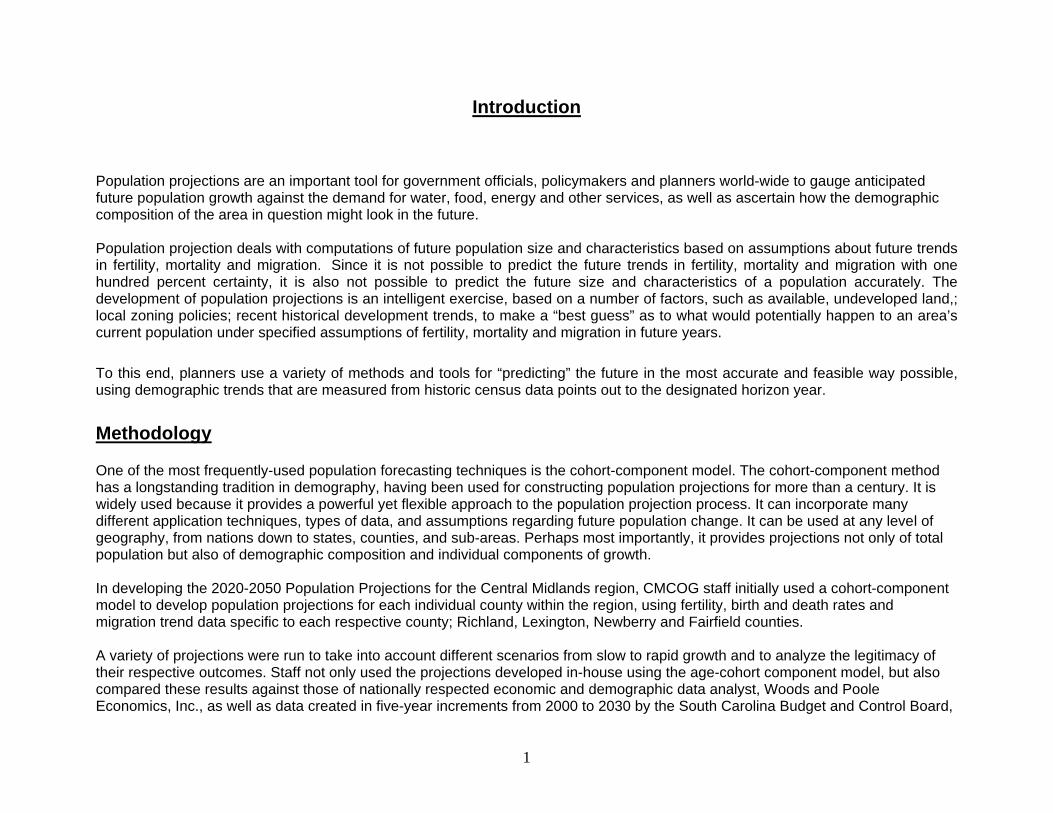
Introduction
Population projections are an important tool for government officials, policymakers and planners world-wide to gauge anticipated future population growth against the demand for water, food, energy and other services, as well as ascertain how the demographic composition of the area in question might look in the future.
Population projection deals with computations of future population size and characteristics based on assumptions about future trends in fertility, mortality and migration. Since it is not possible to predict the future trends in fertility, mortality and migration with one hundred percent certainty, it is also not possible to predict the future size and characteristics of a population accurately. The development of population projections is an intelligent exercise, based on a number of factors, such as available, undeveloped land,; local zoning policies; recent historical development trends, to make a “best guess” as to what would potentially happen to an area’s current population under specified assumptions of fertility, mortality and migration in future years.
To this end, planners use a variety of methods and tools for “predicting” the future in the most accurate and feasible way possible, using demographic trends that are measured from historic census data points out to the designated horizon year.
Methodology One of the most frequently-used population forecasting techniques is the cohort-component model. The cohort-component method has a longstanding tradition in demography, having been used for constructing population projections for more than a century. It is widely used because it provides a powerful yet flexible approach to the population projection process. It can incorporate many different application techniques, types of data, and assumptions regarding future population change. It can be used at any level of geography, from nations down to states, counties, and sub-areas. Perhaps most importantly, it provides projections not only of total population but also of demographic composition and individual components of growth. In developing the 2020-2050 Population Projections for the Central Midlands region, CMCOG staff initially used a cohort-component model to develop population projections for each individual county within the region, using fertility, birth and death rates and migration trend data specific to each respective county; Richland, Lexington, Newberry and Fairfield counties. A variety of projections were run to take into account different scenarios from slow to rapid growth and to analyze the legitimacy of their respective outcomes. Staff not only used the projections developed in-house using the age-cohort component model, but also compared these results against those of nationally respected economic and demographic data analyst, Woods and Poole Economics, Inc., as well as data created in five-year increments from 2000 to 2030 by the South Carolina Budget and Control Board,
2
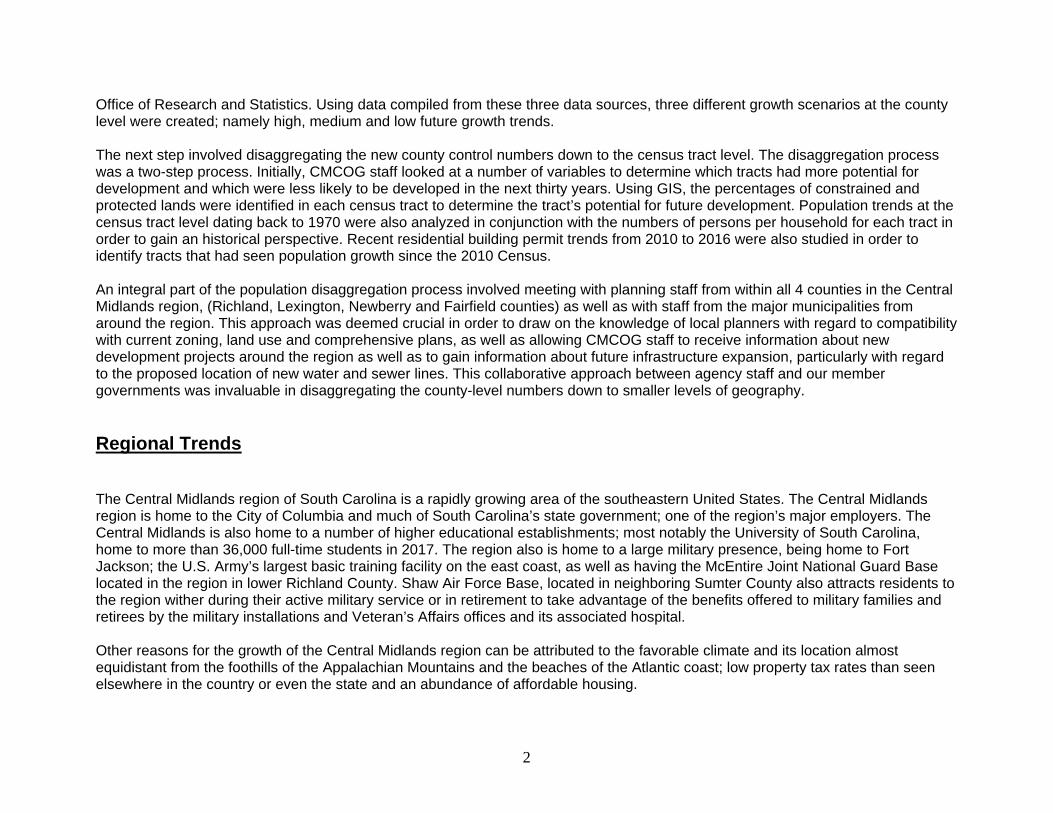
Office of Research and Statistics. Using data compiled from these three data sources, three different growth scenarios at the county level were created; namely high, medium and low future growth trends. The next step involved disaggregating the new county control numbers down to the census tract level. The disaggregation process was a two-step process. Initially, CMCOG staff looked at a number of variables to determine which tracts had more potential for development and which were less likely to be developed in the next thirty years. Using GIS, the percentages of constrained and protected lands were identified in each census tract to determine the tract’s potential for future development. Population trends at the census tract level dating back to 1970 were also analyzed in conjunction with the numbers of persons per household for each tract in order to gain an historical perspective. Recent residential building permit trends from 2010 to 2016 were also studied in order to identify tracts that had seen population growth since the 2010 Census. An integral part of the population disaggregation process involved meeting with planning staff from within all 4 counties in the Central Midlands region, (Richland, Lexington, Newberry and Fairfield counties) as well as with staff from the major municipalities from around the region. This approach was deemed crucial in order to draw on the knowledge of local planners with regard to compatibility with current zoning, land use and comprehensive plans, as well as allowing CMCOG staff to receive information about new development projects around the region as well as to gain information about future infrastructure expansion, particularly with regard to the proposed location of new water and sewer lines. This collaborative approach between agency staff and our member governments was invaluable in disaggregating the county-level numbers down to smaller levels of geography.
Regional Trends
The Central Midlands region of South Carolina is a rapidly growing area of the southeastern United States. The Central Midlands region is home to the City of Columbia and much of South Carolina’s state government; one of the region’s major employers. The Central Midlands is also home to a number of higher educational establishments; most notably the University of South Carolina, home to more than 36,000 full-time students in 2017. The region also is home to a large military presence, being home to Fort Jackson; the U.S. Army’s largest basic training facility on the east coast, as well as having the McEntire Joint National Guard Base located in the region in lower Richland County. Shaw Air Force Base, located in neighboring Sumter County also attracts residents to the region wither during their active military service or in retirement to take advantage of the benefits offered to military families and retirees by the military installations and Veteran’s Affairs offices and its associated hospital. Other reasons for the growth of the Central Midlands region can be attributed to the favorable climate and its location almost equidistant from the foothills of the Appalachian Mountains and the beaches of the Atlantic coast; low property tax rates than seen elsewhere in the country or even the state and an abundance of affordable housing.
3
Since the last decennial Census in 2010 and this study’s base year of 2020, it is anticipated that the population of the four-county area will have increased by 131,460 residents; from 708,359 to 839,918; for a population increase of 18.6%. In the decade prior to 2010, the region’s population had increased by approximately the same proportion; 18.8%. In order to establish the 2020 base year population, a number of assumptions were made alongside those which came out of the age cohort component model. Interim year census estimates, published annually by the U.S. Census Bureau through its sample annual American Community Survey, were analyzed in conjunction with a review of residential building permits issued since the last decennial census in 2010. Permits for both single family and multi-family housing units were tallied before being geo-coded and mapped to latitude and longitude coordinates, to determine their location by census tract. The numbers of permits in each census tract across the region were then multiplied by the average number of persons per household to determine how much population to apply to each level of geography, starting at the county level, before disaggregating the numbers down to pre-defined sub-areas (consisting of combinations of census tracts) and, finally, by individual census tract.
4
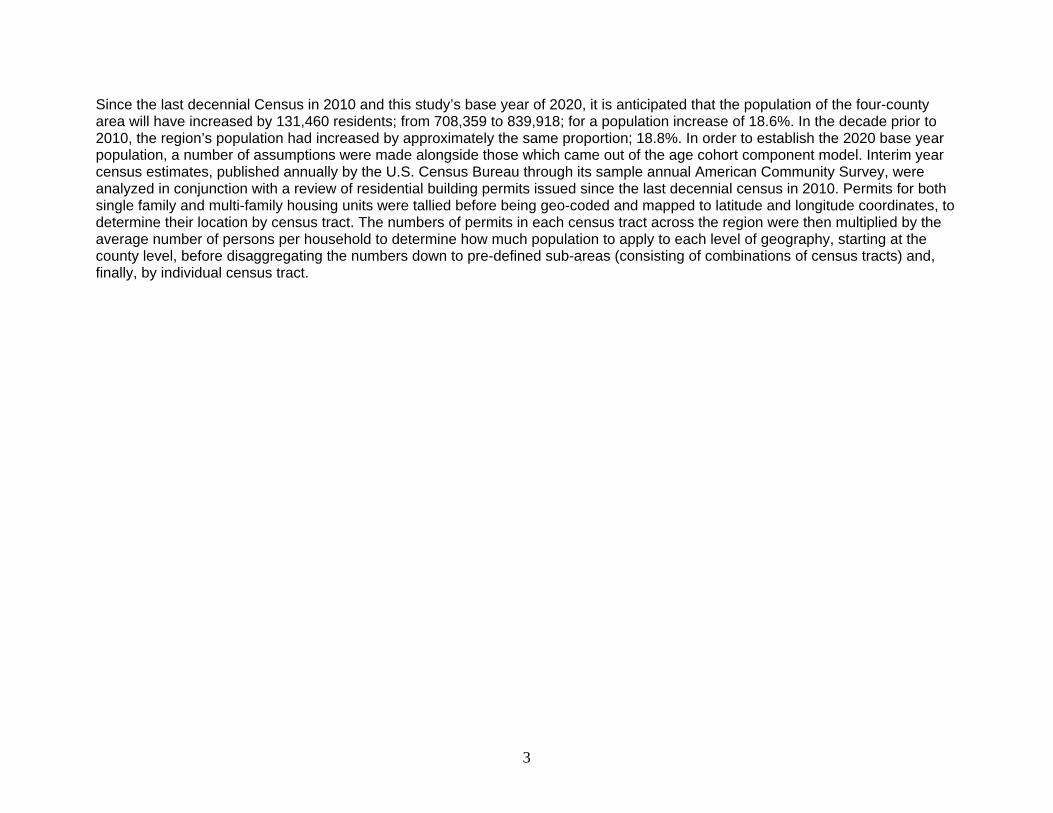
Central Midlands Regional Population Trends: 2020-2050
Figure 1 (Above) shows that over the course of the next thirty years, the population of the Central Midlands region of South Carolina is expected to grow by more than 525,000 residents (62.6%). By 2050, it is projected that the population of the four-county Central Midlands region will total almost 1.4 million people.
FIGURE 1
5
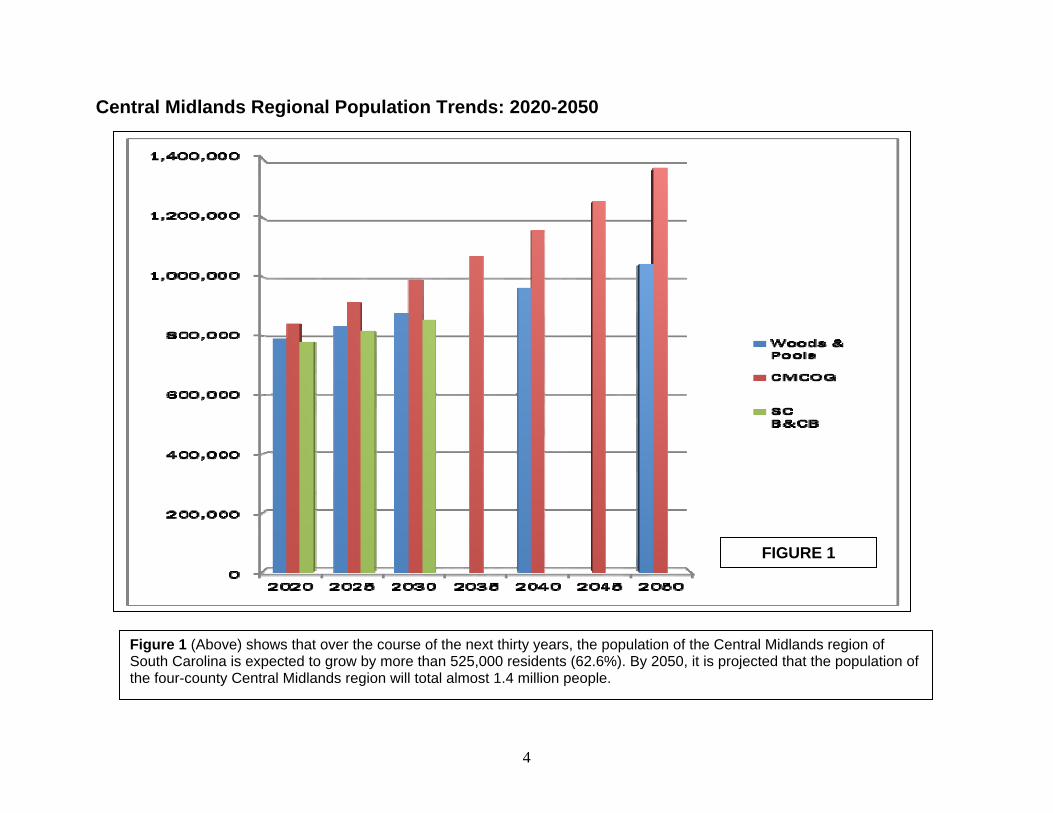
Central Midlands Regional Population Trends by County: 2020-2050
TABLE OF CONTENTS
2020 2025 2030 2035 2040 2045 2050
Richland County 456,027 494,141 532,702 571,854 613,854 658,841 706,818Newberry County 40,612 42,663 44,362 45,984 47,401 48,822 50,251Fairfield County 24,497 25,085 25,321 25,576 25,865 26,501 26,924Lexington County 318,683 350,852 386,044 424,979 468,910 520,278 581,135CMCOG Region 839,819 912,741 988,430 1,068,394 1,155,760 1,254,051 1,365,128
Figure 2
Figure 3
6
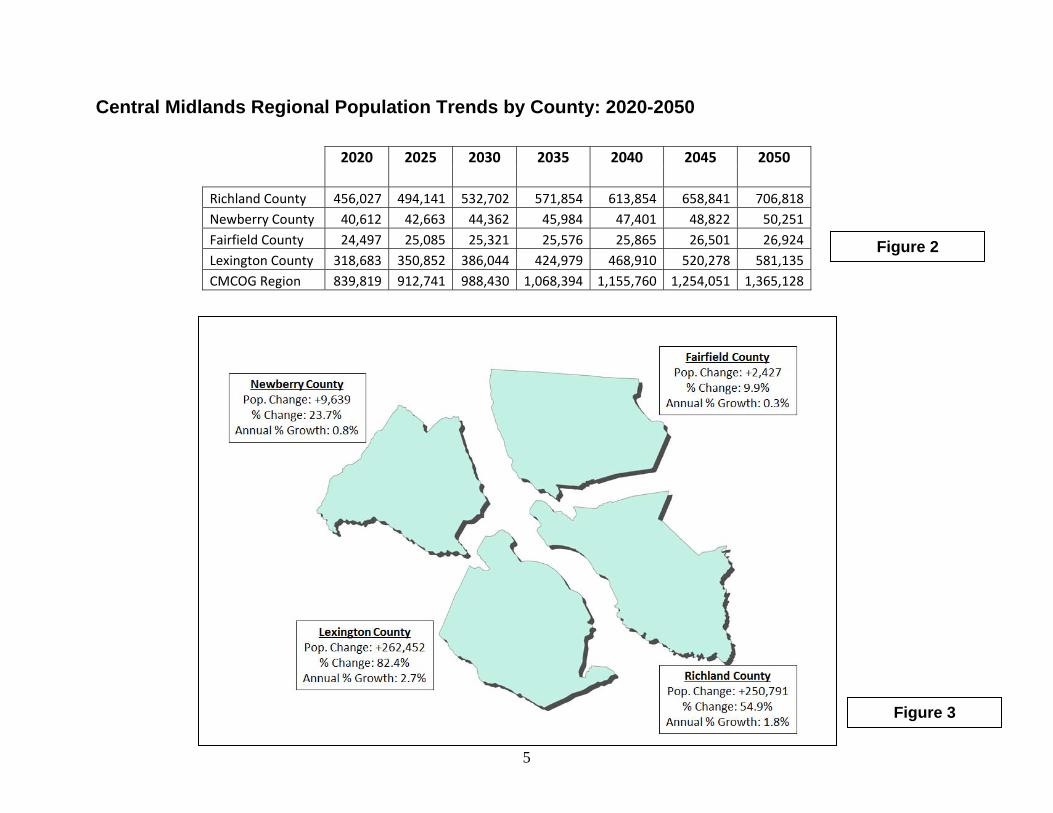
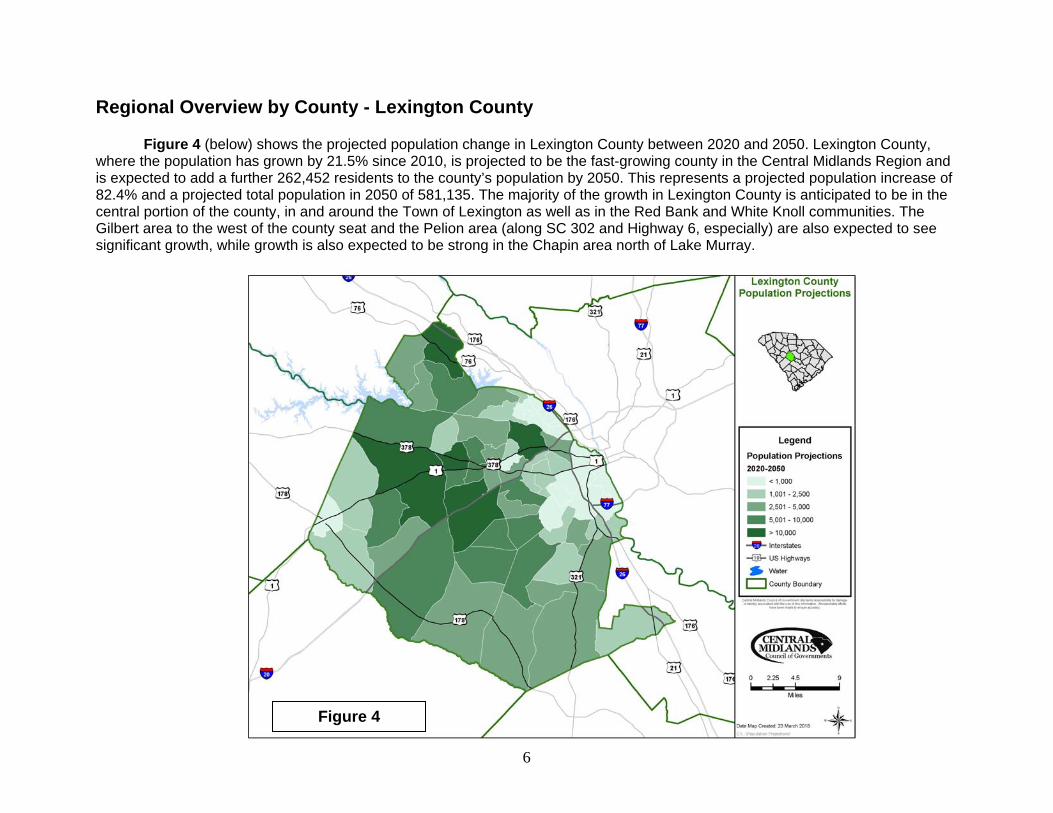
Regional Overview by County - Lexington County Figure 4 (below) shows the projected population change in Lexington County between 2020 and 2050. Lexington County,
where the population has grown by 21.5% since 2010, is projected to be the fast-growing county in the Central Midlands Region and is expected to add a further 262,452 residents to the county’s population by 2050. This represents a projected population increase of 82.4% and a projected total population in 2050 of 581,135. The majority of the growth in Lexington County is anticipated to be in the central portion of the county, in and around the Town of Lexington as well as in the Red Bank and White Knoll communities. The Gilbert area to the west of the county seat and the Pelion area (along SC 302 and Highway 6, especially) are also expected to see significant growth, while growth is also expected to be strong in the Chapin area north of Lake Murray.
Figure 4
7
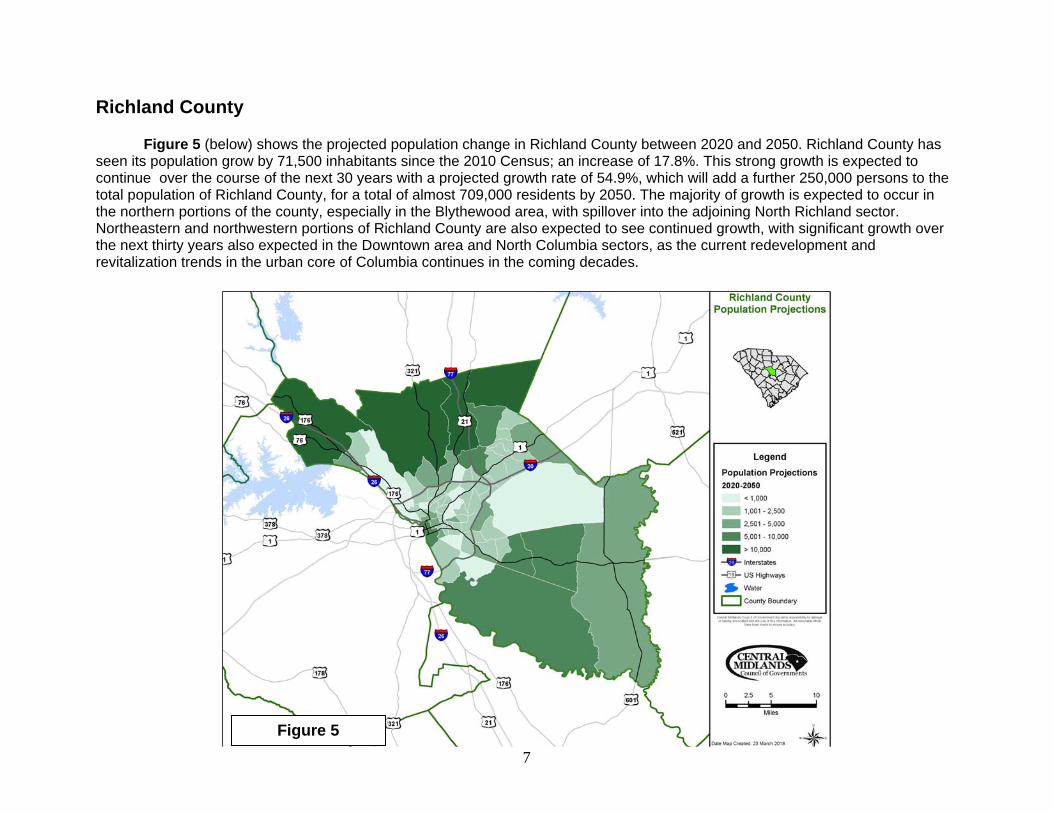
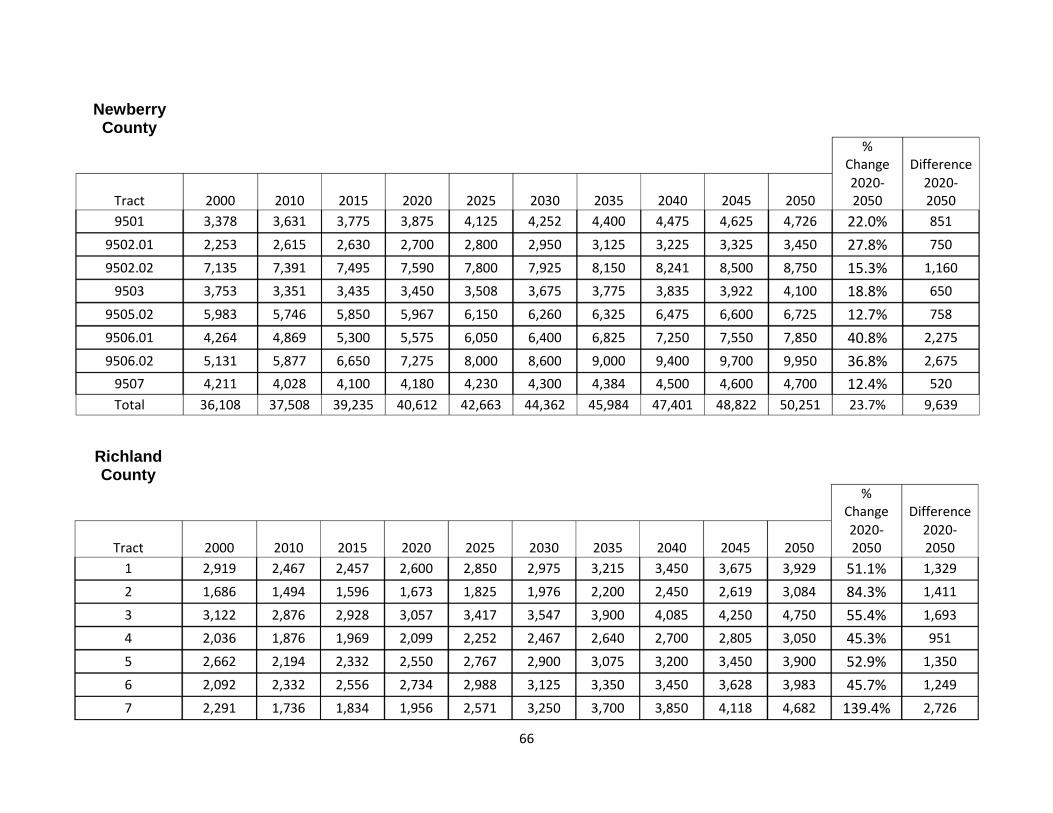
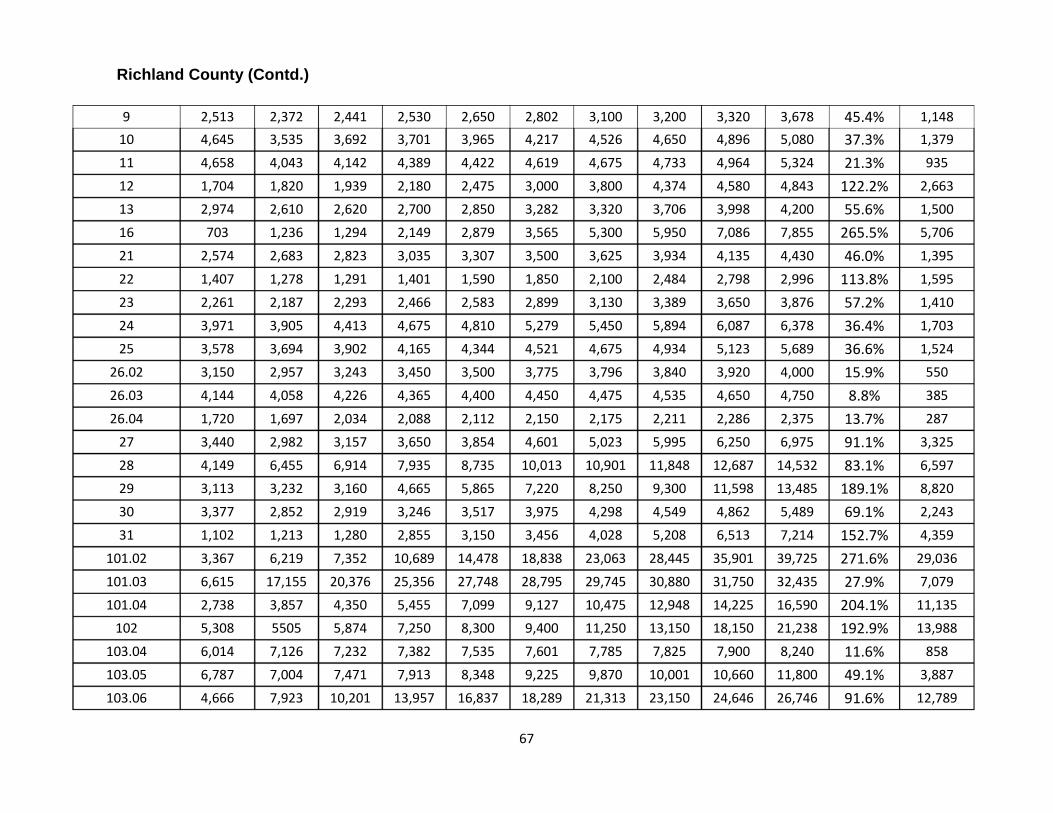
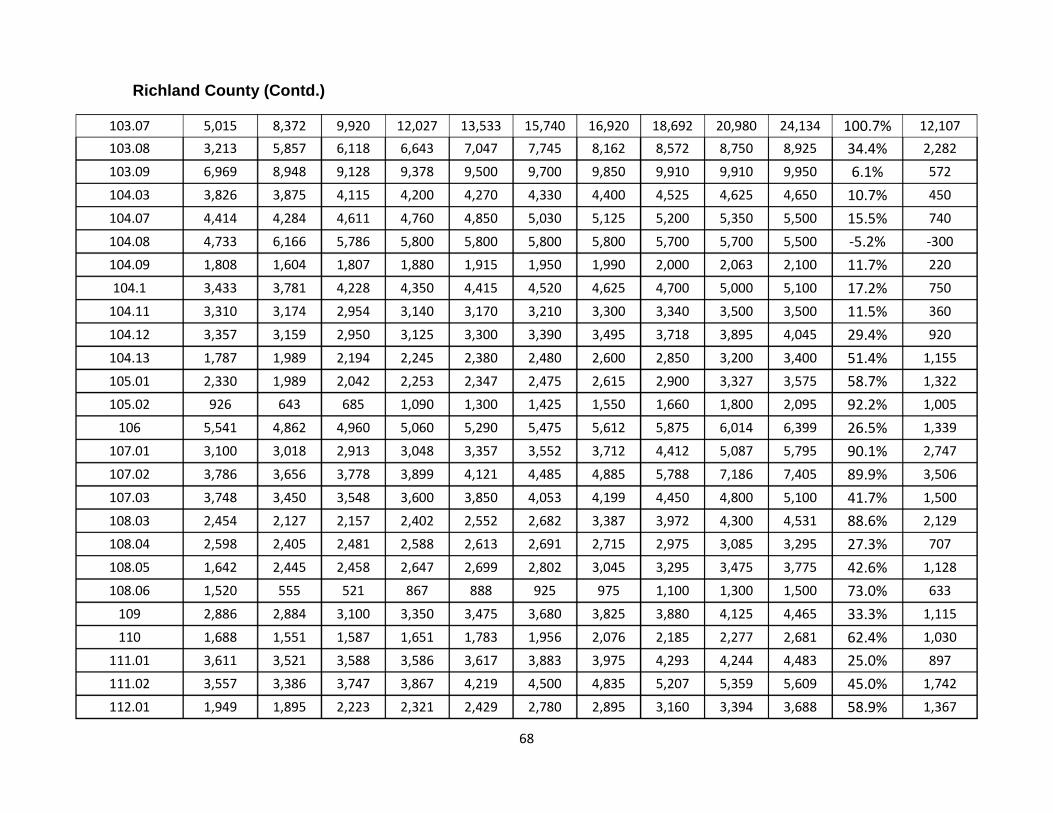
Richland County Figure 5 (below) shows the projected population change in Richland County between 2020 and 2050. Richland County has
seen its population grow by 71,500 inhabitants since the 2010 Census; an increase of 17.8%. This strong growth is expected to continue over the course of the next 30 years with a projected growth rate of 54.9%, which will add a further 250,000 persons to the total population of Richland County, for a total of almost 709,000 residents by 2050. The majority of growth is expected to occur in the northern portions of the county, especially in the Blythewood area, with spillover into the adjoining North Richland sector. Northeastern and northwestern portions of Richland County are also expected to see continued growth, with significant growth over the next thirty years also expected in the Downtown area and North Columbia sectors, as the current redevelopment and revitalization trends in the urban core of Columbia continues in the coming decades.
Figure 5
8
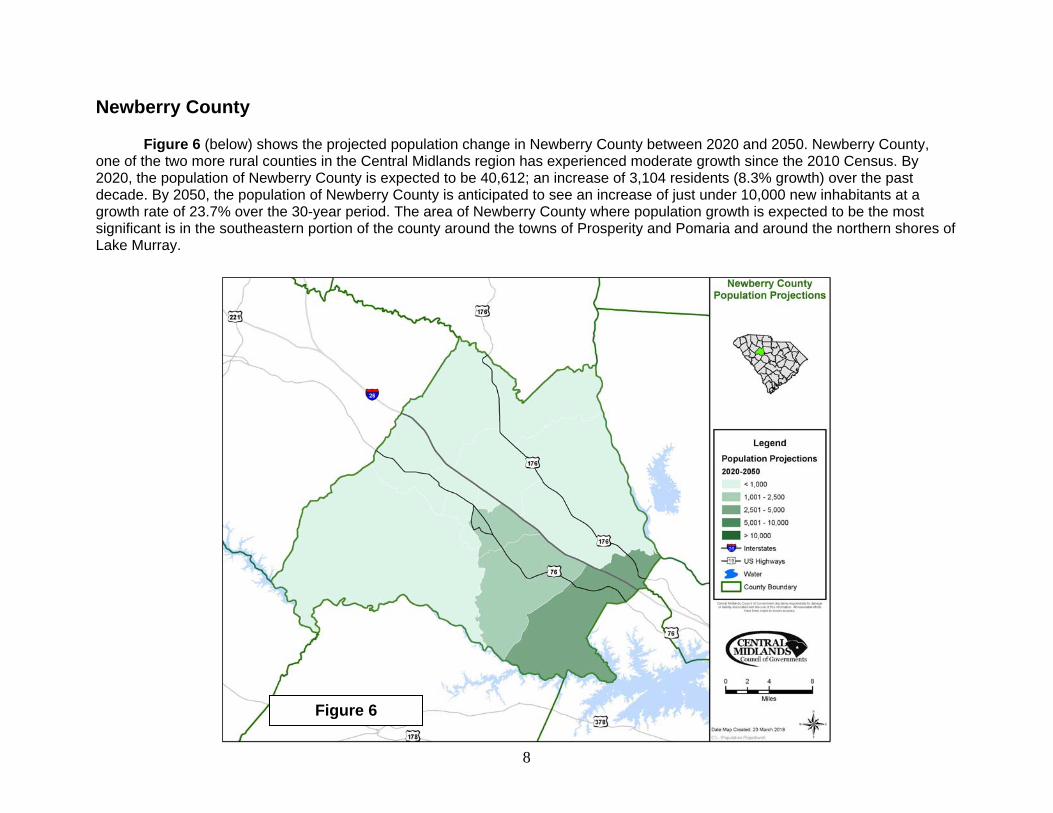
Newberry County Figure 6 (below) shows the projected population change in Newberry County between 2020 and 2050. Newberry County,
one of the two more rural counties in the Central Midlands region has experienced moderate growth since the 2010 Census. By 2020, the population of Newberry County is expected to be 40,612; an increase of 3,104 residents (8.3% growth) over the past decade. By 2050, the population of Newberry County is anticipated to see an increase of just under 10,000 new inhabitants at a growth rate of 23.7% over the 30-year period. The area of Newberry County where population growth is expected to be the most significant is in the southeastern portion of the county around the towns of Prosperity and Pomaria and around the northern shores of Lake Murray.
Figure 6
9
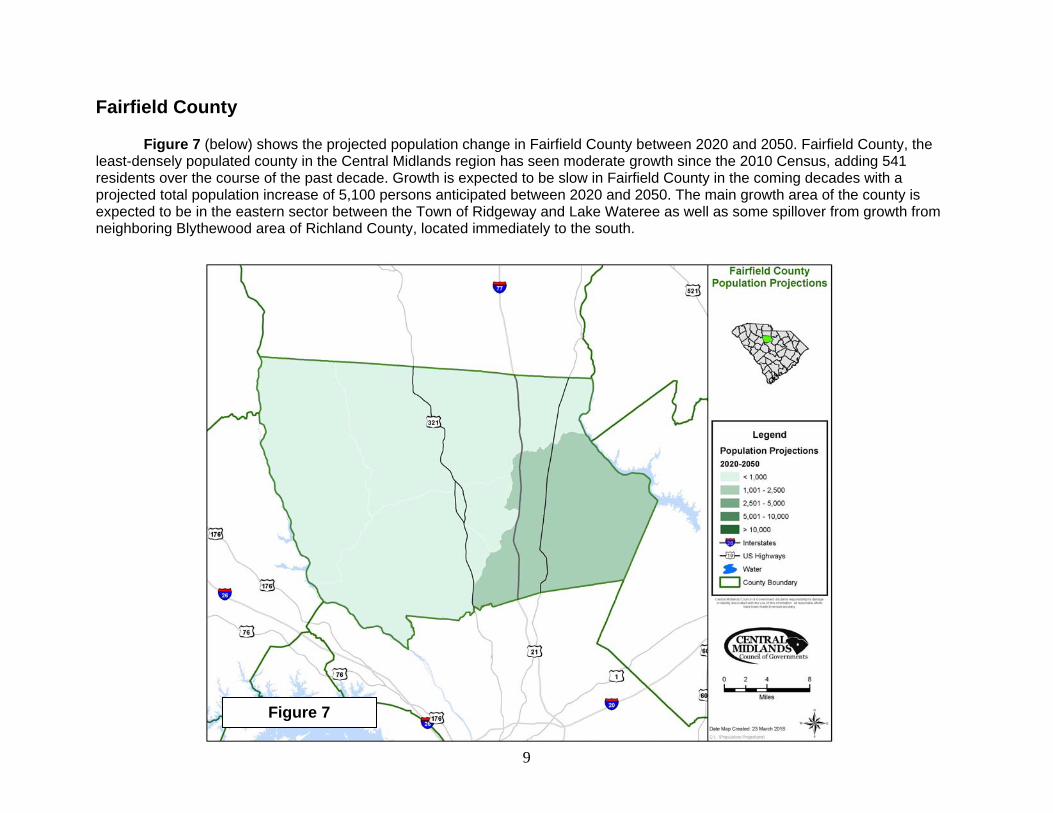
Fairfield County Figure 7 (below) shows the projected population change in Fairfield County between 2020 and 2050. Fairfield County, the
least-densely populated county in the Central Midlands region has seen moderate growth since the 2010 Census, adding 541 residents over the course of the past decade. Growth is expected to be slow in Fairfield County in the coming decades with a projected total population increase of 5,100 persons anticipated between 2020 and 2050. The main growth area of the county is expected to be in the eastern sector between the Town of Ridgeway and Lake Wateree as well as some spillover from growth from neighboring Blythewood area of Richland County, located immediately to the south.
Figure 7
10
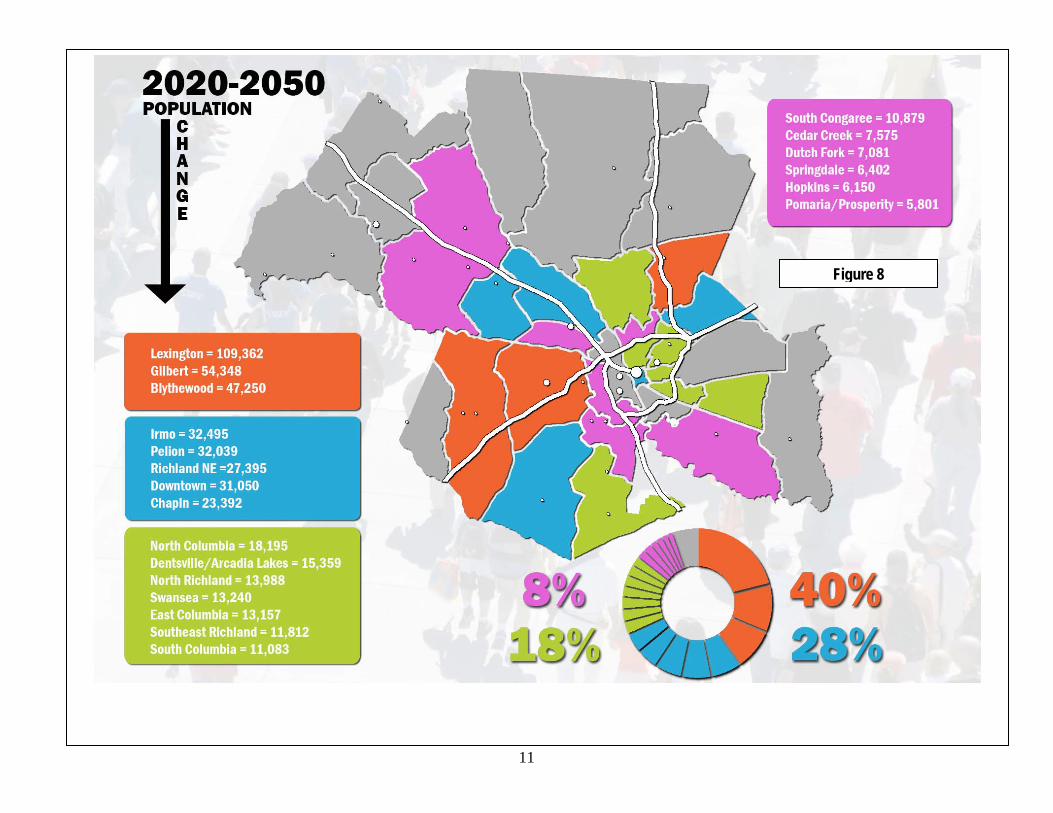
Percentage of Total Population Growth by Planning Sector: 2020-2050 Figure 8 (see page 11 over) shows the planning sectors within the Central Midlands region that are projected to see the highest total population growth in absolute numbers between 2020 and 2050. The sectors shaded in orange (Lexington, Gilbert and Blythewood) are expected to see the highest overall growth in the region, and together are projected to account for 40% of the region’s total growth in population (210,960 persons). The blue shaded areas of Irmo, Pelion, Richland Northeast, Chapin and Downtown Columbia will together account for 28% of the total population growth in the region between 2020 and 2050 (146,371 persons) as growth continues to occur in these large, suburban tracts adjacent to the areas which are anticipated to see the greatest overall population increases. The green shaded areas, which, with the exception of North Richland and Swansea, located within the core of the Columbia Metropolitan area (Forest Acres, Arcadia Lakes, Shandon/Rosewood and the Garners Ferry Road and North Main Street corridors) should account for around 18% of the total growth in the region between 2020 and 2050. 8% of the total population growth is projected to occur in the Springdale, South Congaree, Dutch Fork, Lower Richland/Hopkins communities as well as in eastern Newberry County, with the un-shaded areas, located predominantly in peripheral portions of the region where population growth has, historically been less intense and dense in nature, will see some growth, and will account for the remaining 6% of total population growth in the Central Midlands region between 2020 and 2050
11
Figure 8
12
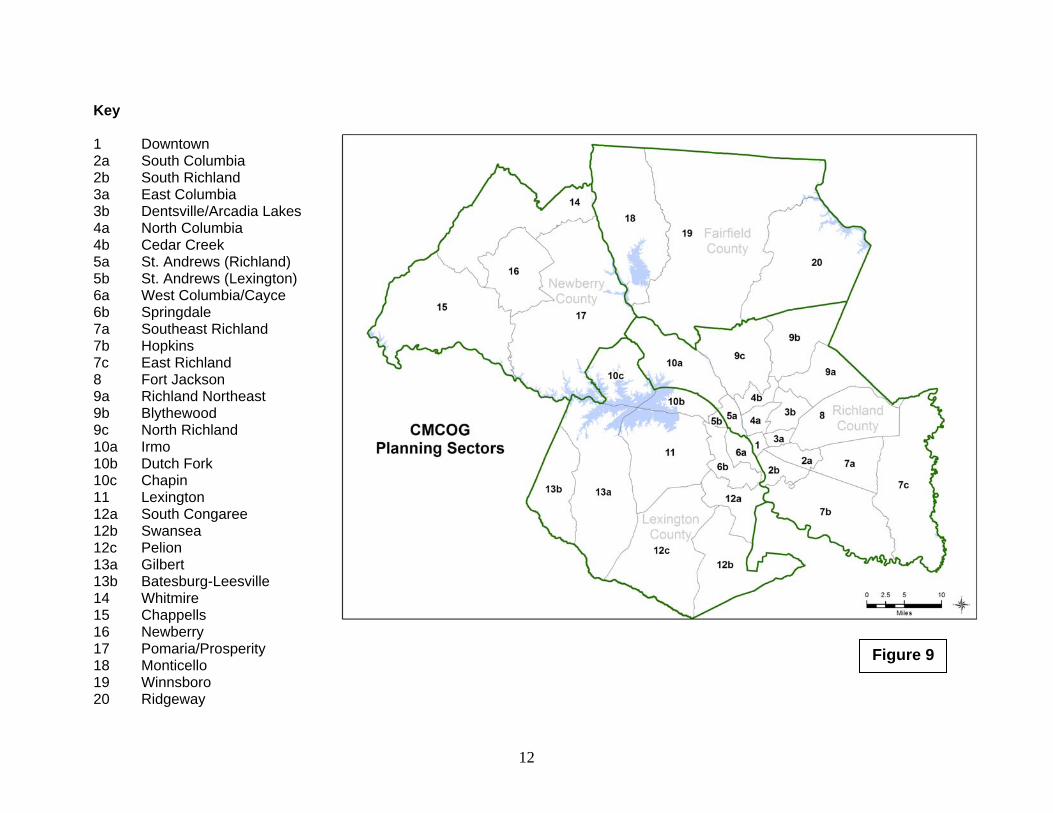
Figure 9
Key 1 Downtown 2a South Columbia 2b South Richland 3a East Columbia 3b Dentsville/Arcadia Lakes 4a North Columbia 4b Cedar Creek 5a St. Andrews (Richland) 5b St. Andrews (Lexington) 6a West Columbia/Cayce 6b Springdale 7a Southeast Richland 7b Hopkins 7c East Richland 8 Fort Jackson 9a Richland Northeast 9b Blythewood 9c North Richland 10a Irmo 10b Dutch Fork 10c Chapin 11 Lexington 12a South Congaree 12b Swansea 12c Pelion 13a Gilbert 13b Batesburg-Leesville 14 Whitmire 15 Chappells 16 Newberry 17 Pomaria/Prosperity 18 Monticello 19 Winnsboro 20 Ridgeway
12
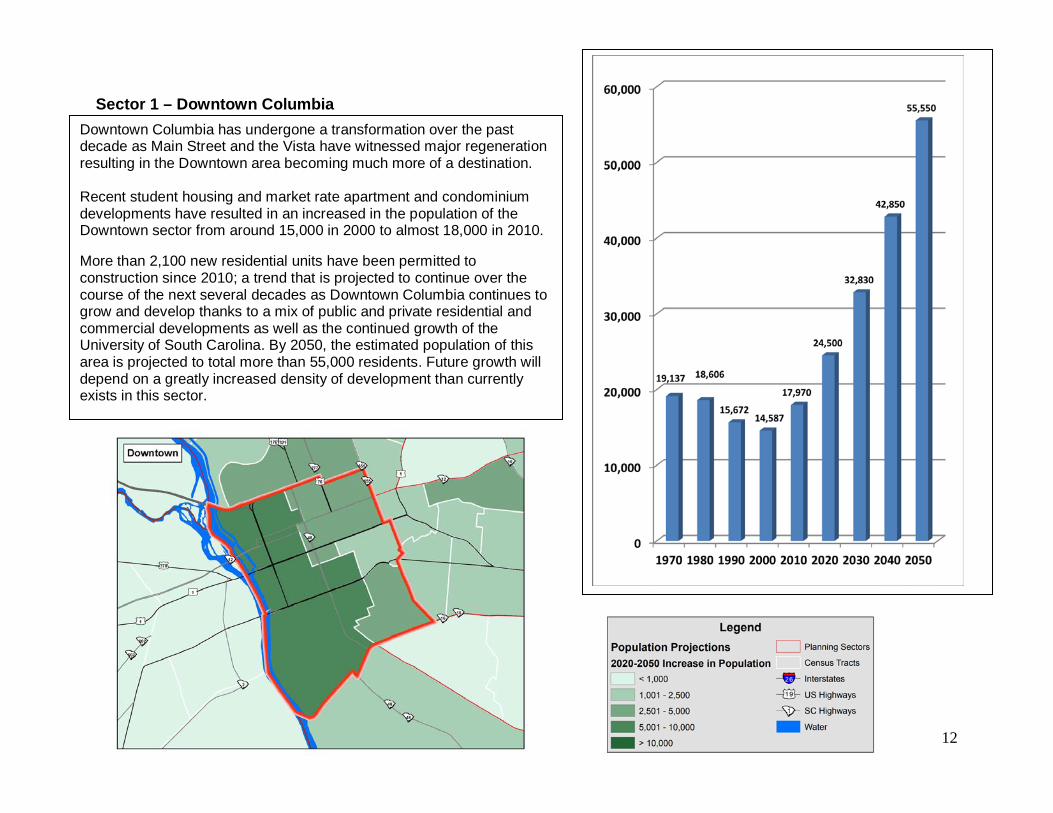
Sector 1 – Downtown Columbia
Downtown Columbia has undergone a transformation over the past decade as Main Street and the Vista have witnessed major regeneration resulting in the Downtown area becoming much more of a destination. Recent student housing and market rate apartment and condominium developments have resulted in an increased in the population of the Downtown sector from around 15,000 in 2000 to almost 18,000 in 2010. More than 2,100 new residential units have been permitted to construction since 2010; a trend that is projected to continue over the course of the next several decades as Downtown Columbia continues to grow and develop thanks to a mix of public and private residential and commercial developments as well as the continued growth of the University of South Carolina. By 2050, the estimated population of this area is projected to total more than 55,000 residents. Future growth will depend on a greatly increased density of development than currently exists in this sector.
13
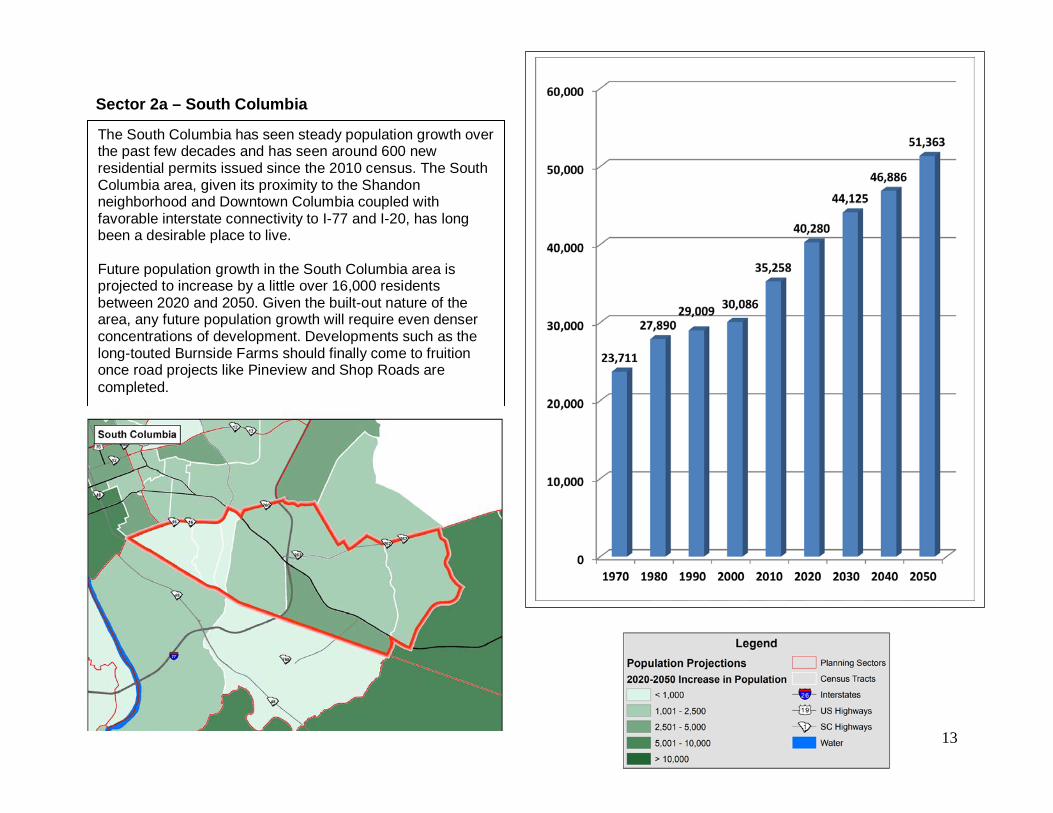
Sector 2a – South Columbia
The South Columbia has seen steady population growth over the past few decades and has seen around 600 new residential permits issued since the 2010 census. The South Columbia area, given its proximity to the Shandon neighborhood and Downtown Columbia coupled with favorable interstate connectivity to I-77 and I-20, has long been a desirable place to live. Future population growth in the South Columbia area is projected to increase by a little over 16,000 residents between 2020 and 2050. Given the built-out nature of the area, any future population growth will require even denser concentrations of development. Developments such as the long-touted Burnside Farms should finally come to fruition once road projects like Pineview and Shop Roads are completed.
14
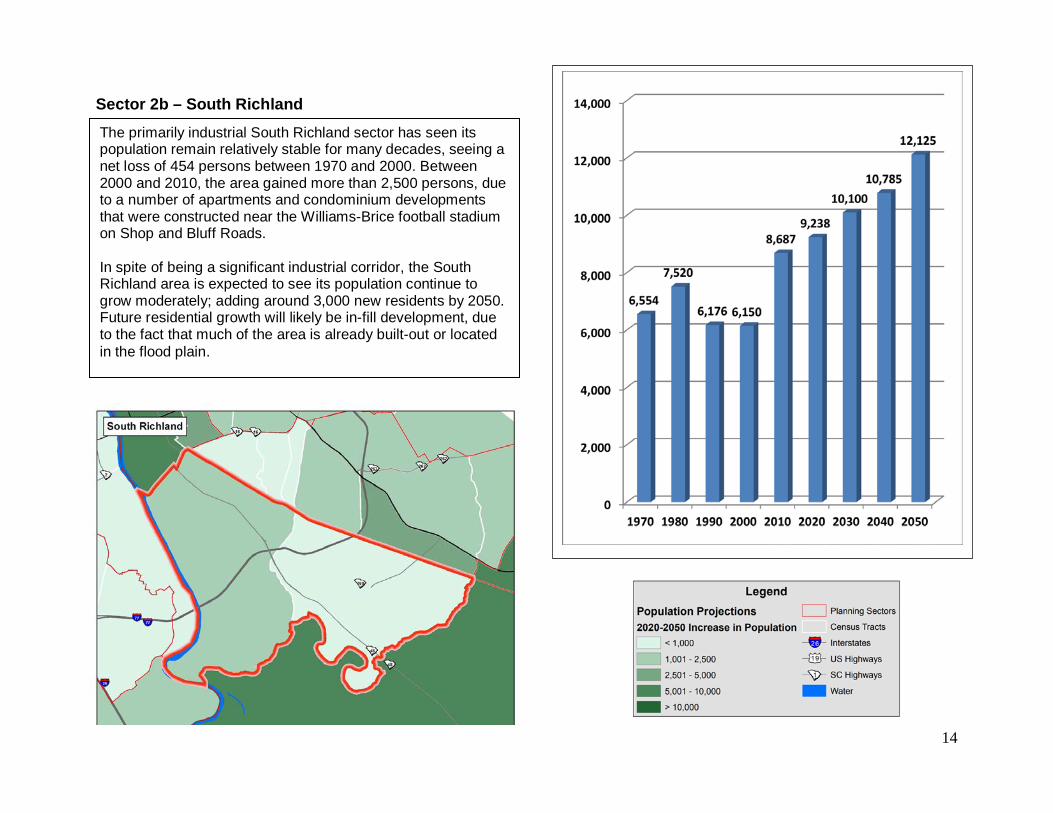
Sector 2b – South Richland
The primarily industrial South Richland sector has seen its population remain relatively stable for many decades, seeing a net loss of 454 persons between 1970 and 2000. Between 2000 and 2010, the area gained more than 2,500 persons, due to a number of apartments and condominium developments that were constructed near the Williams-Brice football stadium on Shop and Bluff Roads. In spite of being a significant industrial corridor, the South Richland area is expected to see its population continue to grow moderately; adding around 3,000 new residents by 2050. Future residential growth will likely be in-fill development, due to the fact that much of the area is already built-out or located in the flood plain.
15
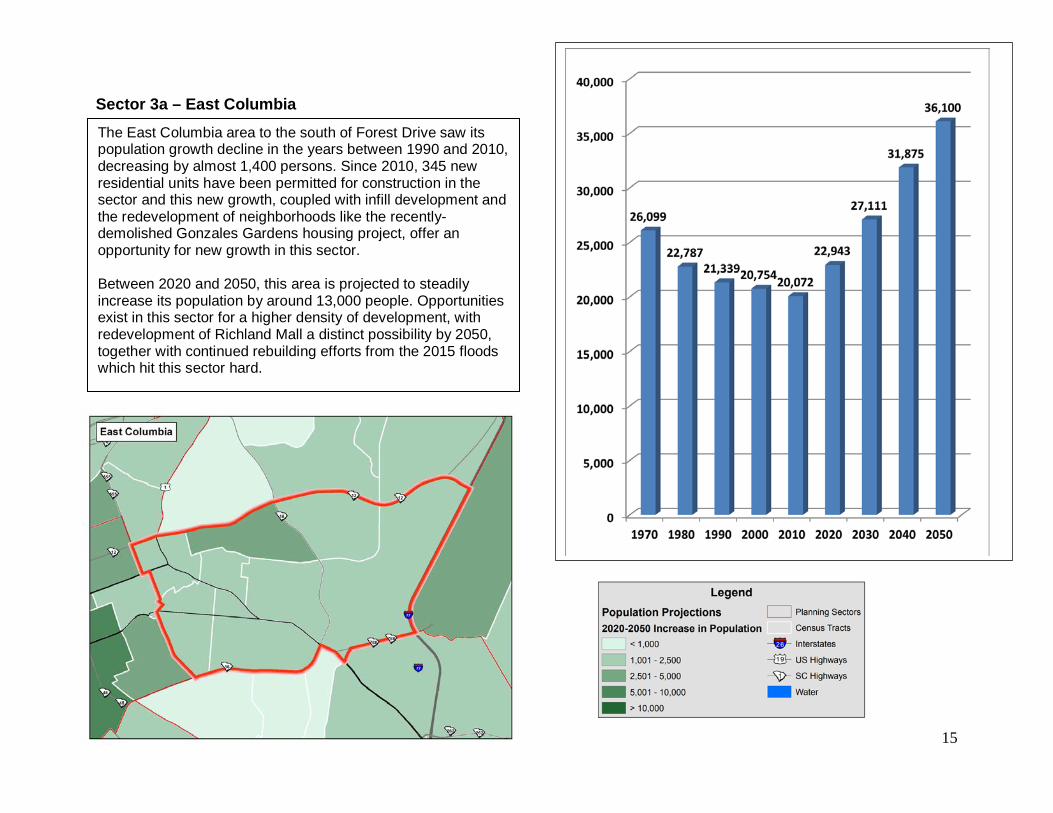
Sector 3a – East Columbia
The East Columbia area to the south of Forest Drive saw its population growth decline in the years between 1990 and 2010, decreasing by almost 1,400 persons. Since 2010, 345 new residential units have been permitted for construction in the sector and this new growth, coupled with infill development and the redevelopment of neighborhoods like the recently-demolished Gonzales Gardens housing project, offer an opportunity for new growth in this sector. Between 2020 and 2050, this area is projected to steadily increase its population by around 13,000 people. Opportunities exist in this sector for a higher density of development, with redevelopment of Richland Mall a distinct possibility by 2050, together with continued rebuilding efforts from the 2015 floods which hit this sector hard.
16
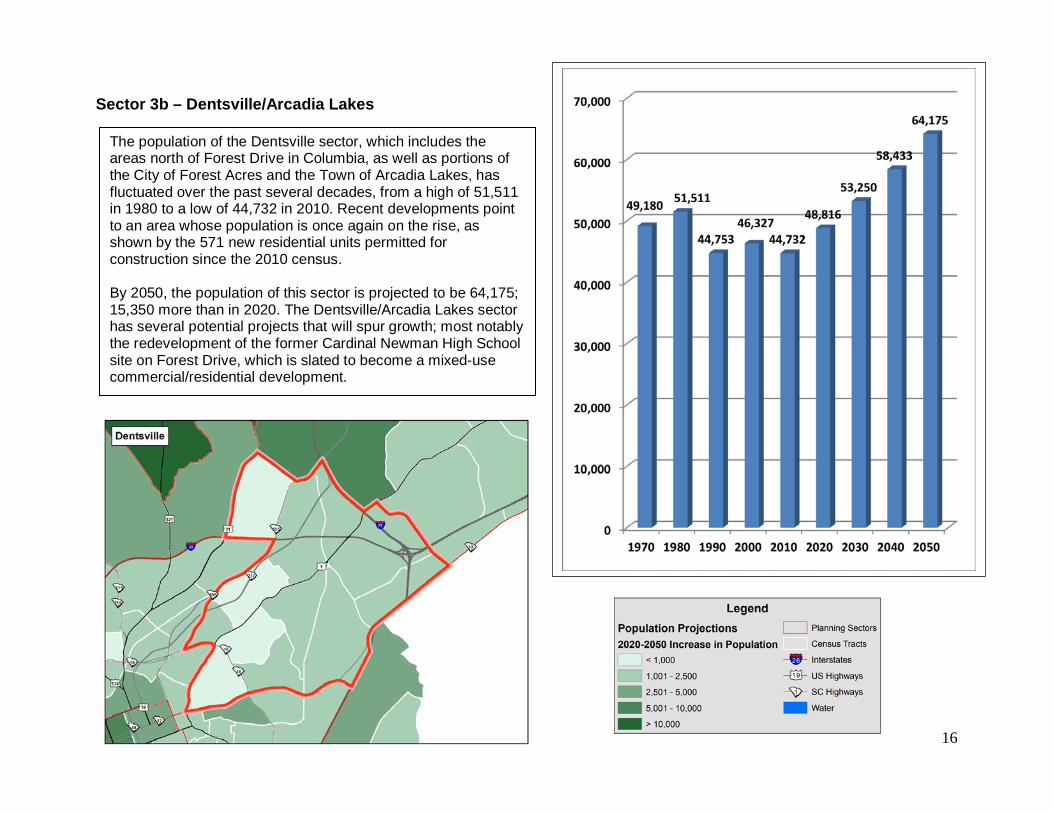
Sector 3b – Dentsville/Arcadia Lakes
The population of the Dentsville sector, which includes the areas north of Forest Drive in Columbia, as well as portions of the City of Forest Acres and the Town of Arcadia Lakes, has fluctuated over the past several decades, from a high of 51,511 in 1980 to a low of 44,732 in 2010. Recent developments point to an area whose population is once again on the rise, as shown by the 571 new residential units permitted for construction since the 2010 census. By 2050, the population of this sector is projected to be 64,175; 15,350 more than in 2020. The Dentsville/Arcadia Lakes sector has several potential projects that will spur growth; most notably the redevelopment of the former Cardinal Newman High School site on Forest Drive, which is slated to become a mixed-use commercial/residential development.
17
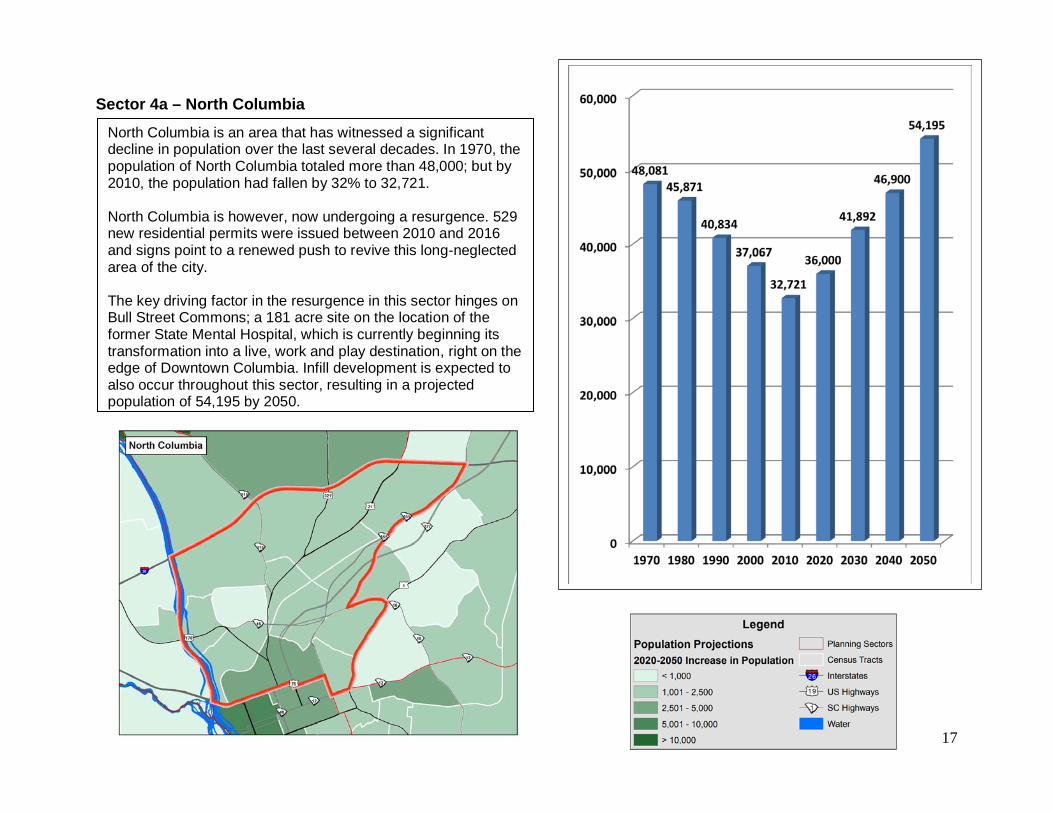
Sector 4a – North Columbia
North Columbia is an area that has witnessed a significant decline in population over the last several decades. In 1970, the population of North Columbia totaled more than 48,000; but by 2010, the population had fallen by 32% to 32,721. North Columbia is however, now undergoing a resurgence. 529 new residential permits were issued between 2010 and 2016 and signs point to a renewed push to revive this long-neglected area of the city. The key driving factor in the resurgence in this sector hinges on Bull Street Commons; a 181 acre site on the location of the former State Mental Hospital, which is currently beginning its transformation into a live, work and play destination, right on the edge of Downtown Columbia. Infill development is expected to also occur throughout this sector, resulting in a projected population of 54,195 by 2050.
18
Sector 4b – Cedar Creek
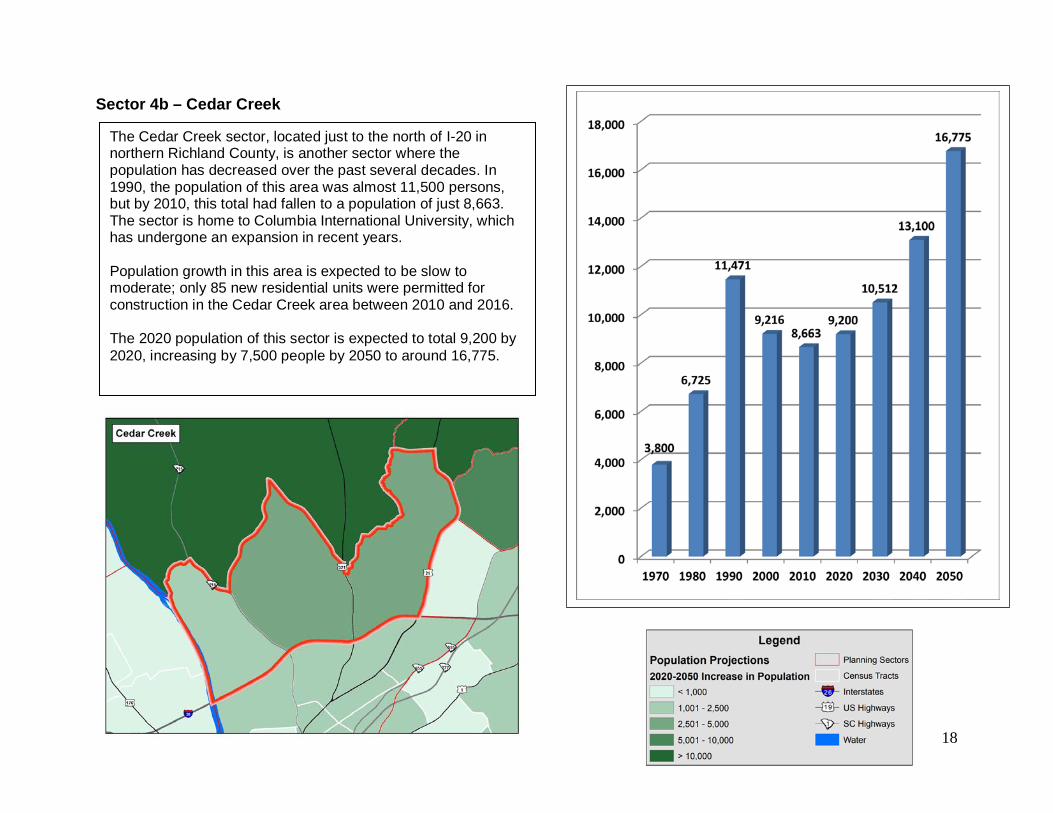
The Cedar Creek sector, located just to the north of I-20 in northern Richland County, is another sector where the population has decreased over the past several decades. In 1990, the population of this area was almost 11,500 persons, but by 2010, this total had fallen to a population of just 8,663. The sector is home to Columbia International University, which has undergone an expansion in recent years. Population growth in this area is expected to be slow to moderate; only 85 new residential units were permitted for construction in the Cedar Creek area between 2010 and 2016. The 2020 population of this sector is expected to total 9,200 by 2020, increasing by 7,500 people by 2050 to around 16,775.
19
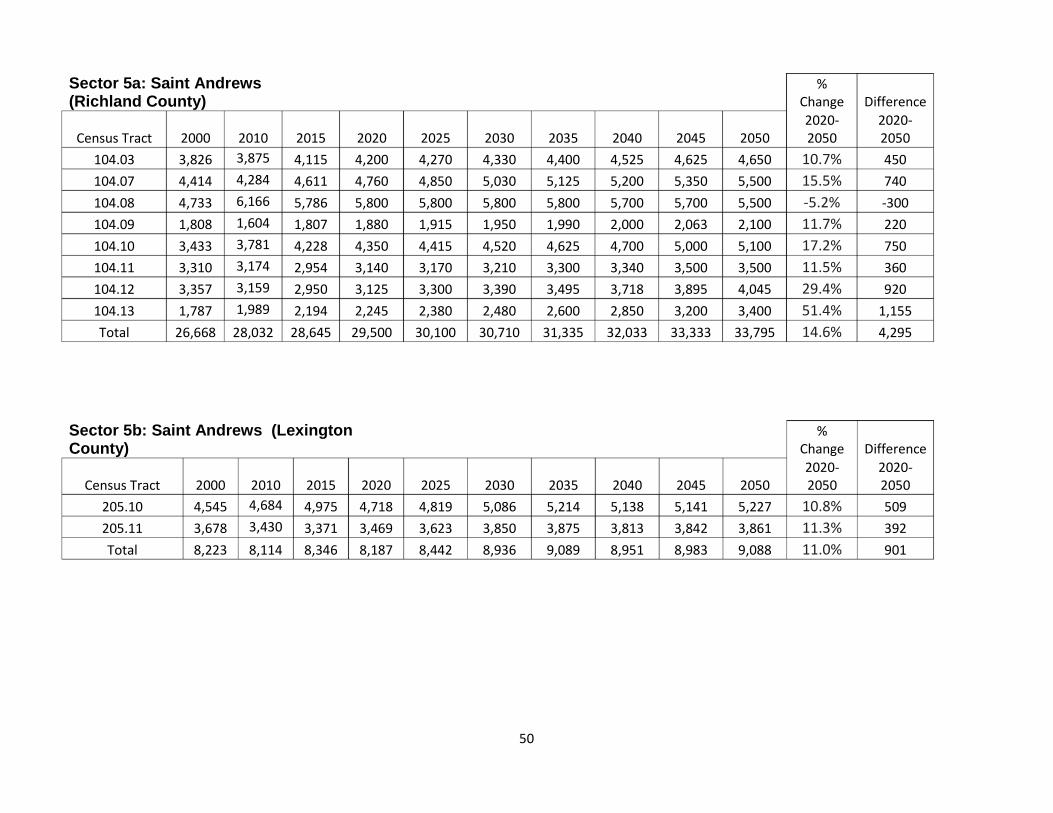
Sector 5a – St. Andrews (Richland)
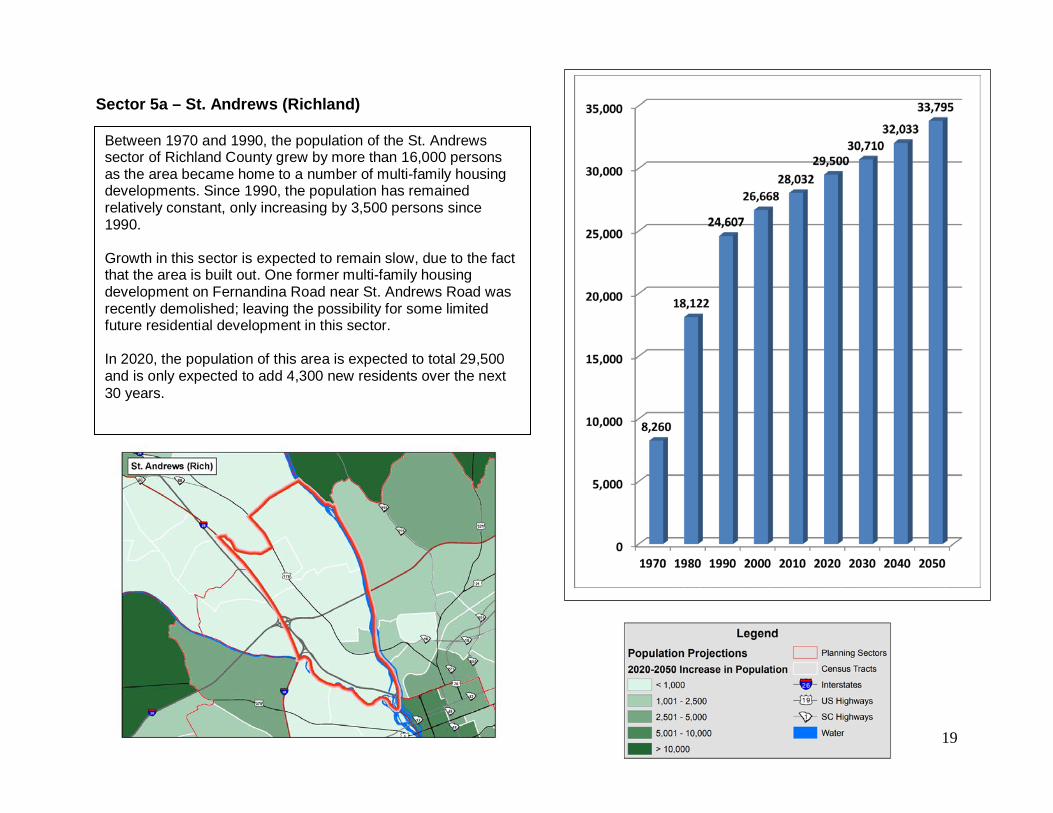
Between 1970 and 1990, the population of the St. Andrews sector of Richland County grew by more than 16,000 persons as the area became home to a number of multi-family housing developments. Since 1990, the population has remained relatively constant, only increasing by 3,500 persons since 1990. Growth in this sector is expected to remain slow, due to the fact that the area is built out. One former multi-family housing development on Fernandina Road near St. Andrews Road was recently demolished; leaving the possibility for some limited future residential development in this sector. In 2020, the population of this area is expected to total 29,500 and is only expected to add 4,300 new residents over the next 30 years.
20
Sector 5b – St. Andrews (Lexington)
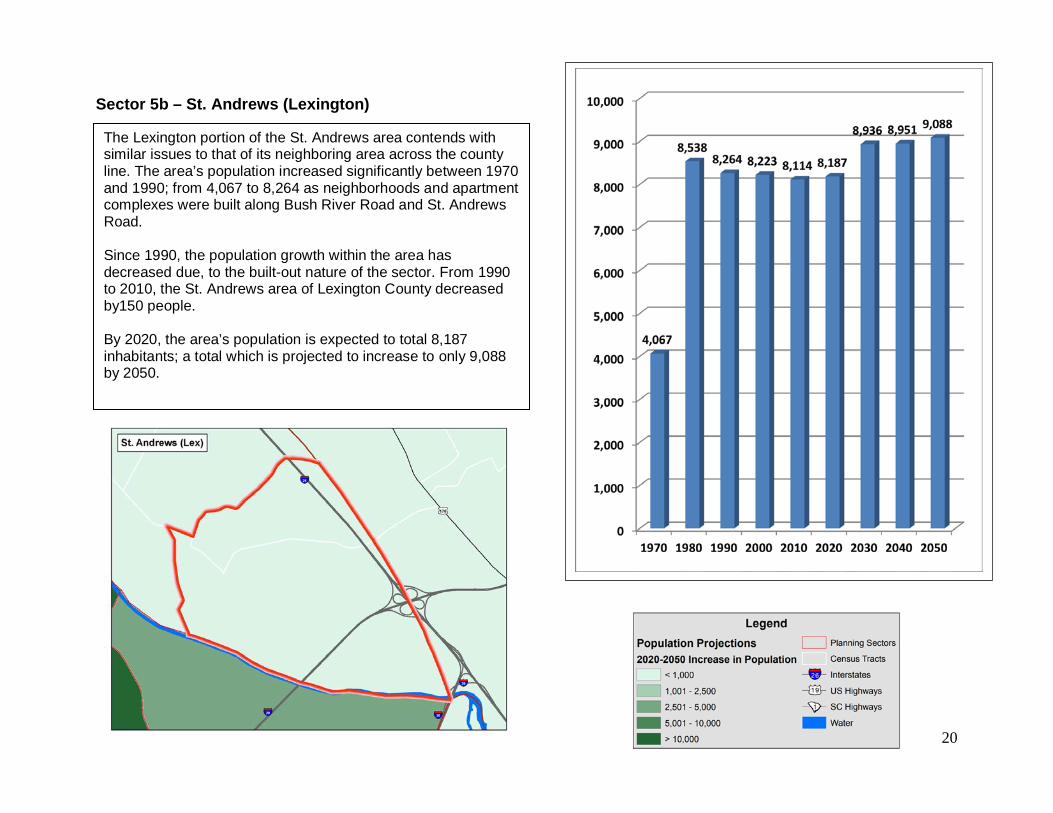
The Lexington portion of the St. Andrews area contends with similar issues to that of its neighboring area across the county line. The area’s population increased significantly between 1970 and 1990; from 4,067 to 8,264 as neighborhoods and apartment complexes were built along Bush River Road and St. Andrews Road. Since 1990, the population growth within the area has decreased due, to the built-out nature of the sector. From 1990 to 2010, the St. Andrews area of Lexington County decreased by150 people. By 2020, the area’s population is expected to total 8,187 inhabitants; a total which is projected to increase to only 9,088 by 2050.
21
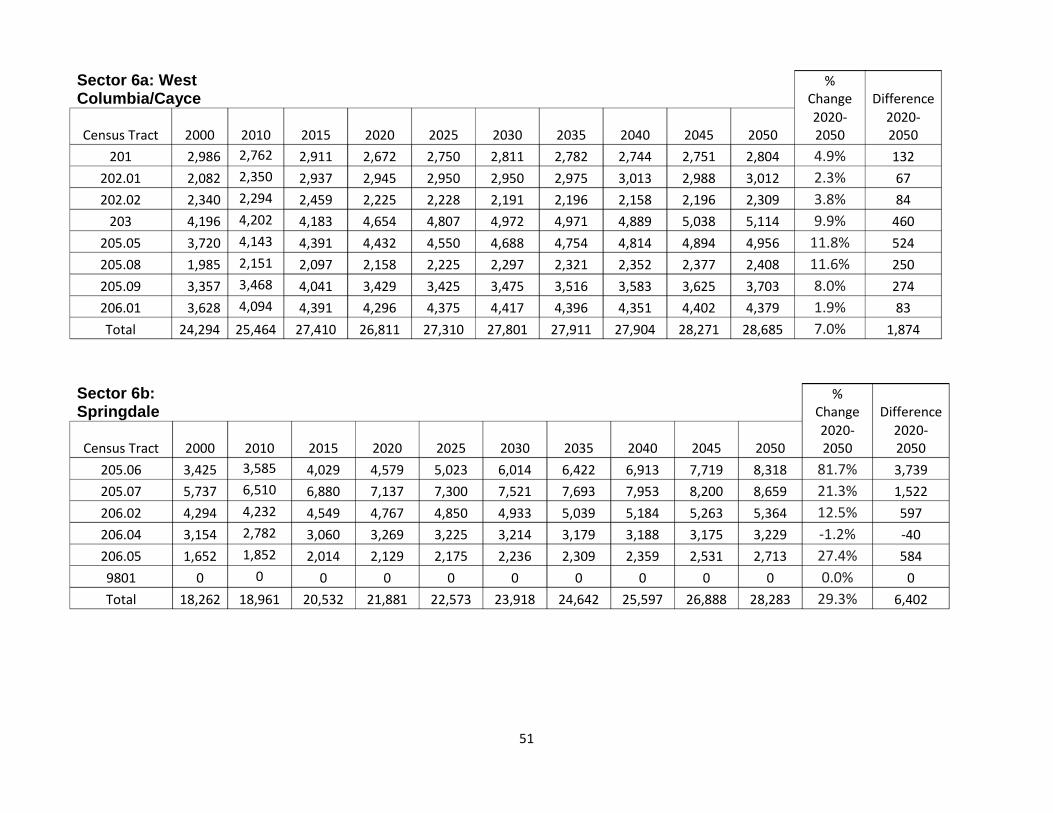
Sector 6a – West Columbia/Cayce
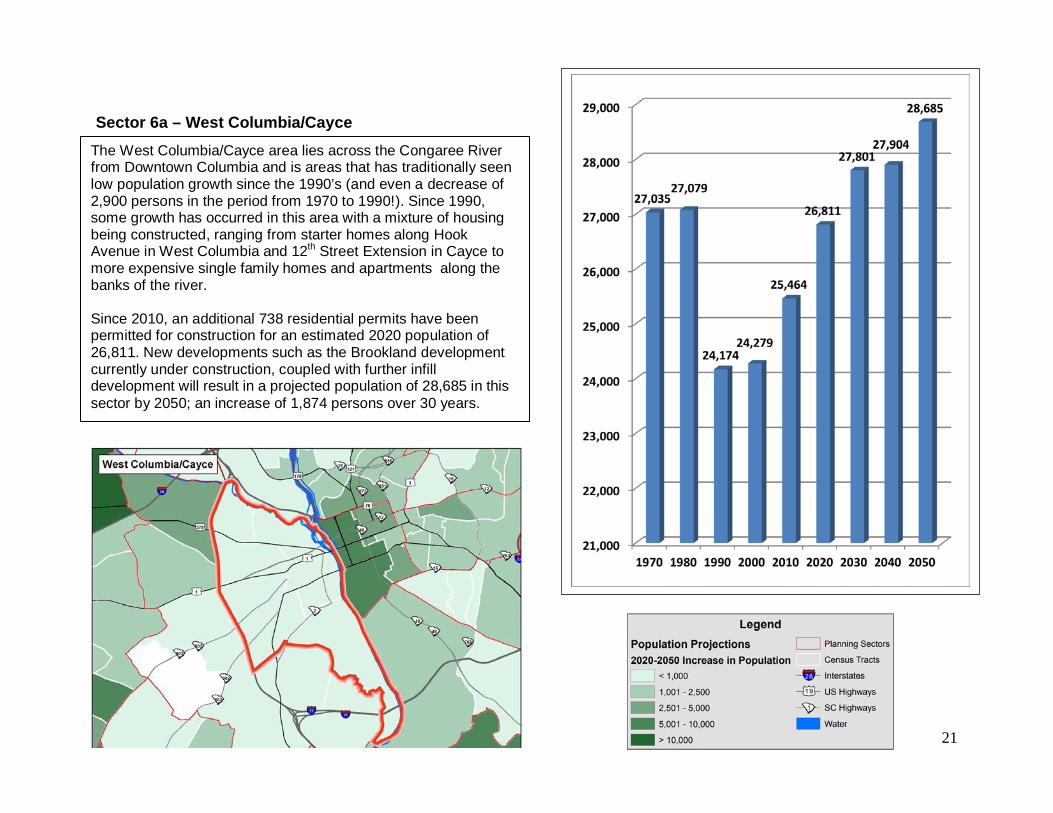
The West Columbia/Cayce area lies across the Congaree River from Downtown Columbia and is areas that has traditionally seen low population growth since the 1990’s (and even a decrease of 2,900 persons in the period from 1970 to 1990!). Since 1990, some growth has occurred in this area with a mixture of housing being constructed, ranging from starter homes along Hook Avenue in West Columbia and 12th Street Extension in Cayce to more expensive single family homes and apartments along the banks of the river. Since 2010, an additional 738 residential permits have been permitted for construction for an estimated 2020 population of 26,811. New developments such as the Brookland development currently under construction, coupled with further infill development will result in a projected population of 28,685 in this sector by 2050; an increase of 1,874 persons over 30 years.
22
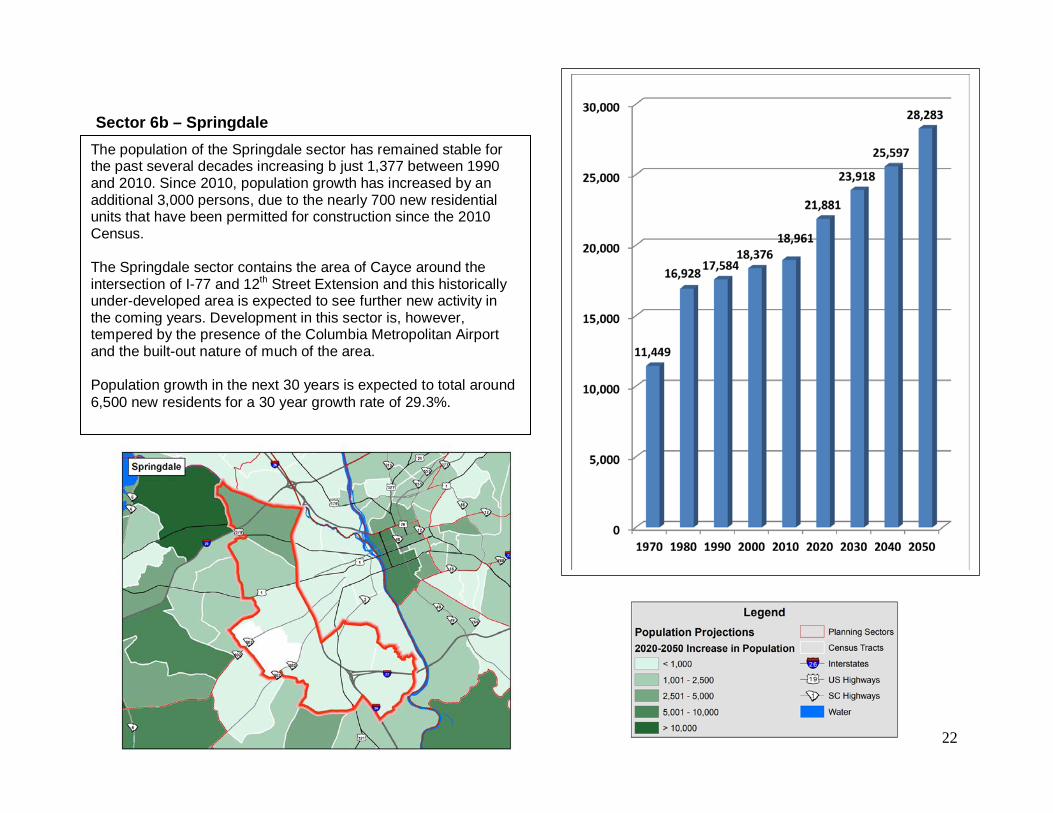
Sector 6b – Springdale
The population of the Springdale sector has remained stable for the past several decades increasing b just 1,377 between 1990 and 2010. Since 2010, population growth has increased by an additional 3,000 persons, due to the nearly 700 new residential units that have been permitted for construction since the 2010 Census. The Springdale sector contains the area of Cayce around the intersection of I-77 and 12th Street Extension and this historically under-developed area is expected to see further new activity in the coming years. Development in this sector is, however, tempered by the presence of the Columbia Metropolitan Airport and the built-out nature of much of the area. Population growth in the next 30 years is expected to total around 6,500 new residents for a 30 year growth rate of 29.3%.
23
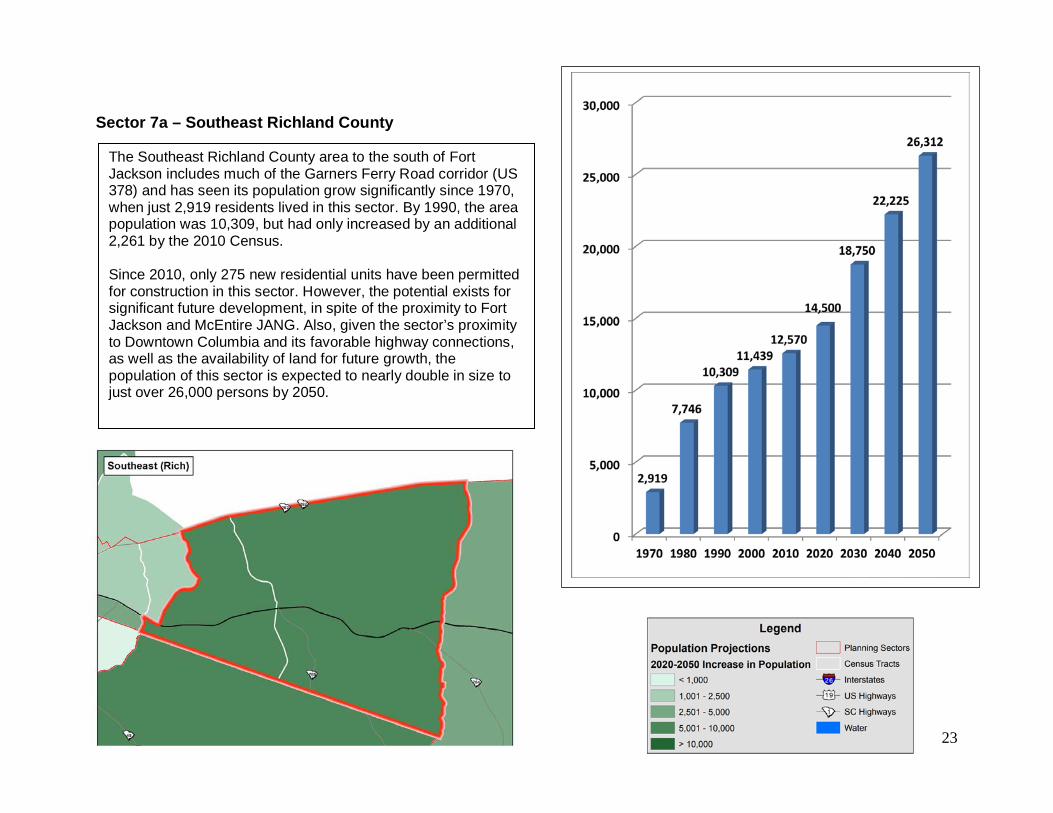
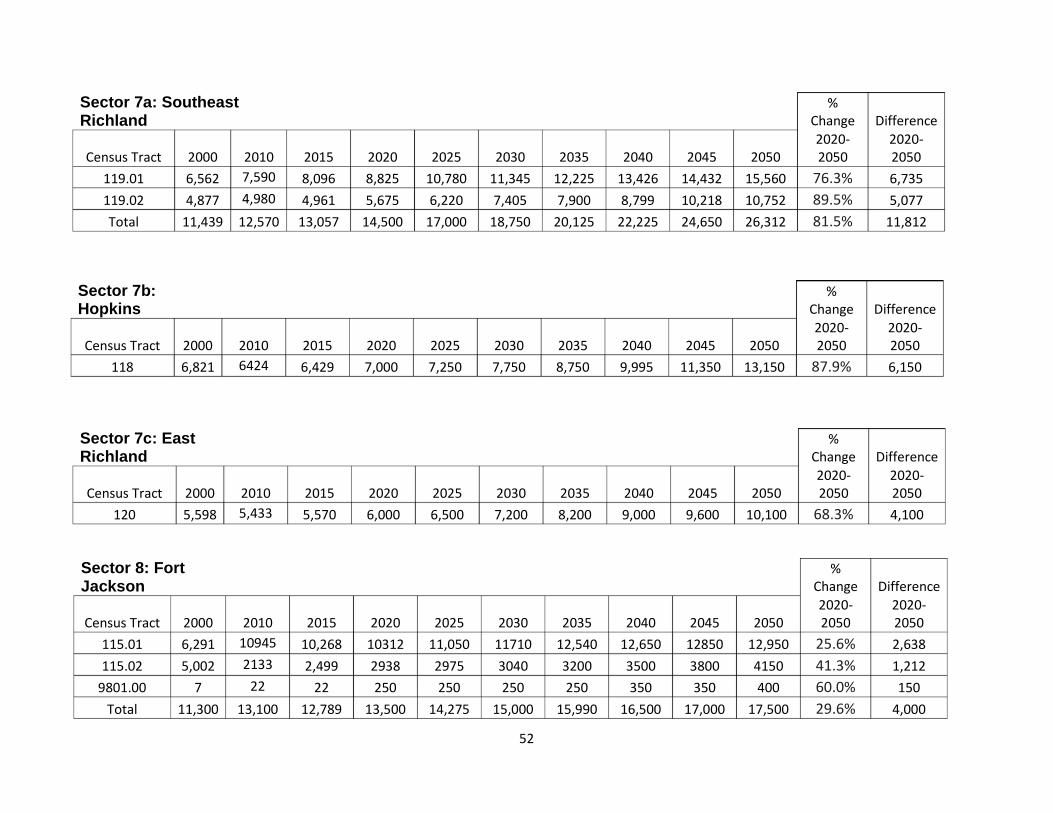
Sector 7a – Southeast Richland County
The Southeast Richland County area to the south of Fort Jackson includes much of the Garners Ferry Road corridor (US 378) and has seen its population grow significantly since 1970, when just 2,919 residents lived in this sector. By 1990, the area population was 10,309, but had only increased by an additional 2,261 by the 2010 Census. Since 2010, only 275 new residential units have been permitted for construction in this sector. However, the potential exists for significant future development, in spite of the proximity to Fort Jackson and McEntire JANG. Also, given the sector’s proximity to Downtown Columbia and its favorable highway connections, as well as the availability of land for future growth, the population of this sector is expected to nearly double in size to just over 26,000 persons by 2050.
24
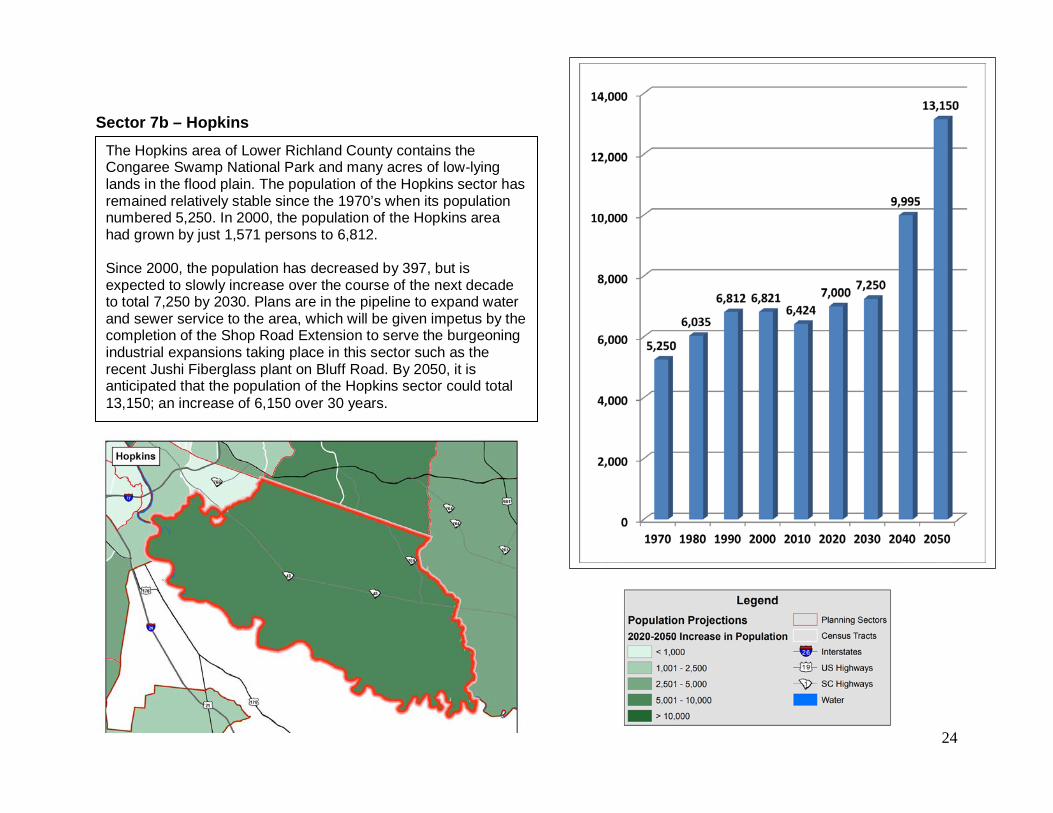
Sector 7b – Hopkins
The Hopkins area of Lower Richland County contains the Congaree Swamp National Park and many acres of low-lying lands in the flood plain. The population of the Hopkins sector has remained relatively stable since the 1970’s when its population numbered 5,250. In 2000, the population of the Hopkins area had grown by just 1,571 persons to 6,812. Since 2000, the population has decreased by 397, but is expected to slowly increase over the course of the next decade to total 7,250 by 2030. Plans are in the pipeline to expand water and sewer service to the area, which will be given impetus by the completion of the Shop Road Extension to serve the burgeoning industrial expansions taking place in this sector such as the recent Jushi Fiberglass plant on Bluff Road. By 2050, it is anticipated that the population of the Hopkins sector could total 13,150; an increase of 6,150 over 30 years.
25
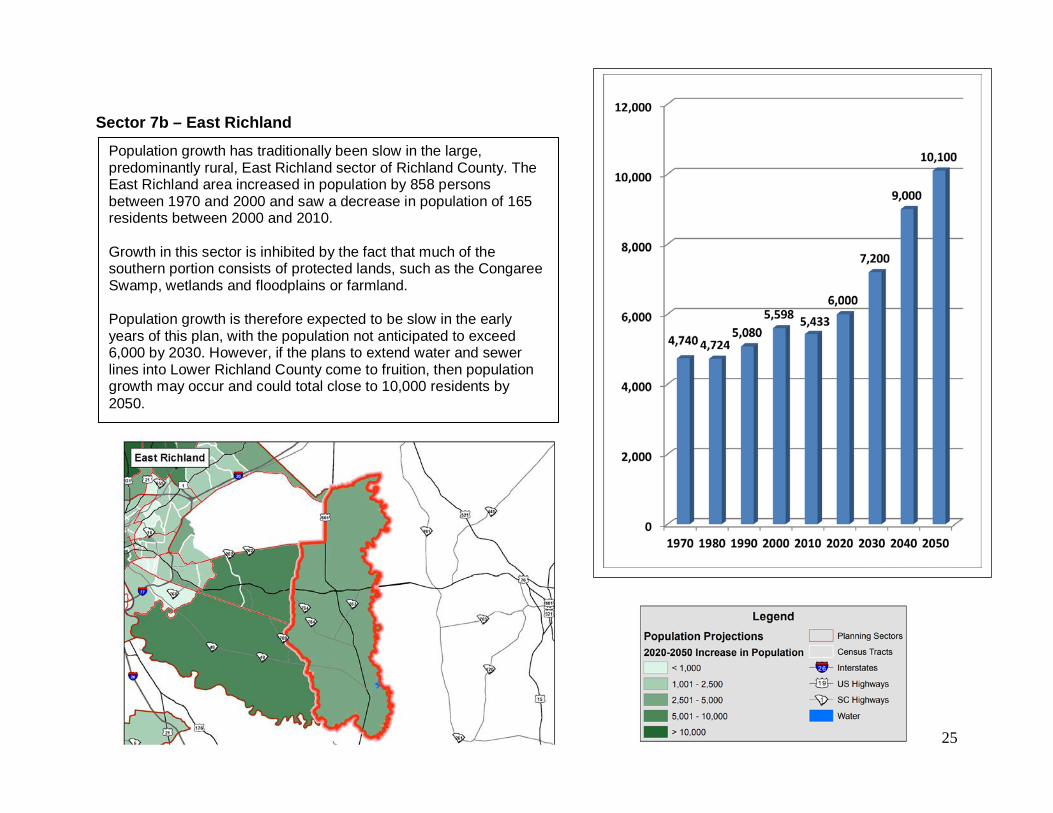
Sector 7b – East Richland
Population growth has traditionally been slow in the large, predominantly rural, East Richland sector of Richland County. The East Richland area increased in population by 858 persons between 1970 and 2000 and saw a decrease in population of 165 residents between 2000 and 2010. Growth in this sector is inhibited by the fact that much of the southern portion consists of protected lands, such as the Congaree Swamp, wetlands and floodplains or farmland. Population growth is therefore expected to be slow in the early years of this plan, with the population not anticipated to exceed 6,000 by 2030. However, if the plans to extend water and sewer lines into Lower Richland County come to fruition, then population growth may occur and could total close to 10,000 residents by 2050.
26
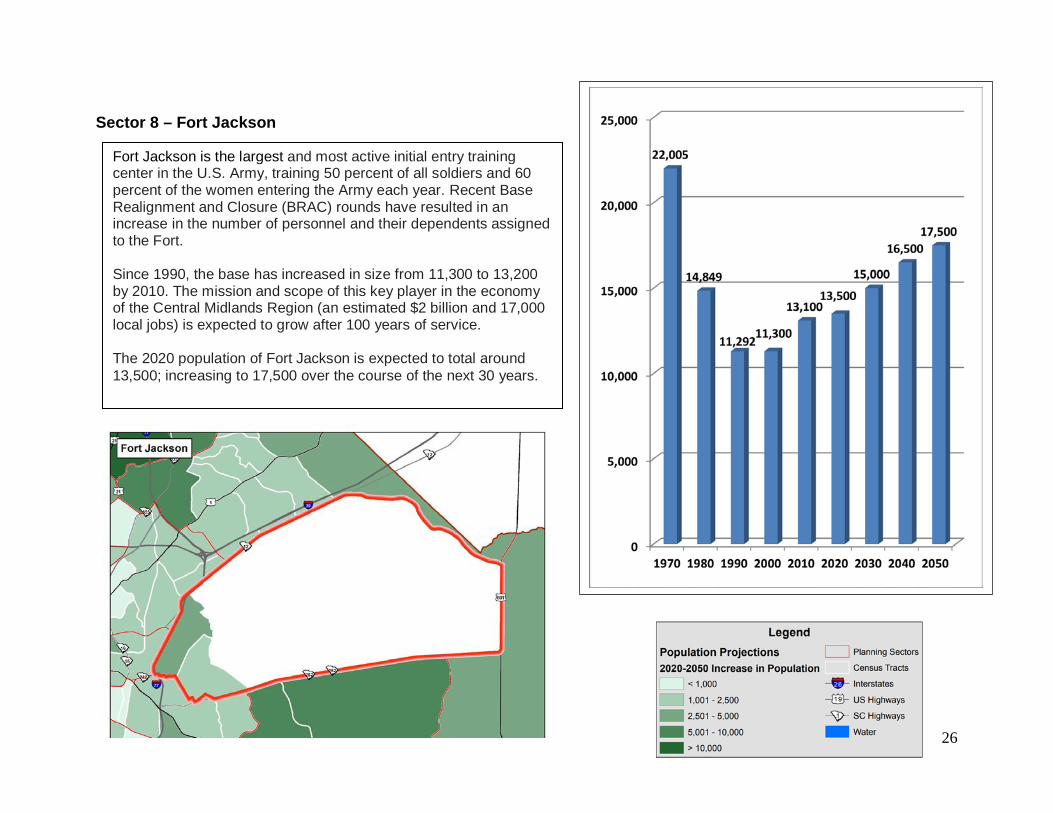
Sector 8 – Fort Jackson
Fort Jackson is the largest and most active initial entry training center in the U.S. Army, training 50 percent of all soldiers and 60 percent of the women entering the Army each year. Recent Base Realignment and Closure (BRAC) rounds have resulted in an increase in the number of personnel and their dependents assigned to the Fort. Since 1990, the base has increased in size from 11,300 to 13,200 by 2010. The mission and scope of this key player in the economy of the Central Midlands Region (an estimated $2 billion and 17,000 local jobs) is expected to grow after 100 years of service. The 2020 population of Fort Jackson is expected to total around 13,500; increasing to 17,500 over the course of the next 30 years.
27
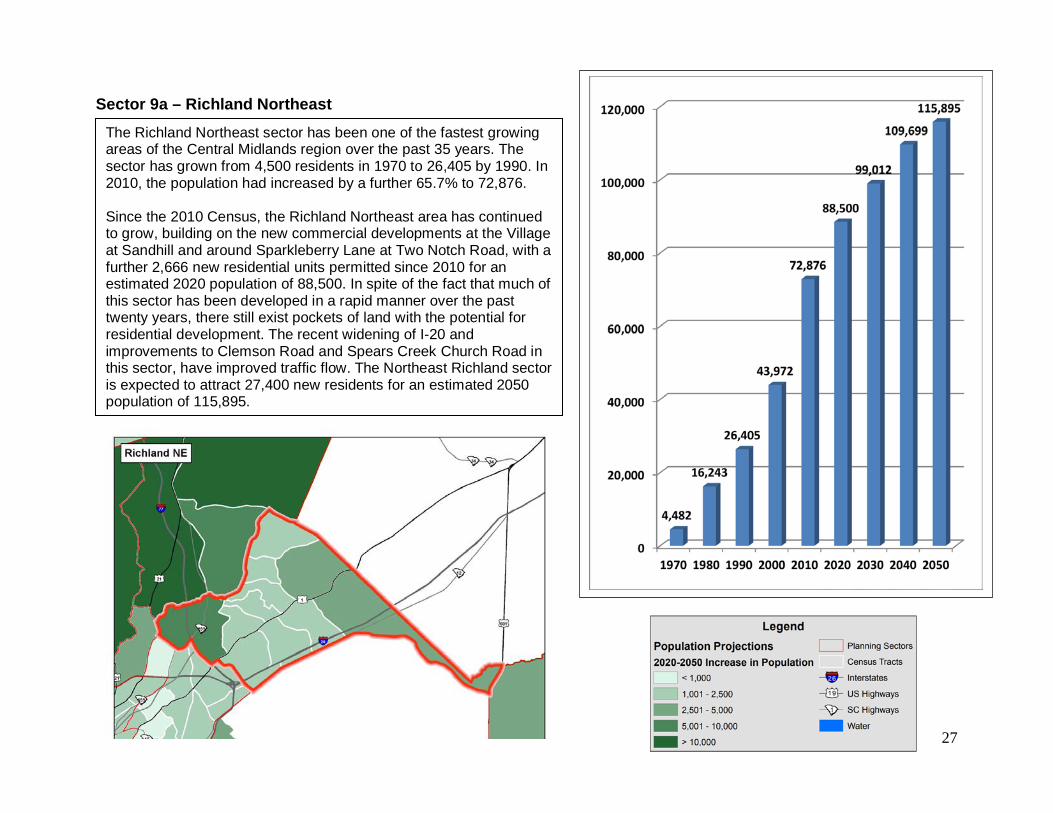
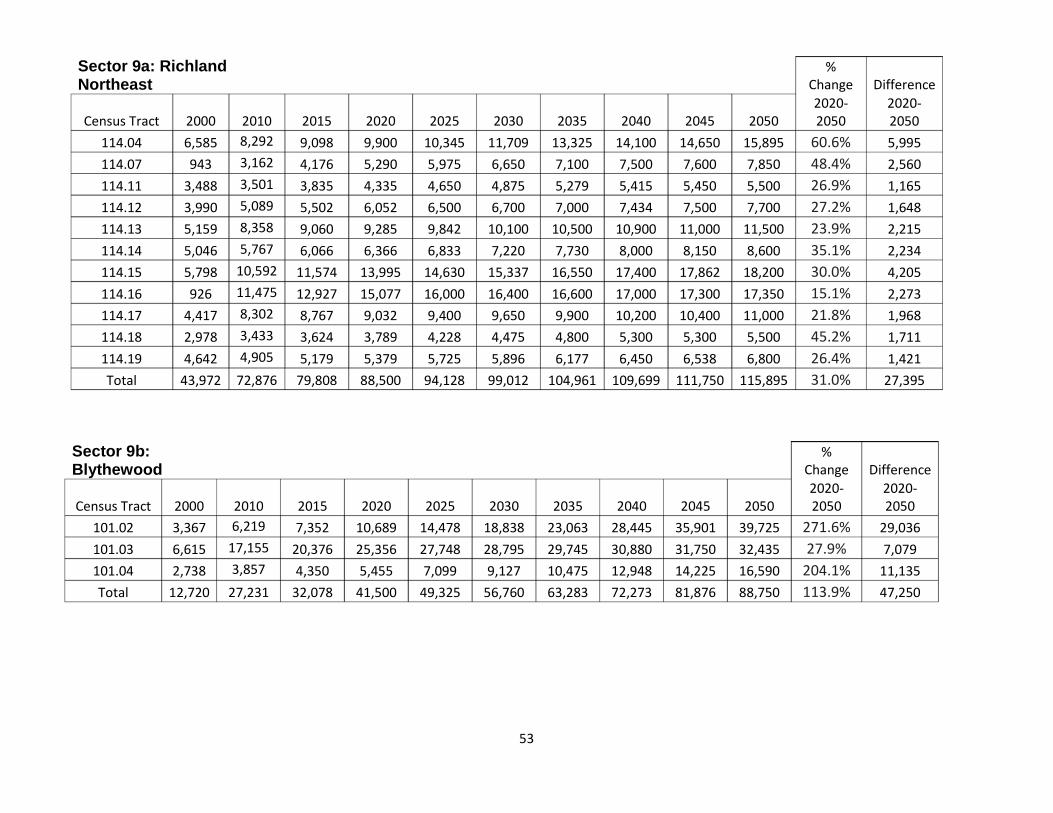
Sector 9a – Richland Northeast
The Richland Northeast sector has been one of the fastest growing areas of the Central Midlands region over the past 35 years. The sector has grown from 4,500 residents in 1970 to 26,405 by 1990. In 2010, the population had increased by a further 65.7% to 72,876. Since the 2010 Census, the Richland Northeast area has continued to grow, building on the new commercial developments at the Village at Sandhill and around Sparkleberry Lane at Two Notch Road, with a further 2,666 new residential units permitted since 2010 for an estimated 2020 population of 88,500. In spite of the fact that much of this sector has been developed in a rapid manner over the past twenty years, there still exist pockets of land with the potential for residential development. The recent widening of I-20 and improvements to Clemson Road and Spears Creek Church Road in this sector, have improved traffic flow. The Northeast Richland sector is expected to attract 27,400 new residents for an estimated 2050 population of 115,895.
28
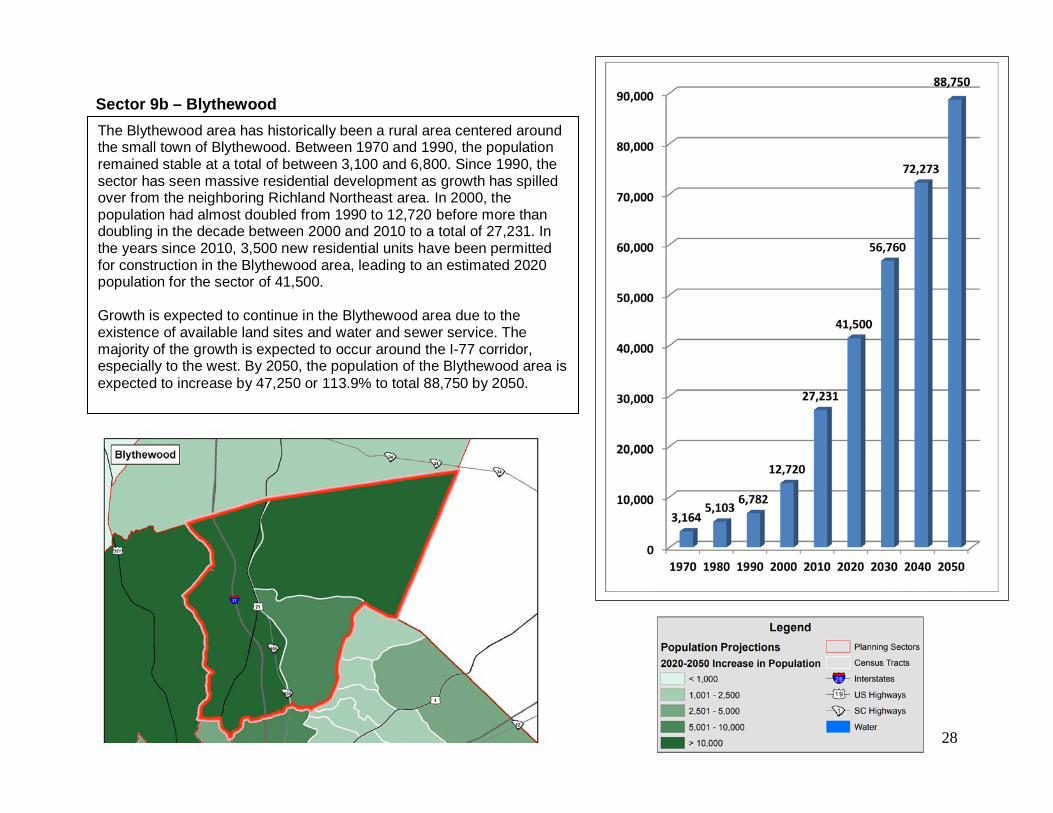
Sector 9b – Blythewood
The Blythewood area has historically been a rural area centered around the small town of Blythewood. Between 1970 and 1990, the population remained stable at a total of between 3,100 and 6,800. Since 1990, the sector has seen massive residential development as growth has spilled over from the neighboring Richland Northeast area. In 2000, the population had almost doubled from 1990 to 12,720 before more than doubling in the decade between 2000 and 2010 to a total of 27,231. In the years since 2010, 3,500 new residential units have been permitted for construction in the Blythewood area, leading to an estimated 2020 population for the sector of 41,500. Growth is expected to continue in the Blythewood area due to the existence of available land sites and water and sewer service. The majority of the growth is expected to occur around the I-77 corridor, especially to the west. By 2050, the population of the Blythewood area is expected to increase by 47,250 or 113.9% to total 88,750 by 2050.
29
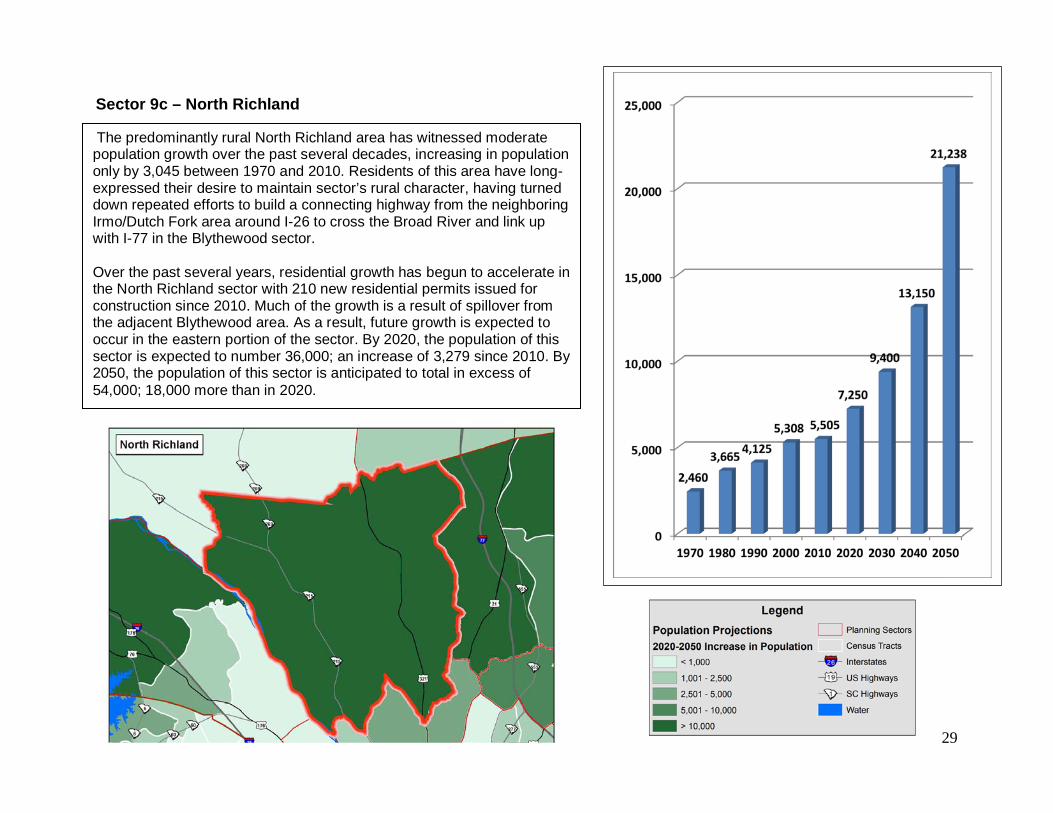
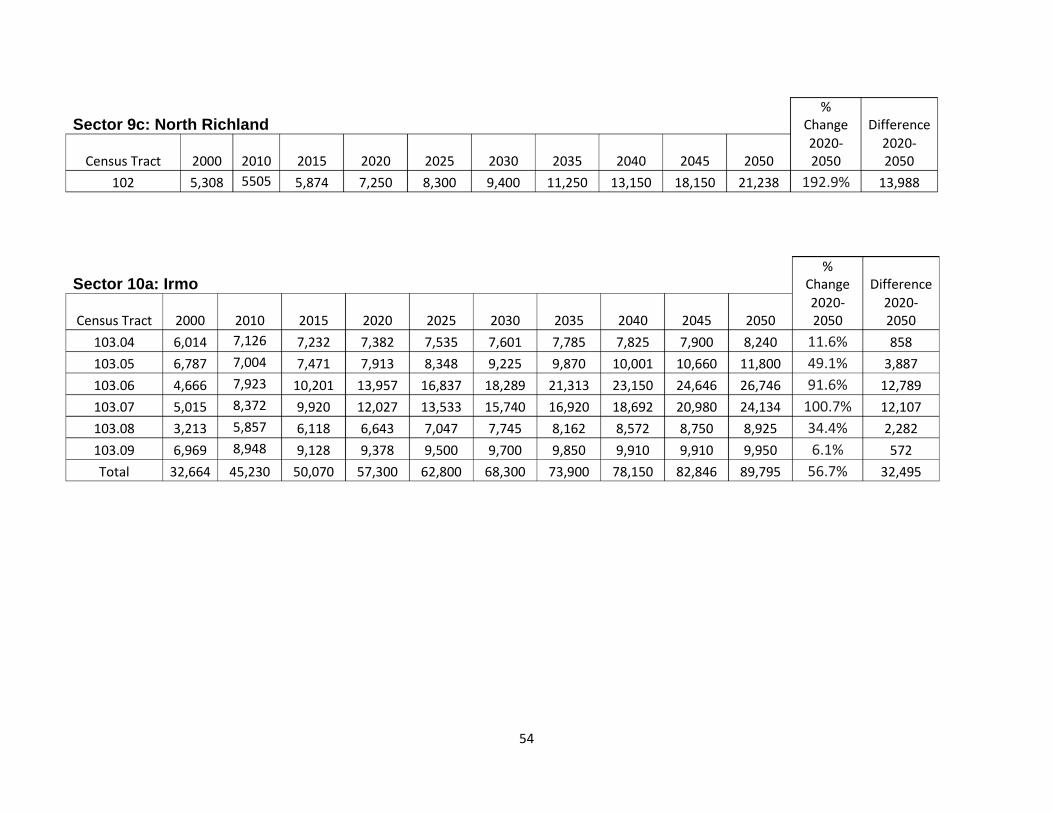
Sector 9c – North Richland
The predominantly rural North Richland area has witnessed moderate population growth over the past several decades, increasing in population only by 3,045 between 1970 and 2010. Residents of this area have long-expressed their desire to maintain sector’s rural character, having turned down repeated efforts to build a connecting highway from the neighboring Irmo/Dutch Fork area around I-26 to cross the Broad River and link up with I-77 in the Blythewood sector. Over the past several years, residential growth has begun to accelerate in the North Richland sector with 210 new residential permits issued for construction since 2010. Much of the growth is a result of spillover from the adjacent Blythewood area. As a result, future growth is expected to occur in the eastern portion of the sector. By 2020, the population of this sector is expected to number 36,000; an increase of 3,279 since 2010. By 2050, the population of this sector is anticipated to total in excess of 54,000; 18,000 more than in 2020.
30
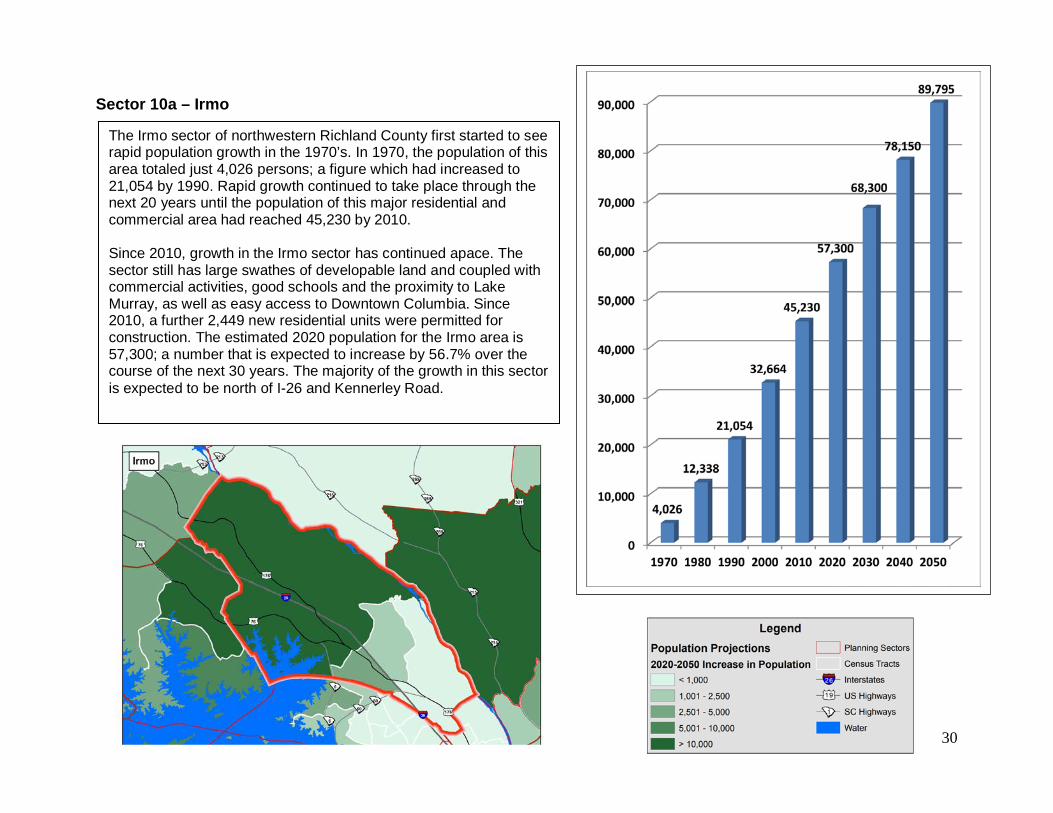
Sector 10a – Irmo
The Irmo sector of northwestern Richland County first started to see rapid population growth in the 1970’s. In 1970, the population of this area totaled just 4,026 persons; a figure which had increased to 21,054 by 1990. Rapid growth continued to take place through the next 20 years until the population of this major residential and commercial area had reached 45,230 by 2010. Since 2010, growth in the Irmo sector has continued apace. The sector still has large swathes of developable land and coupled with commercial activities, good schools and the proximity to Lake Murray, as well as easy access to Downtown Columbia. Since 2010, a further 2,449 new residential units were permitted for construction. The estimated 2020 population for the Irmo area is 57,300; a number that is expected to increase by 56.7% over the course of the next 30 years. The majority of the growth in this sector is expected to be north of I-26 and Kennerley Road.
31
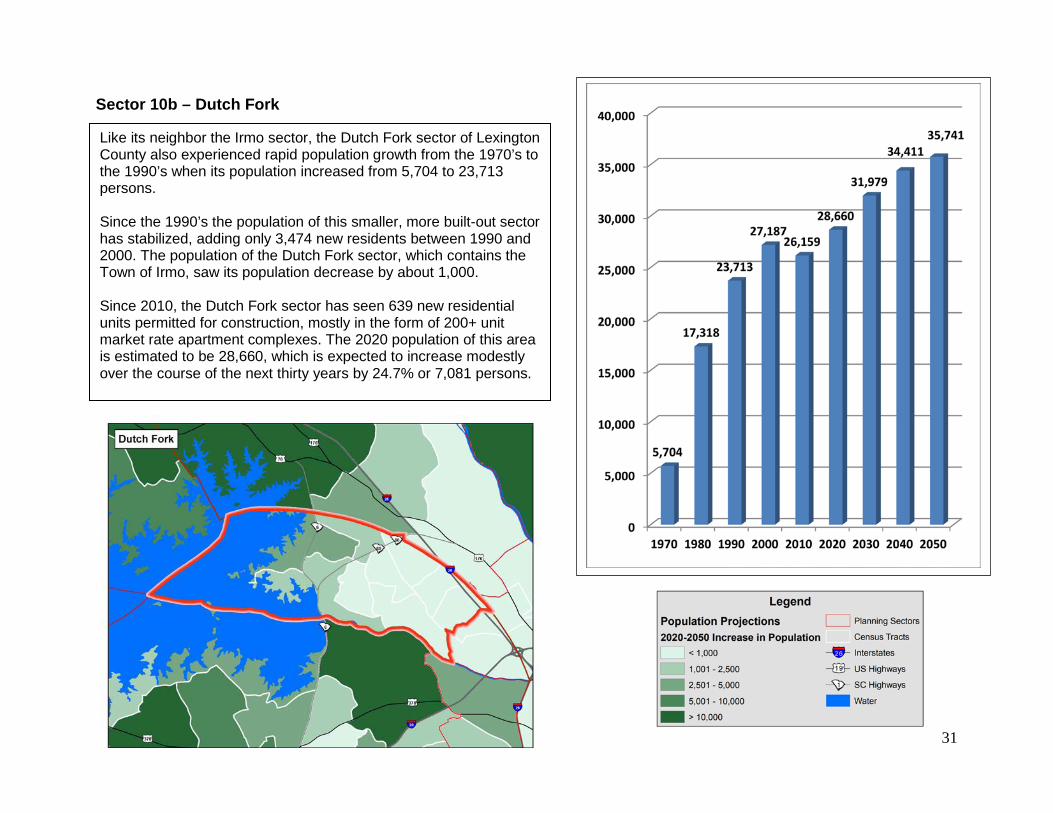
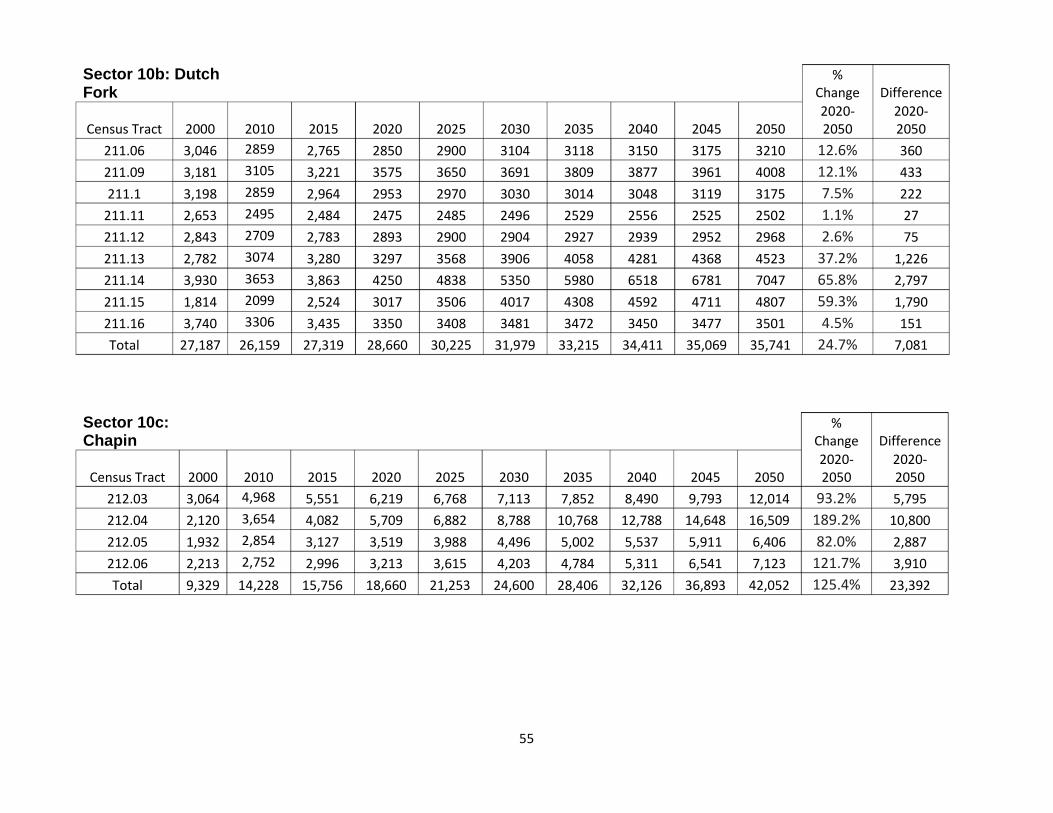
Sector 10b – Dutch Fork
Like its neighbor the Irmo sector, the Dutch Fork sector of Lexington County also experienced rapid population growth from the 1970’s to the 1990’s when its population increased from 5,704 to 23,713 persons. Since the 1990’s the population of this smaller, more built-out sector has stabilized, adding only 3,474 new residents between 1990 and 2000. The population of the Dutch Fork sector, which contains the Town of Irmo, saw its population decrease by about 1,000. Since 2010, the Dutch Fork sector has seen 639 new residential units permitted for construction, mostly in the form of 200+ unit market rate apartment complexes. The 2020 population of this area is estimated to be 28,660, which is expected to increase modestly over the course of the next thirty years by 24.7% or 7,081 persons.
32
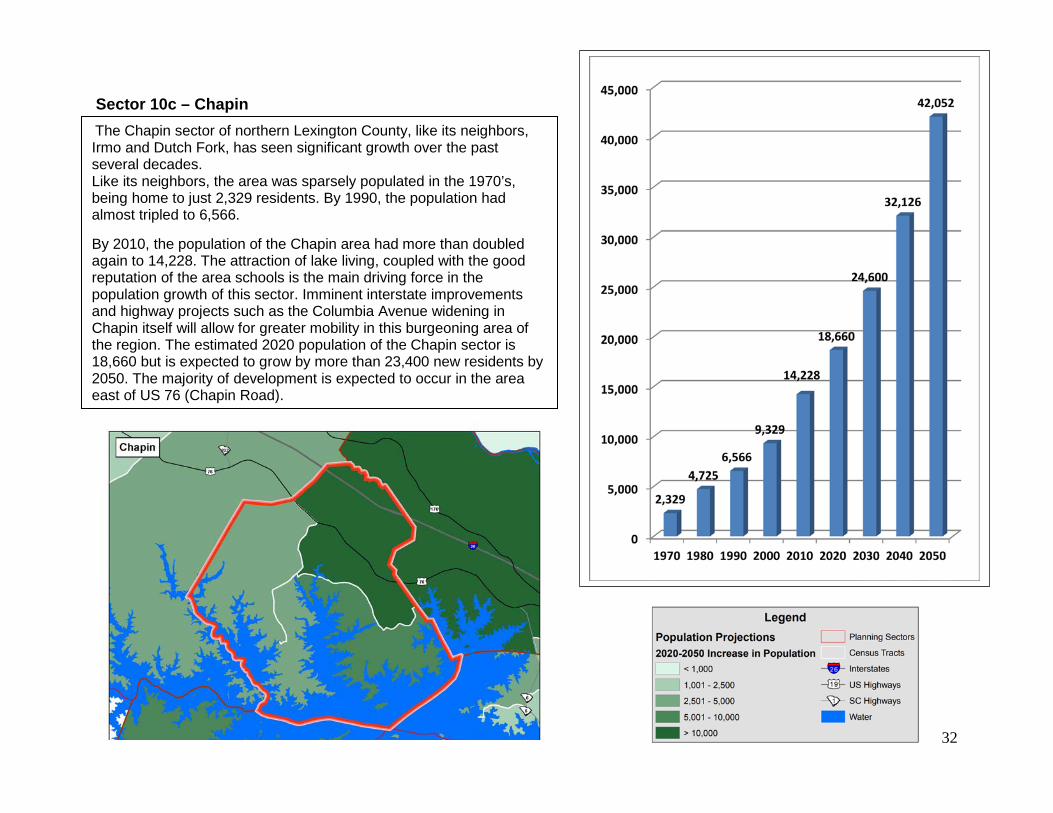
Sector 10c – Chapin
The Chapin sector of northern Lexington County, like its neighbors, Irmo and Dutch Fork, has seen significant growth over the past several decades. Like its neighbors, the area was sparsely populated in the 1970’s, being home to just 2,329 residents. By 1990, the population had almost tripled to 6,566. By 2010, the population of the Chapin area had more than doubled again to 14,228. The attraction of lake living, coupled with the good reputation of the area schools is the main driving force in the population growth of this sector. Imminent interstate improvements and highway projects such as the Columbia Avenue widening in Chapin itself will allow for greater mobility in this burgeoning area of the region. The estimated 2020 population of the Chapin sector is 18,660 but is expected to grow by more than 23,400 new residents by 2050. The majority of development is expected to occur in the area east of US 76 (Chapin Road).
33
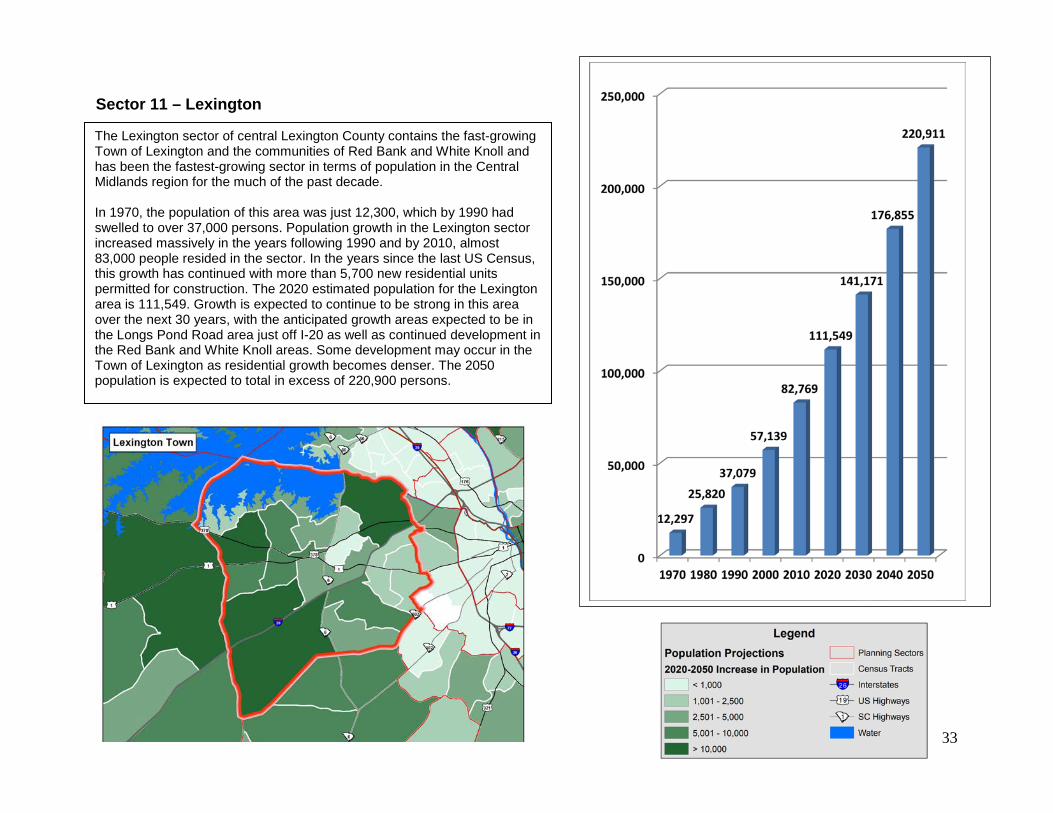
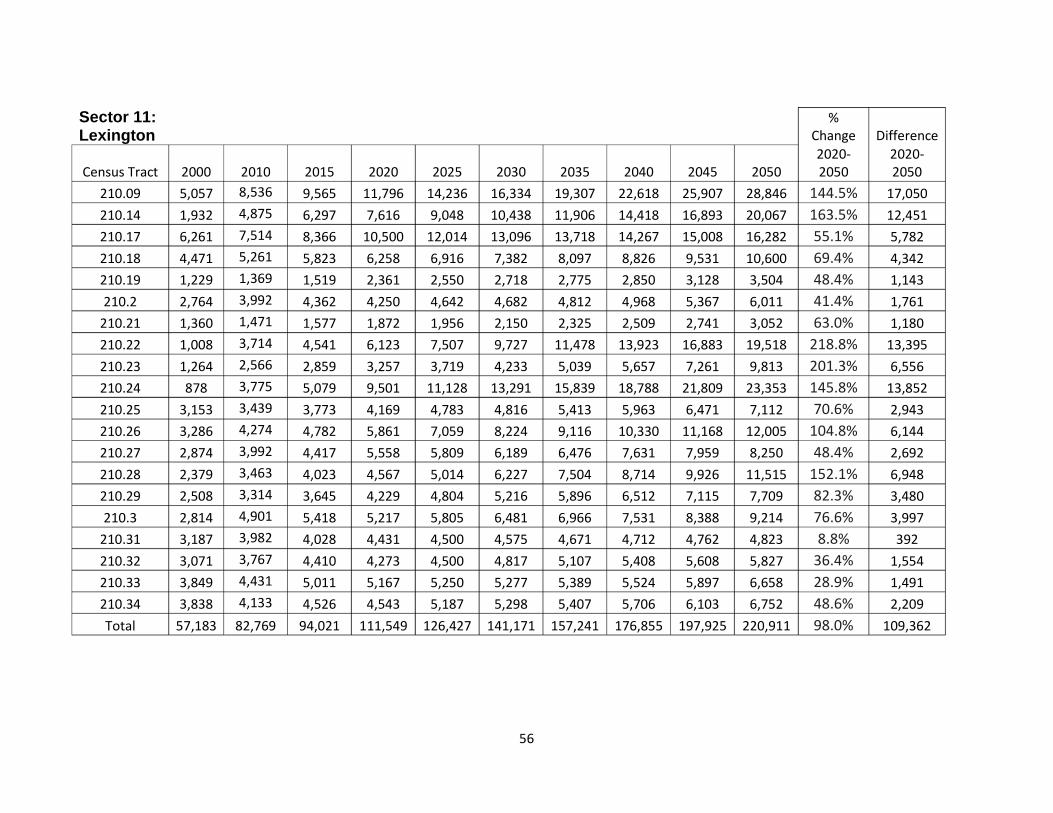
Sector 11 – Lexington
The Lexington sector of central Lexington County contains the fast-growing Town of Lexington and the communities of Red Bank and White Knoll and has been the fastest-growing sector in terms of population in the Central Midlands region for the much of the past decade. In 1970, the population of this area was just 12,300, which by 1990 had swelled to over 37,000 persons. Population growth in the Lexington sector increased massively in the years following 1990 and by 2010, almost 83,000 people resided in the sector. In the years since the last US Census, this growth has continued with more than 5,700 new residential units permitted for construction. The 2020 estimated population for the Lexington area is 111,549. Growth is expected to continue to be strong in this area over the next 30 years, with the anticipated growth areas expected to be in the Longs Pond Road area just off I-20 as well as continued development in the Red Bank and White Knoll areas. Some development may occur in the Town of Lexington as residential growth becomes denser. The 2050 population is expected to total in excess of 220,900 persons.
34
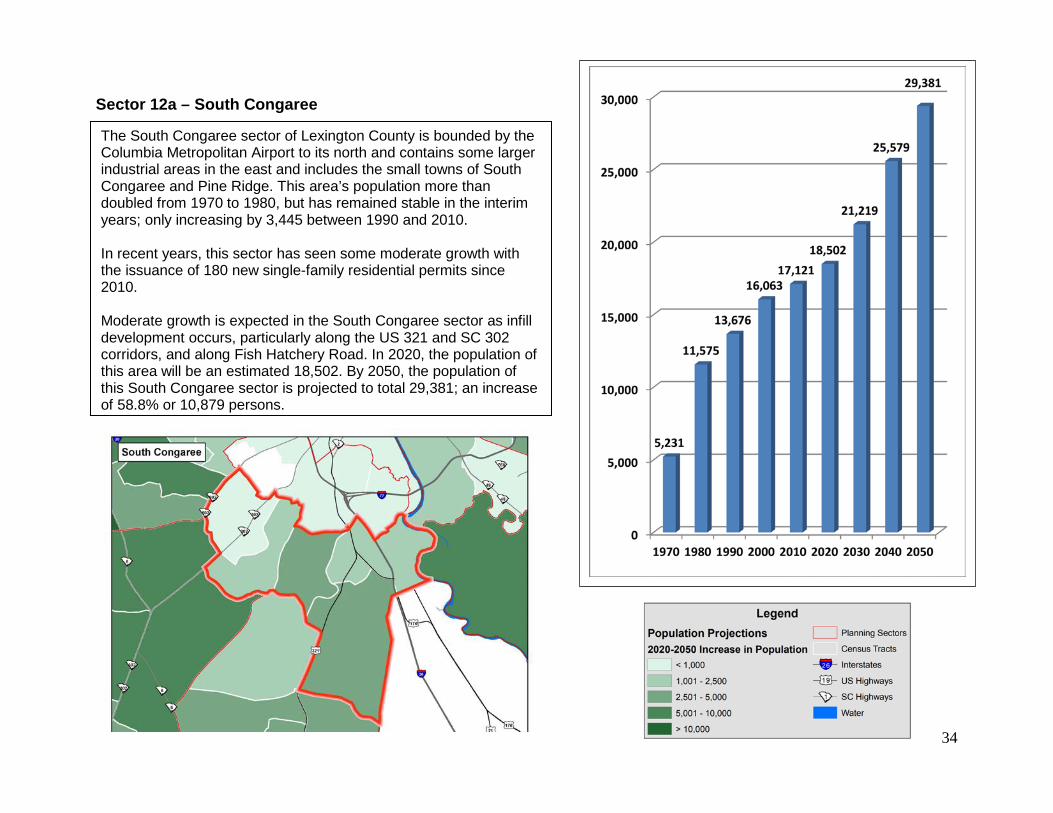
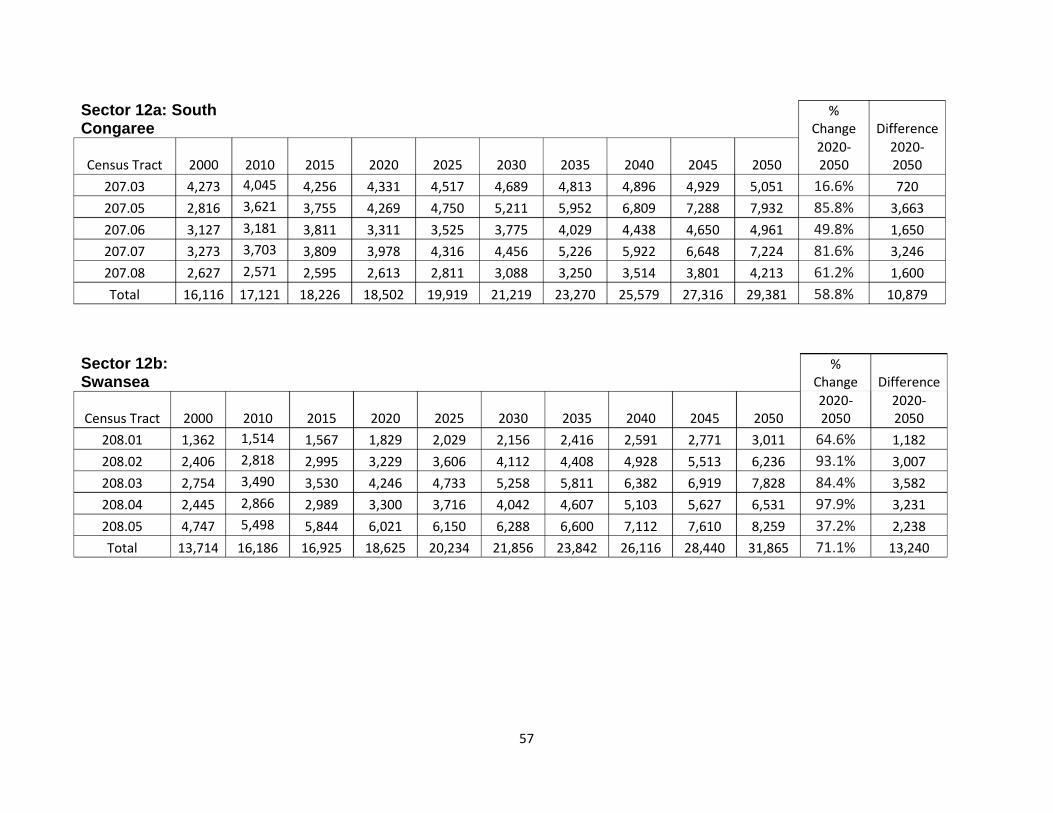
Sector 12a – South Congaree
The South Congaree sector of Lexington County is bounded by the Columbia Metropolitan Airport to its north and contains some larger industrial areas in the east and includes the small towns of South Congaree and Pine Ridge. This area’s population more than doubled from 1970 to 1980, but has remained stable in the interim years; only increasing by 3,445 between 1990 and 2010. In recent years, this sector has seen some moderate growth with the issuance of 180 new single-family residential permits since 2010. Moderate growth is expected in the South Congaree sector as infill development occurs, particularly along the US 321 and SC 302 corridors, and along Fish Hatchery Road. In 2020, the population of this area will be an estimated 18,502. By 2050, the population of this South Congaree sector is projected to total 29,381; an increase of 58.8% or 10,879 persons.
35
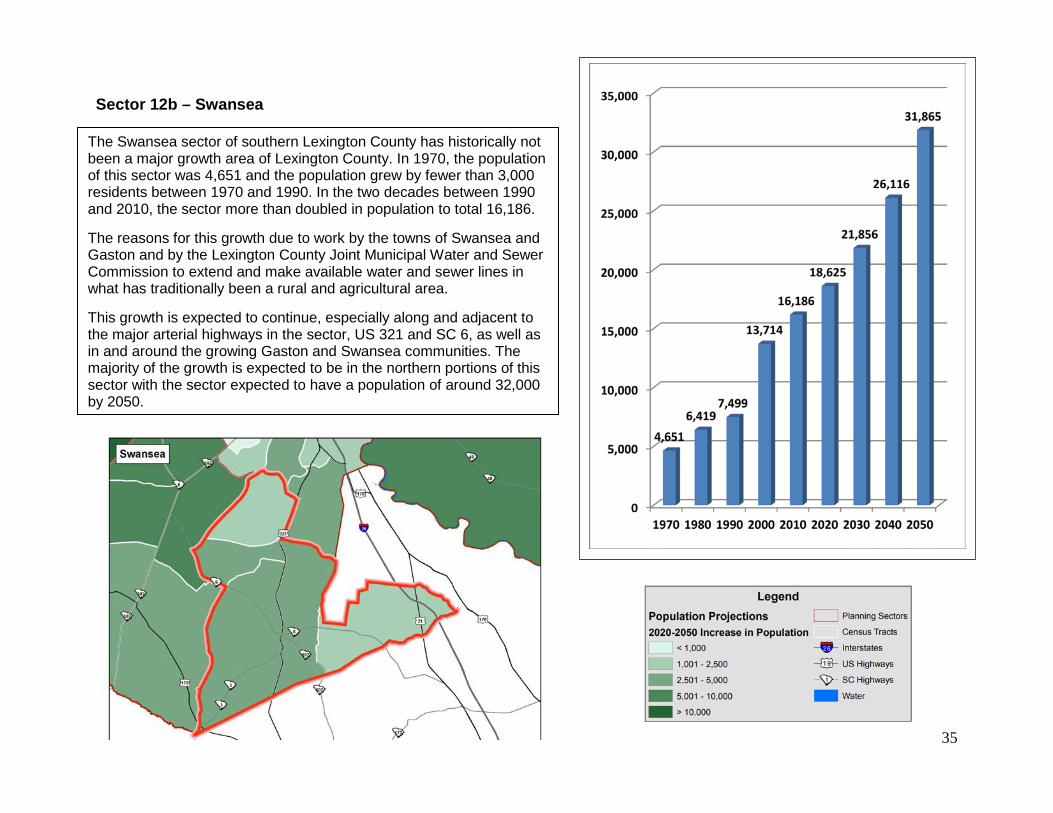
Sector 12b – Swansea
The Swansea sector of southern Lexington County has historically not been a major growth area of Lexington County. In 1970, the population of this sector was 4,651 and the population grew by fewer than 3,000 residents between 1970 and 1990. In the two decades between 1990 and 2010, the sector more than doubled in population to total 16,186. The reasons for this growth due to work by the towns of Swansea and Gaston and by the Lexington County Joint Municipal Water and Sewer Commission to extend and make available water and sewer lines in what has traditionally been a rural and agricultural area. This growth is expected to continue, especially along and adjacent to the major arterial highways in the sector, US 321 and SC 6, as well as in and around the growing Gaston and Swansea communities. The majority of the growth is expected to be in the northern portions of this sector with the sector expected to have a population of around 32,000 by 2050.
36
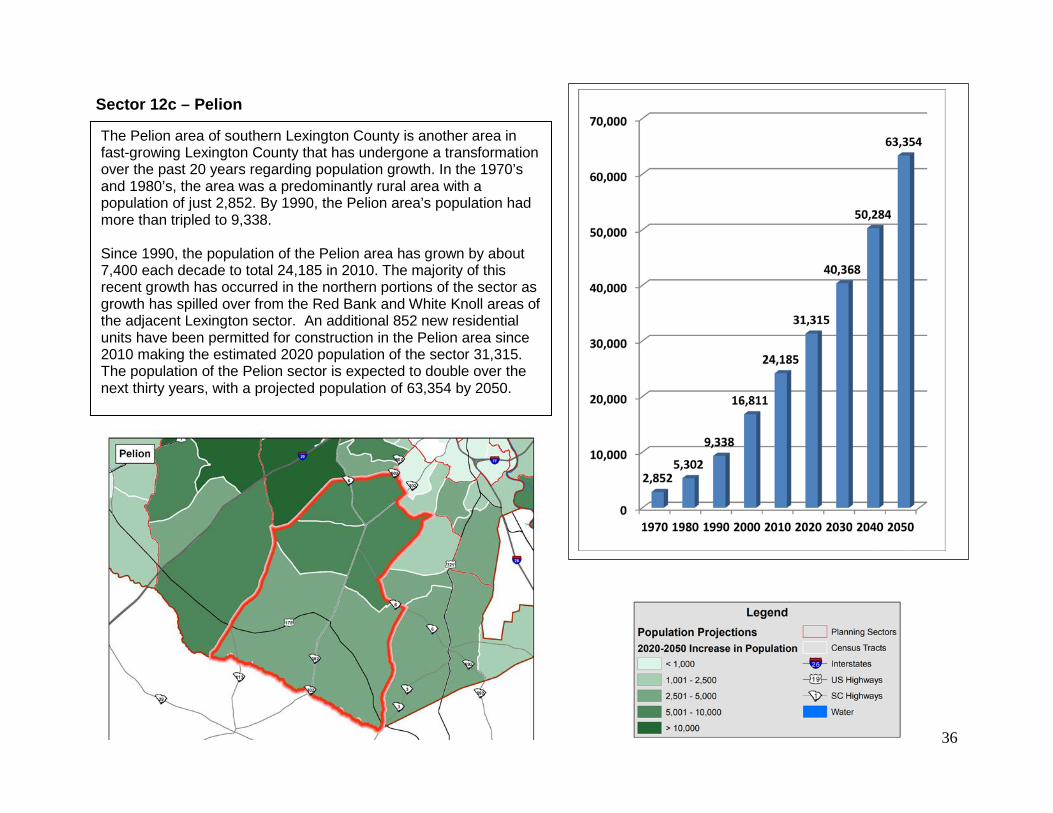
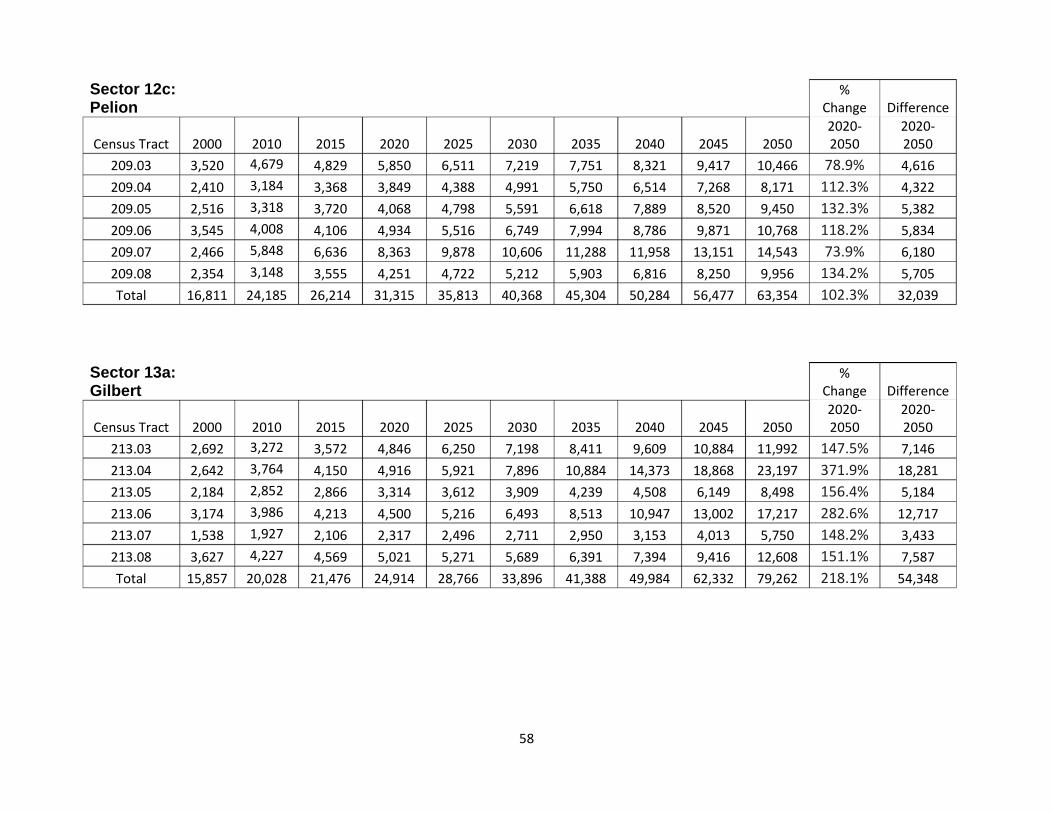
Sector 12c – Pelion
The Pelion area of southern Lexington County is another area in fast-growing Lexington County that has undergone a transformation over the past 20 years regarding population growth. In the 1970’s and 1980’s, the area was a predominantly rural area with a population of just 2,852. By 1990, the Pelion area’s population had more than tripled to 9,338. Since 1990, the population of the Pelion area has grown by about 7,400 each decade to total 24,185 in 2010. The majority of this recent growth has occurred in the northern portions of the sector as growth has spilled over from the Red Bank and White Knoll areas of the adjacent Lexington sector. An additional 852 new residential units have been permitted for construction in the Pelion area since 2010 making the estimated 2020 population of the sector 31,315. The population of the Pelion sector is expected to double over the next thirty years, with a projected population of 63,354 by 2050.
37
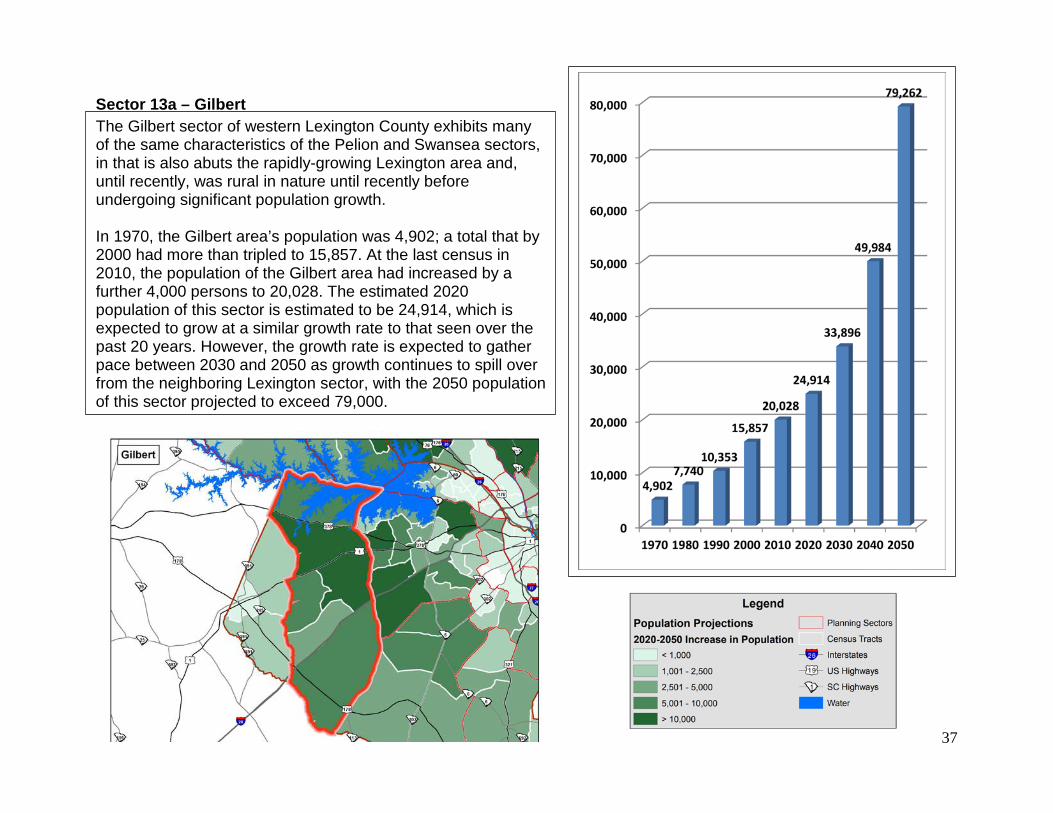
Sector 13a – Gilbert
The Gilbert sector of western Lexington County exhibits many of the same characteristics of the Pelion and Swansea sectors, in that is also abuts the rapidly-growing Lexington area and, until recently, was rural in nature until recently before undergoing significant population growth. In 1970, the Gilbert area’s population was 4,902; a total that by 2000 had more than tripled to 15,857. At the last census in 2010, the population of the Gilbert area had increased by a further 4,000 persons to 20,028. The estimated 2020 population of this sector is estimated to be 24,914, which is expected to grow at a similar growth rate to that seen over the past 20 years. However, the growth rate is expected to gather pace between 2030 and 2050 as growth continues to spill over from the neighboring Lexington sector, with the 2050 population of this sector projected to exceed 79,000.
38
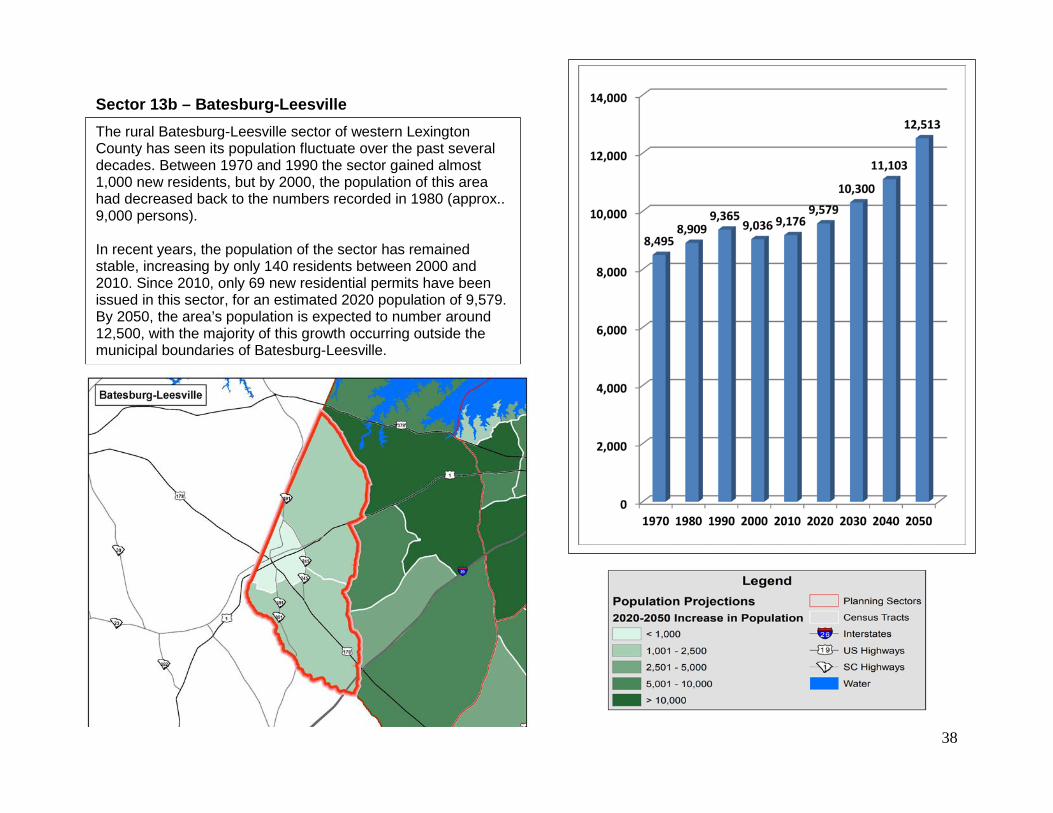
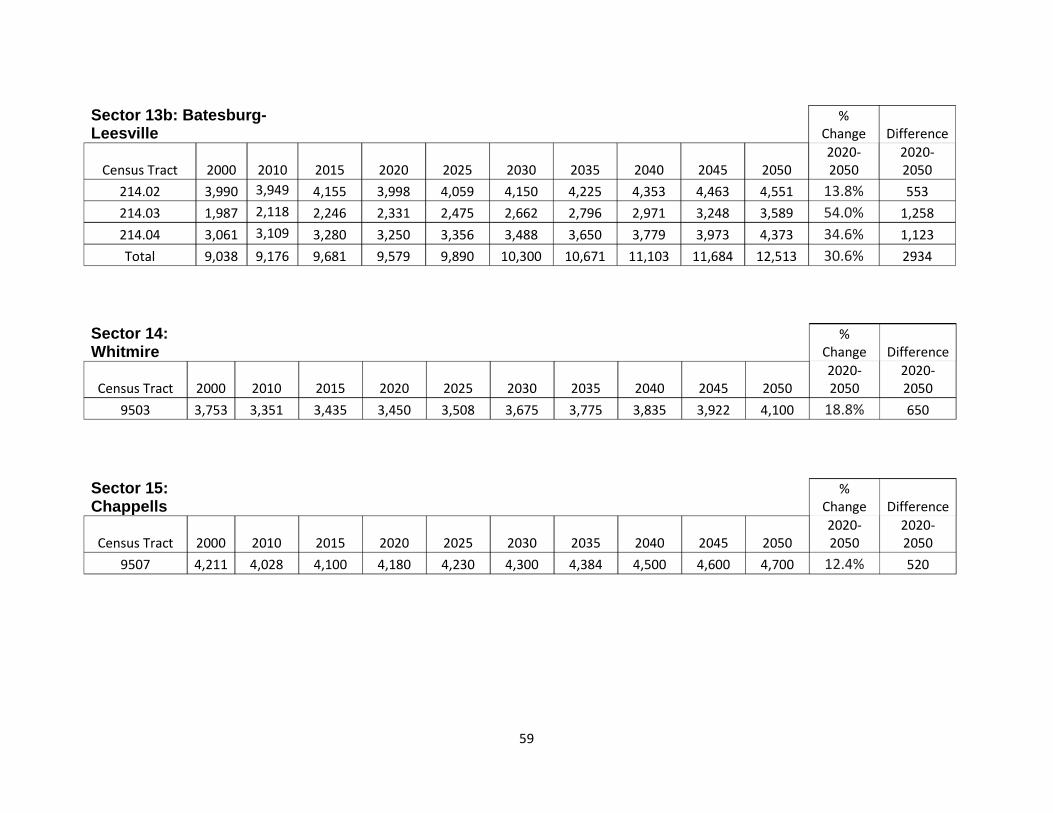
Sector 13b – Batesburg-Leesville
The
The rural Batesburg-Leesville sector of western Lexington County has seen its population fluctuate over the past several decades. Between 1970 and 1990 the sector gained almost 1,000 new residents, but by 2000, the population of this area had decreased back to the numbers recorded in 1980 (approx.. 9,000 persons). In recent years, the population of the sector has remained stable, increasing by only 140 residents between 2000 and 2010. Since 2010, only 69 new residential permits have been issued in this sector, for an estimated 2020 population of 9,579. By 2050, the area’s population is expected to number around 12,500, with the majority of this growth occurring outside the municipal boundaries of Batesburg-Leesville.
39
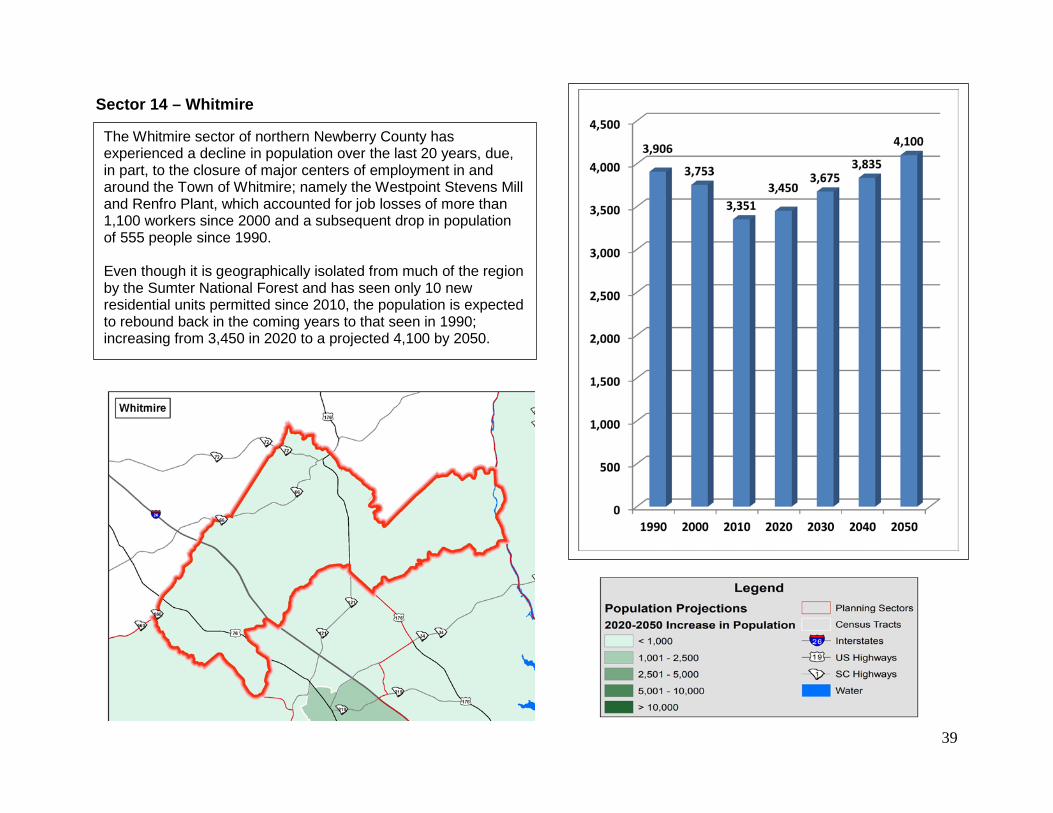
Sector 14 – Whitmire
The Whitmire sector of northern Newberry County has experienced a decline in population over the last 20 years, due, in part, to the closure of major centers of employment in and around the Town of Whitmire; namely the Westpoint Stevens Mill and Renfro Plant, which accounted for job losses of more than 1,100 workers since 2000 and a subsequent drop in population of 555 people since 1990. Even though it is geographically isolated from much of the region by the Sumter National Forest and has seen only 10 new residential units permitted since 2010, the population is expected to rebound back in the coming years to that seen in 1990; increasing from 3,450 in 2020 to a projected 4,100 by 2050.
40
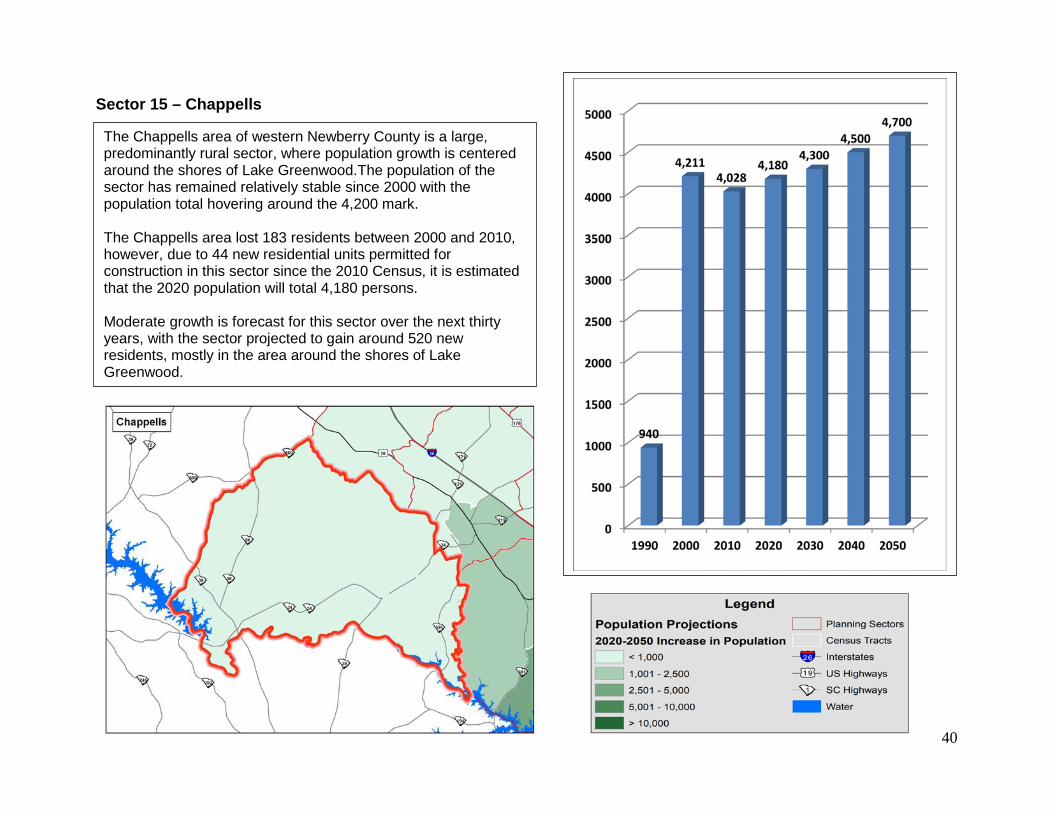
Sector 15 – Chappells
The Chappells area of western Newberry County is a large, predominantly rural sector, where population growth is centered around the shores of Lake Greenwood.The population of the sector has remained relatively stable since 2000 with the population total hovering around the 4,200 mark. The Chappells area lost 183 residents between 2000 and 2010, however, due to 44 new residential units permitted for construction in this sector since the 2010 Census, it is estimated that the 2020 population will total 4,180 persons. Moderate growth is forecast for this sector over the next thirty years, with the sector projected to gain around 520 new residents, mostly in the area around the shores of Lake Greenwood.
41
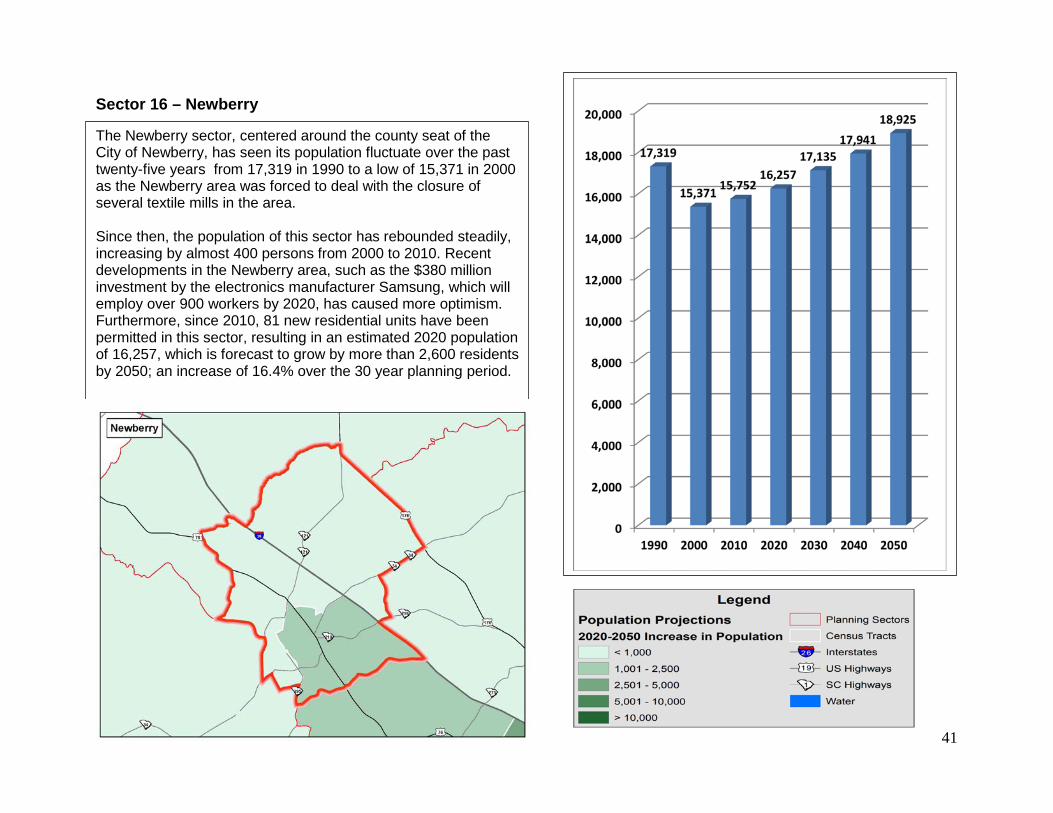
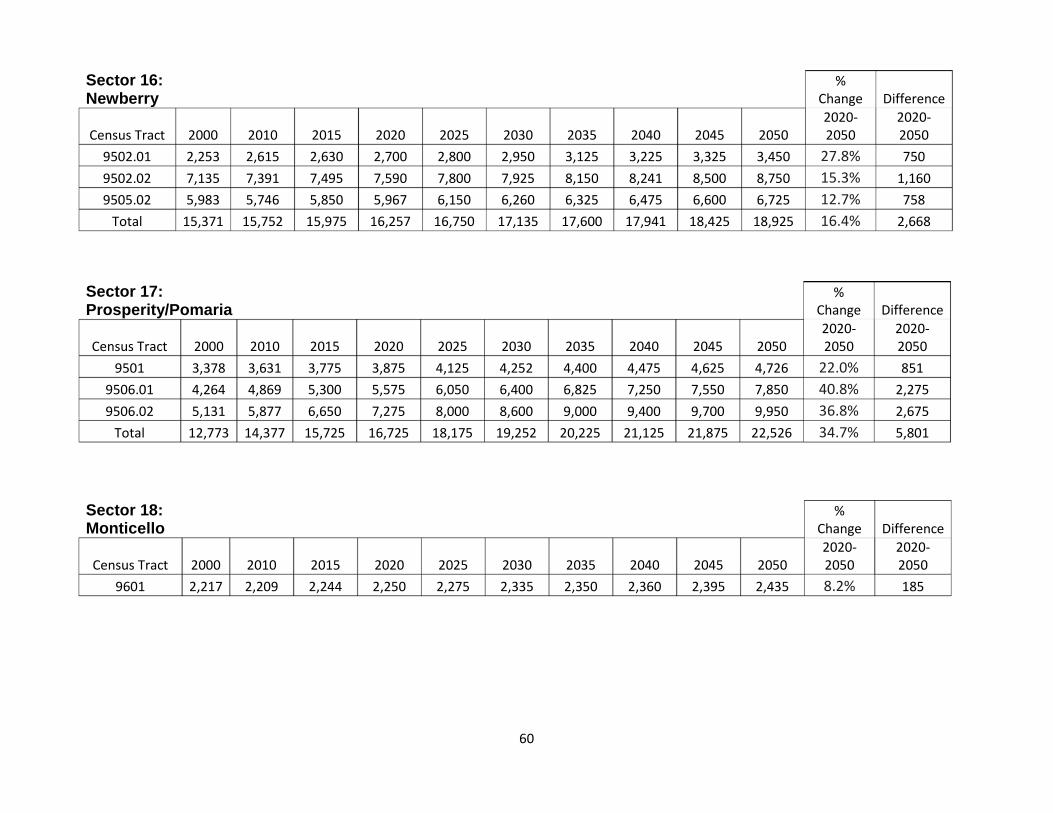
Sector 16 – Newberry
The Newberry sector, centered around the county seat of the City of Newberry, has seen its population fluctuate over the past twenty-five years from 17,319 in 1990 to a low of 15,371 in 2000 as the Newberry area was forced to deal with the closure of several textile mills in the area. Since then, the population of this sector has rebounded steadily, increasing by almost 400 persons from 2000 to 2010. Recent developments in the Newberry area, such as the $380 million investment by the electronics manufacturer Samsung, which will employ over 900 workers by 2020, has caused more optimism. Furthermore, since 2010, 81 new residential units have been permitted in this sector, resulting in an estimated 2020 population of 16,257, which is forecast to grow by more than 2,600 residents by 2050; an increase of 16.4% over the 30 year planning period.
42
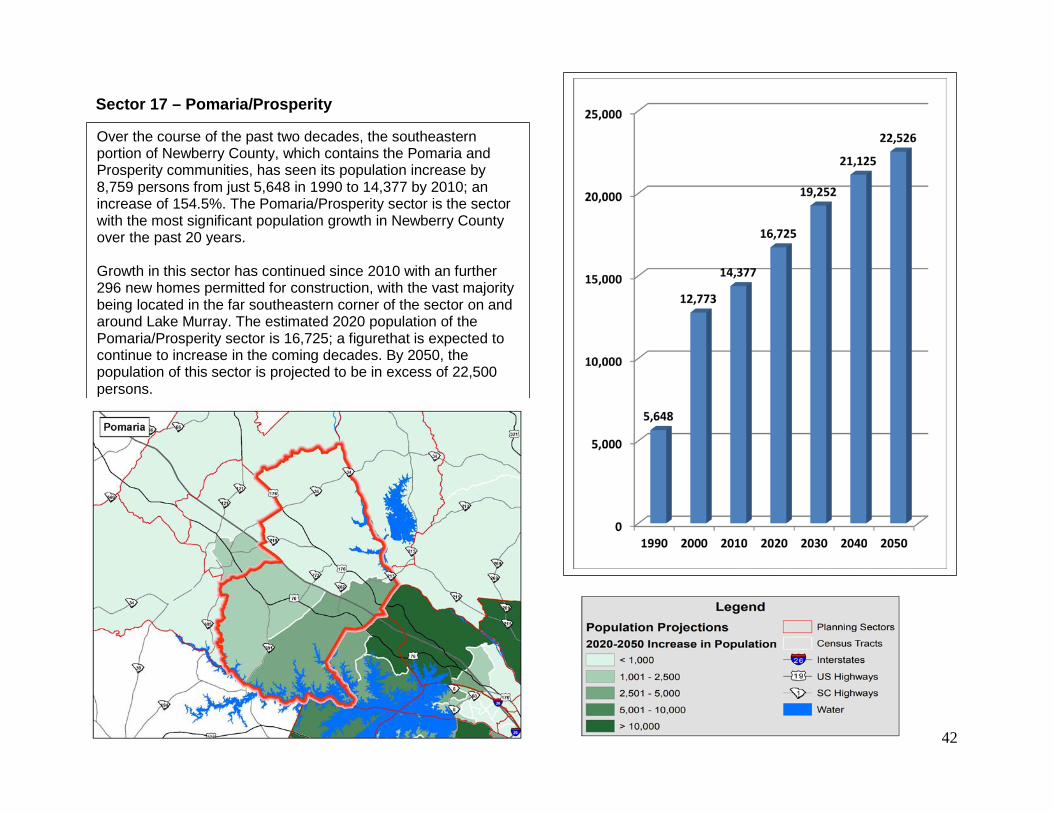
Sector 17 – Pomaria/Prosperity
Over the course of the past two decades, the southeastern portion of Newberry County, which contains the Pomaria and Prosperity communities, has seen its population increase by 8,759 persons from just 5,648 in 1990 to 14,377 by 2010; an increase of 154.5%. The Pomaria/Prosperity sector is the sector with the most significant population growth in Newberry County over the past 20 years. Growth in this sector has continued since 2010 with an further 296 new homes permitted for construction, with the vast majority being located in the far southeastern corner of the sector on and around Lake Murray. The estimated 2020 population of the Pomaria/Prosperity sector is 16,725; a figurethat is expected to continue to increase in the coming decades. By 2050, the population of this sector is projected to be in excess of 22,500 persons.
43
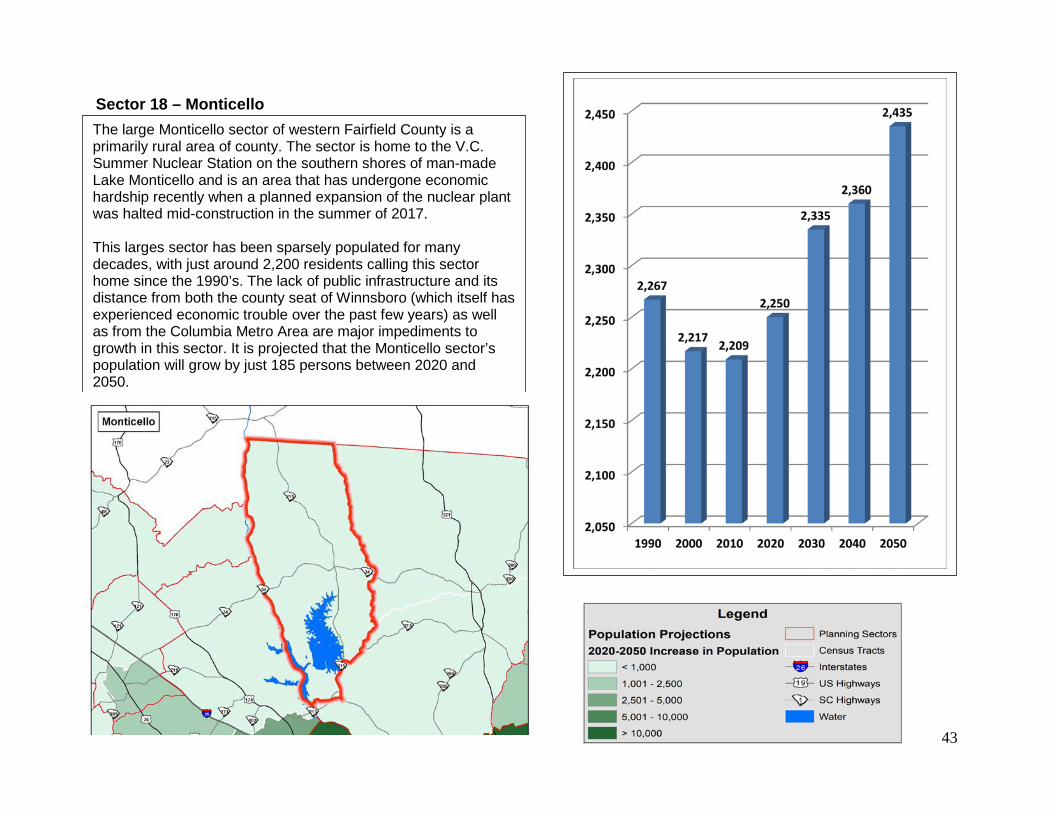
Sector 18 – Monticello
The large Monticello sector of western Fairfield County is a primarily rural area of county. The sector is home to the V.C. Summer Nuclear Station on the southern shores of man-made Lake Monticello and is an area that has undergone economic hardship recently when a planned expansion of the nuclear plant was halted mid-construction in the summer of 2017. This larges sector has been sparsely populated for many decades, with just around 2,200 residents calling this sector home since the 1990’s. The lack of public infrastructure and its distance from both the county seat of Winnsboro (which itself has experienced economic trouble over the past few years) as well as from the Columbia Metro Area are major impediments to growth in this sector. It is projected that the Monticello sector’s population will grow by just 185 persons between 2020 and 2050.
44
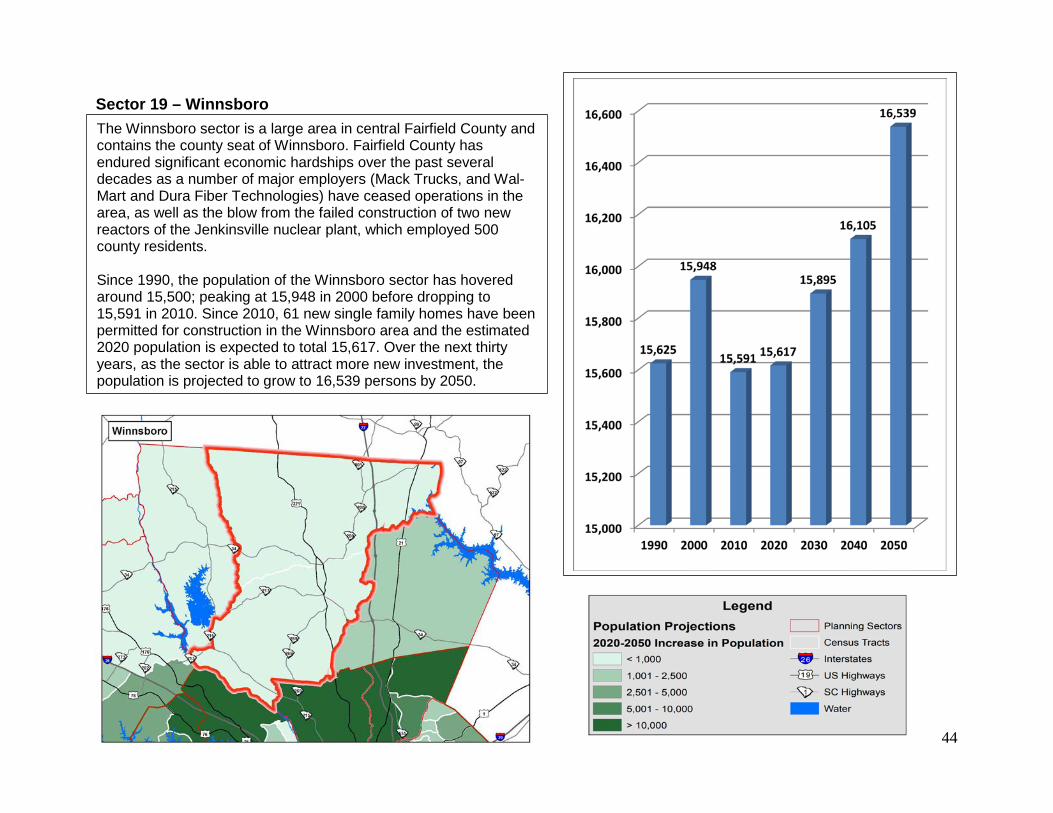
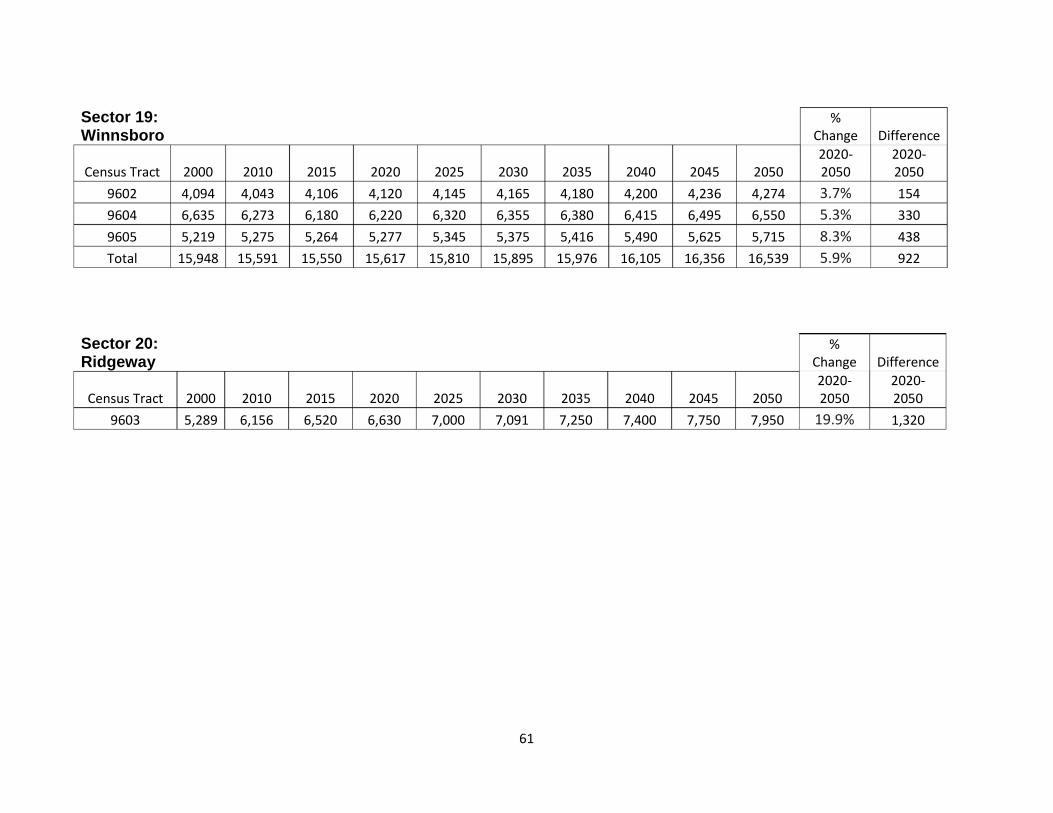
Sector 19 – Winnsboro
The Winnsboro sector is a large area in central Fairfield County and contains the county seat of Winnsboro. Fairfield County has endured significant economic hardships over the past several decades as a number of major employers (Mack Trucks, and Wal-Mart and Dura Fiber Technologies) have ceased operations in the area, as well as the blow from the failed construction of two new reactors of the Jenkinsville nuclear plant, which employed 500 county residents. Since 1990, the population of the Winnsboro sector has hovered around 15,500; peaking at 15,948 in 2000 before dropping to 15,591 in 2010. Since 2010, 61 new single family homes have been permitted for construction in the Winnsboro area and the estimated 2020 population is expected to total 15,617. Over the next thirty years, as the sector is able to attract more new investment, the population is projected to grow to 16,539 persons by 2050.
45
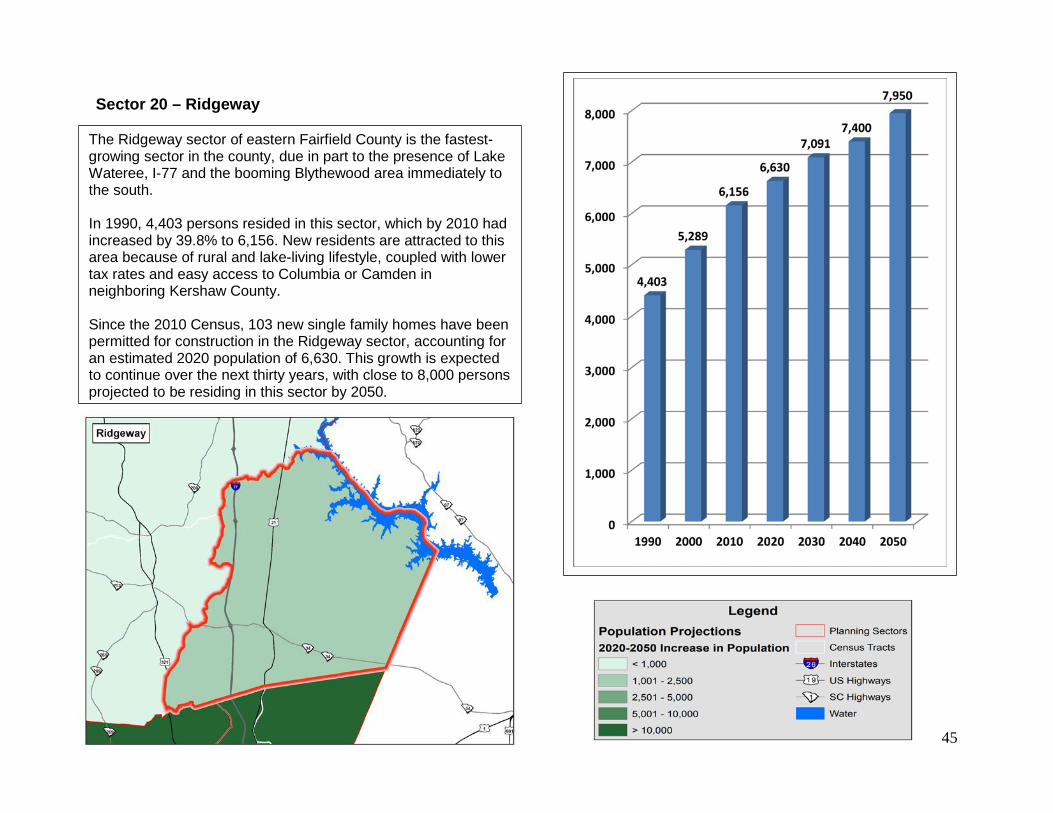
Sector 20 – Ridgeway
The Ridgeway sector of eastern Fairfield County is the fastest-growing sector in the county, due in part to the presence of Lake Wateree, I-77 and the booming Blythewood area immediately to the south. In 1990, 4,403 persons resided in this sector, which by 2010 had increased by 39.8% to 6,156. New residents are attracted to this area because of rural and lake-living lifestyle, coupled with lower tax rates and easy access to Columbia or Camden in neighboring Kershaw County. Since the 2010 Census, 103 new single family homes have been permitted for construction in the Ridgeway sector, accounting for an estimated 2020 population of 6,630. This growth is expected to continue over the next thirty years, with close to 8,000 persons projected to be residing in this sector by 2050.
46
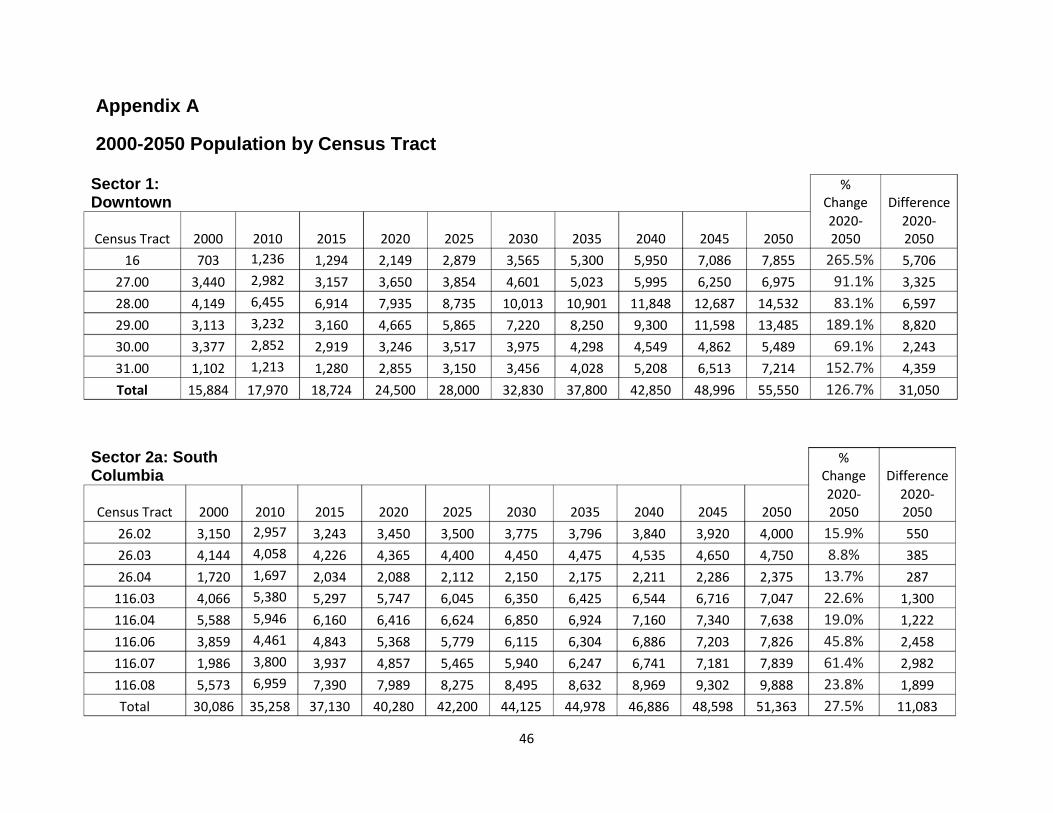
Appendix A
2000-2050 Population by Census Tract
Sector 1: Downtown
% Change Difference
Census Tract 2000 2010 2015 2020 2025 2030 2035 2040 2045 2050 2020-2050
2020-2050
16 703 1,236 1,294 2,149 2,879 3,565 5,300 5,950 7,086 7,855 265.5% 5,706 27.00 3,440 2,982 3,157 3,650 3,854 4,601 5,023 5,995 6,250 6,975 91.1% 3,325 28.00 4,149 6,455 6,914 7,935 8,735 10,013 10,901 11,848 12,687 14,532 83.1% 6,597 29.00 3,113 3,232 3,160 4,665 5,865 7,220 8,250 9,300 11,598 13,485 189.1% 8,820 30.00 3,377 2,852 2,919 3,246 3,517 3,975 4,298 4,549 4,862 5,489 69.1% 2,243 31.00 1,102 1,213 1,280 2,855 3,150 3,456 4,028 5,208 6,513 7,214 152.7% 4,359 Total 15,884 17,970 18,724 24,500 28,000 32,830 37,800 42,850 48,996 55,550 126.7% 31,050
Sector 2a: South Columbia
% Change Difference
Census Tract 2000 2010 2015 2020 2025 2030 2035 2040 2045 2050 2020-2050
2020-2050
26.02 3,150 2,957 3,243 3,450 3,500 3,775 3,796 3,840 3,920 4,000 15.9% 550 26.03 4,144 4,058 4,226 4,365 4,400 4,450 4,475 4,535 4,650 4,750 8.8% 385 26.04 1,720 1,697 2,034 2,088 2,112 2,150 2,175 2,211 2,286 2,375 13.7% 287
116.03 4,066 5,380 5,297 5,747 6,045 6,350 6,425 6,544 6,716 7,047 22.6% 1,300 116.04 5,588 5,946 6,160 6,416 6,624 6,850 6,924 7,160 7,340 7,638 19.0% 1,222 116.06 3,859 4,461 4,843 5,368 5,779 6,115 6,304 6,886 7,203 7,826 45.8% 2,458 116.07 1,986 3,800 3,937 4,857 5,465 5,940 6,247 6,741 7,181 7,839 61.4% 2,982 116.08 5,573 6,959 7,390 7,989 8,275 8,495 8,632 8,969 9,302 9,888 23.8% 1,899 Total 30,086 35,258 37,130 40,280 42,200 44,125 44,978 46,886 48,598 51,363 27.5% 11,083
47
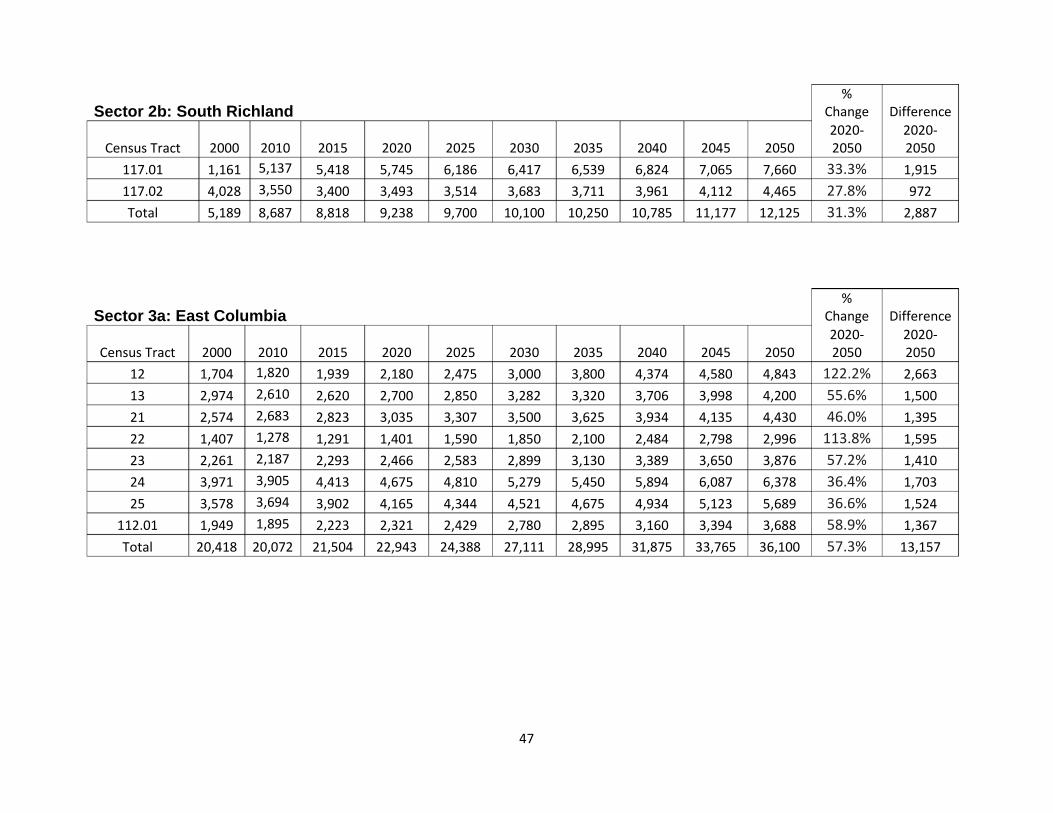
Sector 2b: South Richland
% Change Difference
Census Tract 2000 2010 2015 2020 2025 2030 2035 2040 2045 2050 2020-2050
2020-2050
117.01 1,161 5,137 5,418 5,745 6,186 6,417 6,539 6,824 7,065 7,660 33.3% 1,915 117.02 4,028 3,550 3,400 3,493 3,514 3,683 3,711 3,961 4,112 4,465 27.8% 972 Total 5,189 8,687 8,818 9,238 9,700 10,100 10,250 10,785 11,177 12,125 31.3% 2,887
Sector 3a: East Columbia
% Change Difference
Census Tract 2000 2010 2015 2020 2025 2030 2035 2040 2045 2050 2020-2050
2020-2050
12 1,704 1,820 1,939 2,180 2,475 3,000 3,800 4,374 4,580 4,843 122.2% 2,663 13 2,974 2,610 2,620 2,700 2,850 3,282 3,320 3,706 3,998 4,200 55.6% 1,500 21 2,574 2,683 2,823 3,035 3,307 3,500 3,625 3,934 4,135 4,430 46.0% 1,395 22 1,407 1,278 1,291 1,401 1,590 1,850 2,100 2,484 2,798 2,996 113.8% 1,595 23 2,261 2,187 2,293 2,466 2,583 2,899 3,130 3,389 3,650 3,876 57.2% 1,410 24 3,971 3,905 4,413 4,675 4,810 5,279 5,450 5,894 6,087 6,378 36.4% 1,703 25 3,578 3,694 3,902 4,165 4,344 4,521 4,675 4,934 5,123 5,689 36.6% 1,524
112.01 1,949 1,895 2,223 2,321 2,429 2,780 2,895 3,160 3,394 3,688 58.9% 1,367 Total 20,418 20,072 21,504 22,943 24,388 27,111 28,995 31,875 33,765 36,100 57.3% 13,157
48
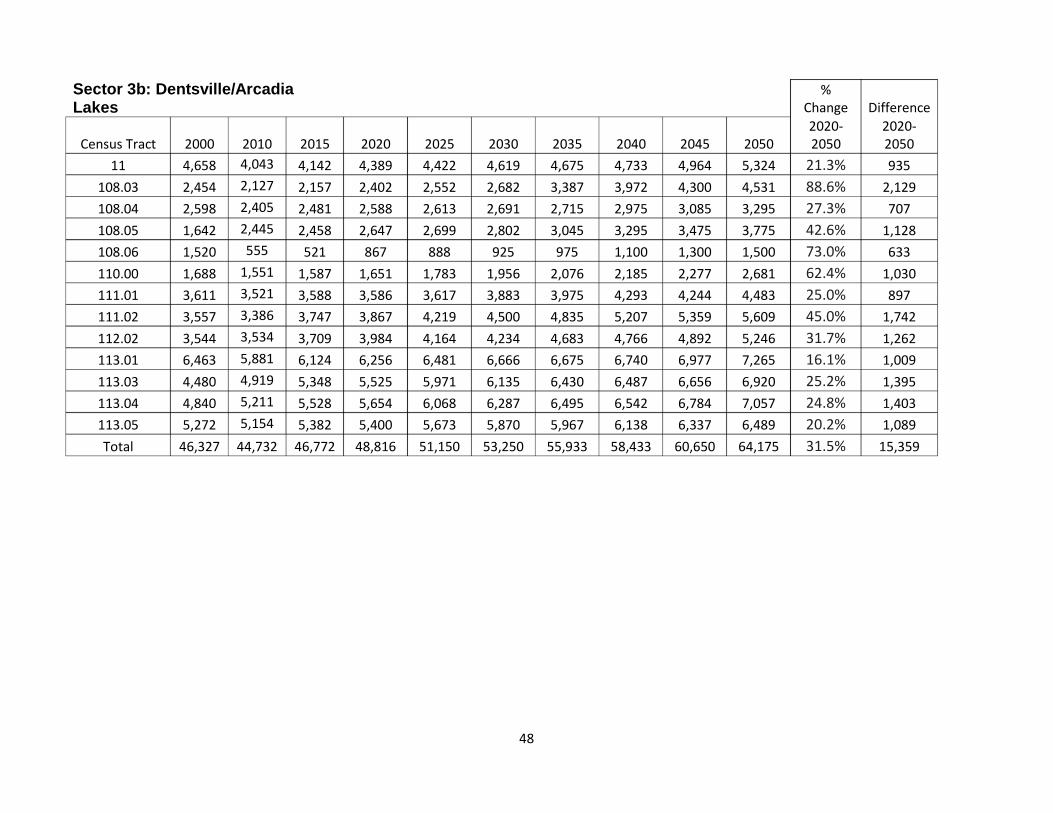
Sector 3b: Dentsville/Arcadia Lakes
% Change Difference
Census Tract 2000 2010 2015 2020 2025 2030 2035 2040 2045 2050 2020-2050
2020-2050
11 4,658 4,043 4,142 4,389 4,422 4,619 4,675 4,733 4,964 5,324 21.3% 935 108.03 2,454 2,127 2,157 2,402 2,552 2,682 3,387 3,972 4,300 4,531 88.6% 2,129 108.04 2,598 2,405 2,481 2,588 2,613 2,691 2,715 2,975 3,085 3,295 27.3% 707 108.05 1,642 2,445 2,458 2,647 2,699 2,802 3,045 3,295 3,475 3,775 42.6% 1,128 108.06 1,520 555 521 867 888 925 975 1,100 1,300 1,500 73.0% 633 110.00 1,688 1,551 1,587 1,651 1,783 1,956 2,076 2,185 2,277 2,681 62.4% 1,030 111.01 3,611 3,521 3,588 3,586 3,617 3,883 3,975 4,293 4,244 4,483 25.0% 897 111.02 3,557 3,386 3,747 3,867 4,219 4,500 4,835 5,207 5,359 5,609 45.0% 1,742 112.02 3,544 3,534 3,709 3,984 4,164 4,234 4,683 4,766 4,892 5,246 31.7% 1,262 113.01 6,463 5,881 6,124 6,256 6,481 6,666 6,675 6,740 6,977 7,265 16.1% 1,009 113.03 4,480 4,919 5,348 5,525 5,971 6,135 6,430 6,487 6,656 6,920 25.2% 1,395 113.04 4,840 5,211 5,528 5,654 6,068 6,287 6,495 6,542 6,784 7,057 24.8% 1,403 113.05 5,272 5,154 5,382 5,400 5,673 5,870 5,967 6,138 6,337 6,489 20.2% 1,089 Total 46,327 44,732 46,772 48,816 51,150 53,250 55,933 58,433 60,650 64,175 31.5% 15,359
49
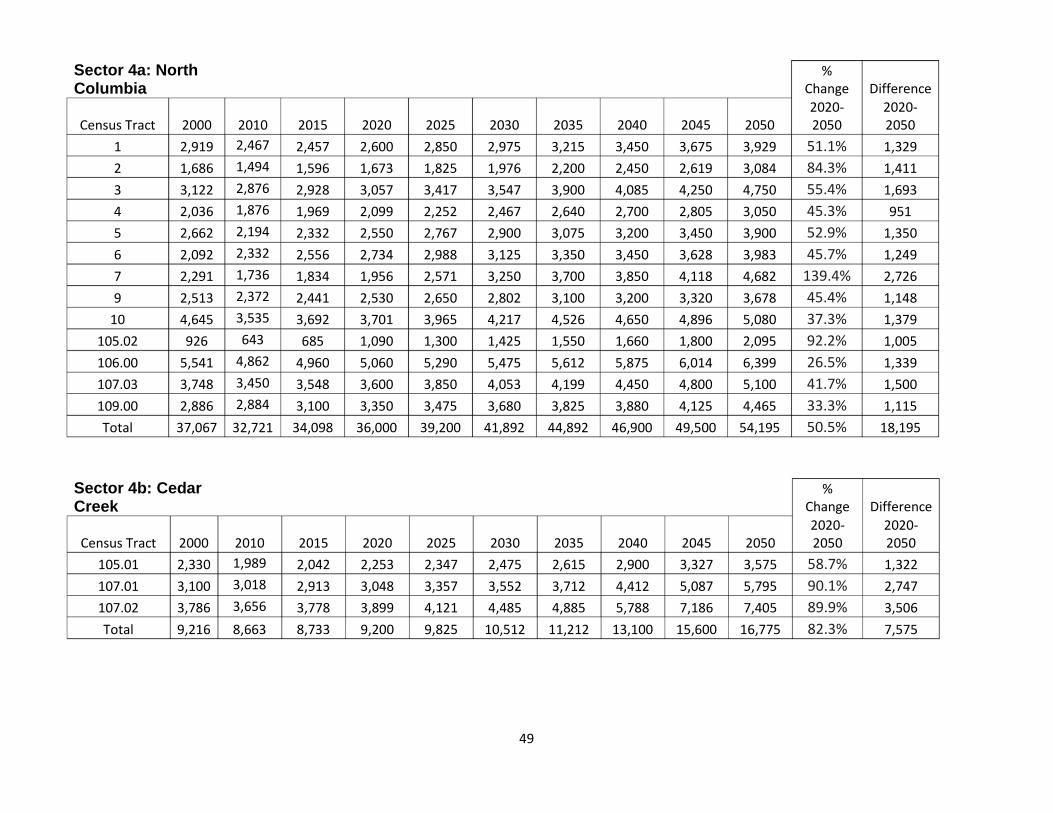
Sector 4a: North Columbia
% Change Difference
Census Tract 2000 2010 2015 2020 2025 2030 2035 2040 2045 2050 2020-2050
2020-2050
1 2,919 2,467 2,457 2,600 2,850 2,975 3,215 3,450 3,675 3,929 51.1% 1,329 2 1,686 1,494 1,596 1,673 1,825 1,976 2,200 2,450 2,619 3,084 84.3% 1,411 3 3,122 2,876 2,928 3,057 3,417 3,547 3,900 4,085 4,250 4,750 55.4% 1,693 4 2,036 1,876 1,969 2,099 2,252 2,467 2,640 2,700 2,805 3,050 45.3% 951 5 2,662 2,194 2,332 2,550 2,767 2,900 3,075 3,200 3,450 3,900 52.9% 1,350 6 2,092 2,332 2,556 2,734 2,988 3,125 3,350 3,450 3,628 3,983 45.7% 1,249 7 2,291 1,736 1,834 1,956 2,571 3,250 3,700 3,850 4,118 4,682 139.4% 2,726 9 2,513 2,372 2,441 2,530 2,650 2,802 3,100 3,200 3,320 3,678 45.4% 1,148
10 4,645 3,535 3,692 3,701 3,965 4,217 4,526 4,650 4,896 5,080 37.3% 1,379 105.02 926 643 685 1,090 1,300 1,425 1,550 1,660 1,800 2,095 92.2% 1,005 106.00 5,541 4,862 4,960 5,060 5,290 5,475 5,612 5,875 6,014 6,399 26.5% 1,339 107.03 3,748 3,450 3,548 3,600 3,850 4,053 4,199 4,450 4,800 5,100 41.7% 1,500 109.00 2,886 2,884 3,100 3,350 3,475 3,680 3,825 3,880 4,125 4,465 33.3% 1,115 Total 37,067 32,721 34,098 36,000 39,200 41,892 44,892 46,900 49,500 54,195 50.5% 18,195
Sector 4b: Cedar Creek
% Change Difference
Census Tract 2000 2010 2015 2020 2025 2030 2035 2040 2045 2050 2020-2050
2020-2050
105.01 2,330 1,989 2,042 2,253 2,347 2,475 2,615 2,900 3,327 3,575 58.7% 1,322 107.01 3,100 3,018 2,913 3,048 3,357 3,552 3,712 4,412 5,087 5,795 90.1% 2,747 107.02 3,786 3,656 3,778 3,899 4,121 4,485 4,885 5,788 7,186 7,405 89.9% 3,506 Total 9,216 8,663 8,733 9,200 9,825 10,512 11,212 13,100 15,600 16,775 82.3% 7,575
50
Sector 5a: Saint Andrews (Richland County)
% Change Difference
Census Tract 2000 2010 2015 2020 2025 2030 2035 2040 2045 2050 2020-2050
2020-2050
104.03 3,826 3,875 4,115 4,200 4,270 4,330 4,400 4,525 4,625 4,650 10.7% 450 104.07 4,414 4,284 4,611 4,760 4,850 5,030 5,125 5,200 5,350 5,500 15.5% 740 104.08 4,733 6,166 5,786 5,800 5,800 5,800 5,800 5,700 5,700 5,500 -5.2% -300 104.09 1,808 1,604 1,807 1,880 1,915 1,950 1,990 2,000 2,063 2,100 11.7% 220 104.10 3,433 3,781 4,228 4,350 4,415 4,520 4,625 4,700 5,000 5,100 17.2% 750 104.11 3,310 3,174 2,954 3,140 3,170 3,210 3,300 3,340 3,500 3,500 11.5% 360 104.12 3,357 3,159 2,950 3,125 3,300 3,390 3,495 3,718 3,895 4,045 29.4% 920 104.13 1,787 1,989 2,194 2,245 2,380 2,480 2,600 2,850 3,200 3,400 51.4% 1,155 Total 26,668 28,032 28,645 29,500 30,100 30,710 31,335 32,033 33,333 33,795 14.6% 4,295
Sector 5b: Saint Andrews (Lexington County)
% Change Difference
Census Tract 2000 2010 2015 2020 2025 2030 2035 2040 2045 2050 2020-2050
2020-2050
205.10 4,545 4,684 4,975 4,718 4,819 5,086 5,214 5,138 5,141 5,227 10.8% 509 205.11 3,678 3,430 3,371 3,469 3,623 3,850 3,875 3,813 3,842 3,861 11.3% 392 Total 8,223 8,114 8,346 8,187 8,442 8,936 9,089 8,951 8,983 9,088 11.0% 901
51
Sector 6a: West Columbia/Cayce
% Change Difference
Census Tract 2000 2010 2015 2020 2025 2030 2035 2040 2045 2050 2020-2050
2020-2050
201 2,986 2,762 2,911 2,672 2,750 2,811 2,782 2,744 2,751 2,804 4.9% 132 202.01 2,082 2,350 2,937 2,945 2,950 2,950 2,975 3,013 2,988 3,012 2.3% 67 202.02 2,340 2,294 2,459 2,225 2,228 2,191 2,196 2,158 2,196 2,309 3.8% 84
203 4,196 4,202 4,183 4,654 4,807 4,972 4,971 4,889 5,038 5,114 9.9% 460 205.05 3,720 4,143 4,391 4,432 4,550 4,688 4,754 4,814 4,894 4,956 11.8% 524 205.08 1,985 2,151 2,097 2,158 2,225 2,297 2,321 2,352 2,377 2,408 11.6% 250 205.09 3,357 3,468 4,041 3,429 3,425 3,475 3,516 3,583 3,625 3,703 8.0% 274 206.01 3,628 4,094 4,391 4,296 4,375 4,417 4,396 4,351 4,402 4,379 1.9% 83 Total 24,294 25,464 27,410 26,811 27,310 27,801 27,911 27,904 28,271 28,685 7.0% 1,874
Sector 6b: Springdale
% Change Difference
Census Tract 2000 2010 2015 2020 2025 2030 2035 2040 2045 2050 2020-2050
2020-2050
205.06 3,425 3,585 4,029 4,579 5,023 6,014 6,422 6,913 7,719 8,318 81.7% 3,739 205.07 5,737 6,510 6,880 7,137 7,300 7,521 7,693 7,953 8,200 8,659 21.3% 1,522 206.02 4,294 4,232 4,549 4,767 4,850 4,933 5,039 5,184 5,263 5,364 12.5% 597 206.04 3,154 2,782 3,060 3,269 3,225 3,214 3,179 3,188 3,175 3,229 -1.2% -40 206.05 1,652 1,852 2,014 2,129 2,175 2,236 2,309 2,359 2,531 2,713 27.4% 584 9801 0 0 0 0 0 0 0 0 0 0 0.0% 0 Total 18,262 18,961 20,532 21,881 22,573 23,918 24,642 25,597 26,888 28,283 29.3% 6,402
52
Sector 7a: Southeast Richland
% Change Difference
Census Tract 2000 2010 2015 2020 2025 2030 2035 2040 2045 2050 2020-2050
2020-2050
119.01 6,562 7,590 8,096 8,825 10,780 11,345 12,225 13,426 14,432 15,560 76.3% 6,735 119.02 4,877 4,980 4,961 5,675 6,220 7,405 7,900 8,799 10,218 10,752 89.5% 5,077 Total 11,439 12,570 13,057 14,500 17,000 18,750 20,125 22,225 24,650 26,312 81.5% 11,812
Sector 7b: Hopkins
% Change Difference
Census Tract 2000 2010 2015 2020 2025 2030 2035 2040 2045 2050 2020-2050
2020-2050
118 6,821 6424 6,429 7,000 7,250 7,750 8,750 9,995 11,350 13,150 87.9% 6,150
Sector 7c: East Richland
% Change Difference
Census Tract 2000 2010 2015 2020 2025 2030 2035 2040 2045 2050 2020-2050
2020-2050
120 5,598 5,433 5,570 6,000 6,500 7,200 8,200 9,000 9,600 10,100 68.3% 4,100
Sector 8: Fort Jackson
% Change Difference
Census Tract 2000 2010 2015 2020 2025 2030 2035 2040 2045 2050 2020-2050
2020-2050
115.01 6,291 10945 10,268 10312 11,050 11710 12,540 12,650 12850 12,950 25.6% 2,638 115.02 5,002 2133 2,499 2938 2975 3040 3200 3500 3800 4150 41.3% 1,212
9801.00 7 22 22 250 250 250 250 350 350 400 60.0% 150 Total 11,300 13,100 12,789 13,500 14,275 15,000 15,990 16,500 17,000 17,500 29.6% 4,000
53
Sector 9a: Richland Northeast
% Change Difference
Census Tract 2000 2010 2015 2020 2025 2030 2035 2040 2045 2050 2020-2050
2020-2050
114.04 6,585 8,292 9,098 9,900 10,345 11,709 13,325 14,100 14,650 15,895 60.6% 5,995 114.07 943 3,162 4,176 5,290 5,975 6,650 7,100 7,500 7,600 7,850 48.4% 2,560 114.11 3,488 3,501 3,835 4,335 4,650 4,875 5,279 5,415 5,450 5,500 26.9% 1,165 114.12 3,990 5,089 5,502 6,052 6,500 6,700 7,000 7,434 7,500 7,700 27.2% 1,648 114.13 5,159 8,358 9,060 9,285 9,842 10,100 10,500 10,900 11,000 11,500 23.9% 2,215 114.14 5,046 5,767 6,066 6,366 6,833 7,220 7,730 8,000 8,150 8,600 35.1% 2,234 114.15 5,798 10,592 11,574 13,995 14,630 15,337 16,550 17,400 17,862 18,200 30.0% 4,205 114.16 926 11,475 12,927 15,077 16,000 16,400 16,600 17,000 17,300 17,350 15.1% 2,273 114.17 4,417 8,302 8,767 9,032 9,400 9,650 9,900 10,200 10,400 11,000 21.8% 1,968 114.18 2,978 3,433 3,624 3,789 4,228 4,475 4,800 5,300 5,300 5,500 45.2% 1,711 114.19 4,642 4,905 5,179 5,379 5,725 5,896 6,177 6,450 6,538 6,800 26.4% 1,421 Total 43,972 72,876 79,808 88,500 94,128 99,012 104,961 109,699 111,750 115,895 31.0% 27,395
Sector 9b: Blythewood
% Change Difference
Census Tract 2000 2010 2015 2020 2025 2030 2035 2040 2045 2050 2020-2050
2020-2050
101.02 3,367 6,219 7,352 10,689 14,478 18,838 23,063 28,445 35,901 39,725 271.6% 29,036 101.03 6,615 17,155 20,376 25,356 27,748 28,795 29,745 30,880 31,750 32,435 27.9% 7,079 101.04 2,738 3,857 4,350 5,455 7,099 9,127 10,475 12,948 14,225 16,590 204.1% 11,135 Total 12,720 27,231 32,078 41,500 49,325 56,760 63,283 72,273 81,876 88,750 113.9% 47,250
54
Sector 9c: North Richland
% Change Difference
Census Tract 2000 2010 2015 2020 2025 2030 2035 2040 2045 2050 2020-2050
2020-2050
102 5,308 5505 5,874 7,250 8,300 9,400 11,250 13,150 18,150 21,238 192.9% 13,988
Sector 10a: Irmo
% Change Difference
Census Tract 2000 2010 2015 2020 2025 2030 2035 2040 2045 2050 2020-2050
2020-2050
103.04 6,014 7,126 7,232 7,382 7,535 7,601 7,785 7,825 7,900 8,240 11.6% 858 103.05 6,787 7,004 7,471 7,913 8,348 9,225 9,870 10,001 10,660 11,800 49.1% 3,887 103.06 4,666 7,923 10,201 13,957 16,837 18,289 21,313 23,150 24,646 26,746 91.6% 12,789 103.07 5,015 8,372 9,920 12,027 13,533 15,740 16,920 18,692 20,980 24,134 100.7% 12,107 103.08 3,213 5,857 6,118 6,643 7,047 7,745 8,162 8,572 8,750 8,925 34.4% 2,282 103.09 6,969 8,948 9,128 9,378 9,500 9,700 9,850 9,910 9,910 9,950 6.1% 572 Total 32,664 45,230 50,070 57,300 62,800 68,300 73,900 78,150 82,846 89,795 56.7% 32,495
55
Sector 10b: Dutch Fork
% Change Difference
Census Tract 2000 2010 2015 2020 2025 2030 2035 2040 2045 2050 2020-2050
2020-2050
211.06 3,046 2859 2,765 2850 2900 3104 3118 3150 3175 3210 12.6% 360 211.09 3,181 3105 3,221 3575 3650 3691 3809 3877 3961 4008 12.1% 433 211.1 3,198 2859 2,964 2953 2970 3030 3014 3048 3119 3175 7.5% 222
211.11 2,653 2495 2,484 2475 2485 2496 2529 2556 2525 2502 1.1% 27 211.12 2,843 2709 2,783 2893 2900 2904 2927 2939 2952 2968 2.6% 75 211.13 2,782 3074 3,280 3297 3568 3906 4058 4281 4368 4523 37.2% 1,226 211.14 3,930 3653 3,863 4250 4838 5350 5980 6518 6781 7047 65.8% 2,797 211.15 1,814 2099 2,524 3017 3506 4017 4308 4592 4711 4807 59.3% 1,790 211.16 3,740 3306 3,435 3350 3408 3481 3472 3450 3477 3501 4.5% 151 Total 27,187 26,159 27,319 28,660 30,225 31,979 33,215 34,411 35,069 35,741 24.7% 7,081
Sector 10c: Chapin
% Change Difference
Census Tract 2000 2010 2015 2020 2025 2030 2035 2040 2045 2050 2020-2050
2020-2050
212.03 3,064 4,968 5,551 6,219 6,768 7,113 7,852 8,490 9,793 12,014 93.2% 5,795 212.04 2,120 3,654 4,082 5,709 6,882 8,788 10,768 12,788 14,648 16,509 189.2% 10,800 212.05 1,932 2,854 3,127 3,519 3,988 4,496 5,002 5,537 5,911 6,406 82.0% 2,887 212.06 2,213 2,752 2,996 3,213 3,615 4,203 4,784 5,311 6,541 7,123 121.7% 3,910 Total 9,329 14,228 15,756 18,660 21,253 24,600 28,406 32,126 36,893 42,052 125.4% 23,392
56
Sector 11: Lexington
% Change Difference
Census Tract 2000 2010 2015 2020 2025 2030 2035 2040 2045 2050 2020-2050
2020-2050
210.09 5,057 8,536 9,565 11,796 14,236 16,334 19,307 22,618 25,907 28,846 144.5% 17,050 210.14 1,932 4,875 6,297 7,616 9,048 10,438 11,906 14,418 16,893 20,067 163.5% 12,451 210.17 6,261 7,514 8,366 10,500 12,014 13,096 13,718 14,267 15,008 16,282 55.1% 5,782 210.18 4,471 5,261 5,823 6,258 6,916 7,382 8,097 8,826 9,531 10,600 69.4% 4,342 210.19 1,229 1,369 1,519 2,361 2,550 2,718 2,775 2,850 3,128 3,504 48.4% 1,143 210.2 2,764 3,992 4,362 4,250 4,642 4,682 4,812 4,968 5,367 6,011 41.4% 1,761
210.21 1,360 1,471 1,577 1,872 1,956 2,150 2,325 2,509 2,741 3,052 63.0% 1,180 210.22 1,008 3,714 4,541 6,123 7,507 9,727 11,478 13,923 16,883 19,518 218.8% 13,395 210.23 1,264 2,566 2,859 3,257 3,719 4,233 5,039 5,657 7,261 9,813 201.3% 6,556 210.24 878 3,775 5,079 9,501 11,128 13,291 15,839 18,788 21,809 23,353 145.8% 13,852 210.25 3,153 3,439 3,773 4,169 4,783 4,816 5,413 5,963 6,471 7,112 70.6% 2,943 210.26 3,286 4,274 4,782 5,861 7,059 8,224 9,116 10,330 11,168 12,005 104.8% 6,144 210.27 2,874 3,992 4,417 5,558 5,809 6,189 6,476 7,631 7,959 8,250 48.4% 2,692 210.28 2,379 3,463 4,023 4,567 5,014 6,227 7,504 8,714 9,926 11,515 152.1% 6,948 210.29 2,508 3,314 3,645 4,229 4,804 5,216 5,896 6,512 7,115 7,709 82.3% 3,480 210.3 2,814 4,901 5,418 5,217 5,805 6,481 6,966 7,531 8,388 9,214 76.6% 3,997
210.31 3,187 3,982 4,028 4,431 4,500 4,575 4,671 4,712 4,762 4,823 8.8% 392 210.32 3,071 3,767 4,410 4,273 4,500 4,817 5,107 5,408 5,608 5,827 36.4% 1,554 210.33 3,849 4,431 5,011 5,167 5,250 5,277 5,389 5,524 5,897 6,658 28.9% 1,491 210.34 3,838 4,133 4,526 4,543 5,187 5,298 5,407 5,706 6,103 6,752 48.6% 2,209 Total 57,183 82,769 94,021 111,549 126,427 141,171 157,241 176,855 197,925 220,911 98.0% 109,362
57
Sector 12a: South Congaree
% Change Difference
Census Tract 2000 2010 2015 2020 2025 2030 2035 2040 2045 2050 2020-2050
2020-2050
207.03 4,273 4,045 4,256 4,331 4,517 4,689 4,813 4,896 4,929 5,051 16.6% 720 207.05 2,816 3,621 3,755 4,269 4,750 5,211 5,952 6,809 7,288 7,932 85.8% 3,663 207.06 3,127 3,181 3,811 3,311 3,525 3,775 4,029 4,438 4,650 4,961 49.8% 1,650 207.07 3,273 3,703 3,809 3,978 4,316 4,456 5,226 5,922 6,648 7,224 81.6% 3,246 207.08 2,627 2,571 2,595 2,613 2,811 3,088 3,250 3,514 3,801 4,213 61.2% 1,600 Total 16,116 17,121 18,226 18,502 19,919 21,219 23,270 25,579 27,316 29,381 58.8% 10,879
Sector 12b: Swansea
% Change Difference
Census Tract 2000 2010 2015 2020 2025 2030 2035 2040 2045 2050 2020-2050
2020-2050
208.01 1,362 1,514 1,567 1,829 2,029 2,156 2,416 2,591 2,771 3,011 64.6% 1,182 208.02 2,406 2,818 2,995 3,229 3,606 4,112 4,408 4,928 5,513 6,236 93.1% 3,007 208.03 2,754 3,490 3,530 4,246 4,733 5,258 5,811 6,382 6,919 7,828 84.4% 3,582 208.04 2,445 2,866 2,989 3,300 3,716 4,042 4,607 5,103 5,627 6,531 97.9% 3,231 208.05 4,747 5,498 5,844 6,021 6,150 6,288 6,600 7,112 7,610 8,259 37.2% 2,238 Total 13,714 16,186 16,925 18,625 20,234 21,856 23,842 26,116 28,440 31,865 71.1% 13,240
58
Sector 12c: Pelion
% Change Difference
Census Tract 2000 2010 2015 2020 2025 2030 2035 2040 2045 2050 2020-2050
2020-2050
209.03 3,520 4,679 4,829 5,850 6,511 7,219 7,751 8,321 9,417 10,466 78.9% 4,616 209.04 2,410 3,184 3,368 3,849 4,388 4,991 5,750 6,514 7,268 8,171 112.3% 4,322 209.05 2,516 3,318 3,720 4,068 4,798 5,591 6,618 7,889 8,520 9,450 132.3% 5,382 209.06 3,545 4,008 4,106 4,934 5,516 6,749 7,994 8,786 9,871 10,768 118.2% 5,834 209.07 2,466 5,848 6,636 8,363 9,878 10,606 11,288 11,958 13,151 14,543 73.9% 6,180 209.08 2,354 3,148 3,555 4,251 4,722 5,212 5,903 6,816 8,250 9,956 134.2% 5,705 Total 16,811 24,185 26,214 31,315 35,813 40,368 45,304 50,284 56,477 63,354 102.3% 32,039
Sector 13a: Gilbert
% Change Difference
Census Tract 2000 2010 2015 2020 2025 2030 2035 2040 2045 2050 2020-2050
2020-2050
213.03 2,692 3,272 3,572 4,846 6,250 7,198 8,411 9,609 10,884 11,992 147.5% 7,146 213.04 2,642 3,764 4,150 4,916 5,921 7,896 10,884 14,373 18,868 23,197 371.9% 18,281 213.05 2,184 2,852 2,866 3,314 3,612 3,909 4,239 4,508 6,149 8,498 156.4% 5,184 213.06 3,174 3,986 4,213 4,500 5,216 6,493 8,513 10,947 13,002 17,217 282.6% 12,717 213.07 1,538 1,927 2,106 2,317 2,496 2,711 2,950 3,153 4,013 5,750 148.2% 3,433 213.08 3,627 4,227 4,569 5,021 5,271 5,689 6,391 7,394 9,416 12,608 151.1% 7,587 Total 15,857 20,028 21,476 24,914 28,766 33,896 41,388 49,984 62,332 79,262 218.1% 54,348
59
Sector 13b: Batesburg-Leesville
% Change Difference
Census Tract 2000 2010 2015 2020 2025 2030 2035 2040 2045 2050 2020-2050
2020-2050
214.02 3,990 3,949 4,155 3,998 4,059 4,150 4,225 4,353 4,463 4,551 13.8% 553 214.03 1,987 2,118 2,246 2,331 2,475 2,662 2,796 2,971 3,248 3,589 54.0% 1,258 214.04 3,061 3,109 3,280 3,250 3,356 3,488 3,650 3,779 3,973 4,373 34.6% 1,123 Total 9,038 9,176 9,681 9,579 9,890 10,300 10,671 11,103 11,684 12,513 30.6% 2934
Sector 14: Whitmire
% Change Difference
Census Tract 2000 2010 2015 2020 2025 2030 2035 2040 2045 2050 2020-2050
2020-2050
9503 3,753 3,351 3,435 3,450 3,508 3,675 3,775 3,835 3,922 4,100 18.8% 650
Sector 15: Chappells
% Change Difference
Census Tract 2000 2010 2015 2020 2025 2030 2035 2040 2045 2050 2020-2050
2020-2050
9507 4,211 4,028 4,100 4,180 4,230 4,300 4,384 4,500 4,600 4,700 12.4% 520
60
Sector 16: Newberry
% Change Difference
Census Tract 2000 2010 2015 2020 2025 2030 2035 2040 2045 2050 2020-2050
2020-2050
9502.01 2,253 2,615 2,630 2,700 2,800 2,950 3,125 3,225 3,325 3,450 27.8% 750 9502.02 7,135 7,391 7,495 7,590 7,800 7,925 8,150 8,241 8,500 8,750 15.3% 1,160 9505.02 5,983 5,746 5,850 5,967 6,150 6,260 6,325 6,475 6,600 6,725 12.7% 758
Total 15,371 15,752 15,975 16,257 16,750 17,135 17,600 17,941 18,425 18,925 16.4% 2,668
Sector 17: Prosperity/Pomaria
% Change Difference
Census Tract 2000 2010 2015 2020 2025 2030 2035 2040 2045 2050 2020-2050
2020-2050
9501 3,378 3,631 3,775 3,875 4,125 4,252 4,400 4,475 4,625 4,726 22.0% 851 9506.01 4,264 4,869 5,300 5,575 6,050 6,400 6,825 7,250 7,550 7,850 40.8% 2,275 9506.02 5,131 5,877 6,650 7,275 8,000 8,600 9,000 9,400 9,700 9,950 36.8% 2,675
Total 12,773 14,377 15,725 16,725 18,175 19,252 20,225 21,125 21,875 22,526 34.7% 5,801
Sector 18: Monticello
% Change Difference
Census Tract 2000 2010 2015 2020 2025 2030 2035 2040 2045 2050 2020-2050
2020-2050
9601 2,217 2,209 2,244 2,250 2,275 2,335 2,350 2,360 2,395 2,435 8.2% 185
61
Sector 19: Winnsboro
% Change Difference
Census Tract 2000 2010 2015 2020 2025 2030 2035 2040 2045 2050 2020-2050
2020-2050
9602 4,094 4,043 4,106 4,120 4,145 4,165 4,180 4,200 4,236 4,274 3.7% 154 9604 6,635 6,273 6,180 6,220 6,320 6,355 6,380 6,415 6,495 6,550 5.3% 330 9605 5,219 5,275 5,264 5,277 5,345 5,375 5,416 5,490 5,625 5,715 8.3% 438 Total 15,948 15,591 15,550 15,617 15,810 15,895 15,976 16,105 16,356 16,539 5.9% 922
Sector 20: Ridgeway
% Change Difference
Census Tract 2000 2010 2015 2020 2025 2030 2035 2040 2045 2050 2020-2050
2020-2050
9603 5,289 6,156 6,520 6,630 7,000 7,091 7,250 7,400 7,750 7,950 19.9% 1,320
62
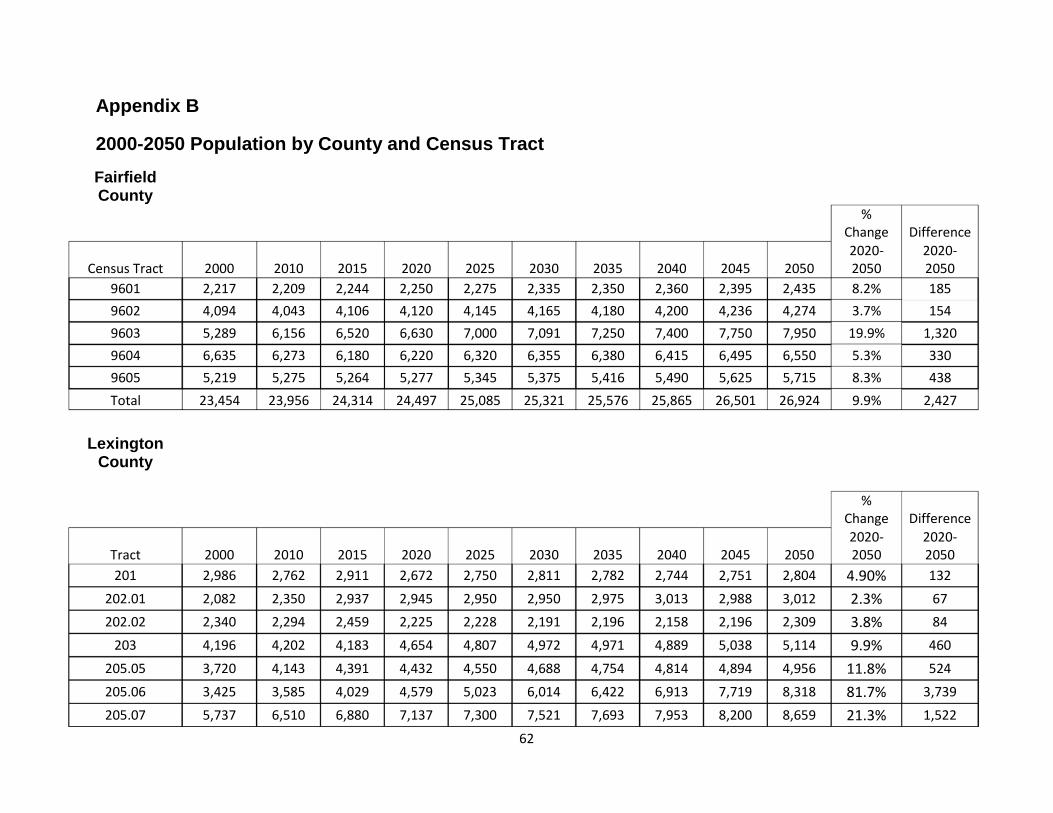
Appendix B
2000-2050 Population by County and Census Tract
Fairfield County
% Change Difference
Census Tract 2000 2010 2015 2020 2025 2030 2035 2040 2045 2050 2020-2050
2020-2050
9601 2,217 2,209 2,244 2,250 2,275 2,335 2,350 2,360 2,395 2,435 8.2% 185 9602 4,094 4,043 4,106 4,120 4,145 4,165 4,180 4,200 4,236 4,274 3.7% 154 9603 5,289 6,156 6,520 6,630 7,000 7,091 7,250 7,400 7,750 7,950 19.9% 1,320 9604 6,635 6,273 6,180 6,220 6,320 6,355 6,380 6,415 6,495 6,550 5.3% 330 9605 5,219 5,275 5,264 5,277 5,345 5,375 5,416 5,490 5,625 5,715 8.3% 438 Total 23,454 23,956 24,314 24,497 25,085 25,321 25,576 25,865 26,501 26,924 9.9% 2,427
Lexington County
% Change Difference
Tract 2000 2010 2015 2020 2025 2030 2035 2040 2045 2050 2020-2050
2020-2050
201 2,986 2,762 2,911 2,672 2,750 2,811 2,782 2,744 2,751 2,804 4.90% 132
202.01 2,082 2,350 2,937 2,945 2,950 2,950 2,975 3,013 2,988 3,012 2.3% 67 202.02 2,340 2,294 2,459 2,225 2,228 2,191 2,196 2,158 2,196 2,309 3.8% 84
203 4,196 4,202 4,183 4,654 4,807 4,972 4,971 4,889 5,038 5,114 9.9% 460
205.05 3,720 4,143 4,391 4,432 4,550 4,688 4,754 4,814 4,894 4,956 11.8% 524
205.06 3,425 3,585 4,029 4,579 5,023 6,014 6,422 6,913 7,719 8,318 81.7% 3,739
205.07 5,737 6,510 6,880 7,137 7,300 7,521 7,693 7,953 8,200 8,659 21.3% 1,522
63
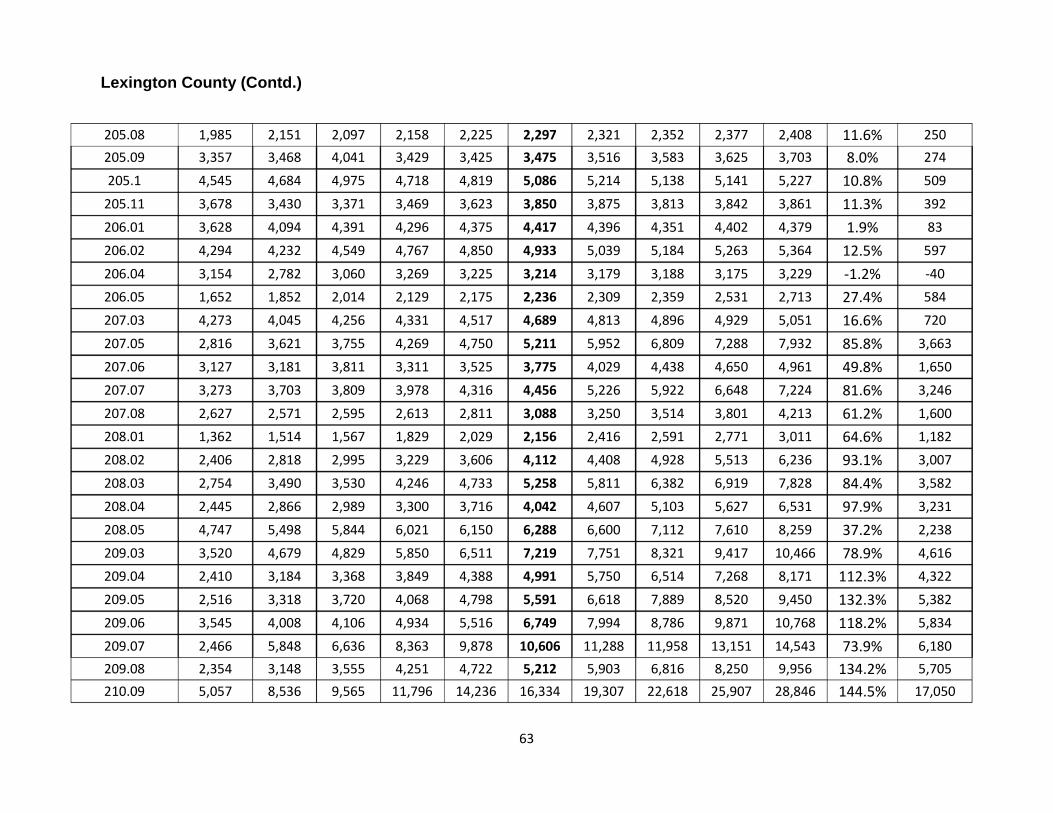
205.08 1,985 2,151 2,097 2,158 2,225 2,297 2,321 2,352 2,377 2,408 11.6% 250 205.09 3,357 3,468 4,041 3,429 3,425 3,475 3,516 3,583 3,625 3,703 8.0% 274
205.1 4,545 4,684 4,975 4,718 4,819 5,086 5,214 5,138 5,141 5,227 10.8% 509
205.11 3,678 3,430 3,371 3,469 3,623 3,850 3,875 3,813 3,842 3,861 11.3% 392
206.01 3,628 4,094 4,391 4,296 4,375 4,417 4,396 4,351 4,402 4,379 1.9% 83
206.02 4,294 4,232 4,549 4,767 4,850 4,933 5,039 5,184 5,263 5,364 12.5% 597
206.04 3,154 2,782 3,060 3,269 3,225 3,214 3,179 3,188 3,175 3,229 -1.2% -40 206.05 1,652 1,852 2,014 2,129 2,175 2,236 2,309 2,359 2,531 2,713 27.4% 584
207.03 4,273 4,045 4,256 4,331 4,517 4,689 4,813 4,896 4,929 5,051 16.6% 720
207.05 2,816 3,621 3,755 4,269 4,750 5,211 5,952 6,809 7,288 7,932 85.8% 3,663
207.06 3,127 3,181 3,811 3,311 3,525 3,775 4,029 4,438 4,650 4,961 49.8% 1,650
207.07 3,273 3,703 3,809 3,978 4,316 4,456 5,226 5,922 6,648 7,224 81.6% 3,246
207.08 2,627 2,571 2,595 2,613 2,811 3,088 3,250 3,514 3,801 4,213 61.2% 1,600 208.01 1,362 1,514 1,567 1,829 2,029 2,156 2,416 2,591 2,771 3,011 64.6% 1,182
208.02 2,406 2,818 2,995 3,229 3,606 4,112 4,408 4,928 5,513 6,236 93.1% 3,007
208.03 2,754 3,490 3,530 4,246 4,733 5,258 5,811 6,382 6,919 7,828 84.4% 3,582
208.04 2,445 2,866 2,989 3,300 3,716 4,042 4,607 5,103 5,627 6,531 97.9% 3,231
208.05 4,747 5,498 5,844 6,021 6,150 6,288 6,600 7,112 7,610 8,259 37.2% 2,238
209.03 3,520 4,679 4,829 5,850 6,511 7,219 7,751 8,321 9,417 10,466 78.9% 4,616 209.04 2,410 3,184 3,368 3,849 4,388 4,991 5,750 6,514 7,268 8,171 112.3% 4,322
209.05 2,516 3,318 3,720 4,068 4,798 5,591 6,618 7,889 8,520 9,450 132.3% 5,382
209.06 3,545 4,008 4,106 4,934 5,516 6,749 7,994 8,786 9,871 10,768 118.2% 5,834
209.07 2,466 5,848 6,636 8,363 9,878 10,606 11,288 11,958 13,151 14,543 73.9% 6,180 209.08 2,354 3,148 3,555 4,251 4,722 5,212 5,903 6,816 8,250 9,956 134.2% 5,705 210.09 5,057 8,536 9,565 11,796 14,236 16,334 19,307 22,618 25,907 28,846 144.5% 17,050
Lexington County (Contd.)
64
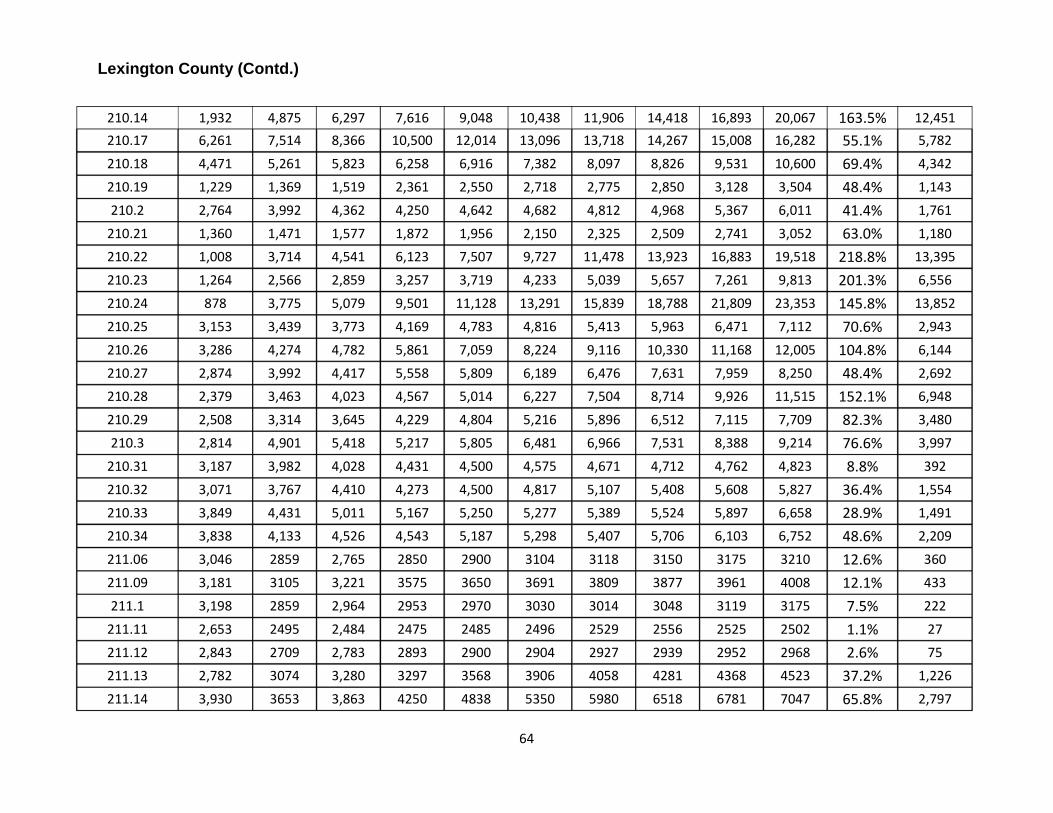
Lexington County (Contd.)
210.14 1,932 4,875 6,297 7,616 9,048 10,438 11,906 14,418 16,893 20,067 163.5% 12,451 210.17 6,261 7,514 8,366 10,500 12,014 13,096 13,718 14,267 15,008 16,282 55.1% 5,782
210.18 4,471 5,261 5,823 6,258 6,916 7,382 8,097 8,826 9,531 10,600 69.4% 4,342
210.19 1,229 1,369 1,519 2,361 2,550 2,718 2,775 2,850 3,128 3,504 48.4% 1,143
210.2 2,764 3,992 4,362 4,250 4,642 4,682 4,812 4,968 5,367 6,011 41.4% 1,761
210.21 1,360 1,471 1,577 1,872 1,956 2,150 2,325 2,509 2,741 3,052 63.0% 1,180 210.22 1,008 3,714 4,541 6,123 7,507 9,727 11,478 13,923 16,883 19,518 218.8% 13,395
210.23 1,264 2,566 2,859 3,257 3,719 4,233 5,039 5,657 7,261 9,813 201.3% 6,556
210.24 878 3,775 5,079 9,501 11,128 13,291 15,839 18,788 21,809 23,353 145.8% 13,852
210.25 3,153 3,439 3,773 4,169 4,783 4,816 5,413 5,963 6,471 7,112 70.6% 2,943
210.26 3,286 4,274 4,782 5,861 7,059 8,224 9,116 10,330 11,168 12,005 104.8% 6,144
210.27 2,874 3,992 4,417 5,558 5,809 6,189 6,476 7,631 7,959 8,250 48.4% 2,692 210.28 2,379 3,463 4,023 4,567 5,014 6,227 7,504 8,714 9,926 11,515 152.1% 6,948
210.29 2,508 3,314 3,645 4,229 4,804 5,216 5,896 6,512 7,115 7,709 82.3% 3,480
210.3 2,814 4,901 5,418 5,217 5,805 6,481 6,966 7,531 8,388 9,214 76.6% 3,997
210.31 3,187 3,982 4,028 4,431 4,500 4,575 4,671 4,712 4,762 4,823 8.8% 392
210.32 3,071 3,767 4,410 4,273 4,500 4,817 5,107 5,408 5,608 5,827 36.4% 1,554
210.33 3,849 4,431 5,011 5,167 5,250 5,277 5,389 5,524 5,897 6,658 28.9% 1,491 210.34 3,838 4,133 4,526 4,543 5,187 5,298 5,407 5,706 6,103 6,752 48.6% 2,209
211.06 3,046 2859 2,765 2850 2900 3104 3118 3150 3175 3210 12.6% 360
211.09 3,181 3105 3,221 3575 3650 3691 3809 3877 3961 4008 12.1% 433
211.1 3,198 2859 2,964 2953 2970 3030 3014 3048 3119 3175 7.5% 222
211.11 2,653 2495 2,484 2475 2485 2496 2529 2556 2525 2502 1.1% 27
211.12 2,843 2709 2,783 2893 2900 2904 2927 2939 2952 2968 2.6% 75 211.13 2,782 3074 3,280 3297 3568 3906 4058 4281 4368 4523 37.2% 1,226
211.14 3,930 3653 3,863 4250 4838 5350 5980 6518 6781 7047 65.8% 2,797
65
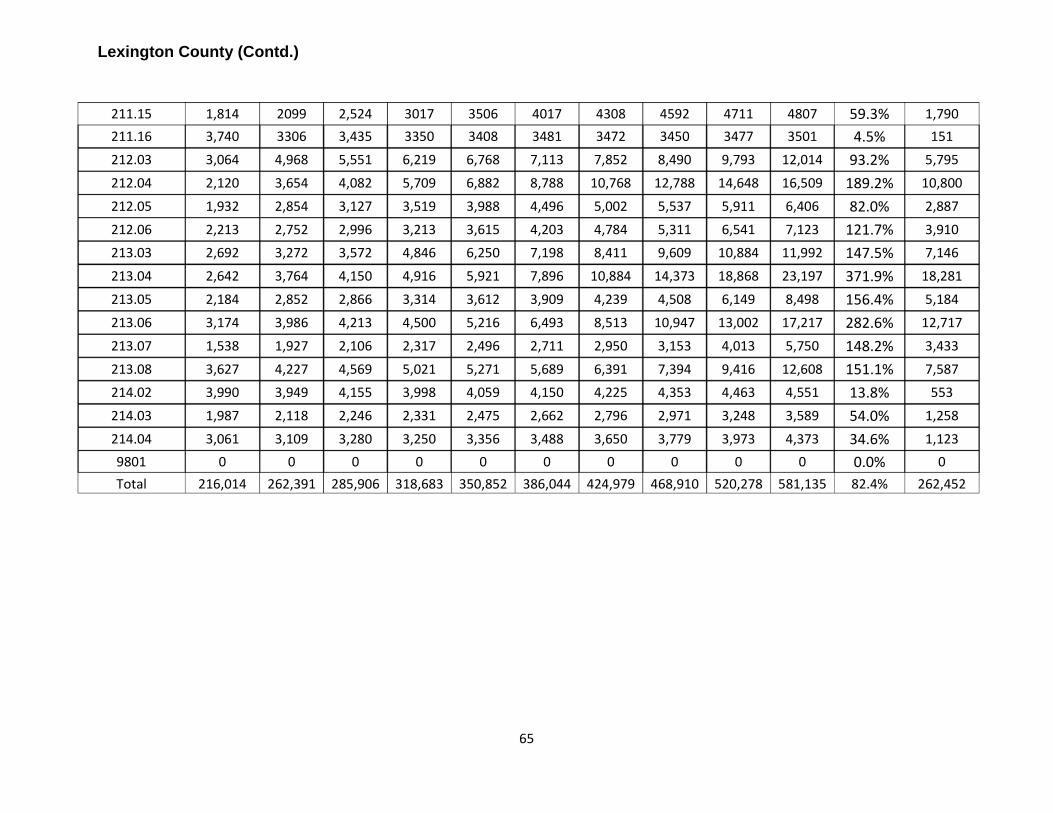
Lexington County (Contd.)
211.15 1,814 2099 2,524 3017 3506 4017 4308 4592 4711 4807 59.3% 1,790 211.16 3,740 3306 3,435 3350 3408 3481 3472 3450 3477 3501 4.5% 151
212.03 3,064 4,968 5,551 6,219 6,768 7,113 7,852 8,490 9,793 12,014 93.2% 5,795
212.04 2,120 3,654 4,082 5,709 6,882 8,788 10,768 12,788 14,648 16,509 189.2% 10,800
212.05 1,932 2,854 3,127 3,519 3,988 4,496 5,002 5,537 5,911 6,406 82.0% 2,887
212.06 2,213 2,752 2,996 3,213 3,615 4,203 4,784 5,311 6,541 7,123 121.7% 3,910 213.03 2,692 3,272 3,572 4,846 6,250 7,198 8,411 9,609 10,884 11,992 147.5% 7,146
213.04 2,642 3,764 4,150 4,916 5,921 7,896 10,884 14,373 18,868 23,197 371.9% 18,281
213.05 2,184 2,852 2,866 3,314 3,612 3,909 4,239 4,508 6,149 8,498 156.4% 5,184
213.06 3,174 3,986 4,213 4,500 5,216 6,493 8,513 10,947 13,002 17,217 282.6% 12,717
213.07 1,538 1,927 2,106 2,317 2,496 2,711 2,950 3,153 4,013 5,750 148.2% 3,433
213.08 3,627 4,227 4,569 5,021 5,271 5,689 6,391 7,394 9,416 12,608 151.1% 7,587 214.02 3,990 3,949 4,155 3,998 4,059 4,150 4,225 4,353 4,463 4,551 13.8% 553
214.03 1,987 2,118 2,246 2,331 2,475 2,662 2,796 2,971 3,248 3,589 54.0% 1,258
214.04 3,061 3,109 3,280 3,250 3,356 3,488 3,650 3,779 3,973 4,373 34.6% 1,123 9801 0 0 0 0 0 0 0 0 0 0 0.0% 0 Total 216,014 262,391 285,906 318,683 350,852 386,044 424,979 468,910 520,278 581,135 82.4% 262,452
66
Newberry County
% Change Difference
Tract 2000 2010 2015 2020 2025 2030 2035 2040 2045 2050 2020-2050
2020-2050
9501 3,378 3,631 3,775 3,875 4,125 4,252 4,400 4,475 4,625 4,726 22.0% 851
9502.01 2,253 2,615 2,630 2,700 2,800 2,950 3,125 3,225 3,325 3,450 27.8% 750
9502.02 7,135 7,391 7,495 7,590 7,800 7,925 8,150 8,241 8,500 8,750 15.3% 1,160 9503 3,753 3,351 3,435 3,450 3,508 3,675 3,775 3,835 3,922 4,100 18.8% 650
9505.02 5,983 5,746 5,850 5,967 6,150 6,260 6,325 6,475 6,600 6,725 12.7% 758
9506.01 4,264 4,869 5,300 5,575 6,050 6,400 6,825 7,250 7,550 7,850 40.8% 2,275
9506.02 5,131 5,877 6,650 7,275 8,000 8,600 9,000 9,400 9,700 9,950 36.8% 2,675 9507 4,211 4,028 4,100 4,180 4,230 4,300 4,384 4,500 4,600 4,700 12.4% 520 Total 36,108 37,508 39,235 40,612 42,663 44,362 45,984 47,401 48,822 50,251 23.7% 9,639
Richland County
% Change Difference
Tract 2000 2010 2015 2020 2025 2030 2035 2040 2045 2050 2020-2050
2020-2050
1 2,919 2,467 2,457 2,600 2,850 2,975 3,215 3,450 3,675 3,929 51.1% 1,329
2 1,686 1,494 1,596 1,673 1,825 1,976 2,200 2,450 2,619 3,084 84.3% 1,411
3 3,122 2,876 2,928 3,057 3,417 3,547 3,900 4,085 4,250 4,750 55.4% 1,693 4 2,036 1,876 1,969 2,099 2,252 2,467 2,640 2,700 2,805 3,050 45.3% 951
5 2,662 2,194 2,332 2,550 2,767 2,900 3,075 3,200 3,450 3,900 52.9% 1,350
6 2,092 2,332 2,556 2,734 2,988 3,125 3,350 3,450 3,628 3,983 45.7% 1,249
7 2,291 1,736 1,834 1,956 2,571 3,250 3,700 3,850 4,118 4,682 139.4% 2,726
67
Richland County (Contd.)
9 2,513 2,372 2,441 2,530 2,650 2,802 3,100 3,200 3,320 3,678 45.4% 1,148 10 4,645 3,535 3,692 3,701 3,965 4,217 4,526 4,650 4,896 5,080 37.3% 1,379
11 4,658 4,043 4,142 4,389 4,422 4,619 4,675 4,733 4,964 5,324 21.3% 935
12 1,704 1,820 1,939 2,180 2,475 3,000 3,800 4,374 4,580 4,843 122.2% 2,663 13 2,974 2,610 2,620 2,700 2,850 3,282 3,320 3,706 3,998 4,200 55.6% 1,500
16 703 1,236 1,294 2,149 2,879 3,565 5,300 5,950 7,086 7,855 265.5% 5,706
21 2,574 2,683 2,823 3,035 3,307 3,500 3,625 3,934 4,135 4,430 46.0% 1,395
22 1,407 1,278 1,291 1,401 1,590 1,850 2,100 2,484 2,798 2,996 113.8% 1,595
23 2,261 2,187 2,293 2,466 2,583 2,899 3,130 3,389 3,650 3,876 57.2% 1,410
24 3,971 3,905 4,413 4,675 4,810 5,279 5,450 5,894 6,087 6,378 36.4% 1,703 25 3,578 3,694 3,902 4,165 4,344 4,521 4,675 4,934 5,123 5,689 36.6% 1,524
26.02 3,150 2,957 3,243 3,450 3,500 3,775 3,796 3,840 3,920 4,000 15.9% 550
26.03 4,144 4,058 4,226 4,365 4,400 4,450 4,475 4,535 4,650 4,750 8.8% 385
26.04 1,720 1,697 2,034 2,088 2,112 2,150 2,175 2,211 2,286 2,375 13.7% 287
27 3,440 2,982 3,157 3,650 3,854 4,601 5,023 5,995 6,250 6,975 91.1% 3,325
28 4,149 6,455 6,914 7,935 8,735 10,013 10,901 11,848 12,687 14,532 83.1% 6,597 29 3,113 3,232 3,160 4,665 5,865 7,220 8,250 9,300 11,598 13,485 189.1% 8,820
30 3,377 2,852 2,919 3,246 3,517 3,975 4,298 4,549 4,862 5,489 69.1% 2,243
31 1,102 1,213 1,280 2,855 3,150 3,456 4,028 5,208 6,513 7,214 152.7% 4,359
101.02 3,367 6,219 7,352 10,689 14,478 18,838 23,063 28,445 35,901 39,725 271.6% 29,036
101.03 6,615 17,155 20,376 25,356 27,748 28,795 29,745 30,880 31,750 32,435 27.9% 7,079
101.04 2,738 3,857 4,350 5,455 7,099 9,127 10,475 12,948 14,225 16,590 204.1% 11,135 102 5,308 5505 5,874 7,250 8,300 9,400 11,250 13,150 18,150 21,238 192.9% 13,988
103.04 6,014 7,126 7,232 7,382 7,535 7,601 7,785 7,825 7,900 8,240 11.6% 858
103.05 6,787 7,004 7,471 7,913 8,348 9,225 9,870 10,001 10,660 11,800 49.1% 3,887
103.06 4,666 7,923 10,201 13,957 16,837 18,289 21,313 23,150 24,646 26,746 91.6% 12,789
68
Richland County (Contd.)
103.07 5,015 8,372 9,920 12,027 13,533 15,740 16,920 18,692 20,980 24,134 100.7% 12,107 103.08 3,213 5,857 6,118 6,643 7,047 7,745 8,162 8,572 8,750 8,925 34.4% 2,282
103.09 6,969 8,948 9,128 9,378 9,500 9,700 9,850 9,910 9,910 9,950 6.1% 572
104.03 3,826 3,875 4,115 4,200 4,270 4,330 4,400 4,525 4,625 4,650 10.7% 450
104.07 4,414 4,284 4,611 4,760 4,850 5,030 5,125 5,200 5,350 5,500 15.5% 740
104.08 4,733 6,166 5,786 5,800 5,800 5,800 5,800 5,700 5,700 5,500 -5.2% -300 104.09 1,808 1,604 1,807 1,880 1,915 1,950 1,990 2,000 2,063 2,100 11.7% 220
104.1 3,433 3,781 4,228 4,350 4,415 4,520 4,625 4,700 5,000 5,100 17.2% 750
104.11 3,310 3,174 2,954 3,140 3,170 3,210 3,300 3,340 3,500 3,500 11.5% 360
104.12 3,357 3,159 2,950 3,125 3,300 3,390 3,495 3,718 3,895 4,045 29.4% 920
104.13 1,787 1,989 2,194 2,245 2,380 2,480 2,600 2,850 3,200 3,400 51.4% 1,155
105.01 2,330 1,989 2,042 2,253 2,347 2,475 2,615 2,900 3,327 3,575 58.7% 1,322 105.02 926 643 685 1,090 1,300 1,425 1,550 1,660 1,800 2,095 92.2% 1,005
106 5,541 4,862 4,960 5,060 5,290 5,475 5,612 5,875 6,014 6,399 26.5% 1,339
107.01 3,100 3,018 2,913 3,048 3,357 3,552 3,712 4,412 5,087 5,795 90.1% 2,747
107.02 3,786 3,656 3,778 3,899 4,121 4,485 4,885 5,788 7,186 7,405 89.9% 3,506
107.03 3,748 3,450 3,548 3,600 3,850 4,053 4,199 4,450 4,800 5,100 41.7% 1,500
108.03 2,454 2,127 2,157 2,402 2,552 2,682 3,387 3,972 4,300 4,531 88.6% 2,129 108.04 2,598 2,405 2,481 2,588 2,613 2,691 2,715 2,975 3,085 3,295 27.3% 707
108.05 1,642 2,445 2,458 2,647 2,699 2,802 3,045 3,295 3,475 3,775 42.6% 1,128
108.06 1,520 555 521 867 888 925 975 1,100 1,300 1,500 73.0% 633
109 2,886 2,884 3,100 3,350 3,475 3,680 3,825 3,880 4,125 4,465 33.3% 1,115
110 1,688 1,551 1,587 1,651 1,783 1,956 2,076 2,185 2,277 2,681 62.4% 1,030
111.01 3,611 3,521 3,588 3,586 3,617 3,883 3,975 4,293 4,244 4,483 25.0% 897 111.02 3,557 3,386 3,747 3,867 4,219 4,500 4,835 5,207 5,359 5,609 45.0% 1,742
112.01 1,949 1,895 2,223 2,321 2,429 2,780 2,895 3,160 3,394 3,688 58.9% 1,367
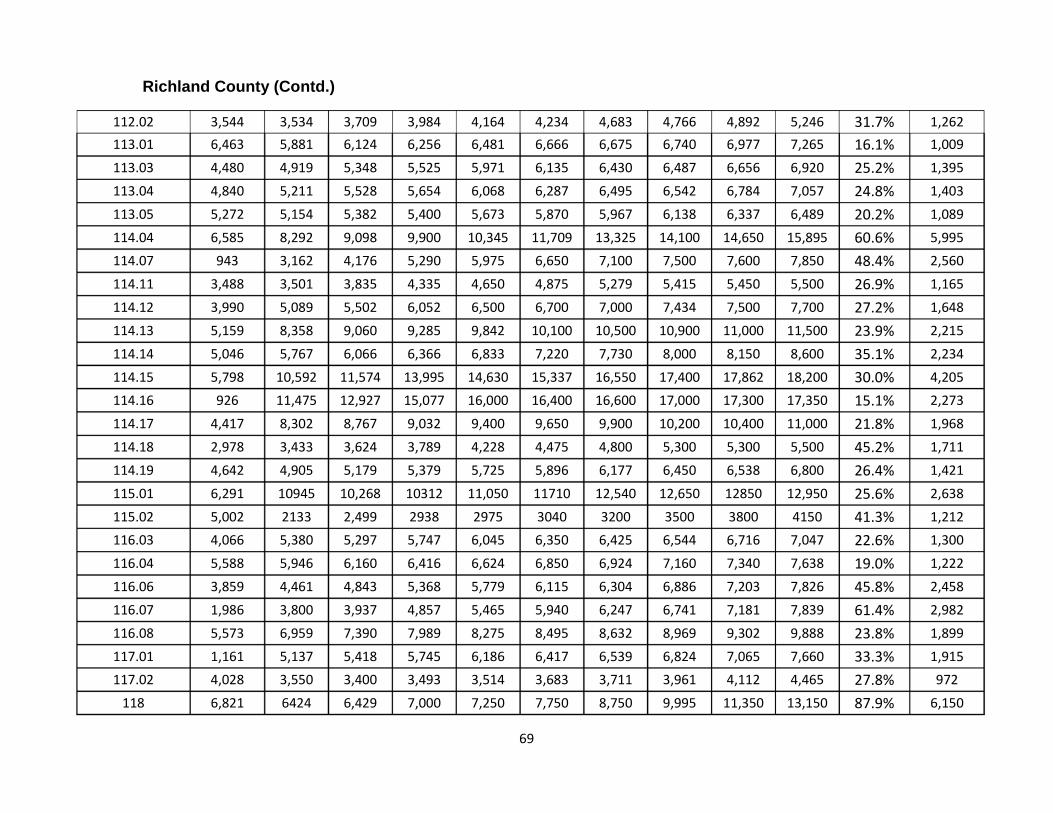
69
Richland County (Contd.)
112.02 3,544 3,534 3,709 3,984 4,164 4,234 4,683 4,766 4,892 5,246 31.7% 1,262 113.01 6,463 5,881 6,124 6,256 6,481 6,666 6,675 6,740 6,977 7,265 16.1% 1,009
113.03 4,480 4,919 5,348 5,525 5,971 6,135 6,430 6,487 6,656 6,920 25.2% 1,395
113.04 4,840 5,211 5,528 5,654 6,068 6,287 6,495 6,542 6,784 7,057 24.8% 1,403
113.05 5,272 5,154 5,382 5,400 5,673 5,870 5,967 6,138 6,337 6,489 20.2% 1,089
114.04 6,585 8,292 9,098 9,900 10,345 11,709 13,325 14,100 14,650 15,895 60.6% 5,995 114.07 943 3,162 4,176 5,290 5,975 6,650 7,100 7,500 7,600 7,850 48.4% 2,560
114.11 3,488 3,501 3,835 4,335 4,650 4,875 5,279 5,415 5,450 5,500 26.9% 1,165
114.12 3,990 5,089 5,502 6,052 6,500 6,700 7,000 7,434 7,500 7,700 27.2% 1,648
114.13 5,159 8,358 9,060 9,285 9,842 10,100 10,500 10,900 11,000 11,500 23.9% 2,215
114.14 5,046 5,767 6,066 6,366 6,833 7,220 7,730 8,000 8,150 8,600 35.1% 2,234
114.15 5,798 10,592 11,574 13,995 14,630 15,337 16,550 17,400 17,862 18,200 30.0% 4,205 114.16 926 11,475 12,927 15,077 16,000 16,400 16,600 17,000 17,300 17,350 15.1% 2,273
114.17 4,417 8,302 8,767 9,032 9,400 9,650 9,900 10,200 10,400 11,000 21.8% 1,968
114.18 2,978 3,433 3,624 3,789 4,228 4,475 4,800 5,300 5,300 5,500 45.2% 1,711
114.19 4,642 4,905 5,179 5,379 5,725 5,896 6,177 6,450 6,538 6,800 26.4% 1,421
115.01 6,291 10945 10,268 10312 11,050 11710 12,540 12,650 12850 12,950 25.6% 2,638
115.02 5,002 2133 2,499 2938 2975 3040 3200 3500 3800 4150 41.3% 1,212 116.03 4,066 5,380 5,297 5,747 6,045 6,350 6,425 6,544 6,716 7,047 22.6% 1,300
116.04 5,588 5,946 6,160 6,416 6,624 6,850 6,924 7,160 7,340 7,638 19.0% 1,222
116.06 3,859 4,461 4,843 5,368 5,779 6,115 6,304 6,886 7,203 7,826 45.8% 2,458
116.07 1,986 3,800 3,937 4,857 5,465 5,940 6,247 6,741 7,181 7,839 61.4% 2,982
116.08 5,573 6,959 7,390 7,989 8,275 8,495 8,632 8,969 9,302 9,888 23.8% 1,899
117.01 1,161 5,137 5,418 5,745 6,186 6,417 6,539 6,824 7,065 7,660 33.3% 1,915 117.02 4,028 3,550 3,400 3,493 3,514 3,683 3,711 3,961 4,112 4,465 27.8% 972
118 6,821 6424 6,429 7,000 7,250 7,750 8,750 9,995 11,350 13,150 87.9% 6,150
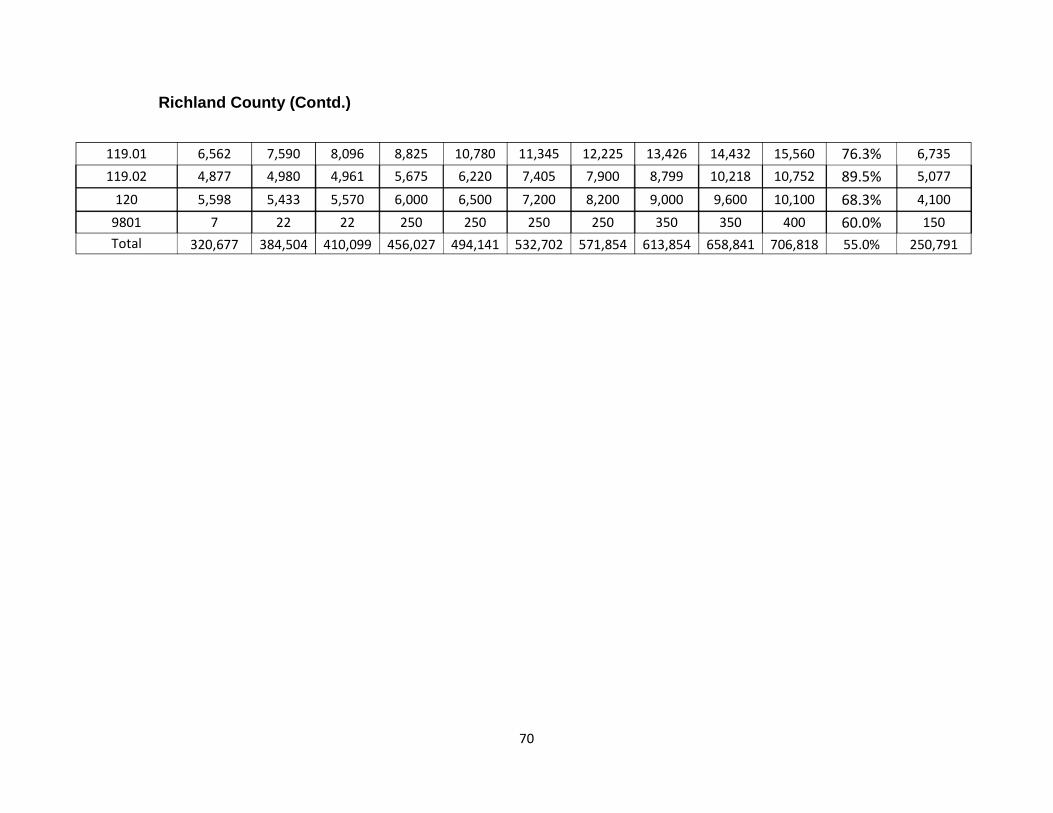
70
Richland County (Contd.)
119.01 6,562 7,590 8,096 8,825 10,780 11,345 12,225 13,426 14,432 15,560 76.3% 6,735 119.02 4,877 4,980 4,961 5,675 6,220 7,405 7,900 8,799 10,218 10,752 89.5% 5,077
120 5,598 5,433 5,570 6,000 6,500 7,200 8,200 9,000 9,600 10,100 68.3% 4,100 9801 7 22 22 250 250 250 250 350 350 400 60.0% 150 Total 320,677 384,504 410,099 456,027 494,141 532,702 571,854 613,854 658,841 706,818 55.0% 250,791