Embed Size (px)
Citation preview

PopulationChapters 6 and 22
Also see:Pgs 52-53, 108-115

Where did I get my data?CIA - The World Factbook
WHO
The World Bank

Nature exists at several levels of complexity

Populations are Dynamic➢ Population ecology - the study of factors that cause
populations to increase or decrease● Inputs - births and immigration● Outputs - deaths and emigration
➢ If inputs exceed outputs, population grows
➢ If deaths and emigration exceed births, population will decline

Species Distribution

Population Characteristics➢ Population Size (N) - the total number of individuals
within a defined area at a given time➢ Population Density - the number of individuals per unit
area at a given time. Can help to see if rare or abundant.➢ Population distribution - how individuals are distributed
to one another.➢ Population sex ratio - the ratio of males to females➢ Population age structure - how many individuals fit into
particular age categories

Factors that Influence Population Size➢ Density Dependent Factors - the size of the population will
influence an individual's probability of survival. Includes food, water, nesting area, nutrients
➢ Limiting resource - one a population cannot live without and which occurs in quantities lower than the pop would need to increase in size. If this decreases, so does the size of the population
➢ Density-Independent factors - the size of the population has no effect on the individual’s probability of survival. Includes tornadoes, fires, floods, volcanoes.

Exponential Growth Model➢ Growth rate - the number of offspring an individual can produce in
a given time period, minus the deaths of the individual or offspring, during the same period
➢ Intrinsic growth rate (r) - under ideal conditions, with unlimited resources, the maximum potential for growth
➢ Under ideal conditions, a high number of births and low number of deaths produce a high population growth rate. When resources are limited, the population’s growth rate will be lower than the intrinisic growth rate because individuals will have fewer offspring and deaths will increase.

Exponential Growth Model➢ Nt = N0ert
➢ r = intrinsic rate of growth➢ t = time➢ N0 = current population➢ Nt = future population➢ e = base of natural log (ex)

Exponential Growth Model➢ J-shaped curve - when graphed, the exponential growth model
looks like this➢ Density-independent
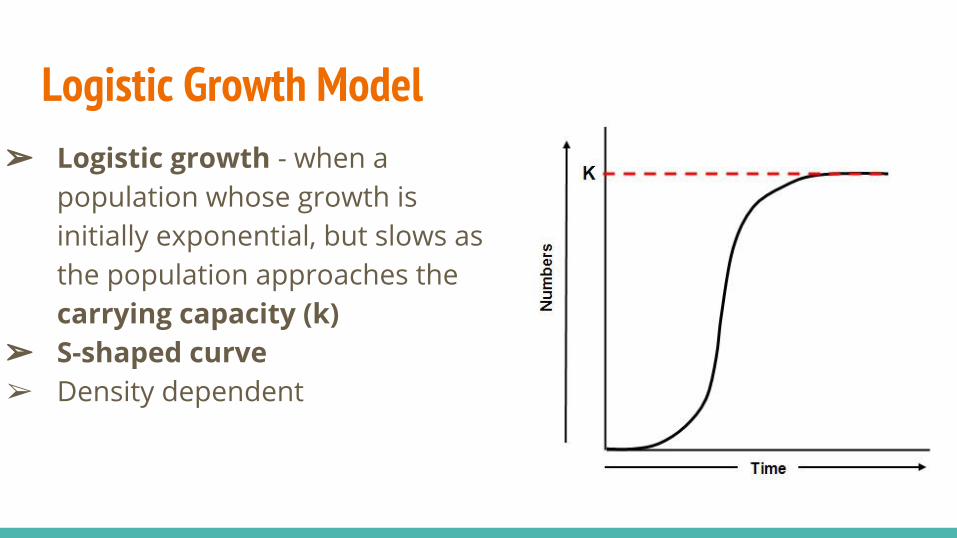
Logistic Growth Model➢ Logistic growth - when a
population whose growth is initially exponential, but slows as the population approaches the carrying capacity (k)
➢ S-shaped curve➢ Density dependent

Variations of the Logistic Growth Model➢ If food becomes scarce, the
population will experience an overshoot by becoming larger than the carrying capacity and will result in a die-off, or population crash

Reproductive strategies➢ K-selected species - the
population of a species that grows slowly until it reaches the carrying capacity.
➢ Examples - elephants, whales, humans, bears, etc

Reproductive strategies➢ r-selected species - the
population of a species that grows quickly and is often followed by overshoots and die-offs
➢ Examples - mosquitoes, cockroaches, dandelions

Survivorship Curves➢ Type I (late loss) - high survival rates and die in
old age; K-selected➢ Type II (constant loss) - experience a constant
decline throughout life span➢ Type III (early loss) - many don’t reach adulthood
and experience low survivorship early in life; r-selected


Chapter 6The Human Population & Its Impact
The problems to be faced are vast and complex, but come down to this: 6.7 billion people are breeding exponentially.
The process of fulfilling their wants and needs is stripping earth of its biotic capacity to support life;
A climactic burst of consumption by a single species is overwhelming the skies, earth, waters, and fauna.
- Paul Hawken

7,445,007,330People at the time of this PowerPoint (8/21/16)
http://www.worldometers.info/world-population/

7,445,007,330...is that too many?

Developed vs Developing- Developed countries - countries with relatively high levels of
industrialization and income
- Developing countries - countries with relatively low levels of industrialization and income of less than $3 per person per day

How has the human population grown historically?A. Early hunter gatherers (before 10,000 years ago)
a. Growth was very slow; increased a little with the use of tools (they can spread)
b. Estimated between 5 and 10 million peopleB. Rise of agriculture (10,000 - 1,000 years ago)
a. Rapid growth due to increased food availabilityb. Increased to about 500 million people

How has the human population grown historically?C. Agriculture gives rise to cities
a. Food produced in country, consumed in cityi. Food wastes are no longer returned to soilii. Soil becomes less productive
b. Waste of population concentrated in citiesc. Population control in medieval societies
i. Infanticideii. Plagues

How has the human population grown historically?D. Industrialization (1,000 years ago; peak in the 1800s)
a. Technological advances led to huge jump in populationb. View of children during early phases of industrial phases of industrial
growthi. Valued as cheap source of income and labor ii. Exponential growth of populations
c. By 1900s, birth rate in industrialized world droppedi. Rise in standards of livingii. Safe & cheap means of birth control introducediii. Increase in the cost of child rearing


Factors for population increase- Ability to expand into new habitats and climate zones- Emergence of modern agriculture- Improved health care, sanitation, sources of water

Projections in 205010.7 billion
World population growth - 1.22%

What’s our carrying capacity? We...don’t know...
➢ Thomas Malthus (1798) said that the human population was growing exponentially while food supply was growing linearly. Eventually, we would run out of food

What’s our carrying capacity? We...don’t know...
Others say the growing population provides intellect and technology to increase food supply

Human Population DynamicsThere are just 3 sources of change in population size.
1) Fertility (births)2) Mortality (deaths)
● “Natural decrease” refers to population decline resulting from more deaths than births
3) Migration● Net migration is the number of immigrants minus
emigrants

Rates of Global Population Change- Crude birth rate (CBR) = # of births per 1000
individuals per year
- Crude death rate (CDR) = # of deaths per 1000 individuals per year
- Population Change = (b + i) - (d + e)

CBRPeak: 36.1 (1963)
2014: 19.3


Peak: 17.8 (1960)
2014: 7.74


In 2014,
Lowest CBR: Italy, Japan, Portugal (8)Highest CBR: Niger (49)
Lowest CDR: Bahrain (2)Highest CDR: Lesotho, Central African Republic, Ukraine (all tie at 15)
http://data.worldbank.org/indicator/SP.POP.TOTL?year_high_desc=true

Rates of Population Change- Global population growth rate = (CBR - CDR)/10
- National Population Growth Rate = (CBR + immigration) - (CDR + emigration) / 10
Curious why 10?It’s the same as if we divided 1000
by 100!


Uneven distribution of population growthDeveloped - 0.1% per year
Developing - 1.5% per year

Doubling Time- How many years it takes for a population to double
- Use the “Rule of 70”
- Doubling Time = 70 / growth rate

Changes in Population Sizes - EXAMPLES- Worldwide in 2009, there were 20 births and 8 deaths
for every 1,000 people

Changes in Population Sizes - EXAMPLES- Worldwide in 2009, there were 20 births and 8 deaths
for every 1,000 people
- Global Pop Rate = [CBR-CDR] / 10
- [20-8]/10 = 1.2%

Changes in Population Sizes - EXAMPLES- For a country with 50 births and 40 deaths for every
1,000 people, with 0 immigration and 6 emigration

Changes in Population Sizes - EXAMPLES- For a country with 50 births and 40 deaths for every
1,000 people, with 0 immigration and 6 emigration
- National Population Growth Rate = (CBR + immigration) - (CDR + emigration) / 10
- ([50+0] - [40+6]) / 10 = 0.4%

Changes in Population Sizes - EXAMPLES- What is the growth rate for a country with a doubling
time of 10 years?

Changes in Population Sizes - EXAMPLES- What is the growth rate for a country with a doubling
time of 10 years?
- 70 / time = 70 / 10 = 7%


Total Fertility Rate- Total Fertility Rate (TFR
- An estimate of the average number of children that each woman in a population will bear
- Average in developed countries: 1.3 - 2.0 - Higher with generous maternity leaves and subsidies for child
care, as in France and Norway- Average in developing countries: 3.8
- Lack of family planning- Worldwide: 2.45 (In 1964, it was 5.06) →
https://ourworldindata.org/grapher/children-per-woman-UN?year=2015


Replacement Fertility Rate- Total fertility rate required to offset the average number of deaths in
a population and or the current population size to remain stable- Typically is 2 to replace parents- A RFR of 2.1 for developed countries with low infant and child
mortality rates- The RFR is higher in developing countries due to higher mortality
rate of younger people (prereproductive mortality)

Factors Affecting Birth & Fertility Rates- Children part of labor force?- Cost of raising and educating children?- Availability of pension system?- Urbanization?- Educational and employment opportunities for women?- Infant mortality rates?- Availability of legal abortions and birth controls?- Beliefs, traditions, cultural norms?
World TFR has dropped from 5.7 to 1.6

Factors Affecting Death Rate- Increased life expectancy and lower infant mortality rate
- Food supplies and distribution- Better nutrition- Medical advances - Sanitation- Safer water supplies

Life Expectancy- The average number of years than an infant born in a particular year
in a particular country can be expected to live, given the current average life span and death rate of that country
2013
This is world → men historically have a shorter LE but the gap in developed countries is most likely going to narrowhttps://ourworldindata.org/grapher/life-expectancy?tab=map&year=2013

Infant Mortality Rate- Infant deaths per 1000 live births
- Infant: less than 1 year- Measure of a nation’s quality of life- As of 2015
- Global average - 32 - U.S. - 6- Angola - 96 (*Afghanistan?)- Lowest -2 (Sweden, Norway, Japan, Iceland, etc)
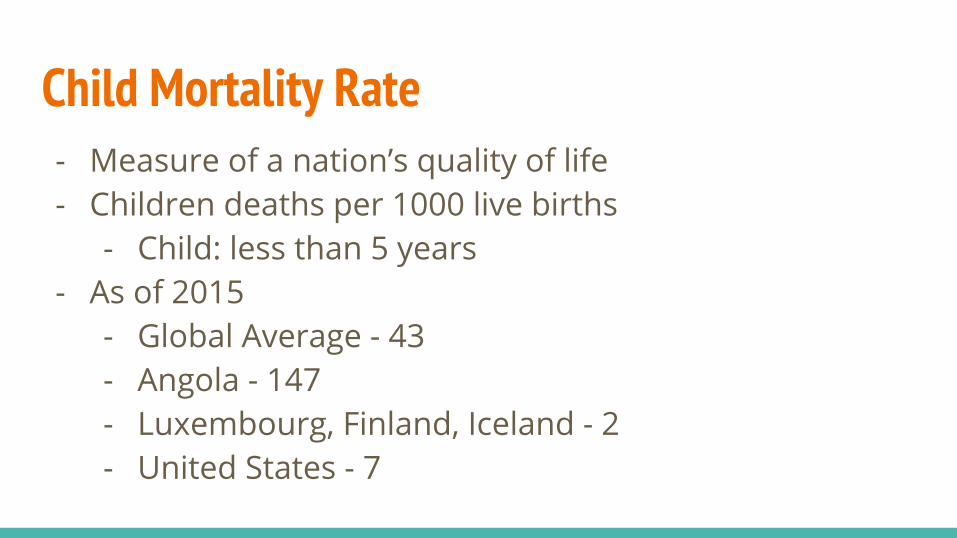
Child Mortality Rate- Measure of a nation’s quality of life- Children deaths per 1000 live births
- Child: less than 5 years- As of 2015
- Global Average - 43- Angola - 147- Luxembourg, Finland, Iceland - 2- United States - 7

Maternal Mortality Rate- Measure of a nation’s quality of life- Pregnancy related deaths per 100,000 live births- Rates
- Global Average - 216 (down from 385 in 1990)- Sierra Leone - 1,360 (2,630 in 1990)- Greece, Poland, Iceland, Finland - 3 (5-17 in 1990)- United States - 14 (12 in 1990, range has been
11-15)

In summary- The world population is growing at a rate of about
1.7%. - If this rate continues, the population will double in 42
years- Unabated, such a rate would lead to a point in about
2000 years, when the mass of humanity would weigh more, and be larger, than the Earth!
- BUT the growth rate is decreasing

Population Pyramids (Age Structure Diagrams)- Graphic device: bar graph- Shows the age and gender composition of a region- Pre-reproductive, reproductive, post-reproductive- Horizontal axis: gender
- Male: left hand, female: right hand- Absolute number of people or %
- Vertical Axis: age- 5 year or 10 year age groups


Data is coming from
http://www.census.gov/population/international/

Population Pyramid - High Growth (Angola)

Population Pyramid - Moderate Growth (Mexico)

Population Pyramid - Zero Growth (US)
“Stabilizing”,“Stationary”

Tracking the Baby-Boom Generation in the U.S.

Population Pyramids - Negative Growth (Italy)

Effects of Population Decline- As percentage of 60+ decline aged people increases,
population begins to decline- 60+ population increase → severe economic and social
problems because 60+ consume- More medical care- Social security- Costly public services
- Labor shortages require automation and immigration

More Problems- Economic growth- Labor shortages- Less government revenue- Less entreneurship- Less technology development- Higher pension and health care costs- Pensions cut, retirement age increased

The Graying of Japan- Family-planning access, cramped housing, expensive
land, late marriage, education cost → voluntary decrease in birth rate (pop could halve in 66 years)
- Low immigration rate- Health insurance and pension
- 45% of national income- Could lead to a lower economy
http://appleinsider.com/articles/15/04/30/apple-to-aid-japans-elderly-with-ipads-in-latest-fruits-of-ibm-alliance

The Demographic Transition- movement of a nation from high population growth to
low population as it develops economically- Transition as a result of 5 stages
- Stage 1: birth and death rates are both high- Stage 2 : Death rates fall; birth rates remain high;
growth rate rises- Stage 3-5: birth rates fall as standards of living rises;
growth rate continues to fall to zero or to a negative rate


The Demographic Transition- Used to be 4, now 5 stages- Birth rates, death rates, and growth rates
systematically change through time as societies change- Modernize, urbanize- Gain access to technology
- Shift in living conditions, infant mortality, economics, skilled workers, national debts

Stage 1- High birth rates, high (at times
erratic) death rates, low growth rates
- Stage for much of human history, traditional societies
- Practically no country today

Stage 2- High birth rates, declining death rates,
rising growth rates- Improvements in sanitation (water) and
medicine- In europe during Industrial Revolution- In developing countries since the 50s/60s- Much of Africa today, some countries of
Asia (Afghanistan, Nepal, etc)

Stage 3- Continued decline of death rates,
declining birth rates, growth rates decline from high to lower levels
- Change in behavior: adaptation to lower death rate, in particular infant mortality rate
- Economic change: urbanization (incentive to have fewer children)
- Mexico today

Stage 4- Low birth rates- Low death rates- Low growth rates- United States today

Stage 5- Low birth rates- Rising death rates- Declining growth rates (if birth
rates drop below death rates: negative rates)
- Several countries of Europe today (Austria)


Which transition correlates to which type of pyramid?

Demographic Trap- Population path of most less-developing countries- “Trapped” in Stage 2 of Demographic Transition
- Before 1970, LDCs seemed poised to make transition thanks to economic growth
- Since 1970, economic growth has not kept pace with population
- High birth and low death rates result in explosive population growth
- Downward spiral in standard of living

Demographic Fatigue- Condition characterized by a lack of financial resources
and an inability to deal effectively with threats such as natural catastrophes and disease
- Possibility that countries suffering from demographic fatigues could slip back into stage 1 of demographic transition

Family Planning- Measures enabling parents to control number of
children (if they so desire)- Goals of family planning
- Not to limit births- For couples to have health children- For couples to be able to care for their children- For couples to have the number of children that
they want

Pros and Cons - Reducing Births- Fertility reduction programs consume less than 1% of
national budgets- Controversy exists over whether earth can provide
adequate care for 3 billion people without massive environmental damage
- Economists encourage population growth- Consider people as valuable resource
- No agreement on optimum sustainable population

Pros and Cons - Reducing Births- Population regulation can violate religious beliefs- Population growth its threat to earth’s life support
systems- Should people have freedom to produce as many
offspring as desired? OR… will more offspring reduce quality of other people’s lives?

Pros and Cons - Reducing Births- U.S. National Academy of Sciences and the Royal
Society of London- Though population growth may not be the only
cause of environmental and resource problems, there is need for drastic changes to prevent accelerating environmental decline and then a rise in death rates, so…

Family planning - reduces births and abortions- 59% contraceptive use in developed countries - 46%
overall (up from 10% in 60s) - FP reduces children’s social services needs- FP reduces risk of childbearing deaths- FP effectiveness depends on program design and
funding- Good in some countries with good program- Poor in other countries

Rewards and Penalties to reduce birthsWhat might work
- Encourage, rather than coerce, people to have fewer children
- Reinforce existing customs and trends toward smaller families
- Don’t penalize for already existing larger family- Increase poor family’s economic status

Empowering women to reduce births- Women tend to have fewer, and healthier children,
when:- They have access to education and paying jobs
outside home- Their society doesn’t suppress women’s rights
- But women do most of the work- Not shown in GDP because of lower pay- Women excluded from economic and political
decision making

Case Studies - India - Family planning efforts began in 1952. The fertility rate
declined from 5.3 to population growth is still exponential → 1.9%
- Disappointing results due to:- Poor planning- Bureaucratic inefficiency- Low status of women- Extreme poverty- Lack of administrative & financial support

Case Studies - China- Family planning efforts began in
1970. The fertility rate declined from 5.7 to 1.8
- Population control program was extensive, intrusive, and strict- One-child family received benefits, penalties to 2+

China’s One Child Policy - What went wrong?- Wealthy residents could have many children,
impoverished are penalized- China’s “missing girls” - 100 million worldwide- Forced abortions and sterilizations (Huaiji)- “4-2-1” problem
Because of the issues → it is now a two-child policy

Cutting Global Population Growth- U.N Conference on Population and Development,
Cairo, 1994- 8 goals to be met by 2015
- Invest in family planning, reduction of infant/child/maternal mortality rates, reduce poverty, and education of women
http://www.unfpa.org/

“Short of thermonuclear war itself, rampant population growth is the gravest issue the world faces over the decades immediately ahead. If we do not act, the problem will be solved by famine, riots, insurrection and war”- Robert S. McNamara

Chapter 22Sustainable Cities
The city is not an ecological monstrosity. It is rather the place where both the problems and the opportunities of
modern technological civilizations are most potent and visible. - Peter Self

SustainabilityThe ability of all of earth’s various systems, including
human cultural systems and economics, to survive and adapt to changing environmental conditions indefinitely

Definitions- Urban (metropolitan) area - town plus its suburbs
- City - large number of people with a variety of professions who depend on resources from the outside of city boundary

Definitions- Rural area - area with a population less than 2,500
people- Village - groups of rural households linked by
custom, culture, family ties. Historical utilization of natural resources.

Urbanization and Urban Growth- Degree of urbanization is percentage of population
living in area of greater than 2500 people- Urban growth due to:
- Natural increase: births- Immigrations - poor are pulled to urban areas or
pushed from rural areas

Urbanization and Urban Growth- Trends of urban growth
- Increase of 2% to 45% of people in urban areas since 1950
- By 2050 about 66% of the world’s people will be living in urban areas

Urbanization and Urban Growth (2014)- The number of large cities is mushrooming
- Today , more than 400 cities have over 1 million or more people
- Megacities - over 10 million people - Hypercities - over 20 million people
- Tokyo - 38 million, Delhi - 25 million, Shanghai - 23 million Mexico City - 20 million, New York - 20 million), Mumbai/Mexico City/Sao Paulo - 21 million

Urbanization and Urban Growth- 2009: 38% of the people live in cities
- 2025 will be 25%- Many of these cities are already short on water, with
waste and pollution problems

Urbanization and Urban Growth- Urban growth is slower in developed countries
- 75% of the people live in cities, but by 2030 it will be 81%
- Poverty is becoming increasingly urbanized- Slums, squatter settlements, and shantytowns- At least 1 billion people live in crowded slums of
inner cities. No access to water, sewer, electricity, education, etc
- 100 million are homeless and sleep on the street
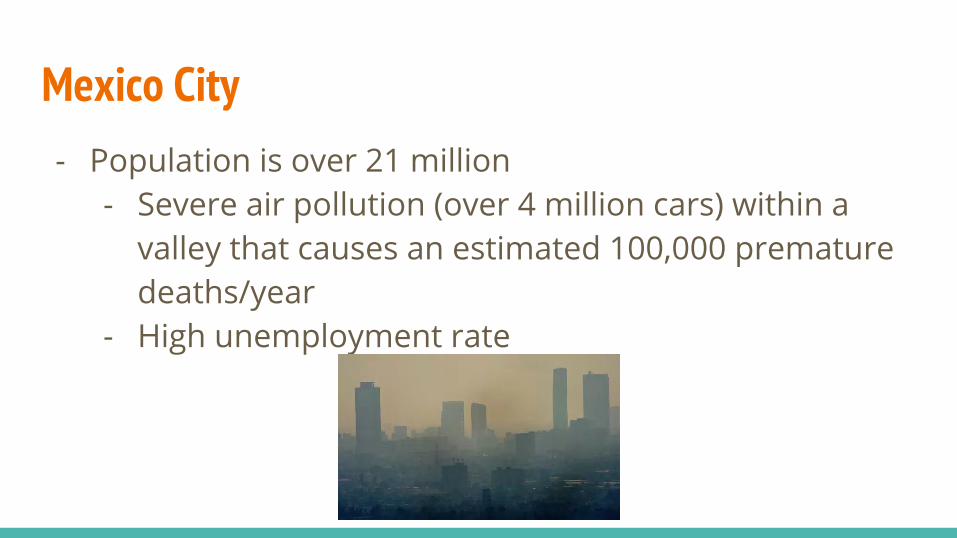
Mexico City- Population is over 21 million
- Severe air pollution (over 4 million cars) within a valley that causes an estimated 100,000 premature deaths/year
- High unemployment rate

Mexico City- Population is over 21 million
- High crime rate- Over ⅓ (6 million) of its residents live
in slums (barrios) without running water, sewer (but running sewage), or electricity
- High infection rates, i.e. salmonella, hepatitis

United States Urbanization - 1800 - 2008 = 5% - 79%- Migration from rural areas- Migration to developed rural
areas- Large central cities to suburbs- North east to south and west

United States Urbanization - Urban sprawl - growth of low-density development on
the edge of cities. Encouraged by:- Availability of cheap land (forest, agriculture fields,
etc)- Government loans guarantees for new single-family
homes- Government and state funding of highways- Low-cost gasoline encourage car use- Low-interest mortgage

Urban Sprawl: growth of low-density housing- Availability of cheap land- Government loans for new single family homes- Government and state funding of highways- Low cost gasoline- Tax laws encourage home ownership- Multiple political jurisdictions which do not work
together to control urban growth

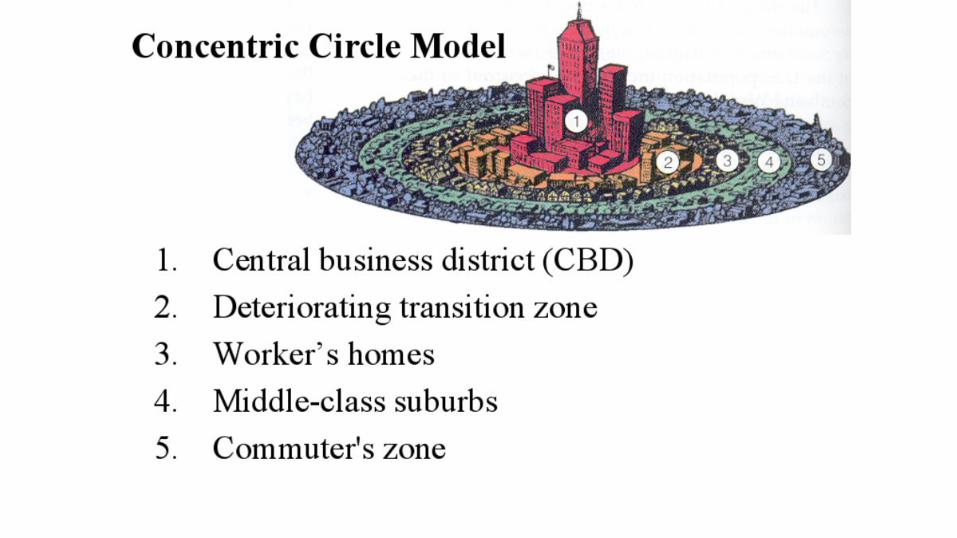
Major Spatial Patterns- Concentric Circle City, such as New York- Sector City is the large urban area extending from San
Francisco to San Jose, CA- Multiple Nuclei City is Los Angeles- Megalopolis is when separate cities join such as the
Bowash


Major Urban Problems in U.S.- Deteriorating services- Aging infrastructures- Budget crunches from lost tax revenues as businesses
and affluent people leave- Rising poverty with violence, drugs, decay- Urban sprawl - growth of low-density development on
edges of cities and towns

Advantages of Urbanization- Recycling more economically feasible- Decreased birth rates reduces environmental
pressures- Per capita expenditures on environmental protection
high in urban areas- Population concentration impacts biodiversity less

Disadvantages of Urbanization- Destruction of plant life - what is monetary value?- Cities produce little of own food- Urban heat island effect → dust dome- Huge ecological footprint- Water supply and flooding problems
- 5 ways to reduce demand on reservoirs and waste treatment systems
- High pollution exposure- Noise pollution


Noise Pollution Excessive noise exposure → health effects like
- Hearing loss, hypertension, muscle tension, migraines/headaches, higher cholesterol levels, gastric ulcers, irritability, insomnia, psychological disorders, aggression


Transportation and Urban Development- Determines where people live, where they go to work
and buy stuff, how much land is paved and exposure to air pollution
- Cities grow up if they can’t grow out; more prone to use mass transit
- Urban sprawl due to cheap gas and land and highways; dispersed car-centered cities use 10x more energy

Motor Vehicle Concentration- Ground transportation: individuals (cars, etc) and mass
(buses and rail)- U.S. has 35% of cars and trucks used for 98% of all
urban transportation- Motor scooters- effort to change to electric- Riding bicycles; less pollution and dangerous
and more efficient than walking- Bicycles available for public use- Bike and ride systems

Robert Samuelson
“Cars expand to fill available concrete”
Washington Post

Reducing Automobile Use- User-pays approach
(paying for the entire environmental impact)- On 8/22/16: $2.193/gal- Full cost pricing -
estimated $12.00
NPR - Gas Price Don't Reflect True Costs

Pros and Cons of Mass Transit- 3% mass transit use in U.S.
to 47% in Japan- 20% gasoline tax revenues
to mass transit- Rapid rail, suburban trains
and trolley - efficient at high population density

Pros and Cons of Mass Transit- High speed rail lines -
replace planes, buses, and private cars; but require large government subsidies
- Bus systems more flexible than rail systems but efficient when full A bullet train passes over Yongdinghe Bridge in Beijing. (Jiao Hongtao / Xinhua /AP Photo)


Summary: A Sustainable City… - Builds and redesigns cities for
people, not cars- Uses solar and other locally
available, renewable energy resources and design buildings to be heated and cooled as much as possible by nature

Summary: A Sustainable City… - Uses solar-powered living
machines and wetlands to treat sewage
- Depends largely on recycled water that is purified and used again and again
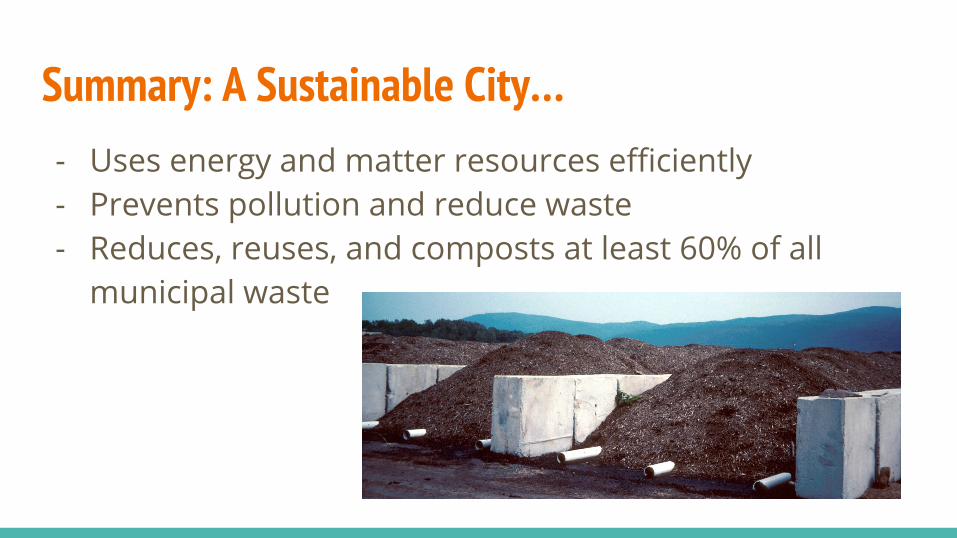
Summary: A Sustainable City… - Uses energy and matter resources efficiently- Prevents pollution and reduce waste- Reduces, reuses, and composts at least 60% of all
municipal waste
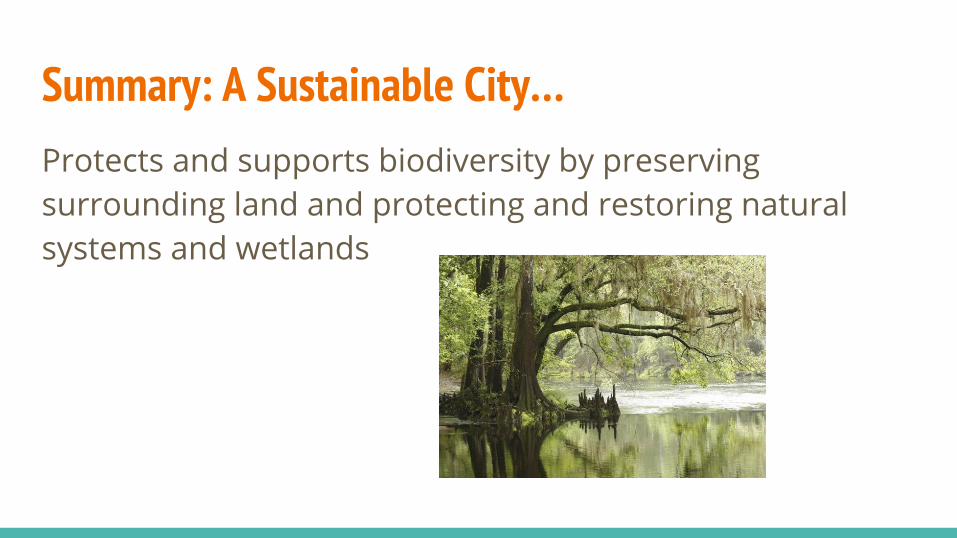
Summary: A Sustainable City… Protects and supports biodiversity by preserving surrounding land and protecting and restoring natural systems and wetlands

Summary: A Sustainable City… - Promotes urban gardens
and farmers markets- Uses zoning and other
tools to keep the the human population at environmentally sustainable levels