Embed Size (px)
Citation preview
1
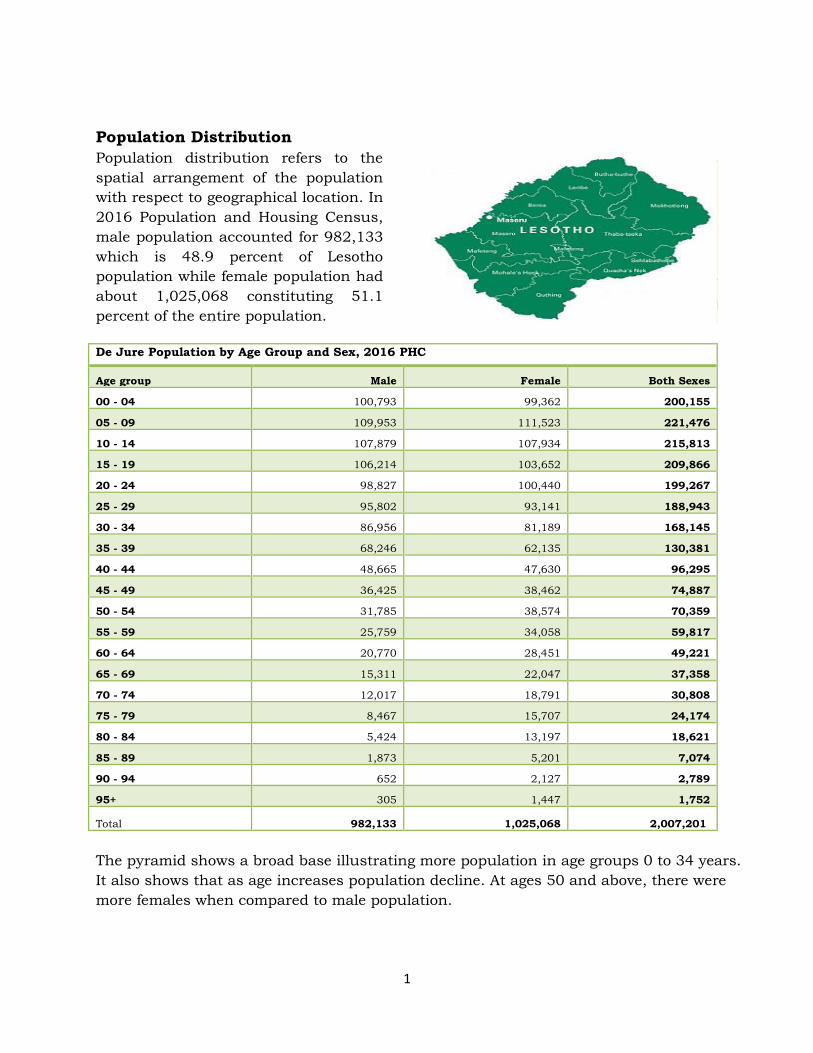
Population Distribution
Population distribution refers to the
spatial arrangement of the population
with respect to geographical location. In
2016 Population and Housing Census,
male population accounted for 982,133
which is 48.9 percent of Lesotho
population while female population had
about 1,025,068 constituting 51.1
percent of the entire population.
De Jure Population by Age Group and Sex, 2016 PHC
Age group Male Female Both Sexes
00 - 04 100,793 99,362 200,155
05 - 09 109,953 111,523 221,476
10 - 14 107,879 107,934 215,813
15 - 19 106,214 103,652 209,866
20 - 24 98,827 100,440 199,267
25 - 29 95,802 93,141 188,943
30 - 34 86,956 81,189 168,145
35 - 39 68,246 62,135 130,381
40 - 44 48,665 47,630 96,295
45 - 49 36,425 38,462 74,887
50 - 54 31,785 38,574 70,359
55 - 59 25,759 34,058 59,817
60 - 64 20,770 28,451 49,221
65 - 69 15,311 22,047 37,358
70 - 74 12,017 18,791 30,808
75 - 79 8,467 15,707 24,174
80 - 84 5,424 13,197 18,621
85 - 89 1,873 5,201 7,074
90 - 94 652 2,127 2,789
95+ 305 1,447 1,752
Total 982,133 1,025,068 2,007,201
The pyramid shows a broad base illustrating more population in age groups 0 to 34 years.
It also shows that as age increases population decline. At ages 50 and above, there were
more females when compared to male population.
2
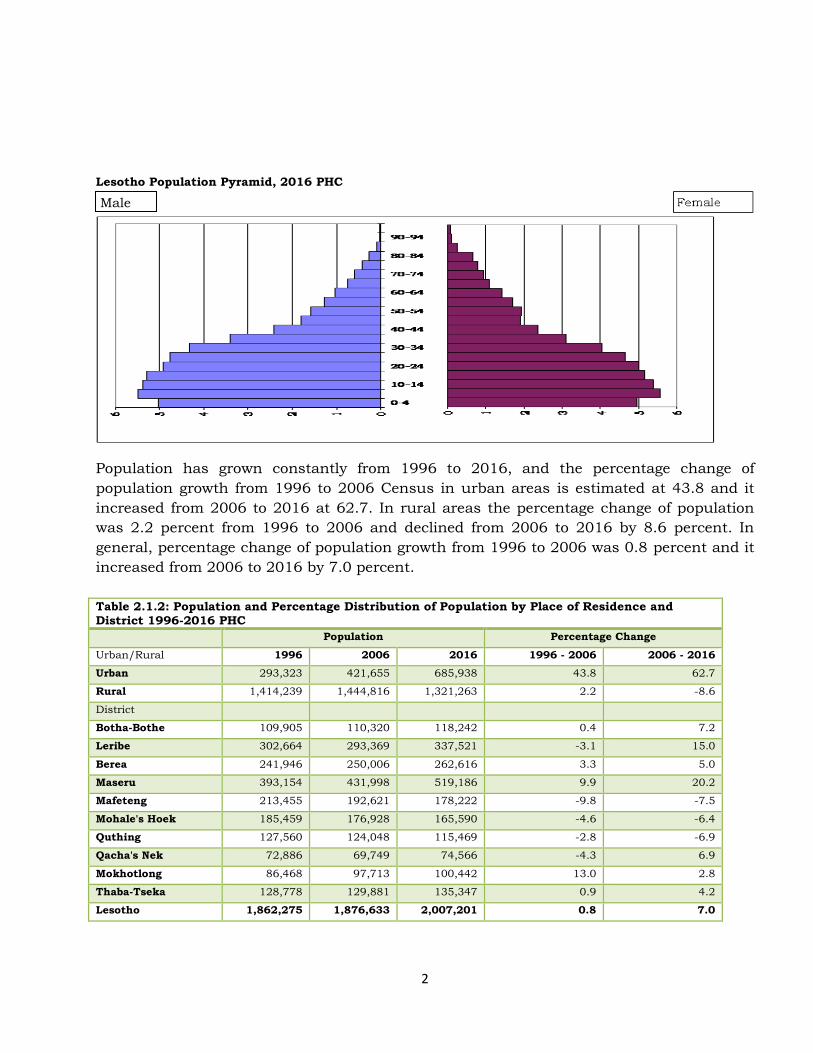
Lesotho Population Pyramid, 2016 PHC
Population has grown constantly from 1996 to 2016, and the percentage change of
population growth from 1996 to 2006 Census in urban areas is estimated at 43.8 and it
increased from 2006 to 2016 at 62.7. In rural areas the percentage change of population
was 2.2 percent from 1996 to 2006 and declined from 2006 to 2016 by 8.6 percent. In
general, percentage change of population growth from 1996 to 2006 was 0.8 percent and it
increased from 2006 to 2016 by 7.0 percent.
Table 2.1.2: Population and Percentage Distribution of Population by Place of Residence and District 1996-2016 PHC
Population Percentage Change
Urban/Rural 1996 2006 2016 1996 - 2006 2006 - 2016
Urban 293,323 421,655 685,938 43.8 62.7
Rural 1,414,239 1,444,816 1,321,263 2.2 -8.6
District
Botha-Bothe 109,905 110,320 118,242 0.4 7.2
Leribe 302,664 293,369 337,521 -3.1 15.0
Berea 241,946 250,006 262,616 3.3 5.0
Maseru 393,154 431,998 519,186 9.9 20.2
Mafeteng 213,455 192,621 178,222 -9.8 -7.5
Mohale's Hoek 185,459 176,928 165,590 -4.6 -6.4
Quthing 127,560 124,048 115,469 -2.8 -6.9
Qacha's Nek 72,886 69,749 74,566 -4.3 6.9
Mokhotlong 86,468 97,713 100,442 13.0 2.8
Thaba-Tseka 128,778 129,881 135,347 0.9 4.2
Lesotho 1,862,275 1,876,633 2,007,201 0.8 7.0
Male

3
Population Characteristics
Population aged less than 15 years is observed to be declining constantly from 1986 to
2006 census years. It increased from 34.1 and 37.8 percent from 2006 to 2016. Population
aged 65and above increased from 5.7 to 6.1 percent from 2006 to 2016 census years. The
overall sex ratio constituted 95.8 percent in 2016 and it declined by 2.5 percentage points
in comparison to that of 2006. Average household size was 4.4 in 2006 while in 2016 it is
now estimated at 3.7 persons.
Selected Demographic Measures, 1976-2016 PHC
Census Year
Measure 1976 1986 2001 2006 2011 2016
% of population <15 40.9 41.5 38.6 34.1 33.7 37.8
% of population 65+ 5.3 5.3 4.9 5.7 6.1 6.1
Overall Sex ratio 93.3 95.5 95.6 94.7 97.3 95.8
Average Household size 5.0 5.1 5.0 4.4 4.2 3.7
% of population urban 11.5 15.0 17.1 22.6 23.7 34.2
Age dependency Ratio 45.2 46.4 43.0 66.2 66.1 60.9
Nuptiality
The proportion of monogamously married
persons was higher than all other marital
categories with males constituting 47.7
percent followed by males that never
married constituting 43.4 percent. The
lowest proportion was observed in the
category of divorced accounting for 0.5
percent.
Percentage Distribution of Persons Aged 15 Years and Above by Marital Status and Sex,
2016 PHC
Marital Status Males Females Total
Never married 43.4 31.0 37.0
Monogamously married 47.7 48.8 48.3
Polygamously married 1.6 1.6 1.6
Living together 0.6 0.6 0.6
Separated 2.6 3.2 2.9
Divorced 0.5 1.0 0.8
Widowed 3.5 13.8 8.8
Total (%) 100.0 100.0 100.0
Total(N) 663,318 705,984 1,369,302
The Singulate Mean Age at Marriage (SMAM) is the average length of single life expressed in
years among those who marry before age 50. The 2016 Population and Housing Census

4
(PHC) shows that majority of males engage in marriage at the age of 28 while females get
married at the younger age than males (24 years).
Trend in Proportions of the Never Married Aged 15 to 54 years by age, Sex and Singulate Mean Age at Marriage for Census/Inter-censal survey years of 2001- 2016 PHC
Census/
Survey
Year Sex 15-19 20-24 25-29 30-34 35-39 40-44 45-49 50-54 SMAM
Inter-censal
Survey
2001 Males 98.4 79.4 44.7 22.7 13.3 6.0 4.1 2.8 27.7
Females 86.3 50.0 26.5 13.6 9.4 5.3 4.1 2.6 23.9
Census 2006 Males 97.6 78.5 45.5 23.8 14.1 9.3 6.2 4.3 27.8
Females 85.5 49.6 29.4 18.0 10.9 7.2 5.1 4.1 24.3
Inter-censal
Survey
2011 Males 98.7 81.3 53.2 27.9 16.4 11.5 6.8 5.6 28.8
Females 87.7 48.8 28.2 20.4 12.5 7.8 5.2 3.7 24.4
Census 2016 Males 98.7 82.7 51.7 29.0 17.7 12.5 9.1 6.7 28.4
Females 88.2 51.7 29.9 21.1 17.0 13.7 9.8 7.8 24.3
Fertility
Fertility is one of the main components of population change. The 2016 PHC Age Specific
Fertility Rates (ASFR) curve indicates that most females were giving birth at the age of 25 to
29 years and females of child bearing ages decrease with an increase in age. In general, the
figure suggests that, the age pattern of fertility in Lesotho has not changed over the years.
Age Specific Fertility Rates 1976 to 2016 Census Year, 2016 PHC
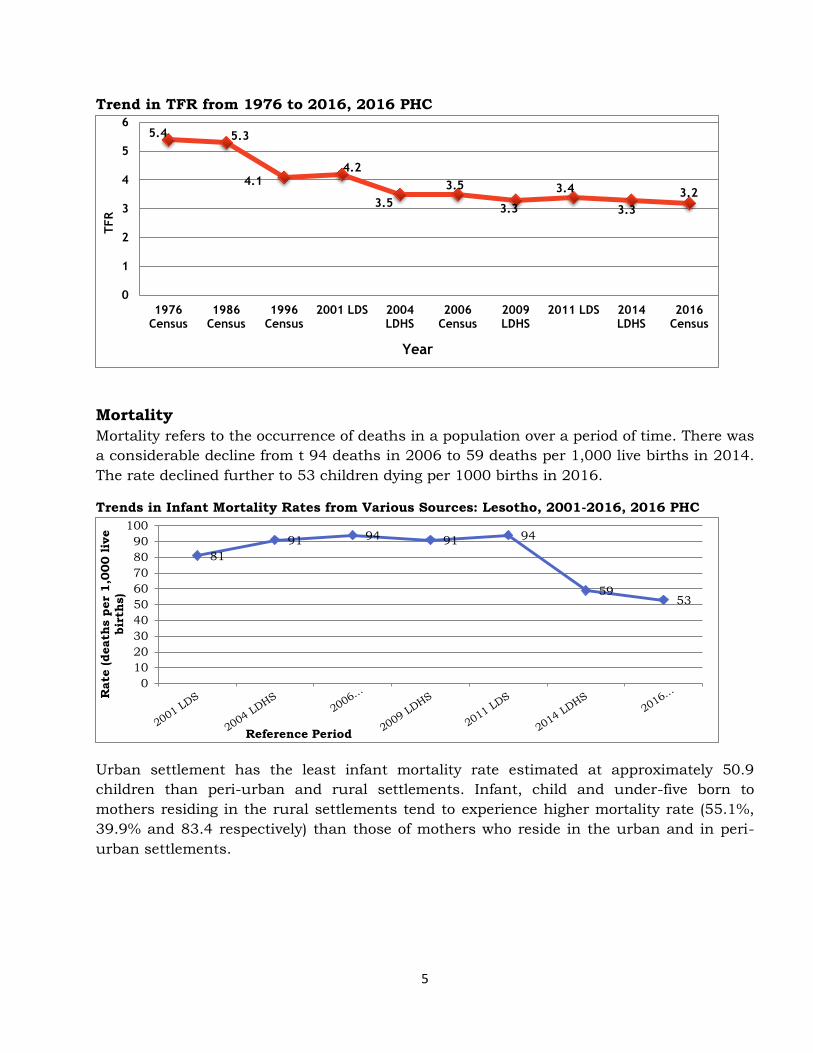
In 1976 census, the Total Fertility Rate (TFR) was estimated at 5.4 children per woman and
it declined to 3.2 children per woman in the 2016 census. The data implies a decline of 2
children from 1976 but the trend in fertility over the years shows that the overall fertility
has declined in recent years.
0.00
0.05
0.10
0.15
0.20
0.25
0.30
15-19 20-24 25-29 30-34 35-39 40-44 45-49
ASFR
Age group 1976 Census 1986 Census 1996 Census 2006 Census 2016 Census
5
Trend in TFR from 1976 to 2016, 2016 PHC
Mortality
Mortality refers to the occurrence of deaths in a population over a period of time. There was
a considerable decline from t 94 deaths in 2006 to 59 deaths per 1,000 live births in 2014.
The rate declined further to 53 children dying per 1000 births in 2016.
Trends in Infant Mortality Rates from Various Sources: Lesotho, 2001-2016, 2016 PHC
Urban settlement has the least infant mortality rate estimated at approximately 50.9
children than peri-urban and rural settlements. Infant, child and under-five born to
mothers residing in the rural settlements tend to experience higher mortality rate (55.1%,
39.9% and 83.4 respectively) than those of mothers who reside in the urban and in peri-
urban settlements.
5.4 5.3
4.1 4.2
3.5
3.5
3.3
3.4
3.3
3.2
0
1
2
3
4
5
6
1976Census
1986Census
1996Census
2001 LDS 2004LDHS
2006Census
2009LDHS
2011 LDS 2014LDHS
2016Census
TFR
Year
81
91 94 91 94
59 53
0
10
20
30
40
50
60
70
80
90
100
Rate
(death
s p
er
1,0
00 liv
e
bir
ths)
Reference Period
6
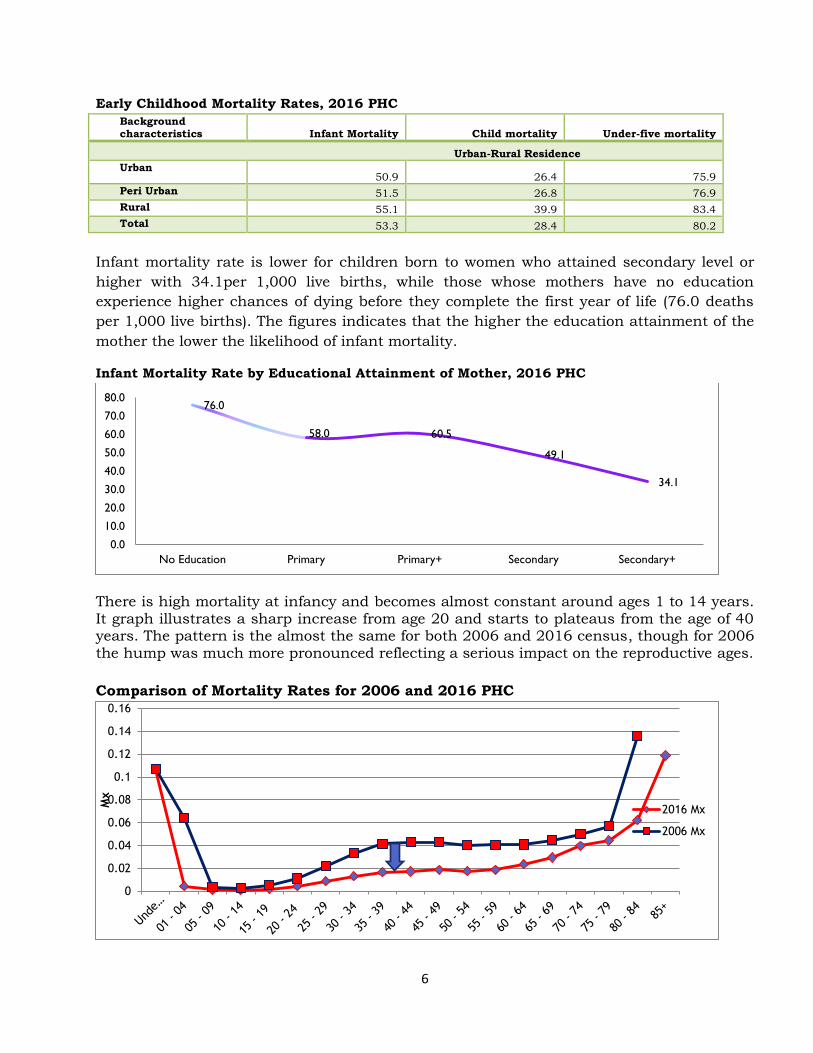
Early Childhood Mortality Rates, 2016 PHC
Background characteristics Infant Mortality Child mortality Under-five mortality
Urban-Rural Residence
Urban 50.9 26.4 75.9
Peri Urban 51.5 26.8 76.9
Rural 55.1 39.9 83.4
Total 53.3 28.4 80.2
Infant mortality rate is lower for children born to women who attained secondary level or
higher with 34.1per 1,000 live births, while those whose mothers have no education
experience higher chances of dying before they complete the first year of life (76.0 deaths
per 1,000 live births). The figures indicates that the higher the education attainment of the
mother the lower the likelihood of infant mortality.
Infant Mortality Rate by Educational Attainment of Mother, 2016 PHC
There is high mortality at infancy and becomes almost constant around ages 1 to 14 years. It graph illustrates a sharp increase from age 20 and starts to plateaus from the age of 40 years. The pattern is the almost the same for both 2006 and 2016 census, though for 2006 the hump was much more pronounced reflecting a serious impact on the reproductive ages.
Comparison of Mortality Rates for 2006 and 2016 PHC
76.0
58.0 60.5
49.1
34.1
0.0
10.0
20.0
30.0
40.0
50.0
60.0
70.0
80.0
No Education Primary Primary+ Secondary Secondary+
0
0.02
0.04
0.06
0.08
0.1
0.12
0.14
0.16
Mx
2016 Mx
2006 Mx

7
Life expectancy at birth refers to the number of years a newborn would live on average if he
or she experienced the prevailing level of mortality in each cohort he or she is in. The 2016
PHC estimated that on average males would live for 52 years while females would live for
approximately 60 years after birth.
Levels in life expectancy at birth, 2016 PHC
Sex 2006 PHC 2016 PHC
Male 39.8 51.7
Female 42.3 59.5
Both 41.1 56.0
Maternal death is defined as the death of a woman while pregnant or within 42 days of
termination of pregnancy, irrespective of the duration and site of the pregnancy, from any
cause related to or aggravated by the pregnancy or its management but not from accidental
or incidental causes. The 2016 PHC gives the Pregnant Related Mortality Rate (PRMR) of
618 maternal deaths per 100,000 live births.
Trend on MMR/PRMR, 2016 PHC
Orphanhood
An orphan is defined as a child who has lost either one of the biological parents or both of
them through death and that child must be aged 0 to 17 years of age. The population aged
0 to 17 years was estimated at 765,614 and out of that, 210,712 were orphans.
Orphanhood Trend, 2016 PHC
419
762
936
1155 1143
1024
618
0
200
400
600
800
1000
1200
1400
2001 LDS 2004 LDHS 2006 PHC 2009 LDHS 2011 LDS 2014 LDHS 2016 PHC
MM
R
134,671 130,245
221,403 210,712
0
50000
100000
150000
200000
250000
1986 1996 2006 2016
Tota
l O
rphans
Census Years

8
The majority of orphans were paternal (64.9 percent), followed by double orphans with 19.7
percent while maternal orphans constituted 15.5 percent of all orphans. The percentages
for maternal and double orphanhood have declined by 1.6 and 1.4 respectively, while the
percentage for paternal orphanhood has increased by 1.9 percentage points from 2006 to
2016.
Orphans by 0rphanhood Type, 2016 Census
Youth
It is defined by using the local definition adopted by Ministry of Gender, Youth, Sports and
Recreation, that is, age 15 to 35 years. In 2016 census, youth were 794,940 accounting for
39.6 percent of Lesotho total population. Males were 403,000 which is 50.7 percent of total
youth while female youth constitutes 49.3 percent.
Youth by Age group and Sex, 2016 PHC
Age-group Male Female Total
15-19 26.3 26.4 209,737
20-24 24.5 25.6 199,237
25-29 23.8 23.8 188,907
30-35 25.4 24.2 197,059
Total 403,000 391,940 794,940
From the total population in Lesotho, 39.6% is youth
The 2016 census results revealed that, from age 15 to 19 years and from age 24 to 35
years, there were more male youths than their female counterparts with proportions of over
50.0. Female youths were more from age 21 to 23 years with percentages of over 50.0.
64.9
19.7 15.5
0.0
20.0
40.0
60.0
80.0
Paternal Double Maternal
Pe
rce
nt
Orphanhood type
9
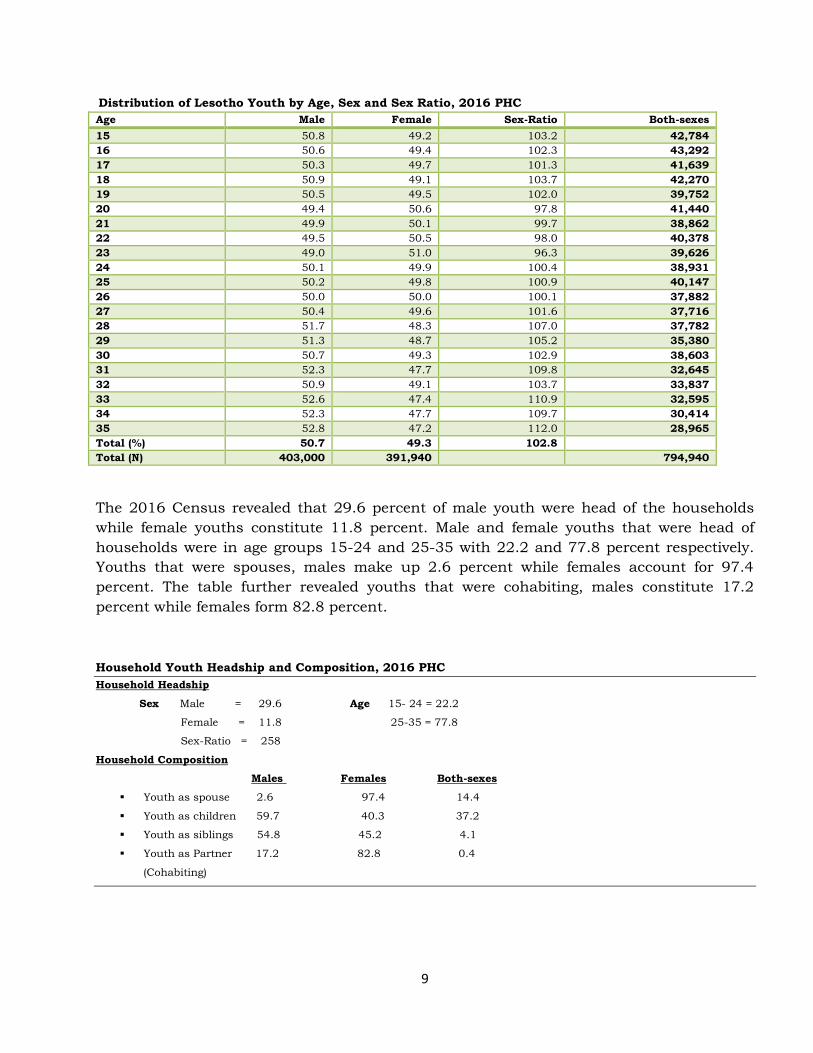
Distribution of Lesotho Youth by Age, Sex and Sex Ratio, 2016 PHC
Age Male Female Sex-Ratio Both-sexes
15 50.8 49.2 103.2 42,784
16 50.6 49.4 102.3 43,292
17 50.3 49.7 101.3 41,639
18 50.9 49.1 103.7 42,270
19 50.5 49.5 102.0 39,752
20 49.4 50.6 97.8 41,440
21 49.9 50.1 99.7 38,862
22 49.5 50.5 98.0 40,378
23 49.0 51.0 96.3 39,626
24 50.1 49.9 100.4 38,931
25 50.2 49.8 100.9 40,147
26 50.0 50.0 100.1 37,882
27 50.4 49.6 101.6 37,716
28 51.7 48.3 107.0 37,782
29 51.3 48.7 105.2 35,380
30 50.7 49.3 102.9 38,603
31 52.3 47.7 109.8 32,645
32 50.9 49.1 103.7 33,837
33 52.6 47.4 110.9 32,595
34 52.3 47.7 109.7 30,414
35 52.8 47.2 112.0 28,965
Total (%) 50.7 49.3 102.8
Total (N) 403,000 391,940 794,940
The 2016 Census revealed that 29.6 percent of male youth were head of the households
while female youths constitute 11.8 percent. Male and female youths that were head of
households were in age groups 15-24 and 25-35 with 22.2 and 77.8 percent respectively.
Youths that were spouses, males make up 2.6 percent while females account for 97.4
percent. The table further revealed youths that were cohabiting, males constitute 17.2
percent while females form 82.8 percent.
Household Youth Headship and Composition, 2016 PHC
Household Headship
Sex Male = 29.6 Age 15- 24 = 22.2
Female = 11.8 25-35 = 77.8
Sex-Ratio = 258
Household Composition
Males Females Both-sexes
Youth as spouse 2.6 97.4 14.4
Youth as children 59.7 40.3 37.2
Youth as siblings 54.8 45.2 4.1
Youth as Partner 17.2 82.8 0.4
(Cohabiting)

10
Elderly
These are people aged 60 years and above and age group 60-64 constituted the largest
proportion of elderly population. There is a higher proportion of males at age 60-74 years
than that of females at the same ages. However, there is a higher proportion of elderly
females at older ages relative to males.
Age and Sex Distribution of Elderly Population, 2016 census, 2016 PHC
Lesotho has more elderly females heading households as compared to elderly males. All the
districts have above 50 percent of elderly females heads while elderly male heads constitute
between 40 and 50 percent.
Household Heads aged 60 Years and Over by Sex and age, 2016 PHC
32.0
23.6 18.5
13.1 8.4
4.4
37.7
26.6
20.6 17.6 14.7
12.3 8.2
62.3
0.0
10.0
20.0
30.0
40.0
50.0
60.0
70.0
60 - 64 65 - 69 70 - 74 75 - 79 80 - 84 85+ Total
Pe
rce
nt
Age Group
Male
Female
0.0
10.0
20.0
30.0
40.0
50.0
60.0
Pe
rce
nt
District
Male
Female

11
Majority of elderly female (72.3 percent) were on Chronic Medication while most elderly
males were using hearing aid estimated at 49.4 percent. A smaller proportion of elderly
population uses white cane as a walking assistive device.
Population 60 years and above by Assistive device and Sex, 2016 PHC
Assistive Device Total Male Female
Use Eye Glasses 19,413 38.1 61.9
Use Hearing Aid 1.139 49.4 50.6
Use Walking Stick 19,436 33.0 67.0
Use Wheelchair 934 44.3 55.7
Use Chronic Medication 53,801 27.7 72.3
Use White Cane 681 42.4 57.6
Disability
Berea had a higher disability prevalence
constituting 3.2 percent while Maseru
follows with 2.8. Mafeteng and Mohale’s
Hoek had similar proportion of disability
prevalence of 2.6 respectively.
Prevalence of Disability in Lesotho, 2016 PHC
Districts Number Percentage Within Districts
Botha-Bothe 2,508 2.4
Leribe 6,596 2.2
Berea 7,546 3.2
Maseru 13,107 2.8
Mafeteng 4,240 2.6
Mohale's Hoek 3,953 2.6
Quthing 2,144 2.1
Qacha's Nek 1,427 2.1
Mokhotlong 1,898 2.1
Thaba-Tseka 2,188 1.8
Total 45,607 2.5
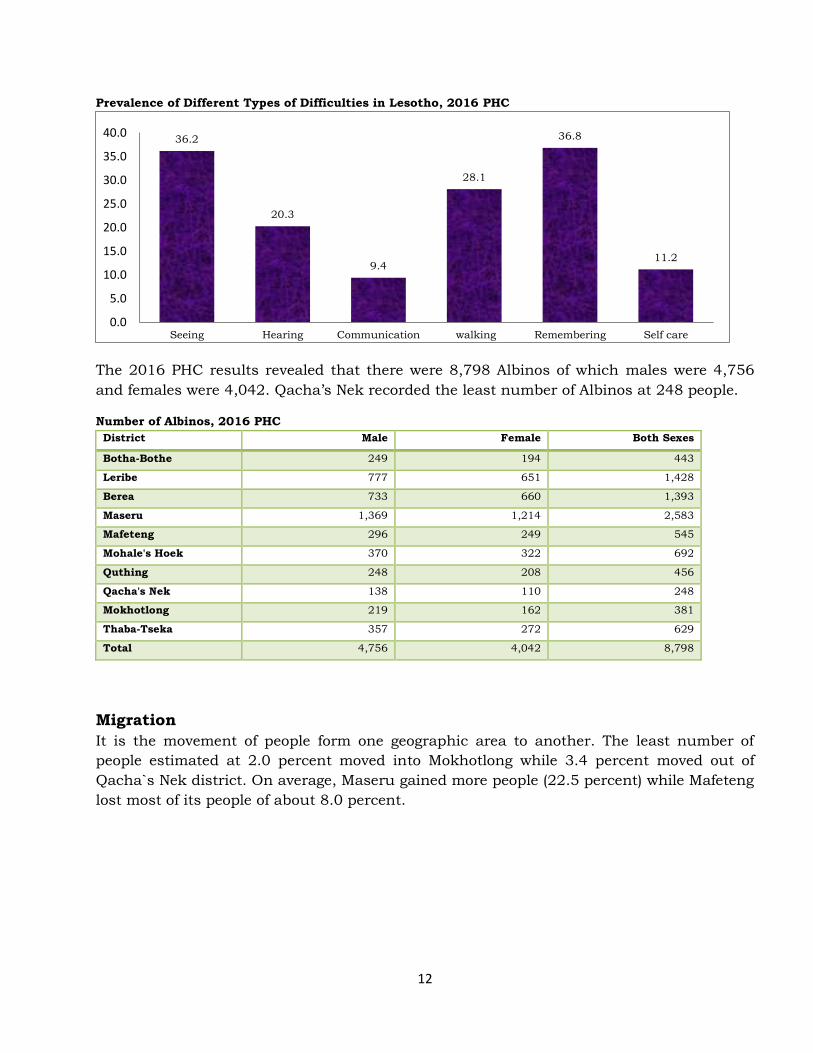
Different types of difficulties that had higher proportions were that of remembering and
seeing with 36.8 and 36.2 respectively while that of Communication was the least with 9.4
percent.
12
Prevalence of Different Types of Difficulties in Lesotho, 2016 PHC
The 2016 PHC results revealed that there were 8,798 Albinos of which males were 4,756
and females were 4,042. Qacha’s Nek recorded the least number of Albinos at 248 people.
Number of Albinos, 2016 PHC
District Male Female Both Sexes
Botha-Bothe 249 194 443
Leribe 777 651 1,428
Berea 733 660 1,393
Maseru 1,369 1,214 2,583
Mafeteng 296 249 545
Mohale's Hoek 370 322 692
Quthing 248 208 456
Qacha's Nek 138 110 248
Mokhotlong 219 162 381
Thaba-Tseka 357 272 629
Total 4,756 4,042 8,798
Migration
It is the movement of people form one geographic area to another. The least number of
people estimated at 2.0 percent moved into Mokhotlong while 3.4 percent moved out of
Qacha`s Nek district. On average, Maseru gained more people (22.5 percent) while Mafeteng
lost most of its people of about 8.0 percent.
36.2
20.3
9.4
28.1
36.8
11.2
0.0
5.0
10.0
15.0
20.0
25.0
30.0
35.0
40.0
Seeing Hearing Communication walking Remembering Self care
13
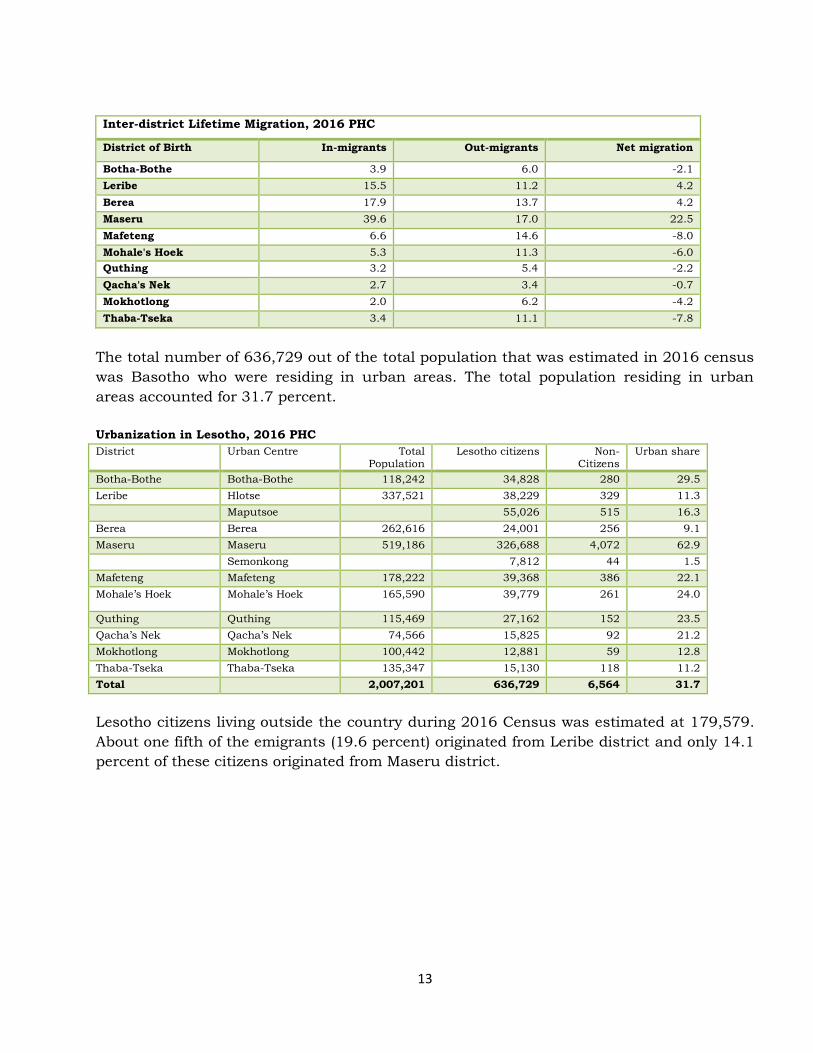
Inter-district Lifetime Migration, 2016 PHC
District of Birth In-migrants Out-migrants Net migration
Botha-Bothe 3.9 6.0 -2.1
Leribe 15.5 11.2 4.2
Berea 17.9 13.7 4.2
Maseru 39.6 17.0 22.5
Mafeteng 6.6 14.6 -8.0
Mohale's Hoek 5.3 11.3 -6.0
Quthing 3.2 5.4 -2.2
Qacha's Nek 2.7 3.4 -0.7
Mokhotlong 2.0 6.2 -4.2
Thaba-Tseka 3.4 11.1 -7.8
The total number of 636,729 out of the total population that was estimated in 2016 census
was Basotho who were residing in urban areas. The total population residing in urban
areas accounted for 31.7 percent.
Urbanization in Lesotho, 2016 PHC
District Urban Centre Total Population
Lesotho citizens Non-Citizens
Urban share
Botha-Bothe Botha-Bothe 118,242 34,828 280 29.5
Leribe Hlotse 337,521 38,229 329 11.3
Maputsoe 55,026 515 16.3
Berea Berea 262,616 24,001 256 9.1
Maseru Maseru 519,186 326,688 4,072 62.9
Semonkong 7,812 44 1.5
Mafeteng Mafeteng 178,222 39,368 386 22.1
Mohale’s Hoek Mohale’s Hoek 165,590 39,779 261 24.0
Quthing Quthing 115,469 27,162 152 23.5
Qacha’s Nek Qacha’s Nek 74,566 15,825 92 21.2
Mokhotlong Mokhotlong 100,442 12,881 59 12.8
Thaba-Tseka Thaba-Tseka 135,347 15,130 118 11.2
Total 2,007,201 636,729 6,564 31.7
Lesotho citizens living outside the country during 2016 Census was estimated at 179,579.
About one fifth of the emigrants (19.6 percent) originated from Leribe district and only 14.1
percent of these citizens originated from Maseru district.
14
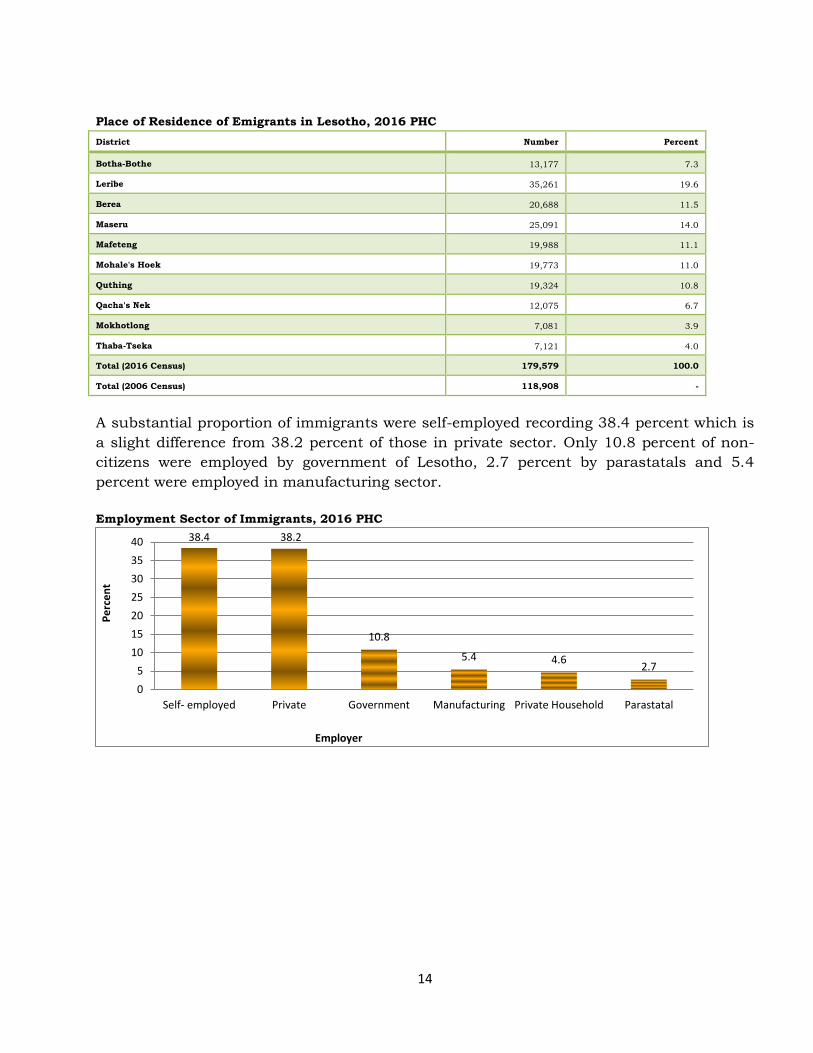
Place of Residence of Emigrants in Lesotho, 2016 PHC
District Number Percent
Botha-Bothe 13,177 7.3
Leribe 35,261 19.6
Berea 20,688 11.5
Maseru 25,091 14.0
Mafeteng 19,988 11.1
Mohale's Hoek 19,773 11.0
Quthing 19,324 10.8
Qacha's Nek 12,075 6.7
Mokhotlong 7,081 3.9
Thaba-Tseka 7,121 4.0
Total (2016 Census) 179,579 100.0
Total (2006 Census) 118,908 -
A substantial proportion of immigrants were self-employed recording 38.4 percent which is
a slight difference from 38.2 percent of those in private sector. Only 10.8 percent of non-
citizens were employed by government of Lesotho, 2.7 percent by parastatals and 5.4
percent were employed in manufacturing sector.
Employment Sector of Immigrants, 2016 PHC
38.4 38.2
10.8
5.4 4.6 2.7
0
5
10
15
20
25
30
35
40
Self- employed Private Government Manufacturing Private Household Parastatal
Pe
rce
nt
Employer
15
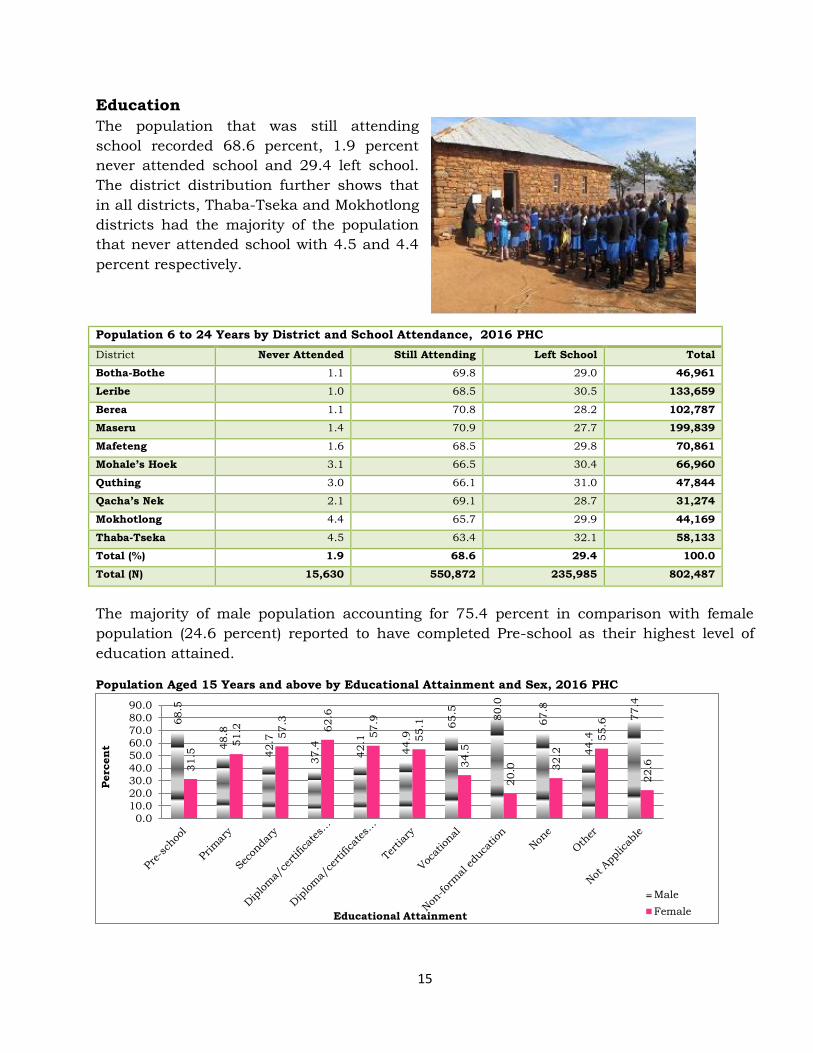
Education
The population that was still attending
school recorded 68.6 percent, 1.9 percent
never attended school and 29.4 left school.
The district distribution further shows that
in all districts, Thaba-Tseka and Mokhotlong
districts had the majority of the population
that never attended school with 4.5 and 4.4
percent respectively.
Population 6 to 24 Years by District and School Attendance, 2016 PHC
District Never Attended Still Attending Left School Total
Botha-Bothe 1.1 69.8 29.0 46,961
Leribe 1.0 68.5 30.5 133,659
Berea 1.1 70.8 28.2 102,787
Maseru 1.4 70.9 27.7 199,839
Mafeteng 1.6 68.5 29.8 70,861
Mohale’s Hoek 3.1 66.5 30.4 66,960
Quthing 3.0 66.1 31.0 47,844
Qacha’s Nek 2.1 69.1 28.7 31,274
Mokhotlong 4.4 65.7 29.9 44,169
Thaba-Tseka 4.5 63.4 32.1 58,133
Total (%) 1.9 68.6 29.4 100.0
Total (N) 15,630 550,872 235,985 802,487
The majority of male population accounting for 75.4 percent in comparison with female
population (24.6 percent) reported to have completed Pre-school as their highest level of
education attained.
Population Aged 15 Years and above by Educational Attainment and Sex, 2016 PHC
68.5
48.8
42.7
37.4
42.1
44.9
65.5
80.0
67.8
44.4
77.4
31.5
51.2
57.3
62.6
57.9
55.1
34.5
20.0
32.2
55.6
22.6
0.010.0
20.030.0
40.0
50.0
60.070.0
80.0
90.0
Perc
en
t
Educational Attainment
Male
Female

16
The percentage of population aged 15 years and above that was categorized under Literacy
1 accounted for 86.2 percent. The group that was classified under Literacy 2 was
represented by 11.1 percent. The illiterate population recorded 2.7 percent. Therefore, the
national literacy rate was estimated at 97.0 percent and it has increased from that of 2006
Census (87.0 percent) by 10.0 percent.
Population aged15 years and above by Literacy Status, 2016 PHC
86.2
11.1 2.7
Literacy 1
Literacy 2
Illiteracy
17
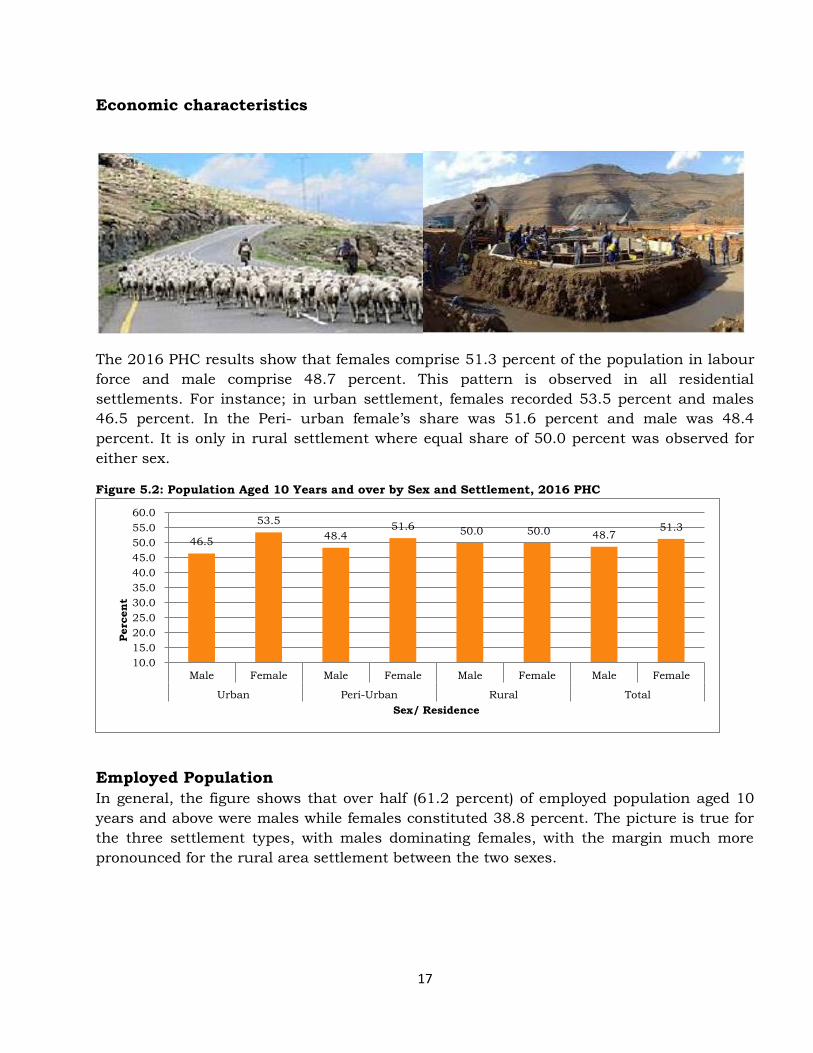
Economic characteristics
The 2016 PHC results show that females comprise 51.3 percent of the population in labour
force and male comprise 48.7 percent. This pattern is observed in all residential
settlements. For instance; in urban settlement, females recorded 53.5 percent and males
46.5 percent. In the Peri- urban female’s share was 51.6 percent and male was 48.4
percent. It is only in rural settlement where equal share of 50.0 percent was observed for
either sex.
Figure 5.2: Population Aged 10 Years and over by Sex and Settlement, 2016 PHC
Employed Population
In general, the figure shows that over half (61.2 percent) of employed population aged 10
years and above were males while females constituted 38.8 percent. The picture is true for
the three settlement types, with males dominating females, with the margin much more
pronounced for the rural area settlement between the two sexes.
46.5
53.5
48.4 51.6 50.0 50.0 48.7
51.3
10.0
15.0
20.0
25.0
30.0
35.0
40.0
45.0
50.0
55.0
60.0
Male Female Male Female Male Female Male Female
Urban Peri-Urban Rural Total
Perc
en
t
Sex/ Residence
18
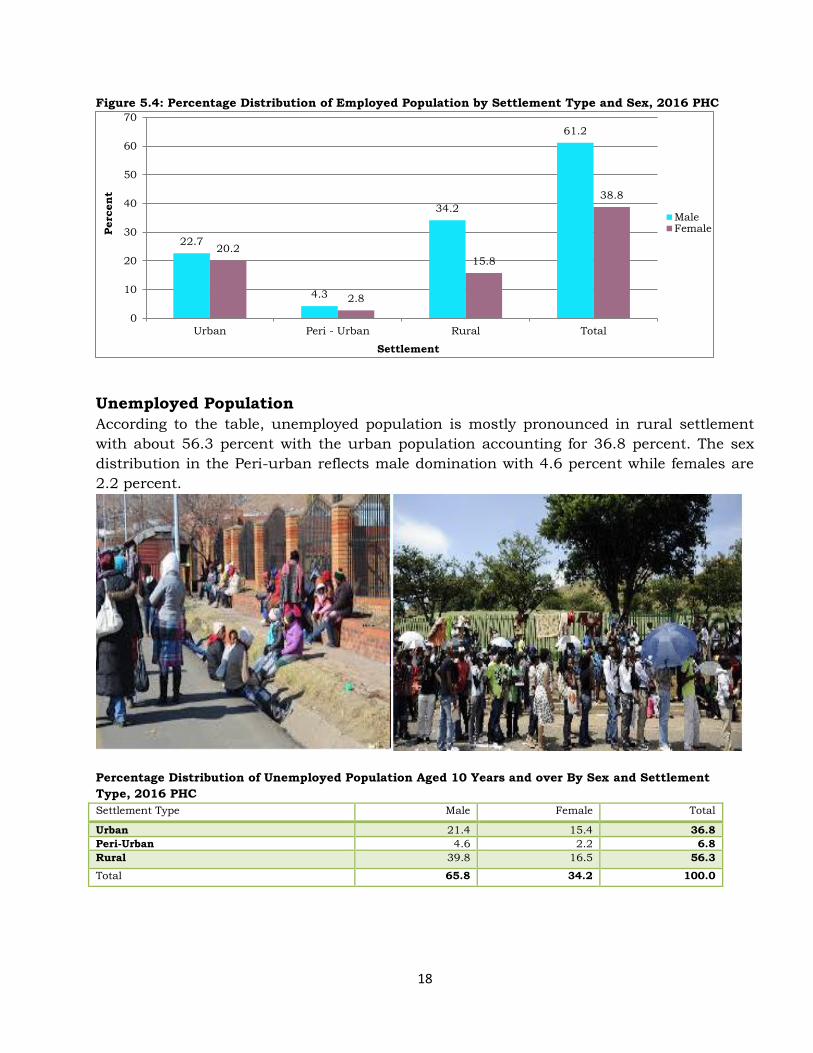
Figure 5.4: Percentage Distribution of Employed Population by Settlement Type and Sex, 2016 PHC
Unemployed Population
According to the table, unemployed population is mostly pronounced in rural settlement
with about 56.3 percent with the urban population accounting for 36.8 percent. The sex
distribution in the Peri-urban reflects male domination with 4.6 percent while females are
2.2 percent.
Percentage Distribution of Unemployed Population Aged 10 Years and over By Sex and Settlement
Type, 2016 PHC
Settlement Type Male Female Total
Urban 21.4 15.4 36.8
Peri-Urban 4.6 2.2 6.8
Rural 39.8 16.5 56.3
Total 65.8 34.2 100.0
22.7
4.3
34.2
61.2
20.2
2.8
15.8
38.8
0
10
20
30
40
50
60
70
Urban Peri - Urban Rural Total
Perc
en
t
Settlement
MaleFemale
19
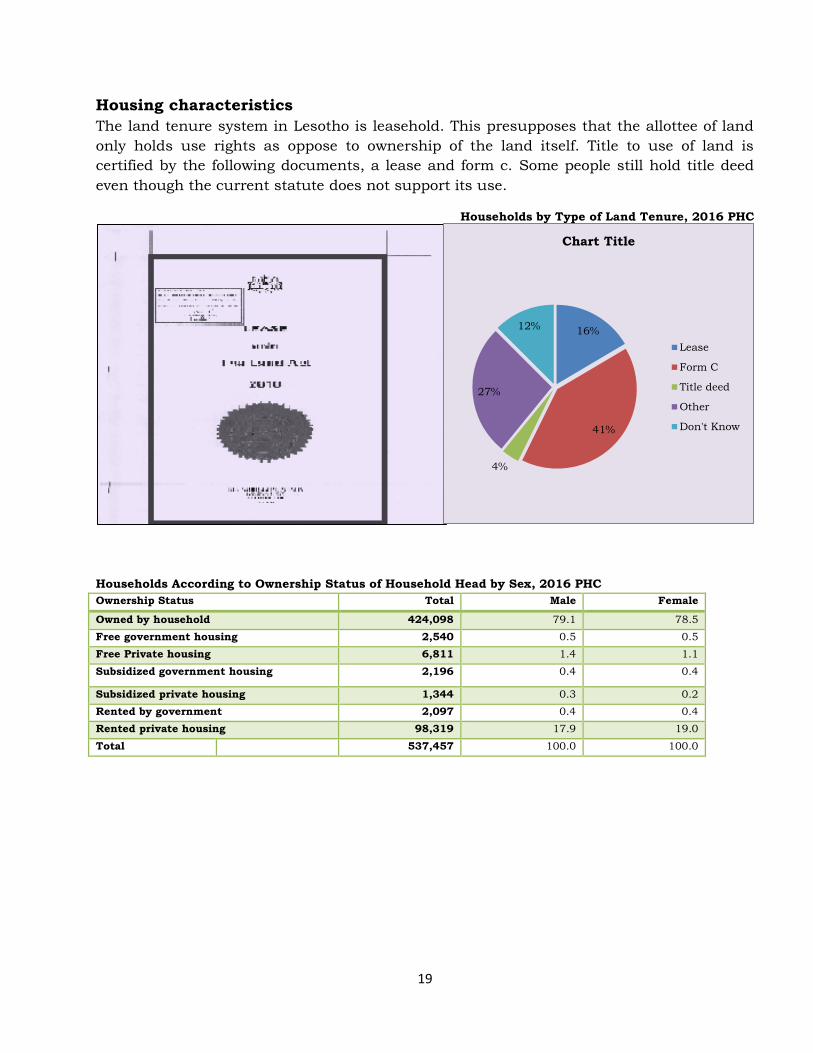
Housing characteristics
The land tenure system in Lesotho is leasehold. This presupposes that the allottee of land
only holds use rights as oppose to ownership of the land itself. Title to use of land is
certified by the following documents, a lease and form c. Some people still hold title deed
even though the current statute does not support its use.
Households by Type of Land Tenure, 2016 PHC
Households According to Ownership Status of Household Head by Sex, 2016 PHC
Ownership Status Total Male Female
Owned by household 424,098 79.1 78.5
Free government housing 2,540 0.5 0.5
Free Private housing 6,811 1.4 1.1
Subsidized government housing 2,196 0.4 0.4
Subsidized private housing 1,344 0.3 0.2
Rented by government 2,097 0.4 0.4
Rented private housing 98,319 17.9 19.0
Total 537,457 100.0 100.0
16%
41%
4%
27%
12%
Chart Title
Lease
Form C
Title deed
Other
Don't Know
20
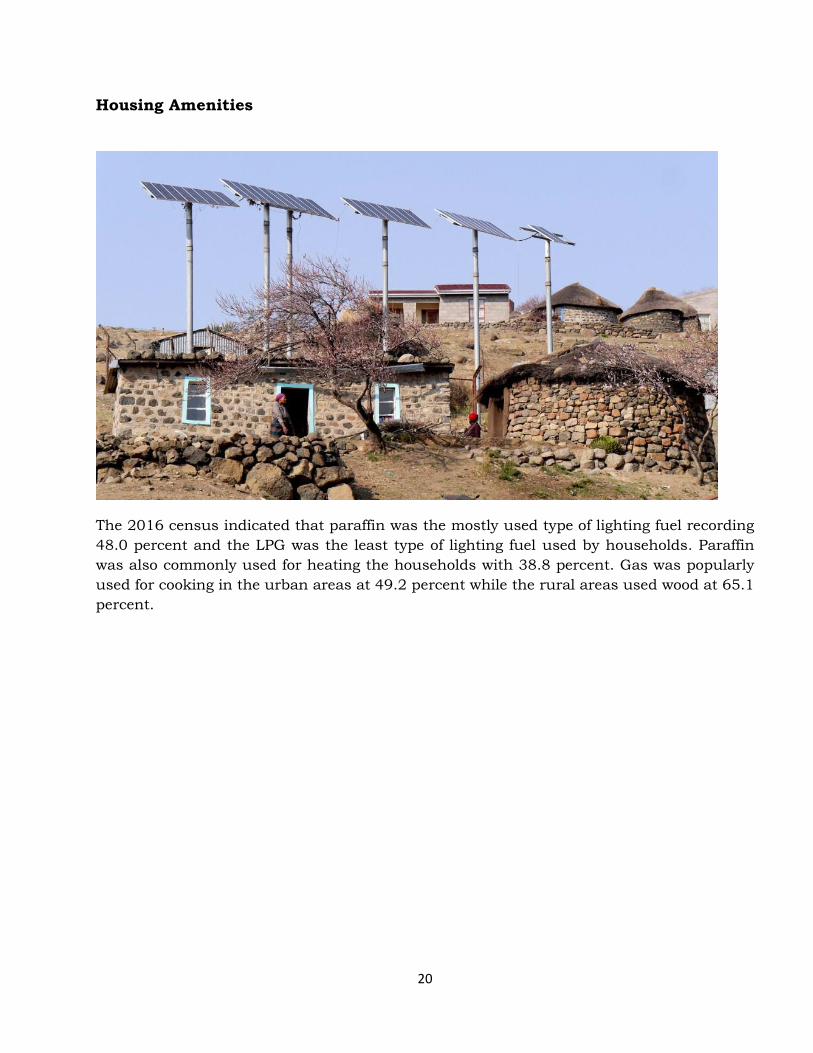
Housing Amenities
The 2016 census indicated that paraffin was the mostly used type of lighting fuel recording
48.0 percent and the LPG was the least type of lighting fuel used by households. Paraffin
was also commonly used for heating the households with 38.8 percent. Gas was popularly
used for cooking in the urban areas at 49.2 percent while the rural areas used wood at 65.1
percent.

21
Main type of lighting fuel, 2016 PHC
38.2
0.2
48
13.6
Electricity
LPG
Paraffin
Candle
22
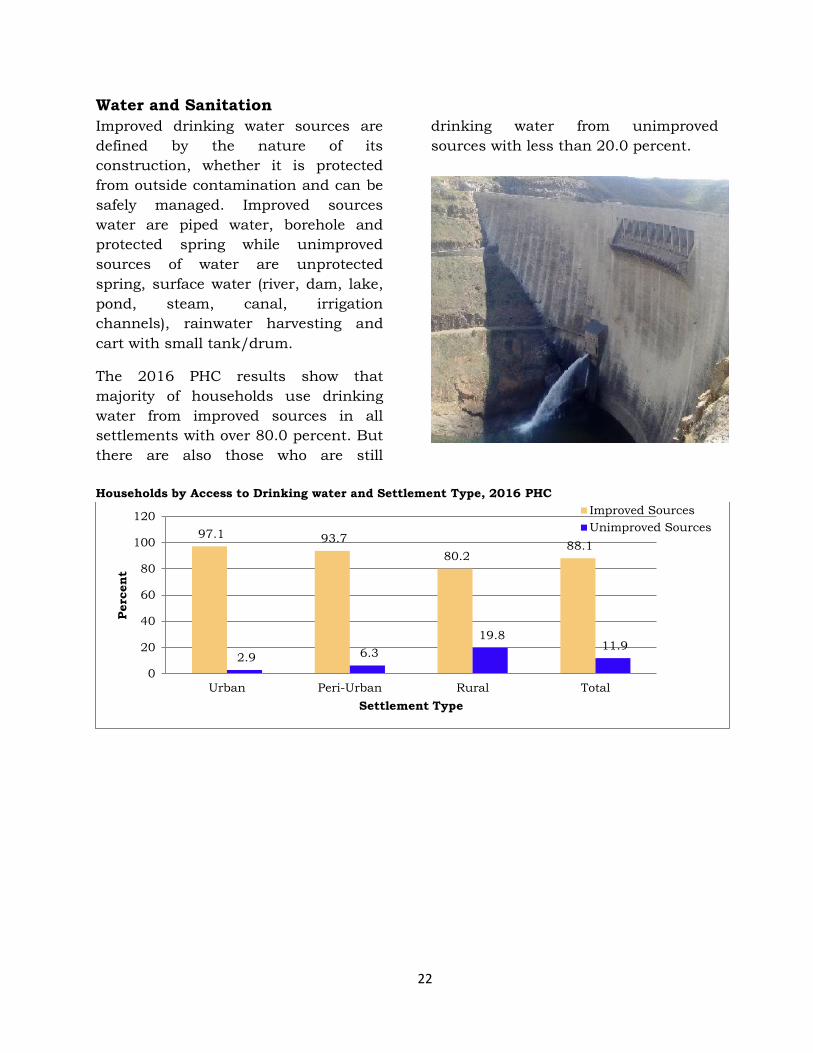
Water and Sanitation
Improved drinking water sources are
defined by the nature of its
construction, whether it is protected
from outside contamination and can be
safely managed. Improved sources
water are piped water, borehole and
protected spring while unimproved
sources of water are unprotected
spring, surface water (river, dam, lake,
pond, steam, canal, irrigation
channels), rainwater harvesting and
cart with small tank/drum.
The 2016 PHC results show that
majority of households use drinking
water from improved sources in all
settlements with over 80.0 percent. But
there are also those who are still
drinking water from unimproved
sources with less than 20.0 percent.
Households by Access to Drinking water and Settlement Type, 2016 PHC
97.1 93.7
80.2 88.1
2.9 6.3
19.8 11.9
0
20
40
60
80
100
120
Urban Peri-Urban Rural Total
Perc
ent
Settlement Type
Improved Sources
Unimproved Sources
23
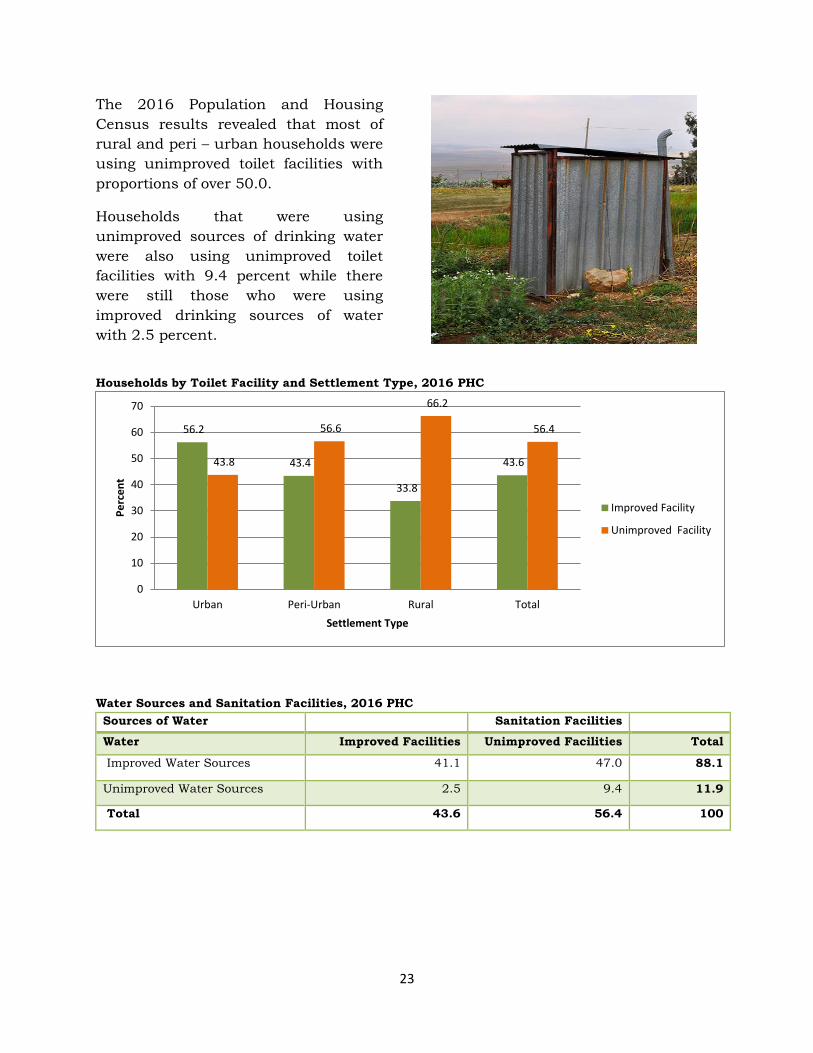
The 2016 Population and Housing
Census results revealed that most of
rural and peri – urban households were
using unimproved toilet facilities with
proportions of over 50.0.
Households that were using
unimproved sources of drinking water
were also using unimproved toilet
facilities with 9.4 percent while there
were still those who were using
improved drinking sources of water
with 2.5 percent.
Households by Toilet Facility and Settlement Type, 2016 PHC
Water Sources and Sanitation Facilities, 2016 PHC
Sources of Water Sanitation Facilities
Water Improved Facilities Unimproved Facilities Total
Improved Water Sources 41.1 47.0 88.1
Unimproved Water Sources 2.5 9.4 11.9
Total 43.6 56.4 100
56.2
43.4
33.8
43.6 43.8
56.6
66.2
56.4
0
10
20
30
40
50
60
70
Urban Peri-Urban Rural Total
Pe
rce
nt
Settlement Type
Improved Facility
Unimproved Facility