Embed Size (px)
Citation preview
POPULATION AND REPRODUCTIVE BIOLOGY OF THE SIX-RAYED
SEA STAR LEPrASTERIAS HEY..ACTIS
ON THE PRO'I'ECTED OUTER COAST
by
THOivjAS M. NIESEN
•
A DISSERTATION
Presented to the Department of Biologyand the Graduate School of the University of Oregon
in partial fulfillmentof the requirements for the degree of
Doctor of Philosophy
June 1973
APPROVED:
ii
VITA
l~ME OF AUTHOR: Thomas Marvin Niesen
PLACE OF BIRTH: San Diego, California
DATE OF BIR'.m~ l\pril 10. 1944
ti1'IDERGRl-\DUAIJ'E AI'm GR.p,DUA'I;:f~ SC:HOOr..S ATTENDED:
Los Angeles Harbor CollegeUnive~si·t.y of Califc!:nia; Santa BarbaraHa~oldt State ColJegeSan Diego State CollegeUniversity of Oregon
DEGREES AWARDED:
.i3ar~helor of Act:s t 1966, Dniversity of Cali forr..ia, Sant.a. Barbara:t..aster of Science ~ 1969, San Diego State Collese
ARElI.S OF SPEC L"'-!.£.. DJTERES'l':
Marin.e EcologyInver-tebrate ?~oology
2chinodenn Repr:>ductive Biology
PROFESSICJNAJJ EXPERIENC"E:
'.r\?aching i-\ssi.sta.n.":!' D3J?al_t.:rr~E:4t c£ :Bi(.1.i0(;"Y I San r)i~S'c SC2.~:e ColJ.cge,1967-1969.
G~::'::1.(.tua+:e rreachi.Xlg ?'ellc\\f r De,?aI't!i.lel1.t: t.)f Bic· logy, Oni\1"';'::'31 ty ofO::-·,)s(n" 1969··1973.
Natiorl2l1 Science ?ouud5.tion Gran·t for ir<:pr'ov].l':g &::ct.oral (1.155erLations in the fi.eld scie:'lces, 1971-1973.
iii
ACYl-JOWLEDG?f.ENT'S
I would first like to tharL).;:. Pet~e~ Fra':lk for his unU :':'ing :lssL~tance
in the prepax'ation of this manu",cript and for }-.is example anc encol1xage-
ment during my 4 yec-.rs here. I ;.vould also like to t:haDk. '!l~' t~hesi2
CCl:nmittee morrbers for their advice and cri::i.cism.
Tne £ltaff at Oregon Institute of Harine Biolcgy, especial~.y Drs.
Rudy and Tendlliger I mad,::; ·the time s.!?en-t there 'iery produc'i:i VF: by
providing a pleasant and congenial environment.
genero'us hOSl)itality and assist:arlce,
I thank them for thd.r
I .....ould like to express my 3;?precic:ttion for the stimula.ting intel-
lect.ual E'nvironment pr:ovicted by colleagues a:,d frieodE': J ()l1.n Cue-it.,
Alla.n Miller I FJ:ed Bernstein, Carol Cross., SUZ:3.ml'2 !-1iller f :Nallci Lorr I
and others who have left before me. I havE' profited sic;nificantlY from
our discussions and conversations, and I ~1il1 miss you all.
'1'0 my other friends who cont.ribub~d to my Ors:ron experience 1 thank
you.. To the Barnes, HOrI~ns 1 Ca:mpbells and Caseys I my sinG1~re thanks
for you.r friendsh~.F a.na SU.'PP01:t.
ply final thank3 go to ray wife An::;.e who llas shared \'I.lit~'" me the
intellectaal and personal gro"Nth ezperi.enccd here in Ore·::Jon. She has
assisted oe in e",,-ery aspect of this research 1 and it indeed represents
a te~'Il effort. I want to thank her for alvlo.ys bE:ing on rr.y team.
~v
TABLE OF CO~~ENTS
LIST OF TABLES.
LIS'1' OF FIGURES
IN1'RODUC'I'ION •
Stateme;,t of Pur;:>oseEchinochrrr E;-::;ol.'-J·:fY and Reproduc·tive 3i:)logy.RL::,produc~..ion in I..ertasteri~.hE.:.:Xac~is.
GENERA.L ~~ETH{)DS 1~!I,T)) DESCRIPTION OF THE STUDY i'-P.EA3o
POPULATION BIOLOGY.
PopulatioH St:udy ~iethods and MaterialsRe:..;ults.Discussion
FEEDI1·IG P.3:0I..O(;Y •
Asteroid Fe~ding Biologyl~e th.ocls ~
Results.Di.s cussicn
REPRODUCTIVE BICL!JGY 0
~lethod <.:.t"'ld :'1c1:e:ria.lsRe~:;ulLs '.DisC'Jssion
CO~CLLTIING DISCUSSION
A.PJ?E1.'DIX.
v
vi
•vi:!.i
1
56
10
15
16n63
66
666971
106
110
111115154
161
173
1~...,
i ,
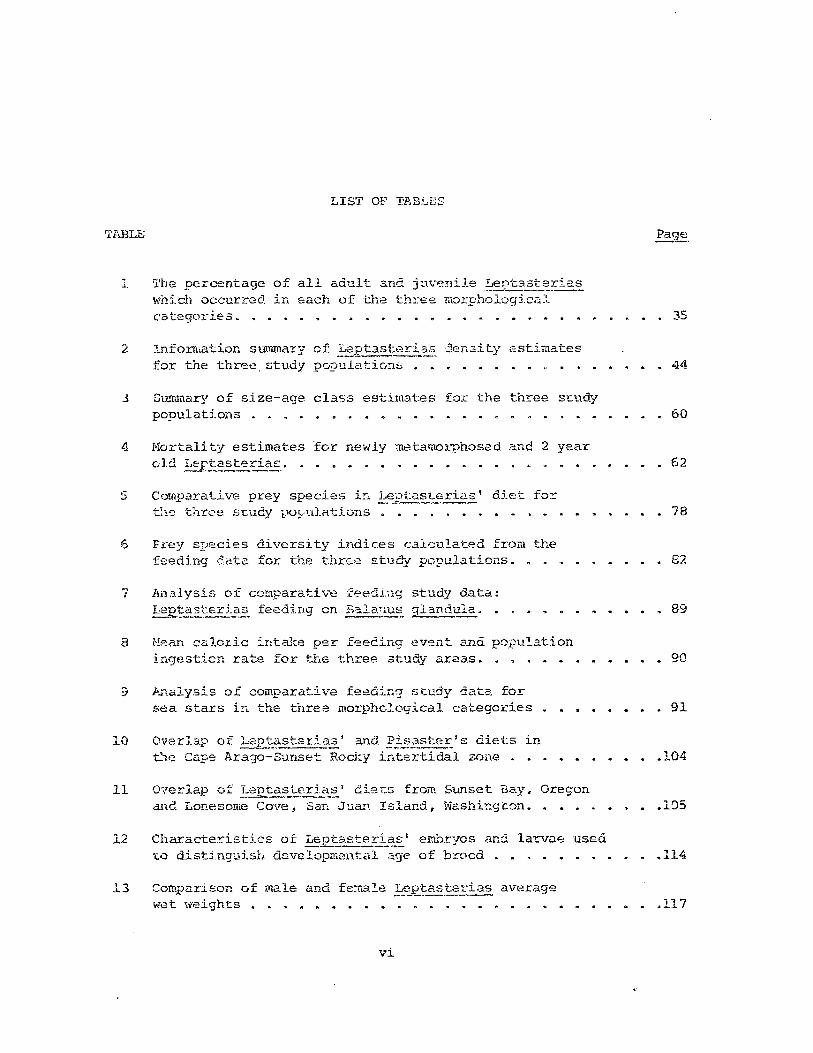
LIs'r OF TAB:...ES
.i. 'l'be percentage of all ad1.l1t ana. jtlv~niJ.e!:,ert.3;.§.!-.~!-j.a~
which occurred in each of the th}~€:e morI:holuqicalcategories. 35
2
3
4
7
10
lnforrnation summary of .!-,ept3.steri..:~ ;]en3ity 2stimatesfor the three. study pO!?'.lla tiG:w
Smnmary of s.ize-age class estimates fO.t" t.:he three Sl:ua.ypopulations
Mortality estimates for newly metamo~~hosed and 2 yearold .!:ET!.§!.st"":ci!~.
Comparative prey species i!'. !:.~~t~~-t:.eria~I die-c fo~
t}lt) t~1..rce st'u.c.y :poFl~11at.:ions "
Frey species diversity indices calcula:tAd from thefs~edi.ng dc-lta for tb.e t.hrs!= stuc1y p....1pulations.
1I11.').1y5i8 0 f camparative feedi01g study data:Leptasi:eria.E-~ feeding on 3alaTl~_ gl:mCl:..ula.
iYlefl.n c<:;.loric intake per feea.ins.- event and popl.l:!.ationingestion rate for the three study areas.
An.alysis of comparative feo:::ding study data. for£.;ea stars i::... the three morphc.logical categories .
and Pisaster's diets in-----~-_..-
Arago-Sunset Rod~y i~tertidal zone
• 44
· 60
• 62
· 78
82
• 89
• gO
· 91
.104
11 O':terlap Qf: Lep,tast.er:Las' dier..s from Sunset Bay. Ores-onarId LOEesome Cove, San Jua.'"' Island, tvashir.s ton. .1~5
12
13
Characteristics O.I: Leptasterias I embryos and larvae usea.-..:0 distingtd.sh developm.ental a9-e of b:cocd •
Cowparison of male and fema~e .~~~as~eEias averagew~t \veights
.114
.117

Tl"BLE
14
IS
16
17
18
19
LIST OF TP.BLES continued
Comparison of peak malereproduct.;ive output for 1971.
Comparison of prebrooding fen:aJ.es for number of mat.urc~
e9gs in their ovar.ies .
Summary of 1371 brooding data recombined into eightlarval developmental categories •
Summary of 1971 brooding data oombined in'tr.::- cat:c-;roriesbased on wet weight of the brooding fem:tle.
Comparison of broodin':J females from each studypopula.tions based on femalG 1riet ,,,eight..
Summary of d.a.te:. collecteft during the 2.972 broodingseason for 11 ~~ia.s populations.
vii
· 123
1 '" ')• L. ..)
• 1"10
• J.42
· 143
1.1-• _ _.J
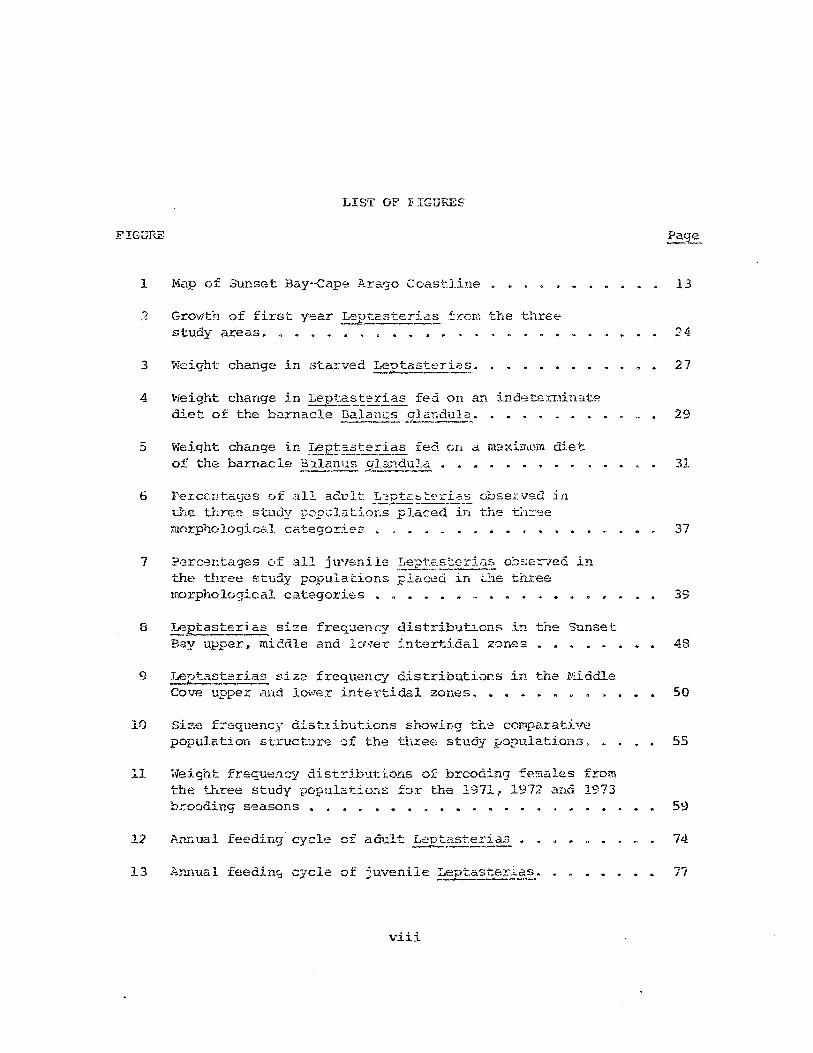
FIG0Tili
1
3
4
6
7
8
<)
10
11
12
13
LIST C>.P FIGUEES
Map of Sunset Bay--Cape Arago Coast-J.ine
Grovith of first. year ;!:::::pt23teTi.a.~ '~:ccm ·the threestudy areas.
vleight change in ~~~~~!2rias fed. on an indets:rmin;:;.tediet of the b<:lrnacle palaE§. _9.li~~1dul..§~.
Weight change in .I!:E!-?-.!?te_ri?s fed OIL d maximmc, diet
of the barnacle ?~la~~5.Q.~lduJ.a •
Ferccnt.ages of all adult .:r:..::.?.!E~:::~:L'_G;'?.. obsexvec1 :intiLe t.Ln::;~ study F0p'.11aU.ons pJac-ed in ·the ti1.::::-2emorphologicc.1 cc_tegorie2
?~rceI:ta.':les c·f all j \1"eni 102 I,ep.!~_;;~crj'2~ C:::'SE:iC-jec. inthe three study populations place.:i in ...l1e threemorphological catego:r:ies
l.e.vtasterias size freqaency uistrib'.l'b.cn.s in the SunsetBay upper, middle and lU!le:,r :'ntertidal zones •
Le:::)ta~~rias size frequency dis·tributions in the 1!iiddleCove upper and 1m'Jer int.8:ctidal zones.
Size f::-equency distxihutions showing t::r.~ comparat.ivepopulation structure ·::;f the -three study popu.lati.ons.
~veight frequt:ncy distril.1'.l1:ions of brcoa.ing females f.!:omthe three study populatlo:is £:Jr the 1971, 1972 aiK1 1973br.ooding seasons •
viii
13
24
27
29
31
37
39
48
50
55
59
74
77
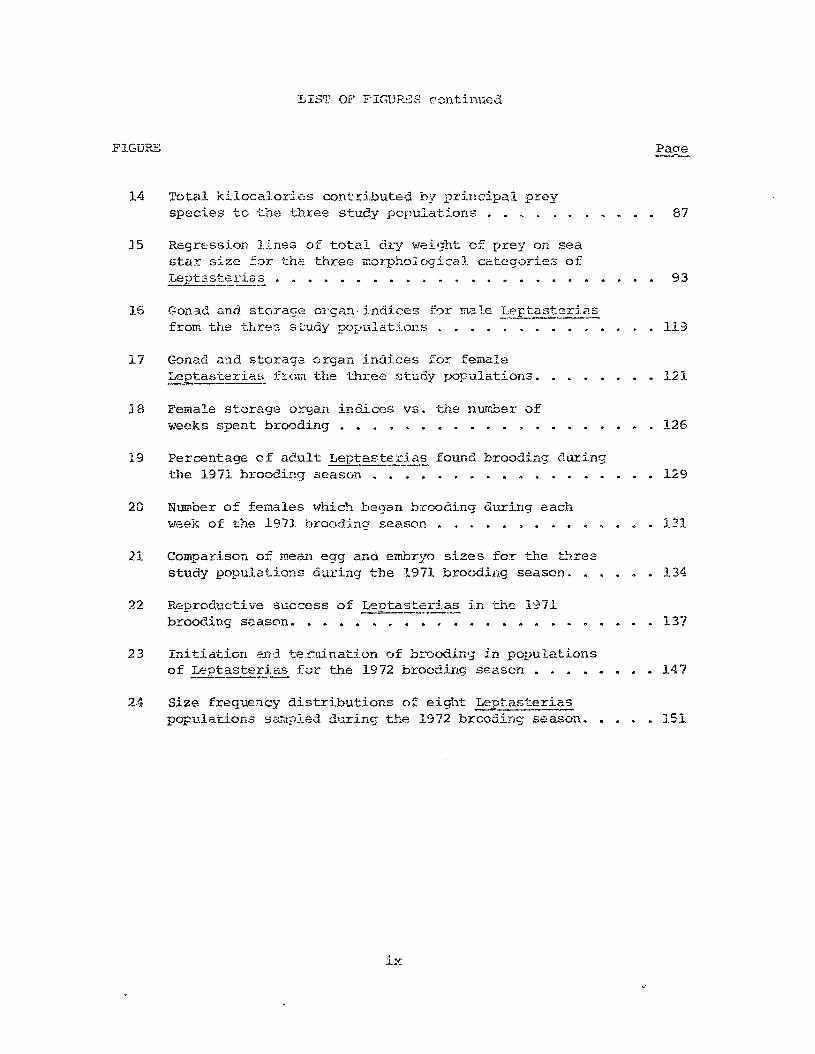
FIGUP....'::
14
J.5
16
17
18
19
20
21
23
24
LIST OE' F'IGUPES conti11ti.c:d
Total ki.localori.es contri.buted by principal preyspecies to the three study populations .
Regn:ssion L~nes of total e.tl:Y \vei'Jht of prey on seastar s:'~ze for th",2three. morphologica.l categories of
I.eI?tas.~.,=-dE:.~ .
Gon3.d and st.orage oi"'san indices for male ~:.:.'?pta.s..!:E.Eia~
from the t.hre:z s Ludy popLilati.ol~s .
Gonad a:ld storage organ indices for femaleLeptasteria~ from the three stuoy populations.
FemaJ.e storage organ indices vs. the number ofweeks spent brooding •
Percenta.ge of adult Leptas~:das found brooding duringthe 1971 brooding season •
Number of females \.;hich began brooding during eachweek of the 1971 brooding' sea.son •
Comparison of mean egg and embryo sizes for t..."1.e t."1.re2.study populations during the 1971 brooding season.
Reproductive success of Le1?tas~!:Fi.<:,:~ i.n thE; 1971brooding season.
Initiation <md te:ouina·tion of broodin'J in populationsof ~ptaste~ias for the 1972 brooding season •
Size frequency distributions of eight Leptaster~
populations s~rn?led du.ring the 1972 broodins; season.
ix
Paae----
87
93
• 119
• 121
· 126
• 129
• 131
• 134
• 137
• 147
• J.51
nrrRODUCTION
The relat:.i.onship bebr18en life his~:ory phenOIr,e!la (such as re:c..-r.Qduc-
tive strategy) a.nd genera] evolut~ior.ary theory has been discussed onIv
recently in ·the ecolG9i calli teratu:n;. Hurdoch (1970) point!:; out that
the population consequences of life history phenomena as they relate ·to
fitness and natural selc-,ction we:>::e first discussed by Cole (l954}. 'X'his
was mor·e than 20 years after the rnat".hematical founda:tioI' of t.ne th.eory
of popula'cion genet.ics was sumrnarized by Fisher (930) in essentially
its present-day form.
In his general theory of clutch size (.:Ln bi.l::ds) Cody (1966) felt.
tha.t. the num.be:c of offs'O,ring \-I7ould decrease as emTironmen-tal stability
and/or predator avcJi.dance i:i1Creas8o. Murphy (l968) dis2.g::reed and felt
that u"·lcertainty in sur'."ival, especially from zygote to first mat.uri t::{,
generated selective pressure f'Jr i teroparity. 'rhis may then entrain
pressure for reduced energy allocation for reproduction (smaller clutch
size) in order to insure longer life.
Hairstonls '2t al. (1970) results contradic'ced ~11..1rphy's (1908) con-
elusion. Th(~y ascribed his results, i.e,. w"'"1e evolution of iteroparity,
to the impositicn of density-depl.:!nc1ent: reproduction on his model. They
concluded from their own experiments that the ..2idespread evol"..ltion of
iteroparity is evi3ence of density-depend9nt population regulation.
Gadgil and Bossert. (1970) conclude tho.t populatic..IDs living in more
2
stable environm2rrts with low incide.flCe of c<'.tC'.st.:::ophic illor'c.ality ...ro1.l1d
t.ene to er.c(".Jur,Ler a r~lai..iveJy lov;' availability of resources. In these
pOP'J.ldt:.i::J:lS <~).ey ~170vld expect to ~j.n:l 10't7 reproducti ve effort and life
hist.ories cha:!::'actE=:!.""ized by late maturation a.nd longer life. spans. Tne.3e
populatimlS are sai.d to delaonst::~:a1:e the It,l<·-selected" reproduct.lve
stratr~gy (NaCi:'rthur & ~'Ii 1sc!" 19<:7). The: "K" st-r:at8gy is to :maintain
the high€st dens:i.ty possible in a. population at equilibriuill, t.hus
favoring genotypes 'which confer competiti'Ie ability, €spe-cialJ.y ·the
capaci ty to seize and hold a piece of the environment. and extract the
energy produced by it (Wilson & Bossert, 1971).
Populations living in more variable eI:.vironments with higher in-
cidence of catastrophic mortalities ~'lould have higher quotas of re-
sources available ·to them (Gadgil & Bossert, 1970). These popl1.1a.tio!15
would ~e expected to exhibit high reproductive effort aLd have their
life histories characterized by early maturation aLd shor-ter life spa::-.s,
Le. t.he "ru-selected reproductive strategy (MacArthur & viilson, 1967).
The "r" st:l::<ltegy J.S to ma.1<:e full use of habitats "ihich, because of their
tempor;:u:y nature, keep many populations at any giver: minute on the as-
cer.ding portion of the logistics growth curve (Wilson & Bossert, 1971).
On a one-d5_mensiDnal continuum bet..ieen rand K thereproductiva
strav.=gies exhibited. by the two common a.steroi.ds of the Oregon rocky
1.ntertida.l zone, ~':J2tasteria.s and Pisaster 1 'tlOuld appear to be far
<lP?ir-t. 1':'1e female ~ster procluces large n:unbers of energy-cheap ova
;"ll1ich develop into long-lived planktotrophic larve.2 tha1; are highly
dispersible and ~:a~")dble of colonizing any s~litable open habitat, 'Ihe
3
female !-,epta~"t:.~.!ias_produ~es c.:onsJ.derably fe',vcr, more energy-expensive
proge::l.y and invests additional energy .1.n brooding them. These larvae
h"ve very low dispersibill·ty but are released as fl::.ll~l metamorphosed
stars and are thus fl"eed from the high lcy'el of mortality suffered by
plcd1kt.cnic larvae el.'!1orson: 19S0).
Vittor (l97J.) poi.nte'::' out the syn·thetic r.ature of apprc:aches ,.;hich
.:rtte;:npt. to ex:;.lai.n all life history strat.egies in terms of an r to K
He fe11: that these b::rms should net be applied where the
assumptions behind the concept of r a~d K selection are not met. The
above comparison of Lepta.:St~Eic~~ and Pisast~..£ is an example. The
dominant selective factor ~'.ihich most influenced !:epta~te:r:i~ reprcduc
tive strategy of brooding vJas p:r:obahly not a stable environment with }(lU
incidence of c.'1.tastrophic mortality, but rat~er t.ne unfavorable pola::-
conditions including 1;:)\v surface saliniU.es du:e to icc. melt, poor plank·"
tonic food conditions, >'lith a short sumrll.er productive period, and low
te:llperature. It is felt that these conditions havo selected against the
production of planktotrophic larvae and explain why an estimated 95% of
polar benthic invertebrate species produce somz type of non pelagic
larvae (Thorsen, 1950; Pearse, 19690).
piarL"k:.a (1970) sUITh.i1arized the controversy oyer rand K sell-;ct:i.cn by
stating tha·t. .. certainly no organism is corr.pletely I r-selected' or ' K-
selected' , but all must reach a comprolnise bsb;een the two extremes."
YlacArG'i.ur a....d \'1ilson (1967) ant.icipated much of this cont.roversy and
recognized in the preface of ·tneir book 00 island biog·eograpny that
t..~ei.r ionr.ulat.ions 'Nould not long fit the "!:'!xacting x'ssults of fut.u.re
empiri.cal invE,stigCl,tion. 11 ROT,toleVer they certainly a.ccomplish2d 1:h,~i1::
stated goal of "stimulating ne~] forms of -cheoretica.l u.nd emp::.r7.ccll
s·tudier; 'iVhic:t ',,,ill ].ead to a 3tr!)Yl'Y=;~: general theory. Ii
F.'~a::-,}: (1968) di.~c".:t;3sed t.he :r.ela·::ionship }jet,,,een life histories and
HE; er::.?hc.sizE::J. Cole's (1354) strong caU, fc~ a more
hi£tory f{~atUJ::es a.nd st.ressed U1P. need for adf~quat,e f.'mpirical Q8,ta,
especially fr.:,T.,~. marine anima.ls. FrCULk made the sV.9"ges tion -that trle evo-
lutioIl cf te.l....res·c.rial ccrn...""!l.u~ities initially was accor.:1I)lishecl :by th~
p:rBsenC2 c£ lcngevous plants as a staJ.::,ilizinq effect. These Im1g-1ivcd
plant:::: tend to haVE:: indE;r.e1.""!!Iinate grovlth, many ha.ve .:..sexual reprodi1c-
tioD., an.d most hi:l'!e a relaUvely large" lit·t.er size" whicb. ter.d:;to in-·
crease with plant si2e.
ties he paint!=:od out t...'1e lad: of long-lived marine plant.s 1 but also the
fact that shor~-lived, 3hallow, epibenthic plants are accon~anied by
animals 1{1':;'t:11 high fecundities and relatively l:mg life sr-?~"1Sr many of
1rlhid1 have 'crt least. part:.ially indeterrdnate grov1t.'1. He indicates that
these J.ife history features ctpply for exampl,s to many coelent.erates,
::i1ClluSC5 aIlu fi shes, a~1d perl1.aps echirLodernls.
Recent. long term studies on sea stars (Mauzey, 1966; Chia, 1964;
~1enge, 1970) are in accord with :5'rank's suggest:i,on. These echinoderms
appear to be lor,g-lived (3-5+ years i.n .!-"eptao~·teric:~: 6,-10+ years in
and are "\i"er:y f~Ctl:ld .. I-im-.;ever F ::\ud:. \ojork is nep.ded 'to c:l.early
dete:rmine and evaluat:e the repro~nctive strat.egies of 'chese a..r.:i.mals an,j
t..'1eir CO~1s.,.~quer)t::::ef; for 'the popula.tion ar.:c1 m.ari.r.e c010mu!"".ity in ger:.ep~l.
5
An orgal'lisw's life hist01:y may b~ lcokec upon as the n~sult.ant cf
tllree biological processes: maintenance; g!:"o'lrth, and reproductiop.
(Gadgil & Bassert E 1970). Any population a.r orgdn::"3ffi has limi t2d re-
sources of en2!:"gy and time at its disf'csal, al"1t.'!. the t.hree compc:1em:
pX'ocesses af life hi.s·tory compete for These limited resou.r:cE':S. 'l'his
st.udy is a'1 investigation of t.he relationship hetween the populi'lt.ior.
biology of an intertidal sea s'1:ar and its reprod~ctive strategy of
hrooding yaun·J. It was pcrforr:!ed to determine hmv this species .?art:'~-
tions the Iimi·ted resources available t.o it a;l1ong it.s J.ife history pxo-'
cesses, and the overall effect this has on popuJ.ation. structu:ce.
population basis involves the study of many aspscts of its m~tuX"aJ.
history. The biology of .!'ePi.:§tst!,=ri~has been considered on the organism
level by Chia U964, 19660. & b I 1968a. & b), and the role of this sea
star in the intertical c01Uffiunity has been describ~d by Menge (1970,
19720. & b). These workers have investigated some aspects of
Le-e.tasterias reproducti;re biology in their studies. Therefore our work
ove::-rlaps somewhat, and I have borrowed from their tec.'J.niques. I have
0.130 bene fi ted from ideas and results pres8nted by th,~se authors a..:... c1
from correspondence and disc·.!5sion 'd.th them.
This paper is organized to follow t.lle 2l.!1!1ual cycle :)f events in
Leptasterias populations. It starts arbitrarily ;,.!ith the release of
newly metamorphosed sea s~ars and followS the arlnu~l population cycles
of growth, mortality, feeding and gonad pYeparation as they contribute
E.i
to t.he sUDsequent brooding and releas~ of youn~ and the beg'inr~ing of
another cycle.
Echinoderms have served as t.he s1.1bject of em:.bry~logical investigcJ.-
tions for mc_TJ.Y years. Conscqu.cntly much is knmm about the r":::produ.ctiVI?
processes and spawning periodic:ities' of many species pal.ticul.arly those
,,'hich occur in aburldance n~ar major marine institutions (Harv<2Y, 1955).
The majority of this work has been done ~;7ith echinoids belongin9 to t.ile
Recent viorkers with echinoderm repl~oduction have de:::3cribeC: oogenE;-"
the breedi.ng .::ycle 'i.nd gona':'! ir.d102!s hc.ve been compu"!:.ed for many species
(suxo.m.arized 7,:)y Boolootiall, 1965). Since then the reproductive periodi-
cities of ~e~exal Indo-Pacific echi~oids (Pearse, 1968, 1969a & b, 1970,
1972) ~ld a New Ze~land ast~roid (CruDP, 1971) have been investigate1.
On a broa.der scale the :r:ela·ticn of gut nutrient. re~erves to repro-
duction and nutri~ion in sea stars has been histochemically defined
(Nimitz, 1971) and t~he mechanisE'i of nt.ltrient transfer demonstra·ted
(Ferguson, 1969). Also ~11e mecha:lisr:1 controlling sea star spawning ·~ias
hypothesized. by Kanata.i1.i and Shirai (1970). :~ involves the release of
a gonad-stimul.ating substance (GSS) by th,:: radial ner.~e (Chaet Ii,
r'lcConnaU9he.y, 1959) \..rhic...'1 act,;; on the mlary to proc.uce Co.n active sub-
stal1c-e (l\1IS; :neiosiz-i.nducing sUbstancE.') re::;p0n.si.ble for oocyte rnat ilra-
tion. After the ooc;/i;es 'Cla·ture~ r-ne sea s-:.ars spa"!,~J'n. F~ecent ':Jlork
7
indicates the existence of such a GSS in echinoids as well (Cochran &
Enge::"man;l, 1972).
Despite this accumulated ..,ealth of inf.ormation en ecninodeY:m repxo-
duction there is still much trl:!t.h i:l NichoIs' (1964) statement COl1-'
cerning ths lacJ~ of cOT-celation between reproductivr:3 activi t.j '2~; and
ecologi cal factcrs in echinode:!:ills. The s-;,:ndy of echi.noderm ecology is a
relatively nevi field which start:ed on i:1:.is coast in the 19508. Again
the Itk1.jority of the eal~ly \..;rork ",as aone with the ubiquitous echinoids,
T,vit.h the exception of f'eder's (1956, 1958) 'No:t'k on Pisas~!:E ~hras:~.
Since then Mauzey (1966) has studied ·t.he feeding habits a..'1d reproducti',e
cycle of Pisaste:c:.r and .La.rJ1.er:berger (1968, 19c.9) studied select.ive
feeding and t.he effects of exposu.re to air in this sped.es. Paine
(l969, 1971) 1'1?-_8 E:xplored r...,','1E: cO'illJ.tlunity shaping role of PisasteE, a.'1d
o·t.'l1er asteroids.
Other ecological stuQles on asteroids include work on growth rates
1970); and work on int.ensi ty of larval sett.ling in Asterias forbesi
(Loosancff, 1964). Several studies of sea star feeding behavior include
\\i'ol:k on the escape responses of sea star prey (Fede:::-. 1963;; Mauzey et
al., 1968) as ·wel.l as ali observa.tion ')H general feeding beh3"i.7ior in a
variety of suhtidal sea stars (Hopkins & Crozier, 196~; Mauzey et: cd.,
1968). The results of these and other pertinent studies on sea stars
\vill be • - ::l ~conS.l.aerea. ~n t.:he appropria.te chapter belm;.
hex~ctis. ha3 bc,e" reported by FU-S}L~ang Chia and Bruce Ne;1ge from the
8
'.Jniversity of Nashington. Chia's work included a detailE:d description
f'0 .• oogE~nesis ~~d larval embryology (lS64 I 1968a, 1963b) as well as ~
brief study of brood.i.1J.g be!lavior (1966&). Chia (1966b} also die. a.
toxonom:!"<:: Gbldy of <:he genus j.n which j1C co~bined tne species TL·.
a.T.'.d L. hexc,ctis.
(1970, 1971a & b) recently completed a long-term stuc1y of t.his speci·::s
in thc-~ San Juan Islands.
'I'he fcrc:ipulat:e asteroid, .!:. ,!:e:i!.actis. is fou.·).d in 1::he middle and
10\'l~;:- intertidal zone anc1 is distributed from Brit.ish Colwnbia. to
Monterey Ba)', California (Chla, 1966b). r~o!'>t members of this genus
brood their eggs, and several methods have been evolved for brooding
wi tj:~in '.:.'~le gc:nllS (Hy:nan, 1.955). Female L•.hexactis accomplish this be-
navior by arching their arms orally, bringing them close together and
forming a .~Jolld~ i:1.-::'("; which they deposit their eg'gs via 12 orally locat~ed
gonopors",. The fer:\i?,le attaches the t-.ips of her arms to the lmdersurface
of o. rock a'1.d remains in this position for a period of 2 i!lcnths (Chia ,
1966",). After this period the yOUt,g, ,·,hich undergo direct development
~Chia. 1968b), are ~eleased from the brood poucl: onto L~e rock surfac~.
The fer-.ale ther.. resu:r-'3S the normal oral-suroEace-down position bUL: con-
tinu.es t.O CGvel: her young »,"ith her a.x."I!1S until they are able t.O fe(?o on
~~eir own, several days later.
'I'here are several otl1.er interesting asp2.::ts observed in th",
~enge (1970) and Chia (1968a~ b«>··
lieve t:]-,::;, female re19ases only enough eggs to fill the brood pO'J.cb I i.e.
Ol1.1y tl1at nuwber which. she can s1.1ccessfu.l1)1 rna11ipulate, aerate, etc"
and a11m,' +:0 d,,"velcp com;?J,tely. ~·1enge (1970) felt t.hat. a female cou.ld
handle the Tlm:t'C81. of eggs 2.ppr:>xirr,.G:.tely ·::qu.al in volume to half the
volume of t:he brood peuch, 30m2 of which "iere lost. during c.evelopmen-t:..
Thus the femaIl?p:codt.lceSrel3.tivelyfe.l?gam~t.es"lInen corcpared t.o nor;.-
brooding sea sta:!:s (Tr.'')L'scn; 1946}.
A:!.location of energy is much tiifieren-:: b2tvleen male and female l:.
hexact:is. The females produce a limited number of gametes but retain
sufficient energy reser.ves to cilrry them through the '} month brooding
period as 1.:hey do not feed du:r-ing this time. The male L. hexactis pro-
dUCE: large qua:'lti·ties of sperm and drastically deplete their energy
However after spam1ing the males are able to
continue fe8ding, althou-;h they do so at aIm"," rat:9.
Another interi.'!sting observation is that the J.anral sea stars "jill
not develop t.o maturity outside the brood pouch.
1s observed is asychronous ,,dA.:h the timing of normal development; and.
the lar"ae rarely escape from the egg membrane. Larval development
within the .t.rood pm.:.ch is synchronous a..."1d direct (Chia, 1968a).
For the remainder of dissertation Leptasterias hexactis will
be the only spec::.es of this genus considered and 'rd.lJ. be referred to
by the generic n~ne I.ep~asteria~.
GENERA,L METHODS AND DESCRIPTION OF STUDY AREAS
In the st.udy of ast.eroids it is customary t:o rep0rt their linear
dimf'lnsions in terms of disc radi'J.s, de$igno.t:ed "r" (H~7,1a!'l, 1955) aY'.d t~h:!
\";1101e animal radi.us frOITl thE::: center of thr-; disc to t.h~~ tip of the ilJ::lll,
"'''0 ".,.six rays inst.ead of five, and ti1.iS allows three ax,~s from "tihieh 3. mea-
S1.U'E: of total dia.metar can be made. Total sea s·tar di ;.:tmeter ,the
equivalent to 2R in convent.ional te:cms, was the main measurement used in
the field and was the mei3.n value obt.ai;led from the tl:ree possible dia-
meter measl~rements.
~~e tidal levels at eac~ study site were obtained by observing the
low point of the low tide, and marking its position. This ~vas done on
calm days and several different observations were made to offset the
variability caused by wind and barometric pressu.re.
reference points the vertical intertidal range was arbit:.rarily divided
into three zones. 'l'he height:. of the le"vel along the shore is given in
feet. above or below f'.lean Lower Low 'itlater (JvJI,LW). These are the lower
intert:idal zone, 0.0 feet and below, middle ifltertical zone 0.0 to 2.5
feE;t aJ.d upper. intertidal zone 2.5 feet to the upper boundar.':!' of
These'zones are approximately the s&ne as zones 4, J, and
~ respectively of Ricket.ts et al. (1968). Lept~sb;;ri~did not usually
occur in zone 1, the highest intertidal zone.
:.LO
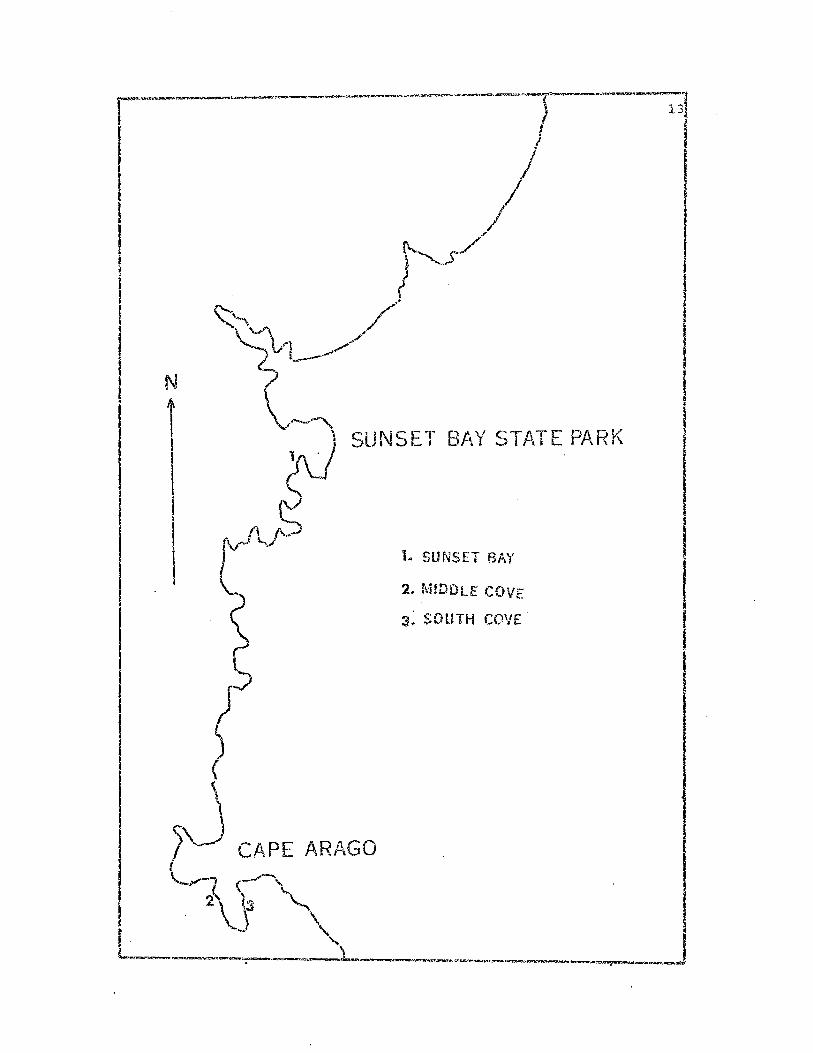
1J
Three p2rrranent study sites were established ~in ilia Cape-Araga Sun-
set Bay area; Sunset Bay, and Hiddle a!ld South Coves. Cepe Arago. "rhese
areas were selected because cf ~~eir similar su~stratlli~, -their year-
round accessibili ~:y a.t 101" ti de I arid bec2.m;c of the densities 2.nd size
frequency distributions of t..'w resident ~J2!:_::l.s~e2ias popu::'ations.
The region from Cape Arago l.ighJ:ouse south,yard beyond Cape Arago
State Park (Fig. 1) is comprised of st6epl.y ,Upping interbedded sand-
stones, siltsto:1es, and mudstones {Rottm.a:m, 1970). It is characterized
by a £u:tf-cut bench and nearly ';rertical .sea cliffs in various stages of
formation and nurllerous small coves eroded along fault lines (Bald'r7in,
1966) •
The Su....1.se·t B.3Y !,eptasteri~s popu1.a·tion. ~"as located on the south
side of t~€ bay or. a relatively f12t area WiL~ a boulder and cobble
area at the north end. The sea stars were found within and adjacenc to
i:...~e boulder field described by Ebert (l966). 'Ine cobble area was at the
base of a cliff b.nd had a smaller area {20 'by 30m) thc~"1 the other two
locations. This area is relat:ively protected from direct 51116115 ovling
to outlying reefs and its >je:)graphic orientation.
The Le~tast':.:r:ias study area in !>liddl€ Cove ,-"ias located appr:oxi-
Eate1y 100m from the base of the n.orth-faci;-;g sea cliff and 10-20 m from
the east-fQ.cing C.U:l::t. It was a mixed. cobble~·boulc:.er area (63 by 21 m)
on a relatively gradua.lly sloping surf-cnt bench. It was bounded on
the sou·t,.'l1, by Iarge boul.ders i':.l.nd on the north by exposed bedrock and
Fig. 1. Map outline of the Oregon coast in the vicinity of Sunset
Bay and Cape Arago State parks. Location of t"...~ree pcrrnammt study
sites is indicated.
12
1
1~ SUNSET BAY
2. E\'ilDDLE COVE
. .-:: Dl!TH ....0'·£3 . .... l J I l~ ".-/
1
14
was Sunset Bay, especially from west ~ld soutlvNesterly s~ells.
Soulh CO\'c is directly exposed only to southerly swells and is Yr.ore
pro·tected thG.:l HidCl.le Cove. 'Ibe r.oc-':helT. base of i.~he cove is a sanoy
beach and a relatively broac. surf-cut bench is located at the base of
the sea cliff Otl th(~ T;.'est S~~le. 'In~ sea stC'lrs ..Jere found within a
i.
c()bble-boiJ~der area (41 by 43 m) wh5_ch extends from the sandy beach
pa:r·t way along the bench.
POPULATION BIOLOGY
Until recently the majority of life history in,~stigations of sea
stars was prompted by the damage L~ey caused to commercial shellfish
beds (Feder, 1970). These studies have shown that aea star growth da
pends mainly Oli temperature, the abundance and suitability of available
food, and sea star size (Feder, 1970; Halpern, 1970).
In sea stars from ·t.emperate and the more northern wate!:s grovlt.h is
reduced and may stop entirely for several months during t.he coldest part
of the year (Feder & Christensen, 1966; Halpe!.-n, 1970). When "'...ater
temperatures get very low, many speci.es cease feeding almost entir<;.ly
(Fed~r & Christensen, 1966; Nauzey, 1966).
It is usually difficult to measure gro\<7th rates in populations of
sea stars, as the grO'.vth rates can fluctuate greatly with varying con
ditions. All species studied so far are apparently capable of assimi
lating lo3.1:ge quant.ities of food, if it is abundant ana of the right
kind (Feder & Christensen, 1956).
It is a]~ost iwpossible to tell the age of a sea star from its
size, because of t.hese 't,ridely fluctuating growth rates. Trying to
determine age groups on tlle basis of size frequency distributions will
generally give fallacious results, especially for the larger animals as
several year classes may overlap greatly in size (Ebert, 1968).
In this chapter I will present growth data for both young and adult
IS
16
Leptaste£ia~1 describe Lhe obse~ved loc~l variation in Leptasterias
distrib';J.t:ion ful.d abundal1ce, and review the factors contributing to these
observed phenomena as discussed by Connell (1972) and others (Dayton,
1971 i Ricketts et 0.1., 1968) in recent revievl articles on the ro::::ky
intertidal con1ffiunity.
Growth Studies
The growth st11dy of the ne;vly released stars from t.h.e 1971 brooding
season was followed in the field for a 1 year period. Monthly samples
of 25--50 i:1dividuals we:ce measm.:ed from each of the t.hree study popula-
tions. ~~e growth d~ta obtained from this investigation were used in
combination wit:h size frequency data mentioned below to estimate age
classes.
The 1 year laboratory study of grcvrrh in adult Leptasterias was
performed a·t the University of Cregon using a 001d constant-temperature
room. During the 1971 brooding season 200 brooding female Lep·taster~~
vlere collected from several Cape Arago-SUYlset Bay populations. These
animals '."ere !:laintained in water tables at t;"e Charleston marine station
Thl.ti1 15 June 1971 when they were transferred to Eugene.
The exp!=:rimental Leptasterias we::::e divided into t..'ree groups of
approximately eq'J.al size distribution. One group was dyed with neut.ral
red and nile blue A (Nat.-·l'=son Corp. Inc., Cincinnati I Ohio) respectively,
using the method described by Feder (1955). Sea stars in the third
group were Ief'e Nith their natural colorat.ion.
17
All a..,imals were da.-np dried with paper tOiJl1elling and ,,,,eighed to
the nearest O.lg on an Ohaus triple beam bala~ce.
madrepori te is excentri.c and located in the inter-radii of two arms
designated C and D by convention (Hyman, 1955). Using this notation
the arm lengths of each Leptasterias were measured to the nearest milli-
meter. The resulting combination of color, weight, and variation in
arm length allowed individual ~tasterias. to be follmied ;,V'hen placed
"together in small numbers.
Groups of eight Leptasterias ,vere placed in 3 liter batte=-.i jars
which contained flat sfu!dstones taken from the sea stars' habitat. All
sea water used was obtained from the Charleston marine station and
filtered before use. All prey used in the feeoing experiments ~ere ob-
tained from areas adjacent to the stu&y sites.
Tnree replicates of eight ~-Etasterias were established at each of
three feeding regimes. Individuals in the first regime were given all
the food they could eat, the second was supplied with approxiwately half
of what was given to the first; and members of the third regime were
starved. These animals were maintained at a constant temperature (IOce)
and a constant diurnal light regirr,e (12 hour light/12 hour dark). The
sea water was changed weekly and the battery jars were cle~~ed ~,d prey
replenished on approximately a hi-weekly basis. All sea stars were
weighed monthly arid measured every 3 months.
l'...aintenance Facto):'
:t'he cobbles and small boulders in the areas inhabited by
18
Leptasterias undergo much movement by storm waves. '1'he crushing ar..d
grinding action of the rolling stones can cause severe damage "to the
resident Ieptasterias populations in ~crms of mortality ar..d loss of
limbs. To estimate the comparativ~ impact this might have on the
Leptasterias study populations an index of morphological condition was
devised, and this "las ca.lled the m<:tintenance factor. Three categories
were designated: nonnal, incomplete and regenerating, and begir..ning in
May 1971 all sea stars observed in the field were classified according to
one of these categories.
The normal category consists of sea stars which 1:..ad all six a~"TO.S
in1:act and of approxima"tely equal size and length. Those animals placed
in the incomplete categorJ have one or more arms regenerated to approxi-
mately half normal length or have recently lost portions of one or
several arms. The regenerating class consist of anL~als which had lost
one or n~re arms entirely, i.e. cut off at the disc margin, or, if re-
generating one or more anus F the new limb (s) is only a fe ...., millimeters
in length.
Density and Distribut.i.on
In the summer 1970 I arbitrarily chose Hiddle Cove of Cape Ara90 as
a s"tudy site to familiarize myself with Leptaster5.as. and its habits. The
Middle Cove Leptasterias' cobble area was divided into a sampling grid
and markers were placed at appropriat-s: intel.-vals to facilitate reloca-
tieD at subsequent lO;"i tides. An arbitrary boundary, parallel to the
shoreline, was established in tbe upper intertidal and grid points were
designated at 3 m~.ntenTals along it ..
19
Transects were "then r.un parallel
to this upper boundal:.y every 3 ill until the lOv,'est intert.ida.l 'i.'as
reached.
At each 3 m grid point along a t.ral"J.sect. a O.Sn? {C.7 by O.7m)
quadrat was taken.
det:ermined using a. :Lc.ndom ::lumbers table. T1;VO plEtce randolii nU::loers were
preselec'l:ed, converted t:o centimete.cs, and the quadrac placed a'c. t..~e
corresponding distancE:' along the transect:. J.u:e,
quad:.:-at was thorO-:,J:9hly searched down to bedrook s'ubstrats and the mean
total dianleter of all sea stars encountered was measured to the nearest
half millimeter. An area of approximat~aly2
1500m (63 by 21 fil) ",as
searched in this manner..
From my experience in summer 1970 it became appa.rent that proper
estima.tion of Lepta.5tf.~rias density using transect teclmiques was 'Jery
time consuming, ana req'xlred fair weather and spring low tides. For
these ,reascns only one large scale esti::n.ate of density ...:as conducted
for SouLh Cove and Sunset Bay. During the summer 1971 at all three
study sites, a series of tr~~~nsects was rili~ parallel to the shoreline at
several intertidal levels. The same transect met:hods described above
were employed except the pe~~anent grids were not established.
The cobhle areas which ~eptasterias irulabits are someth~es diffi
cu.lt 'to search. A. quadJ~at r.1ight be placed over a large boulder or on a
pile of rock::; or on na1<ed bedY'ock. 'l'o estimate the total surface area
present ',.;it..."in each quadrat was 'toe tiIne consum::"£!.g to be profitable.
1'.11 :'>"I..1..IJsequen:t estime'tes of density combine areas that are not topc-
20
graphically homogeneom;; however the stratified rand01:t placing of
quadrats proport:ionally re:preseni:;3 the Sl.IDstrate pl.ese",t C:..t10.. does pro·
vide a reasonable estimate of density.
The spatiiil dispersion of Leptas-r.eribs ",'ia;;; detennincd 2.t:. f·!iddle
Cove by the extensive s2J11.pli.ng done there. 'l'he spat.ial dispcl~sion of
the Sunset B5Y popul3.tion vlaS determined by sa"'ll:fling at the 1m'1 I mic and
upper ti.dal horizons. Each C2nsu.S t.ook clpproximately 2~-3 }10l1r3 ~ A"t
least 100 animals were counted in each. All three 'Ir~ere ::omplet.ed during
two consecutive spring low tides. The spatial dispersion of t.he South
COYG population '¥-ras studi.ed less thoroughly I and ;,vas interpreted from
transect.s and general fiel.d observations. To determine the subtidal
distr:ibution of .~..:.~...!-o.s!.~.Eias the:; subtid&l zone i:m.'lediately belO":'i r.:i1e
t..'1x:ee study areas ,'TaS investigat~ed usin9 SCUR1i.
To observe moveffient within the intertidal zone a short ternl stud}'
..,as conducted in South Cove. A sample of 50 adults and 50 juveniles
was collect.ed on 15 June 1971 from throughout the South Cove intertidal
zone and taken to the marine station at Charleston. The sea stars wen3
dyed bright red with neutral red stain. These animals ~,.qere returned
the next day and released along a band in b~e lower mid~intertidal zone
which ra.n paral1e 1 to the shore. The band t'l1as 20 m long and 2 ill wide
a.'1Q l&rqe bouJ.ders at both ends of the band w-ere cleared of alga.e and
marked. The area ...vas censused a month later to determine movement. The
dye w.=;.s persistent, as marked animals were recovered for several
montr.s after being released.
21
Ir:itially t~he i~hrE.e m.=d!l study popu~.ati.ons weT!'? sampled O~ 2. f'ea-
sanal basis to e:?ti~.ate IX"lp'.11at.i..o:n struC'::,1re a..'1d oyn?mics. The sea
Ohaus triple bca!n bRlanc~" T!~ sca10 was protec~ed by a water tigtt
plywood case which was equipped with a hinged transparent door ~o allcw
readings to be made in t:he wind. ]~f·ter a yenr it: \'ias deternii1iE:~::1 that
the seasonal weight frequencies W8re of limited value.
abandoned in favor of another technique.
'i'hev were.
For the sazr.pling period from June -to DecE'.mber J.971. size frequency'
distributions were taken in co;:,j ur.ction ~·Tith the bi -weekly feeding ob-
sen"'a.tions. It was very difficult to see t~e young of the year end
they were not.: included in the census. The remaining s~",a stars were
grouped into 10 mm size categ'Jr.ies I based on thei r total mean I.limneter.
l;'xom January to .April 1972 a more comprehensive series of size frequency
distributions was ~cken. All sea stars encountered, includi.ng younq
of the year, were measured and groJped into 2 mIll size classes.
'I'hes~ la"tter cOi7Lprehensive size frequency distributions 'tlere
analyzed 1:0 estimate age (size) classes using the probability paper
tedmiques described by Harding (1549) a,"1d Cassie (1953). The former,
.less comprehensive size frequencies were used to estim.ate the relative
rn.mti)er of sec: st.ars within the calculated age (size) classes.
.22
Results
Growth Stucli.e s
In 1971 t.he ne'tl1y me tCll10 rphosed sea stars vlere .r.el"=i.1sed by the fe.-
males i:i Ap!:·U. thl."ough early May. At the time of reJ.ea.S€ the you..."1g "lere
1.6 mea. in di a..~;:-,ter. This year class \"ias folloVh;d on a monthly basis for
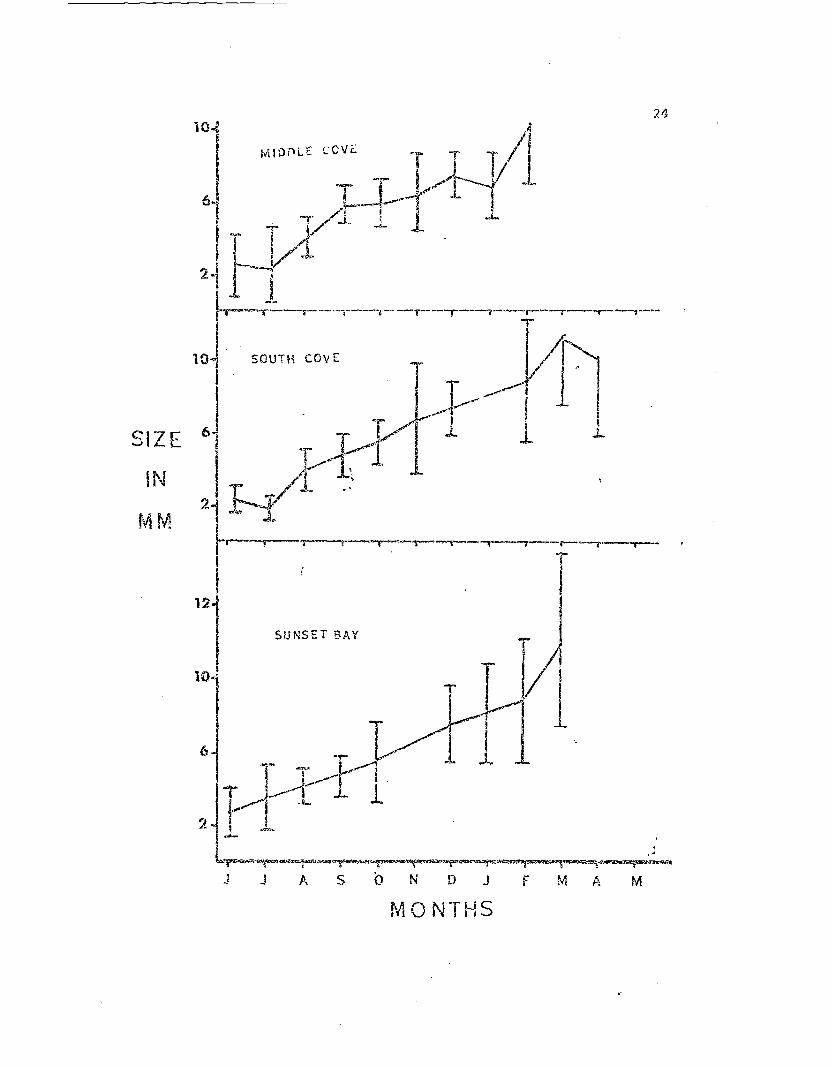
1 year. The monthly ave:cage siz~:l (Fi9. 2) indicates a fairly ste.ady in-
crease in size throughout the year. The increase in the standa:t'j de-
viation "lith ti:~r.e suggest.::; it disparity of growth a,:long individuals as
they become older.
The growth rate appears to be similar for all three study popula-
tions! vli th t.he young reac:'1i.n:; an averagE: size of 10.5 to 12.1 I:l'U in the
first year. T"nis :r:eprese:1ts 0. seven fold increase ir. linear size in the
youn.g stars Qnd is cO!r.pared to aT). approximately 12 fold linear increase
in size in r..ewly settled Pisaster during their first year (Feder 1 1970).
T:b..e growth af adult Le}?t:as~erias "vas measured in a laborat0:Cy ex-
p.:::rtment ,"..hich was designE:d to study t..'1e relationship bet:,ieen feeding
success and £eproductive effert. UnfortlL~atsly 'w~e laboratory system
proYed inade,:::p.Jate to induce the female Leptasterias +..:.0 brood. Alt.hough
the stars gainec \.;eiql~t! none released T..heir eggs du.ring the period t::'e
field popu.latio':ls ",ere brooding'. Act.ive Leptasteri~ spenn l"as added to
individual beake:cs cOrltaini.ng sir:g:e ;:e!'."!ales, and still none could be
induced to brood. '1'hereio't'e the dat.a. are presented as a Measure of
l'eptasterias.· ;r.:),.. th pote:I.1,tial.
BecaUS2 c:f th8 Ctifficul~:y of \olf1;ighi:lg such srr~all an.irr:als J..11 the
23
Fig. 2. Growth of first year LeEtasterias fl.-om the three study areas.
Each point represents the mean diameter of a field sample of 25-50
sea stars. The vertical lines represent cn~ standard deviation.
24101 MlonLE cov" T T 1/1I T--L~l
6-1 .' ~-f--1 I/! ,. .Ly_L {IT ~1 - .
21D=-'__ , I. T " ~ ----=r--.--r---1----
It SOUTH OOvE . 1/ ~, flSIZE 6J, -[ TAl r- 1 1
! ~ ~1
IN ?I ~'1\ --
MM --1 : _.. '-1"'--'-,_.--r---'T""""-"--""---,'--,.'__~I . ~
SUNSET BAY
101 ~
1), L.~---1'" J_ 1
'i I"'~J -.9-i'i .1. .-.. .~~aJ1l~~~~~'\i'l!(f..'ltt.~~~A~~~~..~'~'1t~~~
J J AS b N D J f M AM
MONTHS
field the young stars were compared on a linear basis.
.25
In clder stay's
the linear measu.rements are less accurate as they can varj over short.
periods (Feder, 1970). In order to avoid proh.1.ems, both ",eight and
linear measures ,,'ere taken; "the i;Jeigh~ measurements .proved to he more
re liable and are used here.
Init.ially t.he ma.;dmum a.nd int.ermediate feeding resp.r~es ,,,ere fed
intertidal gastropods, ~~ttori;:-,a spp. The sea stars ate these readily;
hO",,12ver the li·ttorines era.iled t.-pthe sides of the battery jars ai1.Q out
of ~aste:::-i~' reach. After 3 weeks the littorines Vlere replaced by
Balanus glanduL~. The barnacles were collected attached to a thin
layer of Sffildstone s~fustratum and were placed as food in the battery
jars in this attached condition. The stars were checked daily and When
t..l:1ose in tl1e maximum feeding regime had consu..'!Ied all their f00...1, i.t "'18.S
:::-eplenished. P.t the same time approximately half the ammmt of food
given to the stars in the maxiwllffi feeding regime was given to those in
the in·termediate regime.
There was some initial mortality in all three feeding regiroes.
f10rtality ,,,,as great.est among the starved animals and there "t·",er.e many in-
5t&~CeS of cannib~lism in tnis group. Because of this, it was necessarj
to pl:ovide the s·tal:ved animals ',ii th a minimum amount of food. A low
level ()f mortality continued through the 10 mont..~s the experiment \-;as
condlJct:ed f and i"'as highest in the starved animals.
The per cent. c'l.anqe in weigbt over t..'1.e experiment is presented for
the e.~ee fee6.i.ng regi.mes in Figs. 3, 4, ail.d 5. For compariso:l the
stars were grou,ped in 2 g weight classes and separate cu...""\,es plot·ted. for
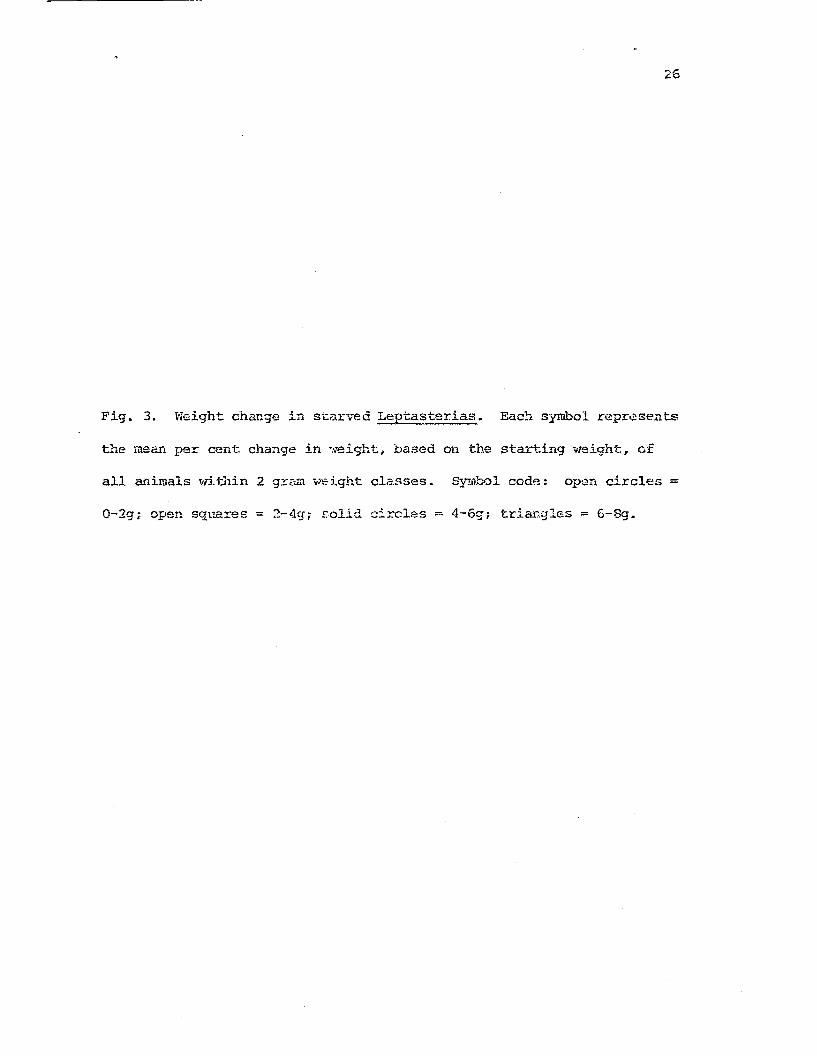
Fig. 3.
26
Weight change in starved LeE~ias. Each symbol repr.~sents
the mean. per cent change in "!leight, based on the starting ""eight, of
all animals within 2 g~c<....'1l y.'€ ight cla.sses. S~i!l1..bol code: open circles =
0-2g; open squares = 2-4g • .'-olia. circles -- 4-6g; triangles = 6-8g.
I
I
50
I25
MEAN
%
CHANGE
-251I
- 50J
MONTHS
27
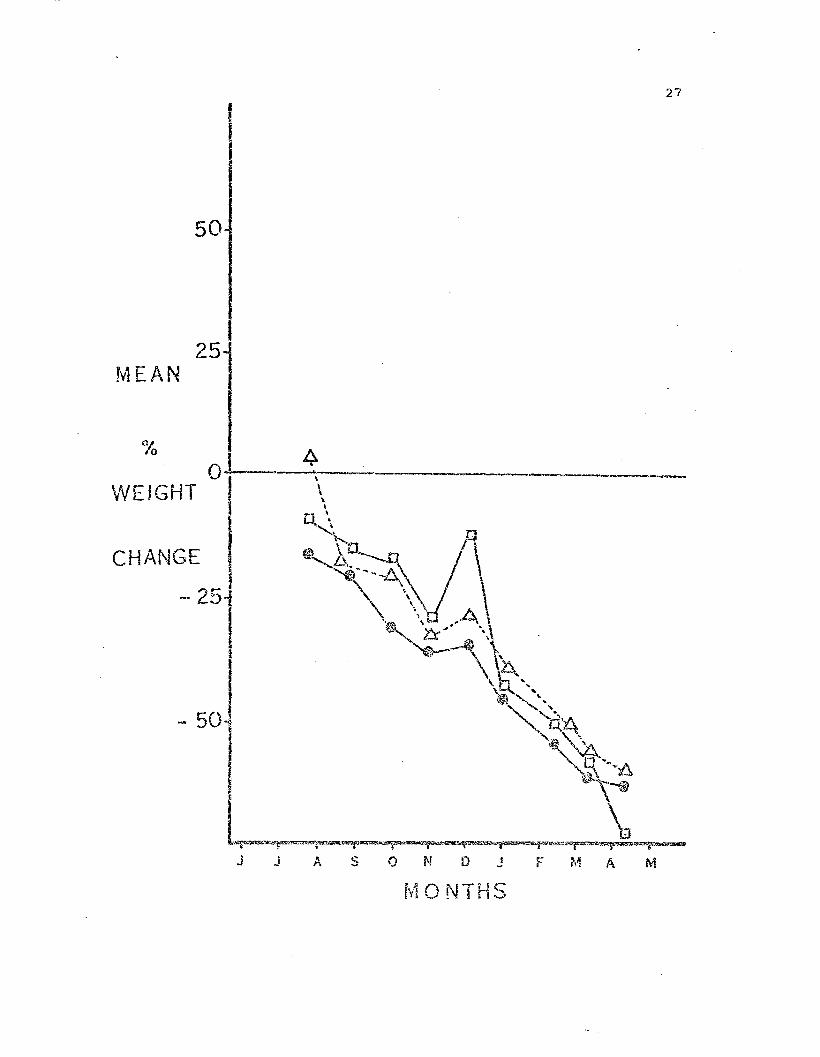
Fig. 4. Weight change in Leptasteri~ fed on an i!!termediate diet of
the barnacle, Balam.l~ g~andula. Each syzr.bol represents t..he mean per
cent change in weight, based on the starting weight, of all animals
28
within 2 gram weight classes. S:::"mbols are the same as in Fig. 3./
29
t::O....J ,t
MEAN
%
°1vVt.IGHT
iCHANGE
- 25
(j..,,,•••.•·•,,
••.,.•
'..I- 50i
IL-~-~__
1 J AS 0 N D J F M AM
MONTHS
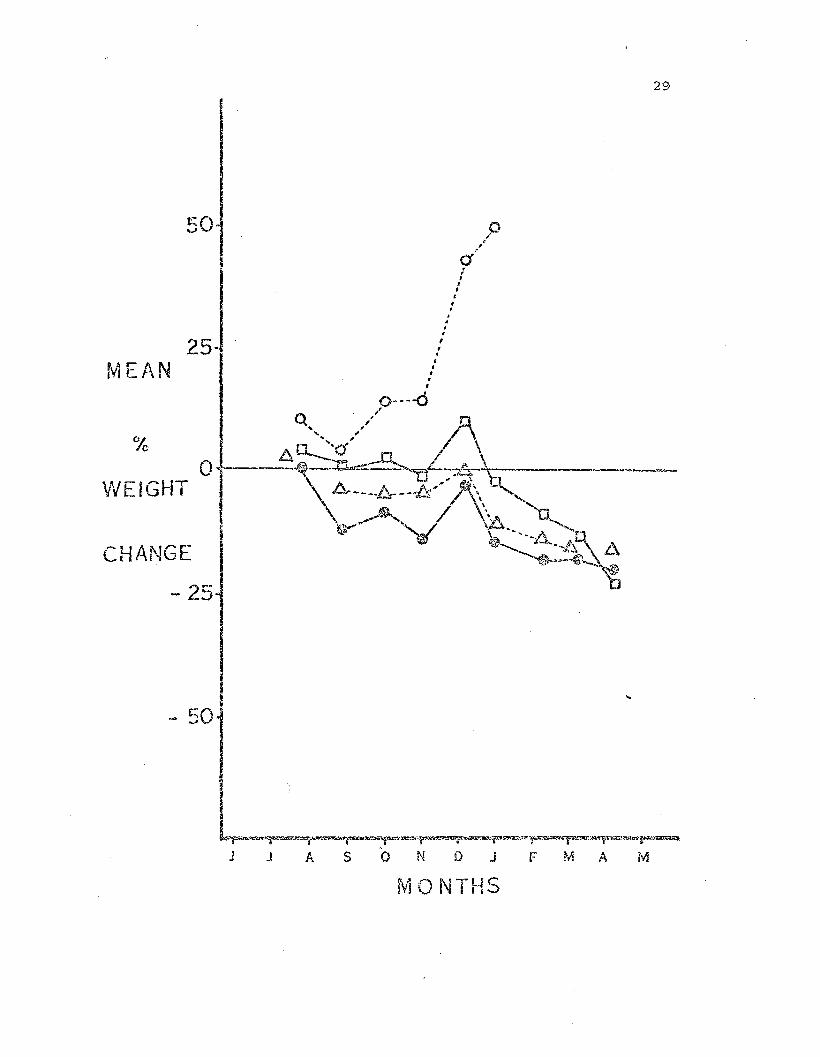
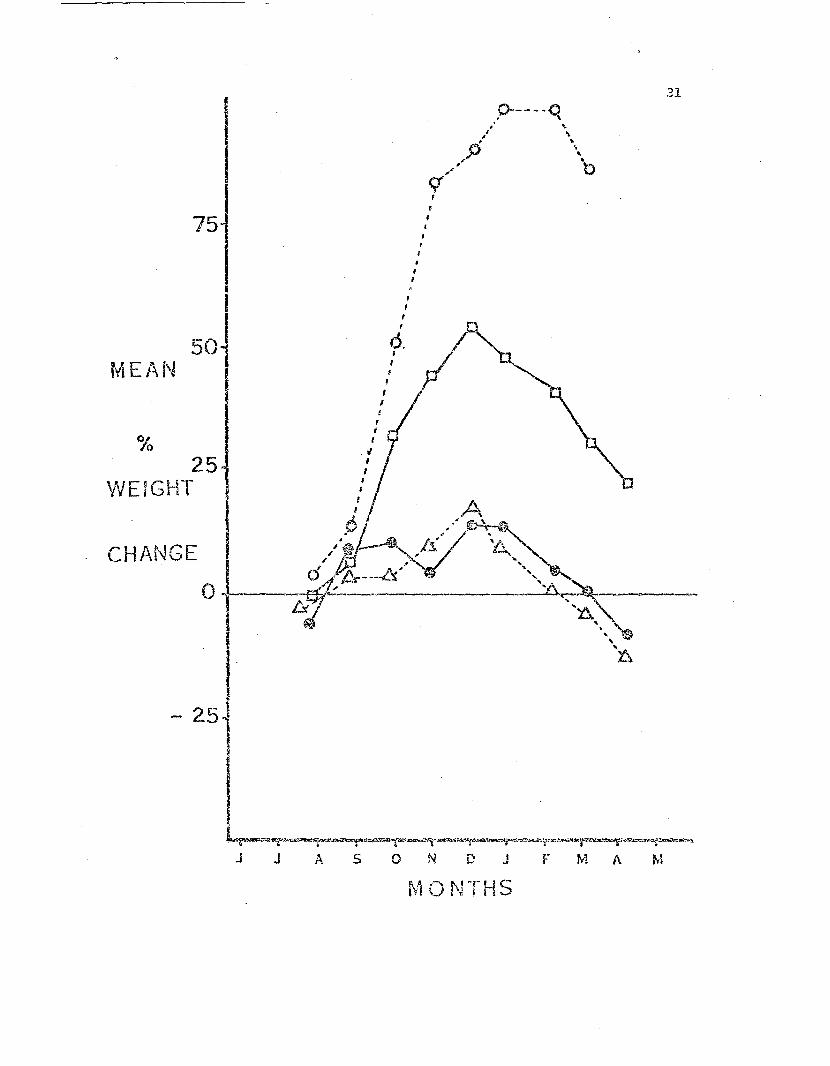
Fig. 5. 'Vieight change in LeptCl.:.§'ter~~ fed on a maximum diet of the
barnacle, Balanus glaI'..:2:u1a.. Each symbol represents the mean per cent:
change in ~Jeight, based en starting to/eight, of all anima.ls 'irlib"lin 2
30
gram. 'iv-eight classes. Syrnbols are the same as in Fig. 3.
0-----0. \
31
"I,.~p
'1/,
6,I
I,I,,
I
,,,,
I
50
%
MEl~N
25"VEIGHT
~'"'-~~~""""'''''·'''''''''f-:'·''·l'''''_~-·''''''r'''''·''''·""""':'·'''''''""f;-<="''''''''''l;"""",,,,''''''''J J A SON C' J F M A M
f\10 NTHS
each"
32
The 0,-2 9 weight class is missing from the starved rl~gil1le as all
these small stars were cannibalized early in the experiment.
In all the growth curves an obvious increas(~ in weight occurred be-
tween N~)vc:;:nber and DeceIflber • Ynis corresponds to the periud of maximum
gonad and storage orga...'1. increa.se in size in preparation for the winter
brooding. This increase was followed by loss of wei~1t by all weight
classes regardless of food availability. The animals in all three
regimes stopped feeding through Janua~7 and February and fed only
sporadically through March.
This is the same feeding pattern obserO'.1ed in t.'1e field, and this
does suggest some type of endogenous annual feeding cycle independent of
light and l'i"ater temperature. HOvieve:c, the sea water used in t.he experi-
ment '/la", obtained from wit.lJ.in. the Coos Bay estu.ary and became more
dilute ",ith increased winter runoff (H2."s. Jean Hanna, OIHB); t:.i1erefore
t.l-}e decrease in feeding activity could ha.ve been ~n. artifact. of the
reduced salinity. 'i'he expf~riment was tenninated in mid-April t and the
animals 'tlere returned to Cap7.! Aragc.
The sto2:l.J::<.fed sea s·cars (Fig. 3) lost weight on a relatively uniform
basis. The sIT;allest sea stars ',v2re least: ctble to \vithstand starvati.on
and became ;veak and then began too lose arms. They TtTere cannibalized
from t..'1e beginning by the larger sea stars. The most dramatic weight
loss was ~e~p in a s~ar that went from 12.4 g to 3.5 g in 10 months.
This ar;.imal rem?linecl in (Jood moxphol:lgical condition but shrc.nk from
61 mm total aiar~etc.r t.o 38.5 mm.
All weight cla.ssc3 in "the maximum feeding regune (Fig. 5) gained
33
weight initially. After' t..h.e peak in December all began to lose weight
and the two largest w?ight classes went belo\v their original \qeight.
The 0-2g weight class showed the greatest~ percer.b~.ge in.-::rease a,'1d the
2-4g weight class showed subs-::'c>...nti al gain in weight.
The sea stars in the intermed.i..ate feeding regime maintained approxi
mately their ini·tial weight until t.he DeceJIl.ber Feak. After this all hut
b~e smallest weight class declined in weight. The 0--2g weight class did
not follcw this pattern but gained weight rapidly f a..'1d instead of
declining after December, cor:tinued off t..'1.e scale t:o 147% in Hareh,
1972.
T:'1.6 pattern of weight chan,:!e demonstrated by the stars in the
intermedia·te feeding regirr.2 is i:.nouyllt.. to typify what occurs in ·the
field. An adult female feeds dtrring the swmr£r and fall al1dobtains
enough energy to matQre her developing eggs fu~d store reserves to main-
tain her ~~rough the 8 week brooding period. During the winter and
early spring the sea stars do not feed and there is c corresponding loss
in weight. After brooding season b~e stars replenish their reserve
storage and any gro;....·th that occur,;; probably d()8S so In the ~arly 5U.U1.mer
before onset of reproduction.
The data also indica·c.e that the smaller sea stars possess the
greatest pet.ential for increase in size and thE~ least ability to wi til.-
stand starvation. 'lnis species on ·the ;,Thole did not demonstrate the
ability to wit~stand long term starvation as has been ShOyffi for Pisaster
(Feder, 1970) and Astr?pecten }:..:t-xe9ula:ds_ {Christensen, 1970). 'i'he in-
crea.se in size (147%) shown by the 0-2gweight. class ;es overshadm"ed
34
by ·tile gro\~h of seven small ~isas~~ which were grown concurrently
under identical conditions. These sea stars showed an average weight
ga.in of 205% in the same time period.
T"he growth of LeJ2!:asterias is probably relatively lliJ.iform in· the
first (Fig. 2) and perhaps the second year in the three populaticDs ob
served. After this time the growth potential of the maturing
Leptast~ria~ is differentially realized depending upon local conditions.
This will be demonstrated below- and in the later chapter on reproduc
tive biology when the size of brooding Leptas~eri~ females is compared.
Maintenance Factor
An arbitrary index of mo:rphological condition, called the mainten-
ance factor, was applied to all sea stars observed in the field from
June 1971 to August 1972. The percen"!:age of all adult: and juvenile sea
stars observed in each of the three categor.ies is given in Table 1.
'J.'he morphological condition of the -rJl.ree popu.lations cor.relates
well ~.vit.h L'Le degree of wave eX'~osure each experiences. The Middle Cove
population, which is mos-t exposed, and had Ul.e 9reatast percent.:=>.ge of
d~~ag8Q individuals, both adults and juveniles. The Sunset Day pop~la-
tion, -,.,;hicn is least exposed, had the lowest per.centage, '11'Q t:'e South
Cove l?opulation was interrnadiate. In all tl1ree populations the
juven.i::J.es bad a higher percentage of injl'.x·l.=d a..."'l.imals t.han the adults i
althougn this disc.l·",pancy becalna lower in the less exposed populations.
These data suggest -that the smaller (younger) SC3 star~" arc mo't"c
Sllscept.i.ble to i.1'~)rpl101og-ical. daHl.age from 'i,'la7e action especially in more
35
'l'l\BLE 1. The percentage of all adult. and juvenile sea starsobs.enred from June 1971 to .fl.ugust 1972 tvhich occurred ineach of three morphological categories.
'========= --
Popul.ation
l>1iddle Co-ve
Normal__--=~~"1o::..:.1?hologiea 1 Ca tegC?..:.ry,",,-__
Regenerating Ir,complete
AdultsJuven:tles
South Cove
Adul·tsJu-veniles
Sunset Bay
AdultsJuveniles
5844
6255
7472
1533
1325
614
2723
2520
2014
eXpCf;ec. areas. Anot.lter possible inft-?rence is that, ,vhereas the
morphological i::ldex data reflect damage from physical environmental
factors they prohably also give a relative index of mortality caused by
these factors.
By collecting morphological data over a year's period it Nas hoped
i-:hat an annual cjcle of winter morphological damclqe and subsequent. re-
generation could ::,e demonstrated. However, ,,,,hen the data are piot·ted
over time {Figs. 6 & 7), no such pattern can be seen. ~fllat is apparent
is -the van;ing degree of morphological da~age that can be inflicted
daring individual ~linters. 'rhe 1971 win-::cr sto:cms c2.used congide:cabJ.y
less cJ.a.mage than did those of 1972. Alt.>.'1.ongh fewer censuses "ve.re taken.
and smaller numbers of sea 'stars observed in 1972 ,th.e data show a
consistent trend "o":hich is probably genuine.
36
Percentages of all adult Leptasterias observed in the three
study populations which were placed in the three morphological
ca.tegories. Symbol code: closed circles = normal sea sta.rs, squares =
~ea stars with rege~erating arms; t.ria."lgles - sea stars with incomplet.e
arms.
£0 ....~ .•.
lJli"
60
~.. _~...... r·······/'"f) : :
"'$...;' • ~"3 €f.. . .
'!fI"
!;).
37SUNS·ET BAY
~........... @ .••.•. eli•.. "$ .
40
20
SOUTH COVE
%
OF
.~
...~ ~.
" ...... t::J.
.. !'O ••'" .' '~"
.'(;:/ •••.~.. :i.t.. '. "'~'"'$ ....
··c.l d ..
MIDDLE COVE
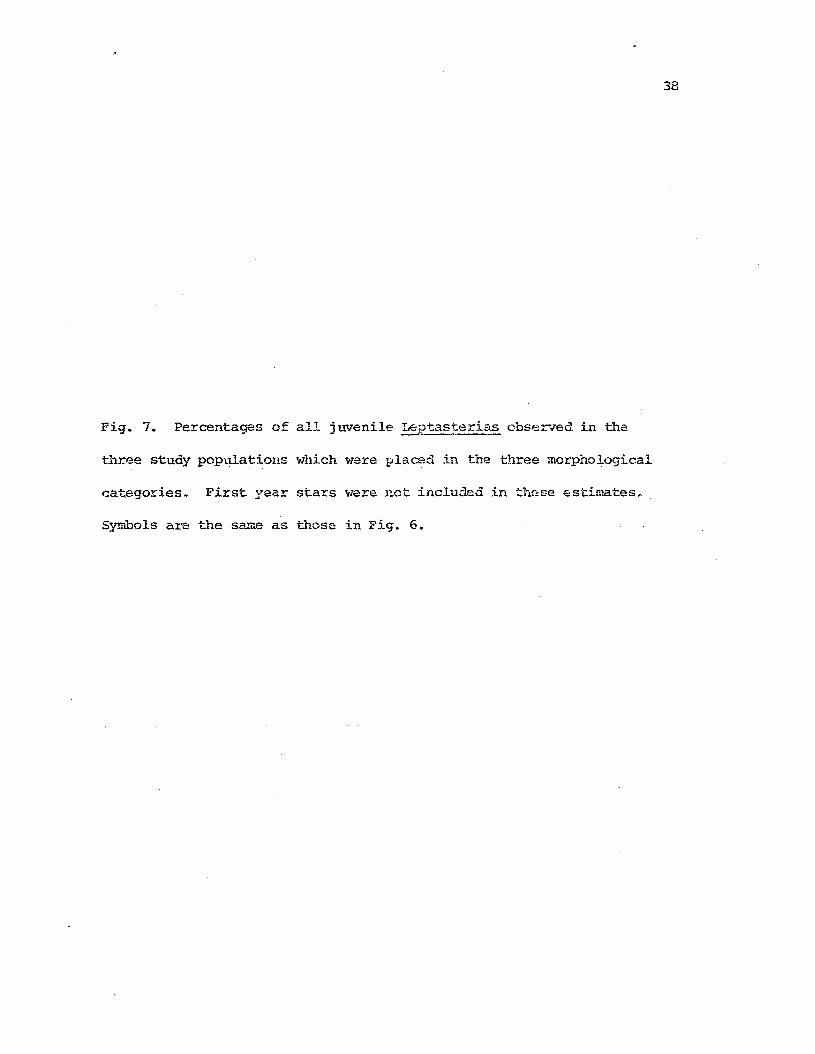
Fig. 7. Percentages of all juvenile ~tasterias observed III tha
b;'ree study populations which ",ere. placed in the three morphological
~ategories. First year stars were net included in these estimates.
S:r-mOols are the same as those in Fig. 6.
38
60
.,.~ .•• /fi) •••• f},•.fP...... ~.... te:.....~"'••••• Jl1i:•••,""'... ~"'.~ w . ..... .
"'\llll'"
......~lJi1 "
39SUNS~T 8AY
0" ......19......
..'
40 .e.., .. " ... ' .. ..'$1i
-- ~------.A A.
. /-~//'----'-"""""~I'"A~ A-_A / ~ ..:;,,'\,_._A "'./'~
A----~./ A.A'" _, ~,,>, . '" ~
~~-A_K ~~~!lJ\.,~~~, .F'l""""""'~-~"'F"""''''''~-'''1''''''''',·''f''.,........',···..=,,-....-....ldU.-
1. SOUTH COVE
&0
j ...~O' '.
Of ll'J".'.~
TO TA. L ~ r~. _.// .•.•••••••• ../" '~J!'.2()~' ~ _A~'~_.J{ ',,>./~---.'r "'ri~"". i -~ <"' ... i.; --~ ....--u.V/ 'A,--- - '-', __ - .. --
l'! ,.~-
I "! f) r./ E CO"':&"1 uv... 'i '-:t
80.,
fvl0N THS
40
Short te~n variation in the percentages of sea stars in the three
categories were often more extreme than seasonal variation. The reason
for t..'1.is became apparent irlhen individual censuses ....'ere made at discrete
tidal levels. Sea stars in the high intertidal zone ~ere in muc'1.
better morphological condition Lhan those in the Imler intertidal zone.
Therefore the intertidal area searched during a given census influenced
the calculated maintenance factor index, and the area searched was
ultimately influenced by the level of the 10\11 tide on the day of the
census.
1.'he main·t.enal1.ce factor values obserYea for I.eptasterias ",ere
probably indices of the frequency of autotomy. I.eptaste:da~".vill
readily drop a, arm when aggrav3.ted or trapped (pers. cbs.) and several
0Lher stars are reported to autotomize (Swan, 1966). As was point2d out
by Ricketts et al. (1968) "autotomy is of qreat survival value to ani
mals that may be imprisoned by loose rocks overturned by vlave action."
'ihe sug9csted influence of the physical envirop.ment on Lept::s.!~~ria~_
as observed in the maint:en2;.'1c~ values does no-t :cule out influence by
biotic factors. The pattern of increased morphological damage in the
lO'rie:!: int.:.ertidal zone cculd be the result of predation by an cillir'lal
which is ~l::"imarily subt.idal l:'~ dist::::ibub.on. 'i'his possibilii:y v1ill be
c,:.,nsidered be1m..)" \lhel1 Le.!2.~as·teries' mOi.:'-cal:Lty is reviewed.
In t.."le Cepe Aragc--S·'.lnset Bay areas inoJestigated the horizor.tal
disw:-ihu1.:ion of .!:'epta.sy~rias was confined primarily to the mixed cobble
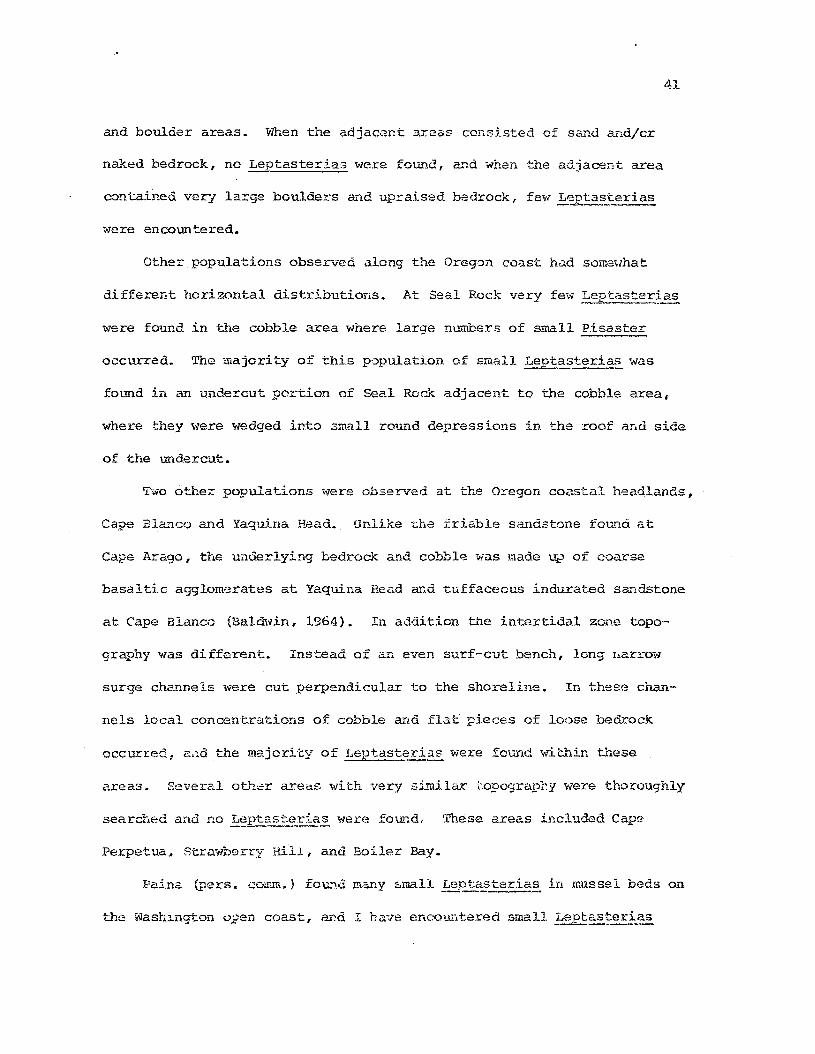
41
fu~d boulder areas. Wnen the adjacent areas consisted of sand and/or
naked bedrock, no Leptasterias were found, and when -the adjacent area
contained verJ large boulders and upraised bedrock, few L~pta~teria~
were encountered.
Other populations observed along the Oregon coast had someHhat
different horizontal distribut.ions. At Seal Rock very fe\" Leptasterias
were found in the cobble area where large nLU~ers of small Pisaster
occurred. The majori·ty of this population of small Lef'·tasteri~was
fot~~d in an undercut portion of Seal Rock adjacent to the cobble area,
where they were wedged into zmall round depressions in the roof aud side
of the undercut.
~~O other populations were obserJed at the Oregon coastal headlands,
Cape Bla."1.cO and Yaqllina Head. Unlike "(.:he friable sandstone found i3.t
Cape Arago, the underlying bedroc~ and cobble was made up of coarse
basalti.c agglomerates at Yaq1..lina Head and tuffaceous indurated sandstone
at Cape Blanco (Baldwin, 1964). In addition ti~e intertidal zone topo-
graphy was different. Inst:ead of an even surf-cu.t bench, long narrmoT
surge channels ,vere cut perpendicular to the shoreline. In these chan-
nels local concentrations of Gobble and flat pieces of loose bedrock
occurred, 2.'1d the majori·ty of Leptasterias ",ere fQi.:md within these
areas. Several ob~er ared~ with very similar topography were thoroughly
searched and no L(~ptast:~...;"S~~ ,..,en~ found, '!'hese a.reas included Cape·
Perpetua~ Strawberry Hill, and Boiler Bay.
Pain2. (pers. COifJIl.) fou-"1d ffi:illy small Le.ptaE~e:;-ia~ in mussel beds on
the ~"1ashington 0l..)en coast, fu:d .I hcl'.!e enCQuntered small Lept~teri~
bensath th8 mussels in f).1ici.dle Cove. These sea st.ars wen~ 20-30 lTIli! in
42
dia-net_er f and their sexual matnri ty was not dete:cmined. The mussel beds
could possibly serve as nursery areas in the lower intertidal zone. The
stars ",ould be protected from desiccation and most predators \~·o111d still
have prey available to them. These stars \'lere n~t; studied further be-
cause to do so would require destruction of the mussel bed.
Chia (1966a) and Menge (l970) reported the vertical distribution
for Leptasterias in the San Juan Islands. They found t.'1at Lept(i:.>t~ria~
o.::::curred from a height of t2m to the lowes-t intertidal zone, and moved
into the lower intert.lda]_ zone during -the \-linter m·.:m-ths to form mating
ag-gregations. I.JIauzey {l966 ) reported a similar dowmvard movement in
winter for Pisaster.
On the open coast k'eder (1970) x:-eported tha-t Pisaster did not
demons1:rate such a winter migration: and I hav? o~")s(;rved none for
Leptas-ter~~ in the areas studied. 'l'he sea stars remained at approxi'-
mately U1e same inter~idal levels year round but did becon~ more
aggregated durir.g the winter. ~Jwever, this was ~robably a passive re-
suIt of the winter storm conditions rather than an actual mating
aggregation as pr\)posed by Chia. (1966a).
As ;,vas mentioned above, expo51.u:e to ,,"lave action is thought to be
th3 chief cause of morphological damage 3..."1d mortali ty ~ During the
winter the sea stars r,love a'-1iay from the smaller.' cobbles ar"d under larger
boulders and into crevices to escape from storms'- These movements may
have a vertical cQnlponent, but tLE'; overall resultant movement is
lateral. Hoving do;';n in the in-tertidal ~"1Ould only expos9 the stars to
more violent wave conditions.
43
Because the larger bould~rs are li~uted
in number a large aggregation of sea stars, both mature and immatur,=,
will acclli~ulate beneath these boulders and remain there -through the
winter.
This clumping behavior is enCO'-lntered throughout the year, not just
in winter. In the calmer S1JIl1lner arld fall months Le...Etas.tei.·ia~ ac-tively
forage m;er -the cobbles and boulders during high tides, but. return to
L~e undersurface of rocks during low tide exposure. Because this
species is very susceptible to desir::cation (!'1enge, 1970) it seeks out
shaded areas that will remain moist. Such areas are limited in the
intertidal zone I a'1.d the density data obtainec during the summe_l:" months
(Table 2), indicate a clumped distrib'.1tion ::or all three study popula-
. . 0 t: 2t~ons at the .~m (0.7 by O.7m) quadrat level.
The short -tenn investigation of Lep-tas1;,.;:!:..ia~ moV"sment in the inter-
tidal indicated this species ventures only short distances while
.c: •J.oraglng. A s~~ple of 100 ~ep~asteria~were dyed red and released along
a band of cobb:l.es and boulders 2m wide a.nd 20m long in the middle
SOUL~ Cove intertidal zone. In a car~ful search of the s~ne area one
mont:h later 19 dyed ani.r.lals wei:e found within or -..tery close to t".e
rearked barld of release I and r.o dyed ani.mals ,\;ere found in the adjoining
areas. These reGaptun:.d sea scars appeared in gaed Gondi-tion and
several were actively feeding when found. During -the next 4 months dyed
individuals were enCOl.l:."ltered in haplEzard fee:ii.r..g (.bservat:io~s cmd had
moved only a fe"l-i meters from the ori'jinal release area.
It is pos,5ible tltaot -the dyed sea stars may have moved great
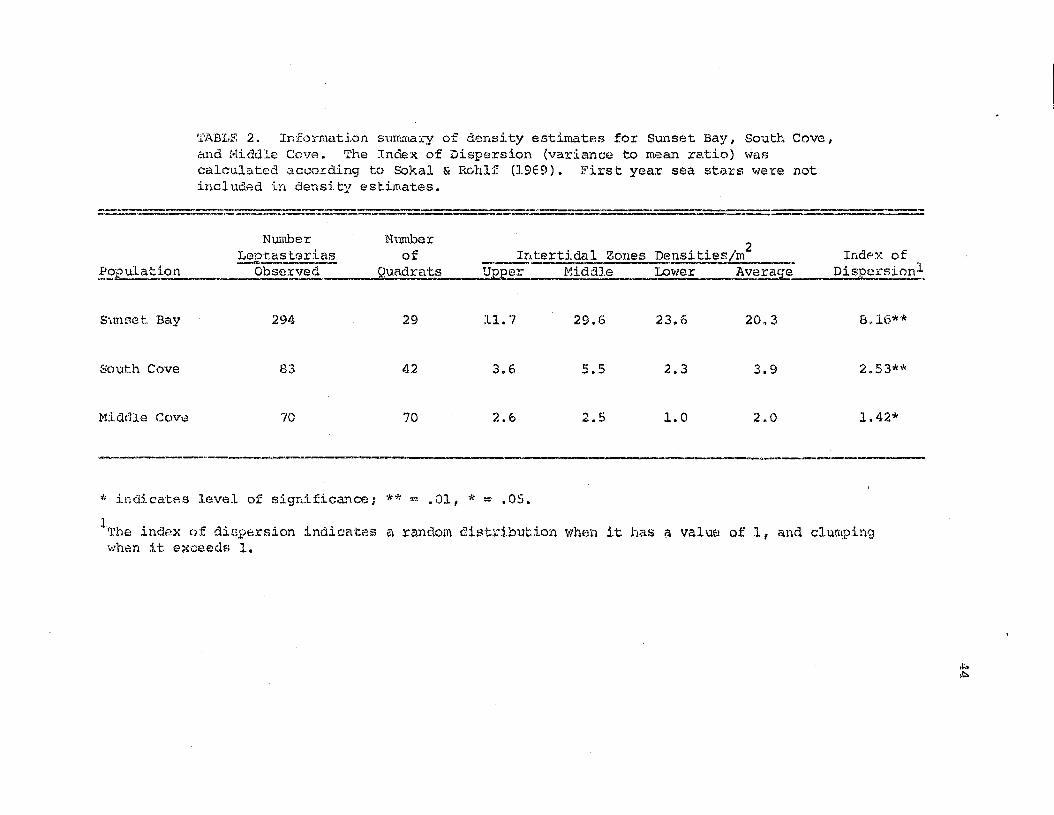
'l'ABI.F. 2. Info:cmab.(Jn summary of density estimates for Sunset Bay, South Cove,clnd !·Iiddle Cove. The Index of Dispersion (variance t.O m,~an re.tio) wascalculated ~ccor.ding to Sakal & Rohlf (19E9). Firs't year sea stars were notincluded in density est.imates.
Number!-~p.t,as!:.:.~
~pulat~__. 0.J?..~t'Ved
Numberof Int:ertidal Zones Densities/m
2Indpx of
QURd:(at~?__JlEper Micldle _ Lower - _!fxerag-e" Dis1?e;rsion.1.
S',,mset Bay
South Cove
Middle Cove
294
83
70
29
42
70
11. 7
3.6
2.6
29.6
5.5
2.5
23.6
2.3
1.0
20.3
3.9
2.0
8.16**
2.53**
1.42*
....... -----" __ __ p _ __ __ • I _a_'" _
'* indicat?s level of s:i.gnifica."'\ce; ** ""' .01, * = .05.
lThe index of diGpe;rsion indicates a random distribution \VhE-m it has a value of 1, and clumpingwhen it. exceedf; 1.
.l:.>,J;l.
45
distanc'3s J.a.terally ,.,ith int-.he r.r:arked ar.ea.. or that they moved avmy aIld
returned to it. The small nmnbe!: of sea stars recapt1..:xed may indicate
that the majority of dyed sea stars died or emigrated from the area
entirely instead of being well concealed witi~in it. This experiment
should have been n~peated a·t several tidal areas and follm'lcd more
closely, but ~~e time was not available.
However after observing Leptasterias in these thre.:: areas for 2~
years 1 their d:i.stribtItion became quite predictable 1 to the degree that
individual sea stars were recognized and repeatedly u)und at the same
location. It is possible t.hat ~::.:etast~rias moves only short dista.'lces
in ~~e intertidal zone and that wave action and desiccation by exposure
to air are t.."-le chief physical factors influencing these movements and
Ute subsequent intertidal distribution of Leptasterias_ "lhich TtTill be
considered next.
In the Cape Arago-Sunset Bay area Leptaste~ias oC~Jrred from a
height. of +2. Sm dOl,oTn to t.lle lo'tlest intertidal. When the st:btidal below
the three study areas \'las searched no ~eptaste"rias we:ce found at soue"!
Cove or Middle Cove. At these t,-:o a'("eas the surf bench graduJ\lly
sloped into c. series of sandstone reefs cove.red t.;ith short dense alga.c.
The suhtidal area was very steep at Sunset Bay dJ::opping off rapidly to
6-81"Q at the edge of the in·te:ctidal. Several Lept.i.lsterias were (?n-
countered alon-} this drop off, but they 'f,ere. in very 1m.... density com-
~~L~d ·to the intertidal zone directly above.
A summary of i.::h.e intertidal zone densit.y e.3timates made in t:te
SU!lh"llers of 1970 at. Hiddle emre I and 1971 at South Cove and Sunset Bay,
is iacluo.ed in Table 2 0
46
In the SOL:D\ and !o1iddle Cove study populations
the lowest d8nsity of Leptasterias cccurred in the lower intertidal
zone. In Sunset Bay and SOu.t_h Cove the rnaximlliu density occurred in the
mid intertidal zone, and at Middle Cove the npper an.a. mid intertidal
zones had approximately equal densities of Le2!~steri~.
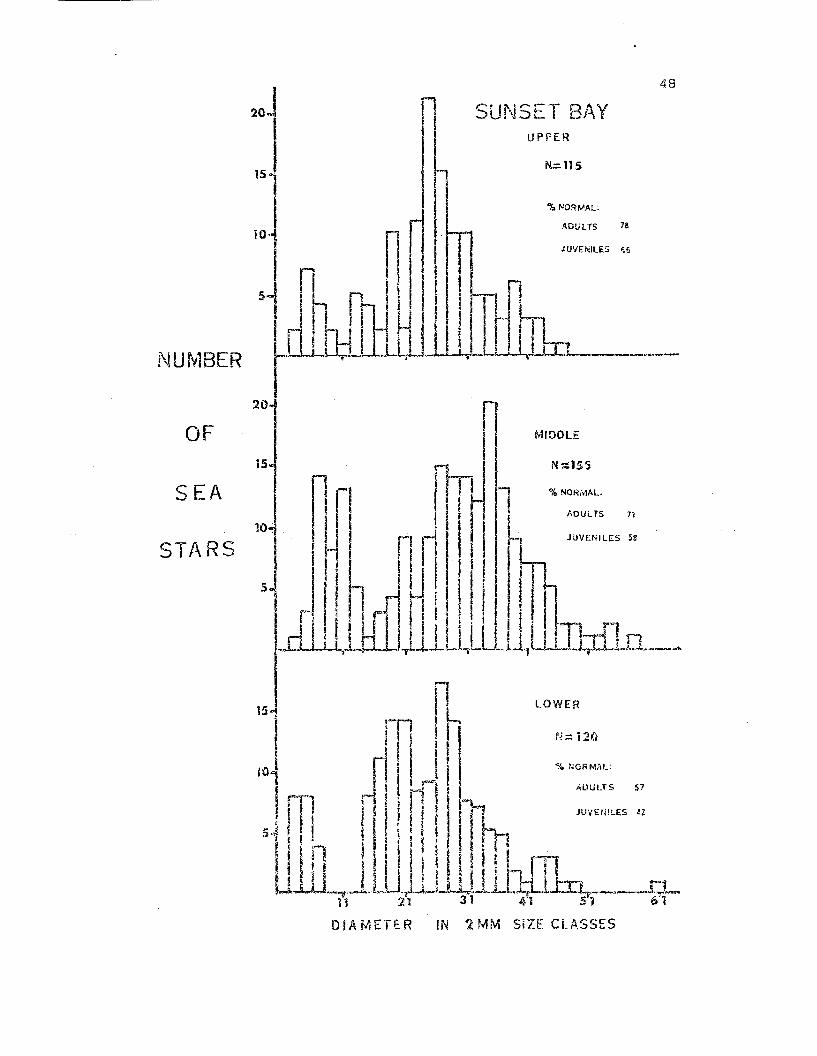
The pattern cf distribution of the Sl.mSE,C Bay population is clearly
seen in the results of three intertid~l smnples taken on 9 and 10
February 1972 (Fig. 8). The mid intert:idal zone had the highest density
(Table 2), the largest animals and greater numbers of small, first year
stars. The upper aIld lowex' intertidal zone F,epta~terias had approxi
mately the same size distribution t but '.vere very different in maintenance
factor and densi ty • The percentage of morphologically undamaged an imals
i.ncreased with height in the intertidal 7..cme.
The pattern of morphological damage was also demonstrated in two
samples taken at Middle Cove on 23 .August 1972 (F.'ig. 9). The sea stars
from the Iovler intert;idal zone had encountered substantially greater
morphological da.'T.age (31% Normal cf. to 7096 fol.- upper intertic11.1
Lep::-asterias) • ,!se12·cas·terias from the upper intertidal zone were' also
Larger tlwn those from tho Iovler i.n:tertidal ~one.
No cleur patterr. of morphological damage was observed at South
Cove. In gsneral ·the animals in the Im17er mid-intertidal zone and those
on the sot:.the::n boundary of the stud".;" area suffered gr:eat.est morphologio
cal damage. Similarly these areas cOLtained fewest yeung Leptasterias.
I ti1ink this peculiar distrihu·tion is ca.used. by the orientation of '::he
South Cove intertidal zone, located en tr.e west side of the cove (Fig. l)~
47
Fig. 8. Size frequency histograms giving the results of t..hree inter·
tidal zone samples conducted at Sunset Bay on 9 end 10 February 1972.
Sea stars are grouped in 2mm size classes; i.e. size class 11 includes
animals 11 and 12mm in total diameter. 'l'he percentages of adults and
juveniles in the normal morphologicaL category are indicated.
r SUNSET BAYUPPER
48
JUVENILES 56
NUMBER
10 ADULTS 78
srLn~l, ~t I ; I I I '
20
OF
SEA
STARS
i5
MIDDLE
N=:155
% NORMAL
AOUL T5 71
OIAl'IlETER IN 2MM SiZE CLASSES
Fig. 9. Size frequen~J histograms giving the results of two inter
tidal zone sa..'1lples conduc·ted at Middle Cove on 23 August 1972. Sea
.stars are grouped in 2 :rom size classes as in Fig. 8~ The percentages
of sea stars in the zlormal morphological category are indicat.9do
49
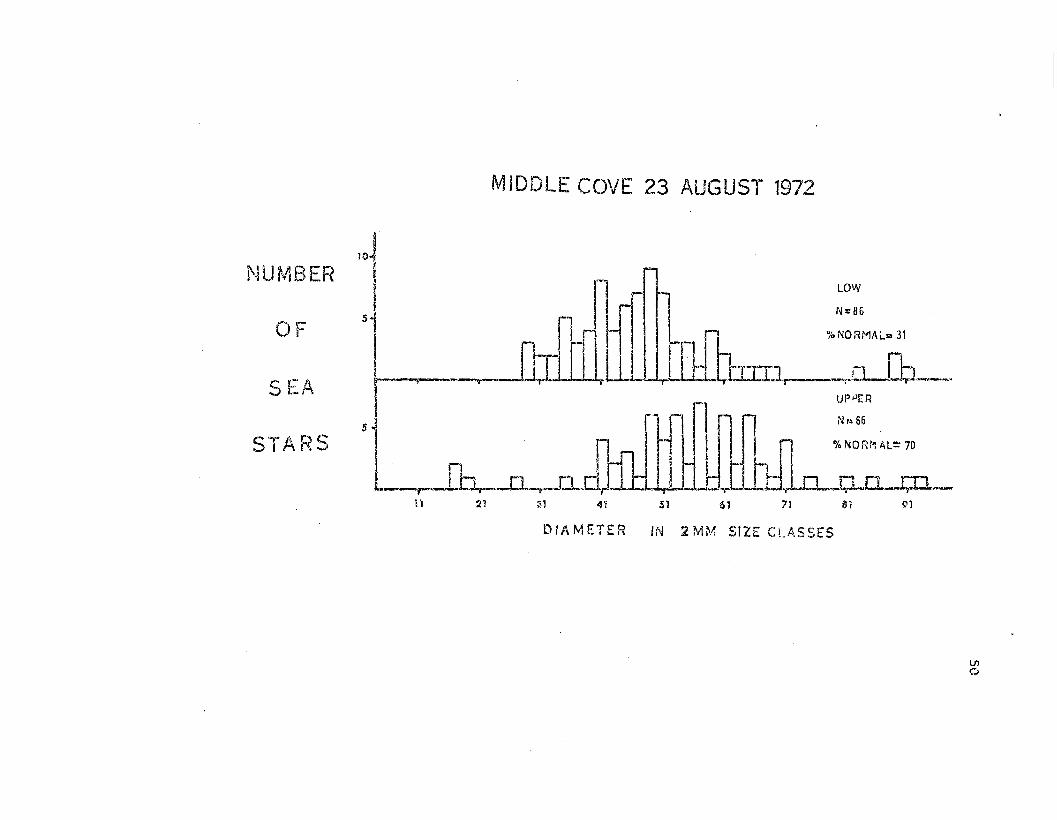
MIDDLE COVE 23 AUGUST 1972
~1ill
'roNORMAi..= 31
71615141<'1;:n11
LOW
N=86
I J ' I
~ '-, -~LllLLLil:iJhmr----R-Cb-I
'l_ ..~~
OF
S ¥-A" r~
S.. ·..,. An. t:::i. r\....J
NUMBER
DIAMETER IN 2MM SIZE CLASSES
U1o
51
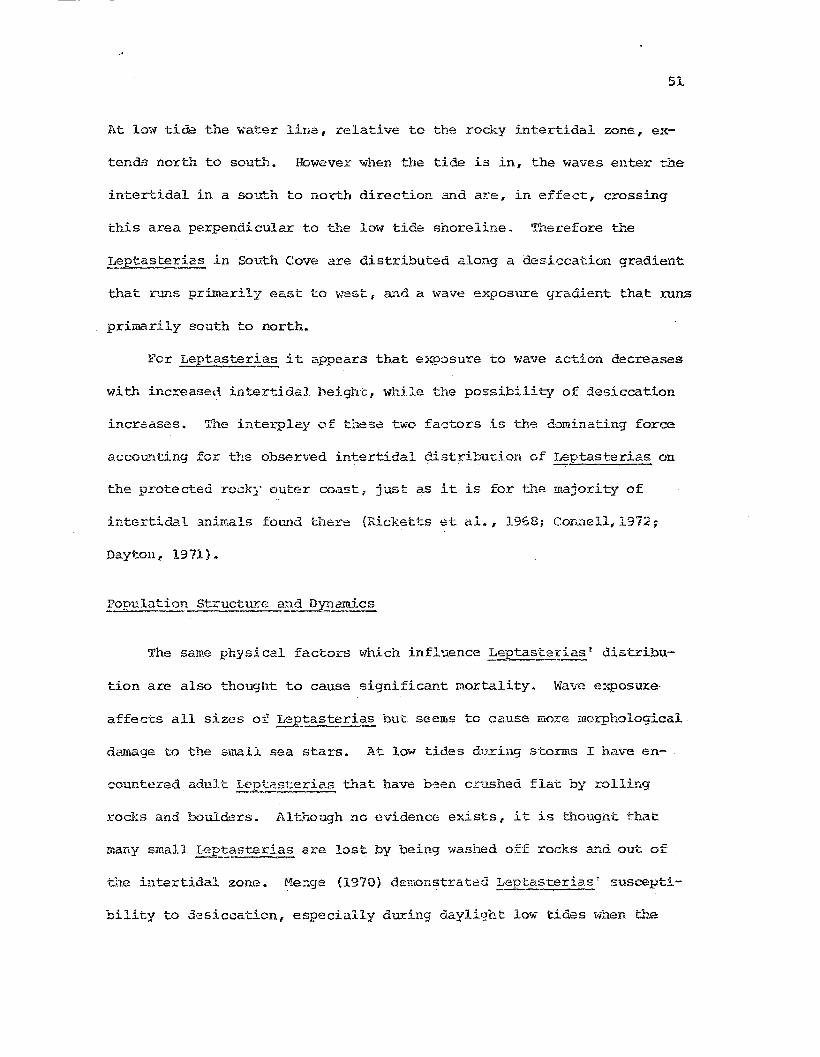
At 1m. tide the water line, relative to the rocky intertidal zone, ex-
tends north to south. Hm·.ever when the tide is in, the waves enter the
intertidal in a sO'l..."th to north direction and are, in effect, crossing
this area perpendicular to the low tide shoreline. Therefore the
Leptasteria~ in SOuth Cove are distributed along a desiccation gradiel1.t
that runs primarily east -to ,,;est. ~'1d a ",'ave exposure gradient that :LUns
primarily south to north.
Fer Leptasteria~it appears that eb~QSUre to wave action decreases
with increased intertidal heigh'c, whi.le the possibility of desiccation
increases. The interplay of these two factors is the dominating force
accounting for t.1:.e observ-ed intertidal distribUi:ion of Leptasteria~ on
the protected rocky outer coast, just as it is for the majority of
intertidal animals found there (Ricket1:s et al., 1968; Connell, 1972,
DaytOll, 1971).
populati0!1 Stz-ucture and Dynai1d.c:E.
The same physical factors which influence Leptasterias' dis·tribu
tion are also thought to cause significant mortality A Wave e::::posuxe
affeGts all sizes of Le.p.tasteric:.~but seen,s to cause more morphologica~
damage to the small sea stars. At. 10100/' tides d1.."'.ring storms I ha,,-e en.-
countered adult L02~a~Ee~~ that ha~e b~en crushed flat by rolling
rocks and boulders. .i\1t1:lough no evidence exists r it is thought that.
many small LeI:-:..l;,~sterias are lost by being washed off z-ocks and out: of
tile intertidal zone. Menge (1970) de~onstrated ~eptasterias' suscepti
bility to desiccation, especially during daylight low tides when t~~
52
wind is blowing and the sun is shiny. He fo~~d that tolerfulce to
desic.::a:tiun increased with size, .:ind desiccation prcbably is the cause
of mortal:,ty of many of !:he fj_rst year stars, especially those released
in ~e upper inte~tidal zcne.
The obst:rved 1m·lEX limit of Leptasterias' vertical distribution is
the lower intertidal zone. In "this zone the young sea. sti'trsare least
abundant and those sea stars that do OCCiJr here suffer the greatest
morphological aa.-nage. The influent::e of physical envirop.ment on these
obserY"a"tions has been discussed; hOi/lever; they are t..'1.ought to be in-
fluenced by a biological component as wel1.
During this study no COIlk'1l0n intertidal predators on Leptasteria~
w~re found ~~d none have been observ9d in the field by other investiga-
tors (Menge, 1970; Chia, 1964). I,eptaste~ias remains have not been_..-.t=--- _
identified in 1::.l1.e stomach contents of any of the C::>ln.'11on intertidal fish
investigated {Johnson, 1968, 1970}. Predation by crabs and birds may
occur. A gull was observed attacking an Evasterias t.roschelli and an-
ot~er was seen txying to swallow a ~isa~~ (P. Rudy, pers. conun.).
Ho,~'sver J..:::Ft~.£:~erias_ remains l.mderneath the rocks during low tide and
would not b8 readily ~cceBsible to bird predation. No intertldal crabs
VIera observed feeding on l.:-ept.~§.~Jj...§-~arid none of w~1ich I am aware are
repo=ted to do so (Hiatt, 1948; Knudsen/ 1960).
Connell (1972) felt t.."J.at the re'.1son intertidal species live in a
physiologica.llyless cOrlrgenlal .cr2'gion at high levels is that they are
forced to do so by interactions with competitors and natural enemies.·
That is, lowe:c vertical liTI'.its are due primarily to biological causes.
53
Birkela~d (1971) f~lli,d Leptasterj~ at 36-40m depths on Cobb Seamount
270 Idles offshore of Washington. He felt this inaicated the
I.eE!_~2teri~were not restrJ..cted to the in·textidal ZGne by t.he demands
.of their owu physiology ~illd were probably prevented from exploiting the
n$arshore subtidal h~Jitats by predators, competitors, or other anim6ls.
Chia.· (1964) observed Lf'J?ta.~!~eri.~being fed upon by Solaster sp.
Henge (1970) ubser"ed 2~.last.:e~ da:-lS.2.J.:li and Dermasterias imbricata feeding
on Leptaste:d<:~ in thE: field. All of these asteroids have a pre-
doruna,tly subtidal dis·~~ib~tion (Mauzey ct al., 1958) and are potential
predators and/o:r cor.-'Fs-::'it.crs "lith :!:.,er:-taster:'::-:.s. In the Cc.pe i'l.rago-
Sunse,t Bay suhtidal I have obs?xved alJ. usteroids except
CrOS5as!:.~ a'1d their preser.;cE:: m<.l.Y play an important role in maintaining
..Leptasteri.3.S' vertical lower limi t. Other priwarily stilitidal predators
such as cr~)s or fish could also be partially responsible for
~:~..ptasterias I reduced S\lCceSS in the lower intertidal zone.
Dynamics
The three study- pcpul&tions varied in density (Table 2) and in size
structure (Fig. 10). An attempt was made to monitor population dynami.cs
by ccmducting seasonal mea.surement of ..;ei.ght frequency distribution.
£~wever these proved unsatisfactory as no clear pattern of population
dy!1cillt1.r.:s such <:'.2 :Cccruitment or qrm\rth ;..a5 readily observable (Appendix
1) • T~12 va.c!.ael 1i ty encOlilltered is probably due t.o several causes in-
cl::ding the in·i:ectidal ai"ea searched, ~'1.e ~"ave condit.ions on the day
54
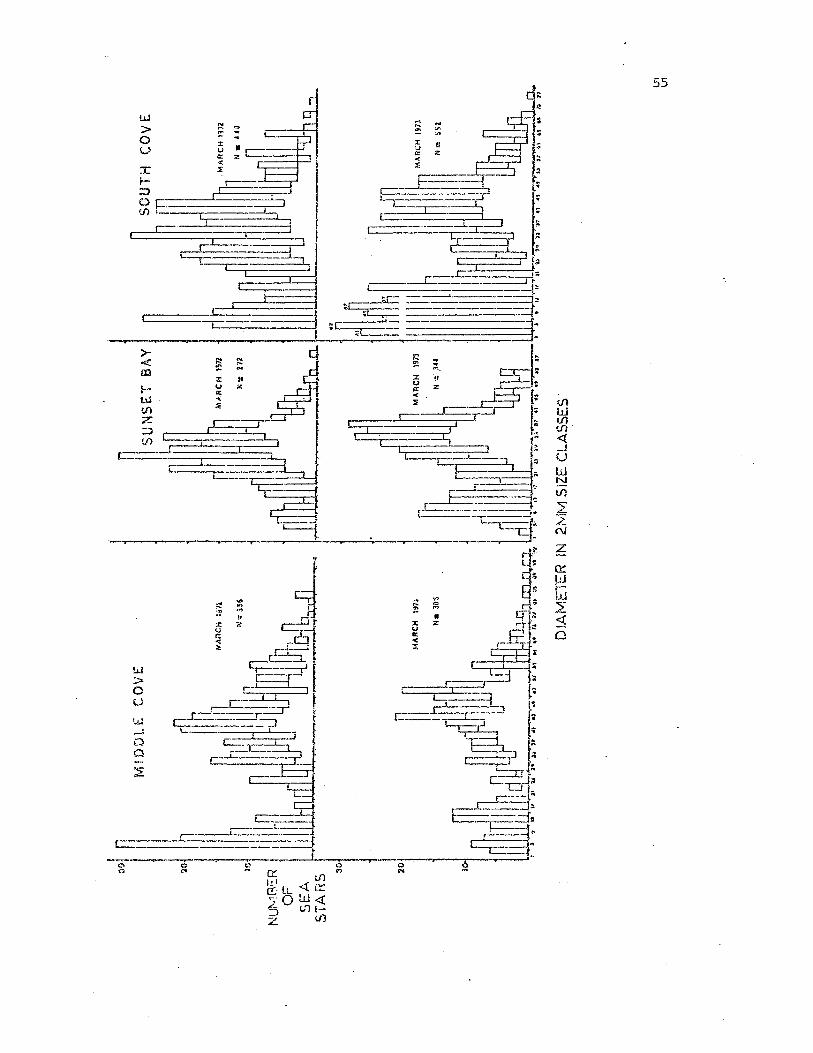
Fig. 10. Size frequen~J' histogrmas showing the comparative population
structure of t.~e three study populations taken in Narch 1972 and 1973.
Brooding .females encountered during this p0riod are represented in the
clear unlin~d portion of the histogram.
::c!'=>~E----
c:::
> ....,,--......,.---~ ---r-"-
~ ~
:c..
u1<
c:...::0
W....J
c= -.r:----e:--L:'L--------- ._----~
-o._-~- -----;'7 ---0-'-""""--
e- *-~
55
56
before tl1e obse~!ationf time of year, and variation in sampling behavior
according to ~tleather conditions. ~-rnat. is appa.rent from these v-.·eight
distT..ibut5..ons is t:ha.t :)OpuJ dtion strncture remained relatively stable
and that the size of tho. sea st..:\rs va!:,ied inversely \<lit..ll den?ity.
Mortality c.nd re(;ruitment ~\;",re est.imated by combining a variety of
data taJ':en fo:(' tll~ t.li.ree pop1.....1a·tions over the 3 years of the study. Be
cause of time limitations all th8se data were not ta~en during the same
year.
From data that will be more thoroughly presented below in the
chapter on reproductive biology r information on sex ratio, mean size of
reproductive anirnals, and fe:nale reproduci:ive eff.ort and brooding
success was obtained. T:'1e data on growL\;. of the first year stars (Fig.
2) and on density (Table 2) presented earlier in this chapter, were also
used. 'fhese da·ta were combined v/ith infcrma.tion derived from a compre-·
hensive series of size frequency distributions taken in t..1Le field from
January tJ:lrouqh April J 972 and more gE::neralized estima"tes of size fre
quency made from Hay to Df;ce"P.1ber 1971. From this combination of data I
celieve a relai:ively accurat.e explanation of popuJ.at:ions dynamics can.
In t....'1e process of deriving tids explanation several assumptions
were made. The first is that fem31e Leptc>__sterias become sexually mat.ure
in their third year. Chia (1968a) has shown that e~e d8velopment of 3n
oocyte from an oogcmil.::m t~ a ripe uvum r.eqaires "about 2 years and that
the g;mads do no·t become fu!:c·tional until late in the first year. It
~tla.8 assUl.lled therefore that. females found. brooding represem:ed aniraals
that \,>7ere i.n at least their t..hir-:1 year.
57
Secondly, it was assumed that
reprooucti·~ effol~ was similar for a given size of female from a giv~~
population over thE: period of this study. E",,oidence su-pportingthis
assumptior: and a third that males a.nd females a.re approximately the
same size will be presented in a later chapter.
The final assumption is that the adult population siz.e structure
fu'1d density remained stable oyer the time of the investigat':'on. This
ca.""l be seen by comparing size frequency distribt:rtions made in r'~arch 1972
and 1973 (Fig. 10). 'luis month is mid\,1ay in the brooding season and ·the
sizes of t.he bl":ooding females are indicated. Both the adult size fre-
quency and the dist.rihution of brooding females 2~re very similar for all
L~ree populations. lN11.en tr•.:; brooding fe:nales observed during the 1971,
1972 and 1973 broodi~g seasonS are compared (Pig. 11) for all three
populations their similar.ity is again apparent. Also seen i.n thi'3
figure is that t~e Sunset Bay females become r€productively mature at
smaller si.zes than do the ot..;'er two populations.
Forea!:med '\'lith ·the k,10\vledge of the size reac.;hed by first year
stars (Fig, 2) and tha·t the size of reprodi.1ct.:~..ve females represer.ted at
least the thir:':: ~"E.2::r cIa.;;;:::; '1<' •:..- .111· 10), ~.e siz8 fxequency data for
incJ..yj.du.:.il censuses, takei.l from January ·thrOlJ.gll ApJ:J.l 1972, ,,:ere plotted
on pr".)f.)ability paper.. From these, z.ge-"si:,,;e cldsses ;'\"(,::I:'e distinguished
USJ,ng the methor'...s ::>f H3:::":(iing (1949) and Cassie (1954). BEcause of their
small size 1.:11e fi.?:st yea~c class waS probably underest.irnated a.nn the
rates (Fed~r, 1970; Ebert, 1968). However the second :{ear class vias
58
Fig. 11. Weight frequency histograms of brooding females from the
three study populations for the 1971, 1972, a~d 1973 brooding seasons.
C,''''-,o..=C. stars are grouped in 19 weight classes; "0" weight class includes
all females weighing up to .99g, "I" = l-L99g, etc.
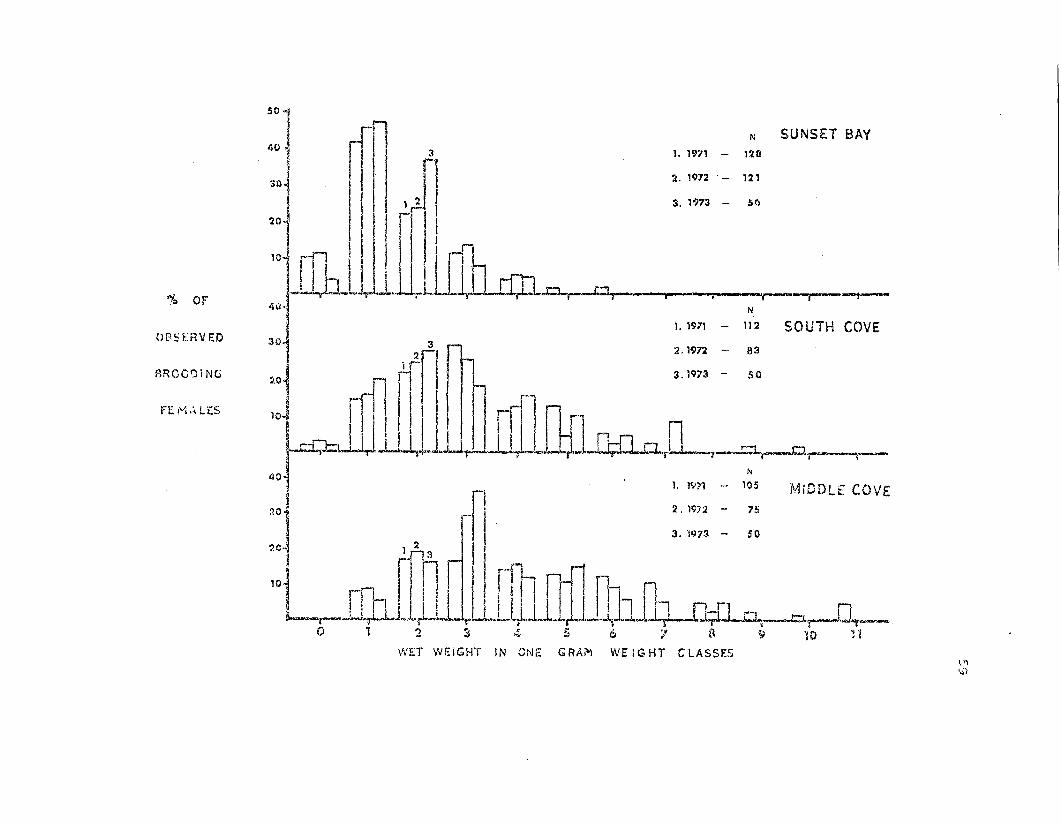
SUNSET BAYN
N
1. 1971 - 128
4\)-
5°1 rn40 'j ! I 3
I I rI 2. 1972 . - 121
30"1 I I 1 2 I 3. 1'973 - Sf.}, II r
2°1 II I
~IIO~ rn !! . rrl
I 1_ II i ! I' ,-t..l.tJ..w,-W.. ~llilU.-cLn.o r---O.r-- . i -,.. -,..--....,..••-__._'Va OF
MiDDLf. COVE75
1. 1971 - 112 SOUTH COVE
2. 197:2 -
3. '1973 - 50
30-
50~ rrfi ~ r . :.::: ~ ::1·1 ~fi III jl Dlml '1 n~t~JJilll.L. II~~_~
40 i 1. 1971 - 105
'°1 rr2C~. ln' , III I n I .'1...
10 r I ! l. ! r1, -n I illi f! h, i j I , I'I !n fill '1 J _ ~L.-.r--J-u~...-,Ll~~ rLLU.LJ_J...J-JJ_~l J t •• 0:;Il0.--~~o 1 2 ~ 4 5 \') "I a y 10 n
Fl: M i~ lES
OBSERVE/.)
I3RCCl)iNG
\\'ET -""EIGHT IN ONE GRAM WEIGHT CLASSES'..."I~)
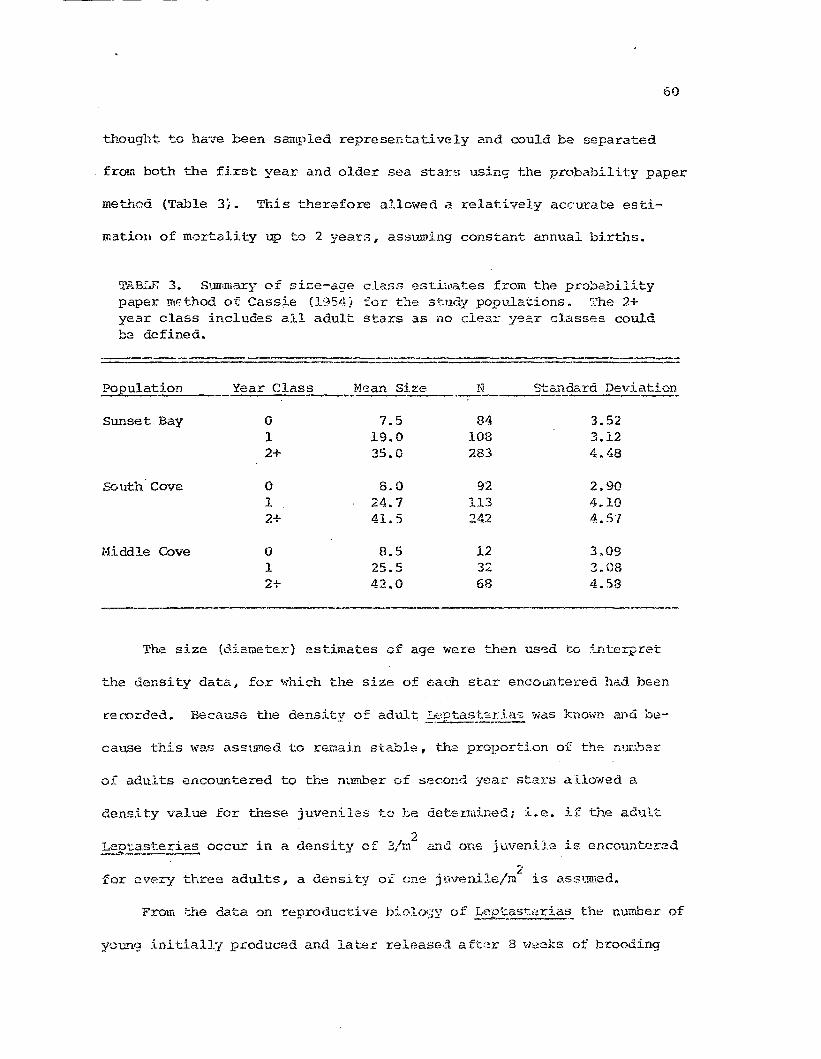
60
thought to ha7e been san~led representatively and could be separated
from both the firs"t yea.r and older sea stars using the probability pa.per
meth0d (Table 3). This therefore allowed a. relatively accurate esti-
mation of m':Jrtc:li ty up to 2 year;:;, assu..'1ling constant annual births.
TAB::,? 3. SU!"(JIli?XY of size-a.ge class estblates from the pro~ability
paper: ITll'thod of Cassie (l95t~) for t~1e study popula1:.ions. The 2+year class includes all adult stars as no c1ea.:::..- ye2.r clisl.sses couldbG defined.
Year Class Mean Size N Stanaard Deviation
0 7.5 84 3.521 19.0 108 3.122+ 35.0 283 4.48
0 8.0 92 2.901 24.7 113 4.102+ 41.5 242 4.57
a 8.5 12 3.091 25.5 32 3.082+ 42.0 68 4.58
----_.__.
South" Cove
POJ2ulation
Sunset Bay
Hiddle Cove
-~----------
The size (dia~etsr) estimates of age were then used to interpret
the density data, for Trj'hich the size of each star enCOt1J."1ter:ed had bE:en
recorded. Because the density o:!: adult ~~ftas!~s::ia";; "Nas known and be-
cause this \~as clSS1IDled to r·~nai.n stable. the prOI?Ortion of the nur..l'J3:r
of adults encountered to the mllnber of second year:: starB ai.1mved a.
dens:L-ty value for these juv~nil(~s to be detsrlid.ned; i .. e. if the ac1l1.lt
~~d one juvenile is enColli~ter2d
for every three adults, a density of cne juvenile/mL
is ass~w~d.
yOU1'1g ini,tially produced and later released. af·t;~r 8 Ttleeks of brooding
61
'/Ias estimated hy Il!ultiplying U1.e average female size encountered in each
population by t..'l.e average nurr.ber of eggs produced per gram and the
average number of metamorphosed stars per gram in the brood pouch just
before release. LeptasteEi~ is know~ to occur in a sex r~tio of 1:1,
and all adult females produce broods. Therefore half D1e adults en
cOlJr.tered in t.he density estimates ,lere assumed to be pQt:m~ially
brooding females. !'1nltiplying the number of eggs produced per fer,1ale by
~e density of females giv~ a value of the number of eggs produced per
square meter, a~d a similar calculation will give the nt~ber of young
released per square meter. These values can then be compared to t.he
densi ty estimates for second year juveniles and estimates of morta1:i.:ty
obtained (Table 4).
Mortality encountereddlrring brooding in 1971 ranged from 19~37% of
the eggs produced. Of the young stars released at the end of brooding
less than one--half of one per cent surv.ived until they were 2 years old r
regardless of eie study ~rea in which they occtrrred. Scanty data
available fro~ ~4iddle Cove from fall 1970 iJ.'"'ldicates ·that 99.1% of the
young stars did not s14rvive the stmun-sr of 1970 and of those: remaining
33% survived G~rough the second year.
Oi.ing to the nature of tllese data, the resulting estimates are to
SG~e degree suspect. Reproduction in 1970 could have been ve~{ low,
alt-llOugh sub3ti'~ntial numbers of broodi:c.g females \vere found in ['larch
1970 at l-iiddle Cove. The hi.gh mortality' could be the result of an
unduly severe ,..inter in 1971-1972 as was r(';~flect.E;d in the maintenance
factor data {?ig~. S & 7). ~)wsv~r ~y estimates of second year
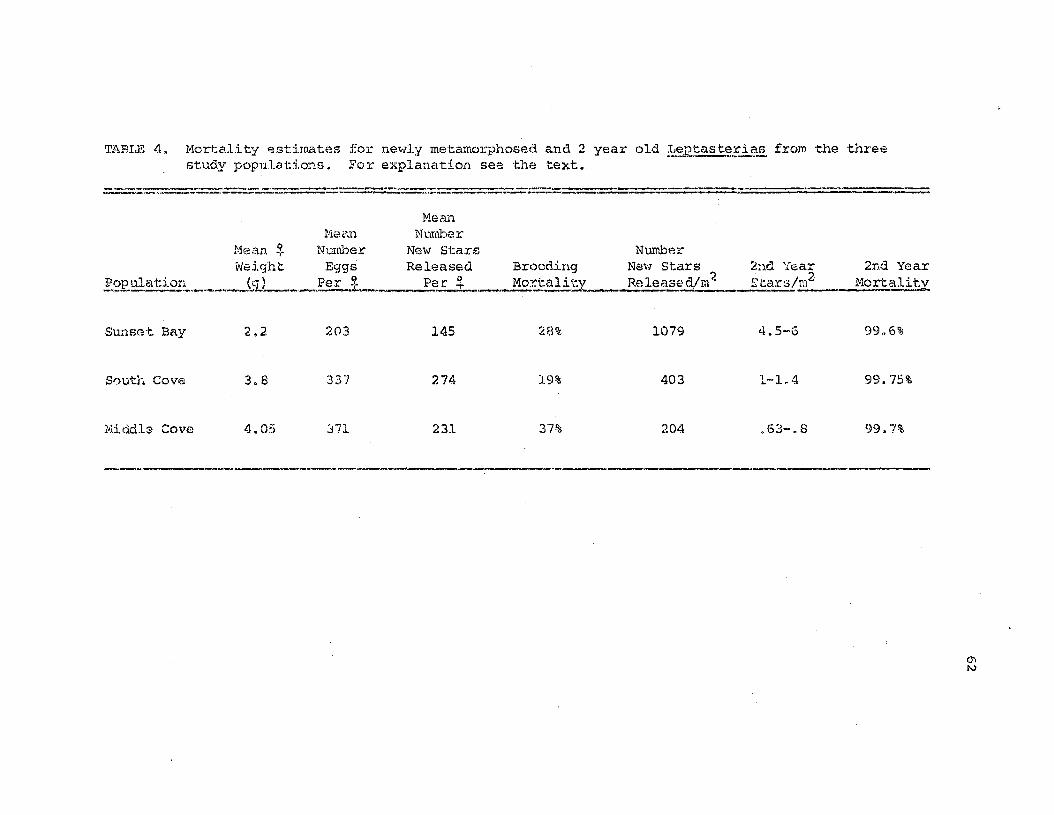
TABLE 4. Ho.rtali ty estimat:es for newly metamoJ::phosed and 2 year old !:'.~J?~~!i,?~ from the threest.udy popll1ai.:io:1s. For explanation see t.hete~t.
----------_........_-_.- -- , - -------------_........"..-.._--_.._---- _ ..... ... -_..
2;ld Year 2nd YearC'1''''-;:s/m2 Nortalitv_ ._.:::.L
NumberNe~1 StarsReleased/m't. _- -_.. ----_._-_..
MeanMeN, Nunilier
Ne.~'1 ~. Numher New S1:arsWeight Eggs Released Brooding
E.op.ul~or~ ~_.J5LL Per ~ Per. ~ .__~,:!-ali'~__
Stmset Bay 2.2 203 145 28% 1079 4.5-6 99.6%
South. Cove 3.8 337 274 19% 403 1-L4 99.75%
Niddla Cove 4.05 371 231 37% 204 .63-.8 99.7%
------------- "'.'
/J'll'V
63
mortality agxee very well with th0se of Menge (1970), and the same pat-
tern of recrui·tment has been observed for several years. Therefore
these mortality estimates are at least relatively consistent.
For an asteroid species, female Leptasterj3s produce a limited
nuraber of eggs whi.ch e>''Perience relatively high survivorship until re-
lease. The nev" yOU-'1g undergo high fi:r.st yea.r mortality and somewhat
less mortality in "t.heir second year, so that each yeac only a few 2
year olds are recruited into the population and become reproductively
mature. This continuous low level of recruitment a.nd tne consistent
adult. population structure suggest 'chat Leptasi:.~J.as is fairly 10n';1
lived and enjoys a s...mstantially 10"!6:::" mortality than do ·the young
stars.
Discussion_._----~
The results of the growth studLes correspond well with these of
Menge (1970) in the San JU~1 Islands. He est.imate:'3. the young stars
reached a diameter of 10-14mm in the first year and found t::cemendous
growth pote:n:tia.l in Leptast~:das wit:h an unlimited supply of rood. A
major discrepancy in our results is t..'Lesize at sexllC'.l matu:ci ty. l'~enge
(l970) felt that Leptasteria~.became rr:atunO! at from 2 to t.1 years and
fou.''1.d that the majority of Leptasterias \"ieighing les.3 t....a..r... 2g \-Ven:' im--'---.-.-----mature. I estimated that Lept3.starias. b;:,come l"r-at.ure in t..heir third yea.r
but found that the Le~~ster~beco~e sexually mature at much smaller
sizes I especially at Sunset B2.y ('V.lq).
~rhe differences in size of brooding feinal.:!s in t.he three study
64
populations i~ thought to indicate a difference in grmvth rate caused by
local conditions. On ~e other hand, the relatively g~eat.er size
reached by female Leptasteria~both at Cape Arago and in the Sa."1 Juan
Islands could be due to later sexual maturity. HOlrJeyer the former
explanation is considered the most reasonable because of the dcnon
st:~nted variabl~growth:?otc:n::.~al '"ith food and the previom.'1y cited
work on oocyte matt:raticn (Chia , 1~168a:. Therefore it is ·thought that
Leptastexias females becoute mature at the same age (probably in their
third year) regardless of their size, and that growth rate is strongly
influenced by local conditions.
In his recent paper 'on the rocky inter'cidal cOID!l1uni·ty Connell
(1972) discussed the factors influencing vertical distri~ution. ~~
argued that upper limits were most often determined by increased mor
tality from di.:rect effects of extremes ir. the physical environment,
general agreement is found by other. workers (Dayton, 1971, Glynn et al.,
19(4) •
Dayton (1971) considers the majority of repx-oducing pQlJUla'U.ons l.n
the intertidal zone to be most critically influenced by intera(,.--ti.ons
fullong the CC1I,ponent intertidal species, '~,;hereas Connell (l972) thinks
biological interactions become limit.ing only 't7bere physical conditions
are less harsh. Connell (1972) reported that populations exhibit varia-
tion in their age structures with changes in severity of physical
factors. Pc~puiations which experience harsh physical conditions and
t."'1ose '''hieh live in more benign areas but are :subjected to intense pre-
dat.ion on the YO'l.mg are often COID90Si?d of a si:i1g1e dominani: class.
65
These' are ::uade u.p of <inimals:'hat. hCiV'l experie.nced higher SUi:""rivorship
dnrinq a favcrdble year, in 'dhicn phys.:l.cal conditions were mare clement
or predation was reduced. In the i!1teTI'1ediate situation, where con-
o.itions are slig:ltly 15s3 harsh or mcr~ predictable a.nd predators are
absent :claturally, some young may s~rrvive every year a..'1.d produce a
population with a mixed age distribution.
The patterns of size (age) distribution obsenredin my studies of
Leptasted.a~ populations could all be inteXTIlediate cases as defined by
Connell (1972) in which a fe'll young are recruited yearly and adult
mort.ali ty detennines the subsequent mixed age population structure.
However, differential success of year classes Gould also provide a.."1.
explanation for the observed population age structures I vThich may be i::~
fl~: rather than being stationary.
My observations could reflect only a short-term pbenomenon whi~ is
a small part of the population dynamics of this species. I believe t'l6
brooding type of reprodl1cticn does allow a substantial nmnber of young
of the year to enter an area every year, and, although :c:ecrlJ..itment is
low, ne\.. adults en·ter the population consistent.ly on a yearly basis.
Mortali ty is primarily due to physical causes: and in <'Area.S of 1m-; wave
action adult mortality is low. The subsequent limits to inc.lhridnal
growth are biological. In more exposed condit:ions mortali.ty is greater,
but the lower density releases the individtal sta~ to exploit the
avai lable reS01.;.rC0£ mors t.horoughly and thus reach a. la.rger si ze.
FEEDING BIOLOGY
The majority of sea stars are carni \lures that only occasionally act
as .sca-Jengers :Feder & ChristGp..sen, 1966). Some speciss are knowri ~o
exploit particulate food qatheren with the aid of illUCOGS sheets ~~d
fla.yellar current.s, and others are suspect~d of at least supplementing
their diet in this "ray (Andersr:n, 1966). Carey (1972) found changes in
feeding type with increasing depth. The deep-sea asteroids feed on
whatever is available and obtain food fr.:-Jffi the sediments as ,..ell US
prey or animal remains; in the food-rich shall0w watGrs
con·tinent..al she 1 £ the asteroid fauna generally consists of specialized
car;livores.
In t.he typica:. macrophagolls sea star food is digested as it lie3
itlitl".l.n I or e;'1.folded by, t.ne cardiac stomach. The folds of ,:::.r••", stomach
are closely applied to the food, and digestive onz~~es are released only
where there is direct contact betw·aen the stelmach wall and the digest-
ible tissue of the p:cey (Feder & Christensen, 1966}? The dig,?sth,....~
e::nzymes are prodnced only in ·the sac·-l i.k.e glandular pouches of the
pyloric caeca(:: and are canied to the cardiac stomach in. thE: fluid of
t..'1e pex·i'\r:h:caral coelom (Anderson, 1966).
In addition to p.rodudng Ciigestive enzymes the pyloric caecae also
66
67
serve as the chief organs of absorption and storage (Anderson, 1966;
Nimitz, 1971). Nutrients are mobilized and transported to dista~t sites
of utilization at all times, but especially in prepexation for the
breeding season as the gonads are built up at tile expense of the re-
serve ('·f the pyloric caecae. F<:.!rguson (1968) has demonstrated the fluid
of t~e perivisceral coelom as the likely vehicle for nutrient trans-
p0rt, as i1: bathes almost all the t::"ssues except those of the outer
surface • The manner in which epidermal cells of the sea stars receive
nourishment is still not clearly c.etenlined. Some of the available data
indi.ca'ce that as·teroids obtain a significant fraction of nourishment of
at least their superficial cell layers by absorpticr. of such things as
sugars and a~ino acids from extremely dil~~e solutions in the sea
(Ar~derson! 1966; Ferguson, 1963, 1999, and 1970).
F,~(:;ding Studies
The ecologically oriented field and labora~:ory studies of asteroid
feeding were reviewed by Hyman (1955) and more recently by Feder and
C:hristensen (1966). Since this last review a number of studies of
ast:eroid fecding have appeared. l~mong th{~se a:r.:e the studies of coral-
eating asteroid ~~anthaster £1anci illld its effect on th2 coral reef
ca~rr~~ity (Cnesher. 1969; Eranhmu, et al., 1971, Porter, 1972; Goreau
et aL, 1972)! a..."ld the laboratory and field feeding of Pisas~.E.
ochraceus (~f;al.lzey• 1966; Pains I 1966, 1969i Landenberger, 1968; Feder.,
1970) and g. gigant~~ (Rosenthal, 1971, Rosent:ha.l a.."ld Chess, 1972).
Of the recent studies of ast:eroid ;feedin'] seyera1 ex..l-1ibi t an
68
ecologically ~ore sophisticated approach to data interpretation ~Ld
general application to current ecological theory. Christensen (1970)
in his study of the sea star, Astrope.ctep irreg1Jlaris. said "it is ob-
vious that a proper interpretation of data obtained by stomach ~~alysis
cannot be given without a L~orough background knowledge of the biolo~~
of the. sea star as well as the organisms on which it subsists." He
feels that gut contents per se were not a reliable "measure" of the
quantitative composition of prey actually disgested per tiffic unit
(A. M. Christensen, pers. Camr.l.). The study of Mal~eYf Birkeland, and
Daycon (l968)'lrlhich compared laboratory.preference studies with field
obserJations of te:l PuO!et 20U1.d asteroids, revealed that a 'VvTide variety
of prey can occasionally be eaten, the diet m<1Y vary locally I an.d
laboratory preference experiments must be checked with field dai:a to
discover which axe the most important natural prey. They concluded
that, in order to define the diet of any sea star, laboratorJ observa
tions can neither be omitted nor relied upon exclusively, a'1d that many
observations from a number of locations throughout a year are necessary.
Careful studies by Paim~ (1969, 1971) have ShO'Vvil that a single
asb,,:coid preda"torce.n be very significan.t in determiniYlg the corcposi·tion
of a:n intert:idalcommunity • Paine (1969) points Out that cn tl12 Pacific
,"le::t co::.sC Pis~s!;~ ochraceus a...'1d it.s main pr<;)¥ shm'l considerable zoo··
geographic homogeneity (Ricketts et al., 1968) sharactcristic of TS~
e:atl.1....e assembla.ge:- !'-iar1.Y spe.cies tJ."1.a.t chara.ct:erize. the associat_ion.
throughuut its entire rol1ge can be shOwn to be affected ei-r.hF.~r direr..;tly
or. indirectly by P.:Lsaste~c (Fe<J!..:;r t 1970; Pain'? i 19(9).
69
Menge (1970, 1972a & b) has studied such an association between
Pisaster and Leptast~hexactis in the rocky in'tertidal region of the
San Jaan Archipelago. Menge (1970) feels that this a~ea repre3ents a
sube>ptima.l Pisast~ habitat, primarily because of the lOVier abundance of
Pisaster's preferred prey, Myti~~ californianu~. Conversely he thinks
tha.t it is the "best" habitat for Le'2ta:~_t?..ri~~, since this sea star is
abunda!1t in the Archipelago but relatively rar:e on the open coast. In
areas where Lep'cast:~,rias and !'.~~~.stpr GO-·occur gisastE.?E is dominant in
that it somehow inhibits the food gathering of LeEtast.~ias., thereby
hindering gJ::Gwth (Nenge, 19 72b I • Henge (19";;;:b) argues that the
spec~alization permitting coexistence in this case is appa:r.er~t.Ly based
on consUtI1j?tion of different sized pi~ey.
Menge t s work with t.'}v::: ~pt:.asterias""E2:sa3tE;,.~ interaction is more
thorough and the arguments more int~icate than I have presented 2~ove.
Sirr~larly his work with Lept~s'teri~~' feeding is more detailed and
derived than ,.,hat I shall present here. I do not presume to suggest my
study fulfills all th~ obviotillly necessary criteria suggested by
Christensen (1970) and Mauzey et al. 0-968j; 'chis ;.ras not my objf~ctive.
HO'd,,::ver comparisons are possible bet';-leen my data and those of the
st.uCli8S mentioned. I feel they contribute to the mrerall unden, tanding
of the complex aad. variable interactions that. al1o\'l species to exist
over a ranqe of habitats.
Feeding observations ':Ier.~ made for the three main ~eptas~~
70
populations cn an approximately bi-weekly basis for a period of 20
monb."1s. The populations were sampled a~ lower low water fu~d infre-
quently at higher low v;ater on the sa.r:1e day. The sea s·tars generally do
not f~rage when not under water but aye known to continue feeding on
prey captured during the previous nigil tide (Feder, 1970; Menge, 197G).
Each sea star ',vas removed from the s1.lbstrab.1I:l and turned o"~er; if
the cardiac st0mach ,,'as everted the sea star \~a.s coll."1ted <lS feeding.
The prey found within the folds of the everted stOlnach or attached to
the substrate directly beneat:.'1 the sea star ...",as recordad. Each py.ey
species was identified at least to genus fulU, for some species, the size
was also recorded. Each sea star obser,7ed was classified according t.c
size (age) and morphological condition using the categories mentioned
in tL"1e firs:: chapter.
During the SUIilmer of 1972 eac!1 lnain I.ep.tast.erias populat.:ion ~'las
sarrpled during the early morning spring low tides. Approximately 100
observations were made of Leptasterla~ feeding on its primary prey
Sliuilar to ether sea st~rs in
the Fa.-nily Asteridae (Feder & Chris·tensen I 1966) .!:'eJ2tasi;~rias use::.; force
to remove this prey from the substratt.1J!1 t so all the barnacles were
fOi.Jn:l within Lc:pta.ster.ias everted :5toma.chs.--,-----~
The sea sta.r's morphologi-
cal condition and total diame'.:er (2R) in millimeters \-:ere recordad, and
t.~e basa.l 8.iarneter of Gac.h prey barnacle was E1-2aSUrea to the nea~"est:
half mUlimeter.
;r11e barn.acles ~ basal diarne"te::-s 'I";;~re used. to con,,'"ert. t.o cry ~l;ei9'ht
values. using' the regresf.aon aquat~ion calculat.ed by Connell (1970) for
71
B. 5,llandula. ':'he total dry weight of all barnacles encountered in each
feeding observation ,-las calculated for comparison of the tota.l dry
',-;eignt of prey consumed per size class of !,eEtasteria~ in each popula-
tien.
In order to determine the approximate contribution of each prey
species to Leptasterias I total caloric diet i-ienge I s (1970) regressions
of prey size {diameter) on dry weight and the conversion factor cf dry
weight to kilocalories were used.
Estimates of the mean prey size and number were obtained for D~e
main prey species, B. slandula by calculating L~e mean basal diameter
fu,d mean number of barnacles encountered per feeding observation for
encn pOF-lla:t:'on in the 1972 summer feeding study. Of the less fre-
quently eaten prey only half ,,rere mea5urE:d. The average prey size used
to calculate caloric value wa~ based on these measur.en~nts.
'Il"1roughout the study all species of sea stars encou..TJ.tered in the
cobble areas common to I~t,~sterLs,s.were cenf,:used for feeding-. Three
och:r:aceus was abundant. The d~~a obtained for
P. ££chaE~ in the area of spatial overlap wi th ~E..i;:.~'3t,e:r.ia~ wi 11 be
prese:1tedand compared wi,th those of Nenge (1972b).
Result.s
The feeding data are in three p~rts. Th~ fir3t part will compare
annual feeding cycles a.nd prey selection anzong tile thn)e main study
popula'tians r as well as the diet of jmteniles ".lith that of the adults.
72
The second portion will present the results of the s~~er 1972 study L~
which th~ three populations are compared for feeding success as a
function of sea star size. 'fhe final saJ.ection will compare my data
from the open coast with those of Menge (1970, 1972a & h) for
Leptasterias from the San Juan Archipelago.
Annual Feeding Cycl~
The adult feeding observations are summarized in Fig. 12, which
shows the percentage of adults feeding on all prey ovsr the study period.
The graphical representation gives a fairly clear idea of the feeding
pattern of ad.Jlt Leotasterias on the ODen coast.- - - . ~----'- .....
The graph sho:'1s that peak feeding activity occurs d'J..d ..ng the mid·~
SUL1:ile:c and continues unLi..l the onset of ;"linter. Feeding during t...'1e
winter months -is redUced. 11.: does not increase unt.il laba spring and
then gradually increases to pea.~ again in midsummer. 'Illis feeding pat--
teIn i::1 adults complemen-ts the reproductive biology of !:,E_ptasterias
(Chia, 1964), in that the adults store energy :ct::serves in the p:lloric
caecae until midsummer vihen gam8t-ogenesis regins ar-a. the gonads in-
crease in 81.:-:e l..ntil the "iid~1ter reproductive pexiod.
Durinq -::he reproductive period i:he females brood th~ :roung foT. at
least 8 weeks 2nd do not feed. 'line males also become inactiv-e a.nd feed
at a. reduced rate. The graph (Fig. 12) is someir/hat misleaciing in that
the brooding felr.."1.1es are .LnchJded i.n the cc...lculation of the percentagE"' ~
and the actual values for males feeding durin,; ..this period could be as
great_ as twice the valxe given. However, -these values r,-Jculd still f.'5l.1.l
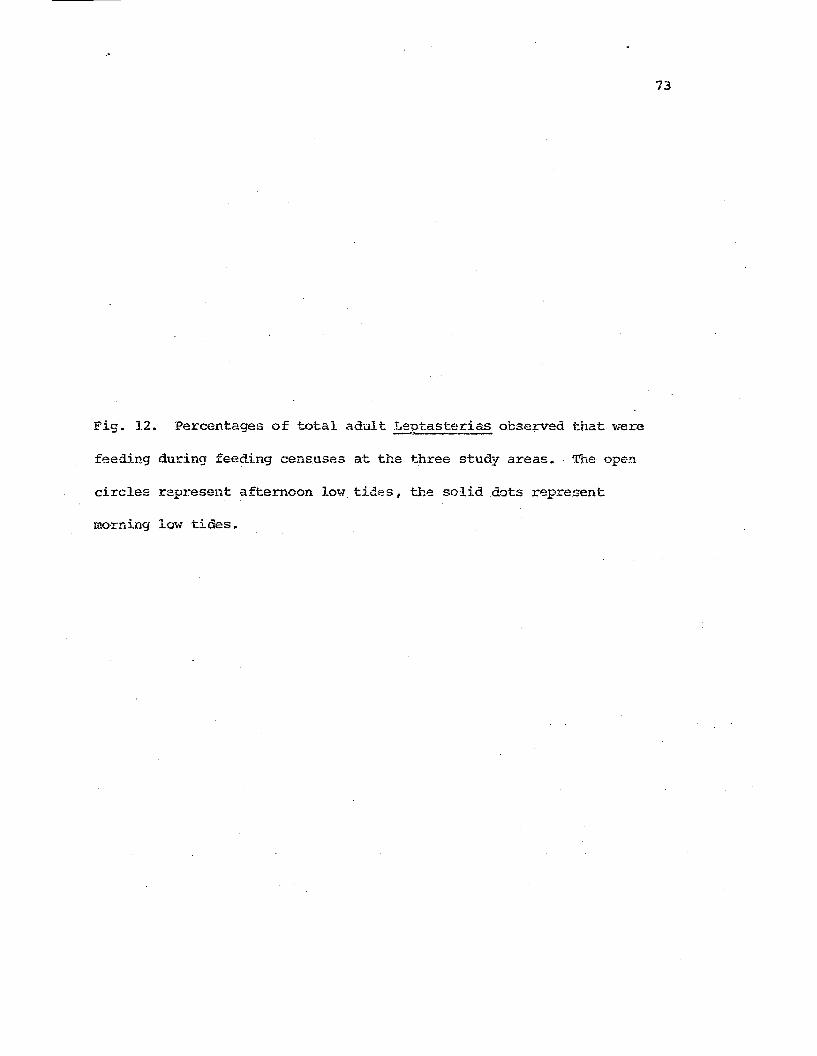
Fig. 12. Percentages of total adult Leptasterias observed that were-= -""" .
73
feeding during feeding censuses a"t the three study areas. The open
circles represent afternoon 10\-l tides, the' solid dots represent
morning low tides.
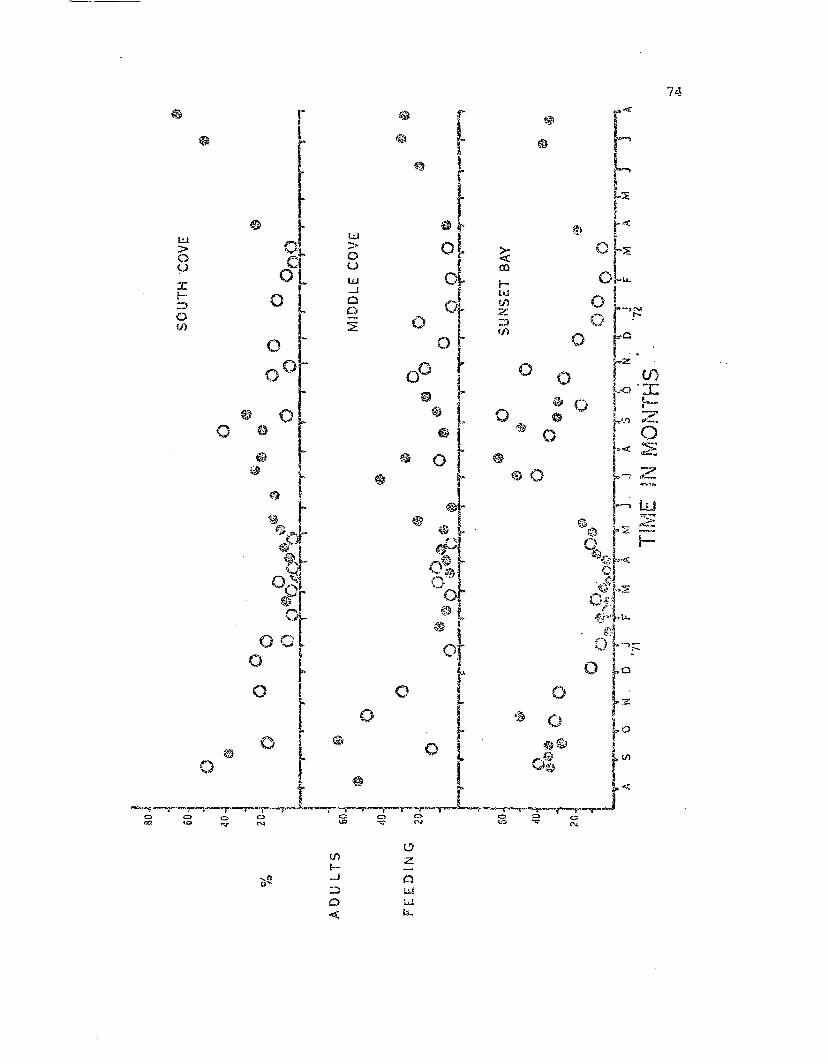
i.:J>ou::r:i--.;::)
o!J)
C>V'I zI-
....<1 _J !.1I).....
:.J 1.1.10 Wq: l:...
74
75
"lell below the maximum feeding rates seen du.ring the summer.
1f1hen the artificially lOirlered win"ter feed:i.ng rate is kept in mind,
c::)mparison of the adul·t feeding pat.-tern (Fig. 12) wi"th tha.t of the
juveniles (Fig. 13) shows that both size (age) classes have a siwilar
ar..nual feeding schedule. The juveniles cO::1tinue to feed throug'h '''inter
at a rate higher than that of adult males, but still belovl t::-:eir peak
feeding, which also occurs in midsummer.
The feeding pattern of the adults and juveniles can be further
cornpared by looking at the diet. Table 5 gives a sun-unary of the rela-
tive numbers of prey species eaten by both adult 2nd juvenile
Leptasterias. In all three populations the adults included a greater
nu..'1'ber of prey species in their diets than did the juveniles. A much
greater percentage of the juveniles rely on the ba:cnacle, na~
glandula, for their prey. For the three populations this percentage
ranged from 84 to 91% of all jm,Tenile sea st:Q.rs observed feeding. 1iJhen
prey selection divCl!Bity indices are calculated ('rable 6) this pattern
is agair:. demonstrated: in <;-~ll populations the adults have higher.
indices than the juveniles. 'fhe 1mvest adult value, from the Sur,seL Bay
popul::l.tion., i::; ~;t:ill greater t..'1an the high8:3t juver::iJ.e 'laIue, frorl1 the
South Cove population.
In a:;.l three Pl?Pulations therE: Viera greater percentages of
juveniles feecUng tha.'1 of adults. '1'11is is chiefly due to the observed
high(~!" feedin<j rat.es in thf'; winter months. The juvenile diet is
76
Fig. 13. Percentages of-the tot-al juvenile ~eptasterias..observed ttlat
we.re feeding during the feed.ing censuses at the -three st.udy areas.
Symbols are the same as in Fig. 12.
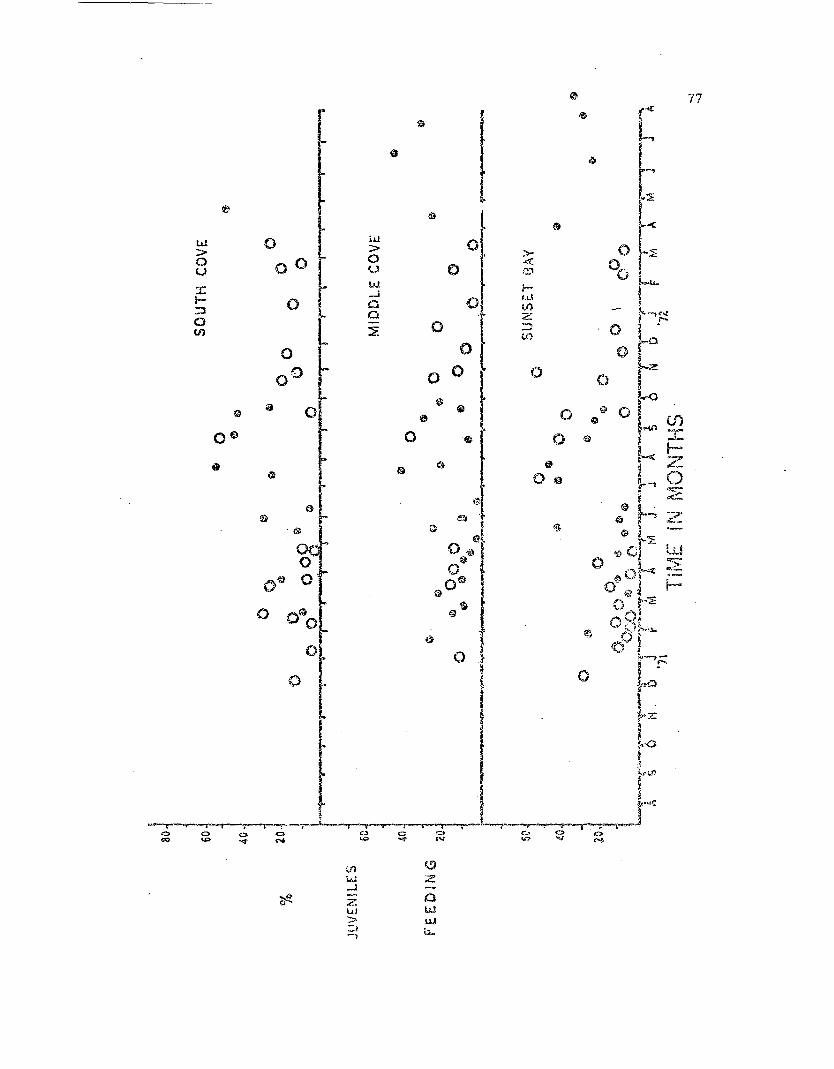
~
Iof)
iii
"l
~IS
t$
w 0 iLJ 0>> 0 >-0 0°
.<1(
U U 0 ,:0
..,.. W l--- ..J !.LI!-- 0 0 0 v'):J 0 :z0 - 0V) ~ -"U)
0 0
0° 0 0 0
a si'{/) e 0
Vl f".')w Z....l
""':!to.(J.Z 0
Ci~
uJ Lo.:...."
u..!.--::'1 ~-,
"7I,
TABT...E S. Sl.munary of the diet of ~eptasteri~ as observed during
feeding censuses by number and percentage.
a. Slmse t Ba.:'t
b. ~4iddle Gmre, Cape Aragc
c. Sou'.:.." Cove, Cape Arago
78
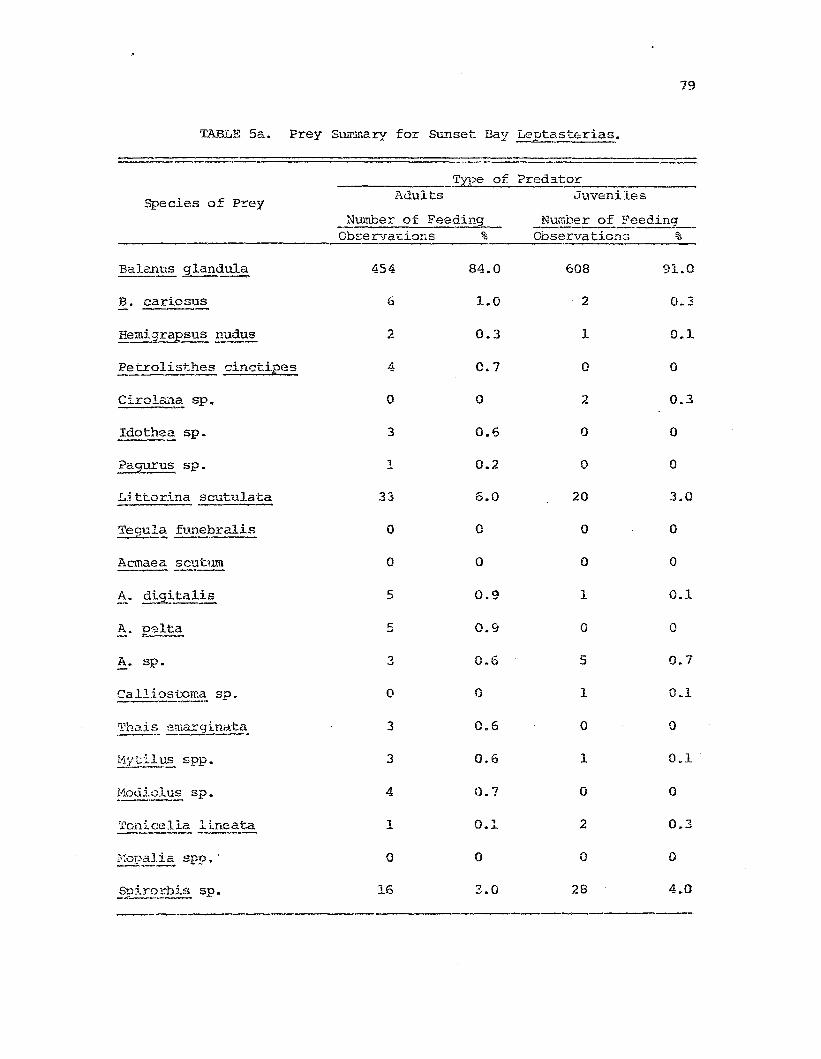
79
TABLE Sa. Prey STh~mary for Sunset Bay Leptasterias.
Adults ~11.1veniIe sSpecies of P~ey
Number of FeedingObserva1:ions %
Number of E'eedinq,,-Observations %._--.,;.=.::.:
Balc.nus glan~la 454 84.0 608
B. cariosus 6 1.0 2-----Hemi~qrapsus!~ 2 0.3 1
Petrolisthes cinctipes 4 0.7 0
Cirolo.;.'1a spa 0 0 2
Idothea sp. 3 0.6 0
l?agurus Spa 1 0.2 0
I,ittorina scutulata 33 6.0 20
Tegul<.:!:. fune~ralis 0 0 0
Acmaea scutum 0 0 0---------A. d.i..g~.ta!_is 5 0.9 1
A. pelta I:; 0.9 0oJ
A. Spa 3 0.6 5
Calliosi.:oma Spa 0 0 1---------'l'ha.is ~'E=gini;!:ta. 3 0.6 0
M17til~ spp. 3 0.6 1
l'1odi.olus Spa 4 0.7 0._-----Tonicella li-neata 1 0.1 2-----~-- -~_._-
?-~opalia spp. 0 0 0--.....-_.
Snirorbis Spa 16 3.0 28-<--..-...----
91.0
0.3
0.1
o
0.3
o
o
3.0
o
o
0.1
o
0.7
0.1
a
0.1
o
O ?.-o
4.0
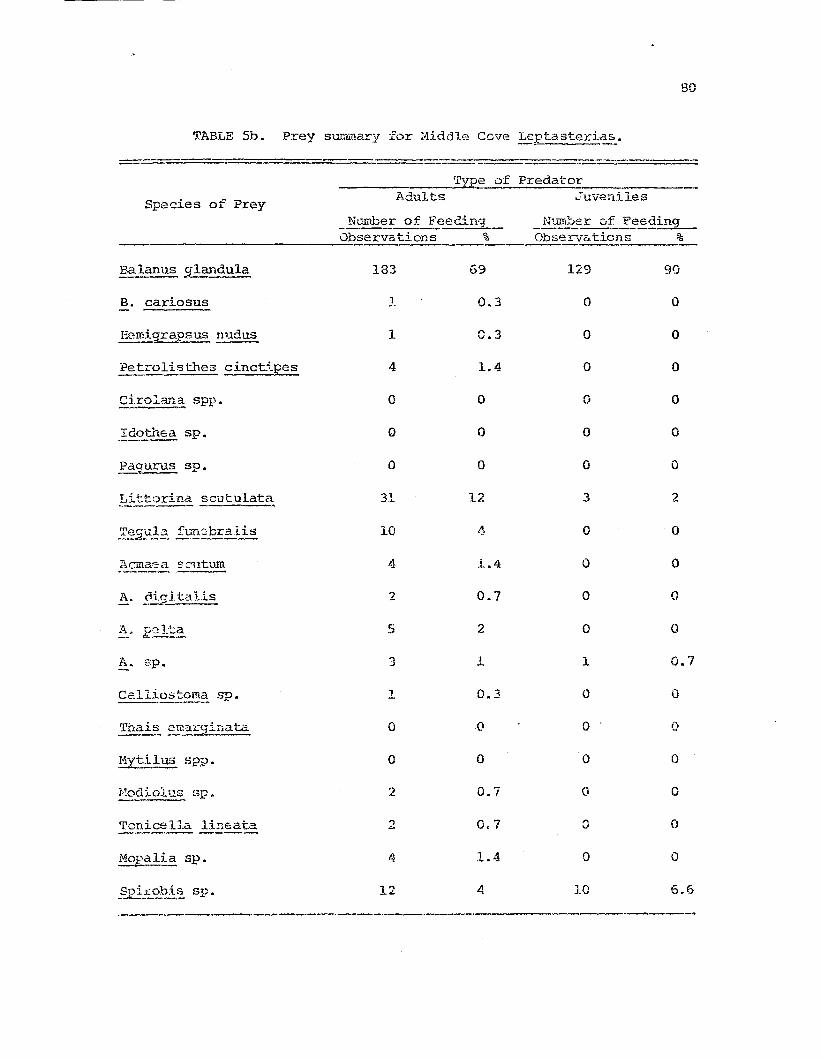
80
.....__._--------
Species of Prey Adultsof Predator
':uveniles
_Number of FeedinqObservations %________________-C..
_ NUlTl~er of F~eding
Observations %
129 90
0 0
0 0
0 0
0 0
0 0
0 0
3 2
0 0
0 0
0 0
0 0
1 0.7
0 0
0 0
0 0
0 0
0 0
0 0
10 6.6
---_._---..._------412
183 69
1- 0.3
1 C.3
4 1.4
0 0
0 0
0 0
31. 12
10 4-
4 l.L!
2 0.7
5 2
3 1.
, 0.3....
0 0
0 0
2 0.7
., 0.7""'
4 1.,1
,-----_.._--_.__._---------_._--~-
A. ~.i£jtalis
r.it.t:Jrina scut:ulata
Acmas:a ~C'utum
Hemigrapsus !:.~.ldus
B. cariosus
Mytilu;~ 5PP.
Tonicella li~~ata
Ido~ Spa
Thais em~rginata--~-------
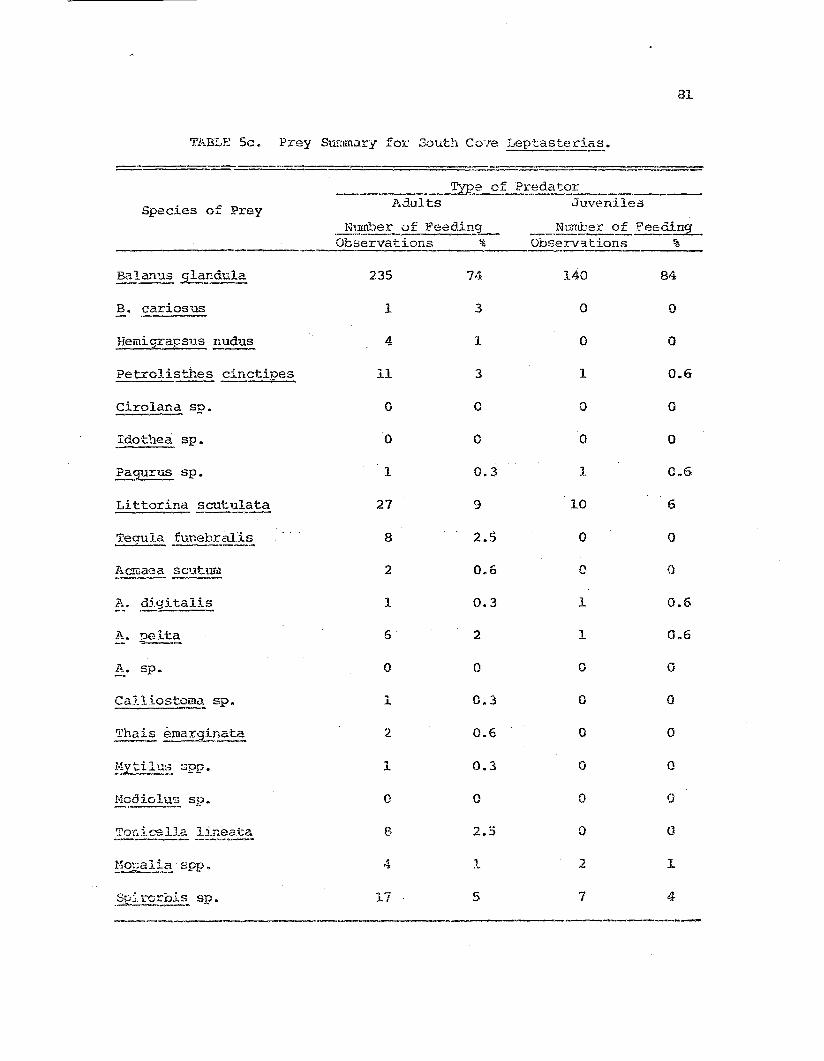
81
TABLE 5c. Prey Summary for 30uth COOle r-,ep+~asterias.
Species of Prey
_...Y.:!2.elI.dul ts
of PredatorJuveniles
" N\~e~ of Feedip:.L- __.Nu-:mber ~_ Feedi..E9:-..Observations % ObseT.V3.t:ions %
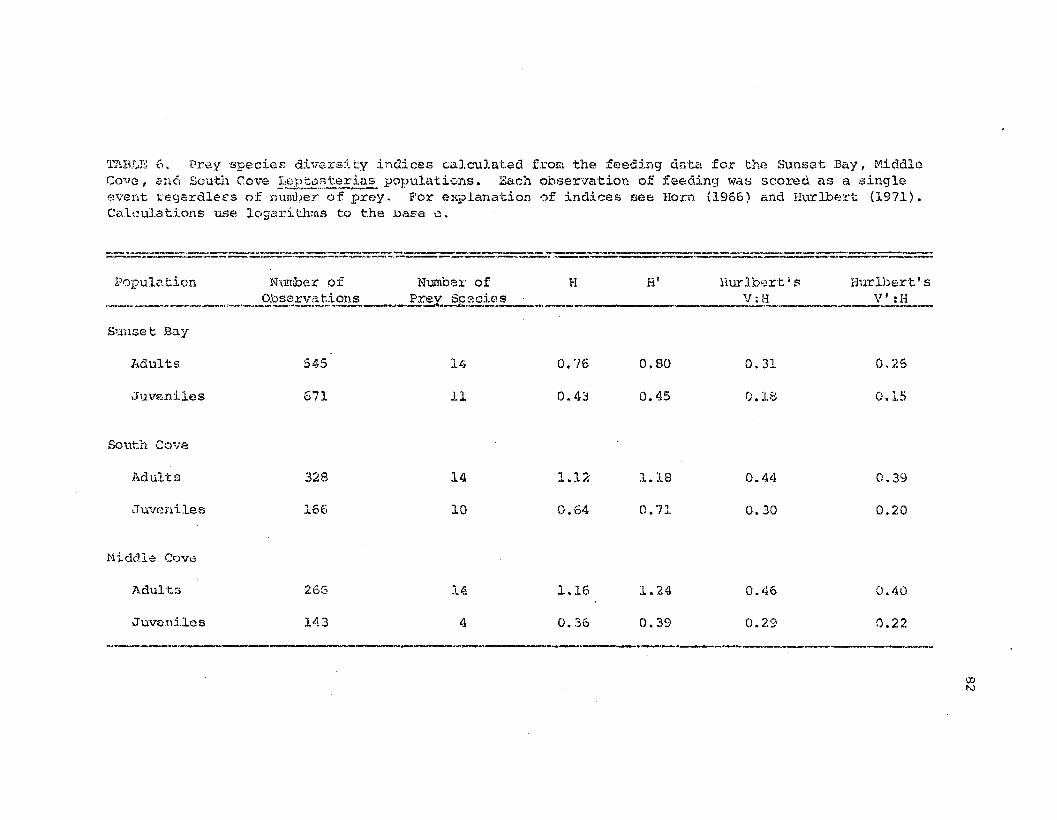
1'AIi.f..r:; 6. Prey species divers5.t:y inc1ices calculat.ed from the feeding c.1<.;·ta for t.ne Sunset Bay, MiddloCOVel ,ena Sou·th Cove l:;~}::.~.~?.!~ius.populations. Each observation of feedin9 was scored as a singleeven.t ::::egardleE"s of DumLer of prey. 1"or explanation of indices see Hori'). (1966) and Hurlbe:ct: (1971).Calculations use le>gar-i thms to t.he .tJase e.
-_ .._......-.....---_.Popul2.tir.m NlIDlber of Numbe:t: of I-I
._.~ " ._c.?:~~rv~~!;i?~~_Pr~ S12.££~~... _
Sunset Bay
- -H' BurIb.3rt 1 S
V:HHurlbert.' s
V' :H
------- . .... --._------,------ ,- .. --_._--_._------_.. -'" -. --
Adults
,Juveniles
SCt1t.h Cove
l\dults
.Juveni.les
t1iddl-a Cove
.Adult:-;
Juveniles
545
671
328
166
266
143
14
11
14
10
14
4
O. '16
0.43
1.1"
0.64
1.16
0.36
0.80
0.45
1.18
0.7l
1.24
0.39
0.31
0.18
0.44
0.30
0.46
0.29
0.25
0.15
0.39
0.20
0.40
0.22
Q:JN
83
characterized to a greater degree by small and/or non motile prey, and
this will be considered below.
The di.?ts of the juveniles and adu.lts overlap markedly, particularly
in the Sunset Bay population ..There se,"3. star dE:nsity is <;reatest (201m2
)
c:.nd t.."1e hi.ean size is smallest. 'l'his great overlap in diet bet-lsen size
(age) classes car! influence ·the intraspecific interactions in a given
area. Members of the smallest size class, the young of the year, are
also potential competitors for available food. Because of their small
size no quantitative study of t..'leir feeding ~Ilas made; however I do 'Hish
to present some pertinent field obserJations.
Chia (1966a) showed that. the brooding female Lepta.ster:i.C'.s prefer
entially seeks the underside of a dark rough-suz'faced reGk en \·;h:tch to
brood her young. In the rJhree.study areas 70% of the females ob3e~ved
with advanced broods were uw.:1er rocks or bou.lders ';lhich had a .!..arge
percentage of the surface covered with tube-secreting serpulid poly-
chaete S£i~orbis sp. The newly met~~orphosed stars were releaseu
a,:Tlongst the worm tubes and viere observed to feed on the ne.>'1y settled
spirorbids almost exclusively wltil they reached a di~~meter of 8-10mm r
whic~ corresponds to approximately an age 0= 8 months (Fig. 2). As the
yeung ofth~ y.sar grew larger t-l'leir main prey shif'ced from spi:corbids to
rec:ent1:t sett:lec1 ba:macle spat and finally to small ~. 9'la..n.<!~la «L.-nm).
\'lhen the juvenile diets of the three populations are compared, the
sea stars from Sunset '5ay have. the greatest number of prey species in
their diet (11), but the &J1..1th Cove nnimals have a. higher prey diversit"I
index W. "': 0.64 cf. Sunset. Bt:i.y H = 0.43). Middle Cove juveniles had the
84
lowest diversity index (H ~ 0.36) and the fewest prey species in the
diet (4).
The greatest n'~~er of prey s?ecies obse~Ted faY Sunset Eay
juveniles is easily explained by the much greater nua~er of observations
(N ~ 671) that were made for this population. II.S mentioned earlier
there is a much higher density at Sunset Bay, so mfu,y more sea stars
were encountered during a low tide feeding census. The:t"efore, ,qhile
the juveniles in this population showedu!e greatest dependency en ~.
glandu~,~ (91%), a greater number of rare species were encountered be
cause of the large- num.ber of sea stars observed. A simi.lar explanation
can be made for the IHddle Cove juvenile feeding date::.. The juveniIe
density was lowest at Middle Cove and therefore fewer juveniles were
encounterE:~d during a IOil;tide period. It is possible because of t:his
lower nluT<ber of feeding observations fewer rare speci8s were encountered.
IIlthe p:;cevious chapter a consistent order ,'I1<1S pointed o~t among
the three I_,eptast(~rias j;opulation3. The Middle Cove popula~ion had th~
largest mean size, greatest population maintenance cost and lowest
density. The S\L."lset Bay popula-tion had the smalle:=:t mean size, lmv-est
maintenance cost, and L~e highest density. The South Cove population
'.Nas in"termediace for all these vahles. The adl.l1t feeding data (Ti'lbles
6 ;;, 7} folIO':.; this pat"tern: Sunset Bay sea stars had the 10'i~'est prey
diversity and highest percentage of anilnals feeding; the Middle Cove
po.;:>Ulation had the highest diversit:' of prey species and the lOviest
85
percentage of sea stars feeding. The South Cove population was again
intermediate for bor~ values.
The low flrey species diversity index 0btained at Sunset Bay was
due to the high percentage of adult animals which fed on ~. g~~dula
(84%) compared to South Cove {74%) and Middle Cove (69%}. The relative
importance of a prey species can further be assessed by its contribution
to the caloric intake of a population (Fig. 14). B. glandula contrib
utes 89% of the total caloric intake to the S~Lset Bay pcp~lation and
68% to both Middle Cove and SOuth Cove populations. ~he second most
importa"lt p~'ey bot.~ calorically and numerically in all populations is
Litte~ sC"utulata. T;;;'e remainder of prey species represe,1ted in E'ig.
14 play significant roles (>1%) only in the Middle Cove and South Cove
populations. All are mollusks alid <ITill be considered belOltl. One
comraon prey species not represented in Fig. 14 is thp polychaete,
Spirorbi_~. sp., becau.c,;e I was not able to estimate its caloric content.
The prey selec-tiondata suggest that pap'.11ations containing loxg.sr
a...'1imals from less densely populated areas were able to secm::e a qrea'cer
varie-ty of prey. The sea stars from a crowd.ed populatior~ of small sized
ind.:Lv.1.duals were feeding at -2. greater rate a.."'ld on less divers.e prey.
Henge (1972b) suggesi.:ed from his data -that: larger indiVidual
~~t~steri~~ eat la~rer prey and that a larger sized predator added Hew
species to its diet_. Feder and Christensen (1966) felt certain that sea
sta::-::s follow the general physiological rule thattllerate of feeding,
expressed as a percenta9-e of their own body waight_ 1 declines as tha sea
star g:r.:O'iS.
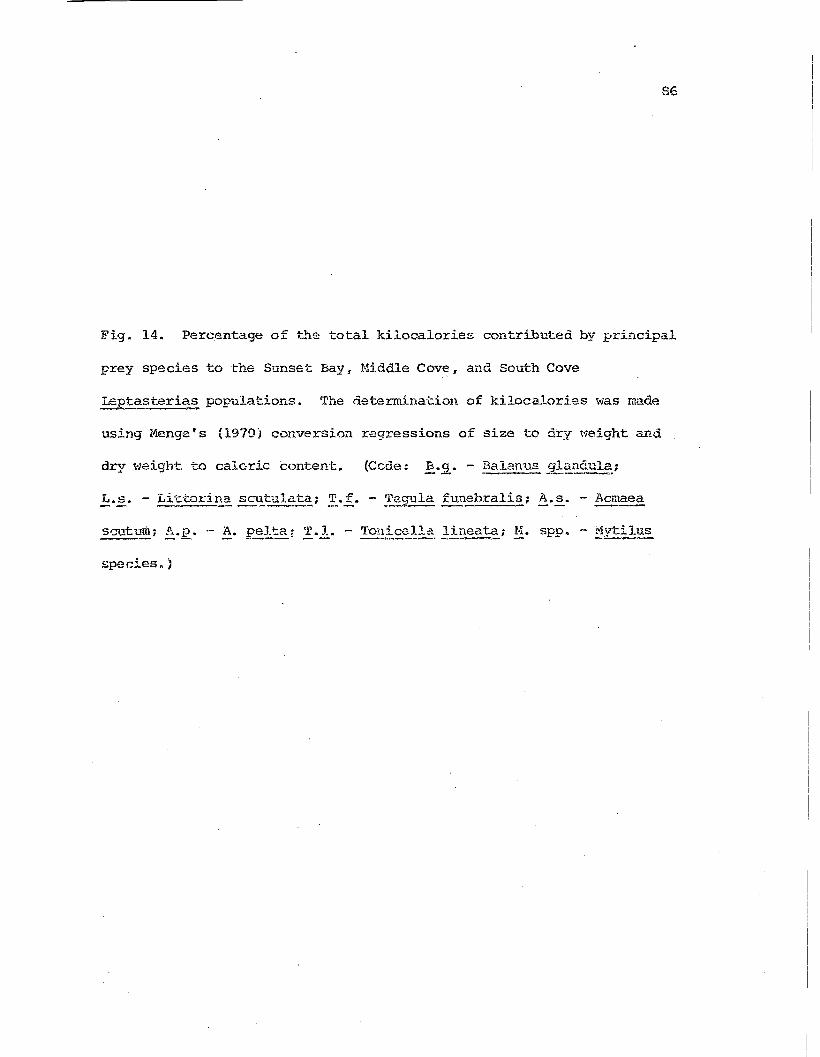
86
Fig. 14. Percentage of L~e total kilocalories contributed by principal
prey species to the Sunse't Bay! t-1iddle Cove I and South Cove
Leptasterias populat.ions. The determination of kilocalories was made
using Menge I s (1970) conversion regressions of size 1:0 c:ry ,,,eight and
dry to/eight to cale:ric conten't.
A. pel~~; T.J.. - ~~£~llc'l.. 1.-ineat~; H. spp. - l'1ytilus
species. )
%
TOTALI<CAL
,..~"I,n
30..·
B.G. L.5.
1. SUNSET BAY
2. SOUTH COVE
3. MIDDl E COVE
PREY SPEC I ES·
87
88
Swruner 1972 Feeding Study
In order to deter-mine luore clearJ_y the differences ir~ feading among
the three populations I de;:dgned a simple experiment that was completed
during the summer of 1972. Three questions were asked: (J.) wha t: i.:: t.ile
relationship between ~t3sterias size and feeding SU~C2SS; (2) does
this :relationship vary between populat.ions; and (3) are an.imals "lith
morphological damage less successful feeders than intact wlimals of the
same size? Each popula.tien \vas sat-npled :luring morning 1ml tides until
the first 100 sea stars, regardless of size, feeding on ~. gl&,dul~ were
found. The animals i:md their prey \....ere tn,ated nsing the methods
stated above.
Regressions of sea star s~ze (diamGter in ITQllineters) en total
prey dry weight were calculated fQr t.0.e three populations. The cor
relation coefficients {r) were all signi..ficar:t (P<.05) a..'1d haC. pcsitiv0
slope. 'Ibis suggests tltat a larger saa star does obtain l.a.cger prey,
and is Dot s~rprising. 1~e regressions were compared by analy~is of
covari,,~1C(? (Sokal t< T;ohlf, 1969) <tnd no significant diffez:oe!1Ce ~-Jas
f01J.Lvi :t2t:v;een them (I'able 7) >
The data indicate that the large sea stars enjoy suped.orit'J over
i:hc ~JIi1:.dl ir. fo,-,d ca.ptnrc:! abilitii~s. To l.mderstand "ihat effset this
r>3latiollship has on overall popl11ation feeding S·i.1:::cess, a~ e;::;ti;nate for
the meen caloric intake per !~~?·ti:~~:t:-~.!-::.~~'?. feed.i.ng even1: ce.n he calculated
'.1.sing the popu1..ation feeding 3tw:maries ('f.=.ble 8), by diilic.ing the total
kilocalories consumed by '::he m ...\1b8r of feeding obsei::vations. t'ihen this
is done, t.ne ~1iddle Cuv'e vahle (9.() calories/feedin'] oDservation) is
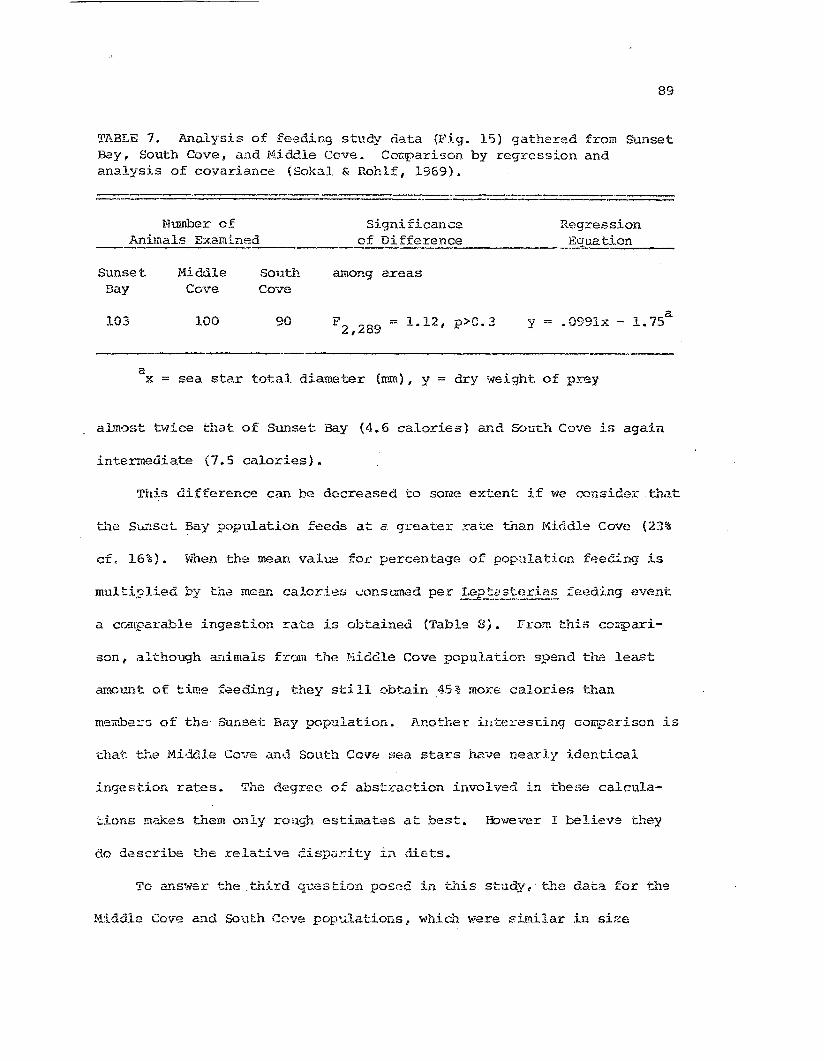
89
Tll._BLE 7. Anal:isis of feeding study data (Fig. 15) gathered from SunsetBay, South Cove, and Middle Cove. COhparison by regression andanalysis of covariance (Sakal. &< Rohlf, 1969).
=====------Regression~qua ti_o_n_, _
Number ofAnimals Examined
Sig-ni ficanceof Difference
~~------
SunsetBay
MiddleCove
SouthCove
among areas
103 100 90 1.12, p>C.3 ya
.0991x - 1. 75
ax = sea star total dia,l1eter (rom), y= dry 'tleighi: of prey
aL'1lost twice that of SU!lset: Bay (4.6 calories) and South Cove is again
intermediate (7.5 calories).
'I'his difference can be decreased to some ex-tent if we consider tha.t
the Su..."").seL Bay population feeds at a. greater rate than Middle Cove (23%
cf. 161;). 1'J'hen the mean val\le fOL" percentage of popnlation feeCi_ng is
a comparable ingestion rate is obtained (Tab19 8). From t.his cOl11pari-
son, although animals from the Nid<lle Cove population spend the least
~acunt of time feeding; they still obtain 45% more calories than
members of the Sunsei: Bay population. Another iutel:.-es't.ing conparison is
that. tlJ.9 Middle Cove 'l.1'1d South Cove sea s'tars have nearly iden-tical
ingestion rates. 'l'he degree of abst:caction involved in these calcula-
~ions m2~es them only rOl1gh estimates at best.
do describe the. relative disp.:;~ity in diets.
However I believe they
To ans~.,er the, t.hird question posed in i::.J."1.is study. the data for the
g:Lddle Cove and South Cove populations. whit",1. ""Tere ~im.ilar in si:~e
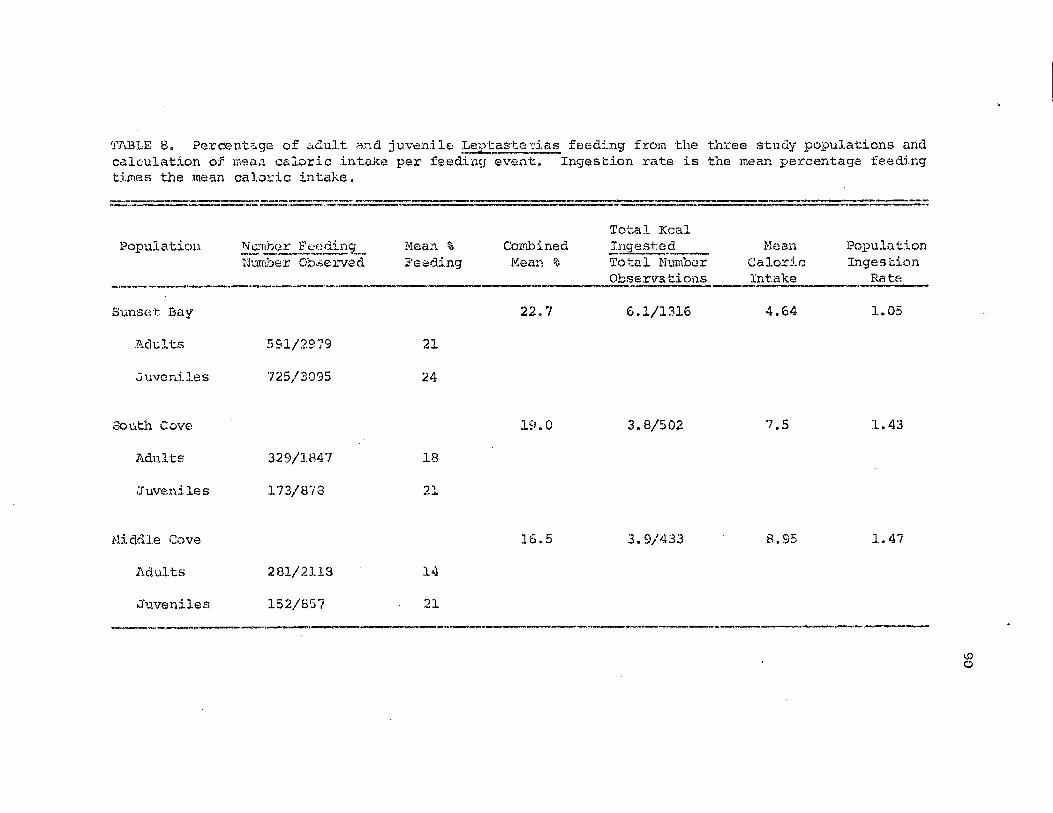
'J'ABLE 80 Percent;;.ge of uG.ult a:1.d ju.v02nile.: Leptas'tc''.'ias ff.:leding from ·the three study populations andcalculation of ID':l<'L1 caloric intak~ per feeding -event. Ingestion rate is the mean percentage feedingtimes the mean caloJ:.:ic intake •
..,_._..._......--~ ... - --- --===========
._._---_.__._--_._-_._,_.._--------~,
Cornb:l.nedl"1ean %
J?opulationIngestion
Rate
MeanCaloricInt.ake-"-----_.
Total Kcal.!ngest:e.9 _Total N1Jmb.:.~r
Observations._-- _.-.--....;;....-;;....-
Hea:l %Feeding
~'11h~~.F~~d.inL
N'nlrLber ObservedPopula.ticm
Sum,e't Bay 22.7 6.1/1316 4.64 1.05
Adults 551/2979 21
,'juveni.les 725/3095 24
SOuth Cove 19.0 3.8/502 7.5 1.43
Adults 329/1847 18
.Juveniles J.73/878 21
HidtUe Cove 16.5 3.9/433 8.95 1.47
Adults 281/2118 14
Juveniles 152/857 21
-------_..._-----------_.----~-_._~--- ..--~,I.Po
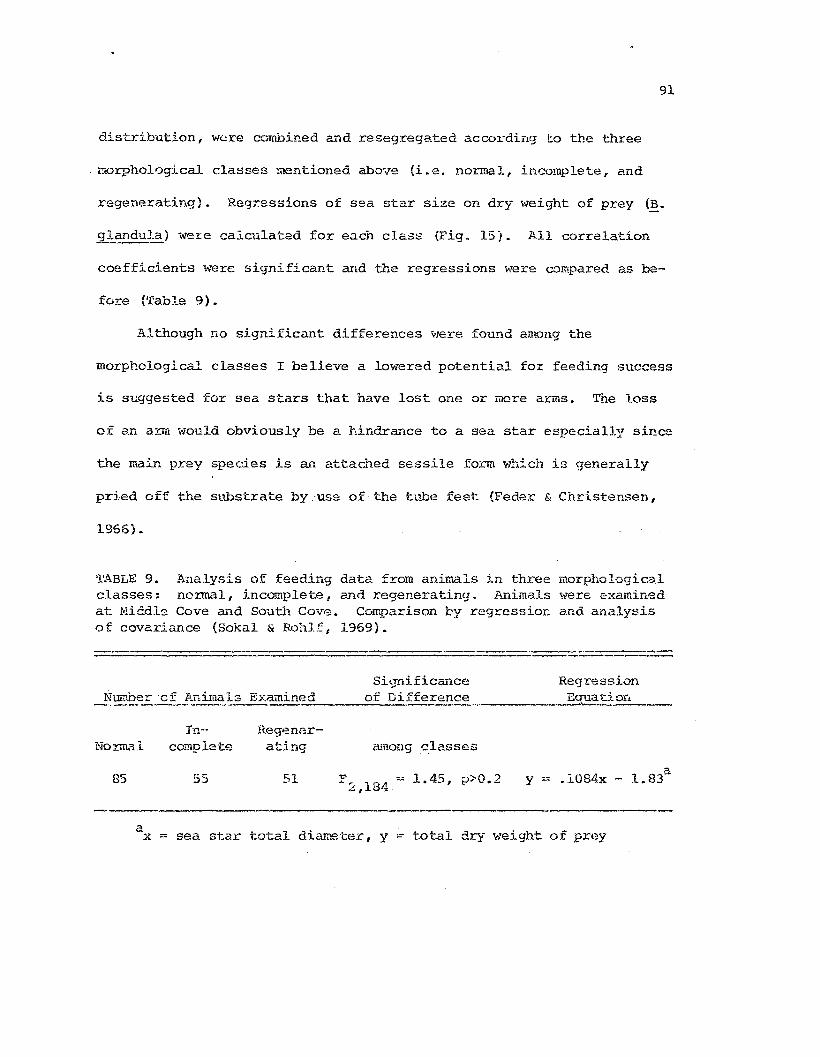
91
distribution, were combined and resegrega.'ted according to the three
morphological classes mentioned above (i.e. normal, incomplete, and
regenerating) • Regressions of sea star size on dry \'1eight of prey (.!?.
9landu]~) were calculated for each class (Fig. lSi. All correlation
coefficients were significant ~,d the regressions were compared as be-
fore (Table 9).
Although no significant differences \'Jere found among the
morphological classes I believe a lowered potential for feedin'=J success
is suggested for sea stars that have lost one or more arms. ~~e loss
of an ann ..louid obviously be a hindra.'1ce to a sea star especially sip..ce
the main prey species is illl attached sessile form wh~ch is generally
pried off t:he substrate by. US2 of the tubl: feet (Feder & Christensen,
1966) •
TABLE 9. &lalysis of feeding data from animals in three morphologicalclasses: nOT.rr~l, incomplete, and regenerating. Animals were examinedat Middle Cove and South Cove. Comparison by regressioL and analysisof covariance (Sokal & FDh1£, 1969).
Significance_~~.e.E._·c_~_!~!,-iE!.<:t_13_F_~x_~_in_~.:;d,- o_f_D.i ffer~E::::~_.,
Regression~3ua!:~or. __.
Normal
85
In-'comple·te
55
Reg-:ner-.....a ...lng
51
among classes
1::' .- 1 4') n'O'".A..-" 1 c" _.. ....".r:- ,. • ,!..
.:. I tit"y - .1084x - 1.83
a
ax :=;: sea s'ta:c total diame·te.:c, y := total dry weight of prey
92
Fig. 15. Regression lines of total dry tl'1eight of prey on sea star size
(diameter in milliweters). Each line represents a morphological
category f~om the combined Hi.ddle Cove a.nd South Cove data. NU!lber of
sea stars in each category is indicated.
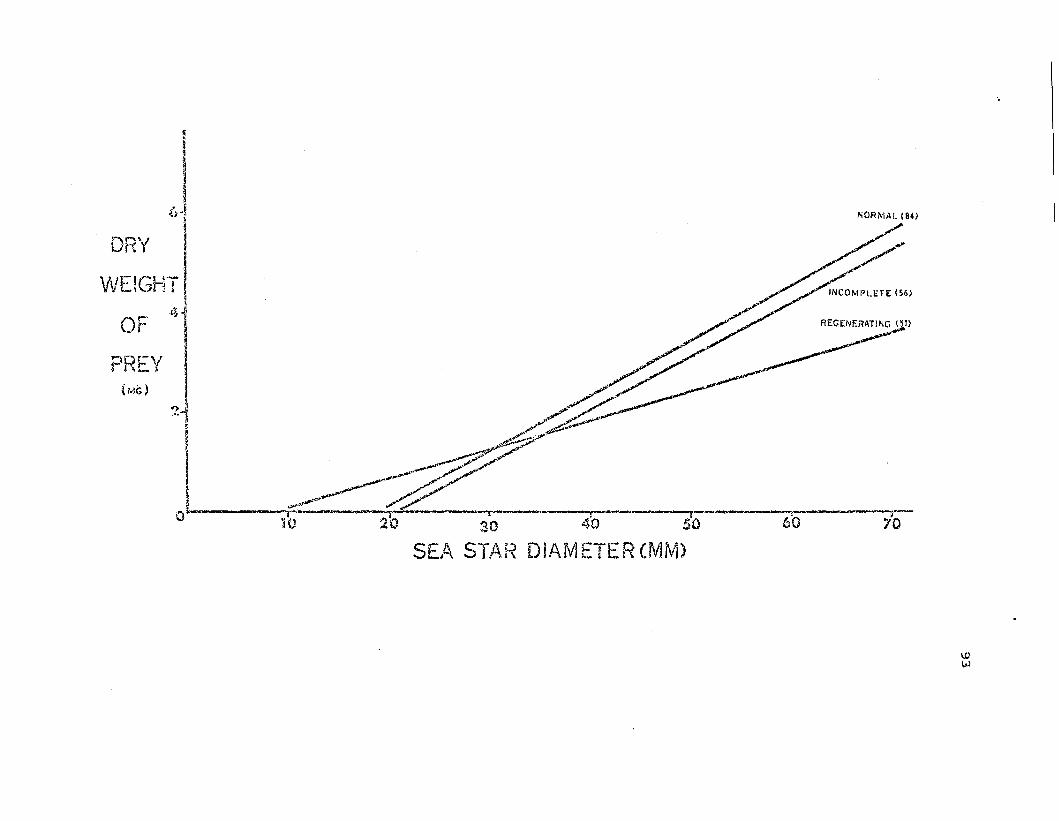
~
IlI~
6·iI
DRY I\tVEIGHTI
4 JOF I
\:,lnr:\( !~ i\.... §
(MG) J ~/ ~~J:1 .,/.~
~ ~,.;~
I .~.
I ~oL-.. . -.---...._._._-- "T •••• ----y~.- -_. . ··r--"· ,_. -- • ...--------.-H) :20 30 4'0 5'0 0'0 70
SEA STA~( DIAMETERCMM)
1.0I.,)
94
Prey Species Characteristics
The main prey species, Bala~ 9Ia.ndul~! ra.lges from the Aleut.ian
Islands to belDw Ensenada, Lower California, and is one of the m.:>st
abunda.."1t animals on the Pacific coast (Ricketts e'c al., 1968). The
biology of this species has been studied by BalTIeS m1d Barne3 (1956)
and more recently by Glynn (1965) and Connell (lg70).
Connell (J.970) found newly settled B. glandula at all shore levels
on both sides of San Juan .lsland from June to early Sep·tembe1C. Settle
ment began in lvi.arch and extended through Octobe~~ at Pacific Grove,
California (Glynn, 1965). Observations from the Cccs Bay area indicate
sett:lement begins in late t1arch and is heaviest from May through
AUg1~['t ,-lith some settlem,'Hi.t throu.gh Gctoher.
)i'ew B. glandula settle belm? the intert.ida.l level, probably because
t..'1e cypric. larvae Slvi.rl" to the surface 1rlhen they aLe rea.dy to settle.
Within the i~tertid;l zone the barn~Gles settle and survive best at
middle levels, although the breeding poptuation is rest~icted to above
the mean high low ·tidE:: mark (Connell, 1970).
This stab.J.e!::'reeding po[>ulation reproduces in the summer and
autum"1-, aild b€:!CaUs9 of this lOD-g,;r season of reproduction i.t is ~.P.BS
vulnerable to chance weather catastrophes. A.s a result settleme~t is
:Iuite :r2gular. ':,;'he breeding pC:i.:.1UL!t::.on produces enough offspring to
maintain itself and regulaxly colonize the lower intertidal zone. Be-
cause of its :r:9gular settlement throughout: the i:Gtertida.l zone B.
91andnl~ provides an extremely depe~dable food supply to several preda-
tors {Connell, :970).
95
On San Juan Island Connell (1970) found that .:!'~~ spp. restricts
B. gla...'1qula to the upper intertidal zone. No adults were fOll..."1d in the
lower intertidal where Thais ~las able to eat them. In areas \'lhere no
Thais were found adult B. glandula ,:.ere abundant.
A siIT~lar situation was observed on tlle Oregon open coast. Inside
Sunset. Bay there are sections of sandstone reef cornpletely surrou.Ilded by
sand and heavily covered by large adult B. glR.!1.d'J.la. The sand restricts
the access of B. glandula's main predators, Thais spp. and ~~ptasterias
both of ',,,,hich have non pelagic larvae and cross the sand ·with diffi-
c..'Ulty. However in the cobble areas with Leptasteri~. large B • .9"landula
are found only all the tops of large boulders Ylhere neit.her predator
regularly forages.
During its first year B. s':landula groY,'s at a similar ra.te on bot.h
the open coast (Glynn, 196~) and in protected areas (Connell, 1970),
reaching a basal dia:n.eter of 7J:run. In the 300 observation.s of predation
on 5!.. glandula, in '\'1hich the individJal barn2.cles ;."ere measured, only 4
of 1055 specimens had a basal diameter 7wl!l or groater. Z"'.en~fore? be
cause L. hexactis can successfully feed on ba~~acles larger than 7mm
(~'lenge, 1970 i pers. obser.) and because t"..he only read.ily accessible
barnacles "ler'= smaller than this, it can be inferred that the majority
of ~. 91andula in ~~e cobble area are eaten before they reach s£xual
Hta.ttrrity at the a.ge of 1 year and that 1~~teri.aS' contributes dg
nificantly to this predation.
A secm:d halanoid bm·na.c1.E':, Qal.~.fms .cariosus, 'Vias also eaten by
~~.!::~st~J;"ia~ rrat at a mnch 10'\>ier: :C3te. 'l'h~.s sp,;;cies is not riS cornman
96
as l?- glandu}a in the Cape Arago arecl. It is reported to "assiduously
avo~d oce~lic conditions, occurring only in deep crevices ?~d under
mTerhanging ledges in t.he low intertidal zone" (Ricketts et a1., 1968).
Menge (1970) reported Lept~~:::}.as had greater difficulty in removing B.
c~iosus t.han B. glandu~. Connell (1970) found the settlement of B.
carios~~ on SaIl "Juan Island to be much more irregulax' than. that of B.
Stlandula.
The second most commonly observed P:t:e:y in this study ;.vas the peri
wini~l(~, Littorina scutula-tao This species, which is found all along t..'>.e
U.s. Pacific coast, inhabits t.heupper intertidal zone; its 'Upper
boundary is rarely ~ore than a half meter above the height reached by
the high tide (Ricketts et al.. 1968). ~. s<?.Etulata! s IOlA'er boundary
overlaps with the upper foraging ra.nge of ~eptasteriasI \vhere my field
notes indicatetnat L. sGutulat.a is preyed upon more cOnLTIlonly than B.
glandul~. During storms many L. SClltulata are washed into the middle
Imver intertidal (John Cubit, pars" carom.) and subsequen·tly eaten by
Leptasterias. L. scu-tulata is reported -to exhibit an escape response to
Leptasterias (Bullock~ 1953), but Mt::nge (1970) found t.his to be very
\veak and observed t:hat the li.ttorine vias easily ca.ptured.
Like .~. 5I~E~S~~~. ~•.~!:El~ta provides a regular, predictable
source of ioodto ~_~st:~E.~. The upper portion of the population is
relat.ively free from preda·tion and pro~:ides a breeding population. '1116
breedh;'/] .20pulaticn is able to mair.tain itself and provide a food source
by regular seasonal spawning a..'1.d subsequent. settlement of pelagic
larvde {Behrens, 1972; p~rs. corom.).
97
The small serpulid polychaetes, Spirorbis spp.! are the main prey
of the newly metamor.phosed Ir2pt~~t€:.!ja~ and are eaten at a lower rate
by both juvenile and adul·t sta.rs. Species of this genus are COIT~on to
the entire Pacific coast and are typically found on sraall round
boulders that are continually im,llerseo in pools (Ricketts et al., 1968).
'these animals brood their y01mg and are reported to release their
larvae in February (Ricketts et al., 1968) alL~ough some species have a
longer r.eprcductiva season (Peter Ro-thlisberg. Oregon State ur..iversi·ty F
pers. camm.). The newly settled polychaetes are typically available tG
the newly meta-rnorphosed sea stars which are released in April through
early l"1ay.
The remaining prey E::pecies were preyed '.Apon less frequently and
will be considered in less detail. S2veral ~haracteristics are common
to some or all of these species. Almost all are common to the upper or
middle in·ter-tidal and are distributed along the Pacific coast: from
Alaska to Baja Ca.lifornia (Ricketts et 0.1.; 1968). Escape responses to
Leptasteria~have been demonstrated by many of the gastropods, including
Tegula ~~~ralisl ~~~~ ..?~~t ~. pelta, and Cal1iosh2~ sp. (Elll-
lock, 1953; Feder & Christensen t 1966) • The p0rce lain Drab- t·
.Pe!:.rolis~he.:~ .9i:t...ctj:~, is quick to autotomize walking legs or claws.
Sea stars observed feeding on tbis species had only a leg or two in
t::'1eir grasp f never the ....hole crab. 'l'his observation is also true ~ to a
lesser extent, for Hemigraps~ nud:u~ which does not <J.utotoll'..ize appEm.d
ages as readily and was sonetimes t:.-apped- by r..epta:sterias.
2~me prey sFecies find refuge in space, in ~~at their intertidal
98
distribution is pccrtially above or belm.; that. of :LeP..!E..~eri~~.
upp~r re£ugG has already been menU_oned for ~. glcU1dula. and ~. scut:1.l1ata
gastropod species whi:::h la.ck escape response to Leptas t~E:ta~~ (Feder &
Christensen, 1966). The chitons Tonicella lineata and ~oEa~~~ spp. have
thei.r lower· distribution in the subtidal where !;ept~~tej:ia2.. is much less
abundant (Menge, 1970).
Hany of Lep~ria~' prey species find a refuge i.n size. This
generally small sea star is unable to attack successfully and feed on
L"he larger individuals of !l.'..any .:i.ntertida.l invertebrate species t..-ith
which it normally comes in contact. Species which apr-ea:::.- to have 3.
refuge in size include ~a !_unebralis, ~cmaea ~cutu..~, A. P~l'
Tonicella fi~~'~~2alia spp. aDa Mytilus spp.
The effect.ivenes3 of t.h:i..s size refuge may be seen by referring back
to the prey data summary {Table 5}. This explains ~-hy the juvenile sea
stars in all populations have low prey species diversity indices and
fet..,er· prey species in their dict. Anirl~als from the Sunset Bay adult
population, which is made up of small !,~ptast;.erias~, were unable to
capture any of the t.WO largest gastropods I 1'. fu."'1ebx:alis or A. ~~;..!1~'
the other .~. spp. captll.ced by this populaticn were generally qu.ite
small. The South Cove and especially the Middle Cove population with
:r.,e~+-as~?:t"ias. The effect that a fCK of t.hese large prey spe~it?:;; ('I'able
5) (.'oj1 1:a"/2 0::1 0·...·::;:::::<111 c=.lo:ci.:.: i::i.take GaD be seen in f'ig. 14.
99
1u complete this section on L~ta~teri~~' prey species several of
Henqe's (1970 ~ 1972a & b) observations are pertinent. In laboratory
studies he found t..l:at Leptasterias selectively choSE: f-ittorina spp.
over all other prey, and that ~. 91andula ranked very lew in preference.
Menge calculated the caloric yield of prey species consumed per gram of
Le.\2tast~~dry weight per hour spent feeding for the major prey
species. In this series ~. glandula had the lowest of measured values
and Acmaea scutum was the highest in caloric yield. Froro his field
stu.dies, ·;/hich were conducted during the day dnd night for both high and
low tides, he fou-Do the percentage .Leptasterias feedir.g at low tide was
generally much lower than the percentage feeding at high tide. B.
91andula Ttiere eaten less c1"...1Iing day low tides than night 10\\1 tides I
and larger Leptaste.E.,ias captured larger prey_
Based on Menge's observations, nw feeding percentages are probably
consistently low because they are all based on low tide observations,
moreover the percentage of sea stars tha'c \\7ere feeding on B. 91a~dvla
may be higr,er t"ha;1 that observed.
ether g~~neral observations from my st,ndy of ~Lept~t~.!:..ias' feeding
(1)ti:18 majo:dty of prey eaten are . non motile (sessile) dnd/or
very small and aLoe very predi.ctable food sources; (2) all age classes of
sea stars feed to sO:r.'"te extent en B. glanClula; this species, "ihen eaten,
lS seldom more tha.'1. 1 year of age; (3) the high densi,ty Sunset Bay
population subsists aL~ost exclusively on B.glandula and, although sea
stars get fewer calories p~r feeding event than at either SOuL~ Cove or
Hiddle C~")Ye, m.uch greater stress OD the prey population results i (.~)
100
larger sea stars capvlre larger prey which are calorically more sig
nificant.
Comparison of Leptasterias ~'eeding Bioloqy f:=om San Juan Island
(Henge, 1970, 1972a 6. b) and <?regon' s PIotecteci. Outer Coast
A':lY comparison made between ths data fl:om these studies must be
p:roefaced \dth the faet that my sampling schedule t,.;as less comprehensive
than Menge's.
Leptasterias followed the same anDual feeding cycle on San Juan
Island and the Oregon coast. All populations observed by Henge (1970)
and myself had a similar peak in feeding duX'ing mid-sumrr.e:= cmd a de-
cline during the winter reproductive period.
Nenge (1970) sampled during both day and night low and high tides
and ....as able °t.o show distinct. differences i.n diet bet\veen tides and
beb¥een day and night feeding. He also observed changes in diet ~ith
season" Because.'! my observations were made only during daylight. Imv
tides I did not observe any tidal differen~es, nor aid I distinguish fu!Y
differences in feeding bet\'1een morning and afte:i::noon 10-;-1 tides.
ever I did observe t..'1a1: 90nsister.tly fe,,;er ~"::ast~.E.:Las t,re:r.:E'l fou.nd
feedin(j during stonHS, ?nd that on equally calm days more sea stars
would be feeding when it was dm~p and/or overcastratller than dry or
su"ny. Eecause of D1G r.elatively lirrdted prey selection, no seasonal
ch2.ngii: ill dia t was obs~;rYcd. ~'ihcn a greater percentage of sea stars
i-lere fOU!."1.d f;;eding. mGre species iovere included as pr(-=y.
101
The barnacle, B. <Jlandul~t was the numerically dominant prey
species (35% of the number of prey eaten) eaten by the San J'Lk-ul
Leptasterias, yet it varied from 3 to 55% of the total diet between
pop'll.lations . In addition it ranked blelfth in overall caloric con-
tribu~ion to Leptasterias' diet. In the Oregon populations B. glandula;,
contributed from 69 to 90% (Table 5) of the total diet and ranked first
in caloric cor~tribution in all three populations (Fig. 14).
Other prey species eate:1 by the two Leptasteri::is aroups were_.-;;.....__. • J
generally the 82'1(\e hut i;1 ebviously different proportions. The San Juan
!unebralis, ""'hich does not. spp.,~~
Leptasterias but were relatively rare in the Cape p~ago region. One
chi ton species, l.'.at.l:erin.§. tunicat:::, wrlich occu.~s in bot.'" areas ,'las
HO,·7eyer tbis species is di5-
tributed mere widely in b'1.e Sar, ,Juanim:ex:tidal (pers. obs.). t..l1.an in
my st.udy a.rea •
.The die ts of ~1.E:!lg~{s Sa.'1 ·Jlli:m ]?opulations var1ed considerably from
one another co.s 'N811as from the u.r-egc:1 pop ulatio;·~5. Menge (1972a) ob-
served that the nur.~er of species in th~ diet was a f~~ction of the
munber of specie,:; availc..ble in ,,1..0.1 area and that available prey, in the
Q~oad sense, probably accounted for most of the differences between
diets in di.ffex-ent areas.
~'he San Juan }cptasterias populations had much great~x.. variations
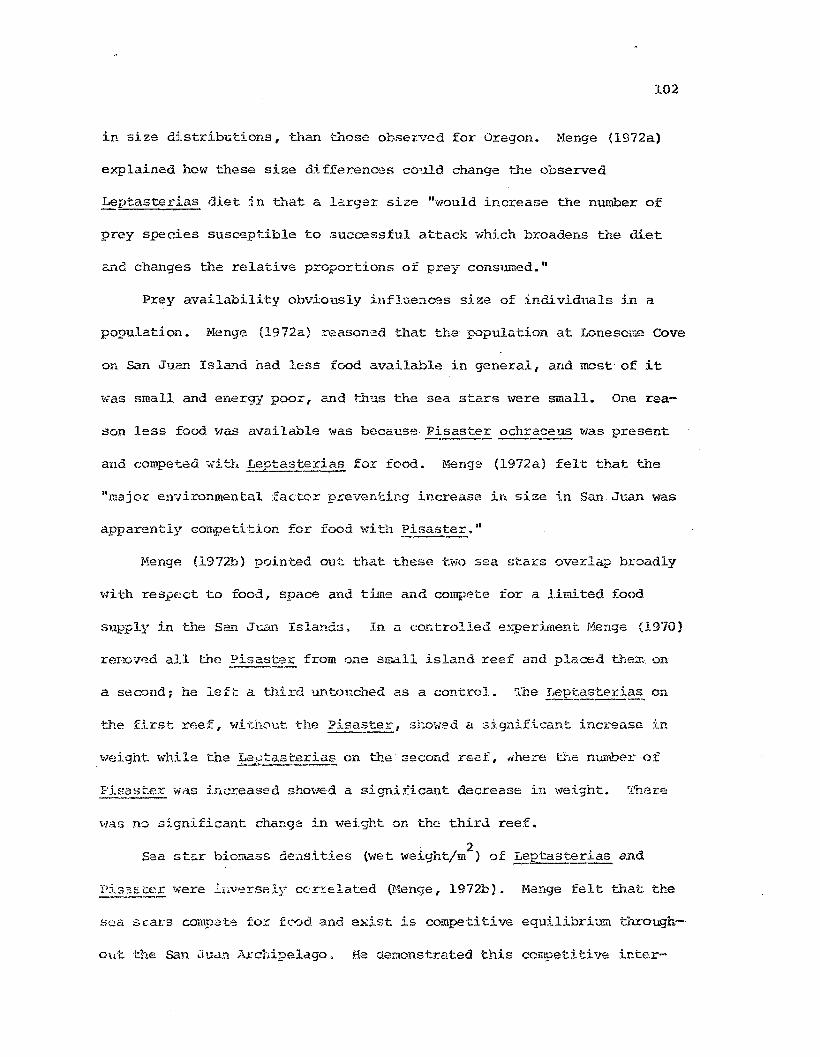
102
in si ze distributions # 'than those observed for Oregon. :Menge (l972a)
explained how these size differ.ences could change t~e observed
Leptasterias die·t .~ n that a l'3.rger size ''"('lauld increase the number of
prey species susceptible to successful attack which broadens the diet
and changes the relative pzooportions of prey consumed. II
Prey availability obviously illflu.e:1C€s size of individuals in a
population. Menge {1972a} reasoned that the population at Loneso:u,G Cove
on. San JUEm Isla.'1.d had less food available in general, and most of it
,\;;-as small and energy poor, and thus the sea stars were small. One rea-
son less food was available was because Pisaster och~2~~ was present
and competed >r;itl:. Lepta.sterias for food. l-l:enge (1972a) felt that tl'1e
"major elr;ironmental factor pr.everd:ing increase i1". size in San Juan was
apparently competi·tion for food vii tIl Pisaste:::,."
l"'lengp. (1972b) poin'ted out that these brO sea stars over.lap broadly
",lith res.i?E:ct to food, space and time and comp<?te for a limited food
supply in ·L'le San J"t:aI1 Island.s. In a controlled ex~eriment Menge (1970)
reno;;ed a11me PisCl:.~te.E. from ("Jl1e Str.all island reef and placed then': on
a second; he left a third untouched as a control. ':rhe I,epi:.a8~ia~, on
the first reef, vd t.llout, the Pisaster, ShO·..l,,:,d a significant, increase in
""eight \"lhile the .f:~!;:ltast~rias on the second reef, where t:he m.unbeJ:: of
PiEaster \''ias increased shm'!ed a significant decrease in \veight.
"',-,as no ;]j.gnificant change in ,,~ei.ght on the third reef.
Sea star biomass de~sities (wet weight/ro2
) of Le2tasterias and
were lr;.verse 1y cc rr:ela·ted (N,enge, 1972b). Menge felt that the
sea sea1.'S compot~ for fr-"'(Jd and exist is competitive equ.i.librimn through-
alIt. the. San aUcl.'1 Archipela.go> He demonstrated this competitive inter-
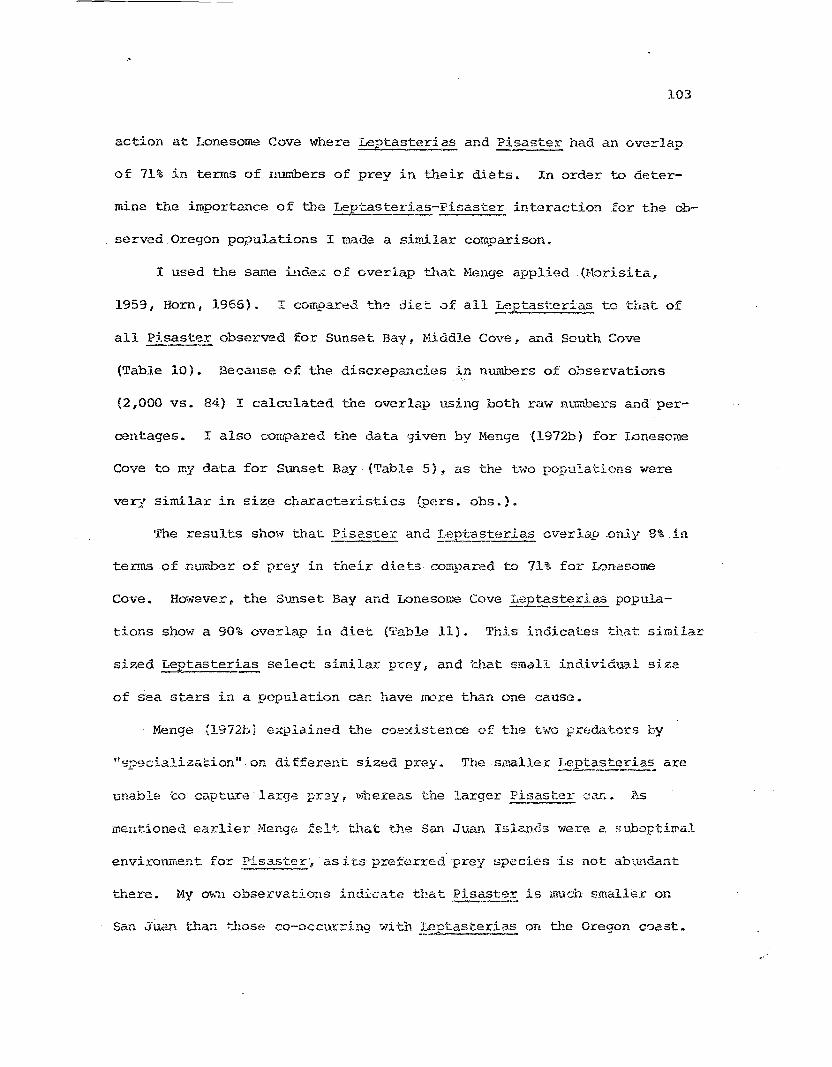
103
act~on "t T·onesome. <:ove whe ....._e • "'...... taster.; as a .... d P' ~~", ' d 1- - - - '. "-=);:'..... u _~",o.::> e. na an over ap
of 71% in terms of numbers of prey in their diets. In order to oeter-
mine the impor·tfuJ.ce of tl1e Lep'1:asterias-Pisaster interaction for the ob-
served Oregon populations I nade a simil.ar comparison.
I used the sa."i1e index of overlap that. Menge applied (Horisita.
1959, Horn, 1966). I compan~a the diet of all Leptasterias to t:hat of
all P:i.saster observed for Sunset Bay, Middle Cove. a ..'1d South Cove
(Table 10). Because of the discrepancies in nl.L.llbers of observations
(2,OOO vs. 84) I calculated ·the overlap using both raw H.umbers and per-
centages. I also compared the data ':Jiven by Henge (1972b) for I,onescme
Cove to my data for Sunset Bay (Table 5), as the t:;·:o popu1..ations were
verj similar in size characteristics (pers. obs.).
'fhe results shm'1 that .Pis2_ste~ and !:Ept'as!erias overlap .only 8% in
terms of nu.i'Uber of prey in their diets com'par,~d to 71% for Lonesome
Cove. However, the Sunset Bay and Lonesome Cove Lepta~terias popula-
t.ions show a 90% overlap in diet ('i'able 11). This indica·tes that similar
sized !'eptasterias select similar prey, and 'chat small individua.l SIze
of sea stars in a population caG have more than one cause.
Menge {1972bi explained the coe~-dstence of the two Fredators by
unable to capture large pr.3y, whereas the larger Pisaster car.. P£
mentioned earlier Meng8 fel·t that t...'1e Sa.n Juan Islands were c. ;;uboptirral
environment. for P~ast~~',asit.s preferred prey species is not abundant
there. Hy m~'11 observations indicate that 'pisast~~ is much smaller on
San Juan than t-]lOse co-occut:ring 'Ii'i th ~~~~steriaS:. on: the Oregon coast.
104
TABLE 10. Overlap of Lept:asterias' and Pisaster! s diets in the CapeArago-Sunset Bay inte~tiaal. The nu~b8rs o~~a'2h prey eaten by ali seas·tars from Sunset Bay, Hiddle Cove, arld South Cove a.re compa.red.
--===
Pl.-ey SpeciesPisaster
Numbers % ofTotal
___ L~2tasterias
Numbers % ofTctal
Tegula funebralisBalai'1.us glandul~
B. cal:iosus_. ----_.-Mopa.lia spp •.Mytilus sp.Modiolus sp.Thais emarginataHemigrapsus nudus .Petrolisthes sp.Pag~~_ spp.Idothea sp.Cirola~ sp.Littornia scutulato.Acmaea SCUb..11Tl.... _.....~. pelta~alEcSto~ sp.TOYlicella lineataSpirorbis sp.
._---_._._--
-.., 74 18 9e ..4 5 1749 834 5 12 0.579 11 10 0.472 2 5 0.242 .., 6 0.28.<., 1 4 0.19...0 0 8 0.380 0 20 0.950 0 .1 0.140 0 3 0.140 0 2 0.090 0 124 6.00 0 11 0.50 0 17 0.80 0 3 0.140 0 14 0.670 0 90 4 ..,_ .. .c:.
--_....__.....,_.._._._--_.~-- -----_......
Using the overlap statistic of Morisit~ (1959):
2LX.y.,-_....._. ~
(It + A )XYx yA
x
~x. (x. -1)J.. ~
;:: ~._---'
x (x - 1)
x. = number of ith prey species c-aten by predator X.~
x -- total m:lIIlber of prey eaten 0Y predator X.
Using raw nurobers:
using propo17tions:
c;\ = 3. "l"{;
Ct,... 7. 8~s
105
TABLE 11. Overlap of LeE!?sterias' diets from Sunset Bay, Oregon andLonesome CO'le, San Juan Islw"1d, Washington (Henge, 1972b). Comparisonis made using the number of feeding observations (for Sunset Bay). t andthe nmm)p.r of prey species (in parentheses in the table) for Sunset Bay.
Prey Spe cies
-----------------Balar:~ .glaEEul.5.,
B. cariosus
Hemigrapsus nudus
Pet:::-olis_thes spp.
IdothE;.~ 5p •
.!'aguru~ sp.
J',. paradigit~l~~
A. pelta
l-10dio;~us sp.
Searlesia dira
~ya:wplax sp.
C1:halamus dalli
'ronicislla lineata_. -----
.-..------_._------Using Sunset Bay o'a:ta as num.l-:>er of feeding obs~:tvatjons regardless ofnlw~er of prey conslli~ed: C1 = 93%.,
Using Sunset Bay data in terms of number of prey consuned: CA = 90.5%
106
The lack of competi'don indicated by my data is relatively easy to
explain. In the Lep~terias boulder-cobble areas, several species,
including Pisaster I large sea anemones, mussels, and sea '-irchins! which
are ab~nda~t on i~mediately adjacent solid substrate, are relatively
vulnerable to crushing from the grinding action of the subs·tratum
dnring storms (Paine, 1969; pers. ons.) a~d avoid t.his area. Pisaster
does frequent this area in the quietar waters of Sa~ Juan. This re-
81.,1 ts in ·the observed competitive interact.ion (:Vlenge 1 1972b). Also the
gastrcpod, Tegula funebralis, a prey species regularly consumed by
Pisaster (Paine, 1969) in absence of its p.referred prey ~tx·.!:ilus (Feder,
1970), is missing (pers. obs.) from the San Juan areas i:westigated by
r"1eEge. Th.:'s species is a.bundant in the cobbl':) areCl.S of the Ore'Jon ope.1
coast B.:ld is often consumed by P~sast.er in tllisregion (Table 10).
Competition between Fisas...!-.::E. and Leptastcr,ias on rJ1e open coast
cannot be dismissed entirely. p.~11 investigators of the na·t:'iY."a.l diet of
PiSa~ (Feder, 1959; ::;>aine, 1966,1969; Hauzey, 1966; Mauzey et al.,
1.9GB) indicate barnacles (5 species) as the numerica.lly dominan.t p"t.:ey
U~SG%) • p .~a~ne (l969) found that the barnacles were not preferred p:cey
and not calorically ti13 most impor.tant. Therefore conceivably inter-
spec2f~c competition could occur locally on the open coast where these
epeciss' distributions over.lap.
Discussion
r<lany asi::eroid species ~3eern to feed oppo!"t.nnistica11y I whereas other
SpeGi8S evid-antly select their food from 2..rG.ong a :cest:.::ic·ted group of
107
prey orga...'1.isms (Feder &: Christensen, 1966). Luidic: sars1 fa!: example
shows a distinct preference for certain ophiuroid ~pecie5, feeding at a
very low rate whcrr only "poor" food is available (Fenchell, 1965). There
are great differences in food uptake in Astropecten irregul~is when fed
on different species of bivalves (Christensen, 1970).
The so-called generalis·ts also show some prey p:c:eferE!Uce as was
mentioned for ?-isaster (Paine, 1966, 1969 i Feder, 19'10) a..,d Leptasterias
(Menge, 1970). Menge (1972a) is probably correct however in saying
that., for a given species I variable prey availability accounts for mos·t
of the differences between diets at different areas. However as he and
D~ristensen (1970) point out, prey availability is contingent upon a
number of biotic and physical factors.
Christensen (l970) found tha:: ~si:r<3i?ectel!. In."':;9ularis did not reach
the same size in L~e ¢res~~d as elsewhere because of its peculiar
hydrographic conditions whic~ fail to bring in the larvae of the pre-
ferred prey species. The comp~titive interaction betwe8n Pisaster and- ----Lep!-asterias in tIle Sa.n Juan Islands inhibits .!:.~Et~~_eri~ feeding and
growth. The result.ing smaller preda-tor size affect the prey a-"ailable
to this species (t-ienge r 1972b).
Physical environmental factors ca... have more di:cect effects on
feed..i.ng. PopUlations of Pisaster eat much less in relati-vely unpro-
tected intertidal areas than in areas better protected from ,..ave action
(Feder I 1970). During stormy periods -che sea stars attach themselves
firmly to the substrate and do not feed. This same response has been
observed for Leptasteria~ ~.d is thought.to restrict its foraging ability
108
~~d L~US the prey available to it.
Sea star size has been indicated as a factor in prey availabili~=?
in that the larger sea stars a~e able su~cessfully to attack the larger
prey. Paine (1972, seminar at the University of Orego~) showed that, in
Pisasi;er populaticns on the \vashingto:l open coast, mean ind.i.vidual size
decreased as the populati.on density increased. He felt that tr~s had
to do vli-th the fu-nOunt of food a pisaster population is able to extract:
from an environment. Usi.ng this same reasoning one could explai_n the
variation in size dist:cibutionsseen ~,-n Oregon Le£tasterias populations.
As wa5 shewn in the previous section, fficrtalityin the smaller size
clas3es ~s qLute high and is probably continge:lt on physical rather
'G'1an bio::'ogical causes. T~ierefore adult animals reach a :cefuge in size,
not unlike that described for LeE~asterias prey species. Depending on
the deg:cee of post-maturity mortality few to many adults .are available
to exploit the prey population. Because of the indeterminate growth
tions can successfully feed and incn:'ase in s~ze. Increased sh".e
allo"ds the intrOduction of ne~tl pre.j species into ·the diet. The ult.ina.te
size_ a sea. star could rcac~1 i.n ,a given area is dependent on many faci:ors
tha-c are unique tor a given population and an "optimal individual size"
(Eh,,"!:t, 19GB) is eventually established for it population"
In less ey-posed a:i-°eas ,'lith reduced physical stress mortality is
red...1ced. The high pr.::dab:n: density results in intraspecific competition
for prey. The sn~ller sea s~ars eat therefore essentially the same prey
as the a.duLts. 'J~he fir-al reslJlt is a population like that at Sunset
109
Bay.
Paine (1966 .. 1969) has demonstrated that }?isaster can exert: great
influence on the structure of the intertidal cormnunity. L'1. its absence
Leptasterias was also important in a community-shaping role in the San
Juan Islands, especially as concerns herbivorous gastropods 01enge,
1972b). Leptasterias on t.."-e Oregon coast appears to hav'e li.ttle in
fluence on the intertidal conununity as its two main prey species, ~~
glandula and Littorina scutulata both have high turnover rates and re
tain breeding populations in high intertidal refuges.
REPRODUCTIVE BIOLOGY
Life history patterrEof different organisms vary w.idely. Factors
such as the time of first reproduction, number of rep.coducthle efforts,
type of development of young, clutch size, et.c. all determine a pattern
for a given species. Ti.,is pattGrn is a reproductive strategy, a..ld it:
is a function of enviroTh~ental conditions.
In marine benthi.c invertebrates t,he chief enviromllsntal conditions
to contend 'i..Jith are physical properties such as cu:=-rents, '''ater bem
perature, and salinity f a..-:d biotic properties such as availability of
food for larvae and adul·ts. time exposed to predatior.. in the plankton,
etc. The brodd overly.tng 'themes 017 ro<:production in be,nth.ic invert.e-
brates have to. do irlith ·the tir.:t6 spent. as larvae e.nd the mode of larval
development {Thorson, 1946, 1950}.
Thorson (1950) defines f01,1r basic types of 1o.:.c\13.1 de',;elop;nent as:
(1) non-pelagic breaded embryos that are nourished by yolk and emerge as
juveniles i (2) lecithotrophic planktonic larvae ";hich deirelop from
larg i'::, YCilky ~ggs I ne€?d no food a~(1d a.!:€: ablet 0 spend. a long time in t...'1e
planktofl; (3) planktotrophic larva',; ·Ilith i.1 10:1g pel<O'.gic life {2-3
mor!~:.hs), vihich ma.ke up 70% of all Il',arL".e invertebrates in recent seas;
and (4) plc.nktotrof'hic lal:va,e .....,jt.h a short pelagic life which undergo
li·t:tle grO'tlth and develo.:;,me,nt dm:ing the pelagic phase in which the. time
spent in the p1ankton va:cie,;;; f~:Oill a fa;" hours t:o a few days.
no
III
Particular reproductive st:r.ategies utiliz2d by marine invertebrates
characterize geographical areas. lit the poles 95% of all species 00-
velop without a pelagic phase, while in the tropics 80-35% of species
have long-lived plank,totrophic larvae. The intermediate temperate areas
have a mixt.ure of types of larval development.
'1~1e Genus Lept,aster!.2:§. has a circ1Jffipolar distribution, and the
majority of species produce non-pelagic brooded embr:[os and provide some
type of parental care (Hyman, 1955). The broodir:.g bel::avior of
In this c.'bapter
Lhe dynm~ics of ~ept~eria~' repro&lctive strategy of ~rooding will be
presented in b~,nns of the i!ldividual brooding female and the local
population, and its significance "\..111 be di,scussed.
Hethods and ;'1aterials
~tasterias' ~nnual reproductive cycle was followed by calculation
of monthly storage organ (pyloric cQecae) and gonad indices for the
t..~ree main study popula1.::i.ons. '1:he indices consist of t,'1e ratio of the
organ wet ,;\'eight to the ,,,hole animal \'!et. w(~ight. The monthly sample of
8-12 adults usually con::;isted of the first adults eno)'1J11'tered dm:'ing ,the
population CeflS1.'.s in tr1e middle of the month. ':'hE-~ animals ~Nere taken to
'until the indices were ci':~lcula:ted~ u3Dally v-lithin 2·1 hours of collec-
tion. :['h.e se'j. :>t.ars .18:nl d31np dried wi th paper tm~els, \.'""ighed and
dissect'3d i the gonads and stonl'Je org'.i,tls ,,;ere removed &nd ~'eighed~
These indices "..ere comput.ed fw,' an 18 month. period t Sepb=.•;ID:."r 1970 to
112
March 1972. and recorded two cycles of rapid gonadal increase 8111 sub-
sequent Ciecre ase with spa"wning.
In January 1971 just before the onset of bY.'ooding, sa"T.ples of 20-
30 sea stars were collected from several popnlations. Tne females in
these sat.Ttples were used to estimate the n'1TI'J)er of eggs prod1lced by an
individual female. These females were weighed, the ovaries were dis-
sected out, and the number of mature ova found viere counted.
During the 1971 brooding season, which lasted from early February
through April, a ",eekly sampling schedule 'I.as followed. Each week r..he
three main populations were sa~pled and the first 10 Drooding females
encountered were collected along with Uleir breads. On aJ. te:tnate weeks
the populations ..,ere censused to discove.l- the percent: of adults
hrooding; t.::b.is was done by searching the 3tndy area unt.iJ. at lea.st 100
adult: animals "lere found: and their acti·vity f i. e. breading, fet:;di ng f
etc. rt:;corded.
The ten fei"'1ales collected each week from each population were
placed in nl.llilbered glass containers with a s:nall aIl10unt of ssa ";o,attn:: and
tr;;u-,sported baC:.;: to t:he laboratory at Charles·ton. P.erE:l each female "ras
daJ.TIp .d.ric.d and weighed -,liith her b.-cood in· pla.ce in· the brocd pouch a.nd
then re~elshcd wit, the brood removed. In addition to t.he weight. of
the ;female, t:Le dia.IL\eter of the disc (r.> aIld the radius {R) from the
center of th~ disc to the tip ofth.:= arm "'1ere l11e.~.sill:ed. Fro:n the v]E:ekly
samfole ::>f ten females t...:hree or four were subsampled and 1.:89d to calCtl-
late stor:age organ indices i the rt:;maining f~males i;,jere maintained at
Char.lest!.:m until t'la.y 1971 wh'Si': they ...16re transpo:::"ted to Engene for
113
laboratoxy growth experiments.
After the brood was taken frma the female, it was placed in a
nurrtbered vial. Each brood was examined microscopically t.o determi.ne i·ts
development.:al stage and then preserved in fonnalin. 'Ihe developmental
seql..t.-ence of ~casterias as described by Chia {l968j was divided into
eight developmenta.l cates·ories which correspond to the 8 weeks the
embryos spent in.the female's brood pouch (Table 12). Later the number
of eggs or developing embryos were counted and a subsample of each breod
was measured asing an ocular micrometer. '1'his t\'lo-dimensiol1al measure-
merlt consisted of the total diameter of -t.he unhatched egg and the fully
m~ta~oy.phosed stars; in the intern~diate larval stage? the brachiolaria,
the measurement was made at. right angles ·to the brachiolarian axis F
across the vlidest part of the lar.ral b::>dy (Chia, 1968b).
In addition to the e1ree main study pcpulation~ othe~ populatio~s
were sarr;pled less frequent.ly during the 1971 brooding season. 'rhe same
sa.-np1ing q.nd measuring procedures t,>jere used for th.::= females and thl~ ir
broods.
D\..tring the 1972 brooding season .. ~vhich also corr.:nenced in earl:,
Februax:y and lasted into .i:"lay I a different sd.TI1pling sohed"_11e vias f01-
lOY-Jed. Durin.~' this pe.d.od the Hi-ddle Cove and Sout.h Cove· popu:':.a.-tions
\olere s.amplodt:::n:ee tiJ,es and th~~ Snnset Bay populations fOlIr I.:J_m~:s. Fs-
:males were r.ollected usincJ the sane sam?ling tech>1.iq'..l'2: as in 1971, Lut
lar'Jec:: samples "'dere taken. The females and their broods ,,}ere handled in
th8 m.::.i1n2::'.:: previously described. [or ·the 1971 breoding season. At the
end of t_he 1972 brooding season t.he females were i:et1.1nlEd to their
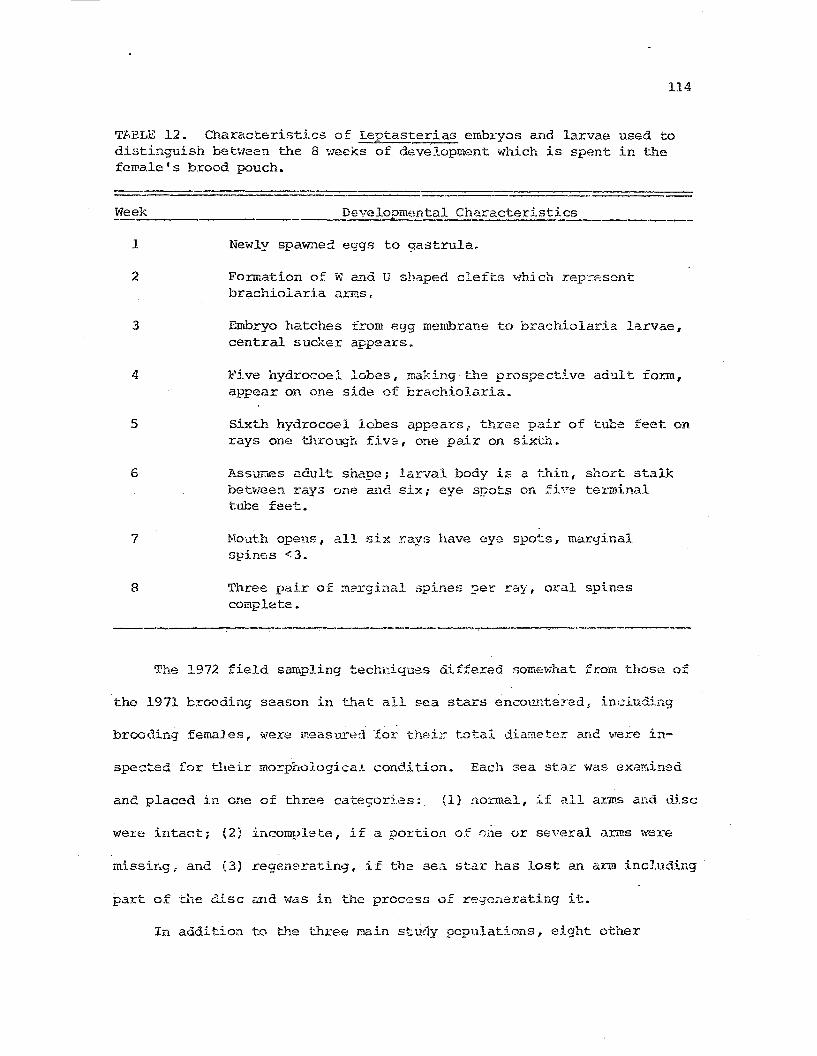
114
TABLE 12. Characteristics of Leptasterias embryos and larvae used todistinguish between the 8 weeks of development which is spent in thefemale's brood pouch.
t1eek Developmental Characteristics~---._--_._-----:::...:::...:.-=-=:.::£==
1
2
3
4
5
6
7
8
Newly spawned eggs to ~astrula.
Formation of v, and U shaped clefts \'!hi ch rep::::esontbrachiolaria a~~s.
Embryo hatches from egg membrane to brachiolari:::. laL"vae,central sud:er appears.
Five hydrocoel lobes, making the prospective ad:.llt form,appear on one side of brachiolaria.
Sixth hydrocoel lobes appears, three pair of tube feet onrays one through fiV2, one pa.ir on sixt.h.
Assumes adult shape; larval body is a thin, short stalkbetween rays one and six; eye spots on £i"2 te:l::mina.ltube fee'!:.
MO"<1th opens, all six rays have eye spots. marginalspines <3.
Three pair of r!largi:aal sp1.!1es ~er r::1Y, oral spinescomplete.
._-----_.---.-----...,...._._---."----
The 1972 field sampling techl:igues differed somf;v;hat from those of
the 1971 brooding s~ason in t..'1at atl sea stars encounte::n3d, including
brooding females, ~'ere measured-for theL'C" total d.iamete:r. and "ren) in-
spected for their morphoJ.ogica:'_ condition. Each sea star "Vlas exarr,ined
and placed in one of t..'1ree catesori.es: (1) normal, :~f a.ll a:r:ms and disc
weJ::e intact; (2) incomplete, if a portion of rme or several arms were
missir.g; and (3) regenerating. if the se:;, sta.r has lost an arm inc1.uding
part ofche d..tsc Zi11d ...,dS in the process of regenerating it:.
In addition to the three nain study populations, eight other
115
Leptasterias populations were sampled durilig t.he 1972 broodi.ng season.
These includo.d popula.tions along the Oregon coast located a::: Brookings,
Cape Blanco, North Cove of Cape Arago, North Sunset Bay, and Yaql.lina
Head. The three other populations '"vere on San Juan Island in Puget
SOll.Tld, Washington.
Each population was sampled as descriood for the main stU0.'Y popula-
tions. All the animals encountered were measured and checked for
morphological condition. All brooding females we~e also measured and a
sample of t-..heir brood. removed to determine developmental stage. The
time spent sampling each population and the number of sea stars en-
countered were used to calculate the relative abtmdance and to o~mpare
the populations. wnen, for a given popula~ionr the developmental
stages of all broods sampled w~re detennined, it was possible to esti-
mate the onset and teLmination of brooding.
A limited amount of data was collected during the 1973 brooding
season for the three study populations. Using the techniques described
for 1972 each population was sampled until 100 brooding f~udl~s had been
encoun·tered. Each female vias measured and a fevi ernbryos '.'lere removed
fJ:c.'u her bro05 to determine the d,.:;,velopmen·tal stage. This was done as
quic~ly as possible, fu~d the female was replaced and allowed to cml-
tinue b:r:oodinq.
Results
The data on Lsr:"!~~_i:".e.:ri..a.§.f reproduction will be presented as £01-
lO....Js~ The gonad end storage organ indices will be compared for the
116
i:hr~e study populat.ions and used to describe the annual reprcx3.uctive
pattern observed for this species. 'rhe data collected just before
sp;nming ,..rill be analyzed for a compar.ison of rep:t·oductive effort be-
tween. populations and within populatiorrs for t ....·o broodins.. season.
The brooding data then will be presented in terms of ~opulation re-
productive effort and synchrony of brooding schedule. 'l'hese da.te. then
will be recombined ~!d aDalyzed in relation to the individual
.Lept.asteria~ female I s size and the developmental stage of her brood.
In the final section, data from the three study populations v,ill be COill-
bined with those for the oUier eight pcpulations sampled in 1972 and
used to describe tr~ reproductive strategy of this species.
Gonad Indices
Male and female J....eptasterias cannot be distinguished from on8 an-
other ex·ternally; thus ·the sea stars used for gonad analysis were c01-
leeted '1..itho.... t kn01.'ll.edge of their sex except during the reproductLre
scaSOI1,
WiJ.en the femal.es c0'.11d be found brooding their eggs. By
e lirJ.inating the SGa s·tars collected. during the broeding season C'..n un-
bj.<':.sed s;;''l.mple is pJ::o".ridcd. fr.o'nwhich deter;;lin",tions of se}~ ratio and
compaxison 0:t m3.1e a'1d. female vll2.ight can be made. '~'he a.verage weig.:Lt.
of male and female sta:-:-s did no'c v<?·.ry s.:LgnLficant. (p>O.2) within each
population a;:ld the sex ratios did not depar·t si::Jniticantly from unity
('I'c.ble 13).
'I'he monthly gonad e...."1d sto:t:a<]e. organ i:ldices calculat.:?d for: the
!ho.les and females of the three study pop:.J.lations drE, presented ir..
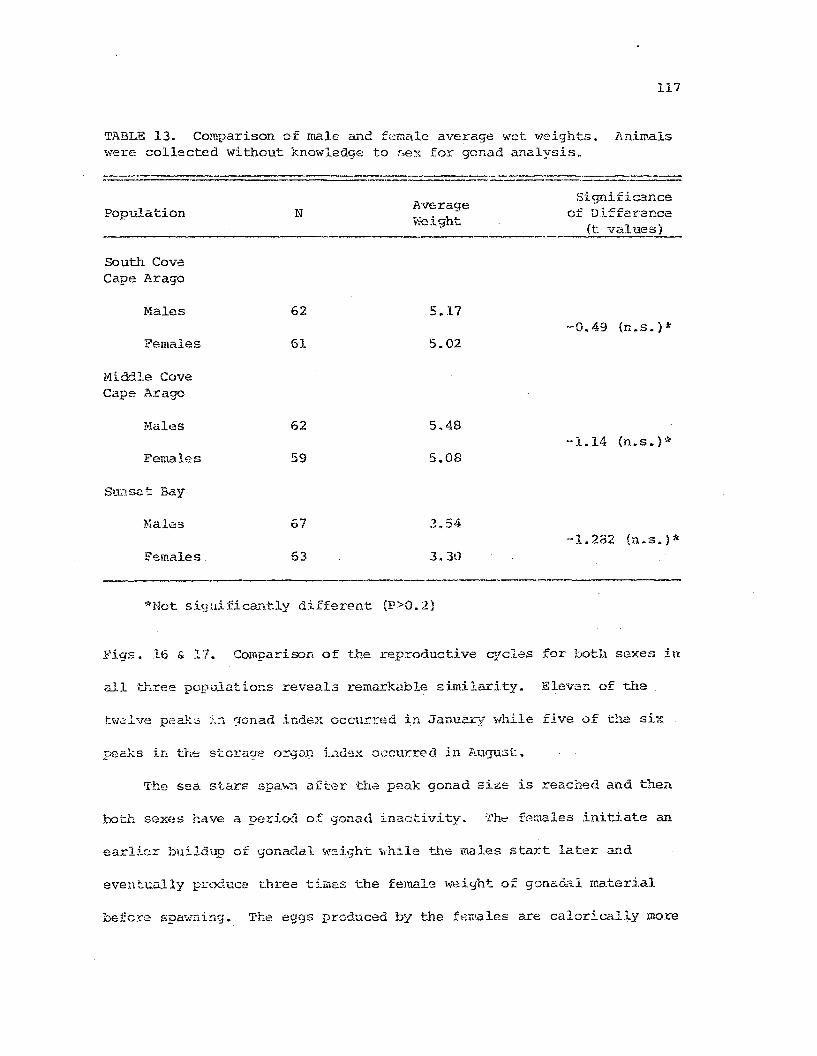
117
T.<\.BLE 13. Comparison of male and femc:l.1e average wet '!leights. lI,nirnalswere collected without knowledge to sex for gonad analysis"
population
South CovaCape Arago
Males
Females
Middle CoveCape Arago
Hales
Females
Su,1se~ Bay
N
62
61
62
59
67
AVE: ragev-Jeight
5.17
5.02
5.48
5.08
Significanceof Differ:ance
(t values)
-0.49 (n.s.)*
-1.14 (n.s.)*
-1.282 (n.s.j*Females 63 3.30
._._----------------------*Not sigJ.1ificar,tly different (P>O.2)
COl'nparisor. of the reproductive C'jc.les for both sexe~. in
all ·three populat1m.s reveal3 remarkable similarity. EIE:v,::T:. of the
twelve peak::: )." ?,onad i'Gd.E:x occurred in Ja•.lU2.ry while five of the six
The sea stars spaw~ after ·tilE: peak gonad size is reached and then
both sexes have a period of gonad inactivity. 'l'he females initiate an
earlier buiJ.dup of gonadal wsi9hi:: while tl1e males start later and
eventJ.:iJ.lly prod;.;;.ce Lhree ti.mes the femal~ weight of gonadal IUa.teria.l
be:rc:cS' spa,.{ni~·..g. The eggs produced by the f~males are calorically more
118
Fig. 16. Gon&d and storage orgro~ in0~ces for male ~eptaster~as from
the three study populations from september, 1971 to February, 1972.
Sywbol code: triangles = gonad indices; circles = storage org8n
indices.
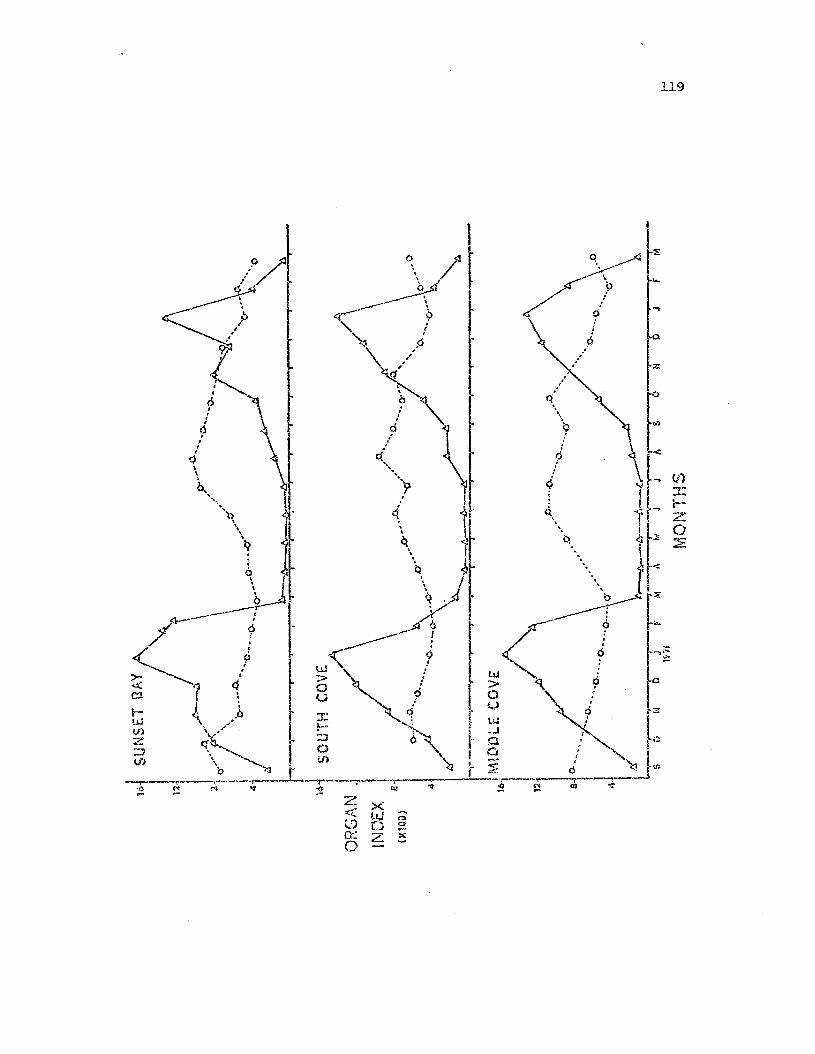
••(.$.,,
d.I,,
Q\\
b."
to,
119
120
l!'ig. 17. Gonad and storage organ indices for female Leptasteria.~ from
i~e three study populations from September, 1971 to February, 1972.
Symbols are the sarne as in Fig. 16.
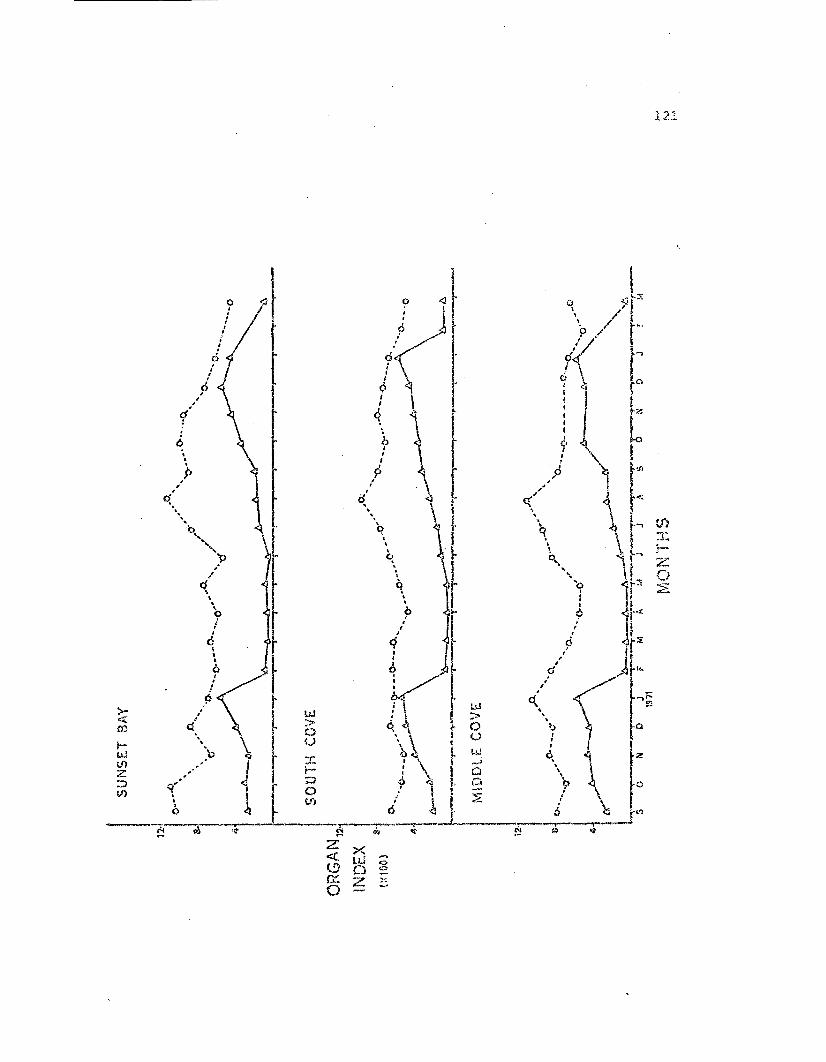
..,P
~
~~'"~b
""~~y
cJ.."\ ,
\
9I
6I•6I
I.l)I
I
0.'.,..:b
122
eA~ensive than tile male's sperm (6-6.5 Kilocalories/g for eggs; 4.7
KilocC'.lor.i..es/g fox: sperm; Henqe t 1970). However, because the females
produce less gonadal material than the males, they do not cause as
severe a drain of their storage organ reserves during the period of
repid g~~etogenesis. Inst.ead they ut.i lize these reserves gradually
during t~e broading pericd. ~~ile the females do not feed during the
brooding season, the males forage at a lew rate and begin to replenish
their Sl:orage organ reserves. With the onset of spring and through
early surn~er both sexes feed l and the storage organs reach their pe~~
and then declin~ as another cycle of gametogenesis commences.
Despite their differences in size structure all three study popula-
tions have similar peak gonad ina.€:y. V;J.lues. This sU(j'gested a rela-
tively lir.(Hr relationship l...,et'Jeen sea star ,.;eight and reprode.ctive
effort. To tes·t t::1is ·the m;;tles collected in DecE.:mber ] 970 'and ,,'a...'1uary
1971 wel~e con:parE;d. Hegressions of tes·tes weighc. on seCt s·tar weight
tNzre COlr,parnd and indic'3.ted significa71t diffe-rences between the popula-
tions (Table 14) a:thJuqh the regres3~on c02fficients were very
similar. Cr:efficients of allometry (l-\.llee at a1., 19(19) v;ere calculated
fro:u t11(. l':Jgad_thrns of testes ",rei'Jht and sea st.a.r vleight using-
BarLlett',:;; lea.st squ5.res method (Simpson et al., 1960). These valu;:':G
cra01e J..5) ir;dica3:e a condi)=ion of positive allon~et:t:y in wb,ich the
geometric ):at£-, of ilicrea,,=~e in gonad \-leight is great.er th3J1 tha'c of body
weight (Si:;;,pson ct aJ.• , 1950). Comparison of male reproductiVE'': effort
bet""::oen 1971 and 1972 brooding seasons was not possible necause of ·the
s:r.:ll1 n::Ur:':':)er of males so1l1pled ir.. 1972.
123
TABI..E 14. Comparison of peak male reproductive output in 1971 fort.hree study populations. Linear and expone!l"tia1* regression equationsof test83 weight (y) on sea st~r weight (x).
===:;::-===;;::-:::;::-;:;:;-:;;::-=-_.====;:
Popular.ion NTestes W;ight on
Regression Equai:ions. S.;.e;...;.a ~_tar J;'i'eight
.1-1iddle CoveCa.fl€: Arago 15 y .224x .541 y 046
1.61.. ~
Sunset Bay 23 y .235x - .227
SOuth Covecape Arago 10 y = .22x - .397 v = O",-6xl. 62
.ol. • ..,
*'1'11e exponential regressions were calculat.3d by linear regressionof log x and log y.
Tll.B:...E 15. Campa.rison cf prebrooding females from four populations forn1..:~.:.--r.bsr ()r :a:nature eggs in tt.":leir o~ra;cies. H.egr~3sions of eg'J rl1...L"TPLe:r 011
female -,-;eight "v-lere compe.red.
Population NHumber Eggs Correlation
gram body Coefficients Combined*weight ...;(:...r-:}:.-. ..__Regr~~ion Eq~lQ._!:i,:?~
Nort:.h Sunset 26Bay
South Sunset 13Bay
~li:1dle Cove 22
Scutl'l Cove 15
128
103
106
86
.85
.75
.87
.76
**y - 113.1x - 29.77
'~No significal'lt differences between regression equations (p>O.2).
i"~y ,,: number of eggs, x = Height of female in qraxfls, r == 0.86 I
S ,,,, 121.6Y,7..
124
iI-he females sampled in ,Tanuary 1971, to provide a prebrooding egg
count ·,.;ere taken from the three main populations and from the north side
of Stmset Bay. The weight of the eggs, estimated from brood weights,
was subtracted from the prehrooding females' whole wet weight in order
to ~ompare them ro,d brooding females for egg production ar.d egg loss.
Regres-sior.s ,,'ere calculated of the n'.uP.ber of ovarian eg9s on corrected
female wet: \veight. All tile regressions were significfu,t, and when com-
pared no si.gnificant differences (p>O. 2) were found bet...leen tl1e popula
tions sampled (Table 15).
The relationship betwee~ egg number and female weight is roughly
li~ear (Table IS).
see:::ns unjustified.
Scatter is great e::1ough so that a fine analysis
S:"l::~~ the p::::ebroodir.g eg!..~ COffi:.t indicated n.o significant dif-
i<=renc'_~ -l.n (~gCJ production for: a gi'121~ female siz(~ beti-'leeU populati.ons,
·the :jonad index fer f.~maJ.e::o ';'n JanUii:L'Y befcre spawn.ing i\ias co~nbined for
t.he t.hree st1.Kly pcpuli'l.tior.s and 1971 and 1972 da·ta we~·.~ Gompaz:'ed. The
females did r.ot vary sigrd.fL::antly (p>O.2) j.n :n:·?producti·v.? etfcrt for
t:i:le ~~ years r based on gonad i.ndices.
t-.l t.;lOugh t"-D.e mean stor'::~lJ(; organ data folIo.,,: a similar pattern for
~cq.i:'2e of st.:or.::ge ·o.("<.:ran vari<J.bili t.y encountered rendered stati stical
In 1971 stoxage o.rqan indices ..lere cal-
culated for brood:i.r.g ferc:·-::.J.es ';'lith br.oods in all st.ases of development in
:3pen t: broc.ding. Hr.)",,,,,<=;:<rer no sisnif.i~a.nt trend was obsel.-ved (Fig. 18).
125
Fig. 1S. Female storage organ indices vs. the nu..-nf.)er of itleeks brooding.
Each point represents the cOlubined mean storage organ index (+2 S.D.)
of all females examined with broods in each of the eight developmental
stages.
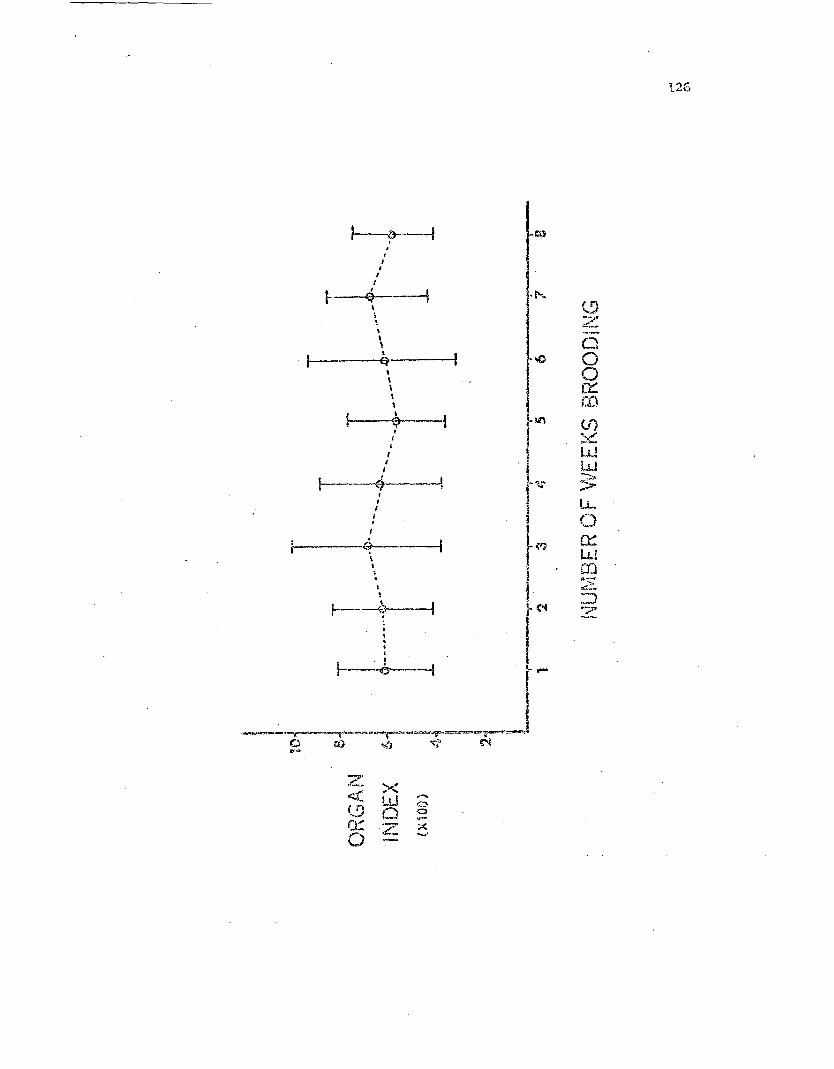
126
...._,.-__~-_~-....,..,-=--.r~-'V:llf~~9l.-.i'_....:et:'t
(") 00 .,.".> ",,'" ("'I...
~-~.,,,,(
}---<CQiT'-~\\\
•,\•Q'-----i
,,,\,
\
,\\\\
t----i&~.---1•I
!I,
II I Ir----a.----,,,
II.
I.,---(+------1
, /--.
z x« LIJi.,!) 0
0 0
0:: Z x0 ......
127
All females fluctuated about a similar mean storage index valur:: r:egard-
less of the stage of ·their brood.
'I'he prebrooding egg count provided an approximation of egg produc
tion. The next question considered was what portion of the adult female
population act,ual1y prodl::.ced broods. Data from three sources support
the viell t.hat in t:.l'le three populations st:udied, nearly all the adult
females produced broods during the 1971 brooding se<:tson.
In the dissec·tion of 80 females for 'che January prebroo-.:iing egg
co;;;:"'::: ali the female,s had niEtture eggs in their ova::::ies; sever'z..l had one
or. JnCX;2 rays completely l.:l':;king o',raries or -,vit.h und~,veloped oVari~)5,
but all had t:he majo~d.ty 0': OV2.1.·:Les fi1.1ed '",i·th !nature ova. Bi-vleekly
fiel.d s<."'..mpl.J.n'J ~;o determine. the percentage of adults brooding shm..;ed a
11laxi"n.1m nE:3r ':;0% (the m<'.ximu!i1 al1o....7ab)e \l7ith a 1:1 sex ratio) for the
tnrse rr:c>.ir, .!7cf,)1l1e.t.i.ons (Fi.g. 19). These observed maxima also occurred
slig~1tly after the pea..~ of breoding j nitiai:.ion (Piq. 20). The final
sonrce of evident::e co;nes frOl<i the gonad index c1"l.ta. Of all adu.lt sea
s~:o.rs collecte.:l dm.·i.ng the 1971 broOl..iiag sea.SOIl for ::"2.1culation of gonad
indices ttl ::: 65) only t.WO WGre females, and both of the 5e had completely
e)~l")':.."!, s,.?a'i,tnf:d.'·o::r'.:. ovaries, similar to those of brooding f3males. It
a::,:p'2ars F therefore I tha·t in t.he three populations most: closely studied
2~. sample of cr:rg-s or embryos ,,-as taken from tb;:. brood of each
broo(iing t"e!1'i<'l.1e co1.1.ected in the 1971 WId 1972 brooding study. 'rhe

128
Fig. 19. Percentage of adult ~eptas~eria~ found brooding during the
1971 brood.ingseason. Each point represents the perc.-entage of adlJ1ts
in the s?mple (N ~ IOO) found vlith broods.
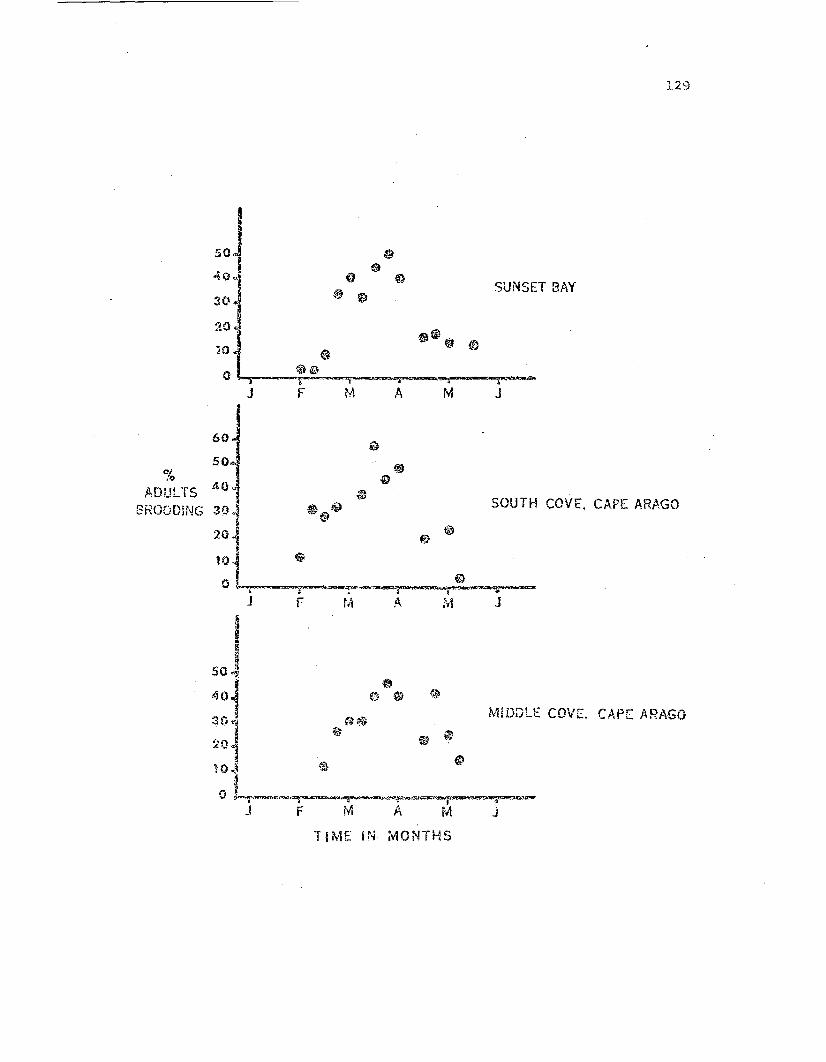
ADULTSBROODiNG
60
50...
f
TIME IN MONTHS
SUNSET BAY
J
SOUTH COVE, CAPE ARft.GO
J
/"1iDDlE COVE, CAPC ARAGO
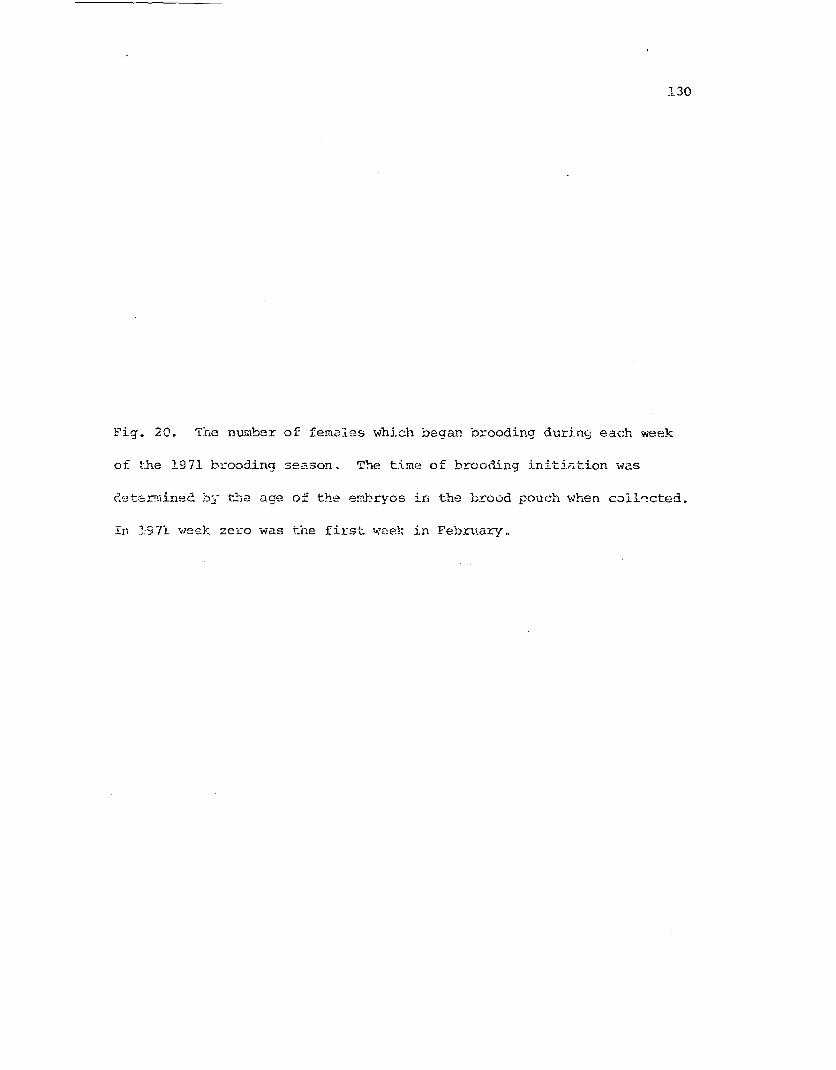
130
]:'ig. 20. The number of females which began brooding during each week
of the 1971 brooding season. The time of brooding initi~tion was
,;'et8r."ined byt.he ace of thl~ embryos in t...':le brood pouch .."hen collo.cted.
In J.:971 vIed:. zero was the first week in February.
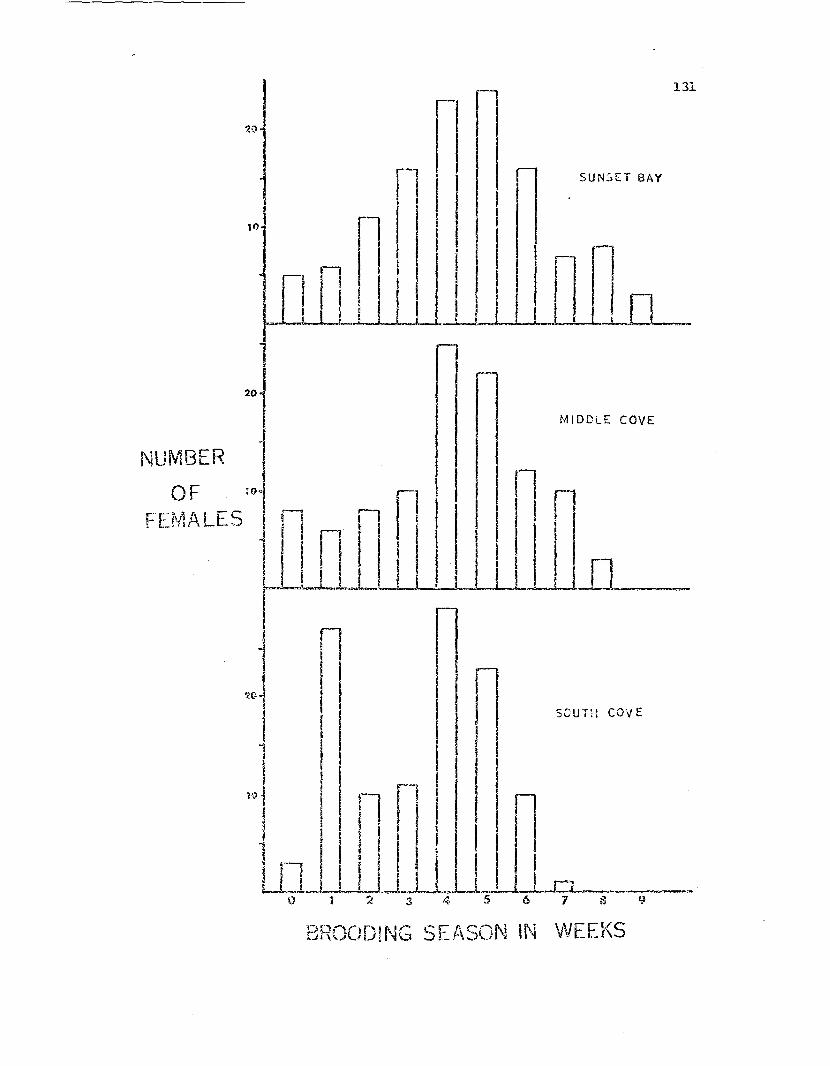
l Ivli DDLE COVE
SOUTH COV E
131
8ROODlNG SEASON IN \NEEKS
132
eg-gs ·"Jere mr"asured, and the mean size for each sa..llple was used to ca1
c'.llate regressions of mean egg (or embryo) sizG on dev~'loprnental stage
for the three study populations. No significant difference (p>.05) in
embryo size with stage was found between popula-tions and wit..0.in popula
ticns for to.'1e two brooding seasons (Fig. 21) which indicates egg size
is relati.vely conservativE: in .i.eptc,.?ter~ and that embryo nw:nber pro
vides a good basis for comparison of reproductive effort and success
between populations.
Brooding success at the population level deals with the nurnber of
ne~.,ly nGta::!lorphosed sea stars that are released after 8 weeks of
brooding. '}j1e fact -that these three populations 'cary in size structure,
densi ty, exposure to •..lave action, and sevi~ral other n~speci:.s has been
poin ted out. As a rssul-t one expects the Hiddle Cove population to be
least successful. 1t:"ne-ther it is least successful is not so in1:eresting
as is -the degree of success it Twas able too achieve.
When the 8 wee}~ brooding season is consi(~eredI 2.ntuitively O.le
e~~f-ect-s t~,e grsa·te;~t Ghance of egg 1-::::-56 to occur curing t.he period when
DV,; your.; are hat_ching out of:. th-2irtougl1 i proL€!ctive egg- merrtbrane
{~·J<.-o'.::k 2--'oHse;<. 3} o_nd W:1en t_hey begin to metarnorphose from the
brctchl.olci:::ia sta;e {~'1eeks J and 4) i'lto tlll~ more motil," s-tar form
(~1eeks 5-8). In ",ddi tiar.. Chia (}.968b: pointed cut -that r:.ewl.y laid eggs
do not became sticl~y and adhere to one another until scree time after
}-3.yiag i tj-i·~refore tld.s period also provides a chance for egtJ less and
133
Fig. 21. Coraparisor. of egg and embryo sizes for the thre2 study
populations during the 1971 brooding season. A mean size was calculated
for each brood and an overall mean was calculated for each brood stage
ia eac.h popuJ. 2. t.ion •
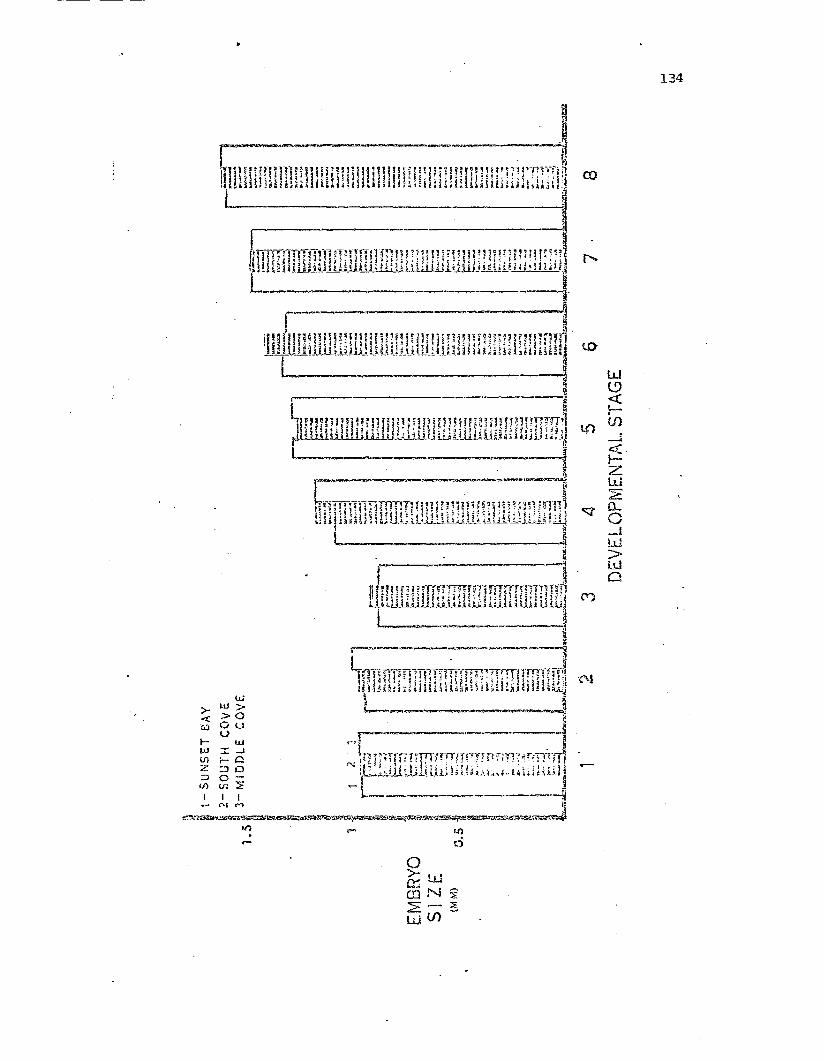
•--"
<C.lZL1J~0...o_1!..tJ>lIJo
134
135
vii 11 be ccns.i.clered in more detc3.il in a later section.
Comparison of the three study populations over the 19'71 and 1972
In:oodinq periods was accomplished by cornputi:r.g mu.ltiple r'~g2':"essions with
egg m1I!lber the d::~pendent variable and female weight and d€-velopmental
stage of the brood the independent variables. The multiple correla~ion
coefficien-ts were significant. (p<.Ol) fo!: all three popul'3.tions in 1971
and the 56cond independent 7ariable, developmental stage of the b:t"ood,
si·~n ificDnt.ly .::-educed the Yariance of the dependent variable (p< .10) ;
the 1972 brooding data \veretoo variable to allo>-l significant correla-
tions. The ·t~l:ee populations were used as treatJ."lents and the 1971
broodin(j" data ,;~e:ce Gcmpared csing a multiple covariance analysis (Steel
£ Torrie, 1960) ;..'hich indic:ate<..~ no sisnificant difference between popu-
in f~<Jq loss for females of ~:rl!~ se..me
size -iij..th broods in the s,ur.e s·tage.
To o""-erceom2 some of the variability in the data and to give a
:r9pr~sentat_iVt=: idea of comparative broodi.L1g success I t.he development.al
sequence 'va,7 cit vided in·to four 2 :....esk periods ar,a. thIS mean ratio of
GrrJJ.;::-yo numbe~: 'Co fer.:a.le ..../eight was calculated. f0~ the 1971 dat:a {Fig.
Kit-en. w·.~;.7:_h ·t.~'1.i.s h:mping Qf do.to. the great variaLilii:y of reproduc-
tive ~uecaS3 is still evident. HOV7ever, other ~oint.s can be made. '£he
Chi.a (l966a) sug':jGsted the mot:her star
aided l-;er yop:;,g .i.~1this pro:::.8s.~ by t:lechanical mnnipulation of th~, brooe.
1.36
Fig. 22. Reproductive SUGcess of Leptasterias from the three main-study
populations for 1971. For each population the data are combined into
classes co~sisting of two consecutive developmental stages and the mean
number of eggs per gra-rn of female vleigh-t fox: ea~h class is given.
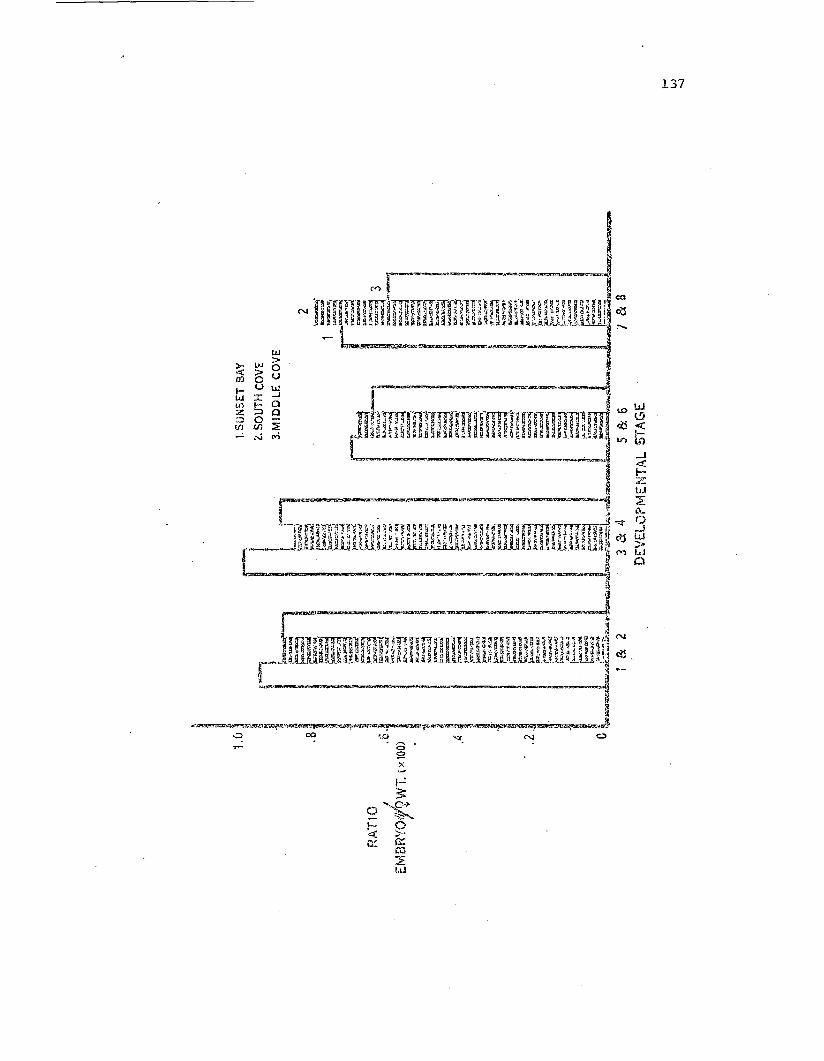
lJJ
>- IJJ :>-<C > 0m 0 uI- U lJJlJJ ..,.. ....J
lfl ~ az .-J a~ 0If) if) :::E
C') )""e_...... ""-.:~~:~~~
n-"TiIDmi-m-rr-'T!l-nf'm-~F!!f.~~¥~"&~" co
N JUh!UBIHh~Udnl~UB~~!i~HihUJ1~i~h~I~ as~L ,:--..
'. ~aB&S!i#~"Sti'Ml'l:~~~~~~· .
>:.-
137
138
embryo waste is caused by the ernbryosthemselves, once tohey become in-
dependently motile. The most impressive feature of this illustration
is th3.t, even v,rith substanotial egg loss and embryo \vastage during the
brooding period, the r1iddle Cove population was able to ~'elease over
half the eggs produced as metamorphosed stars.
Broodi~g synchrony between populations was compared by assigning
each brooding female collected a pair of nw.mers vnlich corresponded to
the vleek it was collected a:::l.d the developmenor.al stage of the embryos in
the Draod. The first week of brooding season was designated week zero,
and s~)seqt:ent w£eJ.:s were numbered in order afte~: this. ~C'he numbers
or,,~ through eic;ht w,:::1:e uS2d to define t:1.e eight de-;elop'llent:a.l categories
'tlh.i..c~l carre SI)ond to the 8 "Jeeks the embryos spent in the mother' s
Therefore, by calculating the regression of developmental
st.:'.ge onr.h.:~ ,ve>~k sa.-npled for each population, a series of regression
E''1ud-;:ions can be used to caropano: synchrony betw~~en populations.
Reg:cess50n lin<?~s 1."ere calculated and compared fer both the 1971 and
1972 ~)r.c.odit-.S ~;easons fo:c the t:hree main stud.y populations. Brooding
'\I,a:" obser.ved °to begin d~Jring the first: \veek in Februcory for both years
at al.l tl~l~e;:; study sites. Comparison fo:ro both years bet"'-esn t"-iddle and
So;.:th ('c,7es ?'::~lpe ArRgo shQi.,;cd no significant difference {p> .05} in the
or,set and pattern of initi"t.ion ave:.:: tJ16 Dl:ooding seas()1'l. The Sunset
Ba:.' .;::c}?uL:1.tio'1 did s:'m'1 a significantly different <p<O.5} pattern of
brooding ·.."hen compcu:ed to South Cove arLO Hiddle Cove during both 1971
139
and 1972. \~,en t~e individual populations were compared sep2rat~ly Ear
differ~nce in brooding pattern between 1971 and 1972, all were found to
differ significantly between the two brooding seasons. These results
suggest L~at the tillLtng of reproduction is based on relatively local
cues '...hich can vary be·t,..een years.
The annual pattern of brooding synchrony among these three popula
tions is seen rr~re clearly when the 1971 data are transformed to show
the week in the brooding season when each female observed began
breading (Fig. 20). All the female sea stars sampled in the Cape AT.ago
populations initiated brooding itiithin a 9 v-teek period, al,a the pea.k
period occurred during weeks 4 and 5. The Sunset Bay females also
reached ,..heir broediw] peak during week£ 4 and .5, but had a more even
pa.t·tern of DJ::ooding initiation "("hich was spread over a slightly lonse:::-
per.Lod. Ibwever. despite the observed differences, the Leptasterias
popula·ticns in the Cape Arago-Sul1set Bay area exhibit a high clegree of
br':'odin<; synohrony on a yearly ca.sis. 'I'he r1iddle Cove pop1..1.1atiofi has
been observed for four brood.ing seasons and the South Cove and Sunset
3ay popul2tions for three. In each case brocdi~g began in early
£:'2bruari, p",·aked in late ",~arch and c':Jntinued th.rough Apri.l.
'riTe three main study pOi.:>ulations did not vary sig!1.ificantly in
br.Joding :3 11cceSS t and therefore t.hey wet"e combined for comparison on the
'The diJ.-i:a for the 3t13 females observed in 1971 Kas combined .in
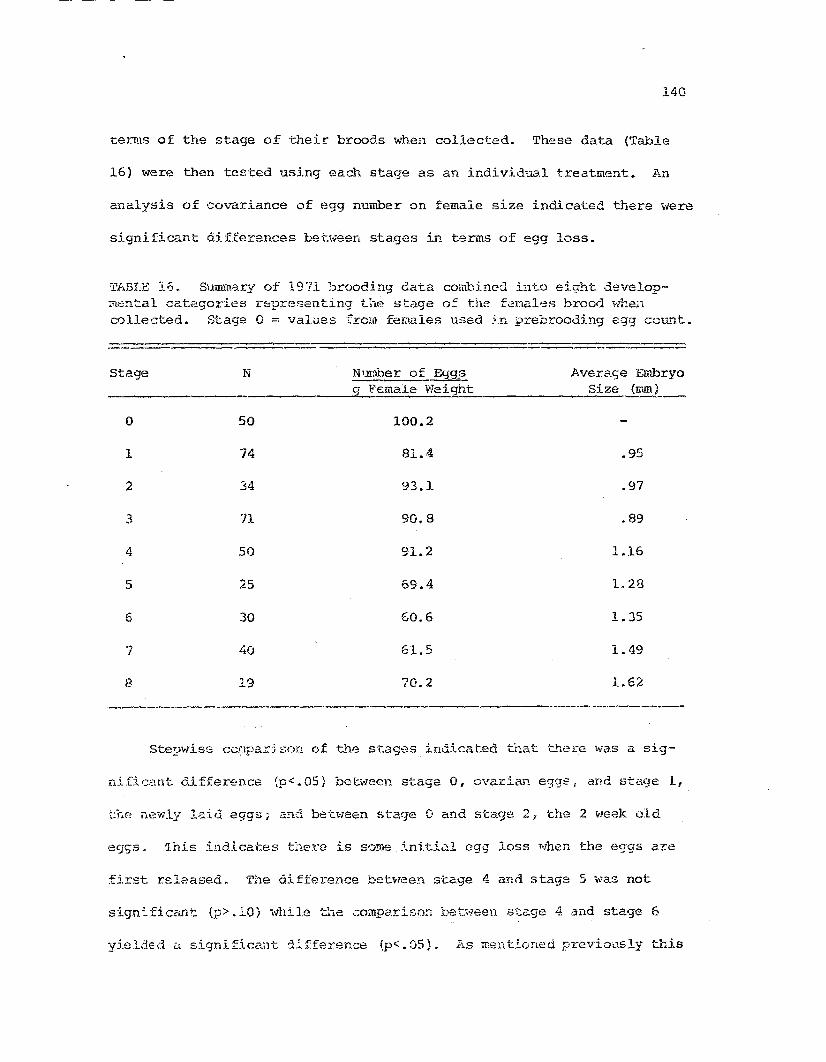
140
tenus of the stage of their broods when collected. These data (Table
16) were then tes·ted using each stage as an individ'.1.a.1 treatment. An
analysis of covariance of egg number on female size indicated there ;vere
significant 6ifferences between stages in terms of egg loss.
Ti.BLB J.o. SUmID.ary of 1971 -:Jr0oding data combined i!1tO eight. develop~l.:;n"t.al categories representing t.hp stage of the fer;W.l'.:!s brood .vhencollected. Stage 0 =: values frolu femal.es used .:in p:tebrooding egg count.
Stage N N'Jmber of Egm~
9 Female Weight
0 50 100.2
1 74 81.4
2 34 93.1
J 71 90.8
4 50 91.2
5 ~.t: 69.4.t!.J
6 30 60.6
7 40 61 .. 5
8- 19 70.2
Average EmbryoSize (mm)
.95
.97
.89
1.16
1. 28
1.35
1.49
1.62
-------_._._...._._-----.--
Ste,:?v-lisG cCI:lpa:;::ison of the stages indicated t~at ·there was a 81.g-
nificant difference {p<.OS) bel:ween s·tage 0, ovarian. eggs, and staqe 1,
the newly laid eggs; and between stage 0 and stage 2, the 2 week old
'This indicates t:ierc is some initia.l egg loss Nhcn the e9'g3 are
first released. 'l'l,e difference bet'lrTeen s·tage 11: and stage 5 was not
sign:'ficCint. (p> .10) '\I/hile '~1e co;npa.riso:::. bet"7een 8t.c:.ge 4 and stage 6
yieldEd ti significant 1iffe:rence (pc;. 05). As mentiorted previo~l.sly this
141
represents ~~e period when the larvae are assuming the adult star shape.
It is also the time when the female n~linquishes her raised brooding
position and becomes flat·tened 3.gainst the rocky substrat1.E!I although
she still remains i~nobile and protects her brood. This combination of
larval metamorphoses wid femB.le movement. evider..tly contrihut.es sig-
nific:lLitly to larval mortality.
On a popnl3.t.icn basis the ffiean size of the embryo ",as not 5ig-
nificantl~{ differer~t for a given stage either bet,veen populations (Fig.
21) 0~ between YP.dY3 within populations. However when mean embryo size
is compared to fcrr-ale weight on a single seage basis there are signifi
cant posi-cive cor:relations (p<. 05) for s·tagp.s land 2. These indicate
larser females tenc. to produc'3 larger eggs. However no siqnificant
co.::-relatioi1s were found aft-e.!." stage 2, alt.hongh all correlation values
ortis infol.:nation suggests l:hat the larger female st.ars .•
lik~ the males, have a sOIilewhat greater initial reproductive output per
'Ihe broooc".ng dai.:a Were resegregated into 19 'Ileight classes based
The weight classes \'lere uSf~d as
t:r-e'cC;.lnent. S'coups p and a multiple regression analysis vlas LUll. on the
0..3,1:0.. Egg rnmlber Kas used as '.::he dependent v.::triable and female "leight
v0.~:'_able;:; .c81:;p,~·::i.:ively. 7he resu.lts ",ere not significa!1t and combining
!1ig':·; de~i1·.20 ':Jf vdriabili ty er.CO'ill",tered ·~;ithin weight classes. Therefore
the d?li."d (Ilable 17) can only ce :~i1·te1::pr:eted on a limited basis.
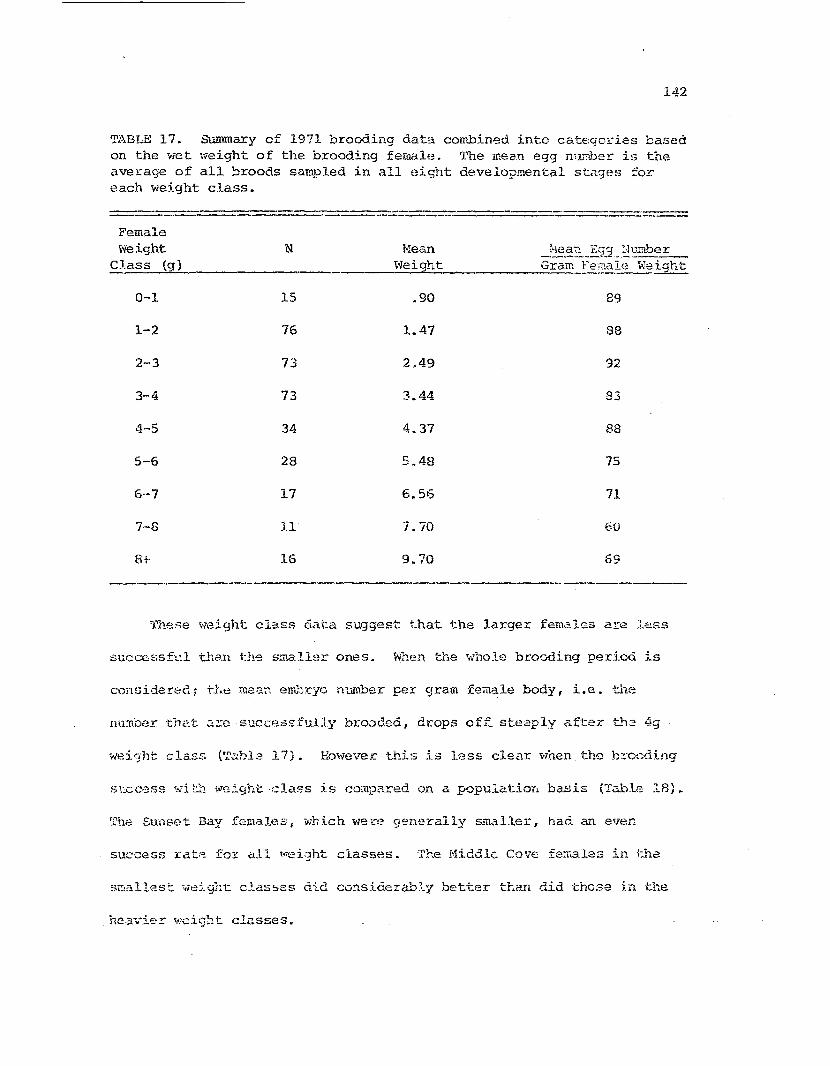
142
TABLE 17. SUl11I!laXy of 1971 brooding data combin~d into categories basedon the wet \'ieight of the brooding female. The mean egg n;lmber is theaveraqe of all ~roods sampled in all eight development.al st.i.'l.ges foreach weight class.
------------,._-------. -----_._-------FemaleWeight N
Class (g)
0-1 15
1-2 76
2-3 73
3-4 73
4-5 34
5-6 28
6-7 17
7-8 11
!'leanWeight
.90
1.47
2.49
3.44
4.37
5.48
6.56
7.70
.J·le.~~_Eg3_.~·~!b~_____G_r_a_m_._!~:nale \\'~.ight
89
88
'32
88
75
71
60
._----------.------8+· 16 9.70 69
~l'hese weight Cb.55 oata suggest t.hat the larger fem;:;.les are less
successful the.n 'l:he smaller ones. When the whole brooding period is
conniden,d; t.he me'3.~. emb:cyc. number per gram female body, Le. ·the
rm:n'oer tlw.t 3.::0 succ83sfully bro;)c.ed, drops off. ste:aplyn.f·ter t..1'1'2 4g
",ei9'ht class (':'able 17). Ho,"1ever this is less clear vlGen ·the b~ooding
s\;.ccess ~'li t:;,1~vei9htclass is compared on a popula.tion basis (Table 18).
The Sunsc·t Bay females, '<Ih ich we ;:'!? generally snk"l.ller, had an even
success ::caVe:; for 0..1.1 ;"sight classes. The J:.1iddle COVE; females in ·the
sr:Lal1.est INsight cJ.a.sses did cO!lsiderably better than did those ii'l the
hc.;J."... ie!: ~.~eign.t clusses.,
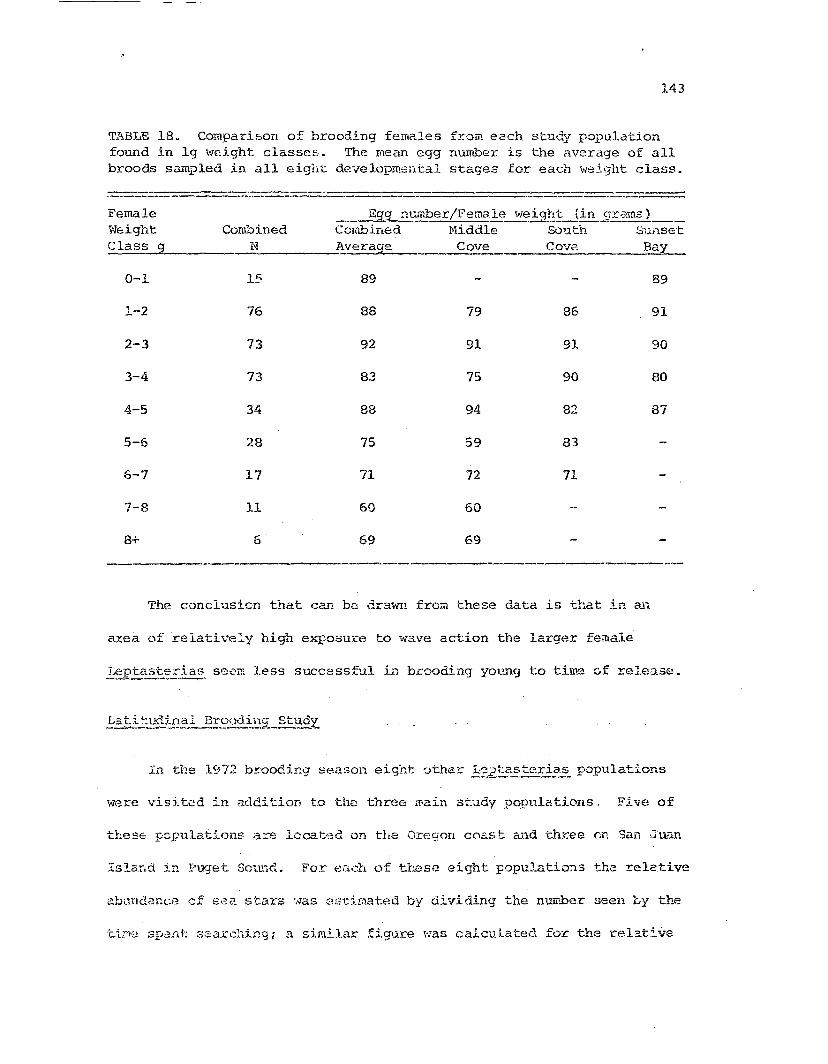
143
TABLE 18. Comparif:>on of brooding females from each study populationfound in 19 "might classes. The mean egg number is the average of allbroods sampled in all eight: developmental stages for each wei'jht class.
--------_...~---_._-.~_______ _..~._._ .._R__~
Eg~ n~~ber/Female weig!lt {in grams)Combined !'1iddle SO',lth Sunsetll:,verage Cove Cove Bay
89 89
88 79 86 91
92 91 91 90
83 75 90 80
88 94 82 87
75 59 83
71 72 71
60 60
Female~'Jeight CombinedClass 9 N
0-1 15
1-2 76
2-3 73
3-4 73
4-5 34
5-6 28
6-7 17
7-8 11
8+ 6 69 69
The conclusicn that can be drawn from these data is that in al.
area of relatb7ely high exposure to ",ave action the larger female
_~...eP~:..r:..~Iia5 S80m less successful in heooding young to time (jf releas8.
In 1~le 1Y72b~ooding season eight other 1~?~~~te~~_~populations
'.vere \'lisited in addi tioD t.o ,the three I£laJ..n st.udy populations., Five of
thesE: p~pulations d.::::e 1ocat<,;d on the Ore90n coast and th~r.ee en San ,J'UC1n
Island in .F'uget Scund. For each of these eight populatio::l3 the :relc.tive
abnndar~c.:"3 cf S,~2. stars ',.;as e:3timated by dividing the nUJ.wer seen by the
,t.im'; sp8.ni": ::-!2:axching; a similar figure \\'as calculated for -the relat:i:ve
144
2.bundance of first year staJ:s (Table 19). Animals tha·c ,lere morphologi
cally da.-naged were counted and 'che p.2rcentage of damaged stars .in each
population J.5 given as a rnainteneU1ce factor value. '.rhe number of fe-
males brooding was also counted ro,a 2ach brood sro~pled. After
exa~ip-ing these brood samples for. developmental stage! a me~i stage (=
time in brood pouch in weeks) vias calculated, and both the initiation
and termination of brooding was extrapolated for comparison bet"'t1f"en
populations (Fig. 23).
'i'llien the onset of egg laying is compared on a latitudinal basis, a
general pat·tern is suggested with the northern populations starting
earlier than those in the south. However the greatest discrepancy in
brooding syn:::hrony ':ias not at the latitudinal extremes but. bet\ieen the
Sa·". Juan Island populations. 'I'he Deadman 1 s Bay po~mlation on the west
side of the island ~~s 4 weeks ahead of the two populations on the east
side. 7his co~dition is typical of San Juan Island (Menge, 1970)~ A
local pat.tern l~~ again !?een in the Cape Arago-Sun3et Bay area with all
fi ve pOl'ula"d.ol1s eXi'!ibi ting essentially the same brooding schedule.
'{":-Ie three San JU3....'1 Islarid populations and the Yaquina H2ac. .9C2ula-
tiCAl 11'01.:1 l,:nv l?e~(,I::entagE"~s of brooding ;:;,dults (Table 19); 11m·;ever ·l:his is
probabl.y jue ·to t.1-teir being sampled during the first mont.h of th,~
:>::iJ:ood.i.n.g seaSCn. The remaining seven populations "mre sa.-npled later
StD.d h;~d considerably higher percentag~s. Al.l eXc8pt the Brookings
popnl",;:::"on approached t.he theorE:tically possible 50 per cent· of the
ad'.l.l·ts brooding.
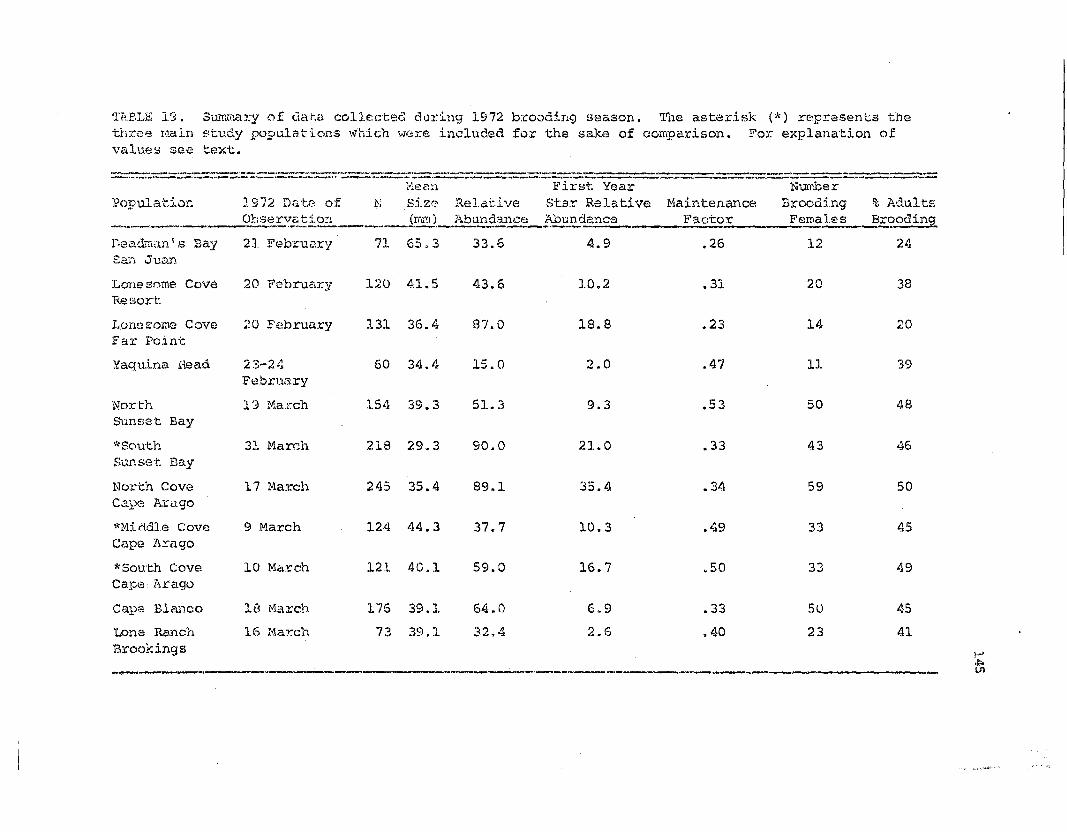
In~.BLE 19. 3urr,rila:t.:y of dar-a colle:.ctec~ cl,.n:ing 1972 b:rooc1ing season. The asterisk (*) rE~P.resents thethJ::'C8 main ~:tudy populations which '-J(..H:e included for the sake of comparison. For explanation of\1't.='.tluBs see text ..
--,..._.:.-.':::-_'--==--~_._---:='-==-'-:"------'---_:::-------:-_- _-:-.-:_---------------..:--. ..- -=-==-=='=-=-~-=-=_.==...l:~irst YeartJ1ean Number
J 972 D;:;."t.C'> of N SiZ0 Relat.ivt'; Star ReJ.e..tive Maintenance Brooding % Adults.__....;;.O,bse~'!!'t1-0:'l _. Jrn."'l)-t~:ndal2£E.:-!~undance ~~ctor _ Feroale s Brooding
Populat.L:m
r:ea.dman~s BaySan Ju.an
21 February 7J. 65,3 33.6 4.9 .26 12 2 A.~
Lonesome Cove'Rec.;ox..t
20 Fc'brua:r:y 120 41. 5 43.6 10.2 .31 2 '''\.V 38
LonCZOlne CoveFar Point
20 Fi~bruary 131 36.4 87.0 18.8 .23 14 20
Yaqu.i.na Head 23-24February
60 34.4 15.0 2.0 .47 11 39
NorthSunse·t Bay
1 J ~fl"al~ch 154 39.3 51. 3 9.3 .53 50 48
~·S0ut.h
Sunset Day3}. March 218 29.3 90.0 21.0 .33 43 46
North CoveCape Arago
17 March 245 35.4 89.1 35.4 .34 59 50
'~~liddle CoveCape Arago
9 March 124 44.3 37.7 10.3 .49 33 45
*Sou'th CoveCape A:cago
10 r-'larc:h 121 40.1 59.0 16.7 .50 33 49
,----_.__.._--~-_._------------- .
Cape Blanco
Lone Ra''1.chBrookings
-"-'-"-
18 C'l.a:r:ch
16 !"1aY:'ch
._----,
1'75
73
39.1
39.1
64.0
32.4
6.9
2.6
.33
.40
50
23
45
41
i-'.::.VI
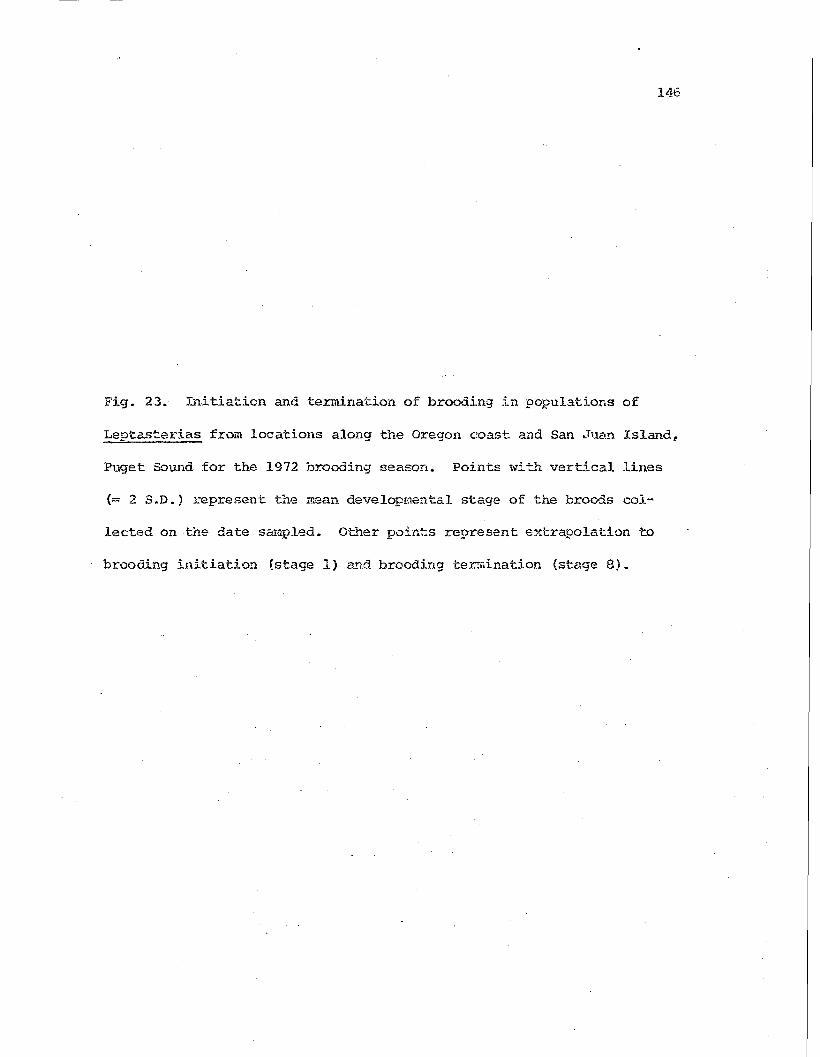
146
Fig. 23. Initiation and termination of brooding in populations of
Leptast.erias from locations along the Oregon coast and San ~r.l()_n Island,
Fuget Sound for the 1972 brooding season. Points with vertical lir~s
(= 2 S.D.) represent the :mean developmental stage of the broods col
lected on the date sampled. Other poin~s represen-t extrapolation -to
brooding initiation (stage l) and brooding ter.:r,ination (stage 8).
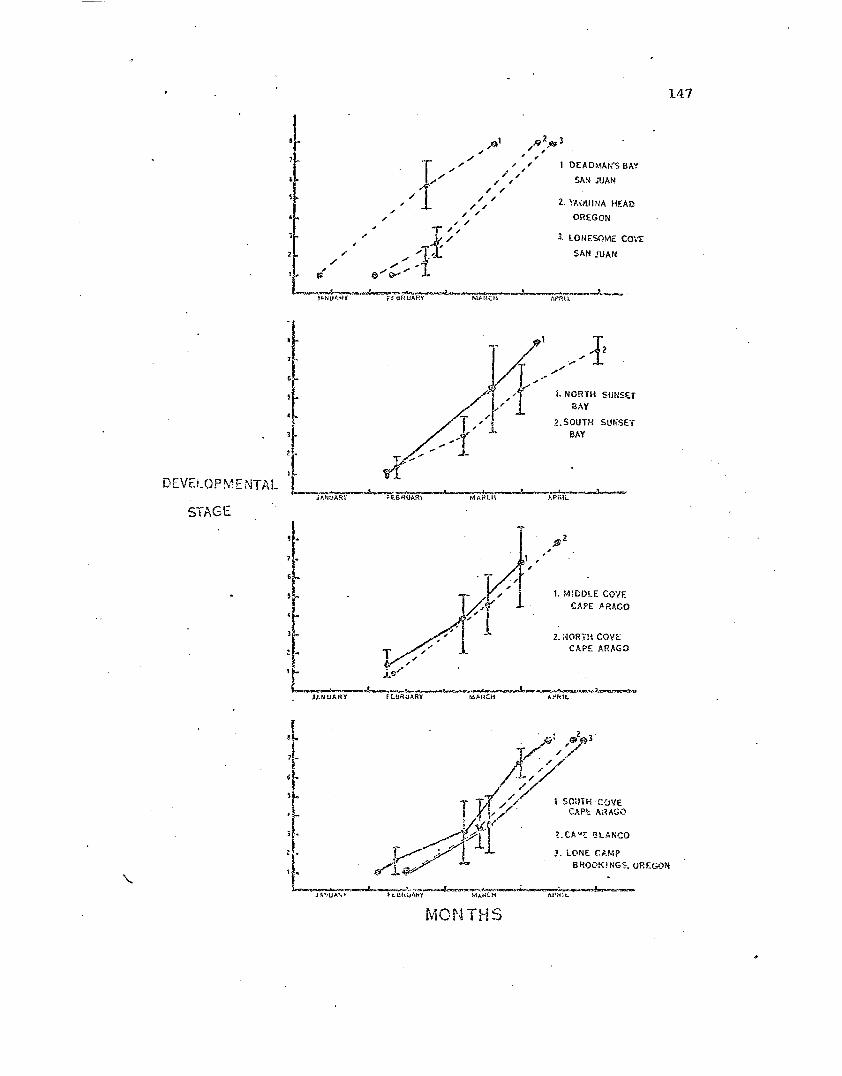
DEVELOP:v~ENTAL
STAGE
2. SOUTH SlINSETBAY
147
MONTHS
148
The remaining data collected during the 1972 brooding season. are
sOI:1Gwhat confusing, though thare is some consistency. The t'i',70 popula-
ti-:::>rlS ,V'ith the lowest relative abundances have equally low relative
abunde..n.ces of first year stars and generally high maintenance factor
values which suggests these are marginal populations.
'.rhe three San Juan Island populations have very low maint.enance
factors indicating the calmer situation which generally persists in
Puget Sound. The Deadman I s Bay population is in ·the path of \'lave trains
entering through the strait of San Juan de Fuca and the low maintenance
factc'r value is probably a function of the extremely robust and large
individuals which are resistant ·to morphological damage and charac·-
terize this popula·tlon.
'f11e relative calm conditions of Puget S01IDd allow ~i~~~;_~:..E ana
.!:':-eptast~E.ias. to overlap significantly intertidally. As mentioned earlier~
r!;.en:;e (1972b) presented com;irlcing evidence that when l,eptast~ri~~. dnd
co-occur in relatively high abu.ndance there is C~>11.pt3tition
for available resources. The end result is that the Lep.tast:eri~~ are
kept at a sw~ll individual size and thus are unable to capture larger.
pre;,". 'l'h8 c.iue:3t.ion arises 'lra'c vlould t.he effect of t.his cGInpetiti.vE:
j.>F.J~:a,ctic;·.. t.e on ~t.asteri~E. reproductive ability. Menge (1970) d.id
••Oi: adores.:: hj.mse:~_f to this question.
'l'he !~IY~2~?~er~~_population at Seal Rock, Oregon perhaps can pro-
C~-;.'.J5::. ar~ anS'''1ej~. This pG!?t11ation, vlhich 'tlaS sampled during the 1971
b.ci)coing season, probably re;?resents the extreme case C . h .o:c t:. e PJ_sast.er.......
.!-,ep~:9_3t:?riE..::::. i..nteraction. becau.se of mlUsual current conditions or for
149
some other reason, large numbers of Pisaster had se·ttled out of the
plankt:on at". Seal Rock for the past several years. There ~"ere many first
&~d second y~ar ~isas~~ in the boulder-cobble area typically inhabited
by ;Leptaste::;ias but avoided by adult ~ast~. Very fe,'1 Leptasterias
occurred wir~ the small ~isaste~ but instead were in small depressions
on t.."1e :roof and side of an undercut at the base of Seal Rock adjacent to
the bould..:;r···co;:'ble area.
These sea stars ...,ere small, a..'1d \<Jhen several ir1ere examined for
gonad development L~e m~les were found with active sperm but with testes
much smaller than those observed for males i.n Cape Arago populations.
Only one of fom: female examined had fully de7eloped eggs in her
ovaries, the re;r,ainder had very small eggs or none at all. Those fe-
males with broods ir"ere ·small, ."lith a mean of .1.7g (ra.'1.ge 0.5-3.8g, N
24), but had a norr:.>i;~l llllil1ber of eggs for their bedy '/leight. HO'i-,6Ver all
the broods \.;ere in very early stages of developme:nt while the other
coast. pcpula:cions observed had been brooding for 2 months. Per-haps
tion reproductive effort is reduced a:1d the; or::.setof brooding is de-
layed.
11?cted du}::tng the 1972bJ::ooding season (':L'ab!.e 19) lend some support to the
ea.rlier st.aV"d ;·l"lpcn:.hesis that a pop'Ldation \,-lith a lO~ve:r density r caused
by Juvenile mortality, ;,,,ill allor,·1 the surviving adults to exploit more
~ • 't • ., .,
f.rjr~.1.cn \v1~ 5.. result in larr;er 3ized ind.i..'lid-
150
uals; more dense populations are held do~~ in individual size because
of the intraspecific interactions. The Cape Arago-Sunset Bay popula-
tions examined in this paper a..'"1d those studied by Menge (1970) on the
San Juan Islands (Fig. 24) are the best knmm and provide the best argu-
ment for the hy"pothesis.
The Deadlnan's Bay population on the west side of San Juan is sub-
jected to relatively severe wave action. ~here are no Pisaster present--_._-'.and the .L.?ptaste!}-a~ reach a very large size. Anotller V9.r.y similar
population, "lhien I ~'as unable to census ,is found at Cattle Point, also
on t.he "'lest side of Sw.. Juan Island (Menge, 1970). At Deadman is Bay
~ept":.st~ri~~density ....-/aslow. The population structure a'1d environ-
C1ent.al cond..it;iol1s observed for this population were ve:l:y similar to
t;';.oze at Ni dd.le cove, Cape Arago.
The pOFd1ation ;:t Lonesome Cove Far Point on San Juan Islanc. is on
the leew3.rd sid~ of the island and there are few Pisaster present as
beey i'!er<~ removed in a p.l~e'itious 'study (Mauzey, 1966). As can 0-2 seen
('I:'ab:!.e l~)) thj.s population i3 very similar to that at Sllr:set: Bay in its
chara.ctel:'istics, and bo·th pOflulations are sirr>ilar to the North Cove!
Co.pe .;:'.ragG popula.tion, w~!.icb. is also in a relativaly protect.ed m:ea \!lith
ThesE: populations all have a high
L;;L:::.~S~~E.;~ densi.-ty, 10i'; i:',aint'~nance £3.ctors and small ir:.dividual adult
The a,')OV2. populationE perhap~,-cepreae!1t the l~xtreI3.es of a con'-
thmw7;of pop·i.l.b.tion S1:.t"Ucture and the ;;lbove stated hypothesis dealing
151
Fig. 24. Size frequency histograms of the eight ~eptasteri?~
populations sampled during the 1972 brooding season. The clear areas
(~~cse size classes Witl1 no left h~.d margin) repr~sent the brooding
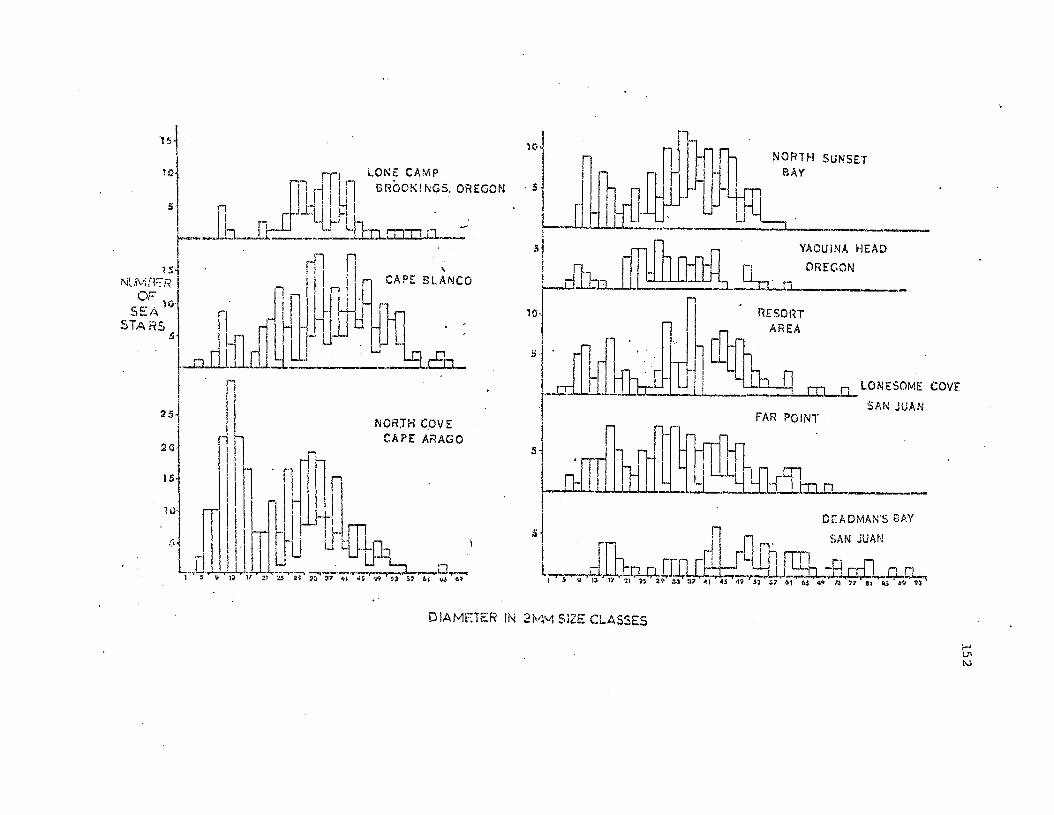
NORJH COVECAPE ARAGO
15~l
10j rn LONE CAMP
i 'l ,~! L1n Sr~OOK! NGS. OREGON
5' n I 'tJ I II III JJ ,- L-l-L' HI ,.-, -\-1., ,I t l-- .1 L~,,, .-'~._. o.._..J..__.__iL~ 0I0lL._I· .
15~ rll n \NUivifFR I . I i I _.., !~'~ CAPE BLANCO
C:F lQ I . Jl r I f'~I1 ~' rSE/:" f" II r
STA RS ,j !~ nl~~ 11; [M] .•t-Dlltflrli.~_ .. __~Cn-I n1 , I
251 II2°1
1
[-I n15 1 I, n ~ rir [l, _.1 UIII
I m I
I II !'rrl~-'Ir-"l{]!;11 II I ~u' p-, Ll~ \1'1 Ill' IU -" ItL,U ! .u...--.-.-. -,-.:-'V'-~ .-....D.,.....
1 5 'I lJ 11 2i :t.5 2~ :13 27 4)) ';S '.II) ::." 57 1,1 W f.9
H:'~ ~ nr,.~ NORTH SUNSET
I ThruI,r BAY
51 .J I lUll l-fTlI LJW lJfLL~, -- L_._.._._
'I rf1l1 rh ,-,~ YAOUINA HEAD
i rt II Ltiill! "'1 OREGON~J.bJ Li ~·_CL
10-! ~. RESORT
5j' rfl ~. ' ncQTh AREA
;_.dili.Lfftt:2 . ,ttl -q CD_O LONESOME COVE
·1 SAN JUAN
I nwlrut fAR POIN',"
51 . - , ~il~~l ~~o__
] . DEADMAN"S BAY
3[ . Il n SAN JUAN~ ! rT_ .. fl t{Ln 11 _'. I""l n..A.Q,~~,.JJ~)~.g;g~.~
DIAivjr::TER IN 2M;\J1 SiZE CLASSES
i-'u;l\,)

153
controlled environments is artificial in tr.at it describes e..ese excep-
tional cases rathe::::- than the majority. The high degree of reproductive
effort and success observed for ·thes':: populations suggests they are
enjoying relati·vely benign conditions. Those populations most severely
limited by biological and physical fac~ors such as tIle ?aquina Head,
Brookings and Seal Rock popuJ.atians should be consul ted. to ccmplete the
description of Leptaster~~ reproductive strategy ana population s~ruc-
ture. In these populations we find l~~ densities wi~h a small individ-
ual mean size and the females, although small, produce a full cOfilplerr.en-1:
of eggs. Some individuc.ls an'! not r:eproductively active; h·::Mever the
majority will attempt to reproduce, although they may have to delay the
onset of re.production.
s~~@ariz~d as follows:
1. Gonad:::..nd storage organ cycles ill·",stra"l::e a well-defined arl.n.u.al
:t"'?productive cycle wi th an irivers'2 relat.::'onship be·t",-:een the tTI'fO
organs.
and do not difflE· sJ..~{liftcantly in ".et w0ight~
3. There; is a lineax· relationship neb;een produci::Lon of gorlad
mat.e.'t"ia.l cLY1& sea· st.a:t' weigrlt fo,"~ botb. ina le ailcl ferrt.a19
4. In t.he populations closely st"o.1diea almost all females produced
h!'oods. In lE,3:3 clos01y wat.ched popaJ..::rtionf:i there is some indica-
tion that sorr..c::: f~~nt~les do 110t 1a.1 eggs eveI."y ¥E':.,:ar «>
5. Reproc.uc·tiv,s; ~ucc(:;s~? is highly variable within and. between
154
populations.
6. During th",~ brooding sequence there is significant loss of eggs
during t:he time of egg laying and during the time of metaniorphosis
from brachioIaria larvae to the adult form.
7. Large females from most exposed locations suffered the highest
mort:ality of brooded young.
8. Timing of reproduction appears to be contingent on local condi
tions although a general trend of earlier onset of b.rooding in
more northerly pcpulations was observed.
9. .Larger females produce somewhat larger eggs.
Discussion
'r-h~:: retention cf young during ·their embryonic development in
specifically adap-ted structures v!ithin or upon e1e body of the parent is
COJ:lID10n among echinode:rms (Boolootian., 1966). Broodi:.1.g behaviaL occurs
in all three o.rders of t.l:le Astexoidea (Hyman, 1955). However, ;.;i·tll the
ex:;ept.ion of the 'Nork done with I.eptasterias (Chia, 19663.) most pub'
'l..ish3d account.s thc:.t deal with brcodi:1g behaviol." are primarily con'::8rned
wLt.~ sj:st.ew:it1.cs (B-.:>olootian, 1966).
C;,i3. (1968) iOlmo. ·thatthe developing oocyte undergoes a slow
growth period which lasts about a year, then gOGS through a 6 month
period of rapid qrm,rth B.nd fL1al1y a "rest period" for about 5 mont.hs
before ~t is spavmed. Chia {1964) reported that maximum fema~e gonad
ir,aic.G:s cccurn~d in September in San Juan Island populations while in a
la'cro:r st'..loy ~erlge (l970) obsex."Ved thl2! maximt.un in October foT. the Sfu-ne
locati.on. Both autho~s reported L~at brooding began 1n January illid
155
lasted through April on San ,Juan.
Chia (1968a) thought t..'le "rest p'=!rL)d" varied in that the gonad of
all individuals reached a fully grown state at about the same time but
spaw.n.ed at different-times, implying that spawning depends on the
availability of proper stimulation from the environment. Menge (1970)
believed that food was the c:l::itical factor; although the gonads were
ripe in late smmner I the animals ir,rould wait to build up energy reserves
before spmming. The data collected Ll this s·tudy do not agree with the
San Juan Island observations. The female ~~.~asteria~ in all three
Cape Araso-Stmset Bay study populations continued to increase their
gonad size l.'.ntil just before spawning. Additionally both male <'md £e-
~ile Le3~~;~ias reached their peak storage organ indices in AU~Jst a~d
these decli-:led steadily to the period beyond the brooding season when
tho stars agair- begin to feed actively.
This discrepa:1cy ~nay represent a r:=al difference in the reproduc-
tive cycle bet:ween the. b....o areas o~': may ~e 81' artifac·l: of d,e small
s&.!nple sises taken in tr.e San Ju::m 1510..,'10. s;.:ud.~.e'3 (Chia I 1968al. 1'h6·
pattern 0:( gonad buildup seen for Lep::aste:d~. in t:11is ctud.:"i is typical
ofth~~ other nOl1'-,b:r-ooding sea st.ars that have l.;een observed: gonad size
iuc~eas~s continuously to just before spo$ning (Farmanfarmaian, et ~l"
spps .. ; C:c~rnp,
a hasic difference between t~esG ~wo repr~ductive types is that ..
.!-~I~3.st:~.!~~a'? £e:"[la168 produce af'p;~cxir.:"3.tely one thLt-d the gonadal material
156
often outproduces the male (Mauzey, 1966; CruJ.TIp, 1971) •
.A. further similarity for Leptasterias and non-brooding sea st:ars
is the invers~ relation between gonad and pyloric cae cae (storage organ)
indices. Fax'manfarmaian et a1. (1958) followed the reproduc·tive cycles
of several west coast s,~a s·t",-T.'S. The pyloric caecae ",er~ largest when
the genads Vier<=! shrunlcen end became reduced as the 1at:ter gre'ti in si::re ~
Hauzey (1966) showed further that in Pisaster ochraceus this inverse
relationship was related to seasonal pa'tterns of feeding as was also
There is again a Cii.fference
bet:Vle,<m .Le.'2t2.sterias and "th~ typical inverse rt"...:Ja tionship seen. for non.-
brooding sea stars. 'l'he pa·::t.exn for male .!-ej2t.as,t£E5as is vep.! sildlcJ:
to th'::tt of r~C'-~~.-b:!:oo0.ers, while t.he, female xGaches a highe:c maxinmm
~,;\:.o:ca,~,e index and deplE::tes it ,moc::-e gr2..du."'l.11y -than the male, presmrahly
because she must not only produce 9arnetes but brood 'them for 2 :i!1cnt:hs
"dt.hout feeding.
Cliia {19H.'a) c.tserved that ,the n11lwer of embryos produced by
In this study ir-divid-
Menge (J.970) reported a
a:ce l:-=::.cn::l.vely 1:mCOhur~O::'L D.nd his obs0J.:'vat.i.on was based on only a :tm,r
1iUii!
157
those from field populations., although the storage organ values were
grea·ter. In a s1.milar experilr,ent with the non-brooding sea star
Patirialla reg1.l1aris, Crump (1971) reported that both gon.ad and storage
organ indices were considerably aboye toe maximum seen for field popula
·tions. These observations indicate that reproductive output is con
3istent. for female Leptaster:Las a"ld the relationship of gonad "iJ.ze to
bo(.~y size remains constant: in contrast to what occurs in non·-trooding
sp,,"ci:.;,s.
In 1971 the data for the Cape Arago-Sunset Bay populations indi
cated 'that almost all adu.lt female LeFtaste~~~ produced broeds. The
1972 data also su.ggestl?d a. similar population reprodu.ctiv'? effort for
t:-tCGe populations. Menge (1970) reported ;:.hat the ir.cidence of repro-
Ctl:.ction ra.1.'Bly l:each:~d 50 9s in San ,J'1.1an "[,slan...:'. pcpulations and. tha.t
maxir.nllU incid.,~;lce vnried from year t.O year for the same area.s. 'l'he
populatior. at Lonesome Cove Far PO~~:r,t "vas ohsexved for ;,<~'i'~ral Y:'':;.r!3 '::.nd
the s·t.ars there ,,:ere incre3sing .in !!U';:):)er.
decrea.sing ?.nd t·;:::.5 ac":ually af.fect:Ed ~)opuJati(1a reprDdt~ctiv.::l effort
(~'ienge; 1970), i.e. fe,oj repro':':llced.. 'rh·~ previous ly meni:icmed oose .tva-
ti.ons for Seal Rock 3.1so S1."tg9",sted that adverse concH tions res:u.lt in
fe~:;e:r.: ad.ult:s "r'!..~proj11ci~nq.
l!:enqe (lfJ70) felt that enexgedc we n-being of !~p-tasteri~' popu-·
latio!1~; seems l:c b2 t.ile major fa.ctor behind temporal vari.:;.tions in the
Orise t oE brood;.ng .. J.."1aximum proportion of ::'he population breeding and
L1d3.vid...lal rem,:-d.e broodir.g effort. HI? is probably correct:. in that
avai 1.&b1.£ :food. ene.rgy d·:)es affect tile maximum proportion of the popula-
158
tion broeding. However I do not think his data substantiate the claim
of a difference: in individu...~l female reproductive effort with popula
tion, since his sample sizes &"':"e too small. Field observations suggest
that in the extreme case of very severe physical or biological pressures
the onset of brooding can be delayed. Menge (1970) did find dif-
ferences in brooding onset between populations; however these remained
consistent throughout his study. Similarly I found brooding onset to
be very well synchronized in i:he Cape Arago'-Sunset Bay region on a si.ngle
year basis and predictable from one year to the next regardless of
population structure.
Boolootian (1966) pointed out that no single abiotic factor ex
clusively influences the course of reproductive events in echinoderms.
I ''1'Juld pake the similar argument for a single biotic factcr. C:r:UIUP
(1971) reported "t..h.at the ·three populations of Patirie1~ he studied
~.::.pawned during the same period although they varied greatly in repro-'
d'.lct.ive pot:ential. Si:m..i..lar observations ha.ve been made for many
echi:l.':·(.'\9:nns including the asteroids Pisas.te}:" ochraceus. ;m.d P.
brEv~.~inL1~ (Fannanfarmaia..."1 et al., 1958; ~.auzey, 1966), and the
echinoids §t.r:on9"yloce!~tr.ot:~_ E..~~ura·tus (3001ootian, 1966) ;;md
F.'::.£?"0s..!;pr ~~!:'u~s (Niesen, 1969). Ther~fore, aJ.thol..:.gh t~1e .'3p"cific
cues for ons8t of breeding have been established for a few sp<-;cies of
echi'loc1errns (Pearse, 1972) no general environmen·tal mecha."lism, either
physical or. biologi:::al, is knowll.
The final que:3tion t.o be considered is why some animals brood while
ot:heIs IJLcdlJCe plankt:>trophic larvz.e. Thorson I s (1950) observed di s-
tribution of the brooding type of larval development with p-igher
lati tude is L'lought: to be corre lated ~..,i·th the short, seasonal phyto-
plankten blooms in the spring and the lack of sufficient plank:t:onic: food
at great depths in this region (r4cConnaughey, 1970).
Benthic invertebrab~s \'1hich have planktotrophic larvae. with a l.on.g
life may be subject to great fluctuations from year to yea.r in suc:cess
of settlement, while those that have a non-pelagic or a shortened
lecithotrophic development show only slight variations (Thorson,_ 1946i.
Thus, in te.:r.:m.s of local population structure it is more equitable to
produce laC\rae that. remain stationary rather than those that mcP[ be
S\'iept. away by cO.rr.ent or perish because of insufficient planktonic fcad~
In the telup::,rat.e l.atit.:'1.dcos conditions are less severe and. ta'il-
poraLi.y mo:;:e .?redicta~.le than ·those in the high arctic laticl.ldes ~ This:
allows a planktotrcphic larva to be relatively succas£ful.
t.J:".lis s'crat2yy is cos'ely ini:e!:ms of larval ....,astage and often resu.l.ts in
g:rcat fl'..'.ctuations in local settlement success especially aI.~lllq C":Jd::its:
Wi-til 2trong long'sr,ore currents (Thorson, 1950, Efford, 1970)'.
'i'torson (1946) describes species which can V&xy their mode: of ::::2;-
pt"ojl]ctior:. from a pelagic ·to a non-pelagic forT.1 or from a planJ:t.o·trcphic
co a lecitnotro:;:hic devel0I:lI",:ent3.ccording to the surrou.l"':ding conditions:~
Or\e £uch species is t~e asteroid ~~~!ic~~ ~anguinolenta, nQr.T411y a
br)o6 prot2ctinq species, which will occasionally not protect the
l~rvae. 'rhey wi.ll then float abo'..!t suspended in t.~,3 v..ater; h(l~\<e.ver
there is no iru1:.enmt di fferBnce be7:';oleen these la::::vd2 and -Lhas.a tlr.~t ar.e
160
Chia (1966a) has shovrn that brooding is necessary for the normal
development of Leptasteri~. None of the embryos survived without
brooding. The main functions proviaed by broo~_ng are protection,
cleaning, maintenaTlce of a uniform environment., and initiating the
hatching process (Chia, 1966a).
By brooding, .!~ta.s~ria?-. is able to provide a consistent source of
recruitment -to the local population. Although environmental conditions
vary from year to year they are relatively predictable, and all members
of the population are subjected to th~~. This results in generally
stable populations well attuned to local conditions.
CONCLUDING DISCUSSION
'l'his study proposed to answer the question of how .LeptasteJ::ias
apportions its limi:ted resources of titre and energy among the three life
histo:rical cor<lponent processes: maintenance, grow·th and reproduction
(Gadgil '" Bossert, 1970). As these processes do "compete" for these
resour~es it is difficult to separate ~ld explain the action of one
without involving one or both of the remaining processes.
YJ1OV11edge of the metabolic rates of Lepta!3teria.s during t.he periods
of brooding and active foraging a.s well as the effect of temperature and.
size on metC"..bol ic rate \.;ould be desirable to understand more completely
I did not nndertake such an investigation
during this: study but I hope to do f.urther research in this e.rea.
In t~Dr..s of reproduc·t:i.ve st:categy it has been said that no
orgc!':1.5U: is conpletely "r-selected" or "K-selected, II bnt all must reach
a comprt:'mise (pianka I :1.970). The observed reproducti'ffi strategy of
The female Lept~ster.ias-~'--.,.-..---...-
prcdw:::es a limited .nJll....:bt~r of energy-expensi.ve eggs. 'I'hess are brood'2d
fel: 2 mor... t.h.s at addi tiarA,:)1 cost to the female. Female Leptd.s"\::"~.E~a~
become sexually matl1re in the ·third year r may live at least 5 ~yea.cs, and
can p:rc:iu::;e t:,.'O or rrlOre broods (see below). All of these features o£
},~T2..t.;;.st..er~.:::.s; life r.istory chara.ct2:r.ize a "I(-·selected" rep:coductivE:
st.rat8Ti (Gadg:":J. & E03sert, 1970).
161

162
Hm",ever the first cOI:lmitment of adult L~pta~tE::r.:!:.~ is to reproduc'~
tion. Normal.ly all the females will produce a brood e,Tery year a'Jen at
t.'l.e expense of indi"idual gro~th. If resources or physical lh~iting
factors restrict popul~tions in some way, all females ~ay not produce a
brood every year (see below), but all males will produce sperm and bo·th
sexes will sacrifice grmvth and remain small. An adclitional feature of
..!'~..Fta~.ria81 reproduction is that, although the young are brooded,
there is high initial mortality and less than one per cent reach sexual
matm::ity. Both features, high reproductive effort and high lTIortali·ty of
the yO'.mg, arE! ch<iracteristic of the "r-selected" reproductive strategy
{Gadgil & B~ssert, 1970).
Yiitho;.•t becoming involved with the "L'-1eoretical contrO',lE:rsy sur'·
roun.din.q t:'1<? evolution of different reprod'.1£:::tive strategies (Vittor,
1970; Pianka( 1970; Hairston et al., 1970). L0ptasterias I reproductiv,?
strategy of brooding can be evaluated on the empirical basis of its ob-
served effectiveness. ;;fuat.I have suggest.ed in this .study is that by
b::::oc-Aling a~1.d .releasing the young t despite the high initial mortality,
~~pta.~.!=!:.ri~~provides a steady annual corps of recnlits. Once
!~}2t.a~~L~~becomes established in an area, tb.e consistent recruitment
aJ.lc'";."s the :ropulation to maintain a relatively stable popula-tion.
~YlereioLc in terms of actual effectiveness on a local basis,
Lel?t2.~t€:::.~~~' reproductive st:categy apprqaches the theoretical goal of
the ·'X-·~,elec·ted" reprodu~tive strategy (MacArthur & Wilson t 1967).
1'he first year Lep!:;..~'=.F~~were shown to g.row at a similar rate
whereV8r observed, but thereafter grov....th varied with populat:1.on. If my
163
assumption that sexual raaturity occurs in the third year is correct, the
small size of the reproducing females in some populations indicates that.
grow,th mr....y be neg-lec·ted in favor of reproduction. The cmnual pattel.'1ls
of feeding and reproduc1:ion indicate tl1e source of this neglect. Both
sexes appear to mobilize the major portion of their energy reserves,
s'cored during the spring and SUi1l.mer period of active feeding, into the
production of sperm in males, and into the production and brooding of
eggs in the females. The period of active adult growth probably occurs
only in the spring, fu.d if resources are in some way limited, little
growth is accomplished.
Sn~ll a,~rage size of inaividuals was obse=ved in several types of
L€:e.!:.aste~-!-~populations sanpled. Some populations had high densities
of small illdivic'J<.'lls and low percen'tages of dam::tg",d stars. These popn-
lations aFpeared t.O be limh:ed by intraspecific interactions. atht1::::
populations co-oocured ".-lith high densities of Pisaster and the individ-
1972b). h t.l"tird type of popula·tion observed h'J.d 10"'" densities of small
!:::,.ptasterias. and high percentages of damaged animals i these popuJ.at.ions
,;··,ere t.:bc·u'Iht t.o be limited by physical environmental facto:cs.
Almost. all n"productive age females from those populations which
--jer2. apilarer.tly cor:t.rolled by intjeaspecific intex:actio:"s 'fJere able to
In. the populations encounc.ering competi·tion
from p~_~:.€;!;. or exposad to pounding by ;;17aves not all femal;~s produce
br:x;Js 0 iIoW9yer those f£:ma IE; s that did produ.ce a brood ha.d a similar
'm1!nb::~r of (~C;jgs per lm-:t body If;eight as the females which produced yearly
164
broods,
Chia' s (1968a) observa·tions that l.ep.tasteri~~ females tak.e 2 years
to mature their eggs may provide an explanation fo~ these lower numbers
of brooding felnales. Chia (1966a) pointed out that the brooding period
was doubly taxing on a female Leptasteria~ in that not only m'.1st she
brood her current clutch of eggs r but also the next year's oggs in her
ovar.ies are going through a r.apid grO\\Tth phase. Both of these pro-
cesses are placing demands on her stored reserves. It is possible that
in f,~males from stressed populations these ovarian eggs are not
p:coperly nourished during the brooding period and thus do not mature.
The result of thi.s would be tha·t all females \';1ould net produce a
ye.arly brood but ins·tead put "all their eggs in one baskst" in .3i.l·ternate
years. ·:;:'hi.s st::::'ategy ,'1ould explain the less thaIl 50% of adults (Le.
aLi.. the females) brooding in a given year. This would also explain ~.yhy
several of the non-broodir.g females sampled a~ Seal Rock, Oregon were
found t';.U.:'l only small i~nmature eggs in their ovaries ~"hen other females
in ·the sar.:;e po:? ulation ".ere :O~ooding. However the lovler r:.umber
breoding females se~n in these populations couldbe explained py a lack
of available energy. Some female:;; may consistently fail to obcain suf-
f.i.c::tGnt resou.rces to do more thEm maintc'<in themselves and never produce
'ifnat. is the cause of this small si.ze in all of the abOve popula-
-':.iOlls? .1'.qain thF~ anS'itler i.s available energy.
oJ::..\:.i:Jin sufficient eneX'gy ·to maintain itself.
Initially the star must
If this is not available
1.:hG ;:.;tar viII lose weigb.t.: and become more suscep-tible to loss of limbs.
165
Energy obtained beyond necessa:ry maintenance levels goes into reproduc-
tion. Gametogenesis is a 1eng"Chy process s·taJ:ti~1g in mid-sUI!ll.-ner altd
lasting through winter; a period of inac·t.ivity during which feeding
activity is low follows. The period of active growth probably occurs
du:d.ng early summer T.vhen feeding ~ctivity is high and gametogenesis has
not yet commenced.
Mauzey (1966) pointed out that the upper size limit of a sea star
is probably not set by "t..0.e maximum size a starfish of particl,;;.lar age can
attain, but rather by an interaction ·.'lith the size and abundance of prey
in a'1.y particular area. Paine (1972,' senLlnar U of 0) found trLat in-
divid1.1al size of ?isaster decreased "'fiith i.ncre2.sed density. Similarly
!:,ep':.:.aS~'2·I~1.aS is held in .::heck by intecactio'.1.s \vith i-::s i:;:mnE:dJ.ate
In areas of high sea star densi ty a,'1 i:1dividual
!:-~.ptasterias is less successful in con:3isbmtly obtainin~, calorie-rich
prey, ond it is hampered by competition for a suitable space to av-oid
::1.;;siccation dnring low tide. This crc'\'lding is cansed by other
I~k.:'::.~:.~!:~.F~ and by otner ilwert.ebr:ates ,..hich 5 1.::;e:< crevices' and under
rc(:}< scu-twn. This int.er-
2.ct:i\"]11 J.S t..)ften seen; 23f.~cially during S"!..!llTiue:: 10·vl tides on clec.::r days;
l.<:.E..~5.st'::'E ..~.?:!l. is alsc bhi0it:ed by physical conditions. In areas of
c'cnstant ,..iet l,'.;? ac·tic,n the St~a stars ffias·t clamp down on the rocks to cwoid
and lim~ts the types of prey ~vailable to it. 'fhe sea star mus·t feed on
166
the most readily available prey .....;hich is t:he barnacle !3al~ glandula.
By feeding consistently on these small, low-calorie prey Leptasterias
obtains sufficient energyt.o maintain i t.self and perhaps reproduce;
there is not often sUl:plus energy· available for grow·th, and Leptasterias
remains small.
The measu~ed "maint~mance factor value s, II i. e, the proportions of
damaged sea stars, were actually an indicator of the toll ·that the phy
sical and biological environment was taking on a population. T:1.ose
factors which induced 11igh maintenance values did not appear to de~er
ind5.\ridual growth in some popu.la{:ions i while the reduced environ.mental
stress suggestod by low maintenance factors did not release individuals
to grow larger in other populations. These latter popul~tions had high
These observations suggest. that the pres-
sure exerted. by intraspecific crowding is high and has a measurable
8ffect 0;:1 the population.
In pC£'l.:!lations \'lith 10\'1 density and small individual Slze.r high
roainbenaYlce factor va.lues COUll':. indicate aiL accu.mulated relative in-
~,.bi lity of i.ndividual~5 to sustain maintenance (and grovith) ~ In the
l:::;Lo.rstc·cy 9[O~,~th 8Xp€:!:ur.ents I regeneration time was relatively fast in
'rhls indeterminate growt:h
pattt:::m :nakesit irr.p"):3~;ib1e to age a given individual. and hiadE.:.rs
de~':;!T:;il;a:t.ion of t!16 species' life span. Using th(~ data for reproducing
fC;:in,des and mortality of young st<lXS up ';;0 2. "j8iJ.ra 01d T calculated ti'.at
167
tiie average sized female in any of the three study popuJ.ations would
hav·e to produce from t.wo and a half to ·three broodsLo replace herself.
This calculat.ion W<'J.S made with the assumption that there '!vas no mortality
~fter 2 years of age. Therefore if a female first reproduces at the end
of her third year, she ~ould live at least 4.5 years. H(;VleV~r, there is
some level of mortality for both adult 3.nd 2 year old Leptasterias, and
the adult stars could live considerably longer than 5 years and produce
more ~~an three broods.
'fhis relatively 10zlg life-spa..'"1 emd the multiple reproductions pro
posed for Leptasterias is in agreement ,...ith its empirical description as
a "K-sel'=cted" species. If LeR~asteri~~ lives this long is L~ere ~~V
advanta~?e to i!1Creasing in size? A linear relationship bet,.,een sea
star size and ~he size of p~~y was dGmonstrated. ?he larger the sea
sta:::-, tl-.c larger the prey capt1Jred. As a s.tar increases in size it is
eo longer limited to IOvl-calorie yieldL-..g barnacles I but is capable of
adding new c?l·~ric·-rich p::cey t.o i C.s· die t and thus cem grO\>l :capidly.
SCi:·.? popu.latJ.on5 I observed consisted of larger sized individuals
Females from these populations follO'!led.
as did ff:.:r;1ah~f) fx·om populations consisting of higher de~"1sities 0:: smaller
Irl addi t:,iOl1 t.here '"as some i!ldication that t..1-;.ese
l<~::Cjer fema::'·:,;s prodt.;ced larger eggs i a relatively unusual 8itu.ation for
em S(;~.li.l/.oden,l (Boolootian I 1966).
~"h.."n c()mpa.red on a :populati0n basis the total 11uiT.ber or eggs pro-
duced P~l: '.,qu,i.:t"Sl lUst.oSX: l,las much lcw2r in th"" populations COIi.sisting of
larger sea stars.
168
There was also sowe evidence that the larger females
were less successful in brooding tlleir eggs.
Pl~aste,}~, the volmae and therefore G~e metabolic demands increase as the
cube of Ilnear dimension (Mauze~', 1966), while the increase in egg
n~J)cr is a linear functio~ of ~eight. These observations suggest that
lEir<;;81- individual S:i..Z6 would be an advantage ·t:o the individual sea star
but l\(.t to Ule popul.a1:i.~:1 ir. tenliS of energy costs and reprodnctive out-
put.
I do not wish to sl1qgest that the above biO ·types of popular.ions I
Le. low-density with l..u;ge individual size and high density ""ith small
i.nd:i.vidua~~ size, are altexnatives in a given area • I believe that they
.r:epreser.t two separate population structures that. have become estab-
lis:~ed for sepa.rate se-ts c~f enviroi'1ra.en.t.al conditions ..
5trab~g:t of. brooding alloKs Le;ptasterias to exist in a variety of
envixomnents and associations. an.d I believe a given population struc-
tt;.J::;~ is p:n;,di ctable for a given envixonment.
In il ralatively p:totected area, where .?i~E. is lov,1 in ml..'llber, I
believe the resultiD'j population structure of LeptasterL5tS would be-;----'"._-------(~haracter-.ized. by b.~\g11 sea. s·tar c::!t::::nsity and re~atj:'Jely _sinall individual
Li:T:i ting [actors fot' b'1is population would probably be available
Large individual sJ.ze would rarely
169
In an area that is geographically situated to avoid the onslaught
of prevailing wave trains F but is susceptible to winter storms from
other directions, the I.e.ptasterias pcpulation wot:',ld be characterized by
low density and a large individual size. I found that the younger
(smaller) sea stars were more susceptible to da..-nage by physica.l factors
and this results in significant mortality. Because fewer stars survive
to necome adults the densit,y remains low a:...d the individual adult star
is freed from the limitation of resources caused by high density.
Thase sea stars are more s~ccessful in obtaining high-calorie prey
illld thus grow larger. The larger females produce a correspondingly
larger nUJ.!lber of eggs 80 that rec1.l1itment on an. annual bJ.sis is still
consistent, although reduced beca;,i.se of :::lo.ct.::alii.:y. Therefore cd,though
this modera'tely e'xposed type cf cnvi::::on,T,t~nt is less compatible,
Le2:~,~tel."ia~ is sti,ll a.hle to main·tain a reasona.bly stable po~)ulation.
Populations in these habitats do not equal the carrying capacities of
less ex:.r:,osed envL~onment.!:! ; but beca.use of the prevailing envi:cor.xnental
conditions the pot.en-tial ca.!.J:ying capacity in ,these areas is probably
In -"m area tlklt is more cxpo~',ed to the prevailing waves, the
I.,,:,:!)t:a~;tsrias p·::>!?ulatLcn 5~s c:l&.rc.;.c;.::eri..zed by small individua,l size and a~ ...-.#:~",_......... _ ••...-- --.".
The m··.Jl~C frequent exposure to wave actio;:).
2.b.i.li ty 0 f aU S2iJ. s·tars t·:.> ior. age fGr food. Thus ene:t.gy irrta..ice is
rl.:lducsd \')£1ioh ef:h:c1:3 Il,Gan individual size and ~cep:co6'.J,ct.ive effort~
Sorr:.-e ternaJ.e;;-, do not produce broods atld th-:=. males produce a smaller
170
'Volmne of sperm. As a result fewer young are available annually as re~
cruits to the adult populat.ion, and the sea star density remains low.
The above predictable outcomes for Leptasterias populations occur
because, unlike sea urchins and other benthic invertebrates with long
lived planktotrophic lal:vae, Lep'casterias young are not subjected to
extra-local physical and biological factors that influence init.ial
settlement. In Leptasterias populations all sea stars are subjected to
t:he same set of environmental factors. There may be differential
success in dealing with these factors among the individual age classes,
but the resulting overall population structure 1.'1il1 be ",ell atttmed to
the local environment.
LeE1:asterias probably has little overall influence on the inter
tidal cownunityon the protected outer coast, especially when compared
to the larger; more voracious star Pisas~. Paine (1966, 1963)
studied the communi tY-'shaping role of Pisaster and demonstrated how this
st.ar! because of its patte:l:n of prey selection, influenced ·the species
composit.:Lon and abundance i.n the rocky intertidal comraunity. Paine
r,e.Eta.~;terias.does grow large iI:. Gome situations and does have t.he
abj.lity to capture la:c38c, ~l:otiL: p:;~·ey. '.rhus.it would seem to 11dV€,
si.rn11ar: potential 7.:0 enqag<.: L, 'J. "k(qs to;..e" .':"ole 1 ike .~:"s~st!:E.. Hm..r
ever Lep.ta s.!:.~i a.;'§. is not r:esist:aJ1.t to desiccation as is Eisa~~::E. and is
t:'::1.ereforc limited in the range it may 1:oL·age. It must :r:ema.in in the
ccbbl·.:--bouJ.de.l:' areas where it CcUl find a 3haded~ moist spa.ce to remain
",hen the tide is out. ?isast~E. can forage over considerably more area
171
and, if left exposed during lO~N tide f it is able to vli-thstand desieca-
tion for 6-8 hours without apparent damage (Feder, 1956).
This limited foraging range of Leptasterias combined ,villi the fact
that foraging time is often reduced because of wave action has perhaps
led this sea star to preferentially select the barnacle f !lalanus
glandul.a as its major veey species. This species maintains a hreeding
popula.tion in a high intertidal zone refuge and regularly produces suf-
fiei-ent progeny to replace itself and colonize the whole intertidal
zone (Connell, 1970). Probably beeaUf.ie Balanus <;tlandula is pred..i.etc1>ly
available and widely distributed throughout the boulder-(nbble area~
less -chan 17% of the sea s-tars observed in t.~is study were feeding or::.
other prey.
The remova.l of barnacles from the substratum provides empty space
for the se-ttlement of nm; barnacles, other -invertebrates or algae.
'I'herefore ~::ptasterias.' most influential role in the i.ntertidal com-
munity may be the provision of s.?dce, a factor that is potentially
.li_11'ci-tintJ in th.9 int.::r-tidal zone (Dayton, 1971).
Pi~;~~te~ is able to witllsta~d long periods of exposure to aiY,
eV6n in direct sw:li_g-ht (:E'eder 1 1556). t;ep!~st~E£as is highly suscept-
ib.le to desiccation; is stxongly photonegat.ive (Menge, 1970) a.'1.d seeks
the vndersl.'rface of rocks dll:cing 10\'/ tide. Pisasterfs so~thern dLs-
lim:!. t is jV!onterey, Cali fo:::nia (aenge, 1970). In Monterey, as is the
<jener::..l. C'::lse to the north; t:.'le months August through October are the
','iaJ::1,',est, but_ du.ring- the summer heavy fogs and overcast conditions serve
172
to protect intertidal organisms from solar insolation (Feder, 1970).·
SOuth of Monte:t:ey, daytime summer 10'" tides are often accompa.nied by
clear, sWiny weather. J believe Lept~terias' physiological inability
to withstand these conditions is the chief factor limiting its southern
distribution.
LeP1.:asterias reproductive strategy of broodi.ng allows this species
to be successful on a local basis although its dispersal abilities are
limited. Physiological limitations probably prevent 18pt~ia~ from
being a dominant predator in i:he intertidal zone aTJ.d are probably
important in limiting the range of its southern distribution.
APPENDIX
Weight frequency histograms of the three study populations. Sea stars
=u~e grouped in O. 5g \leight classes; ~.e. \'leight class 1 includes
ani.mals \\reighing 1.0 to 1.49g, etc.
173
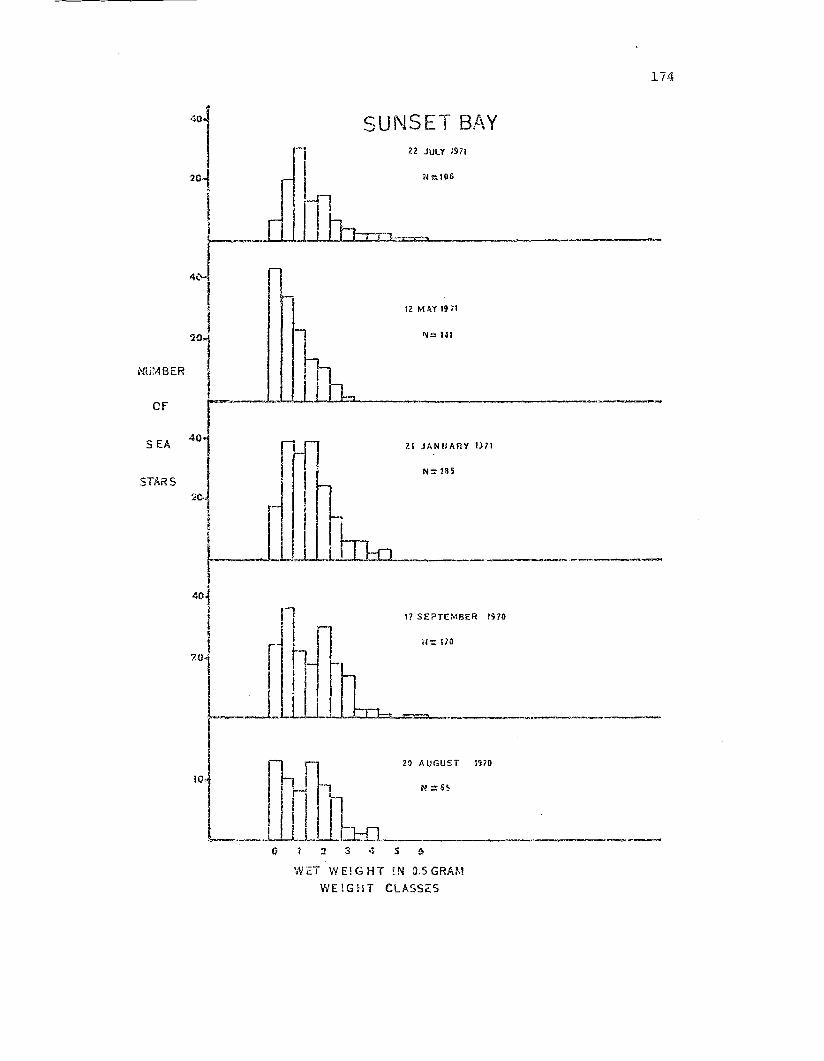
174
'_-J..~~~ N::_14_1 _
'·1'0, GIlI n-n
4~ nI
I20
NUMBER
OF
SEA 40
STARS
SUNSET BAY22 JULY 1971
N~106
12 MAY1971
21 JANUARY 071
17 SEPTEMBER 1970
2~ AllGUST n70
N =65
o i 234 S 6
wn WEIGHT !N O.5GRAM
WE!GHT CLASSES
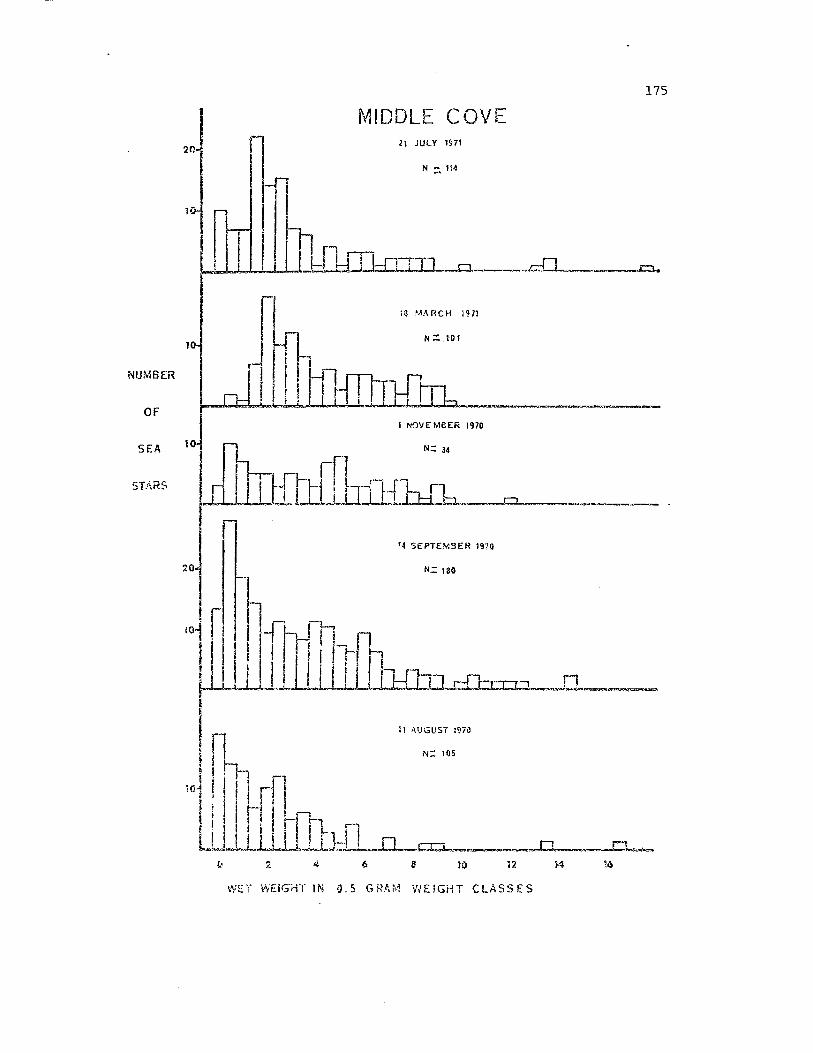
175
II JULY 1~71
N ::::. 114
MIDDLE COVE
I "M::C~..""
~~~~-----I I NOVEMBER 19ro
IO~~~ ..---!-o~
OF
SEA
STARS
NUMBER
'4 SEPTEMBER 1970
20 N.= ISG
II AUGUST :970
N:: 105
}O 12 14 16
WET VIEIG'HT IN (,l.S GRAM 'NEiGHT CLASSES
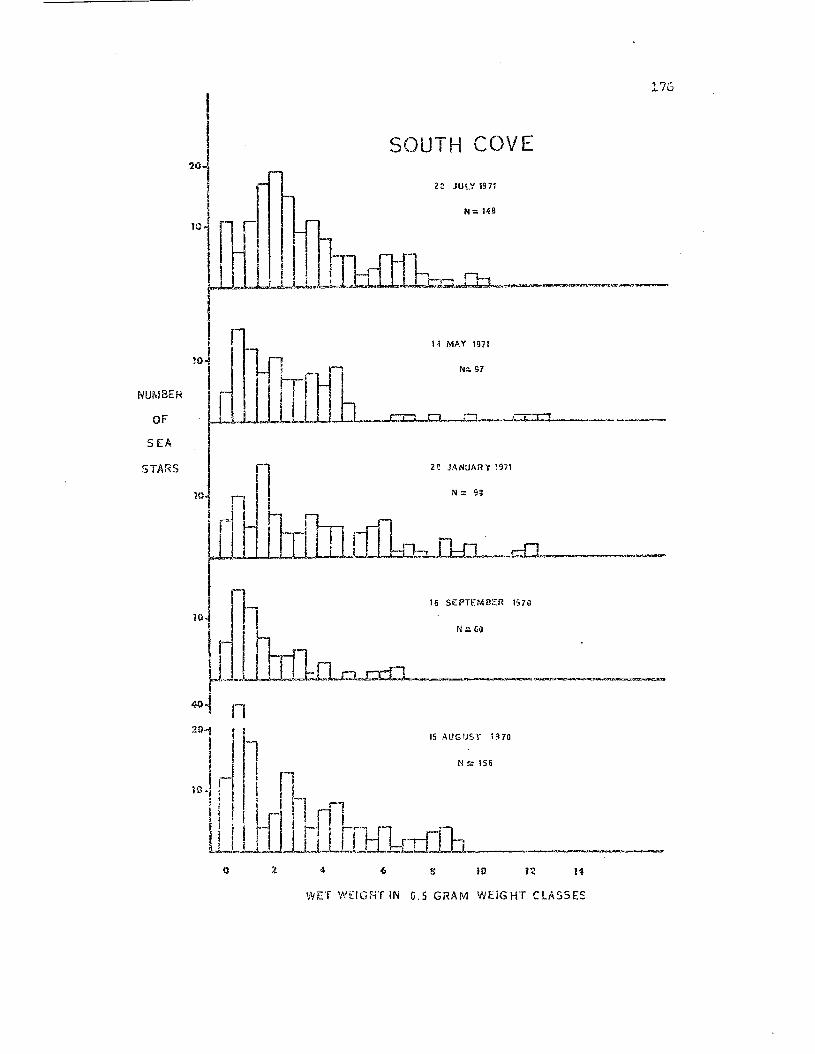
176
N::. 148
14 MAY 1971
20 JU'_Y 1971
SOUTH COVEI20~
I1O~ I InIrl h-rHl ""l-l-!-....I-.J-,I..,J,LLLljh-.~._-I::::r::r:t
I n 2~ JAN~ARY 1971
1O~ n I' 1'1 = 93. j I I
W!rl Hrl-I~1-n .--[[~lI IWJJJ1WL-ho=.Ibo~r-o~-~-_.~--
I 16 SEPTEMB:::R lS76
10-1 I
I 'i -1 '""~. JJI11U=Ldl__--_,~_~401 n
OF
SEA
STARS
NUMBER
is AUG'JSr 1970
N ~ 156
6 10 14
WET 'NfIGHT iN 0.5 GRAM WEiGHT CLASSES
BIB:r.IOGRl\.PHY
Allee, W. C., A. E. Emerson, O. Park, T. Park and K. P.Principles of animal ecology. W. E. Saunders Co.837 pp.
Schrnidt. 1949.Philadelphia.
Anderson, J. M. 1966. l>.spects of nutritional physiology. In R. A.Boolootian ed.: Physiology of Echinodermata. John Wiley andSons, New York. pp. 329-355.
Baldvlin, E. W.Ann Arbor.
1964. Geology of Oregon 2nd Ed.165 pp.
Edwards Brothers Inc.
1966. Some revisipns of the g,.=ology of th:? Coos 3ay :1\::::e3o,Oregon. The Ore Bin 28:l89-203.
Barnes, H. and M. Barnes. 1956.glandula Daxwin. Pac. Sci.
l'he general biology of Bal~~u~
10:415-422.
Behrens, S. 1972. Role of ''';<:t,/e ii:l~pac:t and desiccation on the di stribution of Littori~ s:i::..t::~. Phillippi, 1845. VeJige:;: 15:129-132.
Birkeland, C. 1971. Biological observations on Cobb Sea.mount. N. ftoi.Sci. 45:193-199.
Boolootian, R. A. 1966. Reproductiv8 physiology. In R. .H.• Bcolootianed.: :Physiology of Echinodenuata. John Wiley and Sons, Ne,.., York.pp. 561-614.
Branham, J. M. , S. h. Reed, J. H. Bailey, and S. Caperon. 1971. ~oral
~;ating sea stars Ac~!taste:::.pl~ci in Hawaii. Science 172 :115:;·lIS 7 •
Eu.lIe ci: , T. H. 1953. Preda.t:or recognition a...,d escape responses of somehr'.:e:ctidal gastropods in presence of starfisb.. Behaviour 5: L:50140.
Ca1.-ey, Ii.. G. Jr. 1972. Food som."ces of sl±.litto:cal; bathyl and abyssalaste.r:oids in the Northeast Pacific Oce.3.fl. Ophelia 10:35-47.
Cassie, R. H. 1954. Some uses of probability paper in 'cbe analysis ofsJ-zE. frequeJ;,cy distribut:i.c~nsr J. !'1arl# Fresl'lv:a'ter Res~ 5:513.... 5.22.
177
178
Chaet, A. B. and R. A. McConnaughy. 1959. Physiologic activity innerve extracts. BioI. Bull. 117:407-408.
Chatlynne, "L. G. 1969. A histochemical study of oogene::>is In the seaurchin, Stron~fylocentrotJ.sEur'p~rat~..§.. BioI. BulL 136:167-184.
Chesher, R. H. 1969. Destruction of Pacific corals by the sea star~cill1thaster p1anci. Science 165:280-283.
Chia, F. S. 1964.brooding stardisserta'cion,
The deve1opnent::.;.1 ;;'~1.d reF:':oduct~cve :Jiclo~·iY of afish, Levtasterias hexactis (Stimpson). DoctoralUnive:csity of Washington.
________ 1966a. Brooding be1:avior of a six-rayed starfish,Lepca~i~~hexactis. BioI. Bull. 130:304-315.
196Gb.---_..._--in the vid.ni ty15 : 300- 306.
Systematics of the six-rayed sea star Leptast~~~
of San Juan Island, Washington. Syst. Zool.
____._ 1968a. Some observations on the development and. the cyclivcha.."lges of the oocytes in the brooding starfish Lept~.:~.!.~!-:i~
hexactis. J~ Zool. 154:453-463.
1968b. '1ne embryo.iogy of a brooding starfish, .f;:::.p!::..~?:ter~as
!~~ctis. Acta Zoologica 49:321-364.
Christensen, A, M. 1970. E'eeding biology of the sea sta.r ~_~....~.9.l?~~_~enirr;~·;'.l.laris Pen.r~ant.. Ophelia 8:1-134.
Coch:i."(tn I R. Co and F. Engelmann. 1972. Echinoid spa':ming .induced withY'ddial nerve factor. Science 178: 423-424.
Ccdy, 1\1. 1966. A general theory of clutch size. Evolution 20:l"i4--184.
Cole t L. C. E154. The popula'cion cO::1sequences cf life historyphenomena. Quart. Rev. BioI. 29:103-137.
Connell, J. H. 1970. A predator-prey system in the IUct:rin2' intertidalregion. 1. Balanus glandula and several preda·tory species of!h~~_. Eco1. Monogr. 40:49-78.
shores.3.972 __ Community interactions on marine rocky intertidalAr.n. Rev. Ecol. and Syst. 3:169-192.
Crm~, R. G. 1971. Annual reproductive cycles in three Geographicallys'2parilted popnlat.ions of p,.",tiriell~ reS'ularis (Verrill) I a commonNe~ Zealand asteroid. J. expo mar. BioI. Ecol. 7:137-162.
Dayton, P. K. 1971. Competition, disturbance, and cOIl1l11unitytion: the provi sion aYJ.d subsequent utilizat.ion of spaceintertidal colnmunity. Ecol. Monogr. 41:351-389.
179
organizain rocky
Ebert, T. A. 1966. Local variations of growth, feeding, regenerationill1d size structure in a natural population of the sea urchin,strongY1Ecentrotu~pUrpuratu~ (Stimpson). Doctoral dissertation,University of Oregon.
Growth rates of the sea urchin ~tron~¥.~9~entrot~
9urpura~~ related to food availability an.d spine abrasion.Ecology 49:1075-1091.
Effo:;:"d, I. E. 1970. Recru.itment to sedentary marine populations asexempli fied by the sand crab, Emerita ~na1c'i.~ (')ecapoda,Hippidae). Crustaceanna 18:293-308.
Fannanfarmaia.n, A., A. C. Giese, R. A. Boolootian, and J. Bennett.1958. Annual reproductive cycles in four species of west coastst;irfishes. J. e},.'p. Zeol. 138: 355·· 357.
Feder, H. H. 1955. Th.e use of vital stains in marking- Pacific coaststarfish. Cal. Fish and Game 41:245-246.
1956. Natural history studies on the starfish ~~~~~~~~
ochraceus (Brant, 1835) in the Monterey Bay area. Doctoral disserta-tion, Stanford University.
1959. Food of Pisaster ochraceus. Ecology 40:721-724.
1963. Gas·t.ropod defensive responses and their ef£ed:iveness in reducing predation by starfishes. Ecology 44:505-512.
1970. Growth and predation by the ochre sea star p~~ochraceE.~ (Brandt) in Honterey Bay, Calif. Ophelia 8:161-185.
. 1 an.d A. Christensen. 1956.R. A. Boolootian, ed.: PhysiologyP~~lishers, New York. pp. 88-127.
Aspects of asteroid biology. Inof Echinodermata. Interscience
Fenchel, T. M. 1965.DubsD. and Koren.
Feedine; biology of the sea s·tar Llli..92:..~ .sarsiOphelia 2 :223-236.
F'ergnson, J. C. 1968. Transport of amino acids by starfish digestiveglmlQs. Compo Biochem. Physiol. 24:921-931.
" .__~ 1959. Feeding activity in E~inaster and its induct10nwith di ssolved nutrients. BioI. Bull. 136: 374-384.
180
1970. An autoradiographic study of t:l:'anslocation andutilization of a.millo acids by starfish. BioI. Bull. 138: 14-·25.
Fisher, R. A. 1930.Dover, New York.
The genetical theory of natural selection.287 pp.
Frank, P. H. 1968. Life history and community stabili,ty. Ecology49: 355- 357.
Gadgil, M. and li. I{~ Bossert. 1970. I,if8 l1ist.orical c011seq~..lences ofnatural selection. Amer. Natur. 104:1-24.
Glynn, P. W. 1965. CClTh"Uunity compositioD, structure,relationships in the marine intertidal Endocladiaglandula association in Monterey Bay, California.12:1-198.
and in'termuriata -Balanus-----Beaufortia
, L. R. Almodovar, and J. G. Gonzalez. 1964. Effects of-----hurricane Edith on marine life in La Parguera, Puerto Rico.Carib. J. Sci. 4:335-345.
Goreau, T. F., J. L. La.ing: E. A. Graham, and D. P. Gareau. 1972.St:>cucture arLd ecology of t..'1osaipan reefs in relation to predationby Acant.naster pl~ci {Li:n...."1eaus). Bull. M,ar. ScL 22 :113'-152.
Hai.rston, N. G., D. W. 'l'inkle, and H. M. ~lilbllr. 1970. Nc:tural selection in parameters cf population growth. J. i<'Jildlf. lbr;ag. 34:681-690.
Halpern ~ J • .1l.. 1970. Grm,rth rate of the tropical sea star ..!-u:!:.di~
_sc:'negale~.:>is (Lamarck). Bull. Nar. Sci. 20:626-633.
Harding, .T. P. 1949. Tha use of probability paper for the&nalysis of polymodal frequency distributions. J. Mar.A.5S. U.K. 28:141-153.
gj~af'hical
BioL
BeU v~;y ( 8. B. 1956. The JI.-.me'lCican Abracia and other sea u:,:',:::hins.rri:~cet,on, Pl:inceton University Press. 298 pp.
Hia.-tt, R. W. 1948. 'The biology of the lined crab P~chY5iraJ.?sus
E~~?si~~ R~ndall. Pac. Sci. 2:134-213.
Hopk-Ln.s, ri'o So a..."1Q. G. F. Crozier. 1966. Observations on the Asteroidechinoderm faQna OCc'.l:cr.i.ng in the shallo7tl water of Sou,thernCaLi. fO:J':ni a (I!1tertidal ·to 60 meters). Bull. So. Calif. Acad. Sci.65: 129··145.
Ho=n t H. S. 1966. Heasurement, of overlap in comparative ecologicals1:1.(dies. Amer. Natur. 100:/119-424.
t:'ynwn r L. H. 1955.Hill, New York.
The invertebrates, Vol. Ttl, Echinoderm,,"ta.753 pp.
181
Mc'Graw-
H;.\rlbert, S. w. 1971. The nonconcept of species diversity: acritique and a1ternativ(;! parameters. Eco1oqy 52:577-587.
Johnson, C. R. 1968. Food of the buffalo sculpin, Ehophrys bison.J. Fish. Res. Bd. Can. 25: 807,-812.
_________ 1970. Not.es on the irtertic1al life histor.f o.r Ui(3 northenlClingfish r Gobies~ ;!laeand:dcus. Am. MidI. Natu.c. 33: 625-627.
Kanatani, H. and H. Shirai. 1970. Mechanism of starfish spa~nling.
III. Properties of meiosis-inducing slIDstance produced in gonadunder influence of gonad s'cimulating substance. Develop. Growth& Different. 12:119-140.
Knu(~en, J. W. 1960. Reproduction, life histor.y, and larval ecology ofth.9 Ca.li fornia Xanthidae, "the pebble crabs ~ Pac II Sci. 14: 3-1. 7.
Kenny, R. 1969. Grm07th and -3.sexual reproduction of ·the s·tarfish~epanthia ££lEherj (Perrier). Pac. Sci. 23:51-58.
La::.de':1berger, D. E. 1968. Studies on selective feedi!1g in the :Pacificstarfish Pisaster in Southern California. Ecolog'"j 49:1062-1075.
c:;J]1d i.ts1969. The effects of exposure to air on Pacific starfishrelationship to distribution. PhysioL Zeol. 42 :220-230.
Lcosanoff, V. I,. 1964. Tv'ariations in time and intensity of settling ofL~'l':' starfish, ~~.ria~ _~or.e.~, in Long Island S01.md d1",ring atwenty-five year period. Biol. Bull. 126:423-439.
l"bcArtJl1.::.r, R. H.geography.
and E. O. Wilson. 1967. The theory of island bioPrinceton University Press, Princeton. 203 pp.
Ha'.lzcy, K. P. 1966. Feeding behavior and reproductive cycles ofPisaste.(' och:cc.C'::lus. BioL Bull. 131:127-144.
______._", C. Birkeland, and P. K. Dayton. 1968, Feeding beha~Tio.r ofasteroids and escc~pe responses oft~'18ir prey in t:"le P1.1get SoundR,'=::rion. f;;co10gy 49:603-619.
Nc:Conn.3.u~rh€.y, B. H.:"::)sby Company,
1970. Introduci.:ion ·to marine biology.St. Louis. 449 pp.
c. V.
Hsnge., B. A.. 1970. The pcpulatlon ecology and cOlThllunity role of ·theI:J:edaceous asteroid, LeI?~8..;.:,?~eriaE.hexac1.:is (S·timpson).. Doctoral~.ls<::e.!.-tat:il)n, University of 'ir:ashington.
182
________ 1972a. Foraging strategy of a starfish in relationship toactual prey availability and environmental predictability. Ecol.Monogr. 42:25-50.
1972b. Competition for. food between two intertidal starfish and its effect on body size wid feeding. Ecology 53:635-644.
Morisita, M. 1959. Measuring of interspecific association andsimilarity between communities. Memoirs of the Faculty of Science,Kyushu Unil.·. Seri.es E (B.iolog"j) 3:65--80.
Murdoch, D. B. 1970. Life histories and ecological genetics. In:Connell, Hertz ana Murdoch eds.: Ecology and Ecological Genetics.Harper ::l.nd Rc,w, 1'1e\'I' York. 397 pp.
r.hl..rphy, G. 1. 1968. Pattern in life history and the environment.Amer. Natur. 102:391--403.
Nicl1ols, D. 1964. Echinoderms: experimental and ecological.Oceanog. and Mar. Biol. Ann. Rev. 2:393-423.
Niesen, T. M. 1969. Population structure, dynamics, breeding cycles,and ecotypic variation in San Diego populatiorls of the sand dollarDendraster excentricus {Eschscholtz). Master's thesis, 8&1Diego' Si::2:te College. . . . - .
Himi tz, Sister M. Aquinas. 1971. Histochemical study of gut nutrient:L8serves in relation to reproduction cmd nutrition in the) seastars Pisaster ochraceus and Patria miniata. Biol. Bull. 140:------ ----461-481.
Paine, R. T.Natur.
1966. :£o'ood web complexity and specie s ilivcrsi ty.100:65-75.
mer.
__. .____ 1969. The Pis~.steE.-:Tegula in'ceract ion: prey patches,p:r.ed:=ti.:or food prefex:ence 1 and intertidal community si:r~cture.
Ecology 50:950-961.
_____...__ 1971. A short term investigation of reSOUl~ce partitioningin a Ne\", Zealand rocky intertidal habitat. Ecology 52: 1096-1106.
Pearst-::, J. S. 1966. i\ntarctic asteroid Cdontaste~ ~J:j_du~; constancyof l:eproc1uctive periodicities. Science 152: 1763--1764.
__.____ 1969a. Reproductive periodicities of Indo-Pacificinvertebrates in the Gulf of Suez. 1. The echinoids,?rionocidaris ba~ulosa_ (I,amarck) and LmTenia elongata (Gray).Bull. Mar. Sci. 19:323-350.
183
1969b. Reproductive periodicities of Indo-Pacificinvertebrates in the Gulf of: Suez. II. The echinoidEchinometr~mathae: (DeBlanville). Bull. Mar. Sci. 19:580-6J.3.
19690. Slow developing dermersal embryos and larvae ofthe antarctic sea star Odontaster validus. Mar. Bio1. 3:110-116.
1970. Reproductive periodlcities of Indo-Pacificinvertebrates in the Gulf of Suez III. Tile echil~oid Diadema.-----setosum (Leslie). 3ull. HaL Sci. 20 :697-720.
1972. A monthly reprodu.ctive rhythm in the D:1.adematid seaurchi.n Centrostephanu..§. coronatus Verrill. J. expo mar. BioI.EcoL 8:167-186.
Pianka, E. R. 1970. On r-- and K- selection. Amer. l~atur. 104:592-597.
Porter, J. W. 1972. Predation by Acanthas~er and its effect on coralspecies diversity. Amer. Natur. 106:487-492.
Ricketts, E. F~, J. Calvin and J.Tides. 4th Revised Edition.
W. Hedgpe-th. 1968. Bet,lieen PacificStanford Dniv. Press. 516 pp.
between the sea star ~isasteYRosenthal, R. 1971. 'frophic in'l:eractio:n5Jiganteus and the gas-:'-_~:opod Kel.letiaFishery Bull. 69:669~680.
kel1e-fii. u . S. D(;p t. COliL.J..
1 and J. R. Chess. 1972. A predator-prey relationship be-._----tween the leathey star, Dermasterias ~~.brica::a, and the pm..-pleurchin I StrongyIocentrotu?- purpura-tUB. Fish Bulle'tin 70:205-216.
Rot_tITIan, C. J. 1970. Physical para.met.ers Zt.'1_d interrelationships ofmodern beach sands, Pleistocene terrace sands, Eocene: .sal1.dstonesfrom C~pe Arago Oregon. Doc~oral dissertation, University ofOregGn.
Simpso:J. I G • G., A. Roe and R. C. LGwontln. 1960 .-Quanti tat::.ve ZooJOg-i. Harcourt, Brace and World, Inc., Nm'l York. 440 pp.
So}~al, R. R. a.Tld F. S. Rohli. 1969. Biometry. ~1. E. Freerr.2.n and Co.,San Francisco. 776 pp.
Steel, R. G. a.11.d J. H. Torrie. 1.960. Principles and procedm:es ofstatistics. McGra'-l-·Hil1. Book Company, Inc., New York.
8":,:(;.)1, ~ E~ 1966-~ Gro1/lto., at:tto·torti~l' and regeneration.. In R.. A. Bcolootianed _: Physio.lo'Tl of EchinGoerrr.ata. John vhley and Sons r New York.pp. 397-434.
184
Thorson, C. 1946. Reproduction and development of Danish marine bottominvertebrates Witll special reference to the planktonic larvae ofthe sound. Hedd. Komm. Danmarko Fish. Serie Plankton IV:1-523.
1950. Reproduction fu"'1.d larval ecology of marine bottominvertebrates. BioI. Rev. 25:1-45.
Vittor, B. A. 1971. Effect.s of the environment on fitness-rela"i:edlife history characters in Tigri£~~ californicus. Doctoraldisser-tation. Uni\/e:csity of Oregon.
Wilson, E. o. and vl. H. Bossert.. 1971. A primer of population biology.Sinauer Assoc. Inc. Conn. 192 pp.
Typed by Joann Bra.dy