Embed Size (px)
Citation preview
Ponding-Test Procedure For Assessing the Infiltration Capacity of Storm-Water Basins, Nassau County, New York
By ROBERT C. PRILL and DAVID A. ARONSON
GEOLOGICAL SURVEY WATER-SUPPLY PAPER 2049
UNITED STATES GOVERNMENT PRINTING OFFICE, WASHINGTON : 1978
UNITED STATES DEPARTMENT OF THE INTERIOR
CECIL D. ANDRUS, Secretary
GEOLOGICAL SURVEY
H. William Menard, Director
Library of Congress Cataloging in Publication Data
Prill, R. C.Ponding-test procedure for assessing the infiltration capacity of storm-water
basins, Nassau County, New York. (Geological Survey water-supply paper ; 2049) Bibliography: p.
1. Storm-water retention basins Testing. 2. Seepage. I. Aronson, D. A., jointauthor. II. Title. III. Series: United States. Geological Survey. Water-supplypaper ; 2049.
TD653.P74. 628'.25 78-606022
For sale by Superintendent of Documents, U.S. Government Printing Office Washington, D.C. 20402
Stock Number 024-001-03135-3

CONTENTS
CONVERSION FACTORS
Factors for converting English units to the International System of Units (SI) are given below.
English Multiply ~by
in. (inches) 25.4ft (feet) 304.8
.3048ft 2 (square feet) .0929ft 3 (cubic feet) .02832ft/h (feet per hour) 30.48ft"/h (cubic feet per hour) .00786gal/min (gallons per minute) .06309acres .00403
Metric
mm (millimeters)mm (millimeters)m (meters)m 2 (square meters)m 3 (cubic meters)cm/h (centimeters per hour)L/s (liters per second)L/s (liters per second)km 2 (square kilometers)
PONDING-TEST PROCEDURE FOR ASSESSING THE INFILTRATION CAPACITY
OF STORM-WATER BASINS,
NASSAU COUNTY, NEW YORK
By ROBERT C. PRILL and DAVID A. ARONSON
ABSTRACT
A procedure to obtain field data for assessing performance of storm-water basins having high infiltration rates is described. The basin selected is divided into test plots, and treated municipal water from a fire hydrant is ponded to the desired depth so that infiltration rates and flow patterns in the unsaturated zone can be determined by standard methods. The study was made at a storm-water basin excavated in glacial outwash deposits in Nassau County, Long Island, N.Y. in 1971-72. The types of interpretations and evaluations that can be made from test data are described, and appli cations of the procedure as well as guidelines for developing a similar testing program are given. Observations of special significance were: (1) Infil tration rate of the basin at low water stage is about 1.5 feet per hour but increases with increased water level; (2) flow through the unsaturated zone is essentially vertical; (3) infiltration rate is controlled by a surface stratum in this case a gravelly, sandy loam; and (4) the position of the water table has little effect on infiltration rate provided it is below the lower boundary of the controlling zone. These observations can be used in evaluating a storm-water basin's suitability for supplemental recharge with treated waste- water, in comparing procedures for increasing a basin's infiltration capacity, or in the design of new storm-water basin systems.
INTRODUCTION
PURPOSE AND SCOPE OF STUDY
Storm-water basins are used extensively in Nassau County and other parts of Long Island, N.Y., for recharge of the ground- water reservoir. In 1976, more than 2,200 storm-water basins
2 STORM-WATER BASINS
were used to dispose of storm runoff from paved residential, in dustrial, and commercial areas and highways, and additional basins are being constructed concurrent with new development. Water managers are evaluating the feasibility of using the storm- water basins for recharging the ground-water reservoir with highly treated sewage (reclaimed water). If economical proce dures can be developed for treating wastewater, large quantities are likely to be used for recharge in coming decades. Because of the high cost and scarcity of land on most of Long Island, much of the supplemental recharge is likely to be through already existing storm-water basins. Accordingly, water managers would benefit from new, more efficient procedures for evaluating the performance of present storm-water basins and their suitability for such recharge.
On Long Island, N.Y., the U.S. Geological Survey has developed several procedures for evaluating performance of storm-water basins. A previous paper (Prill and Aaronson, 1973) describes how the infiltration capacity of basins with low infiltration rates can be determined from tests with ponded storm runoff. How ever, data on the infiltration capacity of basins with high infil tration rates cannot be obtained from such tests because storms on Long Island are generally infrequent and of short duration and thus do not provide the complete basin flooding needed for this determination (Seaburn and Aronson, 1974).
This paper describes how complete ponding can be provided to evaluate infiltration capacity of basins with high infiltration rates. A test basin excavated in outwash sands and gravels was divided into test plots, and these were flooded to predetermined stages with treated municipal (fire-hydrant) water. The construc tion, procedures, and testing patterns are described, and the flow characteristics within the unsaturated zone below the test basin are discussed. The tests show that infiltration-rate is controlled by the vertical hydraulic conductivity of the surface stratum in this case a gravelly, sandy loam through which flow is essen tially vertical.
Other methods for determining the infiltration capacity of a basin, such as mathematical modeling, require an accurate meas urement of the vertical hydraulic conductivity, but this factor can as yet be determined accurately only through ponding tests. Thus, the ponding and testing procedures by which this basin's infiltration capacity was obtained provide a means by which the performance of other basins in similar hydrogeologic environ ments could be evaluated with a minimum of effort.
BASIN CHARACTERISTICS 3
ACKNOWLEDGMENTS
The authors thank E. W. Bowker, Senior Civil Engineer (re tired), Nassau County Department of Public Works, for provid ing basic physical data and design information for the basin described in this report; and the South Farmingdale Water Dis trict for use of water from their fire hydrant.
BASIN CHARACTERISTICS
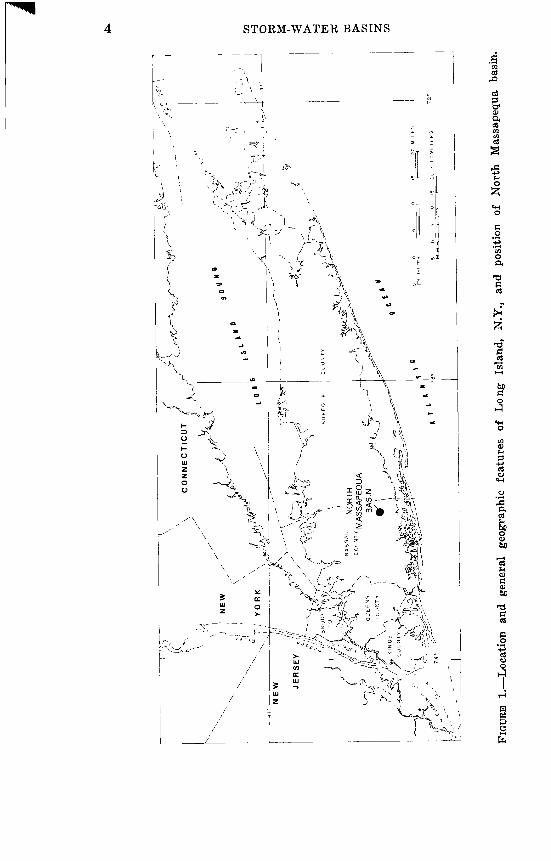
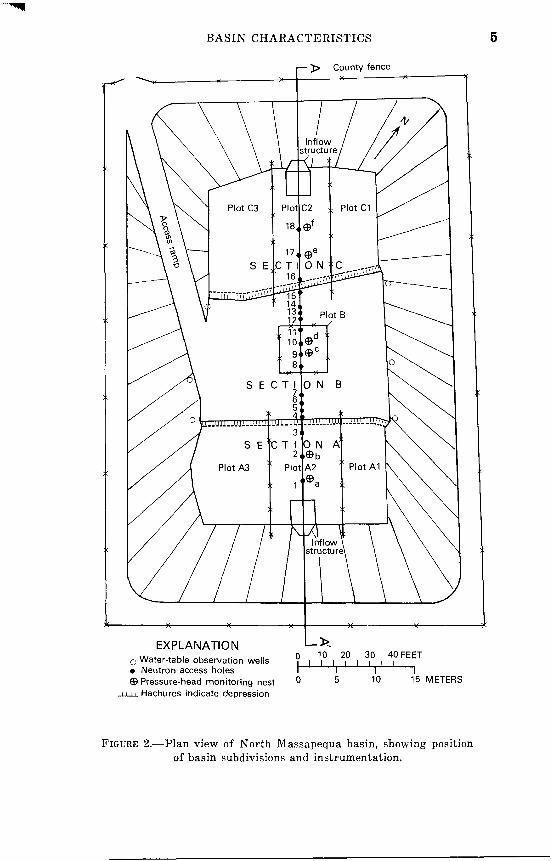
Ponding tests were made in a storm-water basin in the village of North Massapequa in southeastern Nassau County (fig. 1). The basin, hereafter referred to as the North Massapequa basin, is excavated in outwash-plain deposits of glacial origin, which consist primarily of homogeneous gravelly sand but also contain thin, discontinuous stringers and laminae of silt and clay. The basin has been in operation since 1954 and receives storm runoff from a drainage area of approximately 31 acres. Soil cover of the drainage area consists mainly of Haven loam, a yellowish- brown to dark-brown loam and silt-loam soil (Seaburn and Aron- son, 1973; Lounsbury and others, 1928).
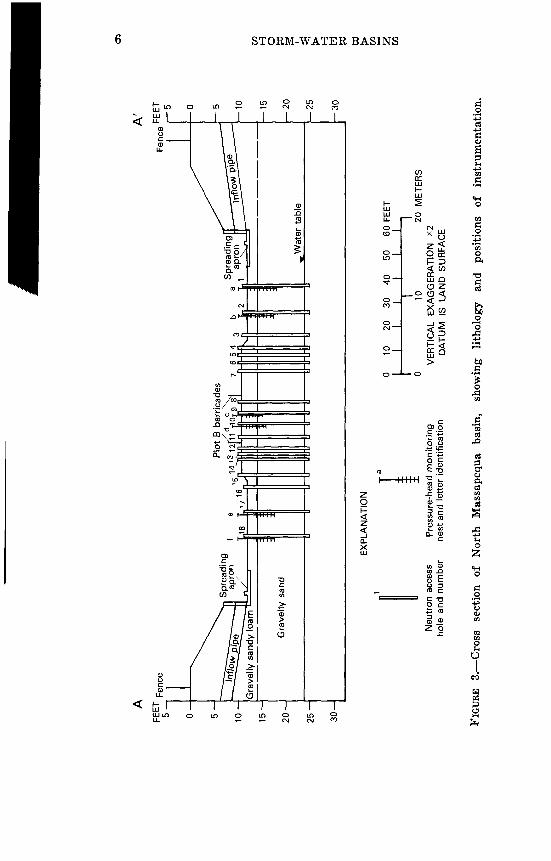
Storm runoff is discharged into the basin through inflow struc tures at the southeast and the northwest ends of the basin (figs. 2 and 3). The basin floor (fig. 2) consists of two lower levels (sections A and C) and a bench level (section B). Areas of sec tions A, B, and C are 4,550 ft2 , 4,620 ft2 , and 3,970 ft2 , respectively. Depth of the basin floor ranges from 12 to 13 ft below land sur face. The potential storage capacity (maximum volume of con tained water) is about 218,000 ft3 . The mean altitude of the floor is 51 ft above mean sea level, which is about 12 ft above the re gional water table.
Most storm runoff infiltrates through the lower levels (sections A and C) of the basin. Observations indicate that the lower levels may be flooded several times in a month, whereas the bench level is flooded only a few times a year. The dense cover of grass at the lower levels, in contrast to the sparse cover of grass at the bench level, is also evidence that the frequency of flooding is markedly greater at the lower levels.
The materials between the basin floor and the water table are separable into two major strata 1 a surface stratum classified as gravelly, sandy loam, and an underlying stratum classified as gravelly sand. (See fig. 3.) A particle-size analysis of samples collected from the two strata is presented in table 1. The gravelly
1 Materials are described according to soil-survey nomenclature (Soil Survey Staff, 1951).
NA
SS
AU
N
OR
TH
COMN
T'M
AS
SA
PE
QU
A
BA
SIN
t/2
H
O W
> 02 i (
^
CX2
FJGU
BB
l.-L
oca
tio
n
and
gene
ral
geog
raph
ic
feat
ures
of
L
ong
Isla
nd,
N.Y
., an
d po
sitio
n of
N
orth
M
assa
pequ
a ba
sin.
BASIN CHARACTERISTICS
I ̂ > County fence
EXPLANATIONo Water-table observation wells 9 , 1|° , 2,0 , 3,° , 4,° FEET Neutron access holes I T"^ V I © Pressure-head monitoring nest 0 5 10 15 METERS
Hachures indicate depression
FIGURE 2. Plan view of North Massapequa basin, showing position of basin subdivisions and instrumentation.
O5
AFE
ET
5-i
0-
5 -
10
-
15-
20-
25
30
-
Fenc
e
^~~
-T ~
_^
^T
I S
prea
ding
£
!!°w
j}ip
e U
aPro
n f
Gra
velly
sandyl
oa7ri~
''^ru^=
:'
Gra
velly
san
d
e 18
1716
EX
PLA
NA
TIO
N1
15 _/ y :!
Plo
t B
barr
icad
es
14 '3
12
(^^0
: g^j
7 6
a
-
0 0
5 4
3 b
S_
1020
|
a 2
U
30
|I in
Fe
/
nee
f^r^
gg
gg
^1
T W
ater
tab
le
40
50
60 F
EE
T!
1 I
1 20
M
FT
FR
S
V FEET
5 r>
STORM-WATER
BASINS
, .a °
if?
8
{Q
g1
1
1
1
1
1
Neu
tron
acc
ess
Pre
ssur
e-he
ad m
on
itorin
g
hole
and
num
ber
nest
and
letter
ide
ntif
ica
tion
VE
RTI
CA
L E
XA
GG
ER
AT
ION
X
2 D
AT
UM
IS
LA
ND
S
UR
FAC
E
FIG
URE
3. C
ross
se
ctio
n of
N
orth
M
assa
pequ
a ba
sin,
sh
owin
g li
thol
ogy
and
posi
tion
s of
in
stru
men
tati
on.
SELECTION OF TEST PLOTS 7
sandy loam stratum is approximately 2 ft thick at the lower levels and approximately 3 ft at the bench level. At the lower basin levels, the upper 0.3 ft of the sandy, gravelly loam is approximately 30 percent organic matter, but the upper 0.1 ft of this stratum at bench level is only about 5 percent organic matter.
TABLE. 1. Particle-size range in soil samples from major strata of unsatu- rated zone, near center of plot A2
Percentage of particles in each size range in soil samples from specified depth interval below land surface
Particle diameter, in millimeters
Clay: <0.004
Silt: 0.004-0.0625- _
Sand: 0.0625-0.125 -.0.125-0.250.25-0.50.5-1 _ _
Gravel :1-22-4_ _____ __4-88-1 6_ _
16-32 __32-64
0.4 ft to (1.7 ft (gravelly, sandy loam)
_____ . 16.5 i
17.9 /
. _ __ 1.45.5
19.9_ _ . 23.3
4.53.7
_____ 2.92.91.50
2.6 ft to 2.9 ft (gravelly sand)
0.5
.2 2.3
21.3 9.9
8.5 9.1
14.6 18.8 14.8
0
SELECTION OF TEST PLOTS
Seven plots were delineated for the ponding tests. The position and the layout of the plots are shown in figures 2 and 4. Location and size of plots were based on (1) estimates of the infiltration rate at each of the sections, (2) quantity of water available for testing, and (3) ease of containing water within the test area.
Infiltration rates were estimated to be 2 ft/h for sections A and C and 4 ft/h for section B. These estimates were based on visual examination of split-spoon samples collected at the basin and on infiltration rates observed at other storm-water basins of similar lithology (Seaburn and Aronson, 1973).
Treated municipal water, which can be obtained from fire hy drants at rates as high as 4,000 ft3/h, was used in the tests. To compute the maximum size of a test plot, the available water supply was considered to be 3,000 ftyh to ensure a supply of 1,000 ft3 /h to fill the test plot during the early part of the tests.
The maximum area for each test plot was determined by divid ing the available water supply by the estimated infiltration rate. The maximum size of the test plots at sections A and C was 1,500 ft2 , and at section B, 750 ft2 .
STORM-WATER BASINS
Hose from fire hydrant
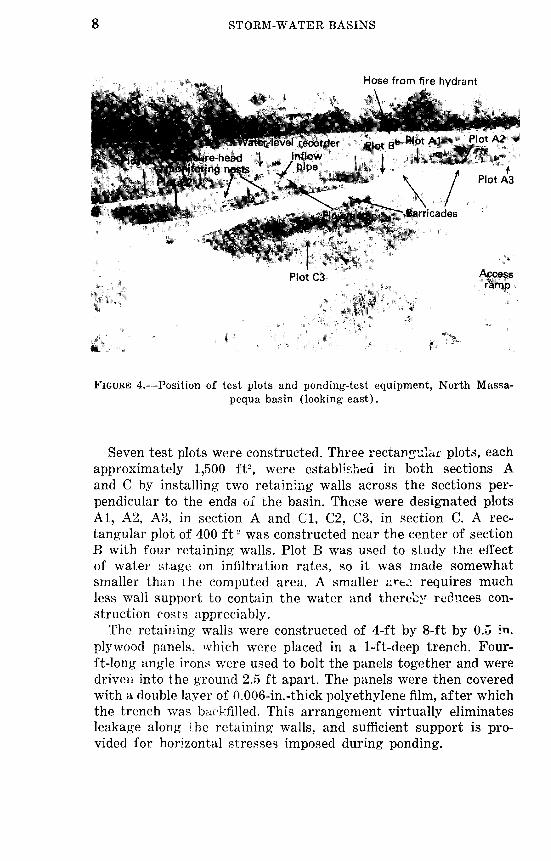
FIGURE 4. Position of test plots and ponding-test equipment, North Massa- pequa basin (looking east).
Seven test plots were constructed. Three rectangular plots, each approximately 1,500 ft2 , were established in both sections A and C by installing two retaining walls across the sections per pendicular to the ends of the basin. These were designated plots Al, A2, A3, in section A and Cl, C2, C3, in section C. A rec tangular plot of 400 ft ~ was constructed near the center of section B with four retaining walls. Plot B was used to study the effect of water stage on infiltration rates, so it was made somewhat smaller than the computed area. A smaller area requires much less wall support to contain the water and thereby reduces con struction costs appreciably.
The retaining walls were constructed of 4-ft by 8-ft by 0.5 in. plywood panels, which were placed in a 1-ft-deep trench. Four- ft-long angle irons were used to bolt the panels together and were driven into the ground 2.5 ft apart. The panels were then covered with a double layer of 0.006-in.-thick polyethylene film, after which the trench was backfilled. This arrangement virtually eliminates leakage along the retaining walls, and sufficient support is pro vided for horizontal stresses imposed during ponding.
FIELD MEASUREMENTS OF INFILTRATION CAPACITY 9
FIELD MEASUREMENTS
During all ponding tests, measurements included water stage, temperature of ponded water and air, and quantity of water ap plied. During tests at plots A2, B, and C2, measurements also included moisture content and pressure head in the unsaturated zone as well as water-table altitude.
The quantity of water applied to a plot was measured by read ings from a totalizing flow meter taken at selected time intervals. Moisture content, pressure head, and water-table altitude were measured at selected time intervals. Water stage, and air and water temperatures, were recorded continuously. Zero water stage was considered equivalent to average land-surface altitude of the test plot.
Location of the neutron access holes for measuring moisture content and the nests for measuring pressure head are shown in figure 2. All sites were along a northwest-southeast traverse that divided test plots A2, B, and C2 approximately in half. The access tubing through which moisture content was measured consisted of aluminum tubing with a 2-in. outside diameter and a 1/16-in. wall thickness. Moisture content was measured with a continuous- logging nuclear meter (Prill and Meyer, 1968).
Nests for measuring pressure head consisted of several piezom eters and tensiometers. Piezometers were placed in zones expected to be under positive pressure during a test; tensiometers were placed in zones expected to be under negative pressure. The piezometers were constructed of Y^-in.-diameter galvanized iron pipe with a drive point welded to the base. The pipe was perforated near the bottom. Perforations were covered with fiberglass gauze to prevent the entrance of soil particles. Measurements were made with steel tape. Tensiometers consisted of a water-filled plastic tube with a porous ceramic cup attached to one end and a mercury manometer attached to the other. Standard procedures of Black (1965) were used to calibrate and install the tensiometers.
Air and water temperatures were continuously monitored with a dual-recording thermograph. Water added to the test sites was measured by two propellor-type totalizing flowmeters. One flow- meter was capable of measuring flow in the range from 6 to 125 gal'min, and the other, from 50 to 400 gal/min.
Water stage was monitored with a Stevens - Type-F water-level recorder installed on a portable stand. The recorder float was placed in a 6-in.-diameter by 3-ft-high perforated bakelite pipe,
- l*se of brand name is for identification purposes and does not indicate endorsement by Geological Survey.
10 STORM-WATER BASINS
which acted as a float guide and a buffer against water turbulence.Water for the ponding tests was obtained from a fire hydrant
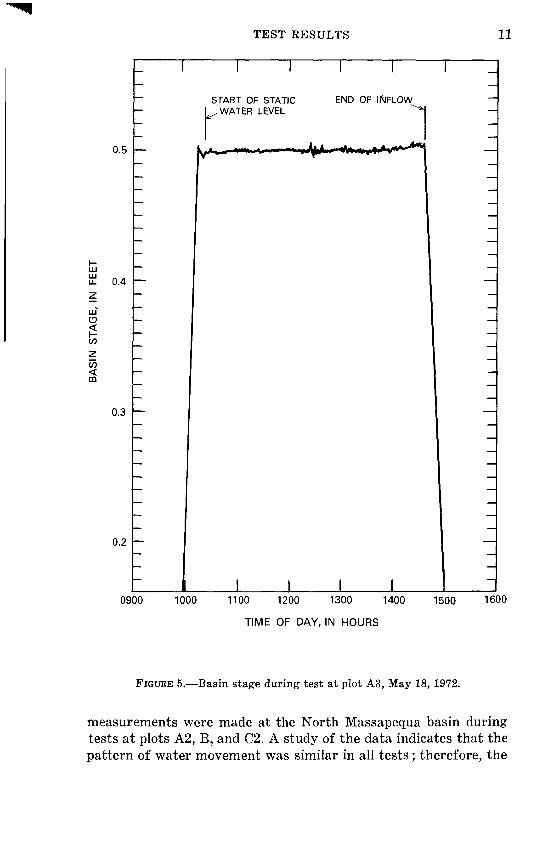
about 50 ft from the east corner of the basin. Inflow to the pond ing sites was regulated by a gate valve. A 5-ft length of 4-in.- diameter cast-iron pipe was placed between the gate valve and the flowmeter to reduce turbulence. After the desired water stage was reached, the gate valve was adjusted until the trace of the water-level recorder became horizontal. Some trial-and-error ef forts were needed to obtain a flat trace, but careful monitoring of the recorder during valve adjustment made corrections for small rises or declines in water levels easy. In most tests, a horizontal trace was obtained within a 15-minute adjustment period; subse quent water-level fluctuations were kept within ± 0.01 ft. A typi cal trace is shown in figure 5.
Infiltration in this report is expressed as a rate per unit area at a water temperature of 15.6° C and was determined by the equation :
,at yx
where
/ is the infiltration rate, in feet per hour ;i is the volume of inflow, in cubic feet, during a specified
time interval;a is the area of the test plot, in square feet;t is the time interval, in hours ;
V2 is the kinematic viscosity of water in test plot;Vi is the kinematic viscosity of water at 15.6° C.
TEST RESULTS
Duration of high-intensity storms on Long Island generally does not exceed several hours (Miller and Frederick, 1969). Thus, in basins with high infiltration rates, such as the North Massa- pequa basin, peak loading tends to occur shortly after the begin ning of a storm (Seaburn and Aronson, 1974). Accordingly, the most useful ponding-test measurements for evaluating perform ance of storm-water basins are those obtained during the early period of a test. Most of the data in this report were collected during the early hours of 15 ponding tests.
FLOW IN THE UNSATURATED ZONE
Movement of water through the unsaturated zone can be char acterized from moisture and pressure-head measurements. These
TEST RESULTS 11
u <CO
0.5
0.4
0.3
0.2
START OF STATIC WATER LEVEL
END OF INFLOW
0900 1000 1100 1200 1300 1400
TIME OF DAY, IN HOURS
1500 1600
FIGURE 5. Basin stage during test at plot A3, May 18, 1972.
measurements were made at the North Massapequa basin during tests at plots A2, B, and C2. A study of the data indicates that the pattern of water movement was similar in all tests; therefore, the
12 STORM-WATER BASINS
discussion of water movement is based on only one of the tests that of October 15, 1971, at test plot A2.
MOISTURE BUILDUP
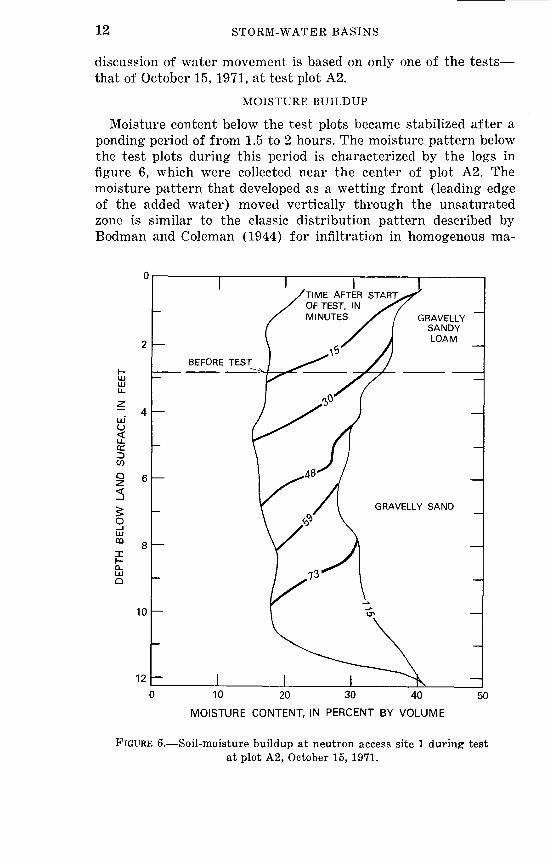
Moisture content below the test plots became stabilized after a ponding period of from 1.5 to 2 hours. The moisture pattern below the test plots during this period is characterized by the logs in figure 6, which were collected near the center of plot A2. The moisture pattern that developed as a wetting front (leading edge of the added water) moved vertically through the unsaturated zone is similar to the classic distribution pattern described by Bodman and Coleman (1944) for infiltration in homogenous ma-
I ITIME AFTER STARTOF TEST, INMINUTES >- / GRAVELLY
SANDY LOAM
10 20 30 40
MOISTURE CONTENT, IN PERCENT BY VOLUME
FIGURE 6. Soil-moisture buildup at neutron access site 1 during test at plot A2, October 15, 1971.
TEST RESULTS 13
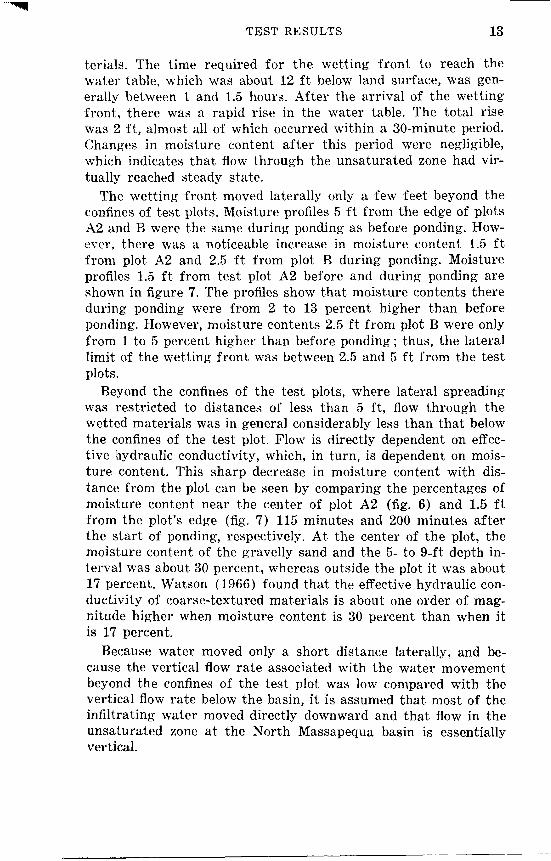
terials. The time required for the wetting front to reach the water table, which was about 12 ft below land surface, was gen erally between 1 and 1.5 hours. After the arrival of the wetting front, there was a rapid rise in the water table. The total rise was 2 ft, almost all of which occurred within a 30-minute period. Changes in moisture content after this period were negligible, which indicates that flow through the unsaturated zone had vir tually reached steady state.
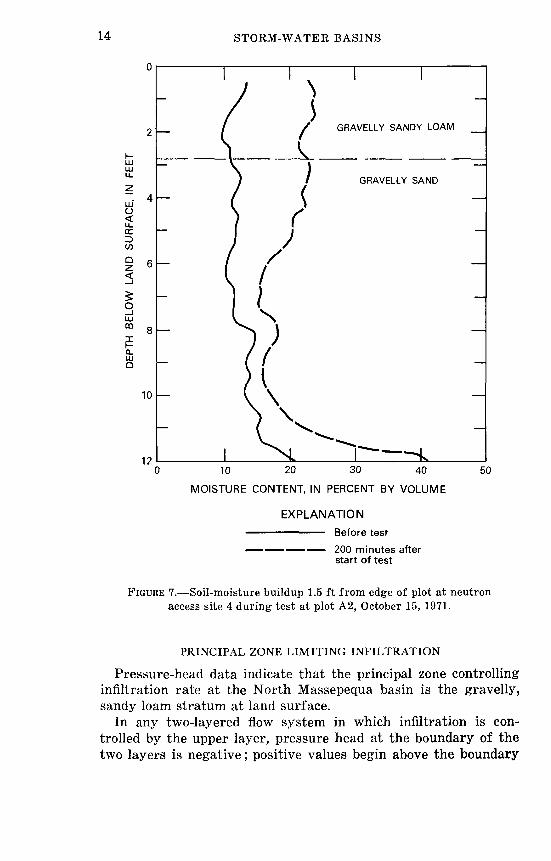
The wetting front moved laterally only a few feet beyond the confines of test plots. Moisture profiles 5 ft from the edge of plots A2 and B were the same during ponding as before ponding. How ever, there was a noticeable increase in moisture content 1.5 ft from plot A2 and 2.5 ft from plot B during ponding. Moisture profiles 1.5 ft from test plot A2 before and during ponding are shown in figure 7. The profiles show that moisture contents there during ponding were from 2 to 13 percent higher than before ponding. However, moisture contents 2.5 ft from plot B were only from 1 to 5 percent higher than before ponding; thus, the lateral limit of the wetting front was between 2.5 and 5 ft from the test plots.
Beyond the confines of the test plots, where lateral spreading was restricted to distances of less than 5 ft, flow through the wetted materials was in general considerably less than that below the confines of the test plot. Flow is directly dependent on effec tive hydraulic conductivity, which, in turn, is dependent on mois ture content. This sharp decrease in moisture content with dis tance from the plot can be seen by comparing the percentages of moisture content near the center of plot A2 (fig. 6) and 1.5 ft from the plot's edge (fig. 7) 115 minutes and 200 minutes after the start of ponding, respectively. At the center of the plot, the moisture content of the gravelly sand and the 5- to 9-ft depth in terval was about 30 percent, whereas outside the plot it was about 17 percent. Watson (1966) found that the effective hydraulic con ductivity of coarse-textured materials is about one order of mag nitude higher when moisture content is 30 percent than when it is 17 percent.
Because water moved only a short distance laterally, and be cause the vertical flow rate associated with the water movement beyond the confines of the test plot was low compared with the vertical flow rate below the basin, it is assumed that most of the infiltrating water moved directly downward and that flow in the unsaturated zone at the North Massapequa basin is essentially vertical.
14 STORM-WATER BASINS
10
12
GRAVELLY SANDY LOAM
GRAVELLY SAND
10 20 30 40
MOISTURE CONTENT, IN PERCENT BY VOLUME
EXPLANATION
Before test
50
200 minutes after start of test
FIGURE 7. Soil-moisture buildup 1.5 ft from edge of plot at neutron access site 4 during test at plot A2, October 15, 1971.
PRINCIPAL ZONE LIMITING INFILTRATION
Pressure-head data indicate that the principal zone controlling infiltration rate at the North Massepequa basin is the gravelly, sandy loam stratum at land surface.
In any two-layered flow system in which infiltration is con trolled by the upper layer, pressure head at the boundary of the two layers is negative; positive values begin above the boundary
TEST RESULTS 15
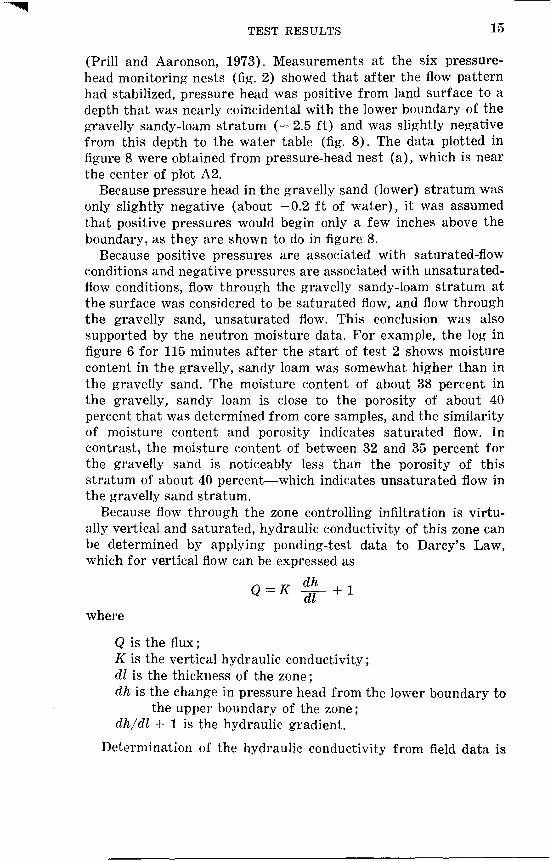
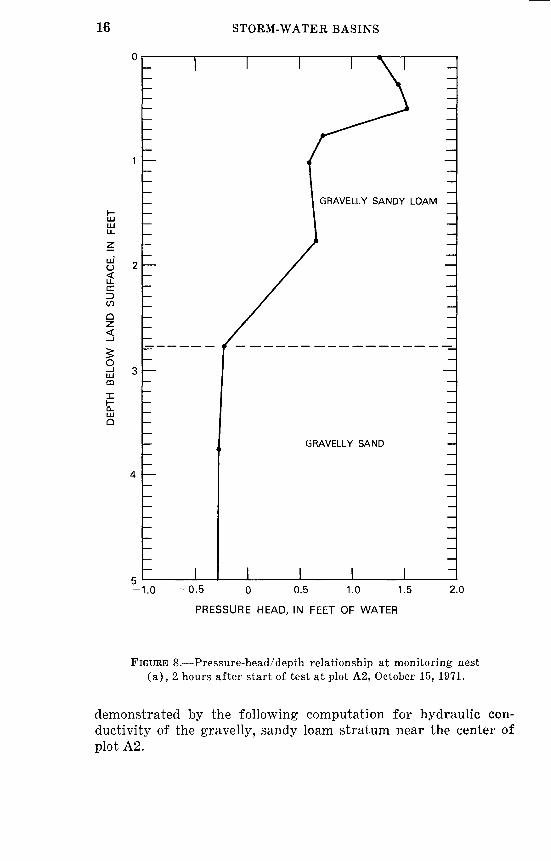
(Prill and Aaronson, 1973). Measurements at the six pressure- head monitoring nests (fig. 2) showed that after the flow pattern had stabilized, pressure head was positive from land surface to a depth that was nearly coincidental with the lower boundary of the gravelly sandy-loam stratum (« 2.5 ft) and was slightly negative from this depth to the water table (fig. 8). The data plotted in figure 8 were obtained from pressure-head nest (a), which is near the center of plot A2.
Because pressure head in the gravelly sand (lower) stratum was only slightly negative (about -0.2 ft of water), it was assumed that positive pressures would begin only a few inches above the boundary, as they are shown to do in figure 8.
Because positive pressures are associated with saturated-flow conditions and negative pressures are associated with unsaturated- flow conditions, flow through the gravelly sandy-loam stratum at the surface was considered to be saturated flow, and flow through the gravelly sand, unsaturated flow. This conclusion was also supported by the neutron moisture data. For example, the log in figure 6 for 115 minutes after the start of test 2 shows moisture content in the gravelly, sandy loam was somewhat higher than in the gravelly sand. The moisture content of about 38 percent in the gravelly, sandy loam is close to the porosity of about 40 percent that was determined from core samples, and the similarity of moisture content and porosity indicates saturated flow. In contrast, the moisture content of between 32 and 35 percent for the gravelly sand is noticeably less than the porosity of this stratum of about 40 percent which indicates unsaturated flow in the gravelly sand stratum.
Because flow through the zone controlling infiltration is virtu ally vertical and saturated, hydraulic conductivity of this zone can be determined by applying ponding-test data to Darcy's Law, which for vertical flow can be expressed as
Q = K dh + 1
where
Q is the flux;K is the vertical hydraulic conductivity;dl is the thickness of the zone;dh is the change in pressure head from the lower boundary to
the upper boundary of the zone; dh/dl + 1 is the hydraulic gradient.
Determination of the hydraulic conductivity from field data is
16 STORM-WATER BASINS
-1.0 -0.5 0 0.5 1.0 1.5
PRESSURE HEAD, IN FEET OF WATER
FIGURE 8. Pressure-head/depth relationship at monitoring nest (a), 2 hours after start of test at plot A2, October 15, 1971.
demonstrated by the following computation for hydraulic con ductivity of the gravelly, sandy loam stratum near the center of plot A2.
TEST RESULTS 17
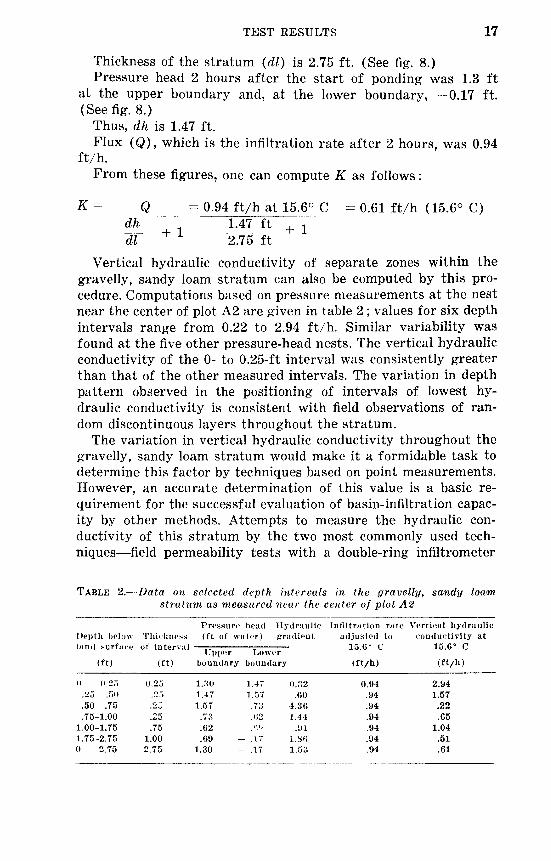
Thickness of the stratum (dl) is 2.75 ft. (See fig. 8.)Pressure head 2 hours after the start of ponding was 1.3 ft
at the upper boundary and, at the lower boundary, 0.17 ft. (See fig. 8.)
Thus, dh is 1.47 ft.Flux (Q), which is the infiltration rate after 2 hours, was 0.94
ft/h.From these figures, one can compute K as follows:
K = Q = 0-94 ft/h at 15.6° C = 0.61 ft/h (15.6° C)^L 1.47 ft + 1dl 2.75 ft
Vertical hydraulic conductivity of separate zones within the gravelly, sandy loam stratum can also be computed by this pro cedure. Computations based on pressure measurements at the nest near the center of plot A2 are given in table 2 ; values for six depth intervals range from 0.22 to 2.94 ft/h. Similar variability was found at the five other pressure-head nests. The vertical hydraulic conductivity of the 0- to 0.25-ft interval was consistently greater than that of the other measured intervals. The variation in depth pattern observed in the positioning of intervals of lowest hy draulic conductivity is consistent with field observations of ran dom discontinuous layers throughout the stratum.
The variation in vertical hydraulic conductivity throughout the gravelly, sandy loam stratum would make it a formidable task to determine this factor by techniques based on point measurements. However, an accurate determination of this value is a basic re quirement for the successful evaluation of basin-infiltration capac ity by other methods. Attempts to measure the hydraulic con ductivity of this stratum by the two most commonly used tech niques field permeability tests with a double-ring infiltrometer
TABLE 2. Data on selected depth intervals in the gravelly, sandy loam, stratum as measured near the center of plot A2
Depth below land surface
(ft)
o -((.25.25- .50.50- .75.75-1.00
1.00-1.751.75-2.750 -2.75
Thickness of interval
(ft)
0.25.25.25.25.75
1.002.75
Pressure head Hydraulic-(ft of water) gradient
Upperboundary
1.301.471.57
.73
.62
.691.30
Lowerboundary
1.47 0.321.57 .60.73 4.36.02 1.44/'.'I .91.17 l.Sfi.17 1.53
Infiltration rateadjusted to
0.
(ft/h)
0.94.94.94.94.94.94.94
Vertical hydraulicconductivity at
15.6° C
(ft/h)
2.941.57.22.65
1.04.51.61
18 STORM-WATER BASINS
(Bouwer, 1961) and laboratory permeability tests with undis turbed cores were unsuccessful. Most of the tests with the double- ring infiltrometer were not completed because of washing away of soil around the cylinder; and results of tests that were com pleted did not compare favorably with ponding-test results. For instance, two tests in the 0.25- to 0.50-ft interval gave values that were 6 and 31 times lower than ponding test values, whereas tests in each of the 0.50- to 0.75-ft and 1.00- to 1.75-ft intervals gave values that were 9 and 17 times higher, respectively.
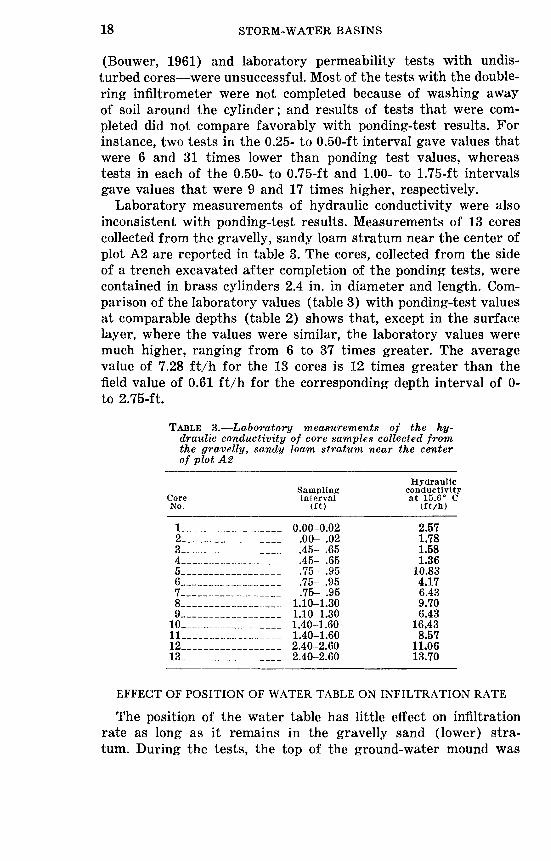
Laboratory measurements of hydraulic conductivity were also inconsistent with ponding-test results. Measurements of 13 cores collected from the gravelly, sandy loam stratum near the center of plot A2 are reported in table 3. The cores, collected from the side of a trench excavated after completion of the ponding tests, were contained in brass cylinders 2.4 in. in diameter and length. Com parison of the laboratory values (table 3) with ponding-test values at comparable depths (table 2) shows that, except in the surface layer, where the values were similar, the laboratory values were much higher, ranging from 6 to 37 times greater. The average value of 7.28 ft/h for the 13 cores is 12 times greater than the field value of 0.61 ft/h for the corresponding depth interval of 0- to 2.75-ft.
TABLE 3. Laboratory measurements of the hy draulic conductivity of core samples collected from the gravelly, sandy loam stratum near the center of plot A2
Core No.
1_ _2 _ _ __ .345_ _6_7__ __8_9_
10 ______ .1112_13__ _____ _.
Sampling interval
(ft)
0.00-0.02.00- .02.45- .65
__ .45- .65.75- .95.75- .95.75- .95
1.10-1.30__ 1.10-1.30
1.40-1.60. __ _ 1.40-1.60
2.40-2.602.40-2.60
Hydraulic conductivity at 15.6° C
(ft/h)
2.571.781.581.36
10.834.176.439.706.43
16.438.57
11.0613.70
EFFECT OF POSITION OF WATER TABLE ON INFILTRATION RATE
The position of the water table has little effect on infiltration rate as long as it remains in the gravelly sand (lower) stra tum. During the tests, the top of the ground-water mound was
TEST RESULTS 19
about 7 ft below the lower boundary of the gravelly, sandy loam stratum, and pressure head at the boundary of the gravelly sand and the gravelly, sandy loam strata was about 0.2 ft of water. A 7-ft rise in the water table would increase the pressure head at this boundary to zero, or atmospheric level, and as indicated by previous computations, the resulting decrease in hydraulic gradient would cause a slight decrease in infiltration rate.
INFILTRATION MEASUREMENTS
In setting up a test program for evaluating the performance of a storm-water basin, the investigator will need to make certain decisions for example, number of ponding tests required, loca tion of test plots, time of year for the ponding tests, and selection of water stage of the ponds and these decisions will depend primarily on how infiltration rate is likely to vary with time and space at a basin. Results of the North Massapequa basin tests as outlined in the following paragraphs provide information that is applicable to basins constructed in coarse-textured glacial-outwash deposits.
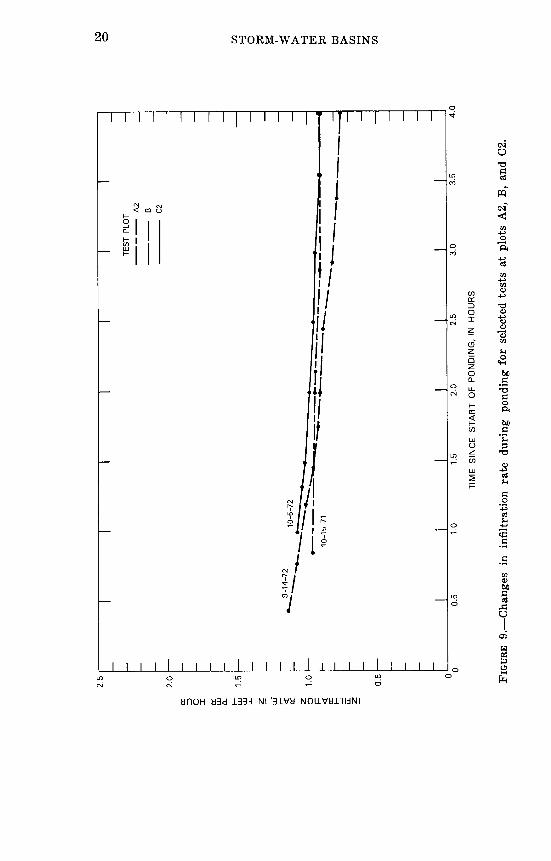
CHANGE IN INFILTRATION RATE DURING TESTS
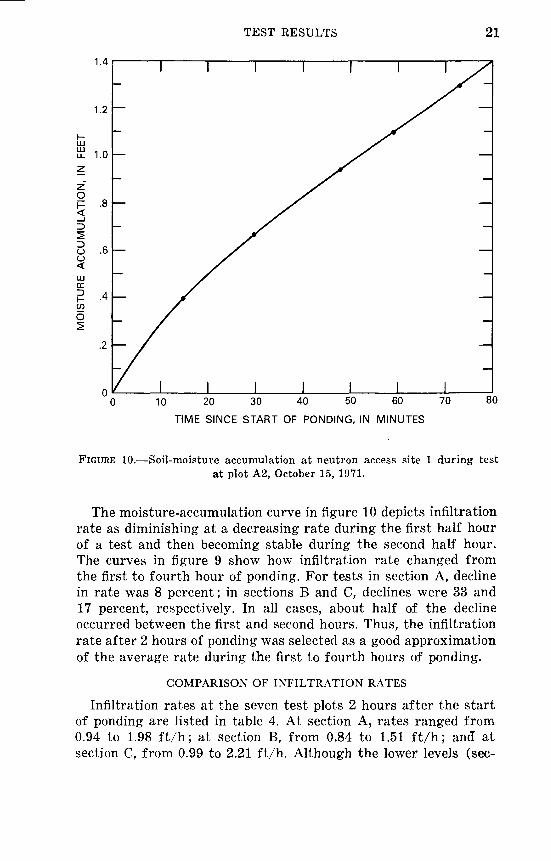
The pattern of change in infiltration rate during tests was similar at all test plots; during the early minutes of a test the rates declined, then tended to stabilize. The change in rate after the test plots were filled to a designated stage is shown by the graphs of infiltration rate as a function of ponding duration in figure 9. The rate changes during the three tests on October 15, 1971, September 14, 1972, and October 5, 1972 are characteristic of the changes observed during all tests in sections A, B, and C, respectively. Although measurements of infiltration rate could not be made during the early minutes of the tests, both inflow and neutron moisture measurements indicate that the rate stabil ized within half an hour after the start of a test. This is illustrated by the cumulative moisture curve in figure 10, which was developed from the moisture logs in figure 6 by plotting the moisture ac cumulation that occurred in the unsaturated zone after the start of the test for each of five time intervals between 15 and 73 minutes. Because flow through the unsaturated zone was essen tially vertical, the increase in moisture with time was nearly equal to cumulative infiltration before the wetting front reached the water table. Accordingly, the rate of moisture accumulation, which is represented by the slope of the cumulative-moisture curve (fig. 10), should approximate infiltration rate.
2.5
to o
2.0
CE
Q.
u]
1.5
A2
B C2
H
O
0.5
10-1
5-71
td
0.5
1.0
1.5
2.0
2.5
TIM
E
SIN
CE
S
TA
RT
O
F
PO
ND
ING
, IN
H
OU
RS
3.0
3.5
4.0
FIG
URE
9
. C
han
ges
in
in
filt
rati
on
rate
du
ring
po
ndin
g fo
r se
lect
ed t
ests
at
plot
s A
2, B
, an
d C
2.
TEST RESULTS 21
1.4
1.2
LLJ
ffi 1.0
P .8
.6
.4
10 20 30 40 50 60 70
TIME SINCE START OF PONDING, IN MINUTES
80
FIGURE 10. Soil-moisture accumulation at neutron access site 1 during test at plot A2, October 15, 1971.
The moisture-accumulation curve in figure 10 depicts infiltration rate as diminishing at a decreasing rate during the first half hour of a test and then becoming stable during the second half hour. The curves in figure 9 show how infiltration rate changed from the first to fourth hour of ponding. For tests in section A, decline in rate was 8 percent; in sections B and C, declines were 33 and 17 percent, respectively. In all cases, about half of the decline occurred between the first and second hours. Thus, the infiltration rate after 2 hours of ponding was selected as a good approximation of the average rate during the first to fourth hours of ponding.
COMPARISON OF INFILTRATION RATES
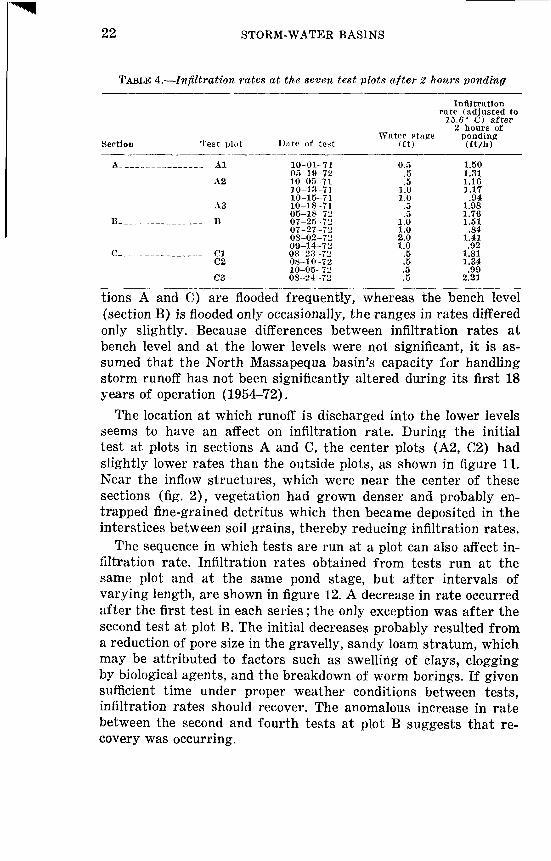
Infiltration rates at the seven test plots 2 hours after the start of ponding are listed in table 4. At section A, rates ranged from 0.94 to 1.98 ft/h; at section B, from 0.84 to 1.51 ft/h; and at section C, from 0.99 to 2.21 ft/h. Although the lower levels (sec-
22 STORM-WATER BASINS
TABLE 4. Infiltration rates at the seven test plots after 2 hours ponding
Section Test plot
A Al
A2
A3
B B
C ClC2
C3
Date of test
10 01 7105-19-72 10-05-71 10-13-71 10-15-71 10-18-71 05-18 72 07 25-7207-27-72 08-02-72 09-14-72 08 23-72 08-10-72 10-05-72 08-24 -72
Water stase (ft)
0.5 .5 .5
1.0 1.0
.5
.5 1.0 1.0 2.0 1.0
.5
.5 .5 .5
Infiltration rate (adjusted to
15.6° C) after 2 hours of
ponding (ft/h)
1.50 1.31 1.16 1.17
.94 1.98 1.76 1.51
.84 1.41 .92
1.81 1.34 .99
2.21
tions A and C) are flooded frequently, whereas the bench level (section B) is flooded only occasionally, the ranges in rates differed only slightly. Because differences between infiltration rates at bench level and at the lower levels were not significant, it is as sumed that the North Massapequa basin's capacity for handling storm runoff has not been significantly altered during its first 18 years of operation (1954-72).
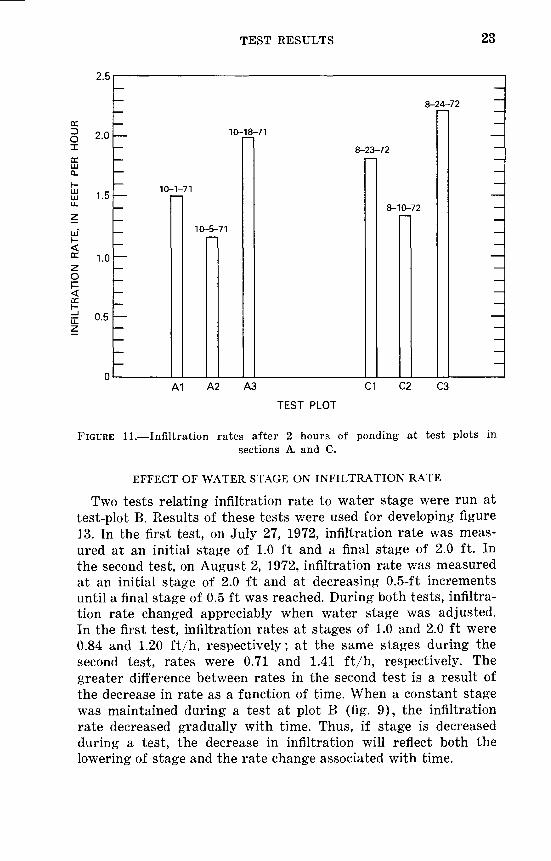
The location at which runoff is discharged into the lower levels seems to have an affect on infiltration rate. During the initial test at plots in sections A and C, the center plots (A2, C2) had slightly lower rates than the outside plots, as shown in figure 11. Near the inflow structures, which were near the center of these sections (fig. 2), vegetation had grown denser and probably en trapped fine-grained detritus which then became deposited in the interstices between soil grains, thereby reducing infiltration rates.
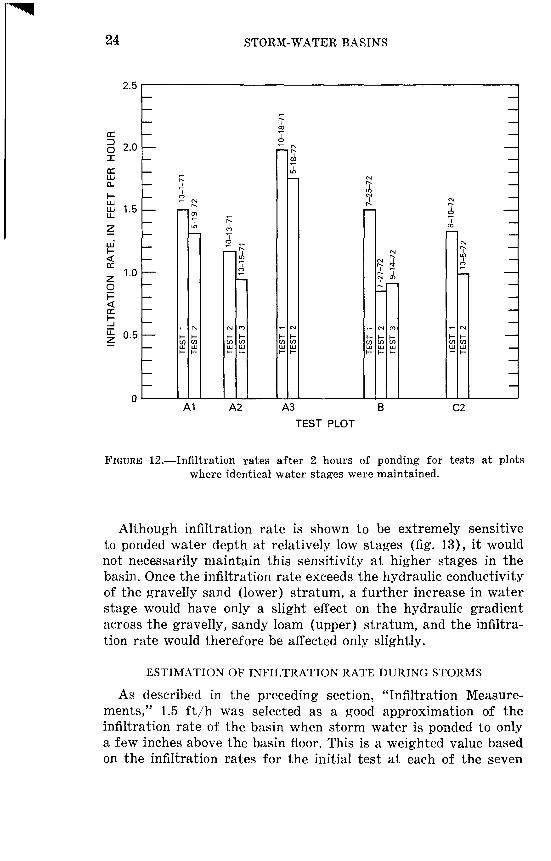
The sequence in which tests are run at a plot can also affect in filtration rate. Infiltration rates obtained from tests run at the same plot and at the same pond stage, but after intervals of varying length, are shown in figure 12. A decrease in rate occurred after the first test in each series; the only exception was after the second test at plot B. The initial decreases probably resulted from a reduction of pore size in the gravelly, sandy loam stratum, which may be attributed to factors such as swelling of clays, clogging by biological agents, and the breakdown of worm borings. If given sufficient time under proper weather conditions between tests, infiltration rates should recover. The anomalous increase in rate between the second and fourth tests at plot B suggests that re covery was occurring.
TEST RESULTS 23
cc0 2.0I
CCLUQ.
LU . r LU 1.0LL.
zLUK
^ 1.0z0
5PE| 0.5
n
~~ 8-24-72
, ___ 10-
~ 10-
_
-1-71
10-5-71
18--71
8-23-72
8-10-72
_
EA1 A2 A3 C1 C2 C3
TEST PLOT
FIGURE 11. Infiltration rates after 2 hours of ponding at test plots insections A and C.
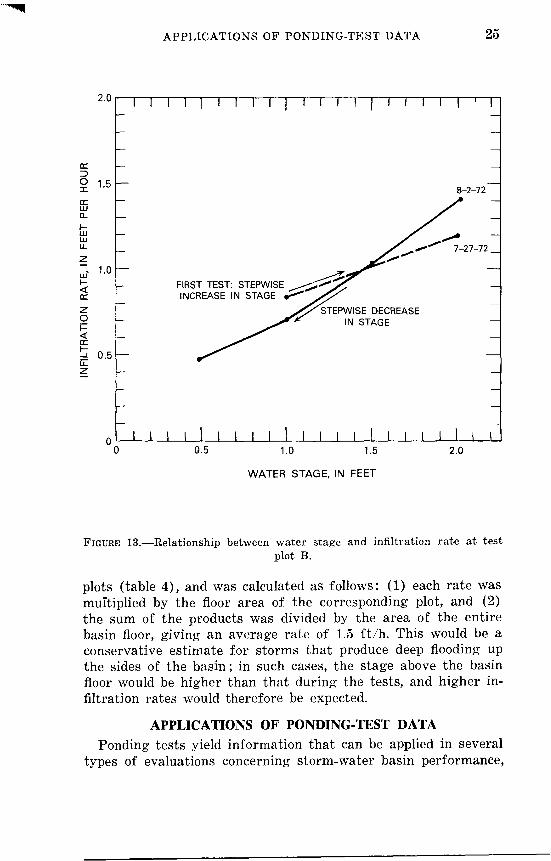
EFFECT OF WATER STAGE ON INFILTRATION RATE
Two tests relating infiltration rate to water stage were run at test-plot B. Results of these tests were used for developing figure 13. In the first test, on July 27, 1972, infiltration rate was meas ured at an initial stage of 1.0 ft and a final stage of 2.0 ft. In the second test, on August 2, 1972, infiltration rate was measured at an initial stage of 2.0 ft and at decreasing 0.5-ft increments until a final stage of 0.5 ft was reached. During both tests, infiltra tion rate changed appreciably when water stage was adjusted. In the first test, infiltration rates at stages of 1.0 and 2.0 ft were 0.84 and 1.20 ft/h, respectively; at the same stages during the second test, rates were 0.71 and 1.41 ft/h, respectively. The greater difference between rates in the second test is a result of the decrease in rate as a function of time. When a constant stage was maintained during a test at plot B (fig. 9), the infiltration rate decreased gradually with time. Thus, if stage is decreased during a test, the decrease in infiltration will reflect both the lowering of stage and the rate change associated with time.
24 STORM-WATER BASINS
QC
0 2.0X
QCUJD_
1- LLJuj 1.5 u_Z
LUI-
QC
zoI-DC
1
£ 0.5^-
n
- -
00
T
_ *"* i
T ot- CM
-
-
-
^_
Hw
3>*T 1s*
^
CM
1-
UJ
ci ^
CM
H
UJ
J)
5
CO
1-C/)
s
O
t_
,_C/)HI
? -J, _
CM
1-(/)UJ
CM
sCMJ CM
1 1
_
j_
w
<i T _
f>S 4 f~- 1.CM a>
-
CM
feHI
CO
fcUJ
CD
t_
H
UJ
CM
J)
O
CM
1-
wUJ
-
-
-
A1 A2 A3
TEST PLOT
C2
FIGURE 12. Infiltration rates after 2 hours of ponding for tests at plots where identical water stages were maintained.
Although infiltration rate is shown to be extremely sensitive to ponded water depth at relatively low stages (fig. 13), it would not necessarily maintain this sensitivity at higher stages in the basin. Once the infiltration rate exceeds the hydraulic conductivity of the gravelly sand (lower) stratum, a further increase in water stage would have only a slight effect on the hydraulic gradient across the gravelly, sandy loam (upper) stratum, and the infiltra tion rate would therefore be affected only slightly.
ESTIMATION OF INFILTRATION RATE DURING STORMS
As described in the preceding section, "Infiltration Measure ments," 1.5 ft/h was selected as a good approximation of the infiltration rate of the basin when storm water is ponded to only a few inches above the basin floor. This is a weighted value based on the infiltration rates for the initial test at each of the seven
APPLICATIONS OF PONDING-TEST DATA 25
2.0
1.5
~r 1.0
0.5
I I I I I I I
8-2-72
7-27-72 _
FIRST TEST: STEPWISE INCREASE IN STAGE
STEPWISE DECREASE IN STAGE
0.5 1.0 1-5
WATER STAGE, IN FEET
2.0
FIGURE 13. Relationship between water stage and infiltration rate at testplot B.
plots (table 4), and was calculated as follows: (1) each rate was multiplied by the floor area of the corresponding plot, and (2) the sum of the products was divided by the area of the entire basin floor, giving an average rate of 1.5 ft/h. This would be a conservative estimate for storms that produce deep flooding up the sides of the basin; in such cases, the stage above the basin floor would be higher than that during the tests, and higher in filtration rates would therefore be expected.
APPLICATIONS OF PONDING-TEST DATAPonding tests yield information that can be applied in several
types of evaluations concerning storm-water basin performance,

26 STORM-WATER BASINS
such as (1) the suitability of a basin for handling a supplemental water supply, (2) appropriate procedures for increasing the infiltration capacity of a basin, and (3) site selection and design of a new storm-water basin.
Although basins on Long Island are built for the disposal of storm runoff, many of them have the potential for handling large quantities of water from a supplemental source. If techniques can be developed for economically treating sewage effluent to produce water of satisfactory quality, returning the treated water to the aquifer through storm-water basins would seem to be a logical management alternative. Data from ponding tests could be used for determining the basins that would be most effective for this purpose and would also be of value in determining how best to apply the effluent. Data on infiltration rates are of prime im portance in basin selection, and information on how rates are controlled and on the manner in which water moves through the unsaturated zone is of importance in planning a management system for applying the water. For example, a mathematical model might be used to expedite planning. Test data would supply critical measurements required by the model, such as system geometry and the hydraulic conductivity of zones affecting in filtration, and would also provide information pertinent to the type of model selected. For example, at the North Massapequa basin, flow through the unsaturated zone is virtually vertical, which indicates that a one-dimensional model would be adequate.
If a storm-water basin is unable to contain all the runoff water, or if water is retained in the basin for extended periods after a storm, thereby creating safety or health hazards, it would be desirable to increase its infiltration capacity. To this end, ponding tests could be used to determine the most effective procedures. For example, data from the North Massapequa basin show that infiltration is controlled by a surface stratum of gravelly, sandy loam that ranges in thickness from 1.5 to 3.0 feet and that has markedly variable hydraulic conductivity. Procedures that might tend to increase the hydraulic conductivity of this stratum, such as deep scarification or introduction of vegetation with a deep root system, could be evaluated by the methods described in this report as to their effectiveness in improving the basin's infiltration capacity.
Ponding tests also help to clarify the relation of infiltration capacity to hydrogeologic conditions, which is of importance in selecting sites and designing new storm-water basins. For in stance, results from tests at the North Massapequa basin indicate
DESIGN OF A TEST PROGRAM 27
that if a proposed basin is to be in an area where the geologic materials consist of outwash sand and gravel (much of Long Island is underlain by such deposits), (1) it would probably be efficient in accepting storm runoff and may also be appropriate for supplemental recharge with treated wastewater; (2) the volume of water that can be absorbed would be relatively large (~1.5 ft 3 per hour per ft-) and (3) the basin would operate efficiently for a long period probably more than 20 years.
DESIGN OF A TEST PROGRAM
The structure of a ponding-test program is dependent on lithologic and hydrologic conditions at the basin, the determina tions needed, and experience from previous testing at other basins. As an example of how one might set up a testing program, let us assume that the following determinations are needed for a basin in outwash sand and gravel:1. An estimate of infiltration rate;2. A determination of how that rate is (a) controlled by strata
in the unsaturated zone, and (b) is affected by the position of the water table.
Results from the North Massapequa basin tests indicate that for basins in outwash sand and gravel, satisfactory assessment of the above factors could be obtained from data collected at two or three test plots. The plots should be positioned to represent infil tration conditions in the dominant types of lithologic materials; drill cuttings of the unsaturated zone and the basin's flooding pattern during storm runoff are useful in determining the posi tions of the plots.
A reasonable estimate of the infiltration capacity of the basin during storm runoff could probably be obtained from measure ments of infiltration rate during initial tests at the plots. The measurements would most likely be made at low water stage and would therefore represent the minimum infiltration capacity.
Assessment of how infiltration rate is controlled by materials in the unsaturated zone and is affected by water-table position could probably be obtained from moisture-content and pressure- head profiles obtained at a few locations and depths within a test plot. Although it is probably safe to assume that flow through the unsaturated zone is vertical, the flow pattern could be readily checked by moisture measurements about 5 ft from the test plots.
One test at each plot would probably be adequate to obtain the infiltration rate, but a second test may be needed to assess flow characteristics through the unsaturated zone. Installations for
28 STORM-WATER BASINS
obtaining pressure-head and moisture data before the first test could be designed on the basis of the lithologic characteristics inferred from drill cuttings. Data obtained during the first test should enable an investigator to judge whether data are needed from additional locations to provide a better understanding of water movement.
SUMMARY
Field data required for assessment of the performance of urban storm-water basins can be obtained through tests in which munic ipal water from a fire hydrant is ponded in test plots so that the manner in which water infiltrates and moves through the un- saturated zone can be observed. Tests were conducted at a storm- water basin excavated in glacial-outwash deposits on Long Island, N.Y. Major conclusions of the study are as follows:
1. Infiltration rate at the North Massapequa basin is controlled by a gravelly, sandy loam stratum at the surface, that ranges in thickness from 1.5 to 3.0 ft.
2. Measurements from ponding tests show that hydraulic con ductivity varies considerably throughout this zone as a re sult of random, discontinuous clay layers. At one location, values at six depth intervals within the zone ranged from 0.22 to 2.94 ft/h. Neither laboratory measurements of hydraulic conductivity from permeability tests on cores of undisturbed material, nor field tests with a double-ring infiltrometer compared favorably with direct measurements from ponding tests. The double-ring infiltrometer results were erratic, and laboratory values were generally many times higher than those obtained from the ponding tests.
3. Flow through the gravelly sand materials underlyling the sur face stratum is in an unsaturated state at pressure heads of about -0.2 ft of water. The low pressure heads suggest that the position of the water table has little effect on in filtration rate as long as the water table remains below the lower boundary of the controlling stratum.
4. Water movement through the unsaturated zone is vertical. Lateral movement does not exceed a distance of 5 ft from the edge of the ponding area. Flow through the materials wetted by lateral movement beyond the ponding area was considerably slower than that below the ponded area.
5. Infiltration rates declined during the early minutes of the tests and then tended to stabilize. Thus, an assumption of steady- state infiltration would probably be satisfactory for most analyses of basin performance during storm runoff. An ap-
REFERENCES CITED 29
proximation of the infiltration rate of the basin at low water stage is 1.5 ft/h.
6. Infiltration rates at the lower levels of the basin, which are subject to frequent flooding, were similar to those at the bench level, which is flooded only occasionally. Because infiltration rates seem to be unaffected by frequency of flood ing, it is assumed that the basin's infiltration capacity has probably not changed appreciably during its 22 years of operation as a storm-water basin.
REFERENCES CITED
Black, C. G., 1965, Methods of soil analysis: Madison, Wis., Am. Soc.Agronomy, Inc., 1572 p.
Bodman, G. B., and Coleman, E. A., 1944, Moisture and energy conditionsduring downward entry of water into soils: Soil Sci. Soc. America Proc.(1943), v. 8, p. 116-122.
Bouwer, Herman, 1961, A double-tube method for measuring hydraulicconductivity of soil in situ above a water table: Soil Sci. Soc. AmericaProc. 1961, v. 25, p. 334-339.
Lounsbury, C., Howe, F. B., Zautner, R. E., Moran, W. J., and Beers, P. D.,1928, Soil survey of Suffolk and Nassau Counties, New York: U.S. Dept.Agriculture, ser. 1928, no. 28, 46 p.
Miller, J. F., and Frederick, R. H., 1969, The precipitation regime of LongIsland, New York: U.S. Geol. Survey Prof. Paper 627-A, 21 p.
Prill, R. C., and Aaronson, D. B., 1973, Flow characteristics of a subsurface- controlled recharge basin on Long Island, New York: U.S. Geol. SurveyJour. Research, v. 1, no. 6, Nov.-Dec. 1973, p. 735-744.
Prill, R. C., and Meyer, W. R., 1968, Neutron moisture measurements bycontinuous- and point-logging procedures, in Geological Survey Research,1968: U.S. Geol. Survey Prof. Paper 600-B, p. B226^B230.
Seaburn, G. E., and Aronson, D. A., 1973, Catalogue of recharge basins onLong Island, New York: New York State Dept. Environmental Conserv.,Bull. 70, 80 p.
1974, Influence of recharge basins on the hydrology of Nassau andSuffolk Counties, Long Island, New York: U.S. Geol. Survey Water- Supply Paper 2031, 66 p.
Soil Survey Staff, 1951, Soil survey manual: U.S. Agriculture Handb. 18,U.S. Dept. of Agriculture, 503 p.
Watson, K. K., 1966, An instantaneous profile method for determining thehydraulic conductivity of unsaturated porous material: Water ResourcesResearch, v. 2, no. 4, p. 709-715.
1.S. GOVERNMENT PRINTING OFFICE: 1978 O 281-359'163