Embed Size (px)
Citation preview
Effect of Manure Ponding
on
Soil Hydraulic Properties
A Thesis
Submitted to the Faculty of Graduate Studies
in Partial Fulfillment of the Requirements
for the Degree of Masters of Science
in the Department of
Agricultural and Bioresource Engineering
University of Saskatchewan
Saskatoon
By
Terrance Alden Fonstad
Fall1996
© Copyright Terrance A. Fonstad, 1996. All rights reserved
PERMISSION TO USE
In presenting this thesis in partial fulfillment of the requirements for a Postgraduate degree
from the University of Saskatchewan, I agree that the Libraries of this University may
make it freely available for inspection. I further agree that permission for copying of this
thesis in any manner, in whole or in part, for scholarly purposes may be granted by the
professor or professors who supervised my thesis work or, in their absence, by the Head
of the Department or the Dean of the College in which my thesis work was done. It is
understood that any copying or publication or use of this thesis or parts thereof for
fmancial gain shall not be allowed without my written permission. It is also understood
that due recognition shall be given to me and to the University of Saskatchewan in any
scholarly use which may be made of any material in my thesis.
Request for permission to copy or to make other use of material in this thesis in
whole or in part should be addressed to:
Head of the Department of Agricultural and Bioresource Engineering
University of Saskatchewan
Saskatoon, Saskatchewan S7N OWO
ABSTRACT
The purpose of this study was to extend previous studies investigating the clogging of soil
by ponded hog manure and to clarify the meaning and the magnitude of the "manure seal".
Specific objectives are related to the effect of clogging upon soil hydraulic conductivity:
1) to measure the effect of clogging with time,
2) to measure the effect of clogging with depth, and
3) to determine the effect of soil texture upon clogging.
Seven soils were studied in column tests in a controlled environment. Hog manure was
ponded on the soils for a period of 185 days and the soils were monitored for changes in
apparent hydraulic conductivity, hydraulic conductivity with depth and visual alterations.
The soil-manure interface was found to govern infiltration into the soil and the apparent
hydraulic conductivity of the soil column. This layer was 5 mm to 7 mm thick and was a
result of particulate matter in the manure clogging the surface soil pores which increased
in thickness with time. Soils below this layer retained their ability to conduct flow with
the exception of some reduction in hydraulic conductivity caused by small particulate
matter passing through the clogged layer and air entrapment caused by fermentation.
The clogging of the soil reduced the apparent hydraulic conductivity of the soil columns to
less than 10-6 cm/s within 5 to 25 days and to less than 10-7 cm/s within 20 to 30 days.
The time required to reduce the apparent hydraulic conductivity of the soil column was
dependent on soil texture and was less for soils with less than 25 % clay content and more
for soils with more than 25% clay content.
ii

ACKNOWLEDGEMENTS
I wish to acknowledge the assistance and guidance from my supervisor, Professor C.P.
Maule of the Department of Agricultural and Bioresource Engineering, my committee
members and my fellow students. Funding for this project was provided by the Canada
Saskatchewan Green Plan Agreement on Agriculture and SPI Marketing Group.
iii
TABLE OF CONTENTS
PERMISSION TO USE . . . . . . . . . . . . . . . . . . . . . . . . . . . . . . . . . . . . . . . . . . . . . . . . . . . . . . . . . . . . . . . . . . . i
ABSRACT ................................................................................... ii
ACKNOWLEDGEMENTS ................................................................ iii
TABLE OF CONTENTS .................................................................. iv
LIST OF TABLES ......................................................................... vi
LIST OF FIGURES . . . . . . . . . . . . . . . . . . . . . . . . . . . . . . . . . . . . . . . . . . . . . . . . . . . . . . . . . . . . . . . . . . . . ... vii
LSIT OF SYMBOLS AND ABRIVIATIONS ........................................ tx
1. INTRODUCTION ................................................................. 1
2. LITERATURE REVIEW . . . . . . . . . . . . . . . . . . . . . . . . . . . . . . . . . . . . . . . . . . . . . . . . . . . . . . .. 5
2.1 Introduction . . . . . . . . . . . . . . . . . . . . . . . . . . . . . . . . . . . . . . . . . . . . . . . . . . . . . . . . . . . . .. 5
2.2 Investigation of the Mechanism of Soil Clogging . . . . . . . . . . . . . . . . . .. 7
2.3 Time and Hydraulic Conductivity Reduction . . . . . . . . . . . . . . . . . . . . . . . . 11
2.4 Thickness of the Clogged or Sealed Layer .. . . . . .. . . . . . . .. . . . . . . . . . .. 16
2.5 Summary and Need for Further Studies . . . . . .. . . . . . . .. .. . .. . . . . . . .. . . 19
3. DIFFERENCES IN LABORATORY AND FIELD SITUATIONS ON
APPARENT HYDRAULIC CONDUCTIVITY AND FLUX............ 21
4 METHODOLOGY .............................................................. 31
4.1 Soil Collection and Analysis ................................. ~. . . . . . . . . 31
4.2 Column Preparation . . . . . . . . . . . . . . . . . . . . . . . . . . . . . . . . . . . . . . . . . . . . . . . . . . . . 32
4.2.1 Column Construction . . . . . . . . . . . . . . . . . . . . . . . . . . . . . . . . . . . . . . . . . . 32
4.2.2 Column Soil Packing .. . . .. . . .. . . . . .. . . . .. . .. .. . .. .. . . . .. . . . . .. . 35
4.3 Hydraulic Conductivity Determination . . . . . . . . . . . . . . . . . . . . . . . . . . . . . . .. 36
4.3.1 Initial Hydraulic Conductivity Determination With Water . 36
4.3.2 Hydraulic Conductivity Measurement With Ponded Manure. 37
iv
5.0 RESULTS AND DISCUSSION . . . . . . . . . . . . . . . . . . . . . . . . . . . . . . . . . . . . . . . . . . . . . . . .. 42
5.1 Soil Properties . . . . . . . . . . . . . . . . . . . . . . . . . . . . . . . . . . . . . . . . . . . . . . . . . . . . . . . . . . . . . . 42
5 .1.1 Physical Soil Properties . . . . . . . . . . . . . . . . . . . . . . . . . . . . . . . . . . . . . . . . . . 42
5 .1. 2 Chemical Soil Properties . . . . . . . . . . . . . . . . . . . . . . . . . . . . . . . . . . . . . . . . . 43
5.1.3 Soil Column Properties . . . . . . . . . . . .. . . . . . . . . . . . . . . . . . . . . . . . . . . . . . 44
5.2 Construction Criteria and Soil Properties . . . . . .. . .. . .. . .. . .. . .. . ... .. .. 45
5.3 Hydraulic Conductivity With Water ..................................... 45
5.4 Manure Ponding Conditions . . . . . . . . . . . . . . . . . . . . . . . . . . . . . . . . . . . . . . . . . . . . .. 46
5.4.1 Column Apparent Hydraulic Conductivities . . . . . . . . . . . . . . . . . .. 46
5.4.2 Soil Manure Interface ............................................. 51
5.4.3 Measured Apparent Hydraulic Conductivity ................... 52
5.4.4 Effect of Clogging With Depth ................................... 55
5.4.5 Effect of Texture and CEC on Clogging . . . . . . . . . . . . . . . . . . . . . . . . 56
5.5 Sources of Error ............................................................. 66
6.0 CONCLUSIONS . . . . . . . . . . . . . . . . . . . . . . . . . . . . . . . . . . . . . . . . . . . . . . . . . . . . . . . . . . . . . . . . . . . . . 67
REFERENCES . . . . . . . . . . . . . . . . . . . . . . . . . . . . . . . . . . . . . . . . . . . . . . . . . . . . . . . . . . . . . . . . . . . . . . . . 69
v
LIST OF TABLES
TABLE DESCRIPTION PAGE
3.1 Sensitivity Analysis .................... 0 ........... 0 ........... 0..................... 23
4.1 Origin of Soils Used in Column Study .. 0. 0 ......... 0 ....... 0 ......... 0. 0 ......... 0 31
4.2 Testing Methods for Soil Physical Analysis .. .. . . . . . . . . . . . . .. . . .. . . . . .. . . .. . . . . .. . 32
4.3 Chemical Analysis of Hog Manure Used in Column Test .. . .. . . . . .. . . . . . . . . . ... 38
404 Schedule of Events ............ 0 .......... 0 ........ 0 0. 0............................... 40
5.1 Physical Properties of Soils Used in Columns . . . . . .. . .. .. . . . . . . . . . . .. . . . . . . .. . . . . 43
5.2 Soil Chemical Properties of Soils Used in Columns............................. 44
5.3 Soil Physical Properties Following Compaction into the Columns . . . . . . . . . . . . 44
504 Summary of Hydraulic Conductivities............................................. 47
vi
FIGURE
LIST OF FIGURES
DESCRIPTION PAGE
3.1 Laboratory vs. Field Situation (soil-manure interface defined as 5 mm thick and
hydraulic conductivity of 5 x10⁻⁹ cm/s) .............................................. 21
3.2 Apparent Hydraulic Conductivity vs. Depth of the Wetting Front (for a laboratory
column with varying thickness of the soil-manure interface (ds1) assuming Ks2 =
10-5 cm/s) ............................................................................... 26
3.3 Flux vs. Depth of the Wetting Front (for a laboratory column with varying
thickness of the soil-manure interface layer (ds1) assuming Ks2 = 10-5 crn/s) .. 26
3.4 Apparent Hydraulic Conductivity vs. Depth of the Wetting Front (for a laboratory
column with varying hydraulic conductivities of the subsoil (Ks2)) ............. 27
3.5 Flux vs. Depth of the Wetting Front (for a laboratory column with varying
hydraulic conductivities of the subsoil (Ks2)) . . .. ... . .. . .. . .. . ... .. . .. .... .. . .. . .. 27
3.6 Typical Field Situation for a Earthen Line Manure Storage..................... 28
3.7 Apparent Hydraulic Conductivity vs. Depth of the Wetting Front (for a lined
earthen manure storage with varying hydraulic conductivities of the subsoil) .. 30
3.8 Flux vs. Depth of the Wetting Front (for a lined earthen manure storage with
varying hydraulic conductivities of the subsoil (Ks2)) .............. _.. ... . .. ... . . 30
4.1 Initial Soil Column Setup for Manure Seepage Study . . . . . . . . . . . . . . . . . . . . . . . . . . . 34
4.2 Final Soil Column Setup for Manure Seepage Study . . . . . . . . . . . . . . . . . . . . . . . . . . .. 34
5.1 Hydraulic Conductivity of Soils in Columns . . . . . . . . . . . . . . . . . . . . . . . . . . . . . . . . . . . . .. 48
5.2 Change of Apparent Hydraulic Conductivity With Time . . . . . . . . . . . . . . . . . . . . . . . . 49
vii
5.3 Apparent Hydraulic Conductivity Change With Time . . . . . . . . .. . . . . . . . . . . . . . . . . . 50
5.4 Measured and Calculated Apparent Hydraulic Conductivity vs. Time........ 54
5.5 Change in Hydraulic Conductivity With Time and Depth....................... 56
5.6 Hydraulic Conductivity vs. Time for Soil No.6 . . . . . . . . . . . . . . . . . . . . . . . . . . . . . . . . ... 58
5.7a Hydraulic Conductivity With Depth at Tl and T2 vs.% Clay Content........ 60
5.7b Hydraulic Conductivity With Depth at Tl and T2 vs.% of Fines............... 61
5.7c Hydraulic Conductivity With Depth at Tl and T2 vs. Plasticity Index......... 62
5.7d Hydraulic Conductivity With Depth at Tl and T2 vs. Effective Pore Diameter 63
5.7e Hydraulic Conductivity With Depth at Tl and T2 vs. CEC. . . . . . ........ .. . . . . ... 64
viii
Cl,C2,etc. de dl d2 d3 K,k Kapp
Kcal Kw,Kmo
Kl K2
K3
Pl P2 t Tl
T2
CEC EC ID PI TS USDASCS
LSIT OF SYMBOLS AND ABRIVIA TIONS
-Column No.1, Column No.2, etc. - effective pore or void diameter -thickness to the soil-manure interface -distance between the top and middle manometer (25 mm) -distance between the middle and bottom manometer (75 mm) -hydraulic conductivity -"apparent" or "effective" hydraulic conductivity, hydraulic conductivity of the column as measured as a whole - calculated apparent hydraulic conductivity - hydraulic conductivity of soil columns as tested with water prior to manure application - hydraulic conductivity of the soil-manure interface layer in the columns - hydraulic conductivity of the top 25 mm of soil in the columns between the top and middle manometer - hydraulic conductivity of the top 25 mm to 100 mm between the middle and bottom manometer - time from manure ponding (Day 0) to Day 38 - Day 38 of testing to Day 185 -time - time period from Day 38 to Day 73 representing five sets of readings and measurements - time period from Day 157 to Day 185 representing five sets of readings
and measurements
- Cation Exchange Capacity - electrical conductivity - inside diameter - Plasticity Index - total solids -United States Department f Agriculture Soil Conservation Service
ix
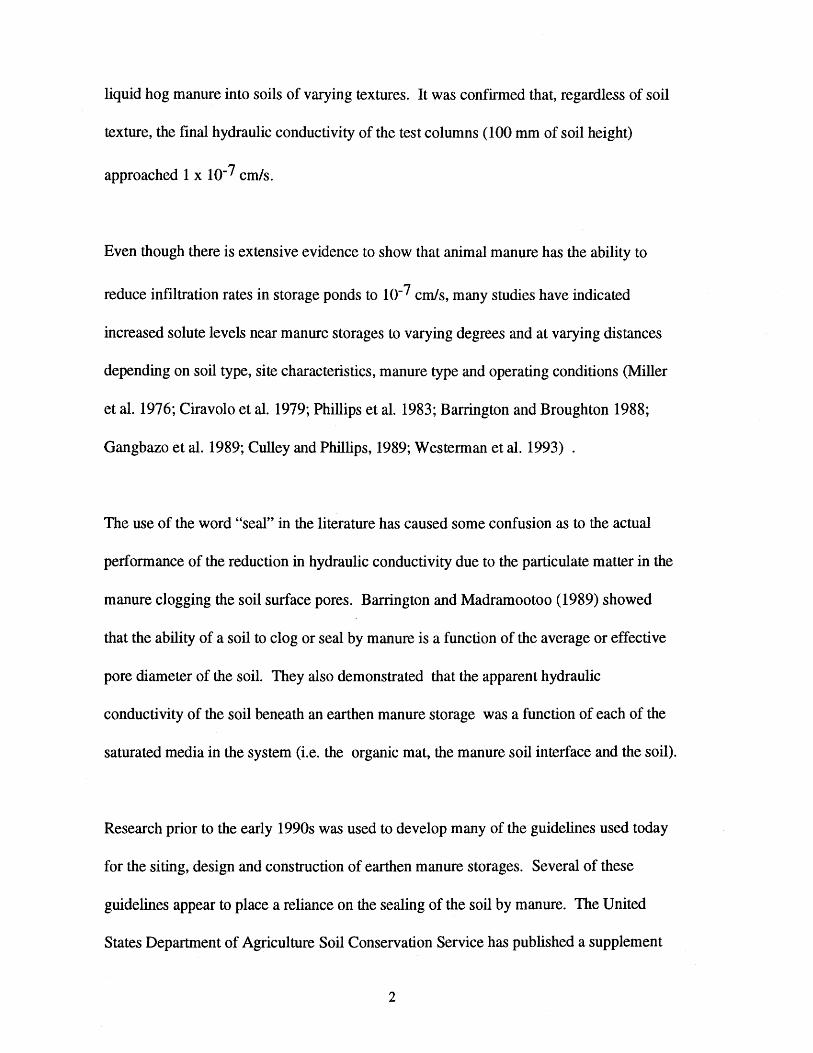
1.0 INTRODUCTION
Since 1990, the Prairie Provinces have seen a dramatic increase in large scale hog
production facilities. These facilities prefer to use earthen manure storages of sufficient
volume to accommodate 200 or 400 days of storage. Typical storage volumes range from
10,000 m3
to 35,000 m3• These storages are constructed using conventional earth moving
equipment and the insitu soil materials. In comparison to concrete and steel storages,
earthen storages are cost effective and an environmentally feasible way of holding the
manure until field application, as long as proper design consideration is given to control of
seepage. Hog manure has very high levels of ions important for plant growth contained
both in solution and in the particulate matter in the manure. Ions in solution have the
potential to move due to advection, dispersion, and diffusion while manure particulate
matter is credited with clogging soil pores inhibiting fluid movement into soil (Davis et al.
1973; Chang et al. 1974; Culley and Phillips 1982; Rowsell et al. 1985; Barrington et al.
1987).
Seepage reduction due to the sealing of soils by manure has been investigated in North
America for many years. Davis et al. (1973), Culley and Phillips (1982), Miller et al.
(1985), and Rowsell et al. (1985) also investigated the sealing of soil by liquid dairy cattle
manure. All concluded that the manure was able to form an effective seal and reduce
infiltration rates to an acceptable rate which was defined as lx1o-6crnJs. Final infiltration
rates approached 10-7 crn/s. Barrington et al. (1987) conducted column tests to study the
infiltration of
1
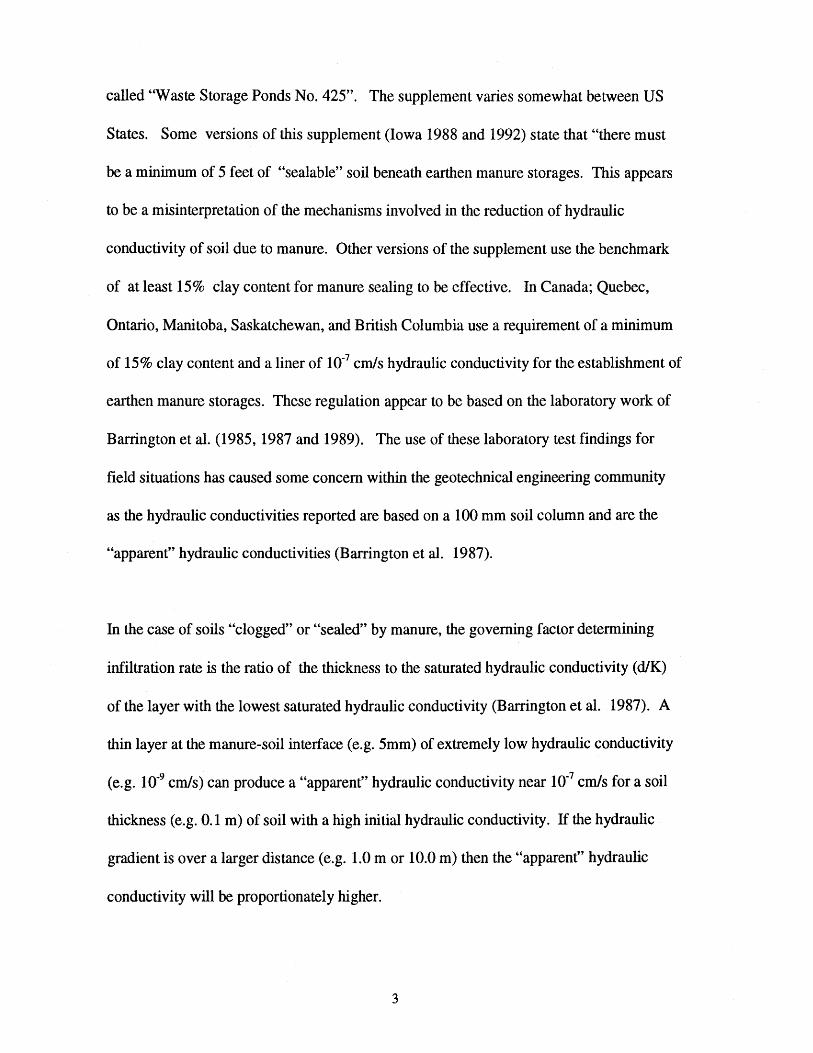
liquid hog manure into soils of varying textures. It was confirmed that, regardless of soil
texture, the final hydraulic conductivity of the test columns (100 mm of soil height)
approached 1 x 1o-7 cm/s.
Even though there is extensive evidence to show that animal manure has the ability to
reduce infiltration rates in storage ponds to 1o-7 cm/s, many studies have indicated
increased solute levels near manure storages to varying degrees and at varying distances
depending on soil type, site characteristics, manure type and operating conditions (Miller
et al. 1976; Ciravolo et al. 1979; Phillips et al. 1983; Barrington and Broughton 1988;
Gangbazo et al. 1989; Culley and Phillips, 1989; Westerman et al. 1993) .
The use of the word "seal" in the literature has caused some confusion as to the actual
performance of the reduction in hydraulic conductivity due to the particulate matter in the
manure clogging the soil surface pores. Barrington and Madramootoo (1989) showed
that the ability of a soil to clog or seal by manure is a function of the average or effective
pore diameter of the soil. They also demonstrated that the apparent hydraulic
conductivity of the soil beneath an earthen manure storage was a function of each of the
saturated media in the system (i.e. the organic mat, the manure soil interface and the soil).
Research prior to the early 1990s was used to develop many of the guidelines used today
for the siting, design and construction of earthen manure storages. Several of these
guidelines appear to place a reliance on the sealing of the soil by manure. The United
States Department of Agriculture Soil Conservation Service has published a supplement
2
called "Waste Storage Ponds No. 425". The supplement varies somewhat between US
States. Some versions of this supplement (Iowa 1988 and 1992) state that "there must
be a minimum of 5 feet of "sealable" soil beneath earthen manure storages. This appears
to be a misinterpretation of the mechanisms involved in the reduction of hydraulic
conductivity of soil due to manure. Other versions of the supplement use the benchmark
of at least 15% clay content for manure sealing to be effective. In Canada; Quebec,
Ontario, Manitoba, Saskatchewan, and British Columbia use a requirement of a minimum
of 15% clay content and a liner of 10-7 crnls hydraulic conductivity for the establishment of
earthen manure storages. These regulation appear to be based on the laboratory work of
Barrington et al. (1985, 1987 and 1989). The use of these laboratory test findings for
field situations has caused some concern within the geotechnical engineering community
as the hydraulic conductivities reported are based on a 100 mm soil column and are the
"apparent" hydraulic conductivities (Barrington et al. 1987).
In the case of soils "clogged" or "sealed" by manure, the governing factor determining
infiltration rate is the ratio of the thickness to the saturated hydraulic conductivity (d/K)
of the layer with the lowest saturated hydraulic conductivity (Barrington et al. 1987). A
thin layer at the manure-soil interface (e.g. 5mm) of extremely low hydraulic conductivity
(e.g. 10-9 crnls) can produce a "apparent" hydraulic conductivity near 10-7 cm/s for a soil
thickness (e.g. 0.1 m) of soil with a high initial hydraulic conductivity. If the hydraulic
gradient is over a larger distance (e.g. 1.0 m or 10.0 m) then the "apparent" hydraulic
conductivity will be proportionately higher.
3
As shown in the discussed literature there is an inadequate understanding of both the
effect of soil clogging from ponded manure in cold climates and the role it plays the in
determination of the average or apparent hydraulic conductivity. The purpose of this
study is to extend previous studies to further investigate the clogging of soil by ponded
hog manure. Specific objectives are related to the effect of clogging upon hydraulic
conductivity:
1) to measure the effect of clogging with time
2) to measure the effect of clogging with depth, and
3) to determine the effect of soil texture upon clogging.
Effort will be placed on the use of common geotechnical engineering terminology and
relating the results to terminology used in previous studies. The results of this study will
help to clarify the meaning and the magnitude of the "manure seal" mentioned by previous
researchers such as Chang et al. (1974), DeTar (1979), Rowsell et al. (1985) and
Barrington et al. (1987).
4
2.0 LITERATURE REVIEW
2.1 Introduction
The purpose of this study is to extend previously pubHshed research to investigate the
clogging of soil by ponded hog manure. Studies into the sealing or clogging of soils were
prevalent in the late 1940s and early 1950s when groundwater recharge by surface
infiltration ponds was being used to replenish depleted· surficial aquifers. These projects
were hampered by an unexpected reduction of hydraulic conductivity under prolonged
submergence (Allison, 1947; McCalla, 1950). The ponds were found to be experiencing
clogging at the surface of the soil. Studies were then initiated to determine the
mechanisms causing the clogging (Gupta and Swartzendruber, 1962; Mitchell and Nevo,
1963; Avenimelech and Nevo, 1963). It was found that the clogging was a function of
microbial activity and polysaccharide accumulation in the reduction of flow through soil
(Allison, 1947; McCalla, 1950; Avnimelech and Nevo, 1963; Mitchell and Nevo, 1963;
Chang et al. 1974; Nicholaichuk, 1978; McConkey et al. 1990). Further studies were
conducted to investigate sealing or clogging of waste water treatment infiltration beds and
to try to find ways of lengthening the life of these treatment facilities by better
understanding the mechanisms causing the clogging (Laak, 1970; DeVries, 1972). The
results of these and other studies led researchers to speculate that earthen manure storages
may be good candidates for infiltration rate reduction due to soil clogging. Research on
clogging by manure was completed both in the field and in the laboratory and under
differing environmental conditions (Hart and Turner, 1965; Davis et al. 1973; Chang et al.
5
1974; Lo, 1977; DeTar, 1977; Culley and Phillips, 1982; Rowsell et al. 1985; Barrington
et al. 1987; Barrington and Madramootoo, 1989; Gangbazo et al. 1989). Based on this
research, Barrington and Jutras (1985) and Barrington and Broughton (1988) published
guidelines for selecting site for earthen manure reservoirs. They recommended a minimum
soil clay content of 15% based on the resulting effective void diameter (Barrington and
Jutras, 1985) and that a manure mat on this soil will result in a final infiltration rate of 10-7
cm/s or 0.1 Um2/day. Barrington and Jutras (1985) went on to give grain size distribution
curves showing the bands in which the soil would "seal" but qualified their
recommendations by saying that the minimum infiltration of 0.1 L/m2/day would still result
in hog manure liquids saturating 300 mm of clay soil over a period of 9 years and 300 mm
of a sandy soil in 11 months. As a result of this research, regulatory agencies have
adopted the use of a minimum of 15% clay content (British Columbia, 1991; Manitoba,
1993; Ontario, 1994; USDA SCS, 1993), and a "final" hydraulic conductivity of 10-7 cm/s
(British Columbia, 1991; Manitoba, 1993; Ontario, 1994). This "final" hydraulic
conductivity is apparently a result of the effect of manure clogging. Rugulations of the
state of Iowa (1988 and 1992) appear to count on the 'sealing' of soil by manure and
require 1.5 meters of "sealable" soil around a newly constructed storage. This appears to
be a interpretation of the sealing mechanisms and the thickness of the sealed or clogged
layer(s).
Although researchers agree that all soils tested will clog and most agree that sandy soils
still allow large quantities of high strength effluent and organic matter to pass through
(Hart and Turner, 1965; Barrington and Jutras, 1987a). Due to the prevalence of
6
research into whether or not a soil will clog and not into whether it will impeaded the
transport of solutes, there is a lack of definition as to which soils are suitable and safe for
the construction of earthen manure storages. The USDA Soil Conservation Service
(1993) gives the most complete guide to what soil types and profiles are recommended for
construction of manure storages. In addition to a minimum clay content they recommend
a plasticity index of> 10 (USDA SCS, 1993).
This study will attempt to determine the effect of manure on soil hydraulic properties as
affected by time, depth, and texture. This literature review will establish the current state
of knowledge and aid in the interpretation of the results. Complimenting studies by others
will attempt to determine the penetration of organic matter with depth and the effect of
soil physical and chemical properties on the soils ability to prevent transport of solutes.
2.2 Investigation of the Mechanism of Soil Clogging
The clogging of soils is defined as the "resistance to flow caused by a change in friction
coefficients or in reduced size or volume of pore spaces" (Davis et al. 1973). The
clogging will occur as long as there is particulate matter or microbial activity present
(Gupta and Swartzendruber, 1962; Barrington and Jutras, 1983). Allison (1947) reported
a reduction in infiltration rate of two orders of magnitude (10-3 cm/s decreased to 10-5
cmls) in ponds subjected to prolonged submergence of natural surface water. Avnimelech
and Nevo (1963), Laak (1970) and DeVries (1972) were concerned with elin1inating this
7
clogging effect in order to lengthen the life of waste water filtration beds. Avnimelech
and Nevo (1963) reported that:
• decreasing the C:N ratio in the organic matter or adding inorganic nitrogen was found
to minimize the amount of polyuronide found in the sand and to be accompanied by a
decline in the extent of clogging,
• polysaccharide production increases with an increase in the C:N ratio,
• the decomposition rate of the organic amendments in the sand seemed to affect the
synthesis of polyuronides and the development of clogging,
• organic substances with very low decomposition rates, such as sawdust or sewage,
would not promote polyuronide production, and
• organic amendments which initially contain a high percentage of polyuronides, such as
barley meal, would induce clogging more than can be expected from the above
statements.
Livestock waste or manure fits this criteria as an organic amendment with a high
concentration of nitrogen and often contains waste barley. Hart and Turner (1965) and
Davis et al. (1973) conducted experiments in California to determine if soil clogging
reduced the infiltration losses from earthen dairy waste ponds. Hart and Turner (1965)
concluded that after two years the infiltration was still considerable and that biological
sealing of the lagoons did not appear to be very effective. They reported that the
digestion of the particulate matter within the lagoon may have reduced the clogging effect.
Davis et al. (1973), however, reported a reduction in water infiltration rate of two orders
of magnitude within four months of manure ponding. These researchers suggested that
the suspended settleable solids in the liquid dairy manure should provide a matrix that
8
would commence sealing or clogging even in coarse sand. They further concluded that
because the manure gives rise to a bottom slime and rapid decomposition of biological
sludge, that the cells of living and dead bacteria adjacent to the soil surface are forced into
the soil pores by hydraulic pressure blocking infiltration. In addition to the biological and
physical clogging of soils, various researchers have shown that chemical clogging can
occur through the exchange of ions causing defloculation or through the products of
oxidation-reduction reactions clogging the soil (Laak, 1970).
Chang et al. (1974), working in California with soil columns placed in the bottom of a new
storage pond; Lo (1977), working in Nova Scotia with laboratory columns; and
Barrington and Jutras (1983), working in Quebec with small scale earthen field storages
and laboratory columns; investigated the extent of the sealing or clogging mechanisms.
All the researchers agree that the initial clogging is a result of the physical entrapment of
particulate matter at the soil surface which, over time, will penetrate into the soil surface.
Chang et al. (1974) reported that biological clogging virtually sealed off the soil for further
water movement within 64 days and to depths of at least 250 mm. Lo (1977) determined
the organic matter distribution in the soil profile after the infiltration tests were completed.
The results indicated that starting from the soil surface, the organic matter decreased
gradually with increasing soil depth in all soil types except sand. In the case of sand, the
concentrations were fairly uniform. The distribution of organic matter in the soil profile
gives a certain indication of soil pore clogging. This researcher felt that the reduction of
organic matter in the soil profile indicated that the sealing process was not a surface
9
phenomenon only. The degree of soil pore clogging was more intense near the soil
surface and became less intense as the depth increased.
Lo (1977) concluded that the sealing of anaerobic lagoons occured in the following way.
The rapid reduction of infiltration rate immediately after the commencement of testing
indicated that physical clogging, i.e. the physical trapping or filtering of solids by the soil
matrix, was predominant in the initial stage of sealing. The continued gradual reduction of
infiltration rate was probably a combined result of physical, chemical and biological sealing
processes. Lo ( 1977) agreed with Chang et al ( 197 4) and suggested that final sealing was
caused by clogging as a result of excretions from anaerobic microorganisms. Lo (1977)
also concluded that the final hydraulic conductivities varied inversely with hydraulic
gradient which seemed to suggest that the physical sealing process was still important.
Barrington and Jutras (1983) concluded that:
• physical clogging factors played a major role as long as soil effective void diameter
was small enough to retain all manure solids,
• swine manure, because of its granular and easily biodegradable character, required a
finer soil than the fibrous, fermentation-resistant dairy manure solids,
• biological factors contributed by transforming the manure seal accumulated at the soil
surface; their effect was about 1/10,000th and 1/60th of that of physical factors for
dairy and swine slurries respectively, and
• chemical factors, acting at the soil level, were insignificant.
10
2.3 Time and Hydraulic Conductivity Reduction
Hart and Turner (1965), Davis et al. (1973), and Chang et al. (1974) all worked with
manure storages in the California dairy industry. Both Davis et al. (1973) and Chang et al.
(1974) reported reductions in hydraulic conductivity to below 1 x10⁻⁶ cm/s while Hart and
Turner (1965) reported considerable infiltration loss (1.5 x 10⁻⁵ cm/s after two years) from
constructed storages in California in sandy loam soils. The average infiltration rate with
water for three storages was 2 x10⁻⁵ cm/s and the final infiltration rate was only 20% to
40% less at the end of two years. The expected biological sealing of the lagoons did not
appear to be very effective. The lagoon bottoms had been compacted thoroughly before
the initial filling, but the sandy loam soil was too permeable.
Davis et al. (1973), while studying the performance of dairy waste ponds in San Diego
County, reported that a manure storage pond constructed in sandy loam soils had a
infiltration rate with water of 1.4 x10⁻³ cm/s which reduced to 7 x10⁻⁵ cm/s after two
weeks and to 6 x10⁻⁶ cm/s after four months. Evaporation from the surface of the pond
was not measured but the authors felt that the infiltration rate would have become
insignificant if evaporation was considered.
Chang et al. (1974) determined the hydraulic conductivity of soil columns and the sections
of soil columns retrieved from the bottom of a newly constructed manure storage pond at
intervals from Day 0 (day of manure application) to Day 64. The authors found that the
hydraulic conductivity, as measured by their apparatus, reduced from 3.9x10⁻³ cm/s at Day
11
0 to 4x 10⁻⁵ crnls by Day 64 in the sand soil and from 7x 10⁻⁵ cm/s to less than 1.7x10⁻⁶
cm/s in the clay soil. It should be noted that with the. methods used~ these researchers
could not measure hydraulic conductivities less than 1.7x10⁻⁶ cm/s. These authors
concluded that the initial seal was caused by the physical entrapment of suspended
particles in soil, followed by a secondary mechanism of microbial growth that , they claim,
completely sealed off the soil from water movement. These "sealed" columns were dried
and when retested exhibited hydraulic conductivities similar to the initial hydraulic
conductivities. The researchers felt that this indicated that the inhibition of water
movement in the soils was not caused by the deflocculation of soil particles due to cation
exchange.
The following researchers in Canada reported similar results of a reduction in hydraulic
conductivity reaching 10-6 cm/s within a short period of time and 2 x 10⁻⁷ cm/s to 5 x 10⁻⁷
cm/s after more than a year of manure ponding:
• Lo (1977), working in November weather conditions in Nova Scotia and using twelve
200 mm diameter soils columns fliled with liquid dairy manure,
• Culley and Phillips (1982), using undisturbed soil columns to determine the rate of
sealing with Ontario soils,
• Barrington and Jutras (1983), using four constructed ponds to study manure sealing in
Quebec,
• Rowsell et al. (1985), using soil cores to determine the effect of ponded manure head
on the infiltration rate of Ontario soils,
• Barrington et al. (1987a), using experimental reservoirs and 100 mm diameter by 100
mm cores of Quebec soils and,
• Barrington and Madramootoo (1989) using soil cores of sand and clay loam to
measure the extent of seal formation as swine manure infiltrates soil.
12
Lo (1977) reported that for all the columns except the clay, the infiltration rate decreased
exponentially within the first 30 minutes of operation. This reduction in hydraulic
conductivity continued for the first few weeks and with a continued gradual reduction
thereafter. Mter three months of operation, the infiltration rate for all of the columns
remained relatively stable at similar lower levels until the end of the study (one year). This
low infiltration rate is approximately 5 x10⁻⁷ cm/s.
Culley and Phillips (1982), Rowsell et al. (1985), and Barrington and Madramootoo
(1989) reported that all soils tested exhibited an exponential decrease in conductivity.
Culley and Phillips (1982) reported all soils reached conductivities of 3.5 x10⁻⁶ cm/s within
5 days and which further reduced to 1 x10⁻⁶ cm/s within 10 days. Rates of sealing
increased in the order of clay<loam<sand, the same order as bulk densities and coarseness
of texture.
Culley and Phillips (1982) used the following equation to determine the hydraulic
conductivity as a function of time from application of the manure:
Ink= -a- (bIn t) Eq. 2.1
where:
k = hydraulic conductivity,
t = time since manure application,
a= coefficient related to the intercept (In A), and
b = coefficient which is a measure of the rate at which the soil,
sealed
Values of a and b for each soil were determined by least squares
regression.
13
Rowsell et al. ( 1985) reported the infiltration rate was found to decrease for all the soils
tested and reached a value of 1 o-6 cm/s or less within 30 days for the soils with 1 m
hydraulic head; at 5 m head the infiltration rate reached a value of 1 o-6 cm/s within 10 days
for clay soil but required > 30 days for the loam and sand soils. Rowsell et al. ( 1985)
used the Kostiakov infiltration equation q = atb , where a and b are constants, to relate
infiltration rate to time.
Barrington and Jutras (1983) and Barrington et al. (1987a) reported that soils with initial
infiltration rates as high as 2.3 to 3 x10⁻³ cm/s demonstrated a reduction in hydraulic
conductivity to 10-6 cm/s within 2 weeks for their reservoirs and 2 days for their soils
columns. The hydraulic conductivity for both the reservoirs and the soil columns further
reduced to near 5 x10⁻⁷ cm/s after one year. It is interesting to note that the hydraulic
conductivity of the clay soil columns increased from 1x10⁻⁸ cm/s at 48 hours to 2.4 x10⁻⁷
cm/s at 840 days. Barrington and Madramootoo (1989) found the infiltration rate for all
columns was related to infiltration time through linear regression using the logarithmic
form of the exponential equation:
where:
I=Wtx
I= infiltration rate (rnls),
t =infiltration time (hours), and
W and X = constants
Eq. 2.2
14
Culley and Philips (1982) found that the difference in sealing rate between sandy and clay
soils was possibly due to the more rapid blockage of the large but less numerous sand
pores than the smaller more porous clay. They suggested that their similarity in
conductivities for all materials between 5 and 10 days could be explained if the layer of
manure solids which formed on the top of the soil columns controlled the flow rate of
liquid through the columns. Barrington and Madramootoo (1989) agreed with this last
statement, and went on to conclude that for sandy soils the reduction in hydraulic
conductivity was governed by the soil-manure interface clogging and that there was no
significant difference in hydraulic conductivity with depth. They also reported that clay
soils experienced some reduction in hydraulic conductivity which was thought to be a
result of the ability of the clay loam soils to accumulate manure solids with depth and their
stronger adsorption properties which help to retain solids along the walls of the flow
channels.
DeTar (1977), working in Pennsylvania using infiltration rings in the base of a dairy
manure storage pond, found that for manure slurries with > 0.3% total solids (TS), the
infiltration rate became relatively constant after four days near 3 x10⁻⁶ cm/s. He
considered the soil "sealed" if the infiltration rate dropped below 1 x 1 o-6_ cm/s and
reported that, for longer time periods, the infiltration rate appeared to reach a minimum
steady value of 6 x10⁻⁷ cm/s. Given that these values of infiltration rate reduction with
15
time match those of other researchers, it is safe to conclude that physical clogging should
occur in effluents with> 0.3% total solids (TS). Barrington et al. (1987b) tested the
performance of slurries down to 3 % TS and found no significant difference from higher
TS contents.
2.4 Thickness of the Clogged or Sealed Layer
To answer the objective of the effect of clogging with depth, to make use of the reviewed
research in designing earthen manure storages, and in estimating the risks associated with
the construction of these storages in different soils, it is important to know the relative
thickness of the layers of different hydraulic conductivity.
The soil layer that becomes clogging with manure particles ranges between 3 mm for clay
to 5 mm to 15 mm for sandy soils (Laak, 1970; Barrington and Jutras, 1983; Rowsell et al.
1985). The layer experiencing further reduction in hydraulic conductivity due to
biological and chemical clogging is variable, depending upon soil texture and chemistry
but is thought to be restricted to the top 300 mm of soil (Allison, 1947; Chang et al.
1974).
Barrington and Jutras (1985) and Barrington and Broughton (1988) recommend the use of
the soil effective void (or pore) diameter to determine a soil's suitability to allow clogging
16
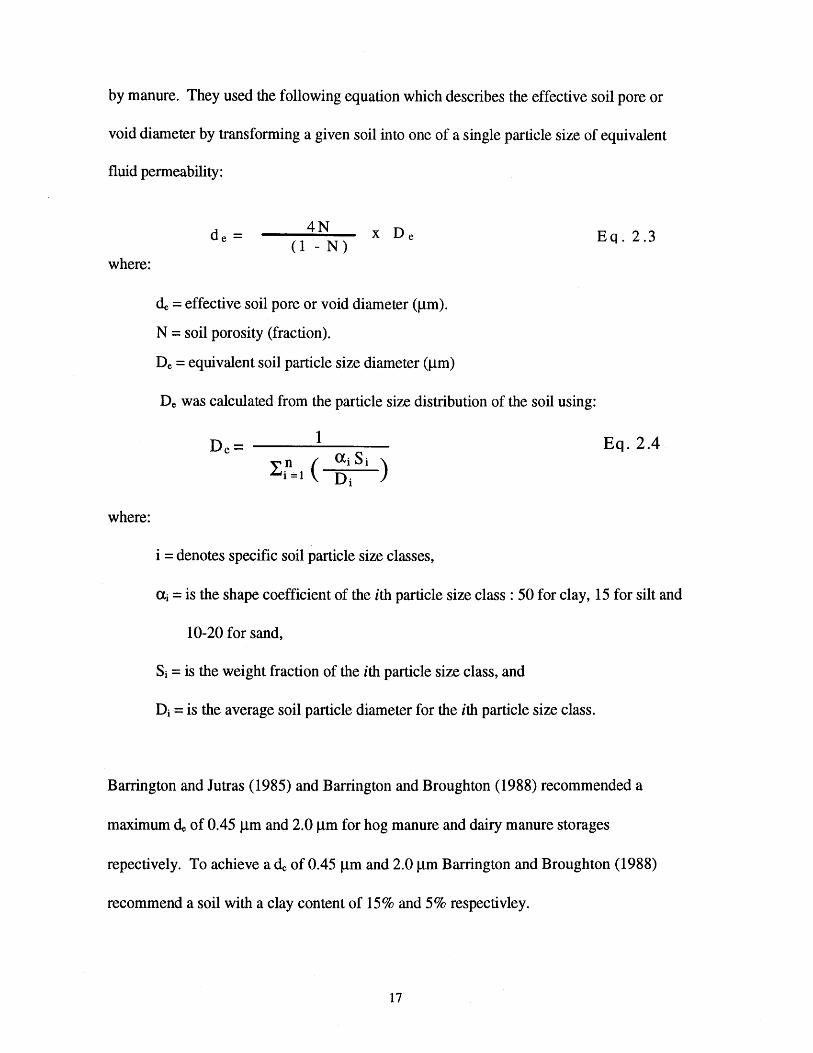
by manure. They used the following equation which describes the effective soil pore or
void diameter by transforming a given soil into one of a single particle size of equivalent
fluid permeability:
where:
where:
de= 4N X De
( 1 - N)
de= effective soil pore or void diameter (Jlm).
N = soil porosity (fraction).
De= equivalent soil particle size diameter (Jlm)
De was calculated from the particle size distribution of the soil using:
i = denotes specific soil particle size classes,
Eq. 2.3
Eq. 2.4
<li =is the shape coefficient of the ith particle size class: 50 for clay, 15 for silt and
10-20 for sand,
si = is the weight fraction of the ith particle size class, and
Di = is the average soil particle diameter for the ith particle size class.
Barrington and Jutras (1985) and Barrington and Broughton (1988) recommended a
maximum de of 0.45 Jlm and 2.0 Jlm for hog manure and dairy manure storages
repectively. To achieve a de of 0.45 Jlm and 2.0 Jlm Barrington and Broughton (1988)
recommend a soil with a clay content of 15% and 5% respectivley.
17
In Canada; Quebec (Gangbazo, 1989), Ontario (1994), Manitoba (1993), Saskatchewan
(1992), and British Columbia (1991, 1992) use a requirement of a minimum of 15% clay
content and a liner of 10-7 cm/s hydraulic conductivity for the establishment of earthen
manure storages. These regulation appear to be based on the laboratory work of
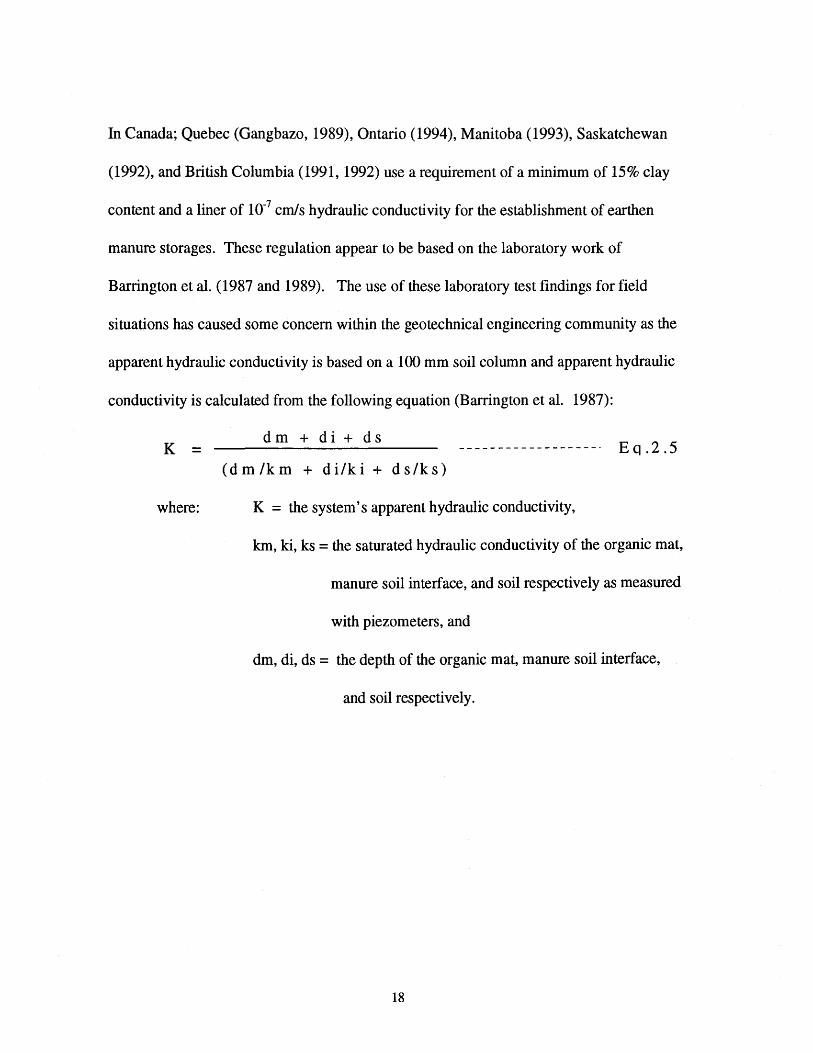
Barrington et al. (1987 and 1989). The use of these laboratory test findings for field
situations has caused some concern within the geotechnical engineering community as the
apparent hydraulic conductivity is based on a 100 mm soil column and apparent hydraulic
conductivity is calculated from the following equation (Barrington et al. 1987):
K =
where:
dm + di + ds Eq .2 .5
( d m /k m + d i/k i + d s/k s)
K = the system's apparent hydraulic conductivity,
km, ki, ks = the saturated hydraulic conductivity of the organic mat,
manure soil interface, and soil respectively as measured
with piezometers, and
dm, di, ds = the depth of the organic mat, manure soil interface,
and soil respectively.
18
2.5 Summary
All researchers agree that the initial clogging occurred at the soil manure interface and that
this clogging was not dependent on soil texture but was on total solids content of the
manure (Davis et al. 1973). Even though all soils tested clogged to demonstrate similar
long term infiltration rates, the time required to achieve these lower steady infiltration was
dependent on soil texture (Lo, 1977; Rowsell et al. 1985). These researchers reported that
sand clogged faster than clay and hydraulic head lengthened the time required for clogging
of the coarser textured soils. This surface clogged interface layer was reported to range
in thickness form 3 mm to 15 mm (Laak, 1970; Barrington and Jutras, 1983; Rowsell et al.
1985). Sealing with depth was reported to be a result of both particulate matter migration
with depth and time and the production of polysaccharides from the anaerobic digestion of
the organic wastes (Chang et al. 1974; Barrington and Madramootoo, 1989). The major
polysaccharide contributing to the clogging of soil beneath manure storage ponds, even at
low temperatures, is thought to be polyuronide which would be especially prominent in
effluents with high C:N ratios, such as manure, and an initially high percent of
polyuronides, such as barley meal (Avinmelech and Nevo, 1963). This biological clogging
was reported to affect soils to a depth of at least 250 mm after 64 days in areas of warm
ground temperatures(> 15°C) (Chang et al. 1974), but was reported to ~e much less
effective in areas of cooler ground temperatures ( < 10 °C) even after 840 days of manure
ponding (Lo, 1977; Barrington et al. 1987a). Hart and Turner (1965) reported very poor
soil clogging and biological sealing in sandy loam soils in California. Barrington and
Madramootoo (1989) reported that this clogging was limited to the surface and any
19
reduction in hydraulic conductivity with depth was not consistent and very secondary to
the surface clogging.
Using Equation 2.5, if we assume that km is very large compared with ki and ks, that di is
very small compared with ds, and that di and ki are very small, 5 mm and 10-9 crn/s
respectivley (Rowsell et al. 1985) and (Barrington et al. 1989) then for a 100 mm soil
column for values of ks > 10-6 cm/s, K approaches 1 x 10⁻⁷ cm/s even for very large
values of ks. Further, as ds becomes larger, K becomes proportionately larger. Therefore
in field conditions, if we consider the 10 meters below the storage, the apparent saturated
hydraulic conductivity would be 1 x 10⁻⁵ cm/s instead of 1 x 10⁻⁷ cm/s according to
Equation 2.5. This raises a concern with the use of a "final" hydraulic conductivity of an
earthen manure storage based on an assumption that manure clogging will reduce the
initial hydraulic conductivity to near 10-7 cm/s. It is therefore important to clarify the
extent and depth of manure clogging so that the recommendations put forward by these
reviewed researchers can be applied to design and regulatory guidelines with an
understanding of the risk associated with use of marginal soils in construction of earthen
manure storages.
Researchers have hypothesized that the clogging of soil was by particulate matter of the
soil surface but none of the researchers reviewed had proven this. Even if the reduction in
hydraulic conductivity of soils is a result of clogging of the surface soil pores, there still
remains the questions of the depth of soil affected by the clogging, the change in the
clogged layer with time, and the extent of soil texture on the ability of soils to assist in
clogging and reduction in hydraulic conductivity.
20
3.0 Differences in Laboratory and Field Situations on Apparent Hydraulic Conductivity and Flux
As previously discussed in Section 2.5, the use of laboratory findings in field situations
must be done with the knowledge of the consequences of changing of variables on the
resulting apparent hydraulic conductivity and flux. To say that the "final" hydraulic
conductivity (Iowa, 1991; USDA SCS, 1993) of a constructed earthen manure storage
must be less than 1x1 o-7 cm/s, one must understand how the laboratory situation compares
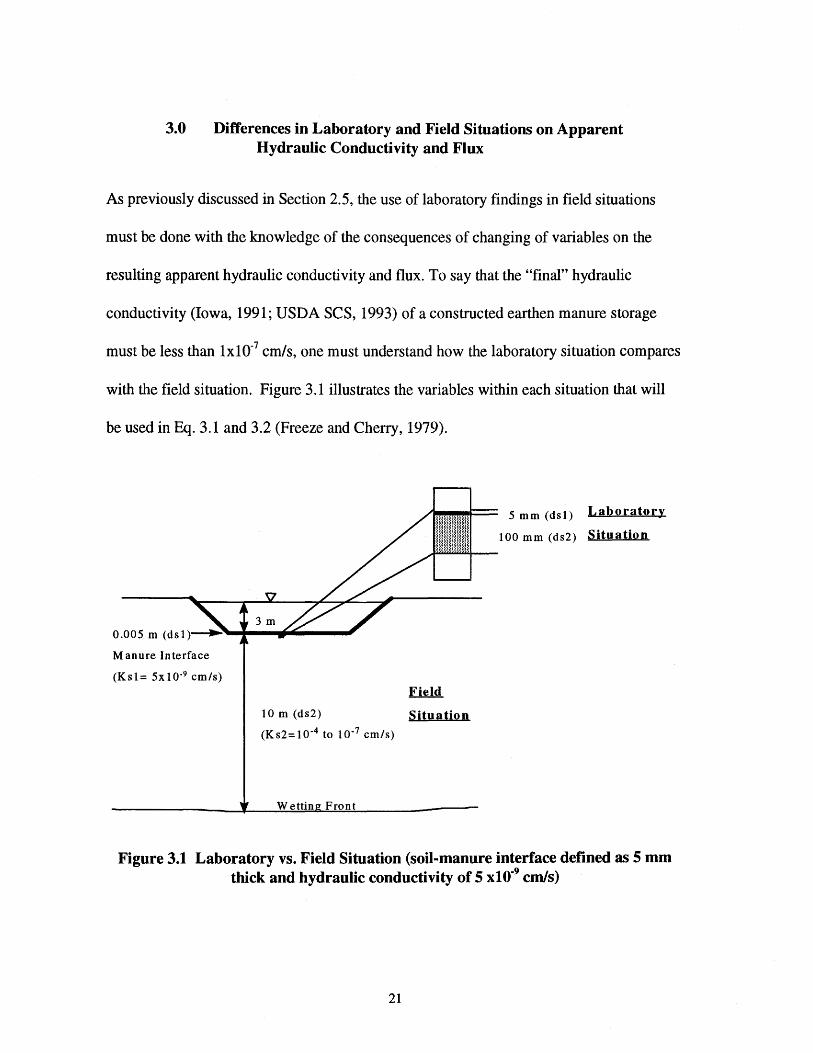
with the field situation. Figure 3.1 illustrates the variables within each situation that will
be used in Eq. 3.1 and 3.2 (Freeze and Cherry, 1979).
Manure Interface
(Ks1= 5x10·9 cm/s)
10m (ds2) Situation (K s2= 1 o-4 to 1 o-7 cm/s)
5 mm (ds 1) Laboratory
100 mm (ds2) Situation
Figure 3.1 Laboratory vs. Field Situation (soil-manure interface defined as 5 mm thick and hydraulic conductivity of 5 xt0·9 cm/s)
21
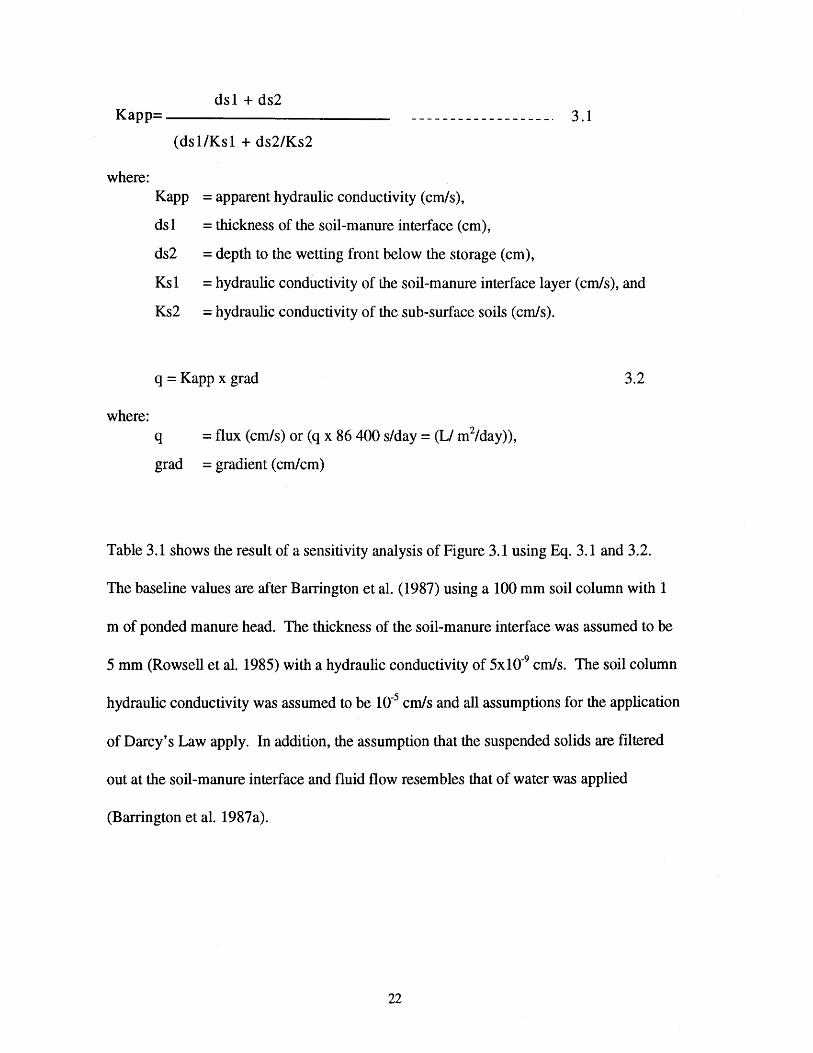
ds1 + ds2 Kapp=----------------------- 3.1
(ds1/Ks1 + ds2/Ks2
where: Kapp =apparent hydraulic conductivity (cm/s),
dsl =thickness of the soil-manure interface (em),
ds2 =depth to the wetting front below the storage (em),
Ks1 =hydraulic conductivity of the soil-manure interface layer (cm/s), and
Ks2 =hydraulic conductivity of the sub-surface soils (cm/s).
q = Kapp x grad 3.2
where: q =flux (cm/s) or (q x 86 400 s/day = (L/ m2/day)),
grad =gradient (em/em)
Table 3.1 shows the result of a sensitivity analysis of Figure 3.1 using Eq. 3.1 and 3.2.
The baseline values are after Barrington et al. (1987) using a 100 mm soil column with 1
m of ponded manure head. The thickness of the soil-manure interface was assumed to be
5 mm (Rowsell et al. 1985) with a hydraulic conductivity of 5x10⁻⁹ cm/s. The soil column
hydraulic conductivity was assumed to be 10-5 cm/s and all assumptions for the application
of Darcy's Law apply. In addition, the assumption that the suspended s~lids are filtered
out at the soil-manure interface and fluid flow resembles that of water was applied
(Barrington et al. 1987a).
22
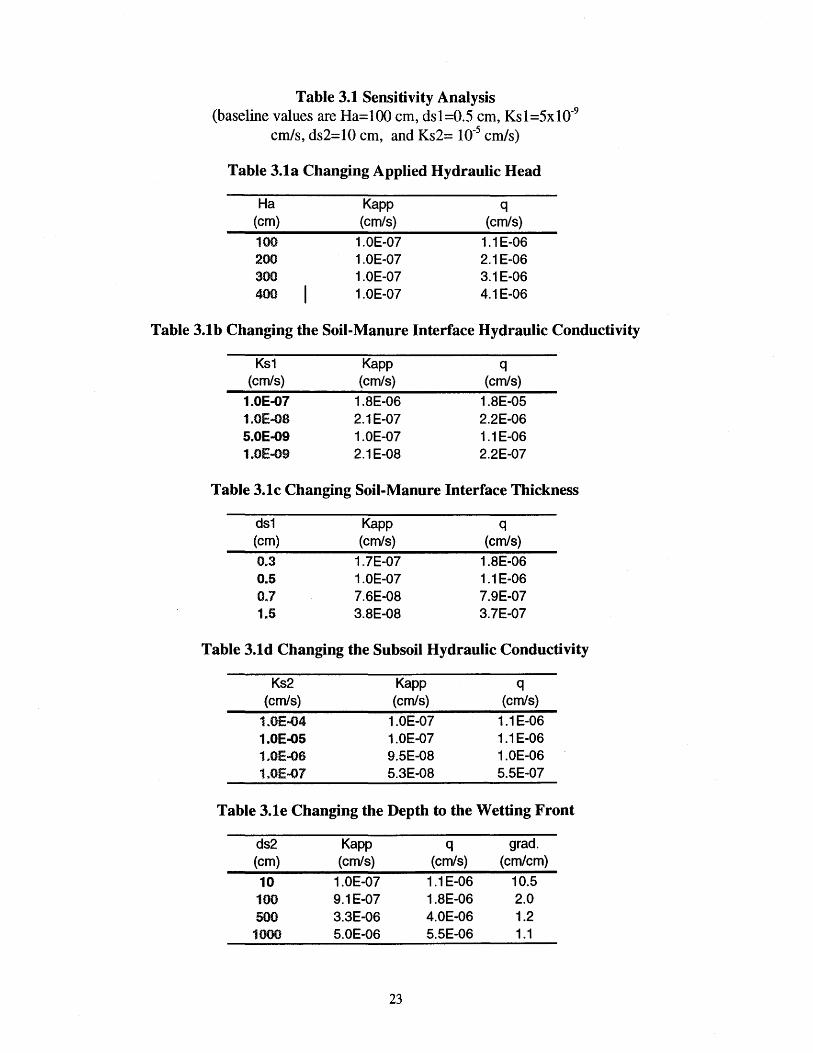
Table 3.1 Sensitivity Analysis (baseline values are Ha=lOO em, ds1=0.5 em, Ks1=5x10⁻⁹
em/s, ds2=10 em, and Ks2= 10-5 em/s)
Table 3.1a Changing Applied Hydraulic Head
Ha (em)
100 200 300 400
Kapp (em/s)
1.0E-07 1.0E-07 1.0E-07 1.0E-07
q (em/s)
1.1 E-06 2.1E-06 3.1E-06 4.1E-06
Table 3.1b Changing the Soil-Manure Interface Hydraulic Conductivity
Ks1 Kapp q (cm/s) (em/s) (em/s)
1.0E-07 1.8E-06 1.8E-05 1.0E..OS 2.1E-07 2.2E-06 S.OE-09 1.0E-07 1.1 E-06 1.0E-09 2.1E-08 2.2E-07
Table 3.1c Changing Soil-Manure Interface Thickness
ds1 Kapp q (em) (cm/s) (cm/s)
0.3 1.7E-07 1.8E-06 0.5 1.0E-07 1.1 E-06 0.7 7.6E-08 7.9E-07 1.5 3.8E-08 3.7E-07
Table 3.1d Changing the Subsoil Hydraulic Conductivity
Ks2 Kapp q (em/s) (cm/s) (em/s)
1.0E..04 1.0E-07 1.1 E-06 1.0E-05 1.0E-07 1.1E-06 1.0E...06 9.5E-08 1.0E-06 1.0E..07 5.3E-08 5.5E-07
Table 3.1e Changing the Depth to the Wetting Front
ds2 Kapp q grad. (em) (em/s) (cm/s) (em/em)
10 1.0E-07 1.1 E-06 10.5 100 9.1 E-07 1.8E-06 2.0 500 3.3E-06 4.0E-06 1.2
1000 S.OE-06 5.5E-06 1.1
23
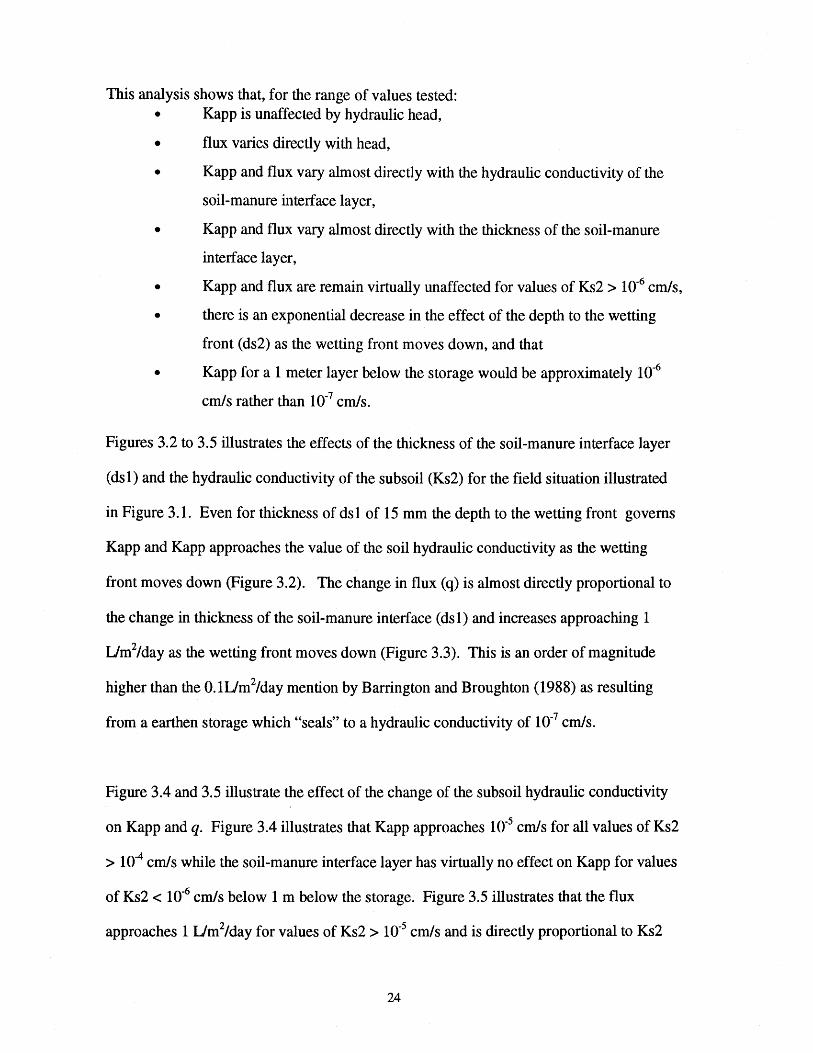
This analysis shows that, for the range of values tested: • Kapp is unaffected by hydraulic head,
• flux varies directly with head,
• Kapp and flux vary almost directly with the hydraulic conductivity of the
soil-manure interface layer,
• Kapp and flux vary almost directly with the thickness of the soil-manure
interface layer,
• Kapp and flux are remain virtually unaffected for values of Ks2 > 10-6 cm/s,
• there is an exponential decrease in the effect of the depth to the wetting
front (ds2) as the wetting front moves down, and that
• Kapp for a 1 meter layer below the storage would be approximately 1 o-6
cm/s rather than 10-7 cm/s.
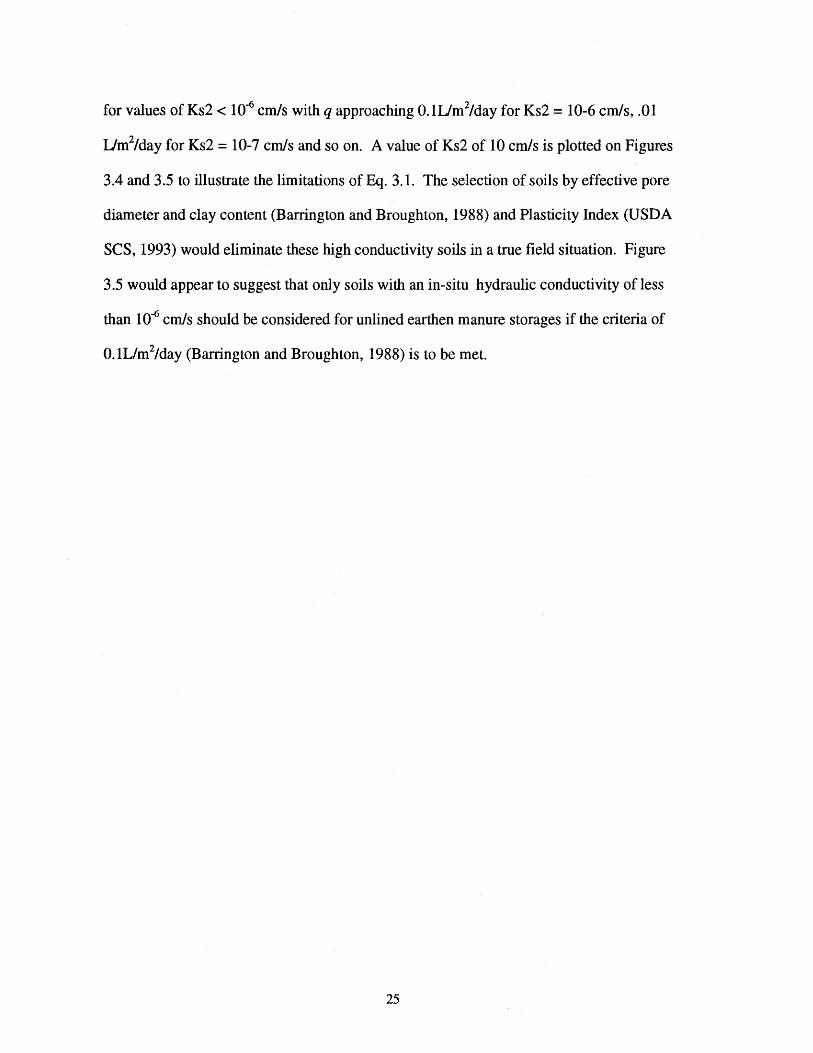
Figures 3.2 to 3.5 illustrates the effects of the thickness of the soil-manure interface layer
(ds1) and the hydraulic conductivity of the subsoil (Ks2) for the field situation illustrated
in Figure 3.1. Even for thickness of ds1 of 15 mm the depth to the wetting front governs
Kapp and Kapp approaches the value of the soil hydraulic conductivity as the wetting
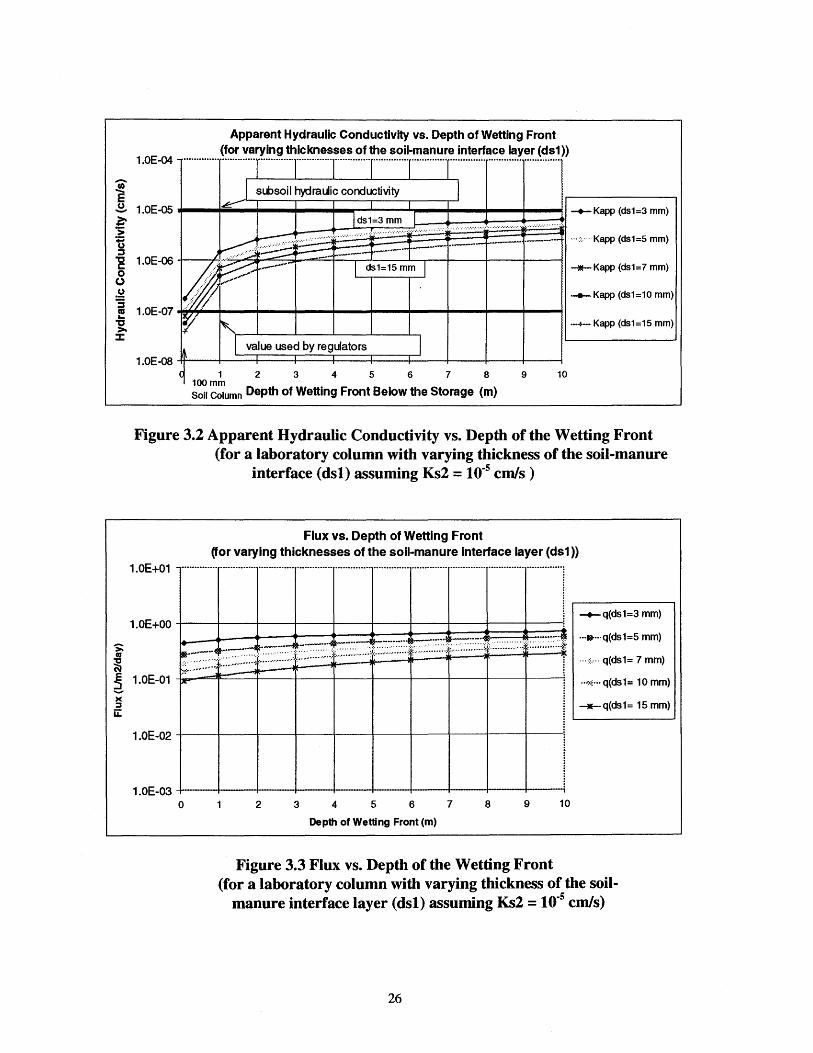
front moves down (Figure 3.2). The change in flux (q) is almost directly proportional to
the change in thickness of the soil-manure interface (ds1) and increases approaching 1
Um2/day as the wetting front moves down (Figure 3.3). This is an order of magnitude
higher than the 0.1Um2/day mention by Barrington and Broughton (1988) as resulting
from a earthen storage which "seals" to a hydraulic conductivity of 10-7 cm/s.
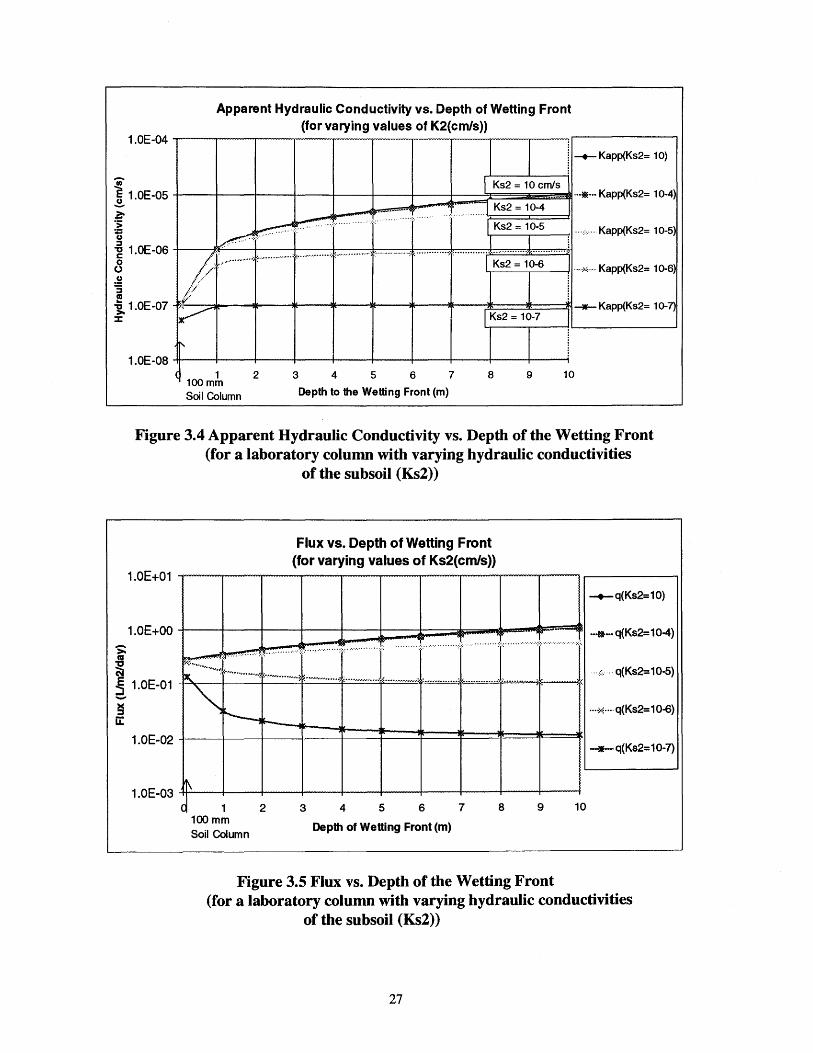
Figure 3.4 and 3.5 illustrate the effect of the change of the subsoil hydraulic conductivity
on Kapp and q. Figure 3.4 illustrates that Kapp approaches 10-5 cm/s for all values of Ks2
> 10-4 cm/s while the soil-manure interface layer has virtually no effect on Kapp for values
of Ks2 < 10-6 cm/s below 1m below the storage. Figure 3.5 illustrates that the flux
approaches 1 Um2/day for values of Ks2 > 10-5 cm/s and is directly proportional to Ks2
24
for values of Ks2 < 10-6 cm/s with q approaching 0.1Um2/day for Ks2 = 10-6 cm/s, .01
Um2/day for Ks2 = 10-7 cm/s and so on. A value of Ks2 of 10 cm/s is plotted on Figures
3.4 and 3.5 to illustrate the limitations of Eq. 3.1. The selection of soils by effective pore
diameter and clay content (Barrington and Broughton, 1988) and Plasticity Index (USDA
SCS, 1993) would eliminate these high conductivity soils in a true field situation. Figure
3.5 would appear to suggest that only soils with an in-situ hydraulic conductivity of less
than 10-6 cm/s should be considered for unlined earthen manure storages if the criteria of
0.1L/m2/day (Barrington and Broughton, 1988) is to be met.
25
Apparent Hydraulic Conductivity vs. Depth of Wetting Front (for varying thicknesses of the soil-manure interface layer (ds1))
........................... r············r············r·············r··············r·············-r·············· ··························· 1.0E-04
~ J subsoil hydraulic conductivity I -u 1.0E-05 ..._ _ _..~iiiillllll ..... __ .__ .... ....., ....... 1--_,_1 ,....-~_....,_...,._--! .,.. -+- Kapp (ds1=3 mm)
! _,,...----.1~==-·==-~gl~ds~1~3~m~m~~ ~~~~~~~~~-~---fi······:':········Kapp (ds1=5 mm)
g 1.0E-06 /-;-::.::.:1~:_-=-t--·t--- . ·-----Kapp (ds1=7 mm) ~._:~ /;:'1./'/A;~._- 1 ds1=15mm 1
L.fi/ -+- Kapp (ds1=10 mm)
~ 1.0E-07 -teliV.~'f"". '--+---+---+--+---+---+--+---+---+---! -g. ~/ '-. -+- Kapp (ds1=15 mm)
::t: ~. I value used by regulators I 1.0E-08
J 1 2 3 4 5 6 7 8 1 100mm
son Column Depth of Wetting Front Below the Storage (m)
9 10
Figure 3.2 Apparent Hydraulic Conductivity vs. Depth of the Wetting Front (for a laboratory column with varying thickness of the soil-manure
interface (dsl) assuming Ks2 = 10-5 cm/s)
Flux vs. Depth of Wetting Front (for varying thicknesses of the soil-manure interface layer (ds1))
1.0E+01 ··-·········· ·······-····· ··········-·· ·-··········· ····-········ .......•..•... ·······-····· ..........•.....•..•....•... ··············~ r-_._--q-(ds_1_=_3_m_m_) -,
1.0E+00 ...;.
~ L~~~~~.~~-~-~~--~-.. ~.:jJ~~=~·=~=~~~=~=-:=:=:1~~=~=~=-~~J~~=~~=~·=:~~~~~~~~~~~~;~~::~:~~ -•-q~s1=5mm) ~ ::-~:·=~:;.-t:=~·::::;-:.:::~~~:::~~J~::~~.... . .. ,,: .... q(ds1= 7 mm)
~ 1.0E-01 :- _ _. ... ;.~ .. ·q(ds1= 10 mm)
----q(ds1= 15 mm)
1.0E-02 +---+----t--+---+---+-----<1------t---r---t------;
1.0E-03 +---+---1--+---+--~--+---r--+---+---; 0 2 3 4 5 6 7 8 9 10
Depth of Wetting Front (m)
Figure 3.3 Flux vs. Depth of the Wetting Front (for a laboratory column with varying thickness of the soil
manure interface layer ( dsl) assuming Ks2 = 1 o-5 cm/s)
26
Apparent Hydraulic Conductivity vs. Depth of Wetting Front (for varying values of K2(cm/s})
1.0E-04 ,.--....,...--.--..----,--"""""-r---,--,....---r-----r-
1-~..-----------.
,_._ Kapp(Ks2= 1 0)
,......_ _ __.__--;I
~ l Ks2 = 10 cm/s ,! 1.0E-05 t--~-~-~-~--t==:t:::::t~~~~~~1···•···Kapp(Ks2= 10-4) ~ __,;r--·· Ks2 10-4 ·:;: ~r- -··::·.
~1.0E-06 /~,~~.~, ...... :: ... u •• ,·:N ,, ............ ,, ............. ~.:::-~.;[ ........ , ... ,,, ..... Kap~Ks2= 1~) o // I -·-·-:~::-···-· Kapp(Ks2= 1 0-6)
t I l ~1~~A~~~~-~-~-~-~~-~-~-~=~~=~~·~-~~~1~ ... .,; 1 Ks2 = 10-7
1.0E-08 -tt'--t----t---+---+--+---+---+----1--+'---1 ( 1 2
100mm 3 4 5 6 7 8 9 10
Soil Column Depth to the Wetting Front (m)
Figure 3.4 Apparent Hydraulic Conductivity vs. Depth of the Wetting Front (for a laboratory column with varying hydraulic conductivities
of the subsoil (Ks2))
Flux vs. Depth of Wetting Front {for varying values of Ks2{crnls))
-.-q(Ks2=10)
-··:::.--·- q(Ks2=10-5)
... iX; .... q(Ks2= 1 0-6)
1.0E-03 I Q 1 2 3 4 5 6 7 8 9 10
100mm Soil Column
Depth of Wetting Front (m)
Figure 3.5 Flux vs. Depth of the Wetting Front (for a laboratory column with varying hydraulic conductivities
of the subsoil (Ks2))
27
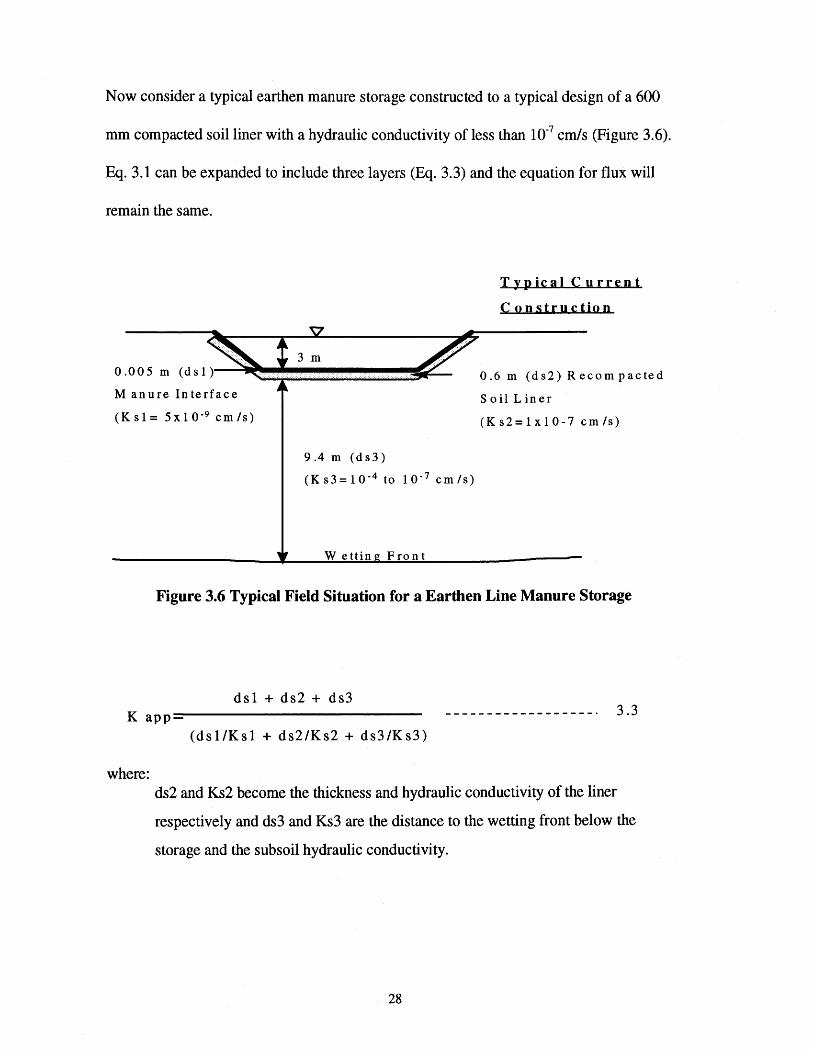
Now consider a typical earthen manure storage constructed to a typical design of a 600
mm compacted soil liner with a hydraulic conductivity of less than 10-7 cm/s (Figure 3.6).
Eq. 3.1 can be expanded to include three layers (Eq. 3.3) and the equation for flux will
remain the same.
Manure Interface
Typic a I Current
Construction
0.6 m (ds2) Recompacted
Soil Liner
( K s 1 = 5 x 1 0-9 c m Is) (Ks2=1x10⁻⁷ cmls)
9.4 m (ds3)
( K s 3 = 1 0- 4 to 1 0 -? c m Is)
Wettin Front
Figure 3.6 Typical Field Situation for a Earthen Line Manure Storage
dsl + ds2 + ds3 K app~-------------------------- 3.3
where:
(dsl/Ksl + ds2/Ks2 + ds3/Ks3)
ds2 and Ks2 become the thickness and hydraulic conductivity of the liner
respectively and ds3 and Ks3 are the distance to the wetting front below the
storage and the subsoil hydraulic conductivity.
28
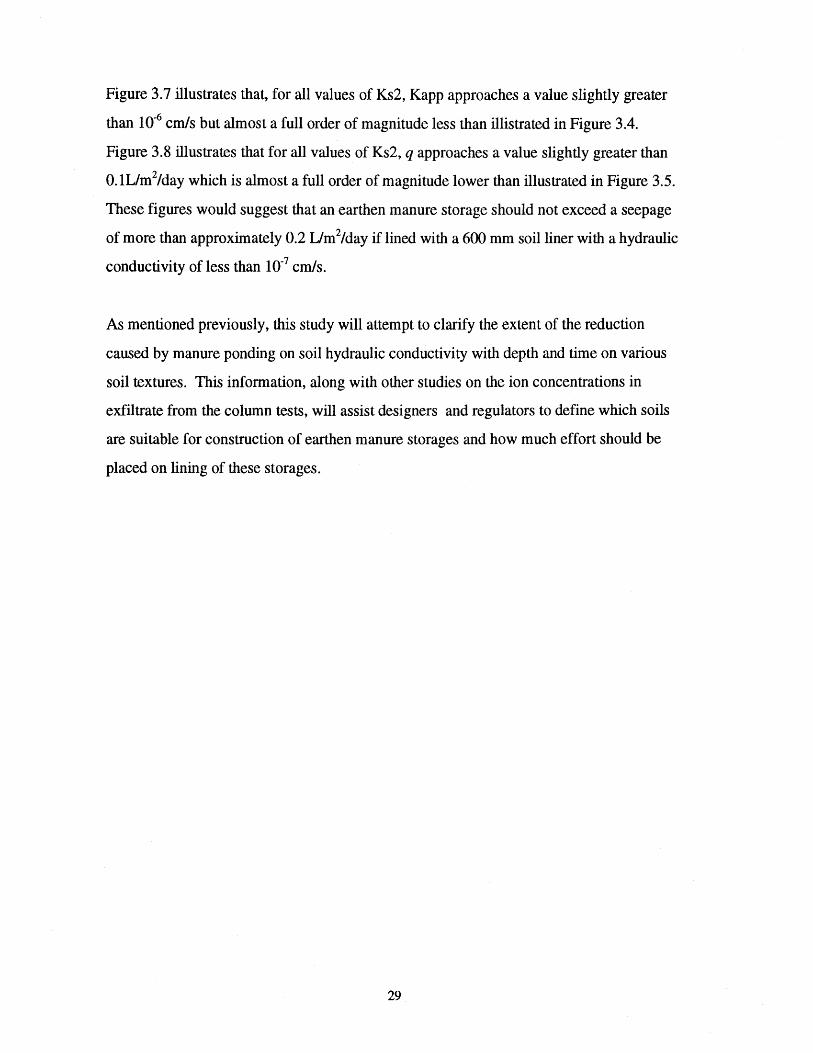
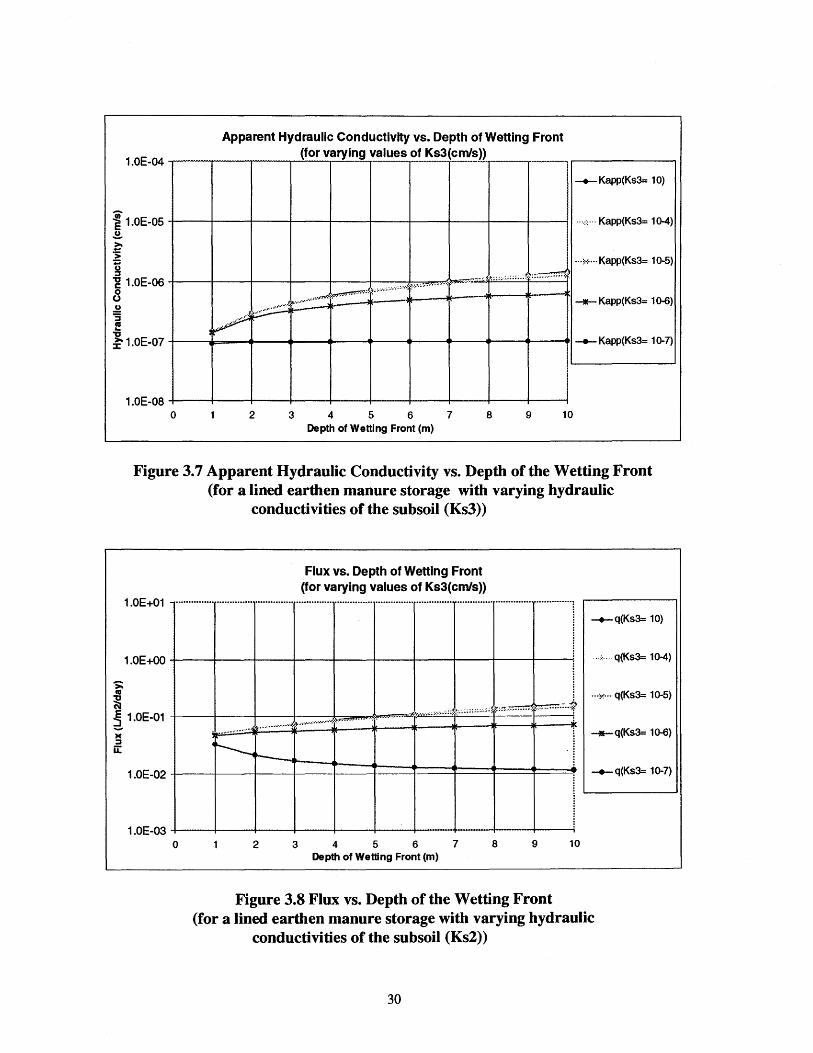
Figure 3.7 illustrates that, for all values of Ks2, Kapp approaches a value slightly greater
than 10-6 crn/s but almost a full order of magnitude less than illistrated in Figure 3.4.
Figure 3.8 illustrates that for all values of Ks2, q approaches a value slightly greater than
0.1L/m2/day which is almost a full order of magnitude lower than illustrated in Figure 3.5.
These figures would suggest that an earthen manure storage should not exceed a seepage
of more than approximately 0.2 Um2/day if lined with a 600 mm soil liner with a hydraulic
conductivity of less than 10-7 crn/s.
As mentioned previously, this study will attempt to clarify the extent of the reduction
caused by manure ponding on soil hydraulic conductivity with depth and time on various
soil textures. This information, along with other studies on the ion concentrations in
exfiltrate from the column tests, will assist designers and regulators to define which soils
are suitable for construction of earthen manure storages and how much effort should be
placed on lining of these storages.
29
>; ar
Apparent Hydraulic Conductivity vs. Depth of Wetting Front
1.oE-04 ,..--.....--.........,--,......;<!..-fo_r_v,a_!.ry~in.....::g~va_l.:...:...ue_s .. o..::...:f_K_s3--+(c.....:.rn/:..:.:...::_s!.!...)).,.........._-,--_......, .----------.
-+- Kapp(Ks3= 1 0)
1.0E-08 +---+-----1--+---+--t----+----+--+------+----1 0 2 3 4 5 6 7 8 9 10
Depth of Wetting Front (m)
Figure 3.7 Apparent Hydraulic Conductivity vs. Depth of the Wetting Front (for a lined earthen manure storage with varying hydraulic
conductivities of the subsoil (Ks3))
1.0E+01
1.0E+00
Flux vs. Depth of Wetting Front (for varying values of Ks3(cmls))
................................................................................................................................... ··············· -+-q(Ks3= 10)
···~·~···· q(Ks3= 10-5) ~ ..... _e 1.0E-01 +---+--l---+-----*=:;;:;;;;o ............. ~-~=-..n .•.. =···=···..d.-'~·--····=·······==l .... :;;;, .... ··::=~ .......... ;· ........... ::-.-.~\ ~ ~~·~··--~·~'~"'~~-~~w:~-~~~~·-""~~~--~~r-~--~~ >< ·~ .......... .. ---- q(Ks3= 10-6) :I
u:: ~~ 1.0E-02 L-L-L=t==t==±::==i===b==b~bd _._ q(Ks3= 10-7)
1.0E-03 +---+--1---+---+--+---+----t~-+---+----i 0 2 3 4 5 6 7 8 9 10
Depth of Wetting Front (m)
Figure 3.8 Flux vs. Depth of the Wetting Front (for a lined earthen manure storage with varying hydraulic
conductivities of the subsoil (Ks2))
30
4.0 METHODOLOGY
4.1 Soil Collection and Analysis
Thirteen subsoil materials were collected from various locations near Saskatoon,
Saskatchewan. Soils were collected from trench excavations, cuttings from test drilling or
from soil stockpiles. The soils are referred to by numbers 1 through 7. These were
chosen as they represent some of the "typical" soils found in Saskatchewan.
In preparation for physical and chemical analysis these subsoil samples were air dried,
ground and sieved through a 2mm sieve to remove larger stones and aggregates. The
Modified Pipette Method (lndorante et al., 1990) was used to determine soil sand, silt, and
clay content for selection of the final seven soils for use in column testing (Table 4.1).
These soil materials were selected on the basis of having a representative range of textures
that may be commonly used in construction of earthen manure storages, ranging from that
of medium clay content (30-40%) to low clay (less than 10%) and high sand content.
SOIL
1 2 3 4 5 6 7
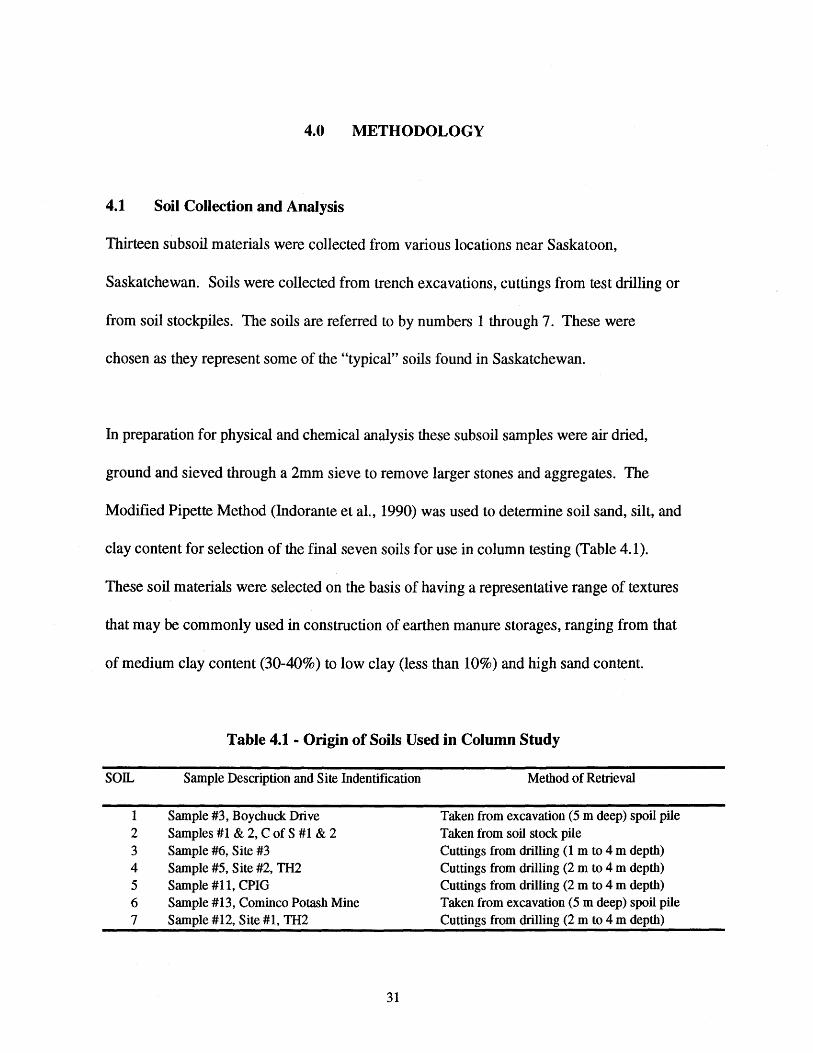
Table 4.1 - Origin of Soils Used in Column Study
Sample Description and Site lndentification
Sample #3, Boychuck Drive Samples #1 & 2, C of S #1 & 2 Sample #6, Site #3 Sample #5, Site #2, TH2 Sample #11, CPIG Sample #13, Cominco Potash Mine Sample #12, Site #1, TH2
31
Method of Retrieval
Taken from excavation (5 m deep) spoil pile Taken from soil stock pile Cuttings from drilling (1 m to 4 m depth) Cuttings from drilling (2 m to 4 m depth) Cuttings from drilling (2 m to 4 m depth) Taken from excavation (5 m deep) spoil pile Cuttings from drilling (2 m to 4 m depth)
The seven soils were then analyzed for physical properties within the laboratories of the
Engineering College (Table 4.2) and for chemical properties by Enviro-Test Laboratories
in Saskatoon, Saskatchewan. pH and EC (electrical conductivity) of the soils were
obtained from saturated paste extracts; cation exchange capacity was by lN BaCh, and
Sodium Adsorption Ratio from N a, Ca, and Mg ions from the saturated paste extract.
Table 4.2 - Testing Methods for Soil Physical Analysis
Physical Property Method Used/Reference
Soil Drying and Preparation ASTM D-421-85 (R93) Particle-Size Analysis ASTM D-422-63 (R90) Atterberg Limits ASTM D-4318-93 Proctor Analysis ASTM D-698-91 Moisture Content (mass) ASTM D-2216 -92 Unified Soil Classification ASTM 0-2487-93 Agricultural Soil Textural Class. USDA Textural Classification Chart, (PCA, 1992) Engineering Soil Textural Class. US-FAA Textural Classification Chart, (PCA, 1992)
4.2 Column Preparation
4.2.1 Column Construction
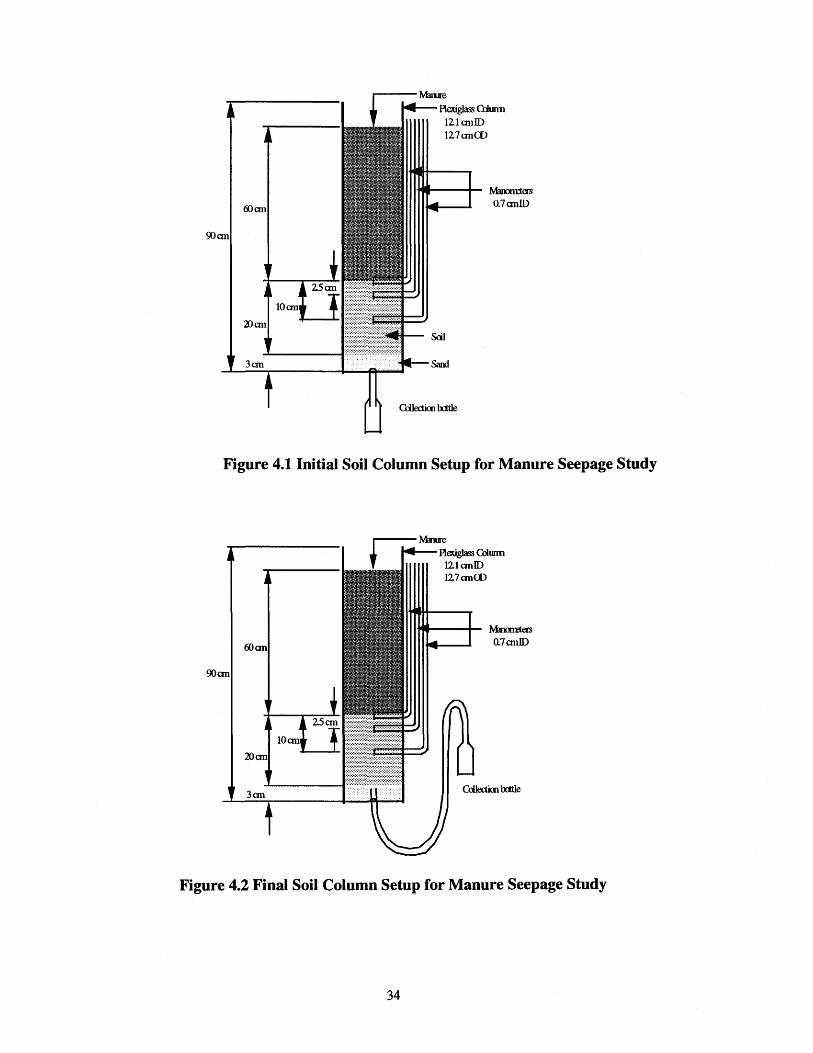
Test cylinders for determination of hydraulic conductivity values with ponded manure
were constructed based upon designs used by Barrington et al. (1987b) and Ghaly (1989).
The cylinders were from 120.6 mm ID acrylic cylinders and were a total of one meter in
length. Manometer tubes were installed at the soil surface, 25 mm below the surface and
at the midpoint of the soil column (Figure 4.1). The manometers were made up of a 6.4
mm ID stainless steel tubing inserted approximately 100 mm horizontally into the cylinder
32
with 3.2 mm diameter holes spaced every 13 mm for the portion within the soil.
Installation of the steel manometer tubes was accomplished by drilling holes into the
saturated soil columns using an electric drill and drilling through the acrylic tubing into the
soil. There was no scarification of the soil after drilling and before tube insertion. Clear
food grade tubing with an ID of 6.4 mm was attached to the stainless steel tube extruding
from the outside of the cylinder. These stainless steel manometers were installed after soil
saturation and before any hydraulic conductivity testing by drilling into the soil columns
with an electric drill, inserting the stainless steel tubes and water proofing with marine
grade sealant on the outside of the column. A 13 mm ID tapered to a 6.4 mm ID drain
insert was installed in the center of the bottom of each column. Clear 6.4 mm ID food
grade tubing was connected from the drain so as to empty vertically down to a sample
bottle (Figure 4.1 ). An air inlet device was installed in the drain line at the tip of the drain
insert to allow free drainage into the sample collection bottles. Later in the study the
vertical outflow tube was re-arranged for an "elbow" outflow tube so as to prevent air
entry through the manometers (Figure 4.2). An air inlet device was installed at the top of
the elbow to allow free drainage into the sample bottle.
33
Hexighm Giunn 121aniD 127an00
Figure 4.1 Initial Soil Column Setup for Manure Seepage Study
Figure 4.2 Final Soil Column Setup for Manure Seepage Study
34
4.2.2 Column Soil Packing
Prior to packing, the soils were dried, ground for 2 minutes, sieved through a 4. 7 5 mm
sieve, brought to optimum moisture content (ASTM D-698-91) and allowed to equilibrate
for a period of one week. Soils were compacted into the cylinders in 50 mm layers to a
200 mm total thickness. Each layer was compacted using a manufactured hammer of the
same weight per unit area as a standard proctor hammer (1233.5 kg/m2) dropped from a
height of 300 mm (ASTM D-698-91 ). The soil surface was scarified with a wire brush
between each layer. Soil compaction effort was 90% of Standard Proctor Density (ASTM
D-698-91 ). Simulation of Proctor Density was achieved by calculation of the amount of
wet soil required for each layer and by marking the column in 50 mm intervals. Each layer
required 6 to 12 hammer blows to compact to 50 mm, with the soils with the highest clay
content requiring the highest amount of hammer blows. The packing was meant to
simulate a minimum construction compaction level of 90% of Standard Proctor density
which the USDA Soil Conservation Service Technical Note 716 (1993) specifies as the
minimum compactive effort required when constructing an earthen manure storage with
their Type I and II soils. This level of compaction is thought to be obtained through the
normal operation of construction equipment during construction with no _specific effort
placed on additional compaction (USDA SCS 1993, Barrington et al. 1989). Three
replicates of each soil were completed for a total of 21 columns. The columns were
35
installed in a controlled temperature room at 7°C, a normal annual average for shallow
Prairie groundwater systems (Gillies, 1996). For the purpose of other studies the
replicates will be disassembled at various times for chemical analysis and microscopic
examination.
The bulk density of the soil in the column was calculated from the packed soil moisture
content, the mass of the soil packed into the column and the dimensions of the column.
This value of bulk density was used to calculate porosity with an assumed soil particle
density of 2650 kg/m3• The resulting porosity was used to calculate the void ratios for
each column. All calculations of bulk density, porosity and void ratio were after Hillel
(1980). Effective void diameter for each column was calculated after Barrington and
Jutras (1985) and Barrington and Broughton (1988). They used Equations 2.3 and 2.4
which describes the effective soil pore or void diameter by transforming a given soil into
one of a single particle size of equivalent fluid permeability.
4.3 Hydraulic Conductivity Determination
4.3.1 Initial Hydraulic Conductivity Determination With Water
The soils, as packed in their columns, were allowed to saturate with tap water under a
surface ponding of 600 mm for a period of two weeks. Hydraulic conductivity of the
entire soil column was then determined by maintaining a constant head of tap water and
measuring outflow with time. It was assumed that the hydraulic conductivity of the s~nd
36
base was large enough so that resistance to transport was negligible relative to the soil
material (flow distance of 200 mm). Exftltrate tap water was returned to the top of the
columns to maintain solution concentration in each column. Hydraulic conductivity values
were calculated using Darcy's law for fluid flow through a porous media.
4.3.2 Hydraulic Conductivity Measurement With Ponded Manure
About four weeks after initial saturation with tap water, the ponded head of water was
removed and manure was added without allowing the water in the soil to drain. Seepage
was collected in bottles sealed against evaporation. Seepage rates were determined by
weekly weighing the amount of exftltrated. When sufficient exftltrate was collected (20
to 50 ml) for each column the exftltrate was then taken for chemical analysis. It often
took between one and four weeks to collect sufficient sample for analysis.
The manure was fresh manure from the pen gutters of a local hog barn and had about
1.5% dissolved solids and about 5.1% suspended solids (Table 4.3). Manure analysis was
done by the Environmental Engineering Laboratory of the Dept. of Civil Engineering,
University of Saskatchewan. Total N in was by Kjeldahl and total diss~lved solids was by
evaporation. Na, K, Cl, N03, pH, and electrical conductivity are values measured in
solution while Nii. and Total P are values in solutions from dissolved solids.
37
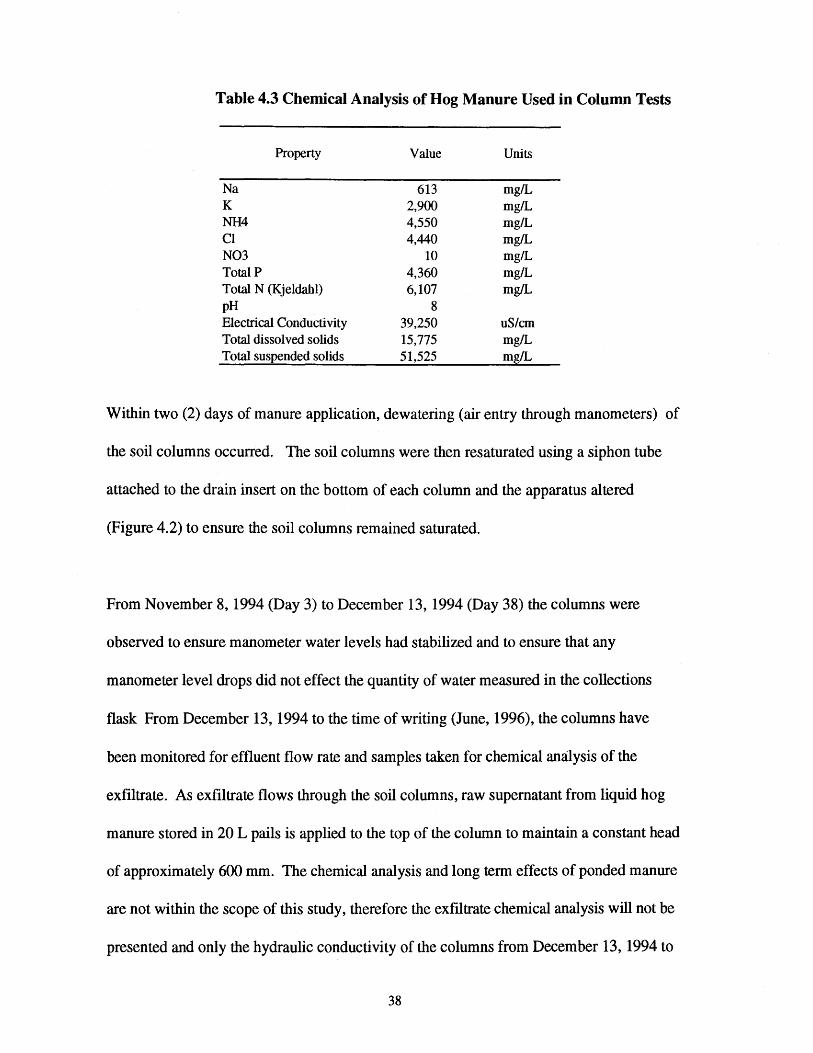
Table 4.3 Chemical Analysis of Hog Manure Used in Column Tests
Property Value Units
Na 613 mg/L K 2,900 mg/L NH4 4,550 mg/L Cl 4,440 mg!L N03 10 mg/L TotalP 4,360 mg/L Total N (Kjeldahl) 6,107 mg/L pH 8 Electrical Conductivity 39,250 uS/em Total dissolved solids 15,775 mg/L Total suspended solids 51,525 mg/L
Within two (2) days of manure application, dewatering (air entry through manometers) of
the soil columns occurred. The soil columns were then resaturated using a siphon tube
attached to the drain insert on the bottom of each column and the apparatus altered
(Figure 4.2) to ensure the soil columns remained saturated.
From November 8, 1994 (Day 3) to December 13, 1994 (Day 38) the columns were
observed to ensure manometer water levels had stabilized and to ensure that any
manometer level drops did not effect the quantity of water measured in the collections
flask From December 13, 1994 to the time of writing (June, 1996), the columns have
been monitored for effluent flow rate and samples taken for chemical analysis of the
exfiltrate. As exfiltrate flows through the soil columns, raw supernatant from liquid hog
manure stored in 20 L pails is applied to the top of the column to maintain a constant head
of approximately 600 mm. The chemical analysis and long term effects of ponded manure
are not within the scope of this study, therefore the exfiltrate chemical analysis will not be
presented and only the hydraulic conductivity of the columns from December 13, 1994 to
38
May 9, 1995 will be presented and discussed. May 9, 1995 was chosen for the cutoff of
the data presented and analyzed in this thesis as this is the date when one column of each
set was dismantled under another study and a 24 hour cooler failure near the end of May
1995 introduced new phenomenon which will be further investigated under other studies.
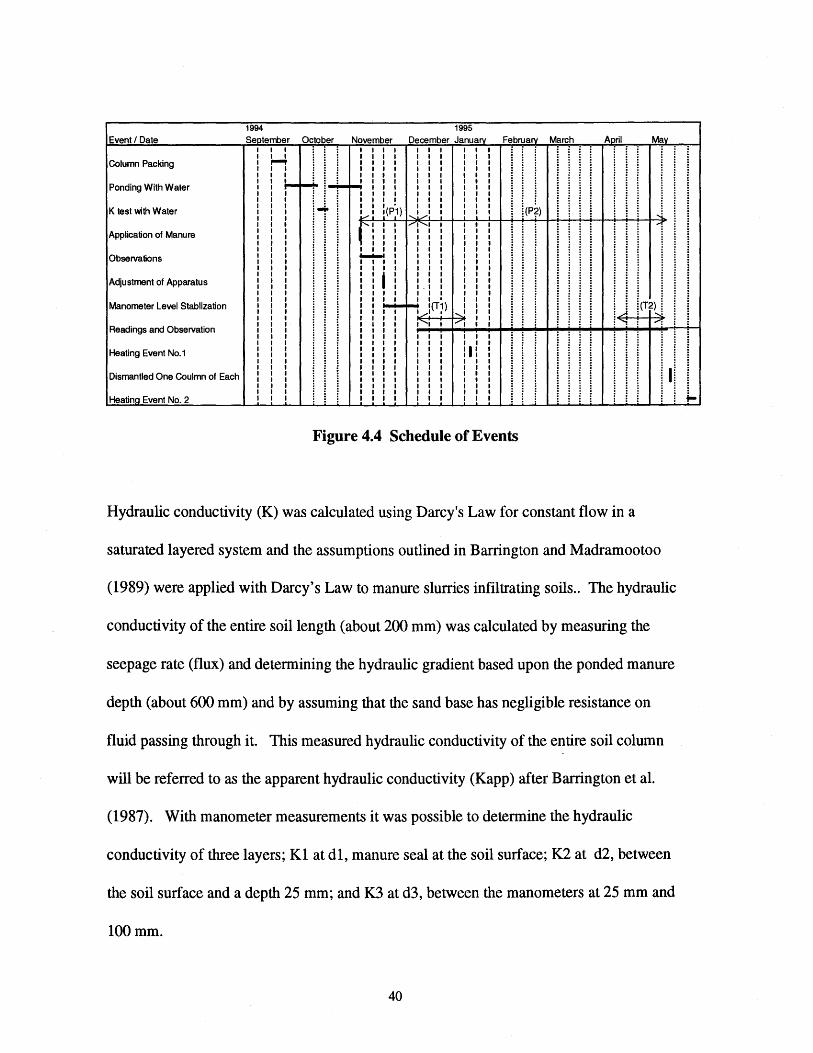
When manure was ponded on the soil columns there was a period when the pressure at the
manometers reduced below the level of the manometer allowing air entry into the system
(Figure No. 4.4). The outlet tube position was adjusted to above the soil surface, the
columns were saturated with water from the bottom and the system was allowed to
equilibrate. From manure ponding to the time when the outflow and manometers
stabilized was from November 5, 1994 (Day 0) to December 13, 1994 (Day 38). On May
9, 1995 (Day 185) one of the columns from each set was disassembled in conjunction with
a separate study. For these reasons I will split the analysis into two periods, Day 0 to Day
38 (P1) and Day 38 to Day 185 (P2). Further, to give representative values at the
beginning and end of the second period, I will use an average of the first five (5) readings
(Day 38 to Day 73) and define this time period as T1 and an average of the last five (5)
readings (Day 157 to Day 185) and define this time period as T2.
I will report on both P1 and P2 for the objective of analyzing the effect of manure
clogging with time and I will limit my reporting to period P2 for the objectives of
analyzing the effect of manure clogging with depth and the effect of texture upon
clogging. The latter two objectives can not be discussed due to lack of data during the
period Pl.
39
1994 1995 Event/ Date September October November December January February March Aoril Mav
I I I I I I I I
Column Packing ,....., I I I I I I I I I
Pending With Water !--t!-!-r-! I I I I
I I I I I I
K test with Water
I~ I :(P.1) l(P?) !.., "'-.1/i ....... r _,."I ...-:
Application of Manure
Observations ........ Adjustment of Apparatus
I (T2) Manometer Level Stablization ~ ~ 1(T1)
...d_ ........ : ' :, ~ '-i I / '! .....-:
Readings and Observation I I
Heating Event No.1 I I I I I
I! Dismantled One Coulmn of Each I I I I I I I
Heatino Event No. 2 I • I +-
Figure 4.4 Schedule of Events
Hydraulic conductivity (K) was calculated using Darcy's Law for constant flow in a
saturated layered system and the assumptions outlined in Barrington and Madramootoo
(1989) were applied with Darcy's Law to manure slurries infiltrating soils .. The hydraulic
conductivity of the entire soil length (about 200 mm) was calculated by measuring the
seepage rate (flux) and determining the hydraulic gradient based upon the ponded manure
depth (about 600 mm) and by assuming that the sand base has negligible resistance on
fluid passing through it. This measured hydraulic conductivity of the entire soil column
will be referred to as the apparent hydraulic conductivity (Kapp) after Barrington et al.
(1987). With manometer measurements it was possible to determine the hydraulic
conductivity of three layers; K1 at d1, manure seal at the soil surface; K2 at d2, between
the soil surface and a depth 25 mm; and K3 at d3, between the manometers at 25 mm and
lOOmm.
40
Measurements of apparent of the soil columns, the hydraulic conductivities of the
individual layers and results of calculations of apparent hydraulic conductivity, using
Equation 2.5, were plotted against time and various soil physical and chemical properties.
The calculations of apparent hydraulic conductivity were based on using the hydraulic
conductivity of the soil-manure interface with a thickness of 5 mm and the use of the
hydraulic conductivity of the soil with water for the remaining layers. These figures were
used to interpret the results and compile conclusions to answer the objectives set out in
Section No.1.
41
5.0 RESULTS AND DISCUSSION
5.1 Soil Properties
5.1.1 Physical Soil Properties
The soils used in the columns ranged in clay content from 9% to 33% and in sand content
from 20% to 75% (Table 5.1). Soils No.3, 4, 5, and 6 have similar clay and sand contents
with only slight variations; clay content ranged between 12% and 17%, while sand content
ranged from 41% to 55%. As many guidelines propose a minimum clay content of 15%
for self-sealing in earthen hog manure storages (Barrington and Jutras, 1985)(Barrington
and Broughton, 1988) (British Columbia, 1991 and 1992) (USDA SCS, 1993)(0ntario,
1994), these soils selected from different locations will provide a good evaluation of this
guideline.
Based on the Unified Soil Classification the soils ranged from an SM to a CH (Table 5.1).
The Plasticity Index of the soils ranged from non-plastic for Soil No.7 (sandy loam or
SM) to a high of 35 for Soil No. 1 (clay loam or CH). Plasticity Index of the loam soils
(ML to CL) ranged from 7% to 15%. The USDA SCS (1993) Technical Note No. 716,
which is used by many state regulatory agencies, recommends a minimum Plasticity Index
of 10%.
42
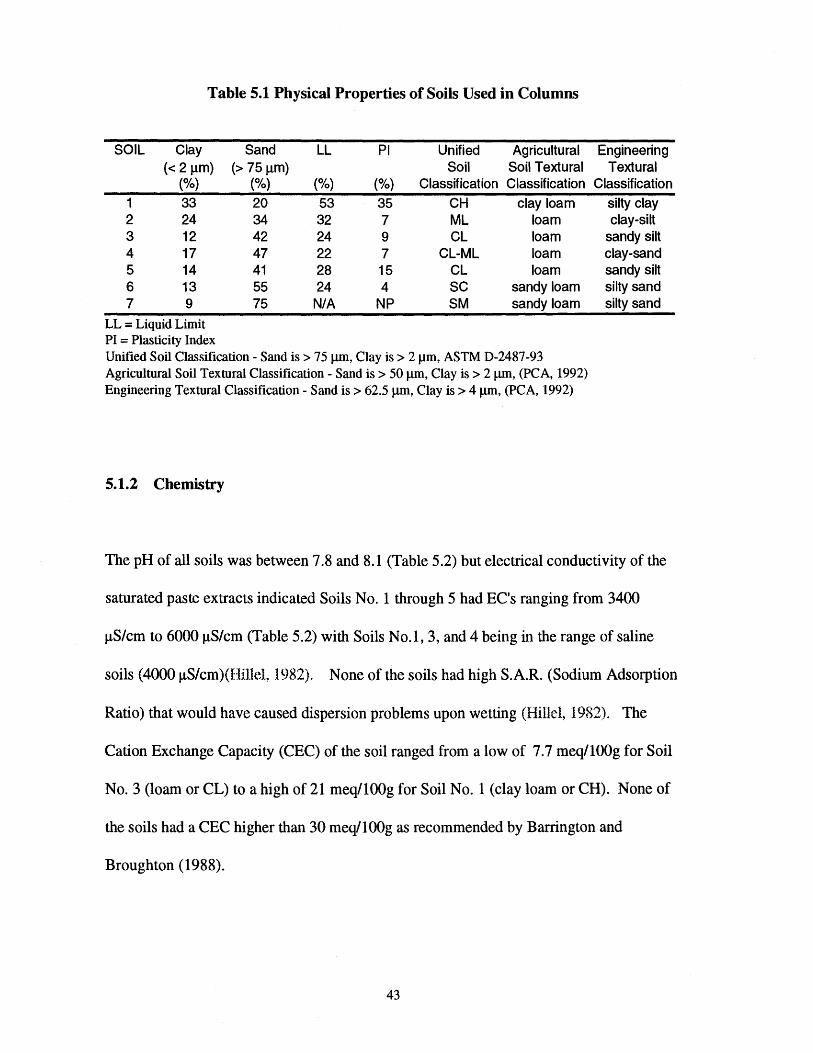
Table 5.1 Physical Properties of Soils Used in Columns
SOIL Clay Sand LL PI Unified Agricultural Engineering {< 2 Jlm) {> 75 Jlm) Soil Soil Textural Textural
(Ofo) {o/o) {o/o) {o/o) Classification Classification Classification 1 33 20 53 35 CH clay loam silty clay 2 24 34 32 7 ML loam clay-silt 3 12 42 24 9 CL loam sandy silt 4 17 47 22 7 CL-ML loam clay-sand 5 14 41 28 15 CL loam sandy silt 6 13 55 24 4 sc sandy loam silty sand 7 9 75 N/A NP SM sandy loam silty sand
LL = Liquid Limit PI = Plasticity Index Unified Soil Classification- Sand is> 75 Jllll, Clay is> 2 Jllll, ASTM D-2487-93 Agricultural Soil Textural Classification- Sand is> 50 Jllll, Clay is> 2 Jllll, (PCA, 1992) Engineering Textural Classification- Sand is> 62.5 Jllll, Clay is> 4 Jllll, (PCA, 1992)
5.1.2 Chemistry
The pH of all soils was between 7.8 and 8.1 (Table 5.2) but electrical conductivity of the
saturated paste extracts indicated Soils No. 1 through 5 had EC's ranging from 3400
JlS/cm to 6000 JlS/cm (Table 5.2) with Soils No.1, 3, and 4 being in the range of saline
soils (4000 JlS/cm)(Hillet 1982). None of the soils had high S.A.R. (Sodium Adsorption
Ratio) that would have caused dispersion problems upon wetting (Hillel~ 1982). The
Cation Exchange Capacity (CEC) of the soil ranged from a low of 7.7 meq/lOOg for Soil
No. 3 (loam or CL) to a high of 21 meq/lOOg for Soil No. 1 (clay loam or CH). None of
the soils had a CEC higher than 30 meq/lOOg as recommended by Barrington and
Broughton (1988).
43
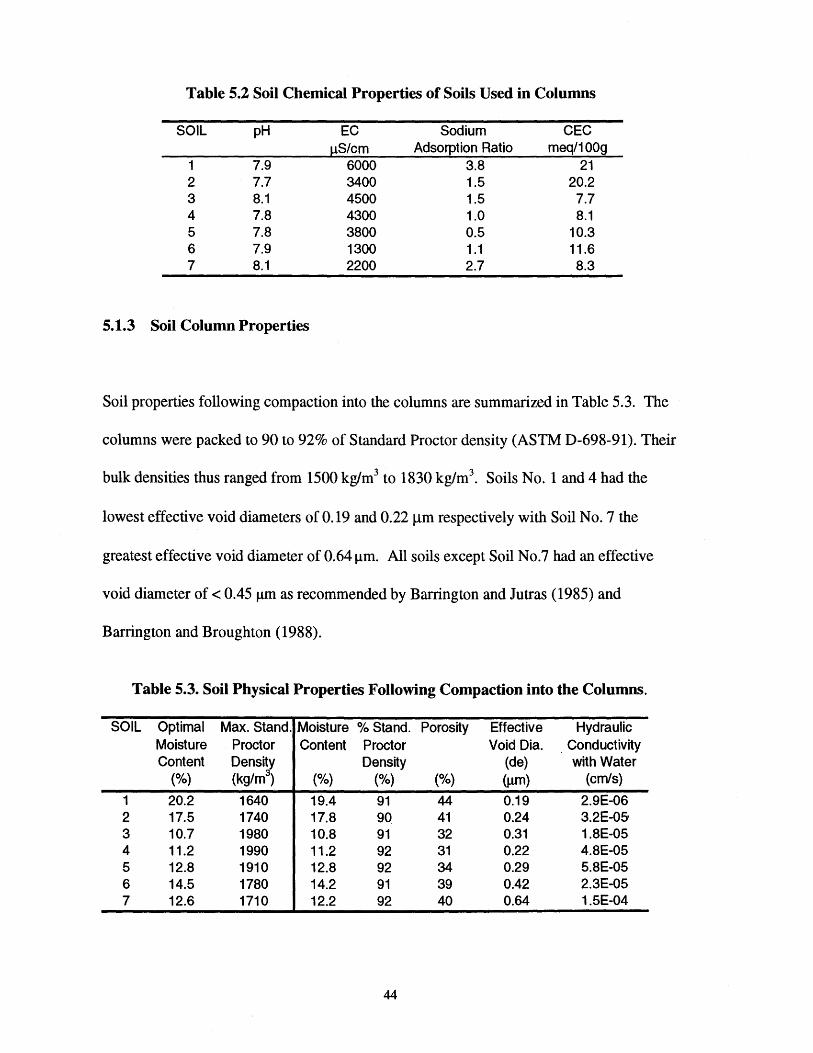
Table 5.2 Soil Chemical Properties of Soils Used in Columns
SOIL pH EC Sodium CEC f..LS/cm Adsorption Ratio meq/100g
1 7.9 6000 3.8 21 2 7.7 3400 1.5 20.2 3 8.1 4500 1.5 7.7 4 7.8 4300 1.0 8.1 5 7.8 3800 0.5 10.3 6 7.9 1300 1.1 11.6 7 8.1 2200 2.7 8.3
5.1.3 Soil Column Properties
Soil properties following compaction into the columns are summarized in Table 5.3. The
columns were packed to 90 to 92% of Standard Proctor density (ASTM D-698-91). Their
bulk densities thus ranged from 1500 kglm3 to 1830 kg/m3• Soils No. 1 and 4 had the
lowest effective void diameters of 0.19 and 0.22 Jlm respectively with Soil No. 7 the
greatest effective void diameter of 0.64 Jlm. All soils except Soil No.7 had an effective
void diameter of < 0.45 Jlffi as recommended by Barrington and Jutras ( 1985) and
Barrington and Broughton (1988).
Table 5.3. Soil Physical Properties Following Compaction into the Columns.
SOIL Optimal Max. Stand. Moisture o/o Stand. Porosity Effective Hydraulic Moisture Proctor Content Proctor Void Dia. _ Conductivity Content Density Density (de) with Water
(0/o) (kg/m
3) (o/o) (
0/o) {0/o) (J..tm) (cm/s)
1 20.2 1640 19.4 91 44 0.19 2.9E-06 2 17.5 1740 17.8 90 41 0.24 3.2E-O& 3 10.7 1980 10.8 91 32 0.31 1.8E-05 4 11.2 1990 11.2 92 31 0.22 4.8E-05 5 12.8 1910 12.8 92 34 0.29 5.8E-05 6 14.5 1780 14.2 91 39 0.42 2.3E-05 7 12.6 1710 12.2 92 40 0.64 1.5E-04
44
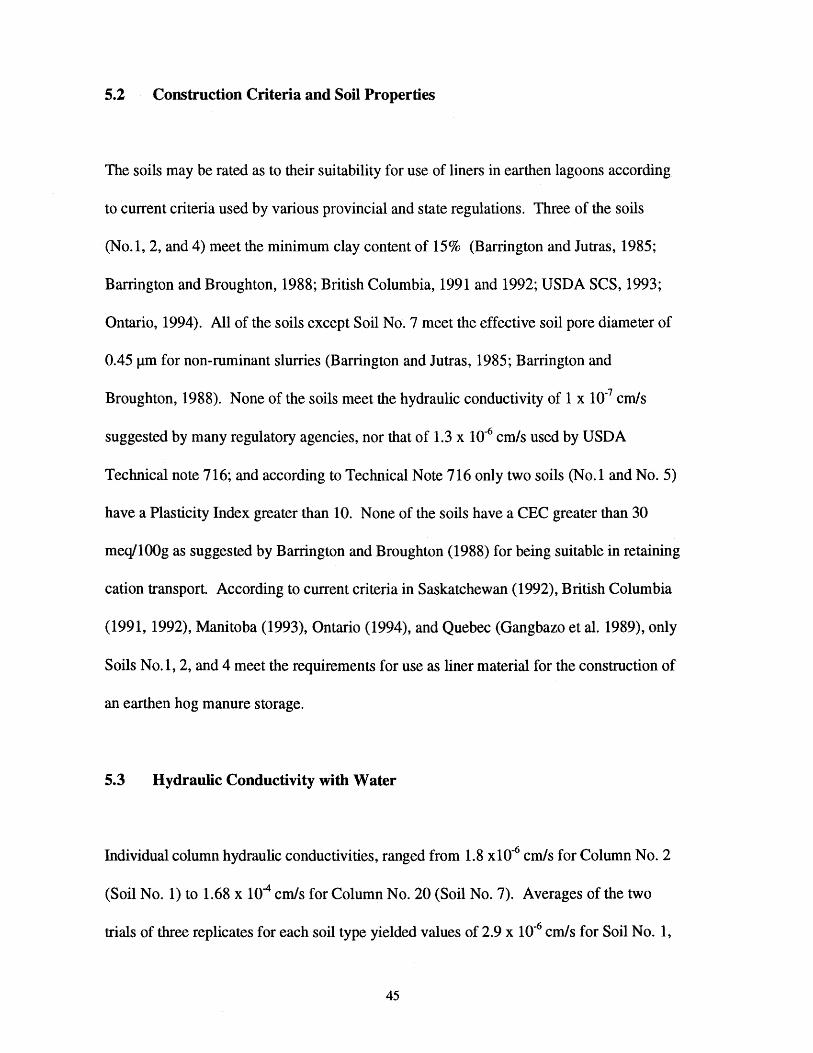
5.2 Construction Criteria and Soil Properties
The soils may be rated as to their suitability for use of liners in earthen lagoons according
to current criteria used by various provincial and state regulations. Three of the soils
(No.1, 2, and 4) meet the minimum clay content of 15% (Barrington and Jutras, 1985;
Barrington and Broughton, 1988; British Columbia, 1991 and 1992; USDA SCS, 1993;
Ontario, 1994). All of the soils except Soil No.7 meet the effective soil pore diameter of
0.45 J.tm for non-ruminant slurries (Barrington and Jutras, 1985; Barrington and
Broughton, 1988). None of the soils meet the hydraulic conductivity of 1 x 10⁻⁷ crnls
suggested by many regulatory agencies, nor that of 1.3 x 10⁻⁶ cm/s used by USDA
Technical note 716; and according to Technical Note 716 only two soils (No.1 and No.5)
have a Plasticity Index greater than 10. None of the soils have a CEC greater than 30
meq/100g as suggested by Barrington and Broughton (1988) for being suitable in retaining
cation transport According to current criteria in Saskatchewan (1992), British Columbia
(1991, 1992), Manitoba (1993), Ontario (1994), and Quebec (Gangbazo et al. 1989), only
Soils No.1, 2, and 4 meet the requirements for use as liner material for the construction of
an earthen hog manure storage.
5.3 Hydraulic Conductivity with Water
Individual column hydraulic conductivities, ranged from 1.8 x10⁻⁶ cm/s for Column No. 2
(Soil No. 1) to 1.68 x 10⁴ crnls for Column No. 20 (Soil No.7). Averages of the two
trials of three replicates for each soil type yielded values of 2.9 x 10⁻⁶ cm/s for Soil No. 1,
45
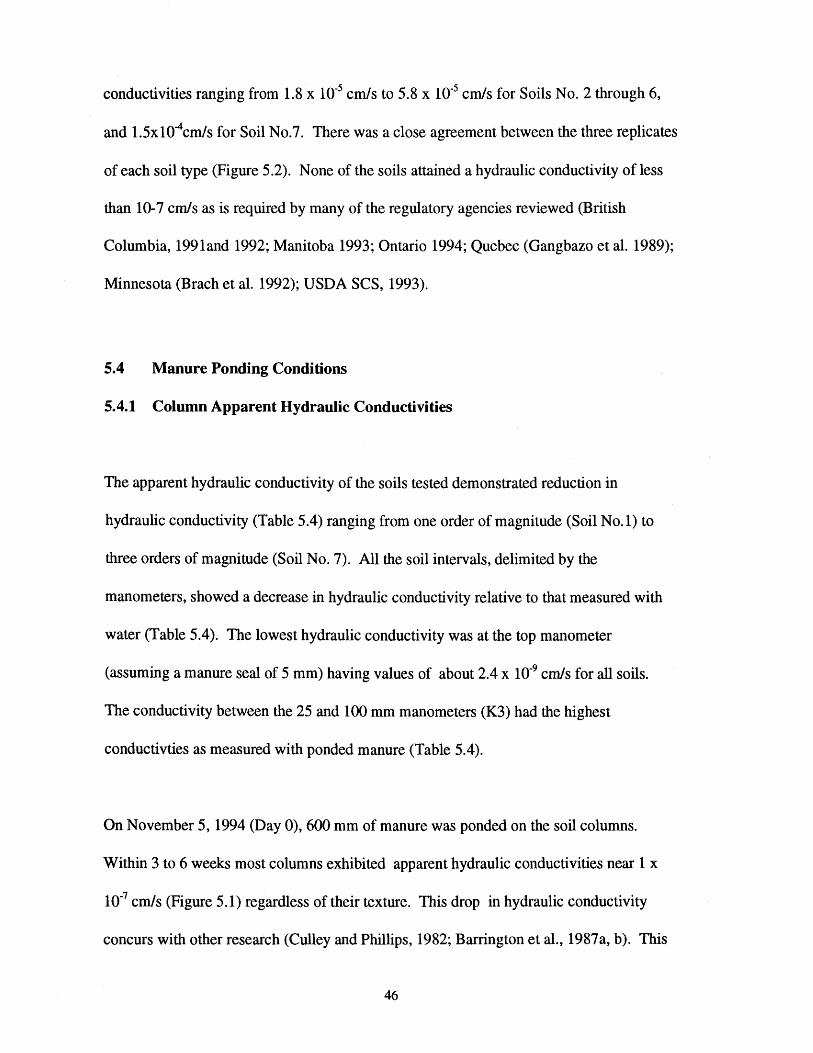
conductivities ranging from 1.8 x 10⁻⁵ cm/s to 5.8 x 10⁻⁵ cm/s for Soils No. 2 through 6,
and 1.5x104 cm/s for Soil No.7. There was a close agreement between the three replicates
of each soil type (Figure 5.2). None of the soils attained a hydraulic conductivity of less
than 10-7 crn/s as is required by many of the regulatory agencies reviewed (British
Columbia, 1991and 1992; Manitoba 1993; Ontario 1994; Quebec (Gangbazo et al. 1989);
Minnesota (Brach et al. 1992); USDA SCS, 1993).
5.4 Manure Ponding Conditions
5.4.1 Column Apparent Hydraulic Conductivities
The apparent hydraulic conductivity of the soils tested demonstrated reduction in
hydraulic conductivity (Table 5.4) ranging from one order of magnitude (Soil No.1) to
three orders of magnitude (Soil No.7). All the soil intervals, delimited by the
manometers, showed a decrease in hydraulic conductivity relative to that measured with
water (Table 5.4). The lowest hydraulic conductivity was at the top manometer
(assuming a manure seal of 5 mm) having values of about 2.4 x 1 o-9 cm/s for all soils.
The conductivity between the 25 and 100 mm manometers (K3) had the highest
conductivties as measured with ponded manure (Table 5.4).
On November 5, 1994 (Day 0), 600 mm of manure was ponded on the soil columns.
Within 3 to 6 weeks most columns exhibited apparent hydraulic conductivities near 1 x
10-7 cm/s (Figure 5.1) regardless of their texture. This drop in hydraulic conductivity
concurs with other research (Culley and Phillips, 1982; Barrington et al., 1987a, b). This
46
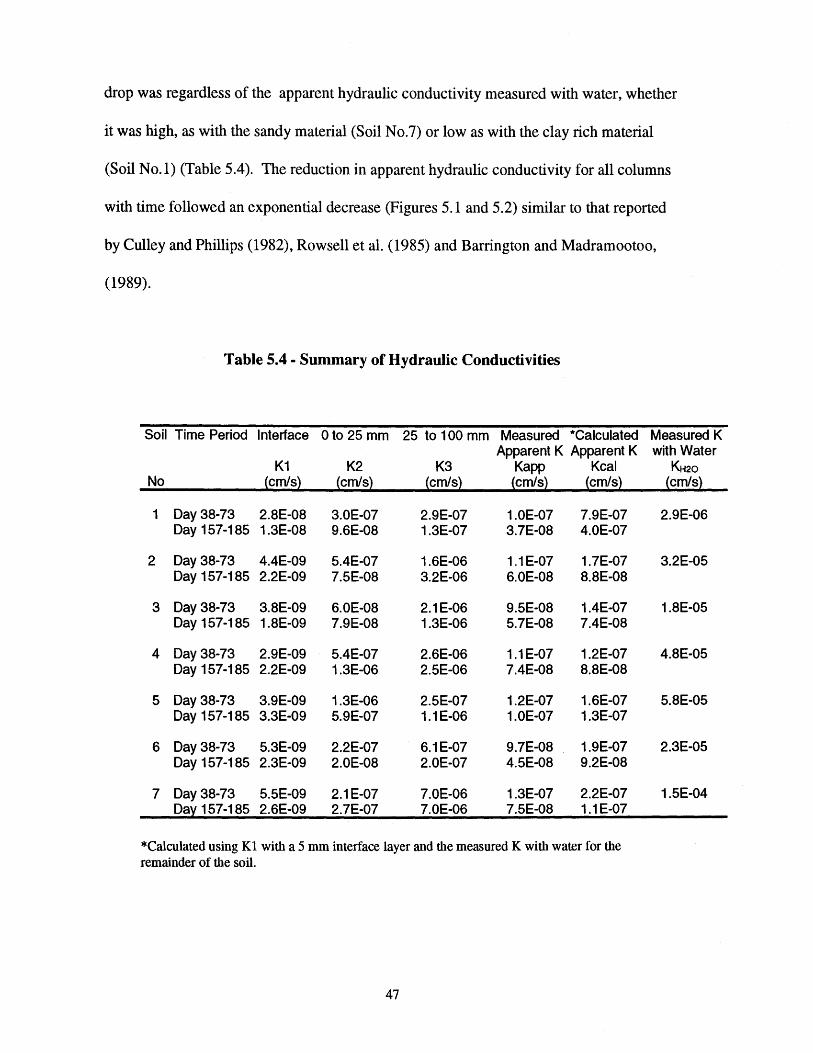
drop was regardless of the apparent hydraulic conductivity measured with water, whether
it was high, as with the sandy material (Soil No.7) or low as with the clay rich material
(Soil No.1) (Table 5.4). The reduction in apparent hydraulic conductivity for all columns
with time followed an exponential decrease (Figures 5.1 and 5.2) similar to that reported
by Culley and Phillips (1982), Rowsell et al. (1985) and Barrington and Madramootoo,
(1989).
Table 5.4 - Summary of Hydraulic Conductivities
Soil Time Period Interface Oto 25 mm 25 to 100 mm Measured *Calculated Measured K Apparent K Apparent K with Water
K1 K2 K3 Kapp Kcal KH20 No (cm/s) (cm/s) (cm/s) (cm/s) (cm/s) (cm/s)
1 Day 38-73 2.8E-08 3.0E-07 2.9E-07 1.0E-07 7.9E-07 2.9E-06 Day 157-185 1.3E-08 9.6E-08 1.3E-07 3.7E-08 4.0E-07
2 Day 38-73 4.4E-09 5.4E-07 1.6E-06 1.1 E-07 1.7E-07 3.2E-05 Day 157-185 2.2E-09 7.5E-08 3.2E-06 6.0E-08 8.8E-08
3 Day 38-73 3.8E-09 6.0E-08 2.1E-06 9.5E-08 1.4E-07 1.8E-05 Day 157-185 1.8E-09 7.9E-08 1.3E-06 5.7E-08 7.4E-08
4 Day 38-73 2.9E-09 5.4E-07 2.6E-06 1.1E-07 1.2E-07 4.8E-05 Day 157-185 2.2E-09 1.3E-06 2.5E-06 7.4E-08 8.8E-08
5 Day 38-73 3.9E-09 1.3E-06 2.5E-07 1.2E-07 1.6E-07 5.8E-05 Day 157-185 3.3E-09 5.9E-07 1.1 E-06 1.0E-07 1.3E-07
6 Day 38-73 5.3E-09 2.2E-07 6.1 E-07 9.7E-08 1.9E-07 2.3E-05 Day 157-185 2.3E-09 2.0E-08 2.0E-07 4.5E-08 9.2E-08
7 Day 38-73 5.5E-09 2.1E-07 7.0E-06 1.3E-07 2.2E-07 1.5E-04 Day 157-185 2.6E-09 2.7E-07 7.0E-06 7.5E-08 1.1 E-07
*Calculated using Kl with a 5 mm interface layer and the measured K with water for the remainder of the soil.
47
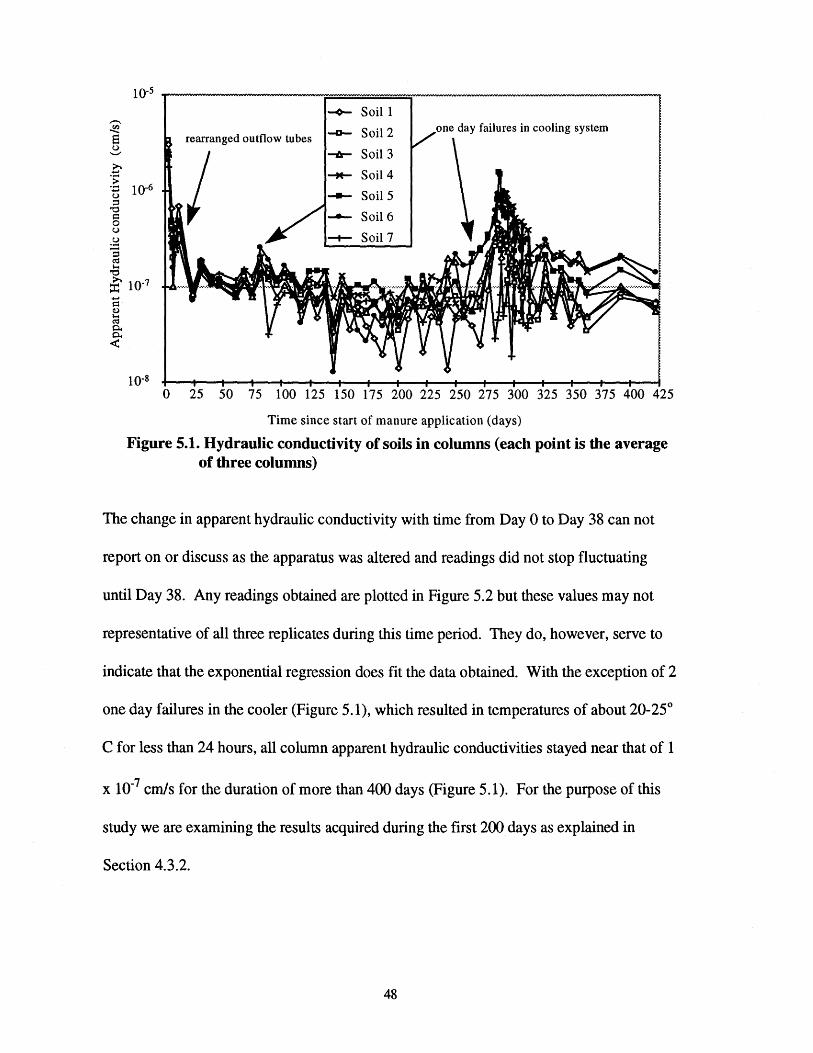
rearranged outflow tubes day failures in cooling system
10·8
0 25 50 75 100 125 150 175 200 225 250 275 300 325 350 375 400 425
Time since start of manure application (days)
Figure 5.1. Hydraulic conductivity of soils in columns (each point is the average of three columns)
The change in apparent hydraulic conductivity with time from Day 0 to Day 38 can not
report on or discuss as the apparatus was altered and readings did not stop fluctuating
until Day 38. Any readings obtained are plotted in Figure 5.2 but these values may not
representative of all three replicates during this time period. They do, however, serve to
indicate that the exponential regression does fit the data obtained. With the exception of 2
one day failures in the cooler (Figure 5.1), which resulted in temperatures of about 20-25°
C for less than 24 hours, all column apparent hydraulic conductivities stayed near that of 1
x 10-7 cm/s for the duration of more than 400 days (Figure 5.1). For the purpose of this
study we are examining the results acquired during the first 200 days as explained in
Section 4.3 .2.
48
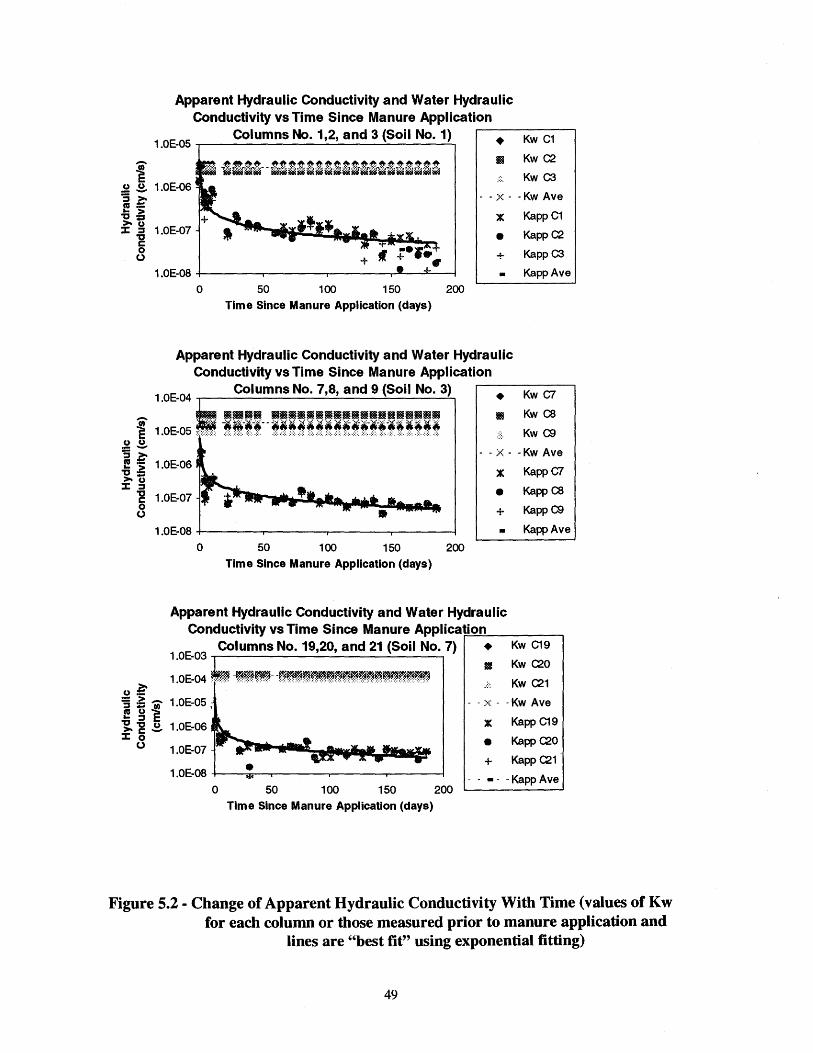
()~
Apparent Hydraulic Conductivity and Water Hydraulic Conductivity vs Time Since Manure Application
1_0
E_05
...----C_o_l_u_m_n_s_N_o_._1....:..,2....:..,_a_n_d_3....:.(S_o_i_I_N_o_. _1.:...,) .---.--K-w-c1-·
m Kw C2
.·:· Kw C3
- - >:: - -Kw Ave
X KappC1
• KappC2
+ KappC3
KappAve
0 50 100 150 200 Time Since Manure Application (days)
Apparent Hydraulic Conductivity and Water Hydraulic Conductivity vs Time Since Manure Application
1_0
E_04
...---Co_l_u_m_n_s_N_o_._7....:..,_8.:....., _a_n_d_9_(!,_S_o_ii_N_o_. 3~):_ r--.--K-w_c:7_,
a Kw C8
.:::. Kw C9
- -X- -Kw Ave 1.0E-06
X Kapp c:1
1.0E-07 • Kapp C8
+ Kapp C9
1.0E-08 +----...----r-----..-------1 • KappAve
0 50 100 150 200 Time Since Manure Application (days)
Apparent Hydraulic Conductivity and Water Hydraulic Conductivity vs Time Since Manure Applicatr-io=n~-----.
1_0
E_03
Columns No. 19,20, and 21 (Soil No.7) • 11 Kw C20
Kw C19
.. ::: Kw C21
=§ ~ 0 1.0E-05 , ftS()"::: .. ::s t:
- -X- -Kw Ave
:.c Kapp C19
• Kapp C20 'g. ~ ~ 1.0E-06 :I: 0
0 1.0E-07 + Kapp C21
0 50 100 150 200 - - •- - Kapp Ave
Time Since Manure Application (days)
Figure 5.2- Change of Apparent Hydraulic Conductivity With Time (values of Kw for each column or those measured prior to manure application and
lines are "best fit" using exponential fitting)
49
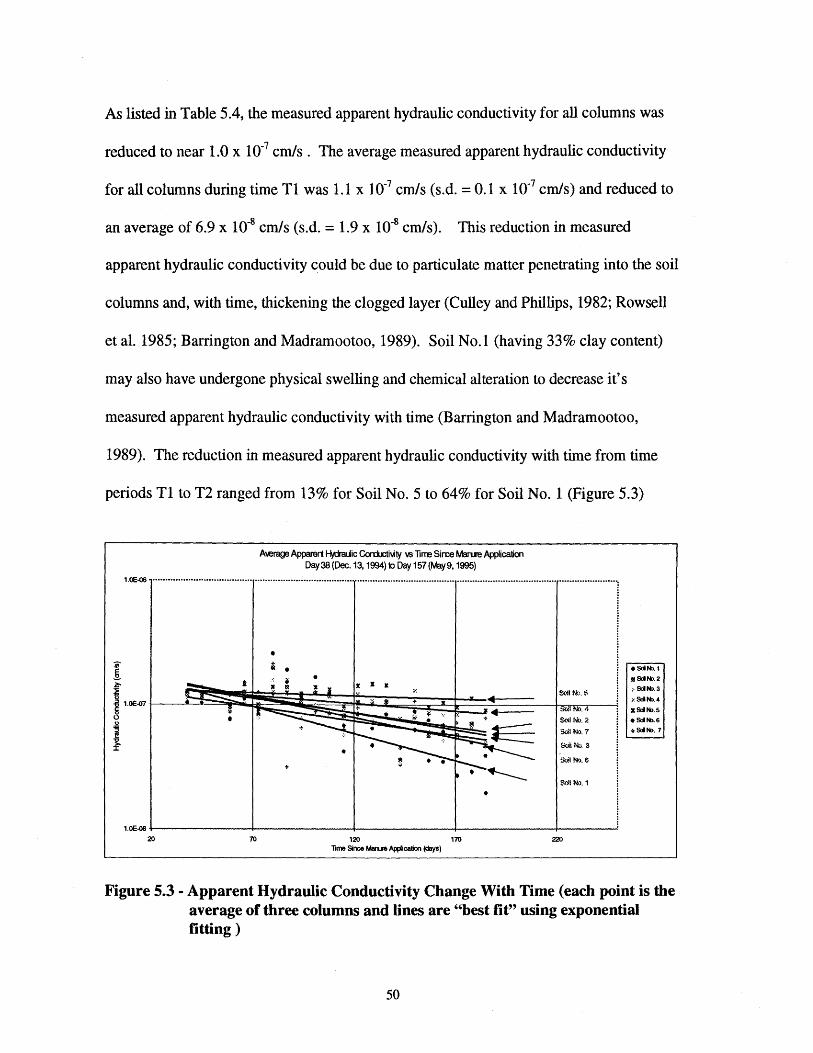
As listed in Table 5.4, the measured apparent hydraulic conductivity for all columns was
reduced to near 1.0 x 10⁻⁷ cm/s. The average measured apparent hydraulic conductivity
for all columns during time Tl was 1.1 x 10⁻⁷ cm/s (s.d. = 0.1 x 10⁻⁷ crnls) and reduced to
an average of 6.9 x 10⁻⁸ cm/s (s.d. = 1.9 x 10⁻⁸ crnls). This reduction in measured
apparent hydraulic conductivity could be due to particulate matter penetrating into the soil
columns and, with time, thickening the clogged layer (Culley and Phillips, 1982; Rowsell
et al. 1985; Barrington and Madramootoo, 1989). Soil No.1 (having 33% clay content)
may also have undergone physical swelling and chemical alteration to decrease it's
measured apparent hydraulic conductivity with time (Barrington and Madramootoo,
1989). The reduction in measured apparent hydraulic conductivity with time from time
periods T1 to T2 ranged from 13% for Soil No. 5 to 64% for Soil No. 1 (Figure 5.3)
I ~
Averag3 Apparert H,Ualjic Con:ll.£ti\1ty vs lirre Sirce Marue Application Day38(Dec.13,1994)to Day157(Miy9,1995) ,_ ............................................................................. ·················-·································································-··········-·]
• * • •
~~ 1.0E..()7r-_j~~rl~~~~~t~;::j~~¥=~~==-f:S<:·ojl:~j( .. ~ .. ~,--l ~ SQ. No.4
Sell No.2
i Soil l'+l. 7
;t Soii N;;, 3
Soil'*'· 6
Soil No). 1
•
1.0E.()8 +---------'1----------~--------l--------l-------! 20 70 120 170 220
lime Since Maru&Applicalion {days)
• Slif\b.1
!I!Siil'b.2
:· Slil'b.3
.:•:Siillb.4
:aSiil<b.5
• Slillb.6
+ Slil<b. 7
Figure 5.3- Apparent Hydraulic Conductivity Change With Time (each point is the average of three columns and lines are "best fit" using exponential fitting)
50
5.4.2 Soil Manure Interface
A black amorphous layer 3 mm to 7 mm in thickness was observed through the acrylic
column at the surface of each soil. This observation of a visually dark layer was also
reported by Rowsell et al. (1985). When the columns were disassembled this black layer
could be separated from the underlying soil but had a fragile rather than ')elly-like" nature,
as it broke and cracked upon separation. Upon drying this black layer tended to be
absorbed into the fibrous manure mat or into the soil. A cloth covered manometer tube
inserted through the ponded manure to within 25 mm of the black layer indicated that
settled manure solids had no affect upon hydraulic conductivity reduction. All the
columns exhibited a drastic reduction in head at the surface manometer relative to that
when just water was used for measurement It is assumed that the black layer was the
'seal' or clogged layer resulting in the large reduction in flow rates. As it was not possible
to measure the overall thickness of the "seal", 5 mm was used to represent this thickness
for all columns because this was the thickness visible on the edge of the column. The
average hydraulic conductivity of this clogged layer (K1) for Soils No.2 through 7, as
calculated from manometer level readings, was 4.3 x 10⁻⁹ cm/s (s.d.= 1.0 x 10⁻⁹ crn/s)
during T1 and decreased to an average of 2.4 x to-9 cm/s (s.d.= 0.5 x 10⁻⁹ crn/s) during
T2. The average hydraulic conductivity of the clogged layer (Kl) for Soil No. 1, as
calculated from manometer level readings, was 2.8 x 10⁻⁸ cm/s during Tl and decreased to
an average of 1.3 x 10⁻⁸ crn/s during T2. These low conductivity readings appears to be
the result of particulate matter clogging the surface pores causing "a reduction in the size
or volume of pore spaces" (Davis et al. 1973). The higher apparent hydraulic
51
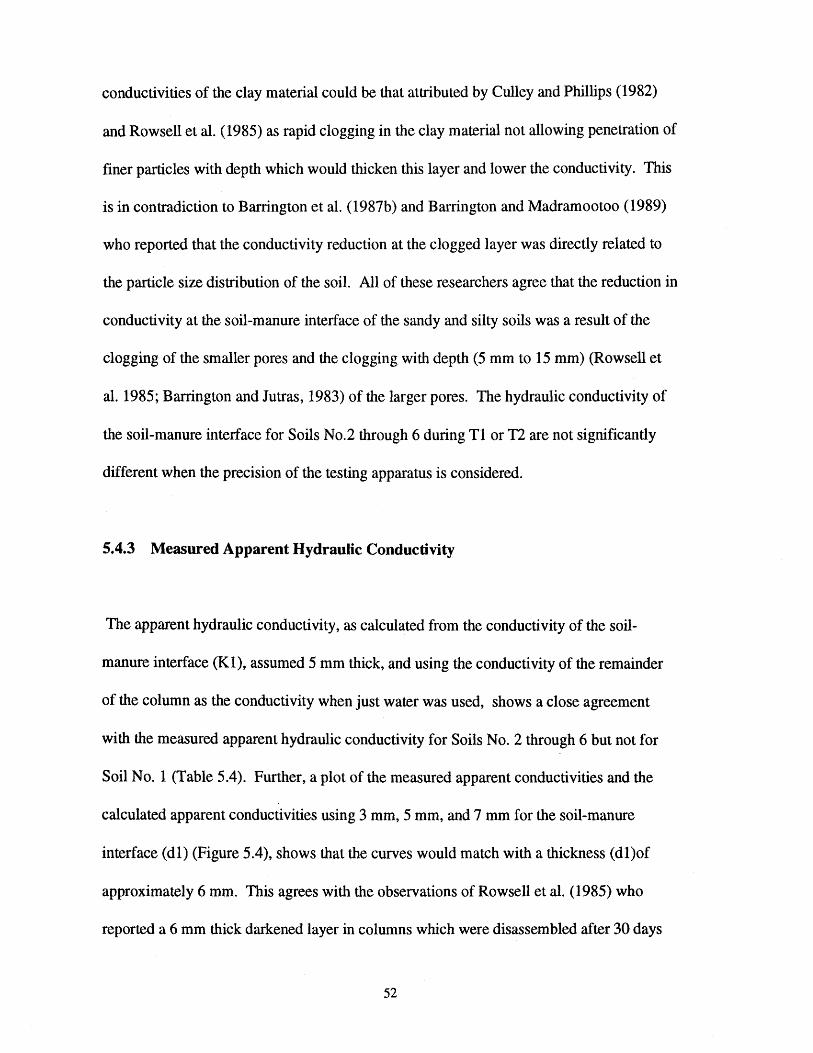
conductivities of the clay material could be that attributed by Culley and Phillips (1982)
and Rowsell et al. (1985) as rapid clogging in the clay material not allowing penetration of
finer particles with depth which would thicken this layer and lower the conductivity. This
is in contradiction to Barrington et al. (1987b) and Barrington and Madramootoo (1989)
who reported that the conductivity reduction at the clogged layer was directly related to
the particle size distribution of the soil. All of these researchers agree that the reduction in
conductivity at the soil-manure interface of the sandy and silty soils was a result of the
clogging of the smaller pores and the clogging with depth (5 mm to 15 mm) (Rowsell et
al. 1985; Barrington and Jutras, 1983) of the larger pores. The hydraulic conductivity of
the soil-manure interface for Soils No.2 through 6 during Tl or T2 are not significantly
different when the precision of the testing apparatus is considered.
5.4.3 Measured Apparent Hydraulic Conductivity
The apparent hydraulic conductivity, as calculated from the conductivity of the soil
manure interface (Kl), assumed 5 mm thick, and using the conductivity of the remainder
of the column as the conductivity when just water was used, shows a close agreement
with the measured apparent hydraulic conductivity for Soils No.2 through 6 but not for
Soil No. 1 (Table 5.4). Further, a plot of the measured apparent conductivities and the
calculated apparent conductivities using 3 mm, 5 mm, and 7 mm for the soil-manure
interface (dl) (Figure 5.4), shows that the curves would match with a thickness (dl)of
approximately 6 mm. This agrees with the observations of Rowsell et al. (1985) who
reported a 6 mm thick darkened layer in columns which were disassembled after 30 days
52
of manure ponding. These observations seem to indicate that the hydraulic conductivity of
the soil- manure interface is the dominant factor controlling the apparent hydraulic
conductivity of Soils No.2 through 6. The clay soil (Soil No.1) did not show agreement
between the measured and calculated values of apparent hydraulic conductivity (Table 5.4
and Figure 5.4). The measured apparent hydraulic conductivity of the column was almost
a full order of magnitude lower than the calculated. Since the soil-manure conductivity
was reported to be lower for the clay than the other soils, it would appear that there are
other factors affecting the sealing or clogging of the clay soils with depth. This
observation agrees with those of Barrington and Madramootoo (1989) who concluded
that this additional sealing a result of the smaller pores and the higher adsorption ability of
the clay allowing it to trap the small particulate matter which bypasses the clogged
interface layer and thus reducing the conductivity of the soil with depth.
53
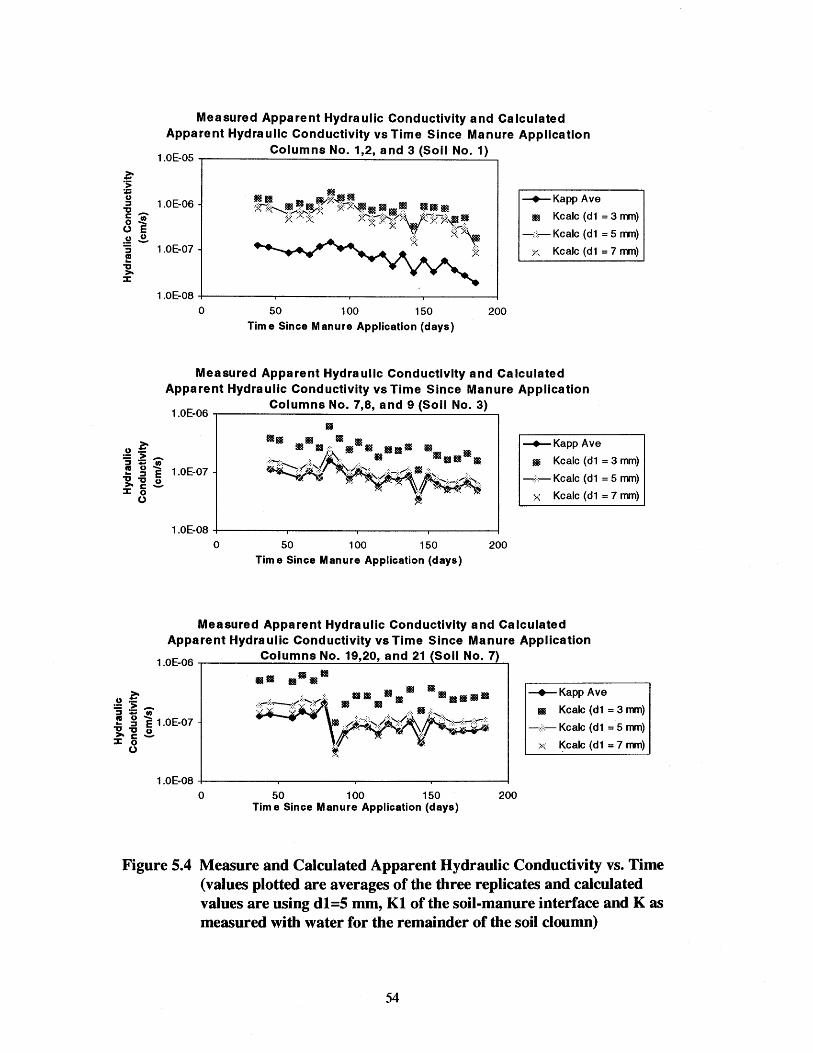
Measured Apparent Hydraulic Conductivity and Calculated Apparent Hydraulic Conductivity vs Time Since Manure Application
1.oE-o5 ,------C_o_l u_m_n_s_N_o_._1....:.,_2.:...., _a_n_d_3_(..:....S_o_i_l _N_o_. _1..:....) __,
.a:~ u :J 1.0E-06 "g- ~t-4:~-tf~~it~~~?.v"~-~1~~ --+- Kapp Ave
o .!e o E .2 ~ :i 1.0E-07 f! -g. :::a::
_:;:::
1.0E-08 +-----,...----~------....-----1
0 50 100 150 200
Time Since Manure Application (days)
111111 Kcalc (d1 = 3 rrm)
--:::,,_. Kcalc (d1 = 5 mm)
;< Kcalc (d1 = 7 mm)
Measured Apparent Hydraulic Conductivity and Calculated Apparent Hydraulic Conductivity vs Time Since Manure Application
1.oE-o6 .,.----c_o_l u_m_n_s_N_o_._7_,_a_, _a_n_d_9__;_(S_o_i_l _N_o_. _3..;...)__,
()~ ·- > j:g~ ... :J E 1 .OE-07 -g.-g~ :::a:: 0
0
1.0E-08 +------r-----,-----,...-----t 0 50 100 150 200
Time Since Manure Application (days)
--+-Kapp Ave
Ill! Kcalc (d1 = 3 mrn)
~:::-:--- Kcalc (d1 = 5 mrn)
::.;; Kcalc (d1 = 7 mrn)
Measured Apparent Hydraulic Conductivity and Calculated Apparent Hydraulic Conductivity vs Time Since Manure Application
1.oE-o6 .,.-----C_o_l u_m_n_s_N_o_._1_9...:..,2_0....:,_a_n_d_2_1...,1(_S_o_ii_N_o_._7 ..... r)c.....,
()~ 3~7> f! g E 1 .OE-07
"'D "'D () >-c
:::t: 0 0
1.0E-08 +------.------....------....-------1 0 50 100 150 200
Time Since Manure Application (days)
--+- Kapp Ave
111111 Kcalc (d1 = 3 mm)
--:'::.- Kcalc (d1 = 5 mm)
:<:;: ~calc (d1 = 7 mm)
Figure 5.4 Measure and Calculated Apparent Hydraulic Conductivity vs. Time (values plotted are averages of the three replicates and calculated values are using dl=5 mm, Kl of the soil-manure interface and K as measured with water for the remainder of the soil cloumn)
54
5.4.4 Effect of Clogging With Depth
All soils demonstrated a reduction in hydraulic conductivity with depth (Table 5.4 and
Figure 5.5) Figure 5.5 shows plots of the change in hydraulic conductivity with time and
depth for Soils No. 1, 3, and 7. Data trends as a result of exponential regression are also
indicated. Soils 1, 3, and 7 were chosen as they are representative of the clay, loam, and
sandy soils respectively. Soil No.6 was an exception as it demonstrated data trends
similar to Soil No. 1. All data points are an average of the data obtained from the three
replicates.
Hydraulic conductivities of the top 25 mm of soil (K2) during period Tl ranged from
6.8xlo-s crnls (Soil No. 3) to 1.3 xl0-6 cm/s (Soil No.5) (Table 5.4). From period Tl to
period T2 the hydraulic conductivities of K2 remained relatively constant for Soils 3, 5,
and 7, decreased for Soils No. 1, 2, and 6 and increased for Soil No.4 (Table 5.4)
Hydraulic conductivities of the top 25 mm to 100 mm of the soil (K3) during period Tl
ranged from 2.5x10⁻⁷ crnls (Soil No.5) to 7.0 xl0-6 cm/s (Soil No.7) (Table 5.4). From
period Tl to period T2 the hydraulic conductivities of K3 remained relatively constant for
Soils No.2, 3, 4, and 7, decreased slightly for Soils No. land 6 and increased for Soil
No.5 (Table 5.4).
55
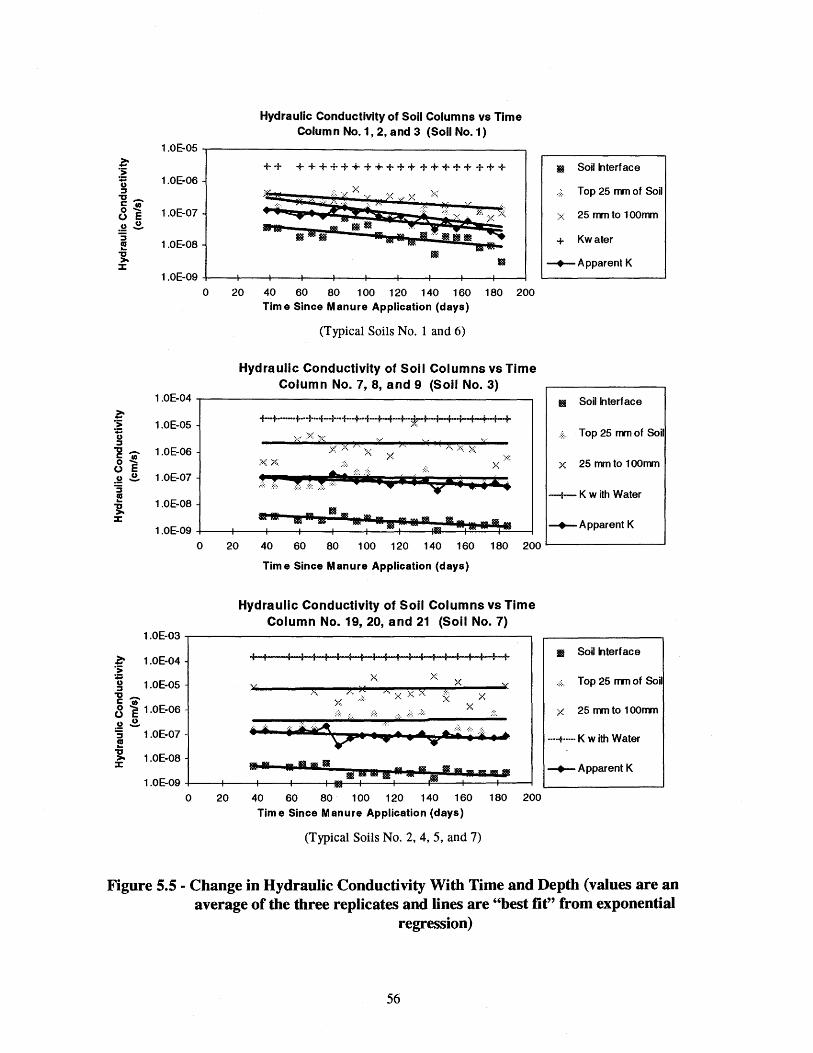
Hydraulic Conductivity of Soil Columns vs Time Column No.1, 2, and 3 (Soil No.1)
1.0E-05 ,..----------------------. .?: :~ () 1.0E-06 :J -o_
S i 1.0E-07 .2 ~ 3 !! 1.0E-08 -g. X
++ +++++++++++++++++++
1.0E-09 +---t---+---+---+--1---+--+---+---+---l
1.0E-04
.?: :~ 1.0E-05 u :J -o_ 1.0E-06 g Je (.) E .2 ~ 1.0E-07 3 ! 1.0E-08 -g.
X
1.0E-09
0 20 40 60 80 100 120 140 160 180 200 Time Since Manure Application (days)
(Typical Soils No. 1 and 6)
Hydraulic Conductivity of Soil Columns vs Time Column No. 7, 8, and 9 (Soli No. 3)
.. ·•· .... :~::: ::~{
::{ .;:{ -;·: .. :
' 0 --,.. .·. 0 ... t .:::, •• • •.•. .. i ·. <;> •••
•• ••••••
1S8 Soil nterface
·=·=· Top 25 mm of Soil
:>:: 25 mn to 1 oomn
+ Kwater
--.-Apparent K
1188 Soillnterface
.:::. Top 25 mn of Soil
x 25 mm to 100mn
--f- K with Water
-+-Apparent K
0 20 40 60 80 100 120 140 160 180 200 L-----------'
Tim e Since Manure Application (days)
Hydraulic Conductivity of Soil Columns vs Time Column No. 19, 20, and 21 (Soil No. 7)
1.0E-03 .------------------------,
.?: 1.0E-04 :~ g 1.0E-05
~0 8 E 1.0E-06 u~ 3 1.0E-07 !! "g. 1.0E-08 ::z::
I !
• • ••
I I ! I I I I I I : I
:x: ><~
. ··• •. , ....... . ... ::< ::< .:·:. • • .Jf· .·:·:· /•.
.·:·. }; ,.;:;. .. ·~ ..
.• • i v-- .; ••• .,.,; ·; ..... •••• •••••••••••••• 1.0E-09 +---+----+--+---+-----+--+---~:....._-+--+------l
0 20 40 60 80 100 120 140 160 180 200
Time Since Manure Application (days)
(Typical Soils No. 2, 4, 5, and 7)
11 Soil nterface
.:::.. Top 25 mm of Soil
x 25 mmto 100mm
···+···· K with Water
-+-Apparent K
Figure 5.5 - Change in Hydraulic Conductivity With Time and Depth (values are an average of the three replicates and lines are "best fit" from exponential
regression)
56
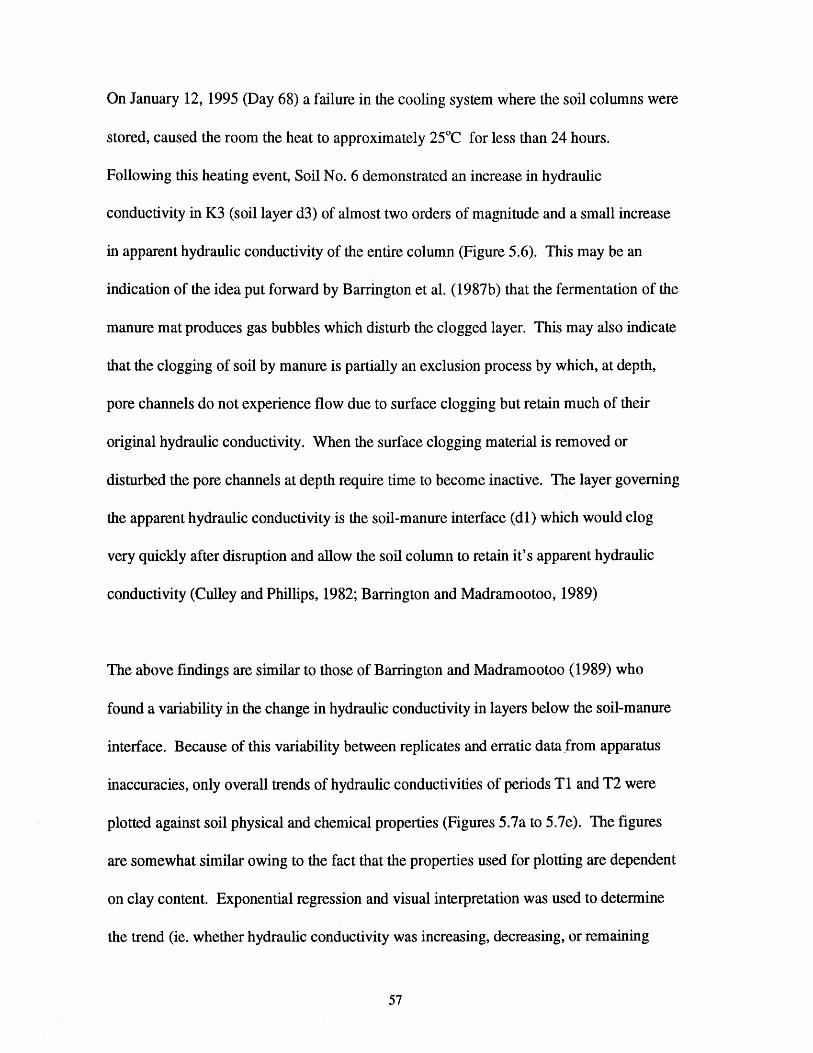
On January 12, 1995 (Day 68) a failure in the cooling system where the soil columns were
stored, caused the room the heat to approximately 25°C for less than 24 hours.
Following this heating event, Soil No. 6 demonstrated an increase in hydraulic
conductivity in K3 (soil layer d3) of almost two orders of magnitude and a small increase
in apparent hydraulic conductivity of the entire column (Figure 5.6). This may be an
indication of the idea put forward by Barrington et al. (1987b) that the fermentation of the
manure mat produces gas bubbles which disturb the clogged layer. This may also indicate
that the clogging of soil by manure is partially an exclusion process by which, at depth,
pore channels do not experience flow due to surface clogging but retain much of their
original hydraulic conductivity. When the surface clogging material is removed or
disturbed the pore channels at depth require time to become inactive. The layer governing
the apparent hydraulic conductivity is the soil-manure interface (dl) which would clog
very quickly after disruption and allow the soil column to retain it's apparent hydraulic
conductivity (Culley and Phillips, 1982; Barrington and Madramootoo, 1989)
The above findings are similar to those of Barrington and Madramootoo (1989) who
found a variability in the change in hydraulic conductivity in layers below the soil-manure
interface. Because of this variability between replicates and erratic data from apparatus
inaccuracies, only overall trends of hydraulic conductivities of periods T1 and T2 were
plotted against soil physical and chemical properties (Figures 5. 7 a to 5. 7 e). The figures
are somewhat similar owing to the fact that the properties used for plotting are dependent
on clay content. Exponential regression and visual interpretation was used to determine
the trend (ie. whether hydraulic conductivity was increasing, decreasing, or remaining
57
Hydraulic Conductivity vs. Time Between 25 mm and 100 mm Below the Soil Surface and at the Soil-Manure Interface
1.0E-04 ,..--.......,--......,...--"'t'"""-f_o"'f'"r S_o_l_l N_o"""t.6--.......... ---'Y"'"'"'"'"-.....,
• Colunn f\b. 16
Bl Colunn f\b. 17
:·. Colunn f\b. 18
···~·:~···Ave. (K3)
-Original K with Water
-+-Ave. Apparent K
+ Colunn f\b. 16
D Colunn f\b. 17
o Colunn f\b. 18
-Ave. nterface (K1)
12-Dec- 1-Jan-95 21-Jan-95 10-Feb-95 2-IVar-95 22-Mar-9511-Apr-95 1-IVay-95 21-May-94 95
Figure 5.6 Hydraulic Conductivity vs. Time for Soil No. 6 (showing effect of a minor heating event)
essentially constant) for each column and each layer. These overall trend lines suggest the
effect of clogging with time and depth for the individual layers. The data plotted in
Figures 5.7a to 5.7e demonstrates similar trends between Kl and K2 and similar trends
between hydraulic conductivity with water and K3. This may be an indication of similar
physical and chemical properties in the soil's layers demonstrating similar characteristics
which would indicate that the clogging effect of the soil was limited to the manure soil
interface (Kl) and the top 25 mm of soil (K2). Further, if the reduction in K2 was caused
by the soil-manure interface layer developing .to a depth below the top manometer, then
some of the soil in the top 25 mm (d2) may have remained relatively unaffected by manure
ponding.
58
All figures (5.7a to 5.7e) show that there does not appear to be any significant difference
in Kapp at Tl or T2 for the range of soils tested. Kl was not significantly different for
soils with less than 25% clay content, 65% fines, a PI of 15, a effective pore diameter of
0.2 mm, and a CEC of21. This includes Soils No.2 through 7. Soil No.1 demonstrated a
slightly higher Kl for all properties. Percentage of fines appeared to give the best
agreement with variation in hydraulic conductivity with water. All figures demonstrate a
variability hydraulic conductivity and soil properties for K2 and K3 at Tl and T2. This is
similar to the findings of Barrington and Madramootoo ( 1989) who reported some
variability in hydraulic conductivity with depth.
The reason for conductivity reduction in deeper layers of the soil was not determined.
Water in the deeper manometers became discolored within 2 months and gas production
during monitoring occasionally produced bubbles in the effluent tube, but did not block
flow. Air bubbles were not observed in the manometers. Soil materials near the surface,
at places of tensiometer insertion and the sand base became noticeably discolored
("blackened") within 2 months from the start. Manure particles were observed in some of
the surface manometer tubes. The possibility of organic matter penetration to depth,
bacterial growth and reduction/oxidation reactions within the soil column could be some
reasons for this reduction. Desaturation at the start and gas production during ponding of
manure may have reduced hydraulic conductivity in the columns due to air entrapment.
59
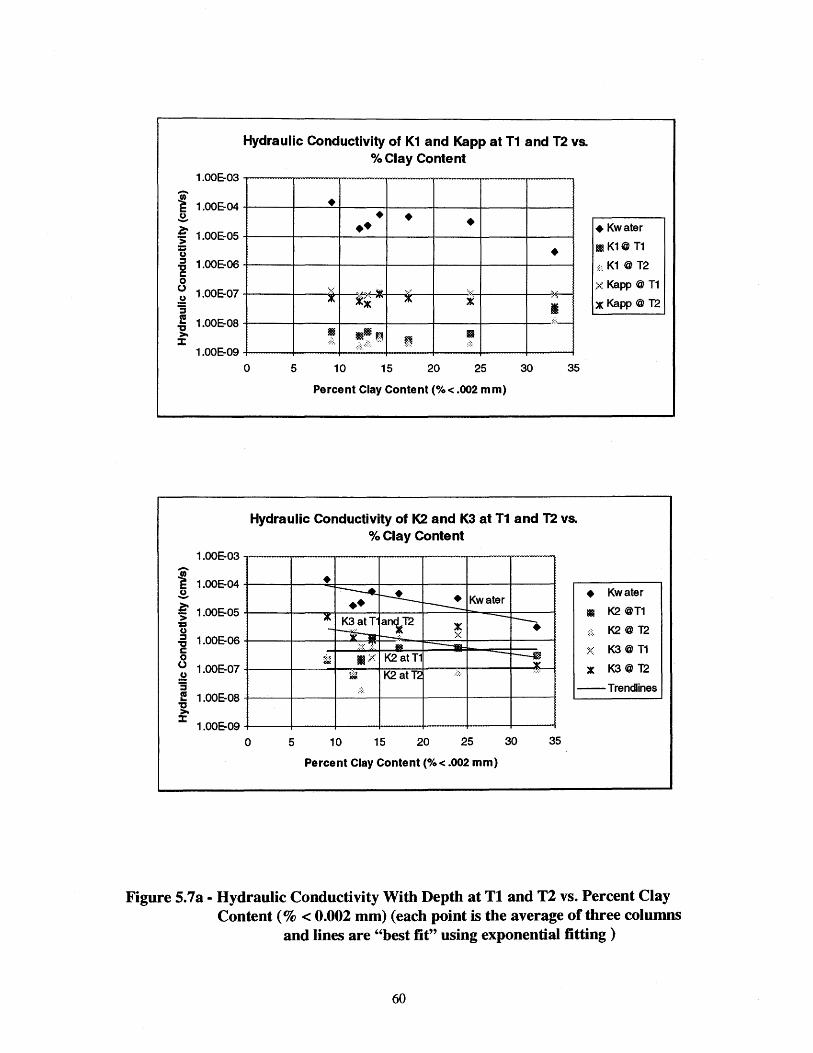
Hydraulic Conductivity of K1 and Kapp at T1 and T2 vs. o/o Clay Content
1.00E-03
I 1.00&04 -2. ~ > 1.00&05 = () ;::, 1.00&06 'C c 0 0 1.00&07 ()
~ 1! 1.00&08 "g.
:::1: 1.00&09
0 5
• • • •• •
Percent Clay Content (o/o< .002 mm)
•
30 35
Hydraulic Conductivity of K2 and K3 at T1 and T2 vs. o/o Clay Content
1.00&03 ,.-.-___,--.....,.....--"1"""""'-........,..--""T""'"-........,r-""""'---""'S 'i' ! 1.00&04 +---+---::•d:r------..:----+~-·--+-----11----+------i ~ •• 1 -~ Kwater > 1.0QE-05 +----t-~Ip-j---f----+-__:::::p:-...._...,=---11------1
~ --=-~=:_~12 ~ ----. ~ 1.00&06 +---+---+-_..._;>--1~ .. IR-;.; +-=~ •.. -4=::::::---....:--..:...::....j----f-----!
o ~ 111 ;:< K2 at T1 - ---m ~ 1.00&07 -t------J--~-1--:~~,., -+-:-K2~a"":"';t r=l ;,::~-~.;:;.-+---+--oil!~:· -!
• Kwater
1111 K1@ T1
::::, K1@ T2
;:<. Kapp@ T1
)C Kapp@ T2
• Kwater
1111 K2 @T1
;:::. K2@ 12
X K3@T1
X K3@12
"5 l! 1.00E-08 +----t--~-··:_·: ---1---+----t--~----!
--Trendlines
"g. :::1: 1.00&09 +---+---+---1---+---+----+---f
0 5 10 15 20 25 30 35
Percent Clay Content (o/o< .002 mm)
Figure 5.7a- Hydraulic Conductivity With Depth at Tl and T2 vs. Percent Clay Content (% < 0.002 mm) (each point is the average of three columns
and lines are "best fit" using exponential fitting )
60
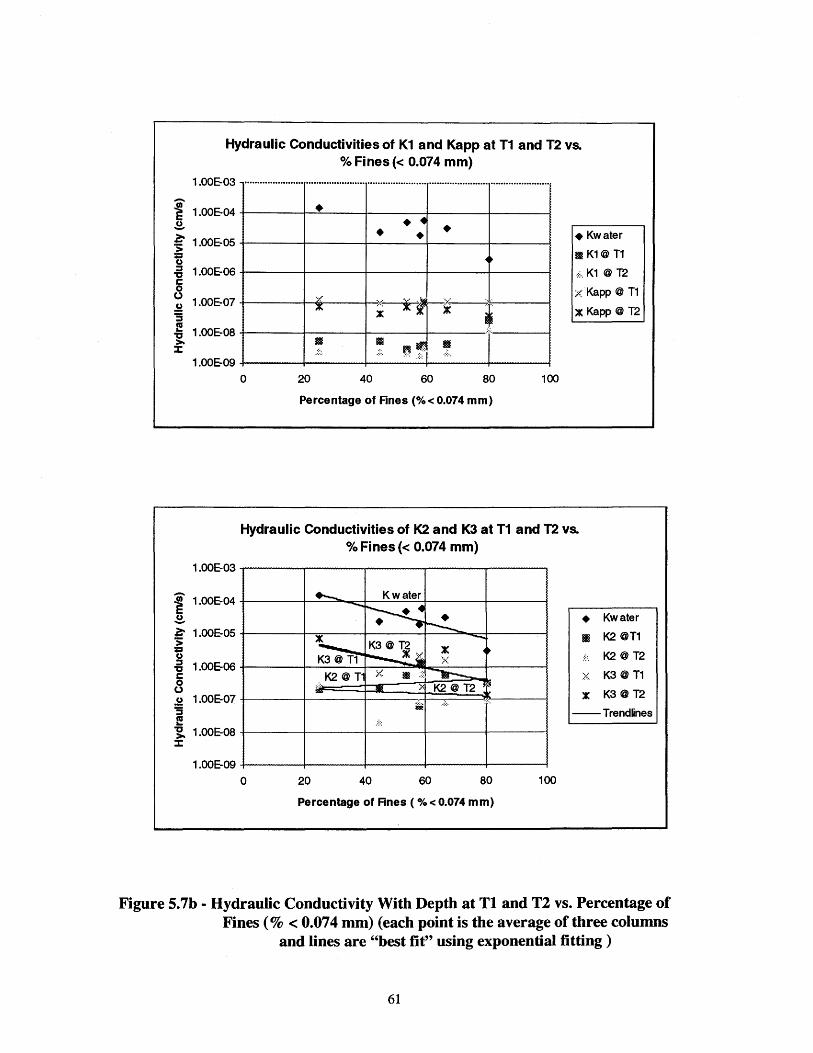
Hydraulic Conductivities of K1 and Kapp at T1 and T2 vs. o/o Fines{< 0.074 mm)
1.006-03
I 1.006-04 +-----+~·----~----+---__.---~ ~ ... ~ 1.006-05 +-----+----+--·---·+------4---~ :g -5 1.006-06 +-----+-----1----+------f------i c 0 0_() 1.006-07 +-----+---~iii.-'-:--~---~-~---:>..--·· -----,;1~,_. -----{ ~ ~ X ~~ X •
t ::::: :~~~~~~:~~~~~~~~:~~~. ~~~~ .. ~ -.:/:: ~~~~-~~~-+r ___ -i 0 20 40 60 80 100
Percentage of Anes (%<0.074 mm)
• Kwater
II! K1@ T1
.::: .. K1 @ T2
;.{ Kapp@ T1
X Kapp@ T2
Hydraulic Conductivities of K2 and K3 at T1 and T2 vs. o/o Fines{< 0.074 mm)
1.006-03 ,..-----,.----y----,-------r-----s
- ..__ Kwater ~ 1.006-04 +------f--=--=...._........,=--l--r---____.:....::...:..:...::: •• =4~ .---+---~ ~ .,. ~~ ~ 1.006-05 +-----t--.:u---1-----1--~-....=+--------i ~ ~K3@T2 ::e:; .... ~ ~ 1.00E-06 -+-----+-K_3_@_T_1--I-~----=~!l!!l_i11111'·<~~o.:=-->< __ +---~ c 1<2 ® r~ ::--:. • .::: -.-__ 8 l_ ___ _J_~~···~~3=~~~~~K2~@~T:~2::~ ____ __J ~ 1.006-07 it .:::. ::: ..
1! ~ 1.006-08 -1-------+-------+-------1--------f--------1
:I:
1.006-09 +-----+----1----1-----4--------4
0 20 40 60 80 100
Percentage of Anes ( o/o < 0.074 mm)
• Kwater
Ill K2 @T1
.:::. K2@ T2
.(•. K3@ T1
X K3@ T2
--Trendlines
Figure 5. 7b - Hydraulic Conductivity With Depth at Tl and T2 vs. Percentage of Fines(%< 0.074 mm) (each point is the average of three columns
and lines are "best fit" using exponential fitting)
61
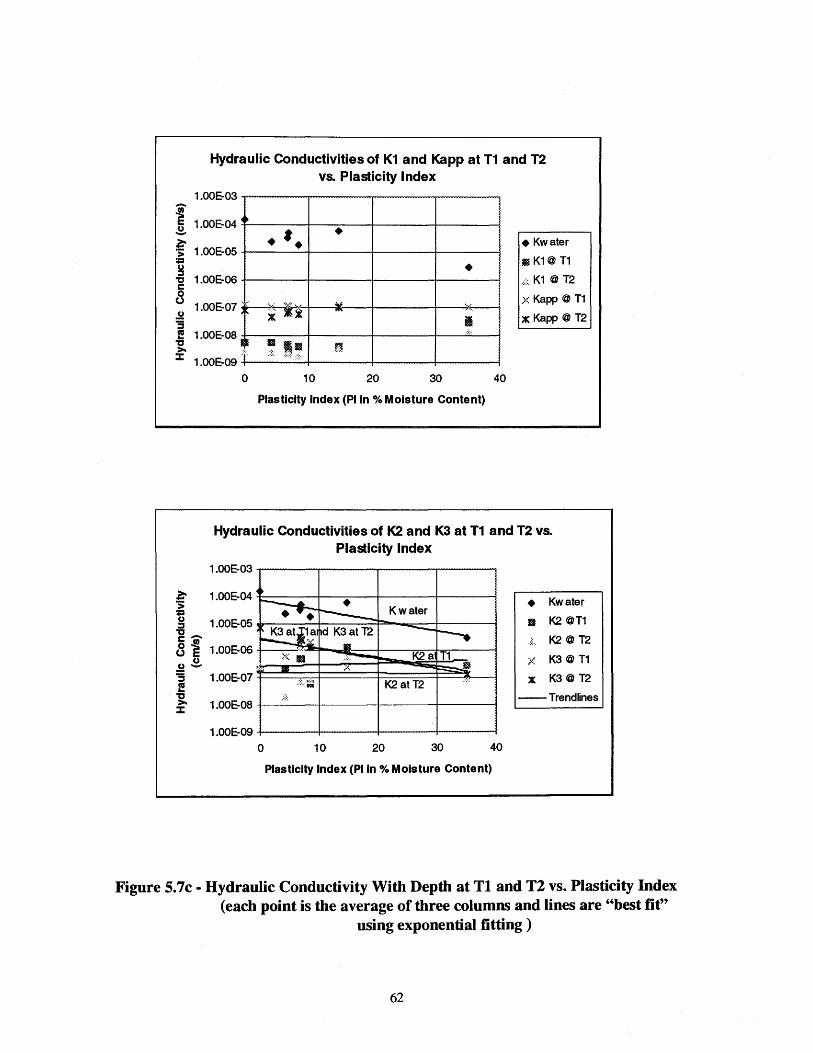
I .2. ~ > = () ::J "0 c 0 0
.!:! '5 I! "0 >-:I:
Hydraulic Conductivities of K1 and Kapp at T1 and T2 vs. Plasticity Index
1.006-03
1.00&04 ~~
'· • • 1.00&05
• 1.006-06
1.00&07 :: ~~·- ~
r- x i ....
1.006-08 •• Ill ~~ ~
1.00&09 ·t· .:::;
0 10 20 30 40
Plasticity Index (PI in %Moisture Content)
• Kwater
111 K1@ T1
-::::. K1 @ T2
;:< Kapp@ T1
~ Kapp@ T2
Hydraulic Conductivities of K2 and K3 at T1 and T2 vs. Plasticity Index
1.006-07 .:::.~ K2 at T2 .::::
1.00&08 +------+----+----~--~
1.00&09 +----+----+----+----~
0 10 20 30 40
Plasticity Index (PI In% Moisture Content)
• Kwater
111 K2 @T1
.:::.. K2@ T2
X K3@ T1
X K3@T2
--Trend lines
Figure 5. 7c - Hydraulic Conductivity With Depth at Tl and T2 vs. Plasticity Index (each point is the average of three columns and lines are "best fit"
using exponential fitting )
62
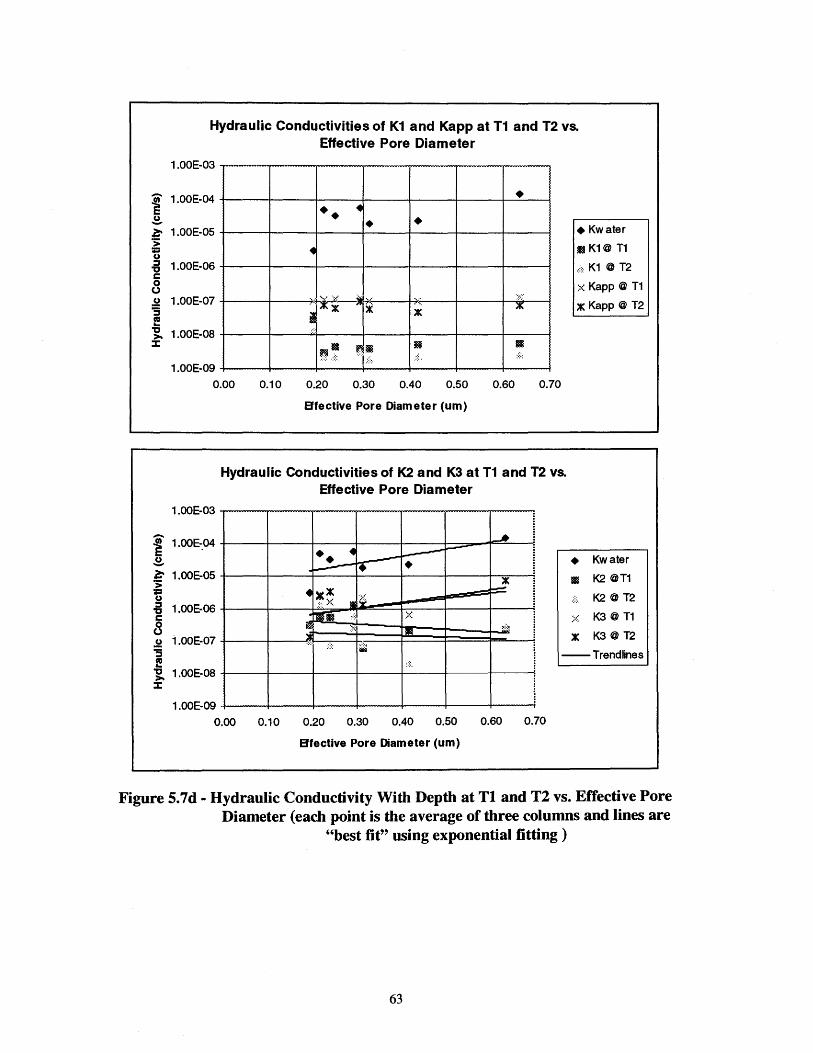
Hydraulic Conductivities of K1 and Kapp at T1 and T2 vs. Effective Pore Diameter
i 1.00E-04 -r---t------;---+---+---+----+--=·~-1 t: ••• ~ . ~ 1.00E-05 -r---t------;---+•---+---+---+--~ > = u ::s , c 0 0
1.00E-06 +---t------ir-----+---+----+----1-----l
~-~ 1.00E-09 +---t------1---+---+---1----l-----1
0.00 0.10 0.20 0.30 0.40 0.50 0.60 0.70
Bfective Pore Diameter (um)
• Kwater
llll K1@ T1
-::::: K1@ T2
::-:: Kapp@ T1
X Kapp@ T2
Hydraulic Conductivities of K2 and K3 at T1 and T2 vs.
I .2. ~ > = u ::s , c 0 0 .2 :; f! , >-
:E:
1.00E-03
1.00E-04
1.00E-05
1.00E-06
1.00E-07
1.00E-08
Effective Pore Diameter
• • ·~l-----1---"" ~· .
;.::
~-Ill -
1.00E-09 +----4---+----+----1------1----+-----t
0.00 0.10 0.20 0.30 0.40 0.50 0.60 0.70
Bfective Pore Diameter (um)
• Kwater
Ill K2 @T1
.:::. K2@ T2
:.-< K3@ T1
X K3@T2
--Trendlines
Figure 5.7d- Hydraulic Conductivity With Depth at Tl and T2 vs. Effective Pore Diameter (each point is the average of three columns and lines are
"best fit" using exponential fitting)
63
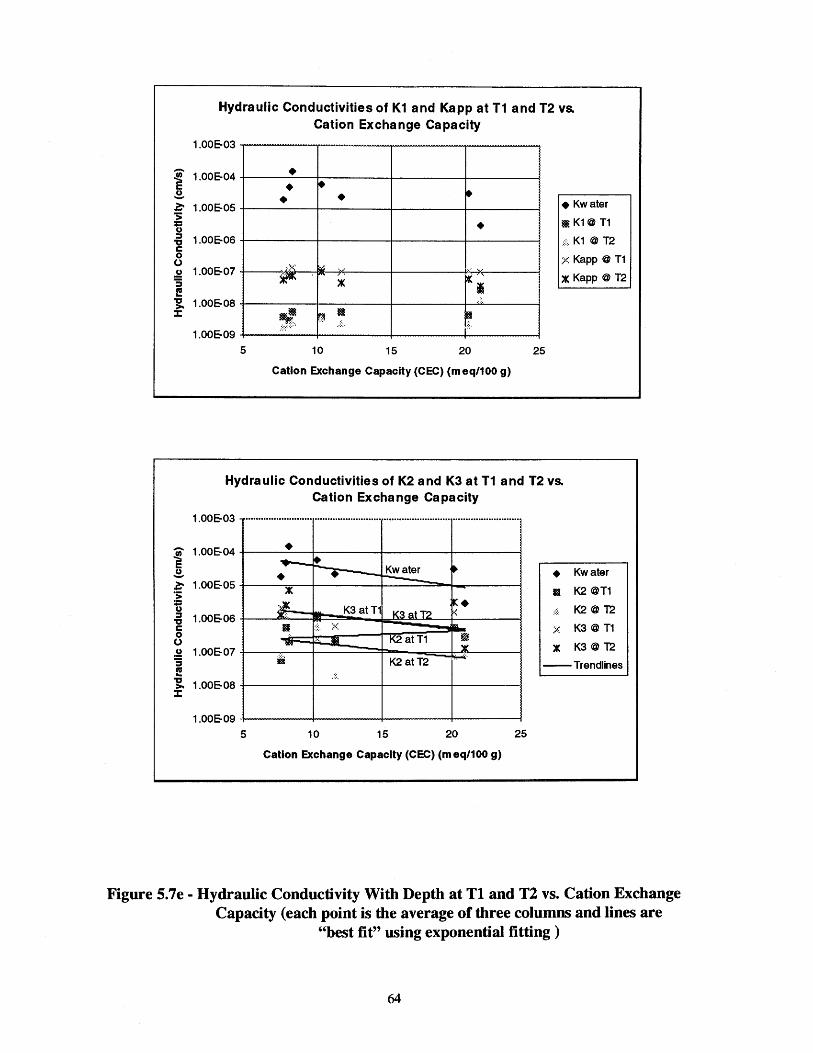
~ .2. ~ ·s: = () :::J , c 0 0 .2 '5 1! , >-::r:
~ .2. ~ > =fi :::J , c 0 0 .2 '5 ftl .. , >-::r:
Hydraulic Conductivities of K1 and Kapp at T1 and T2 vs.
1.00&03
1.00&04
1.00&05
1.00&06
1.00&07
1.00&08
1.00&09
5
• • •
Cation Exchange Capacity
• • •
10 15 20
Cation Exchange Capacity (CEC) (meq/100 g)
25
• Kwater
a K1@ T1
,:::. K1 @ T2
;< Kapp@ T1
:1K Kapp@ T2
Hydraulic Conductivities of K2 and K3 at T1 and T2 vs. Cation Exchange Capacity
1.00&03
1.00&04 • ...,...__ h---• ~ • • Kwater 1.00&05
"' K2 @T1 • ;~ K3 at T1 ~· K2@T2
1.00&06 X:::=: K~ atT? v.: :::::
II ·.·.· >< ;.~ K3@ T1 K2 at T1 m IIi! ...
X J: K3@ T2 1.00&07 iii& .~=
K2 atT2 --Trendlines .·.·.
1.00&08
1.00&09
5 10 15 20 25
Cation Exchange Capacity (CEC) (m eq/100 g)
Figure 5.7e- Hydraulic Conductivity With Depth at Tl and T2 vs. Cation Exchange Capacity (each point is the average of three columns and lines are
"best fit" using exponential fitting)
64
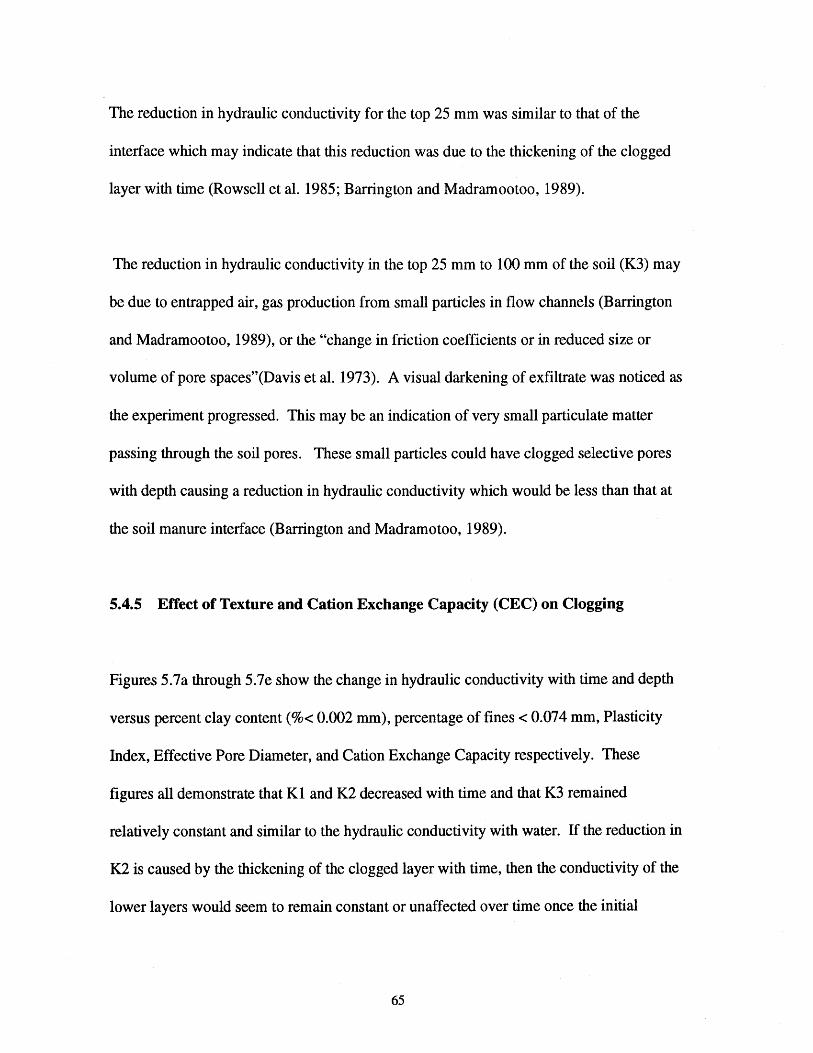
The reduction in hydraulic conductivity for the top 25 mm was similar to that of the
interface which may indicate that this reduction was due to the thickening of the clogged
layer with time (Rowsell et al. 1985; Barrington and Madramootoo, 1989).
The reduction in hydraulic conductivity in the top 25 mm to 100 mm of the soil (K3) may
be due to entrapped air, gas production from small particles in flow channels (Barrington
and Madramootoo, 1989), or the "change in friction coefficients or in reduced size or
volume of pore spaces"(Davis et al. 1973). A visual darkening of exfiltrate was noticed as
the experiment progressed. This may be an indication of very small particulate matter
passing through the soil pores. These small particles could have clogged selective pores
with depth causing a reduction in hydraulic conductivity which would be less than that at
the soil manure interface (Barrington and Madramotoo, 1989).
5.4.5 Effect of Texture and Cation Exchange Capacity (CEC) on Clogging
Figures 5.7a through 5.7e show the change in hydraulic conductivity with time and depth
versus percent clay content(%< 0.002 mm), percentage of fines< 0.074 mm, Plasticity
Index, Effective Pore Diameter, and Cation Exchange Capacity respectively. These
figures all demonstrate that K1 and K2 decreased with time and that K3 remained
relatively constant and similar to the hydraulic conductivity with water. If the reduction in
K2 is caused by the thickening of the clogged layer with time, then the conductivity of the
lower layers would seem to remain constant or unaffected over time once the initial
65
clogged layer forms. This observation is similar to that of Barrington and Madramootoo
(1989).
Figures 5. 7 a to 5. 7b also show that there does not appear to be any effect of textural
properties on the soil,s ability to clog by manure. There is an indication that soils with
clay contents higher than 30 percent are less affected by the manure clogging. This may
indicate that the final hydraulic conductivity may become more dependent on clay content
than on the manure clogging as the clay content of the soil increases above 25% (Figure
5.7a). This agrees with the findings of Barrington et al. (1985 and 1987). Common sense
would also indicate that very granular soils would also be less susceptible to clogging with
manure. Still, these findings should cover a wide range of soils typically used for
construction of earthen manure storages on the Canadian Prairies.
5.5 Sources of Error
The experimental apparatus and procedures could have introduced several sources or
error. Some of these sources are:
• the apparatus did not lend itself to accurate measurements (a differel}.ce of
approximately 15 mm in the water levels in the manometers would give a difference in
results of one order of magnitude), • difference in atmospheric pressure caused by cooling and ventilating equipment may
have caused erroneous level readings,
• evaporation losses were assumed to be negligible from measurements performed on
independent sample bottles,
• reading of water levels was accomplished with a steel tape graduated to 1 mm,
• gas production from fermentation could have caused erroneous readings, and • the manometers could have experienced some clogging effecting level readings.
66
6.0 CONCLUSIONS
The purpose of this study was to extend previous studies investigating the clogging of soil
by ponded hog manure and to clarify the meaning and the magnitude of the "manure seal".
Specific objectives are related to the effect of clogging upon soil hydraulic conductivity:
1) to measure the effect of clogging with time,
2) to measure the effect of clogging with depth, and
3) to determine the effect of soil texture upon clogging.
All soils experienced an exponential decrease in apparent hydraulic conductivity for the
duration of the study. Soils having a clay content less than 25% experienced a reduction
in hydraulic conductivity which started upon contact of the manure with the soil surface.
Within 5 days these soils' apparent hydraulic conductivity was reduced to below 10-6 crn/s
and to 10-7 crn/s within 25 days. This represented a reduction in apparent hydraulic
conductivity of 2 to 3 orders of magnitude. The reduction in apparent hydraulic
conductivity with the clay soil gradually decreased for the duration of the study.
The reduction in apparent hydraulic conductivity was a result of clogging of the soil pores
at the surface of the soil. This was evidenced by the differences in hydraulic conductivity
of the different layers within the soil columns. The soil-manure interface was the
governing layer which controlled infiltration into the soil and the apparent hydraulic
conductivity of the soil columns. This governing layer was 5 mm to 7 mm in thickness
67
and increased in thickness with time. The reduction in hydraulic conductivity with depth
was thought to be caused by clogging of very small pores by particulate matter flowing
through the soil and air entrapment in the larger pores caused by gas production from
fermentation.
The lower layers maintained their original flow characteristics, which are dependent on
texture, while the upper layers which clogged with manure showed no difference in flow
characteristics between soil textures. The clogging of the soil at the soil-manure interface
was more effective in the soils with less than 25% clay content. The soil with more than
25% clay content experienced reduction in hydraulic conductivity with depth which was
thought to be caused by retention of ions and organic matter causing hydration and
reduction in pore size.
This study demonstrates that the reduction in hydraulic conductivity of soils under ponded
manure is caused by clogging of soil pores at the soil-manure interface and that this
clogged layer which governs the infiltration of solution into the soil is concentrated in the
top 25 mm of soil and is further governed by the top 5 mm to 7 mm. Soils below this
layer are not significantly affected and retain their ability to conduct flow.
More study is required to determine the effect of the clogged soil-manure interface and the
soil physical and chemical properties in reducing the migration of solute down through the
soil profile. Once this is determined, the limits of soils suitable for the construction of
earthen manure storages can start to be qualified.
68
REFERENCES
Allison, L.E., 1947 "Effect of Microorganisms on Permeability of Soil Under Prolonged
Submergence." Soil Science, 63: P. 439- 450, 1947.
ASTM D-421-85 (R93). "Dry Preparation of Soil Samples for Particle-Size Analysis and
Determination of Soil Constants". Annual Book of ASTM Standards, 1995, Vol.
04.08, P:8-9.
ASTM D-420-63 (R90). "Particle-Size Analysis of Soils". Annual Book of ASTM
Standards, 1995, Vol. 04.08, P:10-16.
ASTM D-698-91. "Laboratory Compaction Characteristics of Soil Using Standard Effort
(600 kN-m/m3) ". Annual Book of ASTM Standards, 1995, Vol. 04.08, P:69-76.
ASTM D-2216-92. "Laboratory Determination of Water (Moisture) Content of Soil and
Rock". Annual Book of ASTM Standards, 1995, Vol.04.08, P:178-181.
ASTM D-2487-93. "Classification of Soils for Engineering Purposes (Unified Soil
Classification System)". Annual Book of ASTM Standards, 1995, Vol.04.08,
P:207-217.
ASTM D-4318-93. "Liquid Limit, Plastic Limit, and Plasticity Index of Soils". Annual
Book of ASTM Standards, 1995, Vo1.04.08, P:554-564.
Avnimelech, Y., and Z. Nevo, 1963. "Biological Clogging of Sands". ~oil Science 98: P.
222-226, 1964.
Barrington, S.F., P.J. Jutras, 1985. "Selecting Sites for Earthen Manure Storages."
Barrington, S.F., P.J. Jutras, and R.S. Broughton, 1987a. "The sealing of soils by manure.
Part I. Preliminary investigations" Can. Agric. Eng. 29(2):99-105
69
Barrington, S.F., P.J. Jutras, and R.S. Broughton,1987b. "The sealing of soils by manure.
Part ll Sealing Mechanisms." Can. Agric. Eng. 29(2):105-109
Barrington, S.F., and C.A. Madramootoo, 1989. "Investigating Seal Formation from
Manure Infiltration into Soils." Trans. Amer. Soc. Agric. Eng. 32(2):851-856
Barrington, S.F. and Broughton, R.S.,1988. "Designing Earthen Manure Storage Facilities
for Manure Storage." Can. Agric. Eng. 30: 289-292.
Brach, J.C., Ellingboe, R.L., and Nelson, D., 1992. "Manure Storage Criteria and Policy
Development in Minnesota." ASAE Paper No. 924503, 1992 ASAE International
Winter Meeting.
Chang, A.C., Olmstead, W.R., Johanson, J.B., and Yamashita, G., 1974. "The Sealing
Mechanism of Wastewater Pond". Journal Water Pollution Control Federation,
Vol. 46, No.7, July, 1974, P. 1715-1721.
Ciravolo, T.C., D.C. Martens, D.L. Hallock, E.R. Collins, Jr., E.T. Kornegay, and H.R.
Thomas, 1979. "Pollutant Movement to Shallow Ground Water Tables from
Anaerobic Swine Waste Lagoons." J.Environ.Qual.,Vol. 8,No.1:126-130
Culley, J.L.B. and P.A. Phillips, 1982. "Sealing of Soils by Liquid Cattle Manure" Can.
Agric. Eng. 24:87-89
Davis, S., W. Fairbank and H. Weisheit, 1973. "Dairy Waste Ponds Effectively Self
Sealing" Trans. Amer. Soc. Agric. Eng. 16:69-71
DeTar, W.R., 1979. "Infiltration of Liquid Dairy Manure into Soil." Trans. Amer. Soc.
Agric. Eng. 22:520-558
70
DeVries, J., 1972. "Soil Filtration of Wastewater Effluent and the Mechanism of pore
clogging." Journal Water Pollution Control Federation, Vol. 44, No.4, April,
1972: P. 365 - 573.
Freeze, R.A. and Cherry J.A., 1979. Groundwater. Prentice-Hall, Inc. N.J., USA
Gangbazo, G., D. Cluis and M. Vallidres, 1989. "Nitrogen Seepage From Earthen-Built
Manure Storage Tanks." ASAE/CSAE Paper No. 892002, 1989 ASAE/CSAE
International Summer Meeting.
Gillies, J.A., 1996. Personnel Communication. Department of Agricultural and
Bioresource Engineering, University of Saskatchewan.
Gupta, R.P., and D. Swartzendruber, 1962. "Flow-Associated Reduction in the Hydraulic
Conductivity of Quartz Soil". Soil Science Society of America Proceedings 26: P.
6-10.
Hart, S.A. and Turner, M.E., 1965. "Lagoons for Livestock Manure". Journal WPCF
November, 1965. Vol. 37, No.ll. P: 1578-1596
Hillel, D., 1980. Application of Soil Physics. Academic Press, London, New York.
Indorante, S.J, Follmer, L.R., Hammer, R.D., and Koenig, P.G., 1990. "Particle-Size
Analysis by a Modified Pipette Procedure". Soil Science Society of America
Journal. Vol.54, March-April, 1990. P:560-563
Iowa, 1988. "Waste Storage Pond. No. 425." U.S. Dept. of Agric., Soil Conservation
Service, Jan. 1988.
Iowa Department of Natural Resources, March 1992. " Environmental Regulations and
Guidelines for Animal Feeding Operations in Iowa."
71
Laak, R .. , 1970. "Influence of Domestic Wastewater Pre-Treatment on Soil Clogging."
Journal Water Pollution Control Federation. 42: P. 1495- 1500, August, 1970.
Lo, K.V., 1977. "A Study of the Infiltration Characteristics of Dairy Waste Storage
Lagoons." CSAE Paper No. 77-208, CSAE Annual Meeting August, 1977.
Manitoba Agriculture, 1994. "Farm Practices Guidelines for Hog Producers in Manitoba."
(DRAFf)
McCalla, T.M., 1950, "Studies on the Effect of Microorganisms on Rate of Percolation of
Water Through Soils." Soil Science Society of America Proceedings (1950)
15:P182-186. 1951.
McConkey, B.G., C.D. Reimer and W. Nicholaichuk, 1990. "Sealing Earthen Hydraulic
Structures with Enhanced Gleization and Sodium Carbonate I. Laboratory Study
of the Effect of a Freeze-Thaw Cycle and a Drying Interval." Can. Agric. Eng.
32:163-170
Miller, D.C., J.B. Robinson and D.W. Gallagher, 1976. "Accumulation of Nutrients in Soil
Beneath Hog Manure Lagoons." J. Environ. Qual. 5(3):279-282.
Miller, D.C., J.B. Robinson and R.W. Gillham, 1985. "Self-Sealing of Earthen Liquid
Manure Storage Ponds. I. A Case Study." J. Environ. Qual. 14(4):533-538.
Mitchell, R. and Z. Nevo, 1963. "Effect of Bacterial Polysaccharide Accumulation on
Infiltration of Water Through Sand". Applied Microbiology Vol. 12, NO.3, P.
219-223,May, 1964.
Nicholachuk, W., 1978. "Seepage Control in Excavated Earthen Reservoirs." Can. Agric.
Eng. 20:97-101
72
Ontario Ministry of Agriculture, Food and Rural Affairs, 1991, 1994. "Agricultural
Pollution Control Manual".
PCA, 1992. PCA Soil Primer. Portland Cement Association, 1992.
Phillips, P.A., J.L.B. Culley, J.M. Lecleve, and C. Fox, 1983. "Groundwater Seepage from
Earthen Manure Storages in Eastern Ontario." ASAE Paper No. 83-4570, 1983
ASAE Winter Meeting.
Rowsell, J.G., M.H. Miller, and P.H~ Groenbelt, 1985. "Self-Sealing of Earthen Liquid
Manure Ponds. II. Rate and Mechanisms of Sealing." J. Environ. Qual. 14(4):539-
543.
Saskatchewan Agriculture and Food, 1992. "Site Evaluation for an Earthen Manure
Storage"
USDA Soil Conservation Service, Sept. 1993. "Design and Construction Guidelines for·
Considering Seepage from Agricultural Waste Storage Ponds and Treatment
Lagoons." Technical Note 716, Revision 1. South Texas Technical Center, Fort
Worth, Texas.
Westerman, P.W., R.L. Huffman and J.S. Feng, 1993. "Swine-Lagoon Seepage in 'Sandy
Soil". ASAE Paper No. 932531. 1993 International Winter Meeting.
73