Embed Size (px)
Citation preview

Politics and the Media
Topic 2

Political Economy - Trebbi2
Goals of the Lecture
1) Overview
2) Measuring Political Bias in the Media
3) Effects of the Media on Politics
4) Topics on Persuasion, Campaigning, and the Media
Suggested readings: D. Stromberg (Annu. Rev. Econ. 2015); M. Gentzkow & J. Shapiro (ECMA, 2010); R. Puglisi & J. Snyder (JEEA, 2015); S. DellaVigna & E. Kaplan (QJE, 2007); Snyder and Stromberg (JPE, 2010).

Political Economy - Trebbi3
Why Study the Media in Political Environments?
In consolidated democracies:
1) Economist’s view: In democratic regimes media can inform rational voters, change their beliefs, and potentially sway their choices. Evidence that this happens (Stromberg, 2015). This can happen even if the source (media) is biased – as we learn in informational lobbying.
2) Communication Studies’ view: In democratic regimes media can turn behavioral voters by priming, agenda setting, and framing, and eventually determine their choices.
3) Political science’s view is a mix of 1) and 2)

Political Economy - Trebbi4
Why Study the Media in Political Environments?
Autocratic regimes seem to make a very surgical use of information and censorship.
e.g. Censoring in China:“A Chinese news portal’s publication of a mysterious letter calling for President Xi Jinping’s resignation appears to have triggered a hunt for those responsible, in a sign of Beijing’s anxiety over bubbling dissent within the Communist Party. The letter, whose authorship remains unclear, appeared on the eve of China’s legislative session in early March, the most public political event of the year. Since then, at least four managers and editors with Wujie Media—whose news website published the missive—and about 10 people from a related company providing technical support have gone missing, according to their friends and associates, who say the disappearances are linked to a government probe into the letter.”
WSJ, 3/28/2016
In fact, media studies developed in the 1930s to understand propaganda effect in Fascism and Nazism in Europe.
Censoring is a very precise, almost surgical tool for information management, but an expensive one (massive technical investment – think of the Great Firewall of China, GFW)

Political Economy - Trebbi5
Why Study the Media in Political Environments?
Autocratic regimes seem to make a very surgical use of information and censorship.
e.g. Signal jamming in Russia (systematic dissemination of systematically slanted fake news):
“…there weren't any facts. The story was fake. As fake as the stories reported in Russia about the Ukrainian fascists who staged a coup in Kiev in February and then attacked the Russian-speaking southeastern Ukraine. As fake as some of the supposedly indigenous separatist leaders. The rebels' self-styled defense chief, Igor Girkin (aka Strelkov, or "shooter"), for instance, is a former or maybe even current Russian security-services officer with a passion for theatrical re-enactments of battles in the post-1917 civil war. The narrative of the civil war in Ukraine was scripted in Moscow and executed by state television channels that have substituted reality with fiction.”
WSJ 7/28/2014
Signal jamming is a very imprecise tool for information management, but an inexpensive one (just a bunch of trolls and few well trained hackers).
Interesting trade-offs.

Political Economy - Trebbi6
Media Bias

Political Economy - Trebbi7
Media Bias
Media are typically considered biased in reporting facts.

Political Economy - Trebbi8
Media Bias
Media are typically considered biased in reporting facts.

Political Economy - Trebbi9
Media Bias
Media are typically considered biased in reporting facts.

Political Economy - Trebbi10
Media Bias
Media are typically considered biased in reporting facts.

Political Economy - Trebbi11
Ways to Assess Media Bias
1. Assessing the bias in media by looking at the news text. This approach involves identifying partisan patterns of speech in Congress (e.g. “death tax” v. “estate tax” in Congressional floor debate) and then identifying to which class of text the news text is “the closest”. Does the WSJ use GOP patterns of writing? (see Groseclose and Milyo, 2005; Gentzkow and Shapiro, 2010). => Machine learning examples in Trebbi & Weese, 2016.
2. Differential topic coverage of the media. Does the WSJ covers more frequently/ in more depth scandals involving Democrats than Republicans? (e.g. Larcinese, Puglisi and Snyder, 2011; Puglisi and Snyder, 2011).
3. Differential patterns of endorsement of newspapers. Does the WSJ endorse Republicans more frequently than Democrats? Does the WSJ endorse ballot propositions supported by Republicans more frequently than those by Democrats? (e.g. Puglisi and Snyder, 2015)
Assumption: we abstract from the endogeneity cycle of media affecting political opinion, voters’ ideology, preferences – no persuasion effects of media.

Political Economy - Trebbi12
The Balanced US Press
Using the third approach Puglisi and Snyder (“The Balanced US Press”, JEEA, 2015) find that US newspapers are typically very much aligned with the median voter in the State where they operate (no National median voter evidence – only State median voter). Average media bias is a precise 0.
However, they also find that some media outlets are systematically to the left of the state median voter and others systematically to her right – so there is heterogeneity, although dispersion is not high relative to other special interest groups (e.g. environmental groups, labor unions, trade associations, etc.).
Issue-specific differences: Newspapers appear systematically to the left of the median state voter on social issues and to the right of the median state voter on economic issues.

Political Economy - Trebbi13
The Balanced US Press (cont.)
Methodology: Look at State ballot propositions. Typically binary with a Liberal/Conservative policy issue (say, spatially located at L < R on the real line).
3 cases:
i. Suppose, come voting day, that vote shares are split ~50/50 between R & L (or at close margin, say 55/45), then the median voter is around (L+R)/2. Then, any media endorsing policy R is more conservative than the median voter. Any media endorsing policy L is more liberal than the median voter.
ii. Suppose vote shares are split so that R votes >> L votes, then the median voter is close to R. Any media endorsing L is more liberal than the median voter. But if a media endorses R, it could be more or less biased (uninformative case).
iii. Suppose vote shares are split so that L votes >> R votes, then the median voter is close to L. Any media endorsing R is more conservative than the median voter. If a media endorses L, it could be more or less biased (uninformative case).
For each news outlet, average across all ballot propositions. No selection bias issues.
Political Economy - Trebbi14
2 propositions
L
(L+R)/2
R

Political Economy - Trebbi15
If votes are evenly split, an endorsement places media on the correct side of Median Voter M
L
(L+R)/2
RM
The integral of the preference distribution is integrated up to (L+R)/2 to find the pro-L vote share. If vote shares are balanced, then M is close to (L+R)/2. Then endorsing L puts you to the left of M almost certainly.

Political Economy - Trebbi16
L
(L+R)/2
RM
If votes are mostly for R, an L endorsement places media on correct side of Median Voter M
If media outlet endorses L, for sure it is placed to the left of M.

Political Economy - Trebbi17
L
(L+R)/2
RM
If votes are mostly for L, an R endorsement places media on correct side of Median Voter M
If media outlet endorses R, for sure it is placed to the right of M.

Political Economy - Trebbi18
Endorsement Data
All US newspapers with circulation > 20,000.
Period 1996-2012.
Voting yes on propositions is classified as R (or L) based on Party endorsements or endorsement/opposition by a majority of the special interest groups with pre-identified clear political affiliation – the authors use a bunch for robustness.
30,525 endorsements, but in most cases (66%) you have uninformative newspaper endorsements (endorsing on the side of the majority in ii. and iii.)
23% of endorsements are on close propositions (case i.); these are all usable.
State-by-state analysis for Arizona, California, Colorado, Florida, Oregon, Washington.

Political Economy - Trebbi19
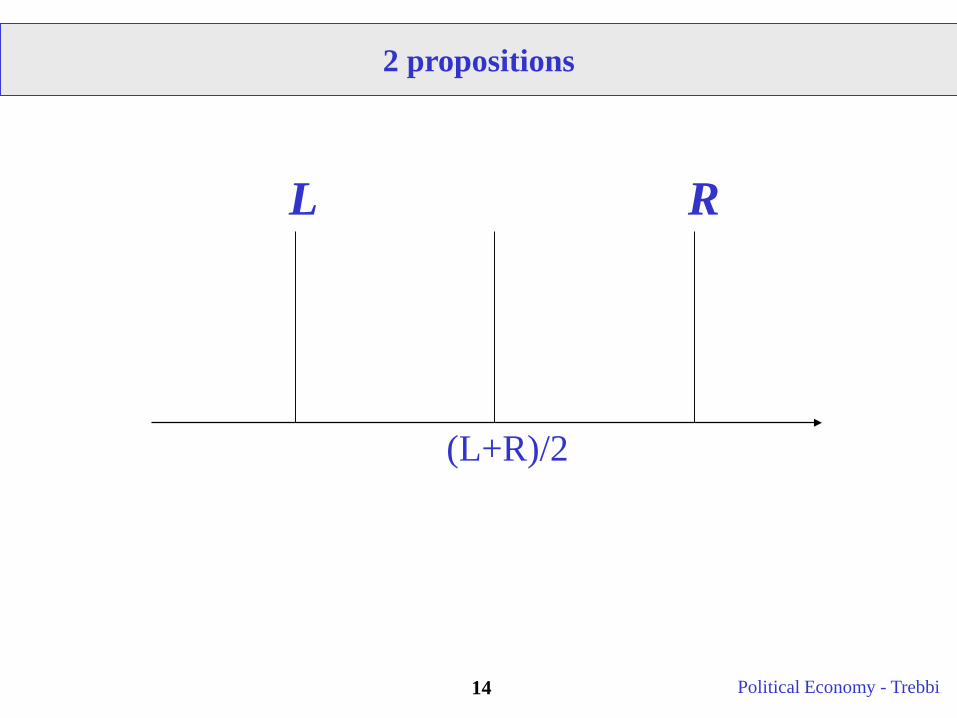
The Balanced US Press (cont.)

Political Economy - Trebbi20
The Balanced US Press (cont.)
The LA Times agrees with the liberal position ~30% more often than with the conservative position.
Political Economy - Trebbi21
The Balanced US Press (cont.)
The CA Sierra Club agrees with the liberal position ~90+% more often than with the conservative position.
Political Economy - Trebbi22
What Drives Media Slant?
Using the first approach Gentzkow and Shapiro (“What Drives Media Slant? Evidence from US Daily Newspapers”, ECMA, 2010) construct a measure of textual similarity between the language of the newspaper and that of a typical congressional Democrat or Republican.
Then the authors estimate a model where newspapers are local monopolists and endogenously select their slant to maximize profits, given the characteristics of the demand side.
Turns out that based on this stylized model of demand the newspapers are optimally selecting their slant. Consumer preference shifters can account for 20% of all measured media slant/bias. Slant seems to be demand-driven not supply-driven.
In fact, other supply dimensions that are typically considered deleterious for bias, such as ownership (think of Rupert Murdoch’s News Corporation and Fox News), do not explain nearly as much.
Political Economy - Trebbi23
What Drives Media Slant?
Use news content of a large sample of US daily newspapers.
The corpus of congressional text is the 2005 Congressional Record.
Pre-process text, stripping away prepositions, conjunctions and common words to get two-word phrases and three-word phrases of text.
The authors select a subset of phrases based on some common heuristics. Drop phrases too frequent or too rare either in congressional speech or in the news. (phrases like “yield the remainder of my time” or “first quarter” are uninformative on partisanship).
For each usable phrase p, they compute usage counts by Republicans and by Democrats and they use these counts to create a Pearson chi-squared statistic for each p.
χ2(p) is simply the statistic of the test for equality in the propensity to use p by Republicans and Democrats if these two counts were drawn from multinomial distributions.

Political Economy - Trebbi24
What Drives Media Slant?

Political Economy - Trebbi25
What Drives Media Slant?

Political Economy - Trebbi26
What Drives Media Slant?
Once an ideology level is assigned to all newspapers, the authors proceed to create a benchmark of what the media bias would be in a context where:
a. Readers like to consume news slanted towards their own (zipcode-specific) ideological bias, which is exogenously given (hence no feedback loop from media to voters preference/types/information is allowed).
b. Firms are local monopolist and give their readers what they want in order to profit maximize, but are potentially affected in their supply also by linear supply shifters.
It is a economic model of slant where essentially:
1. More conservative zipcodes have higher demand for more conservatively biased news.2. Slant supplied by news corporations is increasing in consumer conservativism.
For details on estimation of demand shifters (e.g. for replication purposes of this simple IO model), refer to the main text.

Political Economy - Trebbi27
Demand for Slant

Political Economy - Trebbi28
Demand for Slant
Sales of this newspaper are high in Republican zip codes and low in Democrat zip codes (high coefficient of sales on zip code ideology). This newspaper has also an estimated high Republican slant.

Political Economy - Trebbi29
Consumers Driving Slant

Political Economy - Trebbi30
Consumers Driving Slant
Sales of this newspaper are concentrated in Republican zip codes only. This newspaper has also an estimated high Republican slant.
Political Economy - Trebbi31
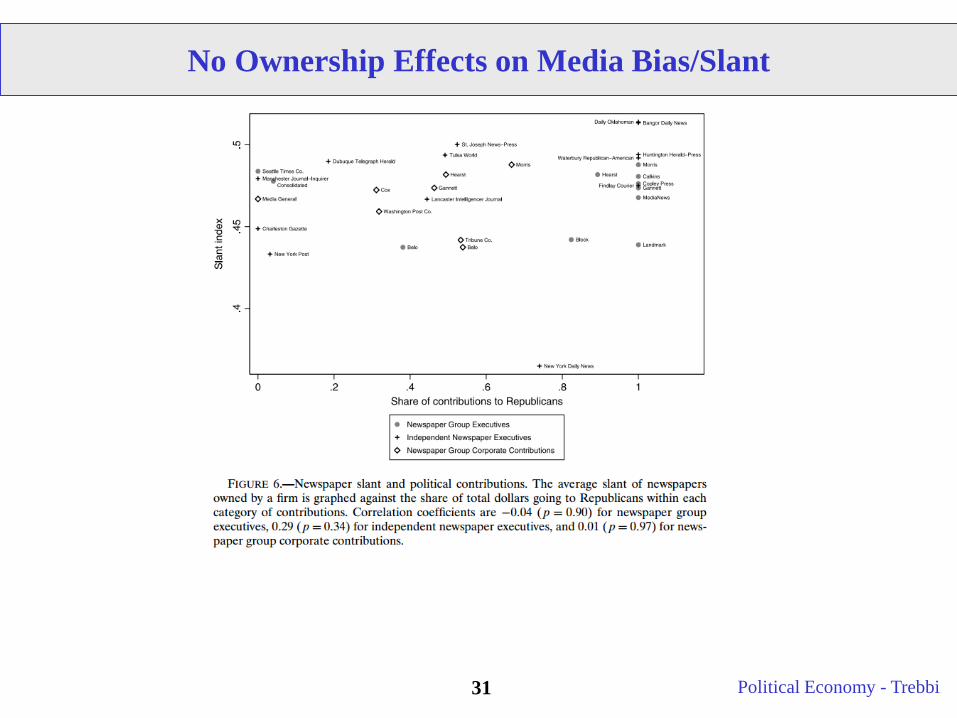
No Ownership Effects on Media Bias/Slant

Political Economy - Trebbi32
Media and Its Effects

Political Economy - Trebbi33
Media and Persuasion
Effect of media on voting.
Most of the evidence is pretty negative. No effect of the media on electoral outcomes. This is potentially consistent with the idea that the evidence relies on observational evidence that is short-run and limited.
e.g. Gerber et al. (2011) on the short lived effects of randomized television ads in Texas for the Rick Perry gubernatorial campaign.
In this respect news change the beliefs of voters, possibly reducing their variance, but news do not sufficiently move beliefs to the point of affecting vote choices.
However, Gentzkow et al. (2011) find precise zeros for the effect of entry and exit of partisan newspapers on party vote shares for the US in the period 1869-2004.
Only exception of a positive result: DellaVigna and Kaplan (QJE 2006) “The Fox News Effect”

Political Economy - Trebbi34
DellaVigna and Kaplan (QJE 2006) “The Fox News Effect”
Exploits gradual introduction of Fox News in US TV cable markets over the period 1996-2000.
“Fox News expanded rapidly to reach 20 percent of U. S. cities and an audience of 17.3 percent of the U. S. population by June 2000 (Scarborough Research data).”
Channel distribution and bundling in US is driven by many idiosyncratic elements and this provides some exogeneity to the Fox News treatment.
The phasing-in timing identification strategy is typical of some of these empirical papers on media see Gentzkow (QJE 2006 on “Television and Voter Turnout” – Television reduced electoral turnout by substituting more politics-rich media, like newspapers).
Fox News Effect

Political Economy - Trebbi35
Fox News Availability in 2000
Source: DellaVigna and Kaplan, 2007. Figure 1

Political Economy - Trebbi36
DellaVigna and Kaplan look at the effects on the 2000 presidential election vote shares and show that areas that started broadcasting Fox on cable before 2000 had increases in Republican vote shares in the 2000 election relative to 1996 of about 0.4-0.7 percentage points (midpoint 0.0055) in the treated towns.
Fox News in 2000 was available in 34% of households, so the overall effect of Fox News was 0.15 to 0.2 percentage points of all voters (midpoint 0.0019 = 0.34*0.0055).
+200,000 GOP votes nationwide – this was the Bush-Gore tied election, remember, so even small numbers mattered. In Florida Fox News effect was +10,757 votes, Bush’s official margin of victory was 537 votes.
Effect not just through switching parties, but through mobilization of Republican voters, increasing conservative turnout especially in Democratic districts.
The paper is also useful in terms of computation of persuasion rates of the media.
Fox News Effect

Political Economy - Trebbi37
DellaVigna and Kaplan (2007) look at persuasion rates of the media. Below is adapted from Della Vigna and Gentzkow (2011, p.5):
Persuasion rate = percentage of receivers that change the behavior among those that receive a message and are not already persuaded.
In a setting with a binary behavioral outcome, a treatment group T, and a control group C, the persuasion rate f (in percent) is:
f = 100 ∗ (yT − yC)/(eT − eC) * 1/(1 − y0)
Where: ei is the share of group i receiving the message. Note: it allows for nonzero eC
yi is the share of group i adopting the behavior of interest (e.g. voting GOP), y0 is the share that would adopt if there were no message. Where y0 is not observed,
approximate it by yC. e.g. in DellaVigna and Kaplan (2007) (yT − yC) = (56.55% – 56%)= 0.55% and f = 11.6%
Fox News Persuasion Rates

Political Economy - Trebbi38
Media and Political Accountability
Media divulge information to voters.
This is at the core of the economic view of the media in politics.
Assumption is some degree of rationality of voters.
Updating based on information and not completely behavioral.
Some evidence from other areas of voters responding to information. In political campaigns (Kendall et al. AER 2015). Using surprise newspaper endorsements Chiang and Knight (ReStud 2011).

Political Economy - Trebbi39
Media and Accountability
Snyder and Stromberg (2010) on “Press Coverage and Political Accountability”, JPE.The authors lever identification by noticing that Congressional District boundaries cut across
media markets in relatively exogenous ways.
Media cater in their coverage to their readers –i.e. they report on issues the readers care about.
If a newspaper media market covers two districts A and B, that newspaper will typically cover the politician from A less than a newspaper whose media market perfectly overlaps (is “congruent”) with district A.
This is because the first newspaper will need to compromise, also reporting on news related to B, hence diluting the intensity of scrutiny on the politician from A. –You need to buy all newspapers covering your congressional district to have a comparable number of news.
If a district is fully “congruent” relative to having a level of zero congruence, the number of articles about that district’s congressman increases by 170 per Cong. cycle on average.

Political Economy - Trebbi40
Snyder and Stromberg (2010) on Media and Accountability
Causality chain:
Media congruence drives media coverage.
Media coverage induces sizeable learning.
Learning increases accountability of politicians.
Politicians’ effort increases.
Higher effort delivers better policy and public goods to the district.

Political Economy - Trebbi41
Snyder and Stromberg (2010) on Media and Accountability

Political Economy - Trebbi42
Media and Policy Effects
Media access improves policy outcomes.
Snyder and Stromberg (2010): one st. dev. increase in congruence (i.e. 50 more articles per Congressional cycle) increases federal spending to district by 3% per capita.
Areas that exogenously had good radio reception received significantly more New Deal spending after the great depression and had higher electoral turnout - Stromberg (2004 QJE).
Note: the exogenous variation in these papers typically comes from some odd geophysical features. Typical measures of exogenous drivers of media penetration are ground conductivity, topography relative to the placement of transmitting antennae, etc.
Using this type of identification strategy, some papers have also looked at the deleterious consequences/costs of media penetration include Yanagizawa-Drott (QJE 2014) on “hate radio” in Rwanda and genocide; Blouin et al. (2016) on pro-government propaganda on Radio Rwanda; Adena et al. (2015) on the role of the radio during Weimar and in Nazi Germany; Pinotti et al. (2015) on Berlusconi’s political ascent and his TV channels (boosting Forza Italia vote shares), etc.

Political Economy - Trebbi43
Media and Policy EffectsMedia access changes policy outcomes.
There is another interesting form of identification of media effect. Holding media penetration constant, look a timing.
Issues are being covered by the media at a differential rate when there are other news “competing for bandwidth”.
Eisensee and Stromberg (QJE 2007) look at natural disasters. Olympic Games coverage crowds out coverage of natural disasters and this decreases the likelihood of the US government sending relief aid on those events happening to overlap. News coverage has a causal effect on US relief.
Durante and Zhuravskaya (“Attack When the World Is Not Watching? International Media and the Israeli-Palestinian Conflict” 2015) look at Israeli attacks/retaliation against Palestine. The authors show that Israeli attacks are more likely to be carried out when US news are expected to be dominated the next day by some prominent, but Middle-East-unrelated, event. These events are predictable in nature and only attacks that carry the risk of civilian casualties and are not urgent are so timed.
Political Economy - Trebbi44
Media and Policy Effects

Political Economy - Trebbi45
Media and Policy Effects

Political Economy - Trebbi46
Conclusions on Media
Issues of media and politics have been explored.
Recent methodological advances in quantifying bias of newspapers. Also rational models seem do a pretty good job in explaining effects of media.
Yet stark incongruences.
Would like to understand/cover better behavioral sides of media.
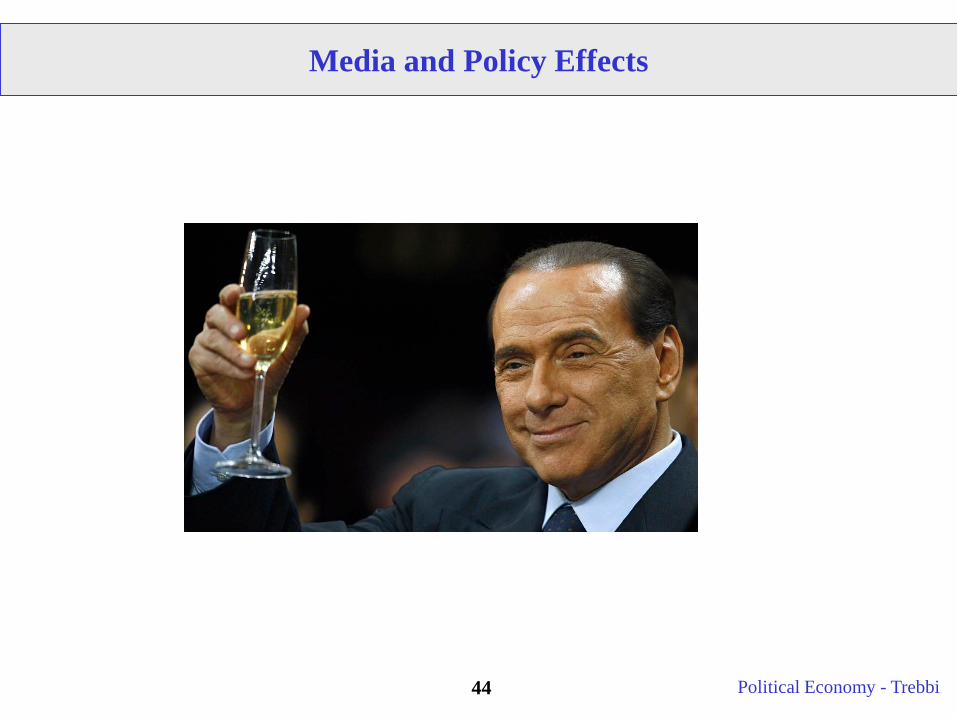
How do you explain Silvio Berlusconi, Donald Trump, etc. ?