Embed Size (px)
Citation preview
POLITICS AND INCOME DISTRIBUTION
Martin Baur
Federal Tax Administration, Eigerstrasse 65, CH-3003 Berne, Switzerland, email:
Keywords
Democratic Institutions, Income Distribution, Interest Groups, Participation, Political Rights,
Public Choice, Voter Turnout.
JEL- Classification
C12, C13, C21, D31, D72, H30, O43
Abstract
The connection between political and institutional variables and income distribution has not gained much attention so far in economics. In a first step, this paper presents the state of research between politics and income distribution with a focus on Public Choice aspects of income distribution, e.g. redistribution, political institutions and participation. In a second step, propositions derived from the research literature are empirically tested. Starting from the notion of Kuznets (1955) about the necessity of the integration of the working class into the political structure of a country as a condition for decreasing income inequality, the role of participation, interest group organization and democratic institutions in the context of income distribution are empirically analysed. First panel regression results support the notion that countries in which the population is more integrated into the political structure experience less income inequality.
2
1. Introduction
The relationship between growth and income distribution as well as political structure and
economic performance has long been a subject of scrutiny for researchers. Whereas the
reciprocal links between growth and income distribution have gained considerable attention
in the last decades, the link between political and institutional variables and income
distribution has not gained much emphasis so far. There are only a few studies investigating
the connection between institutions, political variables and income distribution and most of
them analyse the connection between aggregate democracy measures and income
distribution with ambiguous results (Gradstein and Milanovic 2000).
Considering the generally important role of transfers and redistributive policies in modern
societies, the interactions between politics and income distribution deserve more detailed
attention, especially the question which factors influence the amount and direction of
redistribution in a society. The redistribution literature agrees that redistribution generally
benefits the politically influential groups of society. Therefore, the distribution of political
influence determines the income distribution in a society.
The present paper has two aims. In a first step, the research literature dealing with the
connection between politics and income distribution is reviewed. In a second step, different
propositions concerning the connection between political influence and income distribution
are derived from the research literature and empirically tested.
The paper is organised as follows: Section 2 gives a short overview of the most important
theoretical and empirical findings concerning the connection between growth and income
distribution. Section 3 deals with the literature on the relationship between politics and
income distribution. In section 4 the hypotheses are presented. The empirical analysis
follows in section 5. Section 6 concludes with a short summary of the most important results
and possible strands for further research.
3
2. Income Distribution and Growth
Questions of growth and income distribution have always been a major concern for
economists. In his seminal article (Kuznets 1955) Kuznets proposed his hypothesis of an
“inverted-U” relationship between growth and income distribution. After examining empirical
data for different industrial and developing countries Kuznets found that income inequality
increases in a first stage of economic growth and then begins to decrease after a certain
point of growth. According to Kuznets the reason for this phenomenon lies in labour
migration between a traditional agricultural sector and a modern, urban industrial sector. On
the one hand, the inequalities between these two sectors rise during the development
process, on the other hand, the share of the more unequal industrial sector, where wages
differ more than in the agricultural sector, increases. According to Kuznets (1955, p. 17) the
growing political power of the urban low-income groups, their political participation and the
better chances for organization lead to a variety of protective and supportive legislation by
the state. This means that not until all sectors of the working class are integrated into the
political and economic structure of a country and have begun to gain political influence, will
income inequality begin to fall.
In the following years many economists have tried to find evidence for the Kuznets curve and
to answer the question of how growth and income distribution affect each other (Adelman
and Morris 1973, Chenery et.al. 1974, Ahluwalia 1976, Papanek and Kyn 1986, Fields 1987,
Ram 1988, Bourgignon and Morrisson 1990, Anand and Kanbur 1993, Deininger and Squire
1996, Barro 2000). Although mainly the cross-sectional studies found evidence for the
Kuznets hypothesis, the more recent investigations working with newer and better data
material and using time series data did not obtain unequivocal results (Deininger and Squire
1996, p. 583-589).
A new strand of literature looks at the long-term evolution of the income distribution in
particular countries (Piketty 2003, Piketty and Saez 2003, Atkinson 2003 and Dell, Piketty
4
and Saez 2005). These studies find a strong decrease of income inequality throughout the
first half of the 20th century, whereas the recent experience is quite diverse across countries,
with some countries experiencing an increase in inequality since the 1970s. Whereas skill-
based technological change and globalisation affect the income distribution everywhere
(Glaeser 2005), economic structure, pursued policies and also the geographic and historical
heritage of the investigated countries play a more important role in explaining the differences
in income distribution between countries than the level of development.
In the last few years interest in Kuznets’ hypothesis decreased and the relationship between
growth and income distribution was newly analysed from another point of view. Up until the
early 90’s, the contemporary economics profession had not much to say about the impact of
income inequality on the growth rate of an economy. At the intersection of Public Choice and
Theory of Endogenous Growth, economists were now busy analysing models and empirical
studies dealing with income distribution and its influence on growth (for a survey, see Alesina
and Perotti 1994, Perotti 1996 and Bertola, Foellmi and Zweimüller 2006). Most of these
studies came to the conclusion that a more equal distribution of income has a positive impact
on the growth rate of an economy, whereas an unequal income distribution can affect growth
negatively. These new findings contradicted the notion of inequality as a prerequisite for
development ensuring the adequate incentives for work, savings and investment. Different
channels were identified as possible links connecting income distribution and economic
growth.
The fiscal policy channel predicts that income distribution affects growth through the negative
distortionary effects of government expenditures and taxes on investment and savings
decisions (Persson and Tabellini 1992, Perotti 1993, Alesina and Rodrik 1994, Persson and
Tabellini 1994). The endogenous fiscal policy approach, with its basis on the median-voter
theorem where the amount of government expenditures and the tax rates are decided, is
theoretically persuasive but empirically problematic, not least because the correlation
5
between inequality and tax rates was found to be negative and taxation and redistributive
expenditures are often positively associated with growth (Saint Paul and Verdier 1996,
Perotti 1996 and Josten and Truger 2003). Rodriguez (2004) shows that inequality causes
slower growth, not because inequality leads to more redistribution, but due to the fact that the
groups benefiting from an unequal distribution of income tend to preserve their favourable
position through political activities. Therefore resources are wasted through rent-seeking
activities instead of being used for productive investments (Rodriguez 2004).
Another strand of literature identified the security of property rights as a link between
inequality and growth, with higher income inequality turning property rights less secure
through social polarization, resulting in negative growth impacts (Knack and Keefer 2000).
Related approaches stress the impact of inequality on socio-political stability and its influence
on growth with higher inequality leading to less socio-political stability which is considered
detrimental for growth (Venieris and Gupta 1986, Alesina and Perotti 1996, Perotti 1996 and
Bourgignon 1998).
Non political models of the link between income distribution and growth consider factors such
as education and fertility (Perotti 1996, De la Croix and Doepke 2003) credit market
imperfections and human capital investments (Galor and Zeira 1993, Bertola, Foellmi and
Zweimüller 2006), demand effects (Murphy, Shleifer and Vishny 1989) and aspects of
globalisation (Cornia 2003, Dreher and Gaston 2006).
The proposition that initial inequality seems to be associated with lower growth rates has
gained much empirical support in recent years (Benabou 1996). But many new studies
drawing on the Deininger-Squire database (Deininger and Squire 1996), which is superior to
data available to older studies, have questioned the supposed new consensus. Forbes
(2000), for example, finds a significant and positive impact of inequality on economic growth.
Knack and Keefer (2000) found the only surviving link between income inequality and growth
6
to be the property rights channel. The coefficients for political violence, redistribution, capital
market and market size all lose their significance when tested with higher-quality income
distribution data. However the econometric problems that seem to disturb the negative
relationship in the newer data sets appear to be specific to income inequality. Deininger and
Squire (1998) find the negative coefficient on initial income inequality in their regressions
only insignificant when a variable for asset inequality (the Gini coefficient for land ownership)
is introduced into the model. Some subsequent studies found negative growth impacts of
human capital inequalities (Birdsall and Londono 1997, Castello and Domenech 2002) and
land inequality (Deininger and Olinto 2001).
The current state of the debate can be summarized as follows: while it is not certain whether
initial income inequality directly affects economic growth (Bourgignon 2004), it is a proxy for
more fundamental wealth and human capital inequalities. Once measures for wealth
inequalities are included in the empirical analysis, there seems to be a significant negative
relationship between asset inequality and economic growth.
There seem to be no systematic links between the level of development and income
distribution. Generally, there is too much country specificity in the way growth affects
distribution for any generalisation to be possible (Bourgignon 2004). Nevertheless, the
research literature was able to identify certain factors affecting the income distribution such
as land tenure, education and population growth (Kanbur 2000, p. 818). In addition, most
studies agree, that not the level of development but economic structure and, most
importantly, pursued policies are the most important factors determining income distribution.
7
3. Politics and Income Distribution
Income distribution and growth are definitely influenced by pursued policies. Apart from
providing public goods and services, governments all over the world redistribute income
among its citizens by transfers, taxes and legislation. Therefore the role of the state and
politics in general should not be disregarded. There are two different connections between
income distribution and redistribution, namely the effects of redistribution on the income
distribution and on the other hand the analysis of inequality as a cause for redistribution.
3.1. Redistribution and Income Distribution
Normative redistribution theories (Egalitarianism, Utilitarianism) and the intentions of the
modern welfare state propose redistribution from rich to poor as the primary goal of
redistribution policy. However, in the real world, redistribution from rich to poor constitutes
only a small fraction of existing redistribution (Tullock 1997, Mueller 2004). Empirical
evidence about the effects of redistribution on income distribution in general is quite mixed,
there is no unidimensional flow of income in only one direction (e.g. from rich to poor), but
every possible flow of income between groups happens to occur (Mueller 2004).
Redistribution can be seen as the result of a political struggle within an institutional structure,
where redistribution is determined by self-interested utility-maximizing voters, pressure
groups, politicians and bureaucrats acting in an institutional structure (among others see the
models of Kristov, Lindert and McClelland 1992, Grossman and Helpman 1994, Dixit and
Londregan 1994, Austen-Smith 1997 and Rodriguez 2004). The largest part of transfers
goes to the politically influential and well organised, or generally speaking to those
demanding the money, and takes from those least capable of opposing the transfers (Tullock
1997). Since the possibility of organizing interest groups is far more unequally distributed
than productive abilities and the control of free-riding requires enough resources, poor-to-rich
redistribution is the likeliest consequence of interest group activity (Mueller and Murrell 1986,
Olson 1991, Tollison 1997, Rodriguez 2004). This notion is supported by albeit few empirical
8
studies finding that the main part of government programmes accrues to groups that are well
organised and politically influential (Tullock 1997). Therefore the presence of interest groups
and the inherent logic of their formation is assumed not only to lead to redistribution from
poor to rich and from unorganised to organised, but also to increased income inequality in
general.
3.2. Income Distribution and Redistribution
Another link between income distribution and redistribution is the impact of the income
distribution on policies for redistribution through the Median-voter model developed by
Meltzer and Richard (1981), where redistribution occurs through taxes which are decided by
the Median voter (Pommerehne and Kirchgässner 1991, Mueller 2004). The model shows
that the poorer the median voter is relative to the average voter, the higher his preferred tax
rate and therefore the higher the amount of redistribution. So, inequality and the expansion of
suffrage (with the assumption that the new voters are poorer than the median voter) lead to
more redistribution from rich to poor. While these findings were empirically supported by
older data showing that increasing inequality had in fact a significant impact on the amount
and growth of redistribution and government expenditures (Pommerehne and Kirchgässner
1991), newer empirical evidence is mixed (see Verdier 1999, Reuveny and Li 2003).
According to Saint Paul and Verdier (1996), Josten and Truger (2003) and Rodriguez (2004)
higher inequality not necessarily leads to more redistribution because different income
groups have different political weights and political participation is endogenous with the poor
having a lower participation than the rich, making the decisive voter richer than the median
voter (Bénabou 2000, p. 106ff.). Another argument proposes a negative relationship between
inequality and redistribution because in unequal societies the poor lack the resources to push
their poltical agenda and the governments of these countries are formed by members of the
small rich elite, resisting redistribution and fearing expropriation (Gradstein and Milanovic
2000, Glaeser 2005, similar arguments are found in Rodriguez 2004). While these
propositions are quite difficult to test empirically they nevertheless show that the effects of
9
redistribution and income distribution remain controversial and the results of the different
models depend on the assumptions about the underlying political process and the
institutional structure of an economy.
3.3. Institutions and Income Distribution
The discussion about redistribution and income distribution as well as income distribution
and growth shows that the political context plays an important role in determining income
distribution. According to Kuznets (1955, p. 17) the growing political power of the working
class leads to changes in state policy and is thus a necessary condition for falling inequality.
Tullock (1997, p. 109) states that people are poor for reasons that not only make them
having a difficult position in the economic marketplace, but also in the political marketplace,
which translates into generally lower political participation. The median-voter model
predicting redistribution from rich to poor and an automatic equalisation of the income
distribution is being criticised for not considering different political weights of different income
groups and endogenous political participation (Saint Paul and Verdier 1996, Josten and
Truger 2003).
The analysis of the relationship between institutions, the political process and income
distribution has not gained much emphasis so far. While the impact of economic and political
liberties on the economic growth performance of a country has been extensively investigated
(Scully 1992, Przeworski and Limongi 1993, Knack and Keefer 1995, Baum and Lake 2003,
Przeworski and Limongi 2003, Halperin, Siegle and Weinstein 2004), only few studies deal
with the relationship between institutions and income distribution (see Gradstein and
Milanovic 2000 for a survey). Although it has long been recognized that a more egalitarian
distribution of political rights in the form of a political democracy should, according to the
Median-voter model, be accompanied by a more equal income distribution, the few existing
empirical evidence is mixed (Gradstein and Milanovic 2000).
10
Scully (1992) shows that politically open countries that are committed to the rule of law,
respect private property and have a market allocation of resources, have more equal income
distributions than countries where these rights are restricted. Nee and Lidka (1997) analyse
China’s transition in the last decades from state socialism to a market economy, with its
different institutional arrangements of property rights, from state control to different
corporatist arrangements to outright private property of resources. The empirical results
show that households in corporatist and laissez-faire regions are more likely to end up in the
upper regions of the income distribution than the households in the inland or in the
redistributive areas. The overall level of income inequality is lowest in the corporatist
provinces and highest in the still redistributive inland and the laissez-faire provinces (Nee
and Lidka 1997, p. 220ff.). Gradstein, Milanovic and Ying (2001) argue that ideology, as
proxied by a country’s dominant religion, is an important determinant of inequality. Their
cross-country evidence supports the hypothesis that the democratisation effect on income
distribution works through ideology. The results show that in Judeo-Christian societies
increased democratisation leads to lower inequality, whereas in Muslim and Confucian
societies, which rely on informal transfers to reach the desired level of inequality,
democratisation has an insignificant effect on inequality. Mueller and Stratmann (2002)
present cross-national evidence that high levels of democratic participation in the form of
high voter turnout at elections are associated with more equal distributions of income. Their
reasoning shows that high voter participation rates affect government policies, which in turn
affect the distribution of income. The reduction of income inequality is caused by larger
government sectors, resulting in slower economic growth (Mueller and Stratmann 2002, p.
27). Reuveny and Li (2003) investigate the effects of democracy and economic openness on
income distribution. Their cross-country evidence shows that democracy has a positive effect
on income distribution. The same applies to trade openness, whereas the level of foreign
direct investment leads to more inequality.
11
According to Acemoglu and Robinson (2000, 2002) the experience of some industrial
countries between the middle of the 19th and the beginning of the 20th century shows that
increasing inequality caused by industrialisation led to rising political instability. This forced
the elite of the respective countries towards democratisation which then caused redistribution
measures and a reduction of inequality. Analysing the historical experiences of these
countries the authors find support for a Kuznets curve with democratisation being the link
between growth and income distribution (see chapter 2). The reduction of inequality therefore
depends on political participation. If political participation is low, an equilibrium with high
inequality, slow growth and a low degree of democracy is possible (Acemoglu and Robinson
2002, p. 196).
On a more disaggregate level, some studies investigate the impacts of majoritarian and
proportional, presidential and parliamentarian political systems on income distribution
(Persson and Tabellini 2000, Milesi-Ferreti, Perotti and Rostagno 2002 and Persson and
Tabellini 2003). Whereas empirical evidence of the effects of these constitutional differences
on overall income distribution are lacking to date, these studies find evidence that welfare
spending and size of government differ across political systems. A comparison between
direct and representative democracy is undertaken by Feld, Fischer and Kirchgässner
(2006). They find that in more direct democratic Swiss cantons the government obtains
considerably lower funds for redistribution than in more representative Swiss cantons but
income redistribution in direct democratic Swiss cantons is as high as in all other cantons.
This could be an indication that transfers and tax exemptions in direct democratic cantons
are better targeted than in more representative cantons with a more effective use of available
means (Feld, Fischer and Kirchgässner 2006, p. 22).
The results from studies dealing with the connection between constitutional environments
and inequality show that institutions seem to matter in the determination of the income
distribution of a country. The studies investigating the effects of aggregate measures of
12
democracy on income distribution have mixed results, whereas the studies investigating
specific aspects of democracy such as equality of opportunity and the participation of the
population in the political process get more convincing results. The redistribution literature
shows that political participation not necessarily leads to rich-to-poor redistribution through
the Median voter process, because participation is endogenous (Saint Paul and Verdier
1996, Tullock 1997, Verdier 1999, Josten and Truger 2003). Low-income individuals very
often do not only stand outside of the economic market but they also have, for different
reasons, a weak position in the political marketplace because their political participation is
low. Keeping this in mind, it is easy to see that for a concise analysis of income inequality in
a society and between countries the political process has to be investigated more thoroughly.
Ankündigung
13
4. Hypotheses
There is little empirical evidence so far regarding the connection between political variables
and income distribution. The studies measuring the impact of aggregate regime variables on
income distribution are at best inconclusive. The few studies investigating the relationship
between participation and the income distribution on a more disaggregated level suggest that
increasing participation leads to decreasing income inequality.
The distribution of political income such as monetary transfers, favourable legislation
(protection of markets, price subsidies, favourable wages and working conditions, tax
exemptions), governmental expenditures on education, housing, health care, agriculture and
the like, rents, patronage, jobs and many more is determined by activities of politicians,
voters, interest groups and bureaucrats on the political marketplace. Only people who are
represented in the political structure of a country can influence the decisions regarding the
political income distribution and thus the overall income distribution. People can only become
integrated into the political structure of a country and gain influence through some sort of
political participation.
Participation depends on the individual income situation and educational status with
educated and high-income persons participating more than uneducated and low-income
persons (Saint Paul and Verdier 1996, Tullock 1997). From this it follows that uneducated
and low-income individuals are more likely to stand outside the political marketplace in which
the political income distribution is determined. Increasing participation would therefore lead to
more people from lower-income groups to participate in the political marketplace, being able
to influence the political income distribution. This can be considered to be a necessary
condition for equalizing the income distribution in general.
Participation thus constitutes a link between the institutional structure of a country and its
income distribution and influences the integration of the population into the political structure
14
of a country, therefore influencing the political income distribution and the general income
distribution. Defined in purely political terms, participation involves partisan and political
behavior such as voting, campaigning, interest group activity and lobbying (Ayee 2000, p. 2),
in other words, activities to get people involved collectively in efforts to influence policy
decisions. Political participation thus means taking part in elections and organizing interest
groups with the aim of influencing policy. Therefore, in the following empirical investigation,
political participation and the integration into the political structure will be measured by the
number of interest groups and voter turnout.
4.1. Interest Groups and Income Distribution
Interest groups are a means of promoting the interests of a certain group of people, focusing
their energy on the redistribution of income. Common interests are only a necessary, but not
a sufficient reason for successful group formation. In general, the possible formation of a
group depends on the group size, with small groups having less difficulty to overcome the
free-rider problem than large groups (Olson 1992, p. 5ff.). In addition, the control of free-
riding depends on the availability of necessary resources to bear the coordination costs.
Therefore groups with higher income are assumed to be organised more easily than poorer
income groups (Rodriguez 2004). The impact of the number of interest groups on the income
distribution is not clear however. On the one hand, a large number of pressure groups means
that a lot of different small groups get rents at the expense of the large unorganised
population, thus resulting in an unequal income distribution (Olson 1991). On the other hand,
the rising number of interest groups enhances the possibility that an individual voter is
represented by such a group and therefore gains more influence in the political process. A
large number of pressure groups could therefore lead to more political participation and thus
to a better integration of the population in the political structure of a country with the
possibility of influencing the political income distribution. As a consequence, the political
income distribution would be more equal and so would the general income distribution.
15
From this follows, that the number of interest groups can have two opposing effects on the
income distribution, which are both tested empirically:
§ The “rent-seeking approach” predicts that a larger number of interest groups leads to
a less equal income distribution.
§ The “political participation approach” predicts that a larger number of interest groups
leads to a more equal income distribution
4.2. Voter Turnout and Income Distribution
Voter turnout is a key element of democratic participation. Voters that do not bother or are
not allowed to vote are likely not to be represented in the political process. Without turning
out to vote, a voter or voting group is not able to influence elections and therefore has no or
only a small influence in the political process. Although there are other ways to participate in
the political process of a country (e.g. through pressure groups, public opinion, etc.), the
most obvious way is to take part in elections. The higher the participation of a certain group,
the higher its influence in the political process.
Voter turnout is different for different groups, depending on factors such as income and
education (Saint Paul and Verdier 1996, p. 720f., Mueller and Murrell 1986, p. 139f.), with
high income classes participating more in the political process than low income classes. A
higher level of participation would ceteris paribus lead to more people from lower-income
groups taking part in the political life and influencing the political income distribution. The
hypothesis with regard to voter turnout which will be tested later in this paper is:
§ More participation in the form of a higher voter turnout leads to a more equal income
distribution.
16
4.3. The Importance of Institutions
The political marketplace and the behaviour of voters and politicians and thus the extent of
participation are determined by institutions and the constitutional environment. Institutions
(e.g. decisions systems, organisations, traditions and other rules) can be thought of as
arrangements forming repetitive interactions among individuals and determining restrictions
that are important for the assessment of costs and benefits of alternatives (Frey 1990, p. 2).
The extent of integration of the population into the political structure and the degree of their
influence on the political income distribution depends on the institutional arrangements of the
respective country. Thus the integration of the population represents a link between
institutions and income distribution. Freedom of speech, freedom of association and the right
to vote are fundamental conditions for the representation and participation of groups and
individual voters in the political process. Countries that curtail these rights are assumed to
have lower representation and participation rates than countries where these rights are
guaranteed. In addition, even if more authoritarian countries know some kinds of forced
political participation (compulsory voting, elections with no/limited alternatives, mandatory
interest group membership) the restrictions of the political systems ensure, that the political
income distribution remains unaffected by political participation. Therefore, political
participation (voting, organization of interest groups) is assumed to have no impact on the
income distribution in authoritarian states.
Free institutions such as civil liberties and political rights are assumed to lead to high rates of
integration of the population. The responsiveness of politicians who want to be reelected
ensures that the growing influence of lower-income classes translates into legislative and
redistributing policy measures. Therefore, in a democratic setting, political participation leads
to a more equal political income distribution and thus to a more equal general income
distribution.
17
The validity of these arguments can be tested by the following hypotheses:
§ The more civil liberties and political rights in a country, the more equal the income
distribution.
§ In a democratic setting political participation (voting, organizing interest groups) has
an equalizing effect on the income distribution.
§ In a non-democratic setting political participation (voting, organizing interest groups)
has no effect on the income distribution.
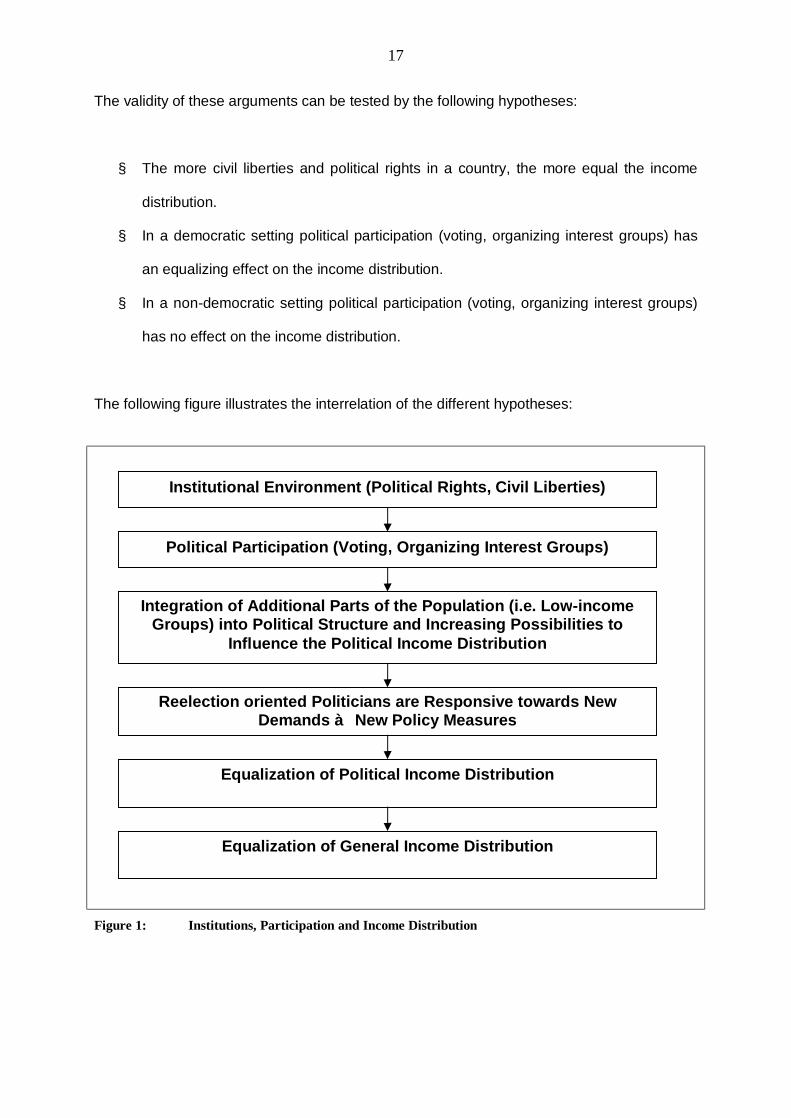
The following figure illustrates the interrelation of the different hypotheses:
Figure 1: Institutions, Participation and Income Distribution
Institutional Environment (Political Rights, Civil Liberties)
Political Participation (Voting, Organizing Interest Groups)
Integration of Additional Parts of the Population (i.e. Low-income Groups) into Political Structure and Increasing Possibilities to
Influence the Political Income Distribution
Reelection oriented Politicians are Responsive towards New Demands à New Policy Measures
Equalization of Political Income Distribution
Equalization of General Income Distribution
18
5. Empirical Analysis
5.1. The Data
In the following section, the 6 propositions about the connection between institutions,
participation and income distribution will be tested empirically. A sample of 59 countries at 3
points in time with 156 observations in total is used. The choice of countries was influenced
by the availability of the necessary data, with available data for all variables for a least two
points in time being the necessary condition for inclusion of the respective country. The 59
countries in the total sample consist of 23 OECD-countries, 13 countries from Latin America
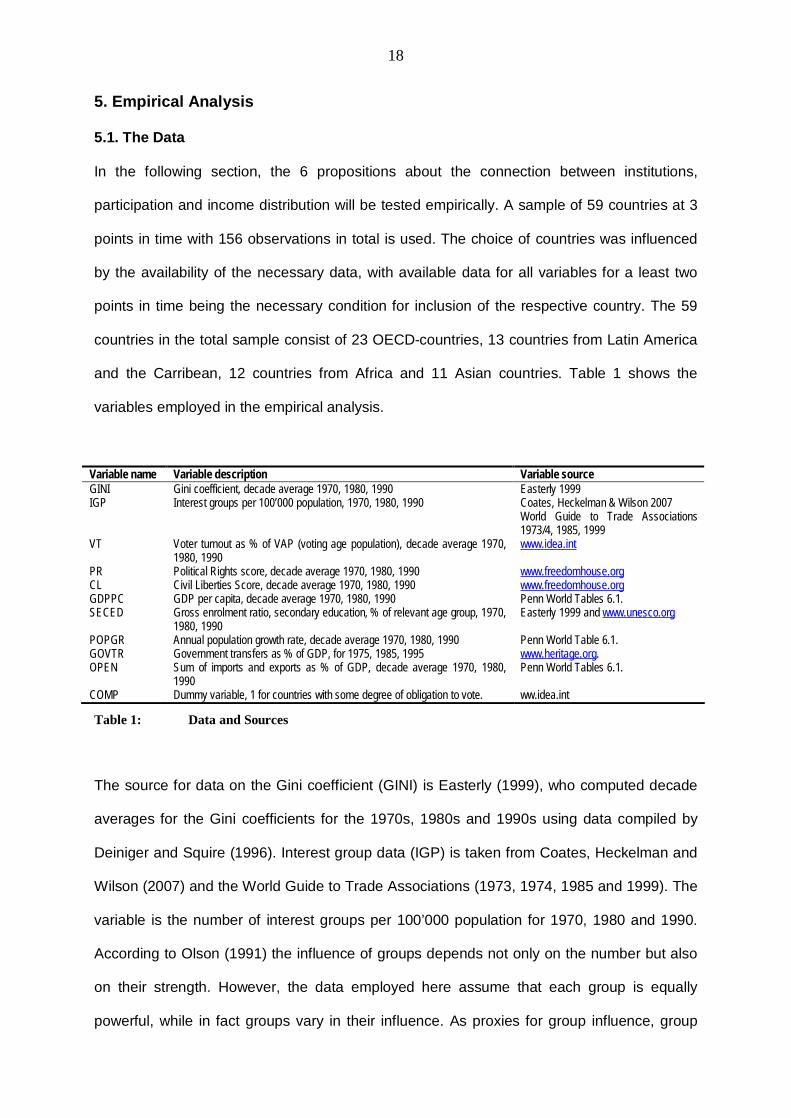
and the Carribean, 12 countries from Africa and 11 Asian countries. Table 1 shows the
variables employed in the empirical analysis.
Variable name Variable description Variable source GINI Gini coefficient, decade average 1970, 1980, 1990 Easterly 1999 IGP Interest groups per 100’000 population, 1970, 1980, 1990 Coates, Heckelman & Wilson 2007
World Guide to Trade Associations 1973/4, 1985, 1999
VT Voter turnout as % of VAP (voting age population), decade average 1970, 1980, 1990
www.idea.int
PR Political Rights score, decade average 1970, 1980, 1990 www.freedomhouse.org CL Civil Liberties Score, decade average 1970, 1980, 1990 www.freedomhouse.org GDPPC GDP per capita, decade average 1970, 1980, 1990 Penn World Tables 6.1. SECED Gross enrolment ratio, secondary education, % of relevant age group, 1970,
1980, 1990 Easterly 1999 and www.unesco.org
POPGR Annual population growth rate, decade average 1970, 1980, 1990 Penn World Table 6.1. GOVTR Government transfers as % of GDP, for 1975, 1985, 1995 www.heritage.org. OPEN Sum of imports and exports as % of GDP, decade average 1970, 1980,
1990 Penn World Tables 6.1.
COMP Dummy variable, 1 for countries with some degree of obligation to vote. ww.idea.int
Table 1: Data and Sources
The source for data on the Gini coefficient (GINI) is Easterly (1999), who computed decade
averages for the Gini coefficients for the 1970s, 1980s and 1990s using data compiled by
Deiniger and Squire (1996). Interest group data (IGP) is taken from Coates, Heckelman and
Wilson (2007) and the World Guide to Trade Associations (1973, 1974, 1985 and 1999). The
variable is the number of interest groups per 100’000 population for 1970, 1980 and 1990.
According to Olson (1991) the influence of groups depends not only on the number but also
on their strength. However, the data employed here assume that each group is equally
powerful, while in fact groups vary in their influence. As proxies for group influence, group
19
budget or membership could be used, but unfortunately, no such data are available for a
cross-section of countries. Data for voter turnout are from the International IDEA website
(www.idea.int/vt). Political participation is measured as voter turnout (VT) as % of the voting
age population (“VAP”), whereas the voting age population is an estimation of the number of
all those citizens over the legal voting age. Average voter turnout for 1970, 1980 and 1990 is
used for all countries in the sample. For the classification of countries according to their
political and civil liberties, the Freedom House index is used (www.freedomhouse.org). The
Freedom House index is one of the most comprehensive and widely used measures of
political rights and civil liberties. Political rights (PR) and civil liberties (CL) are ranked from 1
(highest degree of liberty) to 7 (lowest degree of liberty). Average political rights and civil
liberties for 1970, 1980 and 1990 are used for all countries in the sample.
In addition to the main explanatory variables, several control variables which are frequently
used in previous studies to explain differences in the distribution of income are included.
GDP per capita, population growth and education are identified to affect income distribution
in several studies (Kanbur 2000). The average GDP per capita in a country (GDPPC) for the
1970s, 1980s and 1990s from the Penn World Table 6.1 (Heston, Summers and Aten 2002)
and GDP2 are included to test for the Kuznets curve – a positive sign of GDP and a negative
sign for GDP2 are expected. The average enrolment ratio in secondary education (SECED)
for the 3 decades from Easterly (1999) and UNESCO (http://www.unesco.org/) is expected to
have a positive effect (i.e. a negative coefficient) on the income distribution whereas the
average population growth rate (POPGR) for the 3 decades from the Penn World Table 6.1.
should have a negative effect (i.e. a positive sign). Following the arguments developed by
the Globalization literature (see Reuveni and Li (2003) for an overwiev), trade is expected to
influence the income distribution, but the results are inconclusive. Reuveni and Li (2003)
found open countries to have a more equal income distribution. Therefore the average sum
of imports and exports as % of GDP (OPEN), average for the 1970s, 1980s and 1990s from
the Penn World Table 6.1., is included in the equation and expected to have a negative sign.
20
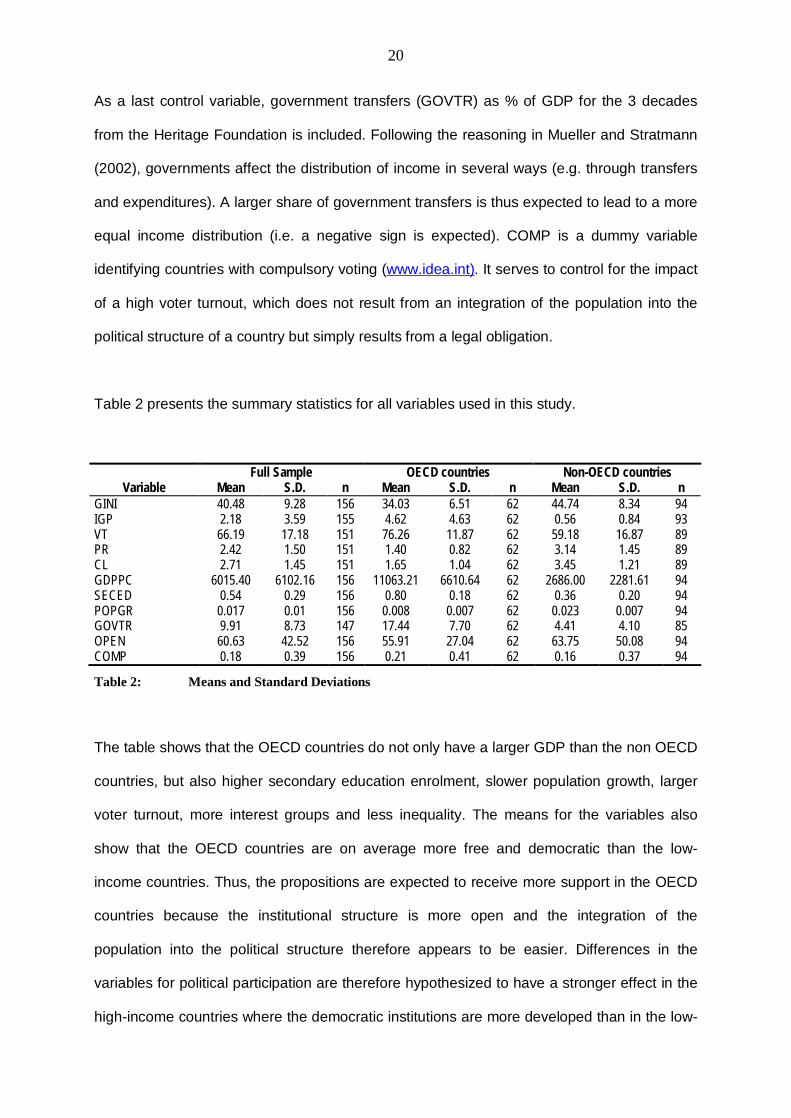
As a last control variable, government transfers (GOVTR) as % of GDP for the 3 decades
from the Heritage Foundation is included. Following the reasoning in Mueller and Stratmann
(2002), governments affect the distribution of income in several ways (e.g. through transfers
and expenditures). A larger share of government transfers is thus expected to lead to a more
equal income distribution (i.e. a negative sign is expected). COMP is a dummy variable
identifying countries with compulsory voting (www.idea.int). It serves to control for the impact
of a high voter turnout, which does not result from an integration of the population into the
political structure of a country but simply results from a legal obligation.
Table 2 presents the summary statistics for all variables used in this study.
Full Sample OECD countries Non-OECD countries Variable Mean S.D. n Mean S.D. n Mean S.D. n
GINI 40.48 9.28 156 34.03 6.51 62 44.74 8.34 94 IGP 2.18 3.59 155 4.62 4.63 62 0.56 0.84 93 VT 66.19 17.18 151 76.26 11.87 62 59.18 16.87 89 PR 2.42 1.50 151 1.40 0.82 62 3.14 1.45 89 CL 2.71 1.45 151 1.65 1.04 62 3.45 1.21 89 GDPPC 6015.40 6102.16 156 11063.21 6610.64 62 2686.00 2281.61 94 SECED 0.54 0.29 156 0.80 0.18 62 0.36 0.20 94 POPGR 0.017 0.01 156 0.008 0.007 62 0.023 0.007 94 GOVTR 9.91 8.73 147 17.44 7.70 62 4.41 4.10 85 OPEN 60.63 42.52 156 55.91 27.04 62 63.75 50.08 94 COMP 0.18 0.39 156 0.21 0.41 62 0.16 0.37 94
Table 2: Means and Standard Deviations
The table shows that the OECD countries do not only have a larger GDP than the non OECD
countries, but also higher secondary education enrolment, slower population growth, larger
voter turnout, more interest groups and less inequality. The means for the variables also
show that the OECD countries are on average more free and democratic than the low-
income countries. Thus, the propositions are expected to receive more support in the OECD
countries because the institutional structure is more open and the integration of the
population into the political structure therefore appears to be easier. Differences in the
variables for political participation are therefore hypothesized to have a stronger effect in the
high-income countries where the democratic institutions are more developed than in the low-
21
income countries. As an alternative to differentiating the sample between OECD and non
OECD countries, the sample is divided into “strong democratic” and “weak democratic”
countries according to the combined scores of the Freedom House index for political rights
and civil liberties (countries with a value of 2 and less are labelled “strong democratic”, the
others are termed “weak democratic”). This differentiation allows for a better separation of
democratic from non-democratic countries because it includes non OECD countries with a
long democratic tradition such as Costa Rica, Mauritius and India whereas OECD members
with a less democratic history such as Mexico, Turkey and South Korea are excluded. The
variables for political participation are expected to have a stronger effect on income
distribution in the “strong democratic” countries as compared to the “weak democratic”
countries.
5.2. Empirical Estimation and Results
The propositions will be tested empirically by using the following regression equation:
(1) GINI = α1 + α2VT + α3IGP + α4PR + α5CL + α6POPGR + α7GDPPC + α8 GDPPC2 +
α9SECED + α10OPEN + α11GOVTR +α12 COMP + ε
This specification follows the standards set in other income distribution studies (Kanbur
2000), where the income distribution is modelled as being linerarly dependent on different
exogenous variables such as the participation variables (voter turnout, interest groups),
institutional variables (openness of political institutions) and control variables (enrolment in
secondary education, population growth, GDP, trade openness and government transfers)
plus a dummy variable for compulsory voting.
This unbalanced panel is estimated using Least Squares regressions with fixed effects to
control for bias resulting from omitted variables which are constant over time. In the present
case of cross-country comparisons these fixed effects could account for historical and
cultural differences between the investigated countries. Heteroskedasticity is accounted for

22
by using White-type robust standard errors. Tables 3 to 5 show the regression results for
different specifications of equation 1 and different samples.
Variable Full Sample 1 2 3 4 5 6 7 Constant 45.41
(6.12)
46.87 (6.39)
41.13 (6.54)
42.00 (6.55)
39.74 (7.70)
41.22 (6.66)
42.38 (7.36)
IGP -0.41*** (-2.66)
-0.25** (-2.32)
-0.36** (-2.53)
-0.24** (-2.05)
-0.34** (-2.48)
VT -0.02 (-0.47)
-0.04 (-0.69)
-0.01 (-0.24)
-0.02 (-0.38)
-0.02 (-0.28)
PR -0.79 (-0.66)
-0.92 (-0.85)
-0.83 (-0.68)
CL -0.16 (-0.15)
-0.15 (-0.15)
0.14 (0.14)
SECED -12.68*** (-2.96)
-12.72*** (-3.08)
-12.20*** (-2.68)
-12.18*** (-2.74)
-12.94*** (-2.97)
-12.75*** (-2.84)
-13.29*** (-3.17)
POPGR 317.20** (2.53)
300.45** (2.45)
320.72** (2.40)
305.08** (2.31)
367.52*** (2.73)
348.29*** (2.72)
372.62*** (3.16)
GDPPC 0.0008 (1.15)
0.0007 (1.00)
0.001* (1.66)
0.001 (1.56)
0.001* (1.71)
0.001 (1.62)
0.0008 (1.17)
GDPPC2 -0.0001 (-1.28)
-0.0001 (-1.13)
-0.0001 (-1.63)
-0.0001 (-1.53)
-0.0001 (-1.61)
-0.0001 (-1.59)
-0.0001 (-1.25)
GOVTR -0.15 (-1.61)
-0.20** (-2.47)
-0.15 (-1.53)
-0.20** (-2.25)
-0.13 (-1.41)
-0.19** (-2.31)
-0.20** (-2.45)
OPEN 0.008 (0.64)
0.005 (0.33)
0.003 (0.20)
-0.001 (-0.06)
0.003 (0.20)
-0.002 (-0.14)
0.002 (0.17)
COMP 3.24** (2.09)
2.91* (1.83)
n 142 142 142 142 146 143 143
R2 adj. 0.49 0.51 0.49 0.50 0.52 0.48 0.48
T-statistics in parantheses: *** statistically significant on the 99%-level ** statistically significant on the 95%-level * statistically significant on the 90%-level
Table 3: Regression Results (dependent variable GINI, different specifications, full sample)
The coefficient of the interest group variable has a negative sign in all equations and is
statistically significant at least on the 95%-level. This result indicates that more interest
23
groups lead to less income inequality. The “participation and integration” aspect of interest
groups thus seems to be stronger than the “rent-seeking” aspect.
Voter turnout has the expected negative sign, indicating that a stronger voter turnout leads to
less inequality. However, the coefficient is not statistically significant. The coefficients of the
institutional variables PR und CL are not statistically significant and in most equations do not
have the expected positive sign. With the exception of the variable measuring openness
towards trade, all the other control variables have the expected signs and the coefficients of
the education and population growth variable have even strong statistical significance, which
is in line with the findings of other income distribution studies (Kanbur 2000). In addition,
government transfers are found to lead to lower income inequality (expected sign in all and
statistical significance in more than half of the equations).
In regressions 2 and 4, a dummy variable for identifying countries with compulsory voting
regimes was added. The coefficient has a statistically significant positive sign in both
equations indicating that countries with some sort of obligation to vote have a more unequal
income distribution. This finding is difficult to interpret, maybe even indicating that the
causality runs from the income distribution towards voting rules with unequal countries trying
to ensure that all parts of its diverse population take part at elections. The coefficient signs
and the t-values of the other variables in the equation do not significantly change in the
regression equations where compulsory voting is controlled for, indicating the robustness of
the other findings.
Overall, the regressions for the full sample are able to explain around 50 percent of the total
variation of the Gini coefficient through the variation of the independent variables, which is a
good result for models trying to explain the income distribution. Generally, the t-statistics and
the coefficients of determination are mostly satisfactory and heteroscedasticity is accounted
for. The problem of omitted variables is considered by estimating a model with fixed effects.
24
Variable OECD sample Non OECD sample 8 9 10 11 12 13 14 Constant 54.04
(7.62)
56.87 (7.65)
48.36 (7.34)
44.60 (12.16)
48.83 (7.49)
38.68 (4.10)
34.53 (4.30)
IGP -0.13* (-1.78)
-0.06 (-0.46)
-0.13* (-1.67)
-0.14* (-1.66)
0.88 (0.75)
1.32 (1.08)
VT -0.05 (-0.93)
-0.11 (-1.36)
-0.05 (-0.83)
-0.05 (-0.84)
-0.02 (-0.25)
-0.006 (-0.08)
PR 0.55 (0.47)
1.13 (0.75)
-1.51 (-1.37)
CL -1.37 (-1.52)
-1.68* (-1.74)
0.54 (0.43)
SECED -8.57* (-1.86)
-6.53 (-1.30)
-9.58** (-2.14)
-9.52** (-2.16)
-8.94** (-2.04)
-13.81** (-2.30)
-13.24* (-1.98)
POPGR 430.61*** (3.49)
390.36** (2.64)
423.76*** (3.66)
455.89*** (4.56)
442.26*** (3.80)
226.07 (1.46)
249.01 (1.52)
GDPPC -0.001* (-1.78)
-0.001* (-1.73)
-0.0006 (-1.06)
-0.0006 (-1.01)
-0.0008 (-1.32)
0.006*** (3.26)
0.006*** (3.65)
GDPPC2 0.0001* (1.71)
+
0.0001 (1.54)
0.00001 (0.85)
0.0001 (0.88)
0.0001 (0.99)
-0.00001*** (3.60)
0.00001*** (-3.73)
GOVTR 0.04 (0.35)
0.07 (0.57)
0.03 (0.26)
0.008 (0.08)
0.03 (0.35)
0.02 (0.07)
-0.05 (-0.23)
OPEN -0.03 (-1.19)
-0.04 (-1.32)
-0.02 (-0.89)
-0.03 (-1.05)
-0.03 (-1.46)
-0.006 (-0.43)
-0.01 (-1.08)
COMP 2.22 (1.39)
n 62 62 62 62 62 80 80
R2 adj. 0.68 0.69 0.68 0.69 0.69 0.19 0.16
T-statistics in parantheses: *** statistically significant on the 99%-level ** statistically significant on the 95%-level * statistically significant on the 90%-level
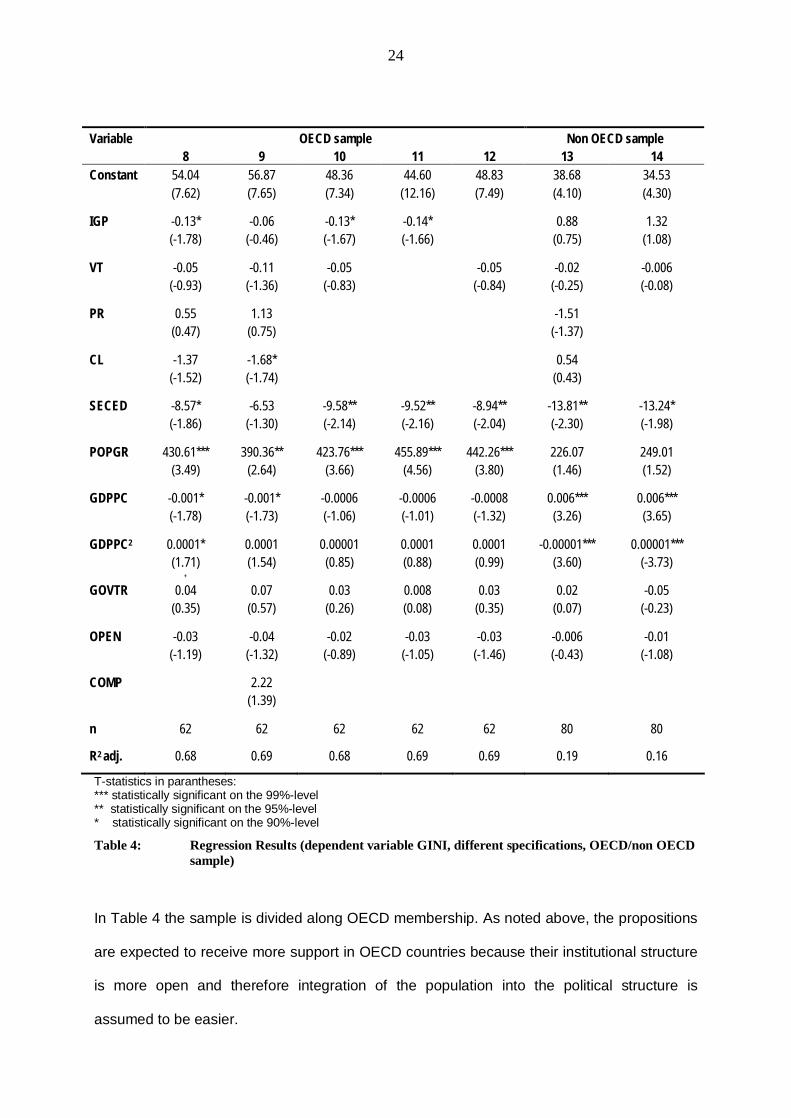
Table 4: Regression Results (dependent variable GINI, different specifications, OECD/non OECD sample)
In Table 4 the sample is divided along OECD membership. As noted above, the propositions
are expected to receive more support in OECD countries because their institutional structure
is more open and therefore integration of the population into the political structure is
assumed to be easier.
25
The results presented in Table 4 do not support this assumption. The participation variables
IGP and VT still have the expected sign, but the statistical significance of the IGP coefficients
are weaker than in the full sample. The coefficient of VT in the OECD and non OECD sample
is still not statistically significant. The other variables do not much differ from the results in
the full sample, with the exception of the variable measuring civil liberties, which has the
expected sign in both OECD equations and is even statistically significant on the 10%-level.
The degree of civil liberties thus has the hypothesized effect on the income distribution, with
more civil liberties (at least in the OECD countries) leading to less income inequality.
The separation of the sample into OECD and non OECD countries does not shed more light
into the relationship between institutions, participation and income distribution. The reasoning
behind this separation is, that the integration of the population should be easier in democratic
societies and that the democratic political process reacts with redistribution measures,
therefore the participation propositions were expected to receive more support in more
democratic countries. It is possible that this assumption holds nevertheless, as the division of
the sample might not be accurate enough. If we look at OECD members closely, we see that
there are countries such as Mexico, Turkey and South Korea which are not labelled as free
and democratic countries for the period 1970 to 1990. Other OECD members such as Spain,
Portugal and Greece got rid of their authoritarian regimes not until the middle of the 1970ies.
On the other hand, non OECD countries include countries with a long democratic tradition
such as India, Mauritius and Costa Rica.
To better account for the assumed differences of the impact of the participation variables on
the income distribution in democratic and non-democratic countries, the sample will now be
divided into “strong democratic” and “weak democratic” countries using the Freedom House
index. The results are presented in Table 5.
26
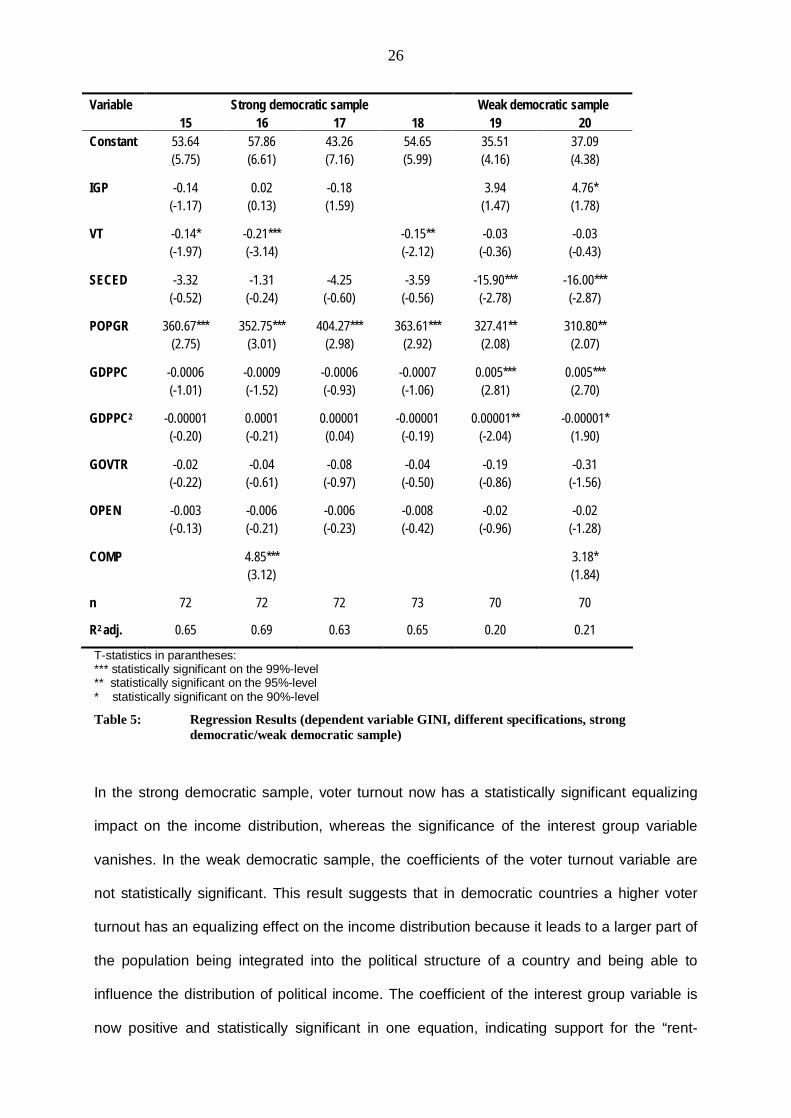
Variable Strong democratic sample Weak democratic sample 15 16 17 18 19 20 Constant 53.64
(5.75)
57.86 (6.61)
43.26 (7.16)
54.65 (5.99)
35.51 (4.16)
37.09 (4.38)
IGP -0.14 (-1.17)
0.02 (0.13)
-0.18 (1.59)
3.94 (1.47)
4.76* (1.78)
VT -0.14* (-1.97)
-0.21*** (-3.14)
-0.15** (-2.12)
-0.03 (-0.36)
-0.03 (-0.43)
SECED -3.32 (-0.52)
-1.31 (-0.24)
-4.25 (-0.60)
-3.59 (-0.56)
-15.90*** (-2.78)
-16.00*** (-2.87)
POPGR 360.67*** (2.75)
352.75*** (3.01)
404.27*** (2.98)
363.61*** (2.92)
327.41** (2.08)
310.80** (2.07)
GDPPC -0.0006 (-1.01)
-0.0009 (-1.52)
-0.0006 (-0.93)
-0.0007 (-1.06)
0.005*** (2.81)
0.005*** (2.70)
GDPPC2 -0.00001 (-0.20)
0.0001 (-0.21)
0.00001 (0.04)
-0.00001 (-0.19)
0.00001** (-2.04)
-0.00001* (1.90)
GOVTR -0.02 (-0.22)
-0.04 (-0.61)
-0.08 (-0.97)
-0.04 (-0.50)
-0.19 (-0.86)
-0.31 (-1.56)
OPEN -0.003 (-0.13)
-0.006 (-0.21)
-0.006 (-0.23)
-0.008 (-0.42)
-0.02 (-0.96)
-0.02 (-1.28)
COMP 4.85*** (3.12)
3.18* (1.84)
n 72 72 72 73 70 70
R2 adj. 0.65 0.69 0.63 0.65 0.20 0.21
T-statistics in parantheses: *** statistically significant on the 99%-level ** statistically significant on the 95%-level * statistically significant on the 90%-level
Table 5: Regression Results (dependent variable GINI, different specifications, strong democratic/weak democratic sample)
In the strong democratic sample, voter turnout now has a statistically significant equalizing
impact on the income distribution, whereas the significance of the interest group variable
vanishes. In the weak democratic sample, the coefficients of the voter turnout variable are
not statistically significant. This result suggests that in democratic countries a higher voter
turnout has an equalizing effect on the income distribution because it leads to a larger part of
the population being integrated into the political structure of a country and being able to
influence the distribution of political income. The coefficient of the interest group variable is
now positive and statistically significant in one equation, indicating support for the “rent-
27
seeking approach” in weakly democratic states. In weakly democratic/authoritarian states,
elections are often symbolic and do not influence the composition of the government or the
outcome of policies and therefore do not allow the population to influence the political income
distribution. The same seems to be true with regard to the organization of interest groups.
The results in general show that participation of the population constitutes a link between the
institutional structure of a country and the income distribution. Participation per se is more
important than the institutional structure in its effect on income distribution, but the
institutional structure influences the size of the effect of participation on income distribution. A
more democratic institutional structure of a country leads to a larger effect of political
participation on income distribution. The general results support Kuznets’ notion about the
importance of the working class’ integration into the political structure of a country as a
necessary condition for falling income inequality. The formation of interest groups such as
trade unions seems to have an important equalizing effect on the income distribution
because it integrates the population into the political structure and allows them to influence
the political income distribution. The results for the government transfers variable indicate
that the resulting government transfers have an equalizing effect on the income distribution.
So redistribution by the state seems to go from richer to poorer segments of the population.
In general, voter turnout seems to be less important than interest group formation for
integrating the population into the political structure and equalizing the income distribution.
However, in a strong democratic setting, voter turnout has a stronger effect on income
distribution because the institutional structure allows for the impact of voting on the political
income distribution.
28
6. Concluding Remarks
The results of this study show that democratic institutions, i.e. civil liberties and political
rights, alone are no guarantee for a more equal income distribution. Participation in the pure
political term seems to be more important in explaining income distribution differentials
across countries than institutional variables. The coefficient of the number of interest groups
was robust and almost always significant. The coefficient of voter turnout was robust and
significant in the strong democratic sample. Democratic participation in the form of being
organized through interest groups and to a lesser extent taking part in elections has an
equalizing effect on the income distribution. The effect of interest groups on the integration of
the population seems to be far stronger than the distortionary effect of interest groups
through redistribution to themselves. Even if the ability of forming interest groups is far more
unequally distributed in a society than resource endowments, the presence of interest groups
integrates the population into the political structure of a country and allows them to influence
the political income distribution. This influence leads to a variety of policy responses
(transfers, legislation etc.). As the political income distribution becomes more equal so does
the general income distribution.
The study presented here is one of only a few studies dealing with the institutional
determination of income distribution and the first to measure the impact of interest groups on
income distribution for a panel of countries. Further research on the topic of institutions and
income distribution could focus on a more detailed analysis of the underlying political process
and the interactions between groups and politicians regarding the political income
distribution, taking into account further factors such as the voting system (proportional or
majority voting probably), the political system (direct versus representative democracy) and
institutionally determined restrictions (the budget restriction, the administrative restriction and
so on).

29
7. References
Acemoglu, D., Robinson, J.A.: Why Did the West Extend the Franchise? Democracy, Inequality, and Growth in Historical Perspective, Quarterly Journal of Economics 115 (4), 2000, 1167-1199. Acemoglu, D., Robinson, J.A.: Inefficient Redistribution, American Political Science Review Vol 95 (3), 2001, 649-661. Acemoglu, D., Robinson, J.A.: The Political Economy of the Kuznets Curve, Review of Development Economics 6 (2), 2002, 183-203. Adelman, I., Morris, C.T.: Economic Growth and Social Equity in Developing Countries, Stanford 1973. Adelman, I., Robinson, S.: Income Distribution and Development, in: Chenery, H., Srinivasan, T.N.(eds.): Handbook of Development Economics, vol. 2, Amsterdam 1989, 949-1003. Ahluwalia, M.S.: Inequality, Poverty and Development, Journal of Development Economics 3, 1976, 307-342. Alesina, A., Perotti, R.: The Political Economy of Growth: A Critical Survey of the Recent Literature, World Bank Economic Review 8(3), 1994, 351-371. Alesina, A., Perotti, R.: Income Distribution, Political Instability, and Investment, European Economic Review 40, 1996, 1203-1228. Alesina, A., Rodrik, D.: Distributive Politics and Economic Growth, Quarterly Journal of Economics 109, 1994, 465-490. Anand, S., Kanbur, S.M.R.: The Kuznets Process and the Inequality-Development Relationship, Journal of Development Economics 40, 1993a, 25-52. Anand, S., Kanbur, S.M.R.: Inequality and Development: A Critique,Journal of Development Economics 41, 1993b, 19-43. Atkinson, A.B.: Bringing Income Distribution in from the Cold, Economic Journal 107, 1997, 291-321. Atkinson, A.B.: Income Inequality in OECD Countries: Data and Explanations, CESifo Working Paper 881, 2003. Atkinson, A.B., Bourgignon, F. (eds.): Handbook of Income Distribution, vol. 1, Handbooks in Economics 16, Amsterdam 2000. Austen-Smith, D.: Interest Groups: Money, Information, and Influence, in: Mueller, D.C. (ed.): Perspectives on Public Choice, Cambridge 1997, 296-321. Ayee, J.R.A.: Participation. Paper presented at DPMF and International IDEAs workshop “Democracy, Poverty and Social Exclusion: Is Democracy the Missing Link”, Addis Ababa 2000. Barro, R.J.: Economic Growth in a Cross Section of Countries, Quarterly Journal of Economics 106, 1991, 407-443. Barro, R.J.: Inequality and Growth in a Panel of Countries, Journal of Economic Growth 5, 2000, 5-32. Baum, M.A., Lake, D.A.: The Political Economy of Growth: Democracy and Human Capital, American Journal of Political Science 47(2), 2003, 333-347. Baur, M.: Political Institutions and Income Distribution, Dissertation, University of Vienna 2002. Beck, T., Clarke, G., Groff, A., Keefer, P., Walsh, P.: New Tools and New Tests in Comparative Political Economy: The Database of Political Institutions, Policy Research Working Paper 2283, World Bank 2000.
30
Becker, G.S.: A Theory of Competition Among Pressure Groups for Political Influence, Quarterly Journal of Economics 98(3), 1983, 371-400. Bénabou, R.: Inequality and Growth, in: Bernanke, B., Rotemberg, J. (eds.): NBER Macro Annual 1996, Cambridge 1996, 11-76. Bénabou, R.: Unequal Societies: Income Distribution and the Social Contract, American Economic Review, Vol 90 (1), 2000, 96-129. Bertola, G., Foellmi, R., Zweimüller, J.: Income Distribution in Macroeconomic Models, Princeton Oxford 2006. Birdsall, N., Londono, J.L.: Asset Inequality Matters: An Assessment of the World Bank’s Approach to Poverty Reduction, American Economic Review (Papers and Proceedings) 82(2), 1997, 32-37. Boadway, R., Keen, M.: Redistribution. In: Atkinson, A.B., Bourgignon, F. (eds.): Handbook of Income Distribution, vol. 1, Handbooks in Economics 16, Amsterdam 2000, 677-789. Bourgignon, F.: Crime as a Social Cost of Poverty and Inequality: A Review Focusing on Developing Countries, DELTA, Paris 1998. Bourgignon, F., Morrisson, C.: Income Distribution, Development, and Foreign Trade, European Economic Review 34, 1990, 1113-1132. Bourgignon, F.: The Poverty-Growth-Inequality Triangle, mimeo, World Bank 2004. Castello, A., Domenech, R.: Human Capital Inequality and Economic Growth: Some New Evidence, Economic Journal 112, 2002, 187-200. Chen, L.E.: Do Democracies Outperform Non-Democracies in Income Inequality? mimeo, University of California, Riverside 2006. Chenery, H., Ahluwalia, M.S., Bell, C.L.G., Duloy, J.H, Jolly, R. (eds.): Redistribution with Growth, Oxford 1974. Cline, W.R.: Distribution and Development: A Survey of Literature, Journal of Development Economics 1, 1975, 359-400. Coates, D., Heckelman, J.C.: Interest Groups and Investment: A Further Test of the Olson Hypothesis. Paper presented at the November 2000 Southern Economic Association meeting 2000. Coates, D., Heckelman, J.C., Wilson, B.: Special-Interest Groups and Growth, draft, July 2007. Cornia, G.A.: The Impact of Liberalisation and Globalisation on Income Inequality in Developing and Transitional Economies, CESifo Working Paper 843, 2003. Coughlin, P. J., Mueller, D.C., Murrell, P.: Electoral Politics, Interest Groups, and the Size of Government, Economic Inquiry 28, 1990, 682-705. Deininger, K., Squire, L.: A New Data Set Measuring Income Inequality, World Bank Economic Review 10(3), 1996, 565-591. Deininger, K., Squire, L.: New Ways of Looking at Old Issues, Journal of Development Economics 57, 1998, 259-287. Deininger, K., Olinto, P.: Asset Distribution, Inequality and Growth, World Bank Working Paper 2375, 2001. De la Croix, D., Doepke, M.: Inequality and Growth: Why Differential Fertility Matters, American Economic Review 93(4), 2003, 1091-1113.
31
Dell, F., Piketty, T., Saez, E.: Income and Wealth Concentration in Switzerland over the 20th Century, CEPR Discussion Paper 5090, 2005. Dixit, A.K., Londregan, J.: The Determinants of Success of Special Interests in Redistributive Politics, CEPR Discussion Paper 1054, 1994. Dreher, A., Gaston, N.: Has Globalisation Increased Inequality? KOF Working Paper 140, 2006. Easterly, W.: Life During Growth, Journal of Economic Growth 4, 1999, 239-275. Feld, L.P., Fischer, J.A.V., Kirchgässner, G.: The Effect of Direct Democracy on Income Redistribution: Evidence for Switzerland, mimeo 2006. Fields, G.S.: Measuring Inequality Change in an Economy with Income Growth, Journal of Development Economics 26, 1987, 357-374. Forbes, K.J.: A Reassessment of the Relationship Between Inequality and Growth, American Economic Review 90(4), 2000, 869-887. Frey, B.S.: Moderne Politische Ökonomie, München 1977. Frey, B.S.: Ökonomie ist Sozialwissenschaft, München 1990. Galor, O., Zeira, J.: Income Distribution and Macroeconomics, Review of Economic Studies 60, 1993, 35-52. Gillis, M., Perkins, D.H., Roemer, M., Snodgrass, D.R.: Economics of Development, New York London 1992. Glaeser, E.L.: Inequality, Discussion Paper 2078, Harvard Institute of Economic Research 2005. Gradstein, M., Milanovic, B., Ying, Y.: Democracy and Income Inequality: An Empirical Analysis, Working Paper 2561, World Bank 2001. Gradstein, M., Milanovic, B.: Does Liberté=Egalité? A Survey of the Empirical Links Between Democracy and Inequality with some Evidence on the Transition Economies, mimeo, World Bank 2000. Grossman, G., Helpman, E.: Electoral Competition and Special Interest Politics, NBER Working Paper 4877, 1994. Halperin, M.H., Siegle, J.T., Weinstein, M.M.: The Democracy Advantage: How Democracies Promote Prosperity and Peace, New York 2004. Josten, S.D., Truger, A.: Inequality, Politics and Economic Growth. Three Critical Questions on Politico-Economic Models of Growth and Distribution, Department of Economics Discussion Paper 3, University of the Federal Armed Forces, Hamburg 2003. Kamal, S.: The Democracy-Poverty Nexus: Summary on Issues of Participation. Paper presented at International IDEA 2000 Democracy Forum “Democracy and Poverty: A Missing Link?” Stockholm 2000. Kanbur, R.: Income Distribution and Development, in: Atkinson, A.B., Bourgignon, F. (eds.): Handbook of Income Distribution, vol. 1. Handbooks in Economics 16, Amsterdam 2000, 791-841. Kaufmann, D., Kraay, A., Zoido-Lobaton, P.: Governance Matters, Policy Research Working Paper 2196, World Bank 1999. Knack, S., Keefer, P.: Institutions and Economic Performance: Cross-Country Tests Using Alternative Institutional Measures, Economics and Politics 7(3), 1995, 207-227.
32
Knack, S., Keefer, P.: Polarization, Politics, and Property Rights: Links between Inequality and Growth, Policy Research Working Paper 2418, World Bank 2000. Kristov, L., Lindert, P., McClelland, R.: Pressure Groups and Redistribution, Journal of Public Economics 48, 1992, 135-163. Kuznets, S.: Economic Growth and Income Inequality, American Economic Review 45(1), 1955, 1-28. Meltzer, A., Richard, S.: A Rational Theory of the Size of Government, Journal of Economy 89, 1981, 914-927. Milesi-Ferreti, G., Perotti, R., Rostagno, M: Electoral Systems and the Composition of Public Spending, Quarterly Journal of Economics 117, 2002, 609-657. Mueller, D.C.: Public Choice III, Cambridge 2004. Mueller, D.C.: The Public Choice Approach to Politics, Aldershot 1993. Mueller, D.C.: Constitutional Public Choice, in: Mueller, D.C.(ed.): Perspectives on Public Choice, Cambridge 1997, 124-148. Mueller, D.C.(ed.): Perspectives on Public Choice, Cambridge 1997. Mueller, D.C., Murrell, P.: Interest Groups and the Size of Government, Public Choice 48, 1986, 125-145. Mueller, D.C., Tollison R.D., Willett, T.D.: On Equalizing the Distribution of Political Income, in: Mueller, D.C.: The Public Choice Approach to Politics, Aldershot 1993, 184-192. Mueller, D.C., Stratmann, T.: The Economic Effects of Democratic Participation, CESifo Working Paper 656. Munich 2002. Murphy, K.M., Shleifer, A., Vishni, R.: Income Distribution, Market Size, and Industrialization, Quarterly Journal of Economics 104, 1989, 537-564. Nee, V., Liedka, R.V.: Markets and Inequality in the Transition from State Socialism, in: Midlarsky, M.I. (ed.): Inequality, Democracy and Economic Development, Cambridge 1997, 202-224. Niedermayer, O., Westle, B. (eds.): Demokratie und Partizipation, Wiesbaden 2000. Norton, Philip (ed.): Parliaments and Pressure Groups in Western Europe, Vol. 2, London Portland 1999. Olson, M.: Aufstieg und Niedergang von Nationen, 2. Aufl., Tübingen 1991. Olson, M.: Die Logik des kollektiven Handelns, 3. Aufl., Tübingen 1992. Papanek, G.F., Kyn, O.: The Effect on Income Distribution of Development, the Growth Rate and Economic Strategy, Journal of Development Economics 23, 1986, 55-65. Paukert, F.: Income Distribution at Different Levels of Development: A Survey of Evidence, International Labour Review 108, 1973, 97-125. Perotti, R.: Income Distribution, Politics, and Growth, American Economic Review 82(2), 1992, 311-316. Perotti, R.: Political Equilibrium, Income Distribution, and Growth, Review of Economic Studies 60, 1993, 755-776. Perotti, R.: Growth, Income Distribution and Democracy: What the Data Say, Journal of Economic Growth 1, 1996, 149-187.
33
Persson, T., Tabellini, G.: Growth, Distribution and Politics, European Economic Review 36, 1992, 593-602. Persson, T., Tabellini, G.: Is Inequality Harmful for Growth? American Economic Review 84(3), 1994, 600-621. Persson, T., Tabellini, G: Political Economics: Explaining Economic Policy, Cambridge 2000. Persson, T., Tabellini, G: The Economic Effects of Constitutions: What Do the Data Say? Cambridge 2003. Piketty, T.: Income Inequality in France 1901-1998, Journal of Political Economy 111, 2003, 1004-1042. Piketty, T., Saez, E.: Income Inequality in the United States, 1913-1998, Quarterly Journal of Economics 118(1), 2003, 1-39. Pommerehne, W.W., Kirchgässner, G.: Neuere Ansätze zur Erklärung der langfristigen Entwicklung der Staatsausgaben: Ein Überblick, WiST 9, 1991, 451-457. Pourgerami, A.: The Political Economy of Development: A Cross-national Causality Test of Development-Democracy-Growth Hypothesis, Public Choice 58, 1988, 123-141. Pourgerami, A.: Authoritarian versus Nonauthoritarian Approaches to Economic Development: Update and Additional Evidence, Public Choice 74, 1992, 365-377. Przeworski, A., Limongi, F.: Political Regimes and Economic Growth, Journal of Economic Perspectives 7(3), 1993, 51-69. Przeworski, A., Limongi, F.: Political Regime and Economic Growth, in: Seligson, M.A., Passe-Smith, J.T. (eds.): Development and Underdevelopment: The Political Economy of Global Inequality, Boulder 2003, 435-448. Ram, R.: Economic Development and Income Inequality: Further Evidence on the U-Curve Hypothesis, World Development 16(11), 1988, 1371-1376. Reuveny, R., Li, Q.: Economic Openness, Democracy, and Income Distribution, Comparative Political Studies 36, 2003, 575-601. Rodriguez, F.: Inequality, Redistribution and Rent-Seeking, Economics & Politics Vol. 16 (3), 2004, 287-320. Saint Paul, G., Verdier, T.: Inequality, Redistribution and Growth: A Challenge to the Conventional Political Economy Approach, European Economic Review 40, 1996, 719-728. Scully, G.W.: Rights, Equity, and Economic Efficiency, Public Choice 68, 1991, 195-215. Scully, G.W.: Constitutional Environments and Economic Growth, Princeton 1992. Summers, R., Heston, A.: The Penn World Table (Mark 5): An Expanded Set of International Comparisons, 1950-1988, Quarterly Journal of Economics 106, 1991, 327- 368. Tollison, R.D.: Rent Seeking, in: Mueller, D.C. (ed.): Perspectives on Public Choice, Cambridge 1997, 506-525. Tullock, G.: Economics of Income Distribution, 2nd edition, Dordrecht 1997. UN (United Nations): Statistical Yearbook 2001, New York 2001. Venieris, Y.P., Gupta, D.K.: Income Distribution and Socio-political Instability as Determinants of Savings. A Cross-Sectional Model, Journal of Political Economy 94(4), 1986, 873-883.
34
Verdier, T.: Models of Political Economy of Growth: A Short Survey, European Economic Review 38, 1994, 757-763. Verdier, T.: Développments récents en économie politique de la croissance, Revue économique 50( 3), 1999, 489-497. Vieira da Cunha, P., Junho Pena, M.V.: The Limits and Merits of Participation, World Bank Policy Research Working Paper 1838, World Bank 1997. World Bank: The East Asian Miracle. Economic Growth and Public Policy, World Bank Policy Research Report, New York 1993. World Bank: World Development Report, Oxford 1999. World Bank: World Development Report, Oxford 2000. World Bank: World Development Report, Oxford 2001. World Guide to Trade Associations, Part 1 Europe, München 1973. World Guide to Trade Associations, Part 2 Africa, America, Asia, Oceania, München 1974. World Guide to Trade Associations, 3rd edition, München, New York, London, Paris 1985. World Guide to Trade Associations, Vol. I & II, 5th edition, München 1999.