Embed Size (px)
Citation preview
1
Political Repositioning
By Michael Tomz and Robert Van Houweling
Under advance contract, Princeton University Press
Detailed Synopsis
How do voters respond when politicians change positions over time? The answer is
fundamental to understanding candidate competition, election outcomes, and representation in
democracies. If voters react negatively to repositioning, they could deter leaders from adapting to
shifts in public opinion or the arrival of new policy-relevant information. The existence of
penalties for repositioning could also contribute to polarization and legislative gridlock. Elected
officials might not compromise with opponents out of concern that voters—including some who
actually agree with the content of the compromise—would punish them for veering from past
commitments. Finally, if voters held incumbents to past positions, even when such positions no
longer appealed to the median voter, challengers could win without taking centrist positions
themselves. Thus, punishing politicians for changing course could be detrimental to democracy.
Forgiving candidates for policy reversals would bring its own problems, however.
Without penalties for repositioning, politicians would have little incentive to speak honestly.
They could say almost anything during campaigns, knowing that voters would excuse them for
reneging on commitments. Under such circumstances voters would find it extremely difficult to
learn who represents their views. Advertisements, speeches, and policy manifestos would
amount to cheap talk, rather than reliable cues about the policies that candidates would pursue in
office. Thus, representative democracy may not function well unless voters apply at least some
penalties against politicians who deviate from their promises.
The theme of repositioning is not only central to democratic representation, but also
ubiquitous in U.S. political campaigns. When candidates change positions, competitors often
expose the inconsistency and try to exploit it for electoral advantage. During the 1992
presidential election, President George H.W. Bush drew fire for breaking his “read my lips: no
new taxes” pledge. In the 2004 presidential campaign, George W. Bush accused Senator John
Kerry of flip-flopping from supporting the Iraq war to opposing it. And in the 2012 presidential
race, Mitt Romney was ridiculed for repositioning on abortion and health care, while Barack
Obama faced criticism for his evolving views about gay marriage and Guantanamo Bay. To
understand how American democracy works, it is important to study when and how voters
respond to politicians who break their commitments.
Unfortunately, we have little evidence about the electoral impact of politicians changing
course. Although there is a building literature on the consequences of repositioning in party-
centered electoral systems (e.g. Adams, Clark, Ezrow, and Glasgow 2006; Adams, Ezrow and
Somer-Topcu 2011; Adams and Somer-Topcu 2009; Tavits 2007) our knowledge remains
particularly thin about the consequences of repositioning in candidate-centered electoral contexts
like the United States.
2
This lacuna persists, in part, due to the inherently strategic nature of repositioning. When
deciding which positions to advocate and whether to abandon old positions in favor of new ones,
candidates anticipate the reactions of their constituents. They shift course when doing so would
improve their electoral fortunes, but stand firm when audiences would react harshly to
repositioning. Historical data therefore suffer from selection bias; they reveal the consequences
of repositioning only in the specific circumstances when politicians thought repositioning would
be optimal. To gain a fuller understanding of repositioning, we need what previous researchers
have not developed: a way to study the consequences of repositioning in a wide range of
situations, including ones in which politicians might prefer not to change course.
We overcome the problem of selection bias by running a sequence of eight experiments,
which we embedded in public opinion surveys and administered to nationally representative
samples of U.S. adults. The total sample size across all eight experiments was 27,374. In each
experiment, we described politicians who had taken positions on major public policy issues. By
randomizing information about what the politicians had said in the past and were advocating
now, and then measuring people’s perceptions and opinions of the politicians, we were able to
see how voters respond to repositioning, while avoiding problems of selection bias that have
hampered previous research.
The book has three parts. In Part I, we develop and test a theory of political repositioning.
For decades, scholars have argued that voters evaluate politicians on two dimensions: policy and
character. We argue that repositioning affects how voters perceive both dimensions. In
particular, we hypothesize that voters draw negative inferences about the character of politicians
who change positions. We also hypothesize that voters will “discount” new positions that
contradict previous ones; that is, voters will not give a candidate full credit for his new position.
These two effects create incentives for politicians to stand firm, even when the public would
prefer a different policy outcome. Finally, our model generates the surprising prediction that
members of the “issue public” (people who regard an issue as important to them personally) will
punish repositioning on that issue less than other types of voters. Thus, the costs of repositioning
should fall, not rise, with issue importance.
In Part I we not only develop a theory of repositioning, but also present the first in a
series of empirical tests. The evidence in Part I comes from a large-scale experiment about
federal tax policy. We asked 5,447 adults to evaluate politicians who varied randomly in what
they had said about taxes on people who make more than $250,000 per year. Some politicians in
our experiment had shifted positions on the issue, whereas others had not. As predicted,
repositioning strongly affected public perceptions about both character and policy. Moreover,
candidates who repositioned performed worse, on average, than candidates who stood firm.
Finally, we identify the optimal strategies that candidates should pursue against various types of
opponents. Our analysis leads to an ironic conclusion: by reacting negatively to repositioning,
the electorate deters office holders from representing its views when they change.
In Part II, we examine whether the effects of repositioning vary across issues or depend
on the party affiliations of candidates. Our analysis, based on a series of experiments about
abortion and taxes, supports several surprising conclusions. First, voters react to repositioning on
moral issues such as abortion in much the same way as they respond to repositioning on more
pragmatic issues, such as taxes. Second, the effects of repositioning are not confined to a single
issue. Instead, repositioning on one issue undermines the candidate’s credibility on other issues,
a process we call “reputational spillover.” Third, as predicted by our model, members of the
issue public are substantially more tolerant of repositioning than other types of voters. Finally,
3
the party affiliations of candidates can moderate the effects of repositioning. On the issue of
taxes, for example, voters will respond more negatively to repositioning by members of the
opposition party than by candidates from their own party, and will punish Democratic candidates
more than Republican ones.
In Part III, we introduce an original and comprehensive database of 361 U.S. presidential
debates and use it to study how repositioning has been discussed in political campaigns. We
identify strategies that political actors use in their attempts to heighten or dampen the effects of
repositioning. In particular, we observe how politicians have used rhetoric to criticize, deny, or
excuse changes in position. We also document the prevalence of strategic ambiguity: the
tendency for candidates to remain vague about their policy positions instead of getting pinned to
clear positions they might regret at a later date. Finally, by monitoring how the content of
debates has changed over time, we note the rise of political pledges, such as the “no new taxes
pledge.” By forcing politicians to clarify their positions and by reducing the potential for
deniability, pledges could affect the viability of a strategy of ambiguity as well as the cost of
repositioning.
After documenting these strategies historically, we study them experimentally. Our
experiments about rhetoric, ambiguity, and pledges support three conclusions. First, candidates
typically cannot use rhetoric to erase the costs of repositioning. Second, voters generally do not
punish candidates for being vague, and in partisan elections voters actually prefer ambiguous
candidates over precise ones. The reason, we find, is that ambiguity allows voters to “see what
they want to see” in members of their own party. This discovery implies that ambiguity offers a
double benefit: it can help candidates increase their vote share (at least among co-partisans) in
the short run, while also providing some protection against charges of flip-flopping in the longer
run. Finally, our experiments show that pledges are extremely effective at tying the hands of
politicians. Pledges bind not because interest groups act as enforcers, but because voters dislike
repositioning and punish candidates for breaking pledges. In summary, Part III identifies the
power and limitations of strategies that political actors use to manipulate the costs of
repositioning.
The book concludes by discussing the implications of our findings for elections, political
representation, polarization, and the health of democracy in the United States. In the remainder
of this prospectus, we describe each chapter in detail.
4
CONTENTS
PART I: UNDERSTANDING AND ESTIMATING THE EFFECTS OF REPOSITIONING
Chapter 1: Introduction
Chapter 2: A Theory of Repositioning
Chapter 3: The Effect of Repositioning on Perceptions
Chapter 4: The Effect of Repositioning on Voting
PART II: THE ROLE OF ISSUES AND PARTIES IN REPOSITIONING
Chapter 5: The Effects of Issue Type and Issue Importance
Chapter 6: The Effects of Political Parties
PART III: STRATEGIES FOR ALTERING RESPONSES TO REPOSITIONING
Chapter 7: Debating Repositioning
Chapter 8: Explanation and Accusation
Chapter 9: Strategic Ambiguity
Chapter 10: Policy Pledges
Chapter 11: 2012 and Beyond
5
PART I: UNDERSTANDING AND ESTIMATING THE EFFECTS OF REPOSITIONING
CHAPTER 1: INTRODUCTION
This chapter introduces readers to the question of how voters respond to repositioning, and
explains why this topic is central for understanding both campaigns and representation. We
discuss the obstacles that have impeded previous research; describe how we use experiments to
overcome those obstacles; summarize the main findings from our research; and present a
roadmap for the remaining chapters.
CHAPTER 2: A THEORY OF REPOSITIONING
For decades, scholars have argued that voters evaluate politicians on two dimensions: policy and
character. An enormous literature, originating with Downs (1957), posits that citizens prefer
politicians whose policy positions are closest to their own. Research has also shown that voters
value politicians with good personality attributes, such as integrity and competence (Stokes
1963; Kinder et al. 1980).
We argue that policy histories affect both types of considerations. A policy history, in our
terminology, is the sequence of positions that a politician has endorsed over time. Politicians
express their views by making statements, issuing press releases, drafting legislation, and voting
on bills. In some cases, new positions will differ from previous ones. By changing positions,
candidates change how voters perceive both character and policy.
First, we hypothesize that voters draw negative inferences about the character of
politicians who change positions. Some might view repositioners as dissemblers who would say
anything to get elected. Others might perceive repostioners as ignorant—as politicians who take
different positions at different times because they do not understand policy issues. Still others
might view backtrackers as weak leaders who lack the competence to make decisions and/or the
backbone to defend their views. We further expect that voters will draw worse inferences about
character when candidates adopt new stances on moral issues than when they reposition on
relatively pragmatic ones (see Tavits 2007).
Of course, some voters may see virtues such as flexibility and open-mindedness in
politicians who change positions. Nonetheless, we anticipate that, on balance, voters will draw
negative conclusions about the character of politicians who change positions. This hypothesis
has important implications. By taking positions, politicians expose themselves to potential
costs—in the form of negative perceptions about character, leading to fewer votes on Election
Day—if they subsequently reposition. Thus, we argue that candidates have an electoral incentive
to remain true to their past statements.
Second, we hypothesize that voters will “discount” new positions that contradict previous
ones. When a candidate abandons an unpopular position in favor of a popular one, many voters
will doubt that the candidate would follow through if elected. Some will expect the candidate to
pursue his old policy; others will conclude that the candidate’s true intention lies somewhere
between his old position and his new one. The tendency to discount new policy pronouncements
instead of taking them at face value creates an additional deterrent to repositioning. Candidates
may decide not to shift toward the preferences of the electoral majority, not only because
6
repositioning would trigger negative inferences about character, but also because they would not
get full credit for the new position.
The overall response to repositioning depends on the relative weight that voters attach to
character versus policy. Our model implies that members of the “issue public” (people who
regard an issue as important to them personally) will punish repositioning on that issue less than
other types of voters. At one extreme, people who care deeply about the issue will attach heavy
weight to policy proximity, instead of letting perceptions of character overwhelm their votes. At
the other extreme, voters who care little about the issue will choose mainly on the basis of
character, which is adversely affected by repositioning. Thus, the costs of repositioning should
fall, not rise, with issue importance. This prediction helps explain why candidates might be
especially willing to reposition on issues that are important to their electoral base.
We now summarize our predictions. If voters ignored the past, candidates might feel free
to espouse whatever policy was most popular or efficacious. In actual politics, though, we argue
that voters will draw negative conclusions about the character of candidates who change
positions, and voters will discount new commitments that contradict previous ones. Candidates
may, therefore, find it optimal to keep old positions instead of responding to shifts in public
opinion or the arrival of new policy-relevant knowledge. The incentive to stick with outmoded
positions will be especially powerful when the “issue public” is small.
CHAPTER 3: THE EFFECT OF REPOSITIONING ON PERCEPTIONS
In this chapter, we offer an initial test of our hypotheses about how voters respond to
repositioning. Our analysis draws on a unique experiment, which we administered to a
representative sample of 5,447 U.S. adults.
The experiment, which focused on U.S. tax rates, involved four steps. First, we measured
each voter’s policy preferences by asking whether the government should increase, keep the
same, or decrease taxes on wealthy Americans. Second, we described two anonymous candidates
who varied randomly in what they said about the issue two years ago and this year. With three
options per time period, each candidate could have one of nine policy histories. There were,
therefore, 9C2 = 36 combinations of candidates with different histories. We randomly presented
one combination to each voter, randomly labeled one candidate as 𝐴 and the other as 𝐵, and
asked which candidate the voter preferred. Third, we measured expectations about which tax
policy each candidate would pursue if elected. Finally, we invited respondents to evaluate each
candidate on one trait—strong leader, knowledgeable, honest, moral, or open-minded—which
was selected at random.
The experiment was fielded by Knowledge Networks, an Internet-based polling firm.
Knowledge Networks uses random digit dialing to recruit panelists and provides Internet access
to households that do not already have it. Studies have shown that data from Knowledge
Networks surveys are typically more representative than data from telephone surveys and non-
probability Internet samples (Chang and Krosnick 2009).
This chapter summarizes our findings about how repositioning affects perceptions of a
candidate’s character and policy preferences.
7
Finding 1: Repositioning changes voter perceptions about character.
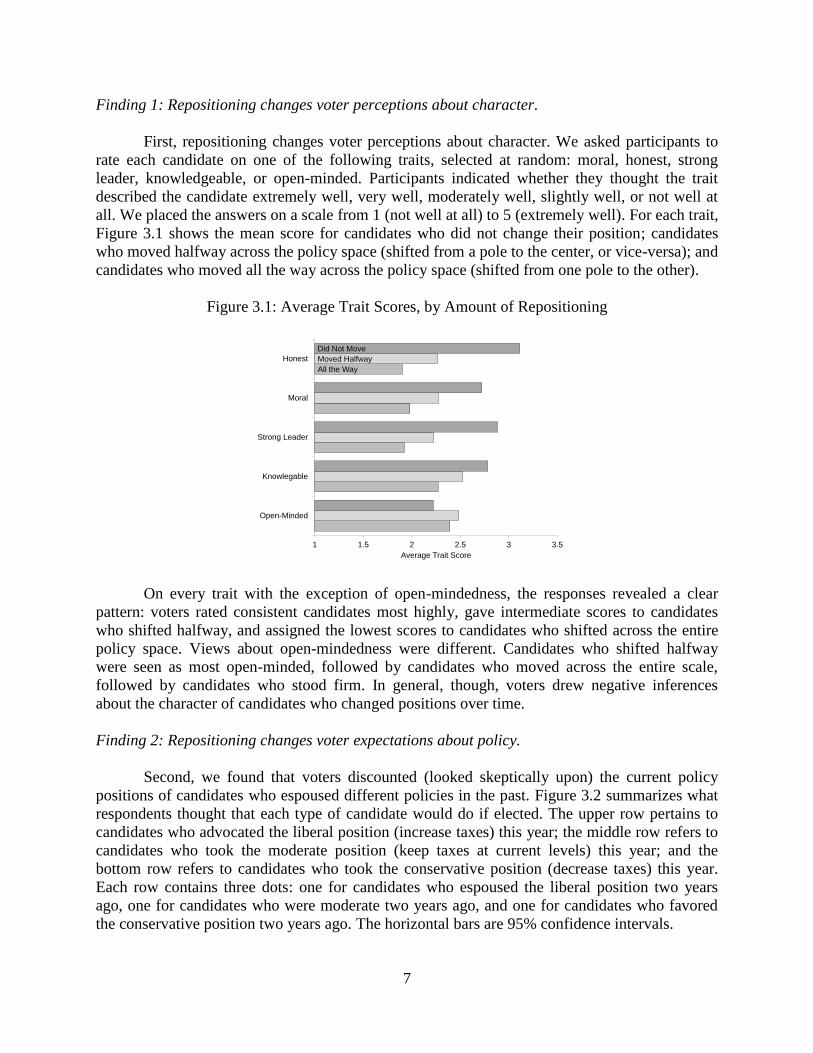
First, repositioning changes voter perceptions about character. We asked participants to
rate each candidate on one of the following traits, selected at random: moral, honest, strong
leader, knowledgeable, or open-minded. Participants indicated whether they thought the trait
described the candidate extremely well, very well, moderately well, slightly well, or not well at
all. We placed the answers on a scale from 1 (not well at all) to 5 (extremely well). For each trait,
Figure 3.1 shows the mean score for candidates who did not change their position; candidates
who moved halfway across the policy space (shifted from a pole to the center, or vice-versa); and
candidates who moved all the way across the policy space (shifted from one pole to the other).
Figure 3.1: Average Trait Scores, by Amount of Repositioning
On every trait with the exception of open-mindedness, the responses revealed a clear
pattern: voters rated consistent candidates most highly, gave intermediate scores to candidates
who shifted halfway, and assigned the lowest scores to candidates who shifted across the entire
policy space. Views about open-mindedness were different. Candidates who shifted halfway
were seen as most open-minded, followed by candidates who moved across the entire scale,
followed by candidates who stood firm. In general, though, voters drew negative inferences
about the character of candidates who changed positions over time.
Finding 2: Repositioning changes voter expectations about policy.
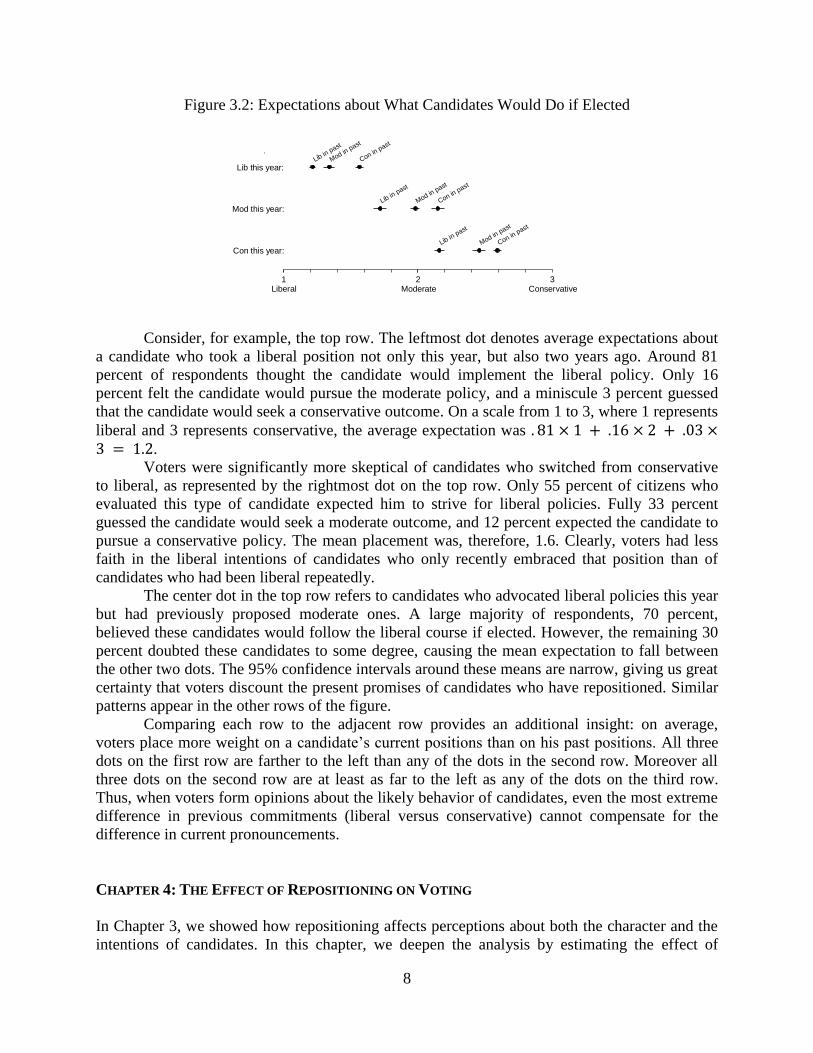
Second, we found that voters discounted (looked skeptically upon) the current policy
positions of candidates who espoused different policies in the past. Figure 3.2 summarizes what
respondents thought that each type of candidate would do if elected. The upper row pertains to
candidates who advocated the liberal position (increase taxes) this year; the middle row refers to
candidates who took the moderate position (keep taxes at current levels) this year; and the
bottom row refers to candidates who took the conservative position (decrease taxes) this year.
Each row contains three dots: one for candidates who espoused the liberal position two years
ago, one for candidates who were moderate two years ago, and one for candidates who favored
the conservative position two years ago. The horizontal bars are 95% confidence intervals.
All the Way
Moved Halfway
Did Not Move
1 1.5 2 2.5 3 3.5
Open-Minded
Knowlegable
Strong Leader
Moral
Honest
Average Trait Score
8
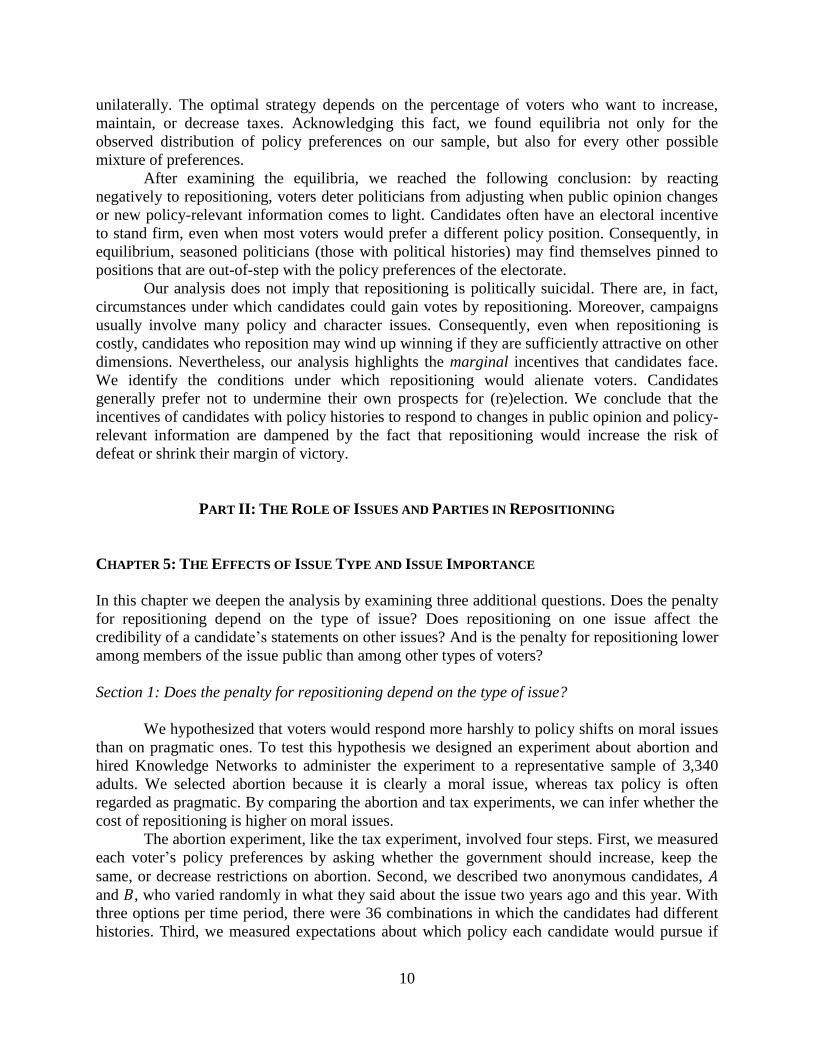
Figure 3.2: Expectations about What Candidates Would Do if Elected
Consider, for example, the top row. The leftmost dot denotes average expectations about
a candidate who took a liberal position not only this year, but also two years ago. Around 81
percent of respondents thought the candidate would implement the liberal policy. Only 16
percent felt the candidate would pursue the moderate policy, and a miniscule 3 percent guessed
that the candidate would seek a conservative outcome. On a scale from 1 to 3, where 1 represents
liberal and 3 represents conservative, the average expectation was . 81 × 1 + .16 × 2 + .03 ×3 = 1.2.
Voters were significantly more skeptical of candidates who switched from conservative
to liberal, as represented by the rightmost dot on the top row. Only 55 percent of citizens who
evaluated this type of candidate expected him to strive for liberal policies. Fully 33 percent
guessed the candidate would seek a moderate outcome, and 12 percent expected the candidate to
pursue a conservative policy. The mean placement was, therefore, 1.6. Clearly, voters had less
faith in the liberal intentions of candidates who only recently embraced that position than of
candidates who had been liberal repeatedly.
The center dot in the top row refers to candidates who advocated liberal policies this year
but had previously proposed moderate ones. A large majority of respondents, 70 percent,
believed these candidates would follow the liberal course if elected. However, the remaining 30
percent doubted these candidates to some degree, causing the mean expectation to fall between
the other two dots. The 95% confidence intervals around these means are narrow, giving us great
certainty that voters discount the present promises of candidates who have repositioned. Similar
patterns appear in the other rows of the figure.
Comparing each row to the adjacent row provides an additional insight: on average,
voters place more weight on a candidate’s current positions than on his past positions. All three
dots on the first row are farther to the left than any of the dots in the second row. Moreover all
three dots on the second row are at least as far to the left as any of the dots on the third row.
Thus, when voters form opinions about the likely behavior of candidates, even the most extreme
difference in previous commitments (liberal versus conservative) cannot compensate for the
difference in current pronouncements.
CHAPTER 4: THE EFFECT OF REPOSITIONING ON VOTING
In Chapter 3, we showed how repositioning affects perceptions about both the character and the
intentions of candidates. In this chapter, we deepen the analysis by estimating the effect of
Lib in past
Mod in past
Con in past
Lib in past
Mod in past
Con in past
Lib in past
Mod in past
Con in past
Lib this year:
Mod this year:
Con this year:
Liberal Moderate Conservative1 2 3
9
repositioning on voting. We quantify the electoral costs of repositioning and discuss its
implications for campaigns and representation.
Finding 1: Repositioning is costly on average.
Using data from the taxes experiment that was introduced in Chapter 3, we found that
repositioning is costly on average. To estimate the cost of repositioning, we considered the
following counterfactual: how much better would a candidate have done on average, against all
possible opponents, if he been consistent instead of repositioning? There are two distinct but
related ways of thinking about this counterfactual. How much more support would the candidate
have received if he had stayed with his original position, instead of moving to a new one?
Alternatively, how much more support would the candidate have received if he had always
expressed his current position, instead of shifting to arrive there? We show that these two
counterfactuals are equivalent on average, and can be estimated by computing the mean support
for consistent candidates against all possible opponents, and subtracting the mean support for
inconsistent candidates against all possible opponents.
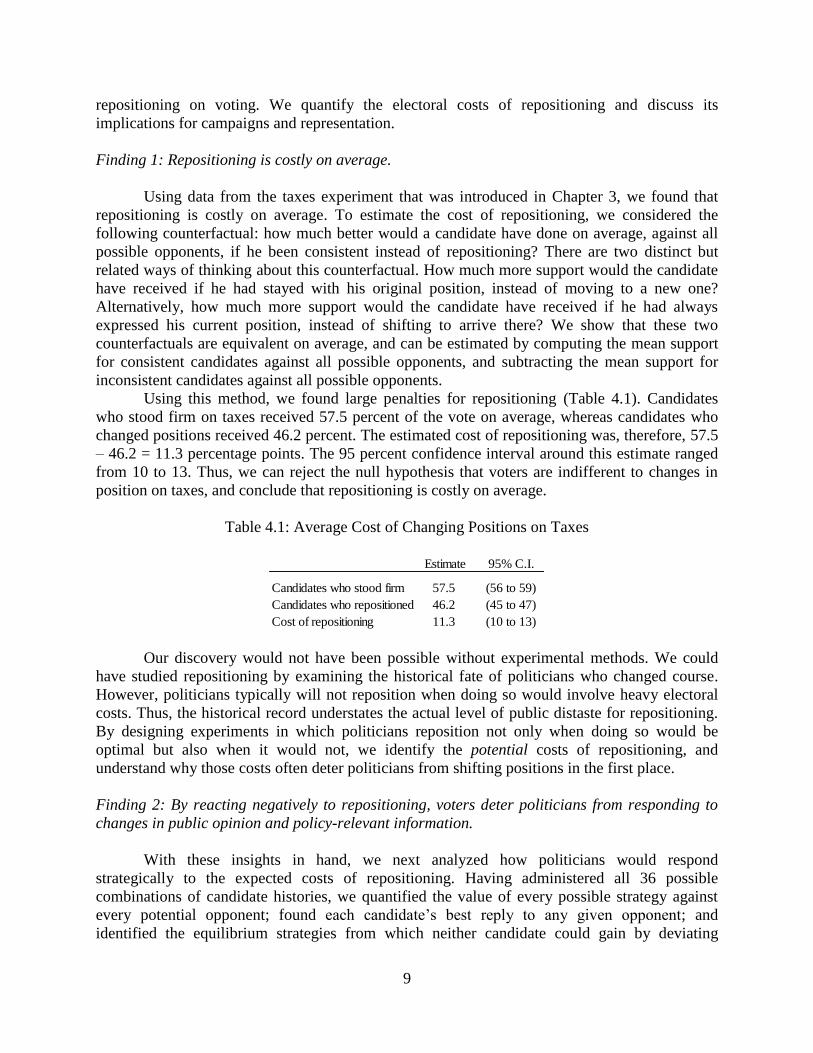
Using this method, we found large penalties for repositioning (Table 4.1). Candidates
who stood firm on taxes received 57.5 percent of the vote on average, whereas candidates who
changed positions received 46.2 percent. The estimated cost of repositioning was, therefore, 57.5
– 46.2 = 11.3 percentage points. The 95 percent confidence interval around this estimate ranged
from 10 to 13. Thus, we can reject the null hypothesis that voters are indifferent to changes in
position on taxes, and conclude that repositioning is costly on average.
Table 4.1: Average Cost of Changing Positions on Taxes
Our discovery would not have been possible without experimental methods. We could
have studied repositioning by examining the historical fate of politicians who changed course.
However, politicians typically will not reposition when doing so would involve heavy electoral
costs. Thus, the historical record understates the actual level of public distaste for repositioning.
By designing experiments in which politicians reposition not only when doing so would be
optimal but also when it would not, we identify the potential costs of repositioning, and
understand why those costs often deter politicians from shifting positions in the first place.
Finding 2: By reacting negatively to repositioning, voters deter politicians from responding to
changes in public opinion and policy-relevant information.
With these insights in hand, we next analyzed how politicians would respond
strategically to the expected costs of repositioning. Having administered all 36 possible
combinations of candidate histories, we quantified the value of every possible strategy against
every potential opponent; found each candidate’s best reply to any given opponent; and
identified the equilibrium strategies from which neither candidate could gain by deviating
95% C.I.
Candidates who stood firm 57.5 (56 to 59)
Candidates who repositioned 46.2 (45 to 47)
Cost of repositioning 11.3 (10 to 13)
Estimate
10
unilaterally. The optimal strategy depends on the percentage of voters who want to increase,
maintain, or decrease taxes. Acknowledging this fact, we found equilibria not only for the
observed distribution of policy preferences on our sample, but also for every other possible
mixture of preferences.
After examining the equilibria, we reached the following conclusion: by reacting
negatively to repositioning, voters deter politicians from adjusting when public opinion changes
or new policy-relevant information comes to light. Candidates often have an electoral incentive
to stand firm, even when most voters would prefer a different policy position. Consequently, in
equilibrium, seasoned politicians (those with political histories) may find themselves pinned to
positions that are out-of-step with the policy preferences of the electorate.
Our analysis does not imply that repositioning is politically suicidal. There are, in fact,
circumstances under which candidates could gain votes by repositioning. Moreover, campaigns
usually involve many policy and character issues. Consequently, even when repositioning is
costly, candidates who reposition may wind up winning if they are sufficiently attractive on other
dimensions. Nevertheless, our analysis highlights the marginal incentives that candidates face.
We identify the conditions under which repositioning would alienate voters. Candidates
generally prefer not to undermine their own prospects for (re)election. We conclude that the
incentives of candidates with policy histories to respond to changes in public opinion and policy-
relevant information are dampened by the fact that repositioning would increase the risk of
defeat or shrink their margin of victory.
PART II: THE ROLE OF ISSUES AND PARTIES IN REPOSITIONING
CHAPTER 5: THE EFFECTS OF ISSUE TYPE AND ISSUE IMPORTANCE
In this chapter we deepen the analysis by examining three additional questions. Does the penalty
for repositioning depend on the type of issue? Does repositioning on one issue affect the
credibility of a candidate’s statements on other issues? And is the penalty for repositioning lower
among members of the issue public than among other types of voters?
Section 1: Does the penalty for repositioning depend on the type of issue?
We hypothesized that voters would respond more harshly to policy shifts on moral issues
than on pragmatic ones. To test this hypothesis we designed an experiment about abortion and
hired Knowledge Networks to administer the experiment to a representative sample of 3,340
adults. We selected abortion because it is clearly a moral issue, whereas tax policy is often
regarded as pragmatic. By comparing the abortion and tax experiments, we can infer whether the
cost of repositioning is higher on moral issues.
The abortion experiment, like the tax experiment, involved four steps. First, we measured
each voter’s policy preferences by asking whether the government should increase, keep the
same, or decrease restrictions on abortion. Second, we described two anonymous candidates, 𝐴
and 𝐵, who varied randomly in what they said about the issue two years ago and this year. With
three options per time period, there were 36 combinations in which the candidates had different
histories. Third, we measured expectations about which policy each candidate would pursue if
11
elected. Finally, we asked respondents to evaluate each candidate on one trait, which we
presented at random.
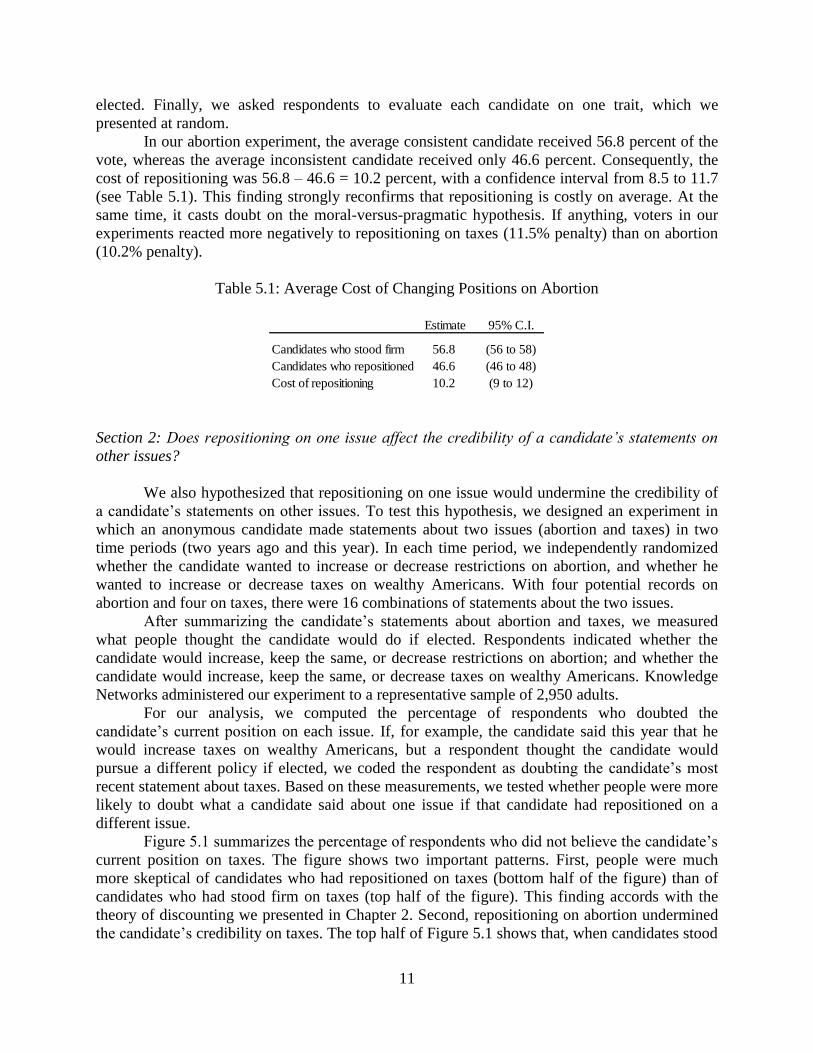
In our abortion experiment, the average consistent candidate received 56.8 percent of the
vote, whereas the average inconsistent candidate received only 46.6 percent. Consequently, the
cost of repositioning was 56.8 – 46.6 = 10.2 percent, with a confidence interval from 8.5 to 11.7
(see Table 5.1). This finding strongly reconfirms that repositioning is costly on average. At the
same time, it casts doubt on the moral-versus-pragmatic hypothesis. If anything, voters in our
experiments reacted more negatively to repositioning on taxes (11.5% penalty) than on abortion
(10.2% penalty).
Table 5.1: Average Cost of Changing Positions on Abortion
Section 2: Does repositioning on one issue affect the credibility of a candidate’s statements on
other issues?
We also hypothesized that repositioning on one issue would undermine the credibility of
a candidate’s statements on other issues. To test this hypothesis, we designed an experiment in
which an anonymous candidate made statements about two issues (abortion and taxes) in two
time periods (two years ago and this year). In each time period, we independently randomized
whether the candidate wanted to increase or decrease restrictions on abortion, and whether he
wanted to increase or decrease taxes on wealthy Americans. With four potential records on
abortion and four on taxes, there were 16 combinations of statements about the two issues.
After summarizing the candidate’s statements about abortion and taxes, we measured
what people thought the candidate would do if elected. Respondents indicated whether the
candidate would increase, keep the same, or decrease restrictions on abortion; and whether the
candidate would increase, keep the same, or decrease taxes on wealthy Americans. Knowledge
Networks administered our experiment to a representative sample of 2,950 adults.
For our analysis, we computed the percentage of respondents who doubted the
candidate’s current position on each issue. If, for example, the candidate said this year that he
would increase taxes on wealthy Americans, but a respondent thought the candidate would
pursue a different policy if elected, we coded the respondent as doubting the candidate’s most
recent statement about taxes. Based on these measurements, we tested whether people were more
likely to doubt what a candidate said about one issue if that candidate had repositioned on a
different issue.
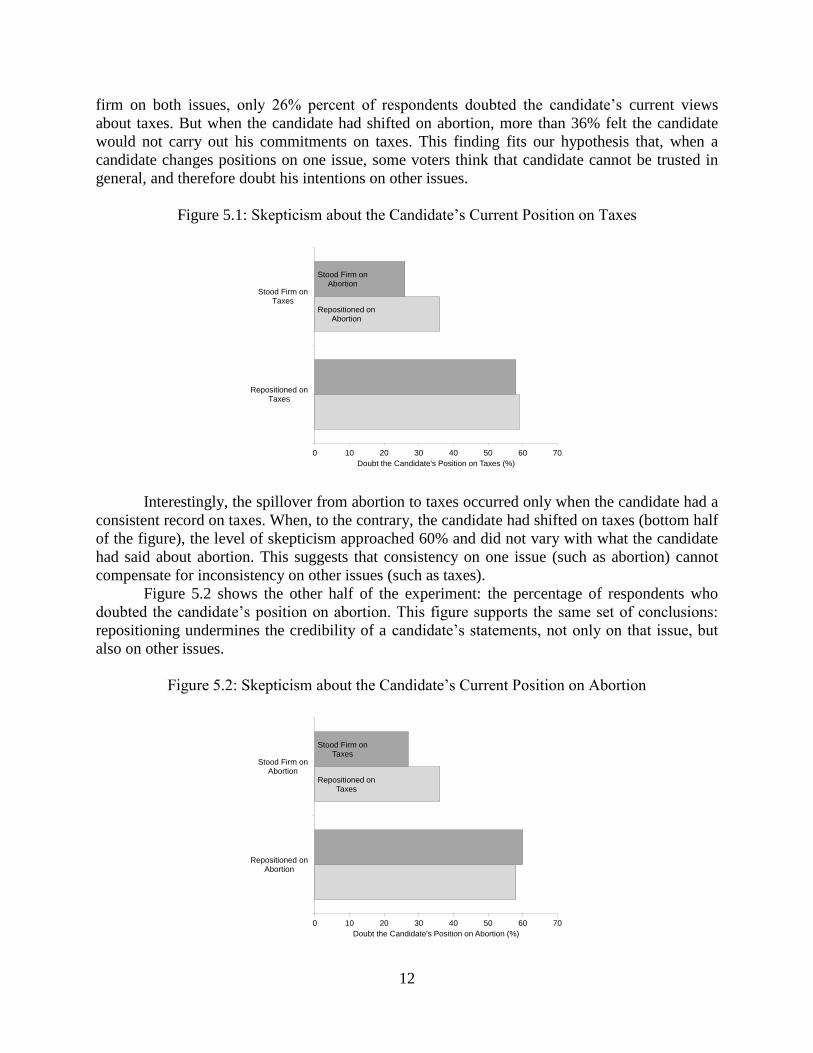
Figure 5.1 summarizes the percentage of respondents who did not believe the candidate’s
current position on taxes. The figure shows two important patterns. First, people were much
more skeptical of candidates who had repositioned on taxes (bottom half of the figure) than of
candidates who had stood firm on taxes (top half of the figure). This finding accords with the
theory of discounting we presented in Chapter 2. Second, repositioning on abortion undermined
the candidate’s credibility on taxes. The top half of Figure 5.1 shows that, when candidates stood
95% C.I.
Candidates who stood firm 56.8 (56 to 58)
Candidates who repositioned 46.6 (46 to 48)
Cost of repositioning 10.2 (9 to 12)
Estimate
12
firm on both issues, only 26% percent of respondents doubted the candidate’s current views
about taxes. But when the candidate had shifted on abortion, more than 36% felt the candidate
would not carry out his commitments on taxes. This finding fits our hypothesis that, when a
candidate changes positions on one issue, some voters think that candidate cannot be trusted in
general, and therefore doubt his intentions on other issues.
Figure 5.1: Skepticism about the Candidate’s Current Position on Taxes
Interestingly, the spillover from abortion to taxes occurred only when the candidate had a
consistent record on taxes. When, to the contrary, the candidate had shifted on taxes (bottom half
of the figure), the level of skepticism approached 60% and did not vary with what the candidate
had said about abortion. This suggests that consistency on one issue (such as abortion) cannot
compensate for inconsistency on other issues (such as taxes).
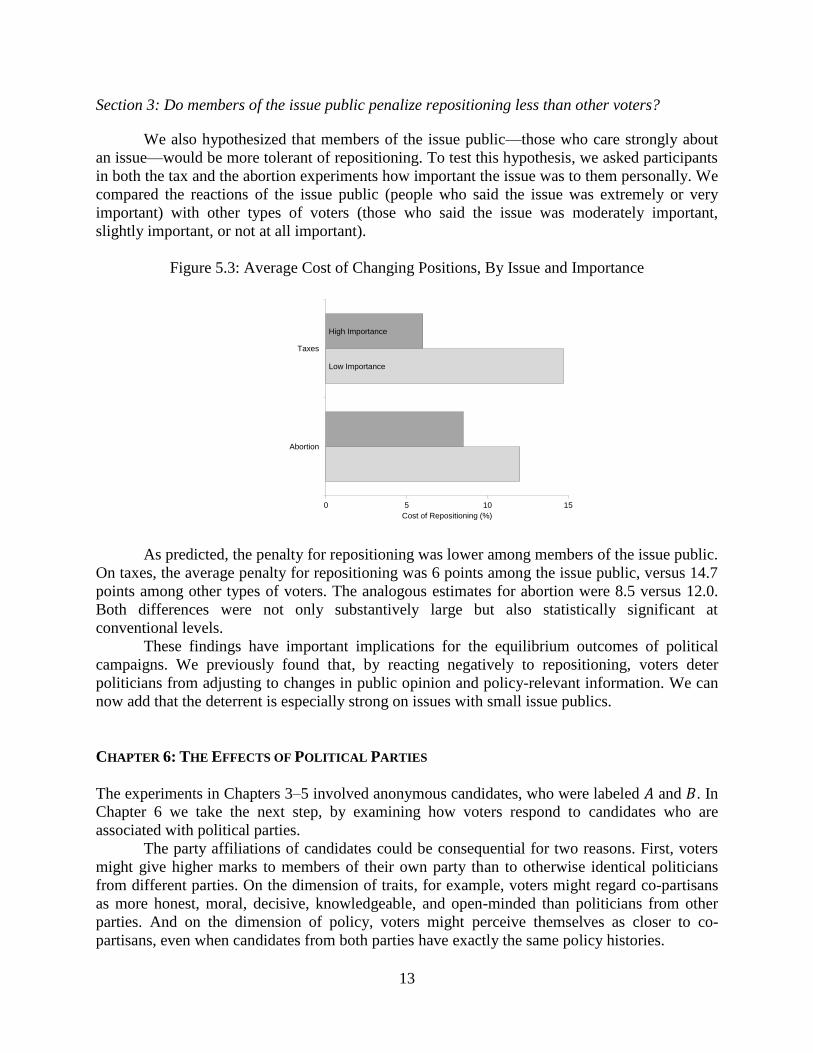
Figure 5.2 shows the other half of the experiment: the percentage of respondents who
doubted the candidate’s position on abortion. This figure supports the same set of conclusions:
repositioning undermines the credibility of a candidate’s statements, not only on that issue, but
also on other issues.
Figure 5.2: Skepticism about the Candidate’s Current Position on Abortion
Repositioned on Abortion
Stood Firm on Abortion
0 10 20 30 40 50 60 70
Repositioned onTaxes
Stood Firm onTaxes
Doubt the Candidate's Position on Taxes (%)
Repositioned on Taxes
Stood Firm on Taxes
0 10 20 30 40 50 60 70
Repositioned onAbortion
Stood Firm onAbortion
Doubt the Candidate's Position on Abortion (%)
13
Section 3: Do members of the issue public penalize repositioning less than other voters?
We also hypothesized that members of the issue public—those who care strongly about
an issue—would be more tolerant of repositioning. To test this hypothesis, we asked participants
in both the tax and the abortion experiments how important the issue was to them personally. We
compared the reactions of the issue public (people who said the issue was extremely or very
important) with other types of voters (those who said the issue was moderately important,
slightly important, or not at all important).
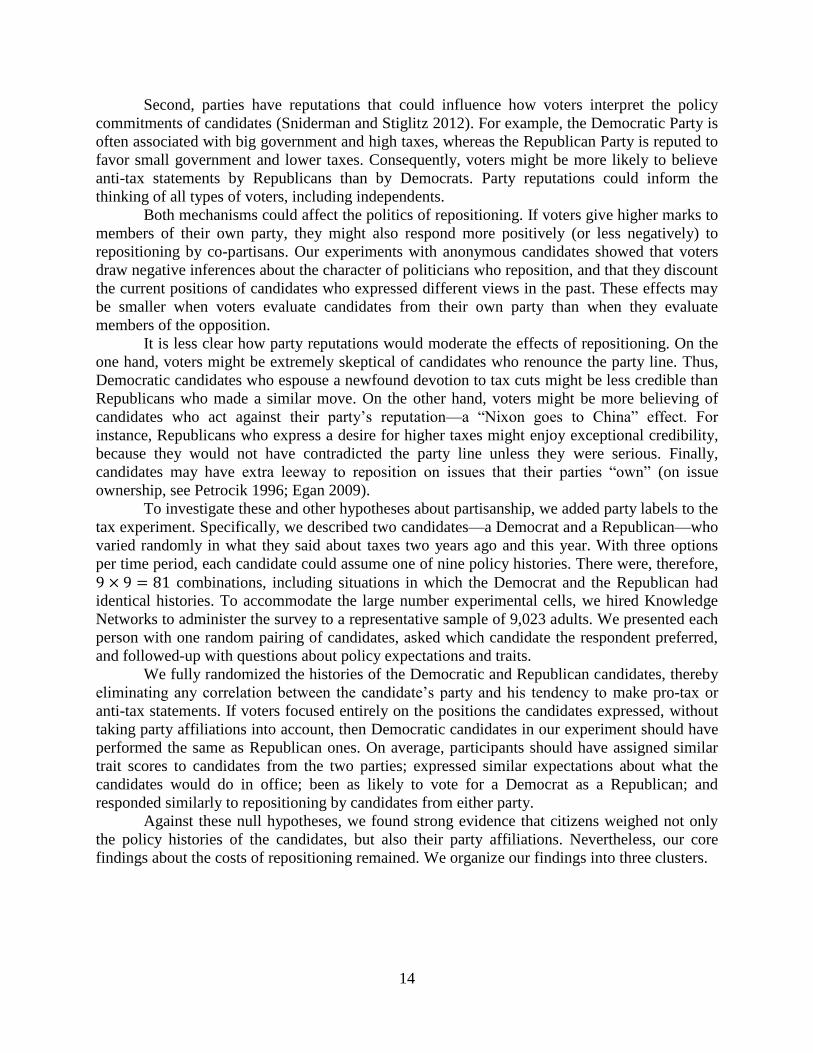
Figure 5.3: Average Cost of Changing Positions, By Issue and Importance
As predicted, the penalty for repositioning was lower among members of the issue public.
On taxes, the average penalty for repositioning was 6 points among the issue public, versus 14.7
points among other types of voters. The analogous estimates for abortion were 8.5 versus 12.0.
Both differences were not only substantively large but also statistically significant at
conventional levels.
These findings have important implications for the equilibrium outcomes of political
campaigns. We previously found that, by reacting negatively to repositioning, voters deter
politicians from adjusting to changes in public opinion and policy-relevant information. We can
now add that the deterrent is especially strong on issues with small issue publics.
CHAPTER 6: THE EFFECTS OF POLITICAL PARTIES
The experiments in Chapters 3–5 involved anonymous candidates, who were labeled 𝐴 and 𝐵. In
Chapter 6 we take the next step, by examining how voters respond to candidates who are
associated with political parties.
The party affiliations of candidates could be consequential for two reasons. First, voters
might give higher marks to members of their own party than to otherwise identical politicians
from different parties. On the dimension of traits, for example, voters might regard co-partisans
as more honest, moral, decisive, knowledgeable, and open-minded than politicians from other
parties. And on the dimension of policy, voters might perceive themselves as closer to co-
partisans, even when candidates from both parties have exactly the same policy histories.
Low Importance
High Importance
0 5 10 15
Abortion
Taxes
Cost of Repositioning (%)
14
Second, parties have reputations that could influence how voters interpret the policy
commitments of candidates (Sniderman and Stiglitz 2012). For example, the Democratic Party is
often associated with big government and high taxes, whereas the Republican Party is reputed to
favor small government and lower taxes. Consequently, voters might be more likely to believe
anti-tax statements by Republicans than by Democrats. Party reputations could inform the
thinking of all types of voters, including independents.
Both mechanisms could affect the politics of repositioning. If voters give higher marks to
members of their own party, they might also respond more positively (or less negatively) to
repositioning by co-partisans. Our experiments with anonymous candidates showed that voters
draw negative inferences about the character of politicians who reposition, and that they discount
the current positions of candidates who expressed different views in the past. These effects may
be smaller when voters evaluate candidates from their own party than when they evaluate
members of the opposition.
It is less clear how party reputations would moderate the effects of repositioning. On the
one hand, voters might be extremely skeptical of candidates who renounce the party line. Thus,
Democratic candidates who espouse a newfound devotion to tax cuts might be less credible than
Republicans who made a similar move. On the other hand, voters might be more believing of
candidates who act against their party’s reputation—a “Nixon goes to China” effect. For
instance, Republicans who express a desire for higher taxes might enjoy exceptional credibility,
because they would not have contradicted the party line unless they were serious. Finally,
candidates may have extra leeway to reposition on issues that their parties “own” (on issue
ownership, see Petrocik 1996; Egan 2009).
To investigate these and other hypotheses about partisanship, we added party labels to the
tax experiment. Specifically, we described two candidates—a Democrat and a Republican—who
varied randomly in what they said about taxes two years ago and this year. With three options
per time period, each candidate could assume one of nine policy histories. There were, therefore,
9 × 9 = 81 combinations, including situations in which the Democrat and the Republican had
identical histories. To accommodate the large number experimental cells, we hired Knowledge
Networks to administer the survey to a representative sample of 9,023 adults. We presented each
person with one random pairing of candidates, asked which candidate the respondent preferred,
and followed-up with questions about policy expectations and traits.
We fully randomized the histories of the Democratic and Republican candidates, thereby
eliminating any correlation between the candidate’s party and his tendency to make pro-tax or
anti-tax statements. If voters focused entirely on the positions the candidates expressed, without
taking party affiliations into account, then Democratic candidates in our experiment should have
performed the same as Republican ones. On average, participants should have assigned similar
trait scores to candidates from the two parties; expressed similar expectations about what the
candidates would do in office; been as likely to vote for a Democrat as a Republican; and
responded similarly to repositioning by candidates from either party.
Against these null hypotheses, we found strong evidence that citizens weighed not only
the policy histories of the candidates, but also their party affiliations. Nevertheless, our core
findings about the costs of repositioning remained. We organize our findings into three clusters.
15
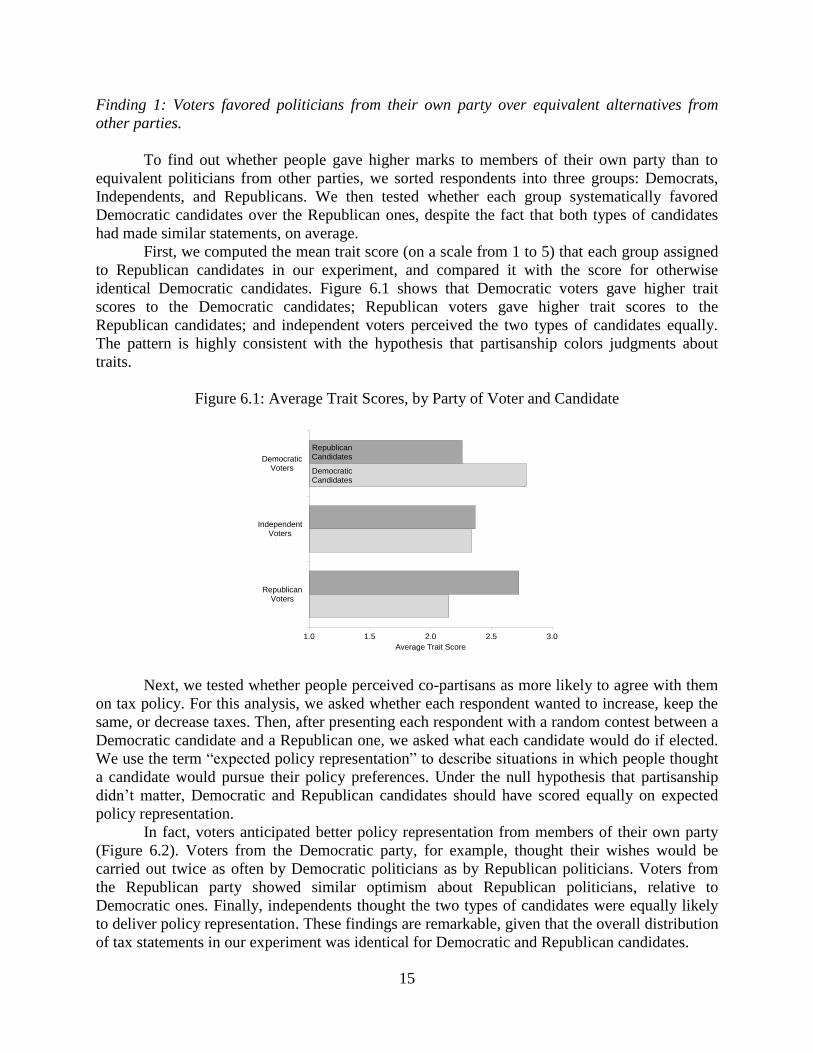
Finding 1: Voters favored politicians from their own party over equivalent alternatives from
other parties.
To find out whether people gave higher marks to members of their own party than to
equivalent politicians from other parties, we sorted respondents into three groups: Democrats,
Independents, and Republicans. We then tested whether each group systematically favored
Democratic candidates over the Republican ones, despite the fact that both types of candidates
had made similar statements, on average.
First, we computed the mean trait score (on a scale from 1 to 5) that each group assigned
to Republican candidates in our experiment, and compared it with the score for otherwise
identical Democratic candidates. Figure 6.1 shows that Democratic voters gave higher trait
scores to the Democratic candidates; Republican voters gave higher trait scores to the
Republican candidates; and independent voters perceived the two types of candidates equally.
The pattern is highly consistent with the hypothesis that partisanship colors judgments about
traits.
Figure 6.1: Average Trait Scores, by Party of Voter and Candidate
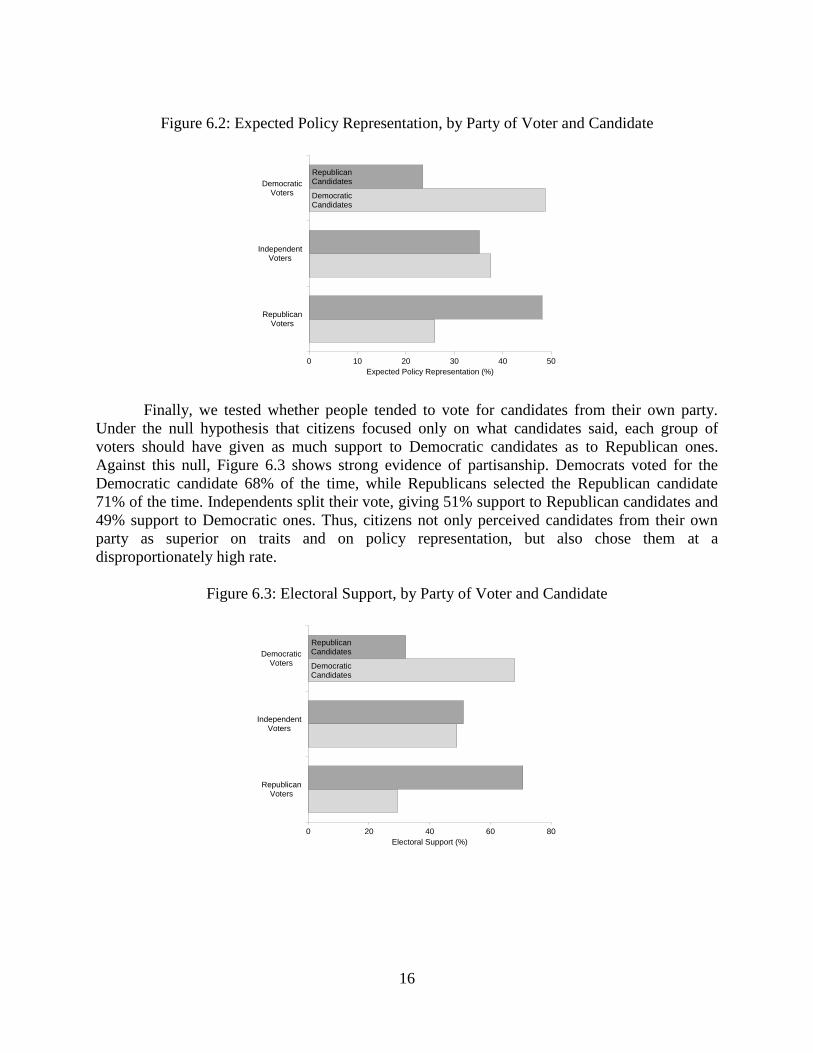
Next, we tested whether people perceived co-partisans as more likely to agree with them
on tax policy. For this analysis, we asked whether each respondent wanted to increase, keep the
same, or decrease taxes. Then, after presenting each respondent with a random contest between a
Democratic candidate and a Republican one, we asked what each candidate would do if elected.
We use the term “expected policy representation” to describe situations in which people thought
a candidate would pursue their policy preferences. Under the null hypothesis that partisanship
didn’t matter, Democratic and Republican candidates should have scored equally on expected
policy representation.
In fact, voters anticipated better policy representation from members of their own party
(Figure 6.2). Voters from the Democratic party, for example, thought their wishes would be
carried out twice as often by Democratic politicians as by Republican politicians. Voters from
the Republican party showed similar optimism about Republican politicians, relative to
Democratic ones. Finally, independents thought the two types of candidates were equally likely
to deliver policy representation. These findings are remarkable, given that the overall distribution
of tax statements in our experiment was identical for Democratic and Republican candidates.
Democratic Candidates
Republican Candidates
1.0 1.5 2.0 2.5 3.0
RepublicanVoters
IndependentVoters
DemocraticVoters
Average Trait Score
16
Figure 6.2: Expected Policy Representation, by Party of Voter and Candidate
Finally, we tested whether people tended to vote for candidates from their own party.
Under the null hypothesis that citizens focused only on what candidates said, each group of
voters should have given as much support to Democratic candidates as to Republican ones.
Against this null, Figure 6.3 shows strong evidence of partisanship. Democrats voted for the
Democratic candidate 68% of the time, while Republicans selected the Republican candidate
71% of the time. Independents split their vote, giving 51% support to Republican candidates and
49% support to Democratic ones. Thus, citizens not only perceived candidates from their own
party as superior on traits and on policy representation, but also chose them at a
disproportionately high rate.
Figure 6.3: Electoral Support, by Party of Voter and Candidate
Democratic Candidates
Republican Candidates
0 10 20 30 40 50
RepublicanVoters
IndependentVoters
DemocraticVoters
Expected Policy Representation (%)
Democratic Candidates
Republican Candidates
0 20 40 60 80
RepublicanVoters
IndependentVoters
DemocraticVoters
Electoral Support (%)
17
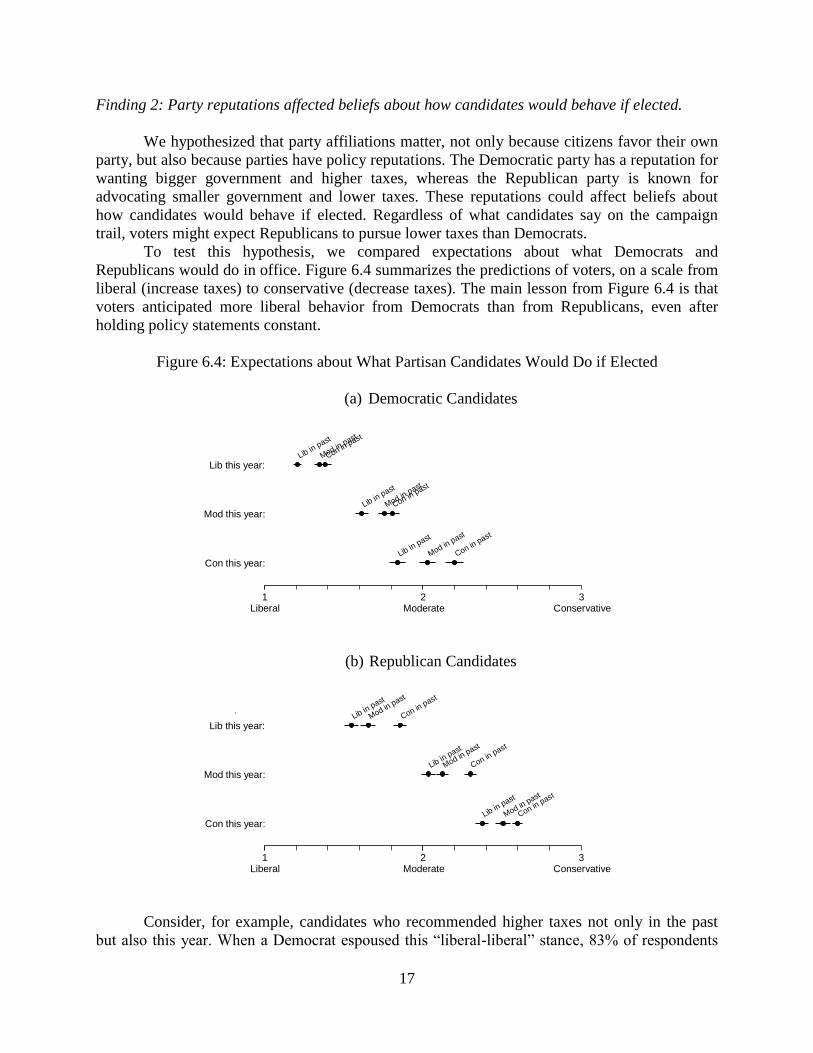
Finding 2: Party reputations affected beliefs about how candidates would behave if elected.
We hypothesized that party affiliations matter, not only because citizens favor their own
party, but also because parties have policy reputations. The Democratic party has a reputation for
wanting bigger government and higher taxes, whereas the Republican party is known for
advocating smaller government and lower taxes. These reputations could affect beliefs about
how candidates would behave if elected. Regardless of what candidates say on the campaign
trail, voters might expect Republicans to pursue lower taxes than Democrats.
To test this hypothesis, we compared expectations about what Democrats and
Republicans would do in office. Figure 6.4 summarizes the predictions of voters, on a scale from
liberal (increase taxes) to conservative (decrease taxes). The main lesson from Figure 6.4 is that
voters anticipated more liberal behavior from Democrats than from Republicans, even after
holding policy statements constant.
Figure 6.4: Expectations about What Partisan Candidates Would Do if Elected
(a) Democratic Candidates
(b) Republican Candidates
Consider, for example, candidates who recommended higher taxes not only in the past
but also this year. When a Democrat espoused this “liberal-liberal” stance, 83% of respondents
Lib in past
Mod in past
Con in past
Lib in past
Mod in past
Con in past
Lib in past
Mod in past
Con in past
Lib this year:
Mod this year:
Con this year:
Liberal Moderate Conservative1 2 3
Lib in past
Mod in past
Con in past
Lib in past
Mod in past
Con in past
Lib in past
Mod in past
Con in past
Lib this year:
Mod this year:
Con this year:
Liberal Moderate Conservative1 2 3
18
thought the Democrat would work for higher taxes. An additional 14% thought he would keep
taxes at current levels, and only 3% thought he would decrease taxes. The average expectation
was, therefore, . 83 × 1 + .14 × 2 + .03 × 3 = 1.2. When a Republican made exactly the
same statements, only 58% of respondents predicted that he would raise taxes. Fully 29%
thought he would maintain the status quo, and 13% claimed that he would cut taxes. Hence, the
average expectation was . 58 × 1 + .29 × 2 + .13 × 3 = 1.55, far to the right of a Democrat
with an identical history. This example illustrates a more general pattern: every dot in the bottom
half the figure lies to the right of the analogous dot in the top half. Thus, people expect
Republicans to deliver more conservative policies than Democrats, even after controlling
candidates’ campaign statements. We had also hypothesized that candidates who shifted toward
their party’s reputation would be more credible than candidates who shifted in the other
direction. Our data, based on Figure 6.4, are fairly consistent with this hypothesis. Consequently,
politicians may find it easier to move towards rather than away from their party’s orthodoxies.
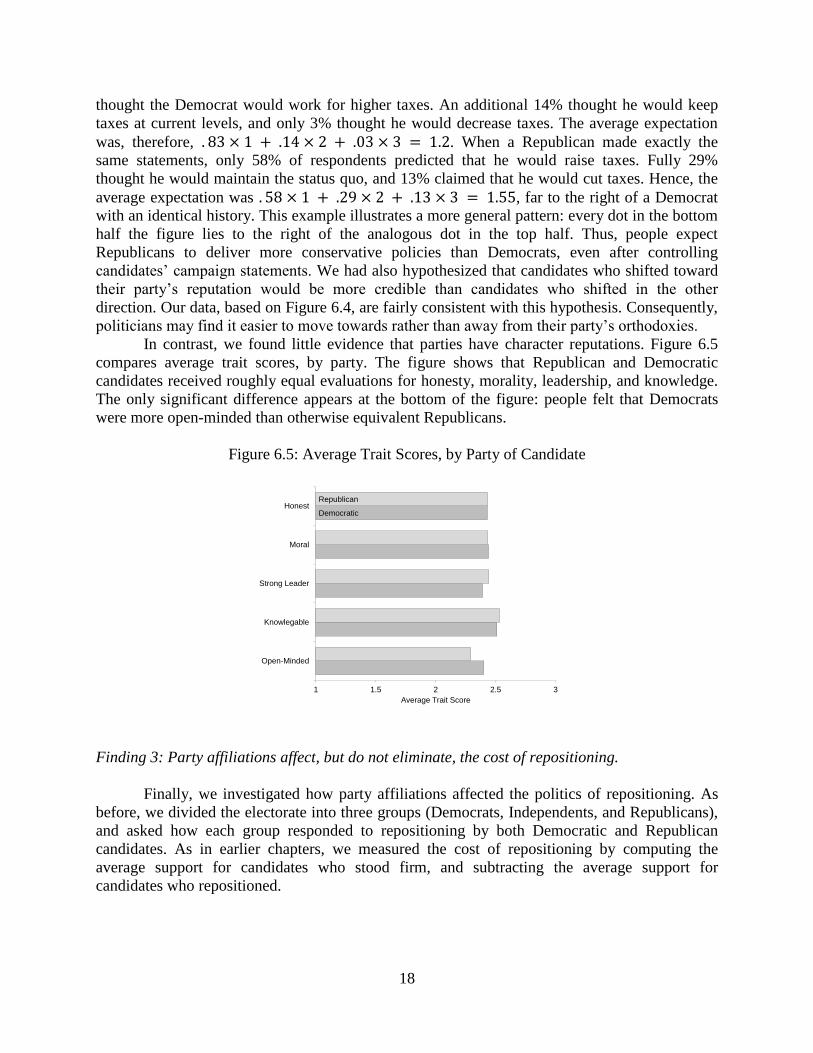
In contrast, we found little evidence that parties have character reputations. Figure 6.5
compares average trait scores, by party. The figure shows that Republican and Democratic
candidates received roughly equal evaluations for honesty, morality, leadership, and knowledge.
The only significant difference appears at the bottom of the figure: people felt that Democrats
were more open-minded than otherwise equivalent Republicans.
Figure 6.5: Average Trait Scores, by Party of Candidate
Finding 3: Party affiliations affect, but do not eliminate, the cost of repositioning.
Finally, we investigated how party affiliations affected the politics of repositioning. As
before, we divided the electorate into three groups (Democrats, Independents, and Republicans),
and asked how each group responded to repositioning by both Democratic and Republican
candidates. As in earlier chapters, we measured the cost of repositioning by computing the
average support for candidates who stood firm, and subtracting the average support for
candidates who repositioned.
Democratic
Republican
1 1.5 2 2.5 3
Open-Minded
Knowlegable
Strong Leader
Moral
Honest
Average Trait Score
19
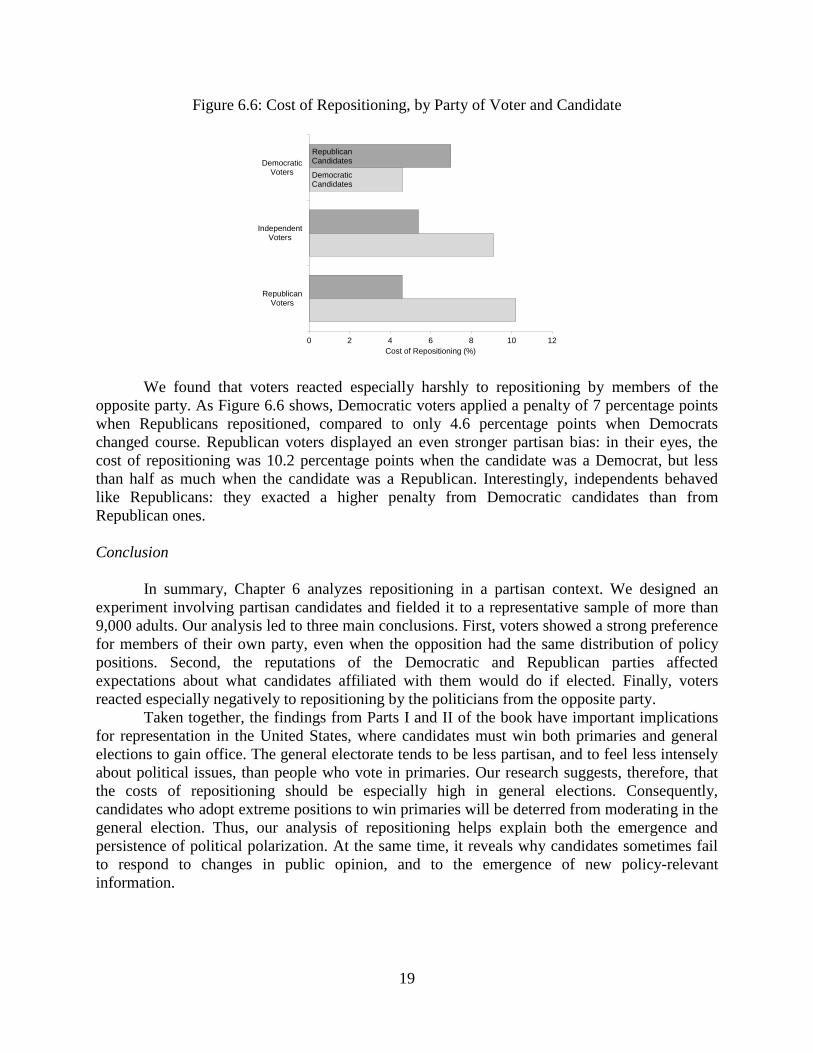
Figure 6.6: Cost of Repositioning, by Party of Voter and Candidate
We found that voters reacted especially harshly to repositioning by members of the
opposite party. As Figure 6.6 shows, Democratic voters applied a penalty of 7 percentage points
when Republicans repositioned, compared to only 4.6 percentage points when Democrats
changed course. Republican voters displayed an even stronger partisan bias: in their eyes, the
cost of repositioning was 10.2 percentage points when the candidate was a Democrat, but less
than half as much when the candidate was a Republican. Interestingly, independents behaved
like Republicans: they exacted a higher penalty from Democratic candidates than from
Republican ones.
Conclusion
In summary, Chapter 6 analyzes repositioning in a partisan context. We designed an
experiment involving partisan candidates and fielded it to a representative sample of more than
9,000 adults. Our analysis led to three main conclusions. First, voters showed a strong preference
for members of their own party, even when the opposition had the same distribution of policy
positions. Second, the reputations of the Democratic and Republican parties affected
expectations about what candidates affiliated with them would do if elected. Finally, voters
reacted especially negatively to repositioning by the politicians from the opposite party.
Taken together, the findings from Parts I and II of the book have important implications
for representation in the United States, where candidates must win both primaries and general
elections to gain office. The general electorate tends to be less partisan, and to feel less intensely
about political issues, than people who vote in primaries. Our research suggests, therefore, that
the costs of repositioning should be especially high in general elections. Consequently,
candidates who adopt extreme positions to win primaries will be deterred from moderating in the
general election. Thus, our analysis of repositioning helps explain both the emergence and
persistence of political polarization. At the same time, it reveals why candidates sometimes fail
to respond to changes in public opinion, and to the emergence of new policy-relevant
information.
Democratic Candidates
Republican Candidates
0 2 4 6 8 10 12
RepublicanVoters
IndependentVoters
DemocraticVoters
Cost of Repositioning (%)
20
PART III: STRATEGIES FOR ALTERING RESPONSES TO REPOSITIONING
In Part III, we examine several strategies that political actors use to alter the costs and benefits of
repositioning. To identify these strategies, we built an original database of the transcripts of U.S.
presidential debates. The database, which includes 361 debates from both presidential primaries
and the general election, reveals how politicians have used rhetoric to criticize, deny, or excuse
changes in position. The debates also document the prevalence of strategic ambiguity: remaining
vague about one’s policy positions, instead of getting pinned to clear positions that one might
regret at a later date. Finally, by monitoring how the content of debates has changed over time,
we document the rise of political pledges, such as the “no new taxes” pledge sponsored by
Grover Norquist’s interest group, Americans for Tax Reform. By forcing politicians to clarify
their positions and by reducing the potential for deniability, pledges could affect the cost of
repositioning.
After documenting these strategies historically, we study them experimentally. Using
survey experiments on nationally representative samples, we measure how rhetoric moderates
the costs of repositioning; what voters think about political ambiguity; and how they respond
when candidates sign and/or violate political pledges. We conclude by discussing the
implications of our findings for contemporary American politics, the 2012 campaign, and
representation in democracies.
CHAPTER 7: DEBATING REPOSITIONING
In this chapter, we introduce an original database of U.S. presidential debates and use it to study
how repositioning has been discussed in political campaigns. The database, which took three
years to build, contains full transcripts for 361 presidential and general election debates,
beginning with a 1948 contest between Thomas Dewey and Harold Stassen. Many transcripts
were not previously available in electronic format; they existed only as paper copies, audio
recordings, or videos that had been deposited in archives across the United States. We
meticulously converted these raw files into verbatim transcripts that could be searched
electronically. The result is the most comprehensive database of presidential debates ever
compiled.
Having assembled the database, we searched for strategies that politicians and other
political actors have used when talking about repositioning. Working with a team of research
assistants, we coded what candidates said about repositioning, and how the issue was broached
by debate moderators and members of the audience. Three types of strategies emerged from our
research: strategies of accusation and explanation; strategies of ambiguity and denial; and the
strategic use of political pledges. By documenting the use of these strategies, we lay the
foundation for the other chapters in Part III.
Finding 1. Strategies of Accusation and Explanation
In American politics, candidates often accuse their opponents of changing positions on
issues. In some of the presidential debates we examined, candidates pointed out that their
opponent had flip-flopped, without elaborating on why voters should reject a politician for
changing his mind. In other debates, candidates not only branded the opponent as a flip-flopper,
21
but also asserted that politicians who change course have poor character or questionable
intentions.
These attacks fell into three main categories. First, candidates who change positions are
dishonest; instead of expressing their true convictions, they say what voters want to hear.
Second, candidates who shift positions are uninformed; they say different things at different
times because they don’t know how to respond to the situation. Finally, politicians who
reposition are unpredictable; it is hard to guess what they will do, given their inconsistent record.
Over the years, then, candidates have used the theme of repositioning to attack both the character
and the policy intentions of their opponents. The presidential debates therefore provide
qualitative support for the theory of repositioning that we developed in Chapter 2.
When accused of flip-flopping, how did candidates respond? We found three patterns in
the historical record. Some candidates ignored the charge and attempted to change the topic, in
an effort to deflect attention from the controversial issue. Other candidates counterattacked, by
alleging that their opponent had flipped on the same issue or a different one. Still other
candidates acknowledged that they had changed positions and attempted to explain why.
When candidates offered excuses for repositioning, their rationales were typically
pragmatic. Candidates claimed that they were adapting to new external circumstances, such as an
increase in the U.S. budget deficit or the emergence of a new scientific consensus. On some
occasions, though, the candidates offered a moral justification: they had experienced a change of
heart, a change of religion, or some other ethical conversion. Surprisingly, we found almost no
instances in which politicians justified their new stance by noting that public opinion had shifted.
In Chapter 8 we use experiments to compare the efficacy of various rhetorical strategies for
altering the costs of repositioning.
Finding 2: Strategies of Ambiguity and Denial
U.S. candidates also employ strategies of ambiguity. By remaining vague on certain
issues, candidates can avoid getting pinned to positions they might need to change at a later date.
We argue that the incentive to remain ambiguous is especially strong for the presumptive
frontrunners in primaries. For those candidates, expressing clear views during a primary can be
hazardous, because the positions that appeal to voters in a partisan primary may seem too
extreme for moderate voters in a general election.
To gauge the level of ambiguity in actual campaigns, we analyzed what U.S. presidential
candidates said on various issues. For example, we examined 430 tax proposals that candidates
made in the 2008 primary and general election debates. We coded each proposal based on two
criteria. First, did the candidate advocate increasing taxes, keeping taxes the same, decreasing
taxes, or some combination of the three? Second, did the candidate specify the magnitude of the
proposed change?
We found widespread evidence of ambiguity. Only 48% of statements were
unambiguous, meaning that candidates called for a specific change or unequivocally advocated
keeping taxes the same. In 41% of statements candidates were somewhat ambiguous: they
advocated increasing or decreasing taxes but did not say how much of a change they would
make. In an additional 10% of cases, candidates held open two options: either keeping taxes the
same or changing them in a particular direction. Finally, 1% of statements were so vague that we
could not discern either the direction or the magnitude of the proposed policy change. Ambiguity
22
was especially common during primary debates, and was employed more often by frontrunners
than by less competitive candidates.
By speaking vaguely, candidates can avoid getting pinned down. Whether this strategy
makes sense, however, depends on whether voters tolerate ambiguity. Do voters punish
candidates for speaking vaguely? We use experiments to investigate this question in Chapter 9.
Finding 3: The Rise of Political Pledges
In recent years, interest groups have sponsored political pledges as devices to encourage
candidates to make clear commitments. For instance, Americans for Tax Reform, a group led by
Grover Norquist, authored the famous “No New Taxes” pledge. Signatories promise never to
increase taxes on individuals and corporations, and commit that they will not close loopholes
without offsetting them dollar-for-dollar with reductions in marginal rates. Other pledges cover
many other issues, such as abortion, immigration, family values, and social security.
Our analysis of presidential debates revealed a secular increase in references to political
pledges. The No New Taxes pledge first surfaced in the 1988 Republican primary. In subsequent
decades, that pledge and others have featured prominently in debates. Moderators now ask
whether candidates will pledge on various issues, and candidates tout the fact that they have
pledged whereas their opponents have not. In Chapter 10 we use experiments to study how
pledges affect the popularity of candidates and the cost of repositioning.
In summary, we identified three strategies that political actors use to affect the cost of
inconsistency: strategies of accusation and explanation; strategies of ambiguity and denial; and
the strategic use of political pledges. In the next three chapters, we examine these strategies in
greater detail.
CHAPTER 8: ACCUSATION AND EXPLANATION
This chapter examines how accusations and explanations moderate the consequences of
repositioning. We administered experiments in which candidates not only stated their views
about taxes on wealthy Americans, but also made accusations and offered explanations.
Each experiment involved two anonymous candidates, who took positions four years ago
and again this year. One candidate was consistent: he recommended either higher or lower taxes
four years ago, and he repeated the recommendation this year. The other candidate repositioned:
he favored tax hikes four years ago but called for tax cuts this year, or vice-versa. With two types
of consistent records (increase-increase taxes or decrease-decrease taxes) and two types of
inconsistent records (increase-decrease taxes or decrease-increase taxes), there were four
possible combinations of candidates. As explained below, we also varied the use of rhetoric, and
studied how it affected public opinion.
Finding 1: One-sided explanations can reduce the cost of inconsistency.
Our first experiment involved one-sided rhetoric: the candidate who changed positions
publicly justified his shift and attacked his opponent for failing to adapt, while the candidate with
23
a consistent record used no rhetoric whatsoever. This scenario is obviously unrealistic. In actual
politics, the consistent candidate would respond by explaining his own position and denouncing
his opponent. Nevertheless, this lopsided experiment was a useful starting point. If one-sided
rhetoric proved powerless, we would not need more realistic but complex designs involving two-
sided rhetoric.
Our analysis of presidential debates showed that candidates who reposition often claim
that circumstances had changed. Building on this idea, we described the positions two candidates
had taken, and then presented a speech in which the inconsistent candidate cited new
circumstances. “When things change, we must adapt,” the inconsistent candidate explained.
“Four years ago, when the economy was better, I wanted to [decrease/increase] taxes on wealthy
Americans. Now that the economy has gotten much worse, we should [increase/decrease] taxes
on wealthy Americans.” He also attacked his opponent for inflexibility: “My opponent doesn’t
adapt his tax policies to the situation. He always wants to [decrease/increase] taxes on wealthy
Americans, no matter how the economy is doing.” After presenting this speech, we asked which
candidate the respondent preferred.
We fielded this experiment to a representative sample of 2,334 adults in August–
September 2010, during the depths of the U.S. recession. Economic conditions had deteriorated
tremendously over the previous four years, lending credibility to the “change-of-circumstances”
argument.
We found that one-sided rhetoric reduced, and in some scenarios entirely eliminated, the
cost of being inconsistent. Rhetoric proved most effective when the inconsistent candidate
switched from advocating a tax increase on wealthy American to advocating a tax cut. Moreover,
rhetoric was highly consequential for voters who did not care much about taxes on wealthy
Americans. In contrast, rhetoric proved much less effective at swaying members of the issue
public, who said the question of taxes on wealthy Americans was important to them personally.
Finding 2: Two-sided rhetoric restores the cost of inconsistency.
Having found that rhetoric can affect the cost of repositioning, we moved to a more
realistic design in which both candidates spoke. In our two-sided-rhetoric experiment, the
inconsistent candidate gave a speech like the one previously described, but the consistent
candidate offered a different point of view. He argued, “We should have [decreased/increased]
taxes on wealthy American four years ago, and we still need to [decrease/increase] them today.
My plan made economic sense then, and it makes economic sense now.” He added, “My
opponent is inconsistent” or “My opponent is a flip-flopper” and concluded with one of the
following four jabs: “he’ll say anything to get elected,” or “you can’t trust him,” or “he’s wishy-
washy and indecisive,” or “you can’t predict what he will do.” We randomized not only the
content of the consistent candidate’s speech, but also order in which the two candidates spoke.
Knowledge Networks administered the experiment to a representative sample of 2,084 adults in
February–March 2011.
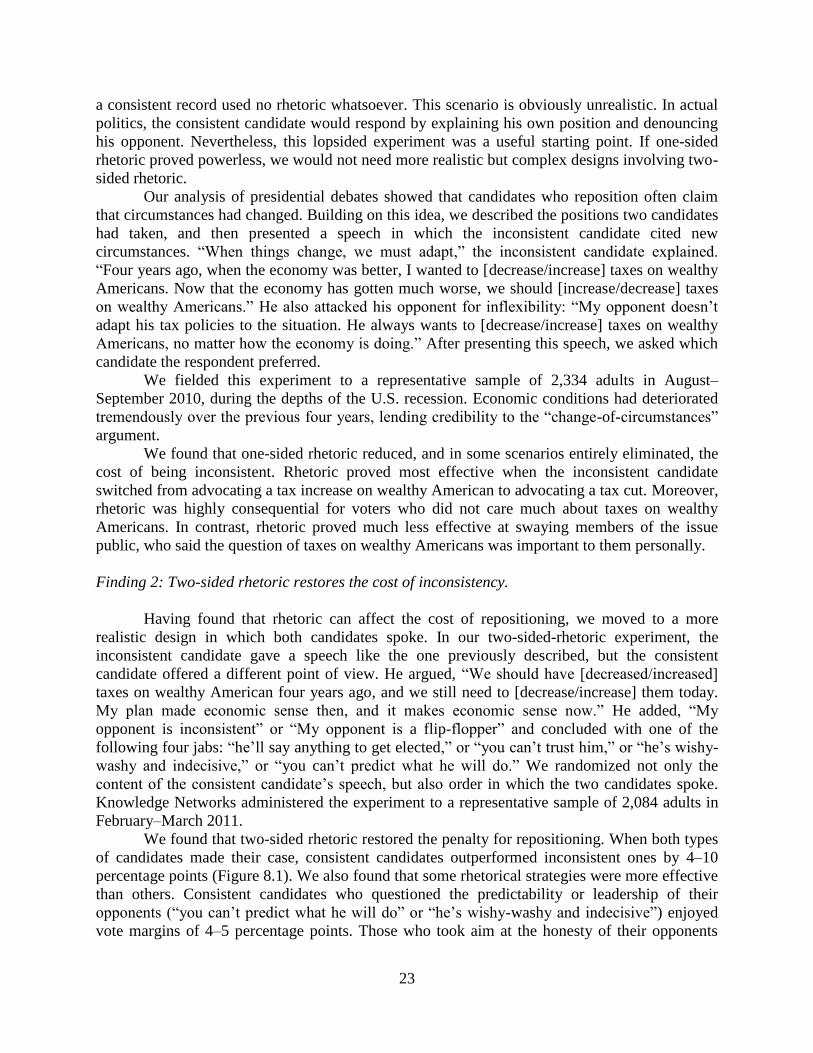
We found that two-sided rhetoric restored the penalty for repositioning. When both types
of candidates made their case, consistent candidates outperformed inconsistent ones by 4–10
percentage points (Figure 8.1). We also found that some rhetorical strategies were more effective
than others. Consistent candidates who questioned the predictability or leadership of their
opponents (“you can’t predict what he will do” or “he’s wishy-washy and indecisive”) enjoyed
vote margins of 4–5 percentage points. Those who took aim at the honesty of their opponents
24
(“you can’t trust him” or “he’ll say anything to get elected”) did twice as well; they outscored
their opponents by nearly 10 percentage points.
Figure 8.1: Effectiveness Accusations from Consistent Candidate
These findings fit the theory in Chapter 2. We argued that voters evaluate candidates on
two dimensions: character and policy. Arguments about honesty are especially powerful, because
they implicate both dimensions simultaneously. Asserting that the inconsistent candidate “cannot
be trusted” or “will say anything to get elected” not only impugns that candidate’s character, but
also casts doubt on what he would do if elected.
Overall, our experiments show both the power and the limits of rhetoric. In the one-sided-
rhetoric experiment, the inconsistent candidate performed about as well as the consistent
candidate. That experiment involved an implausible scenario, however, in which the inconsistent
candidate rationalized his positions and mounted an offensive, while the consistent candidate
remained completely mute. More plausibly, the consistent candidate would join the campaign by
making speeches of his own. Indeed, our analysis of presidential debates showed that consistent
candidates turn flip-flopping into a campaign theme. When we allowed consistent candidate to
tout his own record and chastise his opponent for flip-flopping, repositioning once again proved
costly on average.
Our findings do not imply that repositioning is always costly, or that candidates who shift
are powerless to defend themselves with rhetoric. The experiments do, however, belie the facile
notion that candidates can shift with impunity, simply by taking their case to the public. They
also confirm that the conclusions in Parts I and II of the book are robust to the introduction of
two-sided rhetoric.
CHAPTER 9: STRATEGIC AMBIGUITY
By remaining ambiguous about their policy preferences, candidates can avoid getting pinned to
positions that they might subsequently regret. Whether ambiguity makes sense, however,
depends on how voters respond to it. Do voters tolerate candidates who make vague statements,
or do they punish candidates who fail to state their positions clearly and precisely? To find out,
0 2 4 6 8 10 12
"He will sayanything to get
elected."
"You can't trusthim."
"He iswishy-washy
and indecisive."
"You can'tpredict what he
will do."
Advantage of Consistent Candidates v. Inconsistent Candidates (%)
25
we designed a survey experiment, which Knowledge Networks administered to a representative
sample of 1,001 U.S. adults.
Our experiment involved several steps. First, we asked respondents to locate themselves
on a 7-point scale concerning whether government services should be decreased by a large,
medium or small amount, kept the same, or increased by a small, medium, or large amount.
We then asked respondents to choose between two candidates, one vague and the other
precise. “In the last election,” participants were told, “candidates were surveyed by a non-
partisan group. We would like your views about two candidates, whose names will remain
confidential.” Using the same issue and policy options that respondents had seen previously, we
offered summaries of the platforms of two candidates. The precise candidate took one of seven
discrete positions on the scale. The ambiguous candidate, in contrast, advocated a three point
range on the scale. For example, a vague candidate might have said “the government should
increase services” but failed to specify by how much. The locations of both the precise and
vague candidates were randomized. After displaying the views of both candidates verbally and
graphically (with arrows for precise positions and brackets for vague intervals), we asked whom
the respondent preferred on that issue.
Half the respondents encountered unbranded candidates, who were identified by letters
such as “A” and “B”; the other half encountered party branded candidates, who were labeled as
Democrat and Republican. Both types of contests offered unique opportunities for inference. By
denoting some candidates with letters, we were able to test many theories of ambiguity in their
purest form, without the potentially confounding effects of party. By denoting other candidates
as Democrat and Republican, the design allowed us to study how partisanship conditions the
consequences of ambiguity. Respondents retained their initial assignments (evaluating either
unbranded or branded candidates) for the duration of the interview.
We ended this phase of the experiment by displaying two more pairs of candidates, some
of whom we positioned to allow within-subject analysis of the effects of ambiguity. Our method
involved mimicking the earlier scenarios but, in each case, replacing the ambiguous candidate
with a precise candidate who stood at the midpoint of the previous ambiguous interval. We
presented these “precise scenarios” as if they involved entirely new candidates, rather than ones
respondents had already encountered. By studying the choices each voter made in the ambiguous
scenario and its matching precise scenario, we inferred the voter’s response to changes in
candidate ambiguity, holding other factors constant.
Finally, we investigated how citizens form expectations about the likely positions of
vague candidates. Each respondent saw a single candidate who was randomly assigned to one of
the five possible vague intervals. The candidate was identified as Democrat or Republican in the
party branded condition, or by a letter in the unbranded condition. “If you had to guess,” we
asked, “which position do you think this candidate would actually take?” Respondents chose one
of the three precise positions spanned by the bracket.
Finding 1: Ambiguity is not costly, and it can be electorally beneficial.
Overall, we found that ambiguity carried no significant cost. Averaged across all
scenarios with or without party brand names, respondents were as likely to choose the
ambiguous candidate as they were to choose the precise one.
For additional insight we examined ties: situations in which the precise candidate and the
ambiguous one were equidistant to the voter. Ties arose when a precise candidate advocated a
26
policy at the center of the range of policies espoused by an ambiguous candidate. Ties also arose
when the voter expressed a policy preference that was midway between the two candidates, and
the distance from the voter to the precise candidate equaled the distance from the voter to the
midpoint of the ambiguous candidate’s policy range. These ties are particularly informative,
because they allow us to isolate the effect of ambiguity, after holding proximity constant.
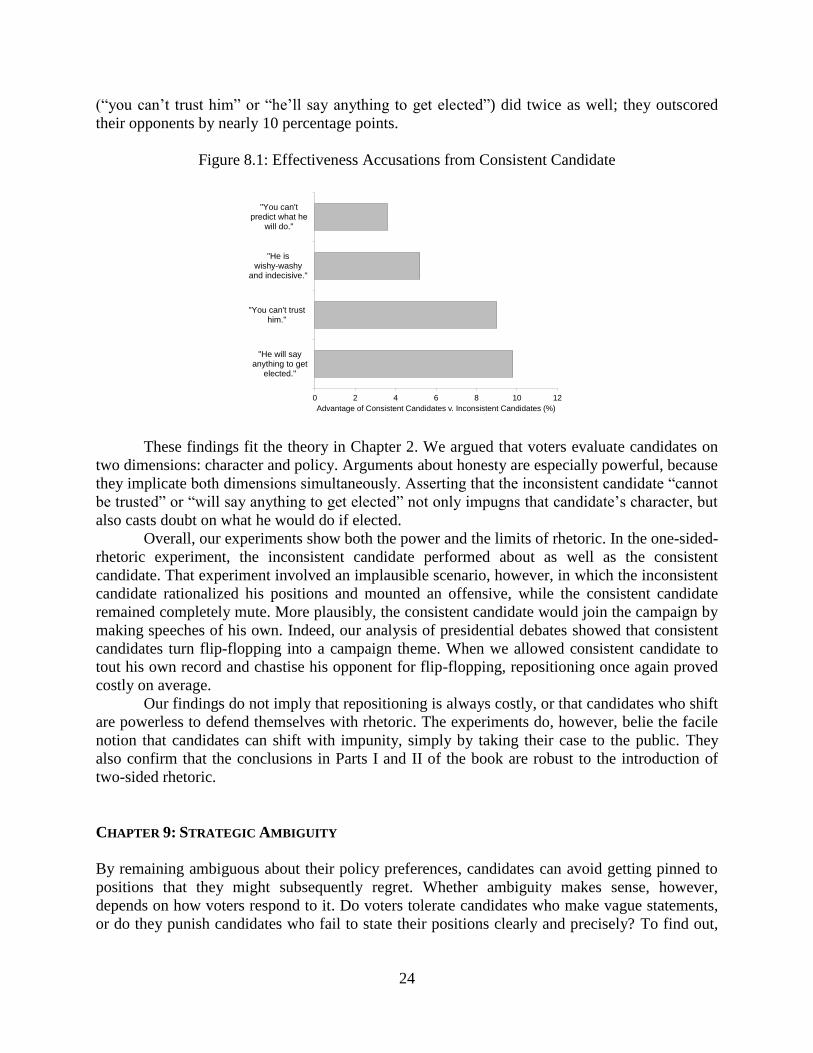
Figure 9.1 shows how voters chose when they were confronted with ties. In the
unbranded condition, 48% of voters who faced ties liked the ambiguous candidate more than the
precise one. Thus, when the candidates in our experiment did not carry party labels, ambiguous
candidates nearly matched the performance of their more precise opponents. In the party branded
condition, 56% of ties went to the ambiguous candidate, suggesting that ambiguity benefitted
candidates in partisan elections.
Figure 9.1: The Electoral Consequences of Ambiguity for Tied Candidates
Finding 2: Ambiguous candidates gain support from co-partisans, without losing others.
To further investigate the consequences of ambiguity in a partisan context, we conducted
a within-subject analysis. In particular, we compared how each voter responded to a pair of
precise partisan candidates, versus how the same voter responded to an otherwise identical
scenario in which one of the partisan candidates took an ambiguous position. The choices a voter
makes in scenarios like these can reveal whether that particular voter is attracted to or repelled by
ambiguity. Moreover, by summing the effects across the entire electorate, we can estimate the
overall consequences of ambiguity.
Once again, ties are especially informative because they allow us to isolate the
consequences of ambiguity in situations where the desire for proximity would not already dictate
the voter’s decision. For statistical power we considered not only exact ties but also near ties, in
which neither candidate enjoyed a proximity advantage of more than one point.
We divided respondents who saw these exact and near ties into three mutually exclusive
and exhaustive subgroups, based on whether the respondents identified with a political party and,
if so, whether the candidate who took an ambiguous position belonged to the voter’s own party
or not. For each subgroup, we estimated the net effect of ambiguity.
Our analysis supports three conclusions. First, ambiguity can be an effective strategy for
appealing to members of one’s own party. When partisan voters evaluated two precise
Ambiguous
Precise
0 10 20 30 40 50 60
Candidateswith party
labels
Candidateswithout party
labels
Electoral Support (%)
27
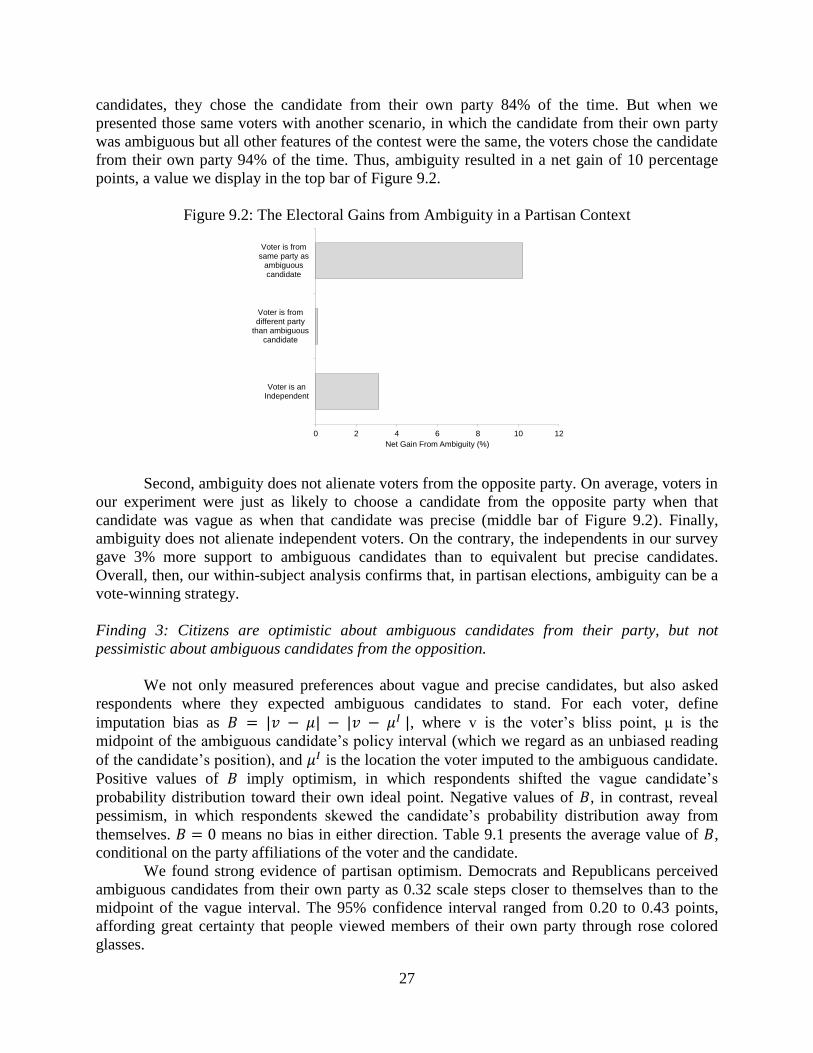
candidates, they chose the candidate from their own party 84% of the time. But when we
presented those same voters with another scenario, in which the candidate from their own party
was ambiguous but all other features of the contest were the same, the voters chose the candidate
from their own party 94% of the time. Thus, ambiguity resulted in a net gain of 10 percentage
points, a value we display in the top bar of Figure 9.2.
Figure 9.2: The Electoral Gains from Ambiguity in a Partisan Context
Second, ambiguity does not alienate voters from the opposite party. On average, voters in
our experiment were just as likely to choose a candidate from the opposite party when that
candidate was vague as when that candidate was precise (middle bar of Figure 9.2). Finally,
ambiguity does not alienate independent voters. On the contrary, the independents in our survey
gave 3% more support to ambiguous candidates than to equivalent but precise candidates.
Overall, then, our within-subject analysis confirms that, in partisan elections, ambiguity can be a
vote-winning strategy.
Finding 3: Citizens are optimistic about ambiguous candidates from their party, but not
pessimistic about ambiguous candidates from the opposition.
We not only measured preferences about vague and precise candidates, but also asked
respondents where they expected ambiguous candidates to stand. For each voter, define
imputation bias as 𝐵 = |𝑣 − 𝜇| − |𝑣 − 𝜇𝐼 |, where v is the voter’s bliss point, μ is the
midpoint of the ambiguous candidate’s policy interval (which we regard as an unbiased reading
of the candidate’s position), and 𝜇𝐼 is the location the voter imputed to the ambiguous candidate.
Positive values of 𝐵 imply optimism, in which respondents shifted the vague candidate’s
probability distribution toward their own ideal point. Negative values of 𝐵, in contrast, reveal
pessimism, in which respondents skewed the candidate’s probability distribution away from
themselves. 𝐵 = 0 means no bias in either direction. Table 9.1 presents the average value of 𝐵,
conditional on the party affiliations of the voter and the candidate.
We found strong evidence of partisan optimism. Democrats and Republicans perceived
ambiguous candidates from their own party as 0.32 scale steps closer to themselves than to the
midpoint of the vague interval. The 95% confidence interval ranged from 0.20 to 0.43 points,
affording great certainty that people viewed members of their own party through rose colored
glasses.
0 2 4 6 8 10 12
Voter is anIndependent
Voter is fromdifferent party
than ambiguouscandidate
Voter is fromsame party as
ambiguouscandidate
Net Gain From Ambiguity (%)
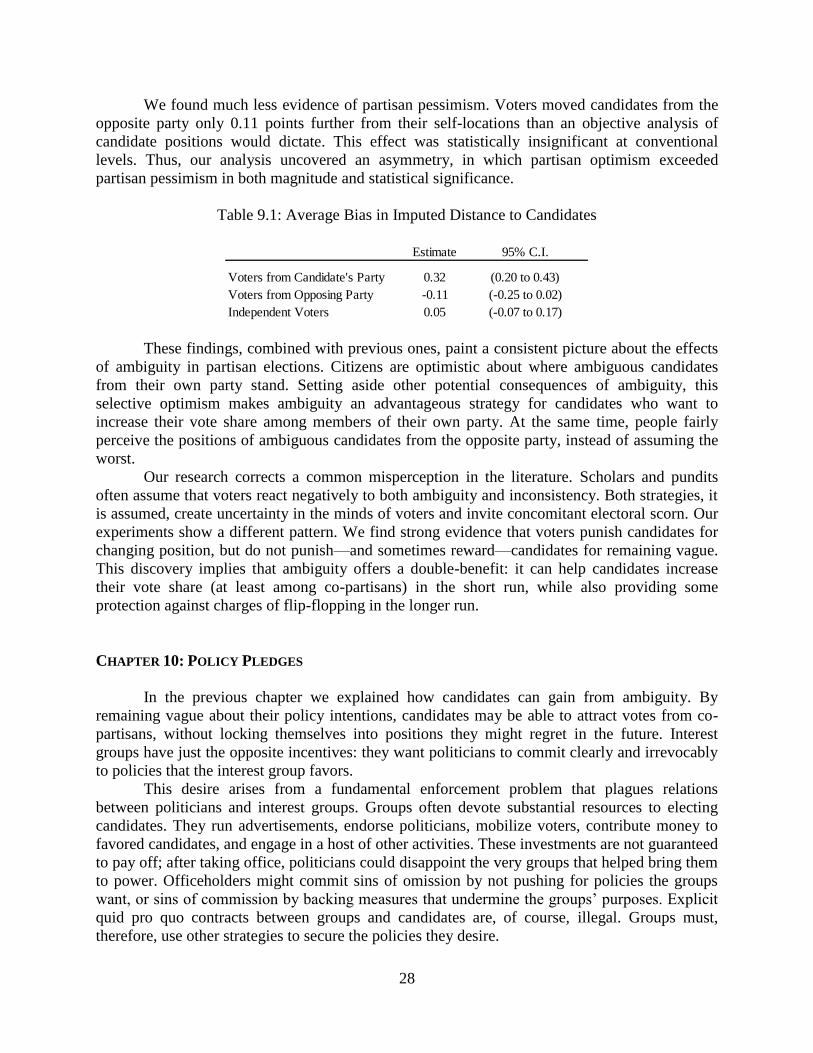
28
We found much less evidence of partisan pessimism. Voters moved candidates from the
opposite party only 0.11 points further from their self-locations than an objective analysis of
candidate positions would dictate. This effect was statistically insignificant at conventional
levels. Thus, our analysis uncovered an asymmetry, in which partisan optimism exceeded
partisan pessimism in both magnitude and statistical significance.
Table 9.1: Average Bias in Imputed Distance to Candidates
These findings, combined with previous ones, paint a consistent picture about the effects
of ambiguity in partisan elections. Citizens are optimistic about where ambiguous candidates
from their own party stand. Setting aside other potential consequences of ambiguity, this
selective optimism makes ambiguity an advantageous strategy for candidates who want to
increase their vote share among members of their own party. At the same time, people fairly
perceive the positions of ambiguous candidates from the opposite party, instead of assuming the
worst.
Our research corrects a common misperception in the literature. Scholars and pundits
often assume that voters react negatively to both ambiguity and inconsistency. Both strategies, it
is assumed, create uncertainty in the minds of voters and invite concomitant electoral scorn. Our
experiments show a different pattern. We find strong evidence that voters punish candidates for
changing position, but do not punish—and sometimes reward—candidates for remaining vague.
This discovery implies that ambiguity offers a double-benefit: it can help candidates increase
their vote share (at least among co-partisans) in the short run, while also providing some
protection against charges of flip-flopping in the longer run.
CHAPTER 10: POLICY PLEDGES
In the previous chapter we explained how candidates can gain from ambiguity. By
remaining vague about their policy intentions, candidates may be able to attract votes from co-
partisans, without locking themselves into positions they might regret in the future. Interest
groups have just the opposite incentives: they want politicians to commit clearly and irrevocably
to policies that the interest group favors.
This desire arises from a fundamental enforcement problem that plagues relations
between politicians and interest groups. Groups often devote substantial resources to electing
candidates. They run advertisements, endorse politicians, mobilize voters, contribute money to
favored candidates, and engage in a host of other activities. These investments are not guaranteed
to pay off; after taking office, politicians could disappoint the very groups that helped bring them
to power. Officeholders might commit sins of omission by not pushing for policies the groups
want, or sins of commission by backing measures that undermine the groups’ purposes. Explicit
quid pro quo contracts between groups and candidates are, of course, illegal. Groups must,
therefore, use other strategies to secure the policies they desire.
Estimate 95% C.I.
Voters from Candidate's Party 0.32 (0.20 to 0.43)
Voters from Opposing Party -0.11 (-0.25 to 0.02)
Independent Voters 0.05 (-0.07 to 0.17)
29
With increasing frequency, groups are using political pledges to solve this commitment
problem. We argue that pledges tie the hands of politicians by involving voters in the
enforcement process. A politician who signs an interest group’s pledge makes a public
commitment that is easy to identify and difficult to deny. If the politician subsequently violates
the pledge, the group, opposition candidates, and the media can bring this news to the attention
of voters.
Building on our theory of repositioning, we anticipate that voters will react negatively to
politicians who break pledges. We also hypothesize that pledges will influence voter
expectations about what politicians will do in the future. Getting politicians to sign pledges can,
therefore, be an effective interest group strategy. After securing signatures from politicians,
groups can play mainly informational roles—pulling the fire alarm when pledges are violated—
while letting citizens carry out the punishment.
To test our hypotheses, we designed an experiment about the Taxpayer Protection Pledge,
which was introduced by Americans for Tax Reform in 1986 and has been signed by nearly all
Republicans in the U.S. Congress. Signatories vow never to increase tax rates on individuals and
corporations, and to offset any efforts to close loopholes with equivalent reductions in marginal
tax rates. This pledge received considerable attention in 2011, when Congress debated how to
deal with the spiraling national debt. Many urged Republicans to raise taxes, even though tax
hikes would violate the pledge. The crisis of 2011 offered an exceptional opportunity to study
whether pledges create electoral incentives to persist with pledge-consistent policies, even in the
face of changing and potentially dire circumstances.
We hired Knowledge Networks to field our experiment in the midst of this crisis. The
experiment involved four steps. First, we asked respondents how they wanted to address the
national debt. Our question read, “To deal with the U.S. national debt, do you think the federal
government should cut spending but not raise taxes, raise taxes but not cut spending, or both cut
spending and raise taxes?” We included the question so that we could group respondents
according to their policy preferences, and study how each group evaluated the candidates in our
experiment.
Second, we displayed the text of the Taxpayer Protection Pledge and noted that all
candidates for state and federal office had been asked to sign it. We then described two senators
who varied randomly in whether they had previously taken the Taxpayer Protection Pledge, and
in how they were now proposing to deal with the debt. The scenario began, “Some senators have
signed the ‘no new taxes’ pledge. Other senators have not. We would like your opinion about
two senators, whose names will remain confidential. They are Senator A and Senator B.” By
representing candidates with letters, we were able to test the pure effect of the pledge, without
the potentially confounding effects of party or other candidate attributes.
We reported whether each senator had signed the pledge two years ago (p) or not (n), and
whether they now wanted to tackle the debt entirely through spending cuts (c) or through a mix
of spending cuts and tax hikes (t). Thus, each candidate had one of four histories: pc, pt, nc, or
nt. We randomly gave each respondent a contest between two of the candidates (excluding ties)
and asked “On this issue, which Senator do you prefer?”
Third, we measured expectations about how the candidates would behave. Specifically,
we reminded each respondent of the statements Senator A had made and asked: “If you had to
guess, what do you think Senator A would try to do in the future?” The response options were
“cut spending but not raise taxes,” “raise taxes but not cut spending,” or “both cut spending and
raise taxes.” We repeated this procedure for Senator B. Finally, we measured how respondents
30
perceived the character of each candidate. We included the five characteristics discussed in prior
chapters—provides strong leadership, knowledgeable, honest, moral, and open-minded.
The interviews took place in July–August 2011, and 1,195 people completed the survey.
Of these, 58% wanted to deal with the national debt entirely through spending cuts; an additional
38% thought the solution should involve higher taxes as well as lower spending; and the
remainder favored tax hikes but no spending cuts. We divided respondents into two groups, those
who favored spending cuts only (group c, comprising 58% of the sample) versus those who
wanted more taxes (group t, comprising 42% of the sample), and analyzed each group separately.
Our split-sample analysis allows us to assess how the consequences of the pledge would vary if
support for taxes were higher or lower than in our sample, either because of shifting preferences
in the electorate as a whole, or because the contest involved a subset of voters, such as the
electorate in a primary.
Finding 1: The pledge affects beliefs about both character and policy.
We found clear evidence that pledge breaking affects how voters view a candidate’s
character. Both groups of voters—not only ones who wanted spending cuts alone, but also those
who favored higher taxes—downgraded the character of candidates who broke the pledge by
advocating new taxes, over equivalent candidates who kept their pledge. This discovery means
that pledge-takers have a characterological incentive to advocate pledge-consistent policies
regardless of whether the electorate prefers such policies.
The pledge also alters expectations about what politicians will do in office. When
candidates said they would solve the debt by cutting spending but not raising taxes, voters
thought candidates who signed the pledge were more credible than ones who had not.
Surprisingly, though, the pledge did not affect the credibility of candidates who proposed to raise
taxes. Voters believed such candidates to an equal degree, whether or not they had previously
pledged. Overall, though, the pledge is consequential because it affects perceptions about both
character and policy, the central elements in our theory of repositioning.
Finding 2: The pledge strongly deters candidates from calling for higher taxes.
Next, we examined how the pledge ties the hands of candidates by deterring them from
calling for higher taxes even when (as in summer 2011) external circumstances are so dire that
compromise might seem justified. Suppose candidates 𝐴 and 𝐵 have partial histories: each has
already accepted or declined the pledge, but neither has announced whether he now recommends
cuts alone or a blend of cuts and taxes. If each wants to maximize his expected share of the
popular vote, what policy positions are best?
When the candidates finally endorse either cuts alone or cuts and taxes, they will convert
their partial histories into complete ones, and voters will judge them accordingly. Figure 10.1
presents the optimal strategies if both candidates have pledged (𝐴𝑝 vs. 𝐵𝑝), if neither candidate
has pledged (𝐴𝑛 vs. 𝐵𝑛), if only 𝐴 has pledged (𝐴𝑝 vs. 𝐵𝑛), and if only 𝐵 has pledged (𝐴𝑛 vs.
𝐵𝑝). Within each graph, the letters denote the optimal strategies, and the solid lines measure the
support 𝐴 would receive if both candidates followed their optimal strategies. The dashed lines
show the support 𝐴 would receive if 𝐴 unilaterally deviated from the equilibrium, meaning that 𝐴
switched his position on whether to address the debt with cuts alone versus cuts-and-taxes, while
𝐵 continued to play his equilibrium strategy. Because the solid lines represent optimal strategies
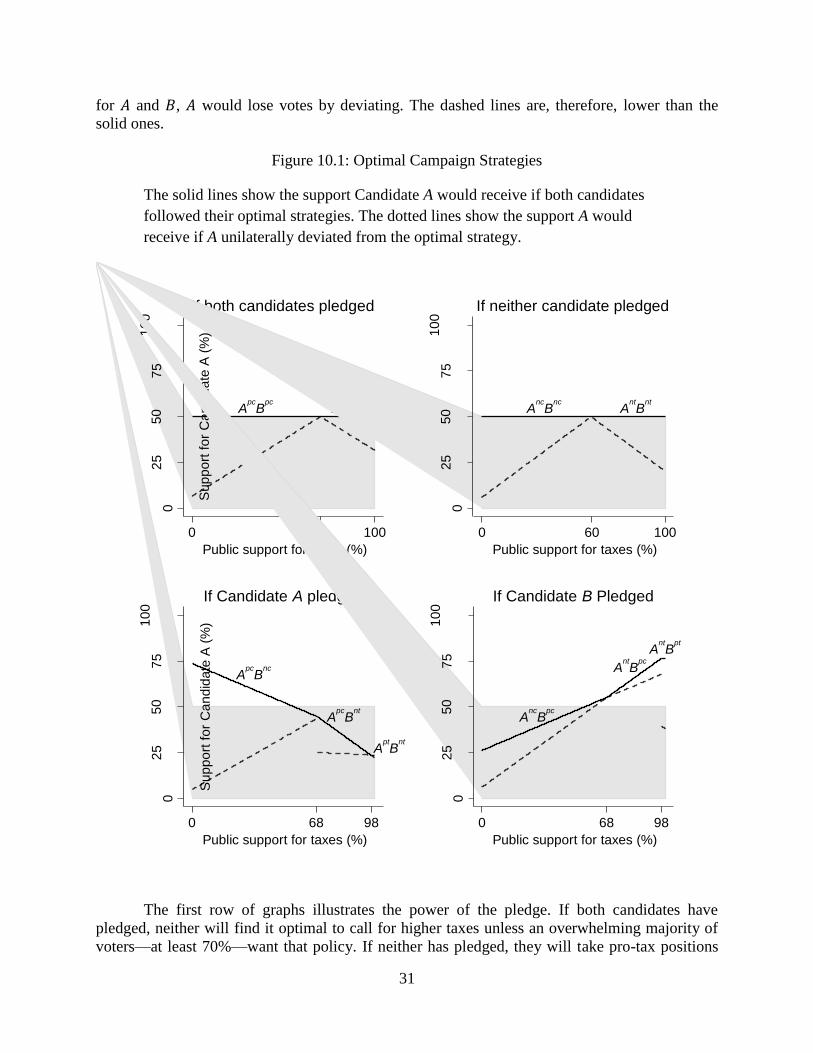
31
for 𝐴 and 𝐵, 𝐴 would lose votes by deviating. The dashed lines are, therefore, lower than the
solid ones.
Figure 10.1: Optimal Campaign Strategies
The solid lines show the support Candidate A would receive if both candidates
followed their optimal strategies. The dotted lines show the support A would
receive if A unilaterally deviated from the optimal strategy.
The first row of graphs illustrates the power of the pledge. If both candidates have
pledged, neither will find it optimal to call for higher taxes unless an overwhelming majority of
voters—at least 70%—want that policy. If neither has pledged, they will take pro-tax positions
Apc
Bpc
AptB
pt
02
55
07
51
00
Su
ppo
rt f
or
Ca
nd
ida
te A
(%
)
0 70 100
Public support for taxes (%)
If both candidates pledged
Anc
Bnc
AntB
nt
02
55
07
51
00
Su
ppo
rt f
or
Ca
nd
ida
te A
(%
)
0 60 100
Public support for taxes (%)
If neither candidate pledged
Apc
Bnc
Apc
Bnt
AptB
nt
02
55
07
51
00
Su
pp
ort
fo
r C
an
did
ate
A (
%)
0 68 98
Public support for taxes (%)
If Candidate A pledged
Anc
Bpc
AntB
pc
AntB
pt
02
55
07
51
00
Su
pp
ort
fo
r C
an
did
ate
A (
%)
0 68 98
Public support for taxes (%)
If Candidate B Pledged
32
whenever public sentiment for taxes is at least 60%. Thus, the critical level of public support for
taxes—the level at which it would become optimal for both candidates to agree on higher taxes,
rather than cuts alone—is substantially higher when the candidates have pledged than when they
have not. Put another way, the pledge makes candidates less responsive to public opinion; it
locks candidates into anti-tax positions even when a large majority of voters want higher taxes.
The second row of graphs shows that the pledge is even more potent when one candidate
has pledged and the other has not. In such a situation, the pledged candidate will maintain his
anti-tax stance unless at least 98% of voters want higher taxes. The pledge binds tightly because
breaking it would alienate voters who want cuts alone, without attracting voters who want higher
taxes. Indeed, some voters who want cuts alone would shun the pledged candidate for breaking
his promise, and cast their votes for the unpledged candidate instead. Meanwhile, voters who
want higher taxes would continue to prefer the unpledged candidate for having better character,
even though on average they see both candidates as equally credible advocates of the pro-tax
position.
Remarkably, the pledge also heightens the incentive for the unpledged candidate to take a
cuts-only position. With the pledged candidate pinned to the right side of the policy space, the
unpledged candidate can maximize his votes by shifting right, thereby stealing voters from the
pledged candidate. In equilibrium, the unpledged candidate will not call for higher taxes unless at
least 68 percent of voters want that outcome. This value is substantially higher than 60, the point
at which pro-tax policies become optimal when neither candidate has pledged, and is quite close
to the 70 percent threshold when both have pledged. Thus, the pledge not only ties the hands of
signatories, but also encourages nonsignatories to recommend cuts only, even when as much as
68 percent of voters would prefer to increase taxes.
In conclusion, our experiments suggest that pledge signatories would almost never find it
electorally optimal to break the “no new taxes” pledge. In the most likely general election
scenario, pitting a pledged Republican against an unpledged Democrat, breaking the pledge
would hurt the Republican’s electoral prospects unless nearly all voters wanted higher taxes. Had
the same Republican abstained from pledging, he would have found it electorally profitable to
advocate higher taxes if as few as 60% of voters wanted that outcome. Hence, the pledge is quite
effective at locking politicians into anti-tax positions.
Convincing candidates to pledge may prove difficult, given that pledging could bind
them to positions they might want to abandon in the future. Nevertheless, the electoral pressure
to sign can be overwhelming, especially during partisan primaries. As Grover Norquist
explained, “It is difficult to imagine winning a Republican primary without having signed the
pledge.” Many Republicans took the Taxpayer Protection Pledge presumably because they
viewed it as necessary for their party’s nomination. Pledges proliferate during primaries because
the groups that sponsor pledges have preferences that are disproportionately popular with one
political party or the other. As the electorate sorts into increasingly homogeneous partisan camps
(Abramowitz 2010; Levendusky 2009), we expect pledges to become even more widespread in
the future.
33
CHAPTER 11: 2012 AND BEYOND
In this chapter we discuss the normative implications of how voters react to candidates who
change their positions. We weigh the negative consequences for democratic responsiveness
against the positive implications for democratic accountability. We also consider how the policy
histories of candidates played a role in the 2012 presidential election, and examine how the
positions the candidates adopted and the pledges they made during the election will shape policy
and politics going forward.
34
REFERENCES
Adams, James, Michael Clark, Lawrence Ezrow, and Garrett Glasgow. 2006. “Are Niche Parties
Fundamentally Different from Mainstream Parties? The Causes and the Electoral
Consequences of Western European Parties’ Policy Shifts, 1976–1998.” American
Journal of Political Science 50:513–529.
Adams, James, Lawrence Ezrow and Zeynep Somer-Topcu. 2011. “Is Anybody Listening?
Evidence That Voters Do Not Respond to European Parties’ Policy Statements During
Elections.” American Journal of Political Science 55:370–382.
Adams, James and Zeynep Somer-Topcu. 2009. “Moderate Now, Win Votes Later: The
Electoral Consequences of Parties’ Policy Shifts in 25 Postwar Democracies.” The
Journal of Politics, 71:678–692.
Egan, Patrick. 2009. “Issue Ownership and Representation: A Theory of Legislative
Responsiveness to Constituency Opinion.” Typescript.
Downs, Anthony. 1957. An Economic Theory of Democracy. New York: Harper Collins.
Kinder, Donald R., Mark D. Peters, Robert P. Abelson, and Susan T. Fiske. 1980. “Presidential
Prototypes.” Political Behavior 2(4):315-23.
Petrocik, John R. 1996. “Issue Ownership in Presidential Elections, with a 1980 Case Study."
American Journal Of Political Science 40:825-850.
Sniderman, Paul M. and Edward Stiglitz. 2012. The Reputational Premium: A Theory of Party
Identification and Policy Reasoning. Princeton: Princeton University Press.
Tavits, Margit. 2007. ‘‘Principle versus Pragmatism: Policy Shifts and Political Competition.’’
American Journal of Political Science 51:151–65.