Embed Size (px)
Citation preview
www.hks.harvard.edu
Political Campaigns and Big
Data
Faculty Research Working Paper Series
David W. Nickerson University of Notre Dame
Todd Rogers Harvard Kennedy School
November 2013 RWP13-045
Visit the HKS Faculty Research Working Paper Series at: http://web.hks.harvard.edu/publications
The views expressed in the HKS Faculty Research Working Paper Series are those of the author(s) and do not necessarily reflect those of the John F. Kennedy School of Government or of Harvard University. Faculty Research Working Papers have not undergone formal review and approval. Such papers are included in this series to elicit feedback and to encourage debate on important public policy challenges. Copyright belongs to the author(s). Papers may be downloaded for personal use only.

Political Campaigns and Big Data
David W. Nickerson
Todd Rogers
Words: 7,085
ABSTRACT (145 words):
Modern campaigns develop databases of detailed information about citizens to inform electoral strategy
and to guide tactical efforts. Despite sensational reports about the value of individual consumer data,
the most valuable information campaigns acquire comes from the behaviors and direct responses
provided by citizens themselves. Campaign data analysts develop models using this information to
produce individual-level predictions about citizens’ likelihoods of performing certain political behaviors,
of supporting candidates and issues, and of changing their support conditional on being targeted with
specific campaign interventions. The use of these predictive scores has increased dramatically since
2004, and their use could yield sizable gains to campaigns that harness them. At the same time, their
widespread use effectively creates a coordination game with incomplete information between allied
organizations. As such, organizations would benefit from partitioning the electorate to not duplicate
efforts, but legal and political constraints preclude that possibility.
David W. Nickerson, PhD, is associate professor of political science at the University of Notre Dame. He
discloses that he served as the “Director of Experiments” in the Analytics Department in the 2012 re-
election campaign of President Obama.
Todd Rogers, PhD, is assistant professor of public policy at Harvard Kennedy School of Government. He
discloses that he co-founded Analyst Institute, which uses field experiments and behavioral science
insights to develop best practices in progressive political communications.

As recently as twenty years ago, a “numbers driven campaign” implied that candidates and their
advisors paid close attention to poll numbers and adjusted policies in response to surveys.1 Presidential
campaigns targeted states based on historical notions of which states were “swing” (i.e., could go either
way) and budget realities. In contrast, contemporary political campaigns amass enormous databases on
individual citizens and hire campaign data analysts to create models predicting citizens’ behaviors,
dispositions, and responses to campaign contact. This new technology allows campaigns to
simultaneously target campaign outreach tactically at particular individuals and aggregate these
predictive estimates up to the jurisdiction-level to inform large-scale strategic decisions. This new form
of data-driven campaigning gives candidates and their advisors powerful tools for plotting electoral
strategy.
Reactions to this new approach to campaigning have ranged from over-hyping the performance
of the tools (Scherer 2012) to alarmist concerns about personal privacy (Duhigg 2012). Given that
campaigns view their analytic techniques as secret weapons to be kept out of the hands of opponents,
the public discourse on campaign data has been largely speculative and somewhat hypothetical. This
manuscript describes contemporary campaign data analytics. It begins by explaining why campaigns
need data and where it comes from. It then describes the techniques used to analyze political data and
provides rough bounds on the utility of the predictive models campaigns develop with it. We conclude
by noting several challenges facing campaigns as data analytics become more widely used and
increasingly accurate.
1 A notorious example of this behavior was Dick Morris fielding a poll to choose Jackson Hole, Wyoming as the
vacation spot for President Clinton (Kuhn 2007).
Why do campaigns need data?
Contemporary campaigns use data in a number of creative ways, but the ultimate purpose of
political data has been – and will be for the foreseeable future – simply providing a list of citizens to
contact. At minimum, campaigns need accurate contact information on citizens, volunteers, and
donors2. Procuring and maintaining large databases of citizens with up-to-date information from
multiple sources may seem straightforward, but it is a nontrivial logistical hurdle and requires
substantial financial commitment. Campaigns would like to record which citizens engage in specific
campaign-supporting actions like donating money, volunteering, attending rallies, signing petitions, or
expressing support for candidates or issues in tracking polls. All of this retrospective data requires
tracking citizens over time, which is difficult because people frequently change residences and contact
information (Nickerson 2006a). Campaigns also need to track their own behavior to prevent awkward
interactions with citizens who have been contacted multiple times previously.
Campaigns also use data to construct predictive models to make targeting campaign
communications more efficient and to support broader campaign strategies. These predictive models
result in three categories of “predictive scores” for each citizen in the voter database: behavior scores,
support scores, and responsiveness scores. Behavior scores use past behavior and demographic
information to calculate explicit probabilities that citizens will engage in particular forms of political
activity (e.g., donate, volunteer or attend a rally for the campaign).
Support scores predict the political preferences of citizens. Ideally campaigns would contact
every citizen and ask them about their candidate and issue preferences. However, this is not feasible, so
campaigns contact a subset of citizens and use their responses as training data to develop models that
predict the preferences of the rest of the citizens who are registered to vote (i.e., “support scores”).
2 The Federal Election Commission requires campaigns and coordinated committees to disclose the identity of all
individuals who contribute more than $200 during the calendar year. These disclosure requirements mean that campaigns have a legal requirement – as well as financial incentive – to maintain good lists of donors.

These support scores typically range from 0 – 100 and generally are interpreted to mean “if you sample
100 citizens with a score of X, X% would prefer the candidate/issue”. A support score of “0” means that
no one in a sample of 100 citizens would support the candidate/issue, “100” means that everyone in the
sample would support the candidate/issue, and “50” means that almost exactly half of the sample
would support the candidate/issue. Support scores only predict the preferences at the aggregate-level,
not the individual-level. That is, people with support scores of 50 are not necessarily undecided or
ambivalent about the candidate/issue and, in fact, have preferences. When citizens have support scores
of 50 it simply reflects the fact that it is difficult to predict their political preferences. Constructing these
support scores saves campaigns the time and cost of collecting the political preferences of every citizen
in the electorate.
Behavior scores and support scores predict the behaviors and preferences of citizens, but
predicting how citizens will respond to campaign outreach is another matter altogether. While there are
theoretical rationales as to who might be most responsive to blandishments to vote (Arceneaux and
Nickerson 2009) and attempts at persuasion (Hillygus and Shields 2008), in general, predicting which
individuals will be most and least responsive to particular direct communications in a given electoral
context is difficult. Campaigns can use field experiments to measure the response to a campaign tactic
(Gerber and Green 2000, 2008; Nickerson and Rogers 2010; Arceneaux and Nickerson 2010; Nickerson
2005; Nickerson, Friedrichs, and King 2006; Bryan, Walton, Rogers and Dweck 2011; Gerber and Rogers
2009; Bailey, Hopkins and Rogers 2013; Rogers and Nickerson 2013). The results of these experiments
can then be analyzed to detect and model heterogeneous treatment effects (Issenberg 2012a, 2012b,
2012c). The citizens found to be especially responsive to the campaign treatment in the pilot
experiments – as reflected in the responsiveness score – can be targeted during a larger roll out of the
campaign treatment. Conversely, citizens who are unresponsive, or are predicted to respond negatively,
can be avoided by the campaign. Hence, responsiveness scores are an important third type of predictive
score created by campaign data analysts.
Campaigns are primarily concerned with whether predictive scores accurately predict the
behaviors, preferences, and responses of individual citizens, so the goal of predictive scores is not
theory testing. As a result, the variables included in the construction of these scores often have thin
theoretical justifications. That said, the more theoretically motivated the variables used to develop
predictive scores, the greater their external validity. A variable in a training data set that is found to
predict an outcome of interest but has no theoretical rationale for the relationship is more likely to
prove to be spurious when validated against in an “out-of-sample” dataset. Thus, successful predictive
scores need not be based on theories, but campaign data analysts must think critically and creatively
about what variables sensibly relate to their outcomes of interest in order to generate predictive scores
with the external validity required by campaigns.
Where does campaign data come from?
In the recent past, campaigns struggled to manage and integrate the various sources of their
data. The data collected by those working on digital communications rarely linked with the data
collected by those working on field operations (i.e., canvassing, phone calls, volunteer recruitment, etc.)
or fundraising. One of the most heralded successes of the 2012 campaign to re-elect President Obama
was the creation of Narwhal, a program that merged data collected from these three sources (digital,
field and financial) into one database (Gallagher 2012; Madrigal 2012).
But where does campaign data come from? The foundation of voter databases is the publicly
available official voter files maintained by Secretaries of State, which ensure that only eligible citizens
actually cast ballots and that no citizen votes more than once.3 The official voter file contains a wide
range of information. In addition to personal information such as date of birth and gender4, which are
often valuable in developing predictive scores, voter files also contain contact information such as
address and phone. More directly relevant to campaigns, all citizens’ past electoral participation is also
recorded on official voter files. Who citizens vote for is secret, but whether citizens vote is reflected in
official voter files – as is the method used to vote (e.g., in person on Election Day, absentee, or early).
This past vote history information tends to be the most important data in the development of turnout
behavior scores.
The geographic location of citizens’ residences can also provide valuable information for
campaigns by allowing them to merge relevant census and precinct data to the information on citizens
in the voter database. Census data, such as average household income, average level of education,
average number of children per household, and ethnic distribution is useful for the development of a
range of predictive scores. Campaign data analysts also append the aggregated vote totals cast for each
office and issue in past elections in each citizen’s precinct to individual voter records in the voter
database. Even being mindful of ecological fallacies, this aggregate-level information tends to provide
significant increases in predictive score accuracy.
Campaign data analysts also tend to append two types of data from consumer databases. First,
and most essentially, they append updated phone numbers. Phone calls are a critical feature of
campaigns. While a volunteer knocking on doors will make successful contact with 2 – 4 people/hour, a
volunteer making phone calls can reach 10–15 people/hour (Nickerson 2006b; 2007a).5 While most
3 The exception to this rule is North Dakota, which does not have a voter registration system. Eligible voters simply
show up and prove their eligibility by showing a valid ID, utility bill, or having a neighbor vouch for their residency. 4 In states that were subject to the Voting Rights Act, the self-identified race of the registrants is included on
official voter files, though this may change in light of the Supreme Court’s ruling in Shelby County v. Holder. 5 Using an automated dialer, these numbers can be even higher.
official voter files contain phone numbers, they are often out of date and coverage is incomplete6. This
tends to make the more accurate contact information available from consumer data firms a worthwhile
investment. Campaigns can also purchase a wide range of additional information from consumer data
vendors, such as estimated years of education, home ownership status, and mortgage information to
use in developing support scores. In contrast, information on magazine subscriptions, car purchases,
and other consumer tastes are relatively expensive to purchase from vendors, and also tend to be
available for very few individuals. Given this limited coverage, they tend to not be useful in constructing
predictive scores for the entire population so campaigns generally limit the consumer data purchased.
While campaigns purchase some information, the vast majority of the useful information
campaigns collect about individuals is provided from individuals directly. For example, those who have
donated and volunteered in the past are high-value prospects for fundraising and volunteer-recruitment
in the future. Moreover, the attributes of these individuals can be used to develop behavior scores to
identify others who may be likely to donate or volunteer. Similarly, information about individuals who
answered the phone or door in the past can be used to develop behavior scores for others who may be
likely to be contactable moving forward. Data from online activities can be useful as well because it
provides a lower threshold for activity. For the small set of citizens who provide an email address to the
campaign to receive campaign emails, all of their email activity (e.g., sign up, opening emails, clicking
links in emails, taking actions like signing petitions) can be tracked and used to predict levels of support
for the candidate or focal issue, likelihood of taking action, and in many cases policy areas of greatest
interest (e.g., voter opens emails about taxes twice as often as any other topic). Thus, a competent
6 The fact that citizens stay registered to vote after they initially fill out a voter registration form is likely good for
civic participation. That said, it means that the phone numbers listed in official voter files could easily be 20 years out of date.
state party or political organization can compile valuable information for developing predictive scores
just by maintaining accurate records of its interactions with citizens over time.7
In short, despite overblown claims about the information that campaigns purchase about
individuals, very little of the information that is most useful to them is purchased. Official voter files are
public records, census and precinct-level information are also freely available, and individual citizens
themselves volunteer a wealth of data that can be used to develop scores that predict all citizens’
behaviors and preferences.8 The most important piece of information campaigns purchase tends to be
phone numbers – and this is purchased with the intent of performing the old-fashioned task of calling
citizens directly.9
An interesting result of the type of data that campaigns acquire (directly from citizens) is that
campaigns are able to accurately predict which citizens will support their candidates and issues better
than which citizens will oppose their candidates or issues. Information regarding citizens who donate,
volunteer, and subscribe to email lists is available to campaigns and can be used to predict which other
citizens will be similar. In contrast, citizens who perform similar behaviors for opposing campaigns
cannot be observed, so discriminating among the citizens who do not actively support a campaign is a
much more challenging task. This information asymmetry likely increases the cost effectiveness of
mobilizing known supporters relative to reaching out to non-supporters. Relatedly, because the
foundations of voter databases are official voter files from states, campaigns tend to have much more
information on citizens who have voted and are registered than citizens who have never voted and are
not registered. This likely exacerbates the inequality in campaign communication and outreach
7 Anecdotally, politicians with good memories have done this for years and benefitted electorally. The task is to
now automate the memory task and perform it on a large scale. 8 In fact, predictive scores can often allow campaigns to more accurately estimate citizen preferences and
behaviors than direct reports from citizens themselves (Ansolabehere and Hersh 2012). 9 Because the most useful information tends to be collected directly from citizens, one of the most valuable data
acquisition activities campaigns engage in is exchanging their information with that of other allied political organizations (when legal) to increase the breadth and scope of data that will useful for the development of predictive scores.
between those who are already politically engaged and those who are not, and between voters and
non-voters (Rogers and Aida 2013).
How do campaigns analyze data to develop predictive scores?
As recently as a decade ago the techniques to predict citizen tendencies were extremely
rudimentary. Citizens’ likely support was gauged primarily by party affiliation and the “performance” of
the precinct in which they lived (i.e., what % of the precinct has voted for a given party in the recent
past). Citizens’ likely turnout was often based on the past four general elections (e.g., it was not
uncommon to hear phrases like “2 of 4 voter” or “3 of 4 voter” used in campaign targeting plans). Past
donors would be recontacted and asked for a flat amount of money (or perhaps asked for their highest
previous contribution, if that information was available) and prior volunteer captains would be
recontacted, but intermittent volunteers were unlikely to appear on any lists. In short, campaigns relied
on very rough – though often useful – heuristics.
If most of the information required to construct the valuable predictive scores described in the
prior section was freely available, why did campaigns take so long to realize the value of resources they
already possessed? Part of the answer is technological: adequate storage and computing power
required large investments and were beyond the infrastructure of nearly all campaigns and state parties.
Even if an entrepreneurial campaign made that investment, some of the data available to it would not
have been as reliable as it is today. States were not required to keep electronic copies of which citizens
voted in each past election until 200210, so the development of predictive scores would have been
onerous in many regions. But these explanations do not fully account for why campaigns did not more
fully use statistical tools and the data available since campaigns already possessed information on
10
Help America Vote Act of 2002, 42 U.S.C. § 15483.
citizens’ preferences (which was collected directly from citizens), and census information was no less
accurate a decade ago.
The biggest impediment to wider adoption of data-driven campaigning was simply that
statistical thinking – and the human capital that supports it – had not taken root in the world of political
consulting. Campaign consultants generate most of their business through social networks and are
judged by win/loss records. Political candidates are typically trained in non-quantitative fields (e.g., law,
education, medicine) and are more focused on fundraising and voter outreach than the nitty-gritty of
managing a campaign. There were certainly consultants specializing in campaign data analytics, and the
development of predictive scores existed as a niche business,11 but most campaign decisions did not rely
on these approaches. Simply put, there were too few people with the skills required to make a
noticeable impact on how campaigns operated, and too few decision-makers equipped to appreciate
the effect they could have.
Most of these impediments to data-driven campaigning have changed in recent years. The costs
of purchasing, storing, managing, and analyzing data have decreased exponentially. The supply of
quantitatively oriented political operatives and campaign data analysts has increased as predictive
analytics has gained footholds in other sectors of the economy (e.g., banking, consulting, marketing, e-
commerce). A large cost for campaigns was purchasing citizen information from vendors, which led the
national parties to eventually construct, maintain, and regularly augment their own voter databases
(McAuliffe and Ketten 2008, p. 280-287). These conditions were fertile ground for analytically-minded
consultants to apply statistical tools to campaign activities and campaign data.
Most of the analytic techniques employed by campaign data analysts are taught in standard
undergraduate econometrics classes. Currently, the vast majority of the predictive scores used by
11
Mail vendors were on the cutting edge of using consumer data for modeling purposes and at least a decade ahead of the curve (see Malchow 2003).

campaigns are created by a campaign data analyst (or a team of them) using simple regression
techniques: ordinary least squares for continuous outcomes; logistic regression for binary outcomes;
and, rarely, tobit for truncated data like dollars donated or hours volunteered. The advantage of these
regression techniques is that the skills necessary for developing them are widespread and the models
can easily be customized to specific political environments. For instance, party registration is not
predictive of candidate preference for older citizens in many Southern states because the South was
historically solidly Democratic and remained so at the state-level well after the Civil Rights Movement
transformed the national political environment. Campaign data analysts modeling candidate support in
these states need to be attuned to contextual facts like this, and can then easily accommodate them in
regressions.
There are two major downsides to using regression techniques for constructing campaign
models. First, the technique is highly dependent on the talent of the particular campaign data analyst
employing it. A capable campaign data analyst who is familiar with the variables available in voter
databases can generate highly accurate predictive scores for citizens. However, a slightly less capable
campaign data analyst might generate predictive scores that are only slightly better than the
unsophisticated methods employed by earlier campaigns. Since people with experience running
campaigns rarely have experience or expertise in data analytics, the competence of the campaign data
analysts they employ cannot be taken for granted. The second downside with using simple regression
techniques is that they provide few economies of scale. While individual campaign data analysts likely
become more efficient with each successive model they develop, they will often have to construct
unique models for different regions, issues, and candidates. This means that constructing models for
multiple races around the country either requires a small army of campaign data analysts, or settling for
very general national models that are not adapted for local contexts.
Machine learning can address both problems that arise from the skills of campaign data analysts
and the need for economies of scale operating across multiple electoral contexts. As a result, data
mining algorithms have become increasingly popular among campaign data analysts. While clustering
and classification algorithms (e.g., k-means clustering or k-nearest neighbor classifiers, see Gan, Ma, and
Wu 2007) and other forms of unsupervised learning are used in the marketing industry to divide
consumers into categorical types (e.g., “blue collar, grilling, SUV owner”), these statistical methods are
less useful for campaign data analysts because campaign planning often requires having individual-
specific probabilities for particular outcomes on which to make strategic cost-benefit decisions (e.g.,
68% of citizens in this category support a candidate or issue). For this reason, supervised learning
algorithms are typically more appropriate for the task of modeling political data.
Supervised machine learning, such as classification and regression trees (Breiman et al. 1984) 12,
presents three major advantages for campaigns. First, these classes of estimators are typically non-
linear, so commonly known curvilinear relations such as age and partisanship are easily accommodated
by the algorithms, obviating the need to answer theoretical puzzles about interactions and non-linear
relationships. Second, they minimize campaign data analyst discretion so the quality of the models
generated is not as heavily dependent on the capabilities and integrity of analysts. People constructing
the models still need to input the most diagnostic variables and set up rigorous out-of-sample tests to
validate the models, but the algorithms are written in advance and run identically for every citizen in the
voter database so the models can have greater robustness to variations in campaign data analyst
capability. Finally, these data-mining algorithms are relatively scalable. Some techniques may be
computationally intensive and the variables included may need to be customized, but, generally, the
12
“Random forests” (Breiman 2001) is a particularly popular decision tree ensemble algorithm because it has very few tuning parameters and is available as an R-package. This means that analysts with little formal education in statistics can develop the models with very little training. Bayesian Additive Regression Trees (BART) have similar advantages (Chipman, George, and McCollough 2010; Green and Kern 2011).

marginal cost of constructing additional models is lower using these algorithms than having a campaign
data analyst construct new models from similar databases using regression techniques.
The major downside of these algorithms from the campaign’s perspective is that their use is
relatively new and not widespread, so customizing the tuning parameters to political requirements may
not be possible in real-time.13 Typically there is not sufficient data from any jurisdiction to create a
unique model, so the data needs to be pooled with the other jurisdictions to gain precision. Most
algorithms can be adapted to accommodate jurisdiction specific political requirements but only a small
fraction of campaign data analysts today have the necessary skillset. As campaign data analytics
becomes more common, sophisticated, and mature, the techniques most widely used will likely move
away from those based on regression to those based on customized machine learning algorithms.
How Are Predictive Scores Used?
The primary utility of predictive scores for campaigns is in increasing the efficiency of efforts to
communicate with citizens. The value of these efficiency gains is simplest to present for fundraising
calls. Professional fundraising phone banks typically charge $4 per completed call (i.e., getting through
the entire script) regardless of how much is donated in the end. Suppose a campaign does not use
predictive scores and finds that it makes an average of $10 per completed call. In one sense the
campaign is doing well since it makes an average of $6 per call. However, the strategy is likely to be
inefficient since many of the citizens who are targeted donate nothing even after completing the call.
Suppose further that upon completion of the call 60% give nothing, 20% give $10, 10% give $20, and
10% give $60. Assuming the campaign sampled a diverse pool of citizens for the initial calls, it can look
through the voter database that includes all citizens it solicited for donations and all the donations it
actually generated and the use other variables in the database such as past donation behavior, past
volunteer activity, candidate support score, predicted household wealth, and census-based
13
Analysts must also take great care to not overfit their models to their data (Dietterich 1995)

neighborhood characteristics (Tam Cho and Gimpel 2007) to develop a fundraising behavior score that
predicts the expected return for a call to a particular citizen. These scores are probabilistic, as it would
be impossible to only call citizens who would donate $60, but large gains can quickly be realized. For
instance, if a fundraising score eliminated half of the calls to citizens who would donate nothing,14 the
expected revenue from each call would increase from $10 to $17.50, which is an increase of 75% in
revenue and 125% in net income from each call. Fundraising scores that increase the proportion of big
donor prospects relative to small donor prospects would further improve on these efficiency gains.
The exact same efficiency logic can be applied to how to target expenditures for voter
mobilization and persuasive communications. Targeting persuasive communications to citizens who are
extremely unlikely to vote is inefficient. Even if the persuasive communication were effective at
convincing these citizens to support the campaign’s candidate or issue, this preference change would be
of little value when the newly persuaded person failed to cast a ballot.15 A similar logic could be applied
to citizens who are extremely likely to support a campaign’s candidate or issue. Imagine that the
support score predicts that a citizen is 98% likely to support a campaign’s candidate or issue. One might
reasonably assume that the marginal returns to targeting persuasive communications to this citizen is
relatively low because the citizen’s support likelihood is near the ceiling. Assuming the opposing
campaign’s activities will not meaningfully undermine this citizen’s support likelihood, one might
assume that persuasive communications would be better targeted to citizens who have a moderate or
low likelihood of supporting the campaign’s candidate or issue, and a high likelihood of voting. Relying
on turnout scores and support scores to target persuasion efforts in this manner represents an increase
in efficiency just as fundraising scores improve the cost effectiveness of fundraising calls.
14
The resulting distribution would be 30% donate $0, 35% donate $10, 17.5% donate $20, and 17.5% donate $60. 15
This logic assumes that changing citizens’ candidate or issue preferences does not meaningfully change their likelihood of voting. This assumption is widespread among practitioners, and little empirical evidence suggests otherwise.
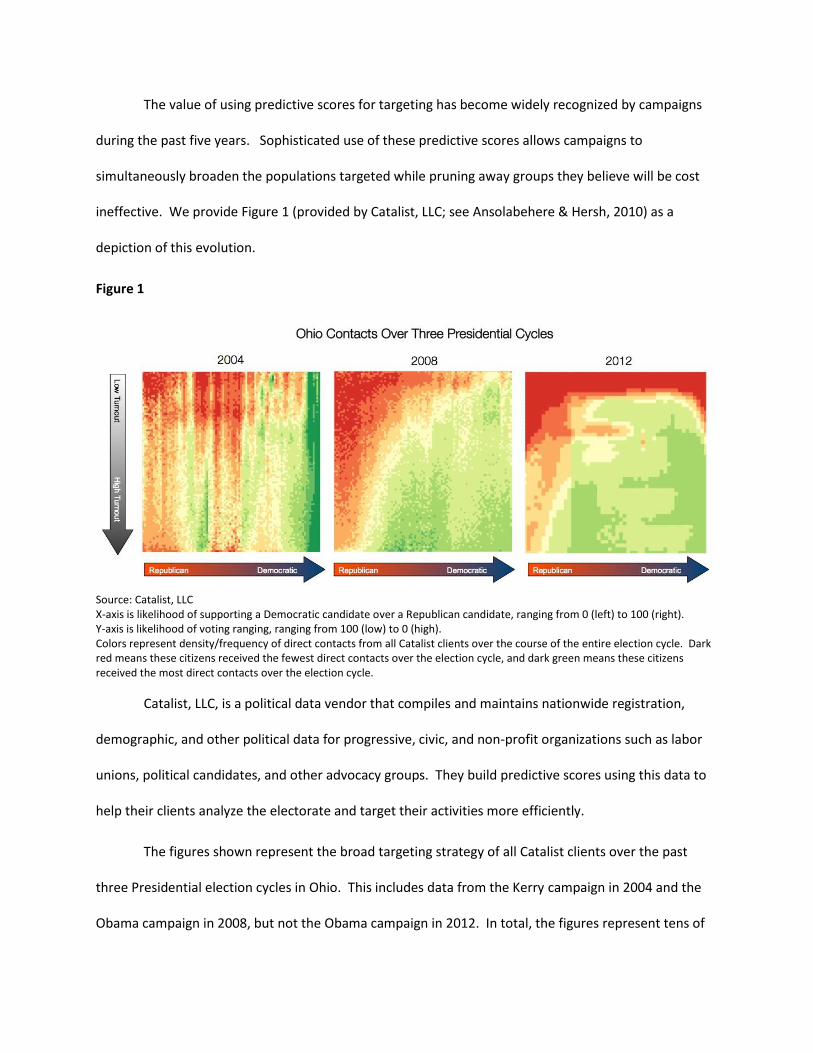
The value of using predictive scores for targeting has become widely recognized by campaigns
during the past five years. Sophisticated use of these predictive scores allows campaigns to
simultaneously broaden the populations targeted while pruning away groups they believe will be cost
ineffective. We provide Figure 1 (provided by Catalist, LLC; see Ansolabehere & Hersh, 2010) as a
depiction of this evolution.
Figure 1
Source: Catalist, LLC X-axis is likelihood of supporting a Democratic candidate over a Republican candidate, ranging from 0 (left) to 100 (right). Y-axis is likelihood of voting ranging, ranging from 100 (low) to 0 (high). Colors represent density/frequency of direct contacts from all Catalist clients over the course of the entire election cycle. Dark red means these citizens received the fewest direct contacts over the election cycle, and dark green means these citizens received the most direct contacts over the election cycle.
Catalist, LLC, is a political data vendor that compiles and maintains nationwide registration,
demographic, and other political data for progressive, civic, and non-profit organizations such as labor
unions, political candidates, and other advocacy groups. They build predictive scores using this data to
help their clients analyze the electorate and target their activities more efficiently.
The figures shown represent the broad targeting strategy of all Catalist clients over the past
three Presidential election cycles in Ohio. This includes data from the Kerry campaign in 2004 and the
Obama campaign in 2008, but not the Obama campaign in 2012. In total, the figures represent tens of
millions of voter contacts. Each panel shows the same heat map. The y-axis describes citizens’ turnout
behavior scores; citizens at the bottom are the most likely to vote in that election. The x-axis describes
citizens’ likelihoods of supporting Democratic candidates as opposed to Republican candidates; citizens
who are likely to support Republican candidates are on the left and citizens who are likely to support
Democratic candidates are on the right. Each axis is broken into 50 equally sized bins (2500 bins in
total), and each bin is colored by the intensity of direct contact the average citizen in the bin received
over the course of the election. This includes all modes of direct contact, for all purposes, across the
entire election cycle. Darker green boxes were contacted at a relatively high rate; darker red boxes at a
relatively lower rate; and shades of orange and yellow are in between.
Although Catalist's client base differed across all three cycles, the increasing sophistication of
their collective voter targeting efforts becomes evident as election cycles progress. In 2004, when few
clients relied on predictive scores for targeting, most contact was concentrated among people predicted
to support Democratic candidates, regardless of their likelihoods of voting. This meant that resources
were probably inefficiently allocated on likely Democratic supporters on both ends of the turnout
spectrum: those who were extremely unlikely to vote (top of the left panel) and those who were
extremely likely to vote and did not require mobilization (bottom of the left panel). The efforts at
persuading citizens not likely to support Democratic candidates are evident, but sparse relative to the
intense concentration on those who were predicted to already support Democratic candidates. There
appears to have been considerable room for improvement.
In 2008, Catalist clients appear to have widely employed predictive scores (see middle panel).
The highest concentrations of direct contacts were observed among citizens predicted to support
Democratic candidates with low likelihoods of voting (they might have been reasonable voter
mobilization targets) and high turnout citizens with middling partisanship scores (who might have been

reasonable "persuasion" targets).16 As a result, the targeting appears much closer to campaign targeting
strategies presumed to optimal than were observed in 2004.
The figure reflecting 2012 (see right-most panel) is similar to that of 2008 except with smoother
transitions and more consistency across the landscape, suggesting even wider adoption of predictive
scores for targeting. One noticeable difference between the 2012 figure and those of previous cycles is
that Catalist clients appear to have avoided communicating with citizens with the lowest turnout
probabilities. Catalist’s clients may have chosen this strategy for a range of reasons, but regardless of
their strategic reasons, these figures suggest that in 2012 Catalist’s 300+ clients used predictive scores to
manifest their strategic plans in ways that they had not in previous cycles.
What Are They Worth?
Presumably organizations have adopted predictive scores because they are electorally useful.
Determining exactly how much using these scores affects electoral outcomes is difficult because the
counterfactual is unclear. Is the appropriate comparison for assessing the value of campaign analytics
between the current uses of predictive scores for targeting and the absence of targeting, or is it to
compare currents uses to the basic heuristics that were used for targeting in the recent past? Without
knowing the specifics of the estimates to be compared and the electoral context, it is difficult to
construct an estimate. That said, it is possible to derive bounds as to how much campaign analytics
could matter to campaigns.
Persuasive communications is a good place to begin because targeting is so diffuse. There are
so many possible targets (e.g., potentially all citizens) and strategies (e.g., shoring up support vs. causing
opposition supporters to defect) that persuasive campaign outreach can be directed almost anywhere
along the support score spectrum, which is why many campaigns use responsiveness scores for
16
The reasonableness of targeting these citizens for persuasion communications depends on one’s theory of who is persuadable. As discussed above, an alternative and atheoretical technique that has been refined very recently for identifying persuadable citizens is to develop responsiveness scores based on pilot experiments.

persuasive targeting (Issenberg, 2012a,b,c). Suppose a campaign’s persuasive communications has an
average treatment effect of 2 percentage points – a number on the high end of persuasion effects
observed in high-expense campaigns. That is, if half of citizens who vote planned to vote for the
candidate, 52% of voting citizens would support the candidate after the persuasive communications.
Thus, if a campaign indiscriminately attempted to persuade 8,500,000 citizens –about the size of the
Florida electorate – it would generate 170,000 votes under this scenario.
To create a stylized counterfactual for this simulated campaign, now imagine that the campaign
has created an accurate responsiveness score that predicts which citizens would be most responsive to
its persuasive communications. Based on the responsiveness score, those in the top quintile are three
times more responsive to the persuasive communications than the average citizen, the next quintile is
twice as responsive, the middle quintile is no more responsive than average, the 2nd quintile shows no
average responsiveness to the persuasive communications, and the bottom quintile actually exhibited
backlash to the persuasive communications equal to the overall average treatment effect (see Table
1).17 Actual campaign data analysts would construct a continuous responsiveness score, but this
example involving quintiles suffices for illustration.
For campaigns with the resources to contact only 20% of the electorate, the responsiveness
score allows them to create 102,000 votes (1,700,000*0.02*3 = 102,000). Without any form of targeting
the campaign would generate only 34,000 votes (1,700,000*0.02 = 34,000), so using predictive scores
improves the new vote yield by 200% (see Table 1, row 1). A better financed campaign that could
contact 40% of the electorate and would target the two most promising quintiles of the population. This
strategy would yield a total of 170,000 votes, which is a 150% increase over having no targeting
(3,400,000*0.02=68,000) (see Table 1, row 2). In this scenario, using predictive scores still improves the
17
Backlash is not an uncommon observation among field experiments examining persuasive campaign effects (e.g., Arceneaux and Kolodny 2009; Bailey, Hopkins and Rogers 2013), and among other types of experiments (Nicholson 2012; Hersh and Shaffner 2013)
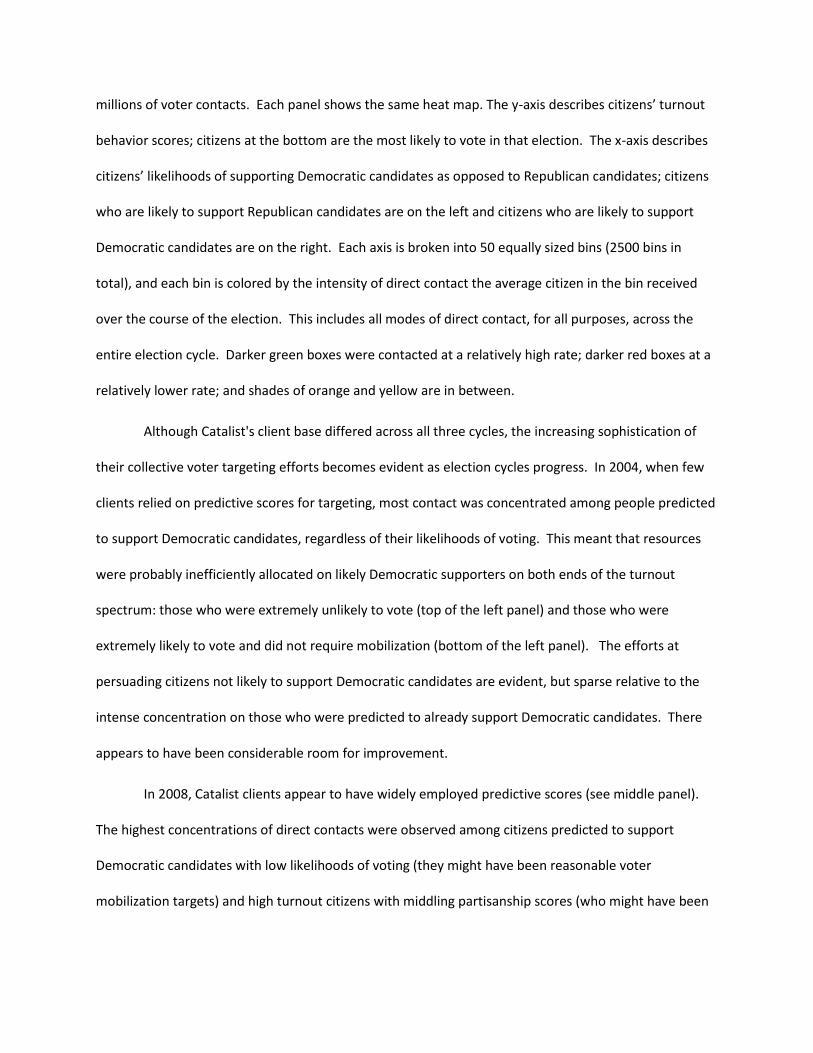
campaign’s impact, but the gain is less than that of the more resource constrained campaign. A
campaign with the resources to push up against the zero bound where additional contacts begin to cost
the campaign votes would see its efficiency improve by only 50% (see Table 1, row 4). This dynamic
means that smaller campaigns are the ones who benefit most from targeting based on predictive scores,
but they are the ones who are least able to afford hiring campaign data analysts and voter databases.
Well-financed campaigns benefit from targeting based on predictive scores, but yield smaller relative
gains over not using predictive scores for targeting.
Table 1: Hypothetical Example of Persuasion Modeling’s Value
Quintile Effect Multiplier
Votes created in quintile
Cumulative votes
Improvement over no targeting
Top 20% 3 102,000 102,000 200%
60 – 80% 2 68,000 170,000 150%
Middle 20% 1 34,000 204,000 100%
20 – 40% 0 0 204,000 50%
Bottom 20% -1 -34,000 170,000 20% The average effect of campaign contact is 2 percentage points. Electorate size is 8,500,000.
Taking these generous assumptions regarding responsiveness scores, we can set an upper
bound on their impact on campaign outcomes. If there are 8,500,000 citizens who will vote in a state
(i.e., the number of votes cast in the 2012 Presidential election in Florida) and a campaign can
successfully administer the attempted direct persuasive communications to only half the targeted
citizens because of inability to reach those citizens, then a campaign that does not use responsiveness
scores would generate 85,000 votes while a campaign that uses responsiveness scores would generate
102,000 votes through direct persuasive communications. While the difference of 17,000 votes is
notable, it constitutes only 0.2% of the overall vote. That said, it would have constituted 23% of the
74,309 vote margin of victory for the Obama campaign in 2012.
Campaigns do not want to mobilize citizens to vote who support their opponent, so one of the
most important uses for support scores is to identify which citizens should be targeted during voter
mobilization efforts. In an evenly divided electorate, indiscriminately mobilizing citizens would net zero
votes since as many opponents would be mobilized as supporters. In this setting a naïve comparison to
absolutely no targeting is not appropriate. Instead, consider the following relatively basic targeting
strategy that is still employed today in electoral settings that do not have access to modeled scores. The
campaign attempts to identify individual citizens who support their candidate or issue by directly
contacting them in person or over the phone. Imagine that this campaign can successfully reach half of
the population. For the remaining half of the population for whom the campaign has not identified a
preference, the campaign makes the assumption that being able to contact a citizen is not related to
that citizen’s support for the campaign’s candidate. The campaign proceeds to sweep through
neighborhoods where more than half of the population supports the campaign’s candidate.18 We can
therefore express the expected yield in votes from this simply targeting strategy as
0.5 (% ) if % 0.5
0.5 (% ) 0.5 (% % ) if % 0.5
N Support Support
N Support N Support Oppose Support
where , is the mobilization effect from the campaign, %Support is the level of support for the
candidate in a precinct, and N is the number of citizens who will vote in the precinct. We can now
contrast this targeting strategy to an imagined predicted support score that exhibits a rate of false
positives (i.e., misidentifying opponents as supporters) and false negatives (i.e., misidentifying
supporters as opponents) that is a function of the diversity of the neighborhood.19
18
In neighborhoods where fewer than half of the population supports the candidate, these blind mobilization sweeps would generate more votes for the opponent than the candidate. 19
The function has a peak false positive and false negative error rate of 15% in precincts where the electorate is evenly split and this error tapers linearly as the precinct becomes more informative of resident beliefs (i.e., moves away from a 50/50 split.
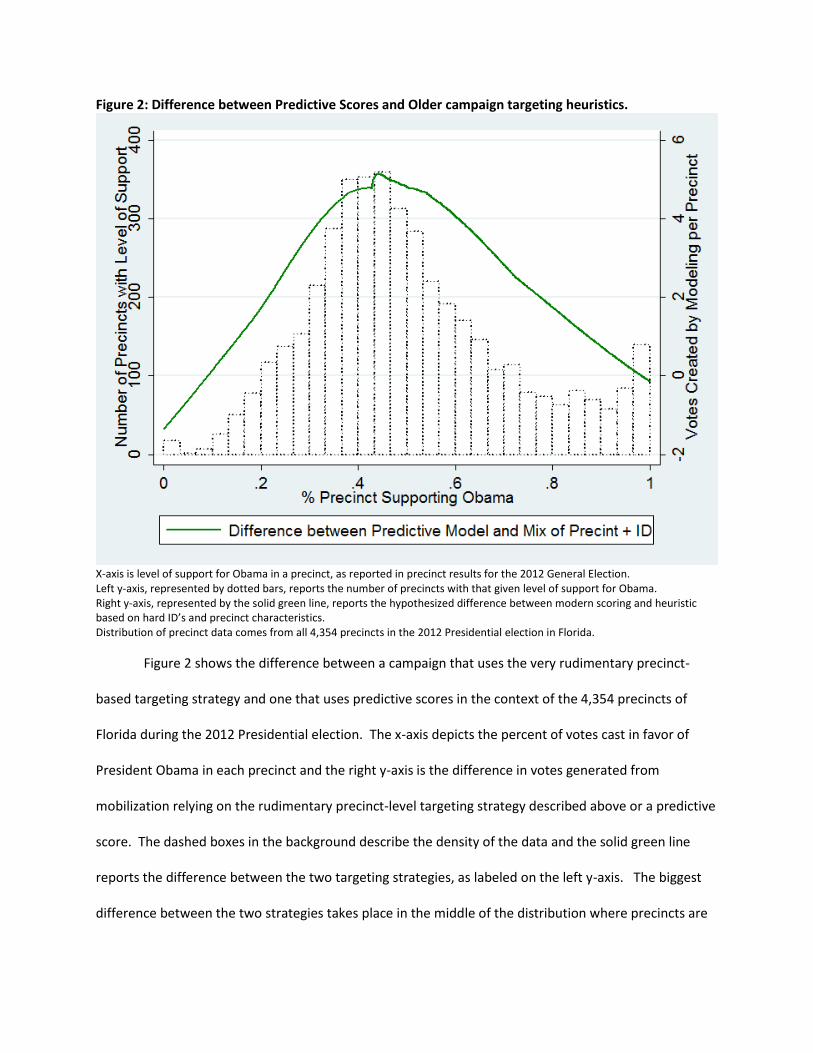
Figure 2: Difference between Predictive Scores and Older campaign targeting heuristics.
X-axis is level of support for Obama in a precinct, as reported in precinct results for the 2012 General Election. Left y-axis, represented by dotted bars, reports the number of precincts with that given level of support for Obama. Right y-axis, represented by the solid green line, reports the hypothesized difference between modern scoring and heuristic based on hard ID’s and precinct characteristics. Distribution of precinct data comes from all 4,354 precincts in the 2012 Presidential election in Florida.
Figure 2 shows the difference between a campaign that uses the very rudimentary precinct-
based targeting strategy and one that uses predictive scores in the context of the 4,354 precincts of
Florida during the 2012 Presidential election. The x-axis depicts the percent of votes cast in favor of
President Obama in each precinct and the right y-axis is the difference in votes generated from
mobilization relying on the rudimentary precinct-level targeting strategy described above or a predictive
score. The dashed boxes in the background describe the density of the data and the solid green line
reports the difference between the two targeting strategies, as labeled on the left y-axis. The biggest
difference between the two strategies takes place in the middle of the distribution where precincts are

most evenly split. The reason for this is clear when the tails are considered. In areas where support for
Obama was low, there were simply not many supporters to mobilize. In the areas where support for
Obama was high, there were many supporters to mobilize but both targeting strategies would target
these citizens and neither would mistakenly mobilize those who support the opposing campaign’s
candidate. It is in areas where the precinct-level data is not predictive of which candidate citizens
support where predictive scores at the individual-level yield the greatest value.
We can now, with assumptions, estimate the impact of the Obama 2012 mobilization effort in
Florida using the predictive scores for targeting (which was the strategy the campaign reportedly
employed) compared to a precinct-based targeting strategy. Assuming the campaign had a 2
percentage point effect on turnout among the half of the citizens that it targeted for mobilization and
successfully contacted, we estimate that it would have generated 8,525 more votes in Florida targeting
based on predictive scores relative to targeting based on precinct. This vote total would have been
decisive in the 2000 election between Bush and Gore, and still constitutes 11% of the 74,309 vote
margin of victory Obama enjoyed in 2012. Combined with the persuasion analysis above, this thumbnail
sketch makes an argument that the Obama campaign in 2012 might have lost key states had it used the
older and coarser targeting technologies, rather than the predictive scores produced by its campaign
data analysts.
Conclusion
Sophisticated campaigns develop and use voter databases that contain a range of detailed
information on individual citizens. As a result, campaign data analysts occupy an increasingly important
role in politics as they develop predictive models that produce individual-level scores that predict
citizens’ likelihoods of performing certain political behaviors, supporting candidates and issues, and
responding to targeted interventions. The use of these scores has increased dramatically since 2004, as

can be seen in the distribution and spread of campaign targets in successive Presidential campaigns.
Simulations suggest that these advances could yield sizable gains to campaigns that harness them.
Since predictive scores make campaigns more effective and efficient by increasing the cost
effectiveness of citizen communication, a broad range of organizations do and will employ the
technologies. To the extent that predictive scores are accurate and reveal true unobserved
characteristics about citizens, it means that multiple organizations will likely use predictive scores to
target the same sets of citizens. That is, some citizens might find themselves contacted many times
while other citizens might be ignored by nearly every campaign (e.g., citizens with low turnout scores in
2012). The marginal effect of the fifth or sixth contact from a campaign will be less than the marginal
effect of the first contact from a campaign. Thus, concentrating attention on the same set of citizens
due to widespread adoption of predictive scores may offset some of the gains reaped from developing
predictive scores in the first place. In this way, developing and using predictive scores creates a
coordination game where allied organizations would like to partition the electorate and not duplicate
efforts.
Coordination can happen between partisan organizations (e.g., state parties, candidate
campaigns, and coordinated campaigns) and across non-partisan activities (e.g., civil rights groups, labor
unions, and environmental groups) but partisan and non-partisan organizations are not allowed to
coordinate their electoral activities. Since it is nearly impossible to observe whom campaigns target for
direct communications (i.e., send mail, knock on doors, and make phone calls), this coordination game
has incomplete information which means that inefficiencies from overlapping contacts are inevitable.
Even when coordination is allowed by law, coalitions may have conflicting incentives. There is
enough regional variation in ideology that it is possible for local candidates to appeal to citizens who
oppose the national candidate. For instance, mobilizing citizens on behalf of Republican candidates in
liberal districts may have hurt Mitt Romney in 2012. The same dynamic plays out among non-partisan

groups as well. While labor union members and environmentalists agree on many policies and values, it
is likely that some members do not hold that same views on both labor and environmental issues.
Thus, mobilizing a set of citizens for a labor related ballot initiative might result in less support for an
environmentally friendly candidate. This tension is endemic to the very nature of the federal system of
representation and coalition politics. The tension has always been present, but now that groups can
share very detailed targeting plans and support scores, the tension bubbles to the surface more often
than in the past.

References
Ansolabehere, Stephen, and Eitan Hersh. 2010. “The quality of voter registration records: A state-by-state analysis.” Cambridge, Mass.: Department of Government, Harvard University.
Ansolabehere, Stephen and Eitan Hersh. 2012. "Validation: What Big Data Reveal About Survey Misreporting and the Real Electorate." Political Analysis 20(4):437-459.
Arceneaux, Kevin, and Robin Kolodny. 2009. "Educating the least informed: Group endorsements in a grassroots campaign." American Journal of Political Science 53.4: 755-770.
Arceneaux, Kevin and David W. Nickerson. 2009. “Who is Mobilized to Vote? A Re-Analysis of Seven Randomized Field Experiments.” The American Journal of Political Science 53(1):1-16.
Arceneaux, Kevin and David W. Nickerson. 2010. “Negative and Positive Campaign Messages: Evidence from Two Field Experiments.” American Politics Research 38(1): 54-83.
Bailey, Michael A., Daniel J. Hopkins and Todd Rogers. 2013. “Unresponsive and Unpersuaded: The Unintended Consequences of Voter Persuasion Efforts.” Working Paper. http://ssrn.com/abstract=2307631 or http://dx.doi.org/10.2139/ssrn.2307631
Breiman, Leo, Jerome Friedman, Charles J. Stone, and R.A. Olshen. 1984. Classification and Regression Trees. Boca Raton, FL: CRC Press.
Breiman, Leo. 2001. “Random Forests”. Machine Learning 45:5–32.
Bryan, Christopher J., Gregory M. Walton, Todd Rogers, and Carol S. Dweck. 2011. “Motivating voter turnout by invoking the self.” Proceedings of the National Academy of Sciences 108(31): 12653-12656.
Chipman, Hugh A., Edward I. George, and Robert E. McCulloch. 2010. “BART: Bayesian Additive Regression Trees.” Annals of Applied Statistics 4(1):266–98.
Dietterich, Tom. 1995. "Overfitting and Undercomputing in Machine Learning." ACM Computing Surveys 27(3):326-327.
Duhigg, Charles. 2012. "Campaigns Mine Personal Lives to Get Out Vote." New York Times, October 14, 2012, page A1.
Gallagher, Sean. 2012. "Built to win: Deep inside Obama’s campaign tech" Arstechnica.com, November 14, 2012. http://arstechnica.com/information-technology/2012/11/built-to-win-deep-inside-obamas-campaign-tech/
Gan, Guojun, Chaoqun Ma, and Jianhong Wu. 2007. Data Clustering: Theory, Algorithms, and Applications. Alexandria, VA: SIAM, Society for Industrial and Applied Mathematics.
Gerber, Alan, and Todd Rogers. 2009. “Descriptive social norms and motivation to vote: Everybody’s voting and so should you.” Journal of Politics 71: 1-14.
Gerber, Alan S. and Donald P. Green. 2000. “The Effects of Canvassing, Direct Mail, and Telephone Contact on Voter Turnout: A Field Experiment.” American Political Science Review 94(3):653-63.
Gerber, Alan S. and Donald P. Green. 2008. Get Out the Vote! Washington, DC: Brookings Institution Press.
Green, Donald P. and Holger L. Kern. 2011. "Modeling Heterogeneous Treatment Effects in Survey Experiments with Bayesian Additive Regression Trees." Public Opinion Quarterly 76(3):491-511.

Hersh, Eitan D. and Brian F. Schaffner. 2013. “Targeted Campaign Appeals and the Value of Ambiguity." Journal of Politics 75 (2): 520-534..
Hillygus, D. Sunshine and Todd G. Shields. 2008. The Persuadable Voter: Wedge Issues in Presidential Campaigns. Princeton, NJ: Princeton University Press.
Issenberg, Sasha. 2010. "Nudge the Vote: How Behavioral Science is Remaking Politics." New York Times Sunday Magazine, October 31, 2010, page MM28.
Issenberg, Sasha. 2012a. The Victory Lab: The Secret Science of Winning Campaigns. New York, NY: Crown Publishers.
Issenberg, Sasha. 2012b. "The Death of the Hunch." Slate, March 22, 2012. http://www.slate.com/articles/news_and_politics/victory_lab/2012/05/obama_campaign_ads_how_the_analyst_institute_is_helping_him_hone_his_message_.html
Issenberg, Sasha. 2012c. "How President Obama's campaign used big data to rally individual voters, Part 2." MIT Technology Review, December 17, 2012. http://www.technologyreview.com/featuredstory/508851/how-obama-wrangled-data-to-win-his-second-term/
Kuhn, David Park. 2007. “Vacation Politics.” CBSNews.com, December 5, 2007. http://www.cbsnews.com/2100-250_162-607234.html.
Madrigal, Alexis C. 2012. "When the Nerds Go Marching In." TheAtlantic.com, November 16, 2012. http://www.theatlantic.com/technology/archive/2012/11/when-the-nerds-go-marching-in/265325
Malchow, Hal. 2003. The new political targeting. Campaigns and Elections Magazine.
McAuliffe, Terry and Steve Kettman. 2008. What A Party!: My Life Among Democrats: Presidents, Candidates, Donors, Activists, Alligators, and Other Wild Animals. New York, NY: St. Martin's Press.
Nicholson, Steven P. 2012. “Polarizing cues.” American journal of political science 56(1): 52-66.
Nickerson, David and Todd Rogers. 2010. “Do you have a voting plan? Implementation intentions, voter turnout, and organic plan making.” Psychological Science 21(2): 194-199.
Nickerson, David W. 2005. “Partisan Mobilization Using Volunteer Phone Banks and Door Hangers,” The Annals of the American Academy of Political and Social Science 601:10-27.
Nickerson, David W. 2006a. “Hunting the Elusive Young Voter,” Journal of Political Marketing 5(3):47-69.
Nickerson, David W. 2006b. “Volunteer Phone Calls Can Increase Turnout.” American Politics Research 34(3):271-292.
Nickerson, David W. 2007a. “Quality is Job One: Volunteer and Professional Phone Calls,” American Journal of Political Science 51(2):269-282.
Nickerson, David W. 2007b. “Don’t Talk to Strangers: Experimental Evidence of the Need for Targeting.” Paper presented at the Annual Meeting of the Midwest Political Science Association, Chicago, IL, April 12-15, 2007.
Nickerson, David W., Ryan F. Friedrichs, and David C. King. 2006. “Partisan Mobilization Experiments in the Field: Results from a Statewide turnout experiment in Michigan,” Political Research Quarterly 34(1):271-292.
Rogers, Todd and Masa Aida. 2013. “Vote Self-Prediction Hardly Predicts Who Will Vote, And Is (Misleadingly) Unbiased.” American Politics Research. doi: 10.1177/1532673X13496453
Rogers, Todd and David Nickerson. 2013. “Can Inaccurate Beliefs About Incumbents be Changed? And Can Reframing Change Votes?” HKS Faculty Research Working Paper Series, RWP13-018.
Scherer, Michael. 2012. “Inside the Secret World of Quants and Data Crunchers Who Helped Obama Win.” Time, November 19, 2012, p. 56-60.
Tam Cho, Wendy K. and James G. Gimpel. 2007. "Prospecting for (Campaign) Gold." American Journal of Political Science 51(2):255-268.