Embed Size (px)
Citation preview

Policy options for electric vehicle charging infrastructure in C40 cities
For
Stephen Crolius, Director – Transportation,
Clinton Climate Initiative
Alfred Wiederer & Ronald Philip (MPP ’10)
Advisor: Prof. Jose Gomez-Ibanez
Seminar Leaders: Prof. Hermann Bennett & Dean John Haigh
Policy options for electric vehicle charging infrastructure in C40 cities | R. Philip & A. Wiederer
1
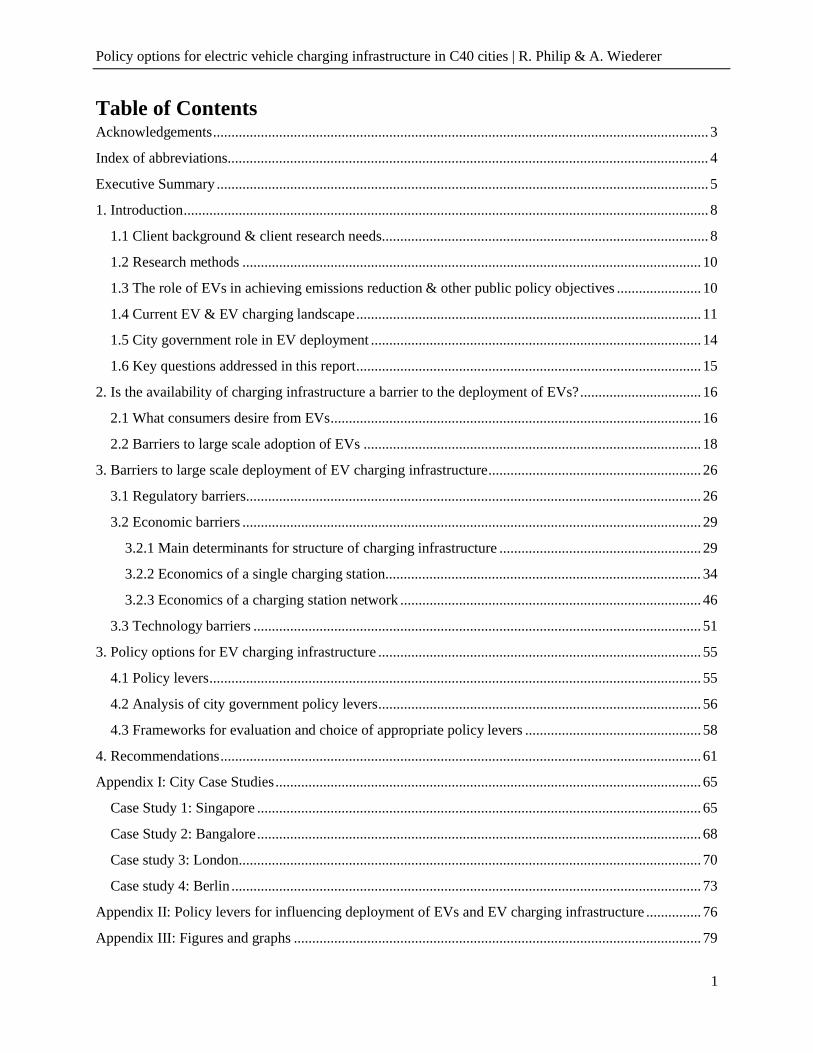
Table of ContentsAcknowledgements....................................................................................................................................... 3
Index of abbreviations................................................................................................................................... 4
Executive Summary ...................................................................................................................................... 5
1. Introduction............................................................................................................................................... 8
1.1 Client background & client research needs......................................................................................... 8
1.2 Research methods ............................................................................................................................. 10
1.3 The role of EVs in achieving emissions reduction & other public policy objectives ....................... 10
1.4 Current EV & EV charging landscape.............................................................................................. 11
1.5 City government role in EV deployment .......................................................................................... 14
1.6 Key questions addressed in this report.............................................................................................. 15
2. Is the availability of charging infrastructure a barrier to the deployment of EVs?................................. 16
2.1 What consumers desire from EVs..................................................................................................... 16
2.2 Barriers to large scale adoption of EVs ............................................................................................ 18
3. Barriers to large scale deployment of EV charging infrastructure.......................................................... 26
3.1 Regulatory barriers............................................................................................................................ 26
3.2 Economic barriers ............................................................................................................................. 29
3.2.1 Main determinants for structure of charging infrastructure ....................................................... 29
3.2.2 Economics of a single charging station...................................................................................... 34
3.2.3 Economics of a charging station network .................................................................................. 46
3.3 Technology barriers .......................................................................................................................... 51
3. Policy options for EV charging infrastructure ........................................................................................ 55
4.1 Policy levers...................................................................................................................................... 55
4.2 Analysis of city government policy levers........................................................................................ 56
4.3 Frameworks for evaluation and choice of appropriate policy levers ................................................ 58
4. Recommendations................................................................................................................................... 61
Appendix I: City Case Studies.................................................................................................................... 65
Case Study 1: Singapore ......................................................................................................................... 65
Case Study 2: Bangalore......................................................................................................................... 68
Case study 3: London.............................................................................................................................. 70
Case study 4: Berlin ................................................................................................................................ 73
Appendix II: Policy levers for influencing deployment of EVs and EV charging infrastructure ............... 76
Appendix III: Figures and graphs ............................................................................................................... 79

Policy options for electric vehicle charging infrastructure in C40 cities | R. Philip & A. Wiederer
2
Appendix IV: Bibliography ........................................................................................................................ 88
Appendix V: List of Interviews .................................................................................................................. 91
The cover page photograph is of Portland city Mayor Sam Adams announcing a collaboration with Nissan for an electric vehicle charging network in Oregon, USA. Photo source: gas2.org1

Policy options for electric vehicle charging infrastructure in C40 cities | R. Philip & A. Wiederer
3
AcknowledgementsWe would like to acknowledge and express our gratitude to a number of people who graciously
contributed their time towards this report:
Steve Crolius, Director of Transportation at the Clinton Climate Initiative (CCI), who provided us with
an exciting and challenging live public policy problem that we could analyze and make recommendations
on, and for meeting with us at regular intervals throughout the academic year to provide useful feedback
on our work and insights into his fascinating EV work around the world.
Prof. Jose Gomez-Ibanez at the Harvard Kennedy School, our Academic Advisor for our PAE, who
provided valuable feedback and suggestions on the report structure and methodology, as well as on
multiple drafts of the report.
Prof. Hermann Bennett and Dean John Haigh, at the Harvard Kennedy School, who provided useful
guidance and feedback throughout the course of the academic year.
Sarah Potts (CCI City Director, Los Angeles), who introduced Ronald to Steve Crolius at CCI.
The Ash Institute for Democratic Governance & Innovation and the Harvard Environmental
Economics Program at the Mossavar-Rahmani Centre for Business & Government, at the Harvard
Kennedy School, for funding our field travel to Singapore to study Singapore’s EV pilot program.
Miguel Brandao from the Experimental Power Grid Centre, Singapore, who connected us with the key
stakeholders involved with Singapore’s EV pilot program.
All our interviewees – listed in Appendix V – who generously gave of their time to meet with us or
speak with us over the phone.
We are very grateful.
Alfred Wiederer & Ronald Philip
MPP Class of 2010, Harvard Kennedy School
Policy options for electric vehicle charging infrastructure in C40 cities | R. Philip & A. Wiederer
4
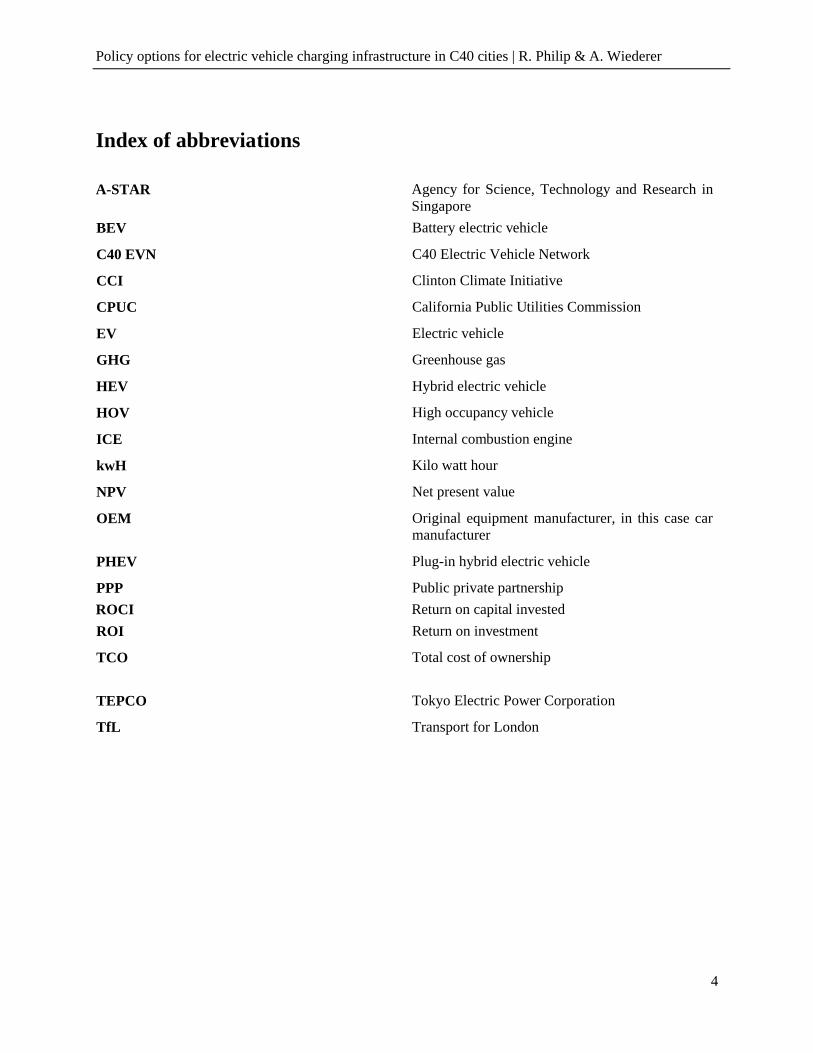
Index of abbreviations
A-STAR Agency for Science, Technology and Research in Singapore
BEV Battery electric vehicle
C40 EVN C40 Electric Vehicle Network
CCI Clinton Climate Initiative
CPUC California Public Utilities Commission
EV Electric vehicle
GHG Greenhouse gas
HEV Hybrid electric vehicle
HOV High occupancy vehicle
ICE Internal combustion engine
kwH Kilo watt hour
NPV Net present value
OEM Original equipment manufacturer, in this case car manufacturer
PHEV Plug-in hybrid electric vehicle
PPP Public private partnership
ROCI Return on capital invested
ROI Return on investment
TCO Total cost of ownership
TEPCO Tokyo Electric Power Corporation
TfL Transport for London

Policy options for electric vehicle charging infrastructure in C40 cities | R. Philip & A. Wiederer
5
Executive Summary
This Policy Analysis Exercise seeks to make policy recommendations to the Clinton Climate Initiative
(CCI), on the deployment of electric vehicle (EV) charging infrastructure in C40 cities - a group of the
world’s largest cities, which have committed to take action on climate change by reducing greenhouse
gases, including from the transport fleet. The C40 Electric Vehicle Network (C40 EVN) is a C40
initiative to facilitate the successful introduction of EVs through collective municipal actions including
planning and deployment of charging infrastructure, streamlining permitting processes associated with
charging infrastructure, providing monetary and non-monetary incentives and mobilizing demand for EVs
in city fleets.
CCI had requested us to undertake analysis and make recommendations on the deployment of EV
charging infrastructure in C40 cities. This analysis included understanding potential barriers (policy,
technological, economic, etc) to the deployment of EV charging infrastructure, understanding how
various cities were approaching the issue, and the policy levers that cities could employ in increasing the
availability of EV charging infrastructure. Based on this research, we have made a series of
recommendations on policy actions that cities can take to increase the deployment of EV charging
infrastructure.
Key recommendations
1. Cities should design EV strategies / programs that are unique to their individual circumstances,
objectives and players, but should draw on lessons from peer cities
Different cities across the world face different circumstances (in terms of parking availability, etc) and
different objectives with regard to EVs. Cities with high percentages of private off-street parking, should
focus mainly on setting a regulatory framework conducive for investment in charging infrastructure
networks, increasing EV deployment by switching public fleets to EVs and leveraging city-owned real
estate to speed up infrastructure deployment. Cities with low levels of private off-street parking can
expect to see a significantly lower EV uptake, due to less favorable economics – and might be forced to
subsidize on-street residential charging infrastructure if they want to speed up this process. Cities also
have differing objectives for EV deployment. For industry development purposes, small test-runs with the
latest technology seem appropriate, whereas wide-spread adaptation required to achieve an environmental
impact will require more elaborate planning, coordination between public and private stakeholders, public
awareness campaigns, investment in charging infrastructure, and the use of proven technologies. Each
city will have to develop its own strategy based on its unique set of objectives connected with EVs and

Policy options for electric vehicle charging infrastructure in C40 cities | R. Philip & A. Wiederer
6
charging infrastructure. There is also immense value from sharing lessons about what works and what
doesn’t in regard to charging, across cities, to overcome information deficiencies.
2. City governments have limited resources to mitigate up-front EV cost but can use other policy
levers to affect TCO of EVs
The upfront cost of EVs is the single biggest barrier to adaptation / deployment of EVs. However cities
have limited means at their disposal (if any) to influence upfront EV cost, but have other instruments at
their disposal which affect the TCO of EVs and therefore enter into the overall value equation of an EV
from a consumer’s perspective. The most prominent levers are waiving congestion charges & parking
fees, providing electricity discounts, etc.
3. Cities should use their regulatory influence smartly to create a conducive environment for
private investors of charging infrastructure – and only provide subsidies under specific
circumstances
There are several regulatory barriers to the deployment of EV charging infrastructure including permitting
of charging infrastructure, the lack of a technical standard for charging infrastructure, policy uncertainty
regarding sale of electricity, regulation regarding EV-related investment by utilities, etc. Cities which face
these regulatory barriers should address them as early as possible by building political consensus and then
mandating the relevant government agency to address each issue whether it be modifying building codes,
streamlining permitting, deciding a standard in consultation with OEMs, etc. As mentioned in Chapter 4,
city governments hold a comparative advantage in zoning and building codes and permitting, and they
should use those levers to good effect. Cities should use their regulatory influence smartly to remove /
mitigate barriers to create a conducive environment for private investors. This report also shows that per-
se a direct subsidy to private infrastructure providers is not required because charging networks offer a
viable business opportunity – the notable exemption being cities with large proportions of on-street
residential parking where residents might be undersupplied with charging infrastructure as the economics
under those conditions are less appealing. Another circumstance where city investment might be
necessary is the case of very high demand uncertainty – under these circumstances cities can also consider
running pilot projects or demonstration projects for proof of concept, which if proved economically
viable, can then subsequently be sold to the private sector.
4. If cities or city utilities do offer charging infrastructure services, there is a strong case for
subscription fee based business models to gain consumer acceptance
Policy options for electric vehicle charging infrastructure in C40 cities | R. Philip & A. Wiederer
7
Two key insights emerge from the analysis of the economics of public charging infrastructure. First, from
a pay-per-use perspective, the mark-up required to make the infrastructure economically feasible might
look prohibitively expensive to consumers. Second, annual subscription fees required to finance a
network would be, even under conservative assumptions, appear modest and in line with amounts
consumers are prepared to pay for other services. To make consumers accept public charging and allow
for a profitable charging infrastructure business, there is a strong case to push for subscription fee models.
Cities which run / own the charging infrastructure themselves (or by city owned utilities) should therefore
have subscription-fee based business models.
5. Cities should be aware of technological uncertainties and not commit prematurely
There are significant technology barriers and uncertainties that exist. EV battery swap technology and
smart grid technology, for example, have generated tremendous media and investor attention, but our
research show concerns regarding these technologies. The EV industry is young and highly dynamic, and
changes in technology while the industry matures are likely. However, for the key components of
charging infrastructure, like Level I, II and III charging, the norms have been set and it appears to be safe
for cities to commit to these standards now. Slowing down EV adaptation for certainty regarding smart
grid technology does not make sense. If a particular smart grid application in the future makes economic
sense, it will generate economic returns that allow for the charging infrastructure to be updated. The
argument that the smart grid is required for the charging infrastructure’s economic viability is not
supported by the analysis in this report – and also not by the reality of public and private sectors currently
investing in charging infrastructure without any smart grid component.
The authors believe that taking these seven recommendations into consideration, cities can increase their
likelihood of a successful and rapid adaptation of EVs. EVs are a reality, and during the next decades
there will be a significant uptake of EVs on streets around the world. Cities that want to actively steer this
development have to act decisively and comprehensively.

Policy options for electric vehicle charging infrastructure in C40 cities | R. Philip & A. Wiederer
8
1. Introduction
Electric vehicles (EVs) are vehicles that use electric motors for propulsion. Conventional internal
combustion engine (ICE) vehicles use the combustion of a fuel (typically a fossil fuel like gasoline) for
propulsion. Electric Vehicles2 (EVs) use only an electric battery to power the vehicle and need to be
charged by plugging into an electric socket. There are a number of variants on the continuum between a
pure ICE and a pure EV. Hybrid Electric Vehicles3 (HEVs) like the popular Toyota Prius have both a
conventional ICE engine and a small electric motor in parallel. The vehicle’s battery is charged through
regenerative braking and can power the vehicle for roughly 40 miles. Plug-in Hybrid Electric Vehicles4
(PHEVs), like HEVs have both ICE and electric engines in parallel but need to be plugged in to an
electric socket to charge the battery. For hybrid EVs, the ICE is typically the primary source of energy
while the battery is uses as a secondary source. This report focuses on pure EVs i.e. battery electric
vehicles that only use battery power for propulsion. This includes EV variants that have range extenders
(engine generators serving as a secondary source of electricity). For an overview of the different
technologies see Appendix III - Figure 1.
1.1 Client background & client research needs
The William J. Clinton Foundation launched the Clinton Climate Initiative (CCI) to create and advance
solutions to the core issues driving climate change. Working with governments and businesses around the
world to tailor local solutions that are economically and environmentally sustainable, CCI focuses on
three strategic program areas: increasing energy efficiency in cities, catalyzing the large-scale supply of
clean energy, and working to measure and value the carbon absorbed by forests. CCI is the delivery
partner of the C40, an association of large cities around the world5 that have pledged to accelerate their
efforts to reduce greenhouse gas emissions. Cities have an important role to play in tackling climate
change, particularly as cities bear a disproportional responsibility for causing it.
In December 2009, at the “Climate summit for Mayors” in Copenhagen, which was held alongside the
UN Climate Change Conference (COP15) in Copenhagen, fourteen6 of the C40 cities came together to
form the ‘C40 Electric Vehicle Network (C40 EVN)’ and pledged to collectively address four areas of
municipal action deemed critical to the successful introduction of electric vehicles.7 Through the C40
EVN, the cities have pledged to:
Policy options for electric vehicle charging infrastructure in C40 cities | R. Philip & A. Wiederer
9
1. Facilitate the planning and deployment of charging infrastructure and related electricity supply
systems in collaboration with local utilities.
2. Work with relevant stakeholders to streamline permitting processes associated with charging
equipment to encourage the safe and expeditious installation on customer premises and elsewhere.
3. Coordinate monetary and non-monetary incentives available to the general public and organizations
purchasing electric vehicles, and contribute to the package appropriately.
4. Develop and publish a plan to mobilize demand for electric vehicles in city fleets for the period 2010
- 2013 and rally private fleets to the safe end.
So far, four private sector companies have committed to work with the C40 Electric Vehicle Network
toward the shared goal of growing the market for electric vehicles. This group includes car manufacturers,
BYD, Mitsubishi Motors Corporation (MMC), Nissan and Renault. These companies will help inform
cities’ EV policies, vehicle procurement and infrastructure investment decisions through advice on
vehicle specifications, charging parameters, business models for electricity supply, and incentives.
The CCI is consciously focusing on cities as means to fight climate change as cities play an important role
in making real and significant progress in reducing GHG emissions. Half the world's population lives in
cities that account for more than two-thirds of carbon emissions. Road transportation, at 11%8, ranks as
one of the largest discrete end-use contributors to GHG emissions and is among the fastest growing9 of
GHG sources. The conversion of major vehicle fleets to electric power, especially light-duty vehicles
such as cars and vans, is an important opportunity to reduce urban GHG emissions, due to the potential
magnitude and speed of implementation.
CCI research needs
Stephen Crolius, Director of Transportation at the CCI, coordinates the C40 EVN and asked us to help
recommend policy options for C40 cities regarding EV charging infrastructure. Mr. Crolius asked us to
take the need for EVs as a given and focus downstream on EV charging infrastructure – to understand
what the key barriers to deployment of ubiquitous charging infrastructure were, what the economics of a
single charger and a charging network were, what policy options and levers city governments had for
increasing deployment of charging infrastructure and what recommended actions cities should take in this
regard. The CCI has asked us to put a special emphasis on the economic dimension as well as which
potential policy measures are available to cities.
Policy options for electric vehicle charging infrastructure in C40 cities | R. Philip & A. Wiederer
10
1.2 Research methods
The research methods employed for this report include extensive primary and secondary research. The
primary research involved interviews with policymakers, EV OEMs, utilities, EV charging infrastructure
providers and EV users in various cities around the world. We traveled to Singapore and Bangalore to
understand the city’s EV pilot program and meet various stakeholders associated with it. Furthermore we
benefited from Mr. Crolius’ updates and feedback from his extensive travel and engagement with key EV
players around the world. The secondary research involved a review of academic reports, analyst and
consulting firm forecasts and reports, policy documents, etc. We have also built models and sensitivity
analyses to understand the economics of charging infrastructure.
1.3 The role of EVs in achieving emissions reduction & other public policy objectives
The client requested us of this report to take the need for BEVs as a given and focus instead specifically
on issues downstream related to EV charging infrastructure. Hence though this report will not delve into
answering the question of whether EVs are an effective means of achieving public policy objectives, this
section briefly highlights the various public policy objectives that governments have stated EVs can
potentially help achieve and present some of the analysis addressing this question.
The most commonly cited public benefit of EVs is in the reduction of GHG (Greenhouse Gas) emissions.
Road transport is responsible for 66% of particulate emissions and 42% of NOx emissions in London10.
Research shows that each EV that displaces a conventional car produces savings of approximately 1.5
tons of CO2 per year11, compared to a conventional vehicle. This represents a 62% reduction compared to
a petrol-powered car, and a 53% reduction compared to a diesel-powered car. Vehicle tailpipe emissions
include hydrocarbons (HC), nitrogen oxides (NOx), carbon monoxide (CO), particulate matter (PM),
formaldehyde (HCHO), etc. EVs generate significantly fewer emissions – in most cases, close to zero –
compared to regular ICE vehicles. Looking only at the emissions created by exhaustion is not sufficient –
many of the emissions created by electric vehicles are produced in earlier steps of the fuel energy value
chain, e.g. at electricity production. The relevant measure is therefore “well-to-wheel emissions” that
looks at emissions along the whole energy production process. Depending on how the electricity used for
charging EVs is generated, i.e. renewable sources or fossil fuels, EVs can lead to significant well-to-
wheel emission reductions12. An interviewee from a utility in California mentioned that under a scenario
where 12% of cars in their service territory were EVs by 2020, that could constitute 11% of total load
served. Unless new renewable energy capacity comes online, this additional load will probably be served
by incumbent fossil fuel generation power generation capacity, thereby limiting the emission reduction
potential.

Policy options for electric vehicle charging infrastructure in C40 cities | R. Philip & A. Wiederer
11
Some of the other public policy objectives associated with EV deployment include:
Industry development: Many governments believe the nascent and growing EV industry can serve
as a generator of employment i.e. “green jobs”. Singapore has stated that it considers the EV industry
a source of great potential for the development of industry, business, standards and R&D in
Singapore.13
Energy security / reduced dependence on imported oil – The Obama Biden Energy Plan (2008),
the London Electric Vehicle Delivery Plan (2009) and other policy documents mention the role of
EVs in reducing the dependence on imported oil, thereby improving energy security.
Others including lower fuel costs & reduced noise – EVs have a lower per-mile cost compared to
ICE vehicles. EVs are significantly quieter compared to ICE vehicles is minimal engine and
transmission noise. (London Electric Vehicle Delivery Plan, 2009)
Needless to say, there are several options beyond deployment of EVs, for addressing reduction of
emissions from transport fleets and for reducing oil consumption. These include and are not limited to:
Investment in mass transit systems
More stringent fuel efficiency standards
Investment in other alternative fuel vehicles including fuel cell vehicles, etc
Urban planning measures to reduce VMT (vehicle miles travelled)
An economy-wide CO2 cap-and-trade system
Fuel taxes
It is clear that EVs aren’t a silver bullet for dramatically reducing GHG emissions and oil consumption.
They would need to be part of a multi-pronged strategy that includes many elements – fuel taxes, mass
transit, compact development, etc – in parallel.
1.4 Current EV & EV charging landscape
There has been an immense amount of media and automotive industry focused on EVs over the last few
years.14 This has been coupled with announcements from governments – federal and municipal –
committing to promoting the deployment of EVs through various investment schemes, subsidies, EV
programs, etc; a sample which is included in Table 1.4.1 below.

Policy options for electric vehicle charging infrastructure in C40 cities | R. Philip & A. Wiederer
12
Table 1.4.1: Select recent municipal government EV announcements
City / Country EV-related announcement
London / UK “Electric Vehicle Delivery Plan for London” – Mayor of London – May 2009
– building of infrastructure, EV procurement, incentives & marketing
Singapore, Singapore “Electric Vehicle Test Bed program” – CEO, Energy Market Authority – May
2009
Los Angeles / USA “Southern California Regional Plug-In Electric Vehicle (PEV) Plan” – Mayor
of Los Angeles – Dec 2009 - Investment in charging infrastructure,
streamlining permitting, fleet acquisition
San Francisco / USA 9-step plan to make Bay Area “EV Capital of US” – Mayors of San Francisco,
San Jose & Oakland – Feb 2009
Portland / USA Mayor Sam Adams announcement with Nissan for electric vehicle pilot
project
Paris / France Mayor Delanoe announces “Autolib”15, a 4000 EV rental program – Oct 2009
There are also several federal government initiatives or projects funded by federal governments across the
world. These include an EV test-bed program in Singapore, a $99.8M stimulus grant awarded by the US
government to ECOtality of Arizona, for an EV test pilot across 5 US states, involving the deployment of
up to 4700 Nissan LEAF EVs and 11,210 charging stations16.In September 2009, China & the USA
announced the launch of the US-China EV Initiative under which both countries would work together on
standards development, demonstrations, a technical roadmap as well as public awareness and
engagement.17
Governments are not alone in showing increasingly high levels of activity in regard to EVs. Almost all
large OEMs have by now either announced EV prototypes, models or even concrete launch dates of EV
models. Nissan will launch its LEAF electric car in 2010, as will Renault. GM, Ford, Volkswagen and
BMW have not only shown prototypes of full EVs but also announced concrete launch dates. Even
Porsche, a sports car manufacturer, has recently shown its first EV prototype. The supplier industry is also
jumping on the bandwagon. First tier suppliers like Valeo and Bosch are announcing EV products, are
joining forces with battery manufacturers or are publishing white papers that take a bullish position on EV

Policy options for electric vehicle charging infrastructure in C40 cities | R. Philip & A. Wiederer
13
adaptation.18 Even consulting companies seem to believe that EVs is a defining topic for the future of the
car industry – both McKinsey and the Boston Consulting Group have recently released extensive studies
on the EV market.19
These are all strong indicators that the EV market will take off. There is a concerted effort of both
governments and industry to push EVs into the market. Against this background it seems unlikely that
EVs will meet the same fate that they did in the mid 80s when they disappeared after a short while and
never could gain significant market traction.
EV charging
EVs need to be charged with electricity from either an internal or external source. An internal source
includes a motor inside the vehicle used to generate electricity (typically through regenerative braking),
while an external source would be a source of electricity with a specified voltage / current / wattage
rating. Throughout this report, “EV charging” refers to charging from an external source. Though the
definitions vary in different cities, a rough guide to EV charging equipment nomenclature is included in
Table 1.5.2 below. This varies across countries / cities depending on each city’s particular electric grid
characteristics / electrical standards.
Table 1.4.2: EV charging equipment nomenclature
Charging level Specifications Typical use Time to charge
battery
Level 1 (Slow) 120 V / 13A Charging at home /
office
7-8 hours
Level 2 (Fast) 240V / 32A Charging at
supermarket, gym
3-4 hours
Level 3 (Rapid) Up to 500V /
200A
Like a normal gas
station
30 minutes

Policy options for electric vehicle charging infrastructure in C40 cities | R. Philip & A. Wiederer
14
Charging location
The location where EV users charge their EVs is important and affects charging behavior, the economics
of charging and planning for investment in charging infrastructure networks, etc. This report categorizes
charging location into three classes:
Home charging – Charging at users residences, including in garages of single homes and multi-unit
apartment complexes as well as on-street residential spaces. Expected to be mostly Level 1 charging as it
exists already in most residences and can be used to charge EVs overnight.
Office charging – Charging at office workplaces including in outdoor office garages, commercial
complex parking garages, etc. Similar to home charging, is expected to be mostly Level 1 charging as EV
users can charge their EVs.
Convenience charging – All non-home and non-office charging including on public streets, public
garages, supermarket garages, etc. Expected to be a combination of Level 2 and Level 3 charging for
quick top-ups of battery power, while users shop at supermarkets, go for movies, run short errands, etc.
1.5 City government role in EV deployment
City governments have a potentially important role in the deployment of EVs and charging infrastructure.
There are varying degrees of city government involvement in EV charging markets, ranging from an
enabling role – providing a conducive regulatory environment for private sector providers of charging
infrastructure e.g. San Francisco, to providing incentives, to getting directly involved in the provision of
charging infrastructure e.g. Singapore & London. In cities, where the electric utilities are owned by the
city and are contemplating investing in EV charging infrastructure, e.g. the LADWP (Los Angeles
Department of Water & Power), city government has a key role sanctioning the use of public funds,
influencing regulation regarding whether EV charging infrastructure investments are included in the rate
base, and whether cost recovery will come from the EV users or all utility customers, etc. This is an
example of one of many policy decisions city governments may be confronted with, as the EV market
picks up. There are many policy levers that city governments possess to influence the deployment of EVs
and EV charging infrastructure. These levers can be clubbed under a few categories:
Regulatory: Government influence on permitting, building & zoning codes, electric utilities and
charging standards.
Procurement: Purchase of vehicles for public fleets

Policy options for electric vehicle charging infrastructure in C40 cities | R. Philip & A. Wiederer
15
Incentives: Monetary (tax waivers, congestion charging waivers, subsidies, free parking, etc) and
non-monetary (access to HOV (High Occupancy Vehicle) lanes for EVs, etc).
Ownership: Leveraging city owned real estate, like parking spots, street sides, etc.
A more detailed discussion of these policy levers, how cities should approach the question of which
levers to employ, is included in Chapter 4.
1.6 Key questions addressed in this report
Given the background on various city announcement regarding EV deployment and the client’s request to
focus downstream on charging infrastructure, this report is structured to address two key questions and
subsequently present recommendations. The questions are:
1. Is the availability of charging infrastructure a barrier to the deployment of EVs?
2. What are the barriers to large scale deployment of EV charging infrastructure?
The subsequent two chapters delve into these questions.

Policy options for electric vehicle charging infrastructure in C40 cities | R. Philip & A. Wiederer
16
2. Is the availability of charging infrastructure a barrier to the deployment of
EVs?
This chapter first explores what consumers desire from EVs which is important to understand for large
scale adoption of EVs and subsequently addresses the question of whether the availability of charging
infrastructure is a barrier to the large-scale deployment of EVs.
2.1 What consumers desire from EVsThere have been several surveys (e.g. by McKinsey and BCG) on what consumers would like from their
EVs in terms of range, reliability, etc.20 We complemented the insights won by secondary research with in
depth interviews with the Bangalore-based EV OEM REVA, which already has a number of EVs on the
road for several years and therefore has a firsthand perspective on needs of EV consumers.
Research indicates that there are multiple segments in the EV consumer market, with consensus on the
fact that there is a continuum of sorts, with enthusiastic early adopters, followed by groups who are
willing to try EVs after being overcoming some initial skepticism, and finally the traditional ICE faithful,
who are reluctant to switch from ICE vehicles to EVs.
In Shanghai, McKinsey identified 6 consumer segments and analyzed their general and EV-specific
attitudes & concerns. Though the breakup amongst segments may differ across cities, the segments may
be broadly similar to other cities.21
Early adopters (30% of all consumers)
1. Trendy greens (15%) – Willing to pay premium and sacrifice performance for green. Like EV
designs & lower running costs, willing to pay for a home charger.
2. Running cost sensitive (15%) – Willing to pay upfront premium for lower running costs / TCO.
Less concerned about safety and reliability.
Shapeable groups (33% of all consumers)
3. Bargain hunters (16%) – Care about both upfront and running costs and shop to find lowest price.
Like low EV running costs but concerned about upfront cost and reliability.
4. Performance seekers (17%) – Like new technology and like to show off. Convenience seekers. Not
very price-sensitive. Attracted by EV technology, concerned about range / charging / performance.
Late adopters (37% of all consumers)

Policy options for electric vehicle charging infrastructure in C40 cities | R. Philip & A. Wiederer
17
5. Trend followers (22%) – Try new products after majority. Prefer popular models and have clear
brand preference. Concerns about new technology. Concerned about EV choices, price and reliability.
6. ICE traditional (15%) – Highly reluctant to change behavior for new products. Not green conscious.
Have strong concerns about EVs and reject EVs on all attributes.
The CCI has the explicit aim of pushing EV adaptation beyond the early adopters to guarantee a mass
deployment of the technology. On the other hand convincing late adopters to switch earlier in the product
life-cycle of EVs might be over proportionally expensive or even impossible. This leaves a focus on the
shapeable group. In this group reliability and availability of charging infrastructure become critical. It is
for the purpose of winning those groups over and making them adopt EVs that the CCI is looking at the
deployment of charging infrastructure.
We also looked at several EV consumer studies and spoke to EV OEMs (Reva) and consumers to
understand what EV consumers are looking for, from their EV experience, to understand how what that
meant for planning and deploying charging infrastructure networks.22 Some common themes include:
Lower running and maintenance costs
Recognition for environmental awareness / green attitude
Distinctive design
Convenience of charging and use
Strong driving power and quick acceleration
Easy access to information on EVs and installation / usage / availability of charging infrastructure
Policy options for electric vehicle charging infrastructure in C40 cities | R. Philip & A. Wiederer
18
2.2 Barriers to large scale adoption of EVsGiven the needs of EV consumers discussed above, it is important to understand what the barrier to large
scale adoption of EVs are. Research23 indicates that there are several key barriers to the large scale
adoption of EVs, of which availability of charging infrastructure is one. The barriers include:
1. Upfront cost of EVs
2. Range anxiety
3. Availability of charging infrastructure
4. Technology uncertainty
5. OEM inertia & current supply chain sunk costs
6. Lack of information
1. Upfront cost of EVs
Our research indicates that the biggest barrier to the large scale deployment of EVs is the high upfront
cost of an EV. EVs cost significantly more than regular ICE vehicles, in terms of upfront costs. Total cost
of ownership (TCO) or lifecycle economics that take into account fuel & maintenance costs can tell a
very different story though, especially under $100+ / barrel oil scenarios. A recent BCG study looked at
the TCO breakeven period for EVs compared to an ICE-based vehicle, for various combinations of oil
prices, ICE mileage, EV battery range characteristics and government incentives, showing that EV
purchasers in some countries could break even in one to five years as depicted in Figure 2.2.1 below.

Policy options for electric vehicle charging infrastructure in C40 cities | R. Philip & A. Wiederer
19
Figure 2.2.1: Years to TCO breakeven for EVs
Source: The Boston Consulting Group (2010), "Batteries for Electric Cars"
The key drivers of EV costs are the cost of the battery and the current lack of scale and early stage in the
learning curve. Though lead acid batteries are significantly cheaper than lithium ion batteries, they offer
less range, making them a potentially less attractive proposition. The key metric with regard to battery
cost is the cost / kWh which currently hovers around $650-790 per kWh for a battery cell. Forecasts
estimate that this should go down to $270-330 / kWh by 2020.24
There are various schemes and initiatives – existing and proposed - to reduce the upfront cost to
customers including:
a) EV incentives (rebates / tax credits, etc) e.g. The US federal government provides a tax credit of up
to $7500 for the first 200,000 electric vehicles produced by an EV manufacturer.25Some cities also
have additional incentives, e.g. the city of Austin, Texas provides incentives of up to $500 for electric
vehicle purchases.
b) Battery leasing – EV OEMs, battery manufacturers or financial services companies can offer battery
lease options to EV customers that reduce the initial upfront cost of the EV, but add monthly /
periodic lease payments for the battery that the customer must make. REVA mentioned that they had
run a battery leasing pilot with some customers that met with a positive response.

Policy options for electric vehicle charging infrastructure in C40 cities | R. Philip & A. Wiederer
20
c) Battery re-use & recycling – Related to battery leasing models, models that allow for future battery
re-use and recycling can potentially reduce the upfront cost of EVs. After a certain number of
charging cycles, the capacity & performance of EV batteries drop to below 80% of their original rated
capacity and hence may not be optimal for EV use. They can then be re-used for other storage
applications including for grid storage, for re-use in cars with smaller range requirements, for
stationary applications e.g. buildings & hospitals and for non-car powertrains e.g. airport vehicles,
forklift trucks, golf-carts, etc.
At this stage it is difficult to say which of the above schemes will prove most effective and find wide-
spread use going forward. Changes in battery technology and the economics of each option will dictate
which of these schemes will find widespread adoption.
2. Range anxiety
A significant concern for EV users is their driving range on a single charge. Range anxiety is the fear of
being stranded in an EV due to inadequate battery capacity / performance. The calls for extensive public
charging networks are largely in response to range anxiety. EV OEMs have sought to address range
anxiety concerns through increased battery capacities, which allow one to drive up to 100 miles on a
single charge. Some OEMs have also developed other mechanisms for emergency situations, e.g. REVA
has a proprietary Revive technology, which is a battery reserve that can be released by EV users texting /
calling a REVA operations center.
To understand whether range anxiety is a valid concern it is prudent to compare trip types and lengths
with the stated range of EVs. In the UK, a high proportion of trips for a given purpose fall into lower
distance bands under 40km (25 miles) as depicted in the graphic below. This would fall well within the
range of most EVs on a single charge.
Policy options for electric vehicle charging infrastructure in C40 cities | R. Philip & A. Wiederer
21
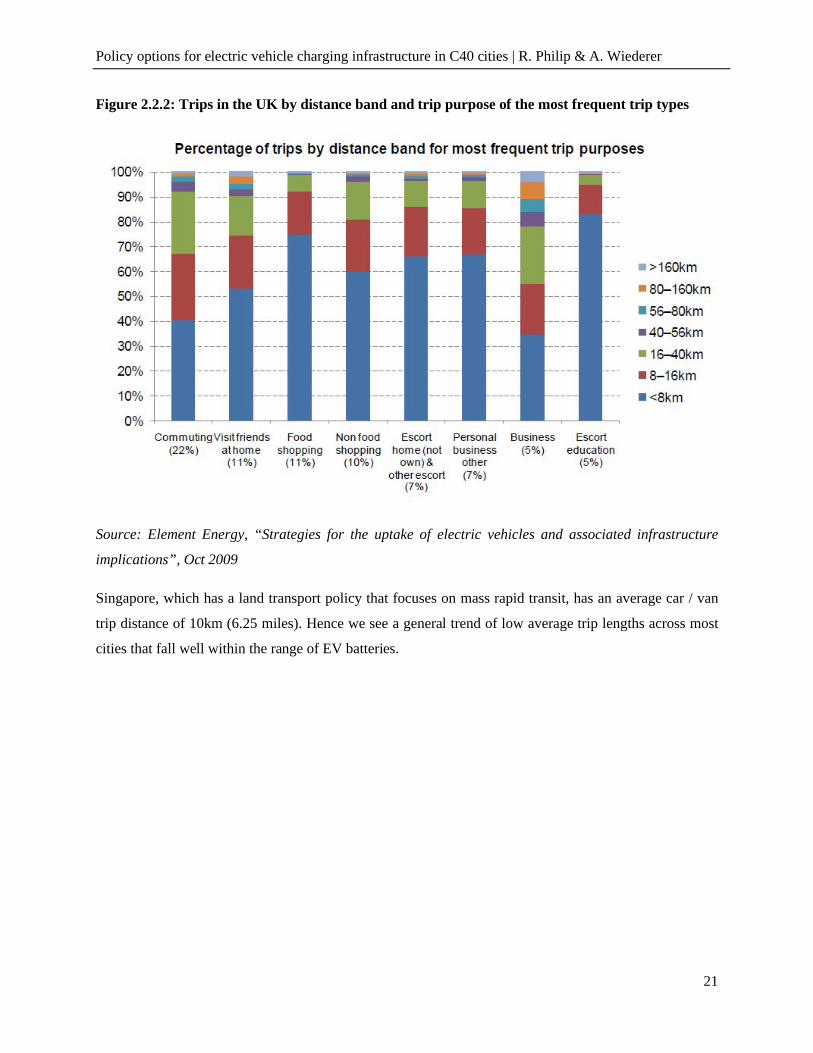
Figure 2.2.2: Trips in the UK by distance band and trip purpose of the most frequent trip types
Source: Element Energy, “Strategies for the uptake of electric vehicles and associated infrastructure
implications”, Oct 2009
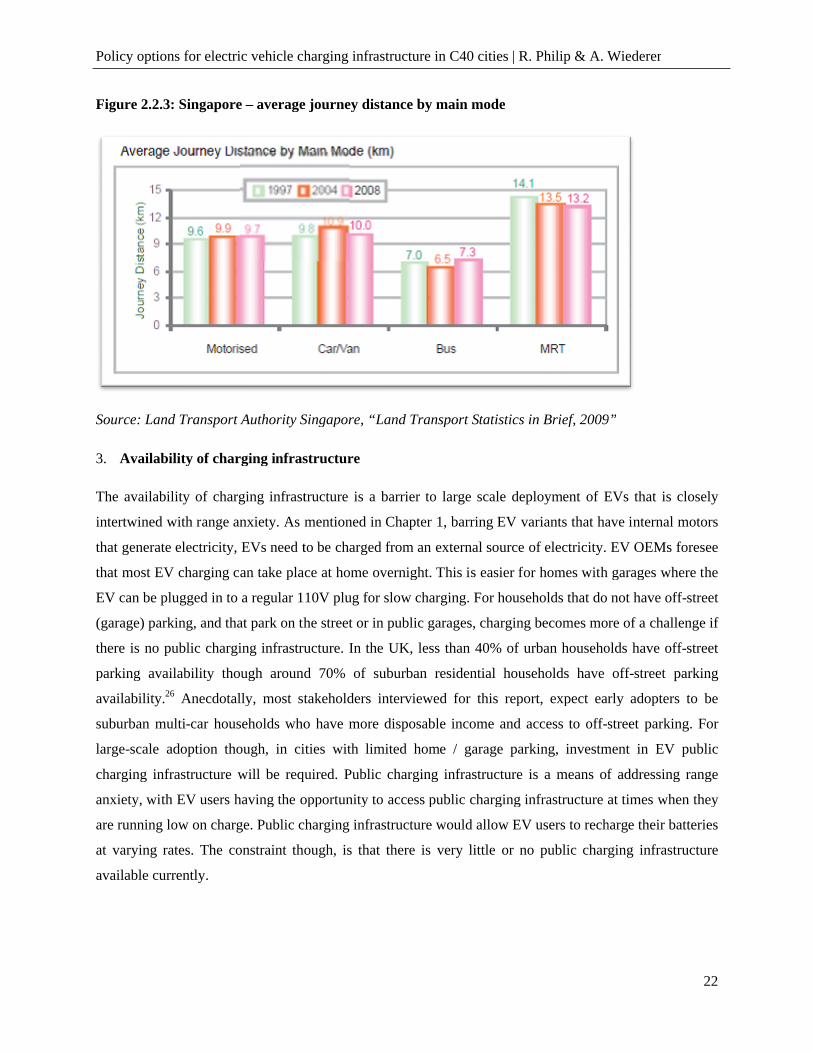
Singapore, which has a land transport policy that focuses on mass rapid transit, has an average car / van
trip distance of 10km (6.25 miles). Hence we see a general trend of low average trip lengths across most
cities that fall well within the range of EV batteries.
Policy options for electric vehicle charging infrastructure in C40 cities
Figure 2.2.3: Singapore – average journey distance by main mode
Source: Land Transport Authority Singapore,
3. Availability of charging infrastructure
The availability of charging infrastructure is a barrier to large scale deployment of
intertwined with range anxiety. As mentioned in Chapter 1, barring EV variants that have internal motors
that generate electricity, EVs need to be charged from an external source of electricity. EV OEMs foresee
that most EV charging can take place at home overnight. This is easier for homes with garages where the
EV can be plugged in to a regular 110V plug for slow charging. For households that do not have off
(garage) parking, and that park on the street or in public garages, cha
there is no public charging infrastructure. In the UK, less than 40% of urban households have off
parking availability though around 70% of suburban residential households have off
availability.26 Anecdotally, most stakeholders interviewed for this report, expect early adopters to be
suburban multi-car households who have more disposable income and access to off
large-scale adoption though, in cities with limited home / garage par
charging infrastructure will be required. Public charging infrastructure is a means of addressing range
anxiety, with EV users having the opportunity to access public charging infrastructure at times when they
are running low on charge. Public charging infrastructure would allow EV users to recharge their batteries
at varying rates. The constraint though, is that there is very little or no public charging infrastructure
available currently.
ctric vehicle charging infrastructure in C40 cities | R. Philip & A. Wiederer
average journey distance by main mode
Singapore, “Land Transport Statistics in Brief, 2009”
Availability of charging infrastructure
The availability of charging infrastructure is a barrier to large scale deployment of EVs that is closely
intertwined with range anxiety. As mentioned in Chapter 1, barring EV variants that have internal motors
that generate electricity, EVs need to be charged from an external source of electricity. EV OEMs foresee
take place at home overnight. This is easier for homes with garages where the
EV can be plugged in to a regular 110V plug for slow charging. For households that do not have off
(garage) parking, and that park on the street or in public garages, charging becomes more of a challenge if
there is no public charging infrastructure. In the UK, less than 40% of urban households have off
parking availability though around 70% of suburban residential households have off
necdotally, most stakeholders interviewed for this report, expect early adopters to be
car households who have more disposable income and access to off-street parking. For
scale adoption though, in cities with limited home / garage parking, investment in EV public
charging infrastructure will be required. Public charging infrastructure is a means of addressing range
anxiety, with EV users having the opportunity to access public charging infrastructure at times when they
on charge. Public charging infrastructure would allow EV users to recharge their batteries
at varying rates. The constraint though, is that there is very little or no public charging infrastructure
| R. Philip & A. Wiederer
22
“Land Transport Statistics in Brief, 2009”
EVs that is closely
intertwined with range anxiety. As mentioned in Chapter 1, barring EV variants that have internal motors
that generate electricity, EVs need to be charged from an external source of electricity. EV OEMs foresee
take place at home overnight. This is easier for homes with garages where the
EV can be plugged in to a regular 110V plug for slow charging. For households that do not have off-street
rging becomes more of a challenge if
there is no public charging infrastructure. In the UK, less than 40% of urban households have off-street
parking availability though around 70% of suburban residential households have off-street parking
necdotally, most stakeholders interviewed for this report, expect early adopters to be
street parking. For
king, investment in EV public
charging infrastructure will be required. Public charging infrastructure is a means of addressing range
anxiety, with EV users having the opportunity to access public charging infrastructure at times when they
on charge. Public charging infrastructure would allow EV users to recharge their batteries
at varying rates. The constraint though, is that there is very little or no public charging infrastructure

Policy options for electric vehicle charging infrastructure in C40 cities | R. Philip & A. Wiederer
23
Figure 2.2.4: Parking availability & household ownership in the UK
Source: Element Energy, “Strategies for the uptake of electric vehicles and associated infrastructure
implications”, Oct 2009
The linkages between range anxiety, availability of charging infrastructure and consumer willingness to
change their behavior to match battery & charging availability constraints are interesting and are likely to
vary across cities. Our primary research in Bangalore and a TEPCO study on an EV trial in Tokyo offer
interesting perspectives on range anxiety. In Bangalore, where a number of REVA EVs are on the road,
there is no designated public EV charging infrastructure, implying that EV users there are charging
entirely at home, as well as relying on the battery reserve mentioned earlier. A TEPCO (Tokyo Electric
Power Corporation) study27 showed that the addition of a second fast charger in an EV test pilot led to EV
users using more of the range of the EV coming to charging stations with less charge remaining in the
batteries, compared to when there was only a lone charger available. This is depicted in Figure 2.2.5
below.

Policy options for electric vehicle charging infrastructure in C40 cities | R. Philip & A. Wiederer
24
Figure 2.2.5: Impact on utilized range of EVs from installation of additional charger
Source: TEPCO
This also calls into question an often mentioned chicken-and-egg problem regarding EVs that goes along
these lines: “You need readily available charging infrastructure for an EV roll out, but you also need a
significant number of EVs on the road to make this infrastructure economically feasible.” Heavy reliance
on home charging could break this argument effectively. A recently published McKinsey study also
argues along these lines: the main charging will be done at home, a wide-spread public charging
infrastructure is not necessary, at least at the beginning. On the other hand we have already seen, this
logic will not hold for cities with a low degree of home and garage parking which will have to rely
already for the early adopters on public charging infrastructure if they want to see a significant uptake.
4. Technological uncertainty
There is a limited number of EVs currently on roads and hence limited data and experience regarding
their performance. A number of the pilots running in different parts of the world have been undertaken to
study the performance of the vehicles and batteries under various conditions as well as driving behavior.
The Singapore pilot for example will seek to understand the performance of batteries under the country’s
tropical climate. Lithium-ion batteries are prone to thermal runaway which is a condition where a sealed
battery can overheat during recharging and potentially explode. This has significant safety concerns and
hence can be a barrier to EV deployment. Research into battery management systems and pilot tests to
understand thermal runaway & EV performance are important to gain the confidence of both consumers
and public agencies – fire safety, regulatory (car safety), etc. Building consumer confidence in EV
technology is critical to mass adoption. One interviewee spoke of a loss of confidence in EV technology

Policy options for electric vehicle charging infrastructure in C40 cities | R. Philip & A. Wiederer
25
after the withdrawal of EV01 – GM’s electric vehicle – earlier this decade. In 2006, GM axed their
electric vehicle program, withdrawing their EV01 cars from the market. This has been covered in the
documentary “Who killed the electric car”. This led to significant loss of public confidence and
continuing skepticism about EVs.
There is also uncertainty about the fast evolving EV battery space with significant government funding
being spent on battery R&D. The battery of today might have very different characteristics from batteries
built in a few years. Hence battery leasing might allow consumers to share in the benefits of technological
improvements in batteries allowing them to lease more advanced batteries in the future.
5. OEM inertia & current supply chain sunk costs
The large automobile OEMs have large sunk costs in existing ICE supply chains – factories, dealer
networks, maintenance networks, etc and hence have limited incentive in making a rapid transition to
having EVs make up a large part of their product portfolios. This can potentially be a barrier to the rapid
deployment of EVs. Renault-Nissan is an exception to this general trend as the company sees EVs as a
key part of their growth strategy.28 A number of other EV players are relatively new smaller start-ups e.g.
Fisker, Miles, BYD, etc who do not have the constraint of significant sunk costs in ICE supply chains.
6. Lack of information
Electric vehicles come with significant benefits and challenges for users and there is currently inadequate
information available to the public about these. The PlaNYC study indicates that providing clear
information about electric vehicles and installation of charging equipment at homes could significantly
boost early adoption of EVs.
There is also a lack of information for other stakeholders including governments, OEMs and utilities.
Governments know very little about EVs, utilities do not know what how many EVs will impact the grid
and OEMs do not how much demand there will be for EVs and what government policy will be in this
regard.
Policy options for electric vehicle charging infrastructure in C40 cities | R. Philip & A. Wiederer
26
3. Barriers to large scale deployment of EV charging infrastructureHaving established in the previous chapter that availability of charging infrastructure is a significant
barrier to the deployment of EVs, a follow-up question is what the key barrier to the large scale
deployment of EV charging infrastructure are. The client is particularly keen on understanding this
question as many C40 city governments are focusing on the provision of charging infrastructure and an
understanding of the key barriers will serve them well.
Our research indicates that there are several barriers to the large scale deployment of EV charging
infrastructure. These barriers can be clubbed in three categories – regulatory, economic & technology.
This chapter delves into these barriers with a particular focus on understanding the economics of EV
charging. The main barriers to the large scale deployment of EV charging infrastructure are:
Regulatory barriers:
- Finalization of standards by international standard setting bodies
- Policy uncertainty regarding sale of electricity, EV-related investment by utilities
- Permitting of EV charging equipment
Economic barriers
- Uncertainty regarding demand
- The economics of a single charger and a charging network make a pay-per-use model unappealing – a
subscription model may be a more suitable alternative
Technology barriers
- Uncertainty regarding charging technologies and smart grid applications
3.1 Regulatory barriersRegulatory barriers are an area where the city has the most influence and power to mitigate / remove.
Some of the key regulatory barriers across cities are:
Lack of agreed upon standards for charging infrastructure
There is currently no single agreed-upon standard for EV charging infrastructure. A technical standard is
important so that EV OEMs and charging infrastructure providers can cater to a particular plug design /
voltage rating specification. There are a few standards currently available internationally. The Society of
Automotive Engineers (SAE) J177229 standard is a standard for electrical connectors for electric vehicles.
The International Electrotechnical Commission (IEC) 6219630 standard also permits conductive charging
Policy options for electric vehicle charging infrastructure in C40 cities | R. Philip & A. Wiederer
27
of EVs. It is important to note that this lack of standard is not because of technological uncertainties – the
technologies of charging are well understood. What is missing is the final adaptation of these technologies
in the regulatory framework of the international standard setting organizations.
Stakeholders we spoke to, particularly in Singapore, mentioned that this was a key barrier to the
deployment of charging infrastructure. Singapore has set up its own technical Committee, led by the
Agency for Science, Technology and Research (A-STAR), to decide on a technical standard for charging
infrastructure in Singapore. The Committee is scheduled to issue the standard by March 2010, which will
be used in the Request for Proposals (RfP) for charging infrastructure that is scheduled to be released in
June 2010. Most interviewees expect this to be a short-term barrier that will be overcome. Cities that are
more entrepreneurial in this regard, like Singapore, will remove this barrier quicker.
Policy uncertainty regarding sale of electricity, municipal investment in infrastructure, etc
Municipal governments have a potential role to play in various aspects related to EV charging
infrastructure, from regulating to provision to municipal investment in charging infrastructure to
providing incentives. Policy uncertainty in any of these aspects can potentially be a barrier to the
provision of charging infrastructure. Some examples of areas of policy uncertainty include:
Regulation over sale of electricity
Whether third-party charging infrastructure providers become regulated entities (like electric utilities),
when engaging in the sale of electricity, influences business model decisions and the economics for third-
party charging infrastructure providers. Some markets have taken legislative measures to address some of
the policy uncertainty mentioned above. The US state of California amended its Senate Bill 626 in July
2009 to “require the California Public Utilities Commission (CPUC), in consultation with specified
parties, to adopt rules by July 1, 2011, to evaluate policies to develop fueling infrastructure for plug-in
hybrid and electric vehicles.”31This is a powerful best practice that can be replicated across other C40
cities that have similar regulatory environments.
Government policy regarding investment in infrastructure
If there is extensive public investment in charging infrastructure, then this public competition might make
the business case unattractive and private providers might not enter the market. Conversely, if
government provides incentives – free electricity - or subsidies (as in Los Angeles), then that may
improve the economics for charging infrastructure providers. There are various stakeholders who could
potentially fund the charging infrastructure – federal or municipal governments, utilities, the private
sector or a combination of both, through a public-private-partnership (PPP) or through the use of public
subsidies. At one end of the continuum of choices, is obtaining full cost recovery of charging
infrastructure from EV users. Alternatively, federal or municipal governments could allocate a budget for
funding charging infrastructure as in the case of the UK and Singapore. In markets where regulated

Policy options for electric vehicle charging infrastructure in C40 cities | R. Philip & A. Wiederer
28
utilities are allowed to earn a specified rate of return on their asset base from electricity customers /
ratepayers, public charging infrastructure they fund and operate could be added to their asset base. The
question is whether regular utility rate-payers share in utility infrastructure costs related to EVs or
whether those costs are borne solely by EV users. The California-based advocacy group TURN (The
Utility Reform Network) in its comments filed32 with the CPUC, expressed its concerns, saying that
“residential customers should install additional equipment in order to support PHEVs and BEVs, the
customer using the service should pay for all equipment and improvements" and "It is not the job of
ratepayers to promote particular vehicle choice by paying for the full cost of wiring and end use
equipment that is tied to specific customers and houses.”
OEMs are also waiting to see whether city governments offer incentives / subsidies for charging
equipment. The City of Los Angeles, in December 2009, announced that it would provide a subsidy for
home chargers of up to $2000 for the first 5000 residential customers. The lack of clarity on policy
regarding investment in infrastructure by utilities and subsidies from government, can be a barrier to
investment in charging infrastructure by private investors and utilities and it is recommended that cities
release policies in this regard as early as possible.
Permitting
One potential barrier to installation of charging equipment at homes and public places is the permitting
process which research indicates is cumbersome, time-consuming and expensive. One of the stated
actions of the C40 Electric Vehicle Network will be to work with relevant stakeholders to streamline
permitting processes associated with charging equipment to encourage the safe and expeditious
installation on customer premises and elsewhere. Some cities are already taking action in this regard. Los
Angeles Mayor Antonio Villaraigosa announced that cities in December 2009 that Southern California
will work to streamline the process for installation of new charging infrastructure including local city
permitting and inspections33. The San Francisco building code will soon be revised to require that new
structures be wired for car chargers.34
Key takeaways regarding regulatory barriers
For each of the regulatory barriers mentioned above, there are often several city government agencies that
share responsibility and that need to work together to remove the barrier. This needs to be done in
consultation with OEMs, charging infrastructure providers and utilities so that policy outcomes are
sustainable and optimal. These barriers retard the deployment of EV charging infrastructure and impede
private investment; hence removing them at the earliest is important for unleashing a more rapid rate of
deployment of charging infrastructure.
Policy options for electric vehicle charging infrastructure in C40 cities | R. Philip & A. Wiederer
29
3.2 Economic barriersCritical to the participation of private investors in the EV charging infrastructure market is a viable
business case. Our interviews with cities, utilities, charging infrastructure providers have provided
interesting and varying perspectives in this regard, from Singapore where the government recently tried in
vain to attract private charging infrastructure providers to invest in networks, to RWE in Berlin which
foresees significant revenue opportunities in the charging space, to Better Place which is betting heavily
on its battery-exchange technology being integral to large-scale EV adoption.
This section explores the economic barriers to the deployment of EV charging infrastructure, with an
analysis of the economics of both an individual charger and an entire charging network.
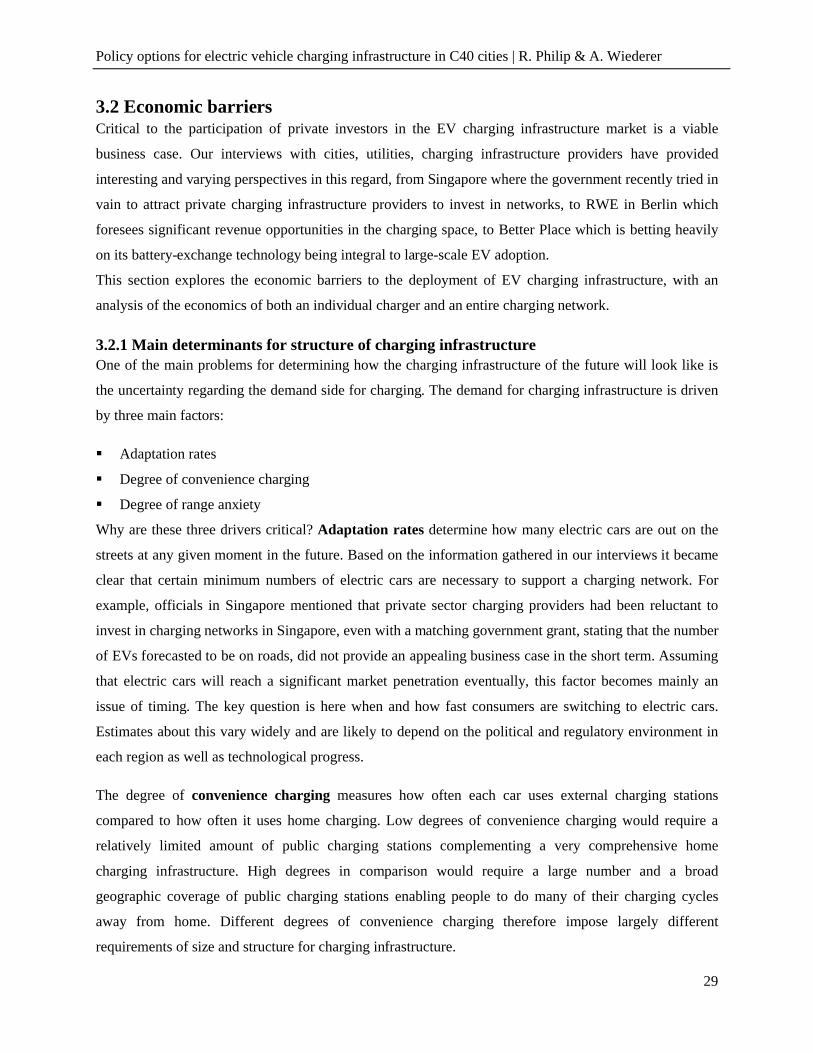
3.2.1 Main determinants for structure of charging infrastructureOne of the main problems for determining how the charging infrastructure of the future will look like is
the uncertainty regarding the demand side for charging. The demand for charging infrastructure is driven
by three main factors:
Adaptation rates
Degree of convenience charging
Degree of range anxiety
Why are these three drivers critical? Adaptation rates determine how many electric cars are out on the
streets at any given moment in the future. Based on the information gathered in our interviews it became
clear that certain minimum numbers of electric cars are necessary to support a charging network. For
example, officials in Singapore mentioned that private sector charging providers had been reluctant to
invest in charging networks in Singapore, even with a matching government grant, stating that the number
of EVs forecasted to be on roads, did not provide an appealing business case in the short term. Assuming
that electric cars will reach a significant market penetration eventually, this factor becomes mainly an
issue of timing. The key question is here when and how fast consumers are switching to electric cars.
Estimates about this vary widely and are likely to depend on the political and regulatory environment in
each region as well as technological progress.
The degree of convenience charging measures how often each car uses external charging stations
compared to how often it uses home charging. Low degrees of convenience charging would require a
relatively limited amount of public charging stations complementing a very comprehensive home
charging infrastructure. High degrees in comparison would require a large number and a broad
geographic coverage of public charging stations enabling people to do many of their charging cycles
away from home. Different degrees of convenience charging therefore impose largely different
requirements of size and structure for charging infrastructure.

Policy options for electric vehicle charging infrastructure in C40 cities | R. Philip & A. Wiederer
30
The degree of convenience charging only measures the actual use of the public charging infrastructure not
the perceived need by consumers. As explained previously, range anxiety is the psychological
phenomenon where people are afraid of running out of charge on a highway and want the assurance that
in this case a charging station is close by. It is important to note that range anxiety is not describing the
actual charging process for such a case – but people being afraid from such a hypothetical case and
therefore demanding a certain kind of charging infrastructure, even though they might not actually use it.
What are the most probable or realistic values for the degrees of convenience charging and range anxiety?
At this point this is unclear. Interviews with various cities and with various players have shown that each
of them faces a high uncertainty regarding these factors because empirical values are missing. Players like
RWE and Singapore are acknowledging this and are setting up test cases right now to gather this kind of
data. Dependent on the outcomes of these test runs and the estimates for the parameter values, the actual
charging infrastructure that will be installed might vary significantly. But even without the results of these
test runs being available yet, one can show the option space opened by variations of these two parameters
and what each of these options means in terms of requirements for the charging infrastructure.
The option space defined by these two parameters is shown in Figure 3.2.1.1 Based on this matrix there
are four generic options. How would each of these options translate in charging infrastructure
requirements?

Policy options for electric vehicle charging infrastructure in C40 cities | R. Philip & A. Wiederer
31
Figure 3.2.1.1
Option 1:
In this option consumers would largely rely on home charging and only show low degrees of range
anxiety. Under these conditions only minimum degrees of charging infrastructure would have to be
installed because no significant demand either in real terms or in psychological terms is to be expected.
Charging infrastructure would be limited to few, strategically well placed spots.
Option 2:
In this option consumers don’t actually show a high real demand for public charging infrastructure, but
their fear of running out of charge creates a “psychological” demand for infrastructure. Given these
conditions charging infrastructure would be rather limited but strategically placed at highly visible
locations to allay these consumer fears.
Options 3 and 4:
Both these options share a high real demand for opportunity charging and therefore require an extensive
public charging infrastructure. The different degrees of range anxiety are unlikely to make a huge
difference in terms of the design for the infrastructure, given that the physical demand alone is enough to
drive the installation of a comprehensive infrastructure.
It is important to note that each of these scenarios not only has implications on the design and structure of
the charging infrastructure but also on the viability of different business models. In options 3 and 4 a
Determinants of demand side for charging infrastructure
Low HighDegree of opportunity charging
Low
High
Degree of range anxiety
42
1 3

Policy options for electric vehicle charging infrastructure in C40 cities | R. Philip & A. Wiederer
32
strong real demand for charging infrastructure supports the economic feasibility of such an infrastructure.
Business models based on real usage as for example pay-per-use models can potentially be feasible under
such conditions. The situation is different under option 2. There we need some (even so arguably not as
comprehensive as under option 3 or 4) public charging infrastructure but real demand will not create a
major share of income supporting this infrastructure. Pay-per-use models are therefore unlikely to be
feasible. More promising could be subscription models in which consumers pay for the provision of the
infrastructure instead of actual usage. Another option are subsidized schemes in which parties profiting
from different parts of the electric car value chain (e.g. car suppliers) support the installation of charging
infrastructure as a business enabler. We will spend more taught about these different models later in this
chapter.
The EV market in 2020
Another important factor for determining the mid-term demand for charging infrastructure is obviously
the number of EVs on the street. This number is determined by the amount of cars on the street in total
and the adaptation rate of EVs as a percentage of these cars. This has to be distinguished from the share of
electric cars sold in any given year, the number most research reports and consultancies focus on. If we
look at medium term estimates for the market share of electric cars sold in 2020 we get widely diverging
views. Estimates range from 1.5% to 10% for purely battery powered cars.35 Numbers get significantly
higher if one considers plug-in hybrids also as electric cars. A consulting report for example estimates
that such plug-in hybrids will make up to 20% of the market in 2020.36 How can divergence in forecasts
be explained? First, the forecasts are based on driver models using specific assumptions for e.g. battery
and oil price developments, subsidies, etc. There is a huge uncertainty for all these factors and differing
assumptions can lead to significantly differing outcomes. Second, especially for car manufacturers the
forecasts also function as signaling device. As one interviewee, who wanted to remain unidentified, put it:
“If you bet your whole company on electric vehicles, you will publish estimates of high adaptation rates
no matter what you believe internally.” Questioning the basic assumptions of each forecast and coming up
with an own estimate for EV adaptation would be beyond the scope of this paper. We will therefore move
forward using three different scenarios instead, representing an expected (5%), high (10%) or very high
adaptation rate (20%).
Are these numbers realistic? A short back of the envelope calculation indicates so. Taking an average age
of the US car fleet of approx. 8 to 9 years, leads to car replacement rates of around 11% to 12% p.a.
Assuming that mass adoption of EVs will start in 2013 with a sales share of approx. 1% and then ramp up
to the numbers forecasted by the consulting study for 2020 means that by 2020 something between 4%
and 9% of the cars on the road will be battery powered depending on which of the growth scenarios

Policy options for electric vehicle charging infrastructure in C40 cities | R. Philip & A. Wiederer
33
developed in the study is used37 – roughly equal to our expected and high scenarios. We included the very
high adaptation scenario for two reasons: First the numbers forecasted are based on the overall car market
– we however look only at cars sold in large cities whose car requirements are arguably more in line with
the characteristics of EVs then hose of rural communities or smaller cities. Second, one can interpret the
very high scenario also as a glance into a little more distant future where a 20% market penetration is
likely and so get a feeling for infrastructure levels required then.
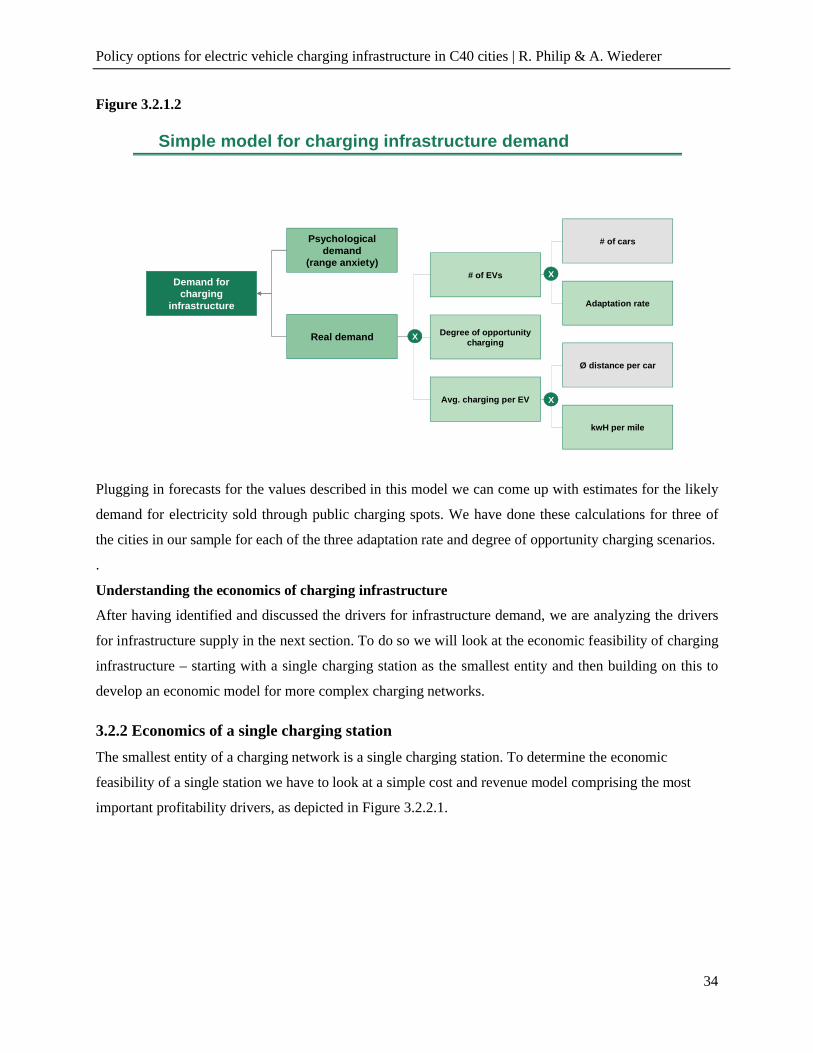
A simple model for charging infrastructure demand
In the next step we formalize the insights won in the last chapters. The main drivers for charging
infrastructure demand are the “psychological” and the “real” demand (see Figure 3.2.1.2). Whereas we
cannot break down the psychological demand further, we can develop a driver tree model for real
demand. Real demand in such a simple model can be calculated by the number of EVs times the degree of
opportunity charging times the average charging load per EV. The number of EVs in turn is determined
by the number of cars in any given region/city times the adaptation rate. The average charging load per
EV is the product of the distance in miles driven on average per car and the amount of kwH required per
km.
Policy options for electric vehicle charging infrastructure in C40 cities | R. Philip & A. Wiederer
34
Figure 3.2.1.2
Plugging in forecasts for the values described in this model we can come up with estimates for the likely
demand for electricity sold through public charging spots. We have done these calculations for three of
the cities in our sample for each of the three adaptation rate and degree of opportunity charging scenarios.
.
Understanding the economics of charging infrastructure
After having identified and discussed the drivers for infrastructure demand, we are analyzing the drivers
for infrastructure supply in the next section. To do so we will look at the economic feasibility of charging
infrastructure – starting with a single charging station as the smallest entity and then building on this to
develop an economic model for more complex charging networks.
3.2.2 Economics of a single charging station
The smallest entity of a charging network is a single charging station. To determine the economic
feasibility of a single station we have to look at a simple cost and revenue model comprising the most
important profitability drivers, as depicted in Figure 3.2.2.1.
Simple model for charging infrastructure demand
Demand for charging
infrastructure
Psychological demand
(range anxiety)
Real demand
# of EVs
Degree of opportunity charging
Avg. charging per EV
X
# of cars
Adaptation rate
X
Ø distance per car
kwH per mile
X

Policy options for electric vehicle charging infrastructure in C40 cities | R. Philip & A. Wiederer
35
Figure 3.2.2.1
Cost and revenue model for single charging station
Cost per charging station p.a.
Capital investment
Maintenance/Operations cost
Co
st m
od
elR
eve
nu
e m
od
el
Margin
+
Cost per installed station
Lifespan station station
/
Pay-per-use modelPay-per-use model Subscription modelSubscription model
Revenue per charging station p.a.
Utilization
Potential capacity in kwH
Mark-Up per kwH
xRevenue per charging
station p.a.
# cars per station
Subscription fee
x
Cost per installed station
Required ROCI
x
The cost side
The costs of a single station are determined by the following factors:
Cost per installed station: These costs consist of the cost for the actual station plus the one-time
installation cost. Both costs vary widely depending on the type of charging station installed. Whereas
home charging stations (Level 1) are relatively inexpensive, additional safety and stability
requirements drive the costs for public charging stations (mostly Levels II & III) significantly up.
Earlier in Chapter 1, we made the distinction between slow (Level 1), fast (Level II) and rapid (Level
III) charging stations. The latter are able to charge a car to up to 80% of its capacity within 30
minutes and are therefore ideal for fast, public charging. However, their costs are up to 7-9 times
higher than those of ordinary slow and fast chargers. Especially for rapid chargers there is also a
significant difference in installation cost between different countries – dependent on how modern the
underlying grid is. Whereas most German and French grids can handle rapid chargers without
significant additional grid investments, most American grids would probably need to be upgraded,

Policy options for electric vehicle charging infrastructure in C40 cities | R. Philip & A. Wiederer
36
hence driving up the costs. For an overview of investment and installation costs per charging location
and type see Figure 3.2.2.2. One has to keep one caveat in mind while discussing the cost of charging
infrastructure. The technology is currently relatively new and charging stations are not mass produced
– one would therefore expect the cost to decrease over time given the increasing scale of production.
However, our interviews have shown that this anticipation might be misguided. First, approx. 50% of
the investment costs are caused by the physical labor of installing the device at a specific place,
getting permits and changing street/parking lot structures. These costs can be expected to be relatively
neutral to scale. The other 50% are caused by the actual charging device. This device mainly consists
of low tech electronics and standard commodities like stainless-steel for the body etc. – which prices
are again are relatively insensitive to scale. The general expectation is therefore that scale cost
reduction will not play a major part for individual charging stations.
Figure 3.2.2.2
Source: PlanNYC, “Exploring Electric Vehicle Adoption in New York City”, p. 15; BCG, “The future of
batteries for electric cars – other cost factors”, p. 9 and 16; Element Energy, “Electric Vehicles –
Strategies for uptake and infrastructure implications“, p. 62; Interviews
Lifespan per installed station: The costs of an installed station have to be spread over the life-span
of a charging station. Since only now the first modern charging stations are installed in public spaces
Estimates for investment and installation cost for single charging outlets
Level II: Private home/garage
Level II: Private home/garage
Level II: Commercial garage/ public streetLevel II: Commercial garage/ public street Level IIILevel III Battery swapBattery swap
PlanNYC/ McKinsey
Interviews and author's estimates
BCG, Element Energy and
other studies
1,500-2,500
500-1,000
500-2,000
2,000-7,500 dependent on
location
3,000 –7,000
3,000 -8,000 dependent on
location
more than40,000
40,000 – 75,000
more than 50,000
-
+1,500,000
-
in US $

Policy options for electric vehicle charging infrastructure in C40 cities | R. Philip & A. Wiederer
37
it is still uncertain what their final life will be. Experts estimate typical life-spans of 10 up to 15
years.38
Maintenance/ operation costs: Maintaining the charging stations, conducting necessary repairs,
controls and cleaning tasks as well as generally operating tem is another cost factor. These costs are
estimated by experts to be between around 10% of the original installation cost annually.
Margin: The required margin is obviously not a direct cost – however, the margin has to be earned
by the generated revenue stream and is therefore treated as a cost component in our model. We set up
the margin as a return on capital invested – in line with how many utilities are regulated right now.
The required ROCI differs of course based on company, location and business model and the
regulatory framework under which the charging station operates.
We have explicitly not included two other cost types in our calculation. First, we have not included
typical sales and operation costs apart from the costs mentioned above. To offset this factor we have
assumed small-household prices for electricity instead of wholesale prices. The assumption being that
apart from the charging specific costs for the infrastructure, car charging is merely a new distribution
channel for electricity with a similar generic cost base. Second, we have not included rental cost for
parking spaces. This decision is mainly driven by the largely varying cost per space we expect to see
across regions and cities. One has to interpret our mark-up scenarios therefore as a mark-up before
additional parking fees a consumer has to pay. This is a reasonable assumption given that consumers are
willing and used to pay these parking fees already today. Looking at it from this perspective, charging is
simply an additional service provided while parking – for which an additional service-fee is charged. This
seems also reasonable looking at operations: it is unlikely (and based on the interviews conducted not
common currently) that charging infrastructure operators will rent the parking lots from current owners
and take over the parking utilization risk. More likely are models in which charging infrastructure
provider will partner with the owners of parking spots for mutual benefit: increasing the attractiveness of
the parking slot for consumers from a parking slots owner’s perspective and available space from an
infrastructure owner’s perspective. If, however, on the long run charging proves to be a profitable
business model it is possible that the real estate owners want to participate in this profitability – most
probably by a revenue sharing model which would translate in higher required returns.
The revenue side
Regarding revenues there are two basic models - either a pay-per-use model in which consumers pay a
mark-up per kwH charged or a subscription model in which consumers pay a annual or monthly
subscription fee for using the charging infrastructure.

Policy options for electric vehicle charging infrastructure in C40 cities | R. Philip & A. Wiederer
38
Pay-per-use model: Revenues in a pay per use model are the degree of the utilization of a single
charging station (how many hours per day are cars actually charging at the station) times the electric
throughput (how many kW are delivered to a car per hour) times the mark-up charged per kWH by
the charging provider.
Subscription model: Here the revenues per charging station is the subscription fee times the number
of cars per charging station.
Whereas there is relatively comprehensive data and forecasts for the cost side of the equation given, the
same is not true for the revenue side. Because of the missing experience regarding the charging behavior
of potential customers and there willingness to pay, it is currently unclear which utilization rates can be
expected (for the pay-per-use business model) or how many installed charging stations are required per
car (subscription model). Furthermore, the willingness of the customer to pay a mark-up or a subscription
fee is untested so far. One of the main goals of the currently running test cases in Berlin, Singapore or
London is to gather exactly this data and base the business models on it. All our interviews have so far
shown that no player has a very good understanding of what to expect regarding these variables.
To gain a better understanding under which circumstances and parameter values a single charging station
is economically feasible we did a ceteris paribus analysis, looking at the expected rate of returns while
varying either expected utilization rates or mark-up premiums.

Policy options for electric vehicle charging infrastructure in C40 cities | R. Philip & A. Wiederer
39
Figure 3.2.2.3
Rate of return based on varying Mark-up prices - Level II
-10
-5
0
5
10
15
20
25
30
35
40
45
0,06 0,07 0,08 0,09 0,10 0,11 0,12 0,13 0,14 0,15 0,16 0,17 0,18 0,19 0,20
Mark-up per kwH in US cent
IRR in %
Note: Utilization 20%; 10 years life time; 10% maintenance cost per year; $5000 price station and installation cost; 7.7kwH throughputSource: Team analysis
Approx. 50% mark-up over normal electricity
rate
Approx. 70% mark-up over normal electricity
rate
We looked first at today’s charging standard, the Level II charging station that is able to deliver approx. 8
kW of charge per hour. Assuming a utilization of 20%, which means that each charging station is used at
least approx. 5 hours per day for 365 days a week and which was deemed realistic in the various
discussions we had with experts, approx. a 50% mark-up over private household electricity prices is
required to achieve positive returns.39 To get to a return of around 15% a mark-up of approx. 70% over
current electricity prices is required. To understand the significance of this finding one has to translate it
into the concrete consumption decision a potential customer is facing. He has to ask himself: “Am I
willing to pay a 70% premium to charge at this public station compared to what I would pay charging at
home?” Even though no data is available for how a consumer facing this decision would behave, one can
doubt whether the willingness to pay this premium will be high if there is no practical reason (e.g.
running out of charge) present. On the other hand one could also look at the impact of the usage of
convenience charging on the overall annual fuel costs. Looking at this metric it becomes clear that even a
70% premium does only translate into a relatively low increase in overall fuel costs even under aggressive
convenience charging assumptions. Take the example of Singapore – even if convenience charging would
represent 20% of the overall charging per car, this would only translate into an annual fuel cost increase
of approx. 14% compared to a no convenience charging case for the average user. And, perhaps even
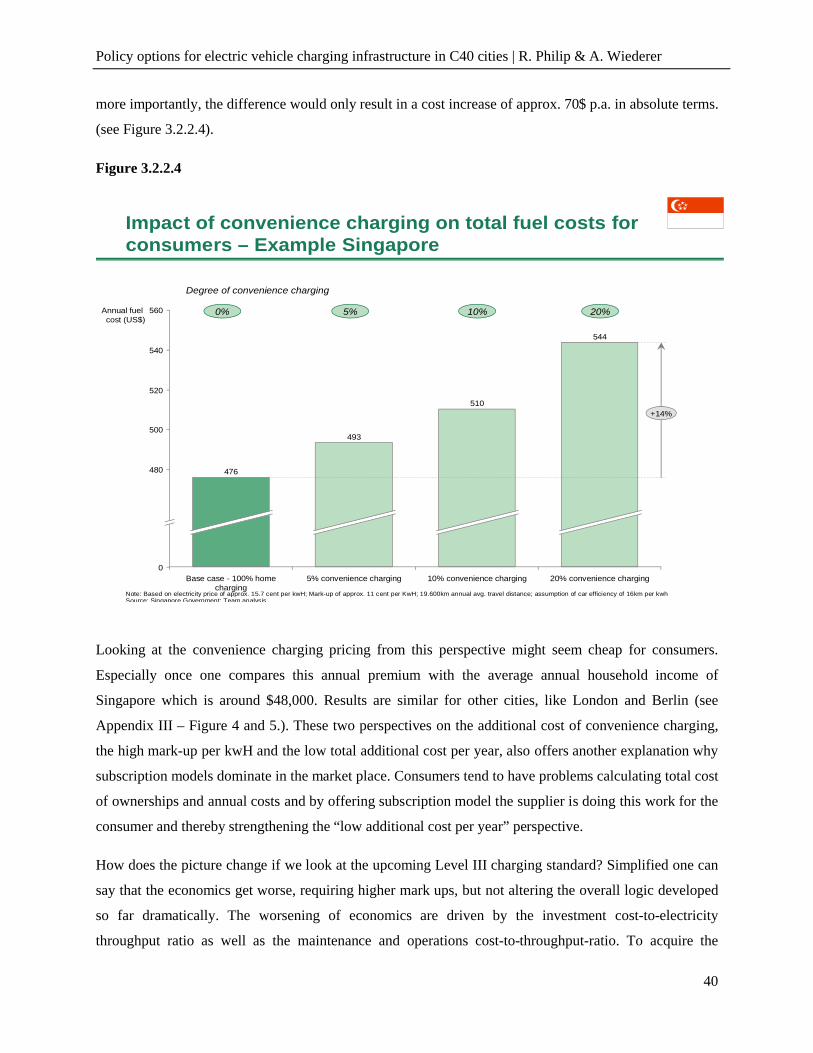
Policy options for electric vehicle charging infrastructure in C40 cities | R. Philip & A. Wiederer
40
more importantly, the difference would only result in a cost increase of approx. 70$ p.a. in absolute terms.
(see Figure 3.2.2.4).
Figure 3.2.2.4
Impact of convenience charging on total fuel costs for consumers – Example Singapore
476
Base case - 100% home charging
493
5% convenience charging
510
20% convenience charging
544
540
520
010% convenience charging
560
500
Annual fuel cost (US$)
480
+14%
0%
Degree of convenience charging
5% 10% 20%
Note: Based on electricity price of approx. 15.7 cent per kwH; Mark-up of approx. 11 cent per KwH; 19.600km annual avg. travel distance; assumption of car efficiency of 16km per kwhSource: Singapore Government; Team analysis
Looking at the convenience charging pricing from this perspective might seem cheap for consumers.
Especially once one compares this annual premium with the average annual household income of
Singapore which is around $48,000. Results are similar for other cities, like London and Berlin (see
Appendix III – Figure 4 and 5.). These two perspectives on the additional cost of convenience charging,
the high mark-up per kwH and the low total additional cost per year, also offers another explanation why
subscription models dominate in the market place. Consumers tend to have problems calculating total cost
of ownerships and annual costs and by offering subscription model the supplier is doing this work for the
consumer and thereby strengthening the “low additional cost per year” perspective.
How does the picture change if we look at the upcoming Level III charging standard? Simplified one can
say that the economics get worse, requiring higher mark ups, but not altering the overall logic developed
so far dramatically. The worsening of economics are driven by the investment cost-to-electricity
throughput ratio as well as the maintenance and operations cost-to-throughput-ratio. To acquire the

Policy options for electric vehicle charging infrastructure in C40 cities | R. Philip & A. Wiederer
41
capacity to transfer one kW per hour, the Level II investment costs are $650 whereas a premium 85% has
to be invested for the same capacity of Level III charging. The higher investment costs also translate in
estimated higher annual maintenance and operation costs. The higher technical complexity and the faster
required turnover of cars at Level III charging spots makes it likely that their business model will more
resemble those of traditional patrol stations – requiring additional personal and more maintenance. In
Figure 3.2.2.5 we estimated these cost differences based on inputs received during interviews.
Figure 3.2.2.5
The impact of these additional costs on the break-even analysis is significant. The mark-up to break even
is now 19.5 cent (compared to 7.5 cent for Level II charging). To achieve a 15% return on investment a
mark-up of approx. 26 cent is required – or of around 165% to today’s electricity prices per kW.
Cost differences Level II and Level III charging
Level III charging:Worse investment-to-throughput ratio...
Level III charging:Worse investment-to-throughput ratio...
...and annual operating and maintenance cost...and annual operating and maintenance cost
1200
650
0
500
1000
1500
US$
Level III chargingLevel II charging
+85%
Initial investment cost in US$ per kW throughput per hour capacity
220
65
0
50
100
150
200
250
Level III chargingLevel II charging
US $
+238%
Operating and maintenance cost in US$ per kW throughput per hour capacity
Note: 5,000$ cost per Level II station and 60,000 cost per level 3 station; 10% annual maintenance cost, additional 5,000$ operating cost per Level III station p.a., 7.7kW throughput for Level II and 50 kW for Level III charging

Policy options for electric vehicle charging infrastructure in C40 cities | R. Philip & A. Wiederer
42
Figure 3.2.2.6
These numbers assume a similar utilization rate as for Level II charging of 20%. In the author’s
discussion with the CCI the hypothesis emerged that the utilization rates for Level III charging are
potentially higher. The reasoning is the different business model: While for Level II charging cars will
park for 3-8 hours to get a significant load and the model will therefore most likely resemble that of
typical parking slots, people will only stop at Level III stations for 15 to 20 minutes to top-up their battery
(within 15 min a car can load electricity for up to 80km distance). In the first case it is most likely that
many spots are only used during peak business hours and during the week, whereas for the second case a
much broader usage (and more use cases) is likely. However, there is no reliable data regarding likely
usage patterns or utilization rates available and the whole industry is relying heavily on estimates and
guesses. Interviews have indicated that 30% utilization might be the upper, very optimistic limit, while
lower utilization rates are more likely. As one can see in the graph, as 30% utilization rate would reduce
the mark-up required for break-even or a 15% return significantly – in the later case a mark-up of 115%
would suffice compared to a mark-up of 165% under the 20% utilization scenario. As the is a large
uncertainty regarding potential utilization rates we will use the conservative 20% estimate to look the
impact of Level III charging on total annual charging cost for users. If we take again the Singapore
example (see Figure 3.2.2.7), we see that even under the most aggressive convenience charging scenario
Rate of return based on varying Mark-up prices - Level III
-15
-10
-5
0
5
10
15
20
25
30
35
40
45
50
55
60
65
70
75
80
0,10 0,12 0,14 0,16 0,18 0,20 0,22 0,24 0,26 0,28 0,30 0,32 0,34 0,36 0,38 0,40 0,42 0,44 0,46
20% Utilization
30% Utilization
Mark-up per kwH in US cent
IRR in %
Note: Utilization 20% respectively 30%; 10 years life time; 10% maintenance cost per year; $5000 additional operation cost p.a.; $60000 price station and installation cost; 50kwH throughputSource: Team analysis
Approx. 125% mark-up over normal electricity rate (20% Utilization
Approx. 165% mark-up over normal electricity rate (20% utilization)
Approx. 115% mark-up over normal electricity rate (30% utilization)
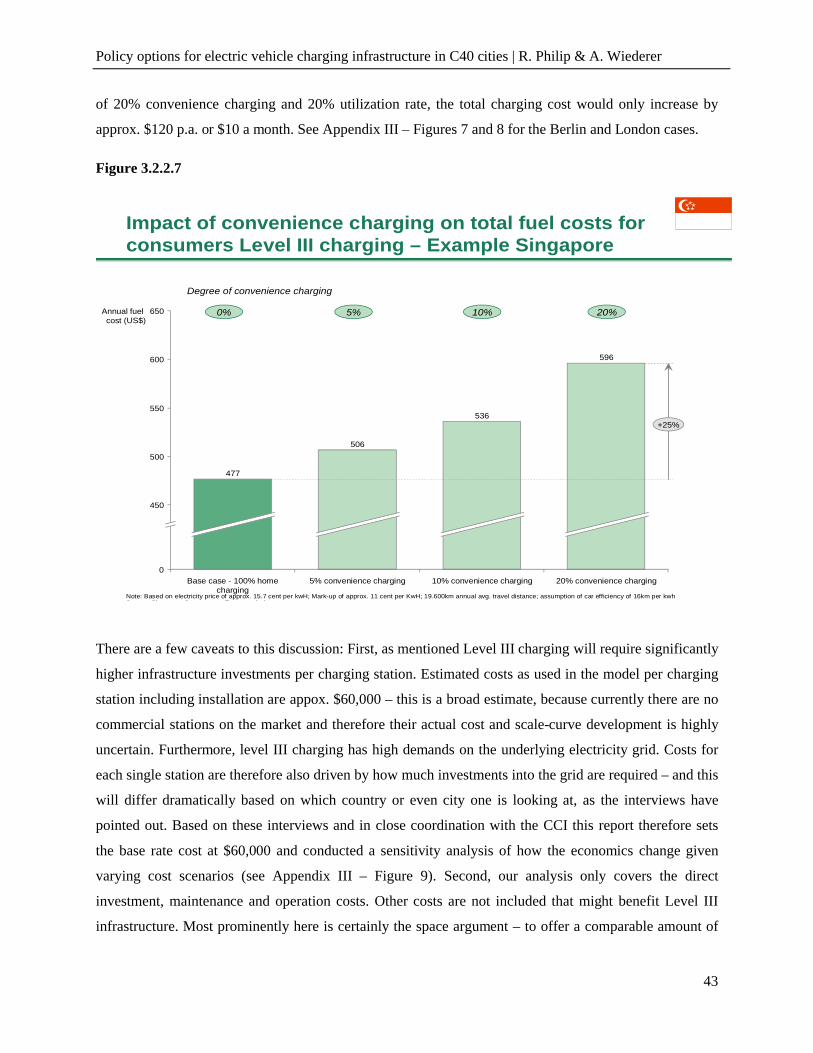
Policy options for electric vehicle charging infrastructure in C40 cities | R. Philip & A. Wiederer
43
of 20% convenience charging and 20% utilization rate, the total charging cost would only increase by
approx. $120 p.a. or $10 a month. See Appendix III – Figures 7 and 8 for the Berlin and London cases.
Figure 3.2.2.7
Impact of convenience charging on total fuel costs for consumers Level III charging – Example Singapore
477
Base case - 100% home charging
506
5% convenience charging
536
596
0
550
500
600
650
450
Annual fuel cost (US$)
10% convenience charging 20% convenience charging
+25%
0%
Degree of convenience charging
5% 10% 20%
Note: Based on electricity price of approx. 15.7 cent per kwH; Mark-up of approx. 11 cent per KwH; 19.600km annual avg. travel distance; assumption of car efficiency of 16km per kwhSource: Singapore Government; Team analysis
There are a few caveats to this discussion: First, as mentioned Level III charging will require significantly
higher infrastructure investments per charging station. Estimated costs as used in the model per charging
station including installation are appox. $60,000 – this is a broad estimate, because currently there are no
commercial stations on the market and therefore their actual cost and scale-curve development is highly
uncertain. Furthermore, level III charging has high demands on the underlying electricity grid. Costs for
each single station are therefore also driven by how much investments into the grid are required – and this
will differ dramatically based on which country or even city one is looking at, as the interviews have
pointed out. Based on these interviews and in close coordination with the CCI this report therefore sets
the base rate cost at $60,000 and conducted a sensitivity analysis of how the economics change given
varying cost scenarios (see Appendix III – Figure 9). Second, our analysis only covers the direct
investment, maintenance and operation costs. Other costs are not included that might benefit Level III
infrastructure. Most prominently here is certainly the space argument – to offer a comparable amount of

Policy options for electric vehicle charging infrastructure in C40 cities | R. Philip & A. Wiederer
44
kW per hour you need between six to seven parking slots with Level II charging and only one with Level
III. For the unlikely case that our previously discussed assumption regarding costs for parking slots does
not hold true this might seriously influence the economics. For cities that own public parking space and
can use parking slots free of cost (assuming that they are able to charge the typical parking fees on top of
the charging fees) this is not relevant to the decision process. Third, Level III charging offers a
significantly different value preposition to the customer. Whereas Level II offers to recharge a typical car
battery between 4 to 8 hours, Level 3 charging can do the same in half an hour. While 10 minutes of
charging at a Level II station does not add significant range, the same can add up to 50 km range using a
Level III charging station. It is likely that users would be willing to pay more for this additional
convenience level – however, no first hand user data is available yet to substantiate this claim.
The specific case of residential on-street parking
How do the economics of a single charging station change if it is not employed on busy roads in the
center of the city but on-street in residential areas where no in-house parking is provided for? To
understand the economics in this case one has first to think about the use case under such conditions.
These parking spaces will most probably be occupied by an individual car during the non-business hours,
parked there after work by its owner, while being empty during the day. This use case makes it clear, that
for such a purpose level II charging is the best technology. Depending on the average km driven per year
by this single car and the amount of charging done at other convenient charging spots, the utilization of
such a station would be significantly lower than the assumed 20% we used before. The following table
provides utilization rates for such stations used by a single car for different cities based on avg. km driven
p.a. in these cities.
Table 3.2.2.1 Estimated Utilization rates of residential on street parking slots with level II charging
Utilization of residential on street charging spot with
5% charging at other spots 10% charging at other spots 20% charging at other spots
Berlin 2,6% 2,5% 2,2%
London 3,3% 3,1% 2,8%
Singapore 4,3% 4,1% 3,6%

Policy options for electric vehicle charging infrastructure in C40 cities | R. Philip & A. Wiederer
45
One can easily see that utilization levels for such a case would be far below any assumption we have so
far operated with. Even when following a policy where it is implicitly assumed that every car is charged
only every second day and therefore each spot could be used by two cars, utilization would only double to
still insufficient 5%-8%. Looking at it from another perspective: In such a case, each electric car
purchaser implicitly would also have to be a charging station or, for the second case, half a charging
station for approx. $7,000 (respectively $3,500) when buying a car, de-facto seriously increasing the
ownership cost of an EV for this user group. So far no answer to this challenge has been found. One of
our interview partners from Better Place acknowledged this problem and at the same time admitted that
they were also still struggling with it. Potential solutions could be significantly stripped down and
therefore cheaper charging stations specifically adapted for this use case (which are, according to the CCI
in development), changed consumer behavior with 100% opportunity charging or other technologies, like
battery swap. But most likely is a very late adoption of EVs from this user group in the product life cycle
of the EV, when technical solutions have been found to this problem and the overall cost of the EV
ecosystem have significantly dropped. On its own residential charging spots do not provide a viable
business case.
Major insights into economics of single charging slots
What has this analysis shown so far? For a single charging station break-even, users would have to pay a
substantial mark-up on current electricity prices. Depending whether we are looking at a Level II or Level
III charging station, these mark ups would be in a range between 50% and 125%. To generate a realistic
return on investment, even higher mark-ups would be required. Looking at the prices from this
perspective, convenience charging might not be overly attractive to consumers. However, translating
these mark-ups into additional annual cost for convenience charging illustrates that these additional costs
are relatively small, ranging somewhere between 20$ and 40$ for the anticipated case of low convenience
charging, and even in the worst case not exceeding 10$ per month. Looking at it from this perspective
might indicate a way higher willingness of consumers to pay for convenience charging infrastructure
when presented to them in the right way. We believe that this is one of the reasons why most offerings
today work based on a subscription model – which is a way of pushing the total annual cost perspective.
Based on these insights one can also understand the industry experts that have uniformly confirmed in
interviews that a charging infrastructure business case has to be based on a holistic, annualized
perspective and not on a single station return model. Our analysis has also shown that the specific usage
patterns of residential charging spots are likely to lead to significantly lower utilization rates than
anticipated in our main model and therefore might not offer a viable business case on their own.

Policy options for electric vehicle charging infrastructure in C40 cities | R. Philip & A. Wiederer
46
3.2.3 Economics of a charging station network
Based on the economics of a single charging station we can do a next step and look at the overall charging
network of a large city. The CCI was especially interested to see how large charging networks in typical
C40 cities would have to be in 2020, what kind of investments would have to be undertaken and how
pricing of charging services would have to look like to support these networks. In order to be able to
answer all these questions we first have to come up with estimates for charging demand and more specific
convenience charging demand in 2020. As already mentioned, coming up or even taking a distinct
perspective of the most likely EV adaptation for the year 2020 is beyond the scope of this paper. We
therefore looked at different, varying scenarios covering most of today’s estimates. For this purpose we
picked three typical cities and analyzed what the range for convenience charging in 2020 given different
level of EV adaptation and degrees of convenience charging could be. To do so we used the charging
infrastructure demand model developed in a previous chapter and focused on the physical demand
component which is the relevant for determining the actual demand of kwH by EVs.
Figure 3.2.3.1
5%
5%
5%
10%
10%
10%
20%
20%
20%
5%
5%
5%
10%
10%
10%
20%
20%
20%
Estimated public charging demand for selected cities
CityCity
Berlin
London
Singapore
Berlin
London
Singapore
Berlin
London
Singapore
Ex
pe
cte
d
ad
ap
tati
on
Hig
h
ad
ap
tati
on
Very
Hig
h
ad
ap
tati
on
# of EVs 2020# of EVs 2020
# cars# cars % adaptation% adaptation Ø dist. (km)Ø dist. (km) Ø kwH/mileØ kwH/mile
1.200.000
2.800.000
570.000
1.200.000
2.800.000
570.000
1.200.000
2.800.000
570.000
5%
5%
5%
10%
10%
10%
20%
20%
20%
12.000
15.000
20.000
12.000
15.000
20.000
12.000
15.000
20.000
16
16
16
16
16
16
16
16
16
% opportunity charging
% opportunity charging
lowlow mediummedium highhigh
5%
5%
5%
10%
10%
10%
20%
20%
20%
Ø kwH per EV p.a.Ø kwH per EV p.a.Estimated
demand 2020 (m kwH)Estimated
demand 2020 (m kwH)
lowlow mediummedium highhigh
5.7
16.3
4.4
11.4
32.6
8.7
22.8
65.1
17.5
11.4
32.6
8.7
22.8
65.1
17.5
45.6
130.2
34.9
22.8
65.1
17.5
45.6
130.2
34.9
91.2
260.4
69.9
x x =
x x

Policy options for electric vehicle charging infrastructure in C40 cities | R. Philip & A. Wiederer
47
In a next step we have looked at how many charging stations would be required to fulfill this demand
given the realistic utilization and technical assumptions we have used while looking at the economics of a
single station. Furthermore, given the costs for individual charging stations we have estimated total
network investment costs. For conciseness reasons we have focused here on the medium adaptation case,
which was also the focus of the CCI. See the appendix for the other cases. What do these results mean?
Let’s look at London to illustrate the findings. Given a 10% adaptation rate, London would have to
transform approx. 2,400 public parking slots into Level II charging spots by 2020 if consumers gravitate
towards a 5% convenience charging degree. If user data shows higher degrees of convenience charging
those numbers would have to increase (approx. 4,800 stations with 10% convenience charging or 9,700
with 20% convenience charging). To offer this infrastructure London would have to invest something
between $12m (5% convenience charging) and $48m (20% convenience charging) for charging stations.
Note, that these costs only cover the stations themselves – not potentially required investments in
additional electricity generation or transmission which might come on top.
Figure 3.2.3.2
Infrastructure size and cost based on Level II charging
BerlinBerlin LondonLondon SingaporeSingapore
17
9
4
5% 10%
% of convenience charging
20%
845
# charging stations
Infrastructure cost in m$
1,690 3,381
48
24
12
5% 10% 20%
% of convenience charging
2,413
# charging stations
Infrastructure cost in m$
4,826 9,651
13
73
5% 10% 20%
% of convenience charging
647
# charging stations
Infrastructure cost in m$
1,295 2,589
Note: Assumes 10% adaptation rate; 20% utilization; 7.7kwH throughput level II charging; cost of 5,000$ per charging stationSource: Team analysis
We have done the same calculations also for a Level III infrastructure network. As to be expected, the
number of stations would be significantly reduced under such a scenario, but the costs would be higher.

Policy options for electric vehicle charging infrastructure in C40 cities | R. Philip & A. Wiederer
48
Figure 3.2.3.3
16
Infrastructure size and cost based on level III charging
BerlinBerlin LondonLondon SingaporeSingapore
31
16
8
5% 10% 20%
% of convenience charging
130
# charging stations
Infrastructure cost in m$
260 521
89
45
22
5% 10% 20%
% of convenience charging
372
# charging stations
Infrastructure cost in m$
743 1,486
24
126
5% 10% 20%
% of convenience charging
100
# charging stations
Infrastructure cost in m$
199 399
Note: Assumes 10% adaptation rate; 20% utilization; 50kwH throughput level III charging; cost of 60,000$ per charging stationSource: Team analysis
Looking back at the demand framework we have developed in chapter 3.2.1, it is important to note that
we have so far only looked at the physical side of demand – the number of stations calculated is the
number required to supply EVs with the electricity that is likely to be consumed. We have not included
the psychology factor, which is driven by range anxiety, in our considerations. The basic question is
whether the amount of charging stations calculated is large enough to cover the geographic area of a city
in a way that there is always a station close by the consumer and a sense of availability is reached. To test
this we have gathered information about the number of petrol stations currently operational in the cities
analyzed. The most reliable data we got for the City of London, where petrol sales are regulated and every
sales outlet hast to be registered. According to these official numbers London has currently 900 petrol
stations.40 We also gathered a rough estimate for Singapore based on an analysis of Singapore’s yellow
pages and business directory. According to this source Singapore has something between 175 and 200
petrol stations. Comparing these numbers with the amount of stations installed under a 10% convenience
scenario, we see that the number of level III charging stations is roughly in line with the number of patrol
stations currently in operation. Should convenience charging only attract 5% of the charging market share
or should the numbers of EV on the road be significantly lower than estimated in our base scenario, this

Policy options for electric vehicle charging infrastructure in C40 cities | R. Philip & A. Wiederer
49
comparison would indicate that the stations required to fulfill the physical demand might not suffice the
psychological demand. However, one should note that patrol stations are not a very good predictor of
psychological demand – patrol stations are profitable and there deployment is driven by real petrol
demand not by psychological factors. The number of petrol stations therefore can only provide an upper
boundary of required outlets, their predictive power as a lower limit is questionable.
Major insights into the economics of a charging network
What are the most interesting insights from this analysis? First, investments required to provide
opportunity charging to even large cities like London are relatively modest. For the case of 10%
convenience charging the pure investment cost would be somewhere between $24m and $45m depending
on the technology chosen – given an investment horizon till 2020 this seems to be a manageable
investment especially comparing them to some of the more prominent public investment schemes in
London like public transportation. Second, based on these cost estimates we can calculate what
subscription fees would be required for such a network to break even or generate positive returns. In
Figure 3.2.3.4 you see the results of this analysis for the medium adaptation case in which it is assumed
that 10% of the cars in 2020 are EVs. Since the cost estimates we used so far only cover the pure station
and installation costs, we depict the subscription fees as a range that of pure station costs plus 20% to
cover any potential additional costs that might emerge to connect the stations and run them as an
integrated network. This rather crude method is used because there are no current estimates for these
network costs available and even experts have difficulties quantifying them. The interesting insight is,
that even when considering these additional network costs, subscription fees per consumer are moderate.
Depending on city, technology used and the degree of convenience charging they are somewhere between
$11 and $192 – all numbers that seem to be moderate giving the income levels of the countries we are
looking at. Also compared to other subscription services people are used to pay for, these numbers seem
to be in line. In Berlin a consumer can easily pay more than $300 p.a. for a mobile phone service. Even
though there is of course no real “willingness to pay” data available, it seems that these subscription costs
are not unreasonable from a consumer perspective and should not seriously limit the employment of
charging infrastructure.

Policy options for electric vehicle charging infrastructure in C40 cities | R. Philip & A. Wiederer
50
Figure 3.2.3.4
Required subscription fees to sustain charging infrastructure in selected cities
BerlinBerlin LondonLondon SingaporeSingapore
11-13
42-50
5% Convenience
20% Convenience
Level IILevel II Level IIILevel III
Subscription fees between $11-$30 for low and $42-$117 for high
convenience charging
Required sub-scription fee p.a. ($)
Required sub-scription fee p.a. ($)
25-30
98-117
20% Convenience
5% Convenience
13-16
5% Convenience
52-62
20% Convenience
Level IILevel II Level IIILevel III
Subscription fees between $13-$37 for low and $52-$146 for high
convenience charging
Required sub-scription fee p.a. ($)
Required sub-scription fee p.a. ($)
31-37
5% Convenience
122-146
20% Convenience
17-20
5% Convenience
68-81
20% Convenience
Level IILevel II Level IIILevel III
Subscription fees between $17-$48 for low and $68-$192 for high
convenience charging
Required sub-scription fee p.a. ($)
Required sub-scription fee p.a. ($)
40-48
5% Convenience
160-192
20% Convenience
Note: Assuming 20% utilization, 15% IRR, Medium 10% adaptation rate for the year 2020, 5,000$ cost per Level II station and 60,000 cost per level 3 station; 10% annual maintenance cost, additional 5,000$ operating cost per Level III station p.a., 7.7kW throughput for Level II and 50 kW for Level III chargingSource: Team analysis
Subscription fee based on only station costs
Additional cost component for network infrastructure (20%)
Some caveats to the economics of charging networks
Our economic analysis so far has shown that economics seem to be no major obstacle to the private roll-
out of charging infrastructure. There are, however, some caveats to this analysis. The three major ones
will be presented here.
First, we have so far only looked at the year 2020 and analyzed whether charging infrastructure can be
economically feasible under the conditions present then. A charging network has a minimum amount of
stations required to cover a geographic area to fulfill the requirements imposed by range anxiety
irrespective of the amount of EVs on the road. Because only a very limited amount of EVs will be on the
roads during the first years of the EV lifecycle, the revenues of these cars will probably not suffice to
cover the cost of this minimum network. These loses during the first years of operation can discourage
private investment. Interview partners in Singapore for example mentioned that because of these initial
losses and the long time frame required to reach positive returns was one main reason why no private
investor could be found. This might also be the reason why London decided to install and operate
charging infrastructure itself for the first years or why the federal government is granting subsidies to the
Berlin test runs.
Policy options for electric vehicle charging infrastructure in C40 cities | R. Philip & A. Wiederer
51
Second, we have seen that there is a large and significant number of unknowns, like consumer behavior
and preferences, utilization rates, etc, which have a major impact on charging infrastructure. Initial
investors in charging infrastructure bear the discovery cost for identifying these currently unknown
parameters, but they are unlikely to gain a significant competitive advantage from this, because this
information can hardly be kept confidential (because behavioral patterns are easily observable). For a
private investor it therefore makes sense to wait and see and let others bear the expenses of discovery.
This can lead to a dynamic in which no player wants to take the role of first mover thereby delaying the
installation of the infrastructure. We have found no conclusive evidence whether this is phenomenon can
be observed in the market right now. Federal subsidies that cover the discovery cost, like in Berlin, or a
city acting as first mover and thereby bearing the discovery cost, like in London or Singapore, might be
interpreted in this regard. On the other hand there are private companies like Better Place who have
willingly taken on the role as first mover.
Third, we have assumed utilization rates of at least 20% on average for our calculations of the network
economics. However, our analysis of the utilization rates of residential charging spots has shown that a
20% average utilization rate might be not obtainable in cities with a very high share of residential parking.
A significant drop of utilization rates would increase the number of required charging stations and thereby
the network cost and subscription fees. Whether this effect could make charging networks in some cities
economically not feasible, will depend on the percentage of required residential charging spots and the
willingness of consumes to pay higher subscription fees. The former is different from city to city, the
latter is yet unknown. We therefore cannot come to a final verdict here whether this problem will become
critical in some cities – but we want to point out that the potential exists and that in those cases a public
intervention might be necessary.
3.3 Technology barriers
All the interviews and research that we conducted have indicated that the core elements of charging
infrastructure technology are ready for implementation. Level II charging stations have been installed in
significant numbers already in London, Berlin and across the US, Level III charging station specifications
are finalized and their production has been announced by leading manufacturers like Coulomb. Also on
the demand side, things are moving fast – Nissan has launched a US wide marketing campaign to promote
the Leaf, their first full electric vehicle. Other large OEMs are following suit; BMW for example just
announced that it plans to launch its fully electric 3-series sedan in 2015. Charging and EV technology
seems to be available and, apart from some standardization issues which will be resolved soon, ready for
employment.

Policy options for electric vehicle charging infrastructure in C40 cities | R. Philip & A. Wiederer
52
There are however certain emerging technologies that might slow down adaptation of charging
infrastructure. Based on our interviews these issues relate mainly to two technologies that are not yet
employed on a large scale, but have the potential to heavily influence the structure, city strategies and
logic of charging infrastructure. These two technologies are battery exchange and smart grid.
Battery exchange
The concept of battery exchange is straight-forward. Whenever a car is running low on battery power, it
can stop at dedicated battery exchange stations where the battery is replaced by a automatic mechanism
within a few minutes. The batteries removed from the car is then fast charged and ready to be redeployed
with approx. 30min to another car thereby holding the battery stock low. The main proponent of this
technology is the Californian start-up Better Place which has entered a partnership with Renault which
will offer cars compatible with this technology. Shai Agassi, founder and CEO of Better Place, argues
that batteries allowing for long enough ranges to allow EVs to leave the niche they are currently
inhabiting, won’t exist for another 15 to 20 years.41 According to Agassi the solution is not postponing the
mass introduction of EVs for several decades but to establish “a ubiquitous infrastructure”. His proposed
panacea to this problem is battery exchange technology, which allows for “exceptional long drive[s]”
through the opportunity to swap a drained battery with a new fully-charged battery. Better Place’s
powerful marketing machine has made the battery exchange a symbol for the electrification of the car –
with whomever non-expert we talked to about this project, the battery exchange topic was brought up.
Battery exchange becomes relevant for overall charging infrastructure because it potentially could change
the patterns of how cars are charged or lead cities to postpone charging infrastructure deployment /
investments until the exchange technology is ready for large-scale deployment.
We have found strong evidence that battery exchange is unlikely to become widespread within the mass
market – if it materializes at all it will most probably be a niche application for fleets. There are three
main reasons driving this assessment. First, battery exchange technology is expensive. Interviewees
mentioned cost figures ranging from $1m to $1.5m – equaling the cost of between 15 and 25 fast charging
stations. Perhaps even more significantly, using a battery exchange concept practically increases the
number of batteries required per car from currently one (the one installed in the car) to a number larger
than one – depending on how large the number of batteries on hold at charging stations has to be.
Especially if there emerge different form factors for different car types and different battery performance
classes the battery stock might have to be significant, factually resulting in an increase of the cost per car.
Second, investing in exchange stations is factually a bet against battery technology and further
performance increases of these batteries in the future. However, battery performance has increased

Policy options for electric vehicle charging infrastructure in C40 cities | R. Philip & A. Wiederer
53
significantly in the past and potentially will do so in the future. Third, and perhaps most importantly,
many OEMs are highly reluctant to engage in this technology. This reluctance has mainly two reasons.
Allowing for batteries to be exchanged limits OEMs in their freedom to place the battery within the car.
But since batteries constitute a significant portion of the car weight (the relatively small battery of the
Renault Kangoo be bop for example weights 250kg – or 17% of the total weight of the car), this makes
car balancing more difficult – a problem especially for high performance manufacturer like BMW or
Mercedes.42 BMW for example mentions how the battery is spread out over different locations in its
Active-E concept car to achieve optimal balancing.43 Perhaps even more importantly OEMs seem to see
battery performance to be a factor they can potentially compete on. As a study by the Boston Consulting
Group (BCG) illustrates, there are currently two competing business logics emerging.44 In one, OEMs
closely partner or even vertically integrate with battery suppliers to differentiate their offering. In the
other, battery suppliers will team with tier one suppliers to allow for larger scale effects. Should scenario
one materialize battery exchanges would become difficult to realize, if not impossible, because this would
require exchange stations to have a stock of different battery packs for each major car manufacturer
increasing costs and complexity significantly.45 BCG expects the first scenario to dominate during the
infancy years of the industry and only foresees a switch to the second model once battery technology
becomes more of a commodity later in the product life-cycle. But this late in the life-cycle one could
expect battery technology to have improved already significantly and offering far longer ranges rendering
battery exchanges pointless.
For all the reasons cited above, we have encountered an enormous skepticism regarding Better Place and
its exchange concept in all of their interviews (apart from the interview with Batter Place of course). Also
a clear sign: So far only one supplier, Renault, has committed itself to offer cars with exchangeable
batteries. And even Renault is hedging its bets – its sister company Nissan is not offering battery-
exchange ready cars diversifying the risk of the technology not catch on and the first fully electrical car of
Renault will, in fact, not offer an exchange option.46 One area in which battery exchanges might be able to
establish themselves are large, high mileage fleets like cabs. These fleets are often using only a limited
number of car models, would extremely benefit by the lower expected TCO cost of EVs and require the
non-interruption recharging exchange stations can offer. However, even though this might be a lucrative
market, it is a niche. A more interesting point from that can be learned from battery exchange concept. As
mentioned the concept was extremely popular initially and a number of countries have committed
themselves to it by collaborating with Better Place – now it seems that this technology might not play a
major part in the overall charging infrastructure and the cost of developing and potentially rolling it out

Policy options for electric vehicle charging infrastructure in C40 cities | R. Philip & A. Wiederer
54
might even slow down other components of the infrastructure. A premature commitment to certain
technologies might yield risks for cities and countries alike.
Smart grid
The smart grid is a catch-all term used to refer to a wide family of grid applications from smart metering
to demand response to using EVs as a storage mechanism. Some of the expected benefits include
increased grid asset utilization, peak smoothing through the use of storage capacity connected to the grid,
and better integration of intermittent renewable sources like solar and wind energy. The key players in the
smart grid space include conventional utilities, IT / networking / telecommunications companies that offer
the software and communications technology, storage companies, renewable energy providers, EV OEMs
and EV charging providers.
There is considerable uncertainty regarding the impact of the smart grid on EV batteries and EV charging
infrastructure. Using EVs as a storage mechanism would require bi-directional flow of electricity through
charging equipment. We spoke to a California-based utility that is carrying out a smart grid pilot as well
as with the key stakeholders involved in Singapore’s smart grid pilot. Interviewees mentioned that there
are several concerns. Frequent charging and discharging of the EV battery could potentially cause damage
to it and reduce its life. An interviewee from Singapore mentioned that connecting an EV battery to the
grid could lead to “dirty signals” of a different frequency from the battery being transmitted onto the grid,
which could cause the grid to trip. The pilot projects would help provide more data on this issue.
From all the interviews and secondary research reviewed, we also gleaned that smart grids are some years
away from large-scale commercial application. Apart from the technical concerns expressed earlier, the
economics are also still unproven. We believe that cities should not hold back their charging
infrastructure plans for certainty on smart grids and should instead go ahead with them. In the future it is
likely that smart grid applications will require upgrades to charging infrastructure. We believe it is
reasonable to expect that the benefits of these smart grid applications will need to outweigh the costs of
upgrading the infrastructure and provide ample incentives to EV users and charging infrastructure
providers to actually be used.

Policy options for electric vehicle charging infrastructure in C40 cities | R. Philip & A. Wiederer
55
3. Policy options for EV charging infrastructureThe earlier chapters of this report analyze the key barriers to the large scale deployment of EVs and EV
charging infrastructure as well as the economics of charging infrastructure. This chapter delves into the
various policy options for city governments in terms of the levers they can exercise to mitigate the
barriers and favorably influence the economics of charging infrastructure. Understanding the levers that
city governments possess as well as their strengths and weaknesses is important in understanding the role
a particular city government can play in encouraging the deployment of EV charging infrastructure.
City governments have a tool-kit of several policy levers at their disposal to influence the deployment of
EVs and EV charging infrastructure. They can be broadly clubbed into the following categories –
monetary and non-monetary incentives, regulatory, real estate, advocacy and public relations and
procurement. Early in this chapter, some of these policy levers are listed (with a more detailed description
in the Annexure), followed by an analysis of the strengths and weaknesses of city government with
regards to these levers, and subsequently frameworks are proposed for deciding which policy-levers from
a city tool-kit to employ to overcome barriers to the deployment of EVs and EV charging infrastructure.
Each city has its unique environment, within which different incentives will have different appeal for
policy-makers, consumers, utilities and charging infrastructure providers.
4.1 Policy levers
Depending on a particular city’s EV objectives and main barriers to deployment of charging
infrastructure; it can exercise particular policy levers in order to achieve its objectives. The major
categories of policy levers are described below. Detailed descriptions of each lever are given in Annexure
II along with examples of cities that have already employed them.
Regulatory levers
Zoning and building codes
Approval for technical standards for charging equipment
Regulation regarding utilities sale of electricity, whether EV-related investments get included in
utility asset bases, etc
Permitting rules and guidelines
Monetary and non-monetary incentives
Subsidies / tax credits for EVs
Discounts or waivers on registration / annual taxes on EVs

Policy options for electric vehicle charging infrastructure in C40 cities | R. Philip & A. Wiederer
56
Subsidies for charging infrastructure
Investment tax credits for charging infrastructure
Production tax credits for charging infrastructure
Free parking for EVs
Waiving congestion charges for EVs
Electricity discounts for EV charging
Access to HOV lanes
Real estate
Ownership of public garages & on-street space that can be used for charging infrastructure
Advocacy and public relations
Demonstration projects
Advocacy by public figures
Procurement for public fleets
City government procurement of EVs for public fleets.
4.2 Analysis of city government policy levers
Of the various levers mentioned above, cities have a comparative advantage in some and a weakness in
others. The main comparative advantage that cities have is in regulation, advocacy and procurement and
to an extent, non-monetary incentives. Monetary incentives for EVs is a weakness for cities as cities
typically have limited local tax resources and many spending needs so subsidizing EV ownership might
be difficult for city governments. State or national governments are more likely to be able to subsidize
EVs.
City strengths: With building codes, cities can mandate that EV charging equipment of a certain level is
included in any new construction, while with zoning regulation, cities can influence where and how many
EV charging stations can be installed in a particular area. This is a key lever that can influence the
availability of charging infrastructure in the future. Similarly streamlining and expediting permitting
processes is something that cities can undertake to make the installation of charging infrastructure easier
and cheaper for EV users and charging infrastructure providers. Many cities have already committed to
such actions already including Los Angeles and the Bay Area cities of San Francisco, San Jose &
Oakland.47
Regulation regarding standards for charging infrastructure and utility investments in EV-related
infrastructure might not be as easy though, depending on the degree of control the city government has on
that regulation. For standards for example, typically a national or international standards agency decides
on a standard in consultation with all stakeholders, which city governments can then include in building
Policy options for electric vehicle charging infrastructure in C40 cities | R. Philip & A. Wiederer
57
codes, permitting processes, etc. Cities can lobby these organizations to develop standards that suit their
local grid conditions and work to implement them in their building codes quickly. Singapore for example
has mandated that it’s Agency for Science Technology & Research develop a standard for charging
infrastructure by a certain timeline and has included the Housing Development Board and other agencies
required to implement and roll out the standard.
Regulatory leverage regarding utility investment in EV charging infrastructure is a function of whether a
city owns the utility and has regulatory control over utilities. For example the city of Los Angeles owns
the LA Department of Water & Power, one of the major utilities serving the city. LADWP has taken the
lead in rolling out charging infrastructure in the city, under a mandate from the city council. LADWP
however, like other utilities in the area like PG&E and SCE, is regulated by the California Public Utilities
Commission which decides what assets a utility can include in its asset base for rate-making, etc. The city
government can however mandate, or work with a state or national government to mandate that the
regulator a policy decision on that issue, as in the example of the California Senate cited earlier.
The other significant competitive advantage cities have is in real estate, in terms of on-street space and in
some cities, public garages. Cities can build charging infrastructure on streets or lease out space to private
sector charging infrastructure providers. This can be done through a concession where a particular
charging infrastructure provider covers a particular area or neighborhood or on an ad-hoc application
basis. This is obviously an asset with revenue-generating potential in terms of rental income, but as
argued earlier in the economic analysis, cities would ideally want to waive this rental opportunity as it
meets the objective of increasing deployment of charging infrastructure, and positively impacts the
economics of charging infrastructure.
Another strength cities have is in advocacy and public relations. City government leaders can play an
active role in promoting electric vehicle adoption and building awareness about charging, etc. There has
been significant publicity and media coverage of the various announcements by Mayors of cities with EV
programs, which comes free of cost to city governments, EV OEMs and charging infrastructure providers.
The picture on this report’s cover page, for example is of Portland Mayor Sam Adams announcing a city
government partnership with Nissan for EV deployment.
Another significant lever that cities have is in procurement of EVs for city fleets. London, in its Electric
Vehicle Delivery Plan has set a target of procuring 1000 EVs by 2015 for the Greater London Authority
fleet, making use of the increased volumes to reduce cost. The Plan also mentions working with suppliers
in terms of specifications, etc.
Weaknesses: Monetary incentives might be more challenging for cities, as cities typically have limited
local tax resources and many spending needs. Monetary incentives that reduce the upfront cost of EVs are

Policy options for electric vehicle charging infrastructure in C40 cities | R. Philip & A. Wiederer
58
more likely to come to come from national government programs. London though has offered a
congestion charging waiver to EV users and some boroughs in the city offer free parking for EVs.
Some cities have rolled out subsidies for charging infrastructure e.g. Los Angeles announced a Home
Charger Early Adapter Incentive Program to subsidize the installation up to $2,000 for the first 5,000
residential customers, in Dec 2009. Cities that do not have the fiscal flexibility to offer monetary
incentives can however make use of other non-monetary incentives like access to High-Occupancy-
Vehicle / bus lanes, to incentivize EV adoption.
For cities that have fiscal flexibility and an entire spectrum of policy levers to choose from, it becomes
necessary to have a framework for evaluation and choice of appropriate policy levers.
4.3 Frameworks for evaluation and choice of appropriate policy levers
Each city has its unique environment, within which different incentives will have different appeal for
policy-makers, consumers, utilities and charging infrastructure providers. This section proposes
frameworks for evaluation of the various available policy levers, which can then enable choice of
appropriate policy levers.
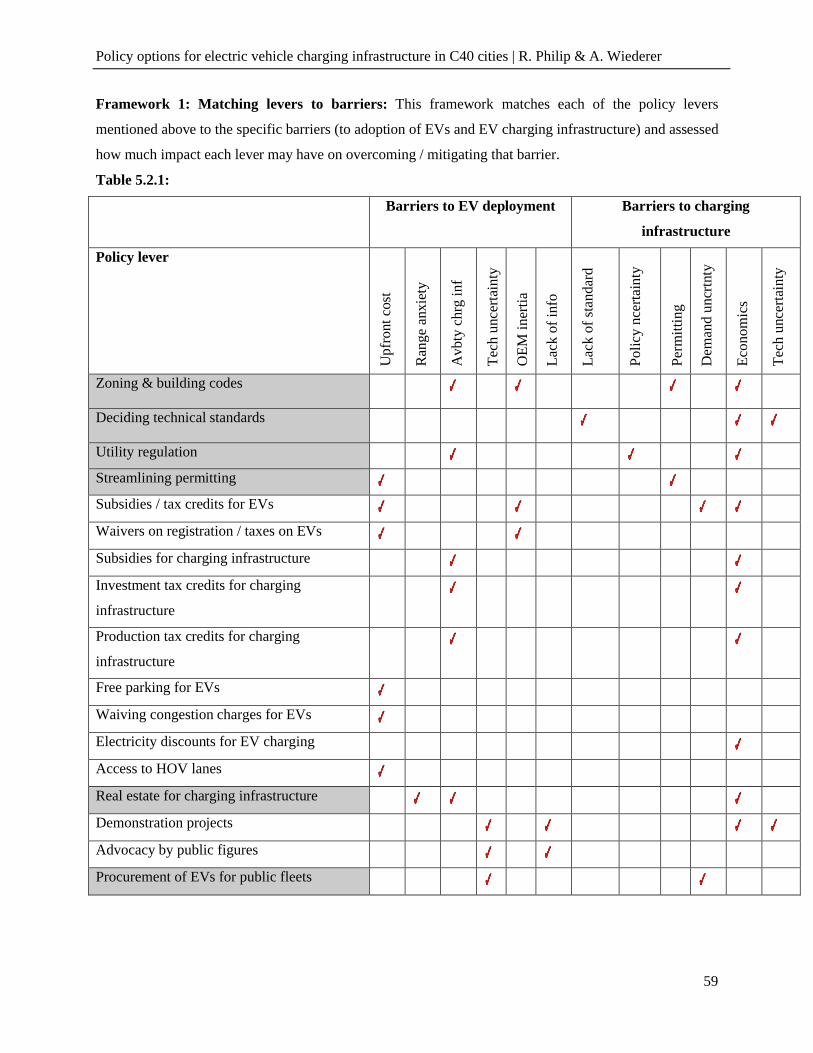
Policy options for electric vehicle charging infrastructure in C40 cities | R. Philip & A. Wiederer
59
Framework 1: Matching levers to barriers: This framework matches each of the policy levers
mentioned above to the specific barriers (to adoption of EVs and EV charging infrastructure) and assessed
how much impact each lever may have on overcoming / mitigating that barrier.
Table 5.2.1:
Barriers to EV deployment Barriers to charging
infrastructure
Policy lever
Upf
ront
cos
t
Ran
ge a
nxie
ty
Avb
ty c
hrg
inf
Tec
h un
cert
aint
y
OE
M in
erti
a
Lac
k of
info
Lac
k of
sta
ndar
d
Pol
icy
ncer
tain
ty
Per
mit
ting
Dem
and
uncr
tnty
Eco
nom
ics
Tec
h un
cert
aint
y
Zoning & building codes
Deciding technical standards
Utility regulation
Streamlining permitting
Subsidies / tax credits for EVs
Waivers on registration / taxes on EVs
Subsidies for charging infrastructure
Investment tax credits for charging
infrastructure
Production tax credits for charging
infrastructure
Free parking for EVs
Waiving congestion charges for EVs
Electricity discounts for EV charging
Access to HOV lanes
Real estate for charging infrastructure
Demonstration projects
Advocacy by public figures
Procurement of EVs for public fleets

Policy options for electric vehicle charging infrastructure in C40 cities | R. Philip & A. Wiederer
60
Framework 2: Cost-benefit and NPV analyses: There are several other policy frameworks that can be
used for evaluation and choice of appropriate levers. These include cost-benefit analyses and NPV
analyses. Many governments already have formal criteria and methodologies for carrying out cost-benefit
analyses of government interventions. An NPV analyses can be used to understand how much of a
subsidy would be required to make the purchase of EV or EV charger positive / profitable.

Policy options for electric vehicle charging infrastructure in C40 cities | R. Philip & A. Wiederer
61
4. RecommendationsThe earlier chapters in this report cover many of the complex issues that cities need to address with regard
to influencing EV adaptation and more specifically charging infrastructure deployment. C40 cities are
facing differing circumstances, initial positions and objectives, as well as differing key actors with
varying levels of expertise / capacity - which call for individually tailored approaches for charging
infrastructure deployment. However, we believe that based on the arguments presented in this report, five
broad and generally applicable recommendations / learning points emerge that are of relevance for all the
C40 cities that our client is advising. These recommendations regarding policy options for EV charging
infrastructure for C40 cities are built on some of the key insights that emerge from the research covered in
this report. These key recommendations are:
1. Cities should design EV strategies / programs that are unique to their individual circumstances,
objectives and players, but should draw on lessons from peer cities
As discussed in this report and as highlighted in more detail in the case studies in Annexure I, different
cities across the world have different circumstances and different objectives with regard to EVs. In terms
of parking availability, while wide-spread cities like LA have high percentages of parking in private off-
street garages, other more densely-populated cities like Paris or San-Francisco rely more on residential
on- street parking. Our analysis has shown that private charging networks are economically feasible in the
former, but costs for on-street residential charging infrastructure might be prohibitively high.
Consequently the behavior of these cities should be different: The role for cities with high percentages of
private off-street parking is to focus more on setting a regulatory framework conducive for investment in
charging infrastructure networks, increasing EV deployment by switching public fleets to EVs and
leveraging city-owned real estate to speed up infrastructure deployment. Cities with low levels of private
off-street parking can expect to see a significantly lower EV uptake, due to less favorable economics –
and might be forced to subsidize on-street -residential charging if they want to speed up this process.
Furthermore, cities have different objectives for deploying EVs and EV charging infrastructure.
Singapore is mainly interested in being a leading test bed for EV and EV charging technology, thereby
leading to industry development, while London is looking primarily at the environmental benefits, while
L.A. is following a mixture of these two objectives. As a consequence, cities will and should follow
different strategies. For industry development purposes, small test-runs with the latest technology seem
appropriate, whereas wide-spread adaptation required to achieve an environmental impact will require
more elaborate planning, coordination between public and private stakeholders, public awareness
campaigns, investment in charging infrastructure, and the use of proven technologies. Each city will have
Policy options for electric vehicle charging infrastructure in C40 cities | R. Philip & A. Wiederer
62
to develop its own strategy based on its unique set of objectives connected with EVs and charging
infrastructure.
On a more general note: Our interviews have also shown that there is also immense value from sharing
lessons about what works and what doesn’t in regard to charging, across cities, to overcome the
information deficiencies discussed in earlier chapters. This is where networks like the C40 EVN have
tremendous value in terms of information and best practice sharing across cities, with regard to
regulation, PPP (Public Private Partnership) models, implementation challenges faced, etc.
2. City governments have limited resources to mitigate up-front EV cost but can use other policy
levers to affect TCO of EVs
The upfront cost of EVs is the single biggest barrier to adaptation / deployment of EVs; however cities
have limited means at their disposal (if any) to influence upfront EV cost, as cities typically have limited
local tax resources and many spending needs. Current programs to reduce upfront cost for EVs are mainly
sponsored on a federal level. However cities have other instruments at their disposal which affect the
TCO of EVs and therefore enter into the overall value equation of an EV from a consumer’s perspective.
Potential instruments (as discussed in chapter 4) include waiving congestion charging & parking costs,
providing free / discounted electricity for charging, preferred street access, etc. All these instruments can
be used to reduce the cost of an EV over its life-time compared to a traditional ICE vehicle. These
measures might not be as effective as direct upfront cost reductions because consumers often seem to
struggle with the concept of TCOs, but the measures might be a second best option from a city
perspective. These additional incentives are potentially especially valuable early in the life-cycle of the
EV technology when scale effects have not yet set in and EVs therefore might seem less attractive. In this
early phase these measures are also likely to impose only a limited burden on city finances because only
few EVs will be sold during the initial years. Our research has shown that several cities have employed
this approach - London and Los Angeles being prominent examples.
3. Cities should use their regulatory influence smartly to create a conducive environment for
private investors of charging infrastructure – and only provide subsidies under specific
circumstances
This report shows that there are several regulatory barriers to the deployment of EV charging
infrastructure including permitting of charging infrastructure, the lack of a technical standard for charging
infrastructure, policy uncertainty regarding sale of electricity, regulation regarding EV-related investment
by utilities, etc. Cities which face these regulatory barriers should address them as early as possible by
building political consensus and then mandating the relevant government agency to address each issue

Policy options for electric vehicle charging infrastructure in C40 cities | R. Philip & A. Wiederer
63
whether it be permitting, deciding a standard in consultation with OEMs, etc. As mentioned in Chapter 4,
city governments hold a comparative advantage in zoning and building codes and permitting, and they
should use those levers to good effect. Various city, state and federal governments have already been pro-
active in the regulatory space – examples include San Francisco, Los Angeles (permitting), Singapore
(EV charging standard), California (mandating the Public Utility Commission to address questions
regarding sale of electricity, utility EV-related investments, etc), Berlin (mandating inter-operability
between EV charging networks). Cities should use their regulatory influence smartly to remove / mitigate
barriers to create a conducive environment for private investors.
This report has also shown in chapter 3 that per-se a direct subsidy to private infrastructure providers is
not required because charging networks offer a viable business opportunity – the notable exemption being
cities with large proportions of on-street residential parking where residents might be undersupplied with
charging infrastructure as the economics under those conditions are less appealing.. It is in those cities
that an extensive public and residential parking infrastructure becomes necessary because consumers can
only rely on cheap home charging to a limited degree. If cities see the need to speed up adaptation in
these areas, cities might be forced to either subsidize infrastructure or operate it themselves on a non-
profit basis. Another circumstance where city investment might be necessary is the case of very high
demand risk – under these circumstances cities can also consider running pilot projects or demonstration
projects for proof of concept, which if proved economically viable, can then subsequently be sold to the
private sector. This approach has for example been chosen by London.
4. If cities or city utilities do offer charging infrastructure services there is a strong case to be
made for subscription fee based business models to gain consumer acceptance
Two key insights emerge from the analysis of the economics of public charging infrastructure. First, from
a pay-per-use perspective, the mark-up required to make the infrastructure economically feasible might
look prohibitively expensive to consumers. Second, annual subscription fees required to finance a
network would be, even under conservative assumptions, appear modest and in line with amounts
consumers are prepared to pay for other services. To make consumers accept public charging and allow
for a profitable charging infrastructure business, there is a strong case to push for subscription fee models.
Cities which run own the charging infrastructure themselves (or by city owned utilities) should therefore
have subscription-fee based business models. Interviews with Better Place and RWE have shown that this
is the direction the private sector is also taking.
5. Cities should be aware of technological uncertainties and not commit prematurely

Policy options for electric vehicle charging infrastructure in C40 cities | R. Philip & A. Wiederer
64
As discussed in Chapter 3, there are significant technology barriers and uncertainties that also exist. EV
battery swap technology, for example, has generated tremendous media attention and investor attention
over the last few years. Our research and interviews show several concerns regarding this technology,
including the constraints it places on EV design by OEMs, its costs, and the inverse relationship of its
usefulness with advances in battery technology. Battery swap is therefore a good example why, we
recommend that cities should not commit prematurely to specific technical solutions. The EV industry is
still young and highly dynamic, and hence changes in technology while the industry matures are likely.
That being said: for key components of charging infrastructure, like Level I, II and III charging, the norms
have been set and one can expect with a high certainty that they are here to stay. It appears to be safe for
cities to commit to these standards now. Waiting to gain additional information about the development of
the smart grid is not recommended. Yes, the smart grid promises to be an important tool in the energy
infrastructure of the future and there are a number of pilot projects and R&D efforts currently focused on
the interplay of EVs as storage device and the electric grid. The uncertainties relating to the smart grid are
still high though – there is uncertainty regarding what technical specifications it will have and what the
impact on charging infrastructure and batteries will be. From today’s perspective it is even uncertain
whether the smart grid will ever rely in significant numbers on car batteries. Therefore slowing down EV
adaptation based on this remote possibility does not make sense given the current dynamic of the sector.
If a particular smart grid application in the future makes economic sense, it will generate economic
returns that allow for the charging infrastructure to be updated. The argument that the smart grid is
required for the charging infrastructure’s economic viability is not supported by the analysis in this report
– and also not by the reality of public and private sectors already investing in charging infrastructure
without any smart grid component.
We believe that taking these five recommendations into consideration, cities can increase their likelihood
of successful and rapid EV deployment. The research for this paper has proven, at least from our
perspective, one thing beyond any reasonable doubt: the adaptation of EVs is a reality, during the next
decades there will be a significant uptake of EVs on the streets around the world – OEMs are preparing
the cars for this uptake, utilities, transport agencies and infrastructure providers are gearing up to build
and operate the charging infrastructure and consulting firms are preparing to restructure whole value
chains. Cities that want to actively steer this development have to act decisively and comprehensively. In
the words of a senior city official of a C 40 city who said in an executive meeting early this year: “This is
really happening! In 2020 we will have tens of thousands of electric cars on our streets. We better get
ready!”
Policy options for electric vehicle charging infrastructure in C40 cities | R. Philip & A. Wiederer
65
Appendix I: City Case Studies
Case Study 1: Singapore
Key government agencies involved in EV pilot program: Energy Market Authority (EMA), Land
Transport Authority (LTA), Economic Development Board (EDB), Agency for Science, Technology and
Research (A-STAR), Housing Development Board (HDB).
Budget for EV pilot program: $20M
Average trip length: 10 km (6.25 miles)
Summary: We traveled to Singapore to understand the city-state’s EV pilot program announced in
November 2009 and that is scheduled to run for 3 years, commencing in June 2010. A-STAR is taking the
lead on finalizing the charging standard, which will then form part of an RFP for charging infrastructure
providers that will the city plans to release in the first half of 2010. The key objective of the city
government is for industry development – to attract technology companies to Singapore, attracting them
with the prospect of using Singapore as an ideal EV pilot test-bed.
Description
On the outset Singapore is an unlikely candidate for a large EV market and an EV program because it has
none of the characteristics which would imply a high demand for EVs. The city has an extremely low
carbon-dioxide profile and no major transportation caused air-quality issues. Most of the electricity is
generated not by renewable energy sources therefore making EVs less green than under other conditions.
Furthermore it has no significant automotive industry which would justify investing in this technology
early on.
On the other hand, Singapore has the characteristics that would make it an ideal place to set up a charging
infrastructure. A very well developed current grid, a geographically clearly defined area with high
population density, a highly effective regulatory environment and a supportive and stable government.
Currently Singapore has no significant numbers of EVs operating on its streets. Private investors tried to
establish an infrastructure for motor-scooter, but had to stop their efforts after money run out after a
testing phase. In regard to EVs and charging infrastructure Singapore therefore would have to start from
scratch.
Approach
Acknowledging the missing experience with EV infrastructure and the low degree of knowledge publicly
available about EV consumer behavior, Singapore has set up a 2 year test balloon. This test run is

Policy options for electric vehicle charging infrastructure in C40 cities | R. Philip & A. Wiederer
66
designed very ambitiously, Singapore wants to install and set-up a complete charging, closed EV and
charging microcosm including charging stations, electric cars and backend solutions (billing, etc.).
Currently it is planned to install 2-3 public charging stations and private charging outlets at the locations
where the EVs that take part in this test-run are parked over night (mostly parking lots of multi-apartment
buildings). After two years the data about usage patterns and consumer behavior obtained by this test run
should be used for a social cost-benefit analysis based on which a mass roll-out will be determined.
The test run is organized and controlled by a multi-stakeholder commission that includes the local
housing, electricity and transport agencies, as well as researchers and regulators. To facilitate the test run,
Singapore is willing to invest significant resources. It offers tax credits for the purchase of EVs and was
offering significant subsidies for installing the charging infrastructure. The EV taskforce has been
working with Renault-Nissan, Mitsubishi and other auto manufacturers to secure a supply of EVs for
Singapore. The city expects a first batch of up to 50 Mitsubishi i-MiEVs to arrive from September 2010.
Logic and reasoning
As mentioned, investing large scale in EV infrastructure and adaptation is not obvious for a country like
Singapore. Interviews have supported that impression and uncovered a different underlying logic. Under
this logic Singapore wants to leverage its nearly optimal starting conditions for installing a charging
infrastructure to establish itself as premier testing ground for new charging technology. Furthermore the
government hopes that based on the experience as testing ground opportunities for new technology
ventures in the charging infrastructure realm might emerge. Singapore sees the efforts to establish a
charging infrastructure therefore more as an investment in its industrial policy and development.
Environmental considerations are only of secondary relevance.
Feedback of key stakeholders
The feedback of key stakeholders so far has been mixed. Singapore’s original plan was to use a private
operator to set up the charging infrastructure. For this purpose Singapore negotiated with several
international players, among them also Better Place. However, even given a direct subsidy of up to 50%
of the infrastructure cost could not motivate private actors to invest in Singapore. According to Singapore
officials the main reasons for this reluctance to invest is the limited size of the Singaporean market. Given
the extremely small number of cars in Singapore, the number of EVs would stay sub-critical even given
the most aggressive adaptation expectations. Also the long term business case for charging infrastructure
in Singapore is grim – given the small size of the car fleet in Singapore the market will be permanently
limited.

Policy options for electric vehicle charging infrastructure in C40 cities | R. Philip & A. Wiederer
67
So far no other major feedback has been obtained – it is to be seen how the industry reacts to Singapore’s
plans.
Current status
The project has been kicked-off at the beginning of 2009 and is currently on time. The next major
milestone is set for early 2010, when the tender process for the infrastructure starts.

Policy options for electric vehicle charging infrastructure in C40 cities | R. Philip & A. Wiederer
68
Case Study 2: Bangalore
Key government agencies involved in EV pilot program: No formal municipal government program
Budget for EV pilot program: No formal municipal government program
Average trip length: Not available
Summary: Ronald visited Bangalore and met with local EV OEM REVA and some REVA customers
and also did a test-drive on the REVA EV. The city has no formal EV program or incentives for EVs, and
no public convenience EV charging infrastructure. In spite of this, the city has over a thousand REVA
EVs on the roads, indicating that EV users driving and charging behavior might be tailored to the
constraint of no public convenience charging infrastructure as well as relying on REVA’s proprietary
Revive battery reserve technology.
Description:
Bangalore offers a stark difference to other cities with organized EV pilots or EV programs. The city
government has not actively encouraged the deployment of EVs through any incentives or pilot program,
etc. Bangalore is a rapid-urbanizing city in India which has had a thousand REVA EVs on the road since
2001, when local EV OEM REVA released its first EV model. There is no public convenience charging
infrastructure for EV users to charge their EVs. EV users charge almost entirely at home and in some
cases, also at working places. This would indicate that EV users in Bangalore constrain their charging /
driving behavior to the fact that there is no public availability of charging infrastructure. Another factor
that mitigates EV users’ range anxiety is REVA’s proprietary Revive technology which is a special
battery reserve, which can be released through a text message or call to a REVA call centre, when the
main battery is running low. This service comes at a fee and hence users have an incentive to only use it
in emergency situations. The REVA interviewee mentioned that this proprietary technology has helped
alleviate users range anxiety.
The upfront cost of the EV is currently more than comparable ICE vehicles: The REVA EV is
significantly – 30-40% - more expensive than a regular ICE vehicle of similar characteristics. The EV
users interviewed mentioned though, that running costs were significantly lower than a regular ICE
vehicle. One of the EV owners interviewed had bought a second REVA and cited driving comfort as an
additional factor to low running costs, for his choice of the REVA EV over a regular ICE. The REVA EV
is automatic (i.e. no gears) and that is an advantage over most ICE models in India which currently have
gears. To reduce the upfront cost of the EV, REVA had run a battery leasing pilot, which reduced the
upfront cost of the EV, which was well received by customers. The company is considering expanding
battery leasing in the future, providing a monthly lease payment option to consumers, with maintenance
for the duration of the lease done by REVA. On completion of the lease duration, consumers will have the

Policy options for electric vehicle charging infrastructure in C40 cities | R. Philip & A. Wiederer
69
option to continue with the same lease plan or upgrade to the latest battery packs available in the future.
Another model that the company is considering for increased consumer awareness is making REVAs EVs
available at big campuses and other central locations for use on a pay-per-use basis.
The company has incorporated user feedback on its earlier EVs in its design of its latest EVs. The first
generation of REVA EVs was small cars, which users expressed safety concerns with. REVA’s VP-
Marketing mentioned that amongst consumers there was a perception that a larger car often lent an
increased sense of safety on Indian roads and hence the second generation of REVA models – the REVA
NXR and NVG - is larger and “more muscular”.
India is currently not the major market for REVA’s EVs. REVA expects most of its sales to come from
Europe. It is already the highest selling EV OEM in the UK with its G-Wiz EV. It foresees a significant
chunk of its revenues coming from technology licensing. It recently entered into a licensing agreement for
its technology with GM in India48. REVA also recently signed a MoU with US-based Bannon Automotive
to open a manufacturing facility in New York State in the US, where it will receive $3M in state grants &
$3.76M in tax incentives and breaks for its new facility49. This is indicative of a global trend where large
automobile OEMs can jump ahead on the EV technology curve by procuring technology from existing
EV OEMs like REVA through licensing agreements / collaboration.
The REVA interviewee mentioned that they don’t view extensive publicly available convenience
charging infrastructure as a key concern for early-adopters. The company’s target early-adopter market is
families that will buy the REVA EV as a second car for use for short trips to the supermarket, to pick up
children from school, etc. These trips are easily within the 100 mile range of the battery, which can be
charged from a regular home charging plug. The new NXR model has two charge ports for both normal
and fast charges. The company doesn’t see the REVA EV being used for long-distance inter-city trips and
believes consumers will use regular ICEs for that purpose for the mean time. However the company does
believe that for mass adoption, there will be a requirement for battery charge stations in various locations
across cities for top-up fast charging, which can be done while consumers shop / eat / drink.
The interviewee mentioned that government support would be useful for providing funding and incentives
for local EV plants. Government fleets are also an opportunity for conversion to EVs in the future.

Policy options for electric vehicle charging infrastructure in C40 cities | R. Philip & A. Wiederer
70
Case study 3: London
Key government agencies involved in EV program: Transport for London, Commissioner’s Delivery
Unit
Budget for EV pilot program: £ 17M
Average trip length: 90% of trips are below 10 miles
Summary: London has started implementation of an ambitious electric vehicle delivery plan, announced
in May 2009. This involves building a comprehensive network of charge points across London,
electrification of the public sector fleet and stimulating the wider EV market and a program of incentives,
marketing & communications. The city government’s transport agency – Transport for London - is taking
the lead in building, owning and operating the charging infrastructure – 250 charging points as of Feb
2010, with a target of 25,000 in London by 2015. TfL is working closely with a consortium of EV OEMs,
the main London utilities, rental car companies and the London boroughs in rolling out his plan.
Description:
London appears to be the leading city in terms of EV charging infrastructure roll-out thus far. In
November 2008, Mayor Boris Johnson established the London Electric Vehicle Partnership50. The
partnership includes representatives of the Greater London Authority, the motor and energy industries and
London’s boroughs, with the objective of working to share best practice, co-ordinate activity, and
encourage greater funding of the technology. This was followed by the publication of an electric vehicle
action plan in May 2009.
Key objectives and details of Delivery Plan
The Delivery Plan51 set out key targets:
100,000 electric vehicles on the capital’s streets as soon as possible.
25,000 charging spaces in London’s workplaces, retail outlets, streets, public car parks and station car
parks by 2015.
At least 1,000 Greater London Authority fleet electric vehicles by 2015.
The Delivery plan is an elaborate strategy document that builds the context and rationale for deployment
of EVs and EV charging infrastructure in London and which then lays out a three-pronged strategy which
includes:
Infrastructure – Working with boroughs and other partners to deliver 25,000 charge points across
London by 2015 - 500 on-street, 2,000 in off-street public car parks, station car parks, 22,500

Policy options for electric vehicle charging infrastructure in C40 cities | R. Philip & A. Wiederer
71
provided in partnership with businesses -to be located in employers’ car parks and retail/leisure
locations. London Plan policy –a requirement to provide charge points in all new developments.
Vehicles – electrify public sector vehicle fleet and stimulate wider EV market by procuring at least
1,000 electric vehicles in the GLA fleet by 2015, extending active support to extend the number of
EVs in the public sector vehicle fleets e.g. the boroughs and central Government and working with
fleet users and companies to expand the use of EVs in business fleets.
Incentives, marketing & communications – increasing and communicating customer benefits,
providing a Congestion Charge discount worth up to £1,700 a year, working with boroughs to
develop simplified range of parking incentives, encouraging uptake of electric vehicles in car clubs
and working with the boroughs to develop a London-wide membership scheme for EV users –giving
access to the charge point network and the congestion charging discount.
Current status
As of February 2010, there were over 250 charging points in London with 1,700 EVs currently registered52. An online database53 contains a list of all publicly accessible EV recharging points in London,
including on-street and off-street (typically located on dedicated bays within a car park). The parking fee
for these charge points vary – for dedicated spots, an application is required and involves an annual
parking fee ranging from £231 – 500, while for hourly parking spots, the fee can range from zero to £2.50
/ hour. The charge fee at most spots is currently free.
In February 2010, London secured £17 million funding for its charging network - £9.3 million from the
Department for Transport, £5.6m provided by Transport for London and £7.6m pledged from a range of
leading organizations. The charging infrastructure is being rolled out by a consortium including TfL
(lead) and Sainsbury's, Tesco, Siemens, Nissan and Hertz which aim to deliver 7500 charge points by
2013, with 1,600 charge points to be installed over the next twelve months. This will contribute to the
delivery of the Mayor's target of 25,000 charge points in London by 2015, with the goal of having no
Londoner more than a mile from a charging point by that time. The total of 7500 charging points are
expected to deliver 6000 points at work places, 500 on-street, 330 in public car parks, 50 at Tube stations,
140 in supermarket car park and 120 for car clubs. The 7500 charge points to be installed by 2013 will be
a mix of standard, fast and rapid charging points. Different types of charging points will be installed in
different sorts of locations across the capital.
A consortium led by Transport for London of public and private partners including London Boroughs,
major supermarkets, energy companies, car park operators, vehicle manufacturers, car club and car hire
companies, had secured the grant funding from the UK Government's £30 million 'Plugged in Places'
fund. The London consortium is comprised of EDF Energy, Enterprise rent-a-car, Europcar, Hertz,

Policy options for electric vehicle charging infrastructure in C40 cities | R. Philip & A. Wiederer
72
London boroughs, NCP, Nissan, Sainsbury's, Scottish & Southern Energy, Siemens, SMMT, Streetcar,
Tesco, Transport for London and Zipcar.
Mayor Johnson has also announced that a single Londonwide brand for electric vehicles in the capital will
be launched in 2010 so that Londoners will be able to clearly identify where a charging point is located.
In terms of the procurement target of 1000 EV for the public fleet, Mayor Johnson is seeking funding
from the government to help deliver this major introduction of electric vehicles.
Given government information that 90 per cent of car trips in London are less than 10 miles and more
than 99 per cent of journeys are within the range of existing or near-market electric vehicles, TfL expects
that a 25,000 strong network will be able to support tens of thousands more electric vehicles in London
and help realise the vision of 100,000 electric vehicles in the capital by 2020.
Stakeholder feedback
In October 2009, we spoke with Mark Evers, Director of the Transport Commissioner’s Transport Unit,
which was responsible at the time for London’s EV program. The unit takes issues of political
significance to the Mayor and issues of strategic significance to the Transport Commissioner. We
understand that responsibility for London’s EV program has now moved to within TfL.
Mr. Evers spoke about the roll-out of the program and how customers could use a single RFID card to
access any charge point across London, despite the fact that there were multiple owners of the charge
points. We asked Mr. Evers why the charging infrastructure was not being built, owned and operated by
the private sector and he mentioned that there was room for selling the infrastructure network to the
private sector in the future, once a critical mass of EVs had come on London’s roads.
Mr. Evers expects that most early adopters will have access to parking facilities and that most charging
will happen at night at domestic charge points.

Policy options for electric vehicle charging infrastructure in C40 cities | R. Philip & A. Wiederer
73
Case study 4: Berlin
Key government agencies involved in EV program: City of Berlin, various agencies on the federal
level
Budget for EV pilot program: not disclosed, mainly private
Average trip length: not available
Summary:
In Berlin two simultaneous test cases have started, both with the main objective to gain a better
understanding of how a potential charging and electric vehicle ecosystem could look like. Both test cases
are initiated by the private sector and supported by a major German utility and car manufacturer
respectively. The city of Berlin is taking a laissez-faire role. The city limited itself to supporting the
private efforts administratively and mandating the interoperability of the two networks. The idea behind
this strategy seems to be to leverage the benefits of the private sector by fostering competition while also
preventing lock-in effects that could have a long term detrimental effect. Both test cases are currently well
under way and the first cars are driving on Berlin’s roads and are charged at public charging stations. All
this is happening against the background of a major federal initiative to make Germany the main hub of
electro-mobility technology.
The field studies:
Two major field studies for electric mobility and charging infrastructure are currently under way in
Berlin. One has been initiated by RWE, one of Germany’s largest utilities and Daimler a major OEM, the
other one by Vattenfall, a Swedish utility with major operations in Germany, and BMW another large
OEM. Both studies are similar in structure: In each the car manufacturers have developed battery powered
versions of their smaller models (the Mini in the case of BMW and a car of Mercedes Smart brand) of
which approx. 100 are permanently rented out to users in Berlin while the utility companies are installing
the required charging infrastructure to supply these cars with electricity. In both cases the utilities are not
only installing single charging stations but complete charging ecosystems including home-charging and
convenience charging spots as well as billing systems and a centralized system architecture.54 The stated
goal of this test runs from a charging perspective is to learn more about user patterns and infrastructure
requirements to prepare a larger scale role out. In the words of the project leader of BMW “We want to
know, when and to which degree the vehicles are used” and then base the further roll out on the identified
customer needs.55 This all is happening against the background of a massive federal electro mobility
program, which is also supporting the RWE/Daimler project with €6m. The federal government has

Policy options for electric vehicle charging infrastructure in C40 cities | R. Philip & A. Wiederer
74
developed a national development plan for electro mobility and pledged €500m until 2011 to jump start
the EV industry in Germany.56 How important these field studies are for the respective companies and the
federal government can be easily seen by the cast present when RWE and Daimler announced their plans.
Present were not only the CEO of Daimler and RWE, but also the head of the German Automobile
Federation and the German chancellor.
Characteristics of infrastructure
Both field studies have decided to install a network based on Level II infrastructure, but designing the
stations in a way that they can be easily upgraded to level III charging. Furthermore the stations already
have vehicle-to-grid capability and therefore can be used for further smart-grid scenarios. The plan for
both field studies is to provide a comprehensive coverage of Berlin. Most charging stations are installed
on private premises like parking garages, parking lots of shopping malls or company parking lots. The
goal of RWE is to have installed over 500 charging spots at the end of the test phase. Currently approx. 70
spots have been installed by RWE and around 30 by Vattenfall.57 Both operators have set up a
comprehensive backbone for the infrastructure including billing services, which rely on a subscription fee
plus paying for the consumed electricity. The billing concept is akin to that of a mobile phone contract
and it is not a coincidence when the CEO of RWE states in the official press statement to announce the
cooperation that “The accounting system should be as simple and convenient as when using one’s mobile
phone”.58
The regulatory environment
Our interviews and research has shown that Berlin’s potential influence on the charging network is
relatively limited. Berlin has privatized its electricity utilities as well as most parking garages. The later
allows it basically every provider to set up a comprehensive charging infrastructure without relying on
any public real estate, thereby limiting the city government’s influence significantly. As steering and
influencing charging infrastructure providers against this background anyways, Berlin seems to have
decided to follow a laissez-faire approach of supporting every infrastructure provider who wants to set up
a network equally instead of preferential treatment. What the city however was able to mandate to every
infrastructure provider active was the interoperability provision. According to our interviews, RWE
charging spots must be accessible for Vattenfall users and the other way around. This approach achieves
several policy goals at once. First, it prevents early lock-in effects which might later once certain critical
network sizes are reached might lead to regional monopolies. Second, it increases the accessibility and
availability of charging infrastructure and therefore should help to support the EV adaptation rates. Third,
it intensifies the competition between the different providers, which can already be seen in early pres
statements in which for example the Daimler CEO teases Vattenfall/BMW about technological
disadvantages they have and the resulting discomfort for users.59

Policy options for electric vehicle charging infrastructure in C40 cities | R. Philip & A. Wiederer
75
First insights from the field studies
Whereas no initial results are available for the RWE test case so far, Vattenfall and BMW have published
a preliminary summary of first insights.60 During the first months of the field test they could observe that
user of EV show almost no changes in their mobility behavior in comparison to using petrol powered
vehicles. The test run so far also confirms that most charging is done at home and convenience charging
is only used supplementary. When users use convenience charging, then they mainly rely on charging
spots close to their work place, major shopping areas or transportation hubs such as the airport. These
usage patterns support the notion that public level II charging will mainly be used if people are parking
anyways for other reasons than charging – with the implication that public level II charging might best be
set-up close to areas to which people travel by car and where they spend significant amount of time.

Policy options for electric vehicle charging infrastructure in C40 cities | R. Philip & A. Wiederer
76
Appendix II: Policy levers for influencing deployment of EVs and EV charging infrastructureThis appendix expands on the list in 4.2.1, with descriptions of various policy levers for influencing
deployment of EVs and EV charging infrastructure along with examples of some cities where these levers
have been deployed.
Regulatory levers
Zoning and building codes: These are city laws that dictate urban planning guidelines as well as
what guidelines and specifications, new construction needs to meet. Some cities e.g. San Francisco &
London, have mandated or committed to mandate, that their building codes will be modified to
require all new buildings to have EV charging infrastructure.
Approval for technical standards for charging equipment: Most countries have a national
technical standards agency that either develops a standard or adopts a standard developed by an
international technical agency, for use in the country. This approval process often involves
consultation with various other government agencies that look after fire safety, electric grid, etc. A-
STAR in Singapore has been mandated by the government with developing a standard for EV
charging in consultation with OEMs, the local utility and other stakeholders.
Regulation whether EV-related investments get included in utility asset bases, etc: In cities
where city government wields considerable influence over utility regulation, it can take a regulatory
decision regarding whether EV-related investments get included in utility asset bases, whether third-
party organizations selling electricity for EV charging become regulated entities, etc. The California
Senate has mandate that the CPUC set rules for EV-related investments by a specific timeline.
Permitting rules and guidelines: Cities can streamline permitting processes for installation of
charging infrastructure. Los Angeles has committed to streamlining its permitting processes for
installation of EV charging equipment.
Monetary and non-monetary incentives
Monetary incentives
Subsidies / tax credits for EVs – These can be employed to reduce the upfront cost of EVs.
Examples include the US federal government tax credit of up to $7500 for the first 200,000 electric
vehicles produced by an EV manufacturer.61 Some cities also have additional incentives, e.g. the city
of Austin, Texas provides incentives of up to $500 for electric vehicle purchases.

Policy options for electric vehicle charging infrastructure in C40 cities | R. Philip & A. Wiederer
77
Discounts or waivers on registration / annual taxes on EVs: Several countries have provided
discounts or waived annual taxes on EVs including Norway and Denmark.
Subsidies for charging infrastructure – City governments can provide subsidies for various types
of charging equipment, and to various owners e.g. consumers for home charging equipment,
supermarkets for public charging infrastructure, etc. For example, the City of Los Angeles, in
December 2009, announced that it would provide a subsidy for home chargers of up to $2000 for the
first 5000 residential customers.
Investment tax credits for charging infrastructure – Similar to investment tax credits for
renewable energy, investment tax credits can be used for investment in charging infrastructure.
Production tax credits for charging infrastructure – Similar to production tax credits for
renewable energy which provide tax credits based on the actual amount of renewable energy
generated, production tax credits for EV charging infrastructure could provide incentives for each
kWh of electricity sold from an EV charging station. A potential advantage over investment tax
credits is that production tax credits reward actual charging.
Free parking for EVs – Cities can provide designated free parking spots for EV users e.g. certain
London burroughs have free parking for EVs. Supermarkets / malls / multiplexes can also offer
designated EV parking spots to attract EV users.
Waiving congestion charges for EVs – Cities that have congestion pricing schemes e.g. London,
Singapore, etc – can potentially waive congestion charges for EVs. London has already done so,
providing EV users with a discount up to GBP 1700 per year.
Electricity discounts for EV charging – London already provides free electricity for EV charging.
Non-monetary incentives
Access to HOV lanes: Cities that have separate lanes for High-Occupancy-Vehicles can potentially
allow EVs to use the lane also. Research has shown (citation required) that access to HOV lanes
significantly impacted adoption rates for hybrid cars.
Ownership of public garages & on-street space that can be used for charging infrastructure
City governments with significant control over on-street space / parking / housing in the city can give out
concessions to private sector operators for provision of charging infrastructure on city-owned property
e.g. Singapore can potentially give a concession for provision of home charging infrastructure in all
government-owned condominiums regulating prices, etc through the concession contract.
Advocacy and public relations

Policy options for electric vehicle charging infrastructure in C40 cities | R. Philip & A. Wiederer
78
Demonstration projects: City governments can get involved in demonstration projects with EV
OEMs to obtain publicity and spread awareness about EVs e.g. Singapore pilot with Renault, etc.
Advocacy: City government can get public figures – e.g. the Mayor, etc – to get involved in EV
projects or drive EVs and engage in advocacy efforts for EV adoption.
Procurement for public fleets
City governments can procure EVs for public fleets e.g. London has announced that it will procure
1000 EVs for its public fleet by 2015.

Policy options for electric vehicle charging infrastructure in C40 cities | R. Philip & A. Wiederer
79
Appendix III: Figures and graphs
Figure 1: Continuum of different car propulsion technologies
Source: The Boston Consulting Group (2009), p. 2
Technology definition
Levers for CO2
reduction
AdvancedICE
Mild Hybrid
Plug-inHybrid
FullHybrid
Advanced gasoline and diesel technologies
Start stop, regenerative braking, mild acceleration assistance
Acceleration assistance, electric launch, electric driving at low speeds
Full hybrid with larger battery and plug-in capability
Electric vehicle with ICE to recharge the batteries
All necessary propulsion energy is stored in battery
Braking losses
Clean energy sources
Electrification path
1. Reduction potential vs. standard ICE, Golf 1.6 gasoline, 20082. Depending on battery capacity, charge depletion strategy, and carbon intensity of electricity generation
CO2 reductionpotential1
up to 25% 10-12% 15-25% 20-30% 35-100%2 35-100%2
Pumping losses / thermodynamic efficiency / idle losses
Range extender
E-Car
Technology definition
Levers for CO2
reduction
AdvancedICE
Mild Hybrid
Plug-inHybrid
FullHybrid
Advanced gasoline and diesel technologies
Start stop, regenerative braking, mild acceleration assistance
Acceleration assistance, electric launch, electric driving at low speeds
Full hybrid with larger battery and plug-in capability
Electric vehicle with ICE to recharge the batteries
All necessary propulsion energy is stored in battery
Braking lossesBraking losses
Clean energy sourcesClean energy sources
Electrification path
1. Reduction potential vs. standard ICE, Golf 1.6 gasoline, 20082. Depending on battery capacity, charge depletion strategy, and carbon intensity of electricity generation
CO2 reductionpotential1
up to 25% 10-12% 15-25% 20-30% 35-100%2 35-100%2
Pumping losses / thermodynamic efficiency / idle lossesPumping losses / thermodynamic efficiency / idle losses
Range extender
E-Car
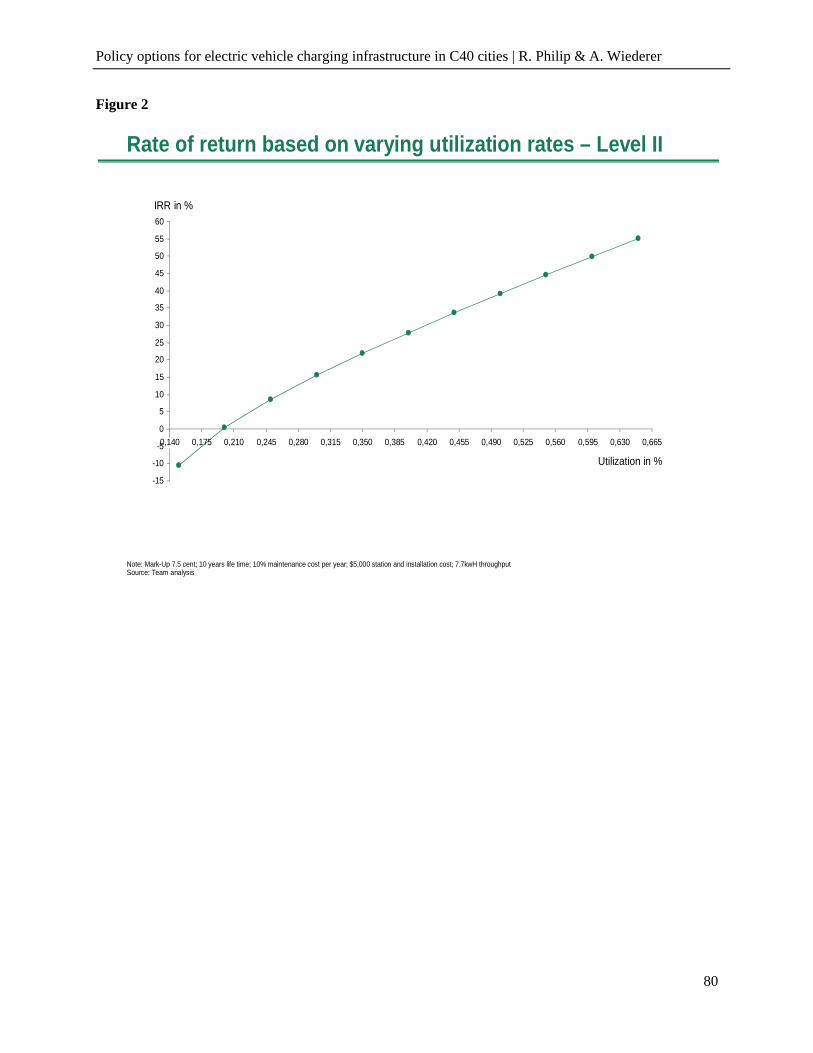
Policy options for electric vehicle charging infrastructure in C40 cities | R. Philip & A. Wiederer
80
Figure 2
3
Rate of return based on varying utilization rates – Level II
-15
-10
-5
0
5
10
15
20
25
30
35
40
45
50
55
60
0,140 0,175 0,210 0,245 0,280 0,315 0,350 0,385 0,420 0,455 0,490 0,525 0,560 0,595 0,630 0,665
Utilization in %
IRR in %
Note: Mark-Up 7.5 cent; 10 years life time; 10% maintenance cost per year; $5,000 station and installation cost; 7.7kwH throughputSource: Team analysis

Policy options for electric vehicle charging infrastructure in C40 cities | R. Philip & A. Wiederer
81
Figure 3
Return rate based on varying station prices – Level II
-8
-4
0
4
8
12
16
20
3.000 3.300 3.600 3.900 4.200 4.500 4.800 5.100 5.400 5.700 6.000
Station cost ($)
IRR in %
Note: Mark-Up 7.5 cent; 20% utilization; 10 years life time; 10% of station cost as maintenance cost per year; 7.7kwH throughputSource: Team analysis
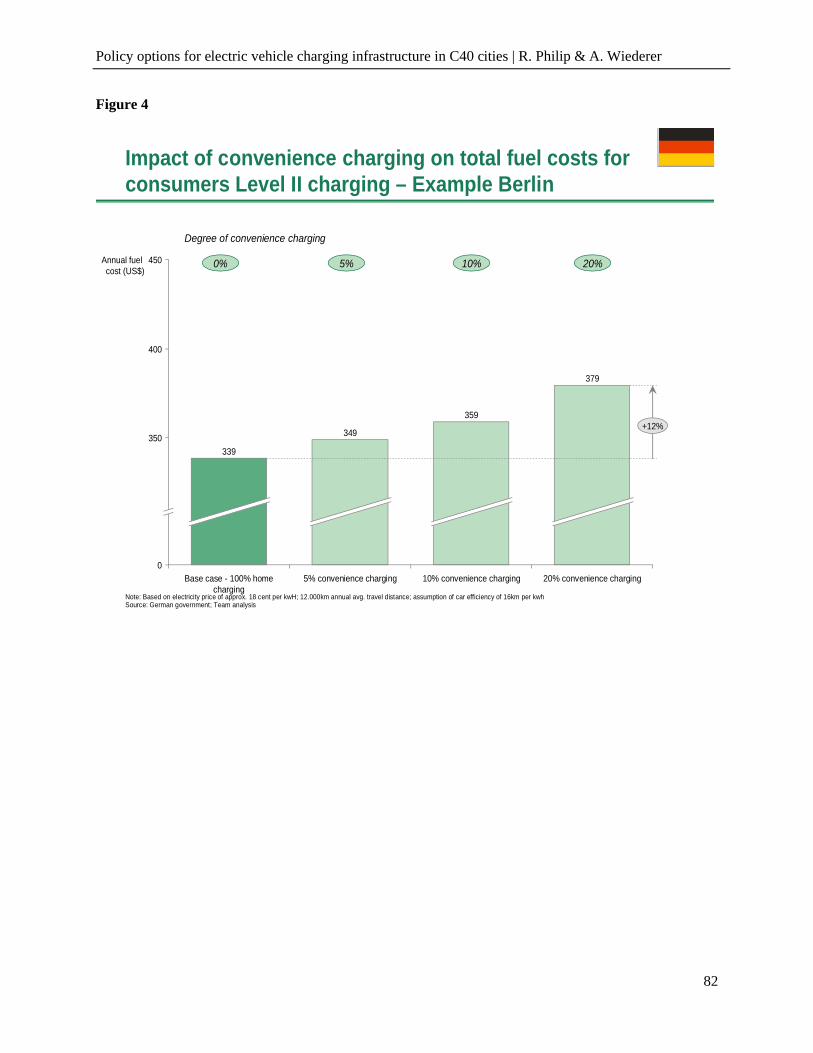
Policy options for electric vehicle charging infrastructure in C40 cities | R. Philip & A. Wiederer
82
Figure 4
Impact of convenience charging on total fuel costs for consumers Level II charging – Example Berlin
10% convenience charging 20% convenience charging
379
0
350
400
5% convenience charging
349
Base case - 100% home charging
339
Annual fuel cost (US$)
450
359+12%
0%
Degree of convenience charging
5% 10% 20%
Note: Based on electricity price of approx. 18 cent per kwH; 12.000km annual avg. travel distance; assumption of car efficiency of 16km per kwhSource: German government; Team analysis
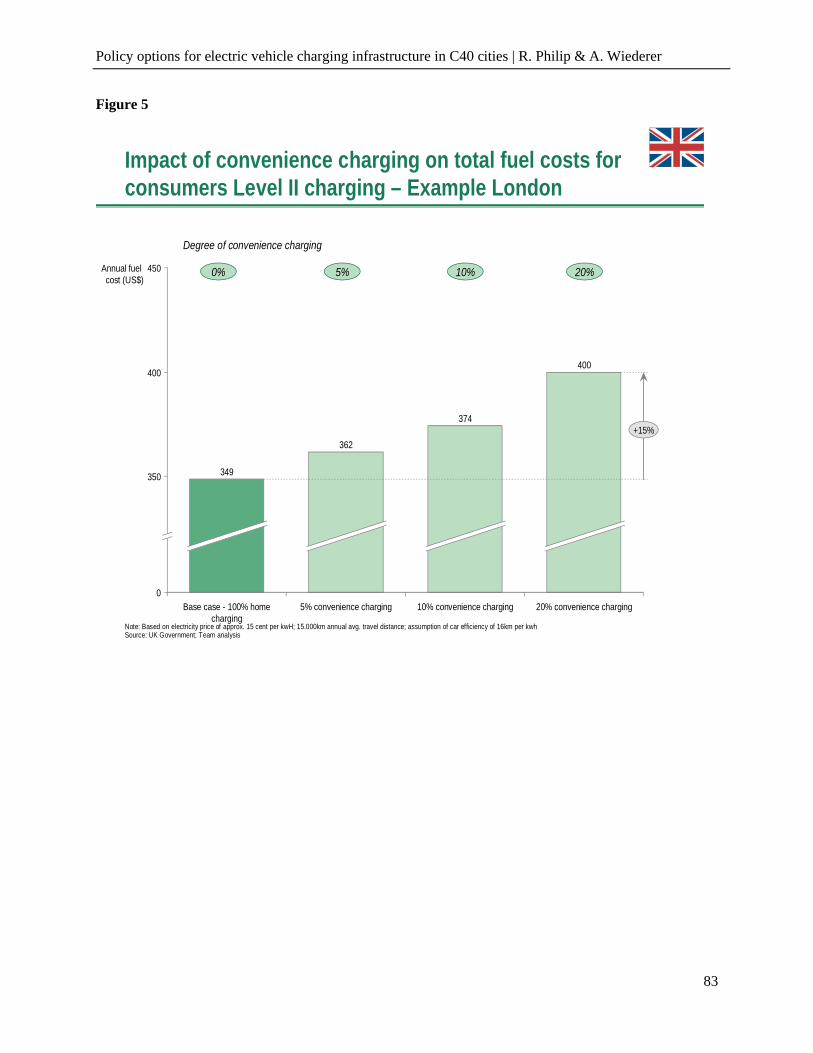
Policy options for electric vehicle charging infrastructure in C40 cities | R. Philip & A. Wiederer
83
Figure 5
Impact of convenience charging on total fuel costs for consumers Level II charging – Example London
450
400
349
Base case - 100% home charging
362
5% convenience charging
374
10% convenience charging
Annual fuel cost (US$)
20% convenience charging
400
0
350
+15%
0%
Degree of convenience charging
5% 10% 20%
Note: Based on electricity price of approx. 15 cent per kwH; 15.000km annual avg. travel distance; assumption of car efficiency of 16km per kwhSource: UK Government; Team analysis
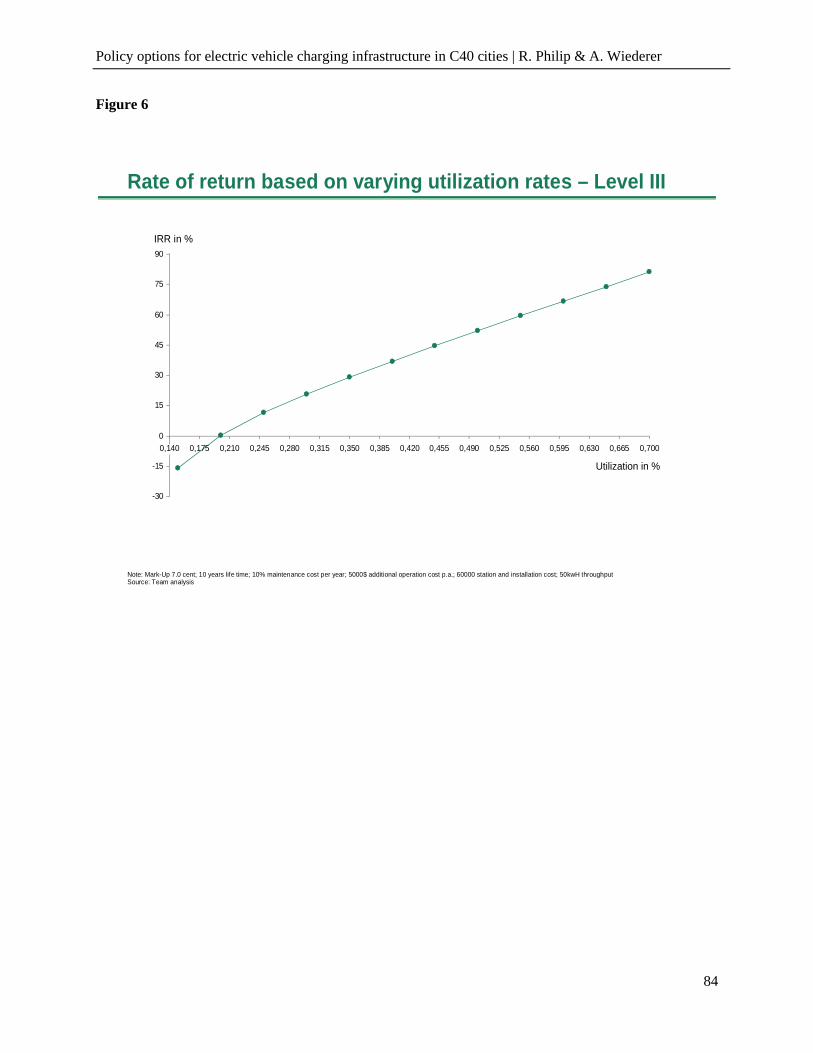
Policy options for electric vehicle charging infrastructure in C40 cities | R. Philip & A. Wiederer
84
Figure 6
Rate of return based on varying utilization rates – Level III
-30
-15
0
15
30
45
60
75
90
0,140 0,175 0,210 0,245 0,280 0,315 0,350 0,385 0,420 0,455 0,490 0,525 0,560 0,595 0,630 0,665 0,700
Utilization in %
IRR in %
Note: Mark-Up 7.0 cent; 10 years life time; 10% maintenance cost per year; 5000$ additional operation cost p.a.; 60000 station and installation cost; 50kwH throughputSource: Team analysis

Policy options for electric vehicle charging infrastructure in C40 cities | R. Philip & A. Wiederer
85
Figure 7
Impact of convenience charging on total fuel costs for consumers Level III charging – Example Berlin
411
0
350
400
450Annual fuel cost (US$)
339
Base case - 100% home charging
357
5% convenience charging
375
10% convenience charging 20% convenience charging
+21%
0%
Degree of convenience charging
5% 10% 20%
Note: Based on electricity price of approx. 18 cent per kwH; 12.000km annual avg. travel distance; assumption of car efficiency of 16km per kwhSource: German government; Team analysis

Policy options for electric vehicle charging infrastructure in C40 cities | R. Philip & A. Wiederer
86
Figure 8
Impact of convenience charging on total fuel costs for consumers Level III charging – Example London
371
349
394
10% convenience charging 20% convenience charging
439
0
350
400
450Annual fuel cost (US$)
5% convenience chargingBase case - 100% home charging
+26%
0%
Degree of convenience charging
5% 10% 20%
Note: Based on electricity price of approx. 15 cent per kwH; 15.000km annual avg. travel distance; assumption of car efficiency of 16km per kwhSource: UK Government; Team analysis
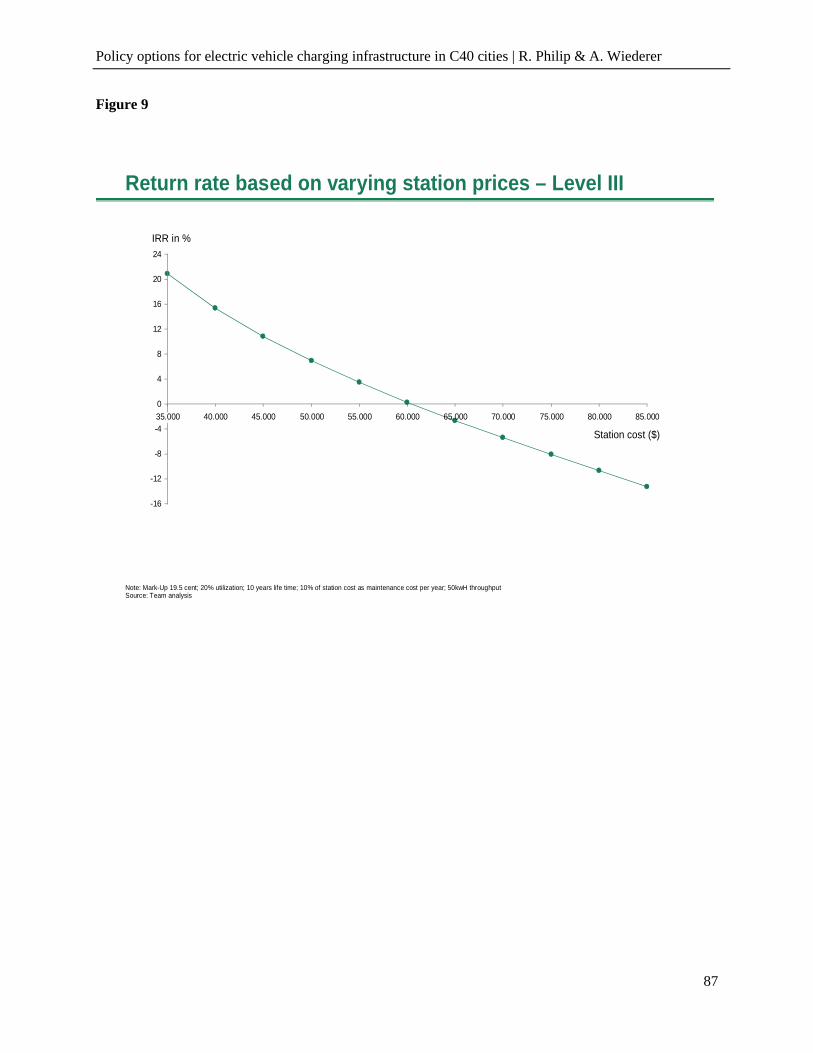
Policy options for electric vehicle charging infrastructure in C40 cities | R. Philip & A. Wiederer
87
Figure 9
Return rate based on varying station prices – Level III
-16
-12
-8
-4
0
4
8
12
16
20
24
35.000 40.000 45.000 50.000 55.000 60.000 65.000 70.000 75.000 80.000 85.000
Station cost ($)
IRR in %
Note: Mark-Up 19.5 cent; 20% utilization; 10 years life time; 10% of station cost as maintenance cost per year; 50kwH throughputSource: Team analysis
Policy options for electric vehicle charging infrastructure in C40 cities | R. Philip & A. Wiederer
88
Appendix IV: Bibliography
AEA, “Market outlook to 2022 for battery electric vehicles and plug-in hybrid vehicles”, June 2009, http://hmccc.s3.amazonaws.com/docs/CH6%20-%20AEA%20-%20Market%20outlook%20to%202022%20for%20battery%20electric%20vehicles%20and%20plug-in%20hybrid%20electric%20vehicles.pdf (accessed March 2010)
Autobloggreen, “Nissan CEO is bullish for Leaf’s success”, http://green.autoblog.com/2009/11/13/nissan-ceo-is-bullish-on-leafs-success-says-million-plug-ins-b/ (accessed March 2010)
BMW AG, “The BMW Concept ActiveE”, December 2009, http://www.bmwusa.com/Standard/Content/AllBMWs/ConceptVehicles/ActiveE/Default.aspx (accessed March 2010)
Bundesregierung, “Nationaler Entwicklungsplan Elektromobilität der Bundesregierung“, Berlin, 2009. http://www.bmwi.de/Dateien/BMWi/PDF/nationaler-entwicklungsplan-elektromobilitaet-der-bundesregierung,property=pdf,bereich=bmwi,sprache=de,rwb=true.pdf (accessed March 2010)
California Public Utilities Commission, "Analysis of SB 626", ftp://ftp.cpuc.ca.gov/OGA/2010%20position%20letters/CPUC%20ANALYSIS%20-%20SB%20626%20(090701)%20-%20090713.pdf
California Public Utilities Commission, "Reply Comments of the Utility Reform Network" -http://docs.cpuc.ca.gov/efile/CM/109562.pdf (accessed March 2010)
City of Los Angeles, "Mayor Villaraigosa announces southern California regional plug-in electric vehicle plan", http://mayor.lacity.org/PressRoom/PressReleases/LACITYP_007366 (accessed March 2010)
Clinton Climate Initiative, “Cities Join Forces on Electric Vehicles”, http://www.c40cities.org/news/news-20091216.jsp. (accessed March 2010)
Daimler AG, “e-mobility Berlin”: Daimler and RWE Embarking on the Age of Electro-Mobility”, 2008, http://www.daimler.com/dccom/0-5-7153-1-1125767-1-0-0-0-0-0-8-7145-0-0-0-0-0-0-0.html (accessed March 2010)
Economic Development Board, (May 2009) “News Release: Test-bedding of Electric Vehicles in Singapore from 2010”,
ECOtality, "The Project" - http://www.ecotality.com/companies/theevproject.php (accessed March 2010)
Element Energy, “Electric Vehicles – Strategies for uptake and infrastructure implications“, 2009,
Gas2.0 website, "It’s On! Portland and San Francisco Battle For Electric Car Domination" -http://gas2.org/2009/04/07/its-on-portland-and-san-francisco-battle-for-electric-car-domination/ (accessed March 2010)
General Motors (2009), "General Motors India and REVA form partnership to transform electric vehicle market", http://www.gm.com/experience/technology/news/2009/nd_092409.jsp (accessed March 2010)
Heise online, "e-mobility Berlin" geht in die zweite Phase“, 2009, http://www.heise.de/autos/artikel/e-mobility-Berlin-geht-in-die-zweite-Phase-889184.html (accessed March 2010)
Heise online, “E-Mobility Berlin: Elektroauto-Pilotprojekt gestartet”, http://www.heise.de/autos/artikel/E-Mobility-Berlin-Elektroauto-Pilotprojekt-gestartet-462212.html (accessed March 2010)
http://www.edb.sg/etc/medialib/downloads/media_release_2009/electric_vehicles.Par.87936.File.tmp/Press%20Release.pdf

Policy options for electric vehicle charging infrastructure in C40 cities | R. Philip & A. Wiederer
89
Huffington Post (2009), "Reva Electric Car Co to Build Electric Cars at Syracuse Plant", http://www.huffingtonpost.com/2009/10/22/reva-electric-car-co-to-b_n_330518.html (accessed online March 2010)
IEC, "International Standard 62196-1", http://webstore.iec.ch/preview/info_iec62196-1%7Bed1.0%7Den.pdf (accessed March 2010)
London Electric Vehicles website - http://www.london.gov.uk/electricvehicles/ (accessed March 2010)
London Fire Brigade, “Our Performance”, http://www.london-fire.gov.uk/OurPerformance.asp (accessed March 2010)
London Government Electric Vehicles website - http://www.london.gov.uk/electricvehicles/ (accessed March 2010)
London government, "London secures £17 million funding for UK’s largest electric vehicle charge point network", http://www.london.gov.uk/media/press_releases_mayoral/london-secures-%C2%A317-million-funding-uk%E2%80%99s-largest-electric-vehicle-charge
McKinsey & Co., “Electric Vehicles in Megacities”, 2010, http://online.wsj.com/public/resources/documents/mckinsey_electric_vehicle_0113.pdf (accessed March 2010)
New York Times, "Cities Prepare for Life With the Electric Car", http://www.nytimes.com/2010/02/15/business/15electric.html (accessed March 2010)
Newride London website, “Recharge points”, http://www.newride.org.uk/recharge.php (accessed March 2010)
Newride London website - http://www.newride.org.uk/index.php (accessed March 2010)
Office of National Statistics, “Summary Statistics Table - English House Condition Survey”. http://www.statistics.gov.uk/ssd/surveys/english_house_condition_survey.asp
Office of Press Secretary, The White House, "FACT SHEET: U.S.-China Electric Vehicles Initiative", http://www.energy.gov/news2009/documents2009/US-China_Fact_Sheet_Electric_Vehicles.pdf (accessed March 2010)
Office of the Mayor of London (2009), “Electric Vehicle Delivery Plan for London”, London. http://www.london.gov.uk/archive/mayor/publications/2009/docs/electric-vehicles-plan.pdf (accessed March 2010)
PlanNYC, “Exploring Electric Vehicle Adoption in New York City”, January 2010, http://www.nyc.gov/html/planyc2030/downloads/pdf/electric_vehicle_adoption_study_2010-01.pdf (accessed March 2010)
Project Get Ready website, “San Francisco” - http://projectgetready.com/city/active-city/san-francisco-bay-area-california (accessed March 2010)
Renault, “Renault's Kangoo be bop z.e. electric vehicle demonstrator to be made available for test drives”,June 2009, http://www.renault.com/SiteCollectionDocuments/Communiqué%20de%20presse/en-EN/Pieces%20jointes/20356_CP_Essai_KangoobebopZE__290609_GB_E5CDC2D7.pdf (accessed March 2010)
SAE International, "SAE Electric Vehicle and Plug in Hybrid Electric Vehicle Conductive Charge Coupler", http://www.sae.org/technical/standards/J1772_201001 (accessed March 2010)
Spiegel Online, (March 2010), "Paris's Electric Car Sharing Plan" -http://www.spiegel.de/international/business/0,1518,641430,00.html (accessed March 2010)

Policy options for electric vehicle charging infrastructure in C40 cities | R. Philip & A. Wiederer
90
Tagesspiegel, “Einmal aufladen, bitte!”, 28.3.2009. http://www.tagesspiegel.de/magazin/mobil/Stromautos-Elektrowagen;art363,2760760 (accessed March 2010)
Takafumi Anegawa, TEPCO (2008), "Development of the most suitable infrastructure for commuter electric vehicles", http://www.iea.org/work/2008/transport/TEPCO.pdf (accessed March 2010)
The Boston Consulting Group (2010), "Batteries for Electric Cars", http://www.bcg.com/documents/file36615.pdf, (accessed March 2010)
The Boston Consulting Group (BCG), “The Comeback of the Electric Car”, 2009, http://www.bcg.com/documents/file15404.pdf (accessed March 2010)
The Economist, “A Netscape moment?”, 04.02.2010. http://www.economist.com/business-finance/displaystory.cfm?story_id=15464481 (accessed March 2010)
The Economist, “Mr Ghosn bets the company”, 15.10.2009, http://www.economist.com/business-finance/displaystory.cfm?story_id=E1_TQGGNDVD (accessed March 2010)
US Department of Energy, "Consumer Energy Tax Incentives" - http://www.energy.gov/taxbreaks.htm (accessed March 2010)
US Department of Energy, “Electric vehicles” - http://www.afdc.energy.gov/afdc/vehicles/electric.html. (accessed March 2010)
US Department of Energy, „Hybrid electric vehicles“, http://www.afdc.energy.gov/afdc/vehicles/hybrid_electric.html. (accessed March 2010)
US Department of Energy, „Plug-in hybrid electric vehicles“,http://www.afdc.energy.gov/afdc/vehicles/plugin_hybrids.html. (accessed March 2010)
US DOE, “Alternative & Advanced Vehicles: Electricity Emissions”, http://www.afdc.energy.gov/afdc/vehicles/emissions_electricity.html (accessed March 2010)
Valeo, “Zero Emission Vehicle”, September 2009, http://www.valeo.com/fileadmin/dotcom/uploads/publications_files/200909/ZEV%20FINAL%20ENG.pdf (accessed March 2010)
Vattenfall,“Die BMW Group und Vattenfall Europe zeigen Alltagstauglichkeit von Elektromobilität“, 2009, http://www.vattenfall.de/www/vf/vf_de/225583xberx/232127press/232157press/232187archi/258228press/index.jsp?pmid=182408 (accessed March 2010)
World Resources Institute, “World Greenhouse Gas Emissions in 2005”, http://www.wri.org/chart/world-greenhouse-gas-emissions-2005. (accessed March 2010)

Policy options for electric vehicle charging infrastructure in C40 cities | R. Philip & A. Wiederer
91
Appendix V: List of Interviews
Name Organisation
Mark Evers Transport Commissioner’s Delivery Unit, London
Marcus Groll RWE, Berlin
Sean Arian Mayor’s Office, Los Angeles
Adrian Garcia Mayor’s Office, Los Angeles
Alex Fay Mayor’s Office, Los Angeles
Alexander Morris Southern California Edison
Sarah Potts Clinton Foundation, Los Angeles
Gustavo Collantes Government of Washington State
David Shlacter Better Place, San Francisco
Miguel Brandao Experimental Power Grid Centre, Singapore
Dr. Sanjay Kuttan Energy Market Authority, Singapore
Dr. George Sun Land Transport Authority, Singapore
Dr John Kua Agency for Science, Technology & Research, Singapore
Ivy Ong National Environmental Agency, Singapore
Jan Croeni Eonlux, Singapore
R. Chandramouli REVA, Bangalore
All these interviews took place over the period from October 2009 till February 2010. We have not listed exact interview dates as we had multiple interactions with most of the interviewees. Several interviewees asked to not be directly quoted in the report; therefore we have not referred to them by name in the report.

Policy options for electric vehicle charging infrastructure in C40 cities | R. Philip & A. Wiederer
92
Endnotes
1 Gas2.0 website, "It’s On! Portland and San Francisco Battle For Electric Car Domination"
2 US department of Energy, “Electric vehicles”3 US Department of Energy, “Hybrid electric vehicles”4 US Department of Energy, “Plug-In hybrid electric vehicles”5 Participating C40 cities (40): Addis Ababa, Athens, Bangkok, Beijing, Berlin, Bogotá, Buenos Aires,
Cairo, Caracas, Chicago, Delhi, Dhaka, Hanoi, Hong Kong, Houston, Istanbul, Jakarta, Johannesburg, Karachi, Lagos, Lima, London, Los Angeles, Madrid, Melbourne, Mexico City, Moscow, Mumbai, New York, Paris, Philadelphia, Rio de Janeiro, Rome, Sao Paulo, Seoul, Shanghai, Sydney, Toronto, Tokyo, and Warsaw. Affiliate cities (19): Amsterdam, Austin, Barcelona, Basel, Changwon, Copenhagen, Curitiba, Ho Chi Minh, Heidelberg, Milan, New Orleans, Portland, Rotterdam, Salt Lake City, San Francisco, Santiago, Seattle, Stockholm, Yokohama.
6 These cities are Bogota, Buenos Aires, Chicago, Copenhagen, Delhi, Hong Kong, Houston, London, Los Angeles, Mexico City, Toronto, Sao Paulo, Seoul and Sydney.
7 Clinton Climate Initiative, “Cities Join Forces on Electric Vehicles” 8 World Resources Institute, “World Greenhouse Gas Emissions in 2005”9 World Resources Institute, “World Greenhouse Gas Emissions in 2005”10 Office of the Mayor of London (2009), “Electric Vehicle Delivery Plan for London” 11 Reduction of 1.5 tonnes of CO2 per year per pure-electric vehicle is based on annual travel of 16,000
km; values for km per kWh reported for the Mitsubishi iMiEV (Japan 10-15 driving pattern) and the Nissan Leaf; and CO2 emissions per kWh for the European grid mix derived from “Well-To-Wheels Analysis Of Future Automotive Fuels And Powertrains In The European Context”, WTT APPENDIX 2 (Version 3.0 November 2008), Concawe, Eucar, Joint Research Commission of the European Union.
12 US Department of Energy, “Alternative & Advanced Vehicles: Electricity Emissions”13 Economic Development Board, (May 2009) “News Release: Test-bedding of Electric Vehicles in
Singapore from 2010”14 See Economist, “A Netscape moment?”15 Spiegel Online, (March 2010), "Paris's Electric Car Sharing Plan"16 ECOtality, "The Project"17 Office of Press Secretary, The White House, "FACT SHEET: U.S.-China Electric Vehicles Initiative"18 See for example Valeo, “Zero Emission Vehicle”19 See McKinsey, “Electric Vehicles in Megacities” and BCG, “The Comeback of the Electric Car”20 See McKinsey, “Electric Vehicles in Megacities” and BCG, “The Comeback of the Electric Car” as
well as BCG, “Batteries for Electric Cars"21 McKinsey, “Electric Vehicles in Megacities”, p. 8.

Policy options for electric vehicle charging infrastructure in C40 cities | R. Philip & A. Wiederer
93
22 See for example Element Energy, “Electric Vehicles – Strategies for uptake and infrastructure
implications“, p. 1 and 10-17.23 For example - Element Energy, “Strategies for the uptake of electric vehicles and associated
infrastructure implications”, Oct 200924 BCG, “The Comeback of the Electric Car”, p. 8.25 US Department of Energy, "Consumer Energy Tax Incentives"26 “Summary Statistics Table”, English House Condition Survey27 Takafumi Anegawa, TEPCO, "Development of the most suitable infrastructure for commuter electric
vehicles"28 See for example Economist, “Mr Ghosn bets the company”, or Renault, “Renault's Kangoo be bop z.e.
electric vehicle demonstrator to be made available for test drives” 29 SAE International, "SAE Electric Vehicle and Plug in Hybrid Electric Vehicle Conductive Charge
Coupler"30IEC, "International Standard 62196-1"31 California Public Utilities Commission, "Analysis of SB 626"32 California Public Utilities Commission, "Reply Comments of the Utility Reform Network"33 City of Los Angeles, "Mayor Villaraigosa announces southern California regional plug-in electric
vehicle plan"34 New York Times, "Cities Prepare for Life With the Electric Car"35 See for example BCG, “The Comeback of the Electric Car”, p. 6-8; Valeo, “Zero Emission Vehicle”, p.
18; PlanNYC, “Exploring Electric Vehicle Adoption in New York City”, p. 13-14; AEA, “Market outlook to 2022 for battery electric vehicles and plug-in hybrid vehicles”, p. 86-88; Autobloggreen, “Nissan CEO is bullish for Leaf’s success”
36 BCG, “The Comeback of the Electric Car”, p. 7.
37 BCG, “The Comeback of the Electric Car”, p. 7.
38 Electrification Coalition, “Electrification Roadmap”, p. 95.39 For a sensitivity analysis regarding utilization rates using a constant mark-up see Appendix III – Figure
2 and for varying station costs with utilization and mark-up rates hold constant see Appendix III –Figure 3.
40 See London Fire Brigade, “Our Performance”41 Agassi, “Projecting the Future of Energy, Transportation, and the Environment”, p. 4, from where also
the following quotes are taken. 42 Renault, “Renault's Kangoo be bop z.e. electric vehicle demonstrator to be made available for test
drives”, p. 14-15.43 BMW AG, “The BMW Concept ActiveE”, p. 3-4.44 BCG, “Batteries for Electric Cars", p. 10-12.

Policy options for electric vehicle charging infrastructure in C40 cities | R. Philip & A. Wiederer
94
45 See Economist, “A Netscape moment?”, for a similar argument.46 Renault, “Renault's Kangoo be bop z.e. electric vehicle demonstrator to be made available for test
drives”47 Project Get Ready, “San Francisco”48 General Motors (2009), "General Motors India and REVA form partnership to transform electric
vehicle market"49 Huffington Post (2009), "Reva Electric Car Co to Build Electric Cars at Syracuse Plant"50 London government, "London secures £17 million funding for UK’s largest electric vehicle charge
point network"51 London Government Electric Vehicles website, “Home page” 52 London government, "London secures £17 million funding for UK’s largest electric vehicle charge
point network"53 Newride London website,“Recharge points“54 Heise online, “E-Mobility Berlin: Elektroauto-Pilotprojekt gestartet”55 Tagesspiegel, “Einmal aufladen, bitte!”
56 For more details see Bundesregierung, “Nationaler Entwicklungsplan Elektromobilität der Bundesregierung“
57 For a current overview of charging locations visit http://www.rwe-mobility.com/web/cms/de/240690/rwemobility/was-ist-elektromobilitaet/standorte-rwe-ladesaeulen/ or http://www.vattenfall.de/www/vf/vf_de/225583xberx/228797innov/228917wasse/1550203minix/1715944ladem/index.jsp
58 Daimler AG, “e-mobility Berlin”: Daimler and RWE Embarking on the Age of Electro-Mobility”59 Heise online, "e-mobility Berlin" geht in die zweite Phase“ (2009)6060 Vattenfall, „Die BMW Group und Vattenfall Europe zeigen Alltagstauglichkeit von Elektromobilität“
(2009)61 US Department of Energy, "Consumer Energy Tax Incentives"