Embed Size (px)
Citation preview
"Point-to-point nanosecond pulse "diffuse filament" discharges for studies of energy transfer and nonequilibrium chemical
reaction mechanisms in molecular plasmas
D. Burnette, S. Bowman , K. Frederickson, B. Goldberg, S. Lanier, A. Montello,
M. Nishihara, A. Roettgen, Z. Yin, I.V. Adamovich, and W.R. Lempert
Objective / Outline
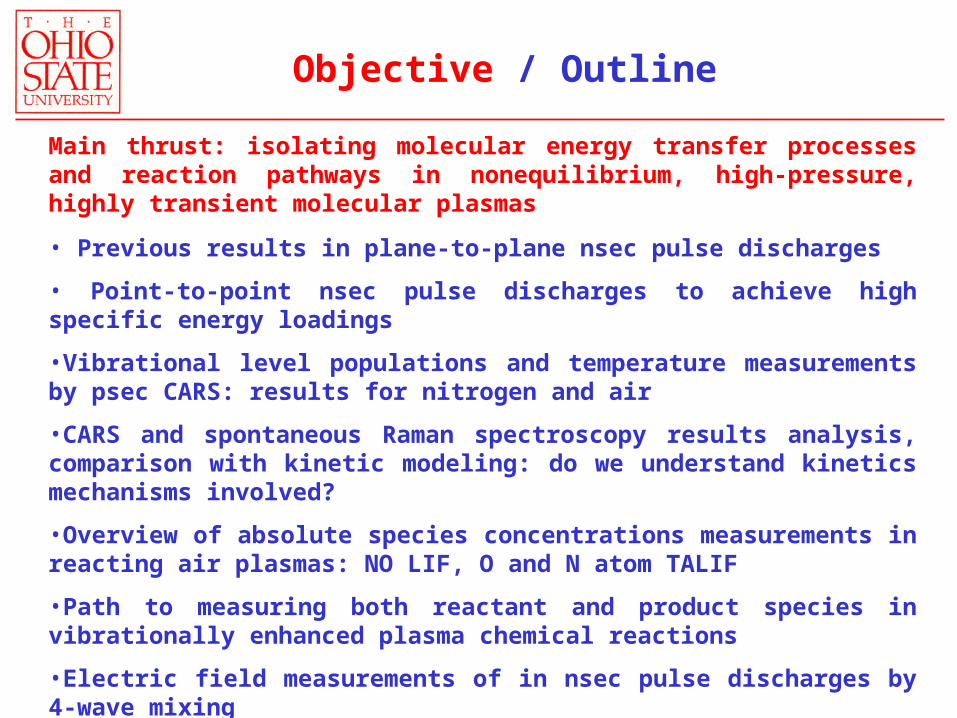
Main thrust: isolating molecular energy transfer processes and reaction pathways in nonequilibrium, high-pressure, highly transient molecular plasmas
• Previous results in plane-to-plane nsec pulse discharges
• Point-to-point nsec pulse discharges to achieve high specific energy loadings
•Vibrational level populations and temperature measurements by psec CARS: results for nitrogen and air
•CARS and spontaneous Raman spectroscopy results analysis, comparison with kinetic modeling: do we understand kinetics mechanisms involved?
•Overview of absolute species concentrations measurements in reacting air plasmas: NO LIF, O and N atom TALIF
•Path to measuring both reactant and product species in vibrationally enhanced plasma chemical reactions
•Electric field measurements of in nsec pulse discharges by 4-wave mixing
•Work in progress: development of electron density measurements by Thomson scattering
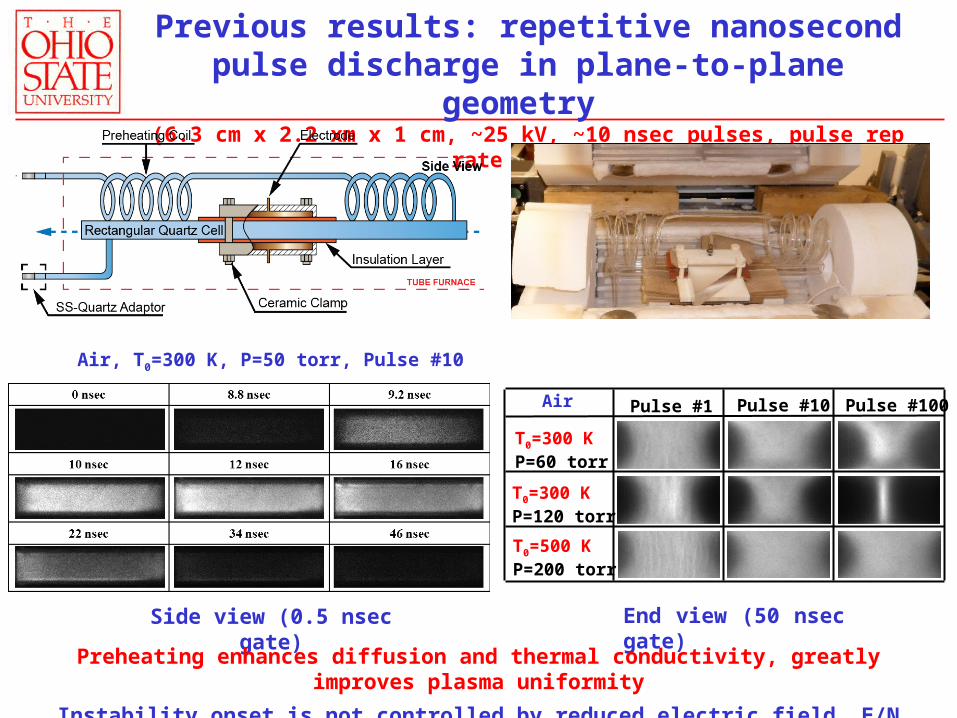
Previous results: repetitive nanosecond pulse discharge in plane-to-plane geometry
(6.3 cm x 2.2 xm x 1 cm, ~25 kV, ~10 nsec pulses, pulse rep rate 10 kHz)
Side view (0.5 nsec gate)
Pulse #1 Pulse #10 Pulse #100
T0=300 KP=60 torr
T0=300 KP=120 torr
Air
T0=500 KP=200 torr
End view (50 nsec gate)
Air, T0=300 K, P=50 torr, Pulse #10
Preheating enhances diffusion and thermal conductivity, greatly improves plasma uniformity
Instability onset is not controlled by reduced electric field, E/N
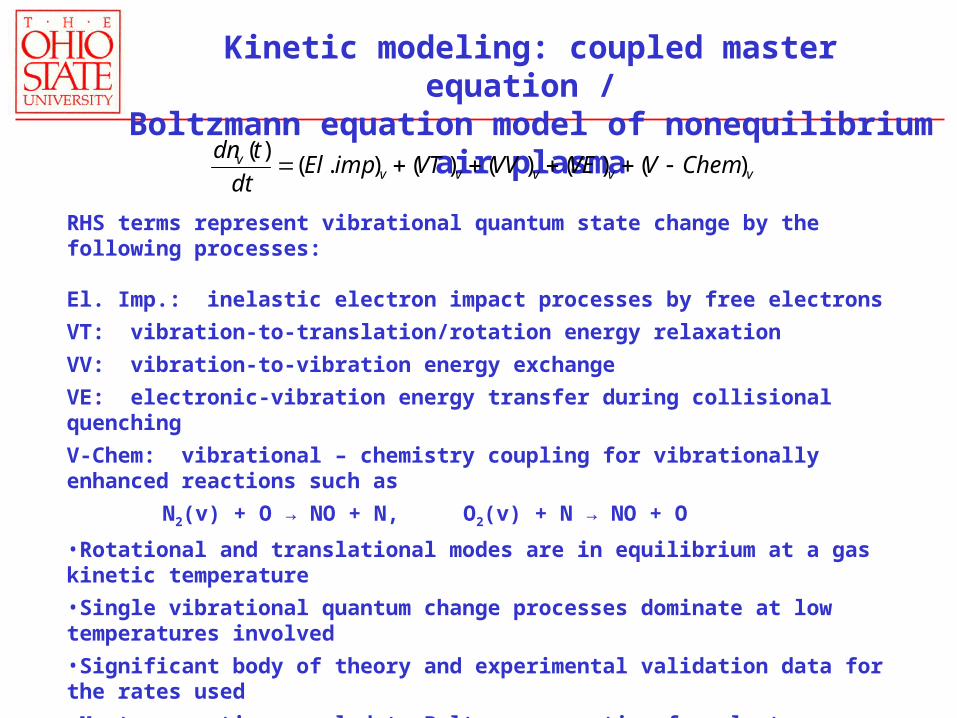
RHS terms represent vibrational quantum state change by the following processes:
El. Imp.: inelastic electron impact processes by free electrons
VT: vibration-to-translation/rotation energy relaxation
VV: vibration-to-vibration energy exchange
VE: electronic-vibration energy transfer during collisional quenching
V-Chem: vibrational – chemistry coupling for vibrationally enhanced reactions such as
N2(v) + O → NO + N, O2(v) + N → NO + O
•Rotational and translational modes are in equilibrium at a gas kinetic temperature
•Single vibrational quantum change processes dominate at low temperatures involved
•Significant body of theory and experimental validation data for the rates used
•Master equation coupled to Boltzmann equation for electron energy distribution, species concentrations equations, and quasi-1-D compressible flow equation
•Nonequilibrium air plasma chemistry, excited electronic states kinetics are included
•0-D, with correction for diffusion
•E/N, ne waveforms predicted by separate nsec pulse, plane-to-plane discharge model
Kinetic modeling: coupled master equation / Boltzmann equation model of nonequilibrium air plasma
vvvvvv ChemVVEVVVTimpEldt
tdn)()()()().(
)(
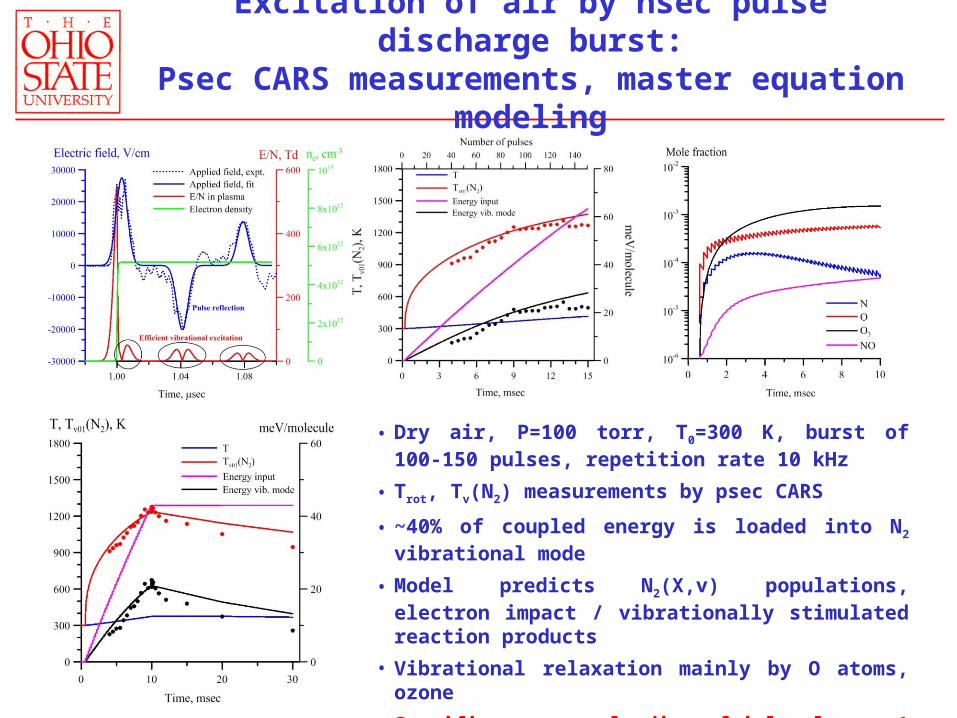
Excitation of air by nsec pulse discharge burst:Psec CARS measurements, master equation modeling
• Dry air, P=100 torr, T0=300 K, burst of 100-150 pulses, repetition rate 10 kHz
• Trot, Tv(N2) measurements by psec CARS
• ~40% of coupled energy is loaded into N2 vibrational mode
• Model predicts N2(X,v) populations, electron impact / vibrationally stimulated reaction products
• Vibrational relaxation mainly by O atoms, ozone
• Specific energy loading fairly low, ~1 meV/molecule/pulse
• Temperature rise ~ 1 K/pulse, Tv(N2) remains fairly low
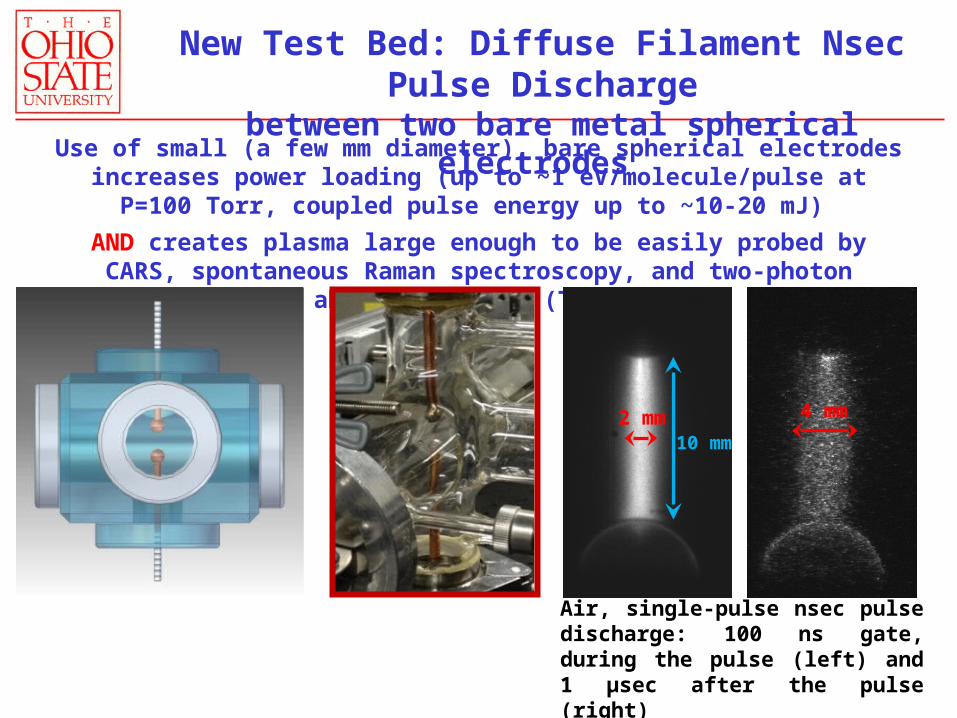
New Test Bed: Diffuse Filament Nsec Pulse Discharge between two bare metal spherical electrodes
Use of small (a few mm diameter), bare spherical electrodes increases power loading (up to ~1 eV/molecule/pulse at P=100 Torr, coupled pulse energy up to ~10-
20 mJ)
AND creates plasma large enough to be easily probed by CARS, spontaneous Raman spectroscopy, and two-photon absorption LIF (TALIF)
10 mm2 mm 4 mm
Air, single-pulse nsec pulse discharge: 100 ns gate, during the pulse (left) and 1 μsec after the pulse (right)
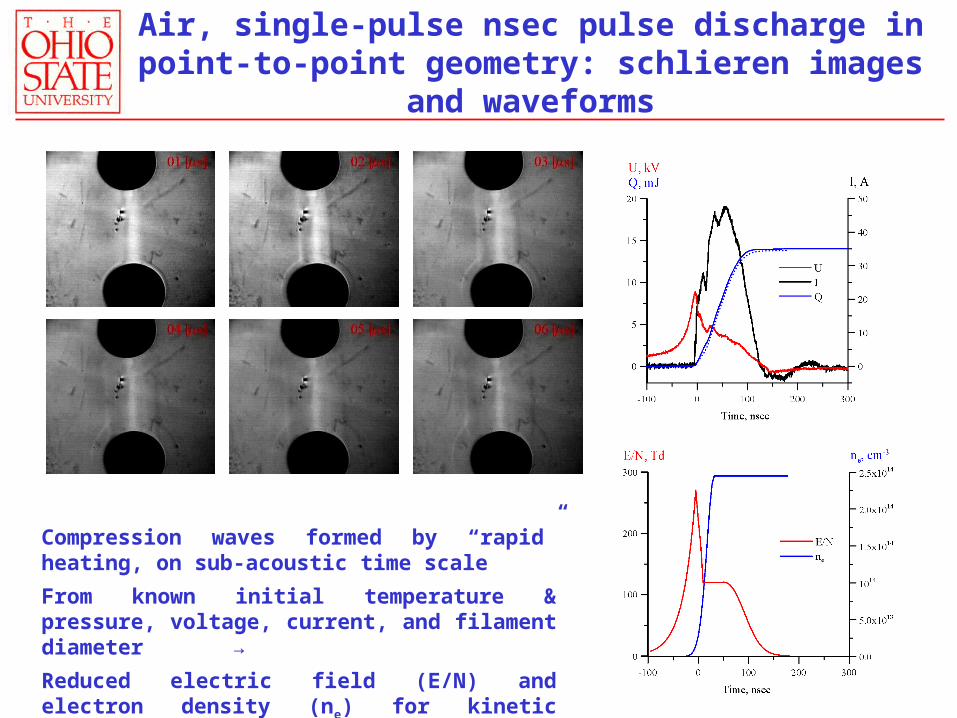
Air, single-pulse nsec pulse discharge in point-to-point geometry: schlieren images and waveforms
Compression waves formed by “rapid” heating, on sub-acoustic time scale
From known initial temperature & pressure, voltage, current, and filament diameter →
Reduced electric field (E/N) and electron density (ne) for kinetic modeling
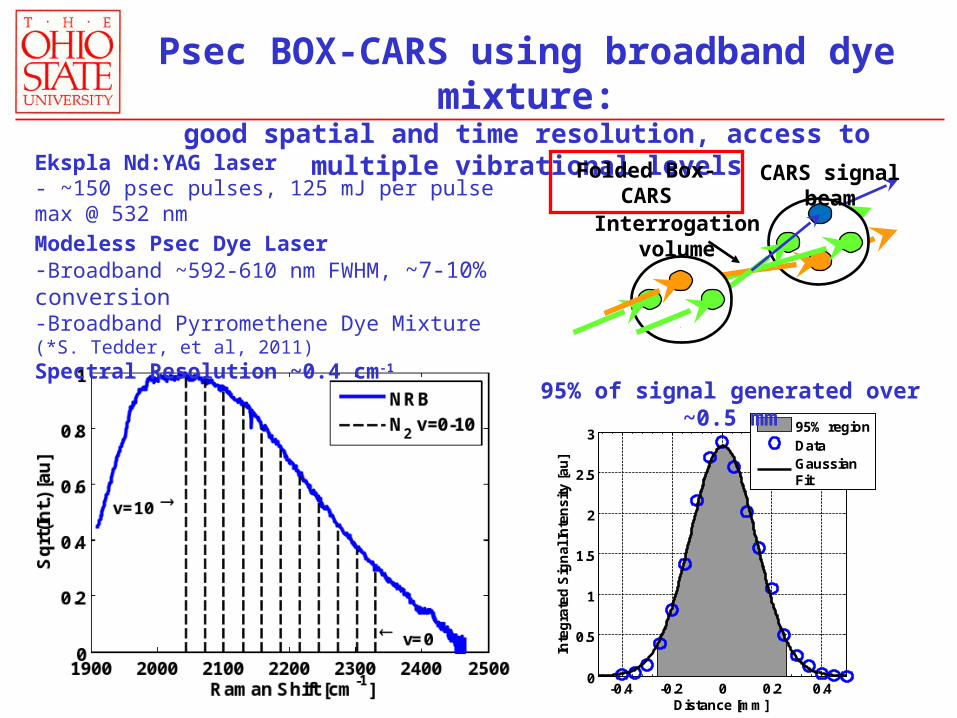
Psec BOX-CARS using broadband dye mixture:good spatial and time resolution, access to multiple vibrational levels
-0.4 -0.2 0 0.2 0.40
0.5
1
1.5
2
2.5
3
Distance [mm]
Inte
gra
ted
Sig
na
l In
ten
sit
y [
au
]
95% regionDataGaussianFit
Interrogationvolume
CARS signal beamFolded Box-CARS
95% of signal generated over ~0.5 mm
Ekspla Nd:YAG laser- ~150 psec pulses, 125 mJ per pulse max @ 532 nm
Modeless Psec Dye Laser-Broadband ~592-610 nm FWHM, ~7-10% conversion-Broadband Pyrromethene Dye Mixture (*S. Tedder, et al, 2011)Spectral Resolution ~0.4 cm-1
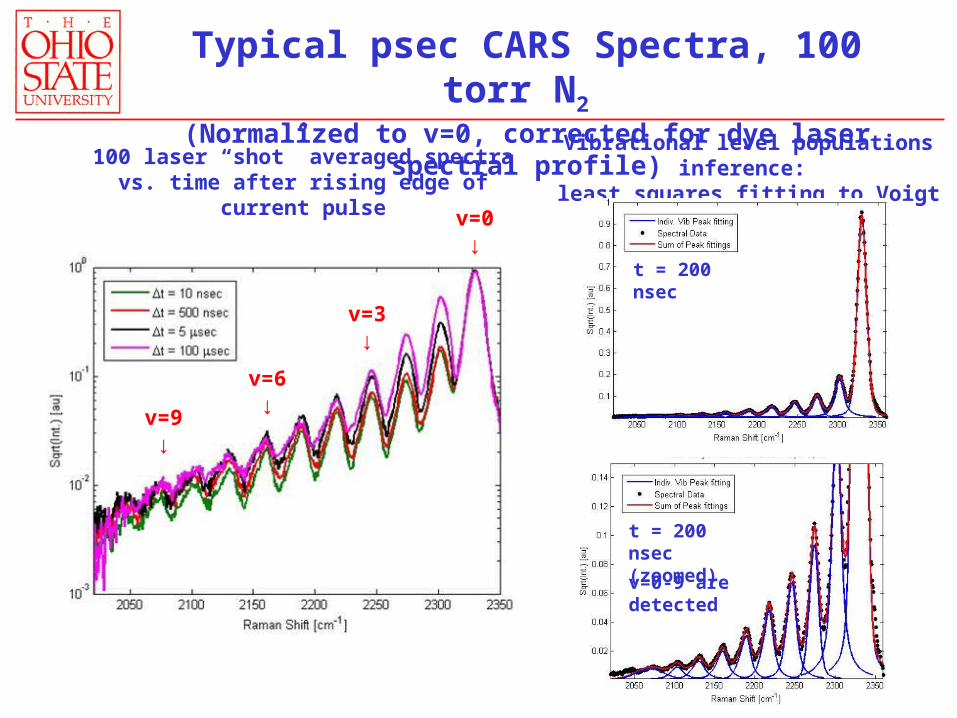
t = 200 nsec(zoomed)
v=0-9 are detected
Typical psec CARS Spectra, 100 torr N2 (Normalized to v=0, corrected for dye laser spectral profile)
v=0↓
v=3↓
v=6↓v=9
↓
100 laser “shot” averaged spectra vs. time after rising edge of current pulse
Vibrational level populations inference: least squares fitting to Voigt line shape
t = 200 nsec
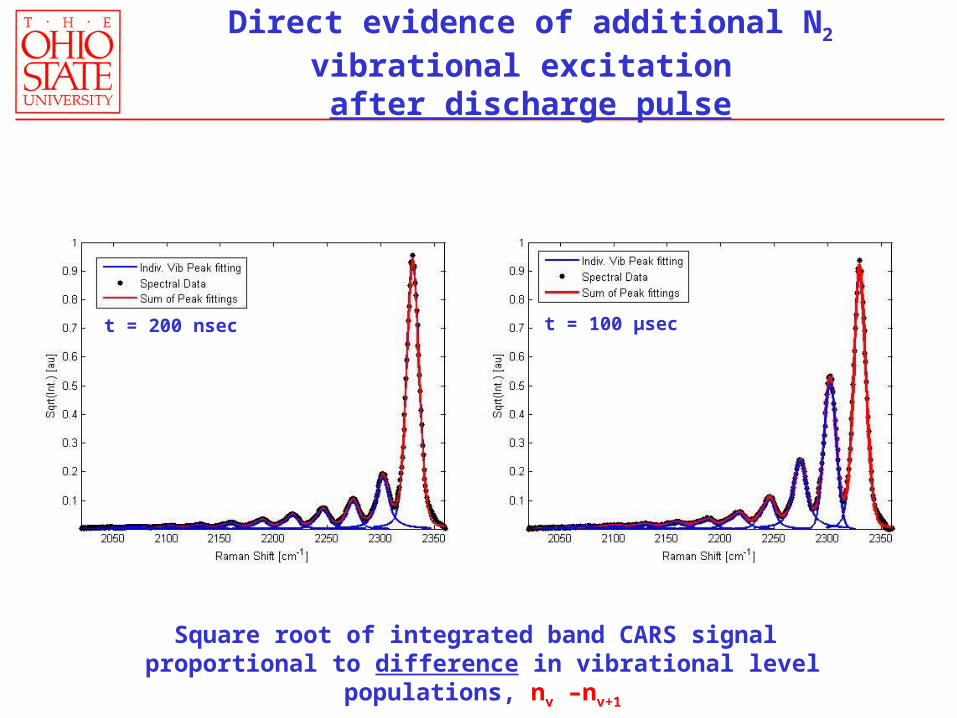
t = 100 μsect = 200 nsec
Direct evidence of additional N2 vibrational excitation after discharge pulse
Square root of integrated band CARS signal proportional to difference in vibrational level populations, nv –nv+1
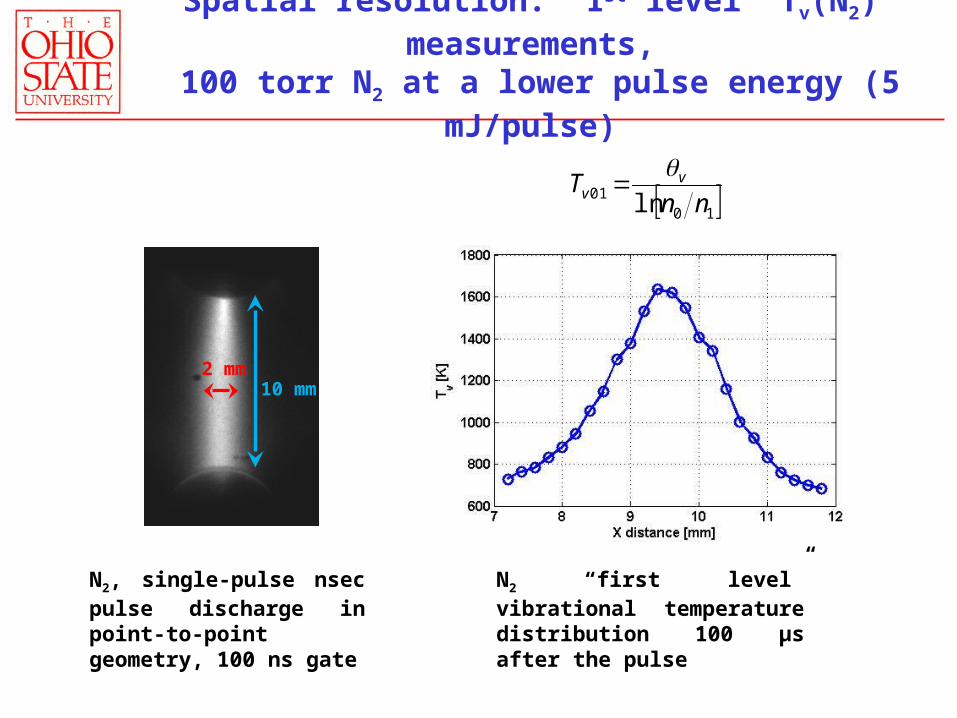
N2 “first level” vibrational temperature distribution 100 μs after the pulse
Spatial resolution: “1st level” Tv(N2) measurements, 100 torr N2 at a lower pulse energy (5 mJ/pulse)
10 mm2 mm
N2, single-pulse nsec pulse discharge in point-to-point geometry, 100 ns gate
1001 ln nn
T vv
280 290 300 310 3200
5
10
15
20
25
Tfit
[K]
Cou
nts
Tfit
=302 K
2320 2325 23300
50
100
150
200
Raman Shift [cm-1]
Sq
rt(I
nt.
) [a
u]
DataT
fit=300K
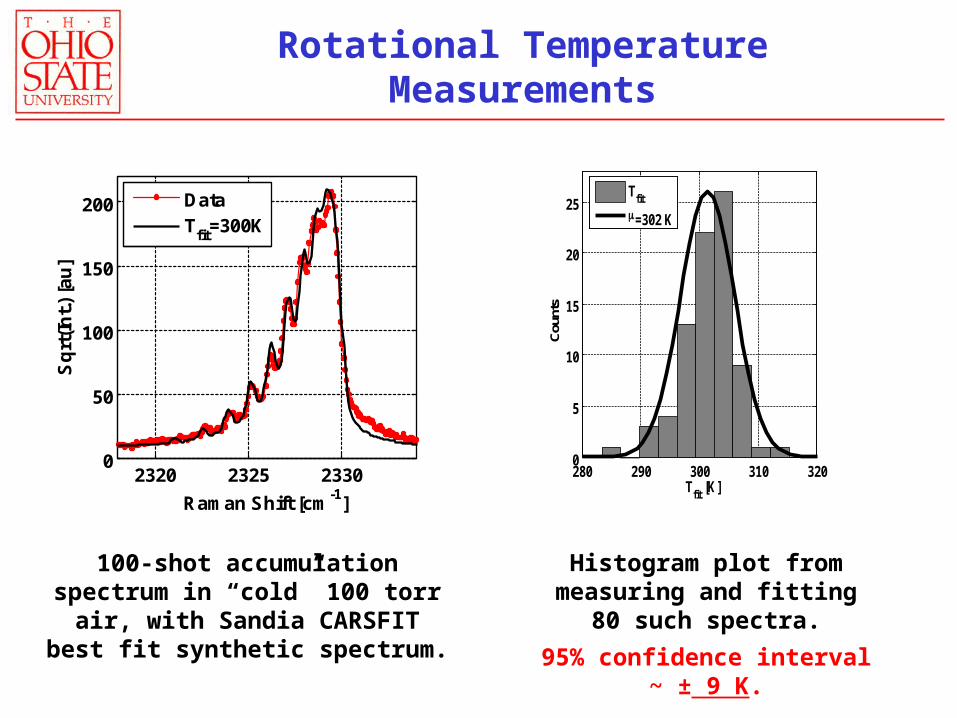
Rotational Temperature Measurements
100-shot accumulation spectrum in “cold” 100 torr air, with Sandia
CARSFIT best fit synthetic spectrum.
Histogram plot from measuring and fitting 80 such spectra.
95% confidence interval ~ ± 9 K.

CARS results summary:time-resolved N2 vibrational populations in nitrogen
Significant vibrational excitation after the pulse (~100 nsec long), followed by eventual relaxation
Energy appears to come to N2(v=1-8) from an “internal storage”, not from electron impact during the discharge
Increase in both “first level” N2 vibrational temperature, Tv01, and total number of quanta per molecule, Q
9
0vvvfQ
1001 ln nn
T vv
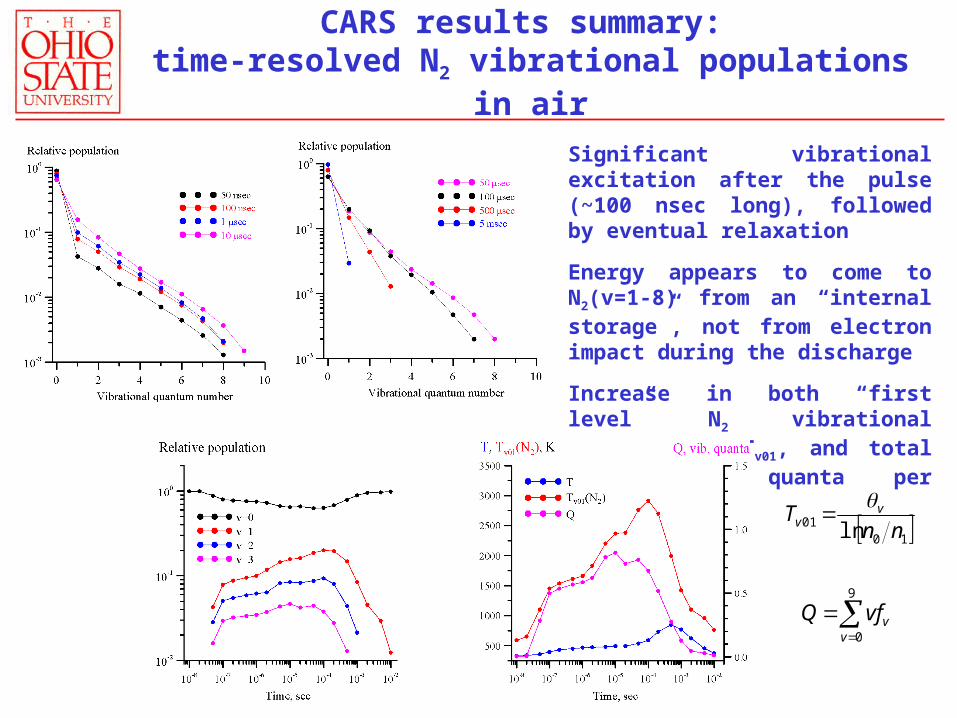
CARS results summary: time-resolved N2 vibrational populations in air
Significant vibrational excitation after the pulse (~100 nsec long), followed by eventual relaxation
Energy appears to come to N2(v=1-8) from an “internal storage”, not from electron impact during the discharge
Increase in both “first level” N2 vibrational temperature, Tv01, and total number of quanta per molecule, Q
9
0vvvfQ
1001 ln nn
T vv
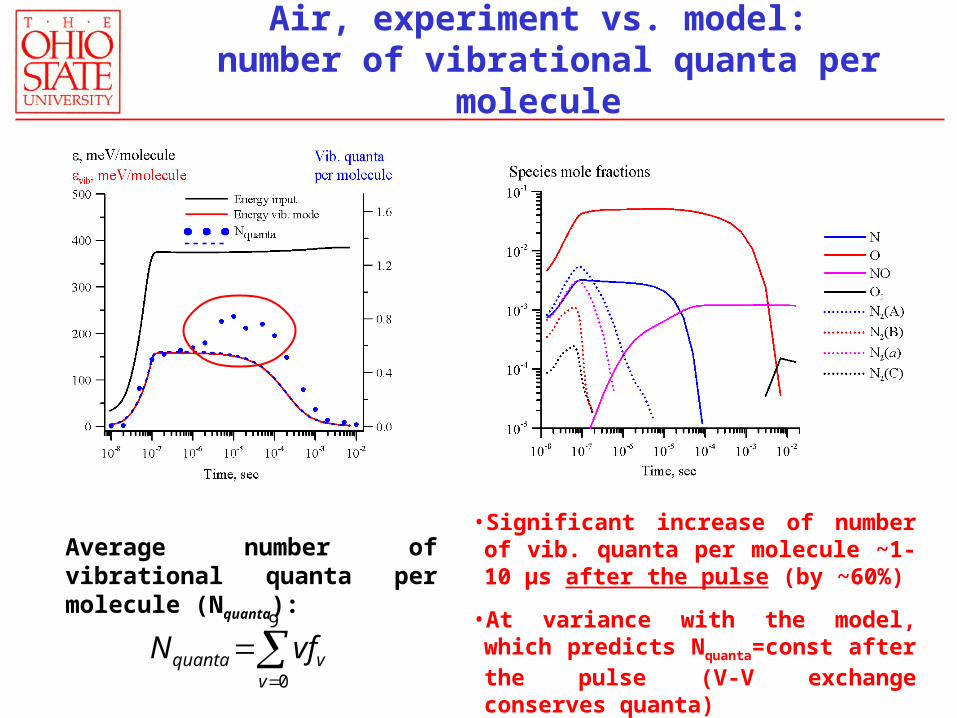
Air, experiment vs. model: number of vibrational quanta per molecule
Average number of vibrational quanta per molecule (Nquanta):
• Significant increase of number of vib. quanta per molecule ~1-10 μs after the pulse (by ~60%)
• At variance with the model, which predicts Nquanta=const after the pulse (V-V exchange conserves quanta)
9
0vvquanta vfN
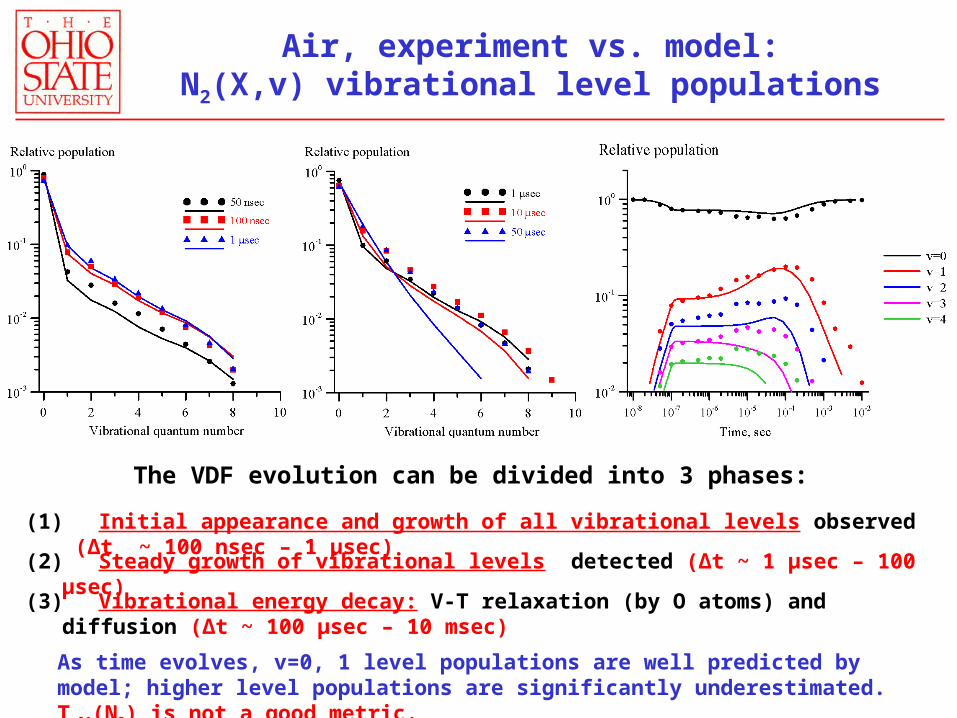
(1) Initial appearance and growth of all vibrational levels observed (Δt ~ 100 nsec – 1 μsec)
(2) Steady growth of vibrational levels detected (Δt ~ 1 μsec – 100 μsec)
(3) Vibrational energy decay: V-T relaxation (by O atoms) and diffusion (Δt ~ 100 μsec – 10 msec)
Air, experiment vs. model:N2(X,v) vibrational level populations
The VDF evolution can be divided into 3 phases:
As time evolves, v=0, 1 level populations are well predicted by model; higher level populations are significantly underestimated. Tv01(N2) is not a good metric.
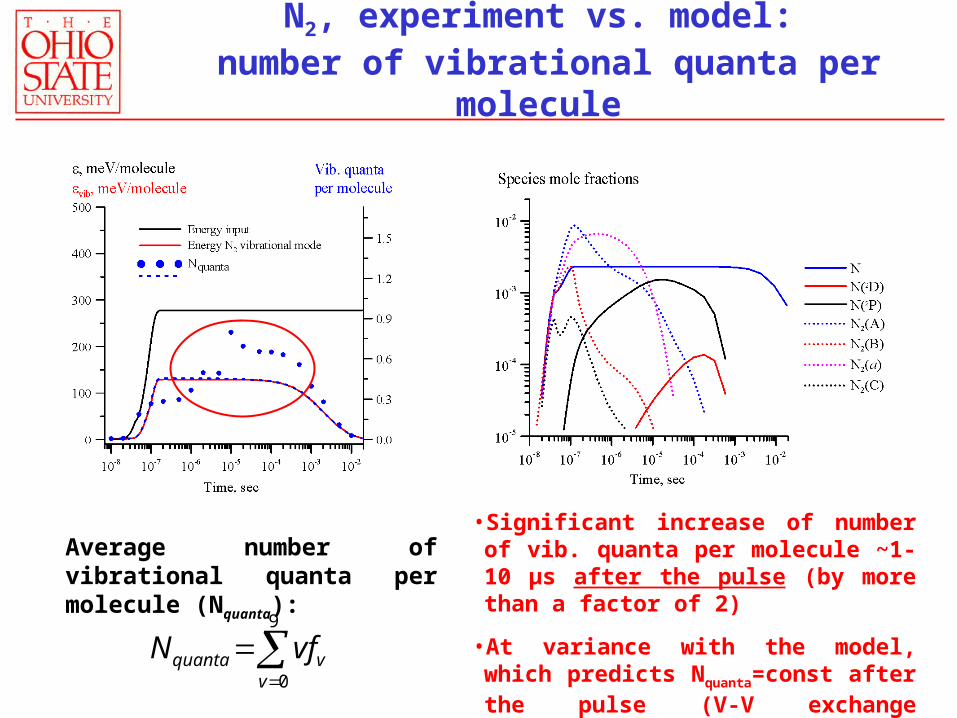
Average number of vibrational quanta per molecule (Nquanta):
• Significant increase of number of vib. quanta per molecule ~1-10 μs after the pulse (by more than a factor of 2)
• At variance with the model, which predicts Nquanta=const after the pulse (V-V exchange conserves quanta)
9
0vvquanta vfN
N2, experiment vs. model: number of vibrational quanta per molecule
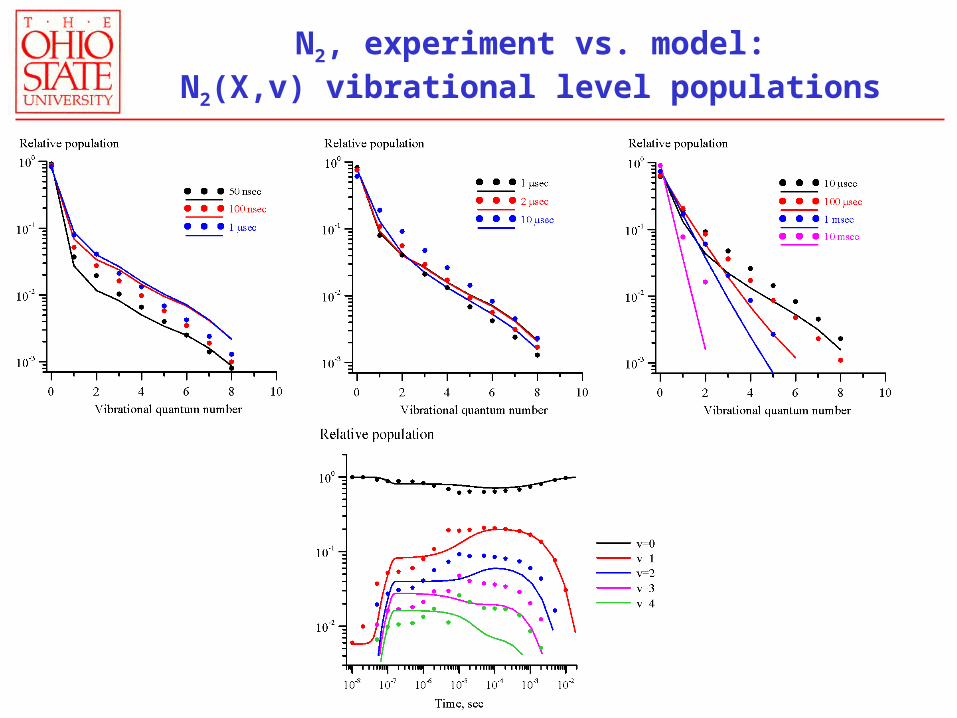
N2, experiment vs. model:N2(X,v) vibrational level populations
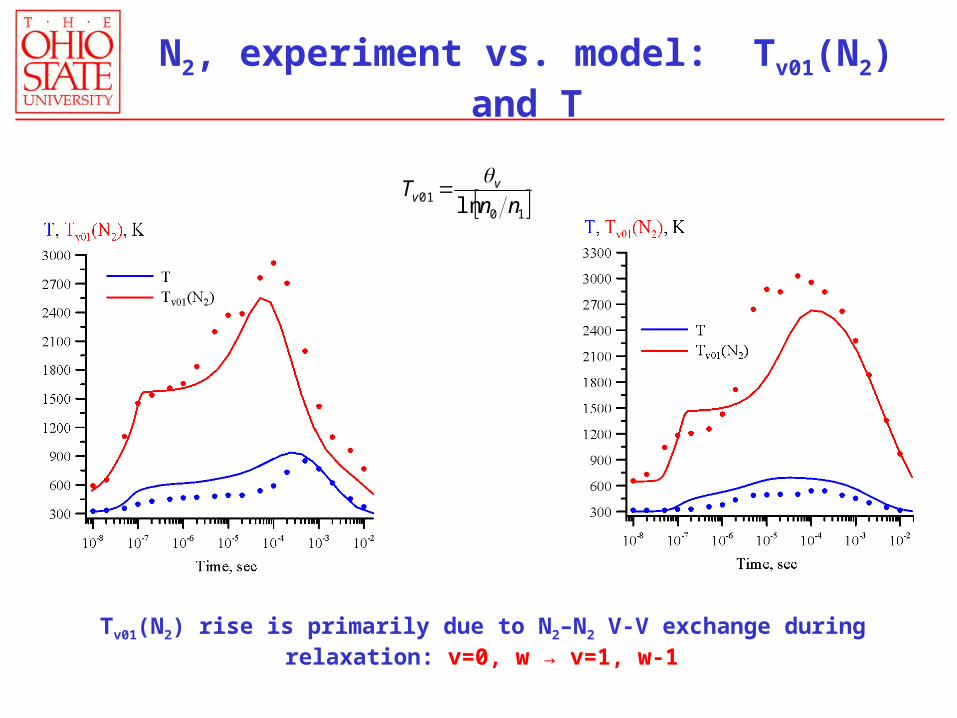
Tv01(N2) rise is primarily due to N2–N2 V-V exchange during relaxation: v=0, w → v=1, w-1
1001 ln nn
T vv
N2, experiment vs. model: Tv01(N2) and T
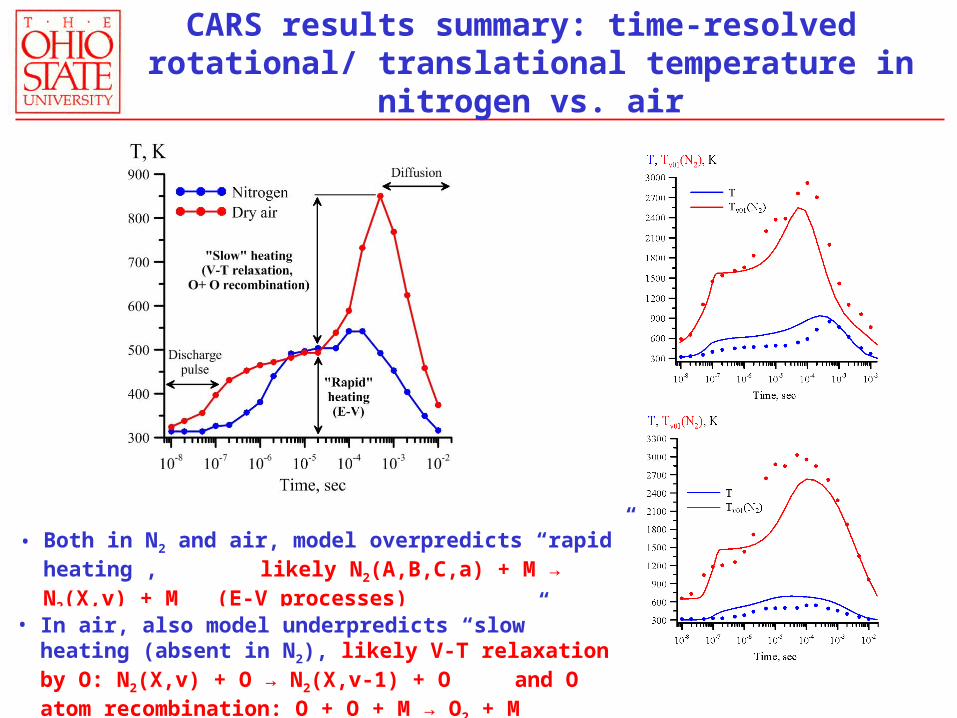
• Both in N2 and air, model overpredicts “rapid” heating , likely N2(A,B,C,a) + M → N2(X,v) + M (E-V processes)
• In air, also model underpredicts “slow” heating (absent in N2), likely V-T relaxation by O: N2(X,v) + O → N2(X,v-1) + O and O atom recombination: O + O + M → O2 + M
CARS results summary: time-resolved rotational/ translational temperature in nitrogen vs. air
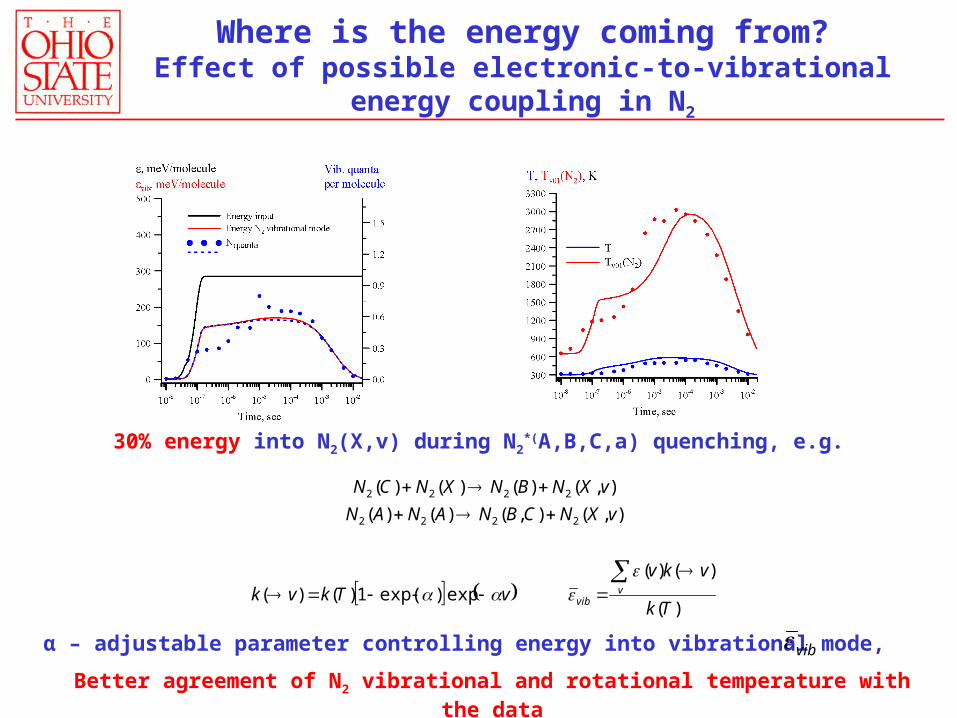
Where is the energy coming from?Effect of possible electronic-to-vibrational energy coupling in N2
30% energy into N2(X,v) during N2*(A,B,C,a) quenching, e.g.
)(
)()(exp)exp(1)()(
),(),()()(
),()()()(
2222
2222
Tk
vkvvTkvk
vXNCBNANAN
vXNBNXNCN
vvib
α – adjustable parameter controlling energy into vibrational mode, vib
Better agreement of N2 vibrational and rotational temperature with the data
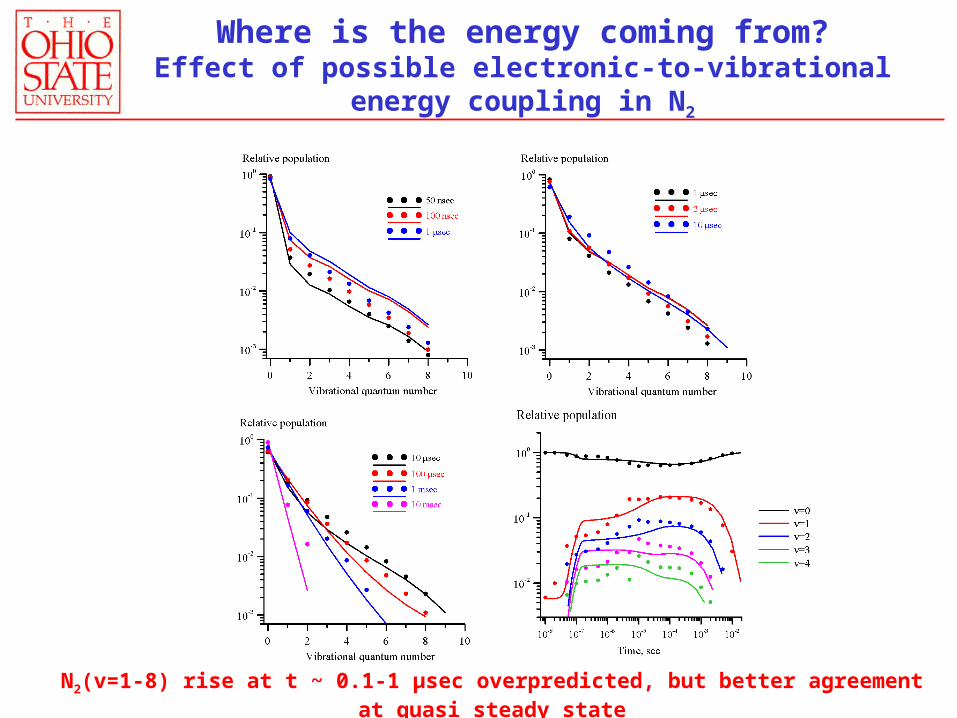
N2(v=1-8) rise at t ~ 0.1-1 μsec overpredicted, but better agreement at quasi steady state
Where is the energy coming from?Effect of possible electronic-to-vibrational energy coupling in N2
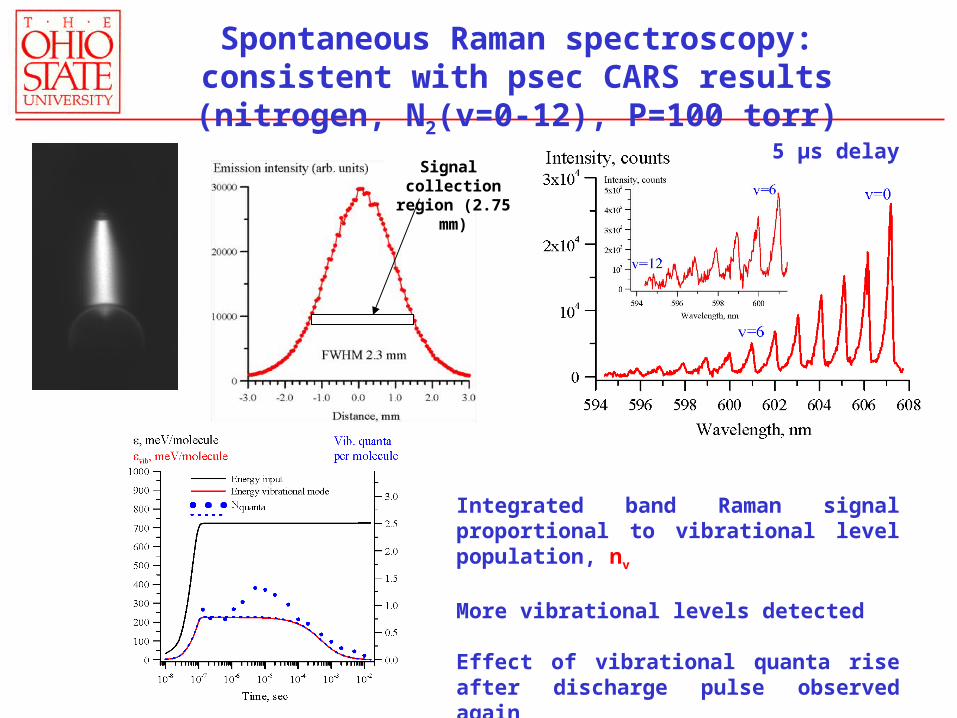
5 μs delay
Spontaneous Raman spectroscopy: consistent with psec CARS results (nitrogen, N2(v=0-12), P=100 torr)
Signal collection region (2.75 mm)
Integrated band Raman signal proportional to vibrational level population, nv
More vibrational levels detected
Effect of vibrational quanta rise after discharge pulse observed again
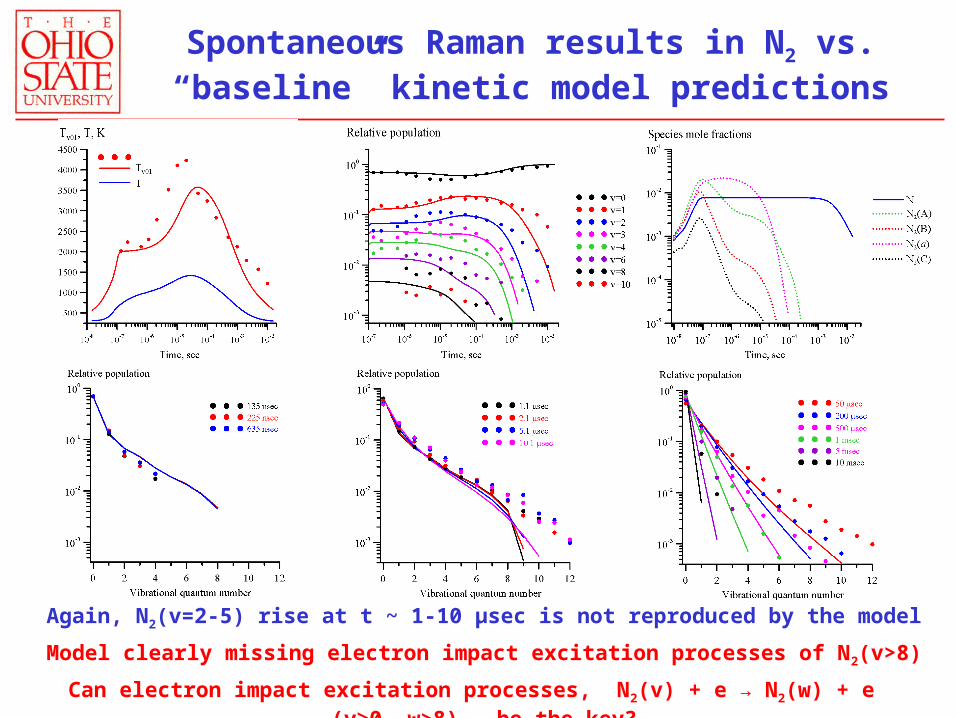
Spontaneous Raman results in N2 vs. “baseline” kinetic model predictions
Again, N2(v=2-5) rise at t ~ 1-10 μsec is not reproduced by the model
Model clearly missing electron impact excitation processes of N2(v>8)
Can electron impact excitation processes, N2(v) + e → N2(w) + e (v≥0, w>8) , be the key?
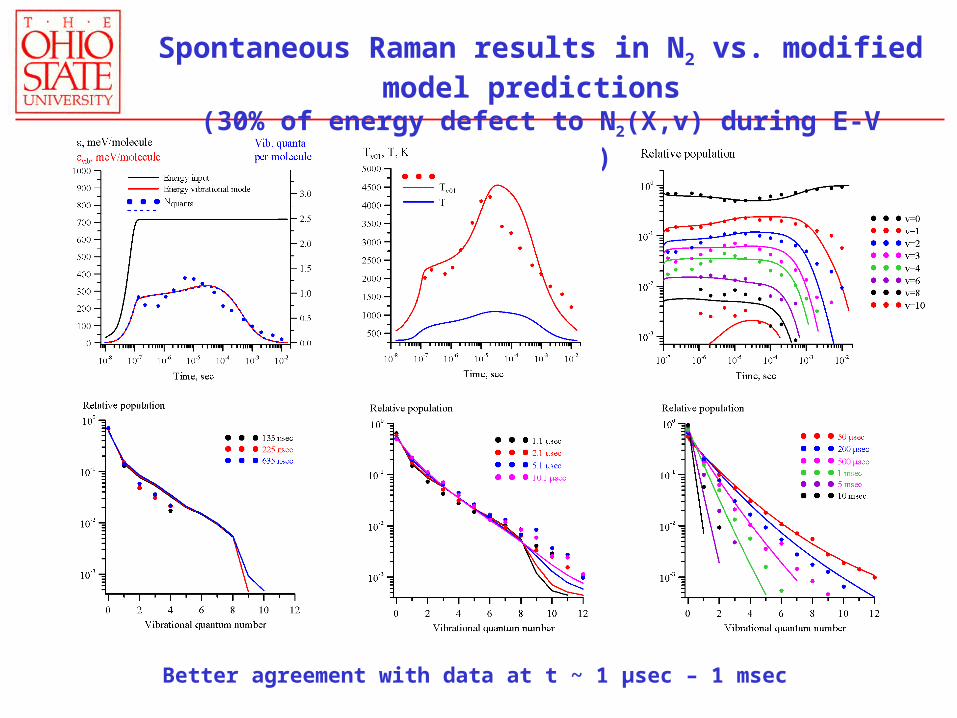
Spontaneous Raman results in N2 vs. modified model predictions (30% of energy defect to N2(X,v) during E-V transfer)
Better agreement with data at t ~ 1 μsec – 1 msec
1 E -6 1 E -5 1 E -4 1 E -3 1 E -2 1 E -1 1 E + 0
1 .0 E -7
1 .0 E -6
1 .0 E -5
1 .0 E -4
T im e , se co n d s
M o le fra c tio n s
O
N O
O
N O
N
O 3
N 2 (A )
O 2 (b )
N 2 (X ,v )
e -
1 E -6 1 E -5 1 E -4 1 E -3 1 E -2 1 E -1 1 E + 0
1 .0 E -7
1 .0 E -6
1 .0 E -5
1 .0 E -4
T im e , seco n d s
M o le frac tio n s
O
N O
O
N O
N
O 3
N 2 (A )
O 2 (b )
N 2 (X ,v )
N O 21 .0 E -7
1 .0 E -6
1 .0 E -5
1 .0 E -4
1 E -6 1 E -5 1 E -4 1 E -3 1 E -2 1 E -1 1 E + 0
1 .0 E -7
1 .0 E -6
1 .0 E -5
1 .0 E -4
T im e , se co n d s
M o le fra c tio n s
O
N O
O
N O
N
O 3
N 2 (A )
O 2 (b )
N O 2
N 2 (X ,v )
1 .0 E -7
1 .0 E -6
1 .0 E -5
1 .0 E -4
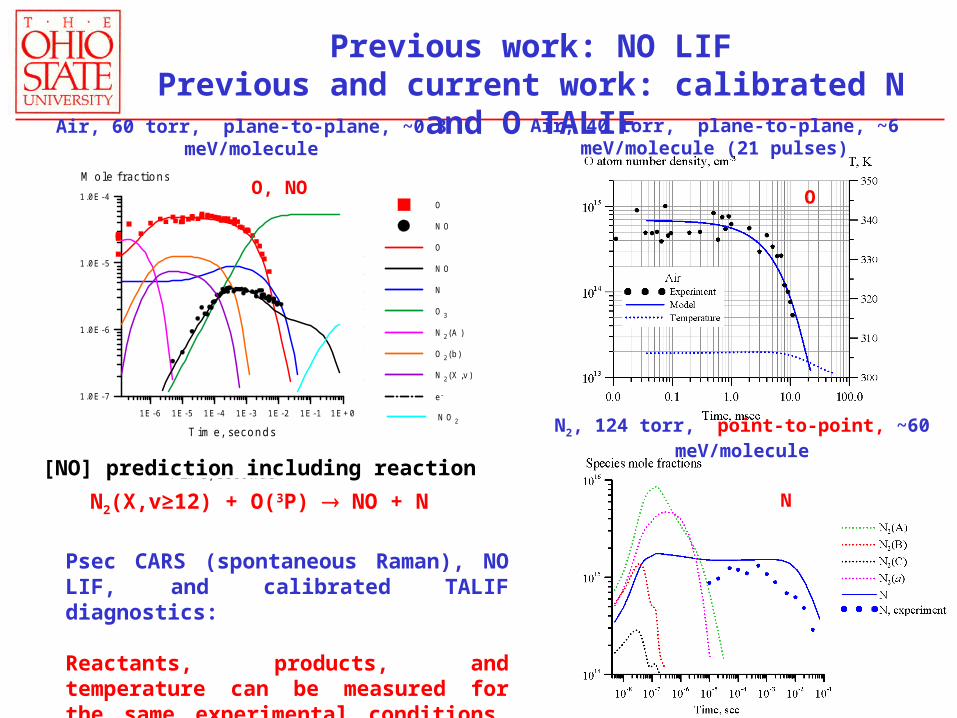
Previous work: NO LIFPrevious and current work: calibrated N and O TALIF
N2, 124 torr, point-to-point, ~60 meV/molecule
Air, 40 torr, plane-to-plane, ~6 meV/molecule (21 pulses)Air, 60 torr, plane-to-plane, ~0.3 meV/molecule
O, NO O
N
[NO] prediction including reaction
N2(X,v≥12) + O(3P) NO + N
Psec CARS (spontaneous Raman), NO LIF, and calibrated TALIF diagnostics:
Reactants, products, and temperature can be measured for the same experimental conditions, state-specific reactant rates can be inferred.
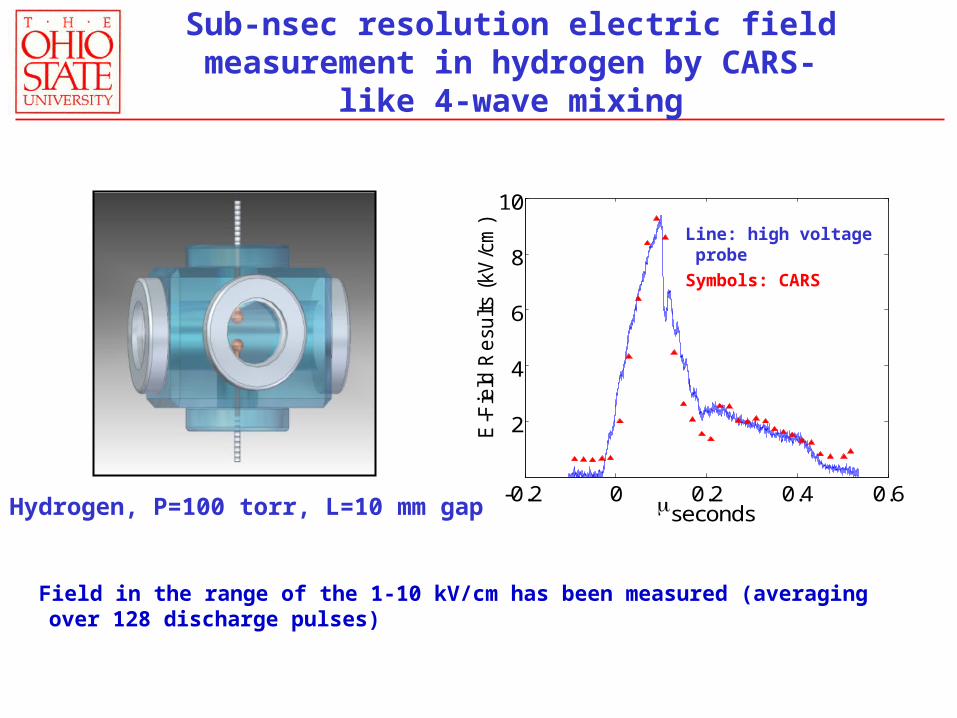
Hydrogen, P=100 torr, L=10 mm gap-0.2 0 0.2 0.4 0.6
2
4
6
8
10
secondsE
-Fie
ld R
esu
lts (
kV/c
m)
Line: high voltage probe
Symbols: CARS
Field in the range of the 1-10 kV/cm has been measured (averaging over 128 discharge pulses)
Sub-nsec resolution electric field measurement in hydrogen by CARS-like 4-wave mixing
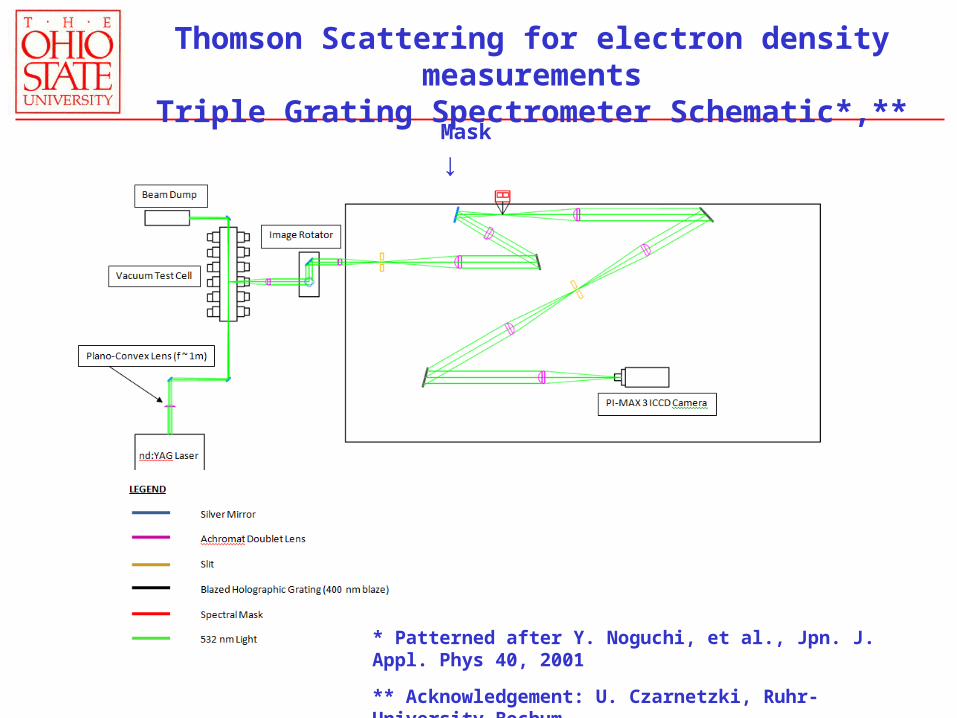
Thomson Scattering for electron density measurementsTriple Grating Spectrometer Schematic*,**
Mask
↓
* Patterned after Y. Noguchi, et al., Jpn. J. Appl. Phys 40, 2001
** Acknowledgement: U. Czarnetzki, Ruhr-University Bochum
Summary
• Time-resolved, spatially resolved T, Tv(N2), and N2 (X,v=0-12) population measurements (psec CARS, spontaneous Raman) in high energy loading nsec pulse discharges in air and nitrogen
• Results suggest coupling between electronic and vibrational mode energies in N2
• Time-resolved, spatially resolved measurements of absolute species concentrations in reacting air plasmas: NO (LIF), O and N atoms (TALIF)
• Results demonstrate feasibility of measuring both reactant and product species in vibrationally enhanced plasma chemical reactions, N2(X,v≥12) + O(3P) NO + N, inference of state-specific reaction rates
• Electric field measurements (4-wave mixing / CARS) in nsec pulse discharges in H2
• Good progress on Thomson scattering diagnostics for electron density measurements
• Comprehensive set of optical diagnostics for characterization of nsec pulse discharges in molecular gases