Embed Size (px)
Citation preview
Nonequilibrium Thermodynamics Laboratories The Ohio State University
Nonequilibrium Gas Dynamics: Understanding of High-Speed Flows
at Strong Energy Mode Disequilibrium
Igor V. Adamovich
Seminar at the Department of Aeronautical Engineering
January 28, 2008
Nonequilibrium Thermodynamics Laboratories The Ohio State University
NETL Group
Faculty:
Igor Adamovich, Walter Lempert, Bill Rich, Vish Subramaniam
Post-docs:
Naibo Jiang, Evgeny Mintusov, Munetake Nishihara, Anna Serdyuchenko
Students:
Sherrie Bowman, John Bruzzese, Inchul Choi, Ashim Dutta, Saurabh Keshav, Mruthunjaya Uddi, Matt Webster, Yvette Zuzeek
Nonequilibrium Thermodynamics Laboratories The Ohio State University
• Generation and sustaining of stable high-pressure weakly ionized plasmas
• High-speed flow control by nonequilibrium plasmas / MHD
• Ignition, combustion, and flameholding by nonequilibrium plasmas
• Molecular gas lasers
• Kinetics of gases, plasmas, and liquids at extreme thermodynamicdisequilibrium
• Molecular energy transfer processes: excitation and relaxation of vibrationaland electronic levels, chemical reactions among excited species, plasmaradiation
• Electron and ion kinetics: ionization, recombination, electron attachmentand detachment, charge transfer, inelastic electron-molecule collisions
• Flow visualization and optical diagnostics
Scope of Research
Nonequilibrium Thermodynamics Laboratories The Ohio State University
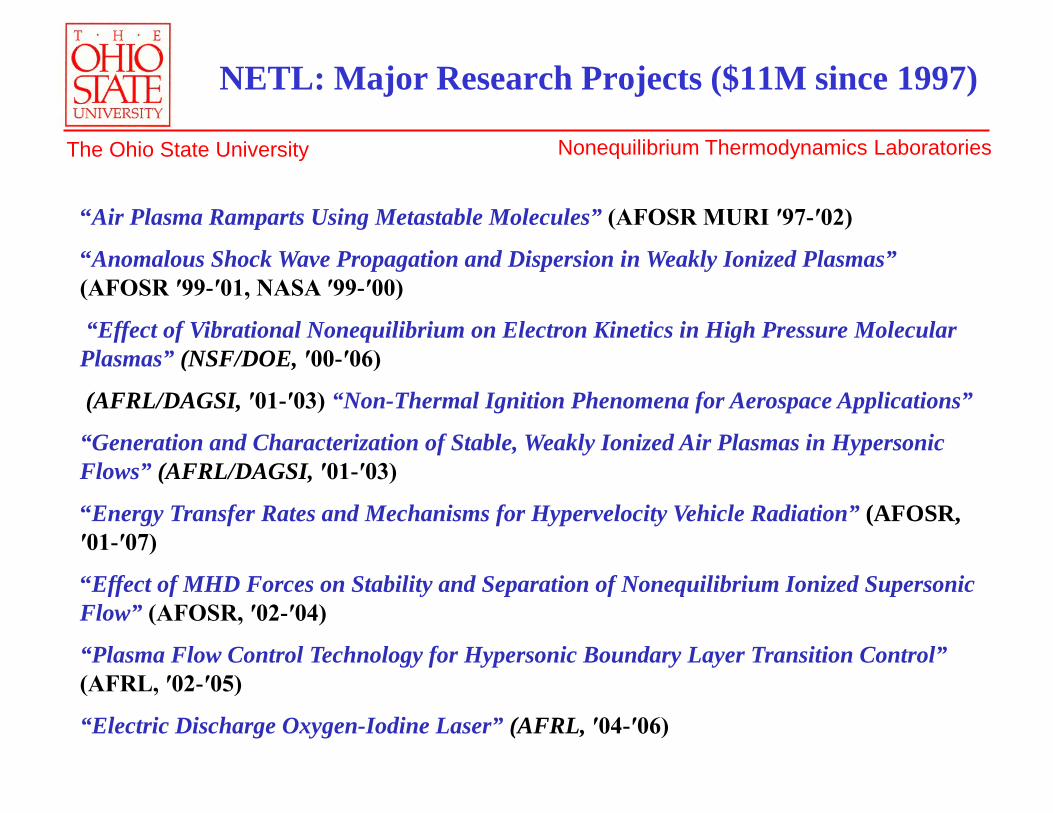
NETL: Major Research Projects ($11M since 1997)
“Air Plasma Ramparts Using Metastable Molecules” (AFOSR MURI ′97-′02)
“Anomalous Shock Wave Propagation and Dispersion in Weakly Ionized Plasmas”(AFOSR ′99-′01, NASA ′99-′00)
“Effect of Vibrational Nonequilibrium on Electron Kinetics in High Pressure Molecular Plasmas” (NSF/DOE, ′00-′06)
(AFRL/DAGSI, ′01-′03) “Non-Thermal Ignition Phenomena for Aerospace Applications”
“Generation and Characterization of Stable, Weakly Ionized Air Plasmas in Hypersonic Flows” (AFRL/DAGSI, ′01-′03)
“Energy Transfer Rates and Mechanisms for Hypervelocity Vehicle Radiation” (AFOSR, ′01-′07)
“Effect of MHD Forces on Stability and Separation of Nonequilibrium Ionized Supersonic Flow” (AFOSR, ′02-′04)
“Plasma Flow Control Technology for Hypersonic Boundary Layer Transition Control” (AFRL, ′02-′05)
“Electric Discharge Oxygen-Iodine Laser” (AFRL, ′04-′06)
Nonequilibrium Thermodynamics Laboratories The Ohio State University
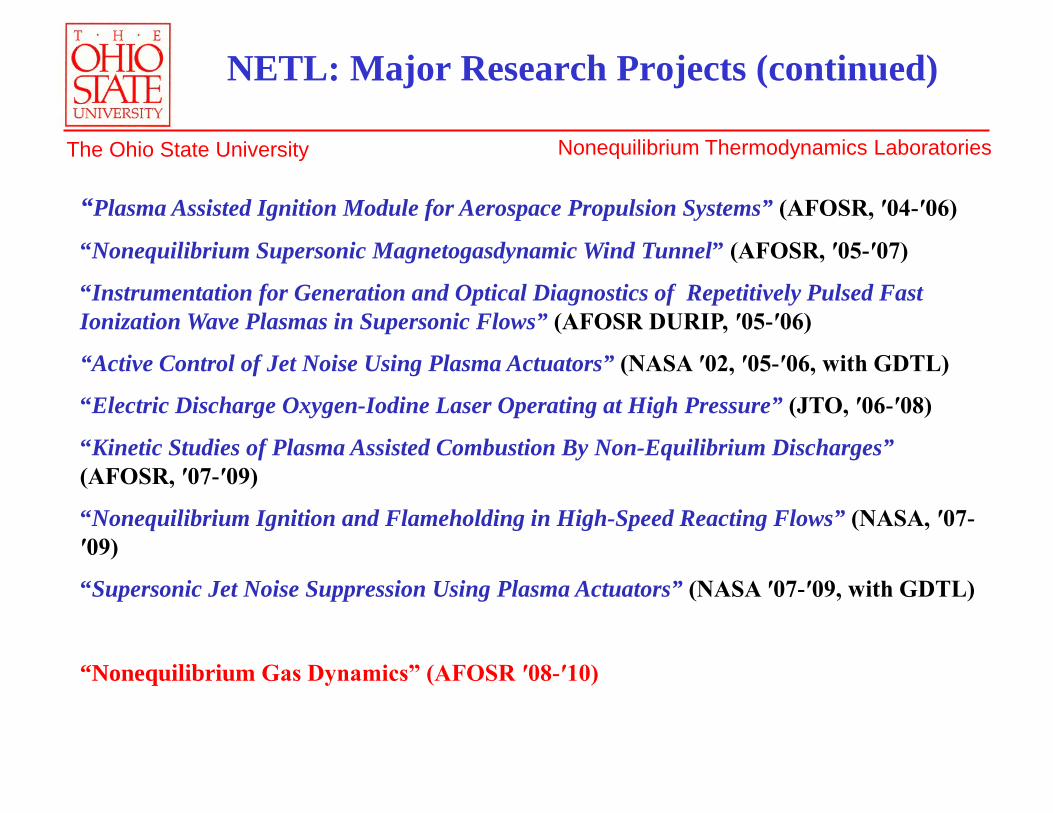
NETL: Major Research Projects (continued)
“Plasma Assisted Ignition Module for Aerospace Propulsion Systems” (AFOSR, ′04-′06)
“Nonequilibrium Supersonic Magnetogasdynamic Wind Tunnel” (AFOSR, ′05-′07)
“Instrumentation for Generation and Optical Diagnostics of Repetitively Pulsed Fast Ionization Wave Plasmas in Supersonic Flows” (AFOSR DURIP, ′05-′06)
“Active Control of Jet Noise Using Plasma Actuators” (NASA ′02, ′05-′06, with GDTL)
“Electric Discharge Oxygen-Iodine Laser Operating at High Pressure” (JTO, ′06-′08)
“Kinetic Studies of Plasma Assisted Combustion By Non-Equilibrium Discharges” (AFOSR, ′07-′09)
“Nonequilibrium Ignition and Flameholding in High-Speed Reacting Flows” (NASA, ′07-′09)
“Supersonic Jet Noise Suppression Using Plasma Actuators” (NASA ′07-′09, with GDTL)
“Nonequilibrium Gas Dynamics” (AFOSR ′08-′10)
Nonequilibrium Thermodynamics Laboratories The Ohio State University
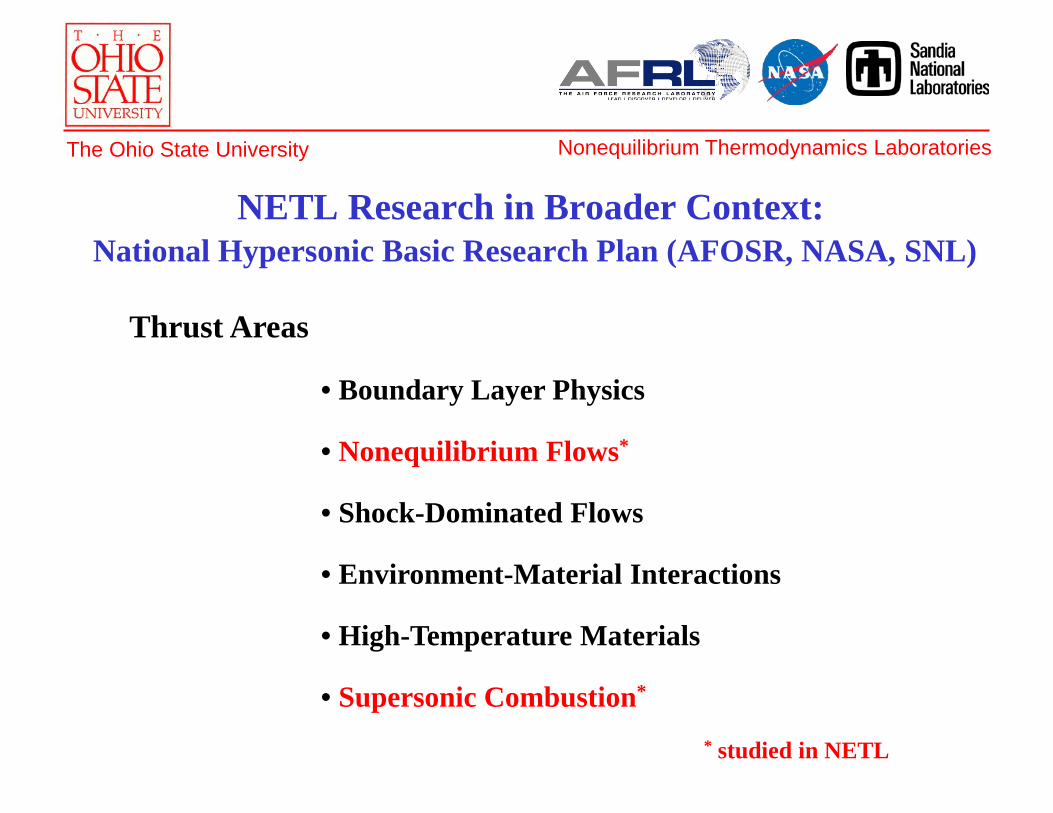
NETL Research in Broader Context:National Hypersonic Basic Research Plan (AFOSR, NASA, SNL)
Thrust Areas
• Boundary Layer Physics
• Nonequilibrium Flows*
• Shock-Dominated Flows
• Environment-Material Interactions
• High-Temperature Materials
• Supersonic Combustion*
* studied in NETL
Nonequilibrium Thermodynamics Laboratories The Ohio State University
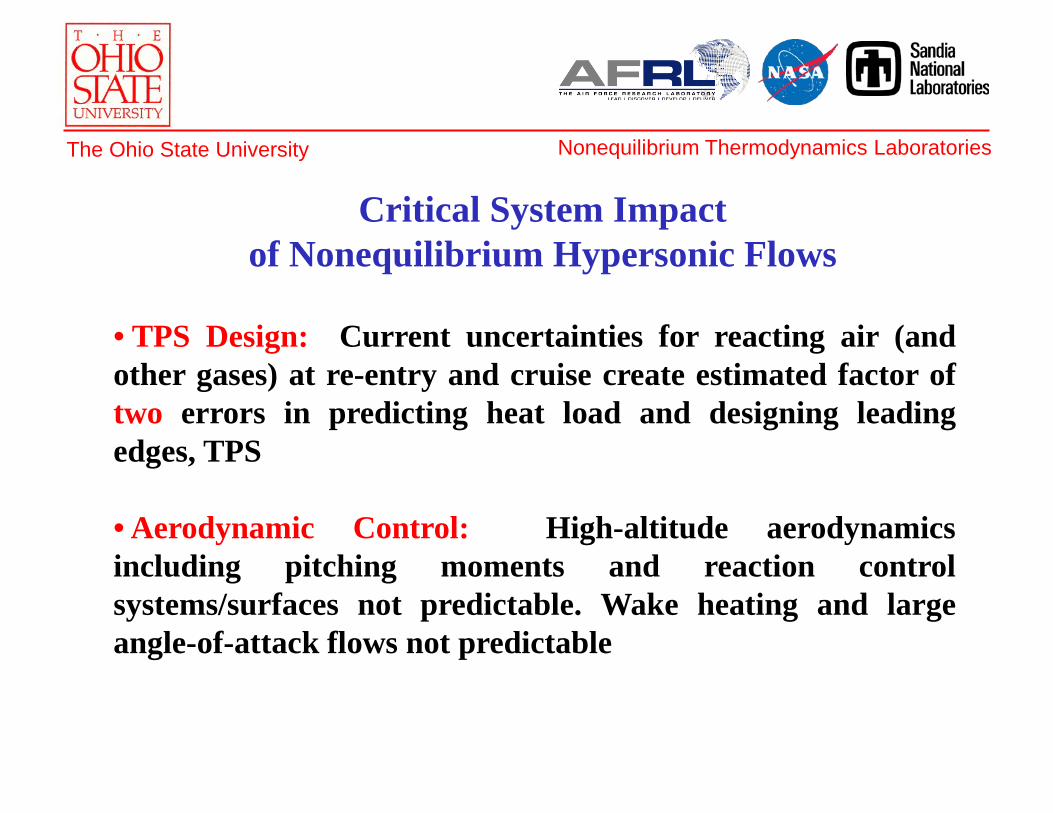
• TPS Design: Current uncertainties for reacting air (andother gases) at re-entry and cruise create estimated factor oftwo errors in predicting heat load and designing leadingedges, TPS
• Aerodynamic Control: High-altitude aerodynamicsincluding pitching moments and reaction controlsystems/surfaces not predictable. Wake heating and largeangle-of-attack flows not predictable
Critical System Impact of Nonequilibrium Hypersonic Flows
Nonequilibrium Thermodynamics Laboratories The Ohio State University
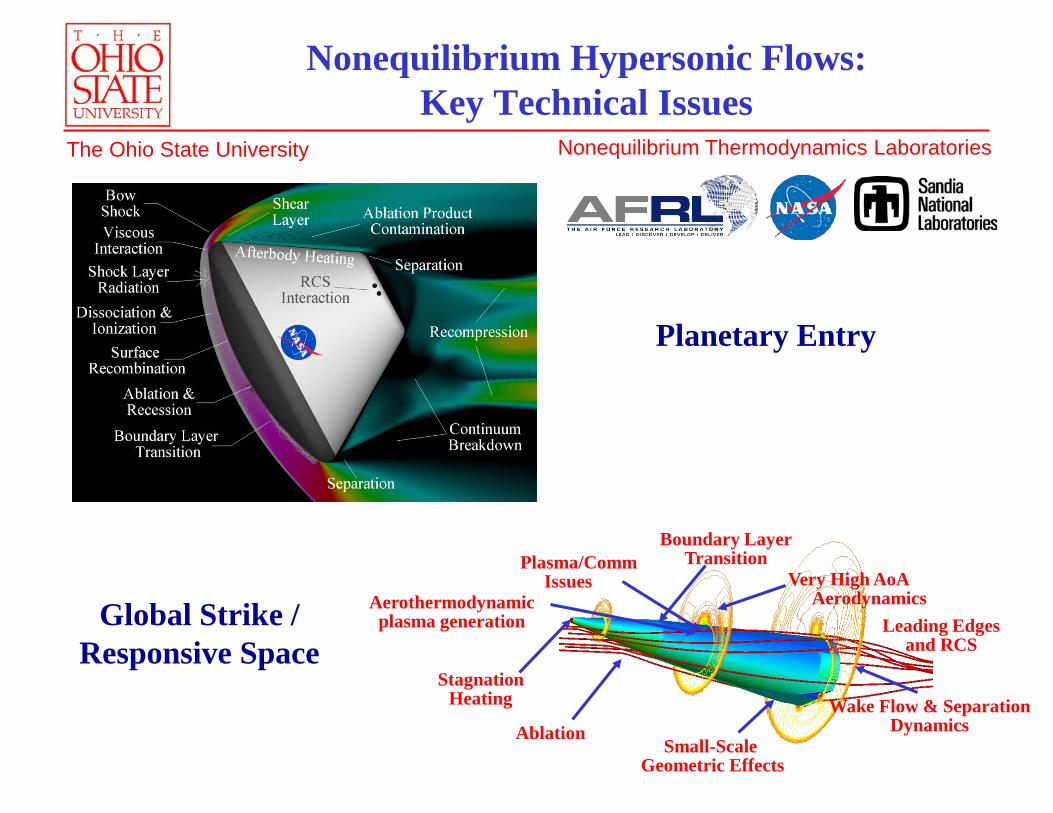
Nonequilibrium Hypersonic Flows:Key Technical Issues
Boundary LayerTransition
Very High AoA Aerodynamics
StagnationHeating
AblationSmall-Scale
Geometric Effects
Plasma/Comm Issues
Aerothermodynamicplasma generation
Wake Flow & SeparationDynamics
Leading Edges and RCS
Planetary Entry
Global Strike / Responsive Space
Nonequilibrium Thermodynamics Laboratories The Ohio State University
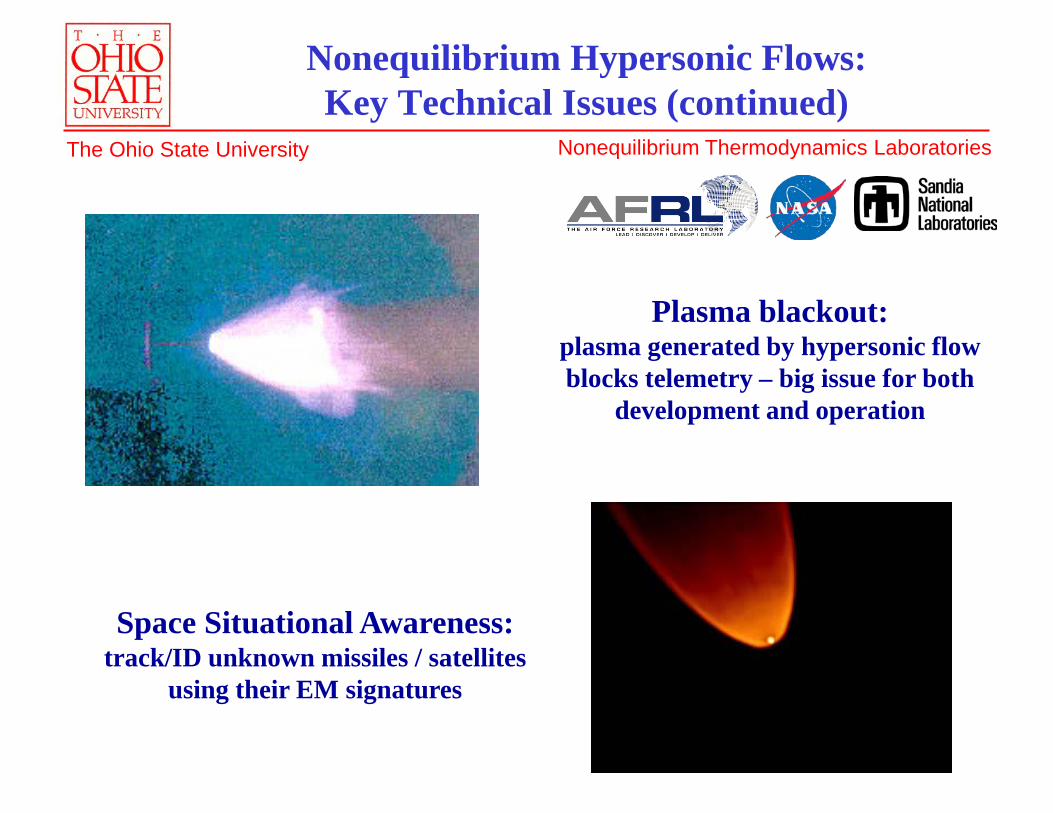
Space Situational Awareness: track/ID unknown missiles / satellites
using their EM signatures
Plasma blackout:plasma generated by hypersonic flow blocks telemetry – big issue for both
development and operation
Nonequilibrium Hypersonic Flows:Key Technical Issues (continued)
Nonequilibrium Thermodynamics Laboratories The Ohio State University
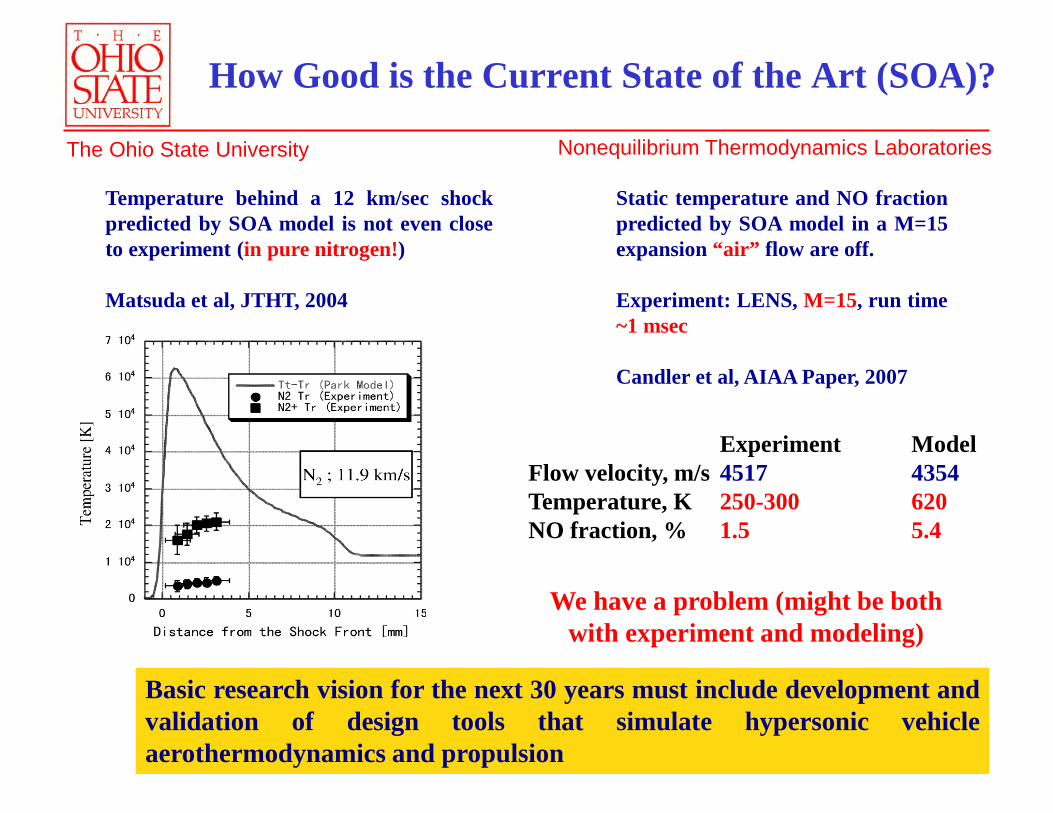
Temperature behind a 12 km/sec shockpredicted by SOA model is not even closeto experiment (in pure nitrogen!)
Matsuda et al, JTHT, 2004
Basic research vision for the next 30 years must include development andvalidation of design tools that simulate hypersonic vehicleaerothermodynamics and propulsion
Static temperature and NO fractionpredicted by SOA model in a M=15expansion “air” flow are off.
Experiment: LENS, M=15, run time~1 msec
Candler et al, AIAA Paper, 2007
How Good is the Current State of the Art (SOA)?
Experiment ModelFlow velocity, m/s 4517 4354Temperature, K 250-300 620NO fraction, % 1.5 5.4
We have a problem (might be both with experiment and modeling)
Nonequilibrium Thermodynamics Laboratories The Ohio State University
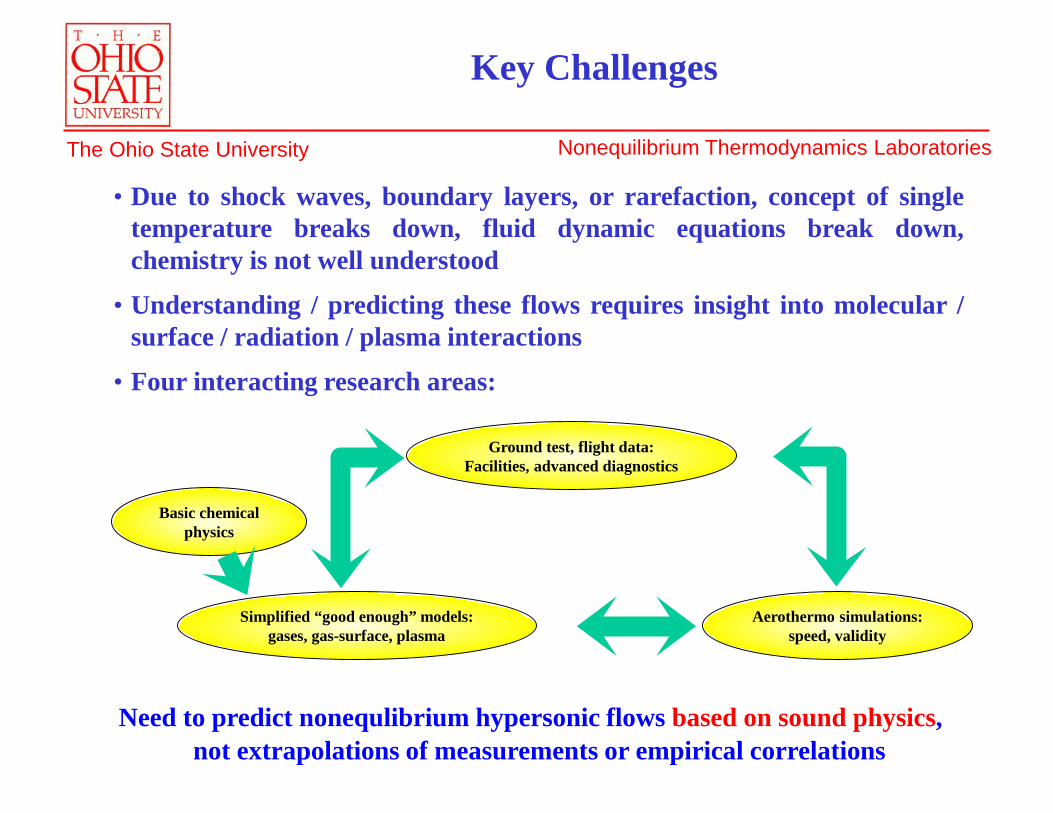
Basic chemical physics
Ground test, flight data:Facilities, advanced diagnostics
Aerothermo simulations:speed, validity
Simplified “good enough” models:gases, gas-surface, plasma
• Due to shock waves, boundary layers, or rarefaction, concept of singletemperature breaks down, fluid dynamic equations break down,chemistry is not well understood
• Understanding / predicting these flows requires insight into molecular /surface / radiation / plasma interactions
• Four interacting research areas:
Key Challenges
Need to predict nonequlibrium hypersonic flows based on sound physics, not extrapolations of measurements or empirical correlations
Nonequilibrium Thermodynamics Laboratories The Ohio State University
Foster development of both technical and human resources for theexploration, characterization and control of flows at high Machnumbers with significant thermochemical nonequilibrium.
• Development of validated physics-based tools for prediction ofheating, aerodynamics, etc of hypersonic system
• Transfer of proven, physics-based models and simulation methodsand complementary technical expertise to industry and appliedresearch
• Development and maintenance of essential human resources tocapitalize on and continue progress in this area.
Strategic (Long Term) Goals
Nonequilibrium Thermodynamics Laboratories The Ohio State University
Near term (<5 years):• Measure key air reaction rates and mechanisms at higher temperatures• Develop improved catalytic wall-boundary condition for hypersonic flow with
typical surface• Plan, design, fund facilities for well-characterized reacting hypersonic flow data• Obtain ground and/or flight data with spectral, species, or spatially-resolved
reacting hypersonic flow. Utilize/coordinate with NATO RTO results
Mid-term (5-10 years):• Measure / accurately calculate all important atmospheric (earth/other) gas
reactions at ultra-high temperatures• Validate advanced ultra-high temperature models for excited states, relaxation,
surface collisions, catalysis, ablation• Complete integrated radiation transport models; accurate ultra-high
temperature gas transport properties• Well-characterized reacting hypersonic flow data using advanced diagnostics• Fast CFD and kinetic simulation tools with integrated physics models
Objectives Defined by Nonequilibrium Thrust Panel at NASA / Air Force Workshop, June 2007
Nonequilibrium Thermodynamics Laboratories The Ohio State University
NETL Contribution: Outline
I. Ability to generate and sustain steady-state supersonic flows withstrong energy mode disequilibrium and targeted energy loading
II. In-depth flow characterization using advanced optical diagnostics
III. Physics-based, validated molecular energy transfer andnonequilibrium chemical reaction models
IV. New research program: characterization of nonequilibriumsupersonic flows, developing instrumentation for use at a nationalhypersonic facility (LENS)
V. Future research thrusts
Nonequilibrium Thermodynamics Laboratories The Ohio State University
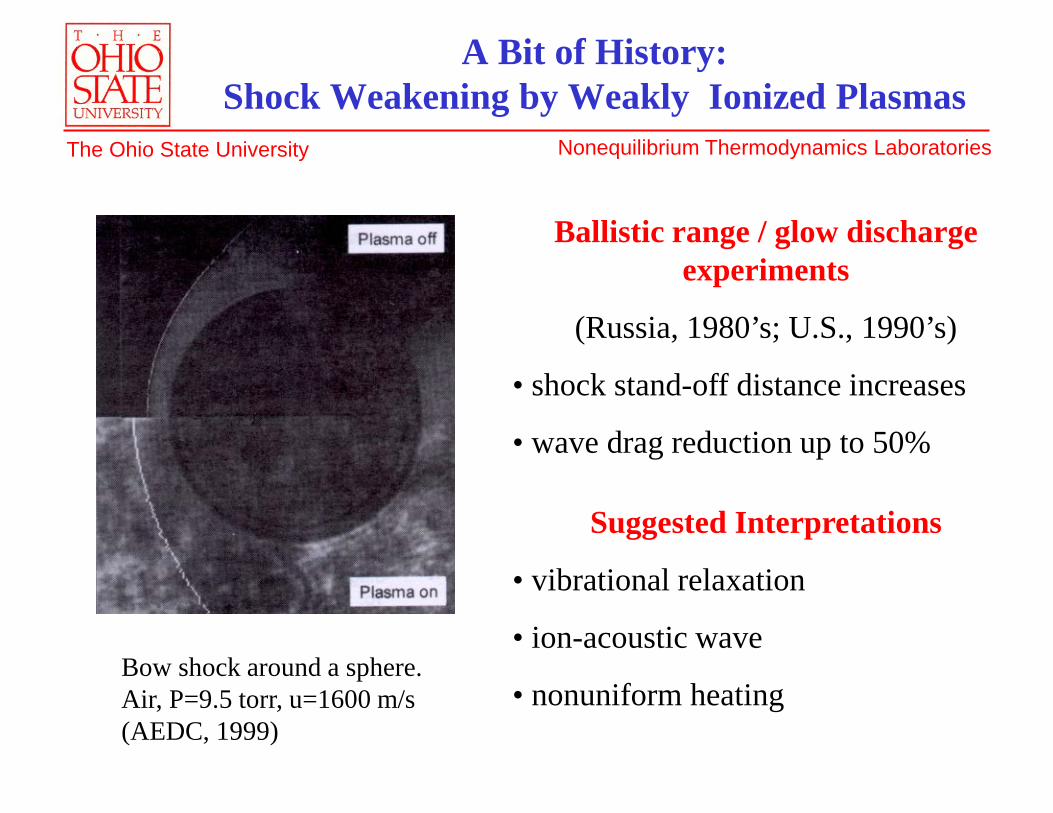
A Bit of History: Shock Weakening by Weakly Ionized Plasmas
Ballistic range / glow discharge experiments
(Russia, 1980’s; U.S., 1990’s)
• shock stand-off distance increases
• wave drag reduction up to 50%
Suggested Interpretations
• vibrational relaxation
• ion-acoustic wave
• nonuniform heatingBow shock around a sphere. Air, P=9.5 torr, u=1600 m/s (AEDC, 1999)
Nonequilibrium Thermodynamics Laboratories The Ohio State University
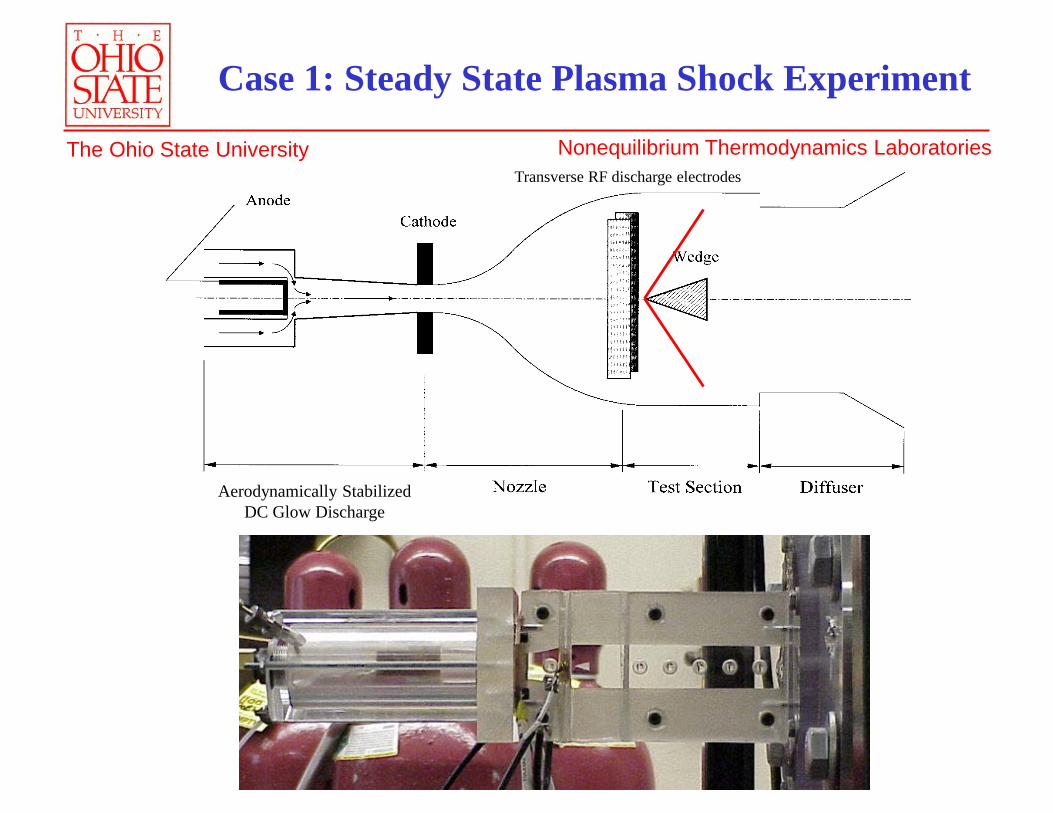
Case 1: Steady State Plasma Shock Experiment
Aerodynamically Stabilized DC Glow Discharge
Transverse RF discharge electrodes
Nonequilibrium Thermodynamics Laboratories The Ohio State University
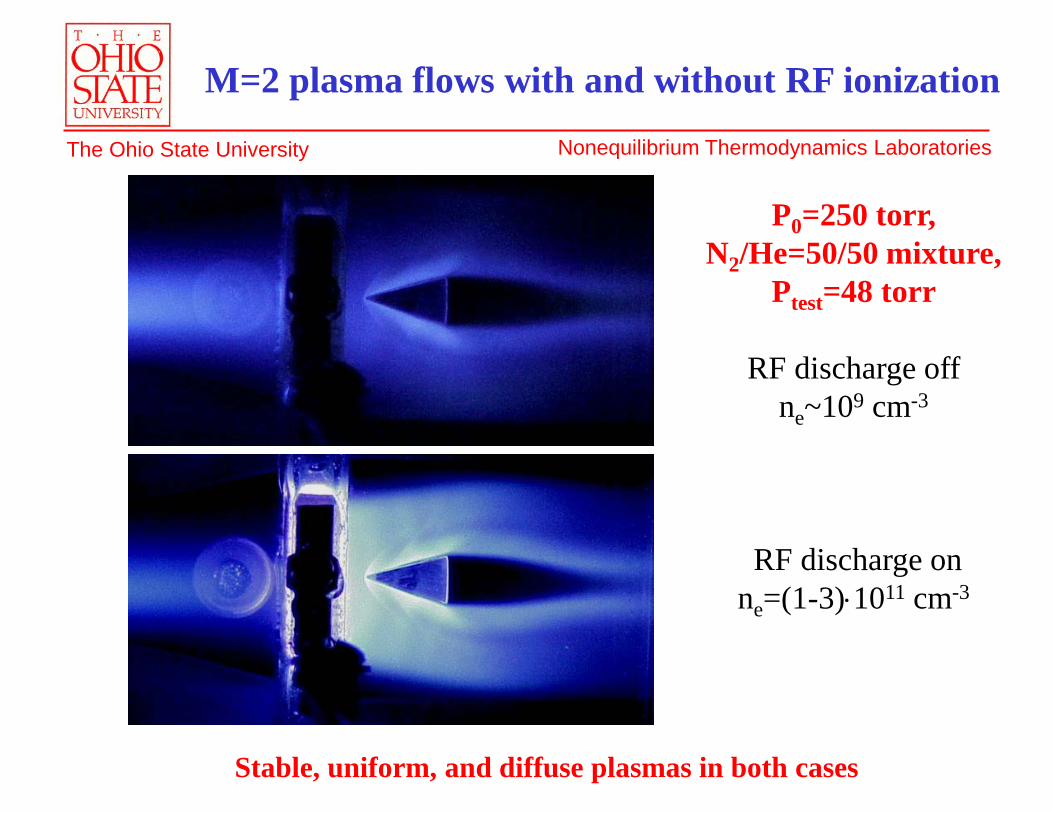
P0=250 torr,N2/He=50/50 mixture,
Ptest=48 torr
RF discharge offne~109 cm-3
RF discharge onne=(1-3)⋅1011 cm-3
M=2 plasma flows with and without RF ionization
Stable, uniform, and diffuse plasmas in both cases
Nonequilibrium Thermodynamics Laboratories The Ohio State University
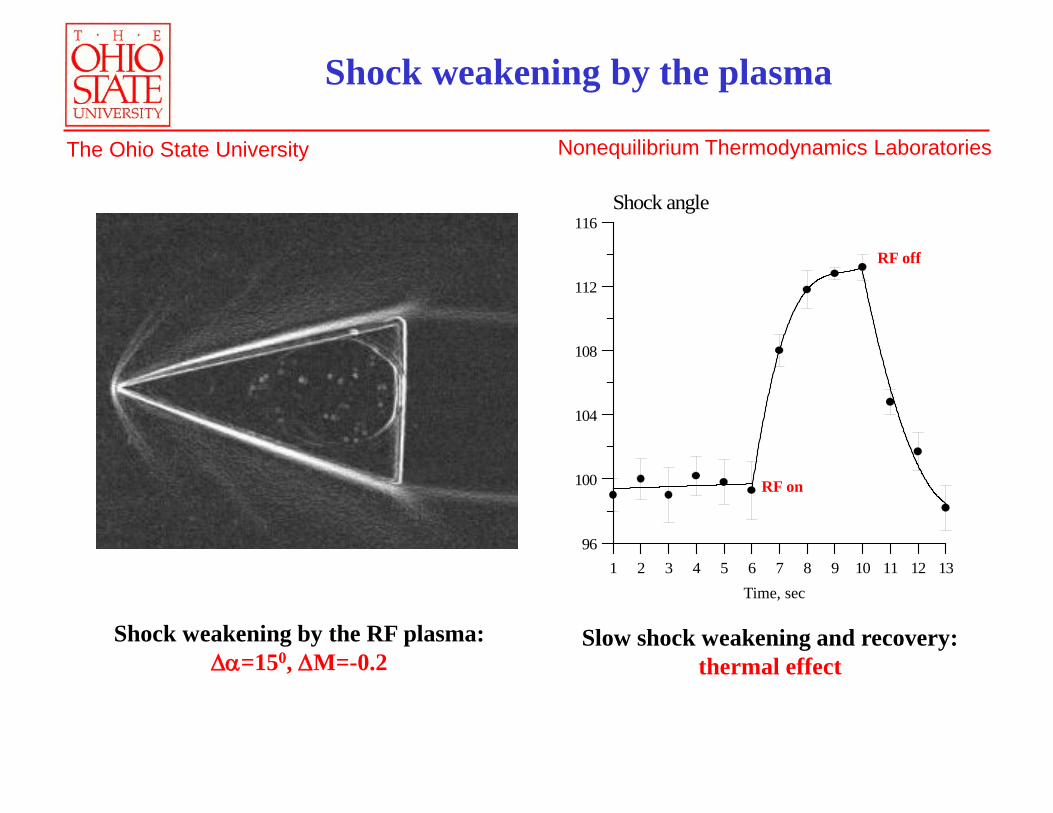
Shock weakening by the plasma
Shock weakening by the RF plasma: ∆α=150, ∆M=-0.2
1 2 3 4 5 6 7 8 9 10 11 12 1396
100
104
108
112
116
Frame number
Shock angle
Time, sec
RF on
RF off
Slow shock weakening and recovery: thermal effect
Nonequilibrium Thermodynamics Laboratories The Ohio State University
0 100 200 300 400-10.0
-8.0
-6.0
-4.0
J'(J'+1)
ln[Iem/(J'+J"+1)]
230 W DC
T=190 K (J'=1-12)
T=221 K (J'=12-19)
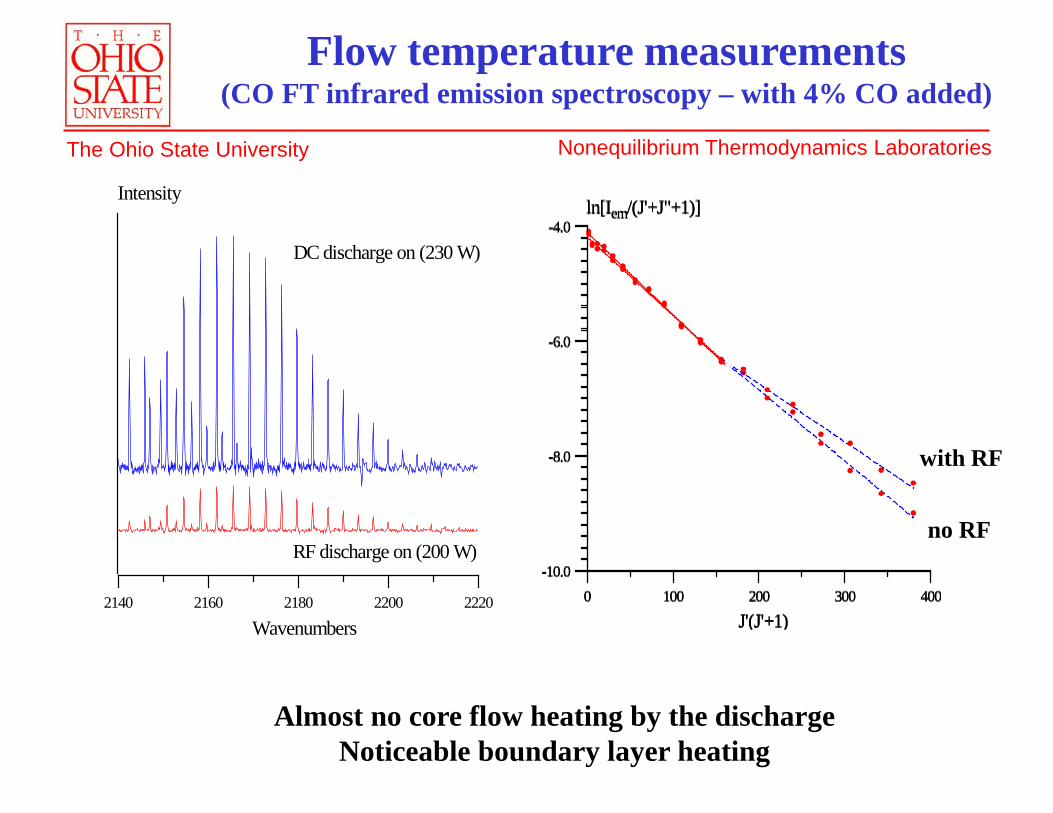
Almost no core flow heating by the dischargeNoticeable boundary layer heating
2140 2160 2180 2200 2220
Wavenumbers
Intensity
DC discharge on (230 W)
RF discharge on (200 W)
Flow temperature measurements(CO FT infrared emission spectroscopy – with 4% CO added)
0 100 200 300 400-10.0
-8.0
-6.0
-4.0
J'(J'+1)
ln[Iem/(J'+J"+1)]
230 W DC, 200 W RF
T=200 K (J'=1-12)
T=271 K (J'=12-19)
with RF
no RF
Nonequilibrium Thermodynamics Laboratories The Ohio State University
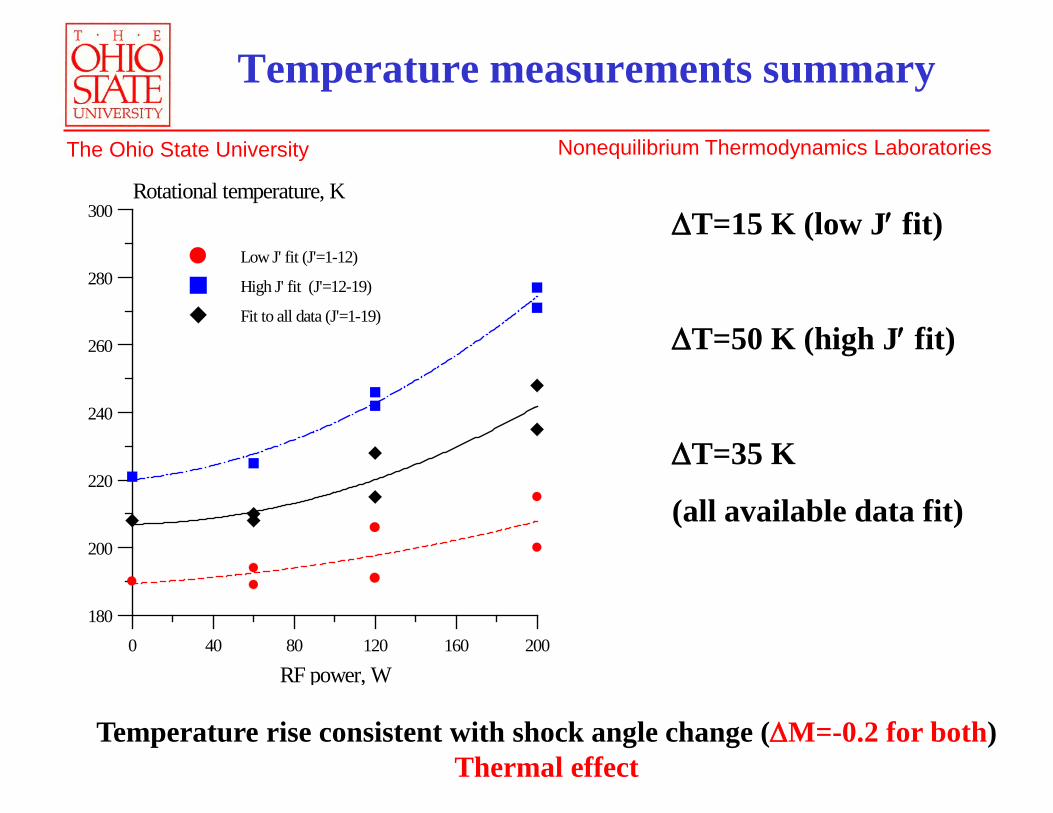
Temperature measurements summary
0 40 80 120 160 200180
200
220
240
260
280
300
RF power, W
Rotational temperature, K
Low J' fit (J'=1-12)
High J' fit (J'=12-19)
Fit to all data (J'=1-19)
∆T=15 K (low J′ fit)
∆T=50 K (high J′ fit)
∆T=35 K
(all available data fit)
Temperature rise consistent with shock angle change (∆M=-0.2 for both)Thermal effect
Nonequilibrium Thermodynamics Laboratories The Ohio State University
Flow
DC electrode block
Pulsed electrode block
Optical access window
Static pressure port
Optical access window
Static pressure port
MTV pump laser beam
B
Magnet pole
Flow
east
west
down
up
Sustainer current
Decelerating force Accelerating force
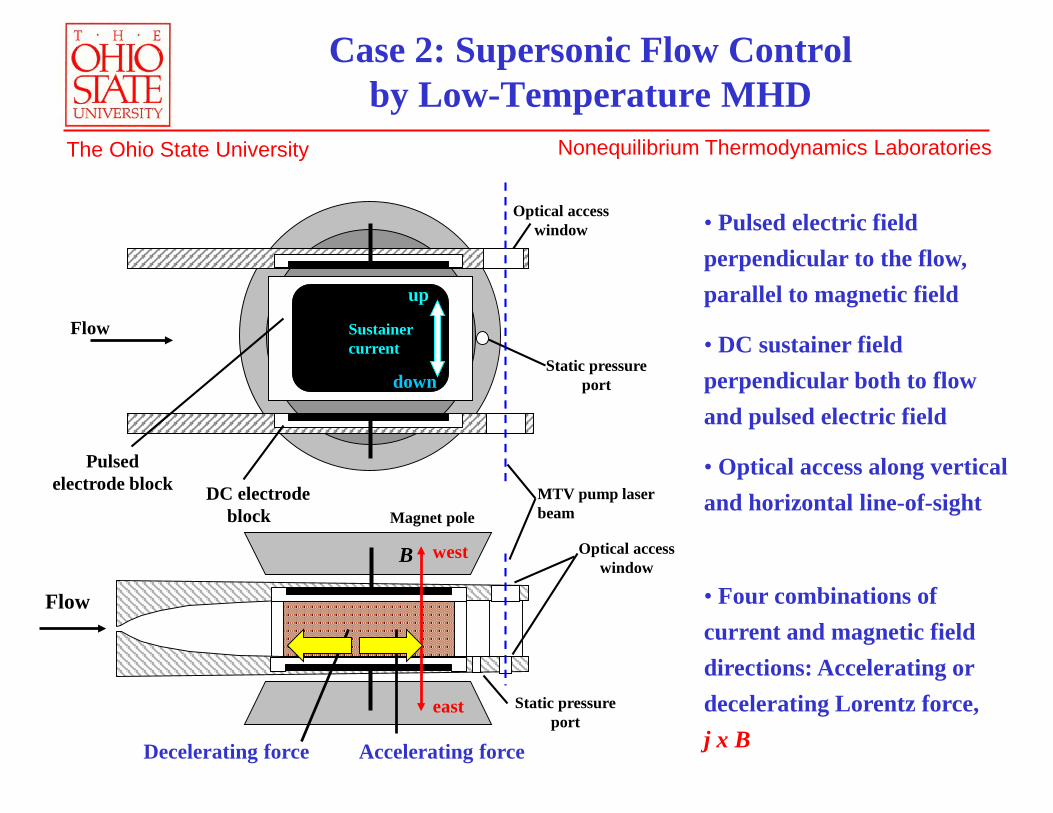
Case 2: Supersonic Flow Control by Low-Temperature MHD
• Pulsed electric field perpendicular to the flow, parallel to magnetic field
• DC sustainer field perpendicular both to flow and pulsed electric field
• Optical access along vertical and horizontal line-of-sight
• Four combinations of current and magnetic field directions: Accelerating or decelerating Lorentz force, j x B
Nonequilibrium Thermodynamics Laboratories The Ohio State University
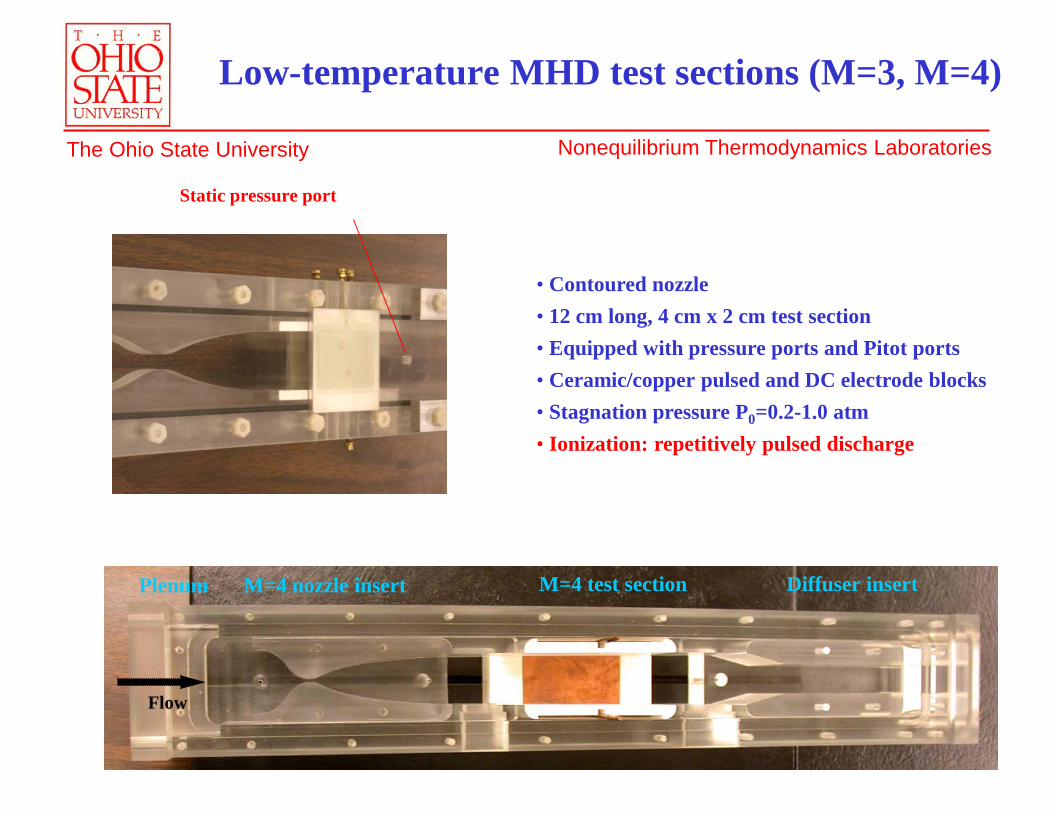
Low-temperature MHD test sections (M=3, M=4)
• Contoured nozzle• 12 cm long, 4 cm x 2 cm test section• Equipped with pressure ports and Pitot ports• Ceramic/copper pulsed and DC electrode blocks• Stagnation pressure P0=0.2-1.0 atm• Ionization: repetitively pulsed discharge
Static pressure port
Plenum M=4 nozzle insert M=4 test section Diffuser insert
Flow
Nonequilibrium Thermodynamics Laboratories The Ohio State University
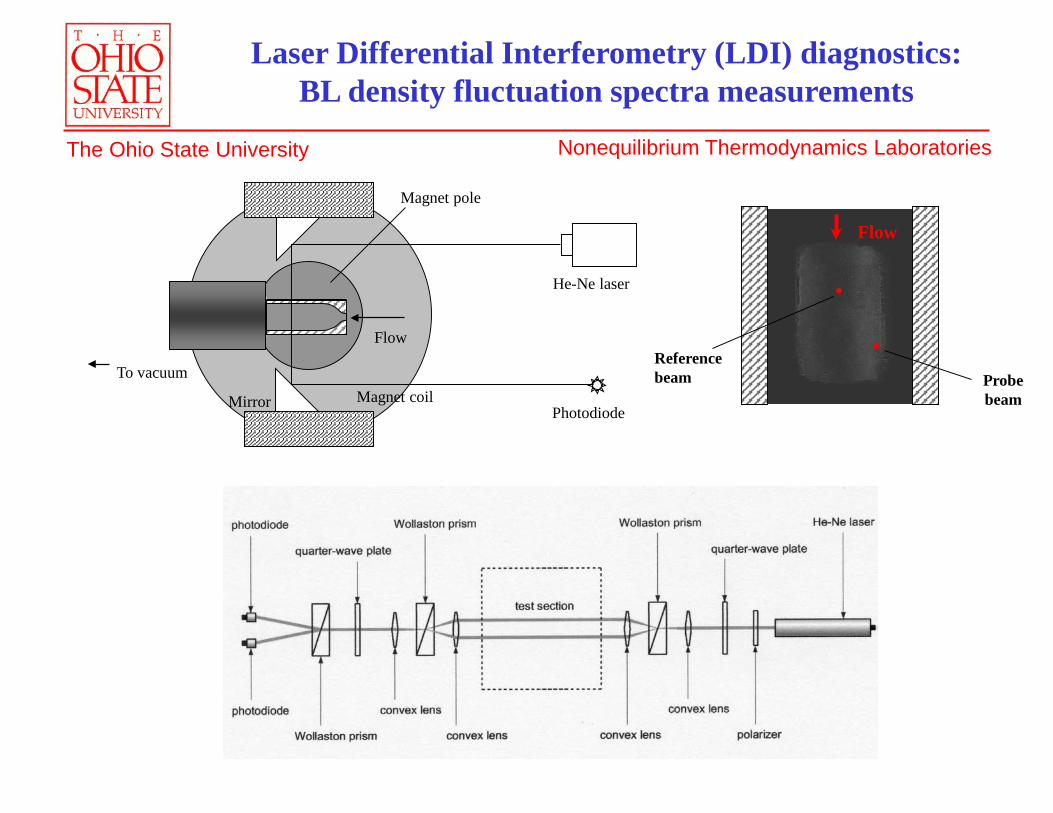
To vacuum
Mirror Magnet coil
Flow
He-Ne laser
Magnet pole
Photodiode
Laser Differential Interferometry (LDI) diagnostics: BL density fluctuation spectra measurements
Flow
Reference beam Probe
beam
Nonequilibrium Thermodynamics Laboratories The Ohio State University
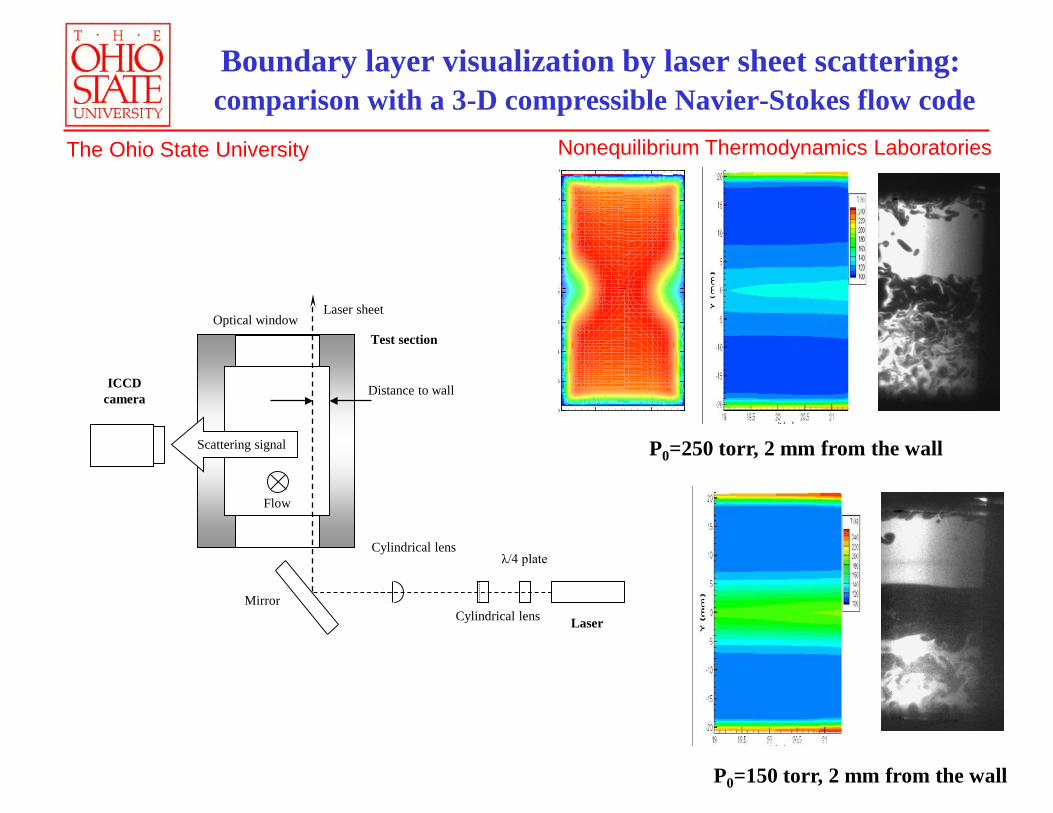
P0=150 torr, 2 mm from the wall
Boundary layer visualization by laser sheet scattering:comparison with a 3-D compressible Navier-Stokes flow code
P0=250 torr, 2 mm from the wall
0
5
1
5
2
0
5
1
5
2
0
5
1
5
2
0
5
1
5
2
Laser
λ/4 plate
Cylindrical lens
Cylindrical lens
ICCD camera
Laser sheet
Mirror
Optical window
Flow
Distance to wall
Test section
Scattering signal
Nonequilibrium Thermodynamics Laboratories The Ohio State University
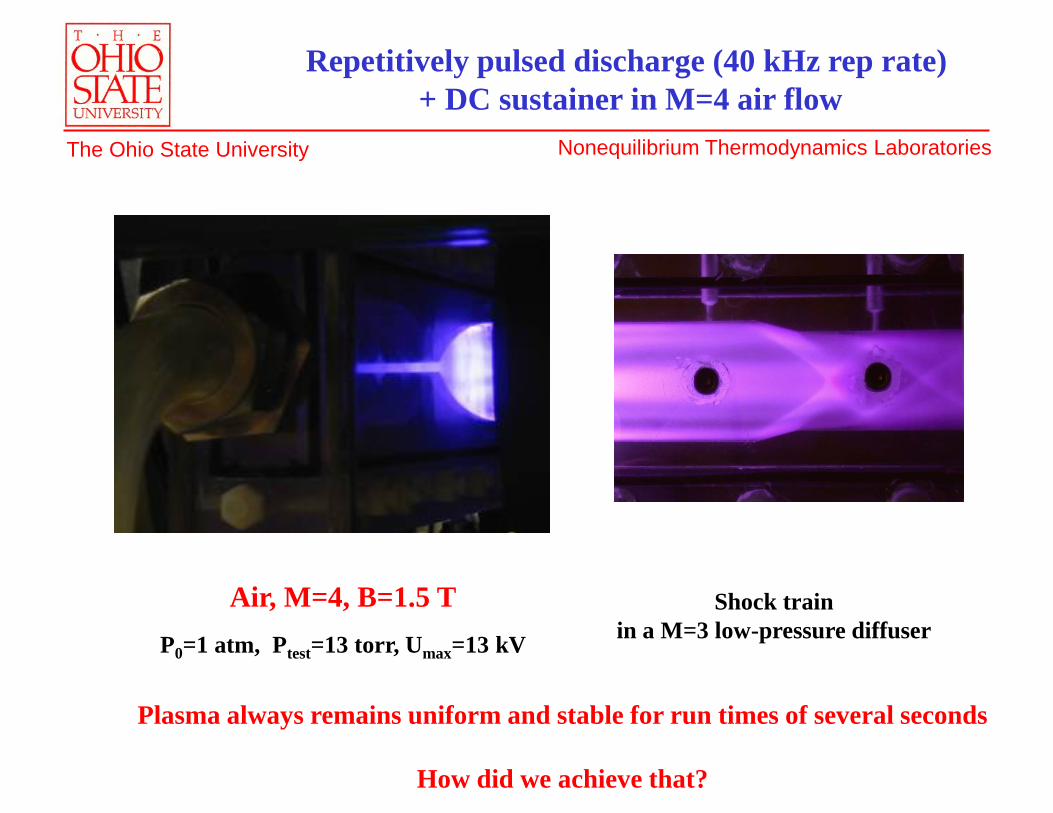
Air, M=4, B=1.5 TP0=1 atm, Ptest=13 torr, Umax=13 kV
Repetitively pulsed discharge (40 kHz rep rate)+ DC sustainer in M=4 air flow
Plasma always remains uniform and stable for run times of several seconds
How did we achieve that?
Shock train in a M=3 low-pressure diffuser
Nonequilibrium Thermodynamics Laboratories The Ohio State University
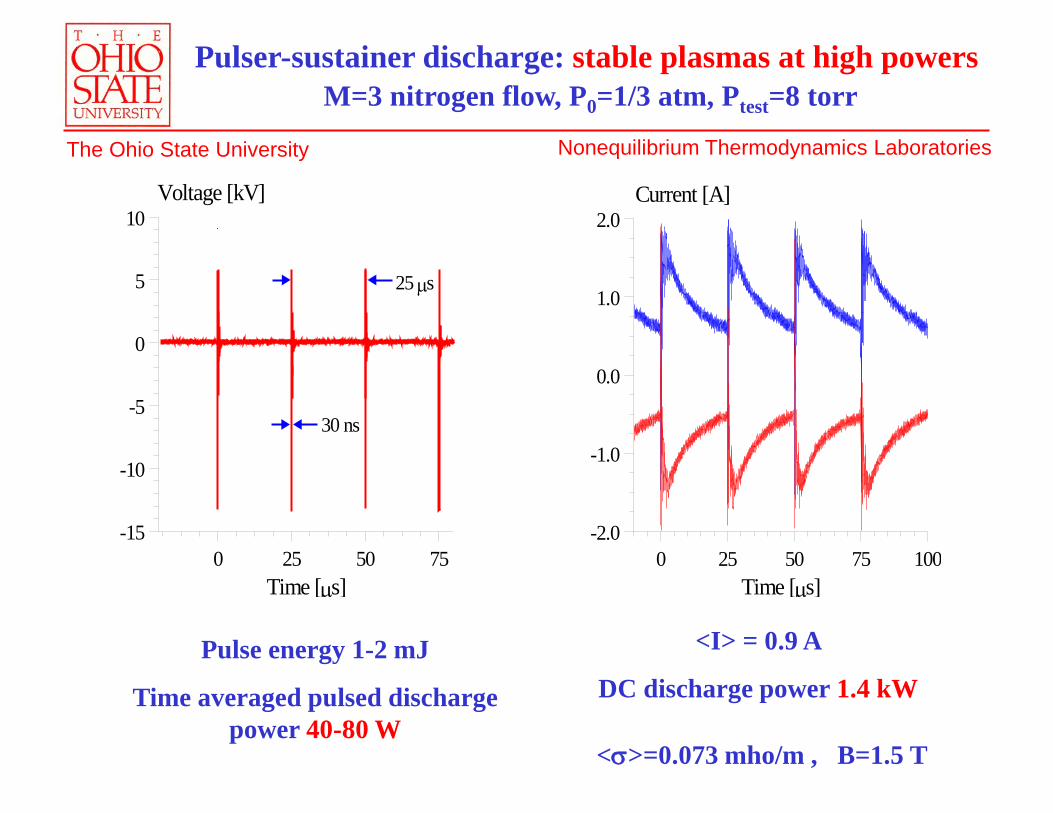
Pulser-sustainer discharge: stable plasmas at high powersM=3 nitrogen flow, P0=1/3 atm, Ptest=8 torr
<I> = 0.9 A
DC discharge power 1.4 kW
0 25 50 75 100Time [µs]
-2.0
-1.0
0.0
1.0
2.0Current [A]
<σ>=0.073 mho/m , B=1.5 T
Pulse energy 1-2 mJ
Time averaged pulsed discharge power 40-80 W
0 25 50 75Time [µs]
-15
-10
-5
0
5
10Voltage [kV]
25 µs
30 ns
Nonequilibrium Thermodynamics Laboratories The Ohio State University
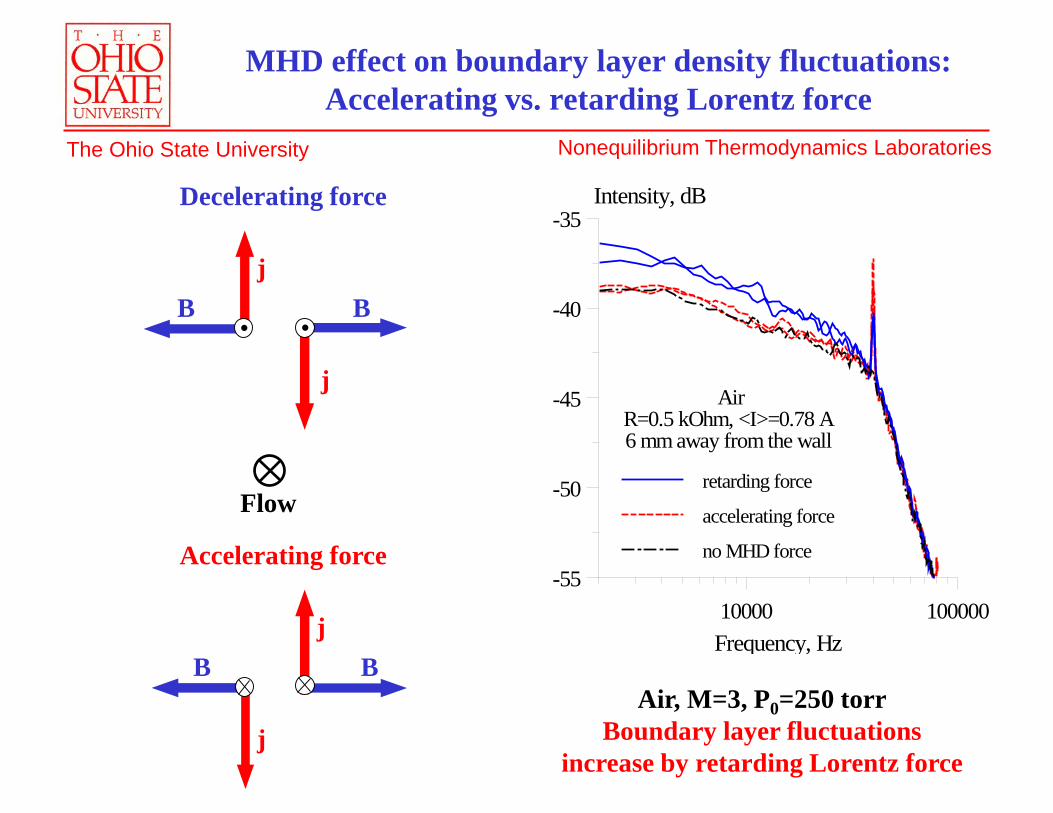
MHD effect on boundary layer density fluctuations:Accelerating vs. retarding Lorentz force
10000 100000Frequency, Hz
-55
-50
-45
-40
-35Intensity, dB
AirR=0.5 kOhm, <I>=0.78 A6 mm away from the wall
retarding force
accelerating force
no MHD force
Air, M=3, P0=250 torrBoundary layer fluctuations
increase by retarding Lorentz force
Decelerating force
Bj
B
j
Accelerating force
jBB
j
Flow
Nonequilibrium Thermodynamics Laboratories The Ohio State University
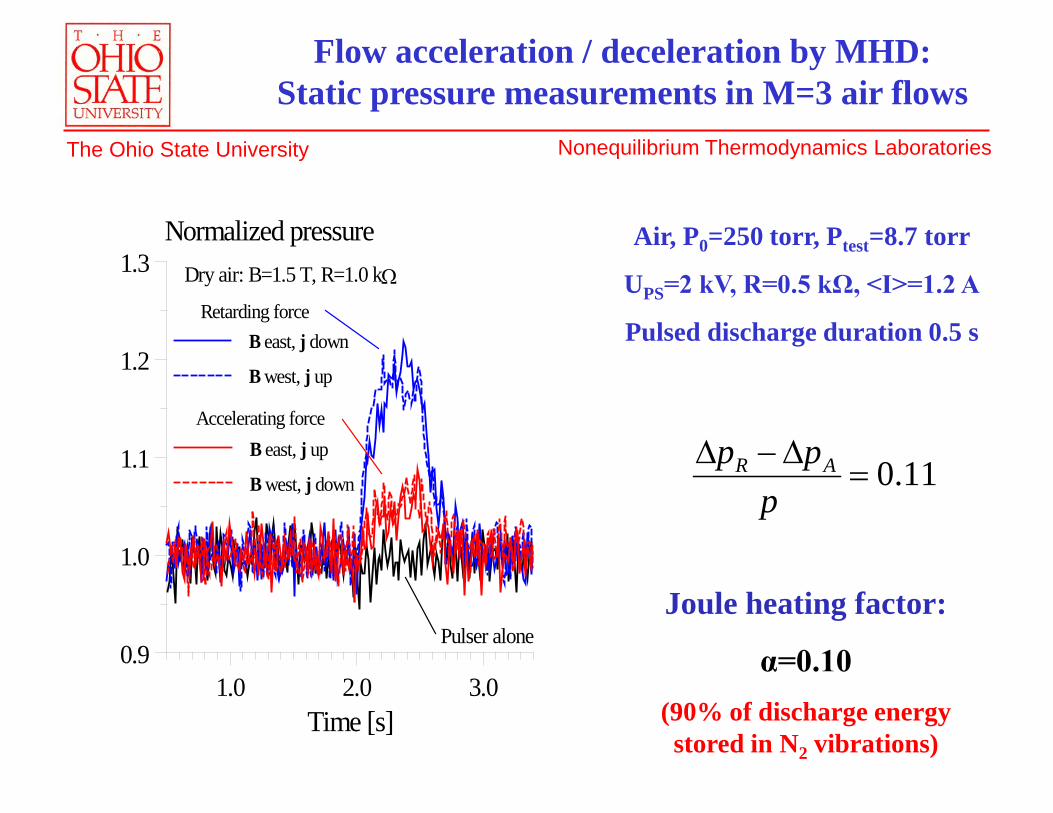
Air, P0=250 torr, Ptest=8.7 torr
UPS=2 kV, R=0.5 kΩ, <I>=1.2 A
Pulsed discharge duration 0.5 s
Flow acceleration / deceleration by MHD:Static pressure measurements in M=3 air flows
Joule heating factor:
α=0.10(90% of discharge energy stored in N2 vibrations)
11.0=∆−∆
ppp AR
1.0 2.0 3.0Time [s]
0.9
1.0
1.1
1.2
1.3Normalized pressure
Retarding force
Accelerating force
Pulser alone
Dry air: B=1.5 T, R=1.0 kΩ
B east, j down
B west, j up
B east, j up
B west, j down
Nonequilibrium Thermodynamics Laboratories The Ohio State University
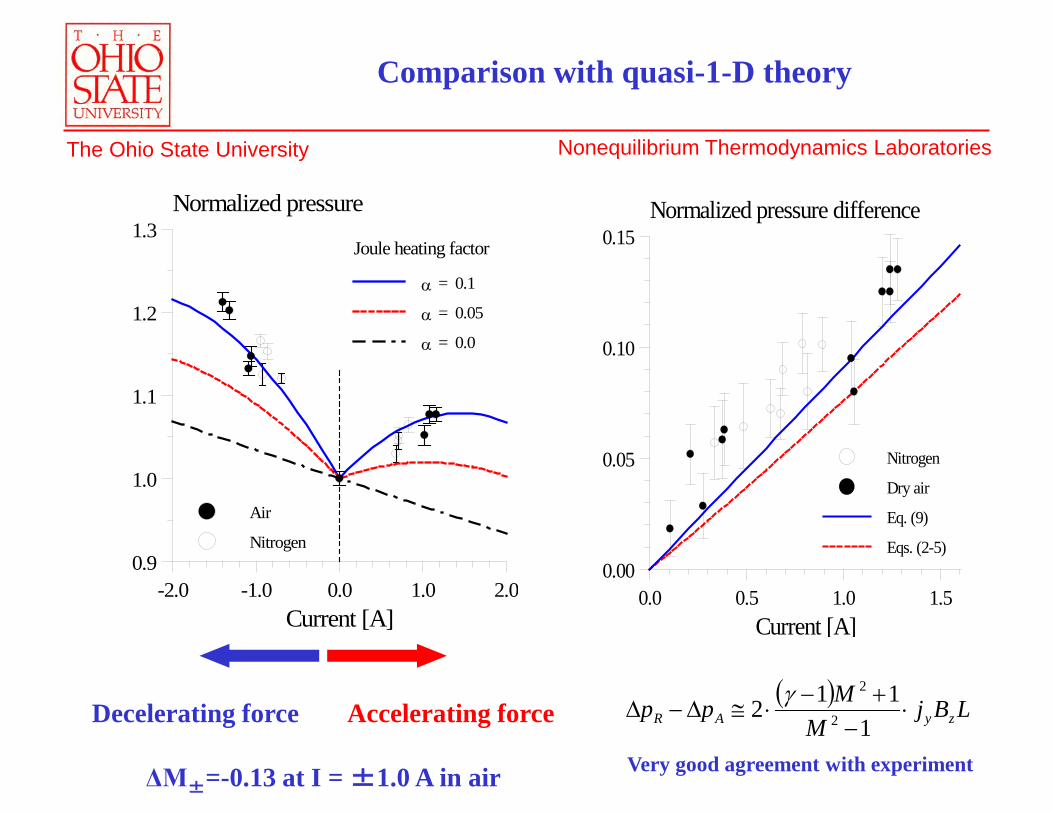
Comparison with quasi-1-D theory
Decelerating force Accelerating force
ΔM±=-0.13 at I = ±1.0 A in air
-2.0 -1.0 0.0 1.0 2.0Current [A]
0.9
1.0
1.1
1.2
1.3Normalized pressure
Air
Nitrogen
Joule heating factor
α = 0.1
α = 0.05
α = 0.0
0.0 0.5 1.0 1.5Current [A]
0.00
0.05
0.10
0.15Normalized pressure difference
Nitrogen
Dry air
Eq. (9)
Eqs. (2-5)
( ) LBjM
Mpp zyAR ⋅−
+−⋅≅∆−∆
1112 2
2γ
Very good agreement with experiment
Nonequilibrium Thermodynamics Laboratories The Ohio State University
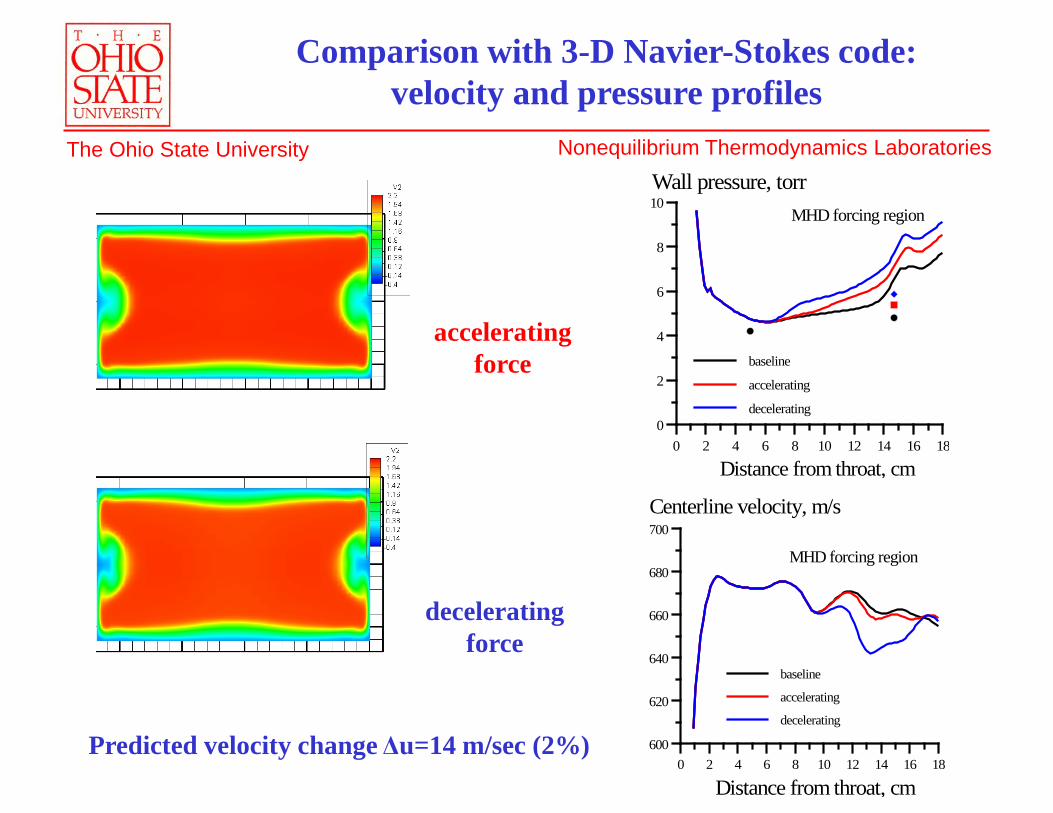
Comparison with 3-D Navier-Stokes code:velocity and pressure profiles
0 2 4 6 8 10 12 14 16 180
2
4
6
8
10Wall pressure, torr
Distance from throat, cm
MHD forcing region
baseline
accelerating
decelerating
accelerating force
decelerating force
Predicted velocity change Δu=14 m/sec (2%)0 2 4 6 8 10 12 14 16 18
600
620
640
660
680
700Centerline velocity, m/s
Distance from throat, cm
MHD forcing region
baseline
accelerating
decelerating
Nonequilibrium Thermodynamics Laboratories The Ohio State University
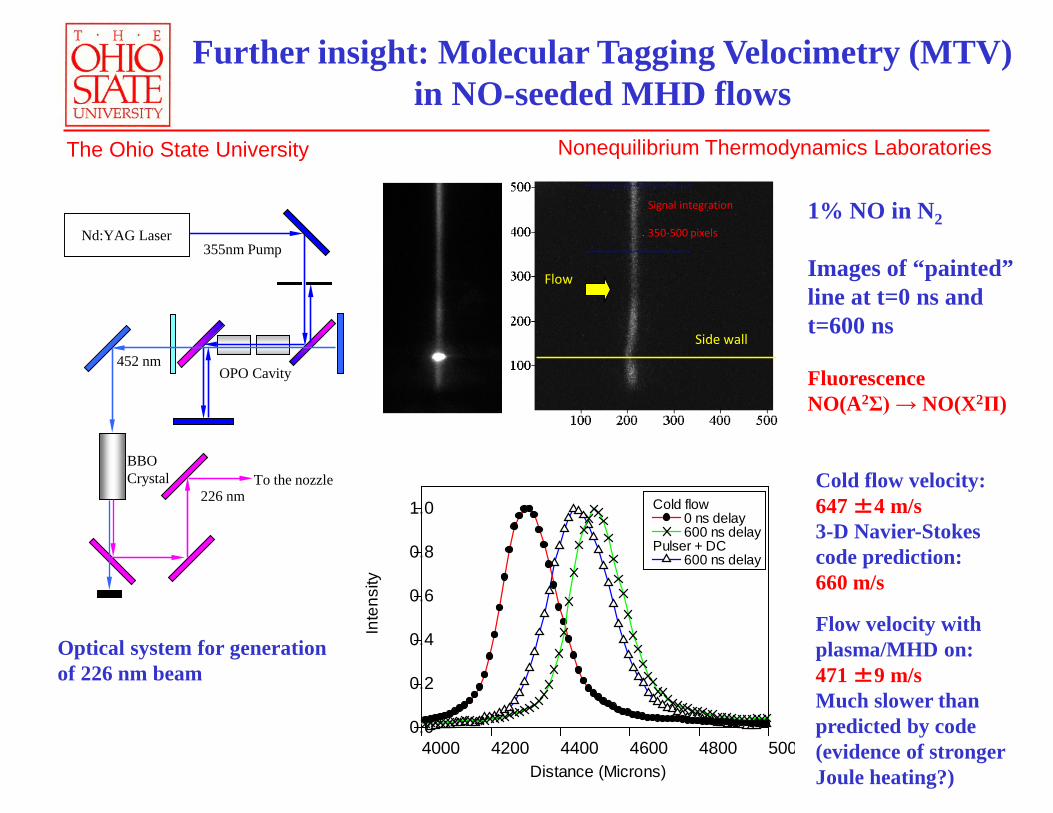
Further insight: Molecular Tagging Velocimetry (MTV) in NO-seeded MHD flows
BBOCrystal
452 nm
226 nm
OPO Cavity
355nm PumpNd:YAG Laser
To the nozzle
Optical system for generation of 226 nm beam
1% NO in N2
Images of “painted” line at t=0 ns and t=600 ns
FluorescenceNO(A2Σ) → NO(X2Π)
Cold flow velocity: 647 ±4 m/s3-D Navier-Stokes code prediction:660 m/s
Side wall
Flow
Signal integration
350-500 pixels
4000 4200 4400 4600 4800 5000.0
0.2
0.4
0.6
0.8
1.0
Inte
nsity
Distance (Microns)
Cold flow 0 ns delay 600 ns delay
Pulser + DC 600 ns delay
Flow velocity with plasma/MHD on: 471 ±9 m/sMuch slower than predicted by code (evidence of stronger Joule heating?)
Nonequilibrium Thermodynamics Laboratories The Ohio State University
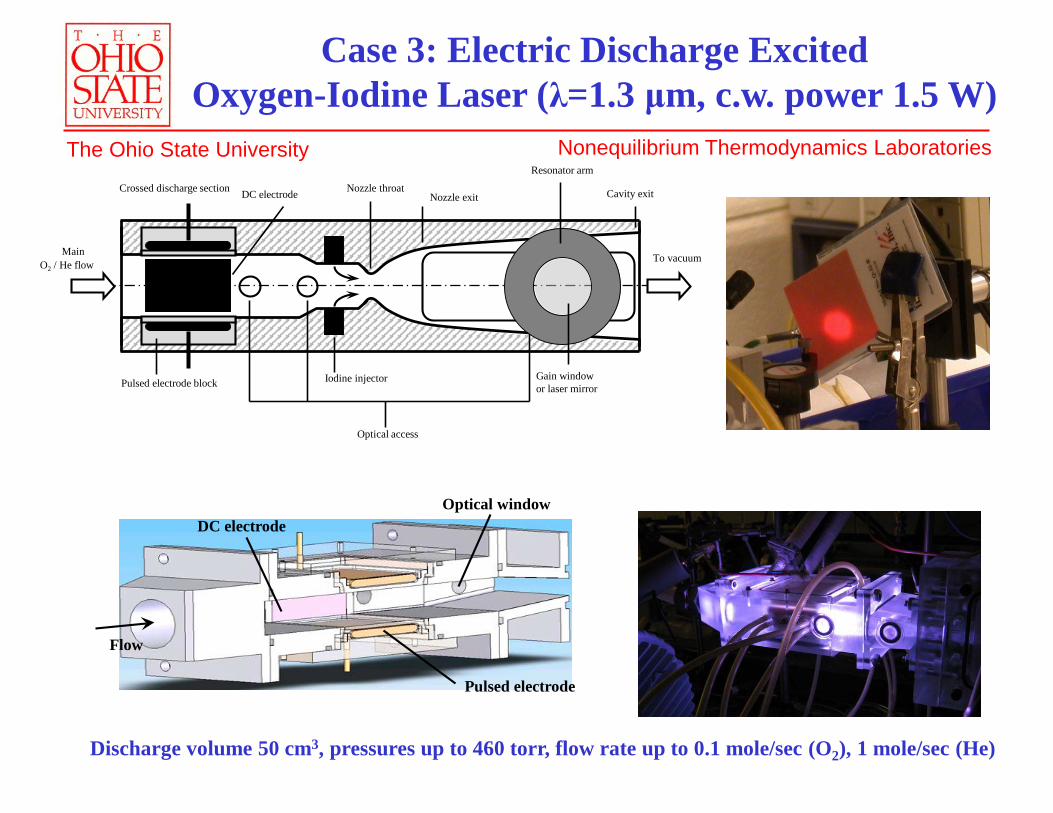
Discharge volume 50 cm3, pressures up to 460 torr, flow rate up to 0.1 mole/sec (O2), 1 mole/sec (He)
Pulsed electrode
DC electrodeOptical window
Flow
Case 3: Electric Discharge Excited Oxygen-Iodine Laser (λ=1.3 μm, c.w. power 1.5 W)
Nozzle throat
Optical access
Nozzle exit
Iodine injector
Cavity exitCrossed discharge section
Pulsed electrode block
Main O2 / He flow To vacuum
DC electrode
Resonator arm
Gain window or laser mirror
Nonequilibrium Thermodynamics Laboratories The Ohio State University
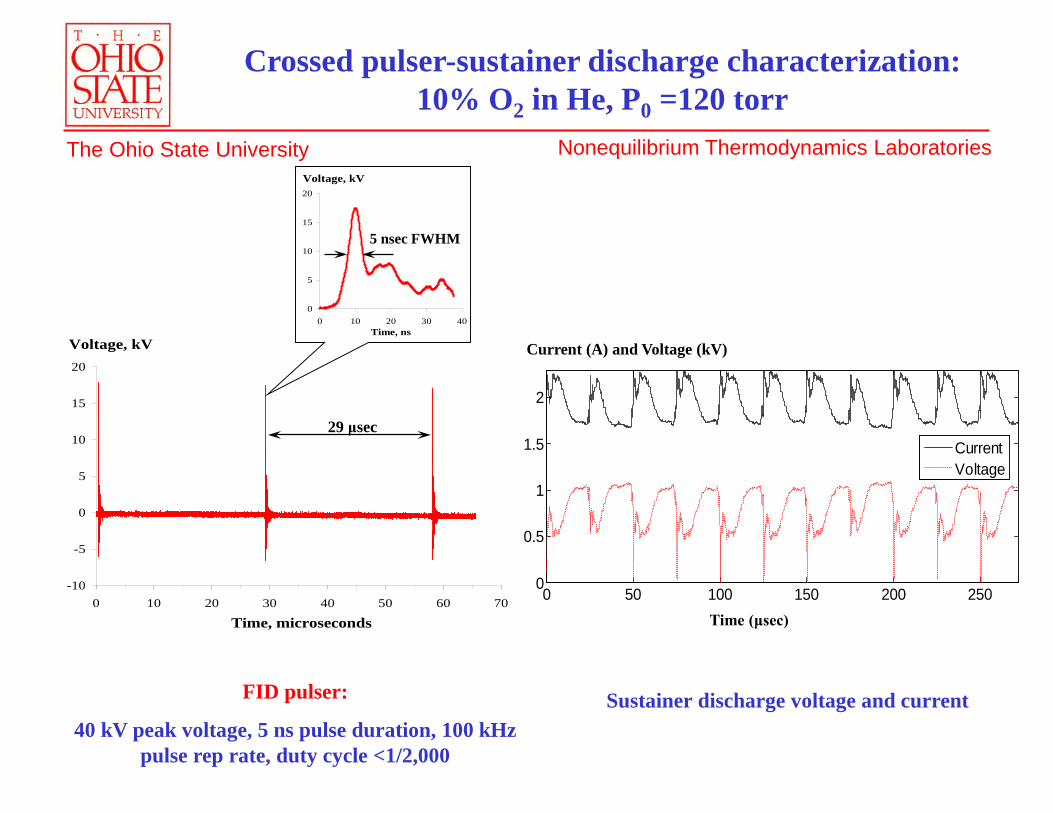
FID pulser:
40 kV peak voltage, 5 ns pulse duration, 100 kHz pulse rep rate, duty cycle <1/2,000
Sustainer discharge voltage and current
Current (A) and Voltage (kV)
0 50 100 150 200 2500
0.5
1
1.5
2
Time (s)
CurrentVoltage
Time (μsec)
-10
-5
0
5
10
15
20
0 10 20 30 40 50 60 70
Time, microseconds
Voltage, kV
29 μsec
0
5
10
15
20
0 10 20 30 40Time, ns
Voltage, kV
5 nsec FWHM
Crossed pulser-sustainer discharge characterization:10% O2 in He, P0 =120 torr
Nonequilibrium Thermodynamics Laboratories The Ohio State University
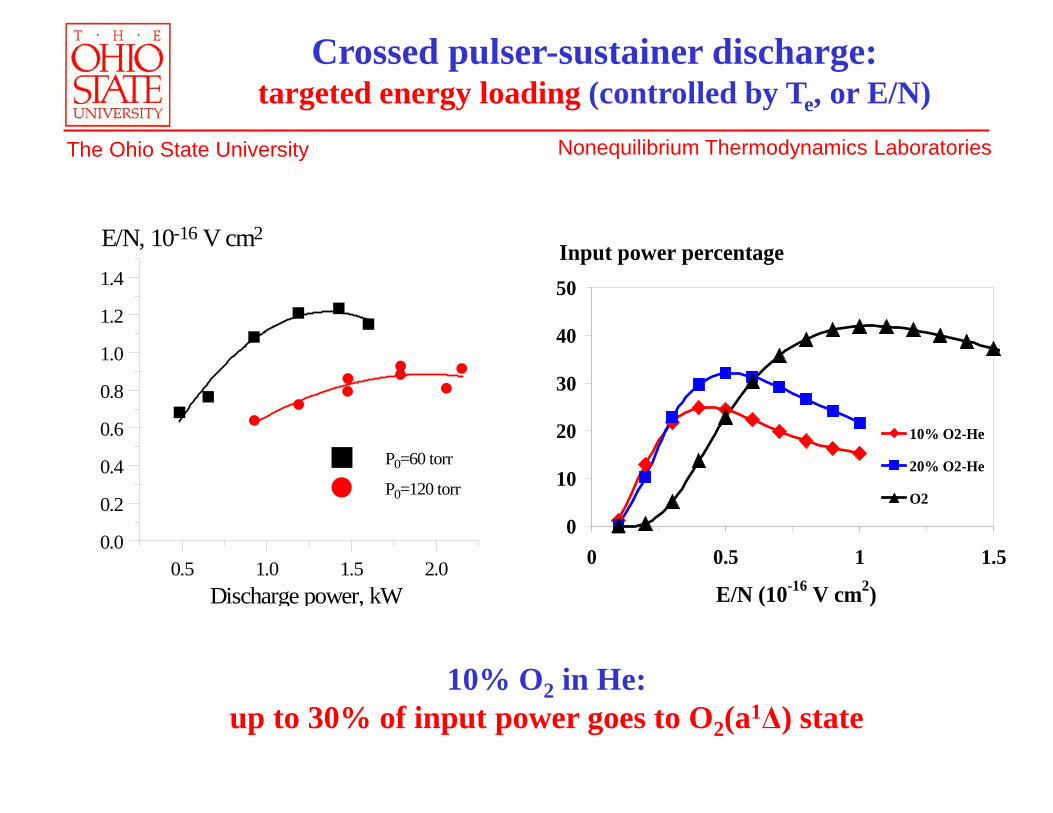
Input power percentage
0
10
20
30
40
50
0 0.5 1 1.5
E/N (10-16 V cm2)
10% O2-He
20% O2-He
O2
Crossed pulser-sustainer discharge: targeted energy loading (controlled by Te, or E/N)
10% O2 in He:up to 30% of input power goes to O2(a1Δ) state
0.5 1.0 1.5 2.00.0
0.2
0.4
0.6
0.8
1.0
1.2
1.4
Discharge power, kW
E/N, 10-16 V cm2
P0=60 torr
P0=120 torr
Nonequilibrium Thermodynamics Laboratories The Ohio State University
νhII
IXOIaO
IIXOnIaOn
eaOeXO
+→
+Σ↔+∆
++Σ⋅→+∆⋅
+∆→+Σ
*
*32
12
322
12
12
32
)()(
)()(
)()(
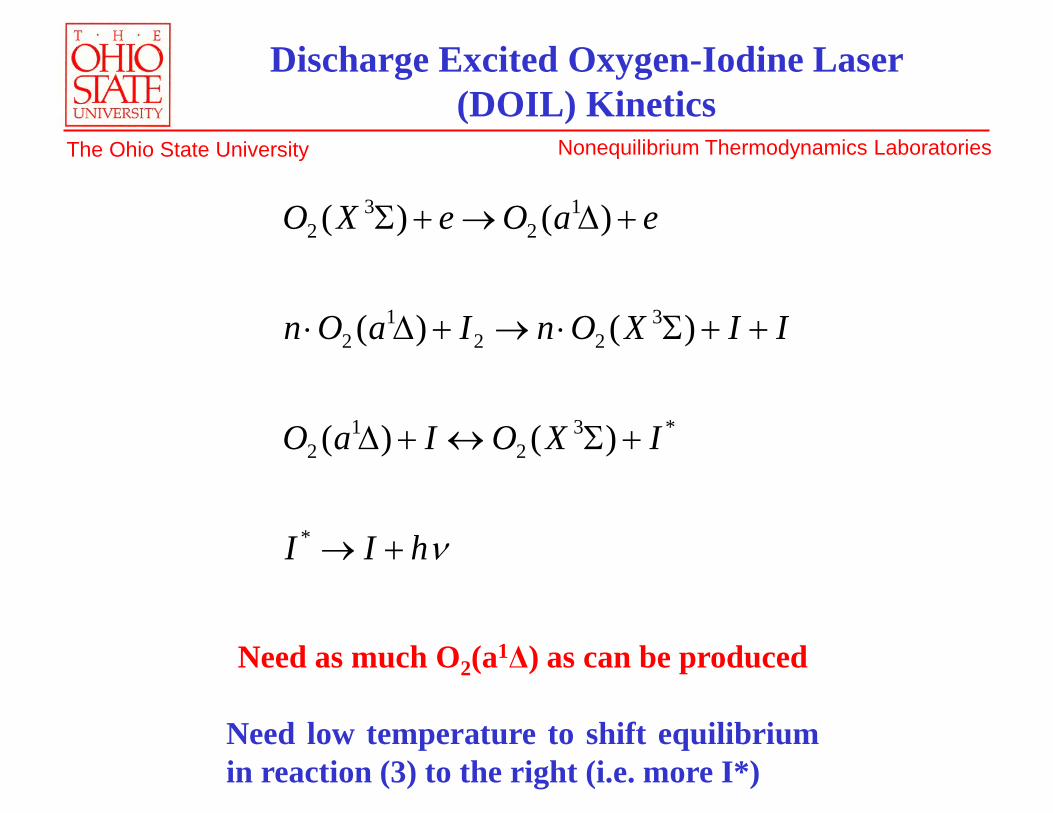
Discharge Excited Oxygen-Iodine Laser (DOIL) Kinetics
Need as much O2(a1Δ) as can be produced
Need low temperature to shift equilibriumin reaction (3) to the right (i.e. more I*)
Nonequilibrium Thermodynamics Laboratories The Ohio State University
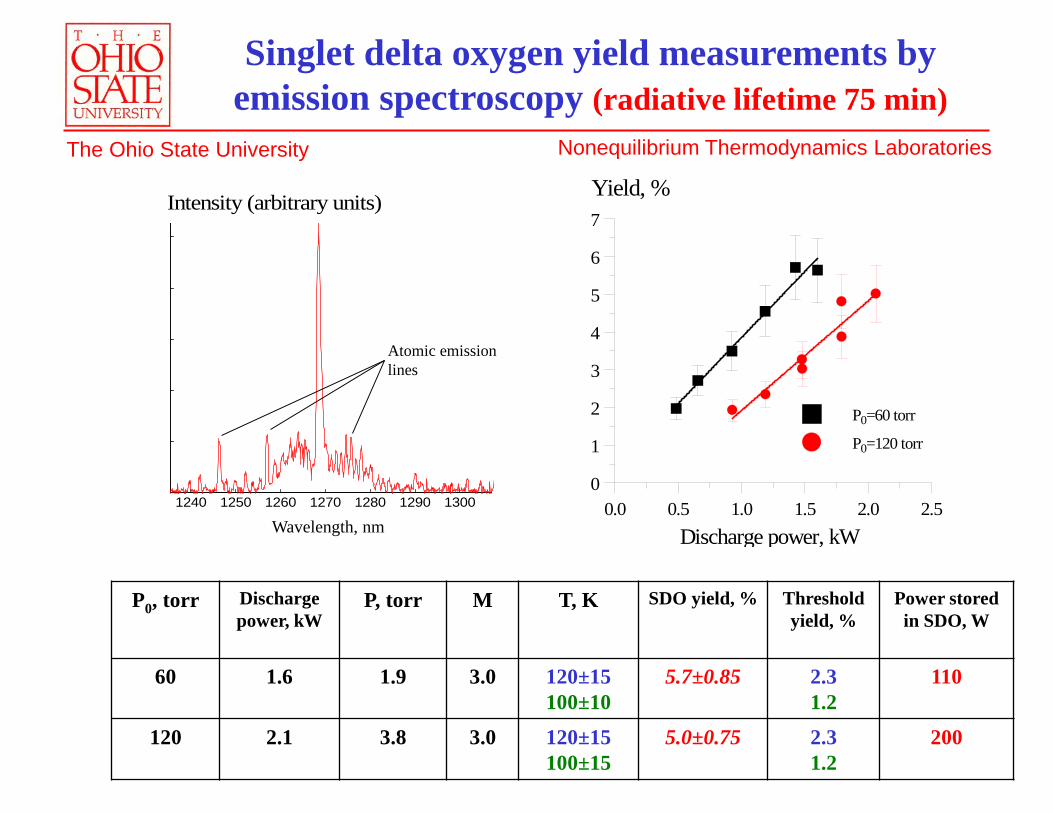
Singlet delta oxygen yield measurements by emission spectroscopy (radiative lifetime 75 min)
P0, torr Discharge power, kW
P, torr M T, K SDO yield, % Threshold yield, %
Power stored in SDO, W
60 1.6 1.9 3.0 120±15100±10
5.7±0.85 2.31.2
110
120 2.1 3.8 3.0 120±15100±15
5.0±0.75 2.31.2
200
0.0 0.5 1.0 1.5 2.0 2.50
1
2
3
4
5
6
7
Discharge power, kW
Yield, %
P0=60 torr
P0=120 torr
Wavelength, nm1240 1250 1260 1270 1280 1290 1300
Intensity (arbitrary units)
Atomic emission lines
Nonequilibrium Thermodynamics Laboratories The Ohio State University
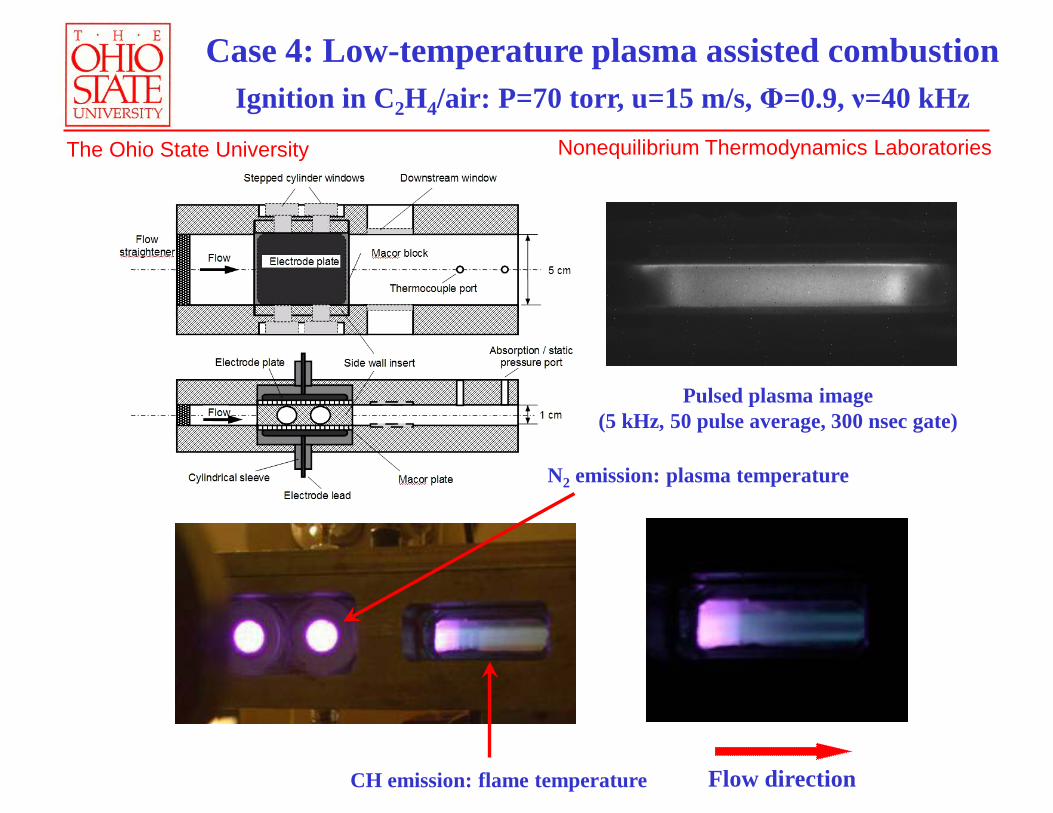
Case 4: Low-temperature plasma assisted combustionIgnition in C2H4/air: P=70 torr, u=15 m/s, Φ=0.9, ν=40 kHz
Flow direction
N2 emission: plasma temperature
Pulsed plasma image(5 kHz, 50 pulse average, 300 nsec gate)
CH emission: flame temperature
Nonequilibrium Thermodynamics Laboratories The Ohio State University
370 372 374 376 378 3800
1000
2000
3000
Inte
nsity
, a.u
.
λ, nm
experiment modelling
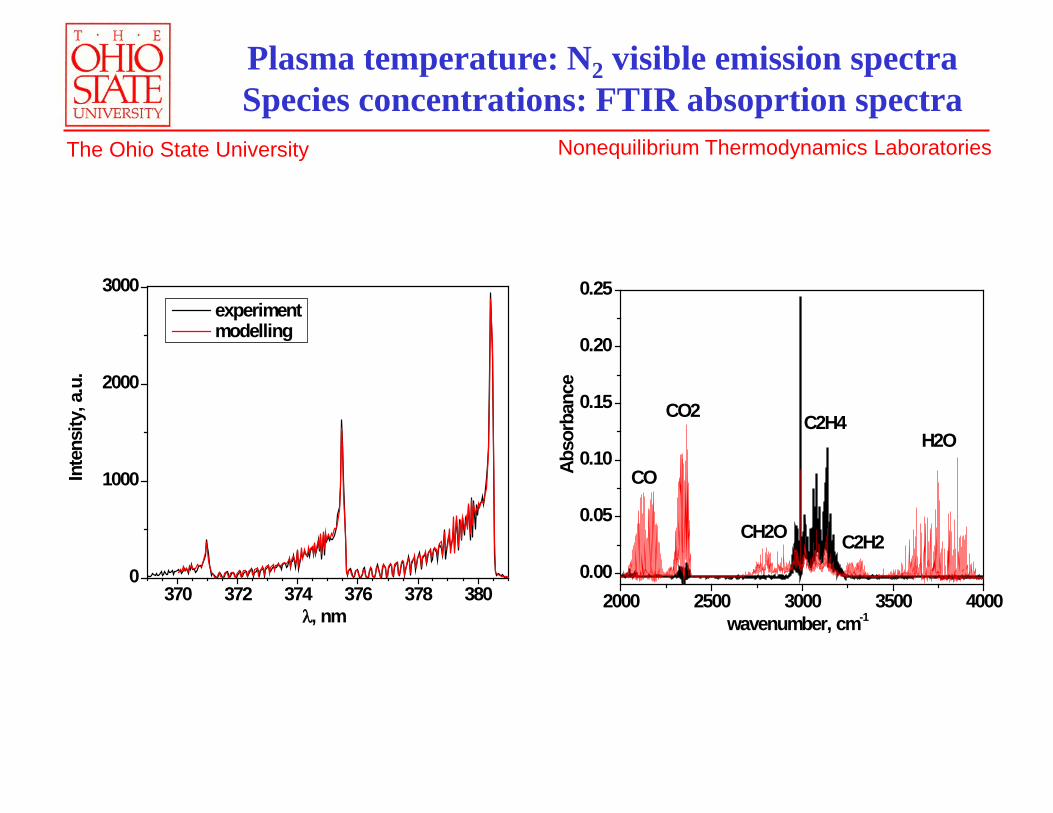
Plasma temperature: N2 visible emission spectraSpecies concentrations: FTIR absoprtion spectra
2000 2500 3000 3500 40000.00
0.05
0.10
0.15
0.20
0.25
H2O
C2H2
C2H4
CH2O
CO2
CO
wavenumber, cm-1
Abso
rban
ce
Nonequilibrium Thermodynamics Laboratories The Ohio State University
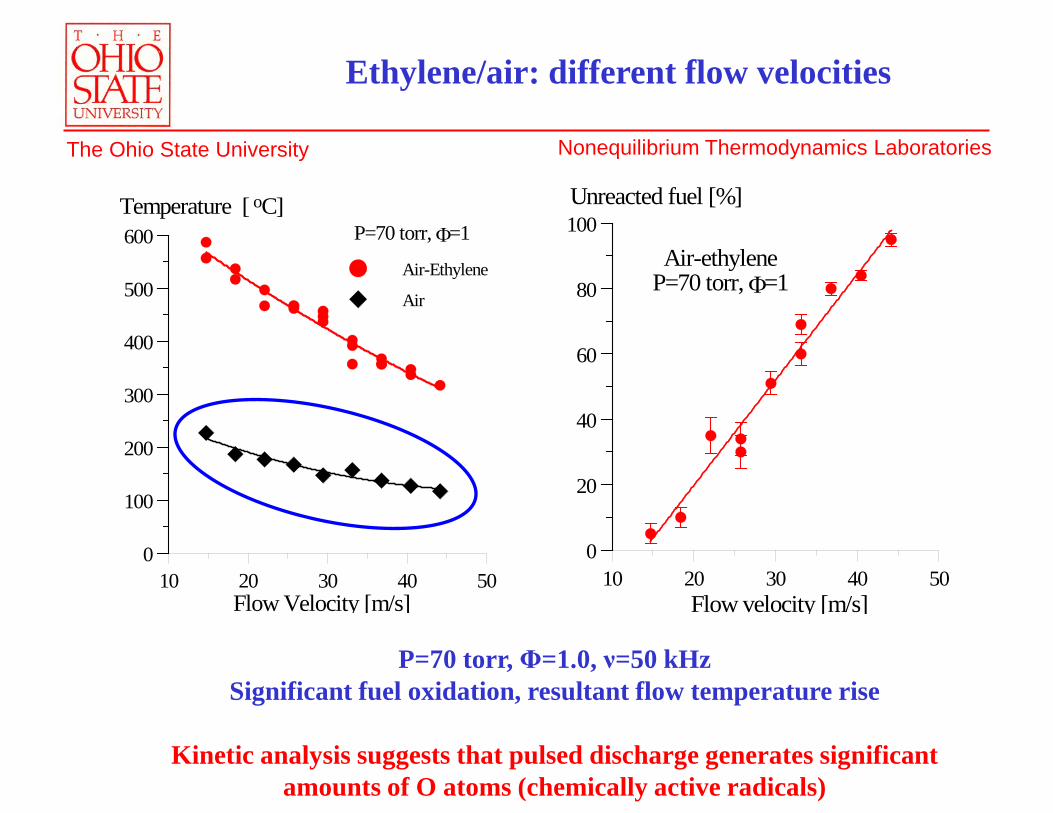
Ethylene/air: different flow velocities
P=70 torr, Φ=1.0, ν=50 kHzSignificant fuel oxidation, resultant flow temperature rise
Kinetic analysis suggests that pulsed discharge generates significant amounts of O atoms (chemically active radicals)
10 20 30 40 500
100
200
300
400
500
600Temperature [ oC]
Flow Velocity [m/s]
P=70 torr, Φ=1
Air-Ethylene
Air
10 20 30 40 500
20
40
60
80
100Air-ethylene
P=70 torr, Φ=1
Unreacted fuel [%]
Flow velocity [m/s]
Nonequilibrium Thermodynamics Laboratories The Ohio State University
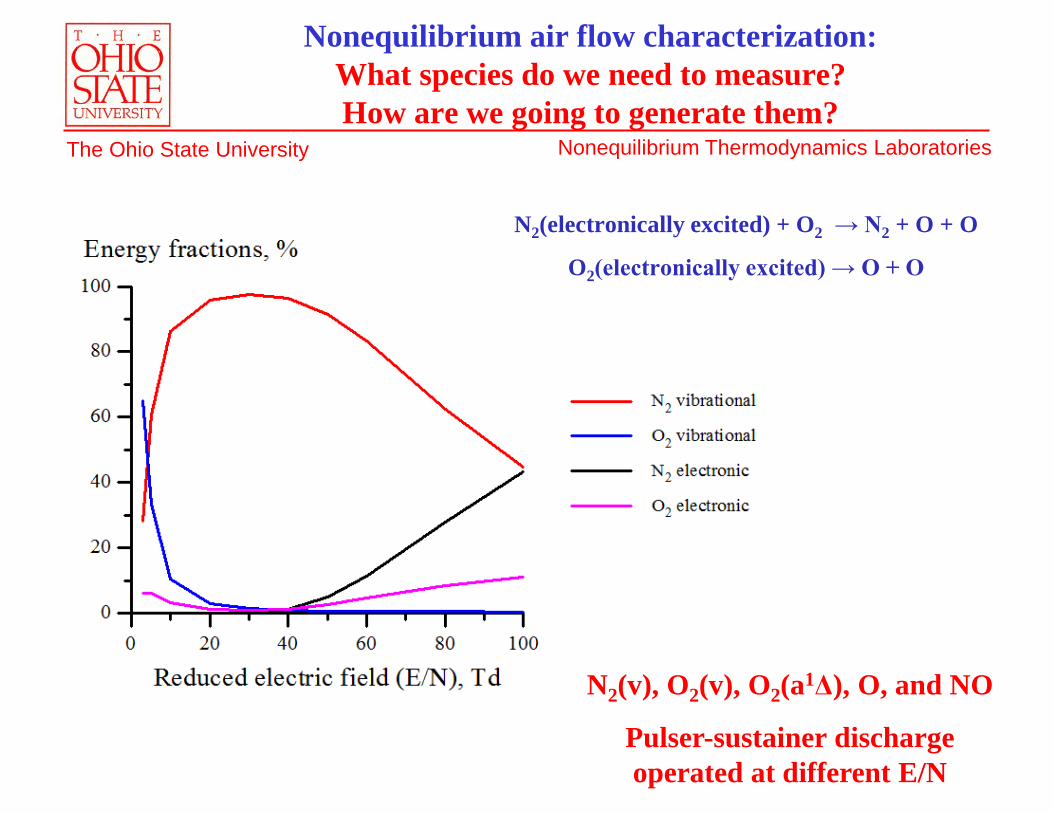
Nonequilibrium air flow characterization: What species do we need to measure?How are we going to generate them?
N2(electronically excited) + O2 → N2 + O + O
O2(electronically excited) → O + O
N2(v), O2(v), O2(a1Δ), O, and NO
Pulser-sustainer discharge operated at different E/N
Nonequilibrium Thermodynamics Laboratories The Ohio State University
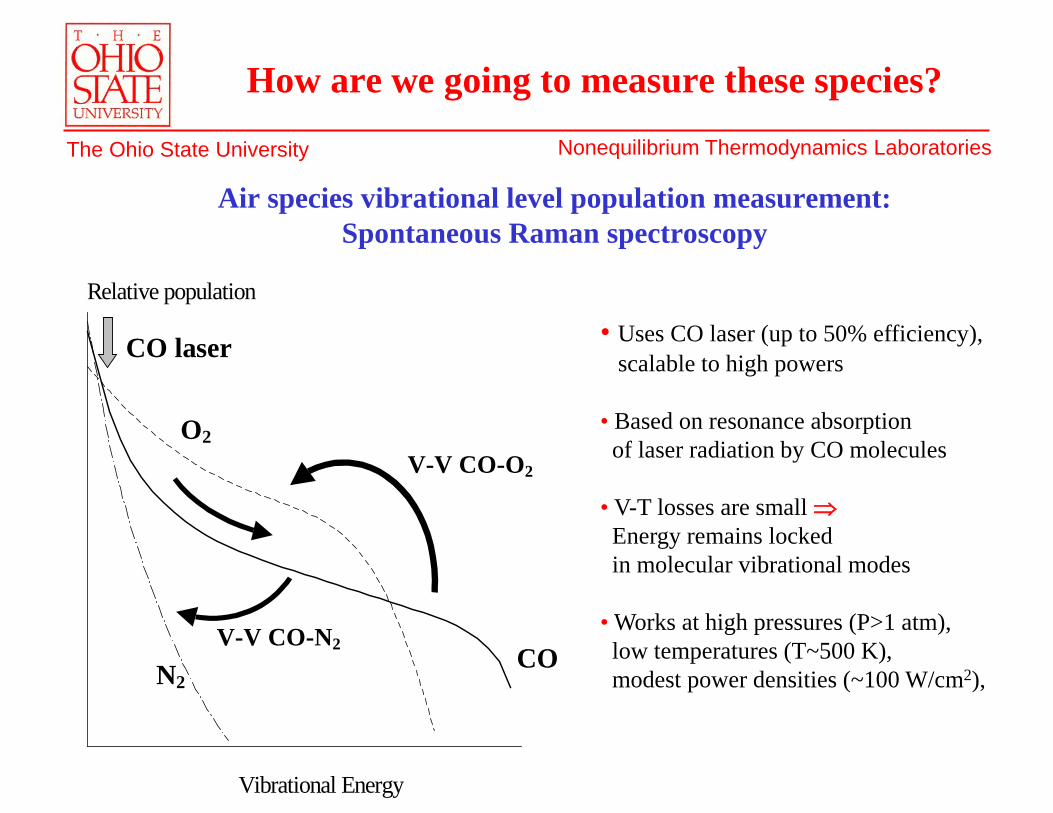
How are we going to measure these species?
V-V CO-N2
CO laser
N2
O2
CO
V-V CO-O2
Vibrational Energy
Relative population
• Uses CO laser (up to 50% efficiency),scalable to high powers
• Based on resonance absorption of laser radiation by CO molecules
• V-T losses are small ⇒Energy remains lockedin molecular vibrational modes
• Works at high pressures (P>1 atm), low temperatures (T~500 K),modest power densities (~100 W/cm2),
Air species vibrational level population measurement: Spontaneous Raman spectroscopy
Nonequilibrium Thermodynamics Laboratories The Ohio State University
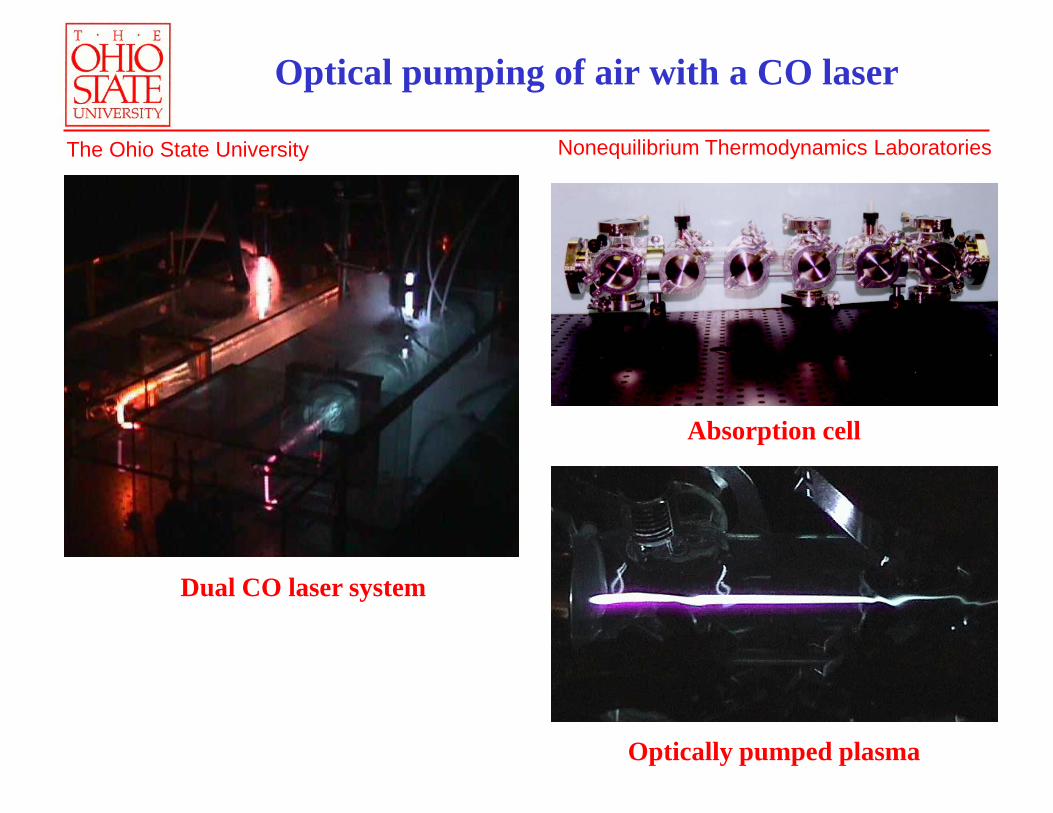
Optical pumping of air with a CO laser
Dual CO laser system
Absorption cell
Optically pumped plasma
Nonequilibrium Thermodynamics Laboratories The Ohio State University
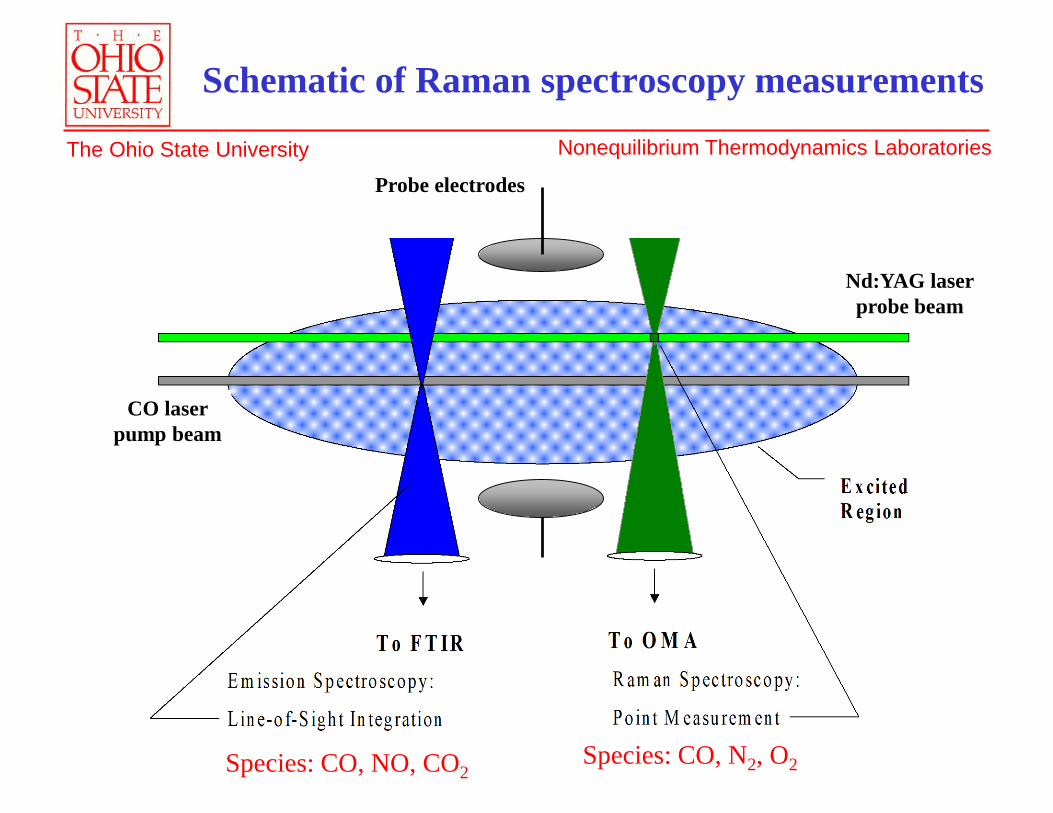
Schematic of Raman spectroscopy measurements
Species: CO, NO, CO2Species: CO, N2, O2
CO laser pump beam
Nd:YAG laser probe beam
Probe electrodes
Nonequilibrium Thermodynamics Laboratories The Ohio State University
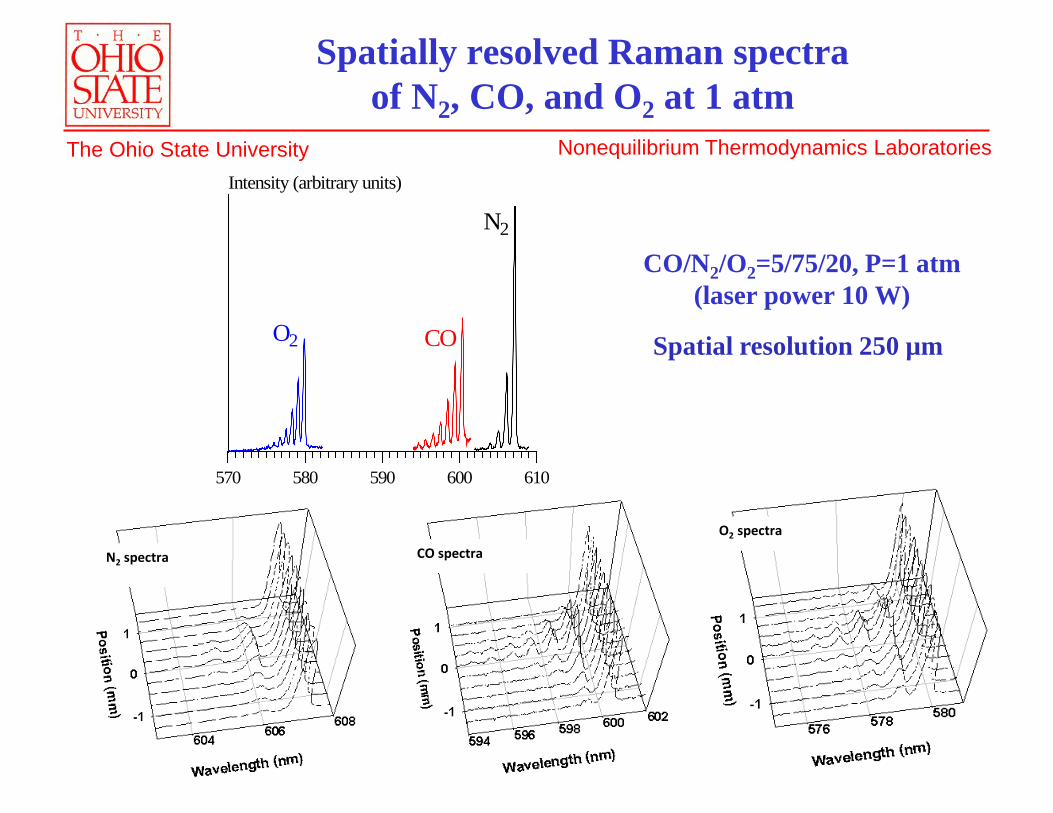
O2 spectraCO spectraN2 spectra
570 580 590 600 610
Intensity (arbitrary units)
N2
COO2
Spatially resolved Raman spectra of N2, CO, and O2 at 1 atm
Spatial resolution 250 µm
CO/N2/O2=5/75/20, P=1 atm(laser power 10 W)
Nonequilibrium Thermodynamics Laboratories The Ohio State University
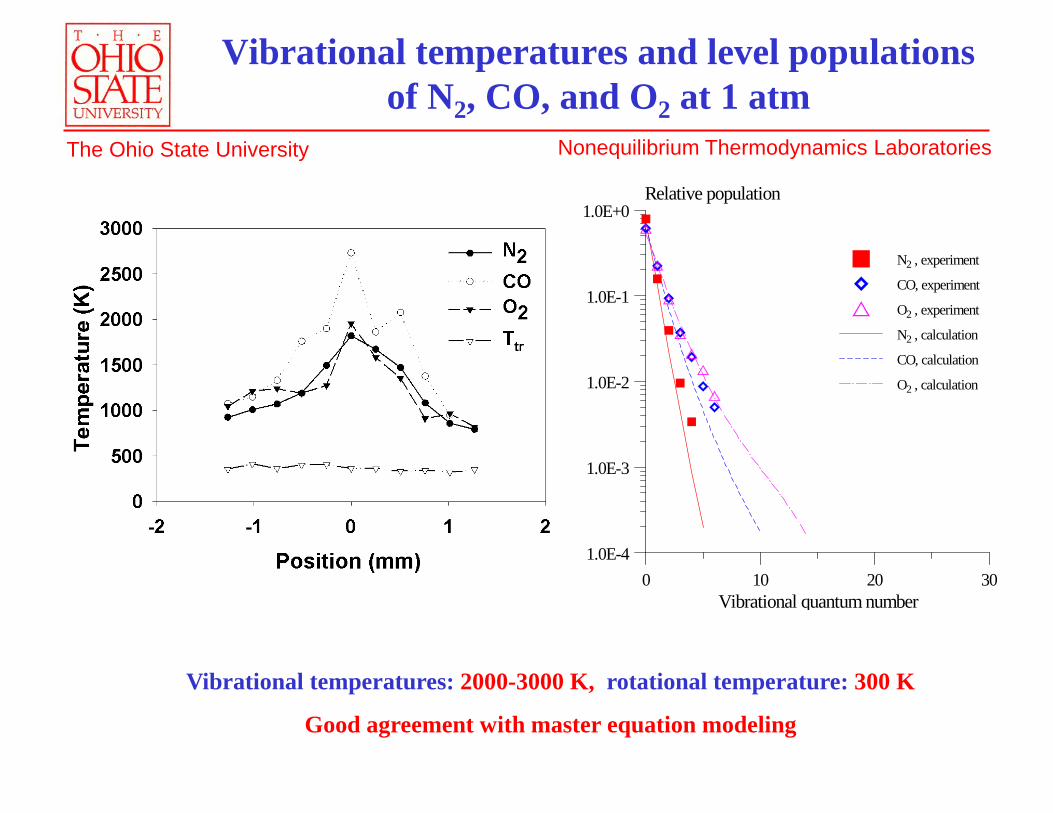
0 10 20 301.0E-4
1.0E-3
1.0E-2
1.0E-1
1.0E+0Relative population
Vibrational quantum number
N2 , experiment
CO, experiment
O2 , experiment
N2 , calculation
CO, calculation
O2 , calculation
Vibrational temperatures and level populations of N2, CO, and O2 at 1 atm
Vibrational temperatures: 2000-3000 K, rotational temperature: 300 K
Good agreement with master equation modeling
Nonequilibrium Thermodynamics Laboratories The Ohio State University
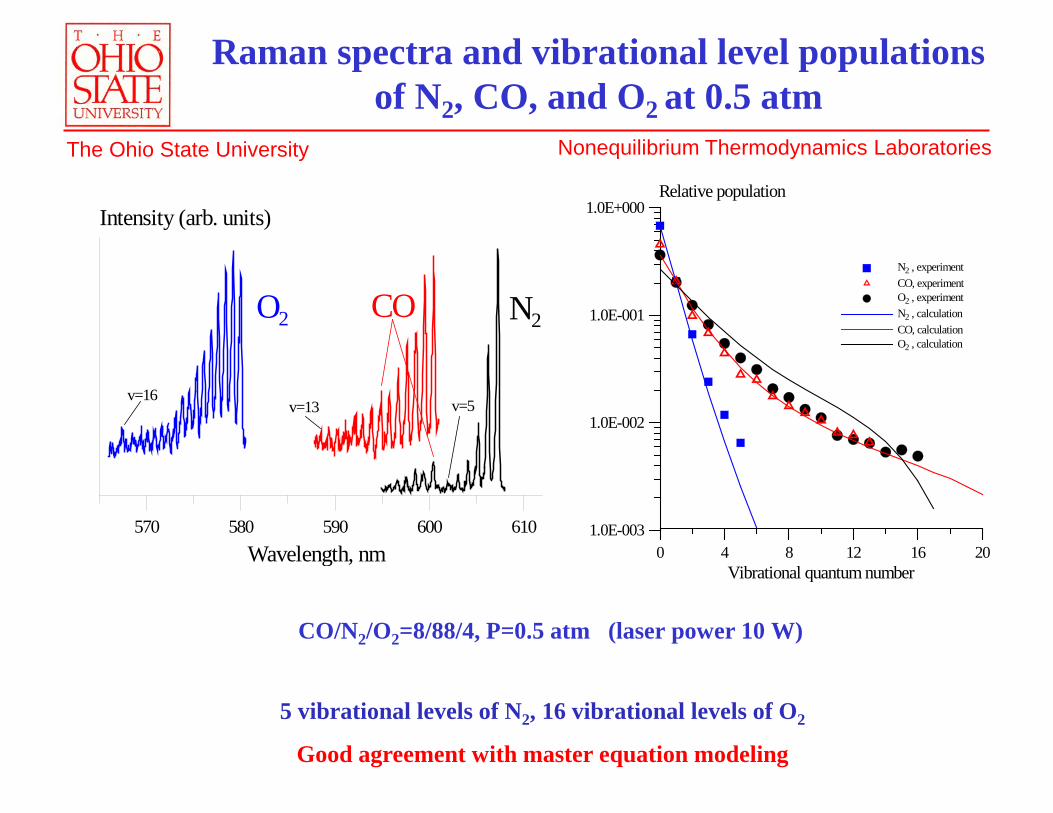
570 580 590 600 610Wavelength, nm
Intensity (arb. units)
N2O2 CO
v=13v=16
v=5
Relative population
Vibrational quantum number0 4 8 12 16 20
1.0E-003
1.0E-002
1.0E-001
1.0E+000
N2 , experimentCO, experimentO2 , experimentN2 , calculationCO, calculationO2 , calculation
Raman spectra and vibrational level populations of N2, CO, and O2 at 0.5 atm
CO/N2/O2=8/88/4, P=0.5 atm (laser power 10 W)
5 vibrational levels of N2, 16 vibrational levels of O2
Good agreement with master equation modeling
Nonequilibrium Thermodynamics Laboratories The Ohio State University
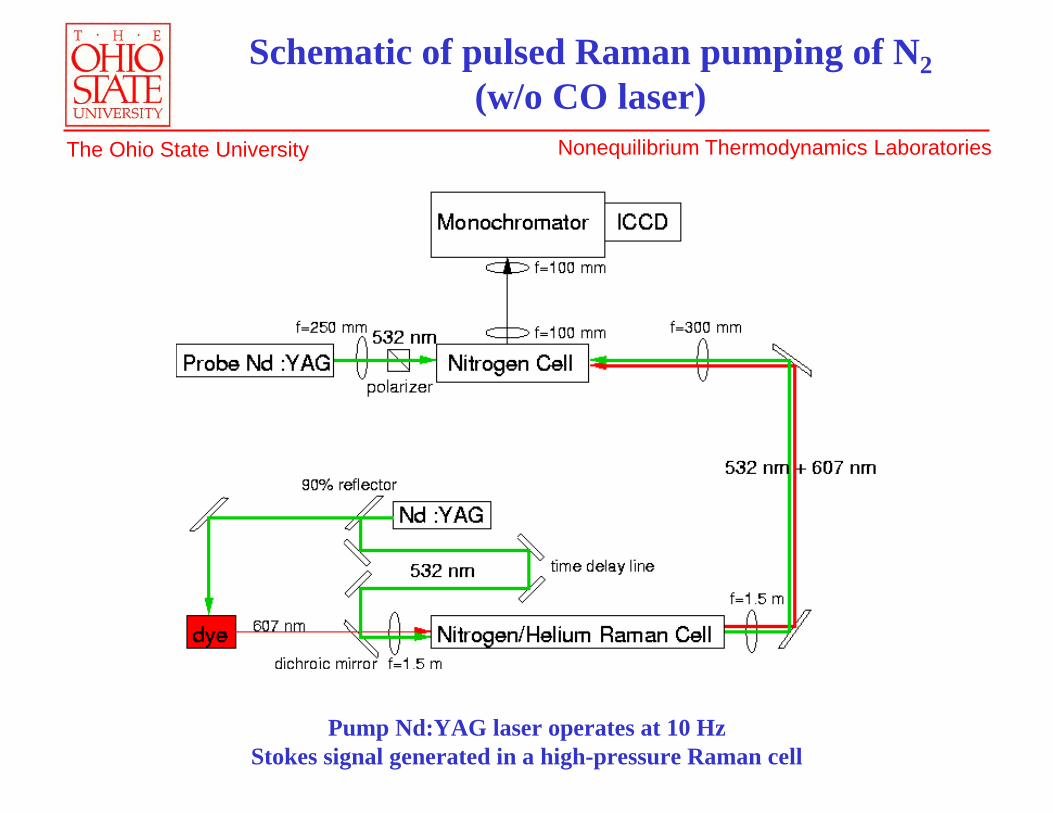
Schematic of pulsed Raman pumping of N2(w/o CO laser)
Pump Nd:YAG laser operates at 10 HzStokes signal generated in a high-pressure Raman cell
Nonequilibrium Thermodynamics Laboratories The Ohio State University
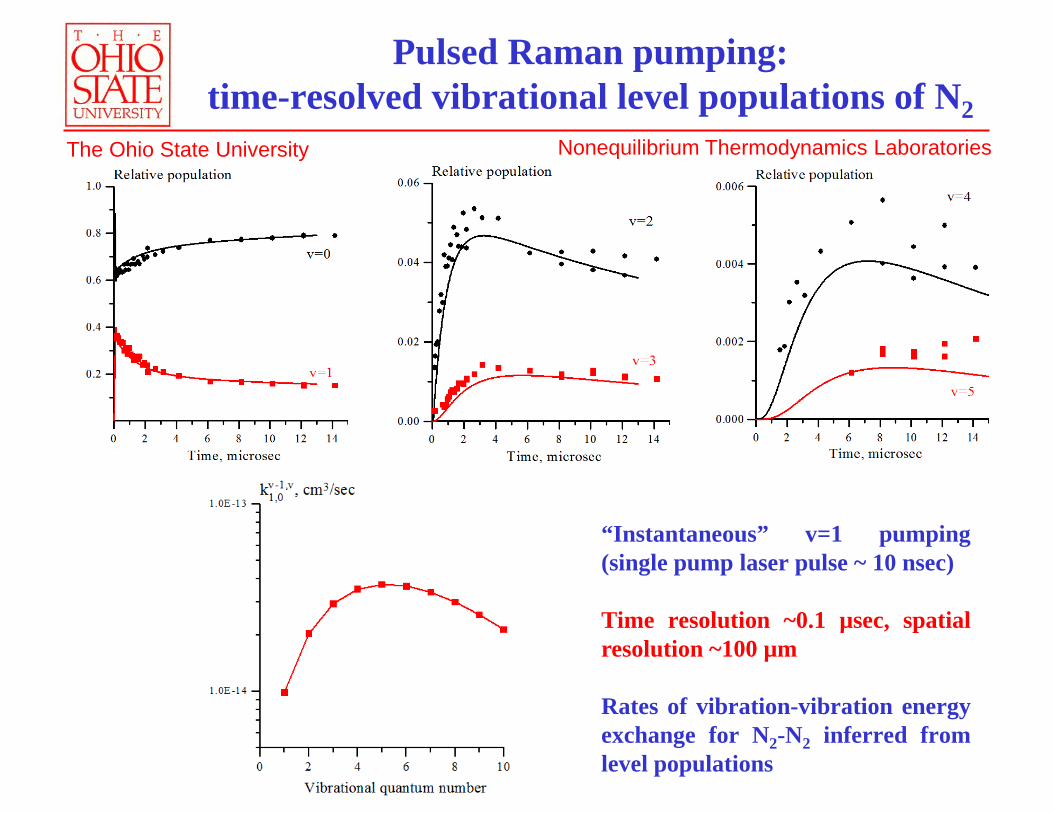
Pulsed Raman pumping: time-resolved vibrational level populations of N2
“Instantaneous” v=1 pumping(single pump laser pulse ~ 10 nsec)
Time resolution ~0.1 µsec, spatialresolution ~100 µm
Rates of vibration-vibration energyexchange for N2-N2 inferred fromlevel populations
Nonequilibrium Thermodynamics Laboratories The Ohio State University
v=2
0.00
0.01
0.02
0.03
0.04
0.05
0.06
0 2 4 6µs
frac
tiona
l pop
ulat
ion
v=4
0.E+00
1.E-03
2.E-03
3.E-03
4.E-03
5.E-03
6.E-03
7.E-03
0 2 4 6µs
frac
tiona
l pop
ulat
ion
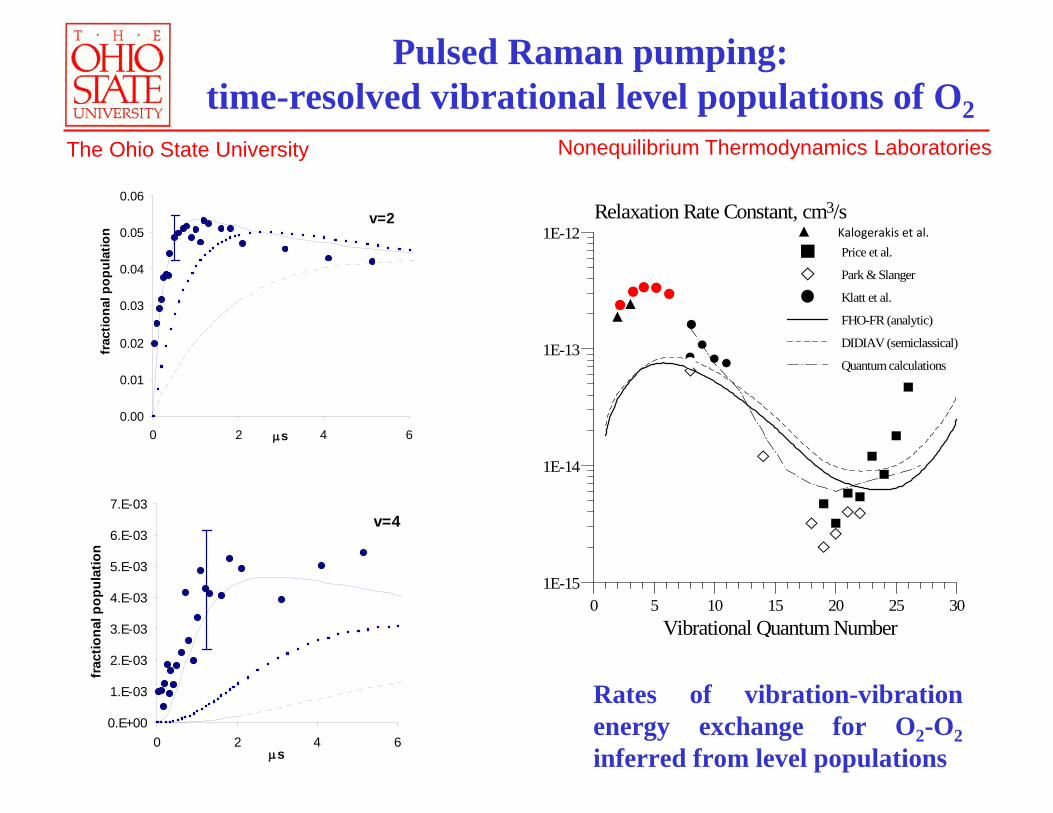
Pulsed Raman pumping: time-resolved vibrational level populations of O2
0 5 10 15 20 25 301E-15
1E-14
1E-13
1E-12
Vibrational Quantum Number
Relaxation Rate Constant, cm3/s
Price et al.
Park & Slanger
Klatt et al.
FHO-FR (analytic)
DIDIAV (semiclassical)
Quantum calculations
Kalogerakis et al.
Rates of vibration-vibrationenergy exchange for O2-O2inferred from level populations
Nonequilibrium Thermodynamics Laboratories The Ohio State University
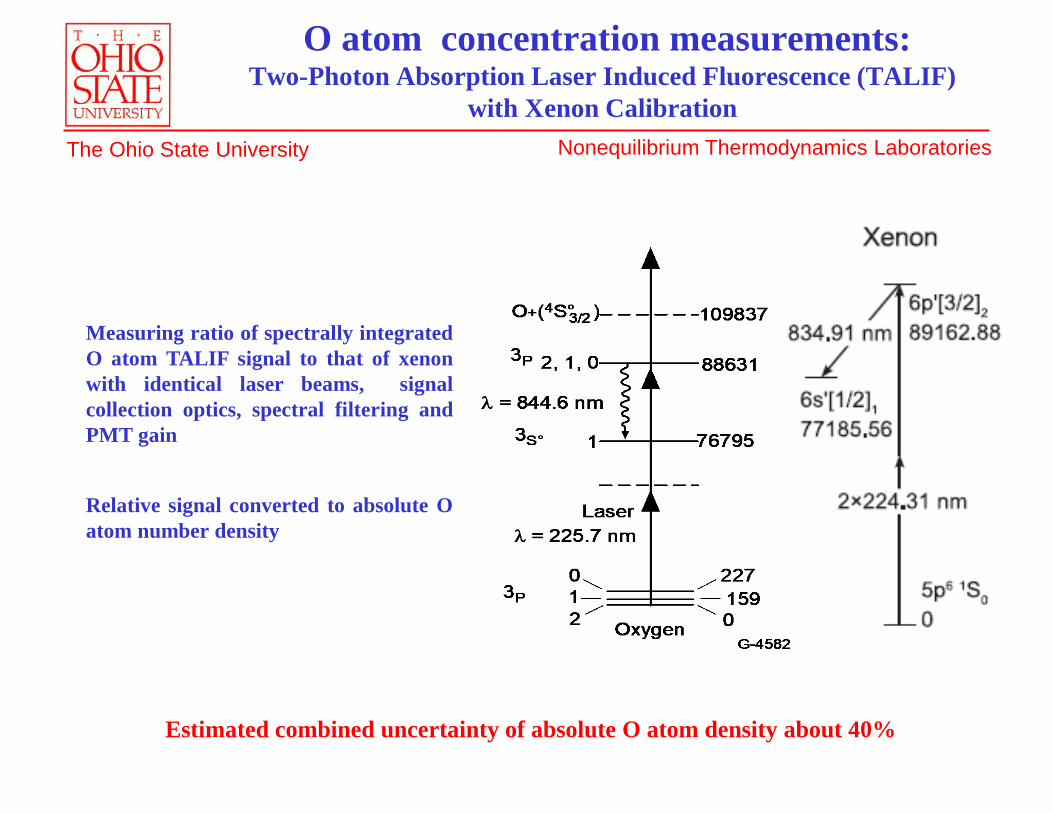
O atom concentration measurements:Two-Photon Absorption Laser Induced Fluorescence (TALIF)
with Xenon Calibration
Measuring ratio of spectrally integratedO atom TALIF signal to that of xenonwith identical laser beams, signalcollection optics, spectral filtering andPMT gain
Relative signal converted to absolute Oatom number density
Estimated combined uncertainty of absolute O atom density about 40%
Nonequilibrium Thermodynamics Laboratories The Ohio State University
0.0E+0 1.0E-3 2.0E-3 3.0E-3 4.0E-30.0E+0
1.0E-5
2.0E-5
3.0E-5
4.0E-5
5.0E-5
Time, seconds
O atom mole fraction
Air
Air-methane, Φ=1.0
1.0E-7 1.0E-6 1.0E-5 1.0E-4 1.0E-3 1.0E-20.0E+0
1.0E-5
2.0E-5
3.0E-5
4.0E-5
5.0E-5
Time, seconds
O atom mole fractionAir
Air-ethylene, Φ=0.5
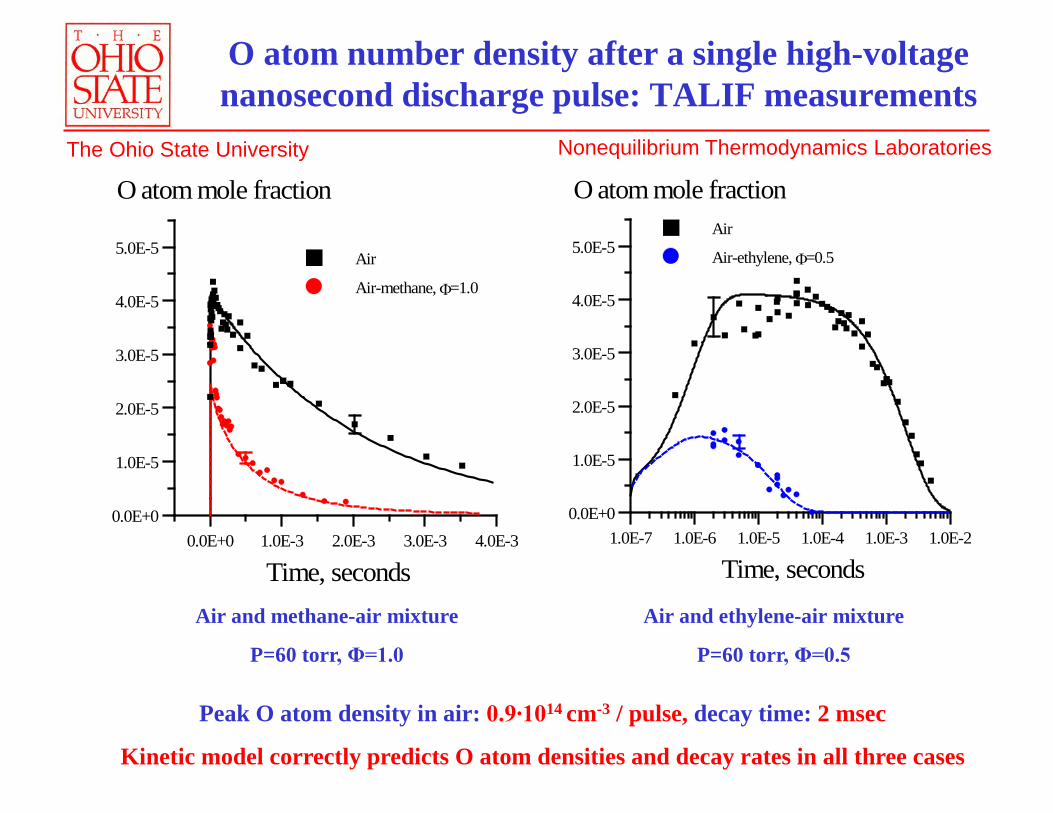
O atom number density after a single high-voltage nanosecond discharge pulse: TALIF measurements
Air and methane-air mixture
P=60 torr, Φ=1.0
Air and ethylene-air mixture
P=60 torr, Φ=0.5
Peak O atom density in air: 0.9∙1014 cm-3 / pulse, decay time: 2 msec
Kinetic model correctly predicts O atom densities and decay rates in all three cases
Nonequilibrium Thermodynamics Laboratories The Ohio State University
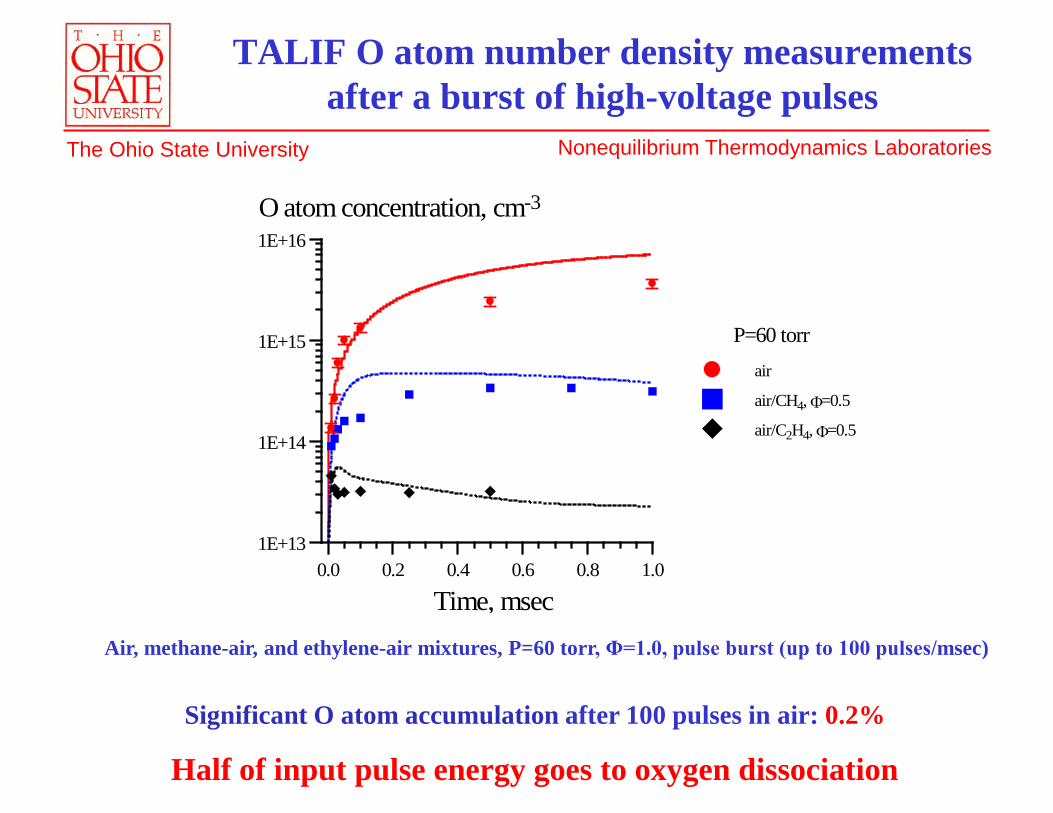
TALIF O atom number density measurements after a burst of high-voltage pulses
Air, methane-air, and ethylene-air mixtures, P=60 torr, Φ=1.0, pulse burst (up to 100 pulses/msec)
Significant O atom accumulation after 100 pulses in air: 0.2%
Half of input pulse energy goes to oxygen dissociation
0.0 0.2 0.4 0.6 0.8 1.01E+13
1E+14
1E+15
1E+16
Time, msec
O atom concentration, cm-3
P=60 torrair
air/CH4, Φ=0.5
air/C2H4, Φ=0.5
Nonequilibrium Thermodynamics Laboratories The Ohio State University
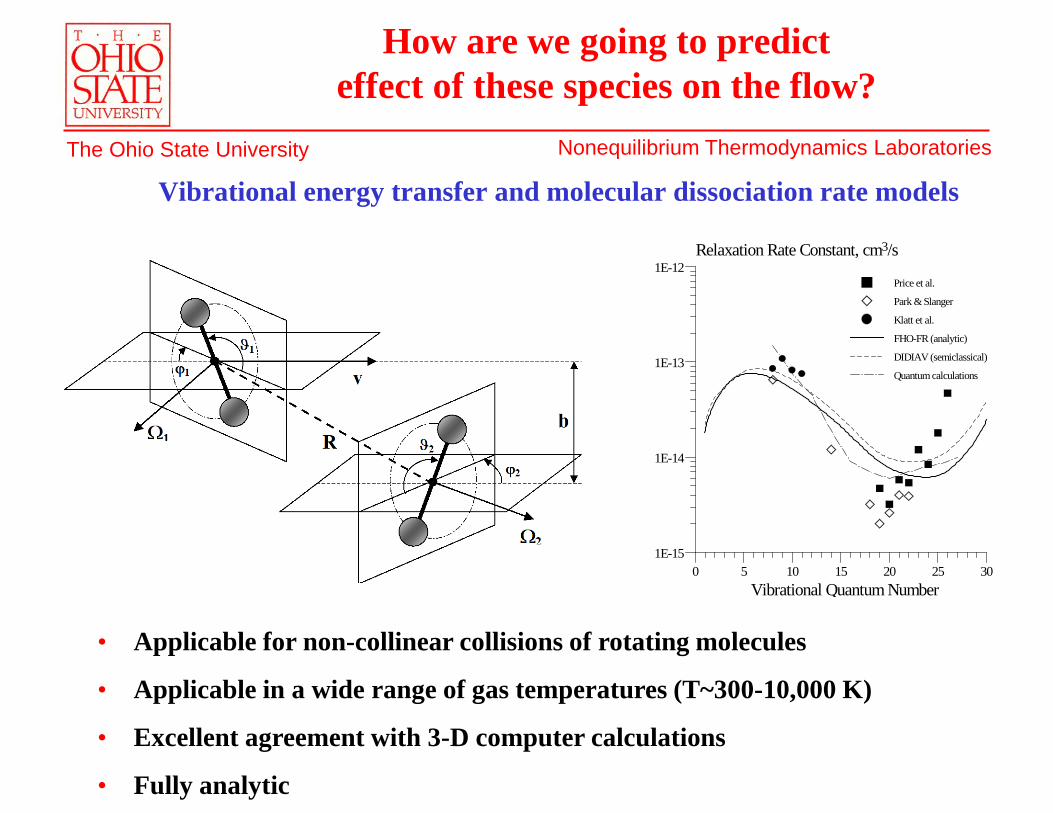
How are we going to predict effect of these species on the flow?
• Applicable for non-collinear collisions of rotating molecules
• Applicable in a wide range of gas temperatures (T~300-10,000 K)
• Excellent agreement with 3-D computer calculations
• Fully analytic
0 5 10 15 20 25 301E-15
1E-14
1E-13
1E-12
Vibrational Quantum Number
Relaxation Rate Constant, cm3/s
Price et al.
Park & Slanger
Klatt et al.
FHO-FR (analytic)
DIDIAV (semiclassical)
Quantum calculations
Vibrational energy transfer and molecular dissociation rate models
Nonequilibrium Thermodynamics Laboratories The Ohio State University
0 2000 4000 6000 8000 100001E-17
1E-16
1E-15
1E-14
1E-13
1E-12
1E-11
1E-10
1E-9
Temperature, K
V-T Rate constant, cm3/s
(1,0→
0,0)
(40,0→
39,0)
(10,0→
9,0)
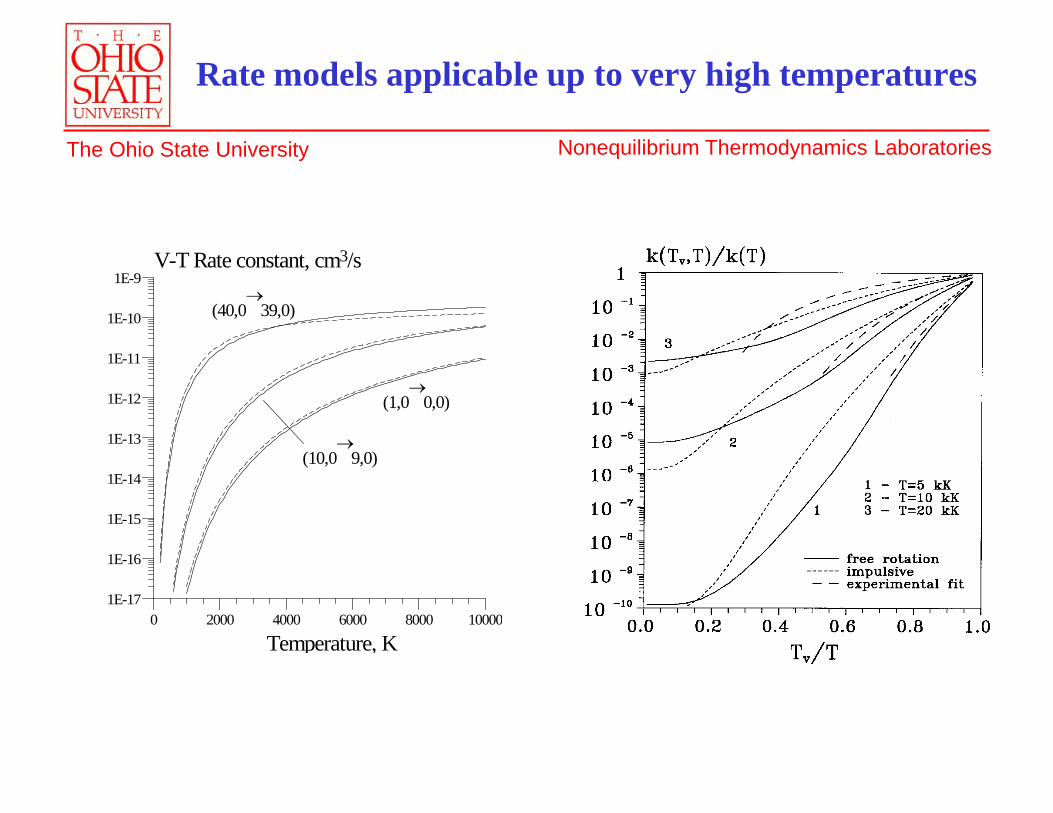
Rate models applicable up to very high temperatures
Nonequilibrium Thermodynamics Laboratories The Ohio State University
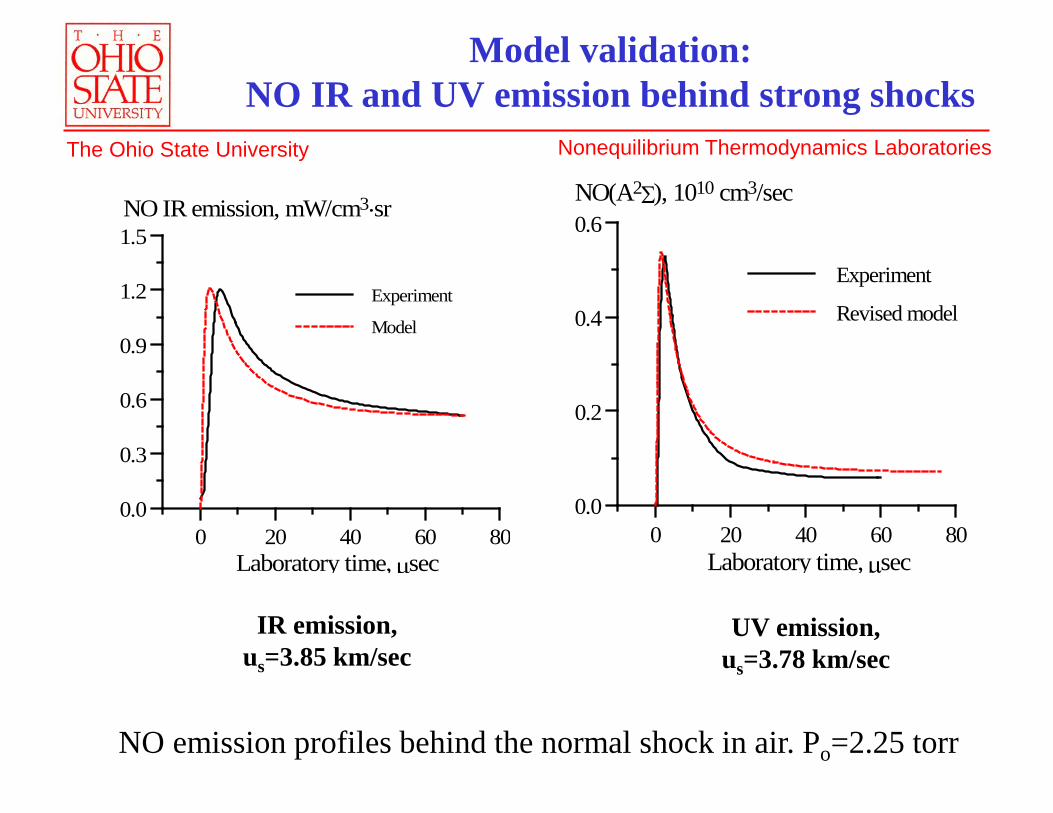
Model validation: NO IR and UV emission behind strong shocks
NO emission profiles behind the normal shock in air. Po=2.25 torr
IR emission, us=3.85 km/sec
UV emission, us=3.78 km/sec
0 20 40 60 800.0
0.2
0.4
0.6
Laboratory time, µsec
NO(A2Σ), 1010 cm3/sec
Experiment
Revised model
0 20 40 60 800.0
0.3
0.6
0.9
1.2
1.5
Laboratory time, µsec
NO IR emission, mW/cm3.sr
Experiment
Model
Nonequilibrium Thermodynamics Laboratories The Ohio State University
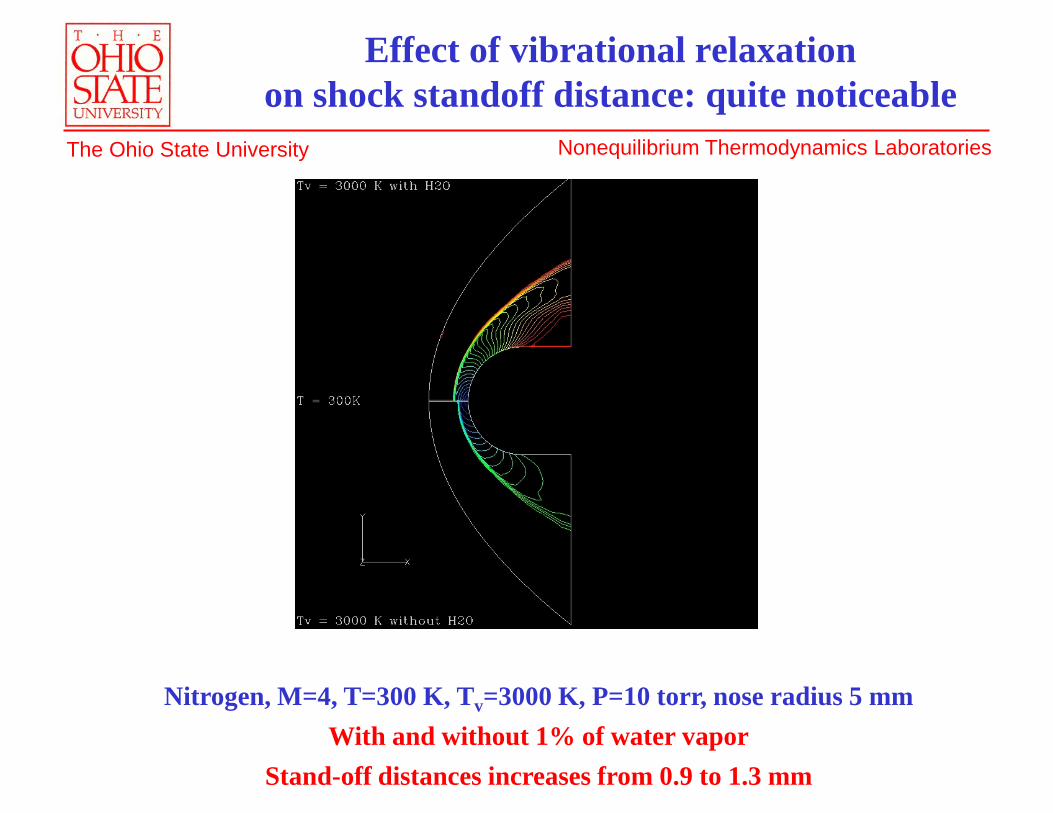
Effect of vibrational relaxation on shock standoff distance: quite noticeable
Nitrogen, M=4, T=300 K, Tv=3000 K, P=10 torr, nose radius 5 mmWith and without 1% of water vapor
Stand-off distances increases from 0.9 to 1.3 mm
Nonequilibrium Thermodynamics Laboratories The Ohio State University
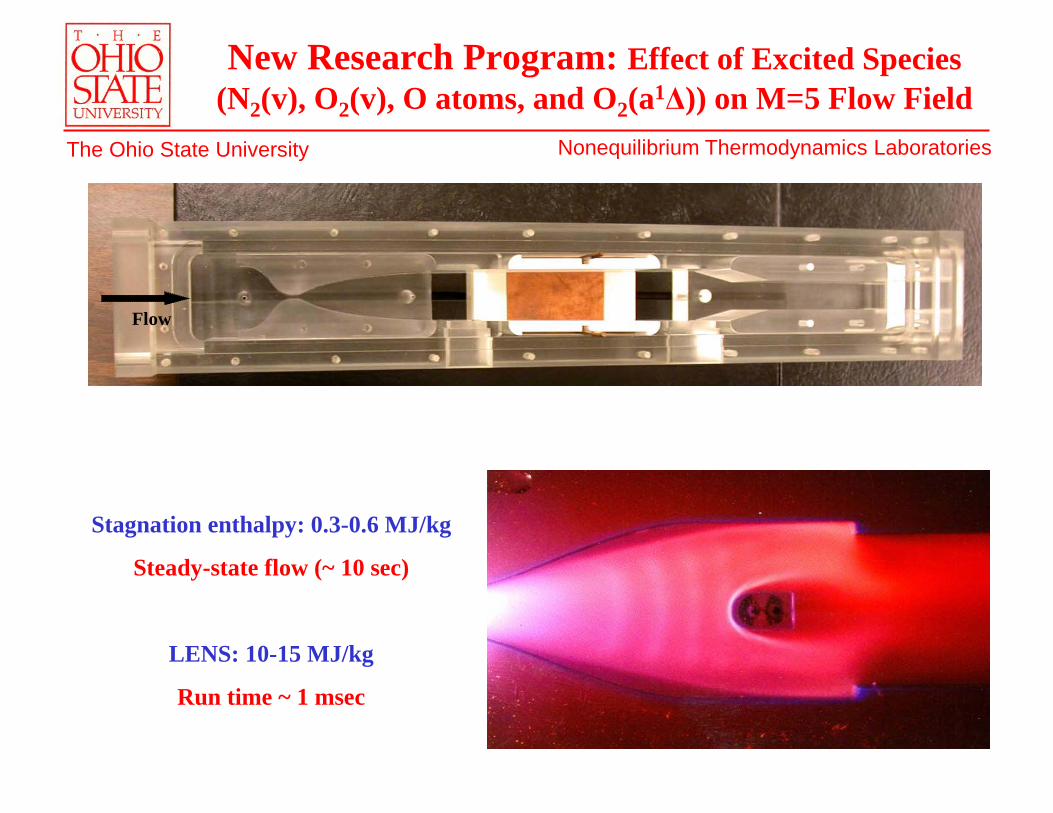
Flow
New Research Program: Effect of Excited Species (N2(v), O2(v), O atoms, and O2(a1Δ)) on M=5 Flow Field
Stagnation enthalpy: 0.3-0.6 MJ/kg
Steady-state flow (~ 10 sec)
LENS: 10-15 MJ/kg
Run time ~ 1 msec
Nonequilibrium Thermodynamics Laboratories The Ohio State University
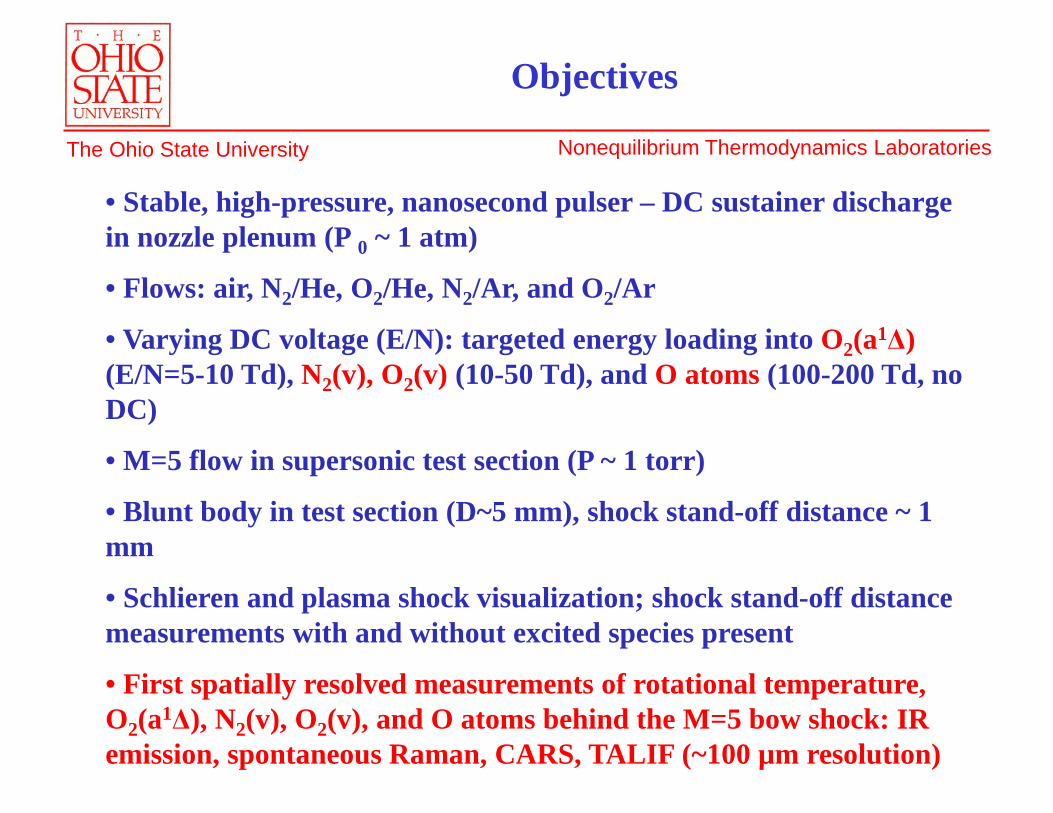
• Stable, high-pressure, nanosecond pulser – DC sustainer discharge in nozzle plenum (P 0 ~ 1 atm)
• Flows: air, N2/He, O2/He, N2/Ar, and O2/Ar
• Varying DC voltage (E/N): targeted energy loading into O2(a1Δ)(E/N=5-10 Td), N2(v), O2(v) (10-50 Td), and O atoms (100-200 Td, no DC)
• M=5 flow in supersonic test section (P ~ 1 torr)
• Blunt body in test section (D~5 mm), shock stand-off distance ~ 1 mm
• Schlieren and plasma shock visualization; shock stand-off distance measurements with and without excited species present
• First spatially resolved measurements of rotational temperature, O2(a1Δ), N2(v), O2(v), and O atoms behind the M=5 bow shock: IR emission, spontaneous Raman, CARS, TALIF (~100 µm resolution)
Objectives
Nonequilibrium Thermodynamics Laboratories The Ohio State University
• Strong vibrational excitation of N2, O2, and H2 using a pulse-burst laser for Raman pumping (20-30 pulses at 1 pulse/µsec rep rate). Measuring vibrationally induced dissociation at high energy loading (several vibrational quanta per molecule) using TALIF
• Comparison with coupled compressible Navier-Stokes / master equation modeling and rate model validation: state-specific vibrational energy transfer and dissociation rates, rates of NO production, O2(a1Δ) quenching rates
• Developing instrumentation for using at LENS hypersonic flow facility
• Developing physics-based design tool nonequilibrium flow models with predictive capabilities
Objectives (continued)
Nonequilibrium Thermodynamics Laboratories The Ohio State University
Other Future Research Thrusts in High-Speed Propulsion and Power
• Confident ignition / flameholding / relight in high-speed flows(using large-volume nonequilibrium plasmas)
• Demonstrating scaling potential of DOIL laser power to makeThe Application feasible: tens to hundreds of W in a laboratoryscale setup
• MHD: electrical power generation in reentry flows, opening up“transmission windows” through reentry plasma using B field,power generation in scramjets (stagnation temperature too highfor a turbine)
Nonequilibrium Thermodynamics Laboratories The Ohio State University
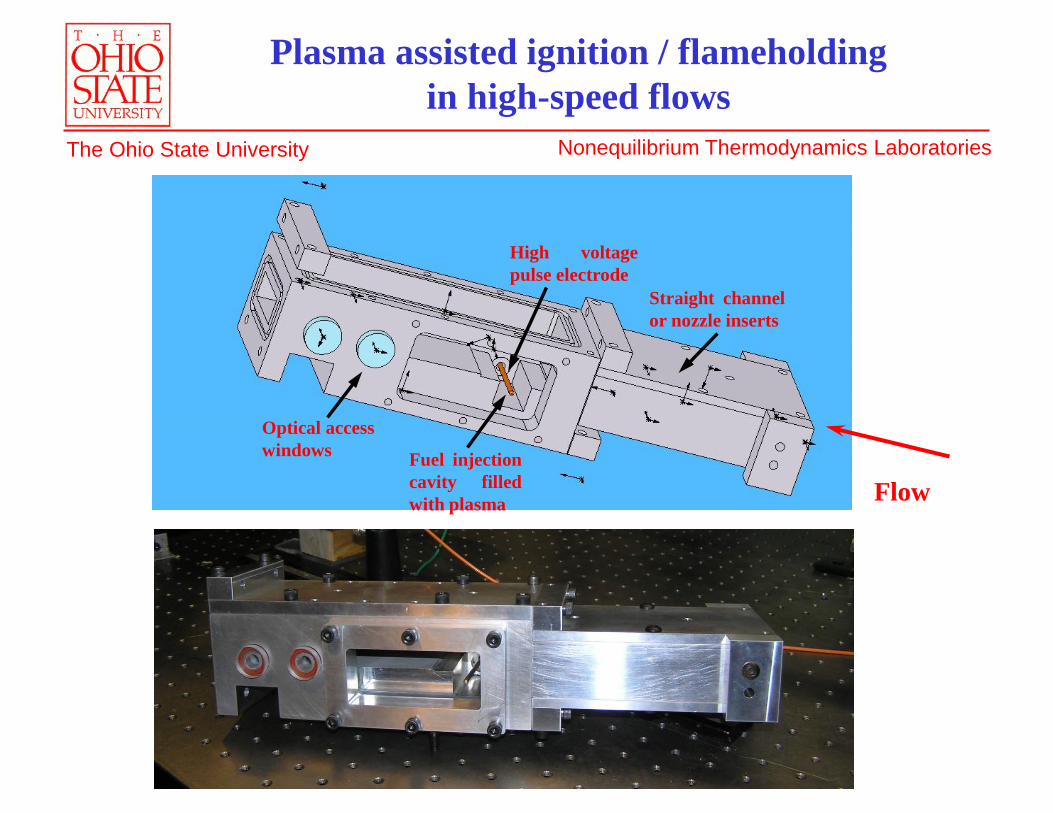
Plasma assisted ignition / flameholding in high-speed flows
Fuel injectioncavity filledwith plasma
High voltagepulse electrode
Straight channelor nozzle inserts
Optical accesswindows
Flow
Nonequilibrium Thermodynamics Laboratories The Ohio State University
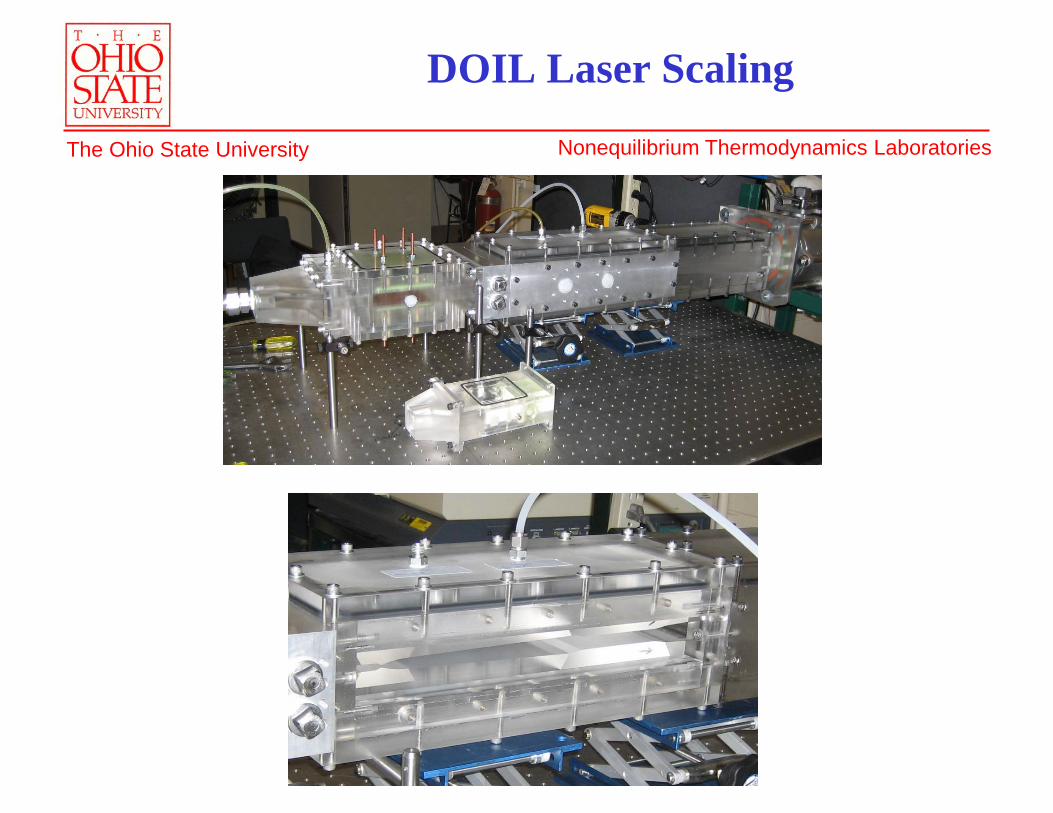
DOIL Laser Scaling