Embed Size (px)
Citation preview
PNL..7474
UC-814
• '_'e
II II .... IIIIII I
Three-Dimensional Modeling ofUnsaturated Flow in the Vicinityof Proposed Exploratory ShaftFacilities at Yucca Mountain, Nevada
M. L. Rockhold
B. SagarM. P. Connelly
II I IIIIrl I I II
April 1992
Prepared for the U.S. Department of Energyunder Contract DE-AC06-76RLO 1830
Pacific Northwest LaboratoryOperated for the U.S. Department of Energy
. by Battelle Memorial Institute

DISCLAIMER
This report was prepared as an account of work sponsored by an agency of tile ,United States Government. Neitiler the United States Government nor any agencythereof, nor Battelle Memorial Institute, nor any of their employees, makes anywarrantyt expressed or implied, or assumes any legal liability or responsibility forthe accuracy, completeness, or usefulness of any information, apparatus, product ,or process disclosed, or represents that itsuse would not infringe privately ownedrights. Reference herein to any specific commercial product, process, or service bytrade name, trademark, manufacturer, or otherwise does not necessarily constituteor imply its endorsement, recommendation, or favoring by tile United StatesGovernment or any agency thereof, or Battelle Memorial Institute. The views andopinions of authors expressed herein do not necessarily state or reflect those of the
United States Government or any agency thereof.
PACIFIC NORTHWEST LABORATORY
opera ted byBATTELLE MEMORIAL INSTITUTE
for the
UNITED STATES DEPARTMENT OF ENERGY
under Contra ct DE-A C06-76RL 0 18.30
Printed iri the United Statesof America
Available to DOEand DOE contractors from the
Office of Scientificand TechnicalInformation, P.O. Box62, Oak Ridge,TN 37831;pricesavailable from (615) 576-8401. FTS626.8401.
Available to the public from the National Technical Information Service,U.S. Department of Commerce,5285 Port RoyalRd.,Springfield, VA 22161.
II ..... 1 'IIIH II ...... li _........ Hre" lit'"'' _l' _'..... llll'_l" Ulllllll_
PNL--7474
DE92 012319
THREE-DIMENSIONALMODELINGOF UNSATURATEDFLOWIN THEVICINITY OF PROPOSEDEXPLORATORYSHAFTFACILITIES AT YUCCAMOUNTAIN,NEVADA
M. L. RoGkholdB SagartaJ (b)M. P. Connelly
Apri I 1992
Preparedforthe U.S. Departmentof Energyunder ContractDE-ACO6-76RLO1830
" Pacific Northwest LaboratoryRichland, Washington 99352
(a) Southwest Research InstituteSan Antonio, Texas 78228
(b) Westinghouse Hanford CompanyRichland, Washington 99352
i_,;_,'_.,
Dlol Fd,:,L.Il t .....b_0t:::ll.ll.t!_I..L)(1)(..;LIML_fq]ltli;LJt'JLIMIILID
1!I .,,,,,,.,,,,,,,,.,,........,..,..................,,,,,......,,,,,,...................,,,,,........,...............,,,,,,_,,,,,,,,,,,........,,...............,,,,,,,......,,,,,......,,_,,,,,,,,,,,,,,,,,,,,

ABSTRACT
This report describes the results of a study to investigate the influ-
ence of proposed exploratory shafts on the moisture distribution within unsat-
urated, fractured rock at Yucca Mountain, Nevada. The long-term effects of
exploratory shafts at Yucca Mountain are important in the estimation of poten-
' tial waste migration and fate, while short-term effects may be important in
the planning and interpretation of tests performed at the site.
" Numerical simulations, using a three-dimensional model, suggest that
most episodic pulses of water from natural precipitation should not reach the
proposed repository directly through fractures or through modified permeabil-
ity zones around exploratory shafts, due to capillary imbibition into the rock
matrix. The results of these simulations also suggest that the ambient mois-
ture content and distribution in the vicinity of the shafts should not change
significantly within a reasonable time frame for subsurface characterization
work (20 years).
Relatively few data exist on the hydrologic properties of unsaturated,
fractured rock at Yucca Mountain. The simulation results reported in this
document are specific to the discretization schemes, boundary conditions, and
hydrologic properties that were used. lherefore, these results simply repre-
sent approximations of the potential effects of exploratory shafts on unsatu-
rated water flow at the site. Improved confidence and quantification of the
uncertainty in this type of modeling study wil be attained as more data
become available.
iii
Im ,r, .,ll,,,plplltrllu,,,,llll_ , r_l,iTii I rl, lilppl,, r_ lll' fir' , ,,llr,Ul_ljl lm "' "Iii' II ,r ' 111r q, iiHll qIl. lV q_qll,,q' ql!'l'rr_' " II I1 II rl, Iii ,, ,,," , I11_' ' plplll' i , ' ,,,HI11rll ,r_l_I_ Hl II1' "

,kNlihl_lUl_lllllldllJlilllmlhHLlJ,llMH_mlilhll_lim,llhml_,u_|ll,lllliMkadlllmllul,bldl_ldl_lll,L,, ,bdH, ,IlL .... ,1, ,,,
EXECUTIVESUMMARY
This report was prepared by Pacific Northwest Laboratory for the Office
of Civilian Radioactive Waste Managementof the U.S. Department of Energy.
This study was undertaken to demonstrate the capability to estimate the mois-
ture distribution within unsaturated fractured media in the vicinity of a
. hypothetical exploratory shaft facility (ESF) at the potential high-level
nuclear waste repository site at Yucca Mountain, Nevada.
+ The ESF is an important part of the subsurface-based site characteriza-
tion activities that are outlined in the Yucca Mountain Site Characterization
Plan. During the construction and operation of the ESF, methods will be
selected to minimize rock disturbances. However, some alterations in the
properties of rocks close to the excavations are to be expected. The objec-
tive of this study is to investigate the influence of these altered rock zones
on the distribution of moisture in the vicinity of the ESF.
This study is limited to investigation of extremely long-term (steady-
state) and short-term (on the order of 20 years) impacts of the ESF on the
moisture distribution in the unsaturated zone. The long-term effects are
important in the estimation of waste migr,_tion and fate, while short-term
effects may be important in the planning and interpretation of tests performed
in the ESF.
The PORFLO-3computer code was used for simulation of moisture flow
through the geologic units adjacent to the ESF. Rather than represent frac-
tures as discrete elements, an equivalent continuum was stipulated, in which
the fractured units were assigned equivalent or composite hydrologic proper-
ties. Explicit treatment of fractures is ,_ot feasible because of the
extremely large number of fractures contained in the site-scale problem and
, the difficulties in characterizing and modeling the fracture geometries.
A three-dimensional geometry was used for the simulations. The explor-
atory shafts and drifts and the altered property rock zones [called the mod-
ified permeability zones (MPZs) in the context of hydrology] associated with
them are represented as one-dimensional ine elements that are embedded in the
n_,.11,,[n ,rl _P.... +._pl,,+.... r,Hlpl'" r_', rllr_l, lip ,+rn,+n 11n,, 1,1, lr, ., ,q, ,, 'l;pnl + ,r, III 'ht" pl'"r'1,1' r, ..... Pl .... _,.r 'Pq1" H'"

general three-dimensional elements. The Ghost Dance fault, one of the
prominent structural and hydrologic features, is included in the calculation
domain. This fault is represented using two-dimensional planar elements. The
ability to incorporate one- and two-dimensional features within general three-
dimensional elem,nts is a unique feature in the PORFLO-3formulation.
The results of these simulations suggest that the MPZsaround thee
exploratory shafts may act as conduits for preferential flow of water in the
welded tuff units when locally saturated conditions and fracture flow occur.
However, given the moisture and flux conditions in these simulations, fracture
flow with an equivalent continuum approximation is limited to the Tiva Canyon
welded tuff unit. Also, with the initial moisture and flux conditions spec-
ified, the Topopah Springs welded tuff unit is sufficiently thick that most
episodic pulses of water from natural precipitation should not reach the
potential repository through fractures duc to capillary imbibition into the
rock matrix.
A potential for significant lateral flow above the interface between the
Paintbrush nonwelded unit and the Topopah Springs welded unit is shown by the
simulation results. Where laterally flowing water intersects preferential
flow paths or structural features, such as fault zones, locally saturated or
perched water-table conditions could develop, which could lead to fracture
flow in the Topopah Springs welded unit (i.e., the repository horizon). The
Ghost Dance fault was embeddedwithin the model domain for these simulations,
and was represented by using the hydraulic properties of a much more permeable
material similar to gravel. These hydraulic properties are estimates because
of the lack of site-specific data. The Simulations suggest that there will be
no appreciable change in the moisture-content distribution below the Tiva Can-
yon welded unit within 20 years after the construction of the ESF. Therefore,
even though excavations associated with the ESF will alter the fracture den- o
sities and permeabilities of the tuff units, the ambient moisture content and
distribution in the vicinity of the shafts should not change significantly
within a reasonable time frame for subsurface characterization work.
vi
_l_li_!', ................ 'I' ,r' ........ I ...... ,I ll_llI'............ ,I ' '!l....... _ " i,.... r','..........lp,"'"...... ' ..... II............fir_=,'_r',......_',...... _l,,_lllll_'"",'qrlf"_'I'_'_l,,.......iit,,,,,,_....

A relatively coarse grid was used for the model simulations, with the
shafts and fault embedded as one- and two-dimensional features within three-
dimensional computational cells. Therefore, the results from these model
simulations are not as accurate in proximity to tile shafts and fault as they
would be if these features were explicitly discretized in three dimensions.
In addition, relatively few data exist on the hydrologic properties of the
' vadose zone at Yucca Mountain. Considering the comparatively large scale of
this model, and theuncertainty of the hydrologic properties, the results
presented should be reasonable. However, these results are specific to the
discretization schemes, boundary conditions, and material properties used for
these simulations, and simply represent approximations of potential effects of
the exploratory shafts on unsaturated water flow at the Yucca Mountain site.
Postclosure thermal effects and vapor-phase transport of moisture caused
by heat generated from the potential repository were not considered .in this
study. However, these factors may have a significant effect on repository
performance. Therefor'e, postclosure modeling studies should consider noniso-
thermal flow and vapor-phase transport of moisture. The MPZs and shaft back-
fill material may become more important for future, smaller scale simulations
when coupled fluid flow, heat transfer, and mass transport are considered.
Future simulations with intermediate- and large-scale multidimensional
models of the potential repository should include site topography and surface
expressions of major fractures and faults to determine potential areas for
preferential local recharge. Then, spatially nonuniform, time-varying
recharge fluxes can be applied as surface boundary conditions to determine the
importance of time and spatial variation of surface recharge to the flow
fields in the natural system at depth.
vii
CONTENTS
ABSTRACT............................. ii i
EXECUTIVESUMMARY ....................... v
1.0 INTRODUCTION ....................... 1.1,,
' 2.0 MODELDESCRIPTION . . ........ 2.1q
2.1 GEOMETRYOF CALCULATIONDOMAIN ............ 2 I
2.2 HYDROLOGICPROPERTIES ................ 2 3
2.3 INITIAL CONDITIONS ................. 2 12
2.4 BOUNDARYCONDITIONS ......... ....... 2 13
3.0 COMPUTERCODEDESCRIPTION . . ................ . 3 I
4.0 RESULTSANDDISCUSSION..................... 4 I
4. I STEADY-STATESIMULATIONS ................. 4 i
4.2 TRANSIENTSIMULATIONS................... 4 12
5.0 CONCLUSIONSANDRECOMMENDATIONS............... 5 I
6.0 REFERENCES................... ....... 6 I
ix
FIGURES
1,1 LocationMap of the YuccaMountain Site, Nevada .......... 1.2
1.2 ConceptualExploratoryShaft Facility. ............. 1.3I
2.1 _,YuccaMountain PORFLO-3ComputationalGrid ........... 2.2
2.2 Matrix HydraulicConductivityCurve and RelativeHydraulicConductivityand SaturationCurves forUnit PTn ........................ ..... 2.6
'4
2.3 Matrix HydraulicConductivityCurveand RelativeHydraulicConductivityand SaturationCurvesforUnit Chnv ............................ 2.7
2,4 CompositeHydraulicConductivityCurve and RelativeHydraulicConductivityand SaturationCurvesforUnit TCw ........................ , . , . 2.8
2.5 CompositeHydraulicConductivityCurve and RelativeHydraulicConductivityand SaturationCurvesforUnit TSwl ............................ 2.9
2.6 CompositeHydraulicConductivityCurve and RelativeHydraulicConductivityand SaturationCurvesforUnit TSw2-3 ........................... 2.10
2.7 HydraulicConductivityCurve RepresentingShaftsand Driftsand RelativeHydraulicConductivityand SaturationCurvesRepresentingShafts and Drifts in Unit TSw2-3 .......... 2.11
4.1 SaturationProfileand PressureDistributionfrom theCenter of the Model Domainfor the Case ISimulation ...... 4 3
4.2 SaturationProfileand PressureDistributionfrom theCenter of the Model Domainfor the Case 2 Simulation ...... 4 4
4.3 SaturationProfileand PressureDistributionThroughtheLine ElementRepresentingES-I for the Case 2 Simulation .... 4 5
4.4 VerticalCross Sectionof Darcy VelocityVectorsThroughPlane IntersectingES-I for the Case 2 Simulation........ 4 6
4..5 HorizontalCross Sectionof Darcy VelocityVectorsThroughtheLower Part of Unit TCw for the Case I Simulation ........ 4 8
4.6 HorizontalCross Sectionof Darcy VelocityVectorsThroughtheLower Part of Unit TCw for the Case 2 Simulation ........ 4 8
lilt_B '_....... _' _Ip_ '" ,........ ,,,,_,,.... _,_llr,_,'rrlqrli11_Ir''H .... q'' " 'i""' llr"......

4,7 PressureDistributionin HorizontalCross SectionThroughLower Part of Unit TCw for the Case 2 Simulation ...... 4 9
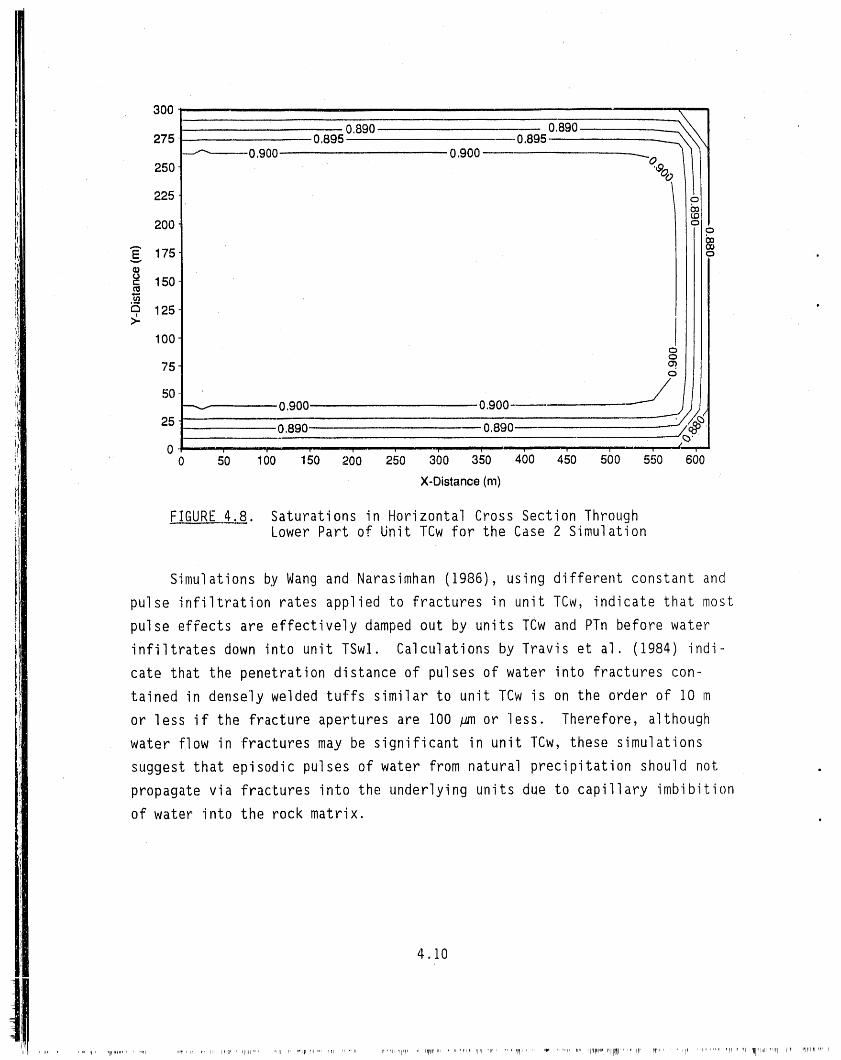
4.8 Saturationsin HorizontalCross SectionThroughLowerPart of Unit TCw for the Case 2 Simulation ...... 4 10
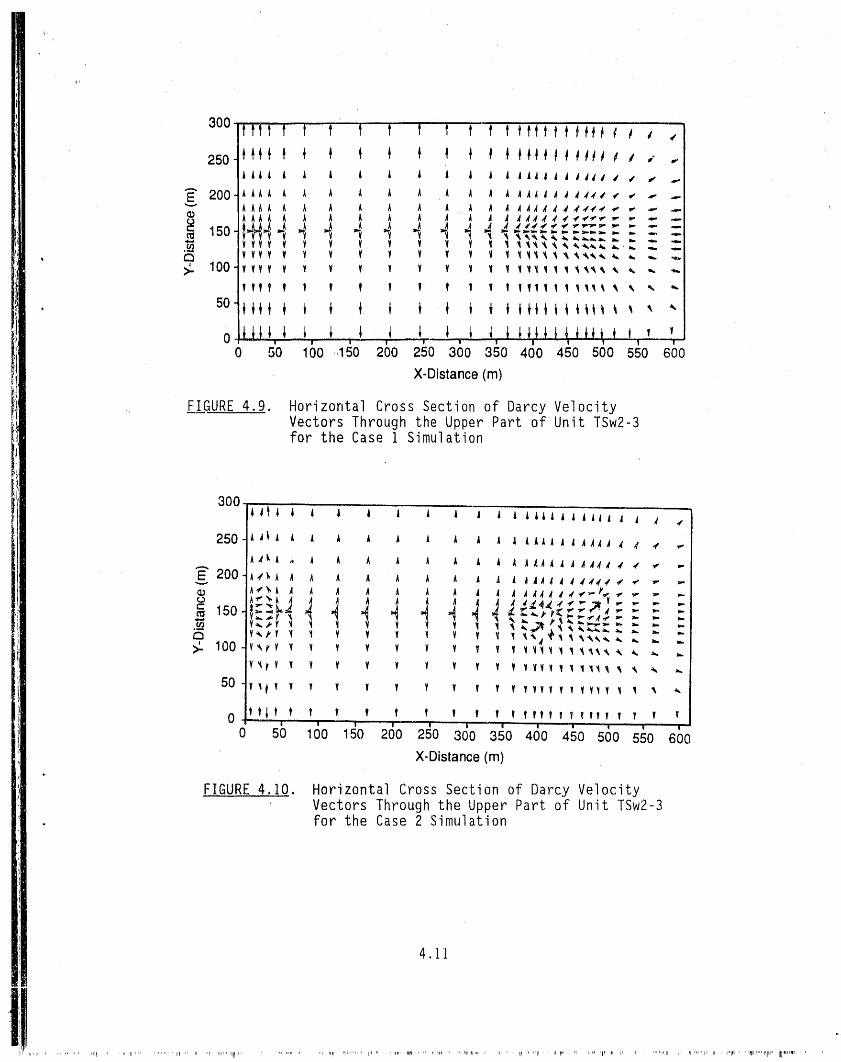
4.9 HorizontalCross Sectionof DarcyVelocityVectorsThroughthe Upper Part of Unit TSw2-3 for the Case I Simulation.. . 4 11
. 4.10 HorizontalCross Sectionof DarcyVelocityVectorsThroughthe Upper Part of Unit TSw2-3 for the Case 2 Simulation. . , 4 11
• 4.11 PressureDistributionin HorizontalCross SectionThroughUpper Part of Unit TSw2-3 for the Case 2 Simulation..... 4 12
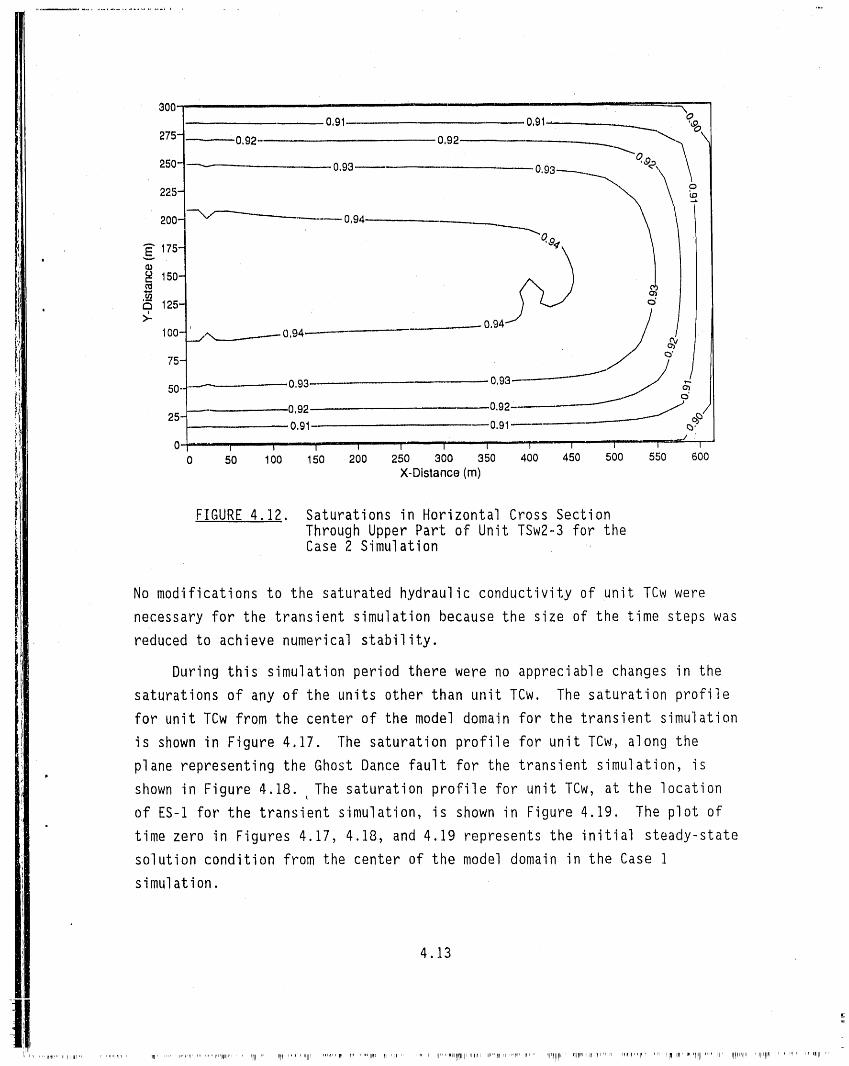
4.12 Saturationin HorizontalCross SectionThroughUpper Part of Unit TSw2-3 for the Case 2 Simulation.... 4 13_
4.13 HorizontalCross Sectionof Darcy VelocityVectorsThroughthe PotentialRepositoryHorizonin Unit TSw2-3 for the Case ISimulation ........................... 4,14
4.14 HorizontalCross Sectionof Darcy VelocityVectorsThroughthe PotentialRepositoryHorizonin Unit TSw2-3 for the Case 2Simulation ............ . . .... 4.14
4.15 PressureDistributionin HorizontalCross SectionThrou,gh the PotentialRepositoryHorizon in Unit TSw2-3for the Case 2 Simulation. . . ................. 4.15
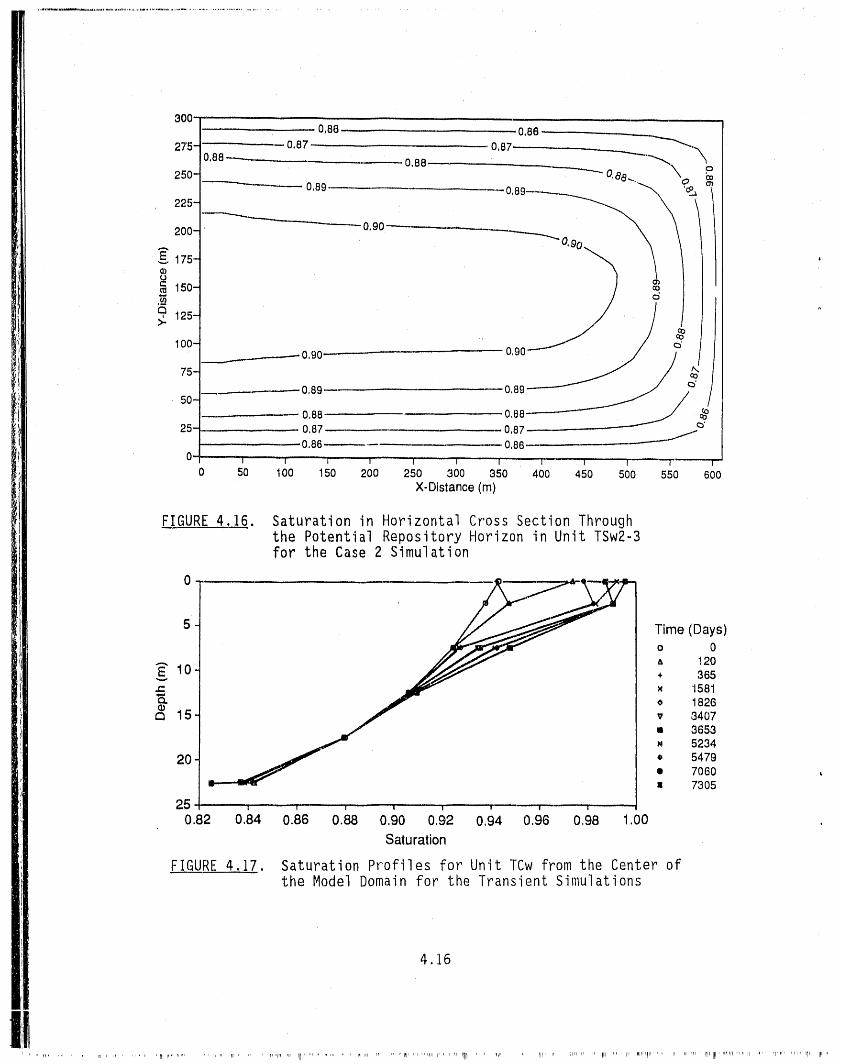
4.16 Saturationin HorizonalCross SectionThroughthe PotentialRepositoryHorizon in Unit TSw2-3for the Case 2 Simulation, , , 4.16
4.17 SaturationProfilesfor Unit TCw from the Center ofthe Model Domain for the TransientSimulations ......... 4.16
4.18 SaturationProfilesfor Unit TCw Along the PlaneRepresentingthe Ghost Dance Fault for the TransientSimulations.......... ................. 4.17
4.19 SaturationProfilesThroughthe Line ElementRepresentingES-I in Unit TCw for the TransientSimulations ......... 4.17
xi
, ,i, ....... ,Irl ' rr '111 ,rl I'r qllF' _' ,IIII,_,,j,,,_H,,,,,,,rlll,,,,i,p i, , rl, , '_r'lrrf' ,,,i, llll ' "ll IIp,l_if,lrlP""TI,r' illi , , ' ii,tr 'rl_I .... Irlllr ..... ,.... IIIp,H'

TABLES.
2.1 Fracture Characteristics of Hydrologic Units .......... 2,3
2.2 Parameters for Matrix Hydrologic Properties ........... 2,4i
2.3 Saturated Hydraulic Conductivity Multiplying Factorsfor the Modified Permeability Zone ............... 2.11
2.4 Initial Conditions for the Case i Steady-State Simulation .... 2.13
xii
rip ....... q' iir.... H17 , ,m 'lq ' _P q_' ,' Pl " "q I_ HIll II '.'",', , I1 II qiP' q_il'_' ai' 'q_lN '_ ' rq I,Illaa I1 H,r_HIpr]qr, i I'l'H '1M " lP ' lr' HI'IIH,' _QJq' "'

1.0 INTRODUCTION
Thegeologic formations in the unsaturated zone underlying Yucca
Mountain, Nevada, are being evaluated by the U.S. Department of Energy as the
potential location for a high-level nuclear waste repository. Investigations
are currently under way to evaluate the hydrologic conditions, processes, and
properties of the unsaturated zone at this site.
, Yucca Mountain consists of a series of north-trending fault-block ridges
composed of volcanic ash-flow and ash-fall tuffs that generally have a
regional dip of 5 to 7 degrees to the east (Scott and Bonk 1984). Someof
the welded tuff units are highly fractured, which requires that the hydrol-
ogic properties of these units be evaluated before estimating the rate at
which radionuclides could migrate to the accessible environment. Determining
the significance of fracture flow at Yucca Mountain is important because the
estimated continuum-saturated hydraulic conductivlties of the welded tuff
units are up to three orders of magnitude greater than the saturated hydrau-
lic conductivities of the matrix in the welded tuffs (Peters and Klavetter
!98_). Therefore, if fracture flow is significant, it could greatly reduce
the travel time of water percolating downward through the potential reposi-
tory horizon. The equivalent continuum approximation that was used to
represent the hydraulic properties of the fractured, welded tuffs is
described 'in Section 2.2. The potential repository area, depicted in
Figure i.I, is bounded by steeply dipping faults or by fault zones, and is
transected by a few normal faults. Therefore, the effects of fault zones on
unsaturated water flow and contaminant transport should be investigated.
The exploratory shaft facility (ESF) is an important part of the
subsurface-based site characterization activities that are outlined in the
Yucca Mountain site characterization plan (DOE1988, 1989)o The ESF will
consist of surface facilities and underground excavations, as conceptualized
in Figure 1.2. The underground excavations include two 4.4-m-diameter shafts
(called ES-I and ES-2) connected by drifts at the potential repository hori-
zon. Descriptions of 34 test activities to be performed in the ESF are,,
provided in thesite characterization plan. While the construction and
operation methods will be selected to minimize rock disturbances, some
I.I
,rl_,,i'ill nlFU" , n,,',,ll...... N_l,,rllr,ill_ i 7_,_llU,rl',rllrUl"rlqr' ,'r, ,'lqqr,_r,_r,,_l,,,pm, iiilql,,_rl,,lr,_qnp,r....fql_irlr,,,,_,,,p,_,,rl,l,_r_rq, ,_......m_,l,rr,.,iillUrp,,_i_r, , , ,Irl,,_r,,,...... I' Imll!qIBrlllllllI ,l,l'l...... ,,,,'

CONTOUR INTERVAL 20 FEET
I
I
t "I: _ F ....... "7 "
\ i .... ,.> NAFR L
_, ,,. I
j , L, ....,, .-_ "1 Ii NTS i I I-,--i
J i i i=
. LAS VEGAS '
\, i _.. I <:
_,\ (' -'-,' .....
N765000 - ' 1 _'P4"_
' ,)
'\. !
\ k
•\. '_
(t ,o_o ,o25 0 25 50 Miles
it # Reference Location of
Proposed Repository
CONTOURINTERVAL100FEETN755000- I I
E560_ E565000
YUCCA MOUNTAIN SITE
FIGURE 1.1. Location Map of the Yucca Mountain Site, Nevada(after Lin et al. ]986)
alterations in properties of the rocks close to the excavations are to be
expected. Therefore, it is important to determine the potential effects of
these altered-rock zones [also referred to as modified permeability zones
(MPZs)] on the moisture distribution in the vicinity of the ESF.
1.2

This study is limited to investigation of extremely long-term (steady-
state) and short-term (on the order of 20 years) impacts of the ESF on the
moisture distribution in the unsaturated zone. Long-term effects are impor-
tant for estimating the migration and fate of wastes, while short-term
1.3
Ii, ,q.... rl Ill rf,' ', rl,,,,N .... ,I " llqm'',Ifr "+I' ',',....... _,ir,','r,.... +'_ . , ...... ,rl_," ,_, " 11' ql_, ' ' III..... III ' _ll'll'l_ 11'PTF"_ _,r ',, ,,,, ,',i,i .... ,IPl' '_ ..... Pl ,_,H = r,ll[ ,,ppll_l,,_iil,,ip,m, rl , rf,l,
effects may be important in the planning and interpretation of the tests
performed in the ESF. This study is focused primarily on short-term effectsof the ESF on the unsaturated zone.
,
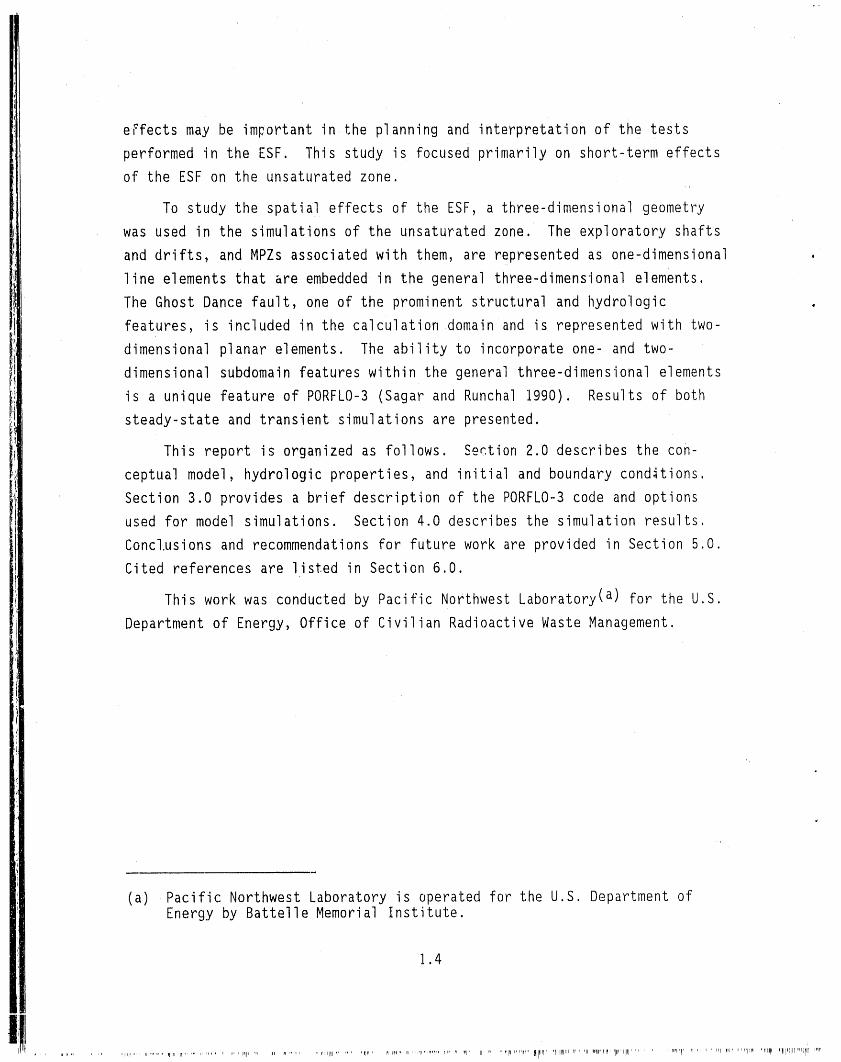
To study the spatial effects of the ESF, a three-dimensional geometry
was used in the simulations of the unsaturated zone. The exploratory shafts
and drifts, and MPZsassociated with them, are represented as one-dimensional
line elements that are embedded in the general three-dimensional elements.
The Ghost Dance fault, one of the prominent structural and hydrologic
features, is included in the calculation domain and is represented with two-
dimensional planar elements. The ability to incorporate one- and two-
dimensional subdomain features within the general three-dimensional elements
is a unique feature of PORFLO-3(Sagar and Runchal 1990). Results of both
steady-state and transient simulations are presented.
This report is organized as follows. Section 2.0 describes the con-
ceptual model, hydrologic properties, and initial and boundary cond.itions.
Section 3.0 provides a brief description of the PORFLO-3code and options
used for model simulations. Section 4.0 describes the simulation results.
Concl.usions and recommendations for future work are provided in Section 5.0.
Cited references are listed in Section 6.0.
This work was conducted by Pacific Northwest Laboratory( a) for the U.S.
Department of Energy, Office of Civilian Radioactive Waste Management.
(a) Pacific Northwest Laboratory is operated for the U.S. Department ofEnergy by Battelle Memorial Institute.
1.4
"llllIl I ...... _l_l lI II l_ li rl+ 'III1''n+''ll Ip" r' ,ll,lrl IP ..... ,iPl,,riI,t,, _ll+_+ir,T111111rl,Pl', 'II II+ItIPR'Irllll'IIII ...... +I'll1I' _r,r ,' rs111PllP ''"lllm I _l+__ _1111111'+'Hlllr IPIIP

2.0 _.ODELDESCRIPTION
2.1 GEOMETRYOF CALCULATIONDOMAIN
For the purpose of these simulations, the lithologic units at Yucca
Mountain have been grouped into five hydrologic units: I) the Tiva Canyon
. welded unit (TCw); 2) the Paintbrush Tuff nonwelded unit (PTn); 3) the
Topopah Springs welded unit I (TSwl); 4) the Topopah Springs welded units 2
. and 3, which are treated as a single composite unit (TSw2-3); and 5) the
Calico Hills nonwelded vitric unit (CHnv). The thicknesses of these units
are 25, 40, 130, 205, and 130 m, respectively. These thicknesses are based
on the stratigraphy of borehole USW-G4,which is located near the eastern
edge of the potential repository boundary.
The decision to treat TSw2 and TSw3 as a single unit (TSw2-3) is based
on the similarity of the hydrologic properties of the two units and the
relatively small thickness of TSw3 (15 m) relative to that of TSw2 (190 m).
The potential repository is to be located within unit TSw2-3 at a depth of
approximately 310 m below the ground surface (with reference to borehole
USW-G4). i
Computations were performed in a three-dimensional cartesian grid sys-
tem. The axes of this system are aligned with east-west (X-axis), north-
south (Y-axis), and vertical (Z-axis). The dimensions of the calculation
domain are 615, 300, and 530 m in the X-, Y-, and Z-directions, respectively.
A total of 25,056 nodes (29, 16, and 54 in the X-, Y-, and Z-directions,
respectively) were used to represent this domain for numerical calculations
(Figure 2.1). The Ghost Dance fault, which is located near the west bound-
ary, is represented with vertical planar elements (two dimensional), extend-
ing from the ground surface to the water table. The exploratory shafts (ES-I
and ES-2) are represented as vertical line elements (one dimensional),
extending from the ground surface to a depth of approximately 310 m (i.e., inv
unit TSw2-3). The shaft elements are connected by offset horizontal line
elements, representing connecting drifts, at the 310-m depth. The explora-
tory shafts and drifts have a 4.4-m diameter and are assumed to have zones of
modified permeability around them, which extend I m beyond the edges of the
2.1
|

shafts and drifts. Case and Kelsall (1987) report the value of I m as an
upper bound estimate of the expected MPZ dimension for fractured, welded
tuff.
The shafts and fault are positioned within the model domain with refer-
ence to borehole USW-G4 (Scott and Bonk 1984; Fernandez et al. 1988). The
geometry of the computational grid was designed in consideration of the
spatial position of the exploratory shafts relative to the Ghost Dance fault.
The line of symmetry dividing the north and south halves of the model domain,
indicated by the finer spaced grid,, roughly corresponds with the position of
2.2
'I , '.... I ......... ,t '_1' _1 .... _ "' "q_l'l II...... ,I ..... irl_l'_i' '|1' _"_11_'' '" _1_I....... Ilml'l_ ....... I_ " _II '"tip

Coyote Wash, which is an east-west-trending watershed that drains off Yucca
Ridge, located to the west. Tile intersection of Coyote Wash with the Ghost
Dance Fault is a potential location for preferential local recharge, The
finer grid spacing could be used to represent, preferential recharge in futureJ
simulations.
2.2 HYDROLOGICpROPERTIES
The welded tuff units (TCw, TSwl, and TSw2-3) are distinguished hydro-
logically from the nonwelded units (PTn and CHnv) by their matrix hydraulic
conductivities and observed fracture density. Table 2 1 lists the fracture
characteristics of the five tuff units.
Although thera are no direct measurements of fracture properties, the
hydrologic properties of the rock matrix and the fractures are expected to
differ considerably, with respect to both saturated and unsaturated condi-
tions. The saturated hydraulic conductivities for the bulk rock containing
TABLE 2.]. Fracture Characteristics of Hydrologic Units(after Peters et al. 1986)
Fracture Fracture Fracture
Sampl_ Aperture Density{ b) Fractu_ Cor,ductivityUnit Code ) _micronsl (no./m 3) ...... Porosit c) (m/s)
TCw G4-2F 6.74 20 1.4E-4 3.8E-05
PTn G4-3F 27.00 I 2.7E-5 6.1E-04
TSwl G4-2F 5.13 8 4.1E-5 2.2E-05
TSw2-3 G4-2F 4.55 40 1.8E-4 1.7E-05
CHnv G4-4F 15.50 3 4.6E-5 2.0E-04
(a) Fracture properties were measured on a limited number of samples• using confined fracture-testing methods described by Peters et al.
(1984). The differences in the fracture properties of the threewelded units (TCw, TSwl, TSw2-3) reflect different confining
• pressures representing overburden weight evaluated at the averageunit depth in borehole USW-G4.
(b) Based on a report by Scott et al. (1983).(c) Fractures are assumed to be planar; therefore, fracture porosity is
calculated as fracture volume (aperture times I mz) times number offractures per cubic meter.
2.3
L
i
i_ ',l, ........ rl,,,Wlr,, 'r_ I,,_"l 'lrll, ']P "_ql_.... Itri Ill,,Ipl,'lF ilal IIFOi,, ,ra1 .... Nrl,li ,, _,,,llll_,' ,qmll, ,FI_, _ .... ,'ra' ",ali ,_ ' ,lllrln" ,rl rar
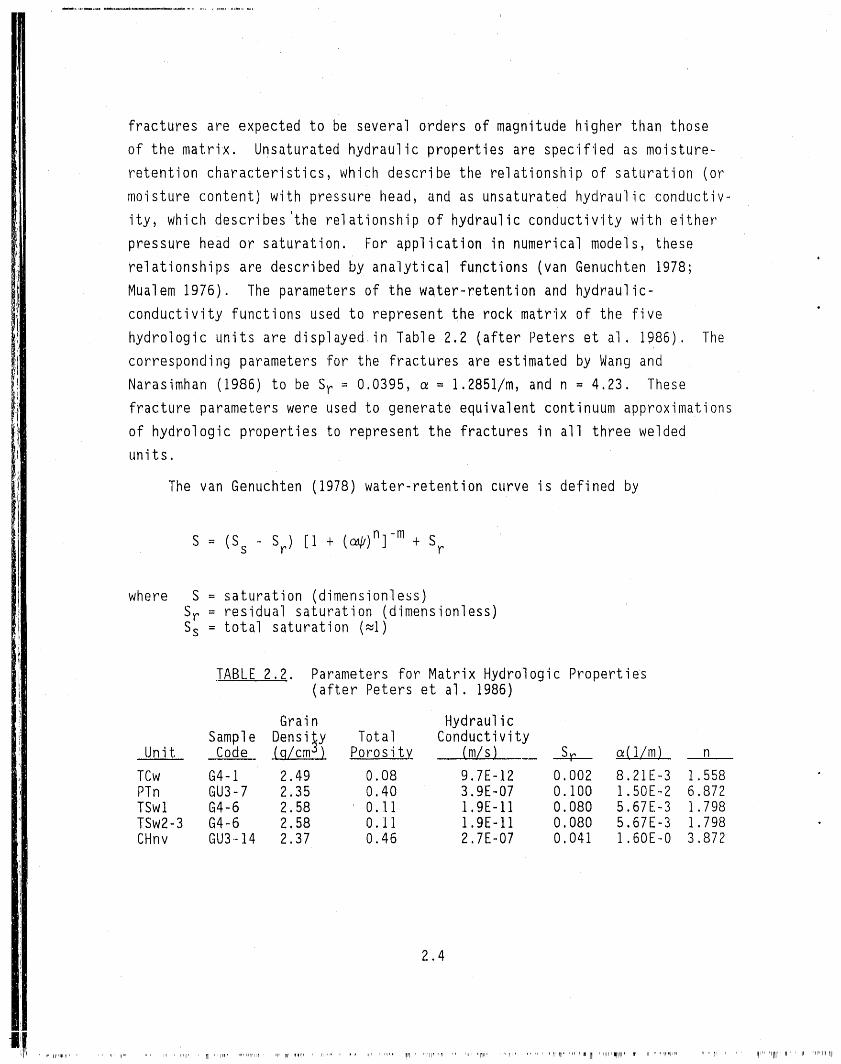
fractures are expected to be several orders of magnitude higher than those
of the matrix. Unsaturated hydraulic properties are specified as moisture-
retention characteristics, which describe the relationship of saturation (or
moisture content) with pressure head, and as unsaturated hydraulic conductiv-
ity, which describes'the relationship of hydraulic conductivity with either
pressure head or saturation. For application in numerical models, these
relationships are described by analytical functions (van Genuchten 1978;
Mualem 1976). The parameters of the water-retention and hydraulic-
conductivity functions used to represent the rock matrix of the five
hydrologic units are displayed in Table 2.2 (after Peters et al. 1986). The
corresponding parameters for the fractures are estimated by Wang and
Narasimhan (1986) to be Sr = 0.0395, _ = 1.2851/m, and n = 4.23. These
fracture parameters were used to generate equivalent continuum approximations
of hydrologic properties to represent the fractures in all three welded
units.
The van Genuchten (1978) water-retention curve is defined by
S = (Ss - Sr) [i + (c,_wj)n]-m + Sr
where S = saturation (dimensionless)Sr = residual saturation (dimensionless)Ss = total saturation (=I)
TABLE 2.2. Parameters for Matrix Hydrologic Properties(after Peters et al. 1986)
Grain HydraulicSample Density Total Conductivity
Unit Code (g/cm _ ) Poros i t._ . (m/s,L__ sr _(i/m) n
TCw G4-I 2.49 0.08 9.7E-12 0.002 8.21E-3 1.558 •PTn GU3-7 2.35 0.40 3.9E-07 0.100 1.50E-.2 6.872TSwl G4-6 2.58 0.11 1.9E-11 0.080 5.67E-3 1.798TSw2-3 G4-6 2.58 0.11 1.9E-11 0.080 5.67E-3 1.798 •CHnv GU3-14 2.37 0.46 2.7E-07 0.041 1.60E-0 3.872
2.4
. '" Ii ...... 'vi'l' Pfr...... n itr '_r'lIIl;' "' lr .... Irl,q... Ipi.. rqI1i'' ,'' i, ur"II'lJl

= capillary pressure head (L)
n, m = empirical parameters (dimensionless)
= inverse air-entry pressure head (L'I).
The eff'ective porosity, _e, of each unit is calculated as
_e : ¢_D(I " Sr) (2.2)
where ¢_Dis the total or bulk porosity listed in Table 2,2.
In this analysis, rather than represent the fractures as discrete ele-
ments, an equivalent continuum is stipulated, in which the fractured units
are assigned equivalent or composite properties (Peters and Klavetter 1988).
Explicit treatment of the fractures is not feasible because of the extremely
large number of fractures contained in the site-scale problem and the
difficulties in characterizing and modeling the fracture geometries.
In the equivalent continuum approximation (Peters and Klavetter 1988),
the fracture porosity, _f, can be defined as the ratio of the fracture volume
to the total bulk rock volume. The matrix porosity, ¢_n, can be defined as
the ratio of the volume of the voids in the matrix (excluding fracture void
space) to the volume of the matrix. A bulk, equivalent porosity, ¢_D, can
t llen be defined after Nitao (1988) as
_D : _f + (I - _f)C_n (2.3)
Given the saturation of the fractures, Sf, and matrix, Sm, the equivalent
bulk saturation, Sb, can be defined as
• S_f__Z__+ Sl_._f)¢_ (2.4)Sb : _f + (1 - _f}_n
t
The weighting procedure of Klavetter and Peters (1986) is used to obtain the
equivalent bulk hydraulic conductivity
Kc = Km(1 _f) + Kf_ (2.5)
2.5
Iip' .... '_' I1"' " lPl Ill'rill nif "' ii_, _ li. ,,,i,_ ,,,, ,,irq,i....... I_'lr,, ,,, 11_ II _rr, , qqr" " ,r_' , ' _" '_..... ,11_ I,l':lr. "lt ',,,'_e_ rl' ii 'l,ar,_nl' ,., , ,, Iqpl, , lr ' tri ' "ql"q'"rlrlllrI''llrqq'llll ..... "?lP 'll_P

where Kc, Km, andKf are the composite,matrix,and fractureconductivlties,
_respectively.
Becausethe two nonweldedunits have relativelyfew fractures,their
, composite properties are approximately equivalent to those of the rock
matrix. Thus, for PTn and CHnv, the properties listed in Table 2,2 are used
directly in the van Genuchten (1978) and Mualem (1976) equations. Graphic
representations of the properties of these two units are shown in Figures 2,2
and 2.3. In Figures P..2a and 2.3a, hydraulic conductivity is plotted as a
function of pressure head. In Figures 2.2b and 2.3b, relative hydraulic
conductivity and pressure head are shown as functions of saturation.
Figure 2,4a shows the composite hydraulic conductivity curve for the
TCw unit. A large jump in the value of the composite hydraulic conductivity
1E-5 1ES _. 1
1E-B 1E.5 f K - 1E-2
/rn 1E-7 - 1E-3_E4
E _' 1E.-4
1E-B E 1E-5 ,--._' I 1ooo ,_>'-- _-J 1E-6> 1E-9 U•o I/I .oo 0 100 _ 1E-7 "El
q.) r"lE-lO Z13 1E-8 0
U0 0 10L 1E-B t_
1E-11 _ :>ol 1E-10
,_ ol 0
1E--12 1E-11 oJ
" 1E-12._ 1E-1
_. 1E-13 r 1E-13
tE-14 1E-2 tE-14
1E-15
IE-15 _= 1E-3 - -_--J--, • . I . , I , 1E-18
1_'-3.,_'-_1_'-__ _o _oo1ooo_',, o.o o.,. o.:_ o.B o.8 _.oPressure Head (-m) Saturation •
FIGURE2.2. (a) Matrix Hydraulic Conductivity Curve and (b) Relat, iveHydraulic Conductivity and Saturation Curves for Unit PTn
L
2.6
t_ I ','111 r ".... rll' " II_'lr_l'llH ....... lTI, rltllli,,Fq',, ,,rl_ .... I,,' ,,, m'" ,r' ',_,',,'' ' ,_l' , n,II .... ' ..... I1'1 ''_"" '"'ht"' " "i"'ll_'l= " I'I' IHii,r

1E-5 1Eli . _ 1
_'_ IE-I
ul 1E-7lE+ '
E _ IE-4V E 1E-_ ,_"._ I tooo- _-_ 1E-_B "+'_
+ "I
u o 100 _ . 1E-7 -o-1 q) r-
O"I_ 1E-10 "1- "_ 1E-8C0 _ 10 -_ 1E-9 q)
' 0 1E-11 _ >O ol - . 1E-10 _+_
cn
D 1E-_12 _ I - 1E-11 cD
I - iE-12:>_ t 1E-1
"1" 1E-13 i - 1E-13
' 11E.-14 1E-2 - 1E-14
- 1E-15
1E-15 ..... _ .... _ .... ..i ,,,,_ ..... _ " _ ..... 1E-3 _ I ,,, I , I , I,, - 1E-16
1E-3 1E-2 1E-1 1 10 100 1000 1E4 0,0 0,2 0,4. 0.8 0.8 1,0
Pressure Head (-m) Saturation
FIGURE 2.3. (a) Matrix Hydraulic Conductivity Curve and (b) RelativeHydraulic Conductivity and Saturation Curves for Unit Chnv
at a certain value of pressure head (=-I In in Figure 2.4a) is a distin-
guishing characteristic of the composite curve. In physical terms, the
discontinuity indicates that at a pressure head of -I m (or the corresponding
value of moisture content) flow switches from the matrix-dominated to the
fracture-dominated flow and vice versa. This abrupt change in the hydraulic
conductivity introduces extreme nonlinearity in the problem, which can lead
to numerical instabilities. Figure 2.4b shows the composite relative con-
ductivity and pressure head as functions of saturat, ion for the TCw unit.
, Figures 2.5 and 2.6 show the composite hydrologic properties of the TSwl and
TSw2-3 units. In the numerical model, the discontinuous continuum curves
cannot be easily represented by the analytical expression. Therefore, the
hydrologic properties of the TCw, TSwl, and TSw2-3 units are introduced in
tabular form rather than the analytic van Genuchten relation.
2.7
'['-Pl_l ' ' =rlll ...... II_ .... 1.... lI'11r " 'I" ,'fl ' III ,r, " h' .... I....... IrIHIP..... - nllr' ' "lP' H' r, ' llm, r,lll,h' Irl' 'II, 111..... ,, ,..... "Plllr"%1 I':" +I!

1E-5 1E8 I
IE-I
1E-6 IE5 1F.-2
rf) IE-7 IE-3IE4
E ...--., - 1E-4
--, _E-8 r-.-.,_.-.-.-,,_ E '" _E-_ _-'-P l '°°° r-- "'J -, 1E'-;8 t,j
o I o ,oo ./ -I": 1E--8 0
C rJ
o _ _ lo 1E-gC.) 1E-1 1 :::3 . .
ol 1E-10 '._,L,) ="o. r,.n O
_- 1E-,12"o _ 1E-1::[: 1E-13
1E-14 \ 1E-2 1E-14
1E-1_1E-15 _. ' '"_ ..... -"- 1E-,3 ._.L_._L__..J_...._L_ 1E-16
_E-__-_-i ,i _o 400,iooo1E4 o,o o,_. 0,4 o,B 0,8 _,o
Pressure Head (-m) Saturation
FIGURE 2,4_. (a) Composite Hydraulic Conductivity Curve and (b) RelativeHydraulic Conductivity and Saturation Curves fur Unit TCw
Calculations, based on the continuum properties, are valid assuming that
there are enough fractures of varied orientation to ensure continuum behav-
ior. According to Pruess et al. (1990), the continuum approach will gener-
ally break down for process=.s involving rapid transitions and for conditions
of a very tight Yock matrix or large fracture spacing. These calculations
are also based on the assumption that each hydrogeologic unit is homogeneous,
except where hydrologic properties have been modified for the shafts, drifts,
MPZs, and Ghost Dance fault. Isothermal conditions also are assumed,
although the PORFLO-3 code will solve nonisothermal flow and transport prob-
lems as well.
The air-entry pressure heads (i/_ in the van Genuchten model) for the
MPZs associated with the shafts and drifts in each unit are assumed to be
half as great as the air-entry heads of the rock matrix in each unit. This
2.8
'_" ..... ',, "_p_lr" ""'"'"' IIIIH....... 1 .......... I IIIsl''_....... rl ,_ ..... ,_,,,, H,,,,r.....i,.... ,.,............... 'l_.....Iq'r' '','r_"' IIIll.... FIf_,p,.II,,smrrs....... I,,IIII,..... "111'"' II_FIIII'",'I' ' ''" ..... II,_,,ll,rl'_,

_E 2.5. (a) CompositeHydraulicConductivityCurve and (b) RelativeHydraulicConductivityand SaturationCurvesfor Unit TSwl
modificationis somewhatarbitrarybecausedata ,arenot available,but
reFlectsthe assumptionthat the excavationprocesswill changethe pore-size
distributionin the MPZs such that the MPZs will effectivelybehaveas a
coarserporousmedium than the undisturbedrock matrix. The van Genuchten
model "n" parameter,used to representthe MPZs, was the same as that used to
representthe undisturbedrock matrix, The saturatedhydraulicconductivi-
ties of the MPZs are assumedto be40 and 80 ti:,esgreaterthan those oF the
undisturbedmatrix in units TSwl and TSw2-3,respectively.These multiplying
, factors are based on the upper bound estimates reported by Case and Kelsall
(1987), as shown in Table 2,3. The saturated hydraulic conductivity of the
MPZs in unit TCwwas assumed also to be 80 times greater than t,he matrix
hydraulic conductivity of this unit. This assumption was based on the simi-
larity of fracture densities and porosities between the TCwand TSw2-3
units,as shown in Table 2.1. For the nonweldedunits (PTnand CHnv), the
saturatedhydraulicconductivitiesof the MPZs were assumedto be 20 times
2,9
4
i
iIi 'l_l' ' ' ll""rl I 'PIlp, r, , ', ,ii I ..... +_" "Irl' "'* lll'r ' "qH i11rllll "=_ ,I,P ' Ill Pm'p' ..... II" , i Ill III11 "' IH' '#' ,l lpll'

E.!.GURE2,6, (a) Composite Hydraulic Conductivity Curve and (b) RelativeHydraulic Conductivity and Saturation Curves for Unlt TSw2-3
higher than the hydraulic conductivities of the matrix of each unit. The
nonwelded units have a much higher porosity and lower fracture density than
the welded units. Therefore, it was assumed that permeability modifications,
resulting from shaft construction in these units, would be less extensive
than for the welded units. Ali other properties of the MPZs 'in each unit are
assumed to be equal to the properties of the undisturbed rock matrix in the
units.
The hydraulic properties of the shafts and drifts are represented with
parameters that describe the properties of a coarse material such as gr_vel,
The van Genuchten (1978) model retention curve parameters used to represent
the shafts and drifts are: Sr = 0.0, e = 1.0, and n = 6,2, Figure 2.7 shows
•these curves graphically, These water-retention characteristics were
selected to create a capillary barrier, effectively restricting flow into the
shafts and drifts until the surrounding MPZsare close to saturation. Each
section of the shafts and drifts was assigned a saturated hydraulic
,2,10
II _'IIIl l l'''lll i rll I l lllll l 111111'll l_ lr l -rl ...... -X = _l -l III . II----' _ll_ 'l

TABLE 2.3, Saturated Hydraulic Conduci;iyity Multiplying Factors for theModified Permeability Zone[a) (after Case and Kelsal 1987)
Stress Redistribution ,Without Blast Damaqe Expected( b) Upper Bound(c )
Depth (m) Elastic Elastop]ast:Ic, Case CaseI00 15 2O 2O 4O
310 15 40 20 80
. (a) Equivalent permeability is averaged over an annulus one radiuswide around the 4.4-m-diameter exploratory shaft.
(b) This is based on an elastic analysis with expected strength,in situ stress, sensitivity of permeability Lo stress, and aO.5-m-wide blast-damage zone,
(c) This is based on an elastoplastic analysis with lower boundstrength, upper bound stress, greatest sensitivity ofpermeability to stress, and a l.O-m-wide blast-damage zone.
FIGURE2.7. (a) Hydraulic Conductivity Curve Representing Shafts and Driftsand (b) Relative Flydraulic Conductivity and Saturation CurvesRepresenting Shafts and Drifts in Unit TSw2-3
2.1'I
'1" rlql"l'li .. .. rqpll..,q...lr ._-'-ipH-rR=I -.---.. "'11 ==ll " II q' ' II pl....... _llpq .... I 'r_rll I' ' "l='

conductivity value I000 times greater than the saturated hydraulic conductiv-
ity of the MPZ adjacent to it. Thus, the rate at which water flows through
the shaft and driftelements is governed by the hydraulic conductivity of the
adjacent MPZs.J
No data are available regarding the hydrologic properties of the rub-
bliZed shear zone around the Ghost Dance fault. Therefore, the fault MPZ i
was arbitrarily modeled as 0.5 m wide, with an air-entry pressure head half
as great as the air,entry pressure head of the rock matrix. Saturated
hydraulic conductivities were taken to be 40 times greater than the undis-
turbed matrix saturated hydraulic conductivities of each unit. Tile
van Genuchten (1978) "n" parameters that were used to represent the fault
were the same as those used to represent the matrix in each unit adjacent to
the fault.
2.3 INITIAL CONDITIONS
Two steady-state simulations were performed. In the first, or Case I,
the initial conditions were prescribed as uniform saturation in each unit.
The saturation percentages used were determined from core samples from
various units at Yucca Mountain, reported by Montazer and Wilson (1984).
From these reported average saturation values, pressure heads were calculated
for input as initial conditions to Case I simulations, using the matrix
water-retention curve parameters listed in Table 2.2. These average satura-
tion values and initial pressure heads for the various hydrologic units are
listed in Table 2.4. The shafts, drifts, and MPZ subdomain elements were
excluded from the Case I simulation• The Case I simulation was performed to
establish the initial conditions for Case 2.
The steady-state vertical pressure distribution from the approximate
center of the model domain in the Case I simulation was used as the initial
pressure distribution everywhere in the domain for the Case 2 simulation to
ensure that the specified boundary conditions were consistent with the
internal solution. In the Case 2 simulation, the shafts, drifts, and MPZ
subdomain elements were included in the model domain. The steady-state

TABLE 2+4. Initial Conditions for the Case I Steady-State Simulation(saturation values from Montazer and Wilson 1984)
Unit Averaqe Saturation Initial @(-_ml
TCw 0.67 (0.23) 194s
PTn 0.61 (0.15) 64
TSwl 0.65 (0.19) 232i
TSw2-3 0.65 (0.19) 232
CHnv 0.90 (n/a)(a) 38t
(a) No value given by Montazer and Wilson (1984).
pressure distribution from the center of the model domain in the Case I
simulation was used also as the initial pressure distribution for the
transient simulation.
2.4 BOUNDARYCONDITIONS
The surface boundary condition for the simulations was specified as a
flux boundary, with fluxes representing recharge rates of 0 or 4.0 mm/yr.
The 4.0-mm/yr recharge rate is comparable to the 4.5-mm/yr recharge estimate
cited by Montazer and Wilson (1984). This estimate assumes that after evap-
orative losses, 3% of the average annual precipitation (= 150 mm/yr) at Yucca
Mountain percolates back into the groundwater flow system. A surface bound-
ary flux equivalent to 4.0 mm/yr was applied over a 4-month simulation
period, and alternated with a zero-flux surface boundary condition for an
8-month simulation period for the transient simulation to approximate the
seasonal distribution of precipitation. The lower boundary was specified as
a fixed pressure (atmospheric) boundary, representing the water table.
• The regional dip of the units in the vicinity of the ESF at Yucca
Mountain is approximately 6 degrees to the east (Scott and Bonk 1984).
. Under certain conditions, this may create a driving force in the lateral
(down-dip) direction, which is approximately 10% of gravity. The regional
dip was not explicitly accounted for in the model simulations. However, the
lateral boundaries of the model domain were specified such that a lateral
flow component was created that approximated the effects of the regional dip.
2.13
III_ ..... 11qlql''qlll.... 11 fqp' I .......... ql I? r; II rill ....... :'r;a" ............ :pnl'llllp _Ilqll,r " r:,+,:,,,:rq ..... _q,, IP, 11 ir q,+ " +"r: ,+ I: .... :r.... l;r I:: ,, , IPli'llr..... ,i, ppqll:r1+,iml , ii Irp:" rq':! ' "lP...... rl "qm+i q_.......... "' :llli'' 'I_II rll
The left, or west, boundary of the model domain was specified as a zero-flux
or "no-flow" boundary so that water could not move "up dip" across the Ghost
Dance fault. The north, south, and east boundaries of the model domain were
specified as fixed-pressure boundaries, with pressures corresponding to thei
initial conditions described in the previous section. The east boundary was
specified as a fixed-pressure rather than a zero-flux boundary to create a
lateral flow component, approximating the effects of the regional dip of the
stratigraphy. The combination of the specified boundary conditions creates a
preferential recharge area corresponding to the locations of Coyote Wash and
the Ghost Dance fault, which is consistent with our conceptual model. Future
simulations will utilize a modified version of PORFLO-3, which incorporates a
gravity tensor so that the effects of the lateral driving force created by
tilted beds are directly accounted for.
2.14
i ,, ,,,, ,,,.,,,' _r ' _rlr'rll " ,_ii,,,lll ,,,,, , _, ..... _, ", M, ,.... '"' '' ,"rlilinfl,'"_ml ' Plllr',, i,r ,,iTi i,i '' ',hp .... rl,' qr 'llrll'lql P'I _ Hl'li ' I_,1' _ ' ,,_r 'IIp IIiIPlllll" ,Ip'ltq qpr_'l,"llll lr

3.0 COMPUTERCODEDESCRIPTION
The flow simulations were performed with the PORFLO-3computer code
(Runchal and Sagar 1989; Sagar and Runchal 1990). This code is designed to
simulate fluid flow, heat transfer, and mass transport in variably saturated
porous and fractured media. Up to three-dimensional simulations in eitherI
steady or transient mode can be performed. The steady-state solution can
either be obtained directly by putting the time-dependent term to zero in the
' governing equation or by solving a transient problem until the solution
becomes steady. The first option is very efficient and was used for the
steady-state simulations reported here.
Fractures, faults, shafts, and drifts can be discretized as fully three-
dimensional features or embeddedas one-and two-dimensional features. The
basic assumption for including one- and two-dimensional features in three-
dimensional calculational domains is that the pressure values at grid nodes
represent both the subdomain features within calculational cells (i.e+,
shafts or faults) and the calculational cells (i.e., adjoining rock). Thus
there is no transfer of fluid between the cells and the subdomains within the
cells, as transfer occurs only across cell boundaries. As a result, calcu-
lated pressure values are not as accurate close to the subdomain features as
they would be if the features were discretized as fully three-dimensional
features. Embedding one- and two-dimensional features within a three-
dimensional domain is much more efficient, however, because it requires fewer
nodes and, therefore, less computational time. Because of the large calcu-
lational domain used for the simulations reported here, the shafts, drifts,
and Ghost Dance fault were included as one- and two-dimensional features
rather than being discretized as full three-dimensional features.
• The options available in the code for describing hydraulic properties
of porous media are the Brooks and Corey (1966) or the van Genuchten (1978)
. water-retention models, with hydraulic conductivities determined by either
the Mualem (1976) or the Burdine (1953) formulae. An additional option is to
provide the water-retention and relative hydraulic conductivity data in
tabular form. This last option is useful for specifying the characteristic
curves of a fractured medium that is represented as an equivalent (continuum)
3.1

porousmedium, If tabularvalues are inputfor the hydraulicproperties,the
code 'linearlyinterpolatesbetweenthe values as neededwhile solvingthe
unsaturatedflow equation.
The PORFLO-3code uses the pressure-basedformulationof the flow equa-t
tion that is discretizedusing an integratedfinite-differenceapproach.
Alternatemethodsof solutionare providedto solve the set of algebraic
equations. An iterativeconjugategradientsolutionmethod (Kincaidet al,
1982) is employedfor the resultsreportedhere,
3.2
II i.il_' ,I' ..._,_. r,.,_. .. _i_.rllr. .'_...... Ii' _'_..... rllr', _' ',ft,. ",r, IV pplp.lprq mrl_qr.... ,.... l.i11_llrlql pll_ll ;iHqlrl, , .. ,llr,.ll 11_,_r ' ,q,r li,lql_ .ippr. 1, H11pili, 11'"ri_'l'lllrIr'_ _II,

4,0 RESULTSANDDISCUSSION
The following results represent quasi-steady-state and transient sim-
ulations with upper.-bound MPZproperties (see Table 2,3) at a recharge rate
of 4,0 mm/yr. Other net infiltration estimates fo_ Yucca Mountain range
from 0.1 to 0,5 mtn/yr (Peters et al, 1986), Therefore, the results of thesesimulations should be considered as conservative estimates of the effects of
the exploratory shafts on the hydrology of the Yucca Mountain site.
4.1 STEADY-STATESIMULATIONS
Direct steady-state solutions did not converge at a recharge flux of
4 mm/yr without modifying the hydrologic properties of unit TCw. The primary
cause of the divergence is the abrupt change in composite hydraulic conduc-
tivity of unit TCw, as shown "in Figure 2.4a. With high recharge fluxes,
pressures develop that indicate the beginning of fracture flow (i.e , sat-
uration becomes close to one). However, the recharge is not large enough to
sustain this fracture flow. The result is that the solution alternates from
matrix to fracture flow between iterations and will not converge. Scaling up
the composite saturated hydraulic conductivity of unit TCwby a factor of 25
for tl_e Case I simulation was suf'ficient for successful convergence of the
direct steady-state solution.
By scaling up the saturated hydraulic conductivity of unit TCwfor the
Case I simulation, higher recharge fluxes could pass through unit TCwand
into the underlying PTn unit without jumping from fracture to matrix flow
between iterations, lt is not clear if the solution obtained with this modi-
fication is realistic because fracture flow in unit TCwwas effectively
eliminated. However, the Case I simulation was only used to establish
• initial and boundary conditions consistent with the internal solution at a
recharge rate of 4 mm/yr for the Case 2 simulation, so the absence of pulse
• infiltration resulting from fracture flow was considered to be relatively
insignificant.
The saturated hydraulic conductivities measured on core samples of unit
TCwrange over four orders of magnitude (Peters et al. 1984) In addition to
4.1
l
lt'+I'II+,IHPI''ti_,lqeill,tmllltT' nrl mm,,r,,,,pM ' "'q' ........... " r...... ,,'+_ep,_l'i_'H,'+.... lr, _' hl, p11p,,Ptllil+,_l,,,'leiIpltl+,,,ilr",,,,, ,,_' ,,q'e' "l_lil,,Pm' ' _11' r lr ...... _l__?lll"lllllTllq"Plt ,,qlrp,+," II+'_Tr........ tl1111ll'''"r+,r'

I
this variability,the hydrologicpropertiesof the fracturesreportedby.
Peterset al. (1986)are estimatedrather thanmeasureddirectly (Wang and
Narasimhan1985). Therefore,scalingup tllecompositehydraulicconduc-
tivitiesof unit TCw by a factorof 25 shouldstillyield hydrauliccon-
ductivitieswithin the range of uncertaintyof the equivalentcontinuum
approximations.Withoutthis hydraulicconductivitymodification,steady-
state solutions could not be obtained using the direct solution method, An,
alternative would be to run a transient problem until steady state is
reached. Numerical stability could then be achieved by reducing the size of
the tinl_ steps. However, this alternative is much more expensive computa-
tionally and, therefore, was not used.
A saturation profile through the center of the model domain from the
Case i simulation is shown in Figure 4.1a. The reference elevation for this
and all subsequent figures is the ground surface, "located at a depth of 0 ni.
The shafts, drifts, MPZs, and Ghost Dance fault were excluded from this
simulation. If one could assume that the initial conditions specified for
the Case I simulation represent a quasi-steady state for tile System (in the
absence of tile ESF), and that the hydrologic properties are reasonable, then
the higher saturation obtained in this solution suggest that the long-term
infiltration rate at Yucca Mountain is considerably lower than the 4 mm/yr
assumed here. The pressure distribution corresponding to tile saturation
profile of Figure 4.1a is shown in Figure 4.1b. This pressure distribution
was used for the initial and fixed-pressure boundary conditions specified in
the Case 2 simulation.
As with the Case I simulation, the direct steady-state solution for the
Case 2 simulation did not converge at a recharge flux of 4.0 mm/yr without
modifying the composite saturated hydraulic conductivity of unit TCw. Scal-
ing up the composite saturated hydraulic conductivity of unit TCw by a factor
of 15 was sufficient for successful convergence in the Case 2 simulation. A
smaller hydraulic conductivity scaling factor could be used for the Case 2
simulation because the initial and boundary conditions for this simulation
were more consistent with the internal solution than the uniform average
saturations in each unit that were imposed as boundary conditions in the
Case i simulation.
4.2
II _' " 111'
0
50
lOO ' --'-"-"-t
150
' ' i i
• 200
250
300
350
400
4SOsooI
550 , , -, ..... , ,------,--, : _ , I , , , , , ...._, , , , ._0 0.1 0,2 0.3 0,4 0,5 0.6 0.7 0.8 0.9 1,0 "500 "400 -'300 "200 "100 0
Saturation Total Head(m)
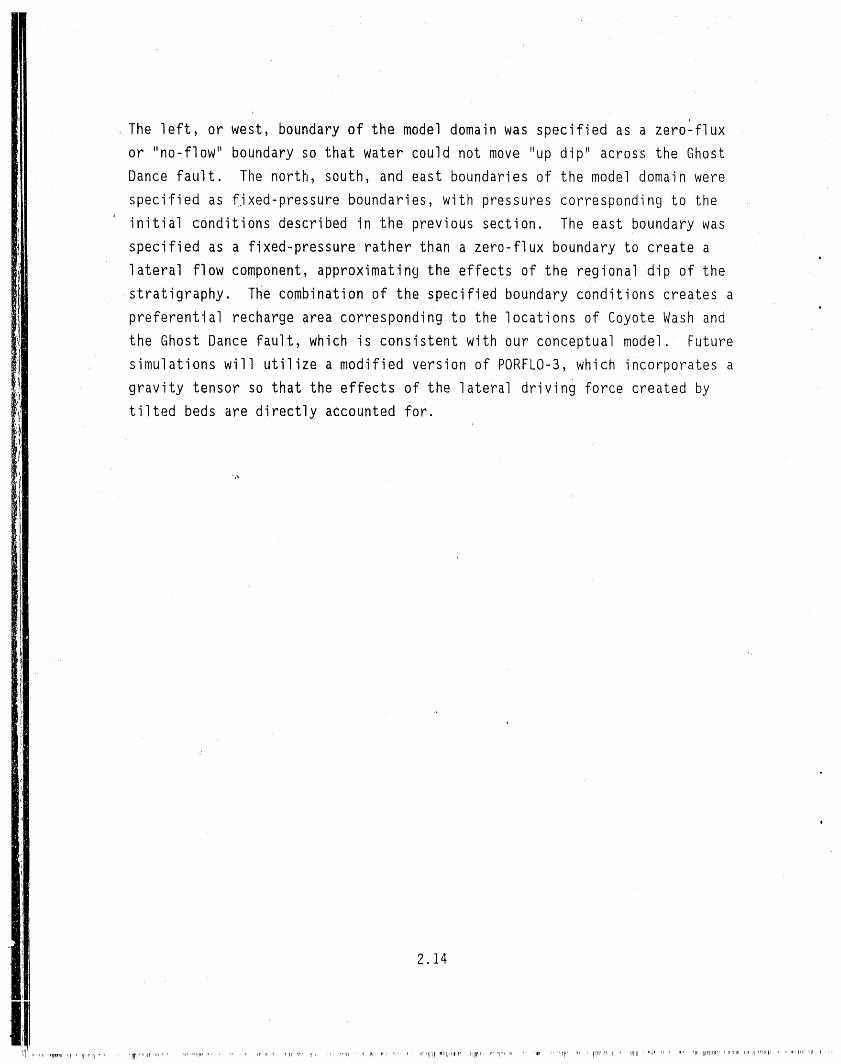
FIGURE 4.1. (a) Saturation Profile and (b) Pressure Distributionfrom the Center of the Model Domain for the Case ISimulation (initial conditions specified for Case 2simulation)
A saturation profile through the center of the model domain for the
Case 2 simulation is shown in Figure 4.2a. The shafts, drifts, MPZs, and
Ghost Dance fault were included in the Case 2 simulation. Comparison of Fig-
ures 4.2a and 4.1a indicates slightly higher saturation in the welded units
for the Case 2 simulation with very little change in the saturations of the
nonwelded units relative to the Case I simulation. The differences in thei
saturation profiles shown in Figures 4.1a and 4.2a show the influence of the
imposed boundary conditions on the internal solution.i
The pressure distribution through the center of the model domain for the
Case 2 simulation is shown in Figure 4.2b. This pressure distribution
corresponds to the saturation profile depicted in Figure 4.2a.
4.3
!Ir ',,r+ r, ,, , " Iri'_,_li r ' 'lli'tll'niu'rql 'irl'l..... lqrlqq ' ,,' " 'iiri" ,,, ,r,i ITill is,rq ii, r, ....... I+I ' ,_'i,_'_r ' ,r;; 'r, ,ql '_ IPll_' '"

FIGURE 4.2. (a) Saturation Profile and (b) Pressure Distributionfrom the Center of the Model Domain for the Case 2Simulation
Also, this figure is provided for comparison with Figure 4.1b, which shows
the pressure distribution from the Case i simulation at the same location.
Figure 4.2 indicates near unit-gradient conditions between the 100- and
350-m depths. If this was a strictly one-dimensional problem, with vertical
downward flow, at steady state one would expect saturations to be nearly
constant between the 100- and 350-m depths. Therefore, Figures 4.1 and 4.2
suggest that a steady-state, one-dimensional flow Field has not been
obtained. However, the solutions are consistent with the specified boundary
conditions.
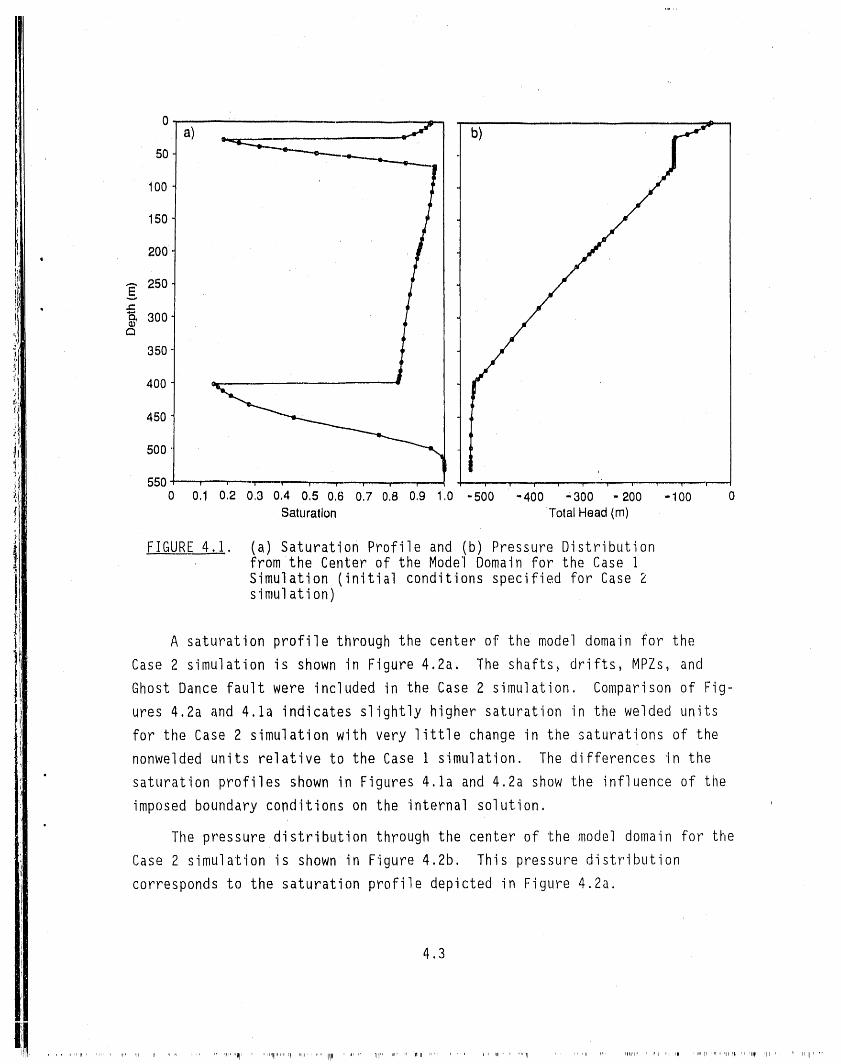
Saturation and pressure distributions through the line elements, repre-
senting ES-I for the Case 2 simulation, are shown in Figures 4.3a and 4.3b,
respectively, The slight pressure/saturation discontinuity at the interface
lltli " , ,, rl, n ',, pml,',,p,' _, ,, ,, 'P "lql "lllq'l'' ' ' _llt',t * '" rq'qipn',r, ,,ill ,l
o .......... "50
lO0
150'1
. 200]
2s01
aoo]
3501
4oo1 ........ _ ...../
4501
50015501 ! ! ! i i ! i'" ' i ! i '" ! !
0 0,1 0,2 0,3 0,4 0,5 0,6 0,7 0,8 0,9 ,0-500 -400, -300 -200 -100 0
Saturation TotalHead(m)
FIGURE 4.3. (a) Saturation Profile and (b) Pressure DistributionThrough the Line Element Representing ES-1 for theCase 2 Simulation
between units TSwl and TSw2-3 reflects slight differences in the properties
of these units. The maximum saturations obtained from the Case 2 simulation
for units TSwl and TSw2-3 are 0.957 and 0.936, respectively. The hydraulic
conductivity curves shown in Figures 2.7a and 2.7b indicate that water in the
fractures is essentially immobile at saturations of less than about 0.984.
Therefore, the results of this simulation suggest that fracture flow, as
. represented with this equivalent continuum approximation, will not occur in
these welded tuff units.
, In one-dimensional simulations of vertical Flow through the unsaturated
zone at Yucca Mountain using the TOSPACcode, Dudley et al, (1988) used a
2303-node model extending from the water table (0.0 m) to the surface of
Yucca Mourltain (530.4 In). Results of these one-dimensional steady-state
simulations show the TSw unit to be saturated or near saturated, and thus
4,5
I:I' II, ' '11 ip li ' 'ii ', ,iii, rl ..... IH,,IIIFIIr II1"rq....... rtr'_l ' III .... II11 .... illll '1_
amenableto fractureflow at rechargeratesgreaterthan 1,0 mm/yr, This is
contraryto the reSultsof the three-dimensionalPORFLO-3simulations
reportedhere. This differenceis attributedto the natureof tileproblem
and the boundaryconditionsspecified'Forthe three-dlmensionalsimulations,
which allow 'laterallyflowingwater to exit'tilemodel domain, Any lateral
diversionof verticalfluxesabovethe potentialrepositoryhorizondecreases' t
the likelihoodof that horizonreachingsaturatedor near-saturatedcondi-
tions,unless the laterallydivertedwater encountersa preferentialFlow
path such as an MPZ arounda shaft or a fault zone, '
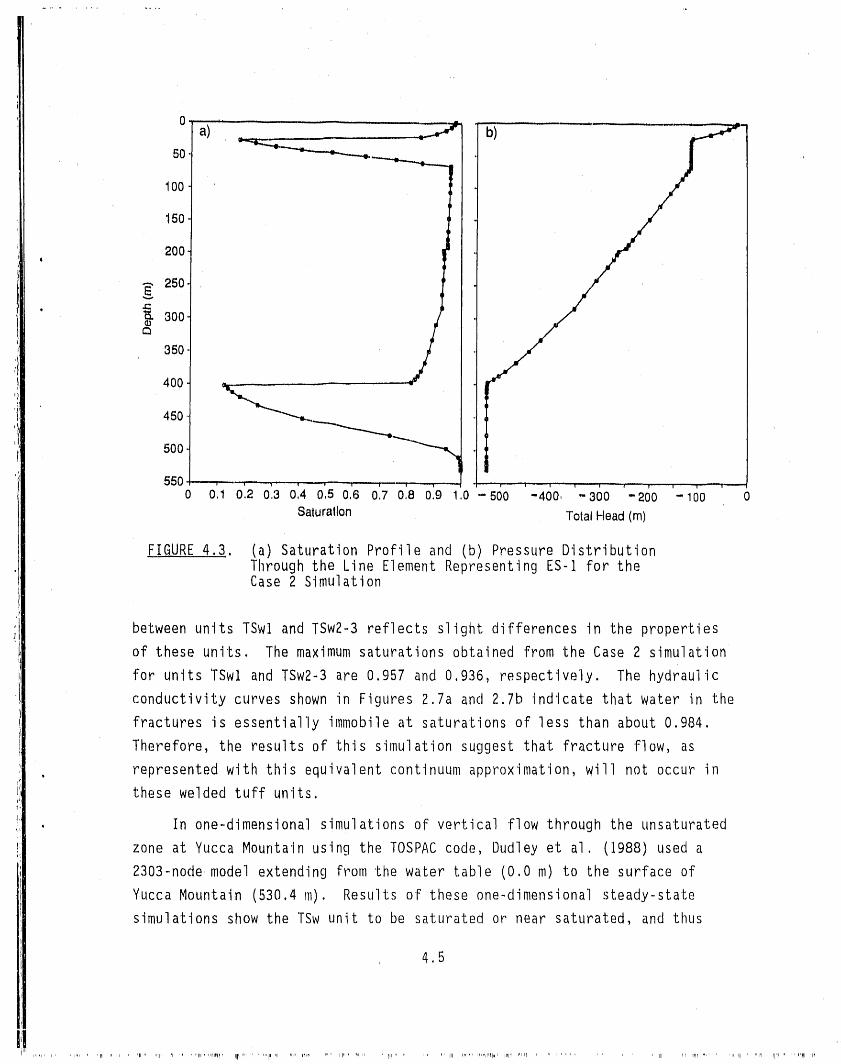
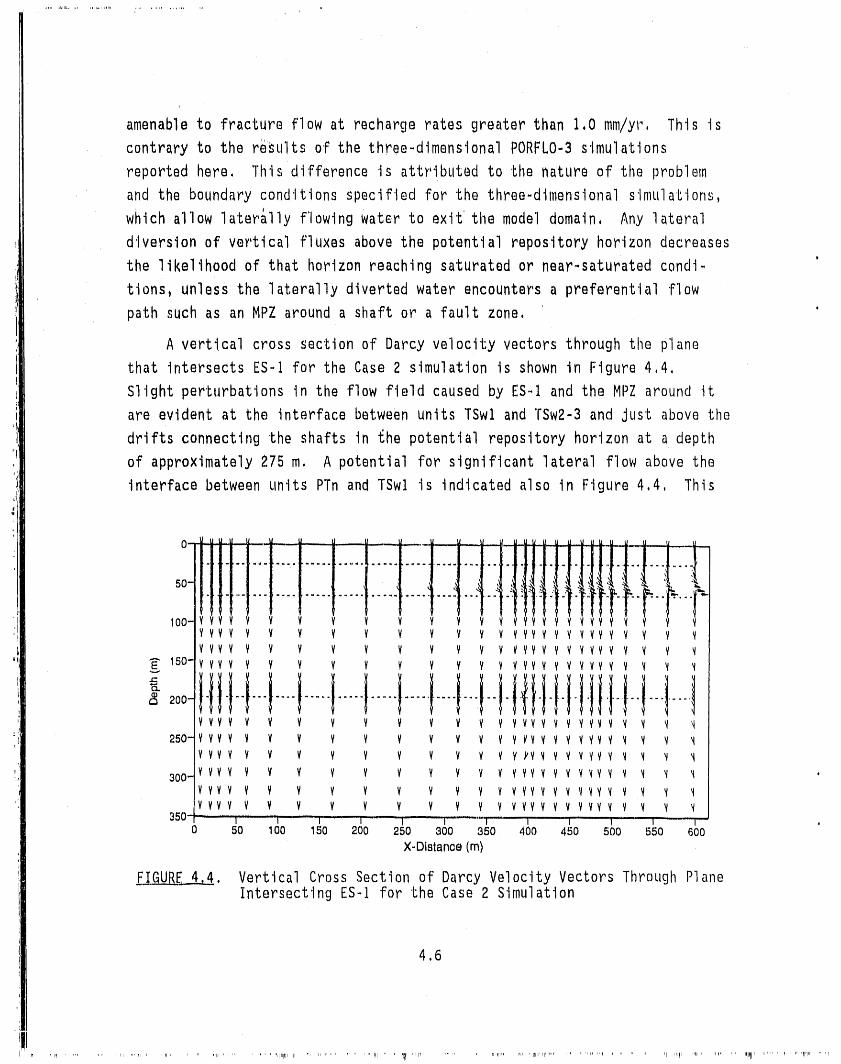
A verticalcross sectionof Darcy velocityvectorsthroughtileplane
that intersectsES-I for the Case 2 simulationis shown in Figure4,4,
Slightperturbationsin the flow field caused by ES-I and the MPZ aroundit
are evidentat the interfacebetweenunits TSwl and TSw2-3 and just abovetile
driftsconnectingthe shafts in i_hepotentialrepositoryhorizonat a depth
of approximately275 m. A potentialfor significantlateralflow above the
interfacebetweenunits PTn and TSwl is indicatedalso in Figure4.4, This
oi! !!ilii........i1111!i!IIII50 ........ _ ..
,,, !iii.iiiiiiii,i. iV V V V V V V V VV V V VVV V V _
250- VVV V V V V V V V V VV V V VVV V Y Y H
VVV V V V V V V V V V V _'VYV V VYV V V Y I
300_V VV V V V V V V V V V V V VV Y V V Y VV V V _( HVVV V V V V V V V V V V V VVVV V V VVY Y Y V 'IVVV V V V V V V V V V V V VVVV V V VVV V V V
0 50 100 150 200 250 300 350 400 450 500 550 600X-Dlstanoe (m)
F1U__. Vertical Cross Section of' Darcy Velocity Vectors Through PlaneIntersectingES-I for the Case 2 Simulation
4.6

lateral f'low 'Is consistent with the results of Rulon et al, (1986) and Wang
and Narasimhan (1988), who also show a potential for significant lateral flow
above tlle potential repository horizon using two-dimensional cross-sectional
flow models,I
A horizontal cross section of Darcy velocity vectors from the Case I
simulation, through the lower part of unit TCw, just abcJvethe interface with
unit PTn, is shown in Figure 4,5, A horizontal cross section of the same
plane depicted in F'!gure 4,5, is shown in Figure 4.6 for the Case 2 simula-
tion, The effects of the exploratory shafts are clearly evident from the
perturbations in the flow field shown in Figure 4,6 relative to Figure 4,5,
The pressure distribution, corresponding to the horizontal flow Field!
j depict(_d In Figure 4,6 for the Case 2 simulation, is shown 'In Figure 4,7.I These pressure contours also "Indicate slight perturbations in the flow Field,
result.lng from the presence of the explore,tory shafts. The saturations,
corresponding to the pressure distribution shown 'In Figure 4.7, are shown in
Figure 4,8,
A horizontal cross section of Darcy velocity vectors f'rom the Case i
simulation, through the upper part of unit Tsw2-3, just below the interface.
with unit TSwl, is shown in Figure 4,9, A horizontal cross section of the
same plane depicted in Figure 4,9 is shown in Figure 4,10 f;or the Case 2
simulation, Again, the effects of the exploratory shafts are clearly evident
from the perturbations 'In the flow "field shown In F_gure 4.10 relative to
Figure 4.9.
The pressure distribution corresponding to the horizontal flow field
depicted in Figure 4.10 For the Case 2 simulation is shown in Figure _.11.
Again, as shown In Figure 4.7, these pressure contours also indicate slight
, perturbations in the flow field, resulting from the presence of the explore.-
tory shafts. The saturations, corresponding to the pressure distribution
shown In Figure 4.1], are shown in Figure 4,12, The boundary conditions,i!
fault placement, and symmetry of this model create a preferential recharge
area on the left (or west) side of the model domain, which corresponds to the
area where Coyote Washcrosses the Ghost Dance fault.
LI,,7
t
11I, II'111",,' 'ml' ' qrrll ..... til '_, _rlll,mlll .... '_'_:lq '" IIIm

_I, _ ..... q,,, '..... n'iilllqr" ,r?itll qp, qirlr ,ii,, ,litr ,Fq, ill ,qtt,l ,lp rf' ' rH.... _I n .1 IIlliilr niiqr"qP ft, ill, _il ',i,r_il ,q_"l,,, ..... Iii' ',,'i *,*, 'iii '_ rllt'"

00 ...... _1 jl i i i J ......... ...... i ..,.. iii J ii i.i i , ,, _ • ..,
.84,.78,- ............. • -_-78,
25O +'
225200
,175 0
,_ 15O E8-2
>L 125 ES-1
lO0
75 _.
&j/j...._
0 _ :t '"'_ " ', ' , : _ r-- ' _, ' i _ m , "'"'i /i,i : T
0 50 100 150 200 250 300 350 400 450 500 550 600
X-Dlstanoe(m)
_FIGURE4.7. Pressure Distribution in Horizontal Cross Section_hrough Lower Part of Unit TCw for the Case 2Simulation
A horizontal cross section of Darcy velocity vectors through the poten-
tial repository horizon, at the 310_m depth in unit TSw2-3 for the Case i
simulation, is shown in Figure 4.13. A horizontal cross section of the same
plane depicted in Figure 4.13 is shown in Figure 4.14 for the Case 2 simu-
lation. The effects of the exploratory shafts are not as evident at this
depth as they are near the interface between units TSwl and TSw2-3 and in
uni t TCw.
, The pressure distribuLion, corresponding to the horizontal -Flow fie'ld
depicted in Figure 4.14, is shown in Figure 4.15, The saturations, corre-
sponding to the pressure distribution shown in Figure 4.15, are shown ini
Figure 4.16, As shown by the flow fields in the previous figures, this
pressure distribution also indicates that the effects of the exploratory
shafts are less significant at the depth of the potential repository than
at shallower depths.
4.9
,,, I'1 _1 m lili'_..... ,,,ll_ ,il,,rilll,II irll....... ,ni .... ,F....... ii_ ', ,_' ,11, ' I'I_" Iii..... _r'"ll lr ......... I I ......... i ......... ii1,11 ii1,......... fill, , _11,,1,_I ................... _1 I, " ....
300 \0.890 0.890 \ ,_,
275 0.895 0,895 .,-0,900- 0,900 ""o
250 '_000
225 c03LC
200 ci Q
'
E 175 i oI15o
o_
a 125>L
lOO0cD ,
75 @ i
0,900 0,900
25 0.890 0,890....
ii_ i ! iI i i , v i i
0 so I00 150 _60 25o _00 3s0 400 4so 5oo s_o 6ooX-Distance(rh)
FIGURE 4.8. Saturations in Horizontal Cross Section ThroughLower Part of Unit TOw for the Case 2 Simulation
Simulations by Wang and Narasimhan (1986), using different constant and
pulse infiltration rates applied to fractures in unit TCw, indicate that most
pulse effects are effectively damped out by units TCw and PTn before water
infiltrates down into unit TSwI. Calculations by Travis et al. (1984) indi-
cate that the penetration distance of pulses of water into fractures con-
tained in densely welded tuffs similar to unit TCw is on the order of i0 m
or less if the fracture apertures are I00 pm or less. Therefore, although
water flow in Fractures may be significant in unit TCw, these simulations
suggest that episodic pulses of water from natural precipitation should not
propagate via fractures into the underlying units due to capillary imbibition
of water into the rock matrix.
4.10
II
3O0tttt t t t t t t t t t t tfttff_ _ j _ ,,,
250 _I_ _ _ I _ _ _ _ _ _ _ _td_l_ _ i .- ...J Al t l i 1 I i I I i I i | Al J d i iii# I i ,_ n,
I::: 200 A Al A A A t A A A A A A A A lA _ _ 4 4 44 4 4 _ _ _."-" AAAA A A A A A A A A l A AAAAdd4444q _ _ ._
" 150 ..........V-_V V 'k_ _ _ ,,,,.,,.,,,.,,,,,,..,,,.,,._ ,,.. ,..,.
,_ V VV Y V V V V V V V V _1 "1 'q'_'_"k_.,,,.,,,.,,.,, ,.,.. ..., _ V VVY V V V V V V V l V _ _ _ __ _ _. _.
_.. 100 vvvv v v v v v v v v v v 't'_,l,_,_,q,_,_,_,_ _ _, ,..I If t t t ! t t t" ! t I I I1111 I _1_,_ _ _ '_ "_
• 50 llll I I I i I I i I i I lllil I I_ _ _ _ "
0 .LE,LI I I I 1 i 1 I _ i I 11111 !ii1!I I v v' ! I' " ! ' li I ! " I
0 50 l C)0 ,,1,50 200 250 300 350 400 450 500 550 600
X-Distance (m)
, FIGURE 4.9. Horizontal Cross Section of Darcy VelocityVectors Through the Upper Part of Unit TSw2-3for tile Case I Simulation
3OO
250 I Jl l l l l l l l A l A 4 A Al A I 4 4 44 A 4 4 4 ..,.^Ak A . A l A A A l A A A A _A A _ _ 144& 4 4 _ ,-
_._ 200 A4_ A l _ l A A l a A _ A _ _ _ _ 4 _44,_ 4 _" ,- --^o A A A A A A 4 _ A A AA A 4 4_,'_¥_.
150 v_ "".-- _,.,_'_ ,_ ._,._.._,. _ _ ,.- ,.
>:.. 100 v,,,_,v v v v v v v v v v I vv,_ ,_,q,_,_,_._.,,. _ ,., ,..V'k_ Y V Y V Y V V V V l I V VVV I I l_q_ _ _ ,_ ,,_
50 Y 1_ Y Y l V V V Y V ¥ Y ¥ V VV Y V I I V_ Y 1 _ _, '_
0 ---ttlt t l t t t V t l t ! lit! I Y _VVY V Y V V' l l II ' '
X-Distance (m)
FIGURE 4.10. Horizontal Cross Section of Darcy VelocityVectors Through the Upper Part of Unit. TSw2-3for the Case 2 Simulation
4.11

FIGURE 4.11. Pressure Distribution in Horizontal Cross SectionThrough Upper Part of Unit TSw2-3 for the Case 2Simulation
4.2 TRANSIENT SIMULATIONS
An objective of this study was to determine the potential effects of the
ESF on the moisture distribution at Yucca Mountain, with emphasis on short-
term characterization work. Therefore, a transient simulation also was per-
formed, using a time-varying recharge rate. The surface boundary flux for
this transient simulation was represented with a step function, so that a
recharge rate equivalent to 4 mm/yr in 4 months (the rainy season) alternated
with no recharge for 8 months. This seasonal recharge was maintained for a
20-year simulation period. This was considered to be an adequate time frame
in which to conduct subsurface characterization work at Yucca Mountain. The
pressure solution from the center of the model domain in the Case ] simula-
tion was used as the initial condition for the transient simulation.
4.12
_i,1!i ........ pr_, ,,, H "' _lllr'q' _"'_"'"..... II1'......... ,,,,' iir,ll ,'pl ......... ,1_ III....'.......'1' "'......"If" ,Irl....."_'_'
300 ............. r , I - _ "
--0,91 0,91- ,
............ _'"_"_"'_275- 0,92- 0,92
'_0250- --_-_--------- 0,93 '0,93---- ,,97,.
225-
200- _'-" O,94
_" 175"
lso-
0,94
,m, a 125-
#.100- _._.-. 0,94-
75- _ + I
50- _----_------ 0,93 2'2225- ,0,92 S
....... 0,91 0,91
O i....... u i u ' I u u' u _'" d.... i i " i-0 50 1O0 150 200 250 300 350 400 450 500 550 600
X-Distance (m)
FIGURE4.12. Saturations in Horizontal Cross SectionThrough Upper Part of Unit TSw2-3 for theCase 2 Simulation '+
No modifications to the saturated hydraulic conductivity of unit TCwwere
necessary for the transient simulation because the size of the time steps was
reduced to achieve numerical stability.
During this simulation period there were no appreciable changes in the
saturations of any of the units other than unit TCw. The saturation profile
for unit TCwfrom the center of the model domain for the transient simulation
is shown in Figure 4.17. The saturation profile for unit TCw, along the
plane representing the Ghost Dance fault for the transient simulation, ism
shown in Figure 4.18. The saturation profile for unit TCw, at the location
of ES-I for the transient simulation, is shown in Figure 4.19. The plot of
time zero in Figures 4.17, 4.18, and 4.19 represents the initial steady-state
solution condition from the center of the model domain in the Case I
simulation.
4.13
II +'+n..... pn,_,....... _,r,'punq.... _rll" pl,i .... qr,lr_ .......n_,rp .....Ip_",'irl,q_...... p, Ii",+,_,!lIlll,,,m_*,"llrnI_r,,'1_'_" ll,,Piiih rlli,,rllf ,_,',,H I_l_lI',_..... I111"_r'" 'llrll....._r i11_.,,i,,'_p+ll_.... , ..... .fr ,,

:300 "i'ttt t t t t t T ' Y f "f t"tff"f ft ffdd 4 _ _ 4
25o tttl t l t l t t 1 1 I I III1 d d _dll i _ .,, ...
i Ai i I l i l i I I i 4 J j lj .1A _ AA44 4 4 .. .
E 200 _ AA A _ _ _ _ _ _ _ A A A _ A_ _ _ A J444 4 4 p.
c_ A AA A A A A A A A A A 4 '_dA A,i 4 ,t # 4 4 4 4 4 _. ,.. .,-
15o .-', "I 4 i "'" " "......
" 0 1111 I I I 1 1 1 I _ I I lllllllttl t t v v! " T-"---- I ' ! ' i l'
o 5'o 'ocX-Distance (m)
FIGURE 4.13. Horizontal Cross Section of: Darcy VelocityVectors Through the Potential Repository Horizonin Unit TSw2-3 for the Case 1 Simulation
300 - '
250 I A_t A 1 l l A i A l i A I A A,A,A ,4 ,4 A AA A I ,t 4 ..
A AJ A _ A, A 'A A A A A A A _ _ _ i1 _ A A.4A 4 4 .. .-
200 AA_X X _ A A A A _ A A A AX_X _ _ _4_4 _..-.._ lm,.
A EA A A _ _ A A A A A A A A AA _ A A A&44 _" ." _" ,-
_L 100 vv_x _ v v v v v v v v v _t_,_,_,q,_,_,_,_,, .,, ,,. .._Y Yl Y V V V V V V Y V V V Y YY'_ I I _'A'A'A % _, _, _.
50 vv_v v _r v v v Y v v v v vv,rv v _ ,_x_,_'t '_ '_ .,,.
0 Hl t t ,.t t t t t t t t t ttr t t t vvvv v v v v, , , , , _) ' (_ _ , , ,0 50 100 150 200 250 3 0 350 4 0 4 0 500 550 600
X-Distance (m)
FIGURE 4.14. Horizontal Cross Section of Darcy VelocityVectors Through the Potential Repository Horizonin Unit TSw2-3 for the Case 2 Simulation
4.14
_r,l ,I n ,'r ",tilt ,," ,,' , irplil,,_q_......... n,, '"rll" ,e,,, ,,,., ,,,,- _p_lv , n.... ml,., r, ,,,,q,ll,lrlIll,,*, "I#_, ll']r'll' 'IRlIP , 'IPl' rl I II '" ii,11 'llP" " ,e....... rf,tmr' nl ,n_,,, ' nl,,,l,ln, ' ,., ""qll' ..... _q,"' ,II " ' ql' IPl_Irll'Irl r l'mir'ele Inlt' '_IqlITP=_"llr ,x,,

300'i
-410 410 +275- .-. 405 +- 405 -- _"_
' "4os. \, \25o------_ -4oo -- ---4oo--_._ --'_ ,'.o
+.oo + -.-. -ago_._. %. \ /|
' '1+ 11//-; +oo__150'
125- ___..._...,._.._,._._.. 390100-
,o..... ,oo :- -405- 40525- 410. +410-
, ,,, , ,........0"' I I I I 1 I 1 I I I I
0 50 100 150 200 250 300 350 400 450 500 550 600X-Distance (m)
FIGURE4.15. Pressure Distribution in Horizontal Cross SectionThrough the Potential Repository Horizon in UnitTSw2-3 'For the Case 2 Simulation
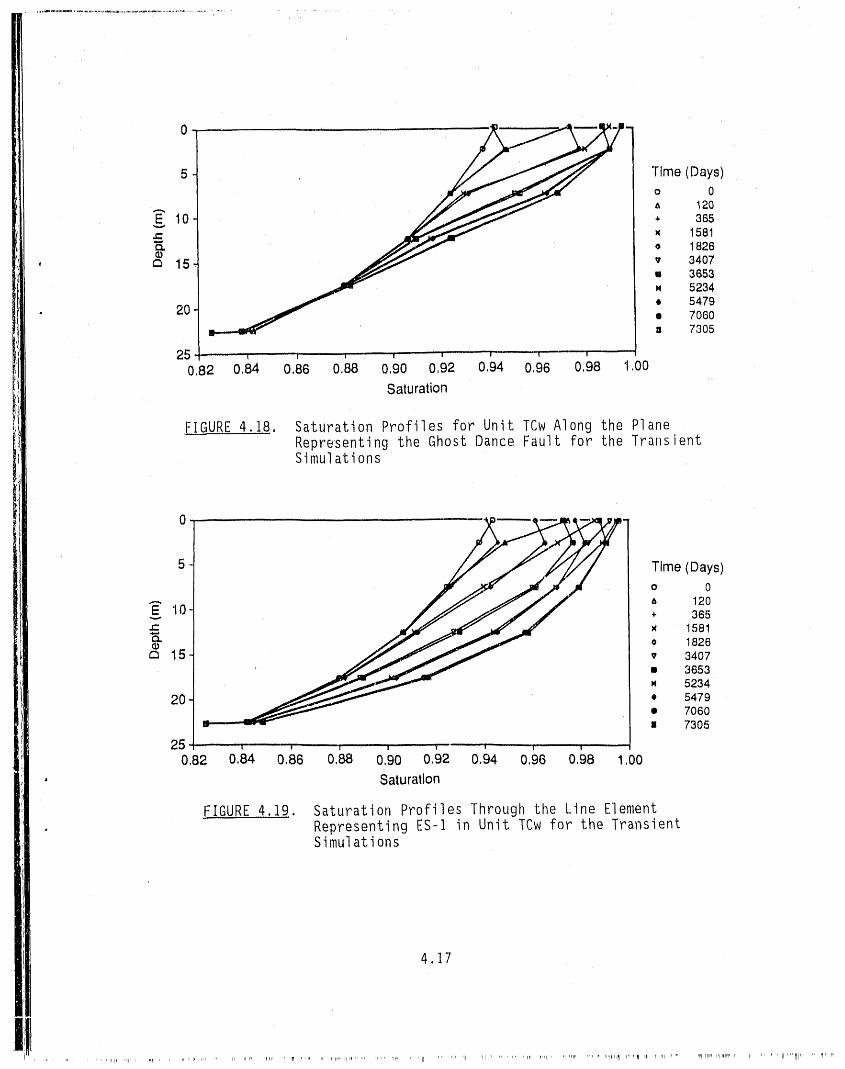
Comparisons of Figures 4.17, 4.18, and 4.19 indicate that, with the
material properties used for these Simulations, the MPZsaY'oundthe explora-
tory shafts create a preferential flow path for water percolating down from
the surface+ The Ghost Dance fault also acts as a preferential flow path,
but its effects are not as significant with the particular properties chosen
to represent it relative to the MPZs and exploratory shafts. At the satura-
tions shown in these figures, fracture flow, as represented with an equiva-
lent continuum approximation, does occur in unit TCw.J
The transient simulations presented in this report suggest that there
will be no appreciable change in the moisture content distribution below unit
TCwwithin 20 years after the construction of the ESF. These simulations,
however, did not account for possible changes in moisture content that
result from additions of drilling fluid into the system during the excavation
4.15
II,., ,,irl_rlllllllll' .... _' " lllilr m' ")'+'m_p'' 'III PI _..... q'll'",. ,,' r'Irl="'' ' ,r"i_I= ',Ph '+_' " ' rl' , .... l_lgll ' '
3oo- o,86 o,88275-_-- 0,87 0,87----------m \ ,0,88------.---- 0,88
250- . 0,8,9.., _ 9(30
0,89 o m
225-_ ,
200- 0,90-----------
175-
' C}_) I
15o-
125- °
100-
__._._.-------- 0,90"75-
50- I_"--- 0'89 /0,88-_ 0,88
25" 0,87 0,87 _I"0,86 0,86
O- '"1 I "' 1 I I I 1 -"='T I r-- "'T"---I'"
0 50 1O0 150 200 250 300 350 400 450 500 550 600X-Distance (rn)
FIGURE 4.16. Saturation in Horizontal Cross Section Throughthe Potential Repository Horizon in Unit TSw2-3for the Case 2 Simulation
iTime (Days)o 0
120
10 + 365
x 1581o 1826
15 v 3407m 3653. 5234
20 • 5479• 7060I 7305
25 _r--'-- ......... , .......0.82 0,84 0.86 0.88 0.90 0,92 0,94 0.96 0,98 1.00
Saturation
FIGURE 4.17. Saturation Profiles for Unit TCw from the Center ofthe Model Domain for the Transient Simulations
4.16
III' _,,,,,_,,,rllI........... _,,,,',,_ ....n' '_....r,,,",,,_,_',IlI, ,, v,,, " lte',, _'_,,,,, ,,,Irt ," rf,,,m,',H", ,_ ,,',,'rlflqq''"_r'r, ......_"' '_" _rn iii'
5 Time (Days)o 0
• _ 120
10 + 365
x 1581o 1828
15 v 3407u 3653. 5234• 5479
20 • 7060u 7305
as ,0,82 0,84 0,86 0,88 0,90 0,92 0,94 0,96 0,98 1.00
Saturation
FI__GGURE4.,I,8. Saturation Profiles for Unit TCw Along the PlaneRepresenting the Ghost Dance Fault for the TransientSimulations
O5 - Time (Days)o 0
120
10 + 365
x 1581o 1826
15 _ 3407II 3653
..... _' " , , .... r'
. 5234
20 • 5479• 7060• 7305
25 , , , +...... ,0,82 0.84 0.86 0,88 0,90 0,92 0,94 0,96 0,98 1,00
Saturation
FIGURE 4.19. Saturation Profiles Through the Line ElementRepresenting ES-I in Unit TCw for the TransientSimulations
4.17
Ill.................... , ....,..............,,_

process. Work by Buscheck and Nitao (1987), however, suggests that imbibi-
tion of the drilling fluid used during the drill-muck-mining excavation
process will be minimal, Therefore, even though shaft construction will
alter the fracture densities and permeabilities of the tuff units, these
simulation,'s suggest that the moisture contents and distributions in the
vi'cinity of the exploratory shafts below l'Cw will not change significantly
within 20 years, which is a reasonable time frame for subsurface characteri-
zation work.
l'he MPZs around tile exploratory shafts in unit TCwappear to create a
preferential flow path for water when fracture flow occurs irl this unit.
This fracture Flow appears to be dampedwith depth, however, so that no
fracture flow occurs in the underlying units. However, lt must be emphasized
that these conclusions are specific to the Initial and boundary conditions,
discretization, and.material properties used for these simulations, and do
not preclude the possibility of lateral flow intersecting preferential flow
paths that result in locally saturated conditions and fracture flow in the
lower units,
6
4.18
I I, ..... H, , , llr

5.0 C_D_CL.USIONSAN.D..RECOMMENDAT!ONS
Irl this model, the exploratory shafts, .drifts, and Ghost Dance fault
are embedded as one- and two-dimensional features within three-dimensional
calculational elements, These featl.ares are'assumed to have tlleir own dis-
tinct .properties, but the results obtained from this model are not as
' accurate in close proximity to these features as they would be if the fea-
tures.were di screti zed as three-dimensional elements, Considering the lack
' of data regardingpropertiesof the Ghost Dance fault and MPZs and the com-
parativelylarge calculationaldomain of the model, the resultspresented
here are reasonableas best estimatesof worst-caseconditionsthai',might
exist. The size of the caIculationaldomainused in this analysisis con-
siderednecessaryto includethe Ghost Dance fault and the exploratory
shafts,while attemptingto minimizeboundaryeffects. If a more accurate
representationof specificsmall-scalefeaturesis desired,the model domain
should be reducedto a smaller.scaleand computationalcell sizes reduced
accordingly, Largerscale approximatesolutions,such as those presented
here, can readilybe used as input to more finelydiscretizedsmallerscale
models within the domainof the "largermodel. On a sufficientlysmaller
scale, the shaftsmay be Includedas three-dimensionalfeatures.
SeveralImportantconclusionsmay be drawn from these simulation
results. The simulationssuggestthat fractureflow, as approximatedby the
equivalentcontinuummodel (i.e.,when hydrologicpropertiesare represented
as shown in Figures2.5 to 2.7), does not occur'at the level of the potential
repositoryat rechargerates up to 4 mm/yr. Discretefracturesor faults
were not simulated,however. Therefore,these resultsdo not precludethe
possibilityof preferentialflow reachingthe potentialrepositoryhorizon
'throughregionsof major structuralfeatures. The Ghost Dance fault is
'includedin this model, but the hydraulicpropertiesused to describetile
fault zone were estimatedbecauseof a lack of data. These simulationsalso
suggestthat there will be no appreciablechangein the moisture-content
distributionbelowthe TCw unit within 20 years after the constructionof the
ESF. This 20-yeartime frame was consideredto be adequatefor subsurface
characterizationwork.
o .
, ,t
5.1
lII_, _ '11 PI al _ ' ii1 ' rDPlPPq' II ir l,pr%, 'iii' 'li?I ' ',lH' ' ........ , 'rl' "' ""1'II1' 'Irl' "

Previous one-dimensional simulations have indicated that the poi:l_rvt'la'l
reposif, ory horizon will be saturated or nearly saturai',ed and t,hus amenabla to
fracture flow at recharge rates of 1,0 mm/yr (Dudley et al, 1988), This Is
contrary to the results of the three-dimensio'nal simulations reported here,I
This difference can be attributed primarily to the dimensionality of the
problem and the nature of the three-dimensional flow field used irl thisI
study, such that water can exit from the model domain through lateral bound-
aries, The results of these three-dimensional simulations support previousii
two-dimensional modeling studies that show a potential for significant lat.-
eral flow above the potential repository horizon, Lateral diversion of ver-
'1tical fluxes above tile potentia repository horizon decreases the likelihood
of that horizon reaching saturated or near-saturated conditions unless the
laterally diverted water encounters a preferential flow path or structural
feature, such as a fault zone,
Postclosure thermal effects and vapor-phase transport of moisture
caused by heat generated from the potential repository were not considered in
•this study. However, these factors may have a significant effect on reposi-.
tory performance, Therefore, postclosure modeling studies should consider
nonisothermal Flow and vapor-phase transport of' moisture. The MPZs and shaft
backfill material may beconlemore important for future smaller scale mocle'l
simulations when coupled fluid flow, heat transfer, and mass transport are
considered.
lt will be impossible to characterize all of the heterogeneities in the
properties of the tuff units at Yucca Mountain in sufficient detail to pre-,
dict all possible outcomes associated with a particular characterization
activity or repository perfornlance after waste emplacement, However, at a
minimum, future simulations with intermediate- and la_ge-scale multidimen-
sional models of the potential repository at Yucca Mountain should inclucle
the topography of the site and surface expressions of major fractures and
faults to determine areas for preferential local recharge. Then, spatially
nonuniform, time-varying recharge fluxes can be applied as surface boundary
conditions to determine the importance of time and spatial variation of
surface recharge to the Flow fields in the natural system at depth, In
addition, "lt may be possible to use multidimensional stochastic modeling
' 5,2 , '
-iw, , , pl,llll i_ ............. til ...... p_, , qp 11_ .... qf' , , _11.... I,,_p ' PJJl..... lP ........ m_, I,qlql,,qrl _1........ I_e ...... _ _"1111," "H'
approaches to evaluate the effects of the va_'iabi'lity and uncertainty of theI
hydrologic properties of the tuff units on ca'Iculai',ions of repository per-
formanceobjectivecriteria,sLlch as clroundwatertraveltime,
|
I
.... .', 5.3
_'_ 'I'' 1lr" ..... ,,H,,,,, II, ' rl ........ n,,,,l, ' ,, _r .... rl[' ,plP,,rl,q ,, ...... H, ,,w1,,,irm,lq; ' fql_' ,_r_ ,, ........... q," I!(l"lll"r' I1'""

o.o B ,ERENCE,
Brooks, R, H,, and A, r, Corey, 1966, "Properties off Porous Media AffectingF'luid Flow," Proceedings of the Amer, Soc, of Civil Engrs,, J, of theIrrig, and Drainage Div,, IR2, 61-68,
Burdine, N, T. 1953, "Relative Permeability Calculations from Pore-SizeDistribution Data," Trans. AIME 198, 35-42.I,
!Buscheck, T, A,, and J, J, Nitao, 1987, Estimates of theHydrologic Impactof Drilling Water on Core Samples Taken from Partially Saturated Densely
' Welded Tuff, UClD-21294, Lawrence Livermore National Laboratory, Livermore,Cal ifornia.
Case, J, B., and P, C. Kelsall. 1987, Modification of Rock Mass Permea-bility in the Zone Surrounding a Shaft in Fractured, Welded Tuff. SAND86-7001, Sandia National Laboratories, Albuquerque, New Mexico,
Dudley, A, L,, R, R. Peters, J. FI, Gauthier, M. L, Wilson, M. S, Tierney, andE, A, Klavetter, 1988, Total System Performance Assessment Code (TOSPAC),Volume I" Physical and Mathematical Bases, SAND85-O002,Sandia NationalLaboratories, Albuquerque, NewMexico,
Fernandez, J, A., T. E, Hinkebein, atld J. B. Case. 1988. Analyses toEvaluate the Effect of the Exploratory Shaft on Repository Performance ofYucca Mountain, SAND85-0598, Sandia National Laboratories, Albuquerque,New Mexico.
Kincaid, D. R,, J. R. Respess, D. A, Young, and R. G, Grimes. 1982."ALGORITHM586 ITPACK2C: A FORTRANPackage for Solving Large Sparse LinearSystems by Adaptive Accelerated Iterative Methods." ACMTransactions onMathematical Software 8(3), 302-322.
Klavetter, E. A., and R. R. Peters, 1986. Fluid Flow in a Fractured RockMass. SAND85-0855, Sandia National Laboratories, Albuquerque, NewMexico.
Lin, Y. T., M, S. Tierney, M. J. Eatough, J. Foster', M. W. Sharp,D. L. Szklarz, D. L, South, B. C. Whittet, R W. Williams, and D. H. Zeuch.1986, Preliminary Estimates of Groundwater Travel Time and RadionuclideTransport at the Yucca Mountain Repository Site. SAND85-2701, S, Sinnock
, (ed.), Sandia National Laboratories, Albuquerque, NewMexico.
Montazer, P., and W. E. Wilson. 1984. Conceptual Hydrologic Model of Flowin the Unsaturated Zone, Yucca Mountain, Nevada. Water-Resources Investi-I
gations Report, 84-4345, U.S. Geological Survey, Denver, Colorado.
Mualem, Y. 1976. "A NewModel for Predicting the Hydraulic Conductivity ofUnsaturated Porous Materials." Water Resources Research 12(3), 513-522,
6.1
Nitao, J, J, 1988, Numerical Modeling of the Thermal and Hydrological Envi-ronment Around a Nuclear Wast6 Package Using The Equivalent Continuum Approx-imation: Horizontal Emplacement, UCID-21444, Lawrence Livermore NationalLaboratory, l.ivermore, California,
Peters, R. R,, and E, A. Klavetter, 1988, "A Continuum Model For WaterMovement in an Unsaturated Fractured Rock Mass." Water Resources Research24(3), 416-430.
O
Peters, R, R., J, H. Gauthier, arld A, L. Dudley, 1986, The Effect ofPercolation Rate on Water-Travel Time in Deep, Partially Saturated Zones,SAND85-0854, Sandia National Laboratories, Albuquerque, NewMexico,
Peters, R. R., E. A. Klavetter, I. J, Hall, S, C. Blair, P. R, Heller, andG, W. Gee. 1984. Fracture and Matrix CharacteristT'cs of TuffaceousMaterials from Yucca Mountain, Nye County, Nevada. SAND84-1471, SandiaNational Laboratories, Albuquerque, NewMexico,
Pruess, K., Y. W, Tsang, and J. S, Y. Wang. 1990. "On Therrnohydrologic Con-ditions Near High-Level Nuclear Wastes Emplaced in Partially Saturated Frac-tured Tuff, 2, Effective ConLinuum Approximation," Water Resources Research26(6), 1249-1261,
Rulon, J,, G. S, Bodvarsson, and P. Montazer, 1986, Preliminary NumericalSimulations of Groundwater Flow in the Unsaturated Zone, Yucca Mountain,Nevada. LBL-20553, Lawrence Berkeley Laboratory, Berkeley, California.
Runchal, A. K., and B. Sagar. 1989. PORFLO-3: A Mathematical Model forFluid Flow, I/eat and Mass Transport in Variably Saturated Geologic Media,Users Manual, Version 1.0, WHC-EP-O041,Westinghouse HanFord Company,Richland, Washington.
Sagar, B., and A, K. Runchal. 1990. PORFLO-3: A Mathematical Model forFluid Flow, Hea_,, and Mass Transport in Variably Saturated Geologic Media,Theory and Numerical Methods, Version 1.0. WHC-EP-O042,Westinghouse HanfordCompany, Richland, Washington.
Scott, R. B., and J. Bonk. 1984. Preliminary Geologic Map of Yucca Mountainwith Geologic Sections, Nye County, Nevada. U.S. Geological Survey Open-File Report 84-494, scale 1:12,000.
Scott, R. B., R. W. Spengler, S. Drehl, A, R, Lappin, and M. P. Chornack.1983. "Geologic Character of Tuffs in tile Unsaturated Zone at Yucca Moun-tain, Southern Nevada," Role of the Unsaturated Zone in Radioactive andHazardous Waste Disposal. J. Mercer, Po S. C. Rao, and I. W. Marine (eds.)Ann Arbor Science Publishers, Ann Arbor, Michigan, pp. 289.335,
Travis, B. J., S. W. Hodson, H. E. Nuttal, T. L. Cook, and R. S, Rundberg.1984. Preliminary Estimates of Water Flow and Radionuclide Transport inYucca Mountain. LA-UR-84-40 (Rev.), Los Alamos National LaboraLory, LosAlamos, New Mexico.
6.2

U.S. Departmentof Energy (DOE). 1988. ConsultationDraft,Site Charac-terizationPlan, YuccaMountainSite, Nevada Researchand DevelopmentArea,Nevada,VolumeII. DOE/RW-0160,Office of CivilianRadioactiveWasteManagement,Washington,D.C.
U.S. Departmentof Energy (DOE). 1989. Site CharacterizationPlan, YuccaMountainSite, NevadaResearchand DevelopmentArea, Nevada,Volume VIII,Part B. DOE/RW-0199,Office of CivilianRadioactiveWasteManagement,
, Washington,D.C.
van Genuchten,R. 1978. Calculatingthe UnsaturatedHydraulicConductivitywith a New Closed-FormAnalyticalModel Water ResourcesBulletin Princeton
f " ,
UniversityPress, Princeton,New Jersey.
Wang, J. S. Y., and T. N. Narasimh_n. 1985. HydrologicMechanismsGoverningFluid Flow in PartiallySaturated,Fractured,Porous Tuff at YuccaMountain.SAND84-7202,SandiaNationalLaboratories,Albuquerque,New Mexico.
Wang, J. S. Y., and T. N. Narasimhan. 1986. HydrologicMechanismsGoverningPartiallySaturatedFluid Flow in FracturedWeldedUnits and Porous NonweldedUnits at YuccaMountain. SAND86-7114,SandiaNationalLaboratories,Albuquerque,New Mexico.
Wang, J. S. Y., and T. N. Narasimhan. 1988. HydrologicModelingof Verticaland LateralMovementof PartiallySaturatedFluid Flow Near a Fault Zone atYucca Mountain. SAND87-7070,SandiaNationalLaboratories,Albuquerque,New Mexico.
6.3
I "Ilq ,,F +,,, qr_...... r,i'" mp,III,,,IM_, i.... lp' 'IIIIq'_lqlP1rl'_",',,Imlql+,,,'qa_l........... 111" qll pi+, +r,' i," Ippl , ,+,,,+1'lr,+ ',II;..... 1..............

PNL-7474UC-814
DISTRIBUTION
No. of No. of ,,__oi__e__ Copies
OFFSITE I. MillerGolder Associates
2 DOE/Office of Scientific 4104 184th Avenue N.E.and Technical Information Redmond, WA 98052
, J.A. Canepa 2 Lawrence Livermore NationalLos Alamos National Laboratory LaboratoryP.O. Box 1663 University of CaliforniaLos Alamos, NM 87545 P.O. Box 808
Livermore, CA 94550H. A. Dockery Attn: W. J. O'ConnellSandia National Laboratory W. HalseyDivision 6312
Albuquerque, NM 87185 T. Pigford,
Department of NuclearB. Hastings EngineeringTRWEnvironmental Safety University of CaliforniaSystems Berkeley, CA 94720
10306 Eaton PlaceSuite 300 M. ReevesFairfax, VA 22030 INTERA, Inc.
6850 Austin Ctr. Blvd.D. Hoxie Suite 300U. S. Geological Service Austin, TX 78731P.O. Box 25046
Denver Federal Center B. SagarDenver, CO 80225 S.W. Research Institute
622 Culebra Road3 INTERA, Inc. San Antonio, TX 78228
101 Convention Ctr. Dr.
Phase II, Suite 540 2 Sandia National LaboratoryLas Vegas, NV 89193 Division 6313Attn: R. W. Nelson Albuquerque, NM 87185
S. Pawah Attn: R. W. BarnardA. E. Van Luik T.E. Blejwas
Distr.l
'II' _I ,_ lr '," ,, ,r, ',lln ...... nj F.,, fqlTn , _rr _ rl _pr'II nnppll_I ",npwlnlll'In'_nnnl'' lr ' , ,' '_' _' _.l'"l.' Tr ,_pp _,_ ,, ......... iln 'n!l _" lllr ,' '_ "_ llll' iIl='"',,,n_ ,rl

PNL-7474UC-814
No. of ONSITECopies -----
DOERichland Field Office2 Science Applications
International Corporation D.C. Langstaff(SAIC)
101 ConventionCtr. Blvd. 2 WestincIhouseHanfordCompanySuite 450
Las Vegas, NV 89109 D.W. LangfordAttn. A. Brandstetter S.J. Ouderkirk
P. L. Cloke
22 PacificNorthwestLaboratory4 U.S. Departmentof Energy
Yucca MountainSite D.M. ElwoodCharacterizationProject D.W. EngelOffice P.W. Eslinger101 ConventionCenter Drive M.D. FreshleyPhase II, Suite 200 C.T. KincaidP.O. Box 98608 M.R. KreiterLas Vegas, NY 89193-8608 K.M. KrupkaAttn. J. M. Boak W.E. Nichols
J. R. Dyer M.L. Rockhold (4)C. P. Gertz D.L. StrengeJ. J. Lorenz J.E. Tanner
R. E. Williford2 U.S. NuclearRegulatory PublishingCoordination
Commission TechnicalReport Files (5)Divisionof EngineeringSafetyWashington,DC 20555 ROUTINGAttn: D. Codell
S. Coplan NLS-260 R.M. EckerJ. W. FalcoM. J. GrahamR. L. SkaggsP. C. Hays (last)
Distr.2

- _' , .... ,,,l_ll"'lr,'.... rl!I_" 'r...... lpr.....!' ......... ii,l,ll,llIl,lr,lrl,,.r . _,,'r_,,r......ilill,,_qn_,_11'rl,'_llT"l,,rlrr'.',lll'lI

iI , , in,lr I lp ii rlll,,,F1prlFi,r ,, F'_" ,1lr' "_pplr''' _ PI......... ,Im_,,_rll_,r@'_','1_'_,_,_,'Fqq__", ,,,, ' ,p_lq_,lr,,',_,' ',Slql,rl,,rj ,IIIF_III jl,l,i "111" ,J_rl,','P_''1rl