Embed Size (px)
Citation preview
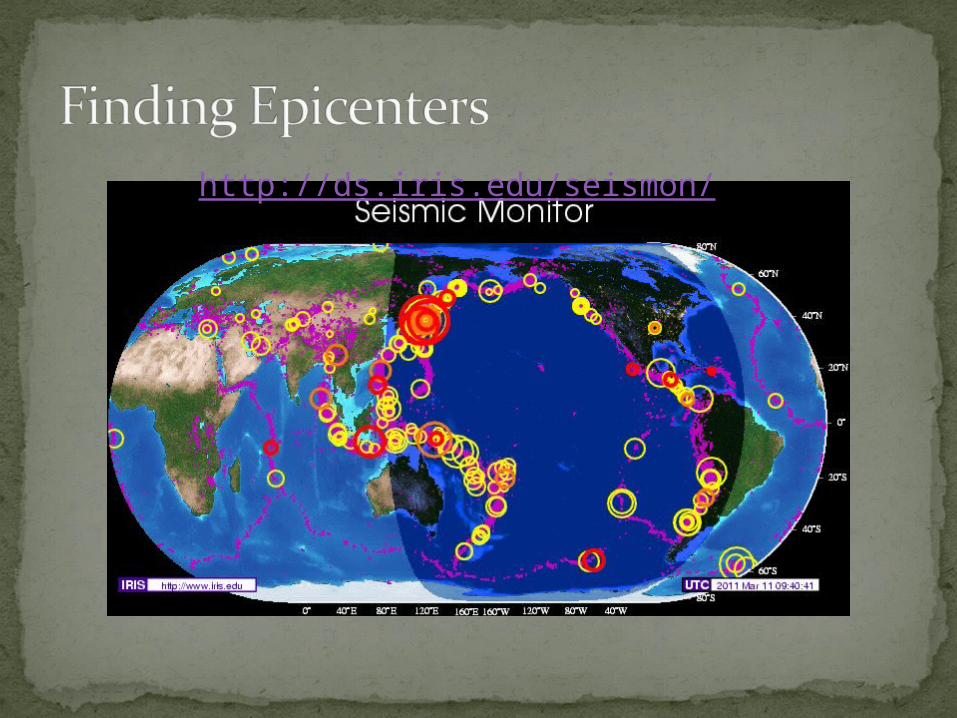
Please view as a slideshow (click slideshow->from beginning). Go ahead… do it now.
You may complete the virtual lab on the website on the following slide if you’d like (This activity is not not required but is fun!)
The purpose of this slide show is just to familiarize you with the steps of locating an epicenter.
Complete the time subtracting and epicenter distance tasks on a separate sheet of paper. (slides 4-8). This is the only activity that requires written practice at this time HOWEVER, YOU MUST SEE THE ENTIRE POWERPOINT and know the steps, so that you can do the activity in class.
READY? Take out your ESRT, a red pencil, a pencil, and a scrap paper (about index card size), if you happen to have a safety compass, try it out! If not, don’t worry. We have plenty in the classroom and we’ll have plenty of time to practice with them!
Ms. Susinno
Note* the following PowerPoint has been adapted for our specific classroom use from the original made by Phil Medina
Found on http://www.mrsciguy.com/resources.htmlPlease visit this website for valuable teacher and student resources!
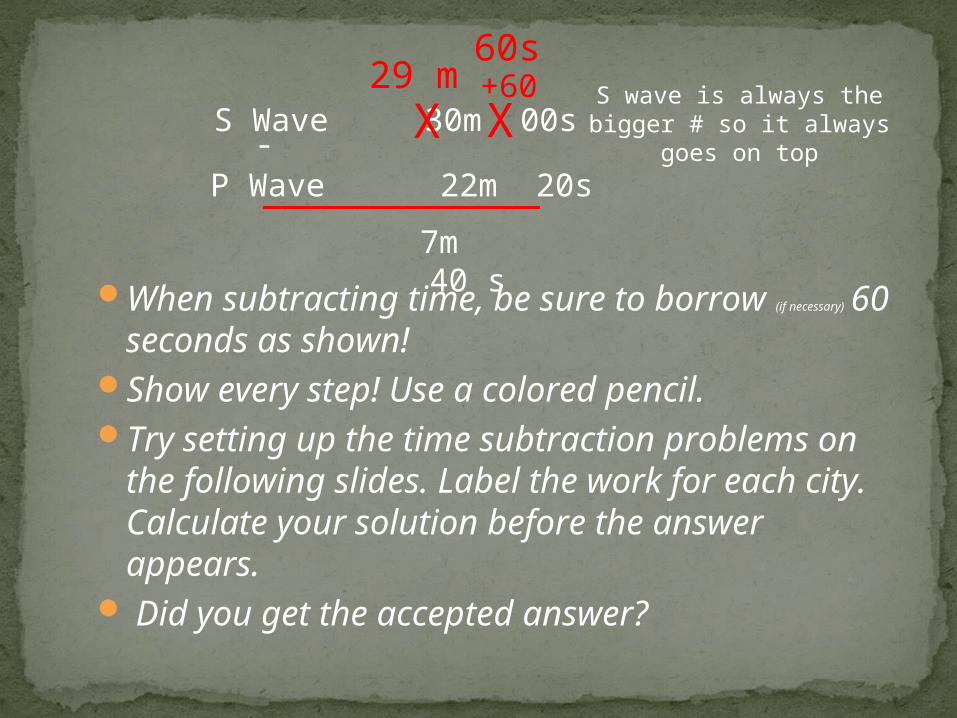
When subtracting time, be sure to borrow (if
necessary) 60 seconds as shown! Show every step! Use a colored pencil.Try setting up the time subtraction
problems on the following slides. Label the work for each city. Calculate your solution before the answer appears.
Did you get the accepted answer?
S Wave 30m 00s
P Wave 22m 20s
S wave is always the bigger # so it always goes on top
-XX
29 m +6060s
7m 40 s
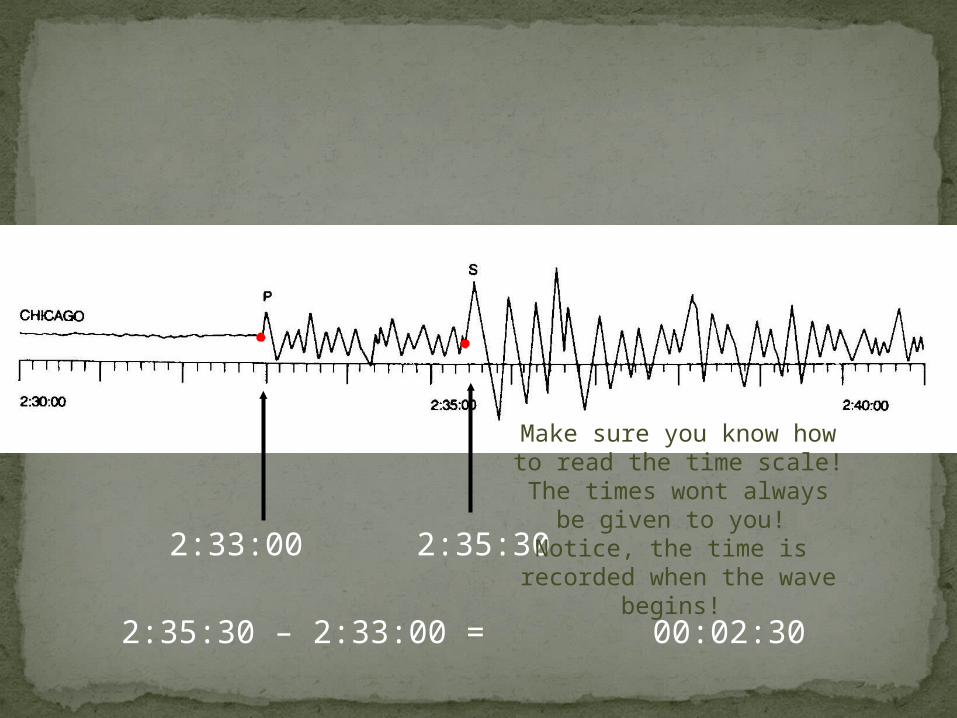
2:33:00 2:35:30
00:02:302:35:30 – 2:33:00 =
Make sure you know how to read the time scale! The times wont
always be given to you! Notice, the time is recorded when
the wave begins!
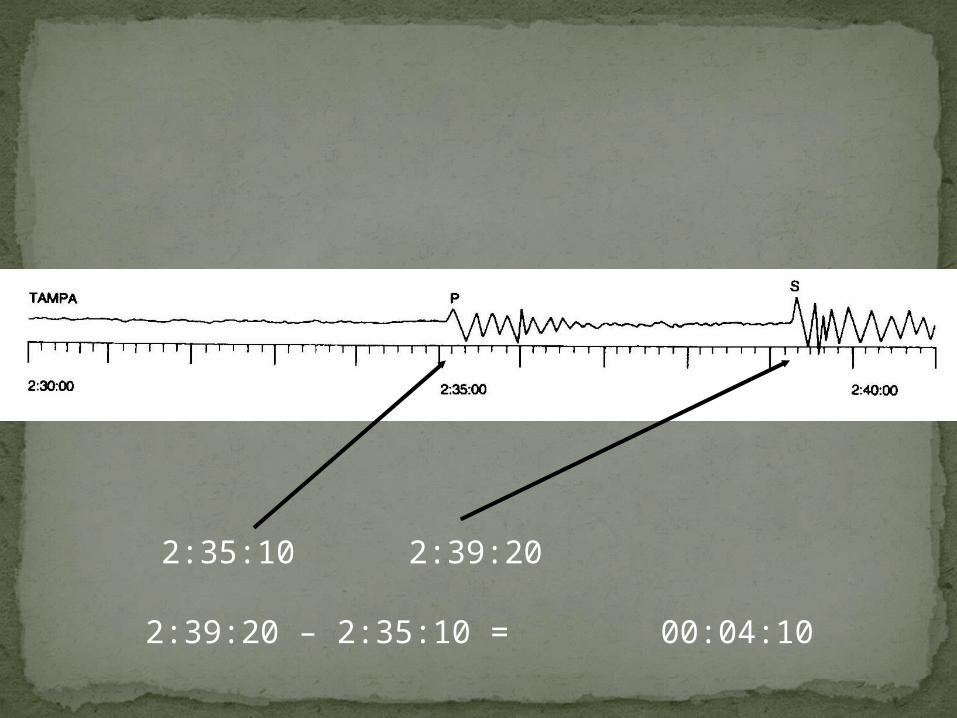
2:35:10 2:39:20
00:04:102:39:20 – 2:35:10 =
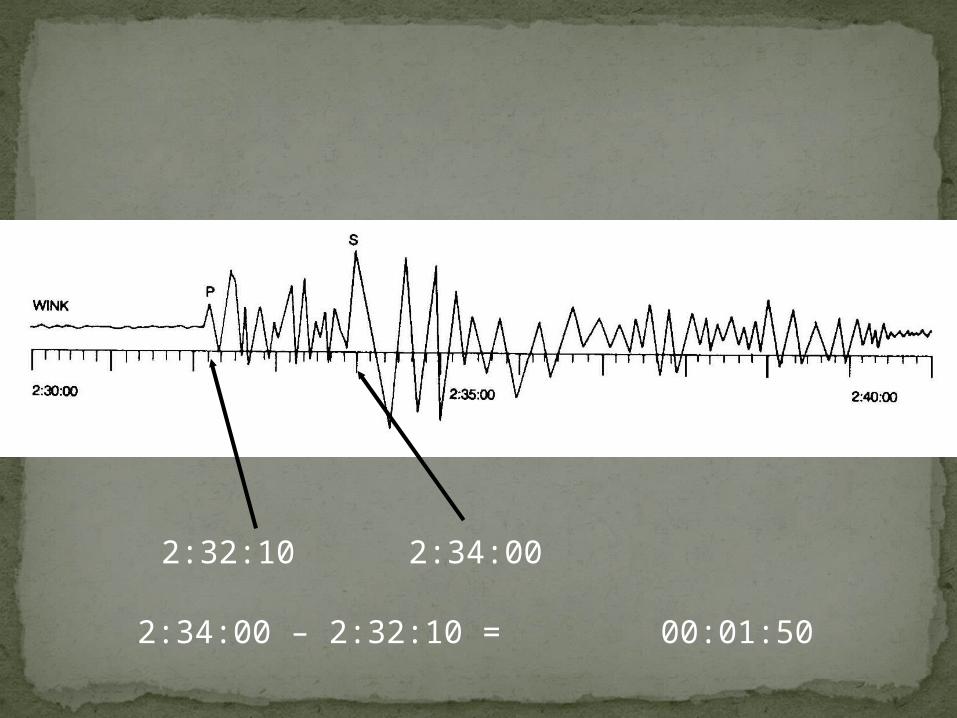
2:32:10 2:34:00
00:01:502:34:00 – 2:32:10 =
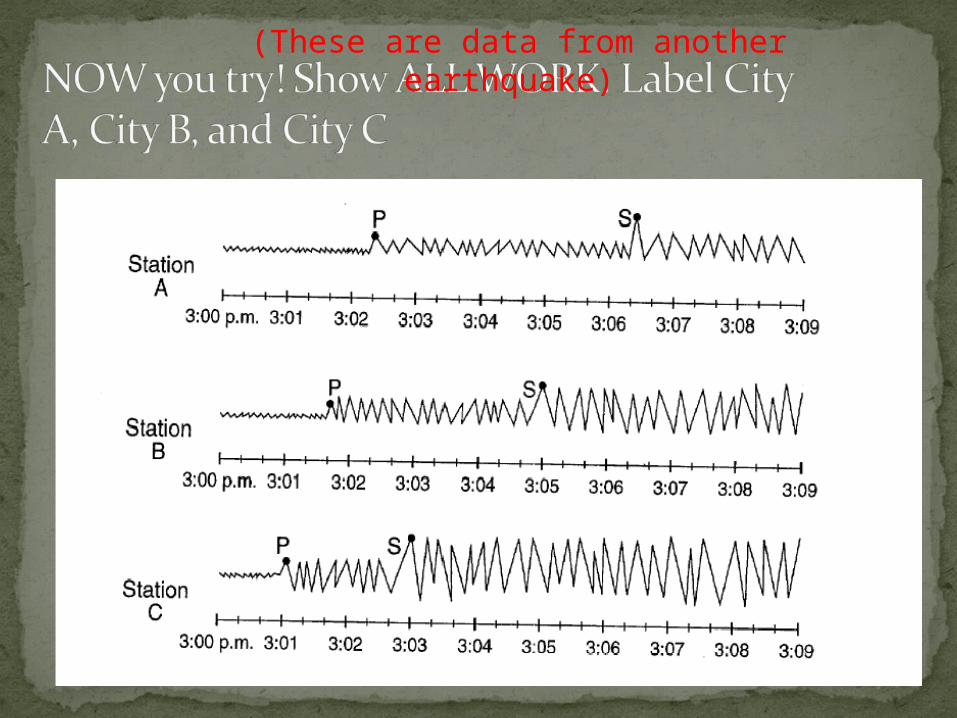
(These are data from another earthquake)
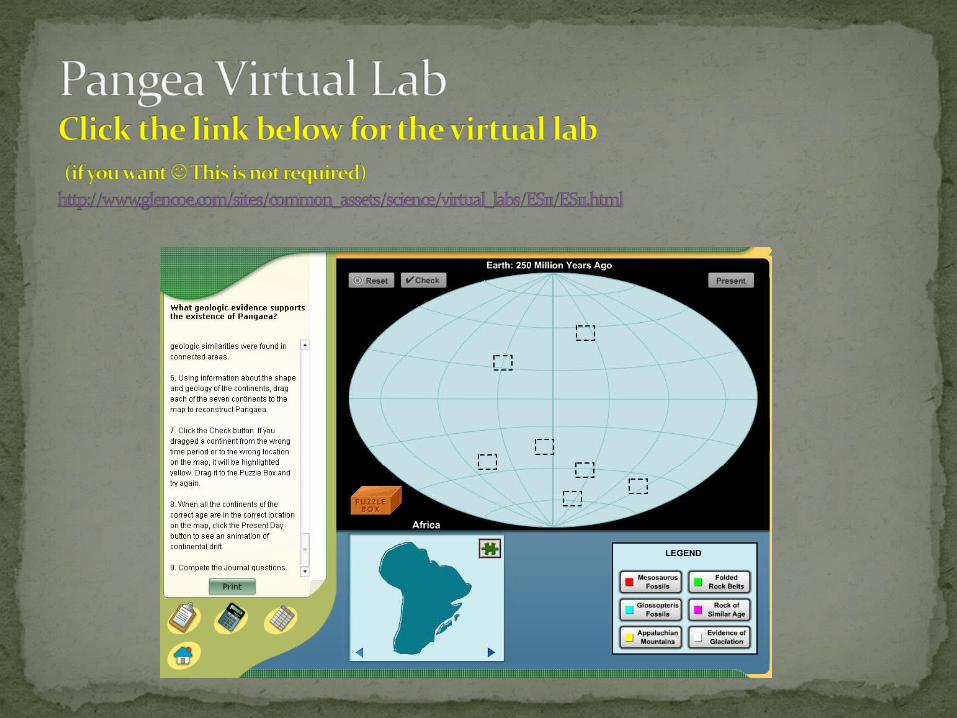
For the lab
Extra practice
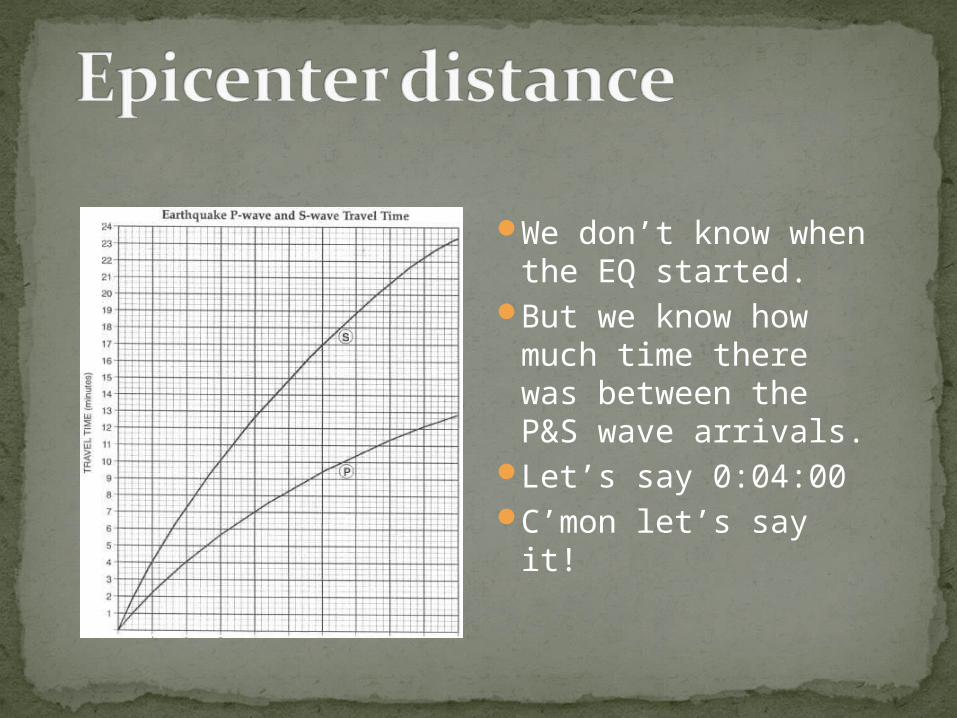
We don’t know when the EQ started.
But we know how much time there was between the P&S wave arrivals.
Let’s say 0:04:00C’mon let’s say it!
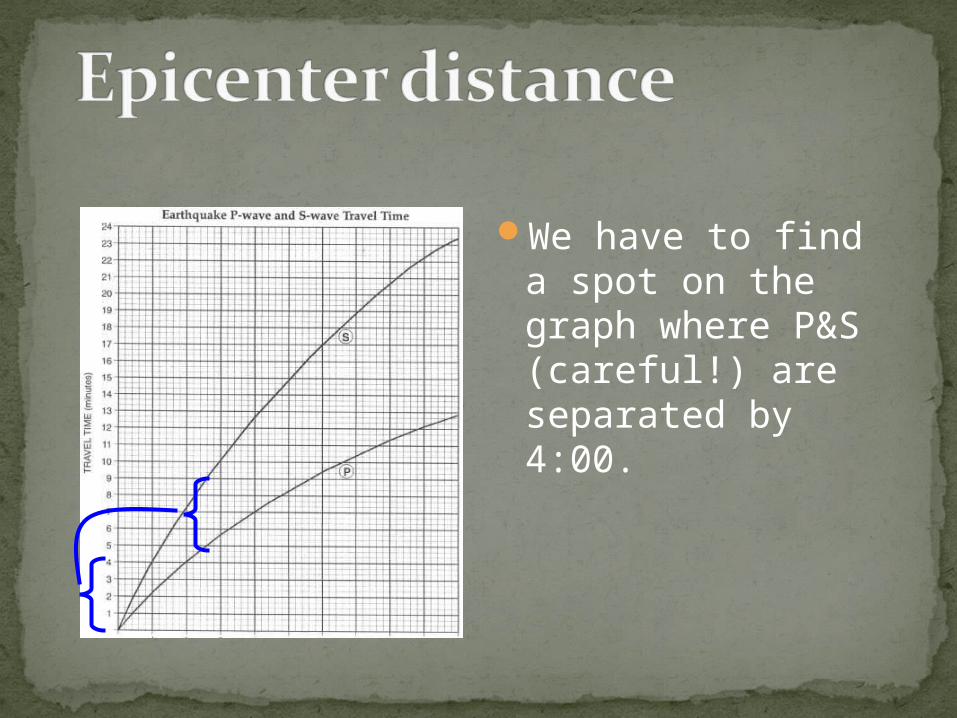
We have to find a spot on the graph where P&S (careful!) are separated by 4:00.
Scra
p p
ap
er
0min
4min
0
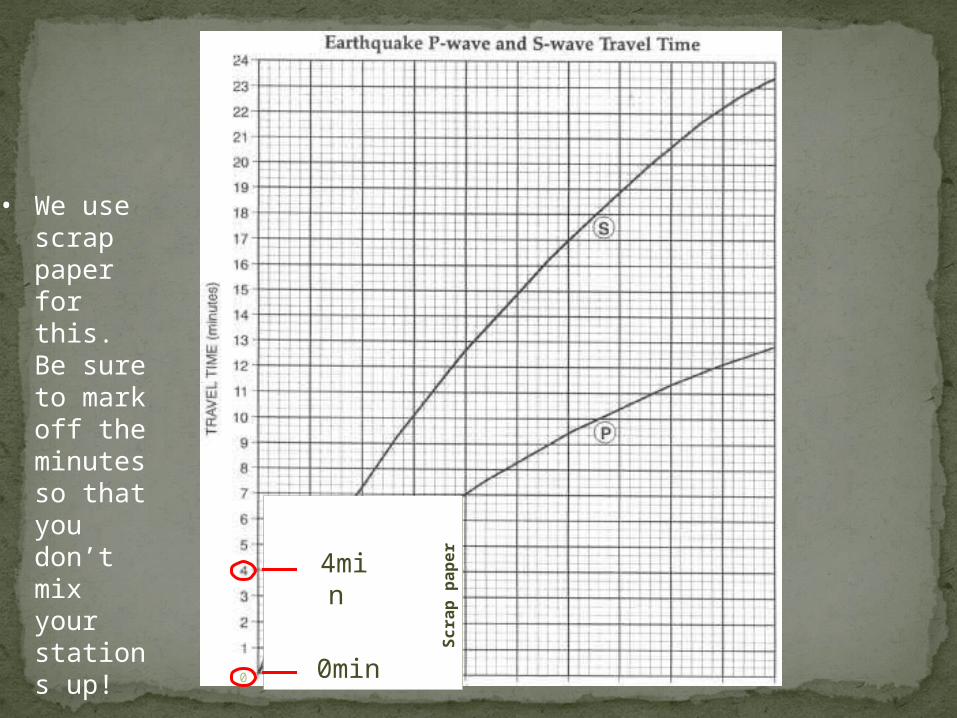
• We use scrap paper for this. Be sure to mark off the minutes so that you don’t mix your stations up!
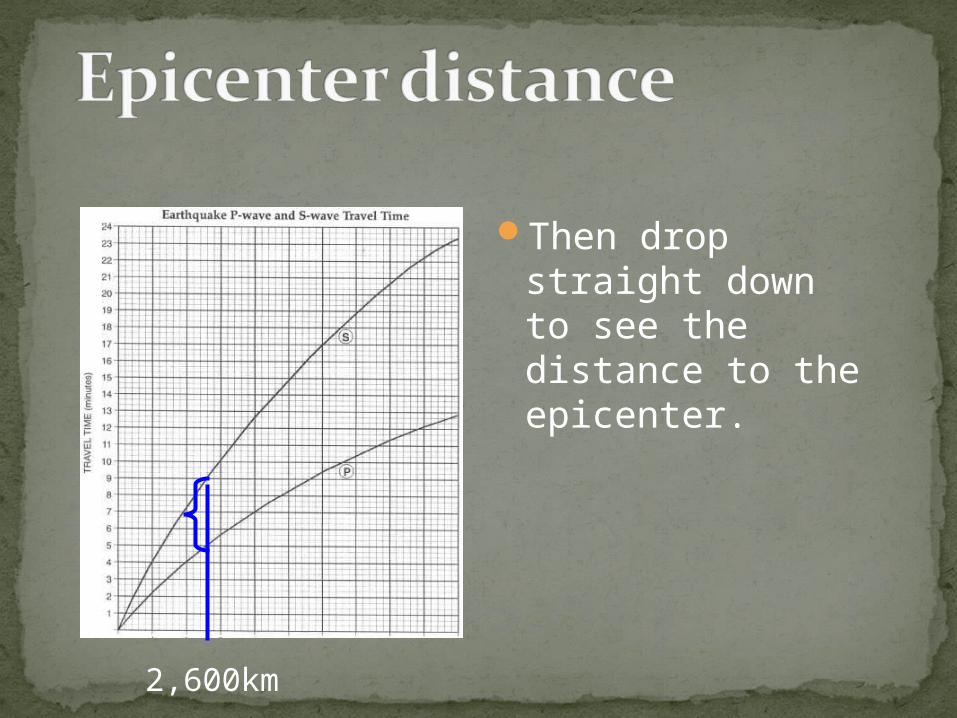
Then drop straight down to see the distance to the epicenter.
2,600km
Scra
p p
ap
er
0min
4min
km
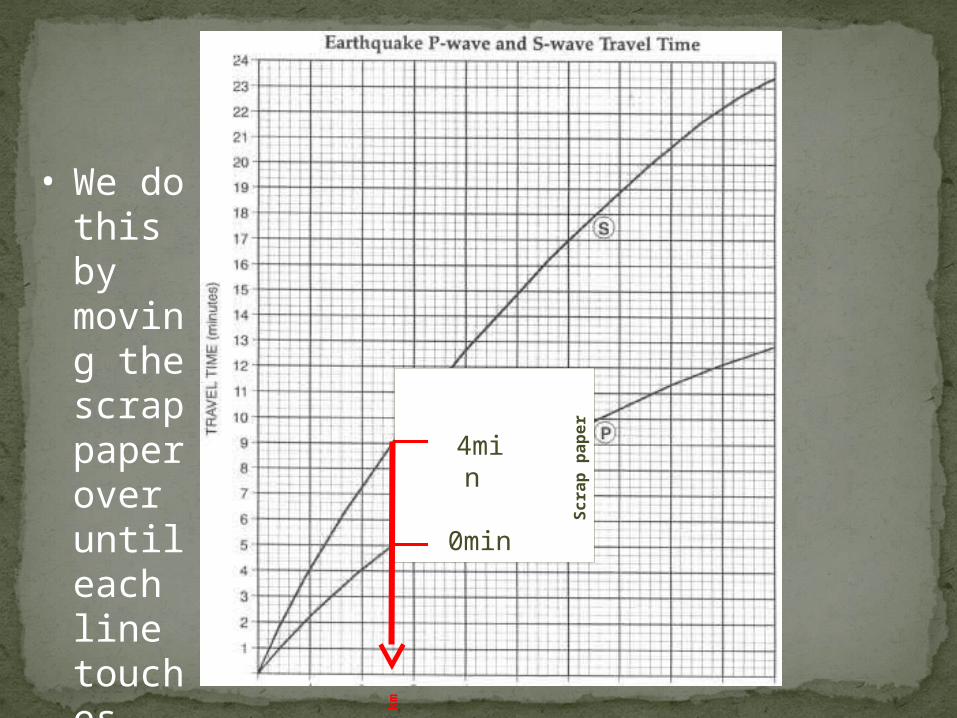
• We do this by moving the scrap paper over until each line touches.
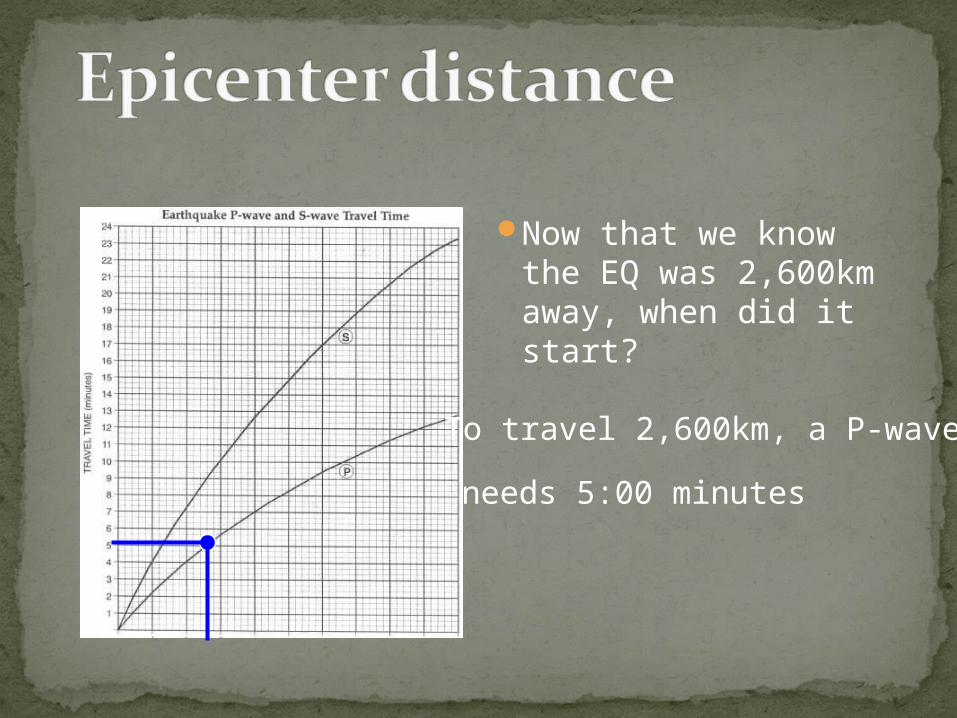
Now that we know the EQ was 2,600km away, when did it start?
To travel 2,600km, a P-wave…
needs 5:00 minutes
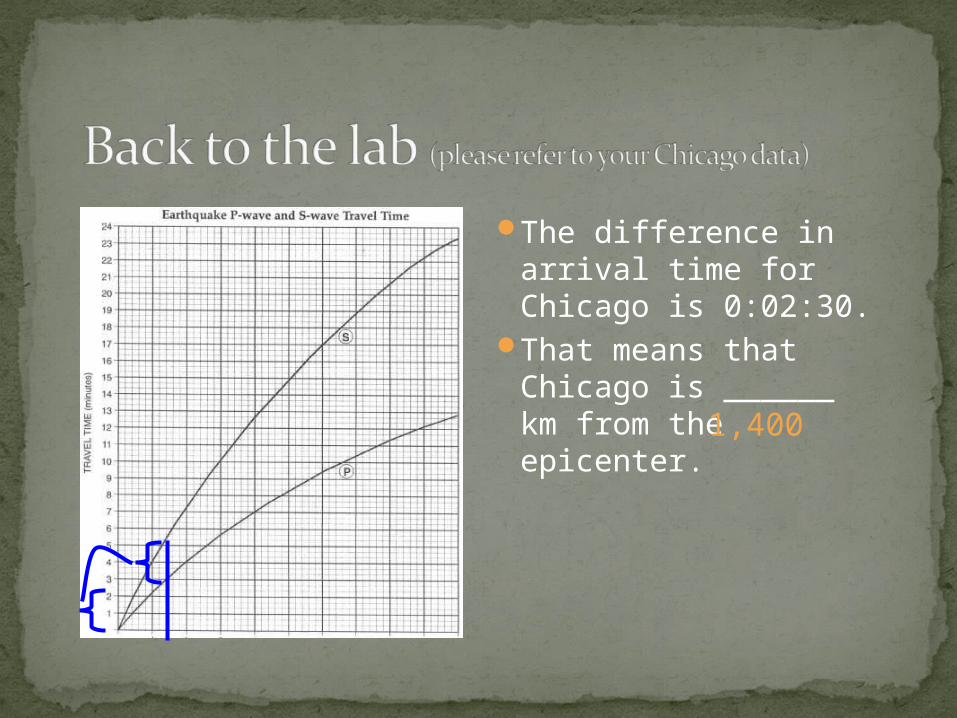
The difference in arrival time for Chicago is 0:02:30.
That means that Chicago is ______ km from the epicenter.
1,400
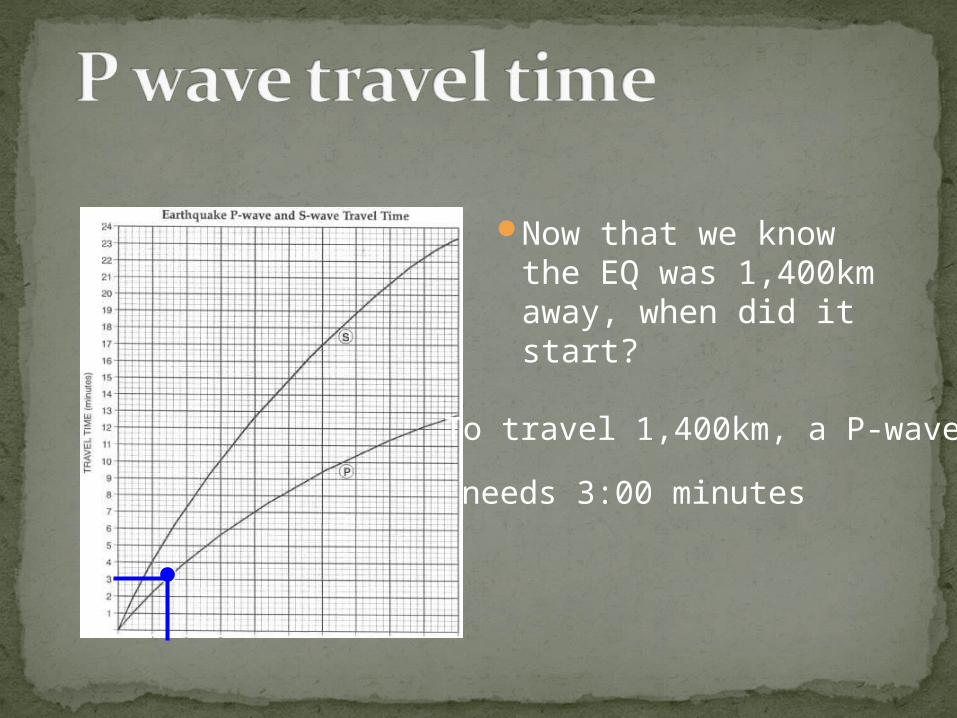
Now that we know the EQ was 1,400km away, when did it start?
To travel 1,400km, a P-wave…
needs 3:00 minutes
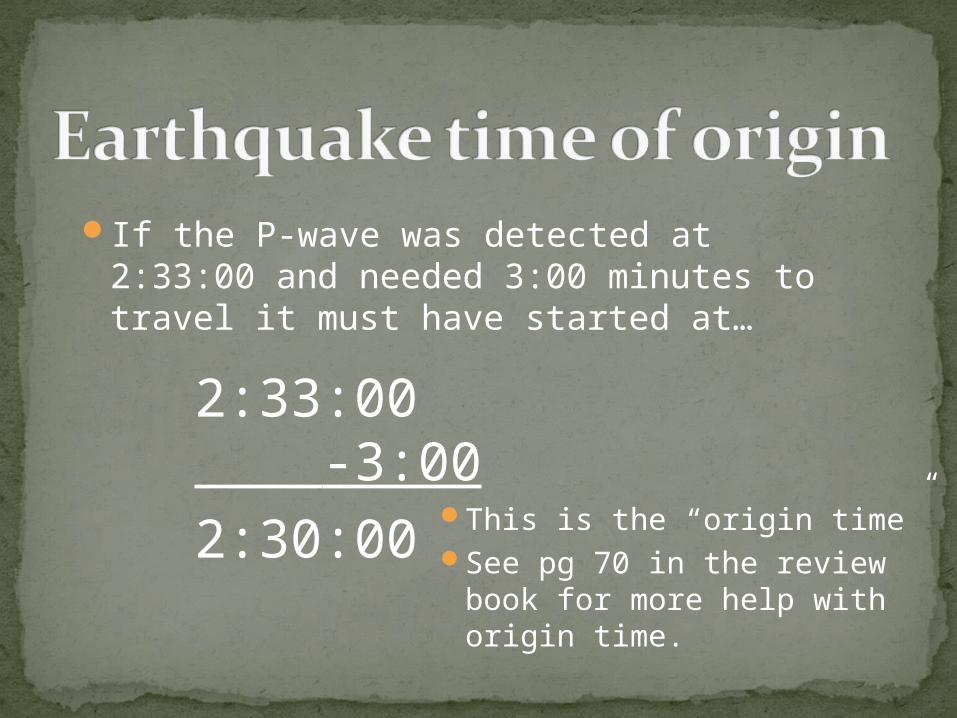
If the P-wave was detected at 2:33:00 and needed 3:00 minutes to travel it must have started at…
2:33:00 -3:00
2:30:00This is the “origin time”See pg 70 in the review
book for more help with origin time.
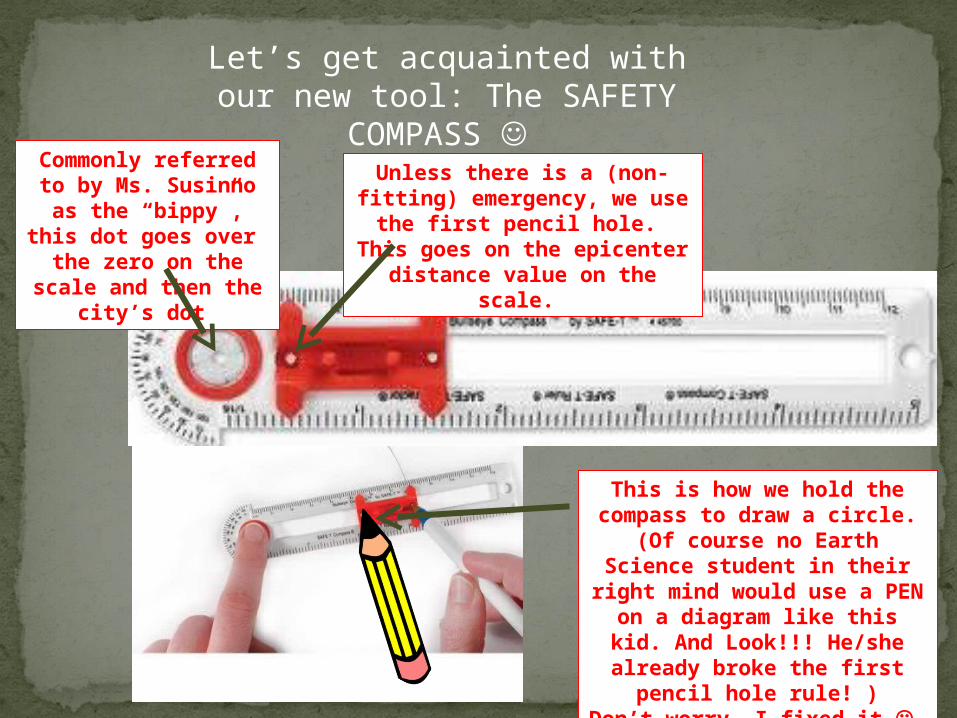
Let’s get acquainted with our new tool: The SAFETY COMPASS
Commonly referred to by Ms. Susinno as the
“bippy”, this dot goes over the zero on the scale and
then the city’s dot
Unless there is a (non-fitting) emergency, we use the first pencil hole. This goes on the epicenter
distance value on the scale.
This is how we hold the compass to draw a circle. (Of course no Earth Science student in their right mind would use a PEN on a diagram like
this kid. And Look!!! He/she already broke the first pencil hole rule! )
Don’t worry, I fixed it
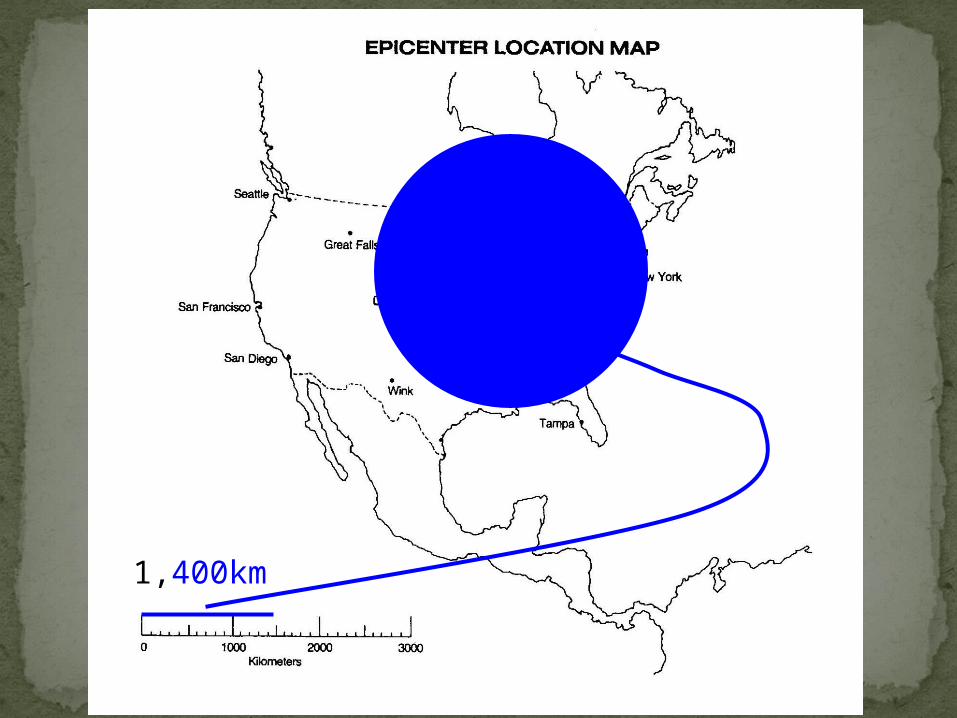
1,400km
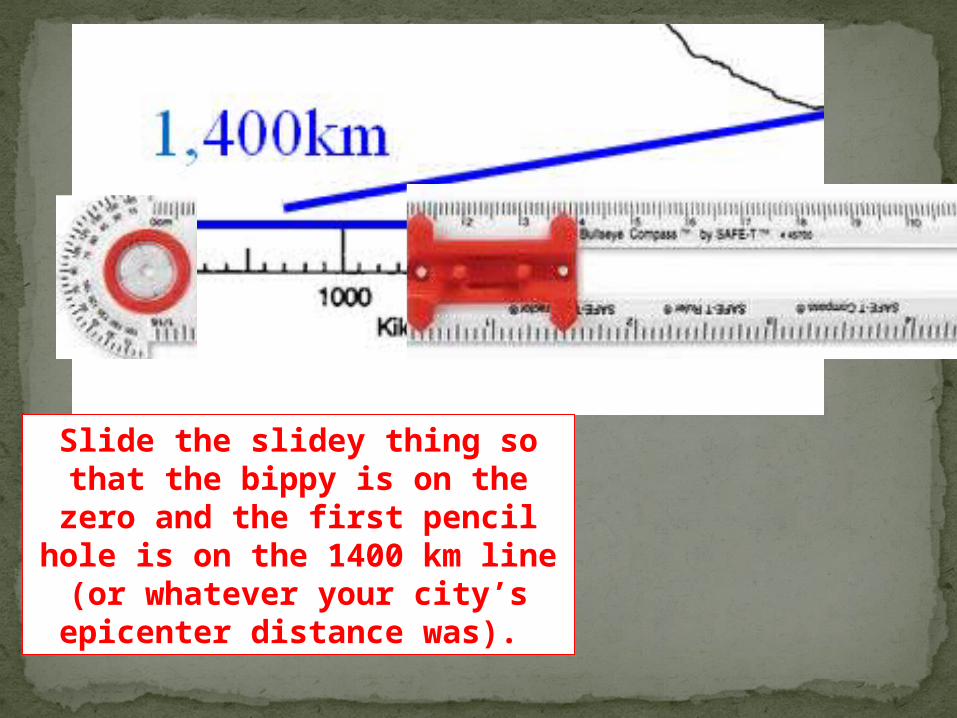
Slide the slidey thing so that the bippy is on the zero and the first pencil hole is on the 1400 km line (or whatever your city’s epicenter distance was).
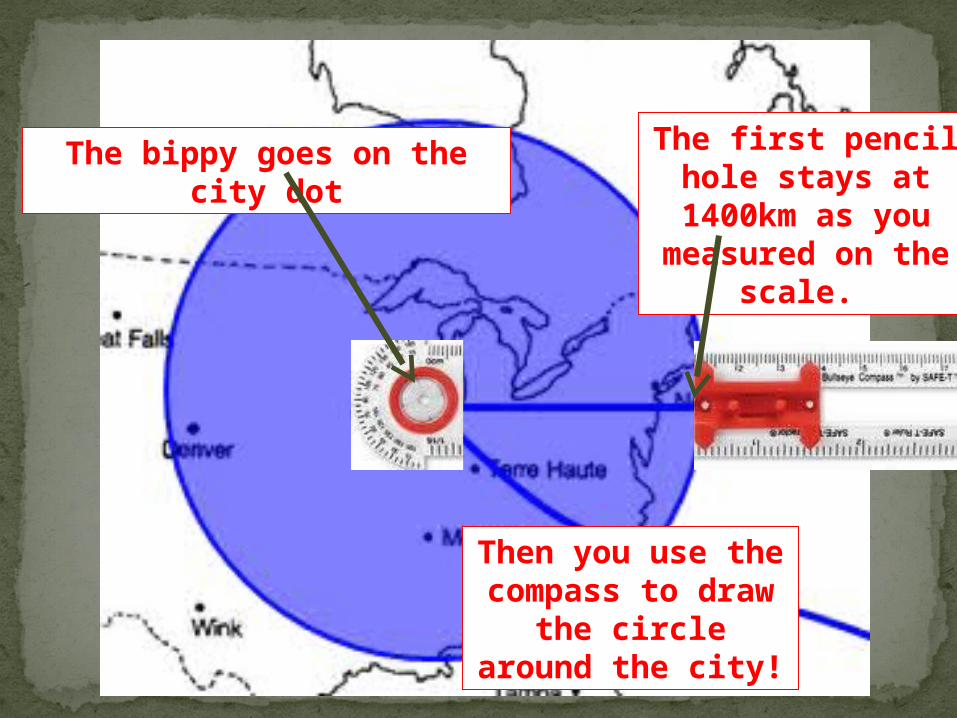
The bippy goes on the city dot The first pencil hole stays at 1400km as you measured on the scale.
Then you use the compass to draw the
circle around the city!
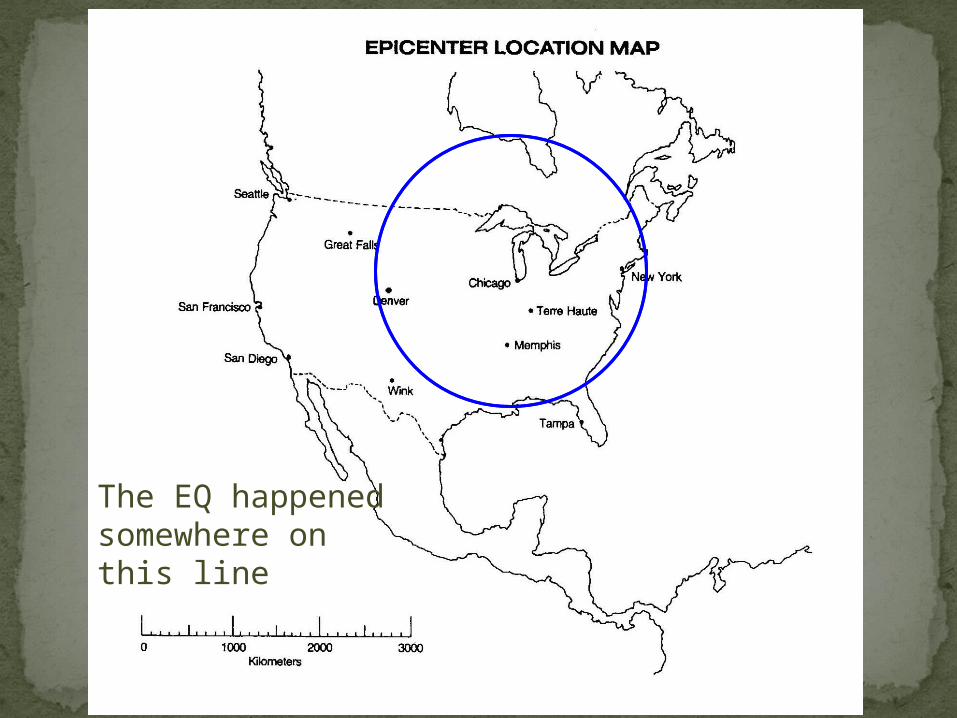
The EQ happened somewhere on this line
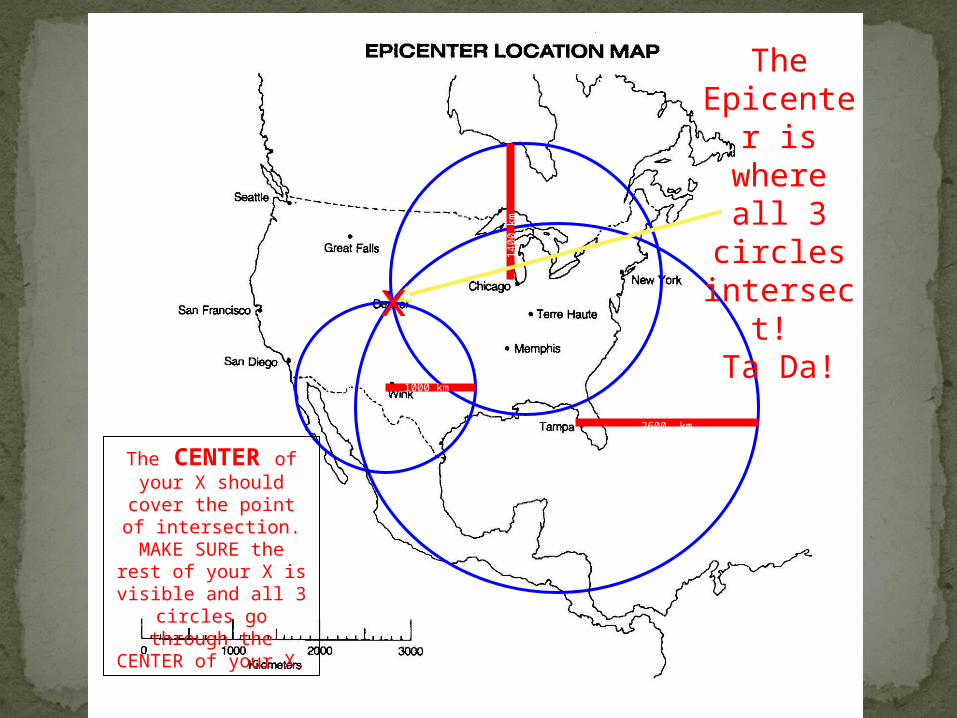
The Epicenter is where all 3
circles intersect!
Ta Da!
1000 km
2600 km
1400
km
x
The CENTER of your X should cover the point of intersection. MAKE
SURE the rest of your X is visible and all 3 circles go through the CENTER
of your X.
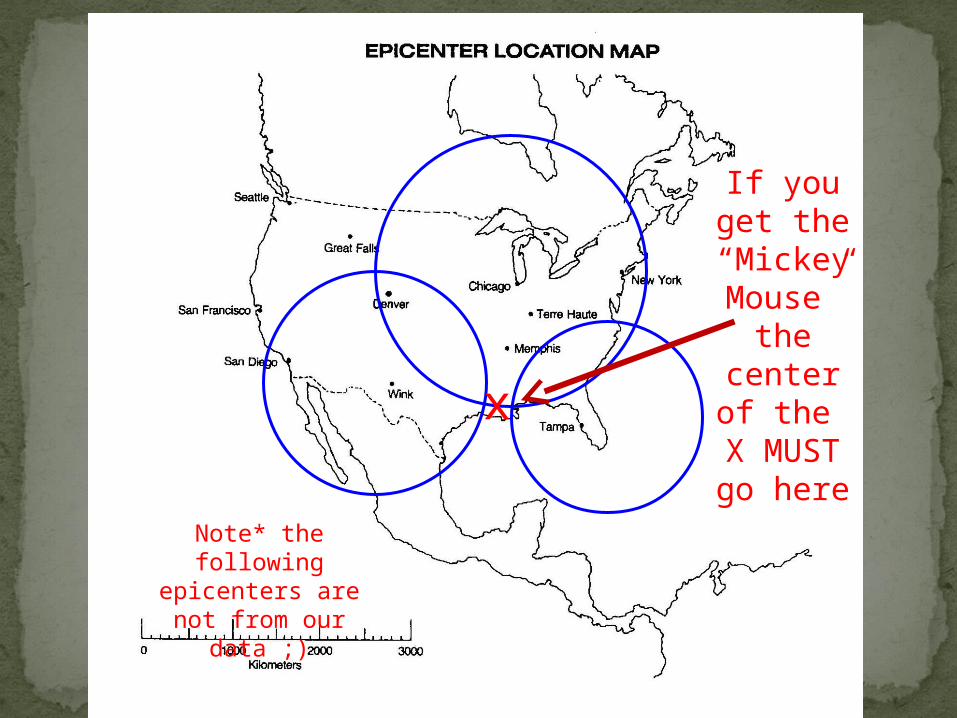
If you get the
“Mickey Mouse”
the center of the X MUST go
herex
Note* the following epicenters are not from our data ;)
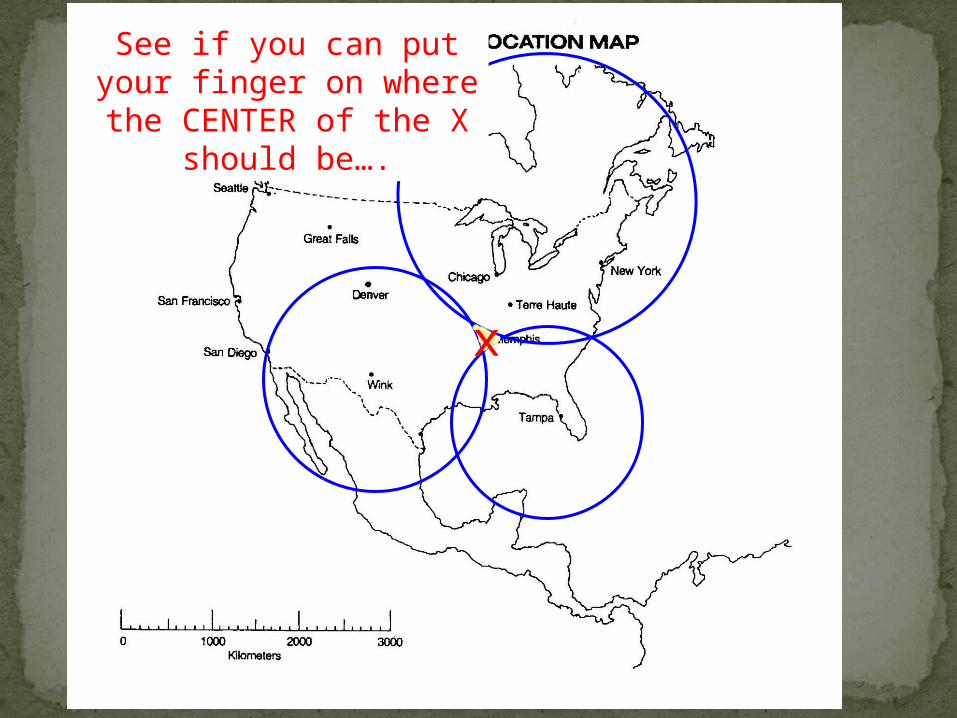
See if you can put your finger on where the CENTER of the
X should be….
x
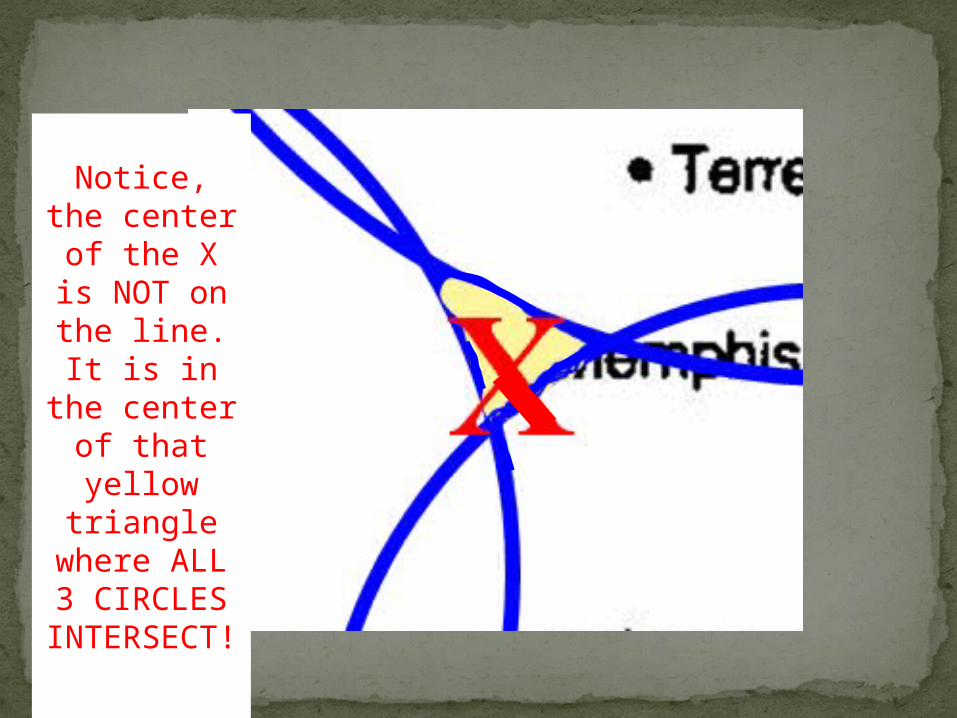
Notice, the center of the X is NOT on the line. It is in the center of that
yellow triangle where ALL 3
CIRCLES INTERSECT!
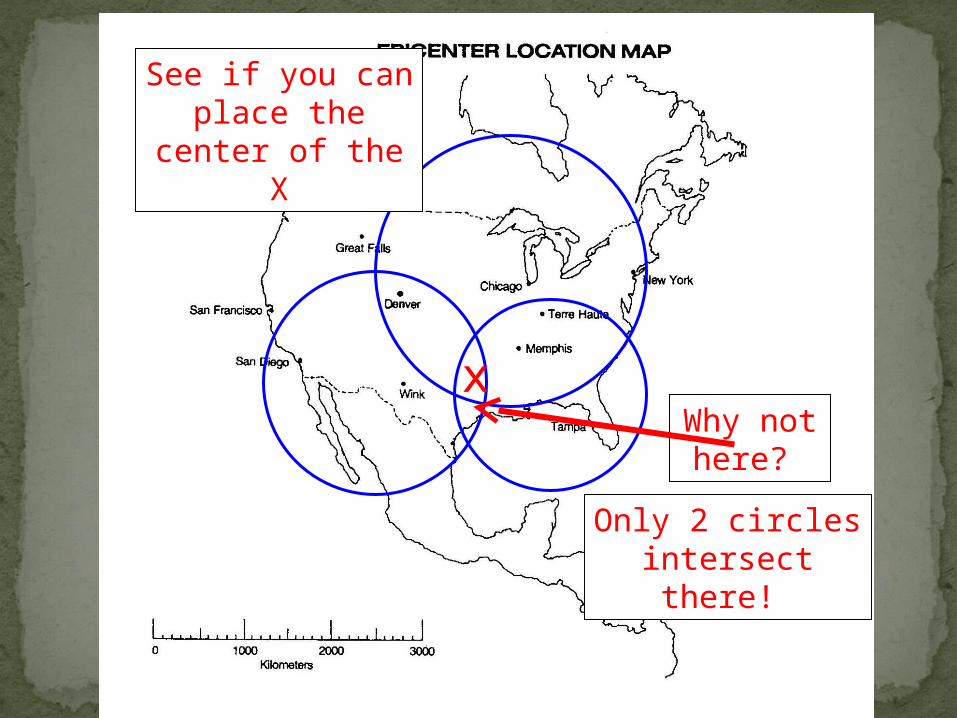
xWhy not
here?
Only 2 circles intersect there!
See if you can place the center of the X
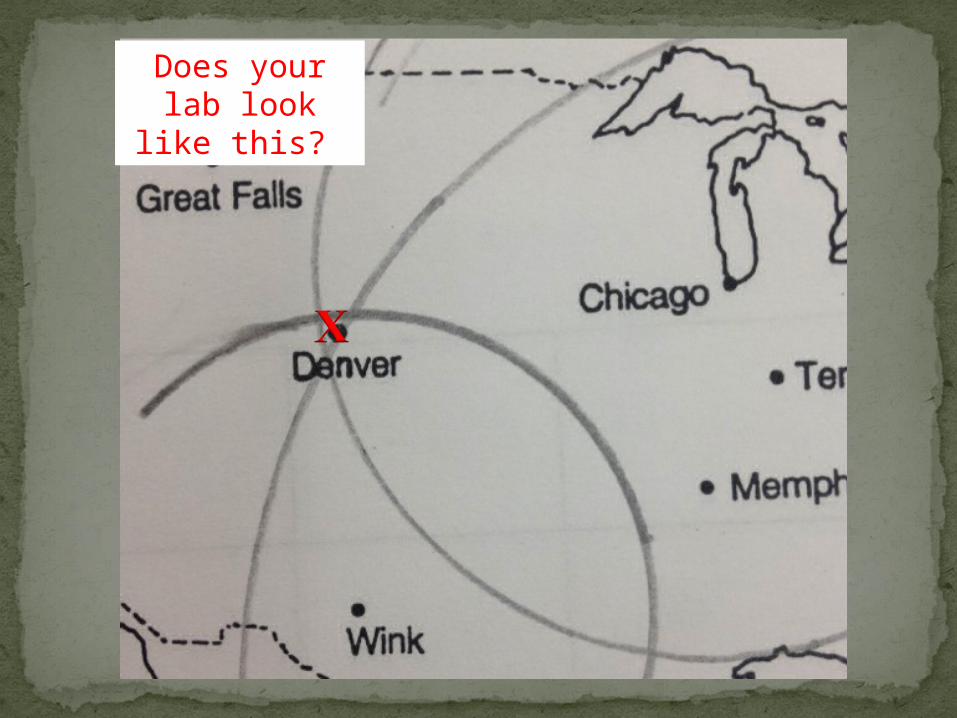
Does your lab look like this?

If you get a nice epicenter, you do the VICTORY DANCE!We’ll have plenty of real practice very soon!
The End