Embed Size (px)
Citation preview
Platinum Availability and Economics for PEMFC Commercialization
TIAX LLC15 Acorn ParkCambridge, Massachusetts02140-2390
References: TIAX LLC: D0034DOE: DE-FC04-01AL67601
Report to:US Department of Energy
December 2003
1D0034.2004-01-06 PGM Final Report.ppt
Notice
This report was prepared as an account of work sponsored by an agency of the United States Government. Neither the United States Government nor any agency thereof, or any of its contractors/subcontractors, or any of their employees, makes any warrant, express or implied, or assumes any legal liability or responsibility for the accuracy, completeness, or usefulness of any information, apparatus, product, or process disclosed, or represents that its use would not infringe privately owned rights. Reference herein to any specific commercial product, process, or service by trade name, trademark, manufacturer, or otherwise, does not necessarily constitute or imply its endorsement, recommendation, or favoring by the United States Government or any agency thereof. The views and opinions of authors expressed herein do not necessarily state or reflect those of the United States Government of any agency thereof.
Copyright © 2003 TIAX LLC
2D0034.2004-01-06 PGM Final Report.ppt
Contacts
Points of Contact for further information:
• TIAX LLC:– Eric J. Carlson
• US DOE:– Arlene F. Anderson
Technology Development ManagerHydrogen, Fuel Cells & Infrastructure [email protected]
3D0034.2004-01-06 PGM Final Report.ppt
Acknowledgements
We want to acknowledge the financial and technical support provided by the Department of Energy during this project and the contributions of the following organizations and individuals.
• TIAX LLC Project Team:– Eric J. Carlson (Principal Investigator)– Matthew Greenfield– Yueqiu Huang– Margot Noordzij– Todd Rhodes– Joan Yurko
• US DOE Project Team:– Arlene F. Anderson– Patrick Davis– Nancy Garland
• Consultants– Professor Grant Cawthorn
Platinum Industry’s Professor of Igneous Petrology, University of the Witwatersrand, South Africa
– Professor Walter Thurman, Department of Agriculture and Resource EconomicsNorth Carolina State University
• Industry Contributors– International Platinum Association– Johnson-Matthey– Engelhard– Freedom Car Fuel Cell Tech Team
4D0034.2004-01-06 PGM Final Report.ppt
Table of Contents
Page Number:
1 Executive Summary 5
2 Project Overview 29
3 Platinum Market Overview 36
4 Future Demand Scenarios 2005-2050 56
5 Economic Analysis 86
6 Appendix 100
5D0034.2004-01-06 PGM Final Report.ppt
Table of Contents
1 Executive Summary
2 Project Overview
3 Platinum Market Overview
4 Future Demand Scenarios 2005-2050
5 Economic Analysis
6 Appendix
6D0034.2004-01-06 PGM Final Report.ppt
Executive Summary Project Objectives and Scope
The US DOE engaged TIAX LLC to assess the long-term availability and price stability of platinum given anticipated demand from fuel cell vehicles. • Project scope:
– The timeframe of the future demand projection is from 2005 to 2050.– Platinum applications include Jewelry, Transportation, Industrial, and
Stationary Fuel Cells.– Demand for fuel cell vehicles (FCVs) is based on projections for five regions
(i.e., US, Western Europe, Japan, China, and India).– Observed historical platinum prices are from 1880 to the present.
• Issues outside of project scope:– Potential for political instability in major platinum producing countries.– Control of platinum production by a limited number of companies in the
major producing countries.– Future growth/decline in the world economy.– Potential for significant increases in platinum demand from new applications
other than fuel cells.– Ability of fuel cell technology developers to overcome technical hurdles.– Ability of the fueling infrastructure to support commercialization of fuel cell
vehicles.
7D0034.2004-01-06 PGM Final Report.ppt
Executive Summary Key Findings
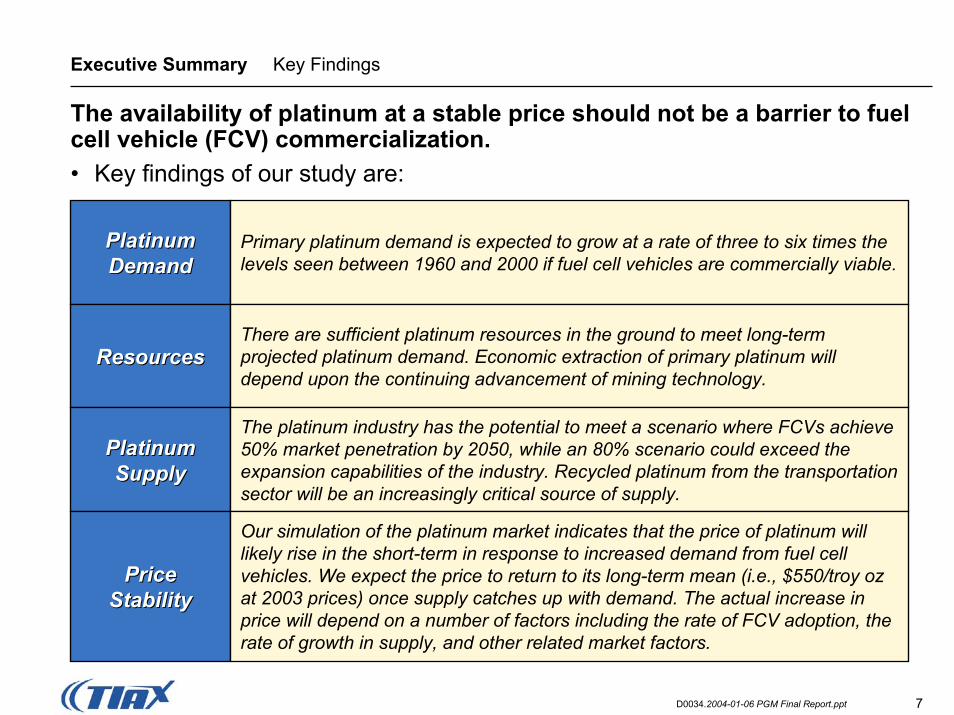
The availability of platinum at a stable price should not be a barrier to fuel cell vehicle (FCV) commercialization.• Key findings of our study are:
Platinum Platinum DemandDemand
ResourcesResources
Platinum Platinum SupplySupply
Price Price StabilityStability
Primary platinum demand is expected to grow at a rate of three to six times the levels seen between 1960 and 2000 if fuel cell vehicles are commercially viable.
There are sufficient platinum resources in the ground to meet long-term projected platinum demand. Economic extraction of primary platinum will depend upon the continuing advancement of mining technology.
The platinum industry has the potential to meet a scenario where FCVs achieve 50% market penetration by 2050, while an 80% scenario could exceed the expansion capabilities of the industry. Recycled platinum from the transportation sector will be an increasingly critical source of supply.
Our simulation of the platinum market indicates that the price of platinum will likely rise in the short-term in response to increased demand from fuel cell vehicles. We expect the price to return to its long-term mean (i.e., $550/troy oz at 2003 prices) once supply catches up with demand. The actual increase in price will depend on a number of factors including the rate of FCV adoption, the rate of growth in supply, and other related market factors.
8D0034.2004-01-06 PGM Final Report.ppt
Executive Summary Recent Platinum Prices
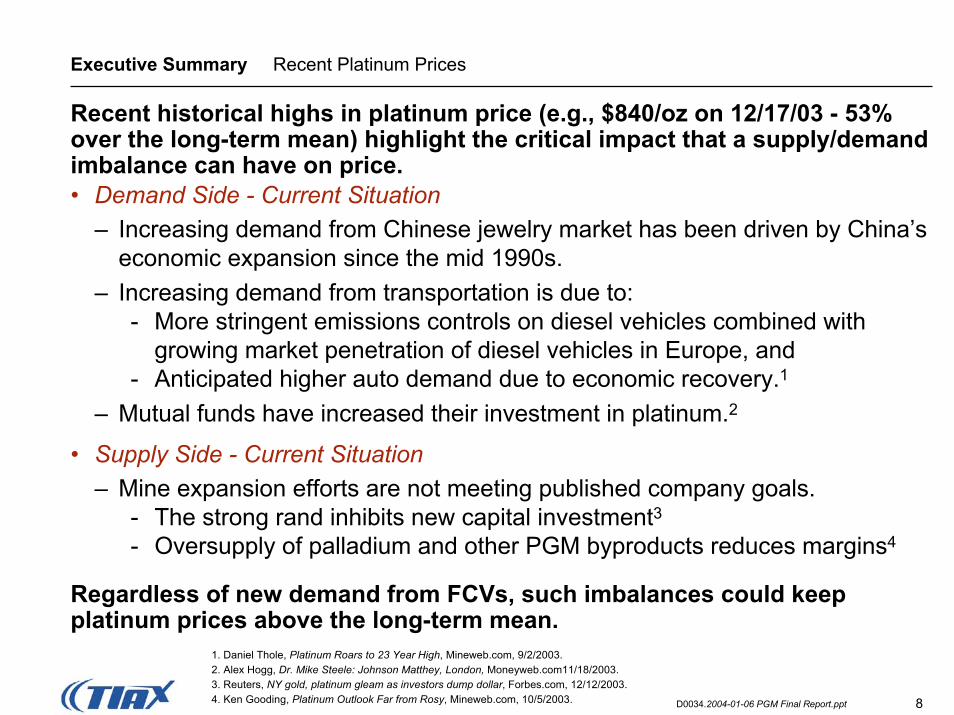
Recent historical highs in platinum price (e.g., $840/oz on 12/17/03 - 53% over the long-term mean) highlight the critical impact that a supply/demand imbalance can have on price.• Demand Side - Current Situation
– Increasing demand from Chinese jewelry market has been driven by China’s economic expansion since the mid 1990s.
– Increasing demand from transportation is due to:- More stringent emissions controls on diesel vehicles combined with
growing market penetration of diesel vehicles in Europe, and - Anticipated higher auto demand due to economic recovery.1
– Mutual funds have increased their investment in platinum.2
• Supply Side - Current Situation– Mine expansion efforts are not meeting published company goals.
- The strong rand inhibits new capital investment3- Oversupply of palladium and other PGM byproducts reduces margins4
Regardless of new demand from FCVs, such imbalances could keep platinum prices above the long-term mean.
1. Daniel Thole, Platinum Roars to 23 Year High, Mineweb.com, 9/2/2003.2. Alex Hogg, Dr. Mike Steele: Johnson Matthey, London, Moneyweb.com11/18/2003.3. Reuters, NY gold, platinum gleam as investors dump dollar, Forbes.com, 12/12/2003.4. Ken Gooding, Platinum Outlook Far from Rosy, Mineweb.com, 10/5/2003.
9D0034.2004-01-06 PGM Final Report.ppt
Executive Summary Role of Platinum in Fuel Cell Vehicles Performance
Platinum is critical to fuel cell performance.
• Platinum is critical to achieving the required levels of fuel cell power density and efficiency.
• Platinum and some ruthenium are essential to the catalysis of anodic and cathodic reactions in the stack.
• Platinum is important for the catalysis of reforming, shift, and preferential oxidation (PROX) reactions in the fuel processor.
10D0034.2004-01-06 PGM Final Report.ppt
Executive Summary Role of Platinum in Fuel Cell Vehicles Cost
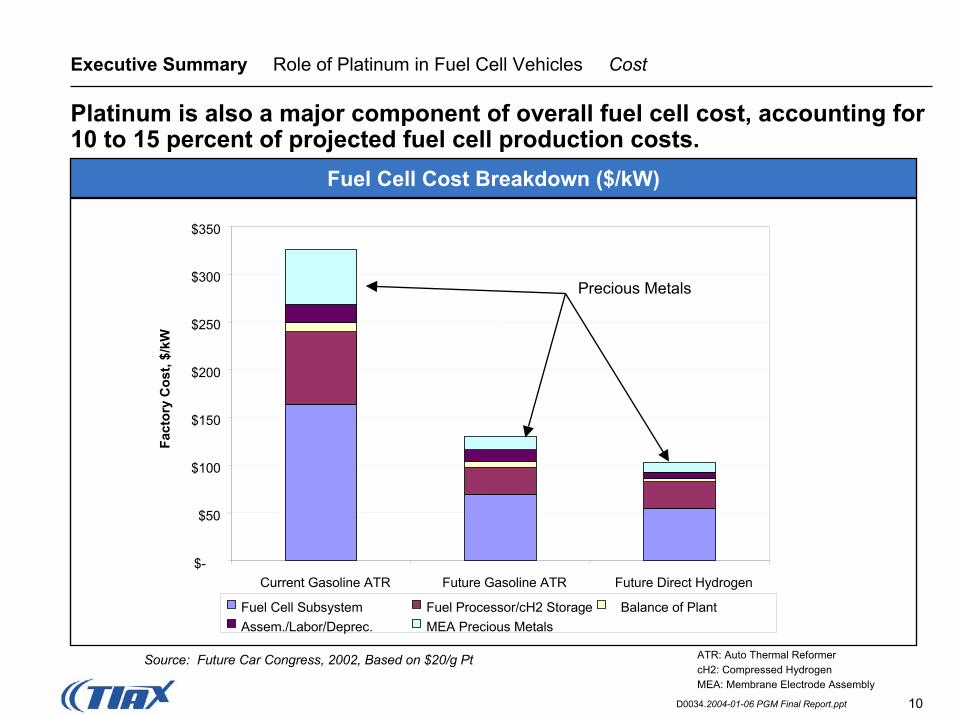
Platinum is also a major component of overall fuel cell cost, accounting for 10 to 15 percent of projected fuel cell production costs.
$-
$50
$100
$150
$200
$250
$300
$350
Current Gasoline ATR Future Gasoline ATR Future Direct Hydrogen
Fact
ory
Cos
t, $/
kW
Fuel Cell Subsystem Fuel Processor/cH2 Storage Balance of PlantAssem./Labor/Deprec. MEA Precious Metals
Precious Metals
Fuel Cell Cost Breakdown ($/kW)
ATR: Auto Thermal ReformercH2: Compressed HydrogenMEA: Membrane Electrode Assembly
Source: Future Car Congress, 2002, Based on $20/g Pt
11D0034.2004-01-06 PGM Final Report.ppt
Executive Summary Platinum Suppliers and Markets
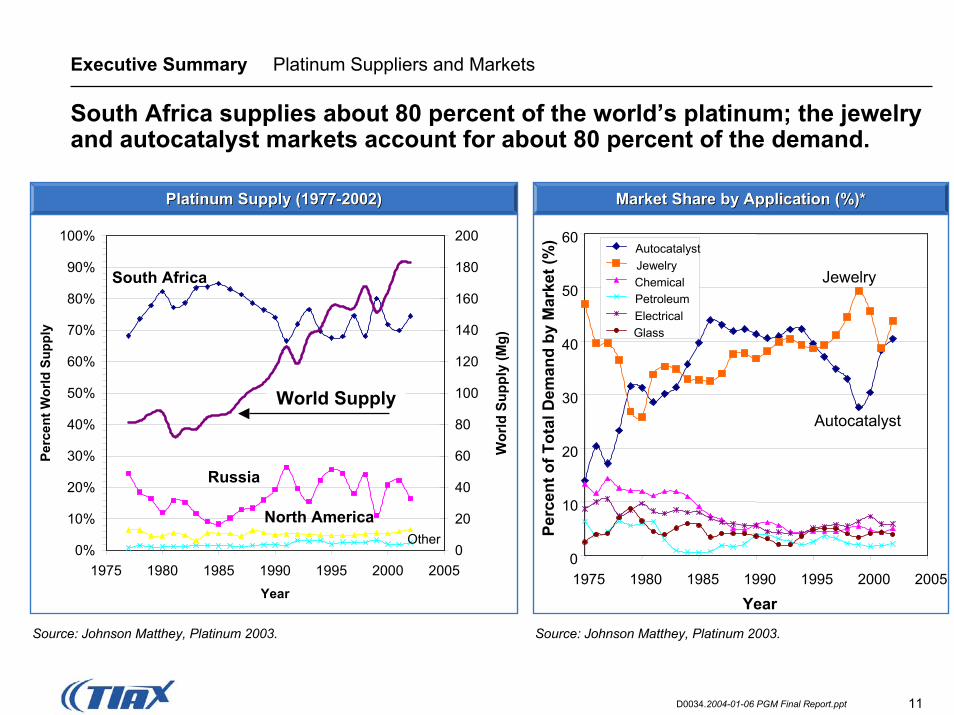
South Africa supplies about 80 percent of the world’s platinum; the jewelry and autocatalyst markets account for about 80 percent of the demand.
Platinum Supply (1977Platinum Supply (1977--2002)2002)
0%
10%
20%
30%
40%
50%
60%
70%
80%
90%
100%
1975 1980 1985 1990 1995 2000 2005Year
Perc
ent W
orld
Sup
ply
0
20
40
60
80
100
120
140
160
180
200
Wor
ld S
uppl
y (M
g)
South Africa
Russia
North AmericaOther
World Supply
Market Share by Application (%)*Market Share by Application (%)*
0
10
20
30
40
50
60
1975 1980 1985 1990 1995 2000 2005
Year
Perc
ent o
f Tot
al D
eman
d by
Mar
ket (
%) Autocatalyst
JewelryChemicalPetroleumElectricalGlass
Jewelry
Autocatalyst
Source: Johnson Matthey, Platinum 2003. Source: Johnson Matthey, Platinum 2003.
12D0034.2004-01-06 PGM Final Report.ppt
Executive Summary Historic Platinum Production
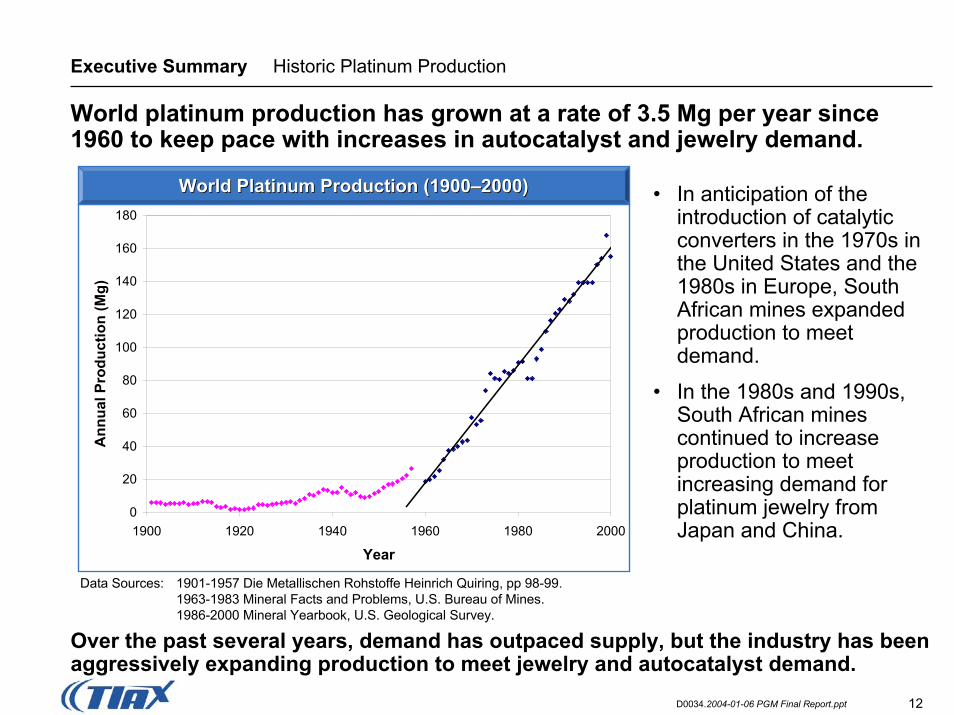
World platinum production has grown at a rate of 3.5 Mg per year since 1960 to keep pace with increases in autocatalyst and jewelry demand.
World Platinum Production (1900World Platinum Production (1900––2000)2000)
0
20
40
60
80
100
120
140
160
180
1900 1920 1940 1960 1980 2000
Year
Ann
ual P
rodu
ctio
n (M
g)
Data Sources: 1901-1957 Die Metallischen Rohstoffe Heinrich Quiring, pp 98-99.1963-1983 Mineral Facts and Problems, U.S. Bureau of Mines.1986-2000 Mineral Yearbook, U.S. Geological Survey.
• In anticipation of the introduction of catalytic converters in the 1970s in the United States and the 1980s in Europe, South African mines expanded production to meet demand.
• In the 1980s and 1990s, South African mines continued to increase production to meet increasing demand for platinum jewelry from Japan and China.
Over the past several years, demand has outpaced supply, but the industry has been aggressively expanding production to meet jewelry and autocatalyst demand.
13D0034.2004-01-06 PGM Final Report.ppt
Executive Summary Future Demand Scenarios
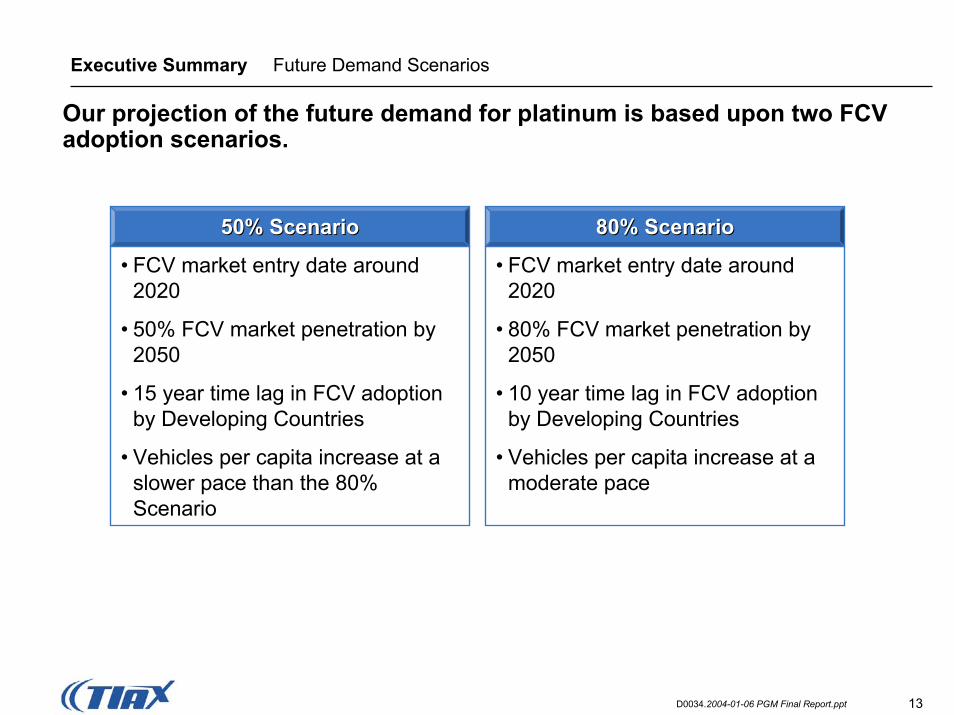
Our projection of the future demand for platinum is based upon two FCV adoption scenarios.
• FCV market entry date around 2020
• 80% FCV market penetration by 2050
• 10 year time lag in FCV adoption by Developing Countries
• Vehicles per capita increase at a moderate pace
• FCV market entry date around 2020
• 50% FCV market penetration by 2050
• 15 year time lag in FCV adoption by Developing Countries
• Vehicles per capita increase at a slower pace than the 80% Scenario
80% Scenario80% Scenario50% Scenario50% Scenario
14D0034.2004-01-06 PGM Final Report.ppt
Executive Summary Future Demand Scenarios Key Assumptions
Important assumptions associated with the two FCV adoption scenarios include:
• Platinum loading in FCVs will decline from 60g/FCV in 2005 to 15g/FCV in 2025.
• Jewelry and Industrial sector demand will grow at a rate of 1.4 percent per year through 2050.
• Stationary fuel cell power generation will enter the market in 2006 and will reach 15 GW/year in 2050, accounting for about one percent of power generated by FCVs.
• Recycling of platinum from fuel cells (considering both recovery and processing) will be 95 percent efficient; recycling of platinum from internal combustion engine vehicles (ICEVs) will be 90 percent efficient.
• Population growth trends in each country will match United Nations projections.
15D0034.2004-01-06 PGM Final Report.ppt
Executive Summary 2050 Vehicle Sales Projections
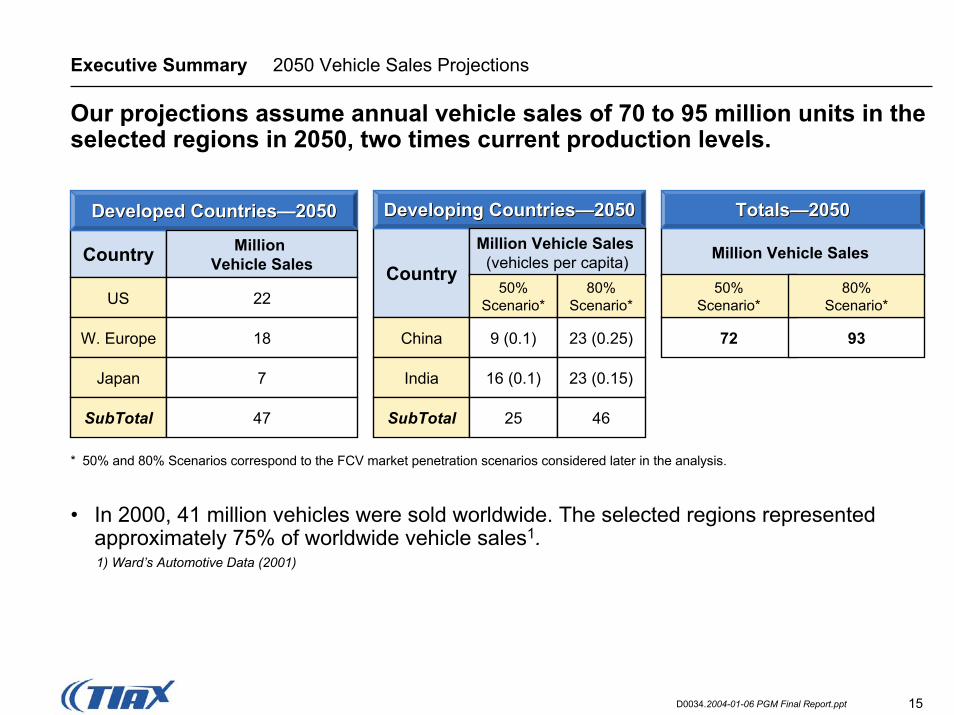
Our projections assume annual vehicle sales of 70 to 95 million units in the selected regions in 2050, two times current production levels.
• In 2000, 41 million vehicles were sold worldwide. The selected regions represented approximately 75% of worldwide vehicle sales1.1) Ward’s Automotive Data (2001)
72 93
Million Vehicle Sales
50%Scenario*
80%Scenario*
Country
Developed CountriesDeveloped Countries——20502050
Million Vehicle Sales
US 22
W. Europe 18
Japan 7
SubTotal 47
Country
Developing CountriesDeveloping Countries——20502050 TotalsTotals——20502050
Million Vehicle Sales (vehicles per capita)
China 9 (0.1)
India 16 (0.1)
50%Scenario*
80%Scenario*
23 (0.25)
23 (0.15)
SubTotal 25 46
* 50% and 80% Scenarios correspond to the FCV market penetration scenarios considered later in the analysis.
16D0034.2004-01-06 PGM Final Report.ppt
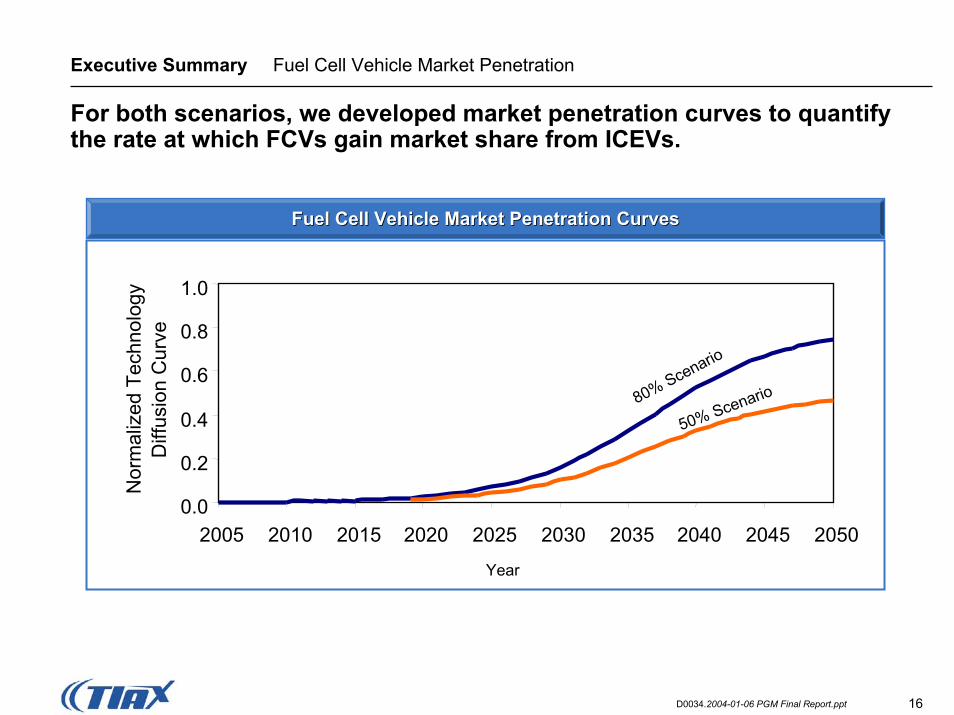
Executive Summary Fuel Cell Vehicle Market Penetration
For both scenarios, we developed market penetration curves to quantify the rate at which FCVs gain market share from ICEVs.
0.0
0.2
0.4
0.6
0.8
1.0
2005 2010 2015 2020 2025 2030 2035 2040 2045 2050
Nor
mal
ized
Tec
hnol
ogy
Diff
usio
n C
urve
80% Scenario
50% Scenario
Year
Fuel Cell Vehicle Market Penetration CurvesFuel Cell Vehicle Market Penetration Curves
17D0034.2004-01-06 PGM Final Report.ppt
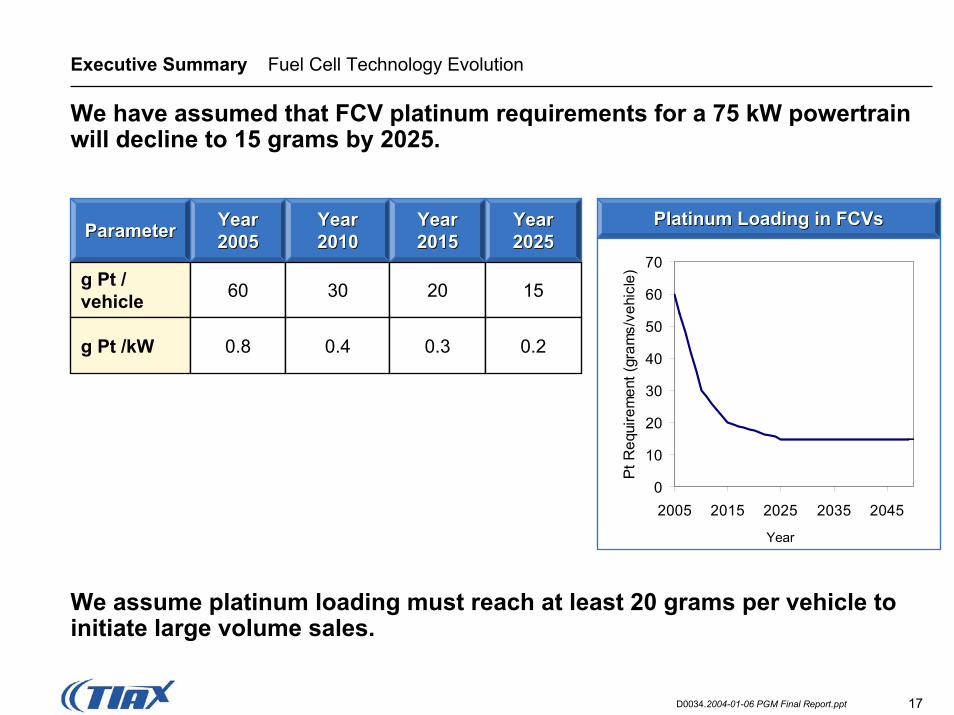
Executive Summary Fuel Cell Technology Evolution
We have assumed that FCV platinum requirements for a 75 kW powertrainwill decline to 15 grams by 2025.
Platinum Loading in FCVsPlatinum Loading in FCVs
0
10
20
30
40
50
60
70
2005 2015 2025 2035 2045
Pt R
equi
rem
ent (
gram
s/ve
hicl
e)
Year
We assume platinum loading must reach at least 20 grams per vehicle to initiate large volume sales.
YearYear20052005
YearYear20102010
YearYear20152015
YearYear20252025ParameterParameter
g Pt /vehicle
g Pt /kW
60
0.8
30
0.4
20 15
0.3 0.2
18D0034.2004-01-06 PGM Final Report.ppt
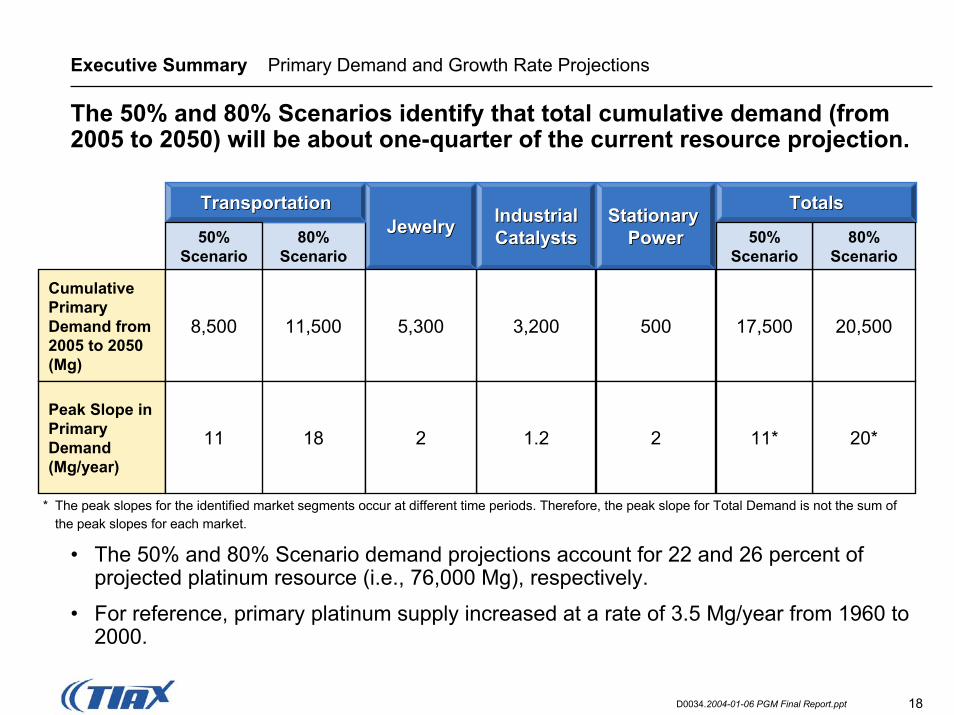
Executive Summary Primary Demand and Growth Rate Projections
The 50% and 80% Scenarios identify that total cumulative demand (from 2005 to 2050) will be about one-quarter of the current resource projection.
Stationary Stationary PowerPower
Cumulative Primary Demand from 2005 to 2050 (Mg)
11,500
18
500
2
TotalsTotalsIndustrial Industrial CatalystsCatalysts
3,200
1.2
JewelryJewelry
5,300
2Peak Slope in Primary Demand (Mg/year)
20,5008,500
11
17,500
Transportation
80% Scenario
Transportation
50%Scenario
50%Scenario
80% Scenario
11* 20*
* The peak slopes for the identified market segments occur at different time periods. Therefore, the peak slope for Total Demand is not the sum of the peak slopes for each market.
• The 50% and 80% Scenario demand projections account for 22 and 26 percent of projected platinum resource (i.e., 76,000 Mg), respectively.
• For reference, primary platinum supply increased at a rate of 3.5 Mg/year from 1960 to 2000.
19D0034.2004-01-06 PGM Final Report.ppt
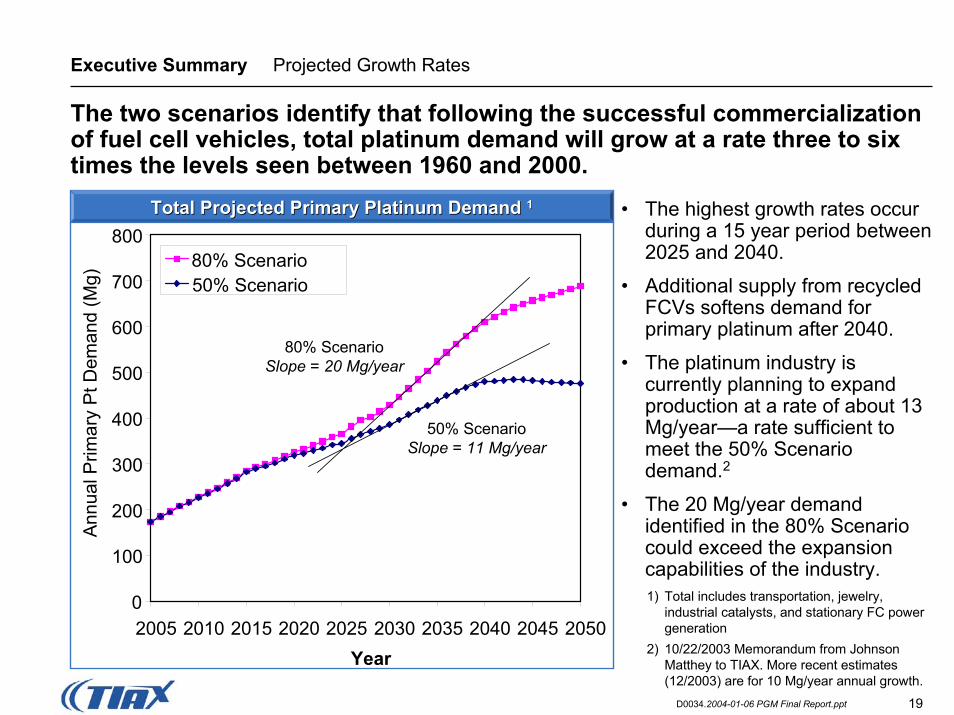
Executive Summary Projected Growth Rates
The two scenarios identify that following the successful commercialization of fuel cell vehicles, total platinum demand will grow at a rate three to six times the levels seen between 1960 and 2000.
0
100
200
300
400
500
600
700
800
2005 2010 2015 2020 2025 2030 2035 2040 2045 2050Year
Ann
ual P
rimar
y P
t Dem
and
(Mg)
80% Scenario50% Scenario
80% ScenarioSlope = 20 Mg/year
50% ScenarioSlope = 11 Mg/year
• The highest growth rates occur during a 15 year period between 2025 and 2040.
• Additional supply from recycled FCVs softens demand for primary platinum after 2040.
• The platinum industry is currently planning to expand production at a rate of about 13 Mg/year—a rate sufficient to meet the 50% Scenario demand.2
• The 20 Mg/year demand identified in the 80% Scenario could exceed the expansion capabilities of the industry.
Total Projected Primary Platinum Demand Total Projected Primary Platinum Demand 11
1) Total includes transportation, jewelry, industrial catalysts, and stationary FC power generation
2) 10/22/2003 Memorandum from Johnson Matthey to TIAX. More recent estimates (12/2003) are for 10 Mg/year annual growth.
20D0034.2004-01-06 PGM Final Report.ppt
Executive Summary Transportation Demand for Platinum
0
50
100
150
200
250
300
350
400
450
500
2005 2010 2015 2020 2025 2030 2035 2040 2045 2050
Ann
ual T
rans
porta
tion
Prim
ary
Pt D
eman
d (M
g)
Developed Countries80% Scenario
Developed Countries
50% Scenario
Wor
ld (8
0%)
World (50%)
80%
Sce
nario
50% Sce
nario
0%
10%
20%
30%
40%
50%
60%
70%
80%
90%
100%
2005 2010 2015 2020 2025 2030 2035 2040 2045 2050
Per
cent
of W
orld
Tra
nspo
rtatio
n P
rimar
y D
eman
d
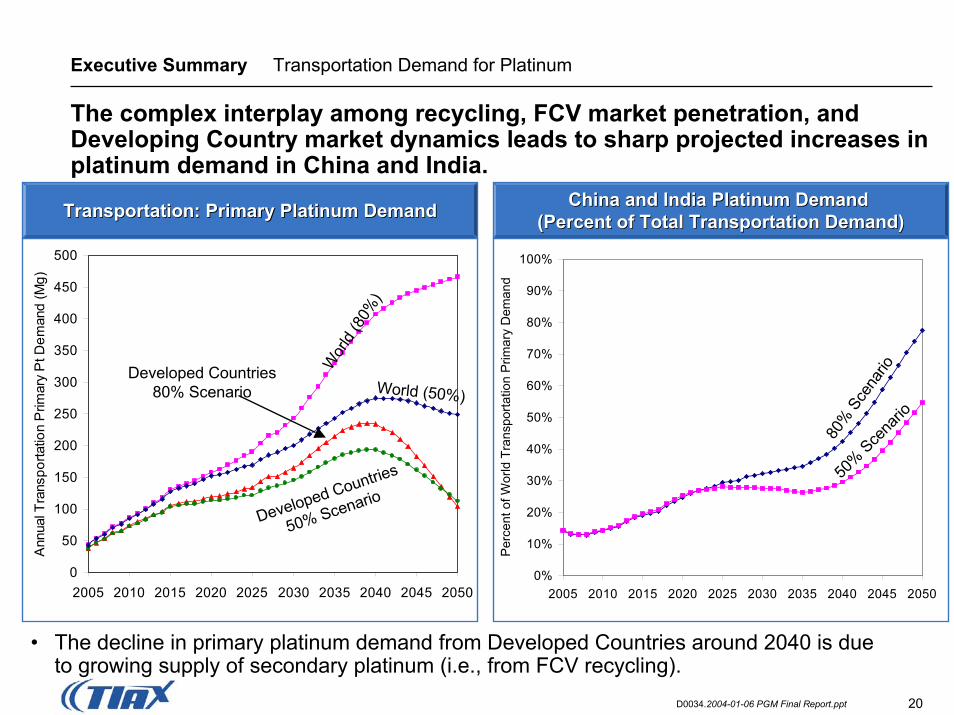
The complex interplay among recycling, FCV market penetration, and Developing Country market dynamics leads to sharp projected increases in platinum demand in China and India.
China and India Platinum Demand China and India Platinum Demand (Percent of Total Transportation Demand)Transportation: Primary Platinum DemandTransportation: Primary Platinum Demand (Percent of Total Transportation Demand)
• The decline in primary platinum demand from Developed Countries around 2040 is due to growing supply of secondary platinum (i.e., from FCV recycling).
21D0034.2004-01-06 PGM Final Report.ppt
Executive Summary Sensitivity Analysis
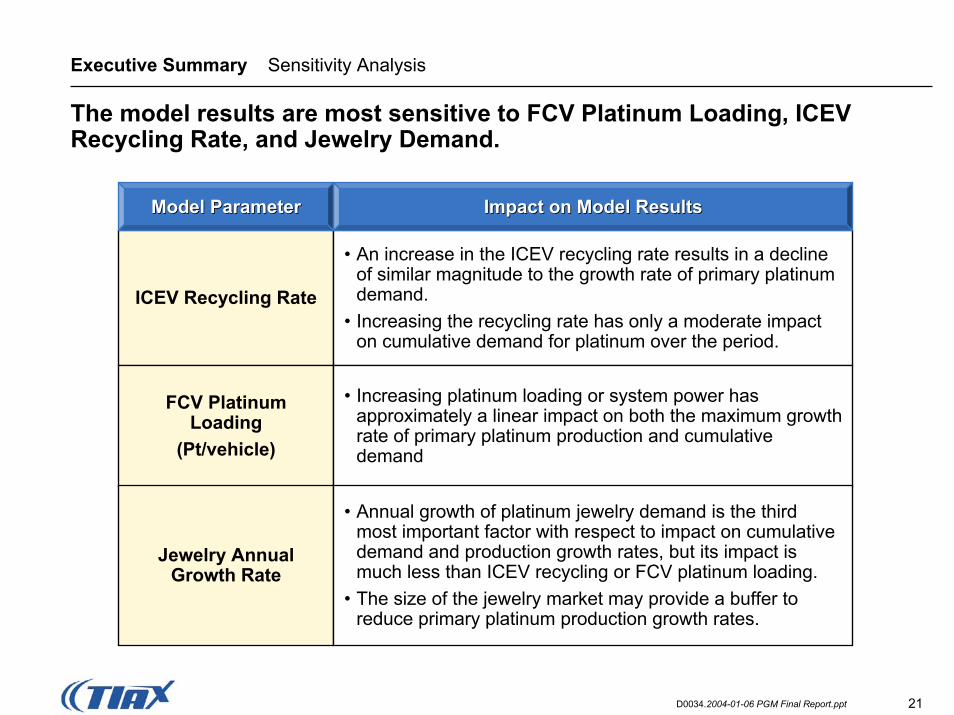
The model results are most sensitive to FCV Platinum Loading, ICEV Recycling Rate, and Jewelry Demand.
ICEV Recycling Rate
• An increase in the ICEV recycling rate results in a decline of similar magnitude to the growth rate of primary platinum demand.
• Increasing the recycling rate has only a moderate impact on cumulative demand for platinum over the period.
Model ParameterModel Parameter Impact on Model ResultsImpact on Model Results
FCV Platinum Loading
(Pt/vehicle)
• Increasing platinum loading or system power has approximately a linear impact on both the maximum growth rate of primary platinum production and cumulative demand
Jewelry Annual Growth Rate
• Annual growth of platinum jewelry demand is the third most important factor with respect to impact on cumulative demand and production growth rates, but its impact is much less than ICEV recycling or FCV platinum loading.
• The size of the jewelry market may provide a buffer to reduce primary platinum production growth rates.
22D0034.2004-01-06 PGM Final Report.ppt
Executive Summary 2050 Platinum Demand by Application
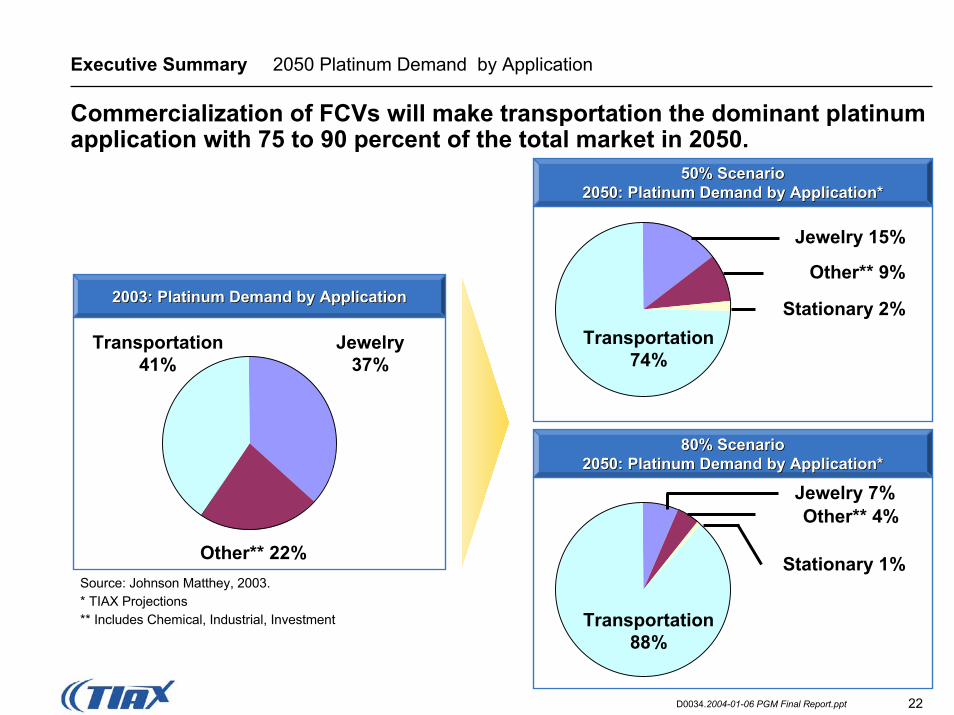
Transportation 74%
Jewelry 15%
Other** 9%
Stationary 2%
Commercialization of FCVs will make transportation the dominant platinum application with 75 to 90 percent of the total market in 2050.
50% Scenario50% Scenario2050: Platinum Demand by Application*
Transportation 88%
Jewelry 7%Other** 4%
Stationary 1%
2050: Platinum Demand by Application*
2005 Slow2003: Platinum Demand by Application2003: Platinum Demand by Application
Transportation41%
Jewelry37%
Other** 22%Source: Johnson Matthey, 2003.* TIAX Projections** Includes Chemical, Industrial, Investment
80% Scenario80% Scenario2050: Platinum Demand by Application*2050: Platinum Demand by Application*
23D0034.2004-01-06 PGM Final Report.ppt
Executive Summary Resource Availability
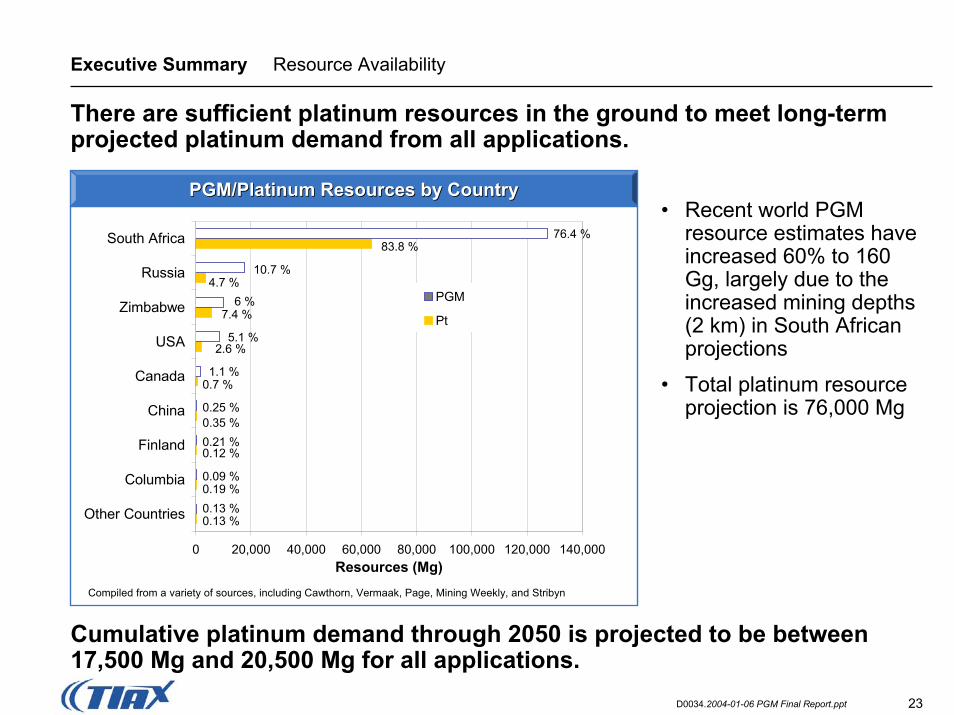
There are sufficient platinum resources in the ground to meet long-term projected platinum demand from all applications.
• Recent world PGM resource estimates have increased 60% to 160 Gg, largely due to the increased mining depths (2 km) in South African projections
• Total platinum resource projection is 76,000 Mg
0 20,000 40,000 60,000 80,000 100,000 120,000 140,000
Other Countries
Columbia
Finland
China
Canada
USA
Zimbabwe
Russia
South Africa
Resources (Mg)
PGM
Pt
76.4 %83.8 %
10.7 %4.7 %
6 %7.4 %
5.1 %2.6 %
1.1 %0.7 %
0.25 %0.35 %0.21 %0.12 %
0.09 %0.19 %0.13 %0.13 %
Compiled from a variety of sources, including Cawthorn, Vermaak, Page, Mining Weekly, and Stribyn
PGM/Platinum Resources by CountryPGM/Platinum Resources by Country
Cumulative platinum demand through 2050 is projected to be between 17,500 Mg and 20,500 Mg for all applications.
24D0034.2004-01-06 PGM Final Report.ppt
Executive Summary Platinum Recycling
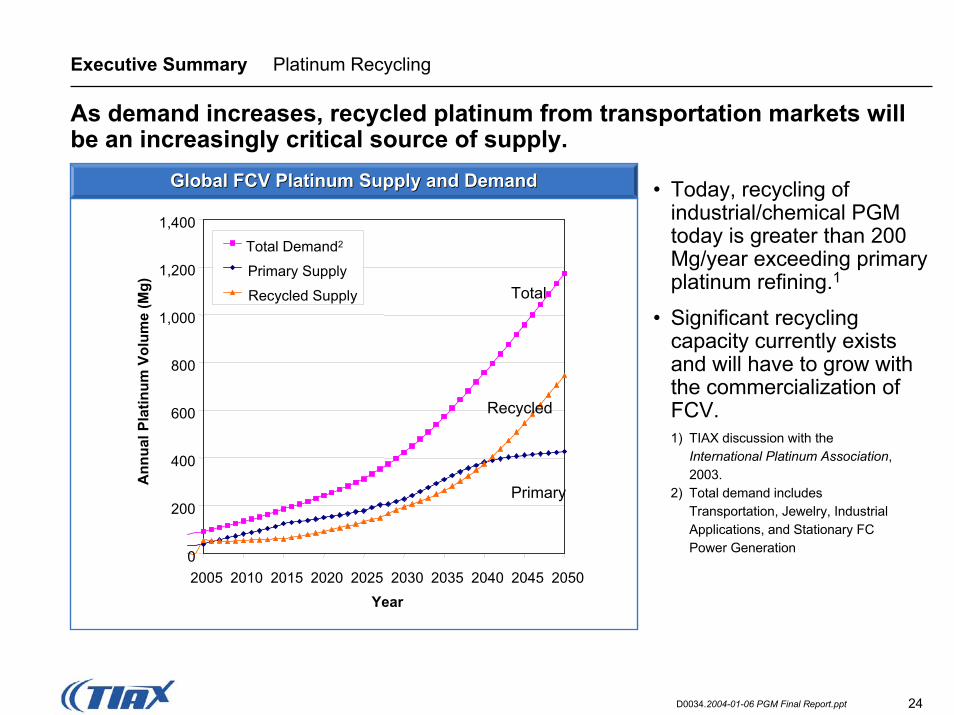
As demand increases, recycled platinum from transportation markets will be an increasingly critical source of supply.
• Today, recycling of industrial/chemical PGM today is greater than 200 Mg/year exceeding primary platinum refining.1
• Significant recycling capacity currently exists and will have to grow with the commercialization of FCV.
0
200
400
600
800
1,000
1,200
1,400
2005 2010 2015 2020 2025 2030 2035 2040 2045 2050Year
Ann
ual P
latin
um V
olum
e (M
g)
Total Demand2
Primary Supply
Recycled Supply Total
Recycled
Primary
1) TIAX discussion with the International Platinum Association, 2003.
2) Total demand includes Transportation, Jewelry, Industrial Applications, and Stationary FC Power Generation
Global FCV Platinum Supply and DemandGlobal FCV Platinum Supply and Demand
25D0034.2004-01-06 PGM Final Report.ppt
Executive Summary Historic Platinum Prices
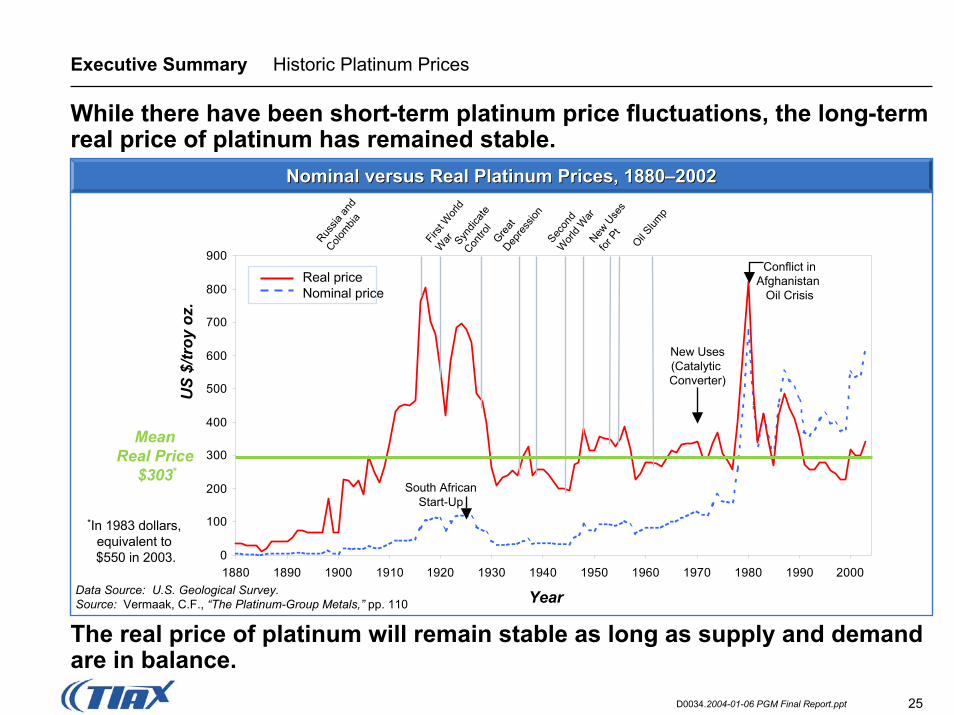
YearData Source: U.S. Geological Survey. Source: Vermaak, C.F., “The Platinum-Group Metals,” pp. 110
Russia
and
Colombia
First
Wor
ld
War Syn
dicate
Contro
lGre
at Dep
ress
ionSec
ond
Wor
ld W
arNew
Use
s
for P
t
Oil Slum
p
0
100
200
300
400
500
600
700
800
900
1880 1890 1900 1910 1920 1930 1940 1950 1960 1970 1980 1990 2000
US
$/tr
oy o
z.
Mean Real Price
$303*
Conflict inAfghanistan
Oil Crisis
New Uses(Catalytic Converter)
South AfricanStart-Up
Real priceNominal price
*In 1983 dollars, equivalent to $550 in 2003.
While there have been short-term platinum price fluctuations, the long-term real price of platinum has remained stable.
Nominal versus Real Platinum Prices, 1880Nominal versus Real Platinum Prices, 1880––20022002
The real price of platinum will remain stable as long as supply and demand are in balance.
26D0034.2004-01-06 PGM Final Report.ppt
Executive Summary Simulation of Platinum Price Behavior
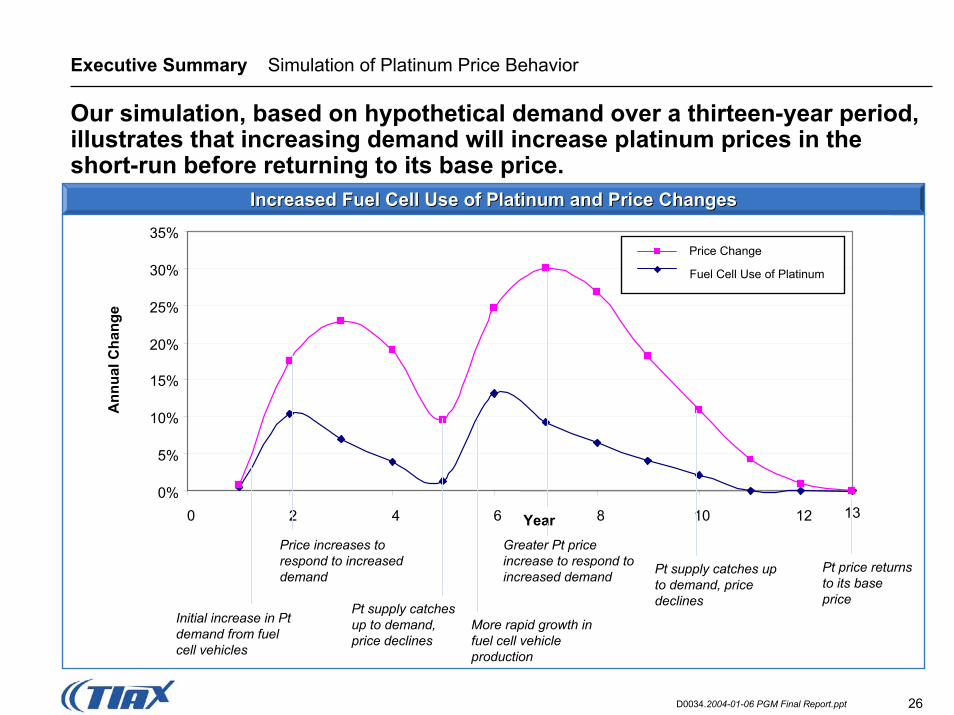
Our simulation, based on hypothetical demand over a thirteen-year period, illustrates that increasing demand will increase platinum prices in the short-run before returning to its base price.
0%
5%
10%
15%
20%
25%
30%
35%
0 2 4 6 8 10 12Year
Ann
ual C
hang
e
Initial increase in Pt demand from fuel cell vehicles
Price increases to respond to increased demand
Pt supply catches up to demand, price declines
More rapid growth in fuel cell vehicle production
Greater Pt price increase to respond to increased demand Pt supply catches up
to demand, price declines
Pt price returns to its base price
13
Fuel Cell Use of Platinum
Price Change
Increased Fuel Cell Use of Platinum and Price ChangesIncreased Fuel Cell Use of Platinum and Price Changes
27D0034.2004-01-06 PGM Final Report.ppt
Executive Summary Study Conclusions
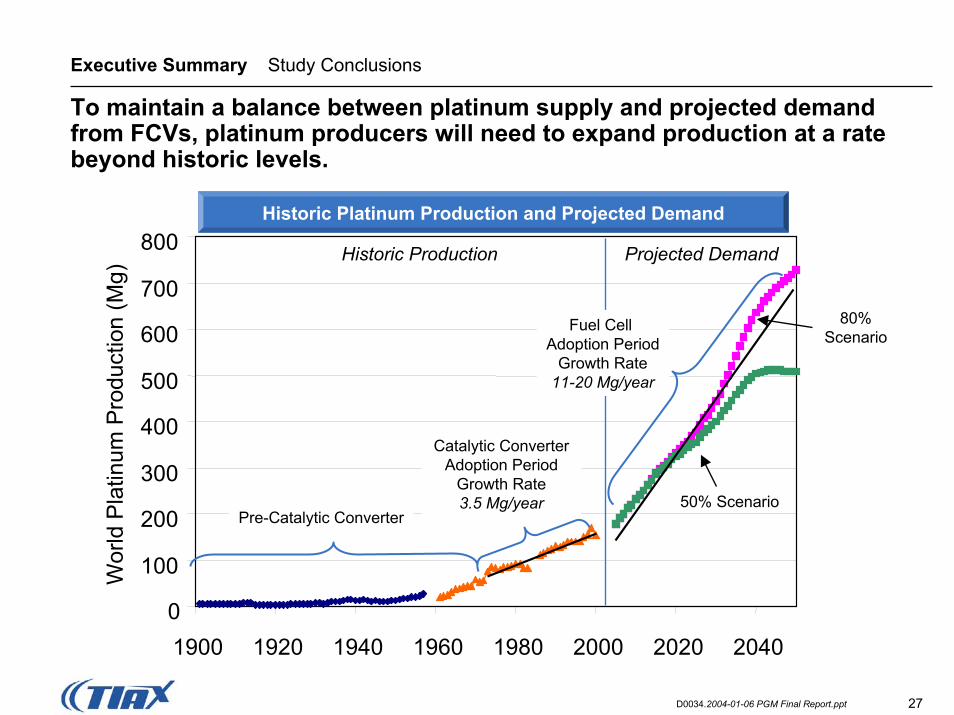
To maintain a balance between platinum supply and projected demand from FCVs, platinum producers will need to expand production at a rate beyond historic levels.
0
100
200
300
400
500
600
700
800
1900 1920 1940 1960 1980 2000 2020 2040
Year
Wor
ld P
latin
um P
rodu
ctio
n (M
g)
Historic Platinum Production and Projected Demand
Pre-Catalytic Converter
Catalytic Converter Adoption Period
Growth Rate3.5 Mg/year 50% Scenario
Fuel Cell Adoption Period
Growth Rate11-20 Mg/year
Historic Production Projected Demand
80%Scenario
28D0034.2004-01-06 PGM Final Report.ppt
Executive Summary Study Conclusions
While increased demand for platinum from fuel cell technology will likely increase platinum prices in the short-run, the long-run platinum supply is sufficient to meet expected demand levels and thereby stabilize prices.
• Historically, the platinum industry has been able to supply platinum at a rate sufficient to keep supply and demand in balance at a long-term mean price of $550/troy ounce.
• Current South African mine expansion plans suggest that capacity could increase at a rate corresponding to our 50% FCV market penetration scenario.
• An 80% FCV market penetration scenario could exceed the expansion capabilities of the industry.
• Ramp-up of FCV production will likely create a short-term supply shortage or deficit leading to price increases. Typically, it takes three to five years to increase platinum production capacity.
• Regardless of new demand from FCVs, supply/demand imbalances (like those seen in 2003) could keep platinum prices above the long-term mean.
29D0034.2004-01-06 PGM Final Report.ppt
Table of Contents
1 Executive Summary
Project OverviewProject Overview2
3
2
Platinum Market Overview
4 Future Demand Scenarios 2005-2050
5 Economic Analysis
6 Appendix

30D0034.2004-01-06 PGM Final Report.ppt
Project Overview Key Questions
The US DOE engaged TIAX LLC to assess the long-term availability and price stability of platinum given anticipated demand from fuel cell vehicles.
Key Questions:
• Will the successful adoption of fuel cells in transportation applications be threatened by platinum price increases and limitations in platinum supply in the long-term? – Can long-term, primary platinum resources accommodate the new demand
from fuel cell markets (transportation, stationary, and portable)?– How will supply operations (mining and refining) respond to increases in
market demand?– What role will recycling play in the supply chain as fuel cell markets
develop?– Will the relationship between supply, demand, and price of platinum change
as fuel cell markets develop?
31D0034.2004-01-06 PGM Final Report.ppt
Project Overview Project Objectives
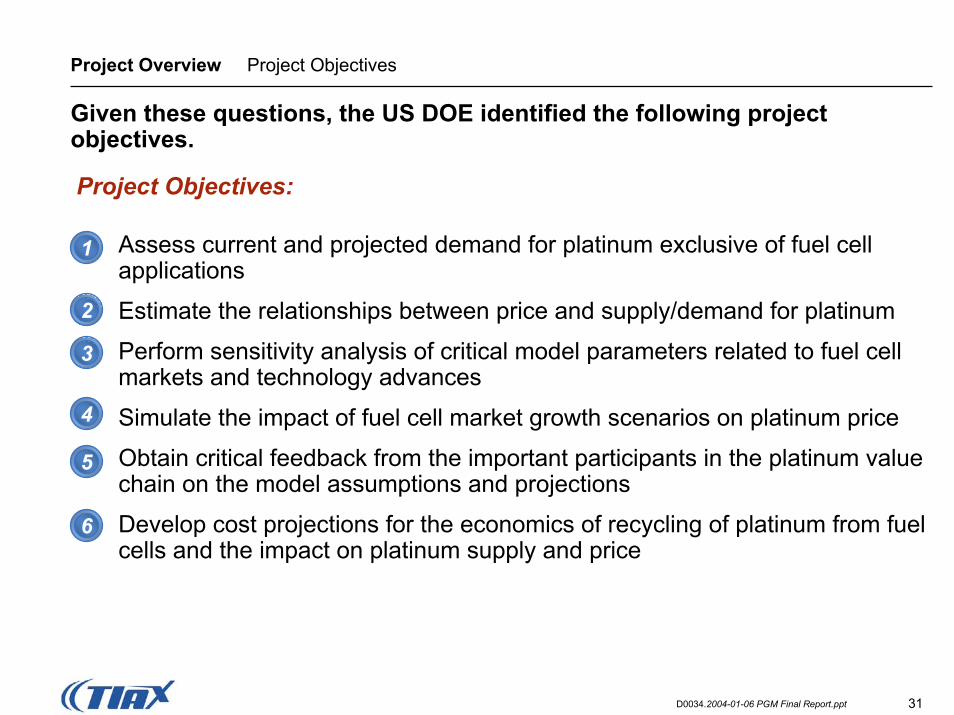
Given these questions, the US DOE identified the following project objectives.
Assess current and projected demand for platinum exclusive of fuel cell applications
Estimate the relationships between price and supply/demand for platinum
Perform sensitivity analysis of critical model parameters related to fuel cell markets and technology advances
Simulate the impact of fuel cell market growth scenarios on platinum price
Obtain critical feedback from the important participants in the platinum value chain on the model assumptions and projections
Develop cost projections for the economics of recycling of platinum from fuel cells and the impact on platinum supply and price
1
Project Objectives:
2
3
4
5
6
32D0034.2004-01-06 PGM Final Report.ppt
Project Overview Scope
Key elements of the project scope and important issues outside the project scope include the following.• Project scope:
– The timeframe of the future demand projection is from 2005 to 2050.– Platinum applications include Jewelry, Transportation, Industrial, and
Stationary Fuel Cells.– Demand for fuel cell vehicles (FCVs) is based on projections for five regions
(i.e., US, Western Europe, Japan, China, and India).– Observed historical platinum prices are from 1880 to the present.
• Issues outside of project scope:– Potential for political instability in major platinum producing countries.– Control of platinum production by a limited number of companies in the
major producing countries.– Future growth/decline in the world economy.– Potential for significant increases in platinum demand from new applications
other than fuel cells.– Ability of fuel cell technology developers to overcome technical hurdles.– Ability of the fueling infrastructure to support commercialization of fuel cell
vehicles.
33D0034.2004-01-06 PGM Final Report.ppt
Project Overview Key Considerations
The following issues must be considered along with the study results.
• Focus on Platinum and PEMFCs*: This study focuses only on potential issues associated with the pricing and availability of platinum in the commercialization of PEMFCs.
• Prevailing Technical Challenges: FCV developers are currently focused on resolving technical challenges, reducing cost, and improving manufacturability. In our discussions with OEMs, they did not raise immediate concerns regarding the pricing and availability of platinum.
• Study Uncertainties: We developed scenarios to describe potential future demand for platinum:– We have stated scenario assumptions (e.g., vehicle markets, fuel cell market
penetration, platinum loading, and average powertrain size).– Uncertainty inherent to any long-term projection will arise from evolving
economic conditions (particularly in Developing Countries), demographics, pricing and availability of hydrocarbon fuels, advances in fuel cell performance and cost, hydrogen infrastructure development, commercialization plans of the OEMs, and advances in ICE technology.
34D0034.2004-01-06 PGM Final Report.ppt
Project Overview Study Approach
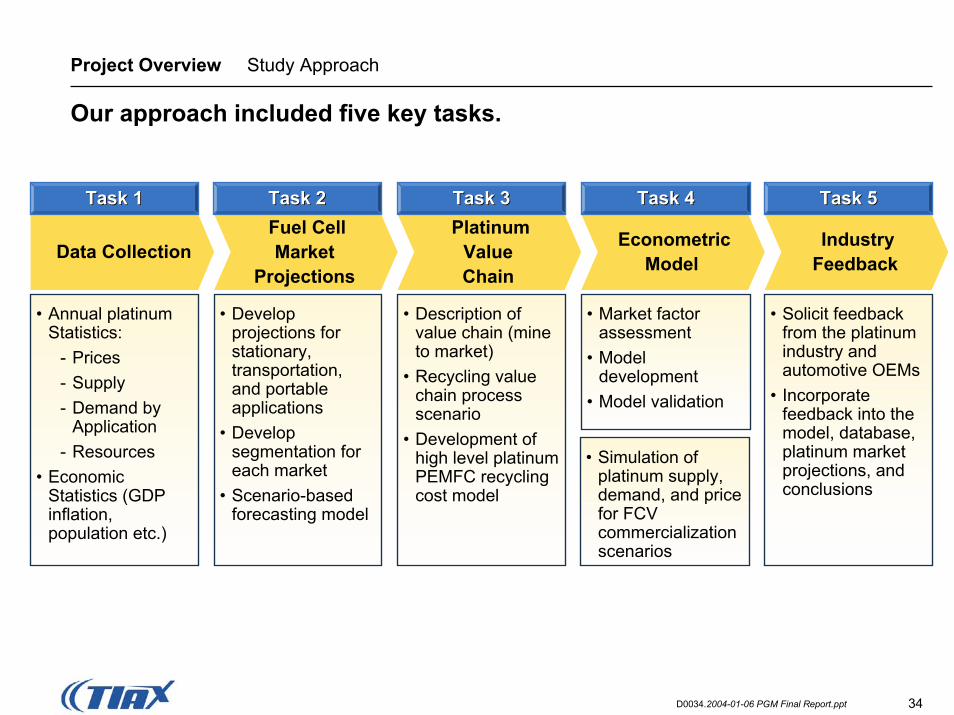
Our approach included five key tasks.
Data Collection
• Annual platinum Statistics:
- Prices- Supply- Demand by
Application- Resources
• Economic Statistics (GDP inflation, population etc.)
• Develop projections for stationary, transportation, and portable applications
• Develop segmentation for each market
• Scenario-based forecasting model
• Market factor assessment
• Model development
• Model validation
• Description of value chain (mine to market)
• Recycling value chain process scenario
• Development of high level platinum PEMFC recycling cost model
• Solicit feedback from the platinum industry and automotive OEMs
• Incorporate feedback into the model, database, platinum market projections, and conclusions
• Simulation of platinum supply, demand, and price for FCV commercialization scenarios
Fuel CellMarket
Projections
PlatinumValueChain
EconometricModel
IndustryFeedback
Task 1Task 1 Task 4Task 4Task 3Task 3Task 2Task 2 Task 5Task 5
35D0034.2004-01-06 PGM Final Report.ppt
Project Overview Terms and Acronyms
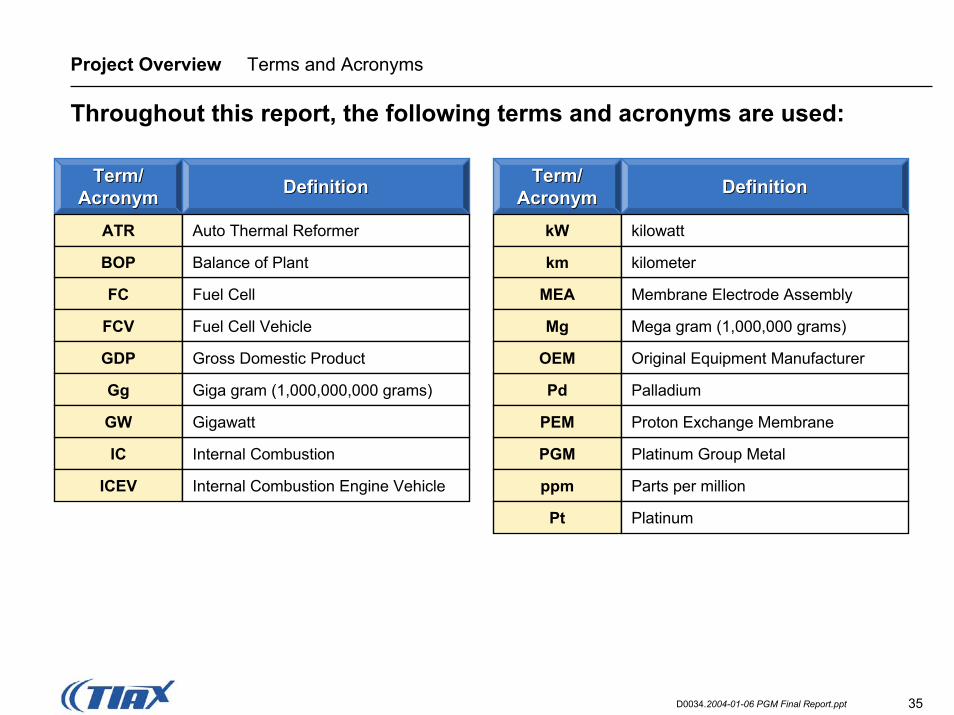
Throughout this report, the following terms and acronyms are used:
Term/Term/AcronymAcronym
Term/Term/AcronymAcronymDefinitionDefinition DefinitionDefinition
ATR kWAuto Thermal Reformer kilowatt
FC Fuel Cell
FCV Fuel Cell Vehicle
IC Internal Combustion
ICEV Internal Combustion Engine Vehicle
PGM Platinum Group Metal
Pd Palladium
GDP Gross Domestic Product
MEA
BOP kmBalance of Plant kilometer
Membrane Electrode Assembly
Mg Mega gram (1,000,000 grams)
OEM Original Equipment Manufacturer
Gg Giga gram (1,000,000,000 grams)
GW PEMGigawatt Proton Exchange Membrane
ppm Parts per million
Pt Platinum
36D0034.2004-01-06 PGM Final Report.ppt
Table of Contents
1 Executive Summary
2 Project Overview
3 Platinum Market Overview
4 Future Demand Scenarios 2005-2050
5 Economic Analysis
6 Appendix
37D0034.2004-01-06 PGM Final Report.ppt
Platinum Market Overview Objectives
The overall objective of this task is to provide a broad understanding of the current platinum market.
Task Objectives:Task Objectives:
• The specific objectives of this task are to provide a understanding of:
– Current markets/applications for platinum;
– Fuel cell technology and the role that platinum and other PGM materials play in the commercialization of FCVs;
– Sources of primary platinum supply and projected platinum resources; and
– Sources of secondary platinum supply and the importance of maintaining value in FCV recycling.
38D0034.2004-01-06 PGM Final Report.ppt
Platinum Market Overview Key Findings
This overview identifies the critical role of platinum to the commercialization of FCVs and the importance of both primary andsecondary sources of supply.
• Sources of Demand: Autocatalysts and jewelry are currently the largest applications for platinum with 80 percent market share and the greatest growth in demand.
• Importance to FCV: Platinum is critical to fuel cell performance and is a large component of fuel cell cost, accounting for 10 to 15 percent of total fuel cell production costs.
• Sources of Supply: The supply of platinum is dominated by South Africa and controlled by a small network of miners, refiners, and traders/brokers.
• Availability of Resources: About 76,000 Mg of platinum resources are estimated to be in the ground to 2 km; advances in mining technology are needed to economically access the deeper ores.
• Importance of Secondary Supply: Recycled autocatalyst provides a good model for the anticipated recycling of fuel cells and demonstrates that recycled fuel cells will likely provide a dependable source of platinum supply that is profitable at each stage of the supply chain.
39D0034.2004-01-06 PGM Final Report.ppt
Platinum Market Overview Markets
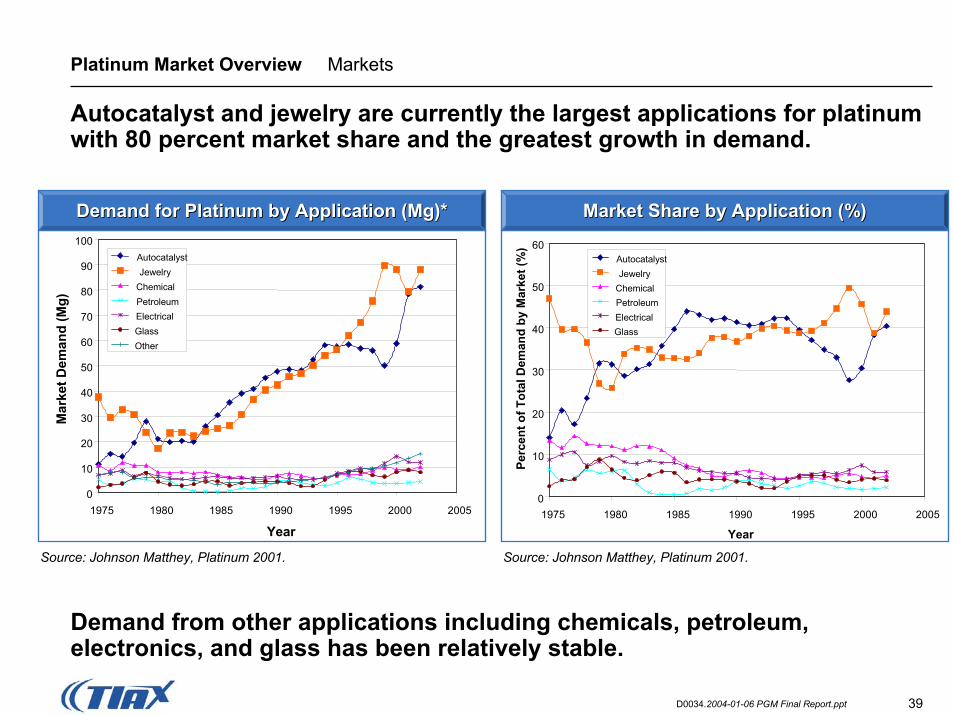
Autocatalyst and jewelry are currently the largest applications for platinum with 80 percent market share and the greatest growth in demand.
60
Perc
ent o
f Tot
al D
eman
d by
Mar
ket (
%)
0
10
20
30
40
50
1975 1980 1985 1990 1995 2000 2005
Year
AutocatalystJewelry
ChemicalPetroleumElectricalGlass
Source: Johnson Matthey, Platinum 2001. Source: Johnson Matthey, Platinum 2001.
0
10
20
30
40
50
60
70
80
90
100
1975 1980 1985 1990 1995 2000 2005
Year
Mar
ket D
eman
d (M
g)
AutocatalystJewelry
ChemicalPetroleumElectricalGlassOther
Demand for Platinum by Application (Mg)*Demand for Platinum by Application (Mg)* Market Share by Application (%)Market Share by Application (%)
Demand from other applications including chemicals, petroleum, electronics, and glass has been relatively stable.
40D0034.2004-01-06 PGM Final Report.ppt
Platinum Market Overview FCV Technology Platinum Loading
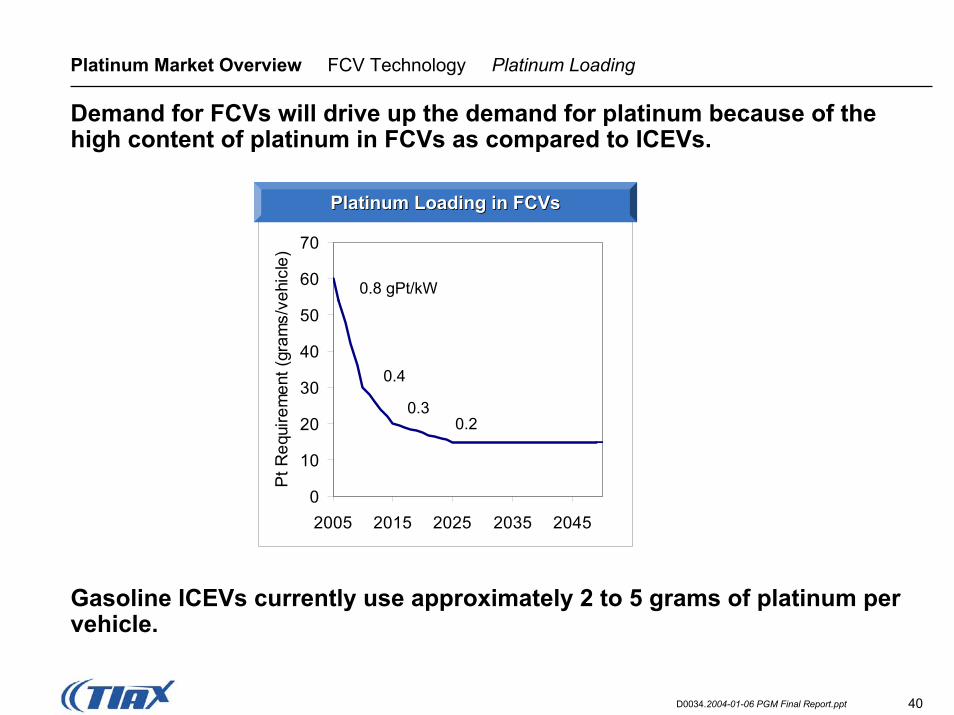
Demand for FCVs will drive up the demand for platinum because of the high content of platinum in FCVs as compared to ICEVs.
0
10
20
30
40
50
60
70
2005 2015 2025 2035 2045
Pt R
equi
rem
ent (
gram
s/ve
hicl
e)0.8 gPt/kW
0.4
0.30.2
Platinum Loading in FCVsPlatinum Loading in FCVs
Gasoline ICEVs currently use approximately 2 to 5 grams of platinum per vehicle.
41D0034.2004-01-06 PGM Final Report.ppt
Platinum Market Overview FCV Technology Performance
Platinum is critical to fuel cell performance.
• Platinum is critical to achieving the required levels of fuel cell power density and efficiency.
• Platinum and some ruthenium are essential to the catalysis of anodic and cathodic reactions in the stack.
• Platinum is important for the catalysis of reforming, shift, and preferential oxidation (PROX) reactions in the fuel processor.
42D0034.2004-01-06 PGM Final Report.ppt
Platinum Market Overview FCV Technology Manufacturing Costs
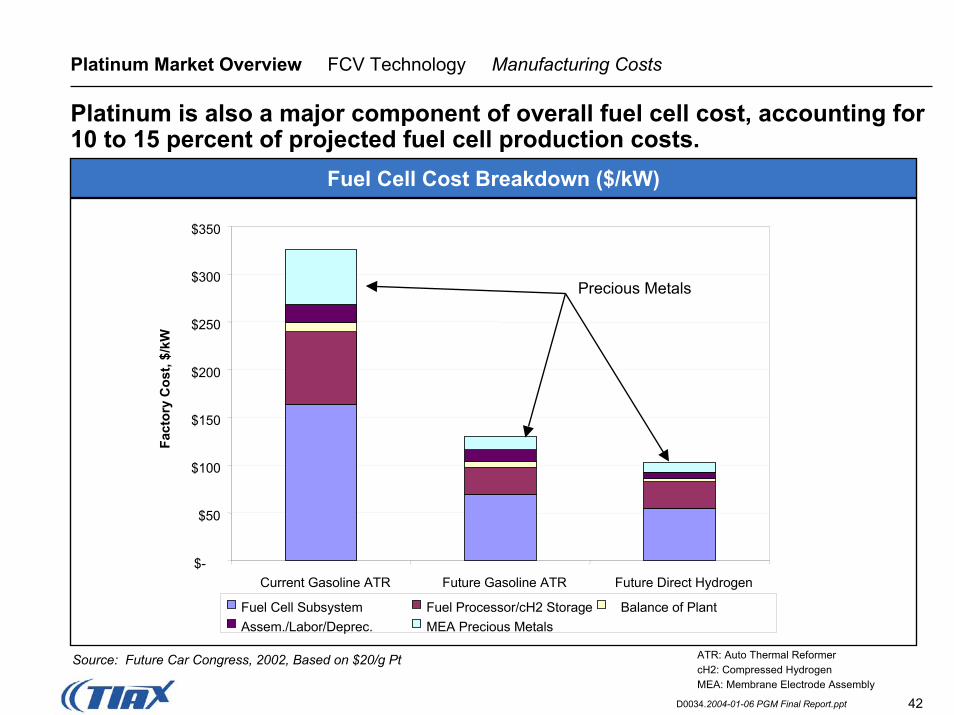
Platinum is also a major component of overall fuel cell cost, accounting for 10 to 15 percent of projected fuel cell production costs.
$-
$50
$100
$150
$200
$250
$300
$350
Current Gasoline ATR Future Gasoline ATR Future Direct Hydrogen
Fact
ory
Cos
t, $/
kW
Fuel Cell Subsystem Fuel Processor/cH2 Storage Balance of PlantAssem./Labor/Deprec. MEA Precious Metals
Precious Metals
Fuel Cell Cost Breakdown ($/kW)
ATR: Auto Thermal ReformercH2: Compressed HydrogenMEA: Membrane Electrode Assembly
Source: Future Car Congress, 2002, Based on $20/g Pt
43D0034.2004-01-06 PGM Final Report.ppt
Platinum Market Overview Platinum Group Metals
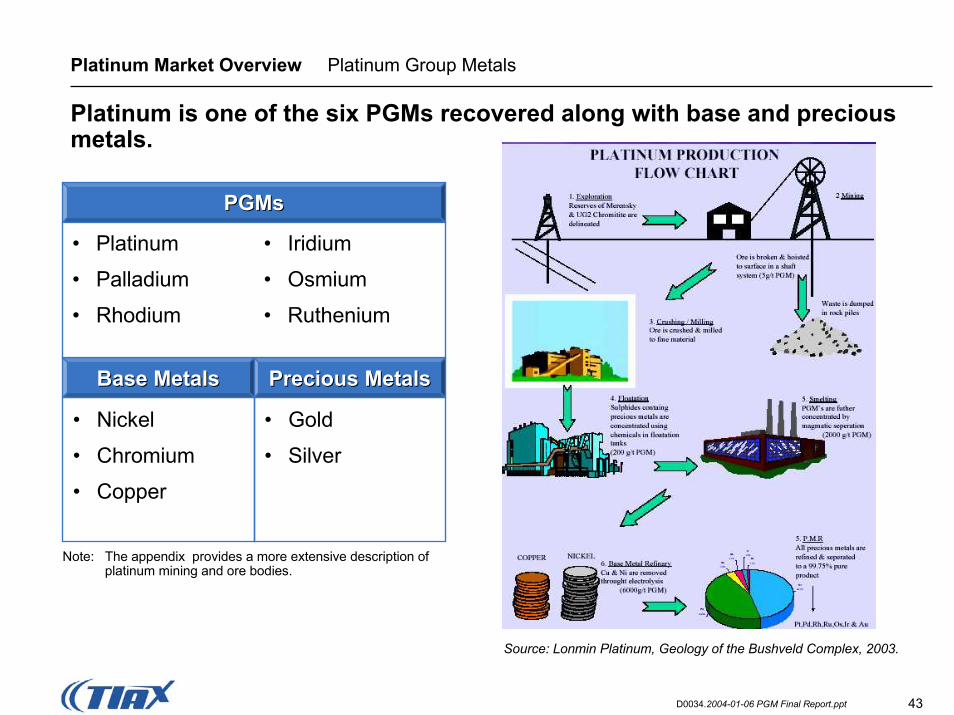
Platinum is one of the six PGMs recovered along with base and precious metals.
PGMsPGMs
• Nickel
• Chromium
• Copper
Base MetalsBase Metals
• Gold
• Silver
Precious MetalsPrecious Metals
Note: The appendix provides a more extensive description of platinum mining and ore bodies.
• Platinum
• Palladium
• Rhodium
• Iridium
• Osmium
• Ruthenium
Source: Lonmin Platinum, Geology of the Bushveld Complex, 2003.
44D0034.2004-01-06 PGM Final Report.ppt
Platinum Market Overview Sources of Supply
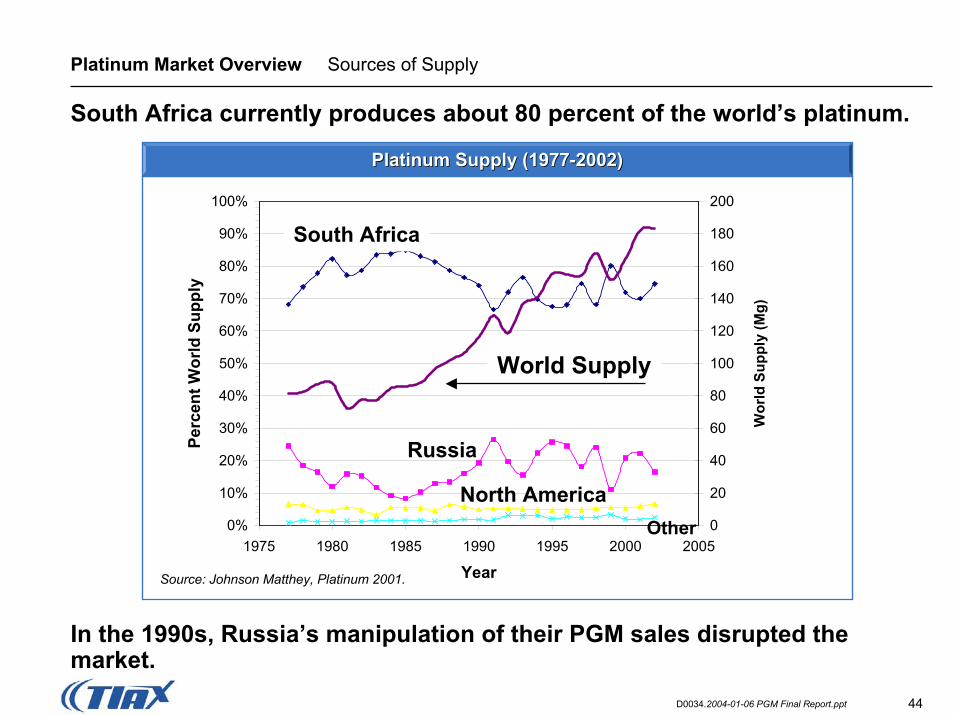
South Africa currently produces about 80 percent of the world’s platinum.
0%
10%
20%
30%
40%
50%
60%
70%
80%
90%
100%
1975 1980 1985 1990 1995 2000 2005
Year
Perc
ent W
orld
Sup
ply
0
20
40
60
80
100
120
140
160
180
200
Wor
ld S
uppl
y (M
g)
South Africa
Russia
North AmericaOther
Source: Johnson Matthey, Platinum 2001.
World Supply
Platinum Supply (1977Platinum Supply (1977--2002)2002)
In the 1990s, Russia’s manipulation of their PGM sales disrupted the market.
45D0034.2004-01-06 PGM Final Report.ppt
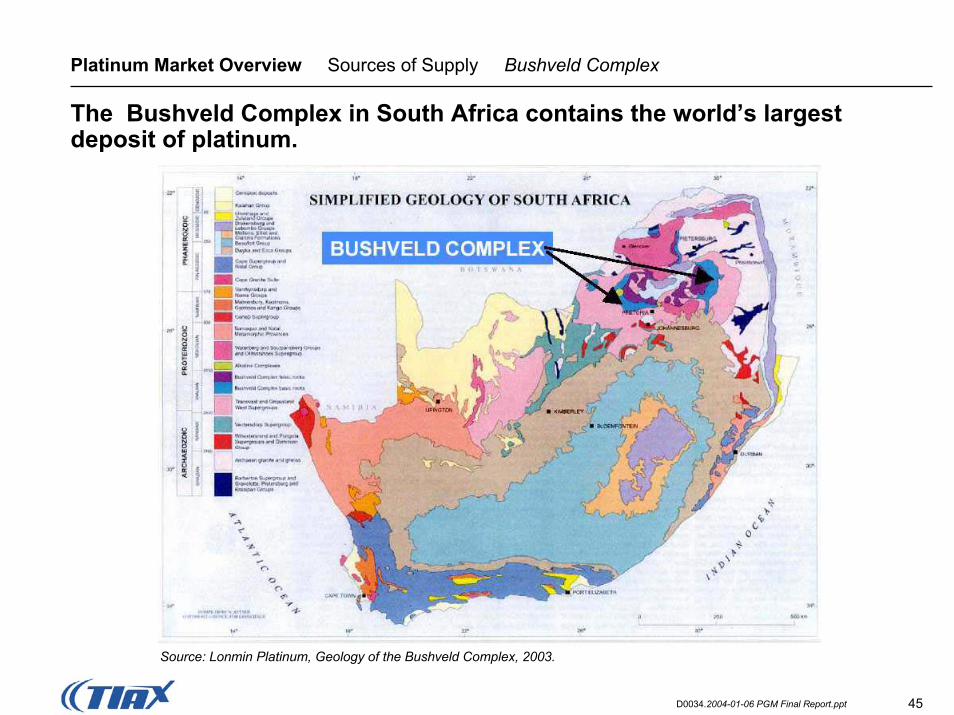
Platinum Market Overview Sources of Supply Bushveld Complex
The Bushveld Complex in South Africa contains the world’s largest deposit of platinum.
Source: Lonmin Platinum, Geology of the Bushveld Complex, 2003.
46D0034.2004-01-06 PGM Final Report.ppt
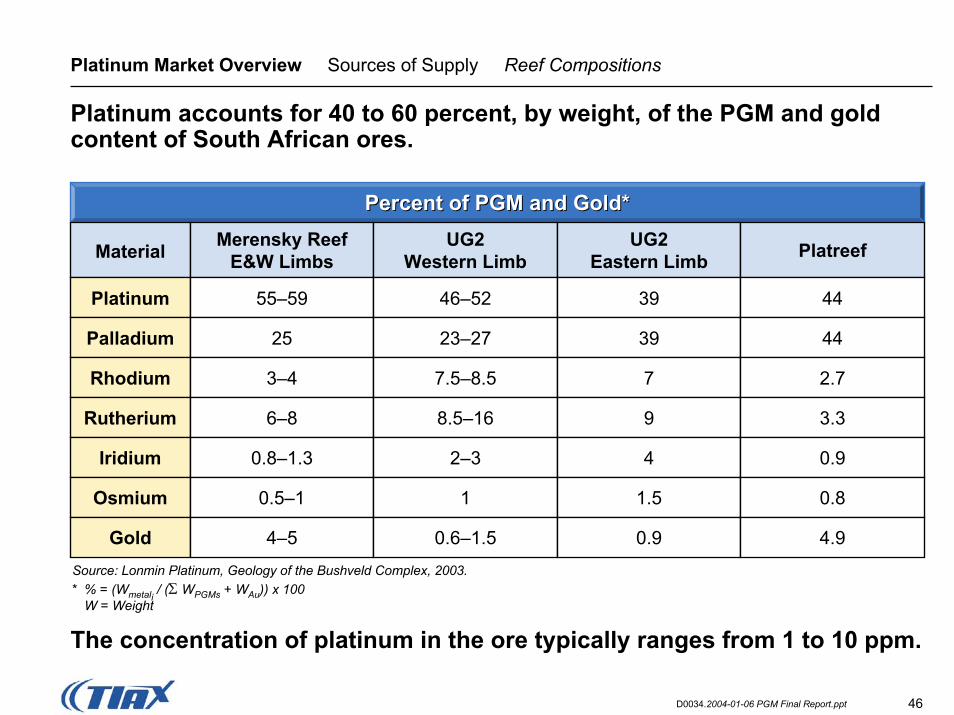
Platinum Market Overview Sources of Supply Reef Compositions
Platinum accounts for 40 to 60 percent, by weight, of the PGM and gold content of South African ores.
Percent of PGM and Gold*Percent of PGM and Gold*Merensky Reef
E&W LimbsUG2
Western LimbUG2
Eastern Limb PlatreefMaterial
Source: Lonmin Platinum, Geology of the Bushveld Complex, 2003.* % = (Wmetal / (Σ WPGMs + WAu)) x 10
i0
W = Weight
Platinum
Palladium
Rhodium
Rutherium
Iridium
Osmium
Gold
55–59
25
3–4
6–8
0.8–1.3
0.5–1
4–5
46–52
23–27
7.5–8.5
8.5–16
2–3
1
0.6–1.5
39 44
39 44
7 2.7
9 3.3
4 0.9
1.5 0.8
0.9 4.9
The concentration of platinum in the ore typically ranges from 1 to 10 ppm.
47D0034.2004-01-06 PGM Final Report.ppt
Platinum Market Overview Platinum Resources
Platinum resource data is reported on a geological basis and was used in our study for the assessment of potential long-term platinum availability.
• Significant platinum deposits are located in dense formations and can be detected by aerial magnetic surveys.
• South African ores are located in well defined layers—the depth of these layers can be accurately estimated.
• South African resource data is now reported to a depth of 2 km (reported resource data for gold is based on a greater depth).
Reserve data, which focus on near-term available ores (i.e., 3-5 years), were not used to characterize future platinum availability.
48D0034.2004-01-06 PGM Final Report.ppt
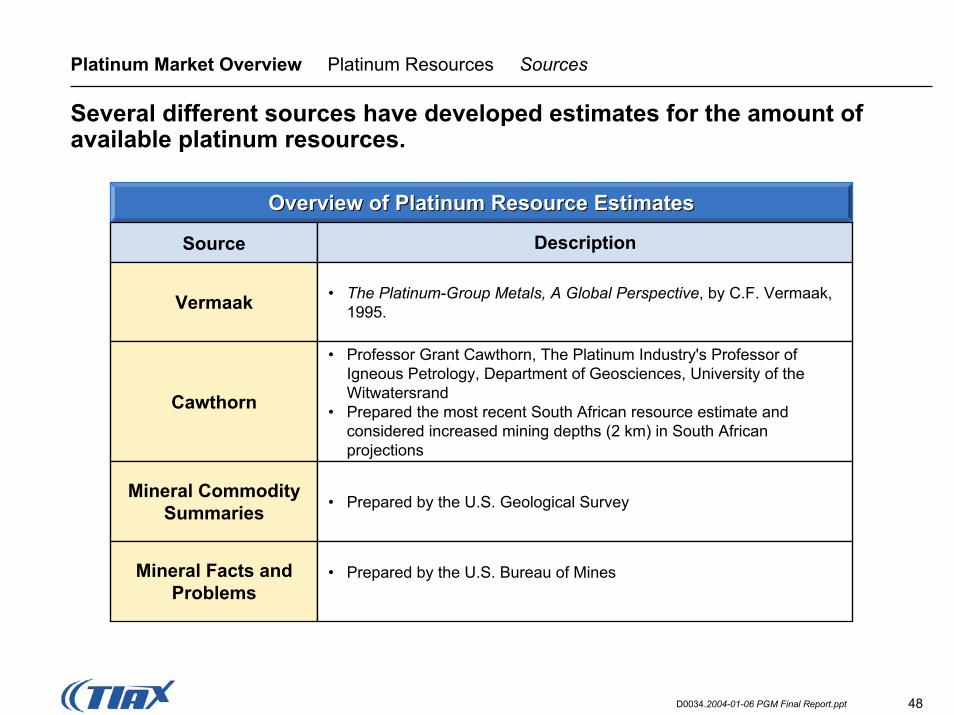
Platinum Market Overview Platinum Resources Sources
Several different sources have developed estimates for the amount of available platinum resources.
Overview of Platinum Resource EstimatesOverview of Platinum Resource Estimates
DescriptionSource
• The Platinum-Group Metals, A Global Perspective, by C.F. Vermaak, 1995.Vermaak
• Professor Grant Cawthorn, The Platinum Industry's Professor of Igneous Petrology, Department of Geosciences, University of the Witwatersrand
• Prepared the most recent South African resource estimate and considered increased mining depths (2 km) in South African projections
Cawthorn
Mineral Commodity Summaries • Prepared by the U.S. Geological Survey
Mineral Facts and Problems
• Prepared by the U.S. Bureau of Mines
49D0034.2004-01-06 PGM Final Report.ppt
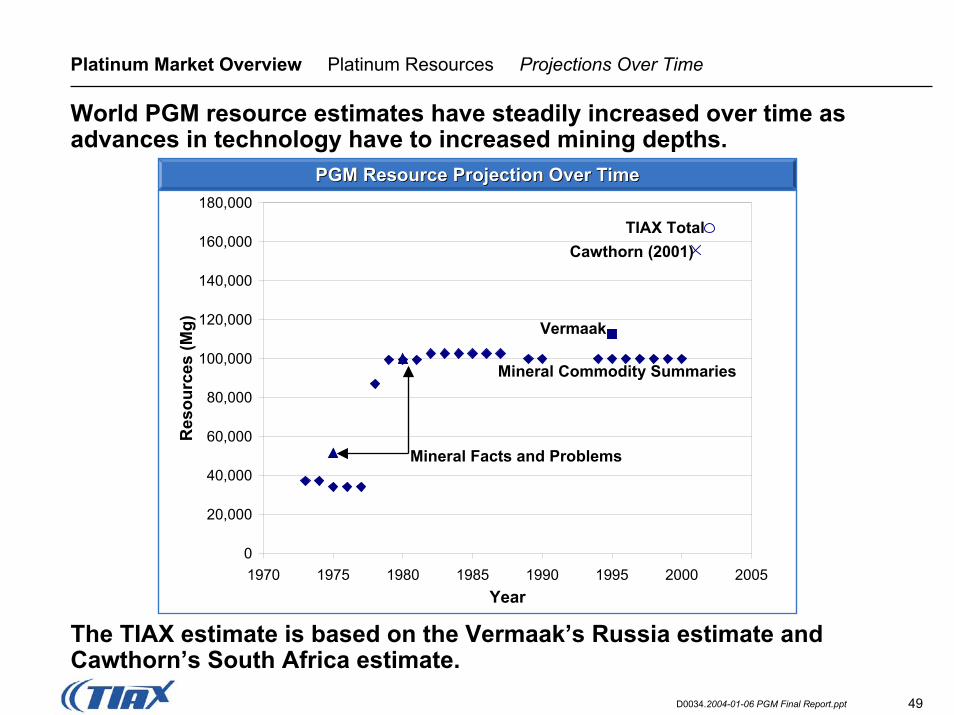
Platinum Market Overview Platinum Resources Projections Over Time
World PGM resource estimates have steadily increased over time as advances in technology have to increased mining depths.
PGM Resource Projection Over TimePGM Resource Projection Over Time
Cawthorn (2001)TIAX Total
0
20,000
40,000
60,000
80,000
100,000
120,000
140,000
160,000
180,000
1970 1975 1980 1985 1990 1995 2000 2005Year
Res
ourc
es (M
g)
Mineral Commodity Summaries
Vermaak
Mineral Facts and Problems
The TIAX estimate is based on the Vermaak’s Russia estimate and Cawthorn’s South Africa estimate.
50D0034.2004-01-06 PGM Final Report.ppt
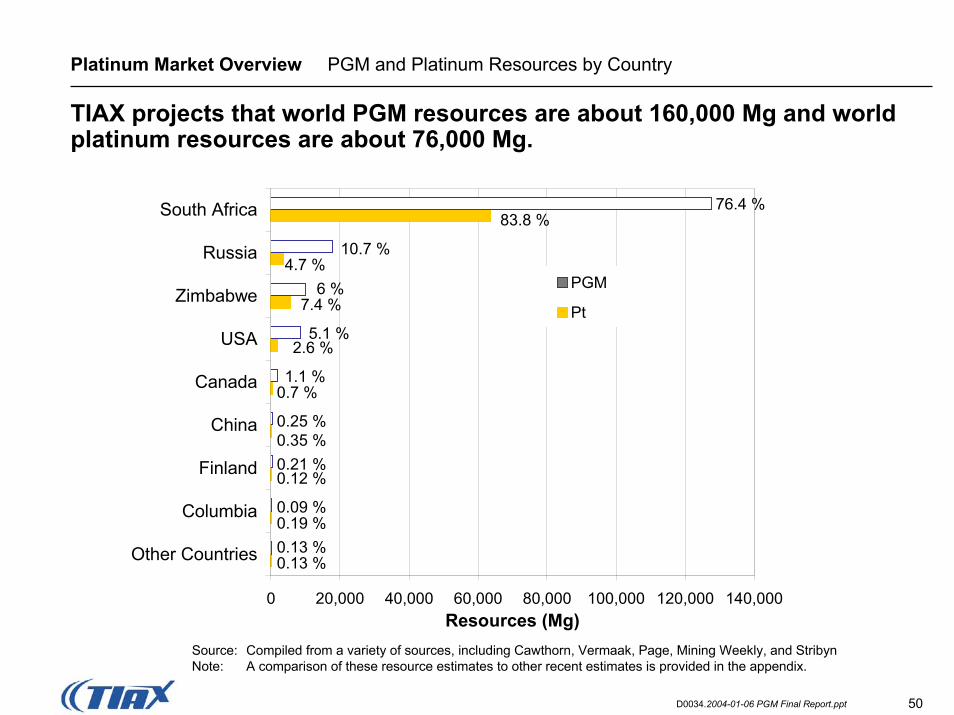
Platinum Market Overview PGM and Platinum Resources by Country
TIAX projects that world PGM resources are about 160,000 Mg and world platinum resources are about 76,000 Mg.
0 20,000 40,000 60,000 80,000 100,000 120,000 140,000
Other Countries
Columbia
Finland
China
Canada
USA
Zimbabwe
Russia
South Africa
Resources (Mg)
PGM
Pt
76.4 %83.8 %
10.7 %4.7 %
6 %7.4 %
5.1 %2.6 %
1.1 %0.7 %
0.25 %0.35 %0.21 %0.12 %
0.09 %0.19 %0.13 %0.13 %
Source: Compiled from a variety of sources, including Cawthorn, Vermaak, Page, Mining Weekly, and StribynNote: A comparison of these resource estimates to other recent estimates is provided in the appendix.
51D0034.2004-01-06 PGM Final Report.ppt
Platinum Market Overview Platinum Industry Companies
About 85 percent of primary platinum goes directly to OEMs or through companies like Johnson Matthey and Engelhard.
• Examples of platinum industry companies:– Mining Facilities
- Bushveld Complex, South Africa (e.g., Anglo Platinum, Impala Platinum, Lonmin Platinum)
- Norlisk Nickel, Russia- Stillwater Mine, USA
– Product Manufacturers and Refiners- Johnson Matthey, USA and Europe- Engelhard, USA and Europe- Umicore, Belgium (now includes dmc2 of Germany)
– Toll Refiners/Concentrators- Inmetco, USA- Multimetco, USA- Tanaka Kikinzoku, Japan
52D0034.2004-01-06 PGM Final Report.ppt
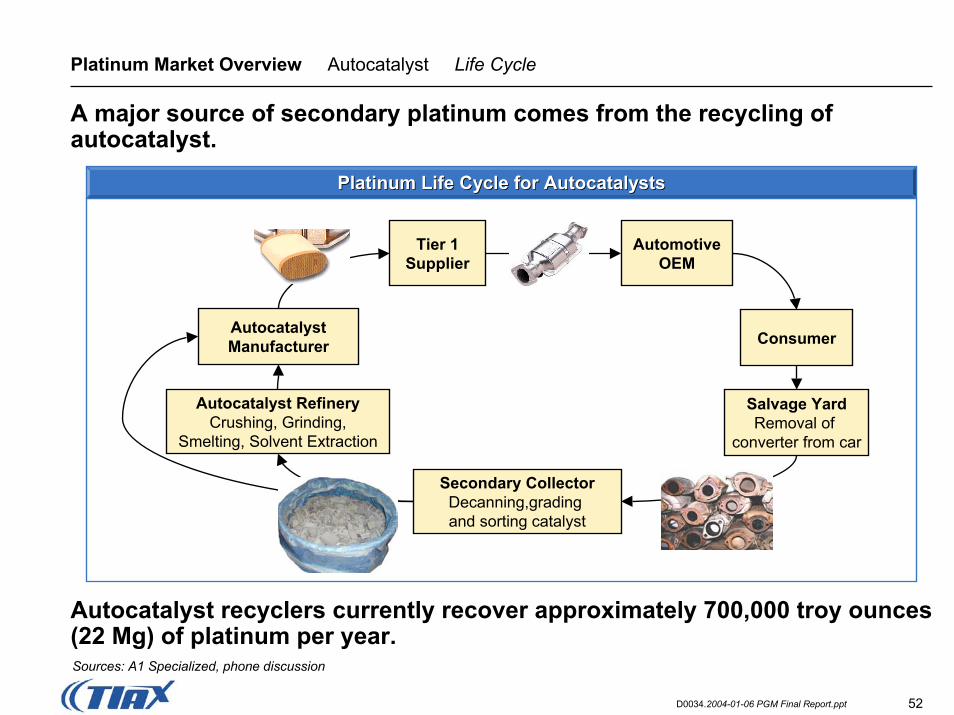
Platinum Market Overview Autocatalyst Life Cycle
A major source of secondary platinum comes from the recycling ofautocatalyst.
AutocatalystManufacturer
Automotive OEM
Consumer
Salvage YardRemoval of
converter from car
Autocatalyst RefineryCrushing, Grinding,
Smelting, Solvent Extraction
Secondary CollectorDecanning,grading and sorting catalyst
Tier 1 Supplier
Platinum Life Cycle for AutocatalystsPlatinum Life Cycle for Autocatalysts
Autocatalyst recyclers currently recover approximately 700,000 troy ounces (22 Mg) of platinum per year.Sources: A1 Specialized, phone discussion
53D0034.2004-01-06 PGM Final Report.ppt
Platinum Market Overview Autocatalyst Platinum Recovery Methods
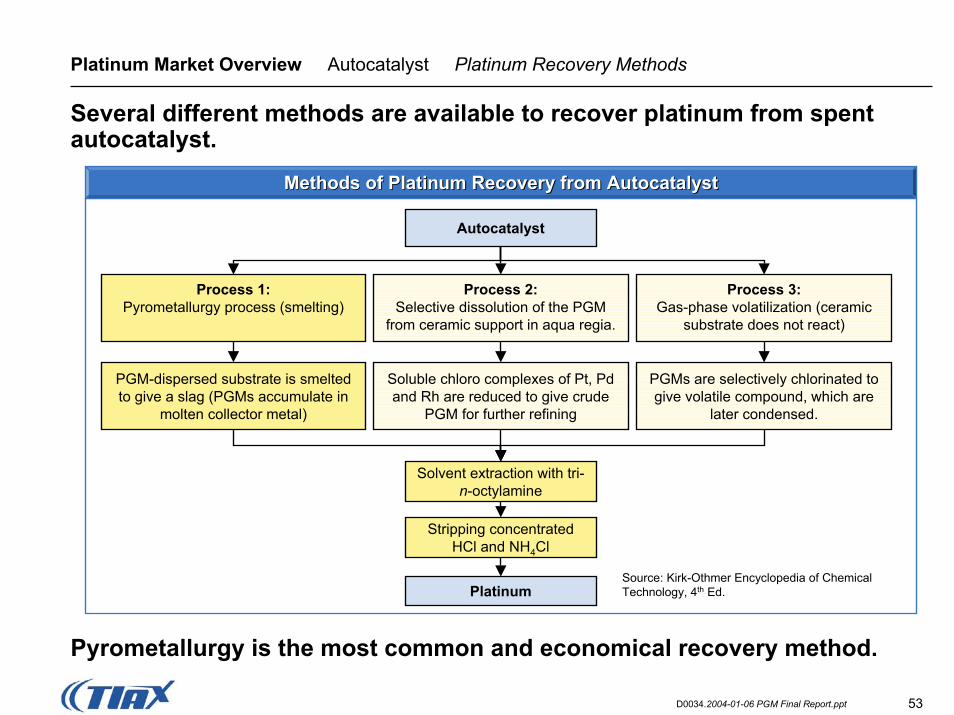
Several different methods are available to recover platinum from spent autocatalyst.
Process 1:Pyrometallurgy process (smelting)
Process 3:Gas-phase volatilization (ceramic
substrate does not react)
Process 2:Selective dissolution of the PGM
from ceramic support in aqua regia.
Autocatalyst
Platinum
Solvent extraction with tri-n-octylamine
Soluble chloro complexes of Pt, Pd and Rh are reduced to give crude
PGM for further refining
PGMs are selectively chlorinated to give volatile compound, which are
later condensed.
PGM-dispersed substrate is smelted to give a slag (PGMs accumulate in
molten collector metal)
Stripping concentrated HCl and NH4Cl
Source: Kirk-Othmer Encyclopedia of Chemical Technology, 4th Ed.
Methods of Platinum Recovery from AutocatalystMethods of Platinum Recovery from Autocatalyst
Pyrometallurgy is the most common and economical recovery method.
54D0034.2004-01-06 PGM Final Report.ppt
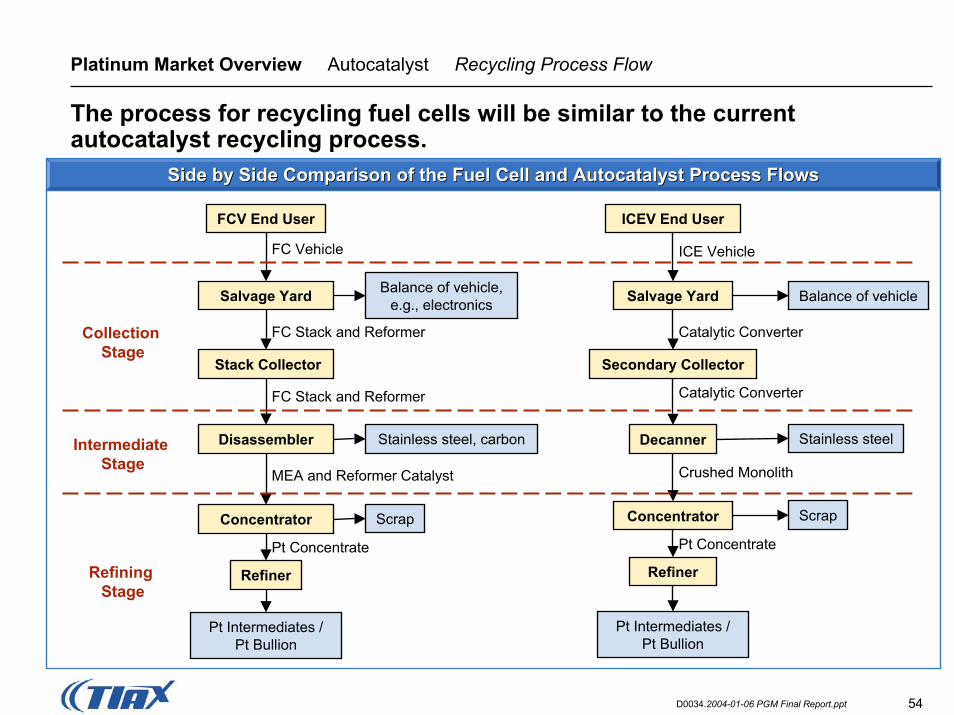
Platinum Market Overview Autocatalyst Recycling Process Flow
The process for recycling fuel cells will be similar to the current autocatalyst recycling process.
FCV End User
Salvage Yard Balance of vehicle, e.g., electronics
Concentrator
Stack Collector
Disassembler
Refiner
Stainless steel, carbon
Scrap
Pt Intermediates / Pt Bullion
FC Vehicle
FC Stack and Reformer
FC Stack and Reformer
MEA and Reformer Catalyst
Pt Concentrate
Collection Stage
Intermediate Stage
Refining Stage
ICEV End User
Salvage Yard Balance of vehicle
Concentrator
Secondary Collector
Decanner
Refiner
Stainless steel
Scrap
ICE Vehicle
Catalytic Converter
Catalytic Converter
Crushed Monolith
Pt Concentrate
Pt Intermediates / Pt Bullion
Side by Side Comparison of the Fuel Cell and Autocatalyst ProcesSide by Side Comparison of the Fuel Cell and Autocatalyst Process Flowss Flows
55D0034.2004-01-06 PGM Final Report.ppt
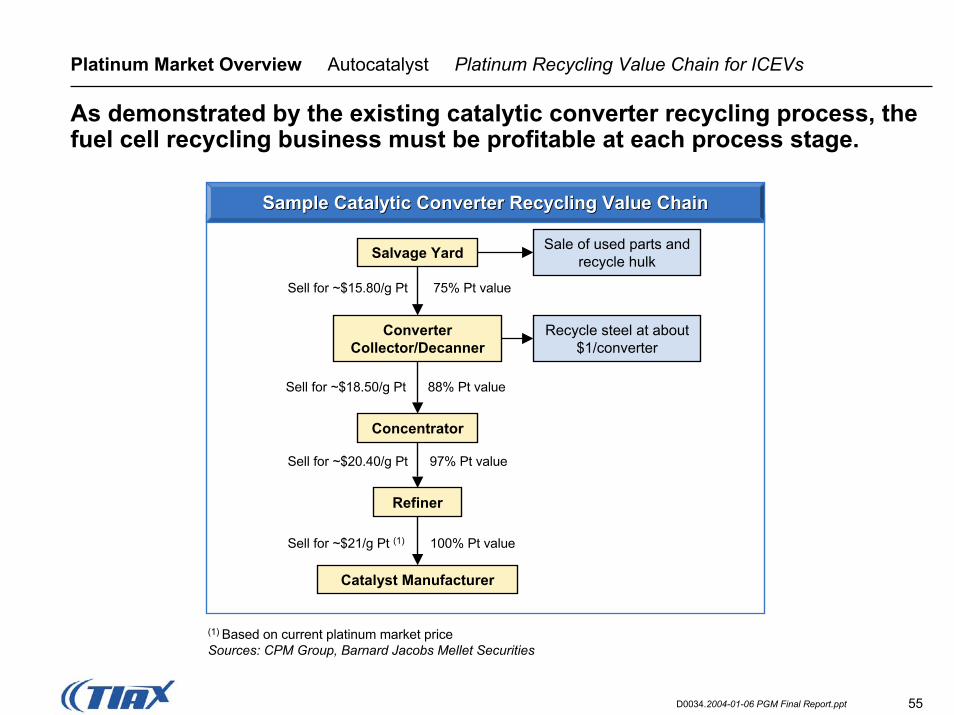
Platinum Market Overview Autocatalyst Platinum Recycling Value Chain for ICEVs
As demonstrated by the existing catalytic converter recycling process, the fuel cell recycling business must be profitable at each process stage.
Salvage Yard Sale of used parts and recycle hulk
Concentrator
Converter Collector/Decanner
Refiner
Recycle steel at about $1/converter
Catalyst Manufacturer
Sell for ~$15.80/g Pt 75% Pt value
Sell for ~$18.50/g Pt 88% Pt value
Sell for ~$20.40/g Pt 97% Pt value
Sell for ~$21/g Pt (1) 100% Pt value
Sample Catalytic Converter Recycling Value ChainSample Catalytic Converter Recycling Value Chain
(1) Based on current platinum market priceSources: CPM Group, Barnard Jacobs Mellet Securities
56D0034.2004-01-06 PGM Final Report.ppt
Table of Contents
1 Executive Summary
2 Project Overview
3 Platinum Market Overview
4 Future Demand Scenarios 2005-2050
5 Economic Analysis
6 Appendix
57D0034.2004-01-06 PGM Final Report.ppt
Future Demand Scenarios Objectives
The overall objective of this task is to develop projections for platinum demand in the period from 2005 to 2050.
Task Objectives:Task Objectives:
• The specific objectives of this task are to provide a understanding of:
– Likely growth in vehicle demand in selected Developed and Developing Countries;
– Key issues associated with the adoption of new transportation technology;
– Future scenarios that describe the adoption rate of FCVs in selected Developed and Developing Countries;
– The impact of FCV demand for platinum on both primary and secondary supply; and
– The model variables that have the most significant impact on demand projections.
58D0034.2004-01-06 PGM Final Report.ppt
Future Demand Scenarios Key Findings
If FCVs are commercialized to the point that they achieve 50% or 80% market penetration, significant pressure will be placed on both the primary and secondary sources of platinum supply.
• Projected Vehicle Sales: Annual vehicle sales in 2050 are projected to be 70 to 95 million units in the selected regions, approximately two times current production levels
• Production Growth Rate: Both the 50% and 80% Scenarios identify a period of rapid growth in primary platinum demand (11 to 20 Mg increases per year) between 2025 and 2040. During this period, average annual growth in primary platinum production will be 3 to 6 times greater than the growth rate from 1960-2000.
• Recycling: Recycling of transportation catalyst will play a critical role in the supply of platinum, with requirements comparable to primary platinum.
• Resources: Cumulative platinum demand in the 50% and 80% Scenarios represents 22 to 26 percent of currently estimated primary platinum resources.
• Market Concentration: The transportation sector will be the major user of platinum, about 75 to 90 percent of primary demand, in 2050.
59D0034.2004-01-06 PGM Final Report.ppt
Future Demand Scenarios Future Sources of Demand
Fuel cell use in transportation will be the major driver of new platinum demand; however, traditional applications will still remain important components of overall platinum demand.
TransportationTransportation
• More demanding emission regulations will increase PGM demand.• Increasing penetration of diesel vehicles will increase platinum demand.• Increasing GDP in Developing Countries will increase vehicles per capita.• Developing Country emission standards will approach or equal those of the
Developed Countries.• Adoption of fuel cell powertrains will increase platinum demands per vehicle.
Stationary PowerStationary Power Other Traditional ApplicationsOther Traditional Applications
If PEMFCs are commercially viable in passenger vehicles (e.g., $50/kW), the cost will be well below what is required to penetrate distributed generation markets.
Jewelry and industrial demand will remain important components of overall platinum demand.
60D0034.2004-01-06 PGM Final Report.ppt
Future Demand Scenarios Historic Trends
Before developing market penetration scenarios, we considered the following historic trends in automotive technology introductions.• A paradigm shift in powertrain technology development analogous to the
introduction of FCVs does not exist; however, non-regulatory driven changes have typically taken place over a 10-15 year period.
• Regulatory driven technology changes (e.g., catalytic converters) have been adopted in less than 10 years.
• Two scenarios may apply to technology adoption in Developing Countries:– Traditionally, technology introduction in Developing Countries lags Developed
Countries by 10 -15 years.– Alternatively, Developing Countries could choose to leapfrog current technology.
With significant growth in vehicle fleets, Developing Countries may choose to invest in new technology rather than an older production systems with limited “useful” life.
• Characteristics of typical automotive technology introductions include:– Initial slow growth while the marketplace validates the quality of the technology
(e.g., reliability, performance, consumer feedback) and the cost performance (e.g., learning curve improvement, cost reduction efforts).
– Rapid growth period displacing older technology when economies of scale shift to the new technology.
61D0034.2004-01-06 PGM Final Report.ppt
Future Demand Scenarios Historic Trends Example: Diesel Vehicles
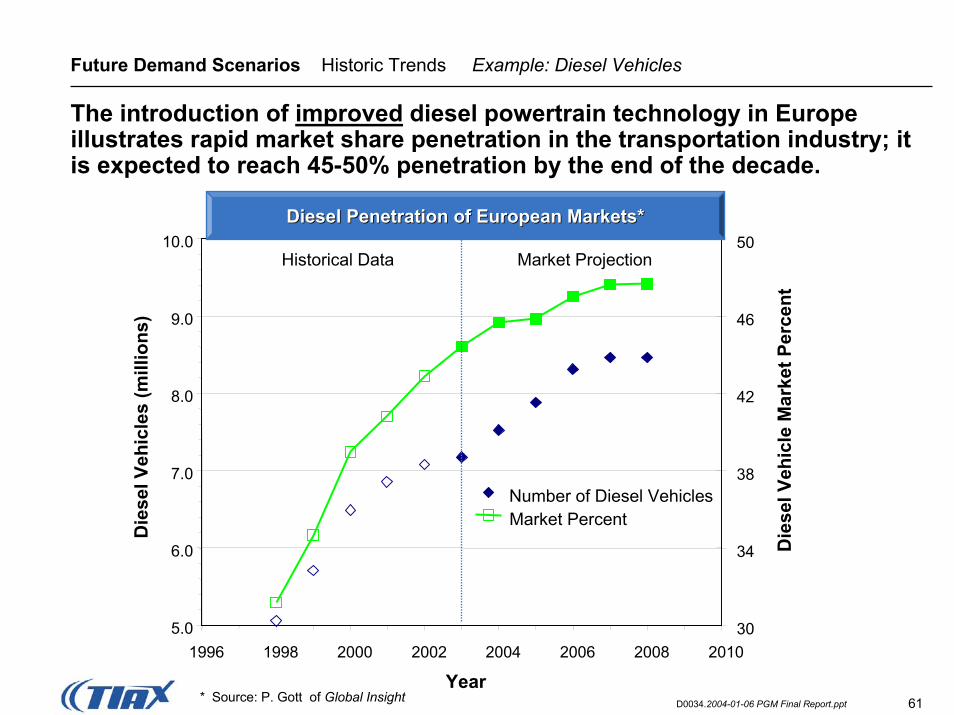
The introduction of improved diesel powertrain technology in Europe illustrates rapid market share penetration in the transportation industry; it is expected to reach 45-50% penetration by the end of the decade.
1996 1998 2000 2002 2004 2006 2008 2010
Year
Die
sel V
ehic
les
(mill
ions
)
30
34
38
42
46
50
Number of Diesel VehiclesMarket Percent
Die
sel V
ehic
le M
arke
t Per
cent
Market Projection
* Source: P. Gott of Global Insight
Historical Data
Diesel Penetration of European Markets*Diesel Penetration of European Markets*10.0
9.0
8.0
7.0
6.0
5.0
62D0034.2004-01-06 PGM Final Report.ppt
Future Demand Scenarios Historic Trends Example: Hybrid Vehicles
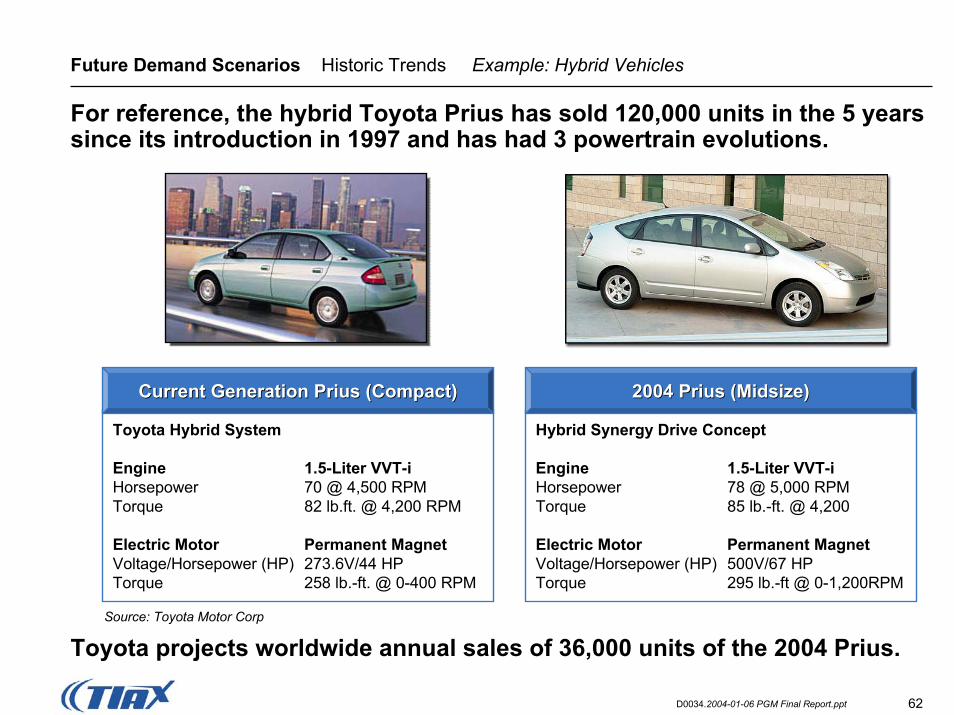
For reference, the hybrid Toyota Prius has sold 120,000 units in the 5 years since its introduction in 1997 and has had 3 powertrain evolutions.
Toyota Hybrid System
Engine 1.5-Liter VVT-iHorsepower 70 @ 4,500 RPMTorque 82 lb.ft. @ 4,200 RPM
Electric Motor Permanent MagnetVoltage/Horsepower (HP) 273.6V/44 HPTorque 258 lb.-ft. @ 0-400 RPM
Hybrid Synergy Drive Concept
Engine 1.5-Liter VVT-iHorsepower 78 @ 5,000 RPMTorque 85 lb.-ft. @ 4,200
Electric Motor Permanent MagnetVoltage/Horsepower (HP) 500V/67 HP Torque 295 lb.-ft @ 0-1,200RPM
Source: Toyota Motor Corp
Toyota projects worldwide annual sales of 36,000 units of the 2004 Prius.
Current Generation Prius (Compact)Current Generation Prius (Compact) 2004 Prius (Midsize)2004 Prius (Midsize)
63D0034.2004-01-06 PGM Final Report.ppt
Future Demand Scenarios Transportation Demand Projection Approach
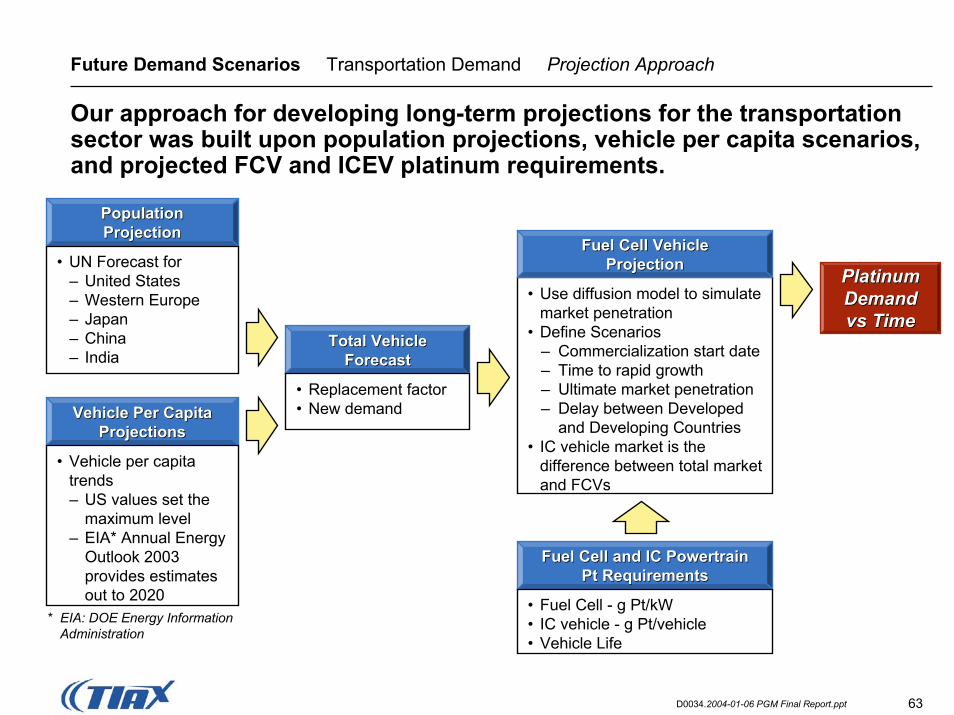
Our approach for developing long-term projections for the transportation sector was built upon population projections, vehicle per capita scenarios, and projected FCV and ICEV platinum requirements.
Population Population Projection
• Replacement factor• New demand
Projection
• Use diffusion model to simulate market penetration
• Define Scenarios– Commercialization start date– Time to rapid growth– Ultimate market penetration – Delay between Developed
and Developing Countries• IC vehicle market is the
difference between total market and FCVs
Fuel Cell VehicleFuel Cell VehicleProjection• UN Forecast for
– United States– Western Europe– Japan– China– India
ProjectionPlatinum Platinum Demand Demand vs Timevs Time
Total Vehicle Total Vehicle ForecastForecast
Vehicle Per CapitaVehicle Per CapitaProjectionsProjections
• Vehicle per capita trends– US values set the
maximum level– EIA* Annual Energy
Outlook 2003 provides estimates out to 2020
Fuel Cell and IC Powertrain Fuel Cell and IC Powertrain Pt RequirementsPt Requirements
• Fuel Cell - g Pt/kW• IC vehicle - g Pt/vehicle• Vehicle Life
* EIA: DOE Energy Information Administration
64D0034.2004-01-06 PGM Final Report.ppt
Future Demand Scenarios Transportation Demand Vehicle Estimation Framework
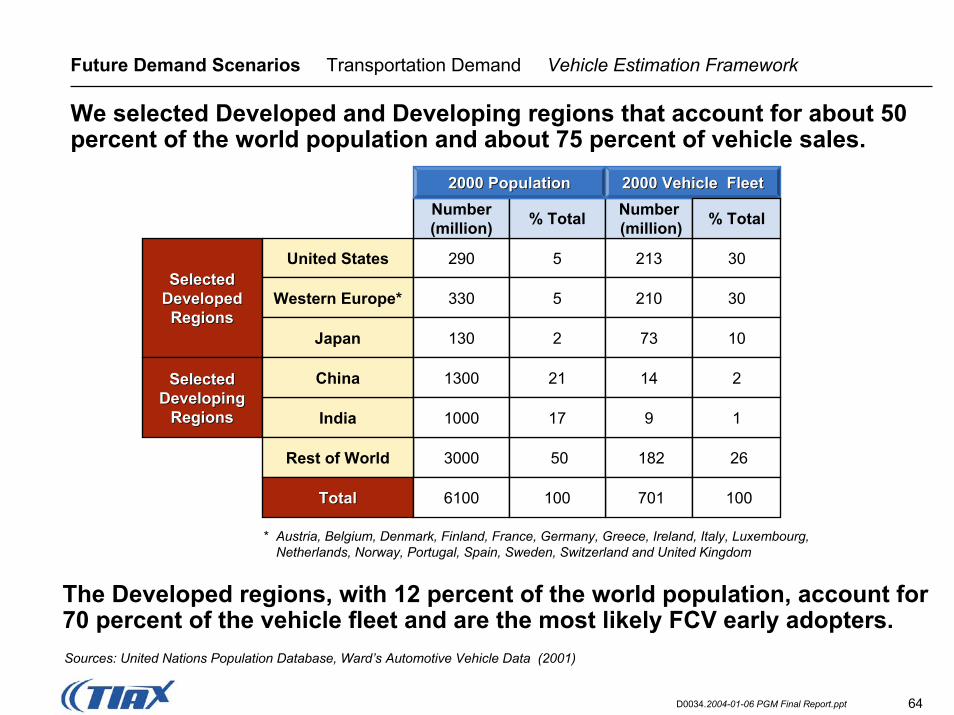
We selected Developed and Developing regions that account for about 50 percent of the world population and about 75 percent of vehicle sales.
Sources: United Nations Population Database, Ward’s Automotive Vehicle Data (2001)
Selected Selected Developed Developed RegionsRegions
Selected Selected Developing Developing
RegionsRegions
United States 290
Number(million)
Western Europe* 330
India
Japan 130
3000
China
Rest of World
1300
1000
* Austria, Belgium, Denmark, Finland, France, Germany, Greece, Ireland, Italy, Luxembourg,Netherlands, Norway, Portugal, Spain, Sweden, Switzerland and United Kingdom
5
% Total
5
2
50
21
17
213
2000 Population2000 PopulNumber(million)
ation 2000 Vehicle Fleet2000 Vehicle Fleet
% Total
30
210 30
73
182
10
14 2
9
The Developed regions, with 12 percent of the world population, account for 70 percent of the vehicle fleet and are the most likely FCV early adopters.
TotalTotal 6100 701100
1
26
100
65D0034.2004-01-06 PGM Final Report.ppt
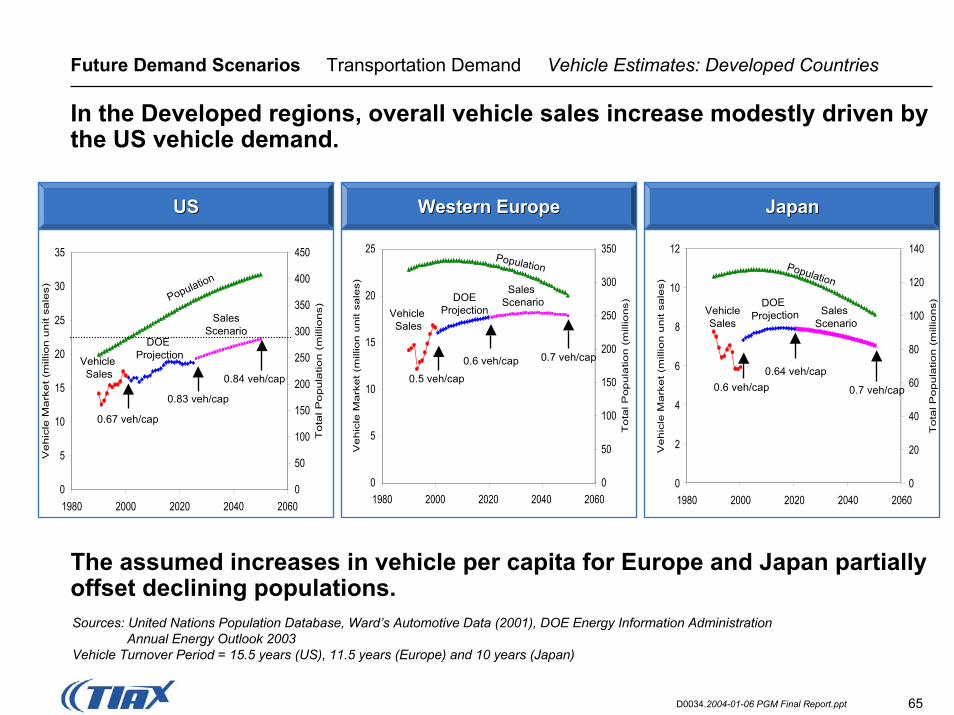
Future Demand Scenarios Transportation Demand Vehicle Estimates: Developed Countries
In the Developed regions, overall vehicle sales increase modestly driven by the US vehicle demand.
0
5
10
15
20
25
30
35
1980 2000 2020 2040 2060
Ve
hic
le M
ark
et
(mill
ion
un
it sa
les)
0
50
100
150
200
250
300
350
400
450
To
tal P
op
ula
tion
(m
illio
ns)
0.67 veh/cap
0.83 veh/cap
0.84 veh/cap
Population
DOE Projection
SalesScenario
Vehicle Sales
0
2
4
6
8
10
12
1980 2000 2020 2040 2060
Ve
hic
le M
ark
et (m
illio
n u
nit
sale
s)
0
20
40
60
80
100
120
140
To
tal P
op
ula
tion
(m
illio
ns)
0.6 veh/cap0.64 veh/cap
0.7 veh/cap
Population
DOE Projection Sales
ScenarioVehicleSales
0
5
10
15
20
25
1980 2000 2020 2040 2060
Ve
hic
le M
ark
et (m
illio
n u
nit
sale
s)
0
50
100
150
200
250
300
350
To
tal P
op
ula
tion
(m
illio
ns)
0.5 veh/cap
0.6 veh/cap 0.7 veh/cap
Population
Sales Scenario
Vehicle Sales
DOEProjection
Sources: United Nations Population Database, Ward’s Automotive Data (2001), DOE Energy Information AdministrationAnnual Energy Outlook 2003
Vehicle Turnover Period = 15.5 years (US), 11.5 years (Europe) and 10 years (Japan)
USUS Western EuropeWestern Europe JapanJapan
The assumed increases in vehicle per capita for Europe and Japan partially offset declining populations.
66D0034.2004-01-06 PGM Final Report.ppt
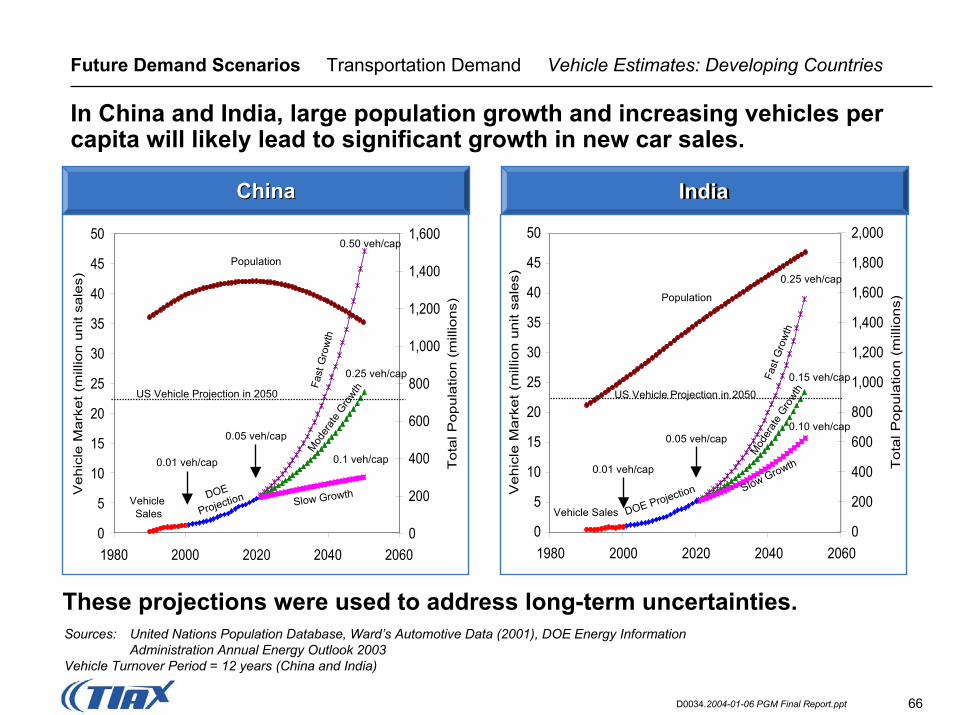
Future Demand Scenarios Transportation Demand Vehicle Estimates: Developing Countries
In China and India, large population growth and increasing vehicles per capita will likely lead to significant growth in new car sales.
ChinaChina India
0
5
10
15
20
25
30
35
40
45
50
1980 2000 2020 2040 2060
Veh
icle
Mar
ket (
mill
ion
unit
sale
s)
0
200
400
600
800
1,000
1,200
1,400
1,600
Tot
al P
opul
atio
n (m
illio
ns)
US Vehicle Projection in 2050
0.1 veh/cap
0.25 veh/cap
0.50 veh/cap
DOE
Projection Slow GrowthVehicle Sales
Population
0.01 veh/cap
0.05 veh/cap
Fast
Gro
wth
Mod
erat
e Gro
wth
India
0
5
10
15
20
25
30
35
40
45
50
1980 2000 2020 2040 2060
Veh
icle
Mar
ket (
mill
ion
unit
sale
s)0
200
400
600
800
1,000
1,200
1,400
1,600
1,800
2,000
Tot
al P
opul
atio
n (m
illio
ns)
US Vehicle Projection in 2050
0.10 veh/cap
0.15 veh/cap
0.25 veh/cap
DOE Projection Slow Growth
Vehicle Sales
Population
0.01 veh/cap
0.05 veh/cap
Fast
Gro
wth
Mod
erat
e Gro
wth
These projections were used to address long-term uncertainties. Sources: United Nations Population Database, Ward’s Automotive Data (2001), DOE Energy Information
Administration Annual Energy Outlook 2003Vehicle Turnover Period = 12 years (China and India)
67D0034.2004-01-06 PGM Final Report.ppt
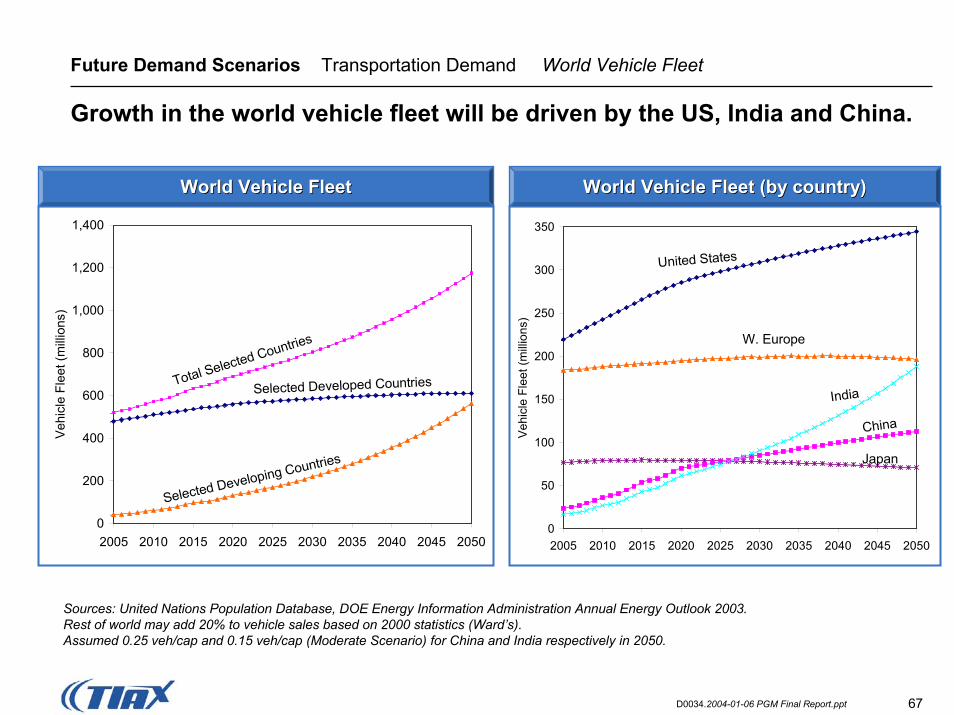
Future Demand Scenarios Transportation Demand World Vehicle Fleet
Growth in the world vehicle fleet will be driven by the US, India and China.
0
50
100
150
200
250
300
350
2005 2010 2015 2020 2025 2030 2035 2040 2045 2050
Veh
icle
Fle
et (m
illion
s)0
200
400
600
800
1,000
1,200
1,400
2005 2010 2015 2020 2025 2030 2035 2040 2045 2050
Vehi
cle
Flee
t (m
illion
s)
United States
W. Europe
Japan
China
Total Selected Countries
Selected Developed Countries
Selected Developing Countries
India
Sources: United Nations Population Database, DOE Energy Information Administration Annual Energy Outlook 2003.Rest of world may add 20% to vehicle sales based on 2000 statistics (Ward’s).Assumed 0.25 veh/cap and 0.15 veh/cap (Moderate Scenario) for China and India respectively in 2050.
World Vehicle FleetWorld Vehicle Fleet World Vehicle Fleet (by country)World Vehicle Fleet (by country)
68D0034.2004-01-06 PGM Final Report.ppt
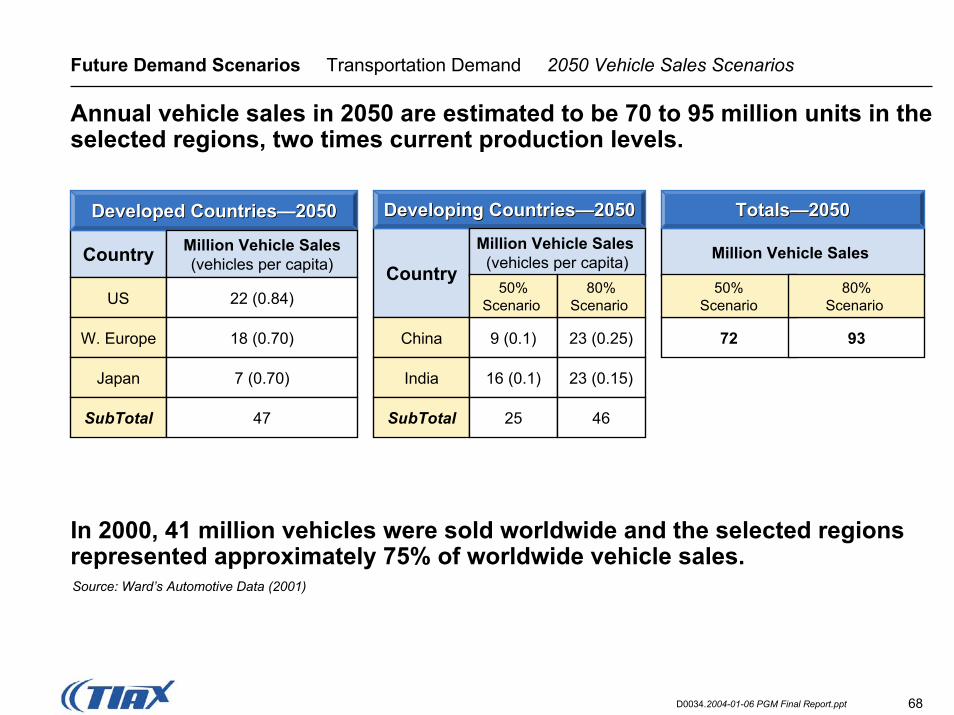
Future Demand Scenarios Transportation Demand 2050 Vehicle Sales Scenarios
Annual vehicle sales in 2050 are estimated to be 70 to 95 million units in the selected regions, two times current production levels.
In 2000, 41 million vehicles were sold worldwide and the selected regions represented approximately 75% of worldwide vehicle sales.Source: Ward’s Automotive Data (2001)
72 93
Million Vehicle Sales
50%Scenario
80%Scenario
Country
Developed CountriesDeveloped Countries——20502050
Million Vehicle Sales(vehicles per capita)
US 22 (0.84)
W. Europe 18 (0.70)
Japan 7 (0.70)
SubTotal 47
Country
Developing CountriesDeveloping Countries——20502050 TotalsTotals——20502050
Million Vehicle Sales (vehicles per capita)
China 9 (0.1)
India 16 (0.1)
50%Scenario
80%Scenario
23 (0.25)
23 (0.15)
SubTotal 25 46
69D0034.2004-01-06 PGM Final Report.ppt
Future Demand Scenarios Scenarios Scenarios and Key Assumptions
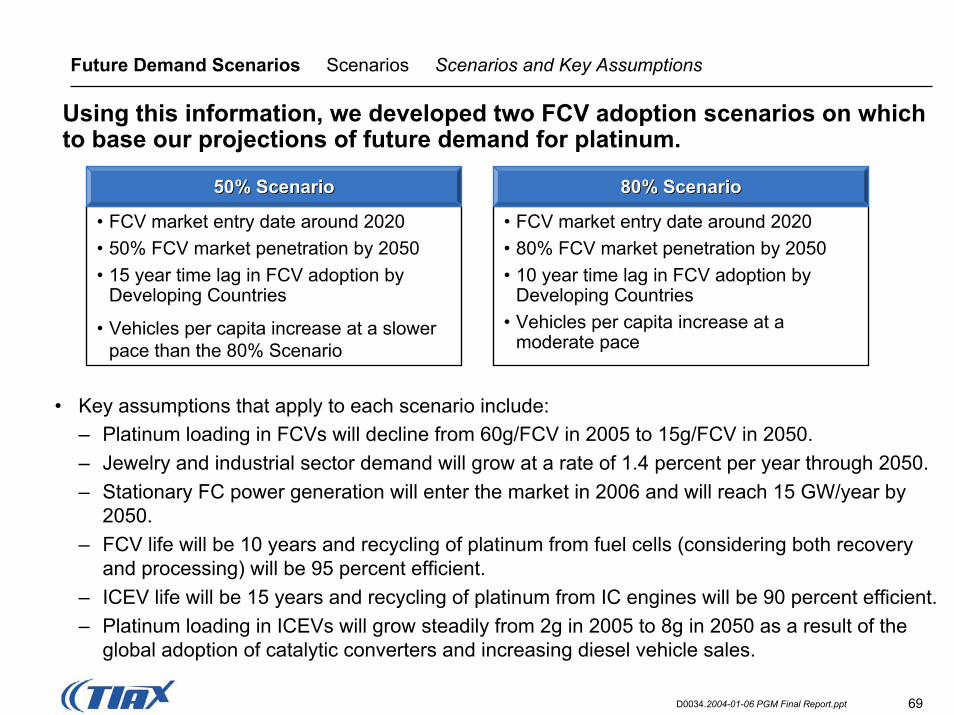
Using this information, we developed two FCV adoption scenarios on which to base our projections of future demand for platinum.
• FCV market entry date around 2020• 80% FCV market penetration by 2050• 10 year time lag in FCV adoption by
Developing Countries• Vehicles per capita increase at a
moderate pace
• FCV market entry date around 2020• 50% FCV market penetration by 2050• 15 year time lag in FCV adoption by
Developing Countries
• Vehicles per capita increase at a slower pace than the 80% Scenario
• Key assumptions that apply to each scenario include:– Platinum loading in FCVs will decline from 60g/FCV in 2005 to 15g/FCV in 2050.– Jewelry and industrial sector demand will grow at a rate of 1.4 percent per year through 2050.– Stationary FC power generation will enter the market in 2006 and will reach 15 GW/year by
2050.– FCV life will be 10 years and recycling of platinum from fuel cells (considering both recovery
and processing) will be 95 percent efficient.– ICEV life will be 15 years and recycling of platinum from IC engines will be 90 percent efficient.– Platinum loading in ICEVs will grow steadily from 2g in 2005 to 8g in 2050 as a result of the
global adoption of catalytic converters and increasing diesel vehicle sales.
80% Scenario80% Scenario50% Scenario50% Scenario
70D0034.2004-01-06 PGM Final Report.ppt
Future Demand Scenarios Scenarios Platinum Loading Assumptions
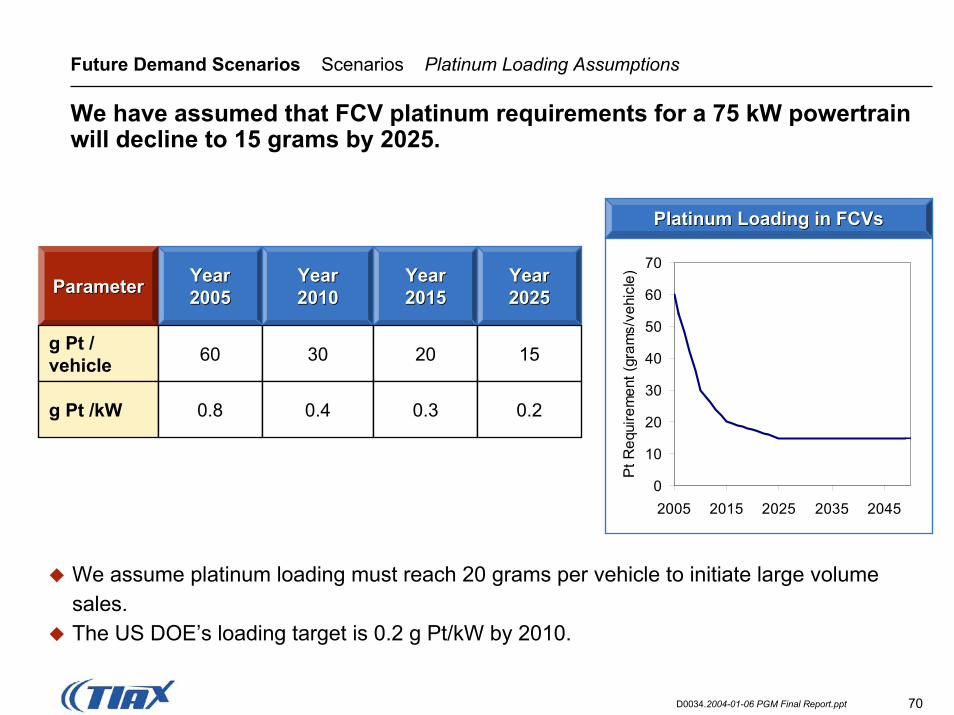
We have assumed that FCV platinum requirements for a 75 kW powertrainwill decline to 15 grams by 2025.
Platinum Loading in FCVsPlatinum Loading in FCVs
0
10
20
30
40
50
60
70
2005 2015 2025 2035 2045
Pt R
equi
rem
ent (
gram
s/ve
hicl
e)YearYear20052005
YearYear20102010
YearYear20152015
YearYear20252025ParameterParameter
g Pt /vehicle
g Pt /kW
60
0.8
30
0.4
20 15
0.3 0.2
We assume platinum loading must reach 20 grams per vehicle to initiate large volume sales.The US DOE’s loading target is 0.2 g Pt/kW by 2010.
71D0034.2004-01-06 PGM Final Report.ppt
Future Demand Scenarios Scenarios Non-Transportation Sector Assumptions
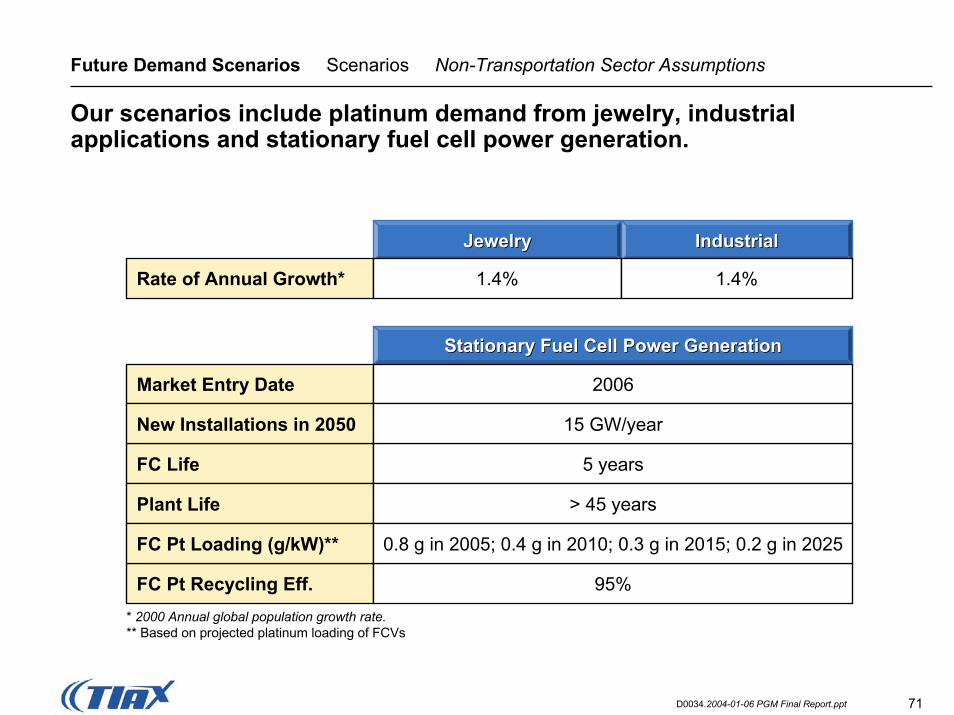
Our scenarios include platinum demand from jewelry, industrial applications and stationary fuel cell power generation.
JewelryJewelry IndustrialIndustrial
Stationary Fuel Cell Power GenerationStationary Fuel Cell Power Generation
Rate of Annual Growth* 1.4% 1.4%
Market Entry Date 2006
FC Life
New Installations in 2050 15 GW/year
5 years
Plant Life > 45 years
FC Pt Recycling Eff.
FC Pt Loading (g/kW)** 0.8 g in 2005; 0.4 g in 2010; 0.3 g in 2015; 0.2 g in 2025
95%* 2000 Annual global population growth rate.** Based on projected platinum loading of FCVs
72D0034.2004-01-06 PGM Final Report.ppt
Future Demand Scenarios Scenarios FCV Penetration
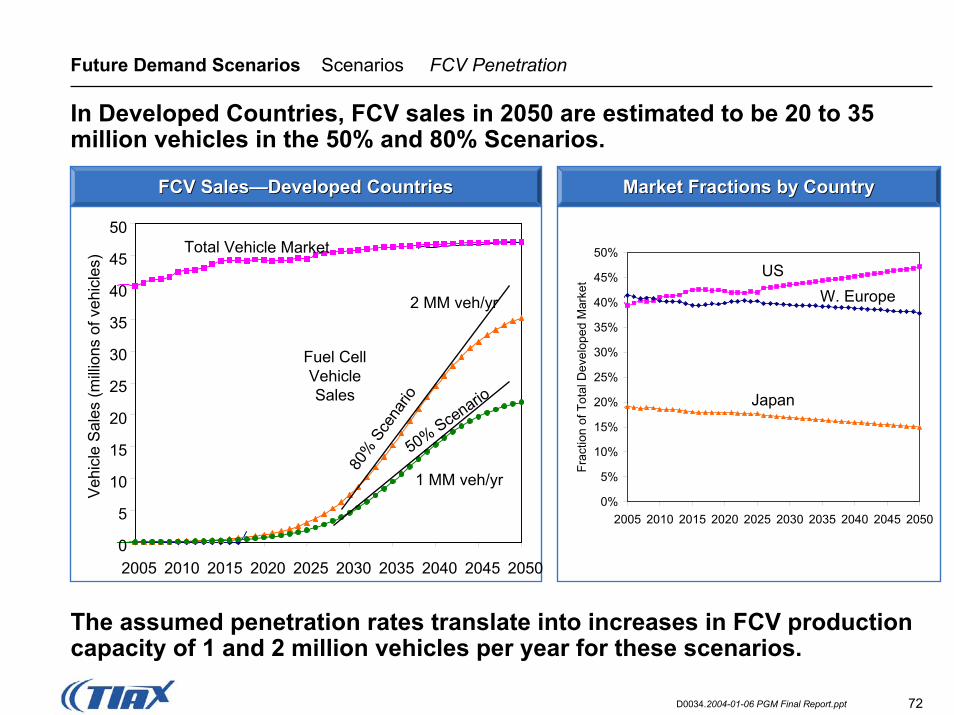
In Developed Countries, FCV sales in 2050 are estimated to be 20 to 35 million vehicles in the 50% and 80% Scenarios.
0
5
10
15
20
25
30
35
40
45
50
2005 2010 2015 2020 2025 2030 2035 2040 2045 2050
Veh
icle
Sal
es (m
illion
s of
veh
icle
s)
Total Vehicle Market
80%
Sce
nario
50% Scenario
0%
5%
10%
15%
20%
25%
30%
35%
40%
45%
50%
2005 2010 2015 2020 2025 2030 2035 2040 2045 2050
Frac
tion
of T
otal
Dev
elop
ed M
arke
t
USW. Europe
Japan
2 MM veh/yr
1 MM veh/yr
Fuel CellVehicleSales
The assumed penetration rates translate into increases in FCV production capacity of 1 and 2 million vehicles per year for these scenarios.
FCV SalesFCV Sales——Developed CountriesDeveloped Countries Market Fractions by CountryMarket Fractions by Country
73D0034.2004-01-06 PGM Final Report.ppt
Future Demand Scenarios Scenarios Total Primary Platinum Demand
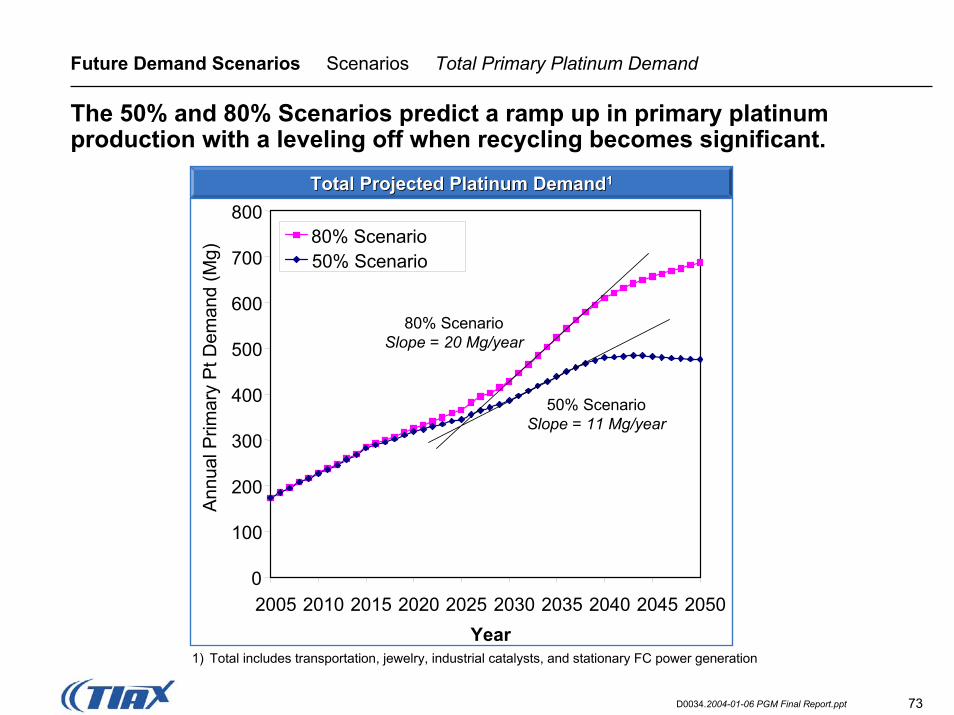
The 50% and 80% Scenarios predict a ramp up in primary platinum production with a leveling off when recycling becomes significant.
Total Projected Platinum DemandTotal Projected Platinum Demand11
0
100
200
300
400
500
600
700
800
2005 2010 2015 2020 2025 2030 2035 2040 2045 2050Year
Ann
ual P
rimar
y P
t Dem
and
(Mg)
80% Scenario50% Scenario
80% ScenarioSlope = 20 Mg/year
50% ScenarioSlope = 11 Mg/year
1) Total includes transportation, jewelry, industrial catalysts, and stationary FC power generation
74D0034.2004-01-06 PGM Final Report.ppt
Future Demand Scenarios Scenarios Transportation Demand
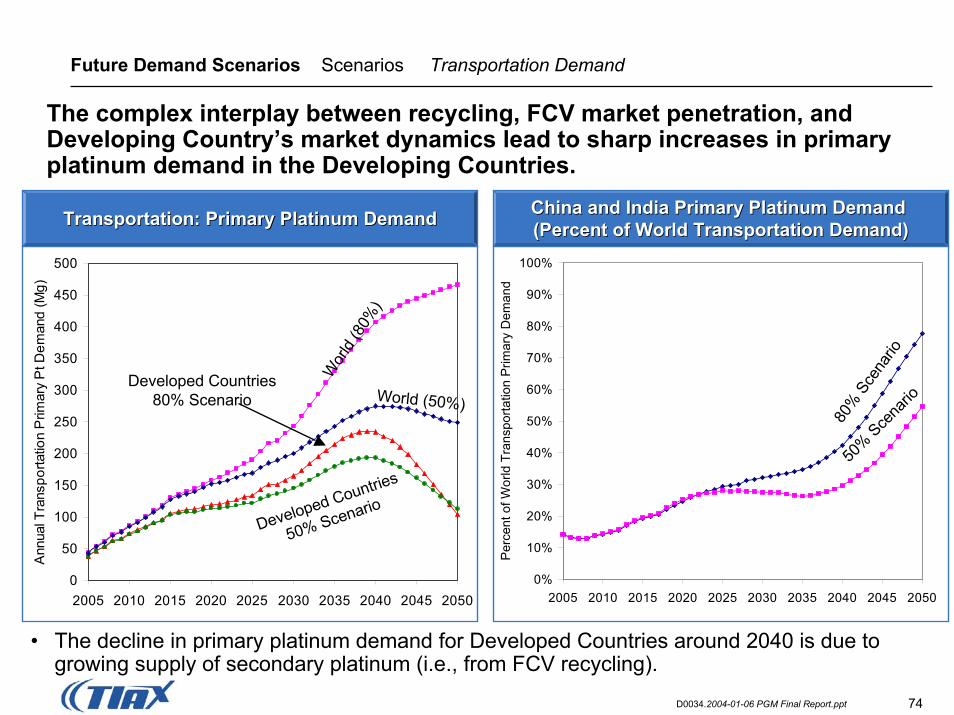
The complex interplay between recycling, FCV market penetration, and Developing Country’s market dynamics lead to sharp increases in primary platinum demand in the Developing Countries.
0
50
100
150
200
250
300
350
400
450
500
2005 2010 2015 2020 2025 2030 2035 2040 2045 2050
Ann
ual T
rans
porta
tion
Prim
ary
Pt D
eman
d (M
g)
Developed Countries80% Scenario
Developed Countries
50% Scenario
Wor
ld (8
0%)
World (50%)
80%
Sce
nario
50% Sce
nario
0%
10%
20%
30%
40%
50%
60%
70%
80%
90%
100%
2005 2010 2015 2020 2025 2030 2035 2040 2045 2050
Per
cent
of W
orld
Tra
nspo
rtatio
n P
rimar
y D
eman
d
China and India Primary Platinum Demand China and India Primary Platinum Demand (Percent of World Transportation Demand)(Percent of World TranTransportation: Primary Platinum DemandTransportation: Primary Platinum Demand sportation Demand)
• The decline in primary platinum demand for Developed Countries around 2040 is due to growing supply of secondary platinum (i.e., from FCV recycling).
75D0034.2004-01-06 PGM Final Report.ppt
Future Demand Scenarios Scenarios Role of Recycling - 50% Scenario
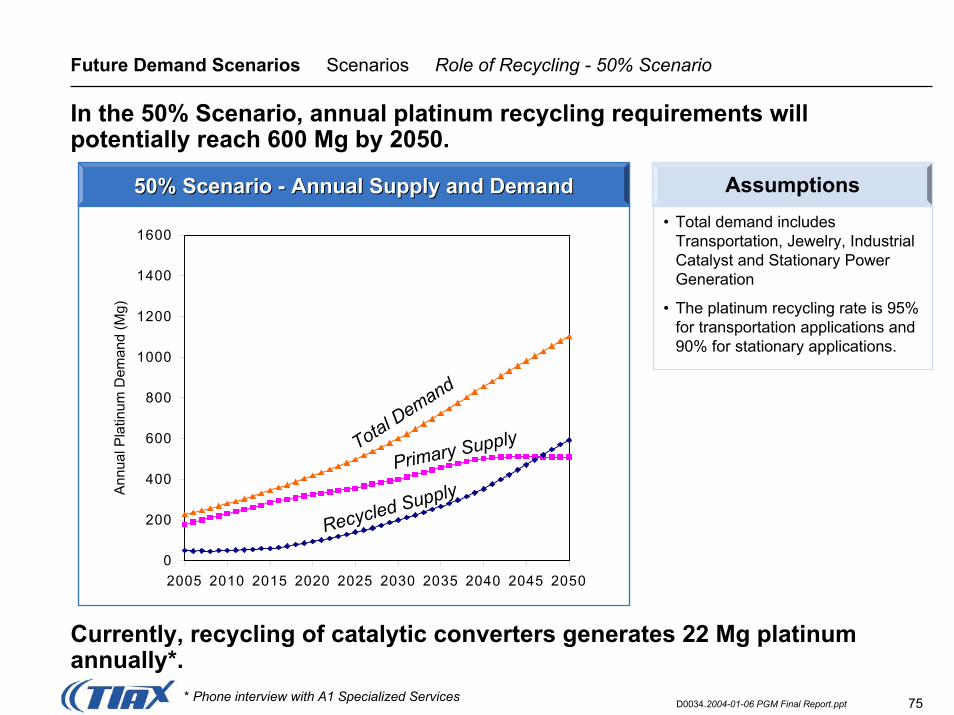
In the 50% Scenario, annual platinum recycling requirements willpotentially reach 600 Mg by 2050.
Currently, recycling of catalytic converters generates 22 Mg platinum annually*.
• Total demand includes Transportation, Jewelry, Industrial Catalyst and Stationary Power Generation
• The platinum recycling rate is 95% for transportation applications and 90% for stationary applications.
0
200
400
600
800
1000
1200
1400
1600
2005 2010 2015 2020 2025 2030 2035 2040 2045 2050
Ann
ual P
latin
um D
eman
d (M
g)
Total Demand
Recycled SupplyPrimary Supply
* Phone interview with A1 Specialized Services
Assumptions50% Scenario 50% Scenario -- Annual Supply and DemandAnnual Supply and Demand
76D0034.2004-01-06 PGM Final Report.ppt
Future Demand Scenarios Scenarios Role of Recycling - 80% Scenario
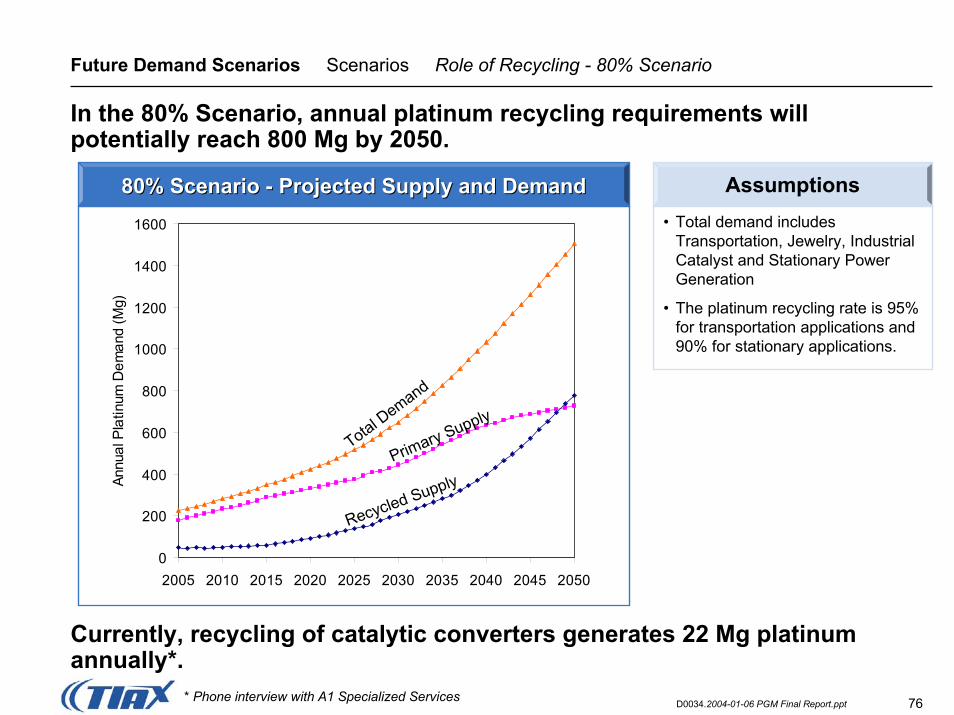
In the 80% Scenario, annual platinum recycling requirements willpotentially reach 800 Mg by 2050.
• Total demand includes Transportation, Jewelry, Industrial Catalyst and Stationary Power Generation
• The platinum recycling rate is 95% for transportation applications and 90% for stationary applications.
0
200
400
600
800
1000
1200
1400
1600
2005 2010 2015 2020 2025 2030 2035 2040 2045 2050
Annu
al P
latin
um D
eman
d (M
g)
Total Demand
Recycled SupplyPrimary Supply
Assumptions80% Scenario 80% Scenario -- Projected Supply and DemandProjected Supply and Demand
Currently, recycling of catalytic converters generates 22 Mg platinum annually*.
* Phone interview with A1 Specialized Services
77D0034.2004-01-06 PGM Final Report.ppt
Future Demand Scenarios Scenarios Summary
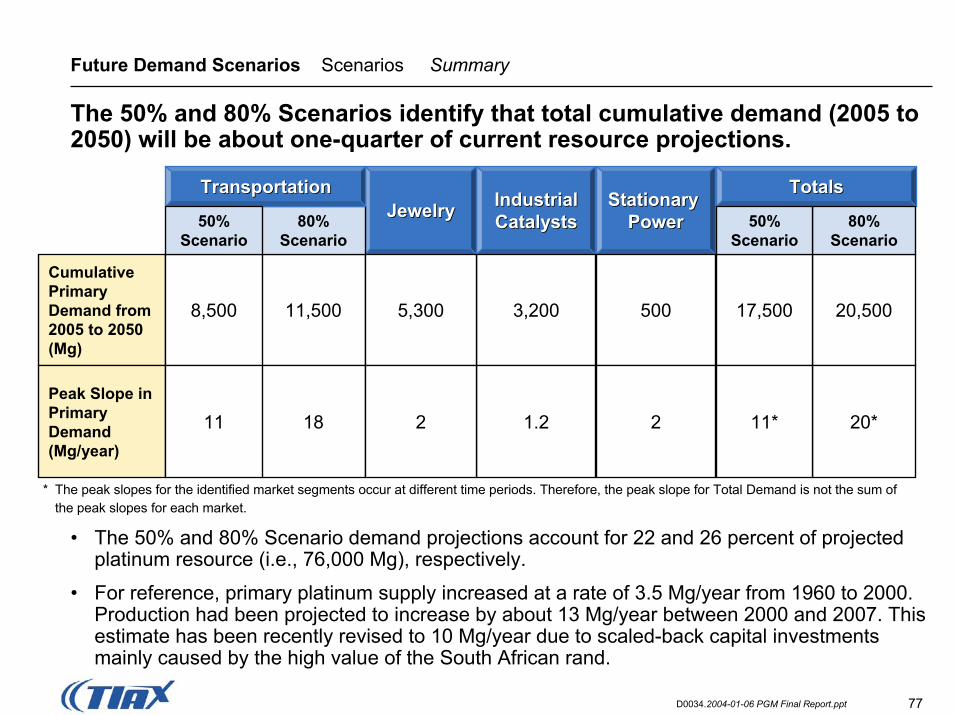
The 50% and 80% Scenarios identify that total cumulative demand (2005 to 2050) will be about one-quarter of current resource projections.
Stationary Stationary PowerPower
Cumulative Primary Demand from 2005 to 2050 (Mg)
11,500
18
500
2
TotalsTotalsIndustrial Industrial CatalystsCatalysts
3,200
1.2
JewelryJewelry
5,300
2Peak Slope in Primary Demand (Mg/year)
20,5008,500
11
17,500
Transportation
80% Scenario
Transportation
50%Scenario
50%Scenario
80% Scenario
11* 20*
* The peak slopes for the identified market segments occur at different time periods. Therefore, the peak slope for Total Demand is not the sum of the peak slopes for each market.
• The 50% and 80% Scenario demand projections account for 22 and 26 percent of projected platinum resource (i.e., 76,000 Mg), respectively.
• For reference, primary platinum supply increased at a rate of 3.5 Mg/year from 1960 to 2000. Production had been projected to increase by about 13 Mg/year between 2000 and 2007. This estimate has been recently revised to 10 Mg/year due to scaled-back capital investments mainly caused by the high value of the South African rand.
78D0034.2004-01-06 PGM Final Report.ppt
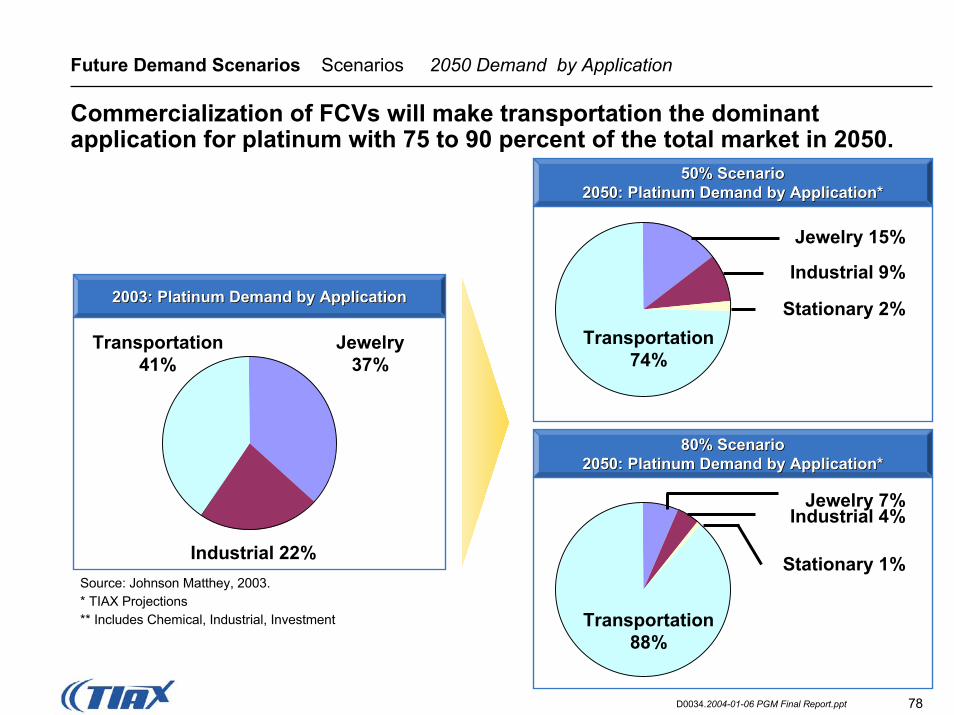
Future Demand Scenarios Scenarios 2050 Demand by Application
Commercialization of FCVs will make transportation the dominant application for platinum with 75 to 90 percent of the total market in 2050.
Transportation 74%
Jewelry 15%
Industrial 9%
Stationary 2%
50% Scenario50% Scenario2050: Platinum Demand by Application*
Transportation 88%
Jewelry 7%Industrial 4%
Stationary 1%
2050: Platinum Demand by Application*
2005 Slow2003: Platinum Demand by Application2003: Platinum Demand by Application
Transportation41%
Jewelry37%
Industrial 22%Source: Johnson Matthey, 2003.* TIAX Projections** Includes Chemical, Industrial, Investment
80% Scenario80% Scenario2050: Platinum Demand by Application*2050: Platinum Demand by Application*
79D0034.2004-01-06 PGM Final Report.ppt
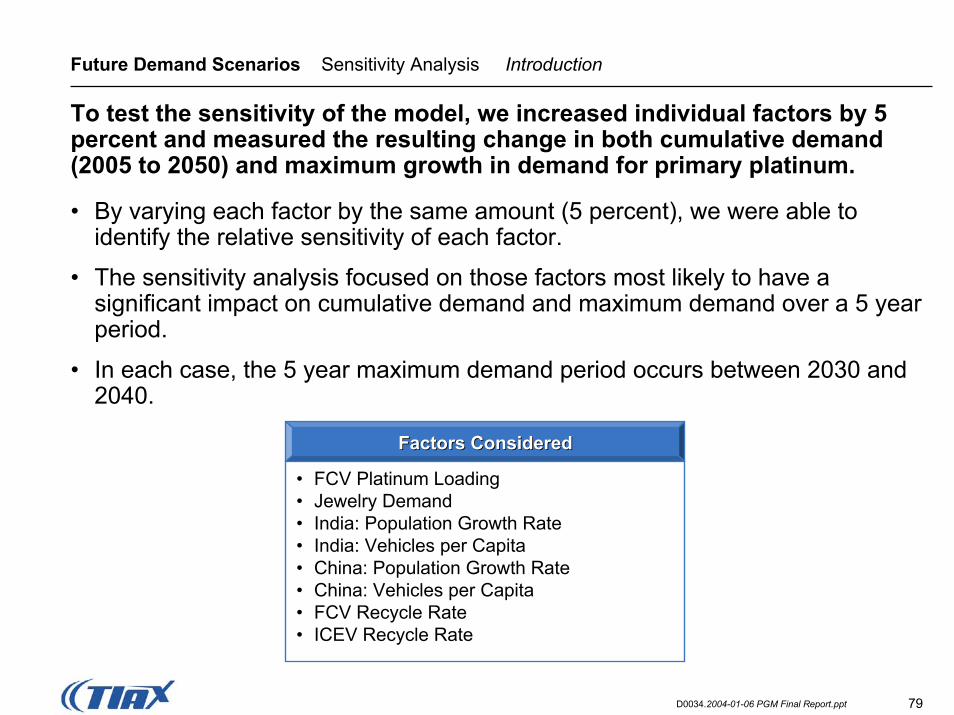
Future Demand Scenarios Sensitivity Analysis Introduction
To test the sensitivity of the model, we increased individual factors by 5 percent and measured the resulting change in both cumulative demand (2005 to 2050) and maximum growth in demand for primary platinum.
• By varying each factor by the same amount (5 percent), we were able to identify the relative sensitivity of each factor.
• The sensitivity analysis focused on those factors most likely to have a significant impact on cumulative demand and maximum demand over a 5 year period.
• In each case, the 5 year maximum demand period occurs between 2030 and 2040.
Factors ConsideredFactors Considered
• FCV Platinum Loading• Jewelry Demand• India: Population Growth Rate• India: Vehicles per Capita• China: Population Growth Rate• China: Vehicles per Capita• FCV Recycle Rate• ICEV Recycle Rate
80D0034.2004-01-06 PGM Final Report.ppt
Future Demand Scenarios Sensitivity Analysis Summary of Results
The sensitivity analysis identified that the model is relatively insensitive to changes in individual factors; of all factors considered, changes to FCV platinum loading levels and ICEV recycling rates have the greatest impact on model results.
• Cumulative demand is relatively insensitive to change in both the 50% and 80% Scenarios:– Changes in platinum loading in FCVs, ICEV recycle rates, and growth in
jewelry demand have the greatest impact on cumulative demand, but even then, a 5 percent increase in these factors results in only a 1 to 2 percent change in cumulative demand.
• Maximum growth in demand over a five year period tends to be more sensitive to change than cumulative demand in both the 50% and 80% Scenarios.– Changes to platinum loading in FCVs and ICEV recycle rates have the
greatest impact on maximum growth in demand. A 5 percent increase in these factors causes a 2.5 to 4.5 percent change in the maximum growth in demand over a five year period.
81D0034.2004-01-06 PGM Final Report.ppt
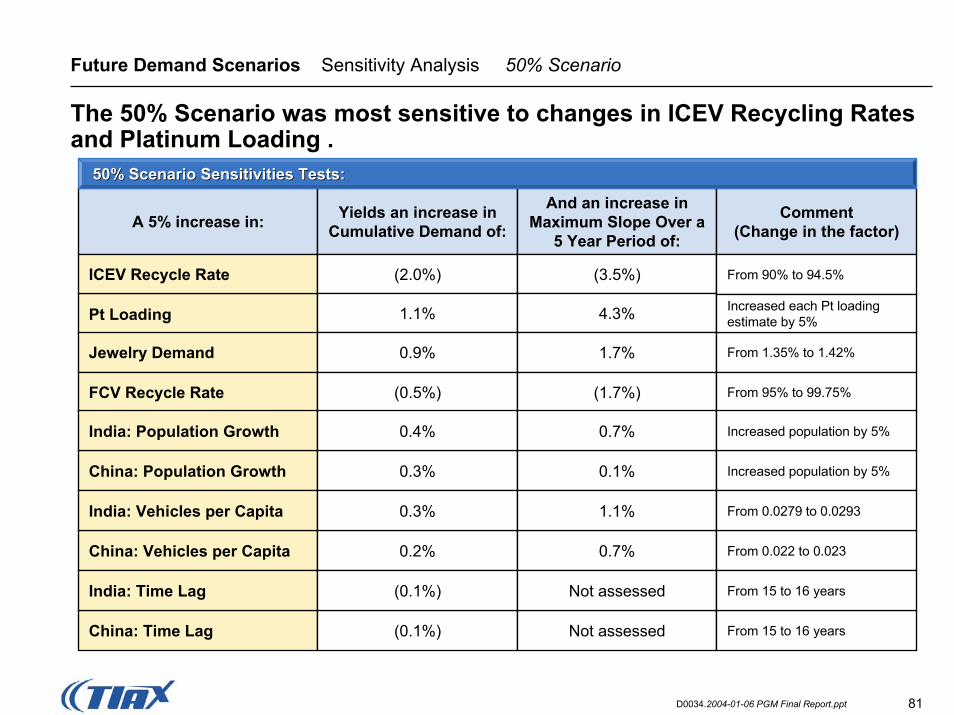
Future Demand Scenarios Sensitivity Analysis 50% Scenario
The 50% Scenario was most sensitive to changes in ICEV Recycling Rates and Platinum Loading .
A 5% increase in:
Pt Loading
ICEV Recycle Rate
Jewelry Demand
FCV Recycle Rate
China: Vehicles per Capita
China: Population Growth
India: Vehicles per Capita
India: Population Growth
China: Time Lag
Yields an increase in Cumulative Demand of:
(2.0%)
1.1%
0.9%
(0.5%)
0.2%
0.3%
0.3%
0.4%
(0.1%)
And an increase in Maximum Slope Over a
5 Year Period of:
(3.5%)
4.3%
1.7%
(1.7%)
0.7%
0.1%
1.1%
0.7%
Not assessed
50% Scenario Sensitivities Tests:50% Scenario Sensitivities Tests:
Comment(Change in the factor)
From 90% to 94.5%
Increased each Pt loading estimate by 5%
From 1.35% to 1.42%
From 95% to 99.75%
From 0.022 to 0.023
Increased population by 5%
Increased population by 5%
From 0.0279 to 0.0293
India: Time Lag (0.1%) Not assessed From 15 to 16 years
From 15 to 16 years
82D0034.2004-01-06 PGM Final Report.ppt
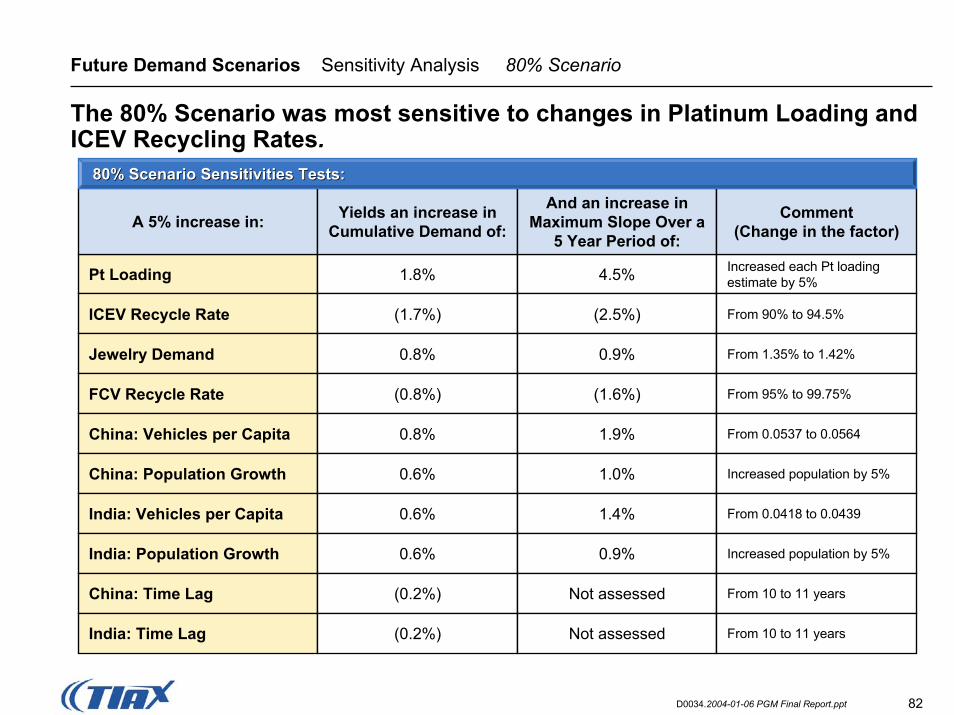
Future Demand Scenarios Sensitivity Analysis 80% Scenario
The 80% Scenario was most sensitive to changes in Platinum Loading and ICEV Recycling Rates.
Pt Loading
ICEV Recycle Rate
Jewelry Demand
FCV Recycle Rate
China: Vehicles per Capita
China: Population Growth
India: Vehicles per Capita
India: Population Growth
China: Time Lag
India: Time Lag
1.8%
(1.7%)
0.8%
(0.8%)
0.8%
0.6%
0.6%
0.6%
(0.2%)
(0.2%)
4.5%
(2.5%)
0.9%
(1.6%)
1.9%
1.0%
1.4%
0.9%
Not assessed
Not assessed
Increased each Pt loading estimate by 5%
From 90% to 94.5%
From 1.35% to 1.42%
From 95% to 99.75%
From 0.0537 to 0.0564
Increased population by 5%
From 0.0418 to 0.0439
Increased population by 5%
From 10 to 11 years
From 10 to 11 years
A 5% increase in: Yields an increase in Cumulative Demand of:
And an increase in Maximum Slope Over a
5 Year Period of:
80% Scenario Sensitivities Tests:80% Scenario Sensitivities Tests:
Comment(Change in the factor)
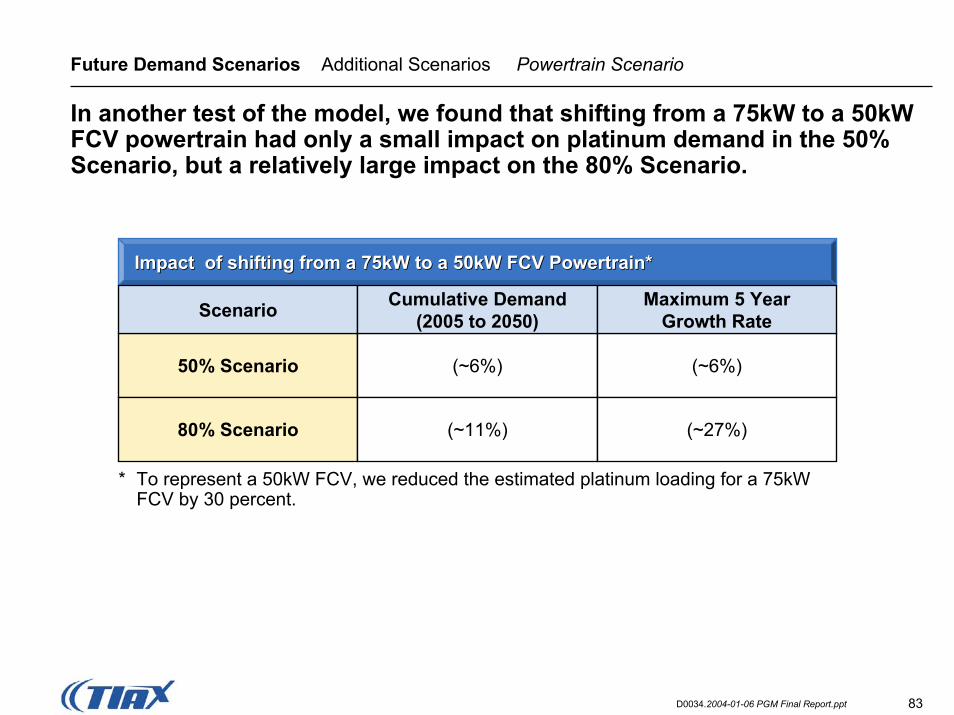
83D0034.2004-01-06 PGM Final Report.ppt
Future Demand Scenarios Additional Scenarios Powertrain Scenario
In another test of the model, we found that shifting from a 75kW to a 50kW FCV powertrain had only a small impact on platinum demand in the 50% Scenario, but a relatively large impact on the 80% Scenario.
Impact of shifting from a 75kW to a 50kW FCV Powertrain*
* To represent a 50kW FCV, we reduced the estimated platinum loading for a 75kW FCV by 30 percent.
50% Scenario (~6%)
Impact of shifting from a 75kW to a 50kW FCV Powertrain*
Cumulative Demand(2005 to 2050)
Maximum 5 YearGrowth RateScenario
(~6%)
80% Scenario (~11%) (~27%)
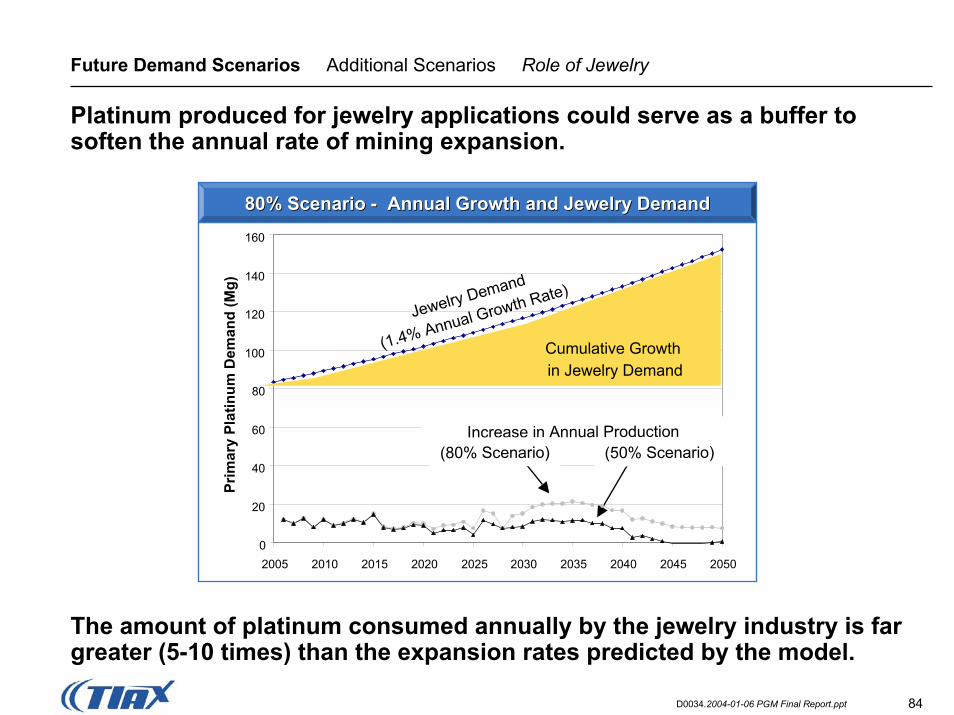
84D0034.2004-01-06 PGM Final Report.ppt
Future Demand Scenarios Additional Scenarios Role of Jewelry
Platinum produced for jewelry applications could serve as a buffer to soften the annual rate of mining expansion.
80% Scenario 80% Scenario -- Annual Growth and Jewelry DemandAnnual Growth and Jewelry Demand
Jewelry Demand
(1.4% Annual Growth Rate)
0
20
40
60
80
100
120
140
160
2005 2010 2015 2020 2025 2030 2035 2040 2045 2050
Prim
ary
Plat
inum
Dem
and
(Mg)
Increase in Annual Production (80% Scenario) (50% Scenario)
Cumulative Growthin Jewelry Demand
The amount of platinum consumed annually by the jewelry industry is far greater (5-10 times) than the expansion rates predicted by the model.
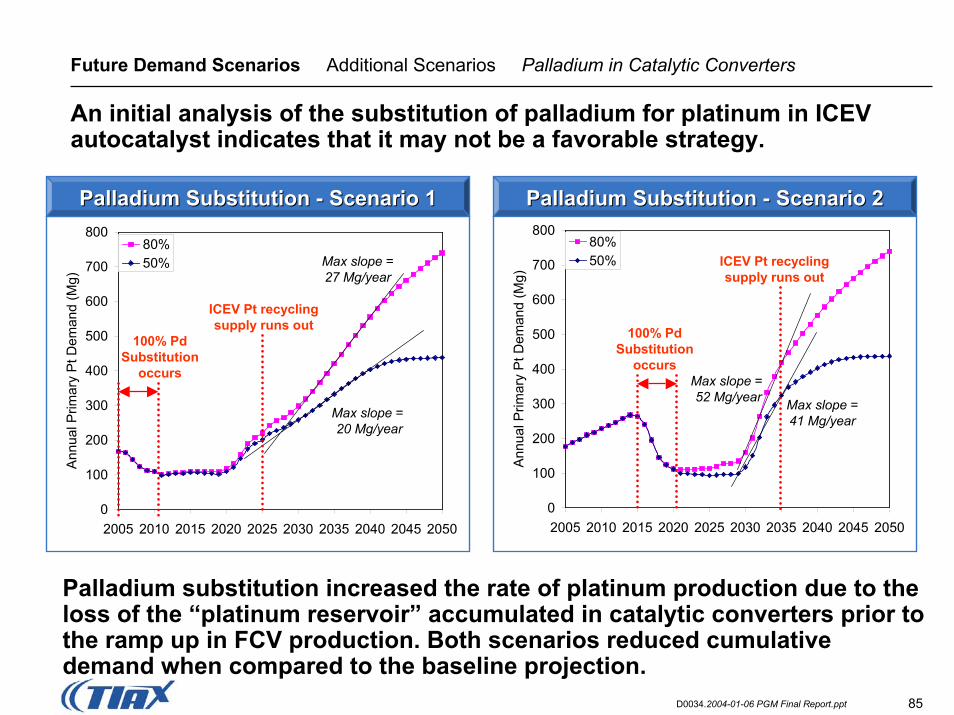
85D0034.2004-01-06 PGM Final Report.ppt
Future Demand Scenarios Additional Scenarios Palladium in Catalytic Converters
An initial analysis of the substitution of palladium for platinum in ICEV autocatalyst indicates that it may not be a favorable strategy.
0
100
200
300
400
500
600
700
800
2005 2010 2015 2020 2025 2030 2035 2040 2045 2050
Ann
ual P
rimar
y P
t Dem
and
(Mg)
80%50%
Max slope =20 Mg/year
Max slope = 27 Mg/year
ICEV Pt recyclingsupply runs out
100% Pd Substitution
occurs
Palladium Substitution Palladium Substitution -- Scenario 1Scenario 1 Palladium Substitution Palladium Substitution -- Scenario 2Scenario 2
0
100
200
300
400
500
600
700
800
2005 2010 2015 2020 2025 2030 2035 2040 2045 2050A
nnua
l Prim
ary
Pt D
eman
d (M
g)
80%50%
Max slope =52 Mg/year Max slope =
41 Mg/year
100% Pd Substitution
occurs
ICEV Pt recyclingsupply runs out
Palladium substitution increased the rate of platinum production due to the loss of the “platinum reservoir” accumulated in catalytic converters prior to the ramp up in FCV production. Both scenarios reduced cumulativedemand when compared to the baseline projection.
86D0034.2004-01-06 PGM Final Report.ppt
Table of Contents
1 Executive Summary
Project Overview
3
4
55 Economic AnalysisEconomic Analysis
2
Platinum Market Overview
Future Demand Scenarios 2005-2050
6 Appendix
87D0034.2004-01-06 PGM Final Report.ppt
Economic Analysis Objectives
The overall objective of this task is to use econometric methods to model platinum supply and demand and simulate the impact of increased platinum demand from FCVs on price.
Task Objectives:Task Objectives:
• The specific objectives of this task are to:
– Study the historical behavior of platinum prices;
– Estimate the platinum demand function; and
– Estimate the platinum supply function.
88D0034.2004-01-06 PGM Final Report.ppt
Economic Analysis Key Findings
Our analysis of platinum supply, demand and price concluded the following:
• Jewelry Demand: Historically, platinum jewelry demand has not been very sensitive to increases in price.
• Total Platinum Demand: In the short-run, platinum price increases will have a relatively small impact on total quantity demanded; however, in the long-run price increases will have a relatively large impact on demand.
• Platinum Price: The real platinum price has been stationary (i.e., the real price has always returned to the long-term mean) over the last century - particularly since the introduction of platinum supply from South Africa. – In the short-run, an increase in demand for platinum from fuel cell vehicles
will likely increase the platinum price.– In the long-run, if supply meets demand, we expect the price of platinum to
return to its long-term mean.
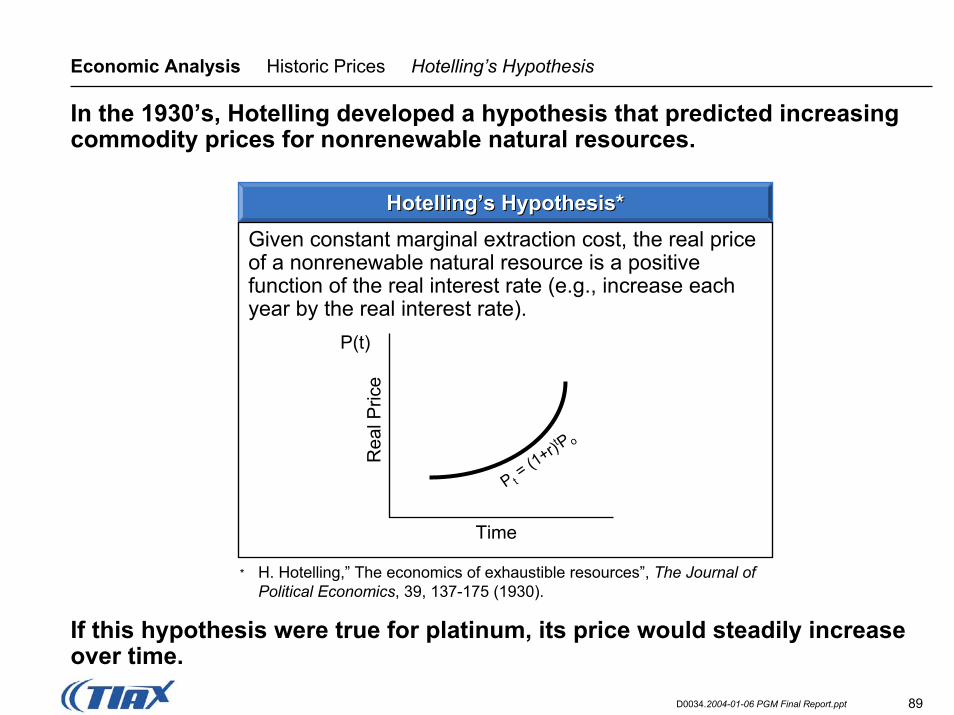
89D0034.2004-01-06 PGM Final Report.ppt
Economic Analysis Historic Prices Hotelling’s Hypothesis
In the 1930’s, Hotelling developed a hypothesis that predicted increasing commodity prices for nonrenewable natural resources.
Hotelling’s Hypothesis*Hotelling’s Hypothesis*
Rea
l Pric
e
P t= (1+r)t P o
P(t)
Given constant marginal extraction cost, the real price of a nonrenewable natural resource is a positive function of the real interest rate (e.g., increase each year by the real interest rate).
Time
* H. Hotelling,” The economics of exhaustible resources”, The Journal of Political Economics, 39, 137-175 (1930).
If this hypothesis were true for platinum, its price would steadily increase over time.
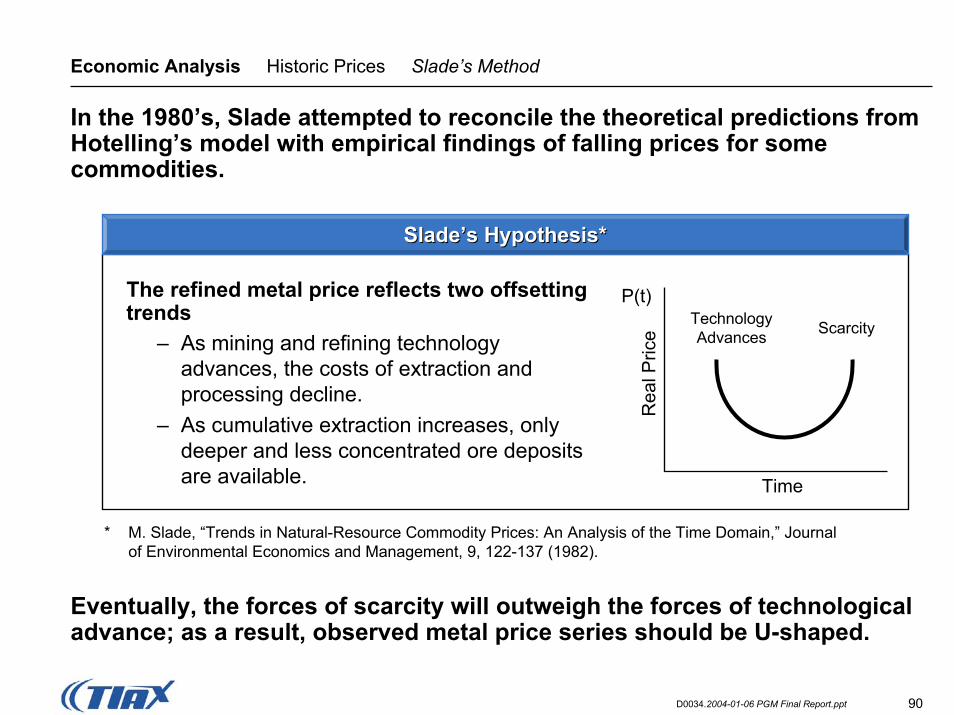
90D0034.2004-01-06 PGM Final Report.ppt
Economic Analysis Historic Prices Slade’s Method
In the 1980’s, Slade attempted to reconcile the theoretical predictions from Hotelling’s model with empirical findings of falling prices for some commodities.
ScarcityTechnologyAdvances
The refined metal price reflects two offsetting trends
– As mining and refining technology advances, the costs of extraction and processing decline.
– As cumulative extraction increases, only deeper and less concentrated ore deposits are available. Time
Rea
l Pric
e
P(t)
Slade’s Hypothesis*Slade’s Hypothesis*
* M. Slade, “Trends in Natural-Resource Commodity Prices: An Analysis of the Time Domain,” Journal of Environmental Economics and Management, 9, 122-137 (1982).
Eventually, the forces of scarcity will outweigh the forces of technological advance; as a result, observed metal price series should be U-shaped.
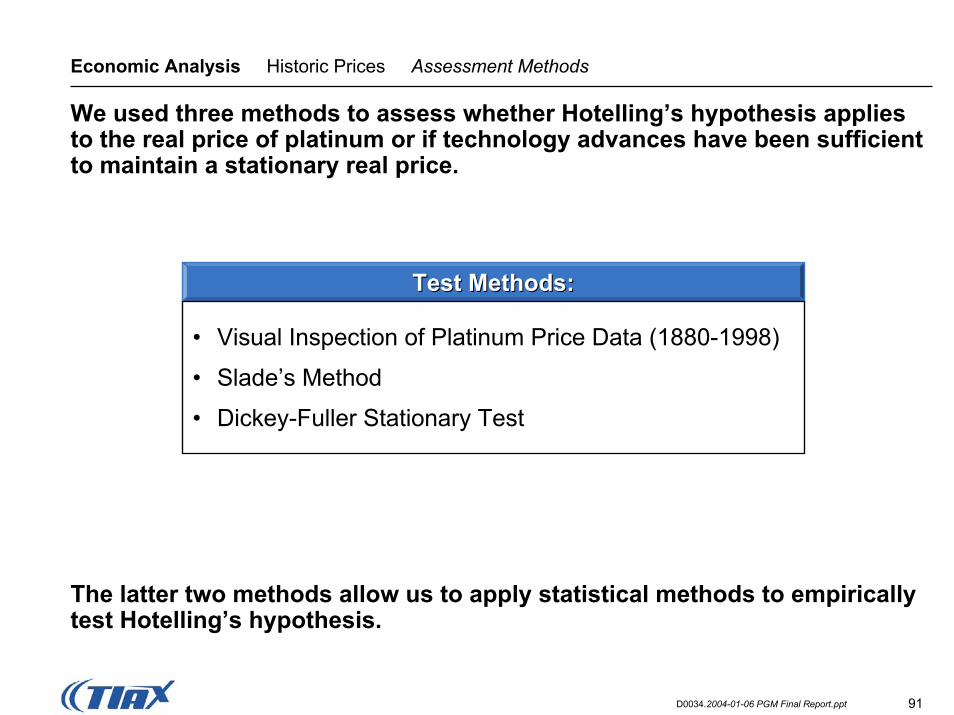
91D0034.2004-01-06 PGM Final Report.ppt
Economic Analysis Historic Prices Assessment Methods
We used three methods to assess whether Hotelling’s hypothesis applies to the real price of platinum or if technology advances have been sufficient to maintain a stationary real price.
Test Methods:Test Methods:
• Visual Inspection of Platinum Price Data (1880-1998)
• Slade’s Method
• Dickey-Fuller Stationary Test
The latter two methods allow us to apply statistical methods to empirically test Hotelling’s hypothesis.
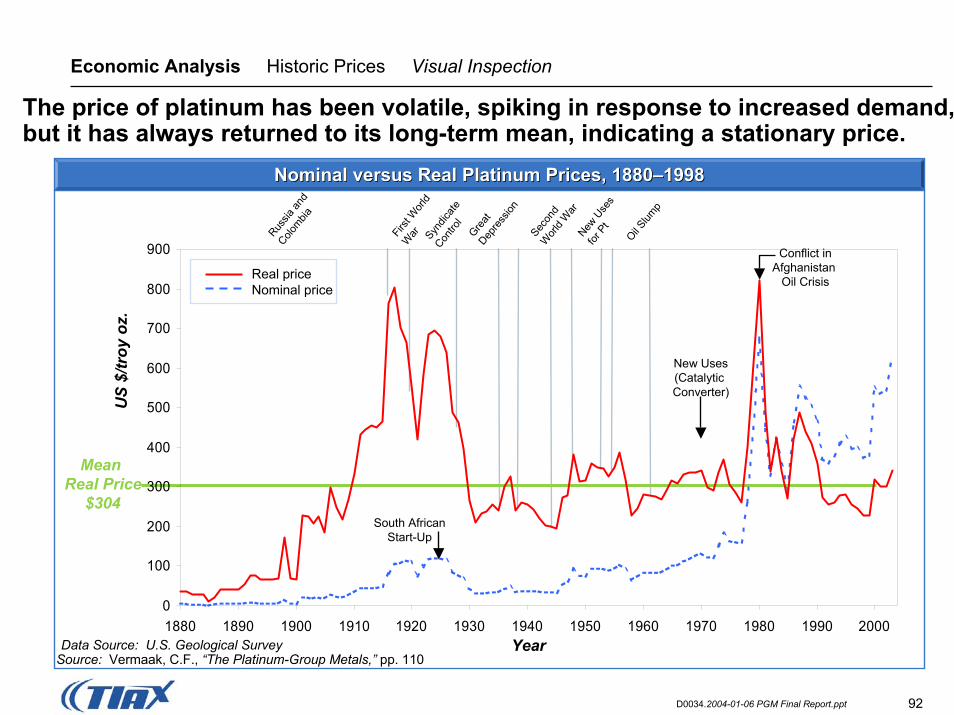
92D0034.2004-01-06 PGM Final Report.ppt
Economic Analysis Historic Prices Visual Inspection
The price of platinum has been volatile, spiking in response to increased demand, but it has always returned to its long-term mean, indicating a stationary price.
Year
US
$/tr
oy o
z.
Mean Real Price
$304
Russia
and
Colombia
First
Wor
ld
War Syn
dicate
Contro
lGre
at Dep
ress
ion
Secon
d W
orld
War
New U
ses
for P
t
Oil Slum
p
Conflict inAfghanistan
Oil Crisis
New Uses(Catalytic Converter)
South AfricanStart-Up
Real priceNominal price
Data Source: U.S. Geological SurveySource: Vermaak, C.F., “The Platinum-Group Metals,” pp. 110
0
100
200
300
400
500
600
700
800
900
1880 1890 1900 1910 1920 1930 1940 1950 1960 1970 1980 1990 2000
Nominal versus Real Platinum Prices, 1880Nominal versus Real Platinum Prices, 1880––19981998
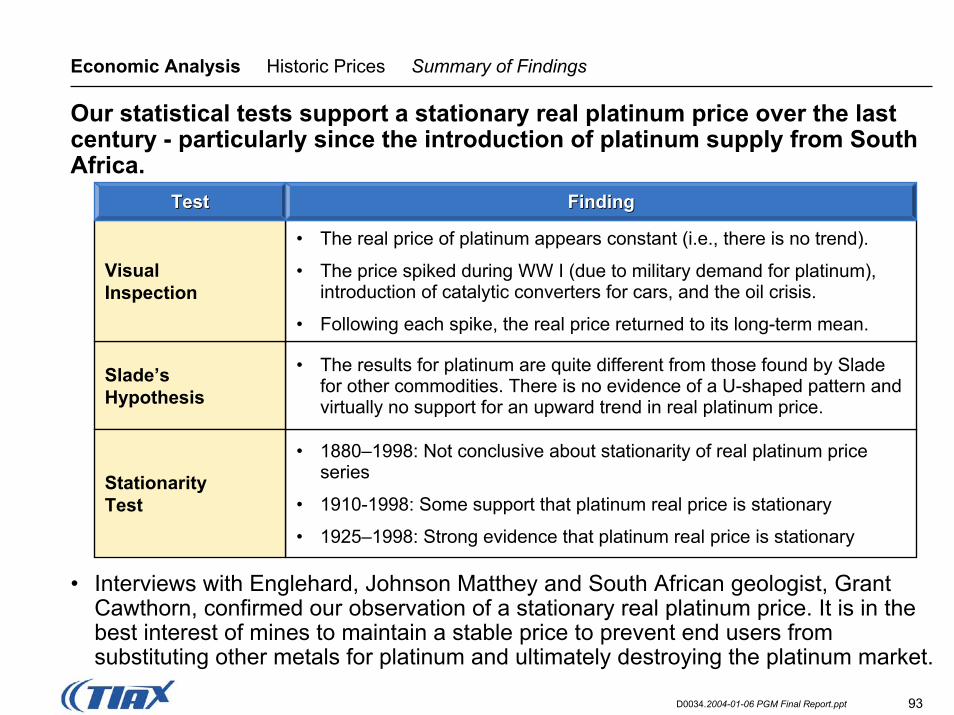
93D0034.2004-01-06 PGM Final Report.ppt
Economic Analysis Historic Prices Summary of Findings
• 1880–1998: Not conclusive about stationarity of real platinum price series
• 1910-1998: Some support that platinum real price is stationary
• 1925–1998: Strong evidence that platinum real price is stationary
• The results for platinum are quite different from those found by Slade for other commodities. There is no evidence of a U-shaped pattern and virtually no support for an upward trend in real platinum price.
Slade’sHypothesis
• The real price of platinum appears constant (i.e., there is no trend).
• The price spiked during WW I (due to military demand for platinum), introduction of catalytic converters for cars, and the oil crisis.
• Following each spike, the real price returned to its long-term mean.
VisualInspection
StationarityTest
FindingFinding
Our statistical tests support a stationary real platinum price over the last century - particularly since the introduction of platinum supply from South Africa.
TestTest
• Interviews with Englehard, Johnson Matthey and South African geologist, Grant Cawthorn, confirmed our observation of a stationary real platinum price. It is in the best interest of mines to maintain a stable price to prevent end users from substituting other metals for platinum and ultimately destroying the platinum market.
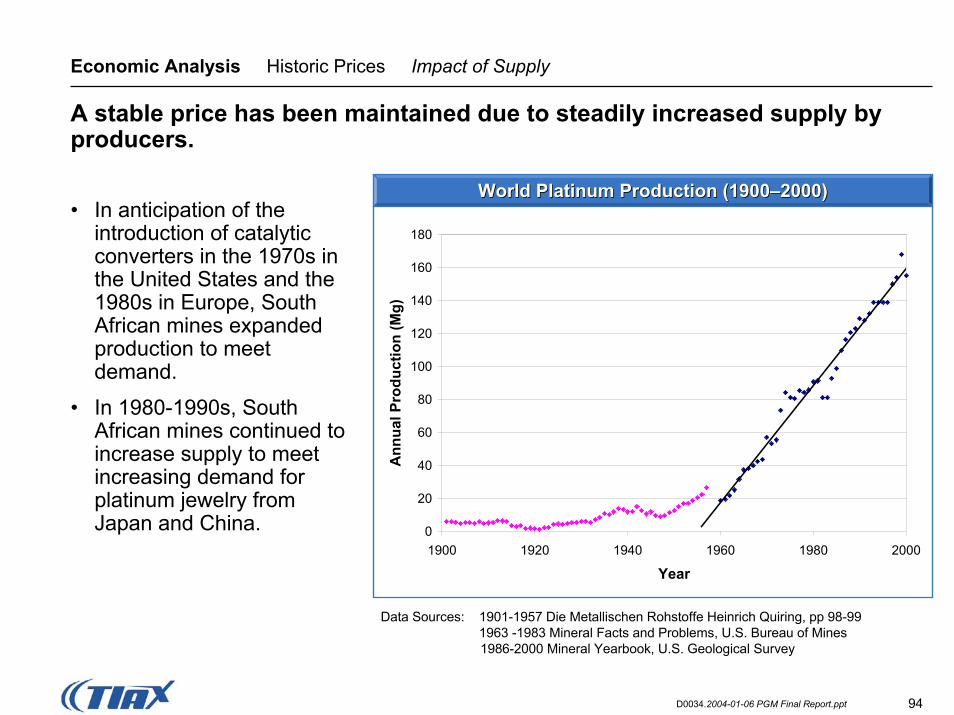
94D0034.2004-01-06 PGM Final Report.ppt
Economic Analysis Historic Prices Impact of Supply
A stable price has been maintained due to steadily increased supply by producers.
World Platinum Production (1900World Platinum Production (1900––2000)2000)• In anticipation of the
introduction of catalytic converters in the 1970s in the United States and the 1980s in Europe, South African mines expanded production to meet demand.
• In 1980-1990s, South African mines continued to increase supply to meet increasing demand for platinum jewelry from Japan and China. 0
20
40
60
80
100
120
140
160
180
1900 1920 1940 1960 1980 2000
Year
Ann
ual P
rodu
ctio
n (M
g)
Data Sources: 1901-1957 Die Metallischen Rohstoffe Heinrich Quiring, pp 98-991963 -1983 Mineral Facts and Problems, U.S. Bureau of Mines1986-2000 Mineral Yearbook, U.S. Geological Survey
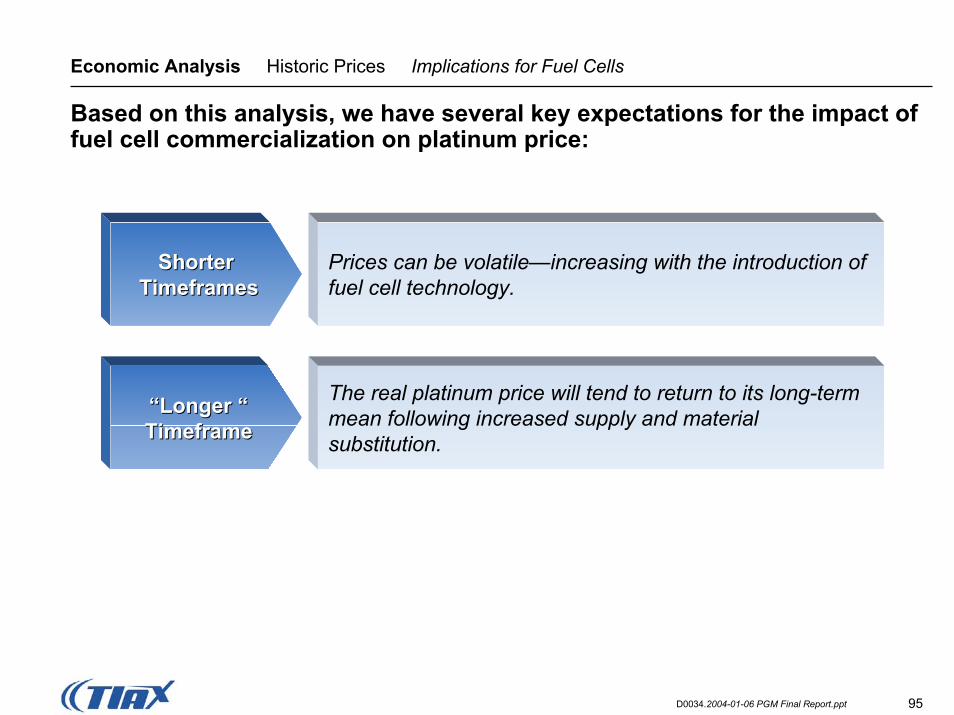
95D0034.2004-01-06 PGM Final Report.ppt
Economic Analysis Historic Prices Implications for Fuel Cells
Based on this analysis, we have several key expectations for the impact of fuel cell commercialization on platinum price:
Shorter Shorter TimeframesTimeframes
“Longer ““Longer “TimeframeTimeframe
Prices can be volatile—increasing with the introduction of fuel cell technology.
The real platinum price will tend to return to its long-term mean following increased supply and material substitution.
96D0034.2004-01-06 PGM Final Report.ppt
Economic Analysis Econometric Models Summary
To project the impact of future platinum supply and demand on price, we developed a set of econometric models for platinum supply and demand.
• We developed econometric models of three sectors of the market:1. Platinum Jewelry Demand: For both Japan and the world.2. World Demand for Platinum: For all uses of platinum.3. Platinum Supply
• The models provided the following insights:– The world demand for platinum jewelry is relatively inelastic (i.e., a 1
percent increase in price will result in only a 0.6 percent decline in demand).
– In the short run, world demand for all platinum is inelastic, but in the long-run, the demand becomes more elastic (i.e., in the long-run a 1 percent increase in price will result in a decline in demand of 1.1 percent).
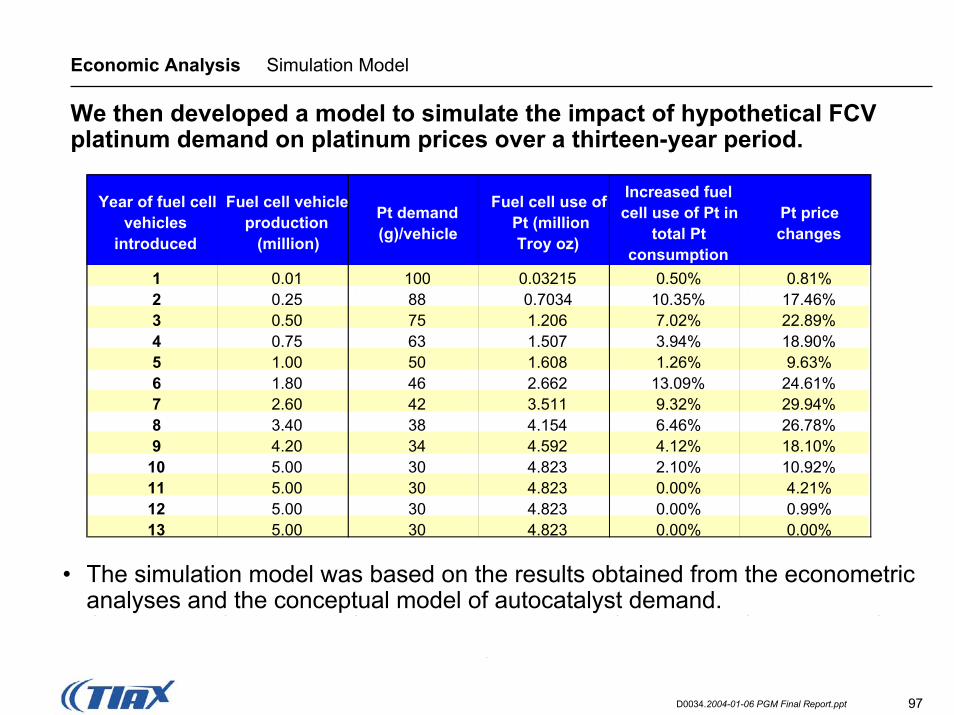
97D0034.2004-01-06 PGM Final Report.ppt
Economic Analysis Simulation Model
We then developed a model to simulate the impact of hypothetical FCV platinum demand on platinum prices over a thirteen-year period.
Year of fuel cell vehicles
introduced
Fuel cell vehicle production
(million)
Pt demand (g)/vehicle
Fuel cell use of Pt (millionTroy oz)
Increased fuel cell use of Pt in
total Pt consumption
Pt price changes
1 0.01 100 0.03215 0.50% 0.81%2 0.25 88 0.7034 10.35% 17.46%3 0.50 75 1.206 7.02% 22.89%4 0.75 63 1.507 3.94% 18.90%5 1.00 50 1.608 1.26% 9.63%6 1.80 46 2.662 13.09% 24.61%7 2.60 42 3.511 9.32% 29.94%8 3.40 38 4.154 6.46% 26.78%9 4.20 34 4.592 4.12% 18.10%
10 5.00 30 4.823 2.10% 10.92%11 5.00 30 4.823 0.00% 4.21%12 5.00 30 4.823 0.00% 0.99%13 5.00 30 4.823 0.00% 0.00%
• The simulation model was based on the results obtained from the econometric analyses and the conceptual model of autocatalyst demand.
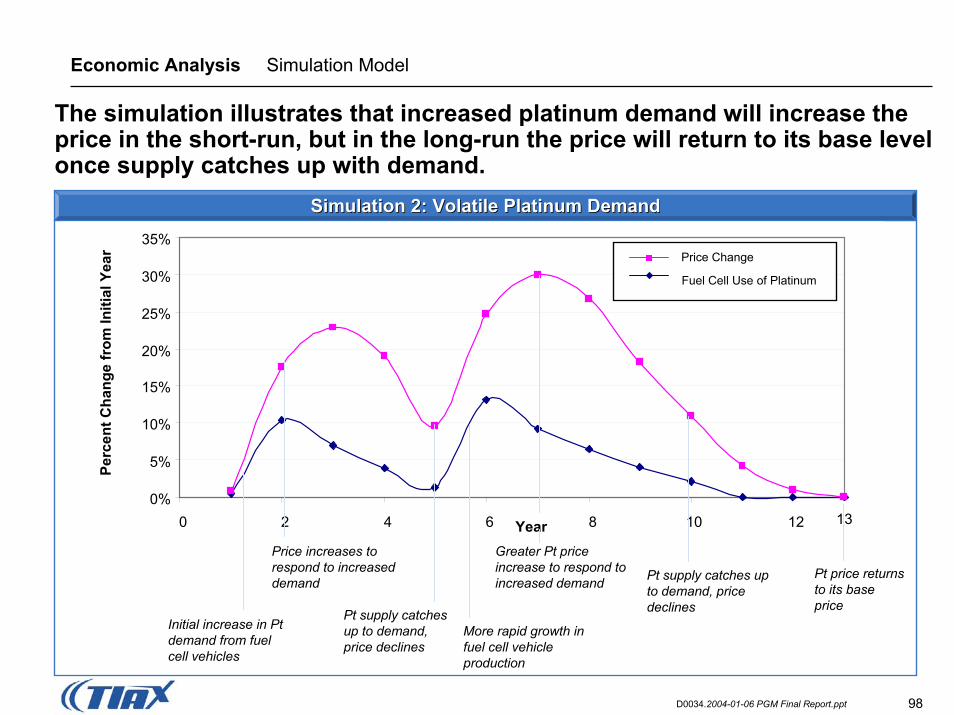
98D0034.2004-01-06 PGM Final Report.ppt
Economic Analysis Simulation Model
The simulation illustrates that increased platinum demand will increase the price in the short-run, but in the long-run the price will return to its base level once supply catches up with demand.
0%
5%
10%
15%
20%
25%
30%
35%
0 2 4 6 8 10 12Year
Perc
ent C
hang
e fr
om In
itial
Yea
r
Initial increase in Pt demand from fuel cell vehicles
Price increases to respond to increased demand
Pt supply catches up to demand, price declines
More rapid growth in fuel cell vehicle production
Greater Pt price increase to respond to increased demand Pt supply catches up
to demand, price declines
Pt price returns to its base price
13
Fuel Cell Use of Platinum
Price Change
Simulation 2: Volatile Platinum DemandSimulation 2: Volatile Platinum Demand
99D0034.2004-01-06 PGM Final Report.ppt
Economic Analysis Simulation Model Conclusions
The simulation model helps to highlight the following issues related to the impact of future FCV demand for platinum on price.
• Future demand for platinum from FCVs could drive up the price of platinum by 20 to 30 percent over its base price.
• A gradual adoption of fuel cell technology would minimize the pressure on platinum market and minimize the impact on platinum prices.
• Price declines over time are due to more elastic long-run supply and demand. The supply side has enough time to increase production and capacity and the demand side has the time to improve technology, to reduce platinum loading, or find alternatives.
100D0034.2004-01-06 PGM Final Report.ppt
Table of Contents
Project Overview
3
4
5 Econometric Modeling
2
Platinum Market Overview
66
1 Executive Summary
Future Demand Scenarios 2005-2050
AppendixAppendix