Embed Size (px)
Citation preview
Plastic debris in the open oceanAndrés Cózara,1, Fidel Echevarríaa, J. Ignacio González-Gordilloa, Xabier Irigoienb,c, Bárbara Úbedaa,Santiago Hernández-Leónd, Álvaro T. Palmae, Sandra Navarrof, Juan García-de-Lomasa, Andrea Ruizg,María L. Fernández-de-Puellesh, and Carlos M. Duartei,j,k,l
aÁrea de Ecología, Facultad de Ciencias del Mar y Ambientales, Universidad de Cádiz, Campus de Excelencia Internacional del Mar, E-11510 Puerto Real, Spain;bRed Sea Research Center, King Abdullah University of Science and Technology, Thuwal 23955-6900, Kingdom of Saudi Arabia; cAZTI, Arrantza etaElikaigintzarako Institutu Teknologikoa, 20110 Pasaia, Spain; dInstituto de Oceanografía y Cambio Global, Universidad de Las Palmas de Gran Canaria,Campus Universitario de Tafira, 35017 Las Palmas de Gran Canaria, Canary Islands, Spain; eFisioaqua, Las Condes, 6513677 Santiago, Chile; fDepartamento deEcología, Universidad de Barcelona, E-08028 Barcelona, Spain; gPakea Bizkaia, 48990 Getxo, Spain; hInstituto Español de Oceanografía, Centro Oceanográficode Baleares, 07015 Palma de Mallorca, Spain; iDepartment of Global Change Research, Instituto Mediterráneo de Estudios Avanzados (Universidad de las IslasBaleares-Consejo Superior de Investigaciones Científicas), 07190 Esporles, Spain; jThe University of Western Australia Oceans Institute and kSchool of PlantBiology, The University of Western Australia, Crawley, WA 6009, Australia; and lFaculty of Marine Sciences, King Abdulaziz University, Jeddah 21589,Kingdom of Saudi Arabia
Edited by David M. Karl, University of Hawaii, Honolulu, HI, and approved June 6, 2014 (received for review August 3, 2013)
There is a rising concern regarding the accumulation of floatingplastic debris in the open ocean. However, the magnitude and thefate of this pollution are still open questions. Using data from theMalaspina 2010 circumnavigation, regional surveys, and previouslypublished reports, we show a worldwide distribution of plasticon the surface of the open ocean, mostly accumulating in theconvergence zones of each of the five subtropical gyres withcomparable density. However, the global load of plastic on theopen ocean surface was estimated to be on the order of tens ofthousands of tons, far less than expected. Our observations ofthe size distribution of floating plastic debris point at importantsize-selective sinks removing millimeter-sized fragments of floatingplastic on a large scale. This sink may involve a combination of fastnano-fragmentation of the microplastic into particles of microns orsmaller, their transference to the ocean interior by food webs andballasting processes, and processes yet to be discovered. Resolvingthe fate of the missing plastic debris is of fundamental importance todetermine the nature and significance of the impacts of plasticpollution in the ocean.
The current period of human history has been referred as thePlastic Age (1). The light weight and durability of plastic
materials make them suitable for a very wide range of prod-ucts. However, the intense consumption and rapid disposal ofplastic products is leading to a visible accumulation of plasticdebris (2). Plastic pollution reaches the most remote areas ofthe planet, including the surface waters of the open ocean.Indeed, high concentrations of floating plastic debris havebeen reported in central areas of the North Atlantic (3) andPacific Oceans (4, 5), but oceanic circulation models suggestpossible accumulation regions in all five subtropical oceangyres (6, 7). The models predict that these large-scale vorticesact as conveyor belts, collecting the floating plastic debris re-leased from the continents and accumulating it into centralconvergence zones.Plastic pollution found on the ocean surface is dominated by
particles smaller than 1 cm in diameter (8), commonly referredto as microplastics. Exposure of plastic objects on the surfacewaters to solar radiation results in their photodegradation, em-brittlement, and fragmentation by wave action (9). However,plastic fragments are considered to be quite stable and highlydurable, potentially lasting hundreds to thousands of years (2).Persistent nano-scale particles may be generated during theweathering of plastic debris, although their abundance has notbeen quantified in ocean waters (9).As the size of the plastic fragments declines, they can be
ingested by a wider range of organisms. Plastic ingestion hasbeen documented from small fish to large mammals (10–12).The most evident effects of plastic ingestion are mechanical [e.g.,gastrointestinal obstruction in seabirds (13)], but plastic frag-ments contain contaminants added during plastic manufacture or
acquired from seawater through sorption processes [e.g., hy-drophobic chemicals (14, 15)]. Recent studies provide evidencethat these contaminants can accumulate in the receiving organ-isms during digestion (14).Our awareness of the significance of plastic pollution in the
ocean is relatively recent, and basic questions remain unresolved.Indeed, the quantity of plastic floating in the ocean and its finaldestination are still unknown (16). Historical time series of surfaceplastic concentration in fixed ocean regions show no significantincreasing trend since the 1980s, despite an increase in productionand disposal (3, 16, 17). These studies suggest that surface watersare not the final destination for buoyant plastic debris in the ocean.Nano-fragmentation, predation, biofouling, or shore depositionhave been proposed as possible mechanisms of removal from thesurface (3, 9, 16).On the basis of samples collected on a circumnavigation cruise
(Malaspina 2010 expedition), on five regional cruises, and avail-able data from recent studies (3–5, 17–19), we aim to provide afirst-order approximation of the load of plastic debris in surfacewaters of the open ocean. We also examine the size distributionof floating plastic debris collected along the circumnavigation toprovide insight into the nature of possible losses of floating plasticfrom the open ocean surface.
Significance
High concentrations of floating plastic debris have been re-ported in remote areas of the ocean, increasing concern aboutthe accumulation of plastic litter on the ocean surface. Sincethe introduction of plastic materials in the 1950s, the globalproduction of plastic has increased rapidly and will continue inthe coming decades. However, the abundance and the distri-bution of plastic debris in the open ocean are still unknown,despite evidence of affects on organisms ranging from smallinvertebrates to whales. In this work, we synthetize data col-lected across the world to provide a global map and a first-order approximation of the magnitude of the plastic pollutionin surface waters of the open ocean.
Author contributions: A.C., F.E., J.I.G.-G., X.I., and C.M.D. designed research; A.C., F.E., J.I.G.-G., X.I., B.U., S.H.-L., A.T.P., S.N., J.G.-d.-L., A.R., M.L.F.-d.-P., and C.M.D. performedresearch; A.C., X.I., B.U., S.N., J.G.-d.-L., and M.L.F.-d.-P. contributed new reagents/analytictools; A.C., J.I.G.-G., B.U., A.T.P., S.N., and J.G.-d.-L. analyzed data; and A.C., F.E., X.I., andC.M.D. wrote the paper.
The authors declare no conflict of interest.
This article is a PNAS Direct Submission.
Freely available online through the PNAS open access option.1To whom correspondence should be addressed. E-mail: [email protected].
This article contains supporting information online at www.pnas.org/lookup/suppl/doi:10.1073/pnas.1314705111/-/DCSupplemental.
www.pnas.org/cgi/doi/10.1073/pnas.1314705111 PNAS | July 15, 2014 | vol. 111 | no. 28 | 10239–10244
ENVIRONMEN
TAL
SCIENCE
S
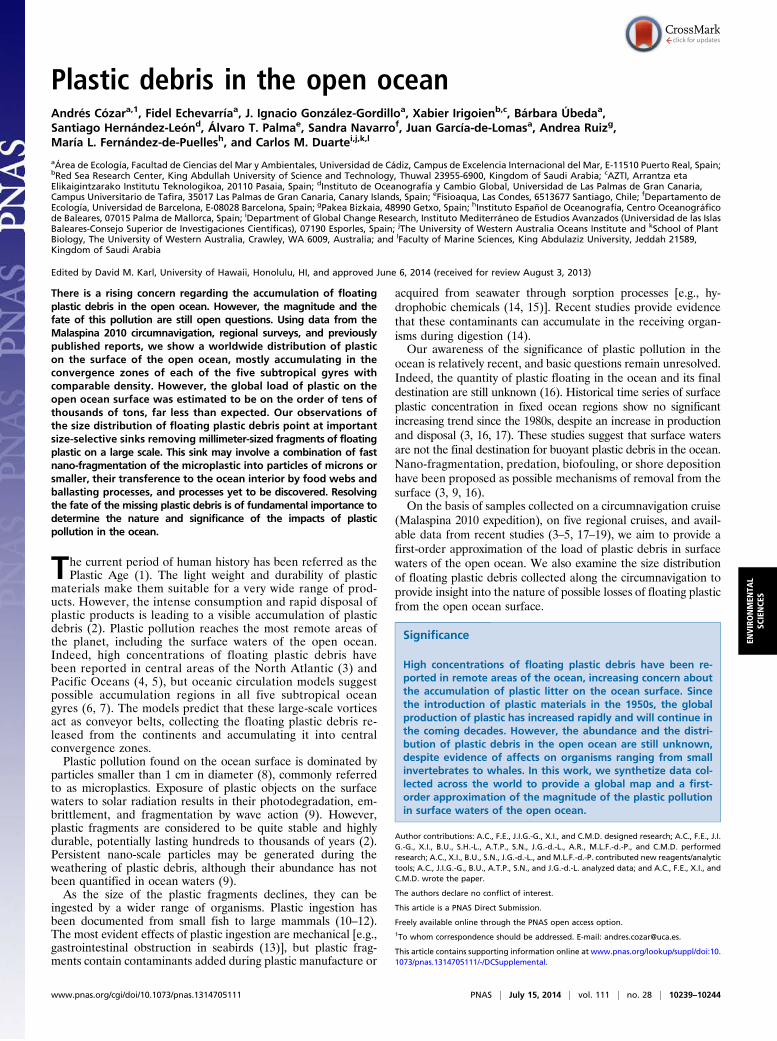
Results and DiscussionThe dataset assembled here included 3,070 total samples col-lected around the world (SI Appendix, Table S1). The frequencyof occurrence of plastic debris in the surface samples of the openocean was considerably high (88%; Fig. 1). Nevertheless, the con-centration of plastic ranged broadly, spanning over four orders ofmagnitude across the open ocean. The distribution pattern agreedwith those predicted from ocean surface circulation models (6, 7),confirming the accumulation of plastic debris in the convergencezone of each of the five large subtropical gyres. Using the high andlow ranges of spatial concentrations measured within 15 majorconvergence/divergence zones in the global ocean (Fig. 2), we es-timate the amount of plastic in the open-ocean surface between7,000 and 35,000 tons (Table 1). The plastic concentrations persurface area were comparable across each of the five accumulationzones, although the North Pacific Ocean contributed importantlyto the global plastic load (between 33 and 35%), mainly owing tothe size of this gyre. The plastic load in the North Pacific Oceancould be related to the high human population on the eastern coastof the Asian continent, the most densely populated coast in theworld, with one-third of the global coastal population (20). Indeed,the surface plastic concentrations measured in the KuroshioCurrent, the western arm of the North Pacific Gyre, can becomeexceptionally high, including the highest reported for nonaccu-mulation regions (21, 22).Continental plastic litter enters the ocean largely through
storm-water runoff, flowing into watercourses or directly dis-charged into coastal waters. Estimating the plastic input to theocean is a complex task. In the 1970s, the US National Academyof Sciences estimated that the flux of plastic to the world oceanswas 45,000 tons per year (23), equivalent to 0.1% of the globalproduction of plastic (24). Since then, the annual productionof plastic has quintupled (265 million tons per year in 2010).Around 50% of the produced plastic is buoyant (24), and 60–64%of the terrestrial load of floating plastic to the sea is estimated tobe exported from coastal to open-ocean waters (7). Despite thepossible inaccuracies of these numbers, a conservative first-orderestimate of the floating plastic released into the open ocean from
the 1970s (106 tons) is 100-fold larger than our estimate of thecurrent load of plastic stored in the ocean.Examination of the size distribution of plastic debris on the
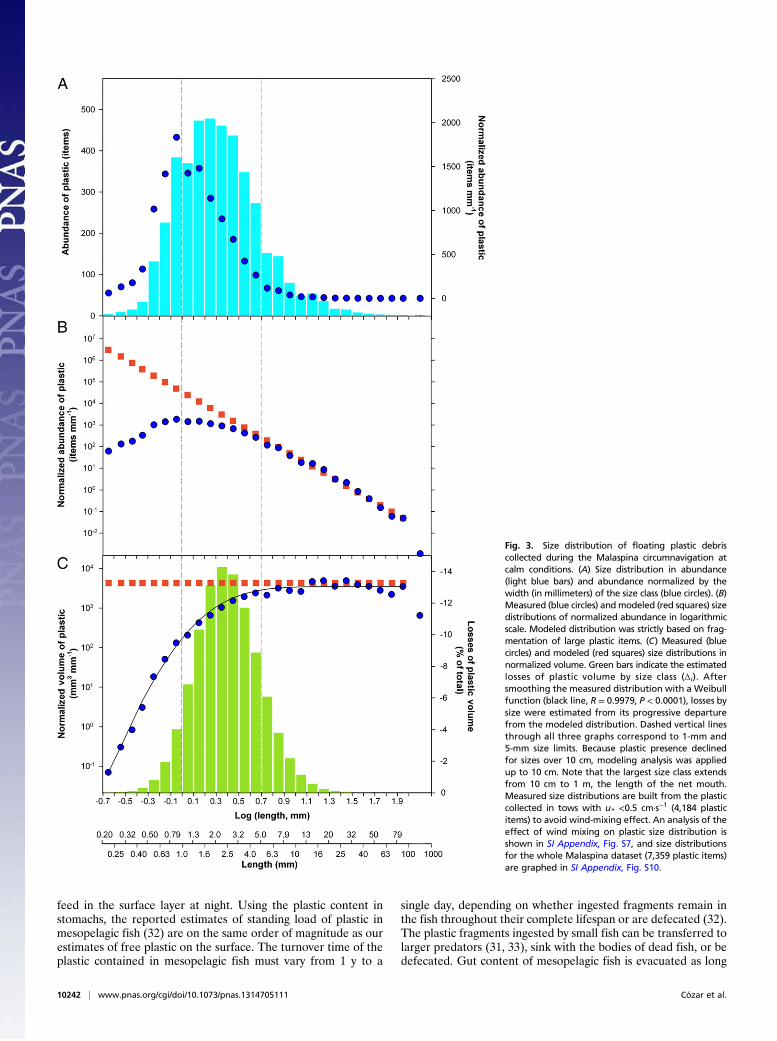
ocean surface shows a peak in abundance of fragments around2 mm and a pronounced gap below 1 mm (Fig. 3A). Similar pat-terns are found when the data are analyzed separately by oceanbasin (SI Appendix, Fig. S6). The predominance of fragments inan intermediate interval (1–5 mm) of the plastic size spectra isalso a general feature for the oceanic size distributions reportedin the past (5, 8). However, experiments on the fragmentation ofplastic materials show that the size distribution of fragmentsgenerated by a plastic object conforms to a fractal process,spreading over several orders of magnitude and below the sizerange in our study (25, 26). Cracking patterns of photodegradedplastics are observed at multiple scales, from centimeters to fewmicrons (9). Therefore, the progressive fragmentation of theplastic objects into more and smaller pieces should lead toa gradual increase of fragments toward small sizes. In steadystate, the abundance–size distribution should follow a power law,with a scaling exponent equal to the spatial dimension of theplastic objects (i.e., 3, SI Appendix, Fig. S8). Likewise, a stableinput and fragmentation of large plastic objects should result ina steady volume–size distribution. A model based on fragmen-tation, without additional losses, gave an abundance–size distri-bution similar to that sampled, which showed a power exponentof 2.93 ± 0.08, similar to the expected value, but only for sizeclasses larger than 5 mm. Below 5 mm, the observed size dis-tribution diverged from that expected from the model (Fig. 3 Band C). Because plastic input is progressively transferred towardsmall-size classes by fragmentation, this divergence results fromthe gradual accumulation of plastic losses. An assessment ofprogressive departures of the observed distribution from a con-servative distribution indicates that losses are concentratedaround sizes of 2.2 mm (Fig. 3C). Hence, the paucity of frag-ments in the lowest part of the size distribution would be ex-plained by the interruption of the downward transfer of plastic atthe millimeter scale, unless there is an abrupt nano-fragmenta-tion of the millimeter-sized particles directly into pieces of
Fig. 1. Concentrations of plastic debris in surface waters of the global ocean. Colored circles indicate mass concentrations (legend on top right). The map showsaverage concentrations in 442 sites (1,127 surface net tows). Gray areas indicate the accumulation zones predicted by a global surface circulation model (6). Darkand light gray represent inner and outer accumulation zones, respectively; white areas are predicted as nonaccumulation zones. Data sources are described in SIAppendix, Table S1. Plastic concentrations along the Malaspina circumnavigation and a latitudinal gradient are graphed in SI Appendix, Figs. S4 and S5.
10240 | www.pnas.org/cgi/doi/10.1073/pnas.1314705111 Cózar et al.
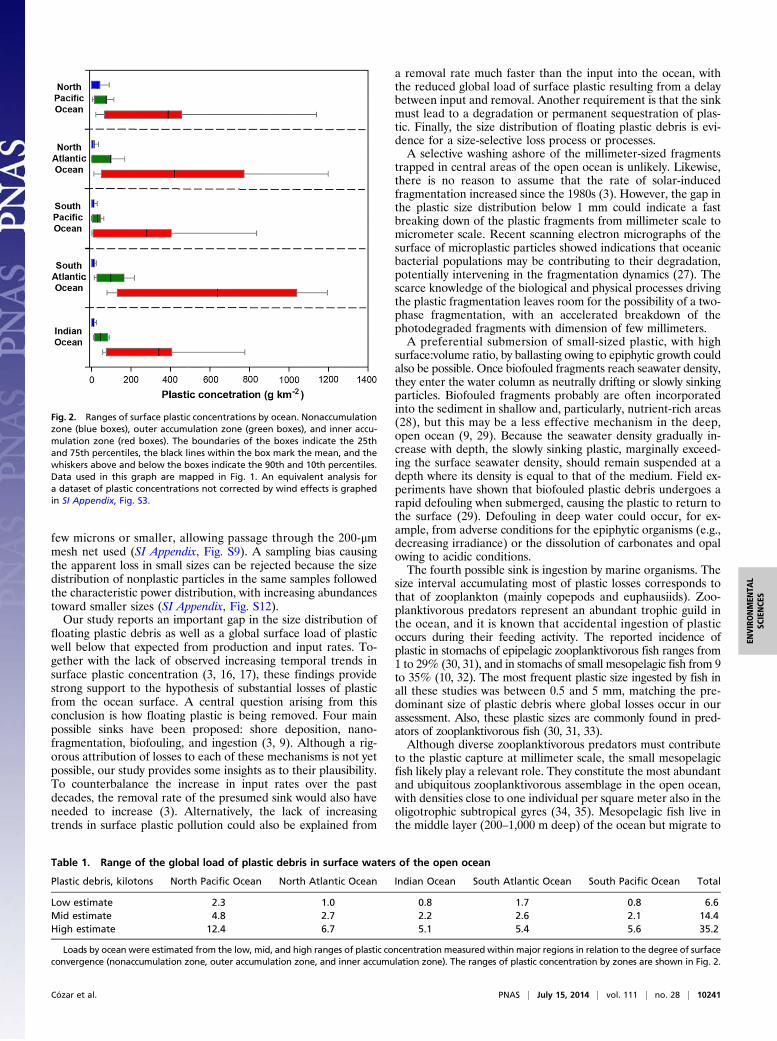
few microns or smaller, allowing passage through the 200-μmmesh net used (SI Appendix, Fig. S9). A sampling bias causingthe apparent loss in small sizes can be rejected because the sizedistribution of nonplastic particles in the same samples followedthe characteristic power distribution, with increasing abundancestoward smaller sizes (SI Appendix, Fig. S12).Our study reports an important gap in the size distribution of
floating plastic debris as well as a global surface load of plasticwell below that expected from production and input rates. To-gether with the lack of observed increasing temporal trends insurface plastic concentration (3, 16, 17), these findings providestrong support to the hypothesis of substantial losses of plasticfrom the ocean surface. A central question arising from thisconclusion is how floating plastic is being removed. Four mainpossible sinks have been proposed: shore deposition, nano-fragmentation, biofouling, and ingestion (3, 9). Although a rig-orous attribution of losses to each of these mechanisms is not yetpossible, our study provides some insights as to their plausibility.To counterbalance the increase in input rates over the pastdecades, the removal rate of the presumed sink would also haveneeded to increase (3). Alternatively, the lack of increasingtrends in surface plastic pollution could also be explained from
a removal rate much faster than the input into the ocean, withthe reduced global load of surface plastic resulting from a delaybetween input and removal. Another requirement is that the sinkmust lead to a degradation or permanent sequestration of plas-tic. Finally, the size distribution of floating plastic debris is evi-dence for a size-selective loss process or processes.A selective washing ashore of the millimeter-sized fragments
trapped in central areas of the open ocean is unlikely. Likewise,there is no reason to assume that the rate of solar-inducedfragmentation increased since the 1980s (3). However, the gap inthe plastic size distribution below 1 mm could indicate a fastbreaking down of the plastic fragments from millimeter scale tomicrometer scale. Recent scanning electron micrographs of thesurface of microplastic particles showed indications that oceanicbacterial populations may be contributing to their degradation,potentially intervening in the fragmentation dynamics (27). Thescarce knowledge of the biological and physical processes drivingthe plastic fragmentation leaves room for the possibility of a two-phase fragmentation, with an accelerated breakdown of thephotodegraded fragments with dimension of few millimeters.A preferential submersion of small-sized plastic, with high
surface:volume ratio, by ballasting owing to epiphytic growth couldalso be possible. Once biofouled fragments reach seawater density,they enter the water column as neutrally drifting or slowly sinkingparticles. Biofouled fragments probably are often incorporatedinto the sediment in shallow and, particularly, nutrient-rich areas(28), but this may be a less effective mechanism in the deep,open ocean (9, 29). Because the seawater density gradually in-crease with depth, the slowly sinking plastic, marginally exceed-ing the surface seawater density, should remain suspended at adepth where its density is equal to that of the medium. Field ex-periments have shown that biofouled plastic debris undergoes arapid defouling when submerged, causing the plastic to return tothe surface (29). Defouling in deep water could occur, for ex-ample, from adverse conditions for the epiphytic organisms (e.g.,decreasing irradiance) or the dissolution of carbonates and opalowing to acidic conditions.The fourth possible sink is ingestion by marine organisms. The
size interval accumulating most of plastic losses corresponds tothat of zooplankton (mainly copepods and euphausiids). Zoo-planktivorous predators represent an abundant trophic guild inthe ocean, and it is known that accidental ingestion of plasticoccurs during their feeding activity. The reported incidence ofplastic in stomachs of epipelagic zooplanktivorous fish ranges from1 to 29% (30, 31), and in stomachs of small mesopelagic fish from 9to 35% (10, 32). The most frequent plastic size ingested by fish inall these studies was between 0.5 and 5 mm, matching the pre-dominant size of plastic debris where global losses occur in ourassessment. Also, these plastic sizes are commonly found in pred-ators of zooplanktivorous fish (30, 31, 33).Although diverse zooplanktivorous predators must contribute
to the plastic capture at millimeter scale, the small mesopelagicfish likely play a relevant role. They constitute the most abundantand ubiquitous zooplanktivorous assemblage in the open ocean,with densities close to one individual per square meter also in theoligotrophic subtropical gyres (34, 35). Mesopelagic fish live inthe middle layer (200–1,000 m deep) of the ocean but migrate to
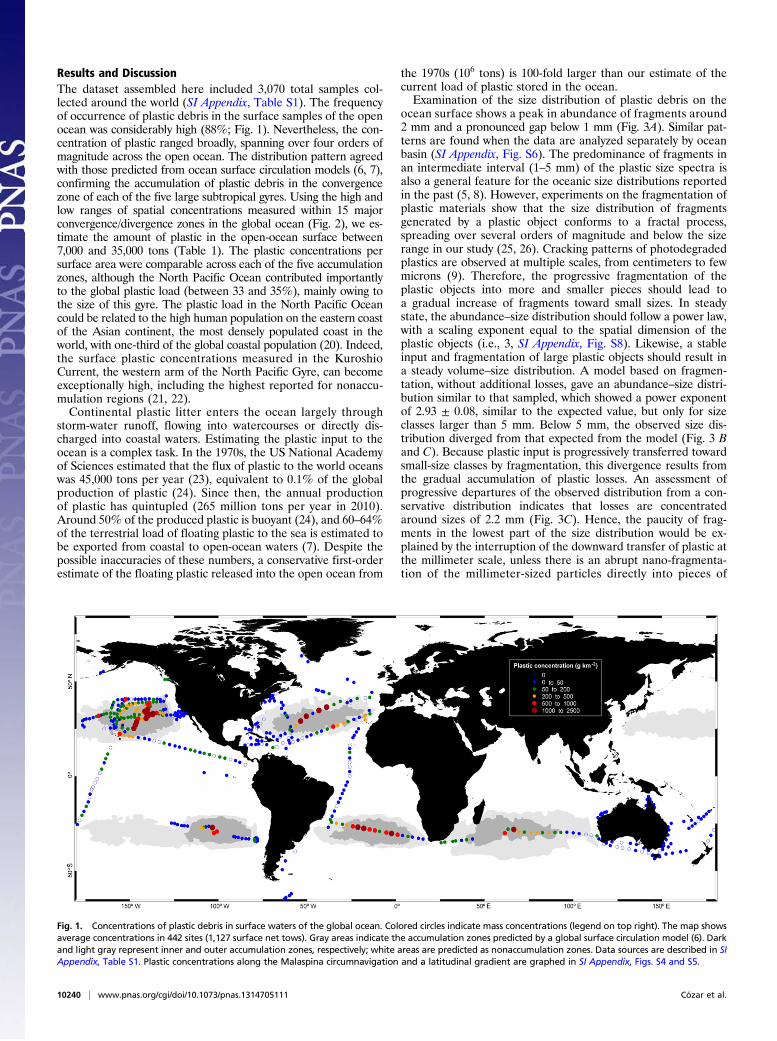
Fig. 2. Ranges of surface plastic concentrations by ocean. Nonaccumulationzone (blue boxes), outer accumulation zone (green boxes), and inner accu-mulation zone (red boxes). The boundaries of the boxes indicate the 25thand 75th percentiles, the black lines within the box mark the mean, and thewhiskers above and below the boxes indicate the 90th and 10th percentiles.Data used in this graph are mapped in Fig. 1. An equivalent analysis fora dataset of plastic concentrations not corrected by wind effects is graphedin SI Appendix, Fig. S3.
Table 1. Range of the global load of plastic debris in surface waters of the open ocean
Plastic debris, kilotons North Pacific Ocean North Atlantic Ocean Indian Ocean South Atlantic Ocean South Pacific Ocean Total
Low estimate 2.3 1.0 0.8 1.7 0.8 6.6Mid estimate 4.8 2.7 2.2 2.6 2.1 14.4High estimate 12.4 6.7 5.1 5.4 5.6 35.2
Loads by ocean were estimated from the low, mid, and high ranges of plastic concentration measured within major regions in relation to the degree of surfaceconvergence (nonaccumulation zone, outer accumulation zone, and inner accumulation zone). The ranges of plastic concentration by zones are shown in Fig. 2.
Cózar et al. PNAS | July 15, 2014 | vol. 111 | no. 28 | 10241
ENVIRONMEN
TAL
SCIENCE
S
feed in the surface layer at night. Using the plastic content instomachs, the reported estimates of standing load of plastic inmesopelagic fish (32) are on the same order of magnitude as ourestimates of free plastic on the surface. The turnover time of theplastic contained in mesopelagic fish must vary from 1 y to a
single day, depending on whether ingested fragments remain inthe fish throughout their complete lifespan or are defecated (32).The plastic fragments ingested by small fish can be transferred tolarger predators (31, 33), sink with the bodies of dead fish, or bedefecated. Gut content of mesopelagic fish is evacuated as long
Fig. 3. Size distribution of floating plastic debriscollected during the Malaspina circumnavigation atcalm conditions. (A) Size distribution in abundance(light blue bars) and abundance normalized by thewidth (in millimeters) of the size class (blue circles). (B)Measured (blue circles) andmodeled (red squares) sizedistributions of normalized abundance in logarithmicscale. Modeled distribution was strictly based on frag-mentation of large plastic items. (C) Measured (bluecircles) and modeled (red squares) size distributions innormalized volume. Green bars indicate the estimatedlosses of plastic volume by size class (Δi). Aftersmoothing the measured distribution with a Weibullfunction (black line, R = 0.9979, P < 0.0001), losses bysize were estimated from its progressive departurefrom the modeled distribution. Dashed vertical linesthrough all three graphs correspond to 1-mm and5-mm size limits. Because plastic presence declinedfor sizes over 10 cm, modeling analysis was appliedup to 10 cm. Note that the largest size class extendsfrom 10 cm to 1 m, the length of the net mouth.Measured size distributions are built from the plasticcollected in tows with u* <0.5 cm·s−1 (4,184 plasticitems) to avoid wind-mixing effect. An analysis of theeffect of wind mixing on plastic size distribution isshown in SI Appendix, Fig. S7, and size distributionsfor the whole Malaspina dataset (7,359 plastic items)are graphed in SI Appendix, Fig. S10.
10242 | www.pnas.org/cgi/doi/10.1073/pnas.1314705111 Cózar et al.
viscous feces that assume spheroid shapes while sinking at highvelocities (around 1,000 m·d−1) (36). Hence, microplastic fragmentscould also reach the bottom via defecation, a proposition that re-quires further quantitative testing.Surface losses of large plastic objects by sinking are un-
accounted for in our fragmentation model (Fig. 3). However,these large objects, included those in the uppermost part of ourplastic size spectrum, are commonly observed on the seafloor(37) and likely contribute significantly to reduce the global loadat the surface. Large plastic objects undergo particular bio-fouling because they can host a wide size range of organisms andoften show large cavities (e.g., bags, bottles) that facilitate theirballasting and subsequent sinking.In the present study, we confirm the gathering of floating
plastic debris, mainly microplastics, in all subtropical gyres. Thecurrent plastic load in surface waters of the open ocean wasestimated in the order of tens of thousands of tons (10,000–40,000). This estimate could be greatly improved through joiningsampling efforts particularly in semiclosed seas (e.g., Mediter-ranean) and the southern hemisphere, where existing data arescarce. Nevertheless, even our high estimate of plastic load,based on the 90th percentile of the regional concentrations, isconsiderably lower than expected, by orders of magnitude. Ourobservations also show that large loads of plastic fragments withsizes from microns to some millimeters are unaccounted for inthe surface loads. The pathway and ultimate fate of the missingplastic are as yet unknown. We cannot rule out either of theproposed sink processes or the operation of sink processes yet tobe identified. Indeed, the losses inferred from our assessmentlikely involve a combination of multiple sinks. Missing micro-plastic may derive from nano-fragmentation processes, renderingthe very small pieces undetectable to convectional sampling nets,and/or may be transferred to the ocean interior. The abundanceof nano-scale plastic particles has still not been quantified in theocean (9), and the measurements of microplastic in deep oceanare very scarce, although available observations point to a sig-nificant abundance of microplastic particles in deep sediments(38), which invokes a mechanism for the vertical transport ofplastic particles, such as biofouling or ingestion. Because plasticinputs into the ocean will probably continue, and even increase,resolving the ultimate pathways and fate of these debris is a matterof urgency.
Materials and MethodsFrom December 2010 to July 2011 the Spanish circumnavigation expeditionMalaspina 2010 sampled surface plastic pollution at 141 sites across theoceans. Floating plastic was collected with a neuston net (1.0- × 0.5-mmouth,200-μm mesh) towed at 2–3 knots for periods 10–15 min (total tows 225).Tow areas were calculated from the readings of a flowmeter in the mouth ofthe net. Wind speed and water surface density were measured during eachtow to estimate average friction velocity in water (u*) (39).
The material collected by the net was mixed with 0.2-mm-filtered sea-water. Subsequently, floating plastic debris was carefully picked out from thewater surface with the aid of a dissecting microscope. This examination wasrepeated at least twice to ensure the detection of all of the smallest plasticparticles. To confirm the plastic nature of the material collected in theexaminations, Raman spectroscopy was applied to a random subset of par-ticles (n = 67). The analysis confirmed the identity of all plastic particles, andpolyethylene was found to be the most common polymer type. The vastmajority of the plastic items consisted of fragments of larger objects, andindustrial resin pellets represented only a small fraction (<2%) of all en-countered items. Textile fibers were found only occasionally and were ex-cluded from the analysis because they could be airborne contaminationfrom clothing during the sampling or processing (31).
Plastics extracted from the seawater samples were washed with deionizedwater and dried at room temperature. The total dry weight of the plasticscollected in each tow was recorded. The maximum linear length (l) of theplastic items was measured by high-resolution scanning (SI Appendix, Fig.S11) and the image processing Zooimage software (www.sciviews.org). Al-ternatively, excessively large plastic objects were measured with a ruler.
Overall, 7,359 plastic items were measured and separated in 28 size classes tobuild a size distribution. Size limits of the bins followed a 0.1-log series of l.The width of the uppermost bin extended from 10 cm to the length of thenet mouth (100 cm) to account for all sizes that could be collected by thenet. The trapping efficiency of fine particles by the mesh was tested fromthe analysis of the size distribution of nonplastic particles in six tows evenlydistributed along the circumnavigation (SI Appendix, Fig. S12). Once theplastic particles were picked out from the samples, the size distribution ofnonplastic particles was measured by the same methods.
Wind stress can extend the vertical distribution of floating plastic debrisinto the surface mixing layer, resulting in underestimation of the plasticconcentrations measured by the surface tows (0.25 m deep). Thus, the in-tegrated plastic abundance from the surface to the base of the wind-mixedlayer (generally <25 m) was estimated with a model dependent on u* andthe numerical concentrations measured in the surface tows (39). Wind-cor-rected abundances were converted to mass concentrations using a correla-tion based on simultaneous measurements of total mass and abundance ofplastic in 570 worldwide tows (SI Appendix, Fig. S13).
Size-Distribution Analysis. A theoretical size distribution of plastic derivedfrom fragmentation was modeled by assuming steady state (large-objectsinput = small-fragments output, below 0.2 mm). Given that the plastic abun-dance in a given size class depends on the fragmentation of larger plasticobjects already present, we selected a size class with relatively large plastic(reference bin) and projected the plastic amount measured in this bin towardsmaller and larger size classes (onward and backward in time). Therefore, thenormalized abundance (divided by the width of the size-class interval) of thesize class i derived from steady fragmentation was modeled as
Afi =
Aref · α · l3refα · l3i
=Aref · l3ref
l3i:
Weused a standard shape for the plastic fragments having the three principalaxes proportional to l. Thus, α · l3i accounts for the mean volume of thefragments of i, with α being a shape factor and li the nominal length for theclass i, set at the bin midpoint. Aref is the normalized abundance measuredin the reference bin (i = ref). The 20- to 25-mm class was selected as reference,although similar results were obtained by selecting other large-size classes.
The normalized volume in each size class derived from fragmentation wasmodeled as Vf
i =Afi · α · l
3i =Aref · α · l3ref , being α = 0.1, a value corresponding
to flat-shaped volume. Because the steady fragmentation of the large-plasticinput results in an even volume–size distribution, deviations of the observedsize distribution from a conservative distribution can be related to changes inthe fragmentation dynamics, inputs of small plastics, or losses (SI Appendix,Fig. S9). Estimating volumes from observed abundances ðV*
i =A*i · α · l3i Þ, andafter smoothing the resulting volume–size distribution to remove small ir-regularities, the deviations from a conservative distribution (Δi, expressed aspercentage of total) were calculated as
Δi =V*i−1 −V*
iPni=1
���V*i−1 −V*
i
���=
�A*i−1 · l
3i−1
�−�A*i · l3i
�
Pni=1
����Ai−1 · l3i−1
�−�Ai · l3i
����,
where i = 1, 2, . . ., n, with n being the lowest size class (0.2–0.25 mm). Thedenominator accounts for the total deviations accumulated across the entiresize range studied. Negative values of Δi are related to net plastic losses andpositive values to plastic accumulations. Note that Δi is independent of thestandard plastic shape (α value) used in the computations. Possible variationsof α with size were unable to induce changes in the volume–size distributionenough to explain the gap found in small sizes, owing to the extremescarceness of plastic below 1 mm and the geometrical constrain for α, get-ting the maximum at 0.52 (spherical shape). Observed plastic abundance inthe lowest part of the size spectrum was four orders of magnitude lowerthan expected from fragmentation (Fig. 3).
The size-distribution analysis is a useful tool to constrain the possibledynamics of marine plastic pollution. Nevertheless, the mechanisms leadingto the observed plastic size distributions still are not entirely understood anddeserve further attention, resolving the size dependence of the sink/sourcesprocesses, as well as testing the framework proposed here (SI Appendix, Fig.S9) to identify additional processes.
Spatial Analysis. To analyze the global distribution of floating plastic, datafrom the Malaspina circumnavigation were combined with additional re-gional surveys and recent (from 2006 to date) measurements reported byother researchers after data standardization (SI Appendix, Table S1).
Cózar et al. PNAS | July 15, 2014 | vol. 111 | no. 28 | 10243
ENVIRONMEN
TAL
SCIENCE
S
Concentrations of plastic per surface-water volume were converted to con-centrations per surface area from the tow depth, determined according tonet type and mouth dimensions (one-half mouth height for neuston nets,three-fourths mouth height for manta nets). Plastic concentrations mea-sured with mesh sizes larger than 0.2 mm were multiplied by a correctionfactor derived from the plastic size distribution measured in the Malaspinacircumnavigation. For 0.3-, 0.5-, and 1.0-mm mesh sizes, numerical un-derestimation was estimated at 0.4, 2.7, and 21.3%, and mass un-derestimation at 0.0, 0.4, and 5.0%, respectively. Data reported in numericalconcentrations were converted to mass concentrations by using the globalrelationship found between total mass and abundance (SI Appendix, Fig.S13). For data reported without wind correction (3–5, 18), we use satellitewinds from the CCMP database (http://podaac.jpl.nasa.gov) to discard samplescollected with winds speeds larger than 5 m·s−1 (u* ∼0.6 cm·s−1), the thresholdabove which the effects of wind stress can be significant (39).
The range of the global plastic load in the surface ocean was estimatedfrom the concentration ranges measured over 15 major zones in relationto the degree of surface convergence and by using two different sets ofmeasurements, a wind-corrected dataset and a noncorrected dataset. Usinga global circulation model (6), nonaccumulation, outer accumulation, andinner accumulation zones were delimited in each ocean basin to reduce theinaccuracies derived from an uneven distribution of measurements. In ad-dition, plastic measurements were spatially averaged over grid cells of 2°in both latitude and longitude to avoid overweight of areas with high
sampling frequency. Overall, 442 grid cells (1,127 net tows) were included inthe wind-corrected dataset (Fig. 1 and SI Appendix, Table S1). Midrangeregional concentrations were calculated from the averaging of the wind-corrected plastic concentrations within each major zone. High-range re-gional concentrations were calculated from the 90th percentile. We useda wide confidence interval for the plastic load estimate to address vari-ability and possible inaccuracies in the spatial concentrations of plastic.Low-range concentrations were calculated from the averaging of the di-rect measurements of surface concentrations, without wind correction ordiscards by high wind mixing (noncorrected dataset: 851 grid cells, 3,070net tows; SI Appendix, Figs. S2 and S3). Global plastic loads in the open-ocean surface were estimated from high, mid, and low regional concen-trations and surface areas.
ACKNOWLEDGMENTS. We thank Pakea Bizkaia and the Chilean Navy, whichcontributed to the sample collection, and K. L. Law, M. C. Goldstein, M. J. Doyle,M. Eriksen, J. Reisser, and their collaborators for their available data. We alsothank S. Loiselle and J. Ruiz for his useful suggestions in writing the paper. Thisresearch was funded by the Spanish Ministry of Economy and Competitivenessthrough the Malaspina 2010 expedition project (Consolider-Ingenio 2010,CSD2008-00077) and the Migrants and Active Flux in the Atlantic Ocean project(CTM2012-39587-C04-01). Original data reported in this paper are freely avail-able at http://metamalaspina.imedea.uib-csic.es/geonetwork. This is Campusde Excelencia Internacional del Mar (CEIMAR) Publication 58.
1. Yarsley VE, Couzens EG (1945) Plastics (Penguin, London).2. Barnes DKA, Galgani F, Thompson RC, Barlaz M (2009) Accumulation and fragmen-
tation of plastic debris in global environments. Philos Trans R Soc Lond B Biol Sci364(1526):1985–1998.
3. Law KL, et al. (2010) Plastic accumulation in the North Atlantic subtropical gyre. Sci-ence 329(5996):1185–1188.
4. Goldstein MC, Rosenberg M, Cheng L (2012) Increased oceanic microplastic debrisenhances oviposition in an endemic pelagic insect. Biol Lett 8(5):817–820.
5. Eriksen M, et al. (2013) Plastic pollution in the South Pacific subtropical gyre. MarPollut Bull 68(1–2):71–76.
6. Maximenko N, Hafner J, Niiler P (2012) Pathways of marine debris derived from tra-jectories of Lagrangian drifters. Mar Pollut Bull 65(1–3):51–62.
7. Lebreton LCM, Greer SD, Borrero JC (2012) Numerical modelling of floating debris inthe world’s oceans. Mar Pollut Bull 64(3):653–661.
8. Hidalgo-Ruz V, Gutow L, Thompson RC, Thiel M (2012) Microplastics in the marineenvironment: A review of the methods used for identification and quantification.Environ Sci Technol 46(6):3060–3075.
9. Andrady AL (2011) Microplastics in the marine environment. Mar Pollut Bull 62(8):1596–1605.
10. Boerger CM, Lattin GL, Moore SL, Moore CJ (2010) Plastic ingestion by planktivorousfishes in the North Pacific Central Gyre. Mar Pollut Bull 60(12):2275–2278.
11. Choy CA, Drazen JC (2013) Plastic for dinner? Observations of frequent debris in-gestion by pelagic predatory fishes from the central North Pacific. Mar Ecol Prog Ser485:155–163.
12. de Stephanis R, Giménez J, Carpinelli E, Gutierrez-Exposito C, Cañadas A (2013) Asmain meal for sperm whales: Plastics debris. Mar Pollut Bull 69(1–2):206–214.
13. Azzarello MY, Van-Vleet ES (1987) Marine birds and plastic pollution. Mar Ecol ProgSer 37:295–303.
14. Teuten EL, et al. (2009) Transport and release of chemicals from plastics to the en-vironment and to wildlife. Philos Trans R Soc Lond B Biol Sci 364(1526):2027–2045.
15. Hirai H, et al. (2011) Organic micropollutants in marine plastics debris from the openocean and remote and urban beaches. Mar Pollut Bull 62(8):1683–1692.
16. Thompson RC, et al. (2004) Lost at sea: Where is all the plastic? Science 304(5672):838.17. Law KL, et al. (2014) Distribution of surface plastic debris in the eastern pacific ocean
from an 11-year data set. Environ Sci Technol 48(9):4732–4738.18. Doyle MJ, Watson W, Bowlin NM, Sheavly SB (2011) Plastic particles in coastal pelagic
ecosystems of the Northeast Pacific ocean. Mar Environ Res 71(1):41–52.19. Reisser J, et al. (2013) Marine plastic pollution in waters around Australia: Charac-
teristics, concentrations, and pathways. PLoS ONE 8(11):e80466.20. Center for International Earth Science Information Network (2012) National Ag-
gregates of Geospatial Data: Population, Landscape and Climate Estimates Version 3(National Aeronautics and Space Administration Socioeconomic Data and Applica-tions Center, Palisades, NY). Available at http://sedac.ciesin.columbia.edu/data/set/nagdc-population-landscape-climate-estimates-v3. Accessed October 16, 2012.
21. Day RH, Shaw DG, Ignell SE (1990) The quantitative distribution and characteristics ofneuston plastic in the North Pacific Ocean, 1985–88. Proceedings of the 2nd In-ternational Conference on Marine Debris, eds Shomura RS, Godfrey ML (NationalOceanic and Atmospheric Administration, Honolulu), pp 247–266.
22. Yamashita R, Tanimura A (2007) Floating plastic in the Kuroshio Current area,western North Pacific Ocean. Mar Pollut Bull 54(4):485–488.
23. National Academy of Sciences (1975) Assessing Potential Ocean Pollutants: A Reportof the Study Panel on Assessing Potential Ocean Pollutants to the Ocean Affairs Board(National Research Council, Washington, DC).
24. Association of Plastic Manufacturers (2011) Plastics – the Facts 2011: An analysis ofEuropean Plastic Production, Demand and Recovery for 2010 (Plastic Europe, Brussels).
25. Timár G, Blömer J, Kun F, Herrmann HJ (2010) New universality class for the frag-mentation of plastic materials. Phys Rev Lett 104(9):095502.
26. Kishimura H, Noguchi D, Preechasupanya W, Matsumoto H (2013) Impact fragmen-tation of polyurethane and polypropylene cylinder. Physica A 392(22):5574–5580.
27. Zettler ER, Mincer TJ, Amaral-Zettler LA (2013) Life in the “plastisphere”: Microbialcommunities on plastic marine debris. Environ Sci Technol 47(13):7137–7146.
28. Vianello A, et al. (2013) Microplastic particles in sediments of Lagoon of Venice, Italy:First observations on occurrence, spatial patterns and identification. Estuar CoastShelf Sci 130:54–61.
29. Andrady AL, Song Y (1991) Fouling of floating plastic debris under Biscayne Bay ex-posure conditions. Mar Pollut Bull 22(12):117–122.
30. Lusher AL, McHugh M, Thompson RC (2013) Occurrence of microplastics in the gas-trointestinal tract of pelagic and demersal fish from the English Channel. Mar PollutBull 67(1–2):94–99.
31. Foekema EM, et al. (2013) Plastic in north sea fish. Environ Sci Technol 47(15):8818–8824.
32. Davison P, Asch RG (2011) Plastic ingestion by mesopelagic fishes in the North PacificSubtropical Gyre. Mar Ecol Prog Ser 432:173–180.
33. Eriksson C, Burton H (2003) Origins and biological accumulation of small plasticparticles in fur seals from Macquarie Island. Ambio 32(6):380–384.
34. Lam V, Pauly D (2005) Mapping the global biomass of mesopelagic fishes. Sea AroundUs Proj Newsl 30:4.
35. Irigoien X, et al. (2014) Large mesopelagic fishes biomass and trophic efficiency in theopen ocean. Nat Commun 5:3271.
36. Robison BH, Bailey TG (1981) Sinking rates and dissolution of midwater fish fecalmatter. Mar Biol 65:135–142.
37. Pham CK, et al. (2014) Marine litter distribution and density in European seas, fromthe shelves to deep basins. PLoS ONE 9(4):e95839.
38. Van Cauwenberghe L, Vanreusel A, Mees J, Janssen CR (2013) Microplastic pollutionin deep-sea sediments. Environ Pollut 182:495–499.
39. Kukulka T, Proskurowski G, Morét-Ferguson S, Meyer DW, Law KL (2012) The effect ofwind mixing on the vertical distribution of buoyant plastic debris. Geophys Res Lett39(7):L07601.
10244 | www.pnas.org/cgi/doi/10.1073/pnas.1314705111 Cózar et al.