Embed Size (px)
Citation preview
Planning Level Study for AlternativeSurface Water Pipeline Routing inMontgomery CountyMay 2008


May 2008 Planning Level Study for Alternative Surface Water Pipeline Routing in Montgomery County Lone Star Groundwater Conservation District and San Jacinto River Authority
page i
Table of Contents Executive Summary.......................................................................................................................................1 Section 1 Introduction ...................................................................................................................................7
1.1 Purpose ...........................................................................................................................................7 1.2 Previous Studies..............................................................................................................................7 1.3 Planning Horizon .............................................................................................................................8
Section 2 Existing Conditions ......................................................................................................................9 2.1 Existing Facilities .............................................................................................................................9
2.1.1 Wells ...................................................................................................................................9 2.1.2 Distribution..........................................................................................................................9
2.2 Existing Water Demand.................................................................................................................10 2.2.1 Regional Planning Demands ............................................................................................10 2.2.2 District Permitting System ................................................................................................11
2.2.2.1 Reported Pumpage ..........................................................................................12 2.2.2.2 Comparison of Reported Pumpage to Regional Planning Demands...............15
2.3 Existing Environmental Conditions ................................................................................................17 2.3.1 Land Use and Population .................................................................................................17 2.3.2 Vegetation.........................................................................................................................17 2.3.3 Threatened and Endangered Species..............................................................................18 2.3.4 Cultural Resources ...........................................................................................................19 2.3.5 Oil and Gas Pipelines .......................................................................................................19 2.3.6 Public Lands .....................................................................................................................20 2.3.7 Waters of the United States..............................................................................................20 2.3.8 Wetlands...........................................................................................................................20 2.3.9 Water Quality ....................................................................................................................21 2.3.10 Floodplains .......................................................................................................................22 2.3.11 Groundwater .....................................................................................................................22 2.3.12 Hazardous Materials.........................................................................................................23 2.3.13 Air Quality .........................................................................................................................24
2.4 Existing Raw Water Quality ...........................................................................................................25 Section 3 Future Conditions & Needs........................................................................................................29
3.1 Desired Conversion .......................................................................................................................29 3.1.1 “Saw Tooth” Curve ...........................................................................................................29 3.1.2 Phasing Requirements .....................................................................................................30

Planning Level Study for Alternative Surface Water Pipeline Routing in Montgomery CountyLone Star Groundwater Conservation District and San Jacinto River Authority page ii
3.1.2.1 Conservation Effects ........................................................................................ 30 3.1.3 Seasonal Demand Issues ................................................................................................ 31
3.2 Pipeline Distribution System.......................................................................................................... 32 3.2.1 Preliminary Alignment Corridor ........................................................................................ 32 3.2.2 Revised Alignment Corridor ............................................................................................. 32
3.2.2.1 Pipeline Sizing.................................................................................................. 33 3.2.2.2 Right of Way..................................................................................................... 42 3.2.2.3 Existing Utilities ................................................................................................ 47 3.2.2.4 Environmental Considerations ......................................................................... 48
3.3 Surface Water Treatment .............................................................................................................. 49 3.3.1 Water Quality Standards Forecast ................................................................................... 49
3.3.1.1 Long Term Phase 2 Enhanced Surface Water Treatment Rule (LT2). ........... 49 3.3.1.2 Disinfectants/Disinfection Byproducts Rule Stage 2 (D/DBP2) ....................... 54
3.3.2 Proposed Treatment Process Selection........................................................................... 58 3.3.2.1 Ultraviolet Radiation Technology ..................................................................... 58 3.3.2.2 Membrane Technology .................................................................................... 58 3.3.2.3 Conventional Processes .................................................................................. 58
3.3.3 Proposed Treatment Process Description ....................................................................... 59 3.3.3.1 Pre-sedimentation ............................................................................................ 59 3.3.3.2 Rapid Mix and Flocculation.............................................................................. 59 3.3.3.3 Disinfection....................................................................................................... 59 3.3.3.4 Sedimentation .................................................................................................. 59 3.3.3.5 Filtration............................................................................................................ 60 3.3.3.6 Advanced Treatment........................................................................................ 60 3.3.3.7 Storage & Residual Disinfection ...................................................................... 60 3.3.3.8 Solids Processing............................................................................................. 60 3.3.3.9 Support Facilities.............................................................................................. 61
3.3.4 Proposed Treatment Plant Capacity ................................................................................ 61 3.3.5 Treatment Plant Layout Assumptions .............................................................................. 61
3.3.5.1 Treatment Type................................................................................................ 62 3.3.5.2 Additional Treatment ........................................................................................ 62 3.3.5.3 Storage Volume ............................................................................................... 62 3.3.5.4 Stormwater Detention ...................................................................................... 62 3.3.5.5 Site Restrictions ............................................................................................... 62 3.3.5.6 Topographic Survey ......................................................................................... 62

May 2008 Planning Level Study for Alternative Surface Water Pipeline Routing in Montgomery County Lone Star Groundwater Conservation District and San Jacinto River Authority
page iii
3.3.5.7 Environmental Assessment..............................................................................62 3.3.5.8 Site Access.......................................................................................................63 3.3.5.9 Phasing.............................................................................................................63 3.3.5.10 Extra Treatment Train ......................................................................................63
3.4 Operational Issues with Introduction of Surface Water .................................................................63 3.5 Unit Cost Development..................................................................................................................64
3.5.1 Waterline Unit Costs.........................................................................................................65 3.5.2 Water Treatment Plant Unit Costs....................................................................................68
Section 4 Planning Alternatives .................................................................................................................71 4.1 Delivery of Wholesale Water .........................................................................................................71
4.1.1 Areas of Conversion Through 2025..................................................................................71 4.1.1.1 Conversion Amounts in 2015 and 2025 ...........................................................72
4.1.2 Areas of Conversion in 2035 and 2045 ............................................................................76 4.1.3 Post-Conversion Peak Day Well Capacity Requirements................................................77
4.2 Single Plant Alternative .................................................................................................................80 4.2.1 Water Treatment Plant .....................................................................................................80
4.2.1.1 Proposed Capacity and Phasing ......................................................................80 4.2.1.2 Site Assessment...............................................................................................81 4.2.1.3 Site Specific Design Considerations ................................................................81
4.2.2 Proposed Alignments .......................................................................................................83 4.2.2.1 Right of Way Issues..........................................................................................83 4.2.2.2 Conflict Identification ........................................................................................83 4.2.2.3 Environmental Impacts.....................................................................................86
4.2.3 Capital Costs ....................................................................................................................88 4.2.4 Annual Costs ....................................................................................................................90 4.2.5 Annual Water Rates .........................................................................................................90 4.2.6 Present Worth Value ........................................................................................................92
4.3 Dual Plant Alternative ....................................................................................................................93 4.3.1 Water Treatment Plant .....................................................................................................93
4.3.1.1 Proposed Capacity and Phasing ......................................................................93 4.3.1.2 Site Assessment...............................................................................................94 4.3.1.3 Site Specific Design Considerations ................................................................95
4.3.2 Proposed Alignments .......................................................................................................97 4.3.2.1 Right of Way Issues..........................................................................................97 4.3.2.2 Conflict Identification ........................................................................................97 4.3.2.3 Environmental Impacts.....................................................................................99

Planning Level Study for Alternative Surface Water Pipeline Routing in Montgomery CountyLone Star Groundwater Conservation District and San Jacinto River Authority page iv
4.3.3 Capital Costs .................................................................................................................. 101 4.3.4 Annual Costs .................................................................................................................. 103 4.3.5 Annual Water Rates ....................................................................................................... 103 4.3.6 Present Worth Value ...................................................................................................... 105
Section 5 Comparison of Alternatives..................................................................................................... 107 5.1 Advantages and Disadvantages ................................................................................................. 107
5.1.1 Water Treatment Plant Locations................................................................................... 107 5.1.2 Proposed Alignment ....................................................................................................... 108 5.1.3 Environmental and Historical ......................................................................................... 108 5.1.4 Relationship and Opportunity to Serve Future Planned Development .......................... 109
5.2 Comparison of Costs................................................................................................................... 110 Section 6 Preferred Alternative ................................................................................................................ 113
6.1 Selection Criteria and Stakeholder Acceptance.......................................................................... 113 6.1.1 Selection Criteria ............................................................................................................ 113 6.1.2 Stakeholder Acceptance ................................................................................................ 113
6.2 Identification and Phasing of Conversion for Existing Facilities.................................................. 114 6.3 Preferred Treatment Plant Location ............................................................................................ 115 6.4 Preferred Pipeline Alignment....................................................................................................... 116 6.5 Final Capital Costs ...................................................................................................................... 116 6.6 Rate Analysis .............................................................................................................................. 116 6.7 Conversion Incentives and Disincentives.................................................................................... 117
Section 7 References ................................................................................................................................ 119
List of Tables
Table 1 Minimum Conversion Requirements by Phase ..................................................................................2 Table 2 Conversion Area Water Demands: 2015 - 2025 ................................................................................3 Table 3 Single Plant Treatment Capacity by Phase.......................................................................................4 Table 4 Dual Plant Treatment Capacity by Phase – North Plant ....................................................................4 Table 5 Dual Plant Treatment Capacity by Phase – South Plant....................................................................4 Table 6 Dual Plant Treatment Capacity by Phase – Both Plants Combined ..................................................4 Table 7 Alternative Comparison – Probable Construction Costs ...................................................................5 Table 8 Alternative Comparison – Probable Capital Costs in 2008 Dollars ...................................................5 Table 9 Alternative Comparison – Probable Capital Costs in Future Dollars.................................................5 Table 10 Alternative Comparison – Operation & Maintenance Costs ............................................................5 Table 11 Alternative Comparison – Annual Costs..........................................................................................5

May 2008 Planning Level Study for Alternative Surface Water Pipeline Routing in Montgomery County Lone Star Groundwater Conservation District and San Jacinto River Authority
page v
Table 12 Single Plant Option – Probable Capital Costs ..................................................................................6 Table 14 Montgomery County Region H Water Demand Projections: 2000-2060........................................10 Table 15 Montgomery County Region H Municipal WUG Water Demand Projections: 2000-2060..............11 Table 16 Permit Amount by Use Type...........................................................................................................12 Table 17 Permit Allocation and Reported Pumpage for Major Groundwater Users......................................13 Table 18 Comparison of Region H Demands to 2005 Reported Pumpage for Large Users.........................16 Table 19 Threatened and Endangered Species for Montgomery County, Texas .........................................18 Table 20 Lake Conroe Water Quality - Monthly Testing Summary ..............................................................26 Table 21 Lake Conroe Water Quality - Quarterly Testing Summary ............................................................27 Table 22 Minimum Phasing Requirements ....................................................................................................30 Table 23 Seasonal Supply Example ..............................................................................................................31 Table 24 Summary of Pipeline Lengths .........................................................................................................33 Table 25 Criteria Used to Size Surface Water Pipelines ...............................................................................33 Table 26 Water Demand for Pipeline Sizing..................................................................................................35 Table 27 Demand at the Woodlands Entry Points.........................................................................................38 Table 28 Demand at the City of Conroe Entry Points....................................................................................38 Table 29 Proposed pipeline length and diameter for single plant option.......................................................39 Table 30 Proposed pipeline length and diameter for dual plant option .........................................................40 Table 31 Summary of Major ROW by Segment ...........................................................................................43 Table 32 Summary of Major Property Right-of-Ways ...................................................................................43 Table 33 Summary of Major Roadway Right-of-Ways..................................................................................44 Table 34 Summary of Major State Highway Right-of-Ways .........................................................................45 Table 35 Summary of Major Utility Right-of-Ways........................................................................................45 Table 36 Planned Roadway Modifications through 2035 .............................................................................46 Table 37 Planned State Highway Modifications through 2035 .....................................................................47 Table 38 Summary of Major Utilities in Project Area ....................................................................................48 Table 39 Monitoring / Implementation Schedule by System Size ................................................................51 Table 40 Treatment Requirements for Bin Classifications............................................................................52 Table 41 The EPA Microbial Toolbox for Compliance with LT2 ...................................................................53 Table 42 DBP2 Compliance Schedule..........................................................................................................56 Table 43 Estimated Conroe System Demand through 2045 ........................................................................61 Table 44 Unit Costs for Waterline Construction............................................................................................68 Table 45 Unit Costs for Conventional Water Treatment Plant Phased Construction ...................................70 Table 46 Conversion Area Water Demands: 2015 - 2025.............................................................................72 Table 47 Projected Monthly Conversion in 2015 Based on Historical Trends...............................................73 Table 48 Projected Monthly Conversion in 2025 Based on Historical Trends...............................................75

Planning Level Study for Alternative Surface Water Pipeline Routing in Montgomery CountyLone Star Groundwater Conservation District and San Jacinto River Authority page vi
Table 49 Conroe and Woodlands 2015 Peak Day Well Production Requirements ......................................79 Table 50 Single Plant Treatment Capacity versus Demand by Phase.........................................................80 Table 51 Single Plant Treatment Capacity by Phase...................................................................................80 Table 52 Single Plant Option – Potential Conflicts ........................................................................................84 Table 53 Pipeline Crossings ..........................................................................................................................87 Table 54 Single Plant Option – Probable Construction Costs......................................................................89 Table 55 Single Plant Option – Probable Capital Costs in 2008 Dollars.......................................................89 Table 56 Single Plant Option – Probable Capital Costs in Future Dollars ....................................................89 Table 57 Single Plant Option – Operations & Maintenance Costs................................................................90 Table 58 Single Plant Option – Annual Costs ..............................................................................................90 Table 59 Single Plant System Rates for Conventional 20 Year Municipal Financing ...................................91 Table 60 Single Plant System Rates: Water Infrastructure Fund Financing .................................................92 Table 61 Single Plant System Rates for Initial WIF Financing And State Participation ...............................92 Table 62 Dual Plant Treatment Demand by Plant and Phase.......................................................................93 Table 63 Dual Plant Treatment Capacity by Plant and Phase ......................................................................93 Table 64 Dual Plant Treatment Capacity by Phase – North Plant ................................................................94 Table 65 Dual Plant Treatment Capacity by Phase – South Plant................................................................94 Table 66 Dual Plant Treatment Capacity by Phase – Both Plants Combined ..............................................94 Table 67 Dual Plant Option – Potential Conflicts...........................................................................................98 Table 68 Pipeline Crossings ........................................................................................................................100 Table 69 Dual Plant Option – Probable Construction Costs .......................................................................102 Table 70 Dual Plant Option – Probable Capital Costs ................................................................................102 Table 71 Dual Plant Option – Probable Capital Costs in Future Dollars.....................................................102 Table 72 Dual Plant Option – Operations & Maintenance Costs ................................................................103 Table 73 Dual Plant Option – Annual Costs ................................................................................................103 Table 74 Dual Plant System Rates for Conventional 20 Year Municipal Financing....................................104 Table 75 Dual Plant System Rates for Water Infrastructure Fund Financing .............................................105 Table 76 Dual Plant System Rates for Initial WIF Financing And State Participation................................105 Table 77 Dual Plant Advantages ................................................................................................................107 Table 78 Dual Plant Disadvantages ...........................................................................................................107 Table 79 Dual Plant Pipeline Advantages ..................................................................................................108 Table 80 Dual Plant Pipeline Disadvantages .............................................................................................108 Table 81 Dual Plant Pipeline Advantages ...................................................................................................109 Table 82 Dual Plant Pipeline Disadvantages ..............................................................................................109 Table 83 Dual Plant Pipeline Disadvantages: Serving Future Development .............................................110

May 2008 Planning Level Study for Alternative Surface Water Pipeline Routing in Montgomery County Lone Star Groundwater Conservation District and San Jacinto River Authority
page vii
Table 84 Alternative Comparison – Probable Construction Costs .............................................................110 Table 85 Alternative Comparison – Probable Capital Costs.......................................................................110 Table 86 Alternative Comparison – Probable Capital Costs in Future Dollars ...........................................110 Table 87 Alternative Comparison – Operation & Maintenance Costs ........................................................111 Table 88 Alternative Comparison – Annual Costs ......................................................................................111 Table 89 Alternative Comparison – Present Worth of Annual Costs..........................................................111 Table 90 Delivery Points for 2015 and 2025 Conversions..........................................................................115 Table 91 Single Plant Option – Probable Capital Costs ..............................................................................116 Table 92 Single Plant System Rates for Initial WIF Financing And State Participation .............................117
List of Figures
Figure 1 Conversion Phasing...........................................................................................................................2 Figure 2 Monthly Rainfall Amounts for the Conroe Area: 2005 - 2007.........................................................15 Figure 3 Conversion Phasing.........................................................................................................................29 Figure 4 Combined DBP2 and LT2 Implementation Schedule.....................................................................57 Figure 5 Open Cut Waterline Unit Cost Development ..................................................................................66 Figure 6 Trenchless Waterline Unit Cost Development................................................................................67 Figure 7 Region H Water Treatment Plant Cost per GPD............................................................................69 Figure 8 Projected Monthly Conversion in 2015 Based on Historical Trends ...............................................74 Figure 9 Projected Monthly Conversion in 2025 Based on Historical Trends ...............................................76 Figure 10 2004-2006 Daily Metered Well Production for The Woodlands and City of Conroe .....................78 Figure 11 Projected 2015 Daily Conversion for The Woodlands and City of Conroe ...................................79
Appendices
Appendix A Exhibits Appendix B Raw Water Quality Data for Lake Conroe Appendix C Alignment Narrative Appendix D Computer Modeling Results for Pipe Sizing Appendix E Utility Coordination Appendix F Developed Unit Costs Appendix G Capital Costs Appendix H Rate Analysis Appendix I Present Worth Analysis Appendix J Environmental Constraints Map Appendix K Environmental Constraints Reference Documents Appendix L Stakeholder Meeting Minutes

Planning Level Study for Alternative Surface Water Pipeline Routing in Montgomery CountyLone Star Groundwater Conservation District and San Jacinto River Authority page viii
Appendix M Public Comments

May 2008 Planning Level Study for Alternative Surface Water Pipeline Routing in Montgomery County Lone Star Groundwater Conservation District and San Jacinto River Authority
page 1
Executive Summary In March 2006, the Texas Water Development Board (TWDB), the Lone Star Groundwater Conservation District (the District), and the San Jacinto River Authority (SJRA) entered into a joint planning activity to conduct the current study, a follow-on to the Regulatory Study and Facilities Implementation Plan for Lone Star Groundwater District and San Jacinto River Authority published in June 2006 (the Phase I Study). Building on the concept of distributing treated Lake Conroe water to the high-demand areas of Montgomery County to meet the District’s regulatory goal of reducing groundwater withdrawal to at or below 64,000 ac-ft/yr by 2015, the primary objectives of the current study are to: identify the most efficient surface water pipeline alignment; size the transmission pipelines; determine the treatment plant location(s) and layout; and perform cost and rate analyses based on a set of assumptions for this study. Identifying the preferred pipeline routes and treatment plant location(s) will assist the implementer of the system, SJRA, in determining where potential additional rights of way and easements may be required for the set of assumptions. Developing probable costs, water rates, and financing options will allow SJRA and the District to work with stakeholders to identify the funding mechanisms required.
The District has set a date of January 1, 2015 by which Montgomery County total groundwater withdrawal must be at or below 64,000 ac-ft/yr. Currently, the permitted groundwater withdrawal from all District Historic Use Permits (HUPs) and Operating Permits (OPs) is nearly 80,000 ac-ft/yr. By 2015 the total water demand is projected to be nearly 90,000 ac-ft/yr. The surface water system proposed herein to meet the regulatory requirements will be constructed in four phases; the initial system in 2015 and system expansions in 2025, 2035, and 2045. This study adopts a “minimum conversion” approach consistent with the Phase I Study; groundwater consumption must be reduced to the target at each conversion point, but increased demands due to growth between conversion points can be met by groundwater. This concept is illustrated in Figure 1 below. This approach reduces the size and cost of the initial system since it requires the least amount of treated water to be delivered. As the District regulatory plan evolves this approach may require modification.
It is extremely important to note that the research and preparation of this report, including the project and facilities contemplated herein, largely predate the adoption of Phase 1 and Phase 2 of the District's District Regulatory Plan (DRP), and were predicated on certain specific assumptions regarding water availability, countywide participation, anticipated regulations, implementation timelines, technical aspects, and financing methodologies. A change in any one or more of these or other factors will significantly impact the cost, design, and feasible implementation schedule of the project.

Planning Level Study for Alternative Surface Water Pipeline Routing in Montgomery CountyLone Star Groundwater Conservation District and San Jacinto River Authority page 2
Figure 1 Conversion Phasing
0
50,000
100,000
150,000
200,000
2000 2010 2020 2030 2040 2050
Year
Tota
l Wat
er D
eman
d (a
cre-
feet
/yea
r)
64,000 a-f
(earliest conversion is in 2015)
Approximately 25,000 af/yr (22.5 mgd) conversion steps
The required conversion volumes were calculated using the 2006 Region H Regional Water Plan (RWP) water demand projections. Table 1 shows the total demands and minimum conversion amounts by phase.
Table 1 Minimum Conversion Requirements by Phase
2015 (I) 2025 (II) 2035 (III) 2045 (IV)
Total Demand (ac-ft/yr) from 2006 RWP1 89,543 113,716 137,435 166,175
Demand Met By Surface Water (ac-ft/yr)2 7,840 7,840 7,840 7,840
Demand Met By Groundwater (ac-ft/yr) 81,703 105,876 129,595 158,335
Minimum Conversion Amount (ac-ft/yr) 17,703 41,876 65,595 94,335
Minimum Conversion Amount (mgd) 15.8 37.4 58.6 84.2 1. Demands prorated from published decadal values (e.g. 2015 demands are an average of 2010 and 2020 demands) 2. Steam-electric contract amount
The required conversion volumes range from approximately 18,000 ac-ft/yr for Phase I to approximately 94,000 ac-ft/yr in Phase IV. SJRA currently owns the rights to approximately 22,000 ac-ft/yr for municipal

May 2008 Planning Level Study for Alternative Surface Water Pipeline Routing in Montgomery County Lone Star Groundwater Conservation District and San Jacinto River Authority
page 3
uses, 9,500 ac-ft/yr for industrial uses, and 1,833 ac-ft/yr for mining uses in Lake Conroe which limits the amount of surface water available to meet the Phase I conversion. A basic assumption of this study is that all the water supply in Lake Conroe, 100,000 ac-ft/yr, will ultimately be available to this system, which would satisfy the anticipated conversion requirements through 2045. However, if this assumption fails to materialize, the design and implementation schedule of the project and its cost would be substantially impacted.
The assumed future conditions and needs related to the system are discussed in Section 3 of the main body of the report. The overall alignment corridor encompassing both of the planning alternatives was evaluated in terms of water demands on the system, environmental and historical impacts, right of way requirements, existing utilities and other factors. The water treatment plants and transmission pipelines were sized for the ultimate conditions in 2045, and the water treatment considerations are described.
Delivering treated water to the high-demand areas along the I-45 corridor minimizes the size of the initial transmission system. Some of the largest water users are in this corridor: The Woodlands and City of Conroe represent the top two consumers of groundwater in the County. Enough high-demand users exist in the corridor such that both the Phase I and Phase II conversions can be met with a relatively small transmission system. Table 2 lists the potential Public Water Systems (PWSs) that together could receive treated water in sufficient quantity to satisfy the anticipated Phase I and II conversion requirements if the water availability and user participation assumptions of this project are realized. The locations of these entities are shown in Exhibits 1 – 4.
Table 2 Conversion Area Water Demands: 2015 - 2025
Projected Demand (ac-ft/yr) PWS
2015 (I) 2025 (II)
The Woodlands 25,270 28,330
City of Conroe 10,400 13,510
Rayford Road MUD 2,090 2,070
Southern Montgomery County MUD 1,970 2,140
City of Oak Ridge North 720 830
City of Shenandoah 510 510
Montgomery County MUD #19 460 460
Chateau Woods MUD 280 370
Woodlands Oaks Subdivision 320 320
TOTALS: 42,020 48,540
Surface water will be delivered to agreed-upon delivery points. The delivery points will typically be ground storage tanks owned and operated by the purchasing entity. Water will be delivered to the top of each tank through an air gap. Each entity in Table 2 would convert 60% of their water demand to surface water in 2015, and 90% in 2025. In Phases III and IV, system expansions would deliver water to the east and west sides of Lake Conroe, the areas west and south of the City of Conroe, the area west of The Woodlands, and the areas east and south of Rayford Road MUD. The areas served by the ultimate 2045 system are shown in Exhibit 6. These areas are anticipated to collectively convert 90% of their demand.

Planning Level Study for Alternative Surface Water Pipeline Routing in Montgomery CountyLone Star Groundwater Conservation District and San Jacinto River Authority page 4
Two planning alternatives are presented to achieve the desired conversions; a single-plant system (one treatment plant operating at the Lake Conroe Dam) and a dual-plant system (one treatment plant operating at the Lake Conroe Dam and one off-channel plant operating downstream of Lake Conroe on the West Fork San Jacinto River. The details of the alternatives are presented in Section 4 of the main body of the report. For the single-plant alternative, eight equal 11.25 mgd trains are recommended, as shown in Table 3.
Table 3 Single Plant Treatment Capacity by Phase
Phase (Year) Added Capacity per Phase Total Plant Capacity I (2015) 22.5 MGD (2 train @ 11.25 MGD) 22.5 MGD (2 train @ 11.25 MGD) II (2025) 22.5 MGD (2 train @ 11.25 MGD) 45 MGD (4 trains @ 11.25 MGD) III (2035) 22.5 MGD (2 train @ 11.25 MGD) 67.5 MGD (6 trains @ 11.25 MGD) IV (2045) 22.5 MGD (2 train @ 11.25 MGD) 90 MGD (8 trains @ 11.25 MGD)
The recommended capacity phasing for the dual-plant option is shown in Table 4 through Table 6 below.
Table 4 Dual Plant Treatment Capacity by Phase – North Plant
Phase Added Capacity per Phase Total Plant Capacity I (2015) 6 MGD (1 train @ 6 MGD) 6 MGD (1 train @ 6 MGD) II (2020) 6 MGD (1 train @ 6 MGD) 12 MGD (2 trains @ 6 MGD) III (2030) 18 MGD (3 trains @ 6 MGD) 30 MGD (5 trains @ 6 MGD) IV (2040) 18 MGD (3 trains @ 6 MGD) 48 MGD (8 trains @ 6 MGD)
Table 5 Dual Plant Treatment Capacity by Phase – South Plant
Phase Added Capacity per Phase Total Plant Capacity I (2015) 18 MGD (3 trains @ 6 MGD) 18 MGD (3 trains @ 6 MGD) II (2025) 12 MGD (2 trains @ 6 MGD) 30 MGD (5 trains @ 6 MGD) III (2035) 6 MGD (1 train @ 6 MGD) 36 MGD (6 trains @ 6 MGD) IV (2045) 6 MGD (1 train @ 6 MGD) 42 MGD (7 trains @ 6 MGD)
Table 6 Dual Plant Treatment Capacity by Phase – Both Plants Combined
Phase Added Capacity per Phase Combined Plant Capacity I (2015) 24 MGD (4 trains @ 6 MGD) 24 MGD (4 trains @ 6 MGD) II (2025) 18 MGD (3 trains @ 6 MGD) 42 MGD (7 trains @ 6 MGD) III (2035) 24 MGD (4 train @ 6 MGD) 66 MGD (11 trains @ 6 MGD) IV (2045) 24 MGD (4 train @ 6 MGD) 90 MGD (15 trains @ 6 MGD)
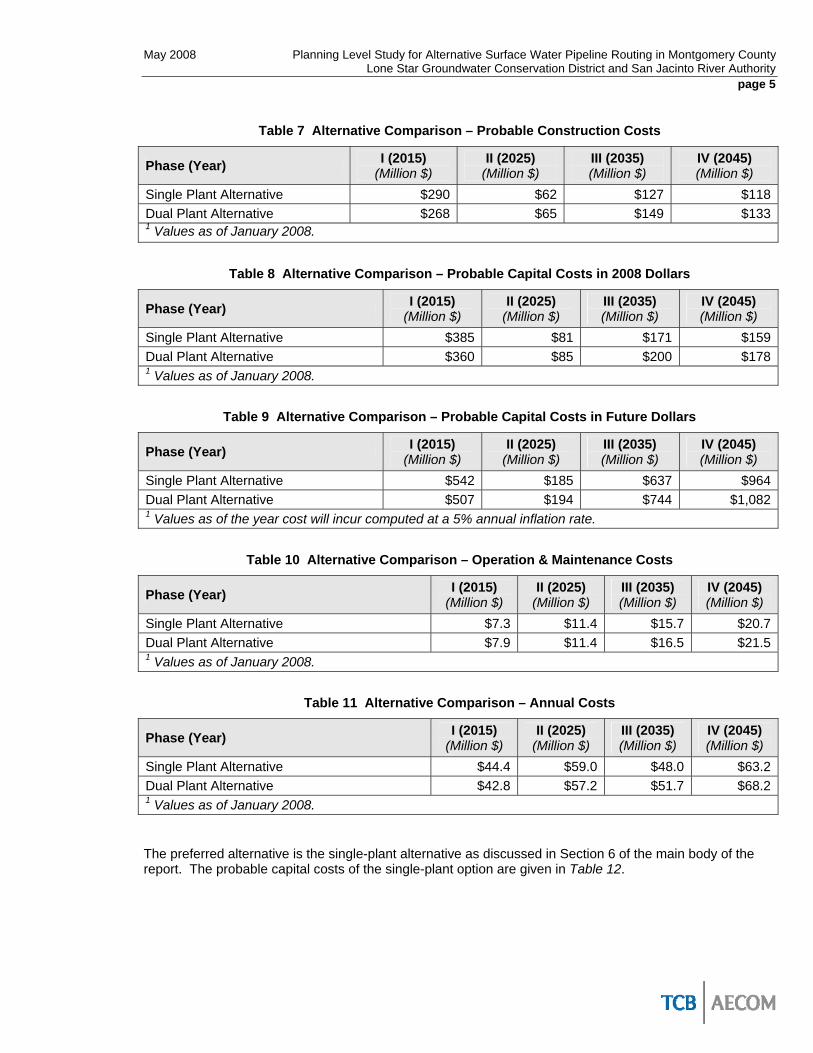
The dual-plant option does not compare favorably with the single-plant option in terms of costs, water treatment plant locations, and the opportunity to serve future development. The full alternative comparison is shown in Section 5 of the main body of the report. The dual-plant option does have the advantage in terms of the proposed alignment and environmental impacts. The higher annual costs related to the operation of the dual-plant system reflects many of the disadvantages of the dual-plant alternative, hence it is the overriding consideration. Table 7 -- Table 11 show the cost comparisons between the two alternatives.
May 2008 Planning Level Study for Alternative Surface Water Pipeline Routing in Montgomery County Lone Star Groundwater Conservation District and San Jacinto River Authority
page 5
Table 7 Alternative Comparison – Probable Construction Costs
Phase (Year) I (2015) (Million $)
II (2025) (Million $)
III (2035) (Million $)
IV (2045) (Million $)
Single Plant Alternative $290 $62 $127 $118Dual Plant Alternative $268 $65 $149 $1331 Values as of January 2008.
Table 8 Alternative Comparison – Probable Capital Costs in 2008 Dollars
Phase (Year) I (2015) (Million $)
II (2025) (Million $)
III (2035) (Million $)
IV (2045) (Million $)
Single Plant Alternative $385 $81 $171 $159Dual Plant Alternative $360 $85 $200 $1781 Values as of January 2008.
Table 9 Alternative Comparison – Probable Capital Costs in Future Dollars
Phase (Year) I (2015) (Million $)
II (2025) (Million $)
III (2035) (Million $)
IV (2045) (Million $)
Single Plant Alternative $542 $185 $637 $964Dual Plant Alternative $507 $194 $744 $1,0821 Values as of the year cost will incur computed at a 5% annual inflation rate.
Table 10 Alternative Comparison – Operation & Maintenance Costs
Phase (Year) I (2015) (Million $)
II (2025) (Million $)
III (2035) (Million $)
IV (2045) (Million $)
Single Plant Alternative $7.3 $11.4 $15.7 $20.7Dual Plant Alternative $7.9 $11.4 $16.5 $21.51 Values as of January 2008.
Table 11 Alternative Comparison – Annual Costs
Phase (Year) I (2015) (Million $)
II (2025) (Million $)
III (2035) (Million $)
IV (2045) (Million $)
Single Plant Alternative $44.4 $59.0 $48.0 $63.2Dual Plant Alternative $42.8 $57.2 $51.7 $68.21 Values as of January 2008.
The preferred alternative is the single-plant alternative as discussed in Section 6 of the main body of the report. The probable capital costs of the single-plant option are given in Table 12.

Planning Level Study for Alternative Surface Water Pipeline Routing in Montgomery CountyLone Star Groundwater Conservation District and San Jacinto River Authority page 6
Table 12 Single Plant Option – Probable Capital Costs
Phase (Year) Capital Improvements
I (2015) (Million $)
II (2025) (Million $)
III (2035) (Million $)
IV (2045) (Million $)
Construction (Capital) Costs $290 $62 $127 $118Engineering, Financial, & Legal 2 $87 $19 $38 $36Land & Easements $8 $0 $6 $5TOTAL $385 $81 $171 $1591 Values as of January 2008. 2 Engineering, Financial, & Legal Services (30% of probable construction costs which include the following: Engineering 10%, Program Management 3%, Environmental Studies and Mitigation 5%, Surveying 1%, Construction Management 6%, Financial 3% and Legal 2%.).
The single-plant alternative produces the most advantageous rate structure when financed through a combination of Water Infrastructure Fund (WIF) loans and State Participation loans available through the TWDB. The rates for the combination WIF/State Participation funding alternative are summarized in Table 13 below.
Table 13 Single Plant System Rates for Initial WIF Financing And State Participation
Groundwater Surface Water Year Demand
(mgd) Anticipated Rate
($/1,000 gal) Demand
(mgd) Anticipated Rate
($/1,000 gal) 2009 59.6 0.51 2015 49.3 1.65 21.0 2.05 2020 59.7 1.93 21.0 2.33 2025 48.6 2.64 41.0 3.04 2030 58.5 3.95 41.0 4.35 2035 48.0 4.50 61.0 4.90 2040 58.6 5.23 61.0 5.63 2045 46.7 6.77 86.0 7.17 2050 60.8 7.95 86.0 8.35 2055 76.1 9.15 86.0 9.55
Rates are in future dollars at a 5% annual inflation Rate
While funding for both the WIF and State participation loans may be limited on availability during any year, obtaining these funds would provide the lowest overall rates as well as a significant initial rate reduction over conventional funding through municipal bond sales. The combination of below market interest rates for the WIF and the deferred up front costs available under both the WIF and State Participation fund make this combination the preferred funding and rate alternative. An additional benefit of utilizing these deferral options would be found if county wide pumping fees could not be utilized in the initial states. The reduction in up front revenue stream requirements would make this funding option preferable should only a subset of the groundwater users be charged a groundwater pumping fee or some other revenue limitation occur.

May 2008 Planning Level Study for Alternative Surface Water Pipeline Routing in Montgomery County Lone Star Groundwater Conservation District and San Jacinto River Authority
page 7
Section 1 Introduction
1.1 Purpose
The Lone Star Groundwater Conservation District (District), in their Phase I District Regulatory Plan (Phase I DRP), is requiring countywide groundwater consumption to be at or below 64,000 ac-ft/yr by the year 2015. This can be achieved by reducing groundwater consumption through conservation and by replacing groundwater use by one or more alternative supplies. While there are a number of options available to the Public Water Systems (PWSs) in Montgomery County to achieve the goals of the Phase I DRP, it is recognized that the large projected groundwater shortages will require a large-scale conversion to surface water to be the predominant solution.
In March 2006, the TWDB in association with the San Jacinto River Authority (SJRA) and the District entered into a joint planning activity under the State Regional Facility Planning Grant Program to conduct a follow-on study to the June 2006 Regulatory Study and Facilities Implementation Plan (discussed in Section 1.2 below). The primary objectives of this study are to:
• Select the most cost-effective surface water pipeline alignment;
• Size pipelines;
• Determine treatment plant location(s) and layout(s);
• Perform cost and rate analyses.
1.2 Previous Studies
In June 2004, the TWDB in association with the SJRA and the LSGCD entered into a joint planning activity under the State Regional Facility Planning Grant Program to develop a Conjunctive Use of Groundwater and Surface Water Study and Facilities Implementation Plan for meeting the long-term water supply needs of Montgomery County. The investigation includes a study of options for groundwater regulation (GR study) and a Conceptual Facilities Plan. The GR study provides the science and engineering underpinnings for the establishment of groundwater management zones by the LSGCD. It also analyzes the need for reduction in groundwater usage to meet the goals in each zone option identified. The Facilities Implementation Plan is the technical mechanism for implementing the GR study. It sets the timetable for implementation of surface water (or other alternatives) based on goals established in the GR study.
The major tasks accomplished in this planning effort included:
• Data collection and analysis
• Development of regulatory options and evaluation of management zones for regulation
• Conceptual planning of a wholesale surface water supply system to facilitate the reduction in dependency on groundwater
• Considerations of financial and management options for implementing a wholesale surface water supply system

Planning Level Study for Alternative Surface Water Pipeline Routing in Montgomery CountyLone Star Groundwater Conservation District and San Jacinto River Authority page 8
• Communication with the stakeholder interests in the planning activity and in soliciting support for its implementation
The final report for this study was released in June 2006 and is entitled Regulatory Study and Facilities Implementation Plan for Lone Star Groundwater Conservation District and San Jacinto River Authority. This report, referred to as the “Phase I Study”, assumed an initial conversion date of 2013 and developed planning level facilities costs for 2013, 2020, 2030, and 2040.
Since the publication of the Phase I Study, the District adopted its Phase I District Regulatory Plan (DRP) which accomplished two things: established a date of January 1, 2015 by which the countywide groundwater consumption must be at or below 64,000 ac-ft/yr; and established a single countywide management zone.
1.3 Planning Horizon
The planning horizon for this report is from 2015 to 2045. The District’s statutory deadline for initial conversion, as established in the Phase I DRP, is 2015. While the District does not currently have regulations regarding long-term management of the groundwater resources, this study anticipates that the surface water system will be expanded in the years 2025, 2035, and 2045. The 2045 date is predicated on the assumption that all of the water in Lake Conroe (100,000 acre-feet/year) will be available for use in Montgomery County, and that the entire supply of the lake will be necessary to meet the conversion requirements in 2045. It is also assumed that conversion beyond 2045, given today’s demand projections, will need to be met by sources other than Lake Conroe (e.g. advanced conservation, wastewater reuse, Lake Houston supply, etc.) It is very important for the reader to note that the project’s cost, design, and implementation schedule would be substantially impacted if one or more of the assumptions in this report fail to come to fruition.

May 2008 Planning Level Study for Alternative Surface Water Pipeline Routing in Montgomery County Lone Star Groundwater Conservation District and San Jacinto River Authority
page 9
Section 2 Existing Conditions This section discusses the existing conditions in Montgomery County that will affect the implementation of a surface water system. Existing conditions were summarized for water production facilities, water demands, environmental conditions, and raw water quality.
2.1 Existing Facilities
The focus of this report is on PWSs -- those systems that provide water for human consumption and “have at least 15 service connections or serve at least 25 individuals at least 60 days out of the year” (30 TAC §290.38).
There are over 300 active PWSs in Montgomery County (TCEQ Water Utility Database, 2006), each with groundwater from the Gulf Coast Aquifer as their source. For the most part, each PWS operates independently of all the others; they have their own wells that are in close proximity to their entry points, and they operate their own distribution system. There is currently no regional system that supplies a group of PWSs.
The Phase I Study identified the most cost-effective solution to the problem of converting the existing groundwater supply to an alternative source: a transmission system supplying Lake Conroe water to the densely populated areas along the I-45 corridor. This system will minimize the amount of pipeline that needs to be constructed and hence the rate charged for the use of that water. For that reason the data collection phase of this project focused on the PWSs with the highest demand; those that would likely be provided wholesale water in the first conversion phase in 2015.
The city limits and currently available utility district (Municipal Utility Districts, Utility Districts, Water Control and Improvement Districts) boundaries in the areas targeted for conversion are shown in Exhibits 1 – 4. Not all utility district boundaries are shown in these exhibits; only those available from either TCEQ or Montgomery County Appraisal District (MCAD).
2.1.1 Wells
Well data was collected from various sources: the District permitting database, the TCEQ water utility database, and from individual PWSs as appropriate. PWS wells from the TCEQ water utility database, SJRA, The City of Conroe, and Southern Montgomery County MUD are shown in Exhibits 1 – 4.
2.1.2 Distribution
Maps of distribution systems are useful in locating or verifying ground storage tank locations. The assumption in this study is that wholesale treated water will be delivered through an air gap to each ground storage tank (GST) location agreed to by the receiving water system and SJRA. It is the responsibility of each individual PWS receiving wholesale surface water to ensure that their distribution system is capable of operating correctly with the addition of surface water. If surface water is introduced at each GST, there would likely be no physical delivery issues (as opposed to chemical issues) since surface water would replace groundwater with essentially the same volumes and rates. In larger distribution systems, if surface water is introduced in only one or two locations, the PWS will need to ensure, through hydraulic modeling, that there is sufficient high service pump and distribution line capacity to deliver the water throughout the system.

Planning Level Study for Alternative Surface Water Pipeline Routing in Montgomery CountyLone Star Groundwater Conservation District and San Jacinto River Authority page 10
Electronic maps of distribution systems in either GIS or AutoCAD/Microstation formats were provided by The Woodlands, City of Conroe, Southern Montgomery County MUD, Rayford Road MUD, and City of Shenandoah. These were used to verify well and tank locations, but are not included as part of this report.
2.2 Existing Water Demand
All of the municipal, manufacturing, and mining water demand in Montgomery County is currently supplied by groundwater from the Gulf Coast aquifer. The two primary sources for evaluating the current water demand in Montgomery County are the 2006 Region H Regional Water Plan (RWP) and the District’s permitting system.
2.2.1 Regional Planning Demands
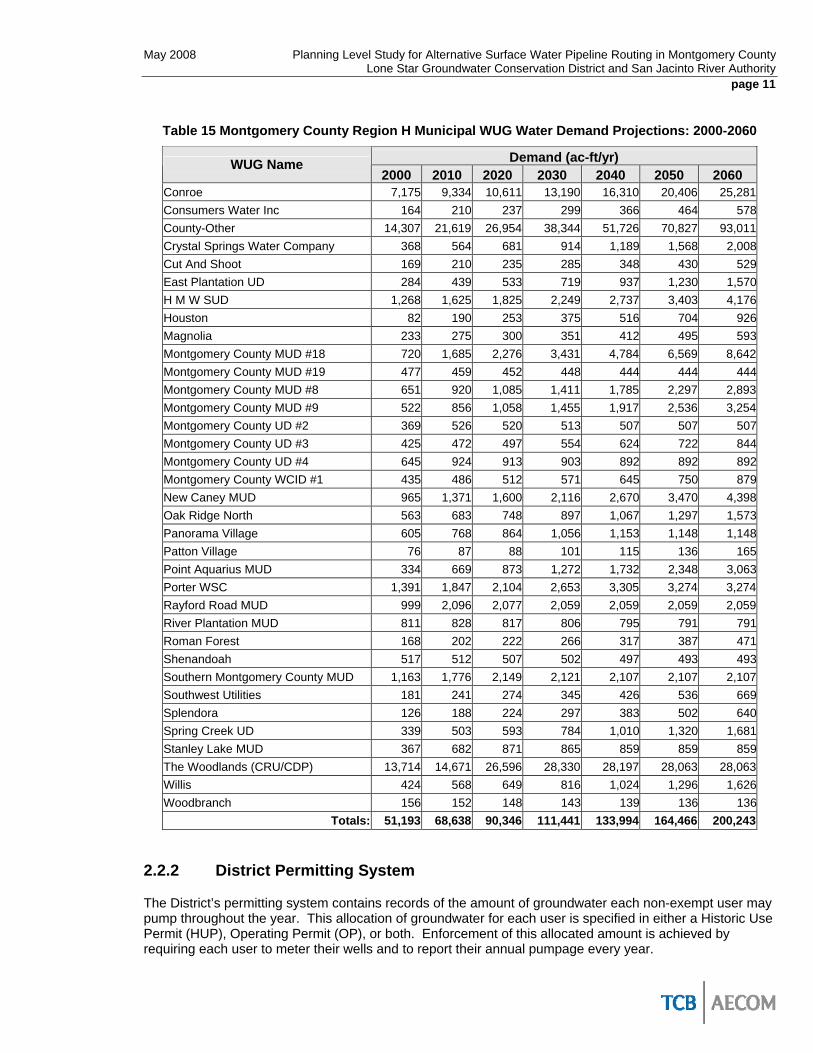
The Region H RWP developed population and water demand projections by use type through the year 2060. Each county in the 13-county region, including Montgomery County, is subdivided into Water User Groups (WUGs) per regional planning criteria that consider population and year 2000 municipal water use. Generally speaking, Municipal WUGs represent cities with year 2000 populations greater than 500, water utilities or groups of utilities with year 2000 water usage of more than 280 acre-feet per year or which were designated a WUG by the TWDB Planning Group, and a special WUG called “County-Other” that represents the area of the county left over after individual WUGs have been designated. The Region H RWP subdivides Montgomery County into 35 Municipal WUGs, and single county-wide WUGs for Irrigation, Livestock, Manufacturing, Mining, and Steam Electric use categories. Table 14 provides a summary of the Region H WUGs and their projected water demands through 2060.
Table 14 Montgomery County Region H Water Demand Projections: 2000-2060
Water Demand (ac-ft/yr) Use Category 2000 2010 2020 2030 2040 2050 2060
Irrigation 66 66 66 66 66 66 66 Livestock 510 510 510 510 510 510 510 Manufacturing 1,587 2,045 2,332 2,608 2,883 3,126 3,392 Mining 414 480 509 526 543 559 573 Municipal 51,193 68,638 90,346 111,441 133,994 164,466 200,243 Steam Electric 2,507 5,046 8,537 9,981 11,741 13,886 16,502
TOTALS: 56,277 76,785 102,300 125,132 149,737 182,613 221,286
Assuming a straight line in demands between decades, the 2008 overall water demand in Montgomery County is 72,683 ac-ft. The 2008 municipal demand, which is supplied 100% by groundwater, is 65,149 ac-ft; 90% of the total demand.
As mentioned above, there are 35 municipal WUGs in Montgomery County. Table 15 lists the municipal WUGs and their demand projections.
May 2008 Planning Level Study for Alternative Surface Water Pipeline Routing in Montgomery County Lone Star Groundwater Conservation District and San Jacinto River Authority
page 11
Table 15 Montgomery County Region H Municipal WUG Water Demand Projections: 2000-2060
Demand (ac-ft/yr) WUG Name 2000 2010 2020 2030 2040 2050 2060
Conroe 7,175 9,334 10,611 13,190 16,310 20,406 25,281 Consumers Water Inc 164 210 237 299 366 464 578 County-Other 14,307 21,619 26,954 38,344 51,726 70,827 93,011 Crystal Springs Water Company 368 564 681 914 1,189 1,568 2,008 Cut And Shoot 169 210 235 285 348 430 529 East Plantation UD 284 439 533 719 937 1,230 1,570 H M W SUD 1,268 1,625 1,825 2,249 2,737 3,403 4,176 Houston 82 190 253 375 516 704 926 Magnolia 233 275 300 351 412 495 593 Montgomery County MUD #18 720 1,685 2,276 3,431 4,784 6,569 8,642 Montgomery County MUD #19 477 459 452 448 444 444 444 Montgomery County MUD #8 651 920 1,085 1,411 1,785 2,297 2,893 Montgomery County MUD #9 522 856 1,058 1,455 1,917 2,536 3,254 Montgomery County UD #2 369 526 520 513 507 507 507 Montgomery County UD #3 425 472 497 554 624 722 844 Montgomery County UD #4 645 924 913 903 892 892 892 Montgomery County WCID #1 435 486 512 571 645 750 879 New Caney MUD 965 1,371 1,600 2,116 2,670 3,470 4,398 Oak Ridge North 563 683 748 897 1,067 1,297 1,573 Panorama Village 605 768 864 1,056 1,153 1,148 1,148 Patton Village 76 87 88 101 115 136 165 Point Aquarius MUD 334 669 873 1,272 1,732 2,348 3,063 Porter WSC 1,391 1,847 2,104 2,653 3,305 3,274 3,274 Rayford Road MUD 999 2,096 2,077 2,059 2,059 2,059 2,059 River Plantation MUD 811 828 817 806 795 791 791 Roman Forest 168 202 222 266 317 387 471 Shenandoah 517 512 507 502 497 493 493 Southern Montgomery County MUD 1,163 1,776 2,149 2,121 2,107 2,107 2,107 Southwest Utilities 181 241 274 345 426 536 669 Splendora 126 188 224 297 383 502 640 Spring Creek UD 339 503 593 784 1,010 1,320 1,681 Stanley Lake MUD 367 682 871 865 859 859 859 The Woodlands (CRU/CDP) 13,714 14,671 26,596 28,330 28,197 28,063 28,063 Willis 424 568 649 816 1,024 1,296 1,626 Woodbranch 156 152 148 143 139 136 136
Totals: 51,193 68,638 90,346 111,441 133,994 164,466 200,243
2.2.2 District Permitting System
The District’s permitting system contains records of the amount of groundwater each non-exempt user may pump throughout the year. This allocation of groundwater for each user is specified in either a Historic Use Permit (HUP), Operating Permit (OP), or both. Enforcement of this allocated amount is achieved by requiring each user to meter their wells and to report their annual pumpage every year.

Planning Level StudLone Star Groundwa
y for Alternative Surface Water Pipeline Routing in Montgomery Countyter Conservation District and San Jacinto River Authority
page 12
In December 2007 there were 714 permittees holding either a HUP, OP, or both. The total permitted amount at that time was 79,800 ac-ft/year. The average permit allocation was 112 ac-ft/year and the median was 11 ac-ft/yr.
Each permit is assigned one of six major use types. The permit allocations for each use type are shown in Table 16. Total Public Supply use accounts for 88% of the total permitted volume which is consistent with the percentage of municipal demand in Table 14 (90% of total demand in 2008).
Table 16 Permit Amount by Use Type
Use Category Permitted Amount (ac-ft/yr) % of Total Commercial 885 1% Industrial 2,287 3% Irrigation 5,189 7% Irrigation(Agriculture) 1,533 2% Public Supply 5,421 7% Public Supply (PWS) 64,500 81%
TOTALS: 79,817 100%
2.2.2.1 Reported Pumpage
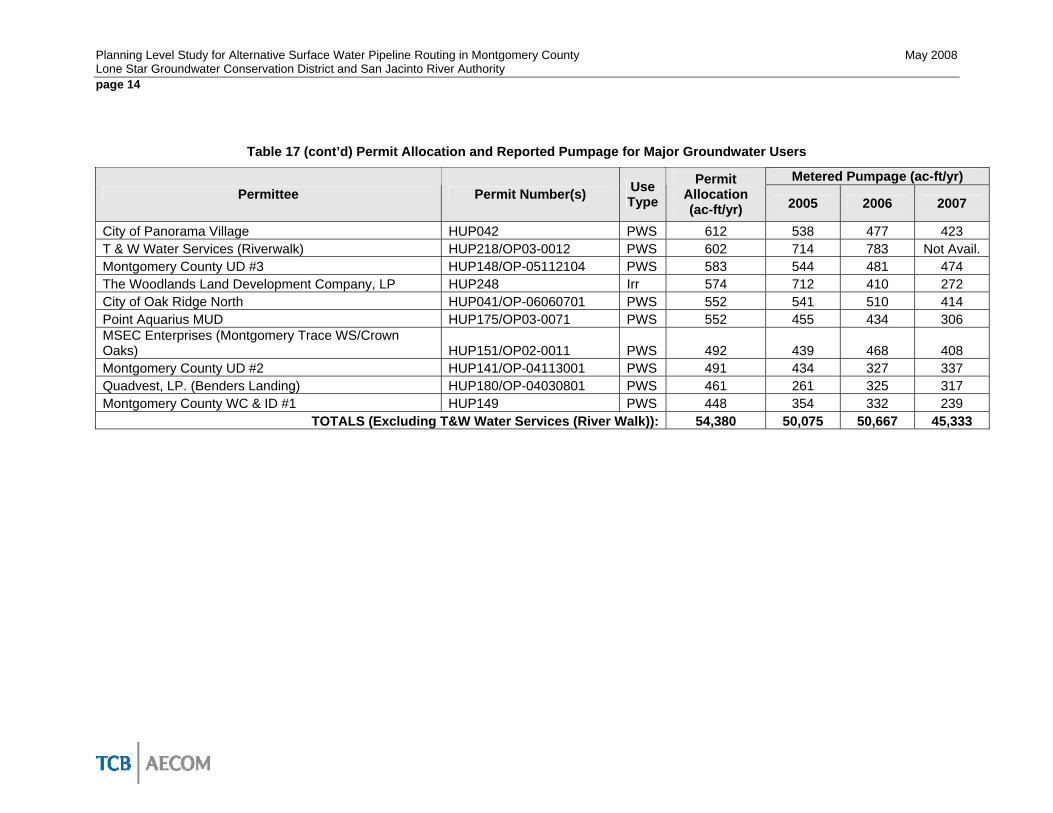
Permittees are required to report annual metered pumpage and are penalized for pumping more than their permit allocation. A large percentage of the total permitted pumpage is represented by a relatively small number of permits: permitted allocations above the 95th percentile account for approximately 70% of the total permitted volume. Table 17 lists permittees at or above the 95th percentile, their permitted allocation, and their historic use from 2005-2007.

May 2008 Planning Level Study for Alternative Surface Water Pipeline Routing in Montgomery County Lone Star Groundwater Conservation District and San Jacinto River Authority
page 13
Table 17 Permit Allocation and Reported Pumpage for Major Groundwater Users
Metered Pumpage (ac-ft/yr) Permittee Permit Number(s) Use
Type Permit
Allocation (ac-ft/yr) 2005 2006 2007
San Jacinto River Authority HUP193/OP03-0050 PWS 16,404 18,473 18,172 16,043 City of Conroe HUP038/OP02-0001 PWS 9,121 8,956 9,304 8,414 City of Houston HUP1300001 PWS 2,964 3,029 2,812 2,458 Montgomery County MUD #18 HUP138/OP-05060201 PWS 1,768 1,127 1,131 1,092 Porter Special Utility District HUP177/OP03-0006 PWS 1,720 1,558 1,571 1,444 Rayford Road MUD HUP184/OP-05101901 PWS 1,412 1,329 1,312 1,119 Southern Montgomery County MUD HUP199/OP-06032301 PWS 1,350 1,220 1,293 1,199 New Caney MUD HUP154/OP03-0073 PWS 1,181 975 945 988 Montgomery County MUD #8 HUP145/OP-05112102 PWS 1,019 943 640 634 Huntsman Petrochemical Corp. HUP099 Ind 972 601 626 502 City of Willis HUP045/OP-07062601 PWS 918 59 656 680 Montgomery County MUD #89 (Also MUD 88) OP03-0043 PWS 902 345 540 703 Montgomery County MUD #9 HUP147/OP-06081401 PWS 837 563 779 543 City of Shenandoah HUP043/OP-04113002 PWS 813 742 821 768 City of Splendora HUP044/OP-04062801 PWS 792 745 738 805 Montgomery County UD #4 HUP143/OP-05112101 PWS 773 730 649 460 Entergy Gulf States / Lewis Creek Plant HUP072 Ind 768 369 727 657 Stanley Lake MUD HUP213/OP-04031003 PWS 705 512 497 446 River Plantation MUD HUP187 PWS 693 519 518 427 Montgomery County MUD #19 HUP140/OP03-0021 PWS 675 588 625 599
Green Valley Growers HUPAG1500020/OP03-0002 Irr 659 85 246 296
City of Magnolia HUP039/OP-04041601 PWS 654 494 393 422 Kings Manor MUD HUP107/OP03-0058 PWS 644 390 373 336 Spring Creek Utility District HUP210/OP03-0075 PWS 640 468 454 338 Montgomery County MUD #83 HUP146/OP-04042802 PWS 615 151 287 298 Quadvest, LP. 1 (Lake Windcrest WS) HUP178/OP03-0025 PWS 615 826 796 473
Metered Pumpage (ac-ft/yr) Permittee Permit Number(s) Use
Type Permit
Allocation (ac-ft/yr) 2005 2006 2007
City of Panorama Village HUP042 PWS 612 538 477 423 T & W Water Services (Riverwalk) HUP218/OP03-0012 PWS 602 714 783 Not Avail. Montgomery County UD #3 HUP148/OP-05112104 PWS 583 544 481 474 The Woodlands Land Development Company, LP HUP248 Irr 574 712 410 272 City of Oak Ridge North HUP041/OP-06060701 PWS 552 541 510 414 Point Aquarius MUD HUP175/OP03-0071 PWS 552 455 434 306 MSEC Enterprises (Montgomery Trace WS/Crown Oaks) HUP151/OP02-0011 PWS 492 439 468 408 Montgomery County UD #2 HUP141/OP-04113001 PWS 491 434 327 337 Quadvest, LP. (Benders Landing) HUP180/OP-04030801 PWS 461 261 325 317 Montgomery County WC & ID #1 HUP149 PWS 448 354 332 239
TOTALS (Excluding T&W Water Services (River Walk)): 54,380 50,075 50,667 45,333
ning Level Study for Alternative Surface Water Pipeline Routing in Montgomery County May 2008 e Star Groundwater Conservation District and San Jacinto River Authority
Table 17 (cont’d) Permit Allocation and Reported Pumpage for Major Groundwater Users
PlanLonpage 14

May 2008 Planning Level Study for Alternative Surface Water Pipeline Routing in Montgomery County Lone Star Groundwater Conservation District and San Jacinto River Authority
page 15
As can be seen in Table 17, the reported pumpage varies; it is primarily influenced by climatic conditions, changes in population, and significant changes in commercial demands. In the years shown, 2005 was a relatively dry year, while 2006 and 2007 were relatively wet years. Total rainfall amounts in the Conroe area for the years 2005-2007 are 29.73 in, 55.11 in, and 50.52 inches respectively. Figure 2 shows the monthly rainfall amounts for 2005 – 2007.
Figure 2 Monthly Rainfall Amounts for the Conroe Area: 2005 - 2007
0.00
5.00
10.00
15.00
20.00
25.00
Jan Feb Mar Apr May Jun Jul Aug Sep Oct Nov Dec
Month
Rai
nfal
l (in
)
2005 2006 2007
For many of the permittees in Table 17, pumpage in the last three years was lowest in 2007: this can primarily be explained by the fact that 2007 was a wet year, and rainfall was relatively higher in the high demand months of July and August. While 2006 had more total rainfall than 2007, most of it (40%) occurred in October. San Jacinto River Authority, the largest groundwater user in the County, experienced increased population from 2005 to 2007, but used 13% less groundwater in 2007 compared to 2005. The City of Conroe, the second largest groundwater user, used 6% less groundwater in 2007 than in 2005 despite population increasing roughly 3% per year. Overall for the users listed, 2007 pumpage was 9.5% lower than 2005 pumpage.
2.2.2.2 Comparison of Reported Pumpage to Regional Planning Demands
Many of the large groundwater users in Table 17 are also WUGs in the Region H 2006 RWP. Table 18 shows a comparison, where applicable, of the Region H water demand for 2005 to the 2005 reported pumpage for large water users. For the entities listed, the total 2005 reported pumpage is 12.9% higher than the total projected demand in the Region H RWP. Three possible reasons for large differences between the Region H projections and actual usage are: a different rate of population growth than projected based on growth in the 1990’s, changes in per capita usage rates, and an unexpected arrival or departure of a major commercial interest (particularly applicable in smaller PWSs). Where there are large differences, it can be difficult to determine whether the rate of demand change will continue in the future, or whether the change is due to short-term effects.

Planning Level Study for Alternative Surface Water Pipeline Routing in Montgomery CountyLone Star Groundwater Conservation District and San Jacinto River Authority page 16
Table 18 Comparison of Region H Demands to 2005 Reported Pumpage for Large Users
Permittee 2005 Region H Demand (ac-
ft/yr)
2005 Reported Pumpage (ac-
ft/yr) %
Difference
San Jacinto River Authority 14,193 18,473 30.2%City of Conroe 8,255 8,956 8.5%Montgomery County MUD #18 1,203 1,127 -6.3%Porter Special Utility District 1,619 1,558 -3.8%Rayford Road MUD 1,548 1,329 -14.2%Southern Montgomery County MUD 1,470 1,220 -17.0%New Caney MUD 1,168 975 -16.5%Montgomery County MUD #8 786 943 19.9%City of Willis 496 692 39.5%Montgomery County MUD #9 689 563 -18.3%City of Shenandoah 515 742 44.0%City of Splendora 157 745 374.5%Montgomery County UD #4 785 730 -7.0%Stanley Lake MUD 525 512 -2.5%River Plantation MUD 820 519 -36.7%Montgomery County MUD #19 468 588 25.6%City of Magnolia 254 494 94.5%Spring Creek Utility District 421 468 11.1%City of Panorama Village 687 538 -21.7%Montgomery County UD #3 449 544 21.2%City of Oak Ridge North 623 541 -13.1%Point Aquarius MUD 502 455 -9.5%Montgomery County UD #2 448 434 -3.2%Montgomery County WC & ID #1 461 354 -23.1%
TOTALS: 38,542 43,499 12.9%
May 2008 Planning Level Study for Alternative Surface Water Pipeline Routing in Montgomery County Lone Star Groundwater Conservation District and San Jacinto River Authority
page 17
2.3 Existing Environmental Conditions
The proposed project is located in Montgomery County in the Piney Woods Natural Region of Texas. The topography is generally rolling and primarily timbered. The project area is crossed by many creeks and includes two lakes. Soils consist of loam, sand and alluvium. The entire project is located within the San Jacinto River Basin. Lake Conroe will provide the surface water for the proposed project with the potential for a Dual Plant Alternative to provide water from the West Fork of the San Jacinto River (WFSJR) near its convergence with Lake Creek. For a map of existing environmental conditions please refer to Appendix J for the Environmental Constraints Map.
2.3.1 Land Use and Population
Based on the 2006 aerial photographs, the project area is approximately 65% urban and 35% wooded. According to the Texas State Data Center and Office of the State Demographer (2007), the current population estimate for Montgomery County is 412,665 and the estimate for the City of Conroe is 53,424. This represents a population increase of 40.5% in Montgomery County and 45.1% in the City of Conroe between the year 2000 and 2007. Population projections for Montgomery County represent additional growth as follows; 483,105 by 2020, 596,820 by 2030, and 717,590 by 2040.
2.3.2 Vegetation
The Piney Woods Natural Region of Texas includes three vegetation types: “Pine Hardwood Forest”, “Young Forest/Grassland” and “Other Native or Introduced Grasses” as defined by The Vegetation Types of Texas (TPWD 1984).
The following plants are commonly associated with “Pine Hardwood Forest”, “Young Forest/Grassland” and “Other Native or Introduced Grasses”: shortleaf pine, loblolly pine, water oak, white oak, southern red oak, winged elm, beech, blackgum, magnolia, American beautyberry, American hornbeam, flowering dogwood, yaupon, hawthorn, supplejack, Virginia creeper, wax myrtle, red bay, sassafras, southern arrowwood, poison oak, greenbriar, blackberry, sweetgum, post oak, black hickory, elm, hackberry, sumac, holly, blueberry, beaked panicum, bitter sneezeweed, blackjack oak, broomsedge bluestem, brownseed paspalum, bushclover, cedar, common persimmon, eastern redcedar, elbowbush, gay feather, Indiangrass, little bluestem, purpletop, sand post oak, sand lovegrass, sandjack oak, slender bluestem, spranglegrass, three-awn, tickclover, velvet bundleflower, yellow jessamine, yellow neptunia, red bay and mixed native or introduced grasses and forbs (TPWD 1984)..
Bottomland Hardwood Forests Another vegetation type common to the Piney Woods is bottomland hardwood forest systems. They are the most diverse Texas ecosystems and are considered a high priority conservation effort for the TPWD. Bottomland wetlands are plant communities that have been created as a result of the actions of creeks, rivers and floodplains and are generally part of a system that begins at a river’s headwaters and ends in an estuary at the ocean. They play a vital role in maintaining water quality by serving as a depository for sediments, wastes and pollutants from runoff.
Historically, oak, ash, hickory, gum, and cottonwood species were common in the Piney Woods along the major river drainages such as the Trinity, Red River, Sulphur, Sabine, Angelina, Neches, and Attoyac. These hardwood trees grew very large in the rich bottomland soil. Early accounts described oaks, ashes, and hickories up to diameters of 6, 4, and 3 feet, respectively. Much of this timber was being harvested and rafted out along the rivers. Local factories were being constructed to utilize the hardwood material.

Planning Level Study for Alternative Surface Water Pipeline Routing in Montgomery CountyLone Star Groundwater Conservation District and San Jacinto River Authority page 18
In addition to the commercial harvest of the bottomland forest, settlers were clearing the forests for settlement and agricultural production in the nutrient rich soils. Much of the area previously occupied by bottomland hardwood forests has been converted to other uses. Many thousands of acres of bottomland hardwood forest have been lost due to reservoir construction. The construction of dams along major river drainages has resulted in the upstream flooding and loss of bottomland hardwood forests. As mentioned previously, these bottomland areas contain highly productive soils. Therefore, thousands of acres of bottomland hardwood forests have been lost due to conversion to agricultural production.
2.3.3 Threatened and Endangered Species
The Endangered Species Act (ESA) provides for the protection of all listed threatened and endangered species from “take”, defined as “to harass, harm, pursue, hunt, shoot, wound, kill, trap, capture, or collect or attempt to engage in any such conduct.” “Harm” is further defined by U.S. Fish and Wildlife Service (USFWS) to include significant habitat modification or degradation that results in death or injury to listed species by significantly impairing behavioral patterns such as breeding, feeding, or sheltering. “Harass” is defined by USFWS as “actions that create the likelihood of injury to listed species to such an extent as to significantly disrupt normal behavior patterns which include, but are not limited to, breeding, feeding or sheltering” (50 CFR §17.3). Two species listed as threatened or endangered in Montgomery County with potential habitat in the project area are the bald eagle and the red-cockaded woodpecker. Potential habitat for these species has been mapped on the Environmental Constraints Map in Appendix J.
Table 19 Threatened and Endangered Species for Montgomery County, Texas
Species USFWS* TPWD* Known Occurrence in Project Area
American Peregrine Falcon DL E No Arctic Peregrine Falcon DL T No Bald Eagle DL T Yes Piping Plover T T No Red-cockaded Woodpecker E E Yes White-faced Ibis - T No Wood Stork - T No Creek Chubsucker - T No Paddlefish - T No Louisiana Black Bear T T No Rafinesque’s Big-eared Bat - T No Red Wolf E E No Alligator Snapping Turtle - T No Louisiana Pine Snake - T No Texas Horned Lizard - T No Timber/Canebrake Rattlesnake - T No E=endangered, T=threatened, DL=delisted
Source: TPWD, 2007.
Bald Eagle The bald eagle (Haliaeetus leucocephalus) has staged a remarkable rebound and has recovered to the point that they no longer need protection under the ESA. Effective August 8, 2007, the bald eagle was delisted from the USFWS list of threatened and endangered species. The bird will still be protected by the Migratory Bird Treaty Act and the Bald and Golden Eagle Protection Act. Both laws prohibit killing, selling or otherwise harming eagles, their nests, or eggs. Bald eagles are found primarily near seacoasts, rivers,

May 2008 Planning Level Study for Alternative Surface Water Pipeline Routing in Montgomery County Lone Star Groundwater Conservation District and San Jacinto River Authority
page 19
and large lakes where food resources such as fish and waterfowl are readily available. Eagles usually build their nests in 40- to 120-foot tall trees or on cliffs.
Red-cockaded Woodpecker The red-cockaded woodpecker (Picoides borealis) sleeps and nests in the cavities of live, large, mature pine trees in east Texas and the southeastern United States. The nesting season is usually from April through July. In Texas, these cavities have been found in longleaf, loblolly, shortleaf, and slash pines approximately 60 to 70 years of age or older. The woodpecker prefers a cluster of trees containing and surrounding the cavity trees where they roost and nest. The preferred cluster sites are mature, park-like pine stands with 50 to 80 square feet of basal area per acre. The decline of the red-cockeded woodpecker is attributed to the decrease in the quality and quantity of old growth pine forest nesting habitat, primarily due to short rotation timber management and to a lesser extent fire suppression.
When alignments are finalized a field study of the entire project area should be completed by a qualified biologist to determine if the project would impact the bald eagle or red-cockaded woodpecker. Additional permitting may be required for construction. Potential impacts to threatened and endangered species should be evaluated and best management practices for construction as well as mitigation opportunities should be documented. Coordination may be required through the county or local municipalities as well as the USFWS and/or TPWD.
2.3.4 Cultural Resources
The Antiquities Code of Texas was passed in 1969 and requires that the Texas Historical Commission (THC) review any action that has the potential to disturb historic and archeological sites on public land. In 1995 the Texas Antiquities Committee, which was created in 1969, was abolished and the THC became the legal custodian of the Antiquities Code, and therefore, all cultural resources, historic and prehistoric, within public domain of the State of Texas.
According to the THC there are 59 historic markers, 2 national register properties and 64 cemeteries located in Montgomery County. Of these resources there is only one cemetery adjacent to the project.
Archeological site records are maintained by the Texas Archeological Research Laboratory (TARL) in Austin, Texas. Research was conducted by a qualified environmental specialist at TARL to locate archeological resources in the proposed project vicinity and digitize them into an electronic file. Resources that were identified by TARL are indicated in orange on the Environmental Constraints Map in Appendix J. Based on an initial research and a desktop survey, one archeological site, Record #100, may be impacted by the proposed project. However, it is possible that new archeological evidence could be discovered along utility corridors or creek crossings during excavation. If resources are discovered during excavation, construction work would cease until the proper THC authorities were notified.
2.3.5 Oil and Gas Pipelines
A review of available oil and gas information from the Railroad Commission of Texas was conducted. Water transmission lines for the proposed project cross over oil and gas pipelines. Pipelines are identified on the Environmental Constraints Map in Appendix J. The pipelines crossed are owned by fourteen various entities and are crossed more than once in some cases.

Planning Level Study for Alternative Surface Water Pipeline Routing in Montgomery CountyLone Star Groundwater Conservation District and San Jacinto River Authority page 20
2.3.6 Public Lands
The TPWD regulates activities which require the acquisition of any public land “designated and used prior to the arrangement of the program or project as a park, recreation area, scientific area, wildlife refuge, or historic site” under Chapter 26 of the Texas Parks and Wildlife Code.
While there are multiple parks in Montgomery County and the City of Conroe located within one mile of the proposed alignments, there are no impacts expected to parks due to encroachment because none are directly adjacent to the project. Refer to the Environmental Constraints Map in Appendix J for the location of parks in the project area.
While several schools are near the project area, only six campuses are directly adjacent to the proposed alternatives. A field survey is recommended to confirm any potential encroachment on public lands. Further coordination with the Conroe ISD, Magnolia ISD, and the school campuses where construction impacts may occur is recommended.
2.3.7 Waters of the United States
The U.S. Army Corps of Engineers (USACE) is the regulatory agency for activities that may impact waters of the U.S. Under Section 404 of the Clean Water Act, a permit is required from the USACE for any activity involving the discharge of dredged or fill material into waters of the U.S., including wetlands. Dependent on the scope and type of impacts to waters of the U.S., authorizations may be in one of three primary forms: general permit, a letter of permission, or a standard individual permit. A study of the surface water resources for the proposed project included a review of the USGS topographic maps and aerial photographs. The project area will require additional field surveys to determine the extent of waters of the U.S. as defined by the USACE. The survey will identify the ordinary high water mark on drainage features and identification of potential wetlands.
There are several drainage crossings within the project limits. Depending on the proposed method of construction the water transmission lines may tunnel around the various segments of the water bodies and therefore impacts may be avoided. Potential impacts can be assessed when the alignments are finalized and the construction method for the water transmission lines is determined.
2.3.8 Wetlands
Wetlands are defined as lands transitional between terrestrial and aquatic systems where the water table is usually at or near the surface or the land is covered by shallow water. An area shall be classified as a wetland if it meets the USACE three parameter technical criteria as outlined in the USACE 1987 Wetlands Delineation Manual. Three parameters for wetland determination include prevalence of hydrophytic vegetation, hydric soil formation, and presence of adequate hydrology.
As mentioned above, the USACE regulates activities that may impact waters of the U.S. Under Section 404 of the Clean Water Act, a permit is required from the USACE for any activity involving the discharge of dredged or fill material into waters of the U.S., including wetlands.
The National Wetland Inventory (NWI) Quad Maps (USFWS, 1992) produced by the USFWS have been used to identify potential wetlands mapped in the project area. The NWI maps indicate the presence of wetlands in the project area and those areas are shown on the Environmental Constraints Map in Appendix J.

May 2008 Planning Level Study for Alternative Surface Water Pipeline Routing in Montgomery County Lone Star Groundwater Conservation District and San Jacinto River Authority
page 21
When alignments are finalized a field study and wetland mapping should be completed for the entire project area by a qualified wetland scientist. Additional permitting may be required for construction. Potential impacts to wetlands should be evaluated and best management practices for construction as well as mitigation opportunities should be documented. Coordination may be required through the county or local municipalities as well as the USFWS. If wetlands are disturbed during the construction of the water treatment facility, an intake site, or the water transmission lines additional permitting and mitigation may be required.
2.3.9 Water Quality
The Texas Commission on Environmental Quality (TCEQ) is required under Section 303(d) of the Clean Water Act to identify water bodies for which effluent limitations are not stringent enough to implement water quality standards and for which the associated pollutants are suitable for measurement by maximum daily load. The TCEQ develops a schedule identifying Total Maximum Daily Loads (TMDLs) that will be initiated in the next two years (from June 27, 2007) for priority impaired waters.
According to TCEQ’s Draft 2006 303(d) List, the project is located near three impaired stream segments or tributaries to impaired segments which are described in detail below. Category 5 water bodies comprise the 303(d) List. A Category 5 water body does not meet applicable water quality standards or is threatened for one or more designated uses by one or more pollutants. Being classified as Category 5a means a TMDL is underway, scheduled, or will be scheduled. Being classified as Category 5b means a review of the water quality standards for the water body will be conducted before a TMDL is scheduled. Being classified as Category 5c means that additional data and information will be collected before a TMDL is scheduled.
The WFSJR is a freshwater stream that begins at the confluence of Spring Creek in Harris/Montgomery County and travels to the Conroe Dam in Montgomery County. This portion of the San Jacinto River is defined as Segment 1004 and is in the San Jacinto River Basin. In 2004, only the area from IH 45 to the Spring Creek confluence was identified as Category 5c and was impaired for bacteria on the TCEQ’s 303(d) List. The updated Draft 2006 303(d) List identifies the area from IH 45 to the Spring Creek confluence as Category 5a and still impaired for bacteria. Additionally, in 2006 the WFSJR from Lake Conroe Dam to IH 45 is identified as Category 5c and as impaired for macrobenthic community.
Upper Panther Branch is an unclassified water body and freshwater stream in the San Jacinto River Basin. This stream is defined as Segment 1008B and is an intermittent stream with perennial pools from the normal pool elevation of 125 feet of Lake Woodlands upstream to Old Conroe Road. The segment is identified as Category 5a and was first listed in 2006. The impaired area of the segment is from Old Conroe Road to the confluence with Bear Branch for bacteria.
Spring creek is a freshwater stream that begins at the confluence with the WFSJR in Harris/Montgomery County and extends to the most upstream crossing of FM 1736 in Waller County. This creek is defined as Segment 1008 and is in the San Jacinto River Basin. This freshwater stream is impaired for bacteria from SH 249 to IH 45 and IH 45 to confluence with Lake Houston.
Issuance of permits to discharge into 303(d)-listed water bodies is described in the TCEQ regulatory guidance document Procedures to Implement the Texas Surface Water Quality Standards (August 2002, RG-194). Further coordination with the TCEQ is recommended once final alignments are determined and construction methods are known.
Compliance with the TCEQ’s Texas Pollutant Discharge Elimination System (TPDES) General Permit for Construction Activities is required if a project disturbs one or more acres. The project described in this document would disturb more than one acre and would be required to adhere to the conditions of the

Planning Level Study for Alternative Surface Water Pipeline Routing in Montgomery CountyLone Star Groundwater Conservation District and San Jacinto River Authority page 22
TPDES General Permit. A Storm Water Pollution Prevention Plan must be prepared and incorporated in to the construction plans.
2.3.10 Floodplains
The National Flood Insurance Program (NFIP) was established to reduce future flood losses through local floodplain management. NFIP requires participating cities, counties, or states, to adopt floodplain management ordinances containing certain minimum requirements intended to reduce future flood losses. The local jurisdiction is responsible for coordinating with the Federal Emergency Management Agency (FEMA) any alterations or relocation of a waterway and proposals for amendments to NFIP maps should it be necessary.
The proposed water treatment facilities, intake facility, and many portions of the transmission lines are located in existing floodplains mapped as Zone A or AE by FEMA on the Flood Insurance Rate Maps (FIRM). Refer to the Environmental Constraints Map in Appendix J for the locations of the 100-year and 500-year floodplain areas.
Zone A is defined as an area with a 1% annual chance of flooding and a 26% chance of flooding over the life of a 30-year mortgage. Because detailed analyses are not performed for such areas; no depths or base flood elevations are shown within these zones.
Zone AE is defined as an area with a 1% annual chance of flooding and a 26% chance of flooding over the life of a 30-year mortgage. In most instances, base flood elevations derived from detailed analyses are shown at selected intervals within these zones. Mandatory flood insurance purchase requirements apply to all of these zones. An initial environmental survey of floodplain maps associated with the project area has identified that these creeks and tributaries have been modeled.
Construction and modification of these floodplains may require coordination with the local Montgomery County Floodplain Administrator. The Engineering Division of the City of Conroe is charged with the maintenance and enforcement of the City's floodplain and floodway ordinances as mandated by the NFIP. The City Engineer operates in the capacity of the Certified Floodplain Administrator (CFM). While only a portion of the proposed water transmission lines are located within the City Limits of Conroe it will be necessary to request a Floodplain Letter from the City to aide in identifying if a parcel in the proposed construction area is affected by the 100-year Floodplain. The purpose of a FIRM is to show the areas in our community that have a 1% or greater chance of flooding in any given year, known as Special Flood Hazard Areas (SFHAs). Further, the project may require FEMA to make an official determination regarding the location of the project relative to the SFHA, and may trigger the need for a Letter of Map Amendment (LOMA) or a Letter of Map Revision Based on Fill (LOMR-F). LOMAs and LOMR-Fs are documents issued by FEMA that officially remove a property and/or structure from the SFHA. To obtain a LOMA or LOMR-F, the applicant must submit mapping and survey data for the property. In most cases, the applicant will need to hire a land surveyor to prepare an Elevation Certificate for the property. The issuance of a LOMA or LOMR-F eliminates the federal flood insurance purchase requirement as a condition of federal or federally backed financing.
2.3.11 Groundwater
Montgomery County is located over the Gulf Coast aquifer which forms a wide swath along the Gulf of Mexico from Florida to Mexico. In Texas, this aquifer provides water for municipal and irrigation uses to all or parts of 54 counties and extends from the Rio Grande to the Louisiana-Texas border. The Greater Houston metropolitan area is the largest municipal user of water from this aquifer in Texas.

May 2008 Planning Level Study for Alternative Surface Water Pipeline Routing in Montgomery County Lone Star Groundwater Conservation District and San Jacinto River Authority
page 23
There are no known water wells located within the proposed right-of-way. No reservoir, aquifer, well, or any other actively used source of public water would be impacted by the proposed project, either during or following construction.
2.3.12 Hazardous Materials
The Resource Conservation and Recovery Act (RCRA) of 1976 governs the management of non-hazardous solid waste, hazardous waste, and underground storage tanks (USTs). Specifically, the RCRA program regulates: solid waste recycling and disposal; federal procurement of products containing recycled materials; waste minimization; hazardous waste generators and transporters; hazardous waste treatment; and storage and disposal facilities.
The Comprehensive Environmental Response, Compensation and Liability Act (CERCLA) approved in 1980, is best known for its “Superfund,” program and provides EPA with the authority to respond to releases or threatened releases of hazardous substances, pollutants, or contaminants that may endanger human health or the environment. Superfund was primarily designed to remedy the mistakes in hazardous waste management made in the past at sites that have been abandoned or where a sole responsible party cannot be identified. CERCLA requires reporting of releases, establishes the liability of persons responsible for releases of hazardous substances, and established a trust fund to provide cleanup when no responsible party can be identified.
A review of selected regulatory environmental databases published by federal and state agencies was conducted via the internet to determine the potential for environmental degradation in the project limits.
The environmental databases provide information on regulated facilities that are listed as having a past or present record of actual or potential environmental impact. The listings are limited and include only those sites that are known to the regulatory agencies at the time of publication to be contaminated or in the process of evaluation for potential contamination. The following is a list of the federal and state databases that were reviewed;
• TCEQ State Superfund List
• TCEQ Municipal Solid Waste Sites/Landfills
• TCEQ Permitted Industrial and Hazardous Waste Sites
• TCEQ Radioactive Waste Sites
• EPA Toxic Release Inventory (TRI)
Based on the regulatory database review of the project limits, few regulated or other suspect hazardous material facilities were identified in the project area.
One superfund site, United Creosoting, is located directly adjacent to the proposed water transmission lines for both the Single Plant and Dual Plant Alternative. Refer to the Environmental Constraints Map in Appendix J for the location of this site. A summary of the site’s description, status, and detailed location map can be found in Appendix K.
A visual reconnaissance of the project limits is recommended to confirm the location of the listed regulatory facilities; look for evidence of underground or aboveground storage tanks; and look for ground stains or other indications that contaminated soils occur within the project.
Planning Level Study for Alternative Surface Water Pipeline Routing in Montgomery CountyLone Star Groundwater Conservation District and San Jacinto River Authority page 24
2.3.13 Air Quality
The Clean Air Act (CAA) was passed in 1963 which established permanent federal support for air pollution research and provided federal assistance to states for development of pollution control agencies. The CAA has been amended several times; beginning in 1970 the Clean Air Act Amendment (CAAA) established National Ambient Air Quality Standards (NAAQS) for six air pollutants (Ozone, Carbon Monoxide, Particulate Matter, Nitrogen Dioxide, Sulfur Dioxide and Lead). The CAA was amended again in 1977 which strengthened the CAA by establishing deadlines for reaching air quality attainment status, requiring the development and implementation of the State Implementation Plans (SIPs) to bring air quality non-attainment areas into compliance with NAAQS. The original Texas SIP was approved by EPA in May 1972 and has been revised several times thereafter. The CAA’s most recent amendment was in 1990 which established specific criteria that must be met for air quality in non-attainment areas.
Montgomery County along with Brazoria, Chambers, Fort Bend, Galveston, Harris, Liberty and Waller counties, collectively referred to as the Houston-Galveston-Brazoria (HGB), hold non-attainment status for ground level ozone under the eight-hour standard. The region was classified as being in “moderate” non-attainment of the eight-hour standard and was given a maximum attainment deadline of June 15, 2010.
All activities associated with the construction of the proposed project would be required to comply with the current Texas SIP.

May 2008 Planning Level Study for Alternative Surface Water Pipeline Routing in Montgomery County Lone Star Groundwater Conservation District and San Jacinto River Authority
page 25
2.4 Existing Raw Water Quality
The proposed alternatives would potentially draw water from one or more surface water locations. The first potential site is Lake Conroe, near the San Jacinto River Authority (SJRA) Lake Conroe Dam. The second potential source water site is the West Fork of the San Jacinto River, 6.9 miles south of the dam.
Raw water quality data from Lake Conroe is very limited. Previously recommended sampling and testing of the water quality is still needed to finalize treatment process selection. Limited water quality data is obtained from USGS website “National Water Information System”, where the water quality of Lake Conroe (USGS 08067600) is continuously monitored. The assessment of the “Overall Public Water Supply Use” is “FULLY SUPPORTING”, which means that there are no major chemical or biological contaminates of concern. Conventional treatment methods should be capable of treating the water for drinking purposes.
There is no raw water quality data for the West Fork San Jacinto River that would be applicable to the Woodlands Area Plant Site. However, the source water is 6.9 miles north at Lake Conroe. There are no heavy industrial or agricultural activities along the river between Lake Conroe and the proposed river intake. The water quality at this site should be similar to, but slightly worse than and more variable than the water quality in Lake Conroe. An additional suspended solids sediment load due to movement of the water in the river is expected. This additional sediment load could still be treated with conventional treatment systems.
At either plant site location, the water quality is anticipated to fully support public water supply use, but specific water quality parameters need to be verified by sampling and testing.
Water quality data collected from Lake Conroe at the Intake Structure East Gate is provided in Appendix B and summarized in Table 20 and Table 21 below.

Planning Level Study for Alternative Surface Water Pipeline Routing in Montgomery CountyLone Star Groundwater Conservation District and San Jacinto River Authority page 26
The monthly testing summary for Lake Conroe water quality, as collected at the Intake Structure East Gate, is summarized below for October through December 2007.
Table 20 Lake Conroe Water Quality - Monthly Testing Summary
Analyte Units 10/01/07 10/24/07 11/28/07 12/19/07 Alkalinity, bicarbonate mg/L as Ca CO3 65.5 68.0 66.6 Note 1
Alkalinity, carbonate mg/L as Ca CO3 < 1.0 < 1.0 < 1.0 Note 1
Alkalinity, total mg/L as Ca CO3 65.5 68.0 66.6 Note 1
Hardness, calcium mg/L as Ca CO3 55 60 63 Note 1
Hardness, magnesium mg/L as Ca CO3 7.9 8.6 8.8 Note 1
Hardness, total mg/L as Ca CO3 63 69 72 Note 1
Color Pt/CO units 40 40 30 Note 1
Odor TON < 1.00 < 1.00 < 1.00 Note 1
Sodium mg/L 12 13 14 Note 1
Turbidity NTU 4.1 4.5 3.6 Note 1
Total dissolved solids mg/L 130 130 120 Note 1
Total suspended solids mg/L < 10 < 10 < 10 Note 1
Total organic carbon mg/L 7.48 7.23 7.83 Note 1
Dissolved oxygen mg/L Not given 6.61 8.25 8.83 Air temperature F Not given 58 56 68 Temperature C Not given 22.3 16.14 15.13 Conductivity umho/cm Not given 209.4 212.2 205.1 pH s.u. Not given 8.13 8.32 7.68 Secci Depth inches Not given 42 40 42 SJRA Results Summary, Monthly Testing, Intake Structure East Gate. This report is a Results Summary of tests previously performed and reported. Test results were reported by Nova Biologicals, Inc., U/L Laboratories, and LCRA Environmental Laboratory Services. 1 No results were reported for this test date.

May 2008 Planning Level Study for Alternative Surface Water Pipeline Routing in Montgomery County Lone Star Groundwater Conservation District and San Jacinto River Authority
page 27
The quarterly testing summary for Lake Conroe water quality, as collected at the Intake Structure East Gate, is summarized below for the late November 2007 testing.
Table 21 Lake Conroe Water Quality - Quarterly Testing Summary
Analyte Units 11/28/07 Aluminum ug/L 37 Ammonia-nitrogen mg/L < 0.1 Bromide mg/L 0.08 Calcium mg/L 25 Chloride mg/L 21 Fluoride mg/L 2.2 Iron mg/L 0.068 Manganese ug/L 97 Magnesium mg/L 2.1 Orthophosphate-phosphorus mg P/L < 0.05 Potassium mg/L 3.4 Silicon mg/L 9.6 Sulfate (as SO4) mg/L < 5.0 Total kjeldhal kitrogen (TKN) mg/L 0.6 Total Nitrate (as N) mg/L 0.22 Total Nitrite (as N) mg/L 0.05 Total Phosphorus (as P) mg P/L 0.09 UV 254 absorbance cm-1 0.136 Carbonaceous BOD mg/L < 3.0 Chemical oxygen demand ug/L 16 Chlorophyll-A mg/L 18.4 E.coli / fecal coliform mpn/100ml 1.0 Total coliform mpn/100ml 547.5 SJRA Results Summary, Quarterly Testing, Intake Structure East Gate. This report is a Results Summary of tests previously performed and reported. Test results were reported by Nova Biologicals, Inc., U/L Laboratories, and LCRA Environmental Laboratory Services.

Planning Level Study for Alternative Surface Water Pipeline Routing in Montgomery CountyLone Star Groundwater Conservation District and San Jacinto River Authority page 28

May 2008 Planning Level Study for Alternative Surface Water Pipeline Routing in Montgomery County Lone Star Groundwater Conservation District and San Jacinto River Authority
page 29
Section 3 Future Conditions & Needs
3.1 Desired Conversion
The levels of future conversion are based on projected water demands and available information on the direction of the Districts’ regulatory planning efforts. This section discusses the planning assumptions made in establishing conversion requirements, the development of conversion requirements for 2015, 2025, 2035, and 2045, and seasonal issues affecting plant sizing.
3.1.1 “Saw Tooth” Curve
The District’s Phase I Regulatory Plan requires groundwater consumption in Montgomery County to be at or below 64,000 acre-feet/year by the year 2015. Given that the District does not have regulations covering conversions beyond 2015, an assumption had to be made regarding the requirements for future conversions. This study adopts a “minimum conversion” approach consistent with the 2006 Phase I study; groundwater consumption must be reduced to the target in 2015, 2025, 2035, and 2045, but increased demands due to growth between those conversion points can be met by groundwater. Figure 3 illustrates this concept.
Figure 3 Conversion Phasing
0
50,000
100,000
150,000
200,000
2000 2010 2020 2030 2040 2050
Year
Tota
l Wat
er D
eman
d (a
cre-
feet
/yea
r)
64,000 a-f
(earliest conversion is in 2015)
Approximately 25,000 af/yr (22.5 mgd) conversion steps

Planning Level Study for Alternative Surface Water Pipeline Routing in Montgomery CountyLone Star Groundwater Conservation District and San Jacinto River Authority page 30
This approach has important consequences: it has the benefit of minimizing the extent, size and cost of facilities, but allows groundwater withdrawals to periodically exceed the sustainable recharge rate of the aquifer system. Given the relatively short timeframe to implement a surface water system to meet the Phase I DRP requirements, this is the most expedient approach. Over time, the District will be evaluating the conditions that affect how the groundwater resources are managed: these include population growth, change in demands due to aggressive conservation and wastewater reuse, and the results of a District-funded aquifer recharge rate study currently being conducted by the United States Geological Society (USGS). District regulations on groundwater use can change periodically to reflect conditions at that point in time.
3.1.2 Phasing Requirements
As discussed in the above section, the amount of conversion in each decade, starting in 2015, is just enough to bring total groundwater consumption in the County to 64,000 ac-ft/yr at that point in time; i.e. a “minimum conversion” approach. Table 22 gives the minimum conversion requirements by decade and is based on projected demands in the Region H RWP.
Table 22 Minimum Phasing Requirements
2015 (I) 2025 (II) 2035 (III) 2045 (IV)
Total Demand (ac-ft/yr) from 2006 RWP1 89,543 113,716 137,435 166,175
Demand Met By Surface Water (ac-ft/yr)2 7,840 7,840 7,840 7,840
Demand Met By Groundwater (ac-ft/yr) 81,703 105,876 129,595 158,335
Minimum Conversion Amount (ac-ft/yr) 17,703 41,876 65,595 94,335
Minimum Conversion Amount (mgd) 15.8 37.4 58.6 84.2 1. Demands prorated from published decadal values (e.g. 2015 demands are an average of 2010 and 2020 demands) 2. Steam-electric contract amount
The total demand is broken down into surface water and groundwater components of supply; the demand met by surface water is the volume of water provided by contract from Lake Conroe to the steam-electric WUG. The demand met by groundwater is the basis for conversion: that number minus 64,000 ac-ft/yr gives the minimum conversion amount for each decade. For the purposes of this study, the minimum conversion amount is the volume of water that the surface water system must be capable of delivering on an annual basis.
These amounts are predicated on regional planning projections, and these projections are based on usage rates established in the year 2000. Climate alone can change the total demand and thus the required conversion. In a relatively dry year such as a repeat of 2000 or 2005, the surface water system may provide all the water it is capable of, but in a wet year such as a repeat of 2007 the demand on the system could be less than the total capacity of the system components.
3.1.2.1 Conservation Effects
The regional planning projections take a small amount of conservation into account through increased projected use of water saving plumbing fixtures, but do not take aggressive conservation or use of reclaimed water into account. The District and SJRA encourage conservation and the use of reclaimed water, and the District is currently evaluating conservation and reuse incentives as ways to reduce total

May 2008 Planning Level Study for Alternative Surface Water Pipeline Routing in Montgomery County Lone Star Groundwater Conservation District and San Jacinto River Authority
page 31
demand and groundwater demand into the future, thereby reducing or delaying the need for expansion of surface water facilities beyond 2015.
A 2007 investigation into wastewater reuse opportunities in Montgomery County showed there is the potential for 12% of the County’s total demand to be met by reclaimed water. Assuming that countywide, aggressive conservation could reduce total demands by 10%, the surface water required in 2045 would be reduced from 94,335 ac-ft/yr to 73,581 ac-ft/yr. This could significantly extend the supply in Lake Conroe and delay the need to bring in additional surface water supplies from other sources such as Lake Houston.
3.1.3 Seasonal Demand Issues
Required conversion volumes are on an annual basis, and it is assumed that the treatment plant(s) would operate such that average day demands are supplied. A PWSs’ actual daily demand is typically either below or above the average daily rate throughout the year. Over the course of a year if no more than average daily flow is delivered to any PWS, the actual volume consumed is less than the yearly demand. Said another way, if no more than average daily flow is delivered, there is a limit to how much of any PWS’s annual demand can be converted to surface water.
Table 23 illustrates this concept by showing the monthly demand from an actual PWS, the available supply (average day constant throughout the year), and the volume of surface water actually supplied. The surface water volume supplied is the lesser of the demand and the available supply in each month. In this example, the annual demand and available supply is 397,647 thousand gallons and the volume supplied is 357,948 thousand gallons. The conversion rate for this PWS is 90% (357,948/397,647). In this case it took 1.09 mgd of available supply to deliver 0.98 mgd on the average.
Table 23 Seasonal Supply Example
Demand Available Supply Volume Supplied Month (x 1,000 gal) (x 1,000 gal) (x 1,000 gal)
Jan 24,358 33,137 24,358 Feb 22,479 33,137 22,479 Mar 25,523 33,137 25,523 Apr 30,170 33,137 30,170 May 38,785 33,137 33,137 Jun 46,822 33,137 33,137 Jul 39,688 33,137 33,137 Aug 37,311 33,137 33,137 Sep 35,971 33,137 33,137 Oct 39,946 33,137 33,137 Nov 29,715 33,137 29,715 Dec 26,879 33,137 26,879
TOTALS: 397,647 397,647 357,948
The conversion rate will vary depending on the usage pattern, but it would typically be below 90% when the supply is provided at a rate equal to the average daily rate on an annual basis.
Consideration of this issue is important when the goal is to minimize the amount of transmission pipeline by converting a smaller number of PWSs at a high rate. In those cases the water treatment plant may have to have capacity above the average day rate to handle achieving the desired conversion; i.e. the plant will require a peaking factor. If the desired level of conversion can’t be met with a plant delivering water at an

Planning Level Study for Alternative Surface Water Pipeline Routing in Montgomery CountyLone Star Groundwater Conservation District and San Jacinto River Authority page 32
average day rate, the two options are to “peak the plant” or deliver water to enough PWSs so that the overall conversion rate is lowered. In the example above, the conversion rate at which no peaking to the plant would be required would be 68% (the ratio of minimum month to average month: 22,479/33,137).
The variability in daily demands versus supply is discussed in Section 4.1.3. The daily demands should be reviewed further during subsequent preliminary engineering efforts and the results may impact the overall plan and costs.
3.2 Pipeline Distribution System
3.2.1 Preliminary Alignment Corridor
A preliminary alignment corridor, shown in Exhibit 5, was identified in the Groundwater Regulatory Plan and Facilities Implementation Plan report (Phase I Study). This corridor was established with a desktop level routing analysis for the purpose of establishing high-level planning costs and water rates. While there was no significant Right of Way (ROW) analysis performed during the Phase I Study, there was significant communication between the District and the regulated community in terms of the general approach. This communication was in the form of public meetings and a series of presentations given to various cities and water districts throughout the County. The basic assumptions of the Phase I Study solution presented to stakeholders represents an accepted starting point for this study; the assumptions being that a treatment plant at or near Lake Conroe and a relatively compact transmission system would be used to convert the densely populated I-45 corridor initially.
The 2020, 2030, and 2040 phases in the Phase I Study were generally not adopted in the current study. For the Lake Conroe system, the Phase I Study showed Southwest Montgomery County as being served starting in 2030: this area will likely continue to develop as low-density ranch style communities, requiring an extensive network of transmission lines to deliver the required conversion volumes.
Using the Phase I Study alignment as a general starting point, the proposed alignment was established based upon stakeholder input regarding available right-of-way, proposed planning alignments, demand phasing, proposed plant locations, and constructability issues. The revised preliminary alignment corridor is discussed in more detail in Section 3.2.2 below.
3.2.2 Revised Alignment Corridor
Two proposed pipeline alignments to supply surface water in Montgomery County in the future are considered in this phase of the study:
1. Single Plant Alignment: The single plant alignment has one water treatment plant located by Lake Conroe which is the sole source of water supply for the proposed alignment.
2. Dual Plant Alignment: The dual plant alignment has two proposed water treatment plants. The first one is located by Lake Conroe (north plant) and the second one is on the West Fork of San Jacinto River (WFSJR) north of the Woodlands (south plant). In this option, water is released from Lake Conroe to the San Jacinto River and withdrawn downstream from the West Fork of San Jacinto River where the second proposed treatment plant is located.
The two alignment alternatives are shown in Exhibit 6. The revised alignment corridors are also shown in Exhibit 22 through Exhibit 28.
Timelines (2015, 2035 and 2045) for the surface water pipelines for both the single and dual treatment plant options are presented in Exhibit 7. The proposed 2015 system can deliver an amount up to 21 MGD. In

May 2008 Planning Level Study for Alternative Surface Water Pipeline Routing in Montgomery County Lone Star Groundwater Conservation District and San Jacinto River Authority
page 33
2035, the proposed pipelines are extended to the west of Lake Conroe and to west and south-west areas in the County. The 2035 system can deliver up to approximately 66 MGD. The 2045 system is extended east of Lake Conroe, south of Conroe, and in the south-east area of the County and can deliver up to approximately 90 MGD. The pipeline segments for the single and dual plant options are presented in Exhibit 8 and Exhibit 9 respectively. A summary of pipeline lengths for the single and dual plant options are presented in Table 24.
Table 24 Summary of Pipeline Lengths
Single Plant Dual Plant System Year (ft) (miles) (ft) (miles) 2015 294,681 55.8 266,850 50.5 2035 232,542 44.0 253,206 48.0 2045 179,389 34.0 179,387 34.0
The feasibility and recommended construction method for these alignments were analyzed and a recommended location within the right-of-way or an adjacent easement was identified. Among the constraints that were considered as part of this recommendation are public agency input, visible or planned utilities within the right-of-way, access/room for construction, existing waterways and topography, existing and planned infrastructure, environmental considerations, and other anticipated impacts of construction.
A detailed narrative of the entire alignment, grouped by segment, is provided in Appendix C.
3.2.2.1 Pipeline Sizing
Surface water pipelines are sized for both single and dual treatment plant options. The pipelines are sized using the Pipe2008 (version 4.102) software program developed by KYPipe. Table 25 provides a list of criteria used to size the pipelines.
Table 25 Criteria Used to Size Surface Water Pipelines
Pipeline Sizing
Pipelines sized for average day flow. Peaking will be done by existing groundwater facilities.
Hazen-Williams formula used to calculate head loss. C value = 120 to 140.
Maximum flow velocity allowed is 5.5 ft/sec.
Pipelines sized assuming a maximum head loss of 5 feet per 1,000 feet of pipe.
Maximum working pressure of pipe material is 150 psi.
Maintain 20 psi at the ground at the end of the alignment to enable filling of storage tanks.

Planning LevLone Star Ground
el Study for Alternative Surface Water Pipeline Routing in Montgomery Countywater Conservation District and San Jacinto River Authority
page 34
Surge analysis was not conducted during this study. The operational impacts of lower demands on the water pipeline sized for larger flows should be investigated and addressed during subsequent preliminary engineering efforts. The lower demands on the water pipeline sized for larger flows may impact the overall plan and costs.
3.2.2.1.1 Model Demand
The pipelines are sized for 90% of 2045 demand amounts at each of the PWSs supplied, allowing a total flow of approximately 90 mgd. The 2045 demand amounts are developed by interpolating the 2040 and 2050 demand projections from 2006 Region H Regional Water Plan which were spatially distributed and aggregated to ‘Demand Planning Areas’ during the Phase I Facility Planning Study. Spatial distribution is based on the U of H Small Area Model (provided by Dr. Steven Craig).
The ‘Demand Planning Areas’ are developed for the purpose of planning and do not have any regulatory jurisdiction. Water demand amounts broken down by PWSs and demand planning areas are presented in Table 26.
Demand for the Woodlands is divided into each entry point based on the ultimate flow rate at each well as presented in Table 27. Demand for the City of Conroe is divided into each entry point based on the tested capacity (GPM) of the wells. Water demand at each entry point for the City of Conroe is presented in Table 28.
For the rest of the PWSs, the demand data is split into different entry points of each PWS based on their tested GPM or capacity listed in the TCEQ website. For any PWSs where no information was available to split the total demand into different entry points, the total demand was distributed evenly between the different entry points (Ex. City of Shenandoah). Water demand amounts at each of the PWS entry points are presented in Exhibit 10.
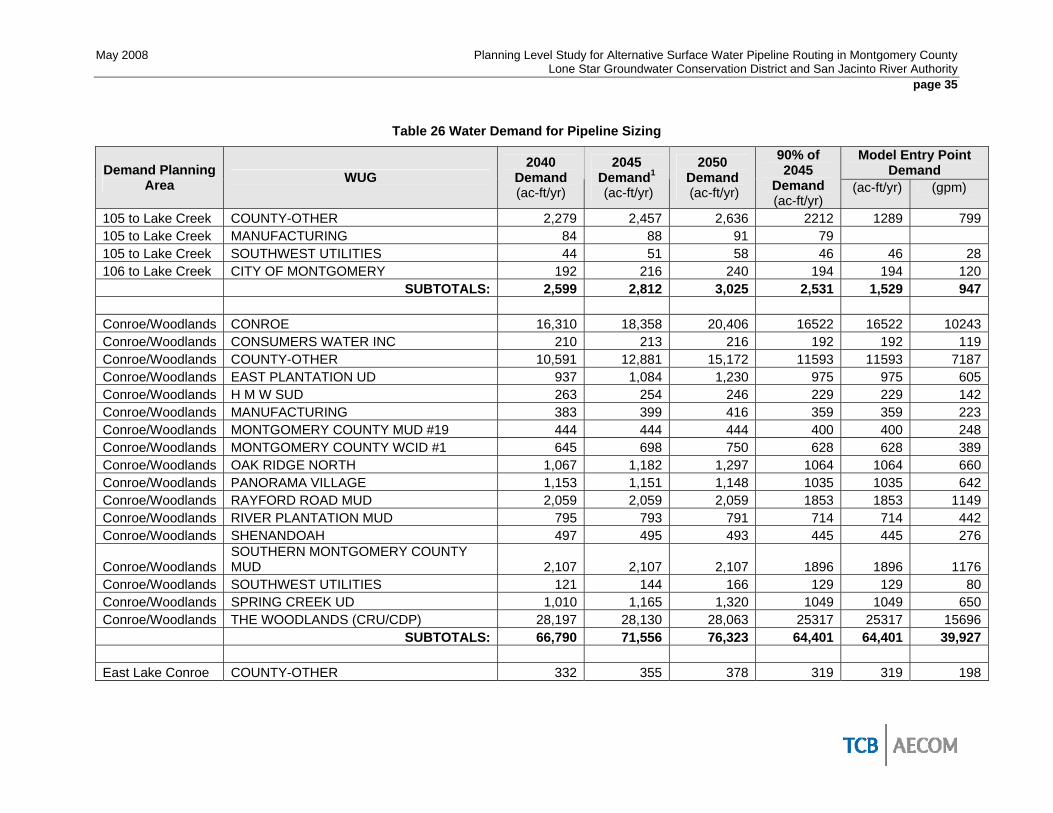
May 2008 Planning Level Study for Alternative Surface Water Pipeline Routing in Montgomery County Lone Star Groundwater Conservation District and San Jacinto River Authority
page 35
Table 26 Water Demand for Pipeline Sizing
Model Entry Point Demand Demand Planning
Area WUG 2040
Demand (ac-ft/yr)
2045 Demand1 (ac-ft/yr)
90% of 2045
Demand (ac-ft/yr)
2050 Demand (ac-ft/yr) (ac-ft/yr) (gpm)
105 to Lake Creek COUNTY-OTHER 2,279 2,457 2,636 2212 1289 799 105 to Lake Creek MANUFACTURING 84 88 91 79 105 to Lake Creek SOUTHWEST UTILITIES 44 51 58 46 46 28 106 to Lake Creek CITY OF MONTGOMERY 192 216 240 194 194 120 SUBTOTALS: 2,599 2,812 3,025 2,531 1,529 947 Conroe/Woodlands CONROE 16,310 18,358 20,406 16522 16522 10243 Conroe/Woodlands CONSUMERS WATER INC 210 213 216 192 192 119 Conroe/Woodlands COUNTY-OTHER 10,591 12,881 15,172 11593 11593 7187 Conroe/Woodlands EAST PLANTATION UD 937 1,084 1,230 975 975 605 Conroe/Woodlands H M W SUD 263 254 246 229 229 142 Conroe/Woodlands MANUFACTURING 383 399 416 359 359 223 Conroe/Woodlands MONTGOMERY COUNTY MUD #19 444 444 444 400 400 248 Conroe/Woodlands MONTGOMERY COUNTY WCID #1 645 698 750 628 628 389 Conroe/Woodlands OAK RIDGE NORTH 1,067 1,182 1,297 1064 1064 660 Conroe/Woodlands PANORAMA VILLAGE 1,153 1,151 1,148 1035 1035 642 Conroe/Woodlands RAYFORD ROAD MUD 2,059 2,059 2,059 1853 1853 1149 Conroe/Woodlands RIVER PLANTATION MUD 795 793 791 714 714 442 Conroe/Woodlands SHENANDOAH 497 495 493 445 445 276
Conroe/Woodlands SOUTHERN MONTGOMERY COUNTY MUD 2,107 2,107 2,107 1896 1896 1176
Conroe/Woodlands SOUTHWEST UTILITIES 121 144 166 129 129 80 Conroe/Woodlands SPRING CREEK UD 1,010 1,165 1,320 1049 1049 650 Conroe/Woodlands THE WOODLANDS (CRU/CDP) 28,197 28,130 28,063 25317 25317 15696 SUBTOTALS: 66,790 71,556 76,323 64,401 64,401 39,927 East Lake Conroe COUNTY-OTHER 332 355 378 319 319 198

Planning Level Study for Alternative Surface Water Pipeline Routing in Montgomery County May 2008 Lone Star Groundwater Conservation District and San Jacinto River Authority page 36
Model Entry Point Demand Demand Planning
Area WUG 2040
Demand (ac-ft/yr)
2045 Demand1 (ac-ft/yr)
2050 Demand (ac-ft/yr)
90% of 2045
Demand (ac-ft/yr)
(ac-ft/yr) (gpm)
East Lake Conroe MANUFACTURING 1 1 1 1 East Lake Conroe MONTGOMERY COUNTY UD #2 507 507 507 456 456 283 East Lake Conroe POINT AQUARIUS MUD 1,732 2,040 2,348 1836 1836 1138 SUBTOTALS: 2,572 2,903 3,234 2,613 2,612 1,619 Lake Creek to 1488 COUNTY-OTHER 2,049 2,474 2,899 2226 SUBTOTALS: 2,049 2,474 2,899 2,226 0 0 Northeast COUNTY-OTHER 5,298 5,748 6,198 5173 3386 2099 Northeast CUT AND SHOOT 348 389 430 350 Northeast MANUFACTURING 260 271 282 244 Northeast SOUTHWEST UTILITIES 144 191 237 172 172 106 Northeast WILLIS 1,024 1,160 1,296 1044 1044 647 SUBTOTALS: 7,074 7,759 8,443 6,983 4,602 2,852 Northwest COUNTY-OTHER 2,212 2,372 2,532 2135 1657 1027 Northwest MANUFACTURING 855 891 927 802 Northwest SOUTHWEST UTILITIES 93 67 41 60 60 Northwest STEAM ELECTRIC POWER 6,745 7,818 8,890 7036 7036 4362 SUBTOTALS: 9,905 11,148 12,390 10,033 8,753 5,389 Southeast CONSUMERS WATER INC 156 202 248 182 Southeast COUNTY-OTHER 17,961 21,390 24,819 19251 3513 2178 Southeast CRYSTAL SPRINGS WATER COMPANY 1,189 1,379 1,568 1241 Southeast HOUSTON 516 610 704 549 Southeast MANUFACTURING 1,298 1,353 1,408 1218 1218 755 Southeast MINING 229 211 192 189
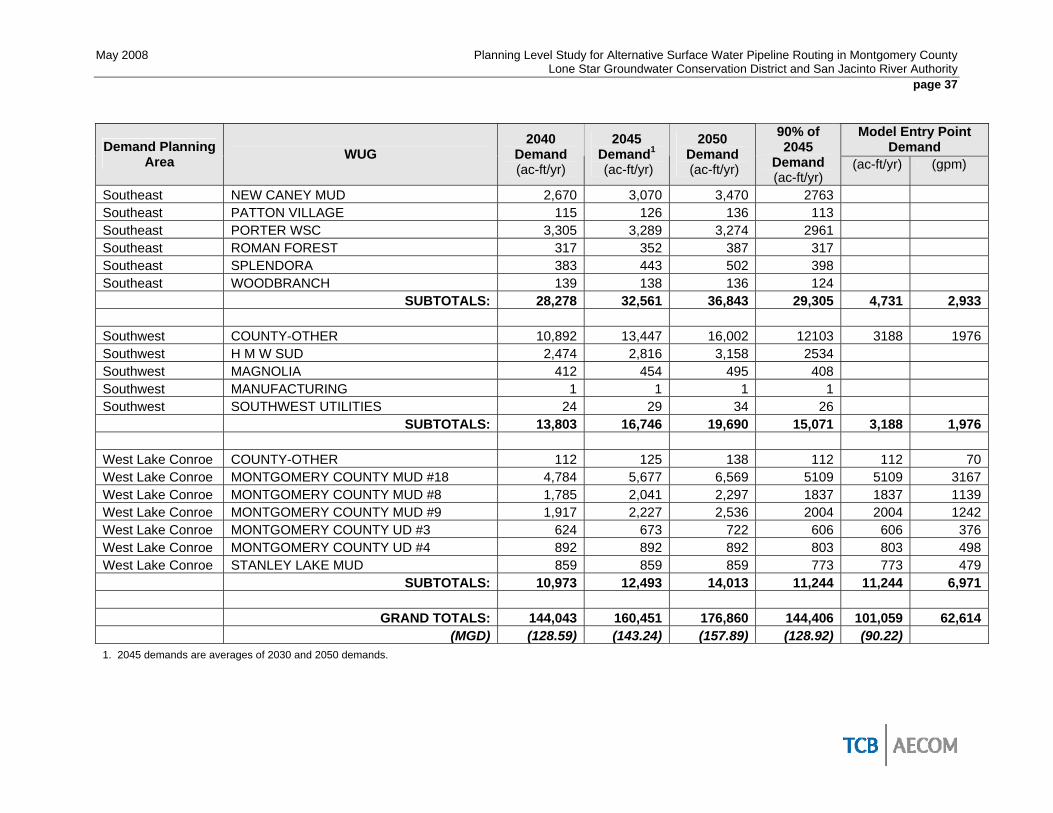
May 2008 Planning Level Study for Alternative Surface Water Pipeline Routing in Montgomery County Lone Star Groundwater Conservation District and San Jacinto River Authority
page 37
Model Entry Point Demand Demand Planning
Area WUG 2040
Demand (ac-ft/yr)
2045 Demand1 (ac-ft/yr)
90% of 2050 2045 Demand Demand (ac-ft/yr) (ac-ft/yr) (ac-ft/yr) (gpm)
Southeast NEW CANEY MUD 2,670 3,070 3,470 2763 Southeast PATTON VILLAGE 115 126 136 113 Southeast PORTER WSC 3,305 3,289 3,274 2961 Southeast ROMAN FOREST 317 352 387 317 Southeast SPLENDORA 383 443 502 398 Southeast WOODBRANCH 139 138 136 124 SUBTOTALS: 28,278 32,561 36,843 29,305 4,731 2,933 Southwest COUNTY-OTHER 10,892 13,447 16,002 12103 3188 1976 Southwest H M W SUD 2,474 2,816 3,158 2534 Southwest MAGNOLIA 412 454 495 408 Southwest MANUFACTURING 1 1 1 1 Southwest SOUTHWEST UTILITIES 24 29 34 26 SUBTOTALS: 13,803 16,746 19,690 15,071 3,188 1,976 West Lake Conroe COUNTY-OTHER 112 125 138 112 112 70 West Lake Conroe MONTGOMERY COUNTY MUD #18 4,784 5,677 6,569 5109 5109 3167 West Lake Conroe MONTGOMERY COUNTY MUD #8 1,785 2,041 2,297 1837 1837 1139 West Lake Conroe MONTGOMERY COUNTY MUD #9 1,917 2,227 2,536 2004 2004 1242 West Lake Conroe MONTGOMERY COUNTY UD #3 624 673 722 606 606 376 West Lake Conroe MONTGOMERY COUNTY UD #4 892 892 892 803 803 498 West Lake Conroe STANLEY LAKE MUD 859 859 859 773 773 479 SUBTOTALS: 10,973 12,493 14,013 11,244 11,244 6,971 GRAND TOTALS: 144,043 160,451 176,860 144,406 101,059 62,614 (MGD) (128.59) (143.24) (157.89) (128.92) (90.22) 1. 2045 demands are averages of 2030 and 2050 demands.
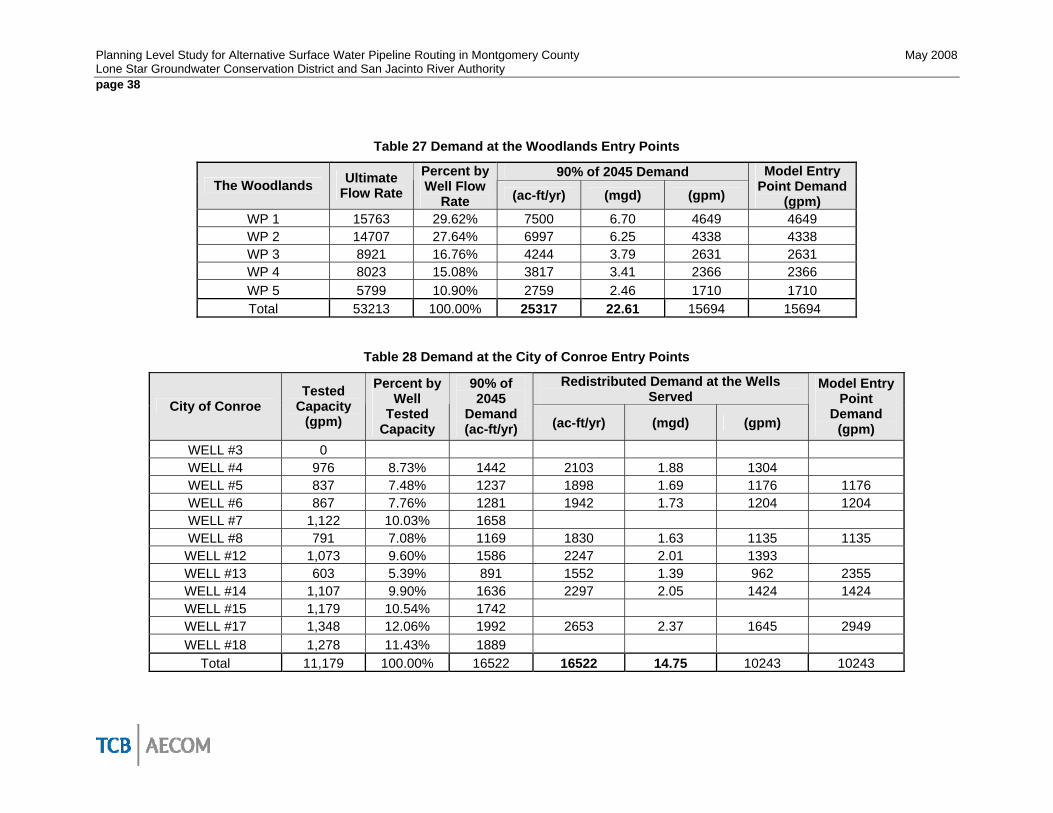
ning Level Study for Alternative Surface Water Pipeline Routing in Montgomery County May 2008 e Star Groundwater Conservation District and San Jacinto River Authority
page 38
Table 27 Demand at the Woodlands Entry Points
90% of 2045 Demand The Woodlands Ultimate
Flow Rate Percent by Well Flow
Rate (ac-ft/yr) (mgd) (gpm)
Model Entry Point Demand
(gpm) WP 1 15763 29.62% 7500 6.70 4649 4649 WP 2 14707 27.64% 6997 6.25 4338 4338 WP 3 8921 16.76% 4244 3.79 2631 2631 WP 4 8023 15.08% 3817 3.41 2366 2366 WP 5 5799 10.90% 2759 2.46 1710 1710 Total 53213 100.00% 25317 22.61 15694 15694
Table 28 Demand at the City of Conroe Entry Points
Redistributed Demand at the Wells Served
City of Conroe Tested
Capacity (gpm)
Percent by Well
Tested Capacity
90% of 2045
Demand (ac-ft/yr) (ac-ft/yr) (mgd) (gpm)
Model Entry Point
Demand (gpm)
WELL #3 0 WELL #4 976 8.73% 1442 2103 1.88 1304 WELL #5 837 7.48% 1237 1898 1.69 1176 1176 WELL #6 867 7.76% 1281 1942 1.73 1204 1204 WELL #7 1,122 10.03% 1658 WELL #8 791 7.08% 1169 1830 1.63 1135 1135 WELL #12 1,073 9.60% 1586 2247 2.01 1393 WELL #13 603 5.39% 891 1552 1.39 962 2355 WELL #14 1,107 9.90% 1636 2297 2.05 1424 1424 WELL #15 1,179 10.54% 1742 WELL #17 1,348 12.06% 1992 2653 2.37 1645 2949 WELL #18 1,278 11.43% 1889
Total 11,179 100.00% 16522 16522 14.75 10243 10243
PlanLon
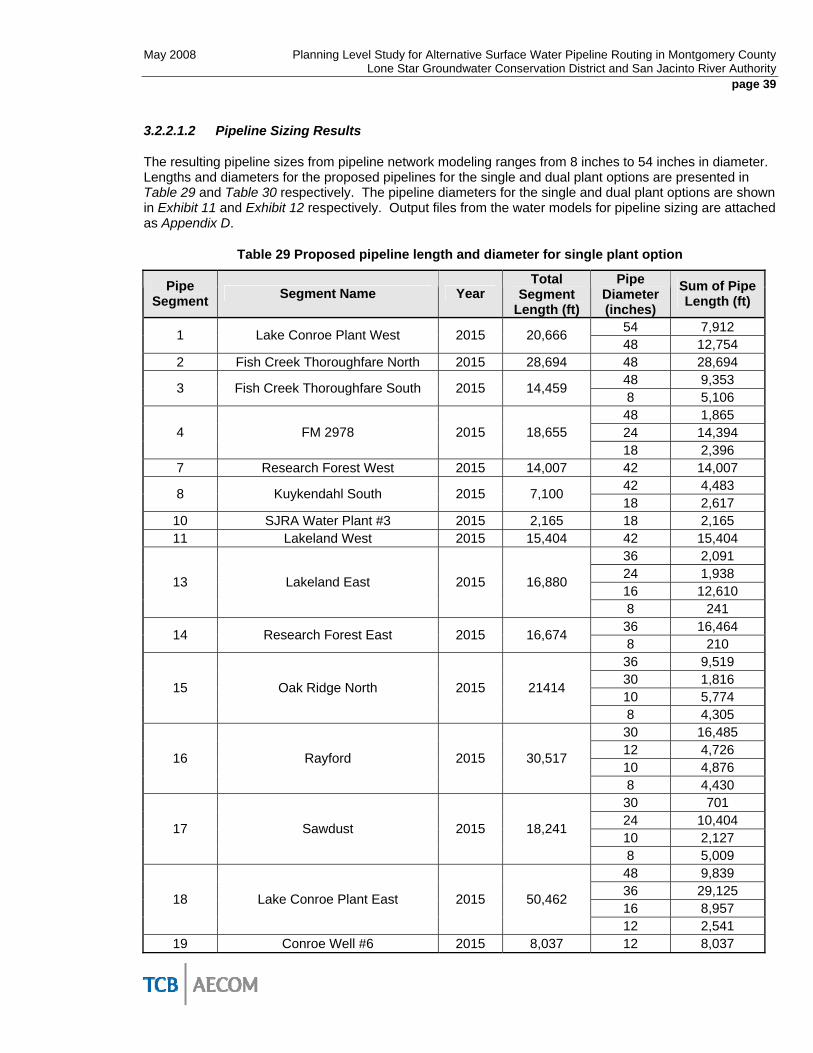
May 2008 Planning Level Study for Alternative Surface Water Pipeline Routing in Montgomery County Lone Star Groundwater Conservation District and San Jacinto River Authority
page 39
3.2.2.1.2 Pipeline Sizing Results
The resulting pipeline sizes from pipeline network modeling ranges from 8 inches to 54 inches in diameter. Lengths and diameters for the proposed pipelines for the single and dual plant options are presented in Table 29 and Table 30 respectively. The pipeline diameters for the single and dual plant options are shown in Exhibit 11 and Exhibit 12 respectively. Output files from the water models for pipeline sizing are attached as Appendix D.
Table 29 Proposed pipeline length and diameter for single plant option
Pipe Segment Segment Name Year
Total Segment
Length (ft)
Pipe Diameter (inches)
Sum of Pipe Length (ft)
54 7,912 1 Lake Conroe Plant West 2015 20,666 48 12,754
2 Fish Creek Thoroughfare North 2015 28,694 48 28,694 48 9,353 3 Fish Creek Thoroughfare South 2015 14,459 8 5,106 48 1,865 24 14,394 4 FM 2978 2015 18,655 18 2,396
7 Research Forest West 2015 14,007 42 14,007 42 4,483 8 Kuykendahl South 2015 7,100 18 2,617
10 SJRA Water Plant #3 2015 2,165 18 2,165 11 Lakeland West 2015 15,404 42 15,404
36 2,091 24 1,938 16 12,610
13 Lakeland East 2015 16,880
8 241 36 16,464 14 Research Forest East 2015 16,674 8 210 36 9,519 30 1,816 10 5,774
15 Oak Ridge North 2015 21414
8 4,305 30 16,485 12 4,726 10 4,876
16 Rayford 2015 30,517
8 4,430 30 701 24 10,404 10 2,127
17 Sawdust 2015 18,241
8 5,009 48 9,839 36 29,125 16 8,957
18 Lake Conroe Plant East 2015 50,462
12 2,541 19 Conroe Well #6 2015 8,037 12 8,037

Planning Level Study for Alternative Surface Water Pipeline Routing in Montgomery CountyLone Star Groundwater Conservation District and San Jacinto River Authority page 40
Pipe Segment Segment Name Year
Total Pipe Sum of Pipe Segment Diameter Length (ft) Length (ft) (inches) 30 5,827 24 4,990 16 259
20 UP Railroad 2015 11,306
12 230 12 46,833 21 FM2854 West 2035 71,205 8 24,372 24 26,872 18 65,559 12 8,303
22 Lake North West 2035 106,723
10 5,989 23 Millers Crossing 2035 3,259 12 3,259
16 5,205 12 28,800 10 3,356
24 South West Extension 2035 51,355
8 13,994 25 FM2854 Loop 2045 42,281 12 42,281
30 27,878 24 15,985 16 7,493 12 23,569
26 Lake North East 2045 80,387
8 5,462 24 17,659 16 3,561 10 10,488
27 Crighton Ridge River Plantation 2045 36,539
8 4,831 28 Oak Ridge 2045 Extension 2045 9,924 8 9,924 29 Spring Creek UD 2045 10,258 10 10,258
Table 30 Proposed pipeline length and diameter for dual plant option
Pipe Segment Segment Name Year
Total Segment
Length (ft)
Pipe Diameter (inches)
Sum of Pipe Length (ft)
30 7,912 1 Lake Conroe Plant West 2035 20,667 12 12,755 24 9,353 3 Fish Creek Thoroughfare South 2015 14,460 8 5,107 24 16,259 4 FM 2978 2015 18,655 18 2,396
5 Sendera-Conroe 2015 15,028 24 15,028 48 23,290 6 Woodlands Plant 2015 27,666 36 4,376
9 Kuykendahl North 2015 6,964 18 6,964

May 2008 Planning Level Study for Alternative Surface Water Pipeline Routing in Montgomery County Lone Star Groundwater Conservation District and San Jacinto River Authority
page 41
Pipe Segment Segment Name Year
Total Pipe Sum of Pipe Segment Diameter Length (ft) Length (ft) (inches) 10 SJRA Water Plant #3 2015 2,164 18 2,164 12 Research Forest Central 2015 8,382 42 8,382
36 2,091 24 1,938 16 12,610
13 Lakeland East 2015 16,880
8 241 36 16,465 14 Research Forest East 2015 16,675 8 210 36 9,519 30 1,816 10 5,775
15 Oak Ridge North 2015 21414
8 4,304 30 16,484 12 4,726 10 4,877
16 Rayford 2015 30,516
8 4,429 30 702 24 10,404 10 2,128
17 Sawdust 2015 18,242
8 5,008 48 9,839 36 29,124 16 8,956
18 Lake Conroe Plant East 2015 50,461
12 2,542 19 Conroe Well #6 2015 8,037 12 8,037
30 5,826 24 4,991 16 259
20 UP Railroad 2015 11,306
12 230 12 46,833 21 FM2854 West 2035 71,205 8 24,372 24 26,872 18 65,559 12 8,302
22 Lake North West 2035 106,722
10 5,989 23 Millers Crossing 2035 3,259 8 3,259
16 5,205 12 17,859 10 6,077
24 South West Extension 2035 51,353
8 22,212 25 FM2854 Loop 2045 42,281 12 42,281
30 27,877 24 15,985
26 Lake North East 2045 80,387
16 7,493

Planning Level Study for Alternative Surface Water Pipeline Routing in Montgomery CountyLone Star Groundwater Conservation District and San Jacinto River Authority page 42
Pipe Segment Segment Name Year
Total Pipe Sum of Pipe Segment Diameter Length (ft) Length (ft) (inches) 12 23,570 8 5,462 24 17,658 16 3,561 10 10,488
27 Crighton Ridge River Plantation 2045 36,538
8 4,831 28 Oak Ridge 2045 Extension 2045 9,924 8 9,924 29 Spring Creek UD 2045 10,257 10 10,257
3.2.2.2 Right of Way
The revised alignment corridor consists of nearly sixty miles of potential alignment corridor. Due to the widespread nature of the existing wells, storage tanks, pumps, and service area distribution systems to be served, use of a large number of various types of right-of-ways must be considered to provide service to this growing and heavily-developed area.
The proposed right-of-way is shown in Exhibit 6 and Exhibit 22 through Exhibit 28. A summary of the major right-of-ways that are under consideration is provided in Table 31 below.

May 2008 Planning Level Study for Alternative Surface Water Pipeline Routing in Montgomery County Lone Star Groundwater Conservation District and San Jacinto River Authority
page 43
Table 31 Summary of Major ROW by Segment
Preliminary Corridor Segment Right-of-Way Description 1 Lake West
Pl t W tSJRA Property, Private, McCaleb Road
2 Fish Creek Throughfare North Fish Creek Thoroughfare, Private, Sendera Ranch Drive (North)
3 Fish Creek Throughfare South Fish Creek Thoroughfare, Sendera Ranch Drive (South), Honea Egypt Road/FM 2978, Private
4 FM 2978 FM 2978, Private 5 Sendera–Conroe Private, Overhead Power Easement 6 Woodlands Plant Private, Overhead Transmission Easement 7 Bear Branch Reservoir Drainage Easement 7A
Research Forest West Research Forest Drive 8 Kuykendahl Kuykendahl Road 9 SJRA Water Plant #3 Drainage Easement
10 Lakeland West Drainage Easement 11 Research Forest Central Drainage Easement 12 Lakeland East Drainage Easement, Vision Park Boulevard, Private 13 Research Forest East Overhead Transmission Easement, Pipeline Easement, Private
14 Oak Ridge North David Memorial Drive, Oak Ridge School Road, Drainage District No. 6 Ditches, Private
15 Rayford Drainage District No. 6 Ditches, Private, Robinson Road, Pipeline Easement, Rayford Road
16 Sawdust Southern Montgomery MUD Drainage Ditches, Gas Easement, Overhead Transmission Easement, Private
17 Lake East SJRA Property, Overhead Power Easement, Private, Longmire Road, FM 3083, N. Frazier Street, N. Loop 336 E, Ditch
18 Conroe Well No. 6 Conroe Sanitary Sewer (Gravity) Easement, Private, Westview Boulevard
19 Downtown Conroe N. 1st Street, Union Pacific Railroad, N. Pacific Street
As shown in Table 32, the only major existing property that can be used as a significant waterline right-of-way is the property owned by the San Jacinto River Authority (SJRA) along the Lake Conroe Dam. This property runs a significant distance in an east-west direction and could be used for both the proposed water treatment plant or the pipeline alignment across the site. A significant number of other properties would potentially be crossed by the proposed alignment and require a waterline easement, but discussion of all private properties potentially requiring an easement is beyond the scope of this report.
Table 32 Summary of Major Property Right-of-Ways
Right-of-Way Proposed Side Primary Issues SJRA Property South Geotechnical, dam, spillways, property width.
Table 33 lists the major streets and roadways with right-of-way that the proposed alignment could potentially run parallel to or within. These roadways are typically either Montgomery County roadways
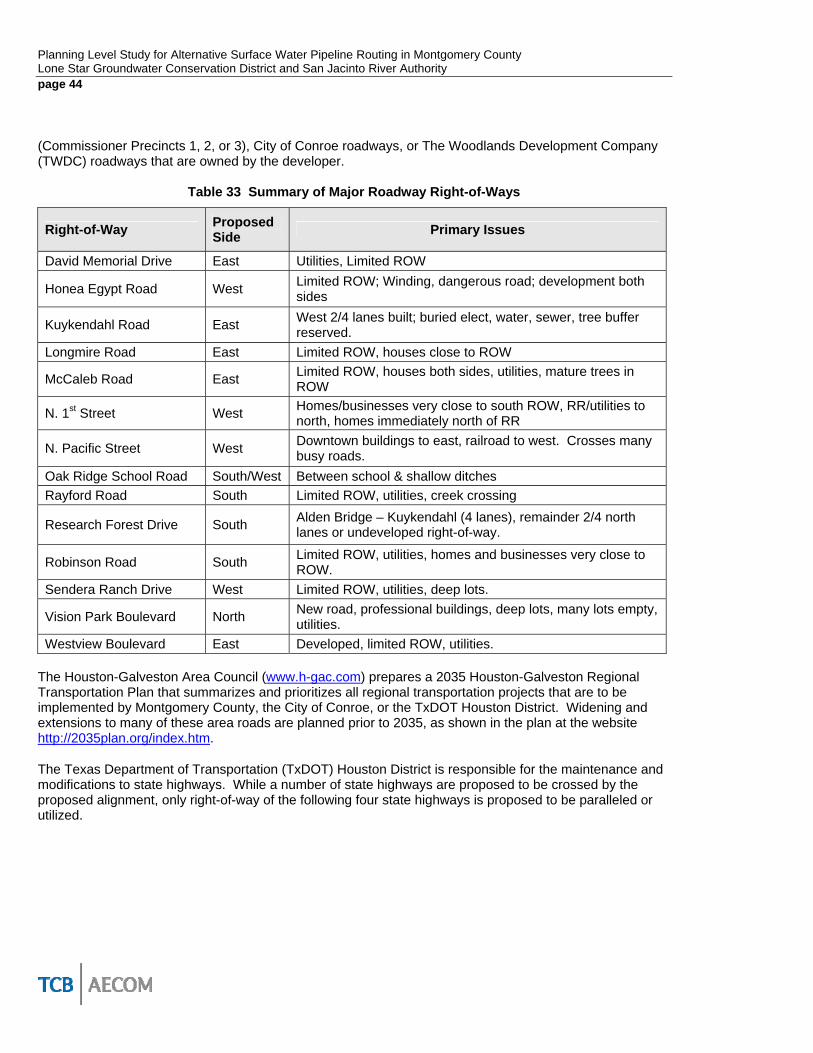
Planning Level Study for Alternative Surface Water Pipeline Routing in Montgomery CountyLone Star Groundwater Conservation District and San Jacinto River Authority page 44
(Commissioner Precincts 1, 2, or 3), City of Conroe roadways, or The Woodlands Development Company (TWDC) roadways that are owned by the developer.
Table 33 Summary of Major Roadway Right-of-Ways
Right-of-Way Proposed Side Primary Issues
David Memorial Drive East Utilities, Limited ROW
Honea Egypt Road West Limited ROW; Winding, dangerous road; development both sides
Kuykendahl Road East West 2/4 lanes built; buried elect, water, sewer, tree buffer reserved.
Longmire Road East Limited ROW, houses close to ROW
McCaleb Road East Limited ROW, houses both sides, utilities, mature trees in ROW
N. 1st Street West Homes/businesses very close to south ROW, RR/utilities to north, homes immediately north of RR
N. Pacific Street West Downtown buildings to east, railroad to west. Crosses many busy roads.
Oak Ridge School Road South/West Between school & shallow ditches Rayford Road South Limited ROW, utilities, creek crossing
Research Forest Drive South Alden Bridge – Kuykendahl (4 lanes), remainder 2/4 north lanes or undeveloped right-of-way.
Robinson Road South Limited ROW, utilities, homes and businesses very close to ROW.
Sendera Ranch Drive West Limited ROW, utilities, deep lots.
Vision Park Boulevard North New road, professional buildings, deep lots, many lots empty, utilities.
Westview Boulevard East Developed, limited ROW, utilities. The Houston-Galveston Area Council (www.h-gac.com) prepares a 2035 Houston-Galveston Regional Transportation Plan that summarizes and prioritizes all regional transportation projects that are to be implemented by Montgomery County, the City of Conroe, or the TxDOT Houston District. Widening and extensions to many of these area roads are planned prior to 2035, as shown in the plan at the website http://2035plan.org/index.htm.
The Texas Department of Transportation (TxDOT) Houston District is responsible for the maintenance and modifications to state highways. While a number of state highways are proposed to be crossed by the proposed alignment, only right-of-way of the following four state highways is proposed to be paralleled or utilized.
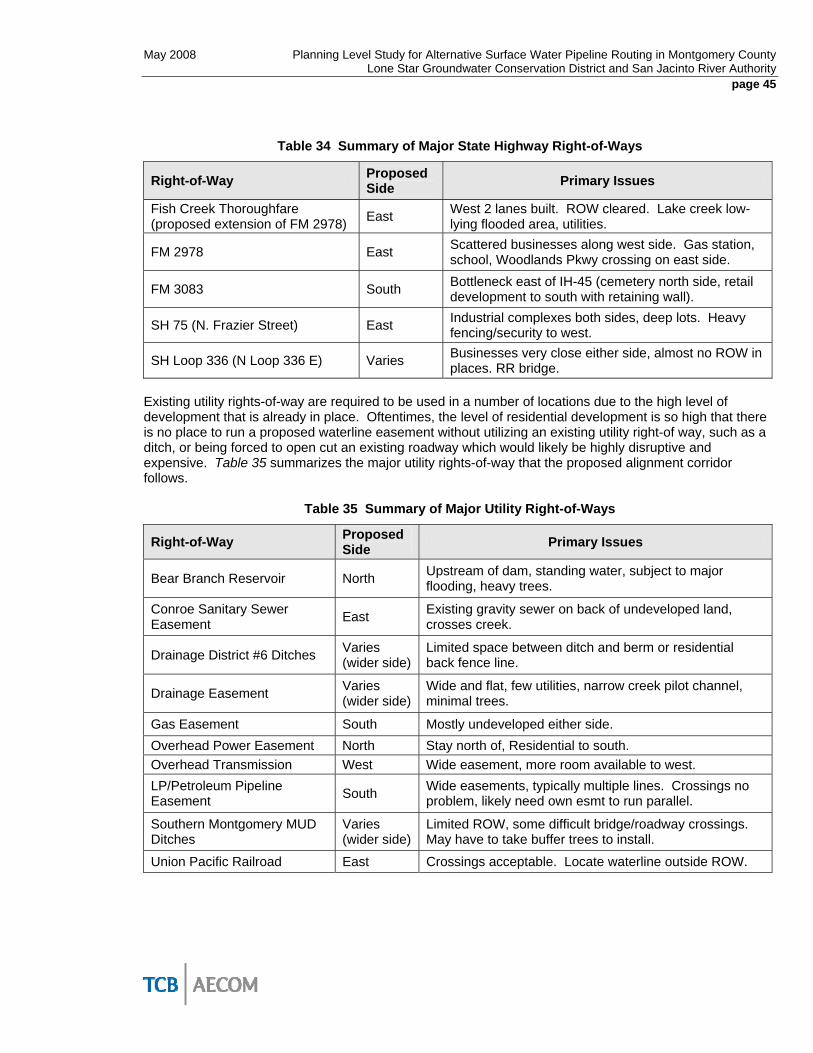
May 2008 Planning Level Study for Alternative Surface Water Pipeline Routing in Montgomery County Lone Star Groundwater Conservation District and San Jacinto River Authority
page 45
Table 34 Summary of Major State Highway Right-of-Ways
Right-of-Way Proposed Side Primary Issues
Fish Creek Thoroughfare (proposed extension of FM 2978) East West 2 lanes built. ROW cleared. Lake creek low-
lying flooded area, utilities.
FM 2978 East Scattered businesses along west side. Gas station, school, Woodlands Pkwy crossing on east side.
FM 3083 South Bottleneck east of IH-45 (cemetery north side, retail development to south with retaining wall).
SH 75 (N. Frazier Street) East Industrial complexes both sides, deep lots. Heavy fencing/security to west.
SH Loop 336 (N Loop 336 E) Varies Businesses very close either side, almost no ROW in places. RR bridge.
Existing utility rights-of-way are required to be used in a number of locations due to the high level of development that is already in place. Oftentimes, the level of residential development is so high that there is no place to run a proposed waterline easement without utilizing an existing utility right-of way, such as a ditch, or being forced to open cut an existing roadway which would likely be highly disruptive and expensive. Table 35 summarizes the major utility rights-of-way that the proposed alignment corridor follows.
Table 35 Summary of Major Utility Right-of-Ways
Right-of-Way Proposed Side Primary Issues
Bear Branch Reservoir North Upstream of dam, standing water, subject to major flooding, heavy trees.
Conroe Sanitary Sewer Easement East Existing gravity sewer on back of undeveloped land,
crosses creek.
Drainage District #6 Ditches Varies (wider side)
Limited space between ditch and berm or residential back fence line.
Drainage Easement Varies (wider side)
Wide and flat, few utilities, narrow creek pilot channel, minimal trees.
Gas Easement South Mostly undeveloped either side. Overhead Power Easement North Stay north of, Residential to south. Overhead Transmission West Wide easement, more room available to west. LP/Petroleum Pipeline Easement South Wide easements, typically multiple lines. Crossings no
problem, likely need own esmt to run parallel.
Southern Montgomery MUD Ditches
Varies (wider side)
Limited ROW, some difficult bridge/roadway crossings. May have to take buffer trees to install.
Union Pacific Railroad East Crossings acceptable. Locate waterline outside ROW.
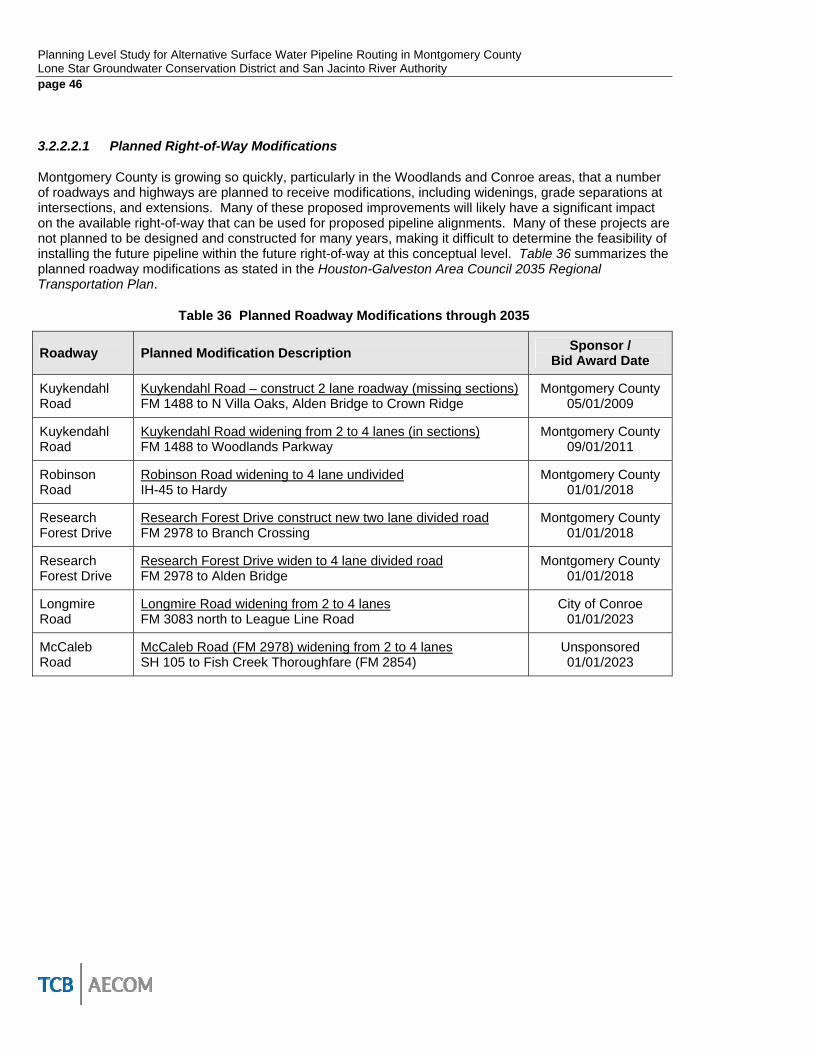
Planning Level Study for Alternative Surface Water Pipeline Routing in Montgomery CountyLone Star Groundwater Conservation District and San Jacinto River Authority page 46
3.2.2.2.1 Planned Right-of-Way Modifications
Montgomery County is growing so quickly, particularly in the Woodlands and Conroe areas, that a number of roadways and highways are planned to receive modifications, including widenings, grade separations at intersections, and extensions. Many of these proposed improvements will likely have a significant impact on the available right-of-way that can be used for proposed pipeline alignments. Many of these projects are not planned to be designed and constructed for many years, making it difficult to determine the feasibility of installing the future pipeline within the future right-of-way at this conceptual level. Table 36 summarizes the planned roadway modifications as stated in the Houston-Galveston Area Council 2035 Regional Transportation Plan.
Table 36 Planned Roadway Modifications through 2035
Roadway Planned Modification Description Sponsor / Bid Award Date
Kuykendahl Road
Kuykendahl Road – construct 2 lane roadway (missing sections) FM 1488 to N Villa Oaks, Alden Bridge to Crown Ridge
Montgomery County 05/01/2009
Kuykendahl Road
Kuykendahl Road widening from 2 to 4 lanes (in sections) FM 1488 to Woodlands Parkway
Montgomery County 09/01/2011
Robinson Road
Robinson Road widening to 4 lane undivided IH-45 to Hardy
Montgomery County 01/01/2018
Research Forest Drive
Research Forest Drive construct new two lane divided road FM 2978 to Branch Crossing
Montgomery County 01/01/2018
Research Forest Drive
Research Forest Drive widen to 4 lane divided road FM 2978 to Alden Bridge
Montgomery County 01/01/2018
Longmire Road
Longmire Road widening from 2 to 4 lanes FM 3083 north to League Line Road
City of Conroe 01/01/2023
McCaleb Road
McCaleb Road (FM 2978) widening from 2 to 4 lanes SH 105 to Fish Creek Thoroughfare (FM 2854)
Unsponsored 01/01/2023

May 2008 Planning Level Study for Alternative Surface Water Pipeline Routing in Montgomery County Lone Star Groundwater Conservation District and San Jacinto River Authority
page 47
Table 37 summarizes the planned state highway modifications as stated in the Houston-Galveston Area Council 2035 Regional Transportation Plan.
Table 37 Planned State Highway Modifications through 2035
Roadway Planned Modification Description Sponsor / Bid Award Date
IH 45 IH 45 widen to 8 main lanes, reconstruct 2-lane frontage roads Loop 336 north to 0.435 miles south of FM 830
TxDOT Houston District 09/01/2008
IH 45 14’ Noise Abatement Wall Woodlands Parkway to Tract 7 Drainage Ditch
TxDOT Houston District 05/01/2009
Fish Creek Thoroughfare Grade Separation over FM 2854 and BNSF Railroad Montgomery County
09/01/2009
Fish Creek Thoroughfare
Construct 2 lane asphalt road (in sections) FM 1488 to FM 2854
Montgomery County 09/01/2011
FM 3083 FM 3083 construct new 4 lane divided roadway, new location IH-45 southwest to SH 105
TxDOT Houston District 07/01/2012
FM 3083 FM 3083 widen to 4 lanes divided rural with raised median IH-45 east to N Loop 336E
TxDOT Houston District 09/01/2012
Loop 336 Loop 336 widening from 4 lanes to 6 lanes divided 0.06 miles east of IH-45 to 0.47 miles east of MPRR
TxDOT Houston District 09/01/2012
FM 2978 FM 2978 widening from 2 to 4 lanes FM 1488 south to Harris County line
Montgomery County 01/01/2013
Loop 336 (North)
North Loop 336 widening to 6 lanes (in sections) SH 105 to IH-45
TxDOT Houston District 01/01/2023
3.2.2.3 Existing Utilities
The primary existing utilities that were encountered along the proposed alignment corridor are summarized in Table 38 below. Utility coordination information gathered during the course of this study is attached in Appendix E.
Field location of all utilities should be completed during subsequent preliminary engineering efforts. It is recommended that the alignment is staked by all utilities and the Texas One Call system locator to identify the location of utilities that may not be properly documented. This effort and the resulting findings may impact the overall plan and costs.

Planning Level Study for Alternative Surface Water Pipeline Routing in Montgomery CountyLone Star Groundwater Conservation District and San Jacinto River Authority page 48
Table 38 Summary of Major Utilities in Project Area
Right-of-Way Utility Companies
Water
SJRA; City of Conroe; Woodlands Joint Powers Agency (Woodlands MUDs); Sendera Ranch; Woodland Oaks Subdivision; Lakeland; Shenandoah; Montgomery County MUD 19, Southern Montgomery County MUD; Rayford Road MUD; Chateau Woods MUD; City of Oak Ridge North
Sanitary Sewer
City of Conroe; Woodlands Joint Powers Agency (Woodlands MUDs); Sendera Ranch; Woodland Oaks Subdivision; Lakeland; Shenandoah; Montgomery County MUD 19, Southern Montgomery County MUD; Rayford Road MUD; Chateau Woods MUD; City of Oak Ridge North
Buried Cable Consolidated Communications (formerly Lufkin-Conroe Telephone Exchange); Conroe Telephone; TXU; Cox Communications; SBC; ICTX/Wave Media
Buried Electric Mid-South Synergy; Entergy; Centerpoint Energy; TXU; Reliant Overhead Cable or Power Mid-South Synergy; Entergy; Centerpoint Energy; TXU; Reliant Overhead Transmission Mid-South Synergy; Entergy; Centerpoint Energy; TXU; Reliant Signalized Intersection TxDOT; Railroad
Natural Gas Centerpoint Energy; LDC, Inc.; Devon Energy; Mid South Synergy; Tennessee Gas Pipeline (El Paso Corp)
High Pressure Products / Petroleum / LPG
Conoco/Phillips; Magellan; Koch; Energy Transfer d.b.a. Houston Pipeline; Gulf South Pipeline Co.
Railroad Atchinson Topeka & Santa Fe; Union Pacific; Burlington Northern Santa Fe
Drainage Ditch Drainage District No. 6, Southern Montgomery MUD Drainage Culverts/ Conduit/Box Culvert Woodland Oaks Subdivision; TxDOT
Most of these utilities affect the alignment only as crossings or as small utilities at the edge of the existing right-of way. Since the distribution line is pressurized, the typical utility crossing requirements require that the waterline be installed deeper than the existing utility in order to maintain the required cover over the line and maintain the required clearance. Such a crossing is typically feasible and not very costly as long as the installation depths are not excessive. Existing products and overhead easements should normally be paralleled rather than trying to install the line in the existing easement. Land for additional easements is often available near these types of easements as developers will often leave a ditch or other buffer between residential development and these types of “unsightly” or “undesirable” easements.
3.2.2.4 Environmental Considerations
Environmental considerations associated with the proposed pipeline alignments would be those resource areas expected to be most impacted by the proposed project and likely to require coordination and/or permitting through regulatory agencies at the state and federal level. These resource areas have been identified as being water resources, cultural resources, threatened and endangered species, and hazardous materials. Water resources that have potential to be impacted are jurisdictional Waters of the U.S., wetlands, and floodplains. Depending on the nature and extent of the impacts a permit may be required from the USACE. Cultural resources may be an issue since areas near water bodies are known to

May 2008 Planning Level Study for Alternative Surface Water Pipeline Routing in Montgomery County Lone Star Groundwater Conservation District and San Jacinto River Authority
page 49
have higher probabilities of containing archaeological artifacts. Additionally there may be cemeteries located within the proposed pipeline alignments and may require coordination with THC. Since some of the area along the proposed pipeline alignments is currently undeveloped it could potentially provide habitat for threatened and endangered species that have the potential to occur in the area. Evaluations would have to be made by qualified biologists to determine what actions will be required with regard to these undeveloped areas. Hazardous materials will be a constraint as well since a superfund site has already been identified to be adjacent to a portion of the project area. Prior to acquiring additional ROW, Phase I Environmental Site Assessments will be required to identify potential sources of contamination prior to acquisition.
3.3 Surface Water Treatment
3.3.1 Water Quality Standards Forecast
In January 2006, the EPA enacted two new rules under the authority of the Safe Drinking Water Act. These rules are the Long Term Phase 2 Enhanced Surface Water Treatment Rule (LT2), and Stage 2 of the Disinfectant / Disinfection Byproduct Rule (D/DPR2). These new rules potentially impact the proposed water treatment plant(s) that are proposed to meet the conversion requirements of the District. The new rules require extensive raw water quality monitoring and treatability studies before the full impact of these rules is determinable. In developing the site plan to meet the requirements of the SJRA water treatment plants, several assumptions based on anticipated raw water quality and treatment performance have been made and areas for future additional treatment processes have been identified. A brief overview of the Rules and the potential impact to the water treatment plant planning process is presented in the following paragraphs.
3.3.1.1 Long Term Phase 2 Enhanced Surface Water Treatment Rule (LT2).
The LT2 is a long awaited rule to address cryptosporidium (crypto) in drinking water. In March and April 1993, an outbreak of cryptosporidiosis occurred in Milwaukee, Wisconsin that was traced to the drinking water supply. Dozens of deaths (69) and an estimated 403,000 illnesses were attributed to this outbreak. This outbreak was the first attributed to cryptosporidium, which was a relatively unknown pathogen at the time.
The Milwaukee cryptosporidiosis outbreak occurred 2 months prior to the June 30, 1993 compliance date for the Surface Water Treatment Rule (SWTR). An analysis of the facilities and operations of the Milwaukee water system indicated that the utility was already in compliance with the then proposed SWTR, but the outbreak still occurred. The Milwaukee outbreak sent a near panic through the regulators because it was now obvious that the proposed rules were not capable of adequately protecting our drinking water supplies from pathogens. Since that time, the EPA has promulgated several rules (Interim Enhanced Surface Water Treatment Rule, Enhanced Surface Water Treatment Rule, Long Term Phase 1 Enhanced Surface Water Treatment Rule, etc), has been gathering information on the occurrence of cryptosporidium in surface water sources, and has been identifying treatment technologies to remove or inactivate cryptosporidium in drinking water supplies and protect consumers. LT2 is the result of these investigations and regulatory actions and is expected to be the final word on cryptosporidium control in drinking water supplies.
In the years following the Milwaukee outbreak, the EPA has analyzed watersheds and raw water sources through out the United States for the occurrence of cryptosporidium. The EPA analyses have determined that cryptosporidium is an elusive pathogen, but environmental conditions required to support cryptosporidium occur in every watershed used for drinking water purposes. Cryptosporidium is difficult to detect because it occurs infrequently and intermittently. Many large utilities have been monitoring for cryptosporidium for many years and have never detected it. Cryptosporidium has also proven to be very difficult to inactivate and is resistant to commonly used disinfection technologies.

Planning Level Study for Alternative Surface Water Pipeline Routing in Montgomery CountyLone Star Groundwater Conservation District and San Jacinto River Authority page 50
EPA regulations must demonstrate cost effectiveness. In other words, EPA can not promulgate arbitrary regulations and must justify the financial impact of the regulations or provide funding to the utilities for implementation. The EPA is prevented from promulgating an unfunded mandate. Therefore prior to issuing new rules, the EPA must estimate the cost for implementing the new rules and compare it to the costs for not implementing the new rules. Typically the costs of lost productivity and illnesses, including medical costs are used in this analysis. Because of the infrequent occurrence of cryptosporidium, and the high cost associated with removing or inactivating cryptosporidium, cryptosporidium based regulations have been difficult to justify economically. The Center for Disease Control (CDC) estimated the costs of the cryptosporidiosis outbreak in Milwaukee to be between $75 million and $118 million. Even though in the Milwaukee case, cryptosporidium treatment requirements could have been justified, the infrequency of outbreaks throughout the country could not economically justify a nationwide uniform treatment mandate.
The new LT2 regulation takes a measured approach to addressing the cryptosporidium enigma. LT2 only addresses systems using surface water as the supply source. The initial steps, which began in November 2006, require large systems to perform 2 years of source water monitoring for cryptosporidium. Smaller systems also have monitoring requirements on a slightly delayed scheduled compared to the large systems. This monitoring is considered to be an initial monitoring phase and must be completed by 2010. Based on the initial monitoring results, bin classification and treatment requirements will be established for all systems, and implementation schedule requirements are established. The entire process is repeated for a second round beginning in 2015. Table 39 presents a synopsis of the monitoring and implementation schedule for various utility sizes.

May 2008 Planning Level Study for Alternative Surface Water Pipeline Routing in Montgomery County Lone Star Groundwater Conservation District and San Jacinto River Authority
page 51
Table 39 Monitoring / Implementation Schedule by System Size
SYSTEM SIZE (Population Served)
>99,999 50,000 to 99,000
10,000 to 49,999
<10,000 (E. coli 2)
<10,000 (Crypto 3) ACTION ITEM
Schedule 1 Schedule 2 Schedule 3 Schedule 4
Begin Monitoring 10/01/06 04/01/07 04/01/08 10/01/08 04/01/10
Complete Initial Monitoring 10/01/08 04/01/09 04/01/10 10/01/09 04/01/12
Report Initial Bin Classifications 04/01/09 10/01/09 10/01/10 N/A 10/01/12
Compliance/ Implementation(1) 04/01/12 10/01/12 10/01/13 10/01/13 10/01/14
Begin Round 2 Monitoring 04/01/15 10/01/15 10/01/16 10/01/17 04/01/19
Complete Round 2 Monitoring 04/01/17 10/01/17 10/01/18 10/01/18 04/01/21
Report Second Bin Classifications 10/01/17 04/01/18 04/01/19 N/A 10/01/21
Round 2 Compliance
TBD by TCEQ
TBD by TCEQ
TBD by TCEQ
TBD by TCEQ
TBD by TCEQ
1. A 2 year extension for Compliance/Implementation can be granted if capital improvements are required. 2. Small filtered systems that provide E. coli monitoring or other indicator. 3. Small filtered systems that monitor for cryptosporidium and unfiltered systems.
New systems also have to comply with the monitoring and treatment requirements, though the schedule is not as clear cut as it is for existing systems. The EPA has allowed the individual States to establish monitoring and implementation schedules for new systems. States may require the two year source water monitoring to occur prior to construction of the facilities or may allow the monitoring period to extend into the operational period. Guidance on this issue is not clear cut in the Federal regulations, and because it will be decided at the State level on a case by case basis, early discussions with the TCEQ are recommended to avoid project delays and to optimize process selections.
The Bin classifications that will result from the 2 year source water quality monitoring program are critical to establishing treatment requirements for existing and new treatment systems. Under the Bin classification system, a baseline treatment technique is established for the current in-place treatment technologies, and then additional treatment requirements are established for the respective Bin classifications. For instance, if conventional treatment is the basis, then 3-log (99.9%) removal inactivation credit for cryptosporidium is granted, contingent on compliance with conventional treatment requirements. The treatment requirements for each Bin classification are then over and above the baseline treatment that exists. The EPA has provided a “Toolbox” of treatment techniques that can be used to meet the Bin classification treatment requirements. The additional treatment requirements required under the LT2 Bin classifications are presented in Table 40. From review of Table 40, any Bin classification above Bin 1 will impact treatment processes at surface water treatment facilities.

Planning Level Study for Alternative Surface Water Pipeline Routing in Montgomery CountyLone Star Groundwater Conservation District and San Jacinto River Authority page 52
To achieve the required performance for Bin classification 2, 3, and 4, the LT2 identifies several processes that can be used in addition to conventional treatment. For full credit, the conventional treatment is assumed to be fully capable of meeting all of the requirements of the Surface Water Treatment Rule (SWTR), the Interim Enhanced surface Water Treatment Rule (IESWTR), and the Long Term Phase 1 Enhanced Surface Water Treatment Rule (LT1ESWTR). The available Toolbox processes are divided into 5 categories of processes; 1) source Protection and Management Options, 2) Pre-filtration Options, 3) Treatment Performance Options, 4) Additional Filtration Options, and 5) Inactivation Options
Table 40 Treatment Requirements for Bin Classifications
Bin ADDITIONAL TREATMENT REQUIRED APPLICABLE TOOLBOX PROCESSES
Bin 1 No Additional Treatment Required 3-log Total Crypto Removal (99.9%) Conventional Treatment is Adequate
Bin 2 1-log Additional Treatment Req’d; 4-log Total Crypto Treatment (99.99%) All Toolbox Processes
Bin 3 2-log Additional Treatment Req’d; 5-Log Total Crypto Treatment (99.999%)
Ozone, Chlorine Dioxide, UV, Membranes, Bag Filtration, Cartridge Filtration, Bank Filtration
Bin 4 2.5-log Additional Treatment Req’d; 5.5-log Total Crypto Treatment (99.9997%)
Ozone, Chlorine Dioxide, UV, Membranes, Bag Filtration, Cartridge Filtration, Bank Filtration
A brief description of the processes identified in the LT2 Toolbox for meeting the Bin classification treatment requirements is provided in the following Table 41.

May 2008 Planning Level Study for Alternative Surface Water Pipeline Routing in Montgomery County Lone Star Groundwater Conservation District and San Jacinto River Authority
page 53
Table 41 The EPA Microbial Toolbox for Compliance with LT2
SOURCE PROTECTION AND MANAGEMENT OPTIONS
Watershed Control Program
0.5-log credit
Comprehensive program and ongoing monitoring requirements to be established by States
Source/Intake Management TBD No prescribed credit. Requires simultaneous monitoring of alternate
source locations to determine applicability.
PREFILTRATION OPTIONS
Pre-Sedimentation with Coagulation
0.5-log credit
Continuous operation of pre-sedimentation system with coagulation. At least 0.5 log turbidity reduction required
Two-Stage Lime Softening
0.5-log credit Chemical addition and hardness removal required in two stages
Bank Filtration 0.5 to 1.0 log credit
Credit depends on setback. Aquifer must contain <10% fines, turbidity from wells must be < 1NTU. No additional credit for existing systems.
TREATMENT PERFORMANCE OPTIONS
Combined Filter Performance
0.5-log credit Combined filter effluent must be < 0.15 NTU in 95% of samples.
Individual Filter Performance
0.5-log credit
Individual filters must be < 0.15 NTU in 95% of samples & never exceed 0.3 NTU. This credit is in addition to combined filter performance.
Performance Demonstration TBD Only available after challenge test using State approved protocol.
ADDITIONAL FILTRATIONS OPTIONS
Bag and Cartridge Filters
<= 2.5-log credit Challenge test required
Membranes TBD Challenge test required
Second Stage Filtration
0.5-log credit Coagulant applied to first stage filters and second stage filters required.
Slow Sand Filters 2.5 to 3.0 log credit
2.5 log credit for secondary filtration step, 3 log credit available for primary filtration step.
INACTIVATION OPTIONS
Chlorine Dioxide CT Tables Based on published CT tables
Ozone CT Tables Based on published CT tables
UV CT Tables Based on UV dose tables. Reactor validation testing required.
Based on the above information, conventional treatment will be adequate for Bin 1 classification. Bin 2 Classification will require some modifications to the conventional treatment processes, but is likely to be achievable with a conservative filter design. Bin 3 and Bin 4 classifications will require significant advance

Planning Level Study for Alternative Surface Water Pipeline Routing in Montgomery CountyLone Star Groundwater Conservation District and San Jacinto River Authority page 54
treatment techniques and will also likely require validation or performance challenge testing through pilot plant or full scale testing of the proposed processes. It is currently anticipated that Lake Conroe and the San Jacinto River immediately downstream of Lake Conroe will be assigned a Bin 1 or Bin 2 Classification, which should be achievable by a well-designed and operated conventional treatment system. For this reason, cost estimates are based on conventional treatment at this time.
A second round of source water sampling for cryptosporidium is required but will not be completed for more than 10 years. It is not known at this time if cryptosporidium requirements will be further tightened at that time or if new treatment technologies will become available. Therefore, the site plan has identified space for advance treatment, but no associated costs are identified at this time.
To further refine the anticipated Bin classification and to identify appropriate treatment processes and resultant costs, a raw water sampling protocol should be identified as quickly as possible and discussions with the TCEQ should begin soon. As with any long term planning efforts, significant contingencies should be established to account for future regulatory changes and unanticipated conditions.
3.3.1.2 Disinfectants/Disinfection Byproducts Rule Stage 2 (D/DBP2)
The second major rule that was enacted in early 2006 is the Disinfectants / Disinfection Byproducts Rule Stage 2 (D/DBP2). Whereas the previously described LT2 focuses on removing or inactivating pathogens in drinking water, D/DBP2 limits the amount and types of disinfectants that can be applied to accomplish the disinfection requirements and also places limits on the formation of disinfection byproducts. The relationship between LT2 and D/DBP2 is a balancing act to ensure adequate disinfection is achieved without introducing other constituents that could compromise water quality.
The D/DBP2 Rule establishes numeric limits on disinfection dosages and on the disinfection byproducts that are created with each disinfectant. Limits were originally established under D/DBP1 in the mid 1990s. Although the numerical limits do not change under D/DBP2, the method of calculation for compliance is significantly stricter than previous regulations and will impact the disinfection processes used at many surface water treatment plants. The numeric limits for the most common disinfection byproducts are 0.080 mg/l total trihalomethanes and 0.060 mg/l haloacetic acids.
To ensure that the water is adequately disinfected, a disinfectant residual must be maintained in all portions of the distribution system. This can lead to long detention times in the distribution system. Because treated water exhibits a disinfection demand, in general the disinfection residual will deteriorate with time. The longer the retention time in the distribution system, the residual leaving the treatment plant will have to be higher to maintain the minimum residual at the consumer’s tap. Disinfection byproduct formation is directly related to the detention time and the concentration of disinfectant in the system. The result is that systems must select an appropriate disinfection protocol that allows the system to be in compliance with both the minimum disinfection residual and the byproduct formation requirements.
Under the previous D/DBP1 Rule, disinfectant and byproduct concentrations were measured at several locations in the distribution system. Rule compliance was measured by a running annual average of quarterly sampling of all samples taken in the distribution system. Under this calculation methodology, if certain locations in the distribution system received consistently high level of byproducts, compliance could be achieved through offsetting readings at other locations in the system. Under the proposed rule, each sampling location must achieve compliance based solely on the samples from that location.
Because the dilution effect of averaging is eliminated, the byproducts in the water leaving the surface water treatment plants must be generally lower while still maintaining adequate disinfection. DBP formation is generally caused by the chemical reaction between the disinfectant and organic matter or other constituents in the water. The D/DBP2 Rule will require systems with medium or high levels of organics in

May 2008 Planning Level Study for Alternative Surface Water Pipeline Routing in Montgomery County Lone Star Groundwater Conservation District and San Jacinto River Authority
page 55
the water to further reduce the level of organics prior to applying the disinfectant. This could result in no disinfectant credit being available until after treatment for organics has been accomplished, or a primary disinfectant be chosen that does not form objectionable byproduct levels.
To understand the impacts of this rule, extended distribution system modeling and field sampling are required to determine the longest system residence times and then to further determine if objectionable levels of byproducts would be formed at these locations. For existing systems, a sampling program could be performed to directly measure the byproduct formation throughout the system. For a planned system (not yet constructed), system hydraulic modeling is required to determine the maximum detention times, and then extended distribution system DBP formation studies performed to estimate the amount of byproducts that would be formed. An Initial Distribution System Evaluation (IDSE) plan is required. The IDSE will identify sampling locations. Consecutive systems (such as systems receiving water from a wholesale supplier) are also required to comply with all monitoring and sampling requirements and the numerical limits. Therefore, in a wholesale-retail consecutive system, the entire network must be considered in the planning and treatability testing efforts.
With the new locational running annual average techniques to be employed, lower disinfection byproducts levels will be required leaving the plant site. The disinfectant demand of the water will also have to be lowered. Treatment techniques that could be employed to lower disinfection byproducts and disinfectant demand of the water would generally focus on removing organic matter during the treatment processes, such as enhanced coagulation, activated carbon, or nano-filtration membranes. Enhanced coagulation is not capable of removing a substantial portion of organics and often will not allow the application of a strong disinfectant. Activated carbon is effective at removing organic material but requires costly periodic regeneration and/or disposal of spent carbon. Nano-filtration membranes require high quality water applied to the membrane to avoid fouling, and therefore are typically used as an add-on process using either a conventional or a high rate conventional plant for pretreatment. The nano-filtration process is relatively expensive process with high operational and maintenance costs, although membrane costs have become more economical in recent years.
Alternatively, a disinfectant that does not form appreciable byproducts in the presence of organics could also be employed, such as UV radiation or chloramines. Currently, neither of these disinfectants is without significant drawbacks for use as a primary disinfectant. UV radiation requires a substantial field validation testing program and is currently not approvable in Texas. Chloramine is a very weak disinfectant and requires very large basins to achieve the required contact time for adequate disinfection. To select the appropriate disinfection protocol, the selection of disinfectant must be coordinated with the process selection. A comprehensive sampling and testing program on the source water is recommended to fine-tune these selections.
The schedule for DBP2 is staggered based on system size, but generally requires an IDSE to be submitted for approval approximately 1 year ahead of system monitoring. IDSE monitoring will occur for approximately one year and the results of the monitoring reported to the State within 4 months of completion. Compliance with the DBP2 is required to coincide with the LT2 compliance dates, which occurs approximately 3 years after the submission of the IDSE report. A two-year extension is possible if extensive capital improvements are necessary to establish compliance. The DBP2 compliance schedule is presented in Table 42.

Planning Level StudLone Star Groundwa
y for Alternative Surface Water Pipeline Routing in Montgomery Countyter Conservation District and San Jacinto River Authority
page 56
Table 42 DBP2 Compliance Schedule
SYSTEM SIZE (Population Served) ACTION ITEM
>99,999 50,000 to 99,999
10,000 to 49,999 <10,000
Submit IDSE Monitoring Plan 10/01/06 04/01/07 10/01/07 04/01/08
Complete Monitoring 09/30/08 03/31/09 09/30/09 03/31/10
Submit IDSE Report 01/01/09 07/01/09 01/01/10 07/01/10
Compliance Date(1) 04/01/12 10/01/12 10/01/13 10/01/13 1. A 2 year extension for Compliance/Implementation can be granted if capital improvements are required.
The LT2 and DBP2 regulations are integrally related from a process selection and compliance schedule perspective. These rules can not be addressed individually. Both LT2 and DBP2 require the treatment and disinfection processes to be compatible if simultaneous compliance of both Rules is to be achieved. Figure 4 presents a combined compliance schedule for LT2 and DBP2.
New systems also have to comply with the monitoring and treatment requirements of the LT2 and DBP2, though the schedule is not as clear cut as it is for existing systems. The EPA has allowed the individual States to establish monitoring and implementation schedules for new systems. States may require the two year source water monitoring to occur prior to construction of the facilities or may allow the monitoring period to extend into the operational period. Guidance on this issue is not clear cut in the Federal regulations, and because it will be decided at the State level on a case by case basis, early discussions with the TCEQ are recommended to avoid project delays and to optimize process selections. A likely scenario is that if existing monitoring of the surface water has already been performed on this watershed and near the proposed intake locations, an initial Bin assignment might be available and would provide a direction for final treatability analyses and process selections. However, this could result in a conservative Bin assignment and costly plant construction and operations. With initial plant operations scheduled for 2015, the initial two year sampling program should begin soon to allow sufficient time for Bin classifications, treatability studies, preliminary engineering, design, and construction activities.

y 2008 Planning Level Study for Alternative Surface Water Pipeline Routing in Montgomery County Lone Star Groundwater Conservation District and San Jacinto River Authority
page 57
Combined DBP2 and LT2 Implementation Schedule2006 2007 2008 2009 2010 2011 2012 2013 2014 2015
Systems Serving at Least 100,000 People
Systems Serving 50,000 to 99,999 People
Systems Serving 10,000 to 49,999 People
Systems Serving Fewer than 10,000 People
2006 2007 2008 2009 2010 2011 2012 2013 2014 2015
Assign Bins Treatment Installation
Treatment Installation
Treatment Installation
Possible 2-yr Extension
4/07 Crypto Monitoring 4/09
IDSE MonitorTreatment Installation Possible 2-yr ExtensionAssign
Bins
10/06 Crypto Monitoring 10/08
IDSE Monitor
Possible 2-yr Extension
Possible 2-yr Extension
1. Small systems (<10,000) are required to perform Crypto monitoring if E. Coli monitoring detects high levels and have an additional 12 months to comply with DBP2 MCLs
4/08 Crypto Monitoring 4/10
IDSE Monitor
IDSE Monitor
Assign Bins
Assign Bins
E. Coli Monitor Crypto Monitor(1)
IDSE Plan10/06
IDSE Plan4/07
IDSE Plan10/07
IDSE Plan4/08
IDSE Report Due1/09
IDSE Report Due7/09
IDSE Report Due1/10
IDSE Report Due7/10
Compliance4/12
Compliance10/12
Compliance10/13
Compliance10/13
Begin 1 yr IDSEMonitoring 9/07
Begin 1 yr IDSEMonitoring 3/08
Begin 1 yr IDSEMonitoring 9/08
Begin 1 yr IDSEMonitoring 3/09
10/08
10/09
Crypto Plan7/06
Crypto Plan1/07
Crypto Plan1/08
E. ColiPlan 7/08
Figure 4 Combined DBP2 and LT2 Implementation Schedule
Ma

Planning Level Study for Alternative Surface Water Pipeline Routing in Montgomery CountyLone Star Groundwater Conservation District and San Jacinto River Authority page 58
3.3.2 Proposed Treatment Process Selection
There are several issues described in previous sections that make process selection and optimization a difficult task at this time. Several studies need to be performed before process selections and facilities sizing can be finalized. The most significant unknowns at this point are the LT2 Bin classifications that won’t be available until at least 2010, and the disinfection byproduct formation potential correlation between the water source and the various disinfectants.
3.3.2.1 Ultraviolet Radiation Technology
From a technology perspective, ultraviolet radiation disinfection holds significant promise as a primary disinfectant that does not contribute to disinfection byproducts. This technology has been approved for use at the federal level, but TCEQ is still resistant to allowing disinfection credit for UV. Because UV radiation is accomplished by applying a light source through the water, there is no disinfection residual that can be measured to verify that adequate disinfection has been accomplished. The inability to have positive verification of disinfection is the primary concern of the TCEQ. At the nearby Northeast Water Purification Plant, a UV radiation disinfection system was installed in anticipation of approval, but currently sits idle in favor of conventional chlorine based disinfection techniques. With the significantly more stringent rules concerning disinfection and disinfection byproducts, UV radiation technology should be considered in all future water treatment applications.
3.3.2.2 Membrane Technology
Membrane technology is also viable for new treatment plants. Membranes have evolved significantly in the last 15 years in terms of both advancing the technology and reducing cost. In large plants greater than 10 mgd, membranes are still more expensive than conventional treatment, but provide a positive barrier to suspended solids and pathogens when working properly. Relatively high operating and membrane replacement costs can impact the overall cost effectiveness of membranes. High turbidity water or highly variable raw water quality could require significant pretreatment prior to application on to the membranes. The selection of membranes requires a site specific pilot test to validate membrane performance. This site specific test must use the specific water to be treated and the specific membrane to be used. Pilot testing requirements are specific to each membrane manufacturer, and therefore to maintain a competitive bidding environment, several pilot studies are typically conducted. These pilot studies can add significant cost and schedule to the membrane procurement process.
3.3.2.3 Conventional Processes
Without further studies on the quality and treatability of the raw water, conventional treatment processes are selected at this phase of the project. Conventional treatment processes represent proven technology and are indicated as the bases for the LT2 Bin classifications. The success of conventional treatment is based on decades of experience and the multiple barriers that are inherent to the process. The proposed process block diagram identifies an area for advanced treatment processes that can be added on in the future once the Bin classifications are known and treatability studies are conducted. Alternatively, if this information is obtained in advance of the design phase of the project, the process selection and site plan can be modified at that time if appropriate. This methodology offers a conservative, reliable, yet flexible approach to the water treatment planning process.
A conventional plant results in the largest potential plant site for planning purposes. Conventional circular clarifiers are shown in the plant layouts, but the actual sediment removal method will be determined during preliminary design.
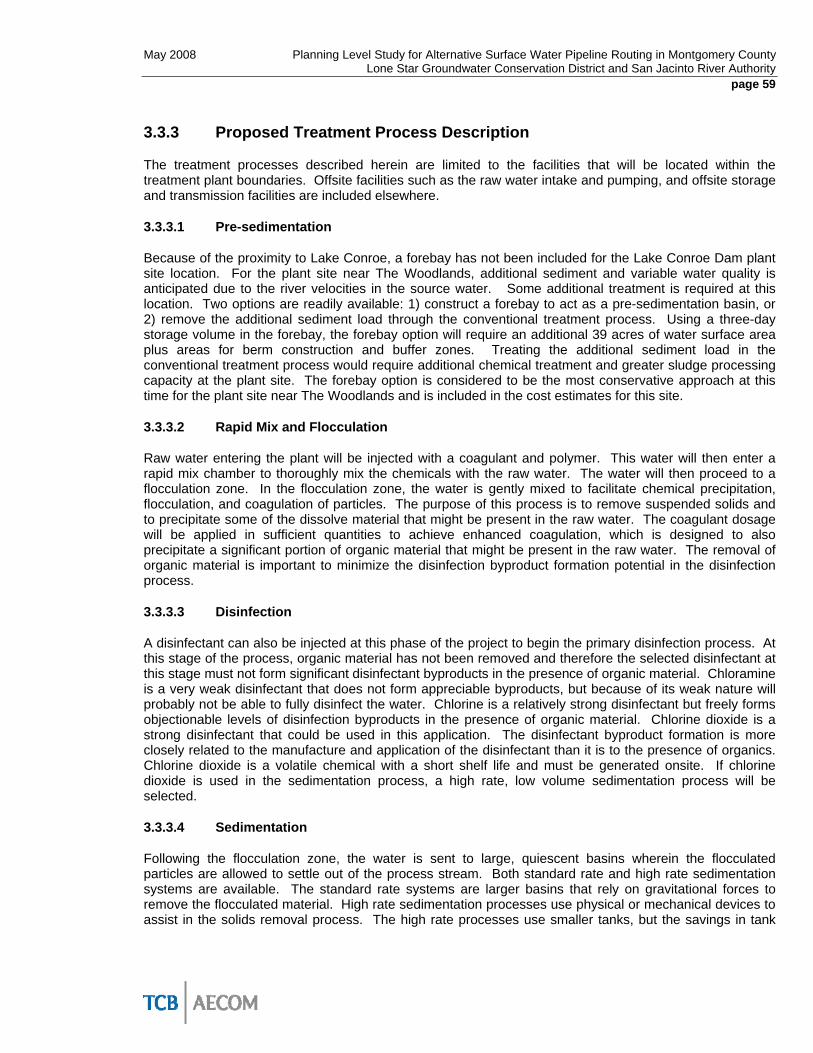
May 2008 Planning Level Study for Alternative Surface Water Pipeline Routing in Montgomery County Lone Star Groundwater Conservation District and San Jacinto River Authority
page 59
3.3.3 Proposed Treatment Process Description
The treatment processes described herein are limited to the facilities that will be located within the treatment plant boundaries. Offsite facilities such as the raw water intake and pumping, and offsite storage and transmission facilities are included elsewhere.
3.3.3.1 Pre-sedimentation
Because of the proximity to Lake Conroe, a forebay has not been included for the Lake Conroe Dam plant site location. For the plant site near The Woodlands, additional sediment and variable water quality is anticipated due to the river velocities in the source water. Some additional treatment is required at this location. Two options are readily available: 1) construct a forebay to act as a pre-sedimentation basin, or 2) remove the additional sediment load through the conventional treatment process. Using a three-day storage volume in the forebay, the forebay option will require an additional 39 acres of water surface area plus areas for berm construction and buffer zones. Treating the additional sediment load in the conventional treatment process would require additional chemical treatment and greater sludge processing capacity at the plant site. The forebay option is considered to be the most conservative approach at this time for the plant site near The Woodlands and is included in the cost estimates for this site.
3.3.3.2 Rapid Mix and Flocculation
Raw water entering the plant will be injected with a coagulant and polymer. This water will then enter a rapid mix chamber to thoroughly mix the chemicals with the raw water. The water will then proceed to a flocculation zone. In the flocculation zone, the water is gently mixed to facilitate chemical precipitation, flocculation, and coagulation of particles. The purpose of this process is to remove suspended solids and to precipitate some of the dissolve material that might be present in the raw water. The coagulant dosage will be applied in sufficient quantities to achieve enhanced coagulation, which is designed to also precipitate a significant portion of organic material that might be present in the raw water. The removal of organic material is important to minimize the disinfection byproduct formation potential in the disinfection process.
3.3.3.3 Disinfection
A disinfectant can also be injected at this phase of the project to begin the primary disinfection process. At this stage of the process, organic material has not been removed and therefore the selected disinfectant at this stage must not form significant disinfectant byproducts in the presence of organic material. Chloramine is a very weak disinfectant that does not form appreciable byproducts, but because of its weak nature will probably not be able to fully disinfect the water. Chlorine is a relatively strong disinfectant but freely forms objectionable levels of disinfection byproducts in the presence of organic material. Chlorine dioxide is a strong disinfectant that could be used in this application. The disinfectant byproduct formation is more closely related to the manufacture and application of the disinfectant than it is to the presence of organics. Chlorine dioxide is a volatile chemical with a short shelf life and must be generated onsite. If chlorine dioxide is used in the sedimentation process, a high rate, low volume sedimentation process will be selected.
3.3.3.4 Sedimentation
Following the flocculation zone, the water is sent to large, quiescent basins wherein the flocculated particles are allowed to settle out of the process stream. Both standard rate and high rate sedimentation systems are available. The standard rate systems are larger basins that rely on gravitational forces to remove the flocculated material. High rate sedimentation processes use physical or mechanical devices to assist in the solids removal process. The high rate processes use smaller tanks, but the savings in tank

Planning Level Study for Alternative Surface Water Pipeline Routing in Montgomery CountyLone Star Groundwater Conservation District and San Jacinto River Authority page 60
volume is typically offset by the additional mechanical equipment used in the process. For the site plans presented in this study, the more conservative conventional clarification basins are used.
Two process streams leave the sedimentation process. The solid material that settles to the bottom of the basins is removed in a dilute slurry with a concentration of 0.5% to 1% solids and sent to a solids processing area. The clarified water is sent to additional treatment processes for further purification.
The settled water stream must have a very low turbidity to meet state design requirements and to prevent overloading downstream processes with excess solids. The TCEQ design criteria requires a maximum of 2 NTU coming off the sedimentation basins, though a well designed sedimentation tank can provide water that is typically less than 1 NTU.
3.3.3.5 Filtration
After sedimentation, the water is filtered through a granular media filtration process. An additional or alternative disinfection application point will be included in the process between the sedimentation basins and the filters. Typically filters are loaded at up to 5 gpm/square foot of filter surface area. Higher loading rates have been achieved, and approved through the TCEQ. However, in anticipation of the LT2 Bin classifications and the expectation that filter performance will be the backbone of LT2 compliance, a conservative filter design was chosen for this plant configuration. Extra deep filters with a filter loading rate of 4 gpm per square foot is chosen with a goal filtered turbidity of less than 0.10 NTU in each individual filter. With this conservative design philosophy, the plant can be in compliance with LT2 requirements for either Bin 1 or Bin 2, which are the most likely Bin classification assignments at this location.
The effluent from the filters is collected in a filter clearwell. The clearwell will be baffled to enhance the effective detention time of the filtered water and improve the disinfection process.
3.3.3.6 Advanced Treatment
Space will be allotted in the site plan and process flow diagram to accommodate the addition of advanced treatment in the future if warranted by the impacts of LT2 and DBP2 regulations. Advanced treatment may include additional solids removal through the use of membranes, or alternative or additional disinfection processes such as ultraviolet radiation or ozone. Although it is anticipated that full treatment meeting the anticipated regulatory requirements will be achieved with the conventional treatment processes described above, prudence dictates that regulations will continue to require more stringent water quality standards and that some additional treatment will be required in the future.
3.3.3.7 Storage & Residual Disinfection
Depending on the plant site topography, a transfer pumping station will probably be required to deliver the water to onsite ground storage tanks. Chlorine and ammonia will be added to the transfer line to form chloramine as the residual disinfectant.
Onsite ground storage tanks will provide 6 to 8 hours of detention time for the finished water and function as equalization basins between plant production and system demands. Again, depending on topography and demand locations relative to the ground storage tanks, a high service pump station will be provided to deliver treated water to the distribution systems and consumers.
3.3.3.8 Solids Processing
The residual streams that are removed from the sedimentation and filtration systems will be diverted to a solids processing area. The solids processing will consists of a thickener, a sludge storage facility, and a centrifuge or belt press sludge dewatering facility. The solids removed in this process will be in a sludge
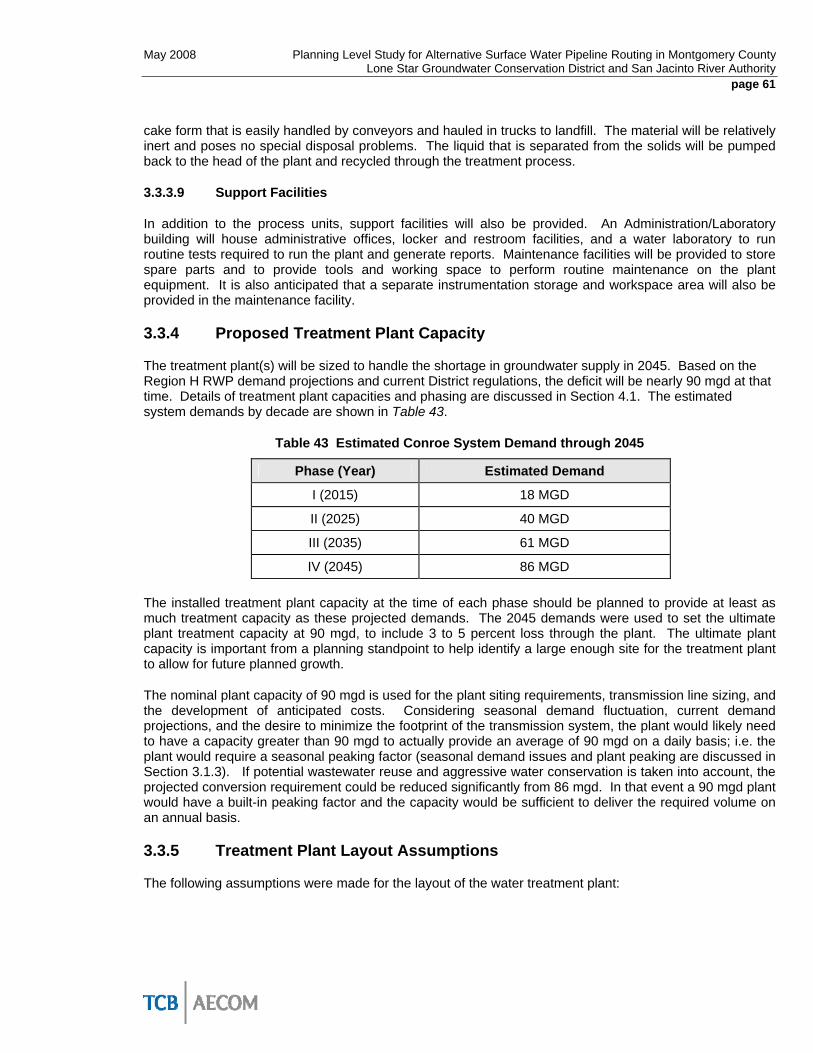
May 2008 Planning Level Study for Alternative Surface Water Pipeline Routing in Montgomery County Lone Star Groundwater Conservation District and San Jacinto River Authority
page 61
cake form that is easily handled by conveyors and hauled in trucks to landfill. The material will be relatively inert and poses no special disposal problems. The liquid that is separated from the solids will be pumped back to the head of the plant and recycled through the treatment process.
3.3.3.9 Support Facilities
In addition to the process units, support facilities will also be provided. An Administration/Laboratory building will house administrative offices, locker and restroom facilities, and a water laboratory to run routine tests required to run the plant and generate reports. Maintenance facilities will be provided to store spare parts and to provide tools and working space to perform routine maintenance on the plant equipment. It is also anticipated that a separate instrumentation storage and workspace area will also be provided in the maintenance facility.
3.3.4 Proposed Treatment Plant Capacity
The treatment plant(s) will be sized to handle the shortage in groundwater supply in 2045. Based on the Region H RWP demand projections and current District regulations, the deficit will be nearly 90 mgd at that time. Details of treatment plant capacities and phasing are discussed in Section 4.1. The estimated system demands by decade are shown in Table 43.
Table 43 Estimated Conroe System Demand through 2045
Phase (Year) Estimated Demand
I (2015) 18 MGD
II (2025) 40 MGD
III (2035) 61 MGD
IV (2045) 86 MGD
The installed treatment plant capacity at the time of each phase should be planned to provide at least as much treatment capacity as these projected demands. The 2045 demands were used to set the ultimate plant treatment capacity at 90 mgd, to include 3 to 5 percent loss through the plant. The ultimate plant capacity is important from a planning standpoint to help identify a large enough site for the treatment plant to allow for future planned growth.
The nominal plant capacity of 90 mgd is used for the plant siting requirements, transmission line sizing, and the development of anticipated costs. Considering seasonal demand fluctuation, current demand projections, and the desire to minimize the footprint of the transmission system, the plant would likely need to have a capacity greater than 90 mgd to actually provide an average of 90 mgd on a daily basis; i.e. the plant would require a seasonal peaking factor (seasonal demand issues and plant peaking are discussed in Section 3.1.3). If potential wastewater reuse and aggressive water conservation is taken into account, the projected conversion requirement could be reduced significantly from 86 mgd. In that event a 90 mgd plant would have a built-in peaking factor and the capacity would be sufficient to deliver the required volume on an annual basis.
3.3.5 Treatment Plant Layout Assumptions
The following assumptions were made for the layout of the water treatment plant:

Planning Level Study for Alternative Surface Water Pipeline Routing in Montgomery CountyLone Star Groundwater Conservation District and San Jacinto River Authority page 62
3.3.5.1 Treatment Type
As discussed in Section 3.3.2, a conventional type plant was assumed to develop the layout. The actual process will be selected based on additional collection of raw water quality data and the completion of treatability studies. The selection of a conventional plant layout at this point results in the largest potential plant site for planning purposes. The proposed layouts show conventional circular clarifiers. The actual sediment removal method will be determined during preliminary design.
3.3.5.2 Additional Treatment
The advanced treatment area was provided to allow the capability of providing additional treatment beyond conventional treatment to provide maximum flexibility for future regulations and to provide an area for additional process units that may be required based on the future sampling and treatability studies. The current location of the additional treatment was provided to simply allow space for future facilities. The exact location is dependent upon what type of additional treatment is planned. The processes that will be planned for will be determined from the treatability study.
3.3.5.3 Storage Volume
Ground storage tank (GST) volume requirements that are based on typical water demand parameters resulted in a GST volume representing approximately 8 hours of daily pumping. This volume assumes a 35 feet water depth in the GSTs. The height of the GSTs could be increased in height to 40+ feet side wall depth to obtain additional volume in the GSTs or could be decreased to be more neighbor friendly. The actual required GST volume may be less depending on the peak pumping capacity required. The actual number of the GST will depend upon storage requirements and tank diameter and height.
3.3.5.4 Stormwater Detention
Based on input from the San Jacinto River Authority (SJRA), no stormwater detention pond was provided.
3.3.5.5 Site Restrictions
The plants were laid out on the proposed sites without information regarding geotechnical, structural, or other development restrictions.
3.3.5.6 Topographic Survey
The exact property lines and existing utilities were not surveyed and parcel sizes were estimated based on information provided by SJRA and the Montgomery County Appraisal District. A survey of the property corners, dam, creek, and all surrounding access roads and topographical features is recommended to determine the actual size and useable limit parameters of each site. Building setbacks or other area development requirements should be investigated and taken into consideration as part of the future layout.
3.3.5.7 Environmental Assessment
No environmental assessments were performed on the proposed sites or alignments. It is assumed that no environmental impacts exist on the sites which would limit the useable area of the site or require cleanup/mitigation prior to construction of improvements. An environmental assessment should be made as required.
May 2008 Planning Level Study for Alternative Surface Water Pipeline Routing in Montgomery County Lone Star Groundwater Conservation District and San Jacinto River Authority
page 63
3.3.5.8 Site Access
Access to and from each plant site varies considerably based upon the site and is discussed in greater detail in the planning alternatives discussion. Access is not only for plant operations personnel, but also heavy delivery truck traffic to and from the plant for chemicals, sludge removal, maintenance activities, and construction activities. Generally it was assumed that access to the site could be provided along at least one major access road to the plant site.
It was assumed that access to the site could be provided along Dam Site Road from the east (Longmire Way) by securing a short access easement for a driveway across adjoining property. Access to the water treatment plant located on the northeast end of the dam from Highway 105 would require access/traffic over the dam and gate structure leading to security and facility maintenance issues. Therefore access to the water treatment plant would only be from Longmire Way. It appears that White Oak Ranch Drive has limited access (key-access gate) which could limit the ability to use this east entry as a general access point.
3.3.5.9 Phasing
Construction of the plant to the ultimate capacity is assumed to occur in four phases. Space is left between each phase to allow access and prevent disruptions to existing operations during construction of future phases.
3.3.5.10 Extra Treatment Train
Consideration was given to including an extra treatment train to provide firm treatment capacity. However, given that the initial stages of the plant are only providing a small portion of the water for the area and that well capacity is available to meet the majority of peak day capacity, the additional cost associated with an extra train appears to be overly conservative. TCEQ does requires parallel treatment trains but does not require redundant sedimentation basins when a public water supply has interconnections or wells that can meet the system’s average daily demand. Whether an extra treatment train is required appears to be an Owner preference but this should be confirmed during the preliminary engineering phase of plant design.
3.4 Operational Issues with Introduction of Surface Water
There are a number of issues that must be addressed in introducing surface water into a typical Montgomery County PWS. The mechanics of introducing the surface water into one tank, or into multiple tanks in a system should be addressed with hydraulic modeling. This section discusses a number of other issues that must be addressed in order to provide a water of consistent quality to the PWS’s customers. These issues are related to the manner in which the surface water is introduced.
First and foremost, all of the PWSs use free chlorine as the disinfectant of choice and they will have to change their disinfection practices. Most surface water in this area is treated with chloramines, a combination of chlorine and ammonia, instead of free chlorine. Use of chloramines provides a longer lasting disinfectant residual, and reduces the formation of disinfection byproducts (DBPs). DBPs are formed as a result of the interaction of free chlorine and organic acids present in surface water from the decomposition of leaves, grass, algae, and other materials common to surface waters in Texas. In order to be compatible with the chloraminated surface water, each PWS will need to provide ammonia feed equipment at all of their current disinfection locations. If this is not done, the combination of the free chlorine from the groundwater with the organic acids in the surface water will result in accelerated DBP formation and likely exceedances of the standard. One other issue is that chloramines are a less powerful disinfectant than free chlorine. As a result, the PWS may have to revert to free chlorine in the distribution system for short periods of time each year to “burn out” unwanted bacterial slime growths commonly referred to as biofilm.

Planning Level Study for Alternative Surface Water Pipeline Routing in Montgomery CountyLone Star Groundwater Conservation District and San Jacinto River Authority page 64
A second water quality issue that needs to be addressed is the blending of surface and groundwater in the system. The ideal method of blending surface and groundwater is at the storage tanks. Groundwater is generally at a lower temperature than surface water, usually has a higher hardness, and oftentimes contains dissolved gasses that are temperature dependent for their saturation concentrations. Mixing groundwater with generally higher temperature surface water, with typically lower hardness, can produce interactions which cause gases to be driven off, and can result in the precipitation of calcium carbonate and iron, if there is dissolved iron in the system. Blending at the tanks allows this process to take place, precipitates to form and drop out of solution, and gases to leave via the tank vents. The end result of this process is the production of a more stable water quality in the distribution system.
Although introduction of the surface water and blending it with the groundwater in the storage tanks is the preferred method, there are circumstances where this is not feasible. One of these is where elevated storage tanks are served primarily by a well which pumps into the top of the tank. It will probably not be feasible to provide sufficient pressure to lift the surface water into an elevated tank. Also, some of the tanks may be far from the likely connection point with the surface water and the cost of lines through densely populated areas may make this option cost prohibitive. For these situations, a careful analysis of the surface and groundwater compatibilities is needed. The chemical equilibrium for calcium carbonate (the whitish precipitate that forms in most moderately hard waters) can be calculated for various blending ratios and parameters and adjustments made to minimize this occurrence. Similarly, the wells may need some type of splash plate aeration to reduce the occurrence of dissolved gases in the system. If either iron or manganese is present, a sequestering agent can be fed into the system to prevent the iron or manganese from being oxidized and forming a precipitate.
All of the issues in the above paragraph are primarily for aesthetic purposes. However, the chemical equilibrium of the water is important in determining compliance with the Lead Copper Rule as well. The Lead Copper rule requires that water in the distribution system be stabilized so that it will not tend to dissolve copper or lead pipes in the distribution system. While a particular water system is not likely to have significant quantities of lead pipe in their service lines or in the plumbing of the houses they serve, copper is a common plumbing material inside houses and there will be a concern to balance the water so that it will not tend to dissolve the copper pipes. This is especially true for systems which have previously had well water with some moderate hardness in it. Again, sequestering agents can be used to provide a thin protective coating on the pipes to prevent this occurrence.
Finally, there is a need to prepare the city and water district customers for the change to softer surface water. Those customers who have water softeners will need to adjust their softeners for the new hardness levels in the blended water. The zeolite softeners in common use today are capable of softening to zero hardness, and if that occurs the water produced will be very aggressive. Houses in other areas that have changed from groundwater to surface water have experienced pinhole leaks in copper plumbing within two to three years. Bypassing a portion of the incoming water around the softener effectively remedies this problem, but people will have to be informed of the need to do so. The softer water also requires less frequent regenerations. Water softeners will need to be adjusted to regenerate on alternate time or flow schedules depending on the current basis for regeneration.
All of the issues noted above can be effectively managed if they are known prior to the initiation of surface water into the system. At the same time, if they are neglected they can become a source of friction between the surface water supplier and its customers and a negative perception of the surface water supply can be created.
3.5 Unit Cost Development
Capital costs for construction of pipelines, pumps, storage, and treatment facilities were compiled from a variety of reliable sources and analyzed for trends that could be used for estimating purposes. The prior

May 2008 Planning Level Study for Alternative Surface Water Pipeline Routing in Montgomery County Lone Star Groundwater Conservation District and San Jacinto River Authority
page 65
Regulatory Study and Facilities Implementation Plan utilized Appendix F(Cost Estimating Procedure) of the TWDB 2006 Region H Regional Water Plan, which is based on second quarter 2002 dollars. For this Surface Water Supply Plan, the Engineering News Record Construction Cost Index (ENR CCI) was used to adjust the Region H cost data to January 2008 dollars.
See Appendix F for additional detail on unit cost development.
3.5.1 Waterline Unit Costs
The bid tabs for 24 recent waterline construction projects that were bid between 2004 and 2007 were analyzed to help identify any recent cost trends in the last 5-10 years. The ENR CCI was used to adjust the bid tab data for each project to January 2008 dollars, based on when the project was bid.
A comparison of the Region H cost data and the recent waterline project cost data is shown in Figure 5. The open cut unit costs for the recent waterline data tended to be less than the Region H urban costs and more than the Region H rural costs. This is likely due to a varying level of urbanization at the 24 different recent waterline project sites.
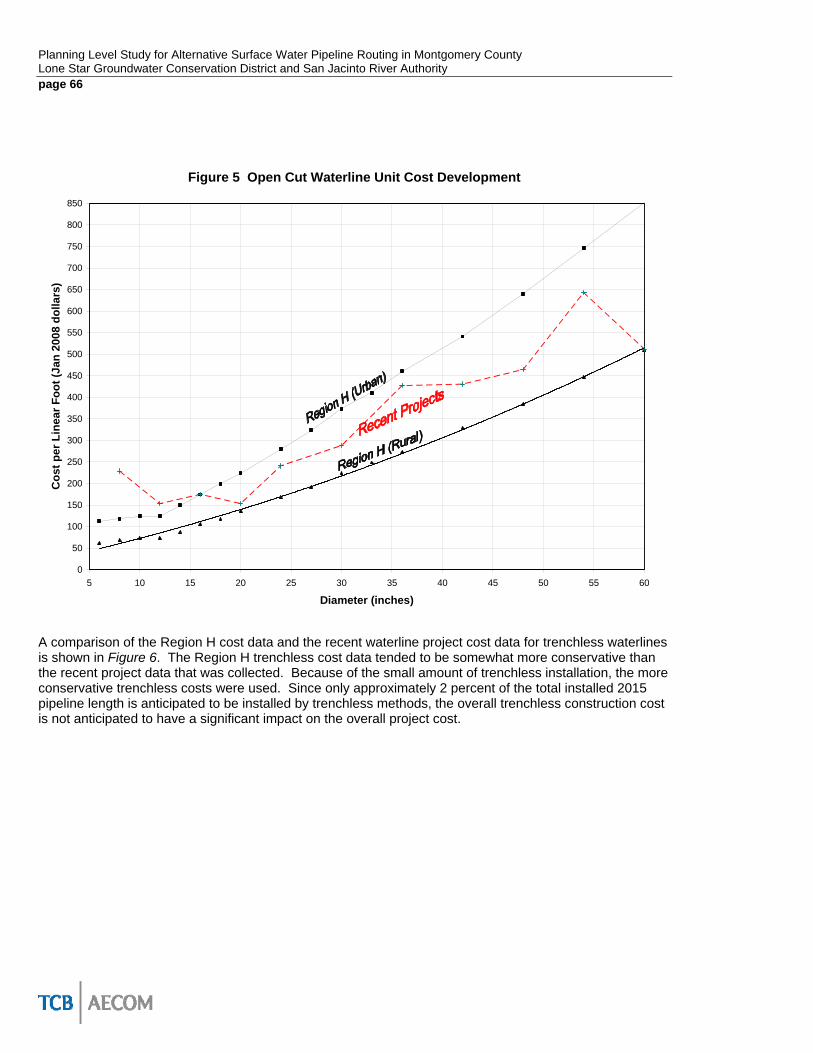
Planning Level Study for Alternative Surface Water Pipeline Routing in Montgomery CountyLone Star Groundwater Conservation District and San Jacinto River Authority page 66
Figure 5 Open Cut Waterline Unit Cost Development
0
50
100
150
200
250
300
350
400
450
500
550
600
650
700
750
800
850
5 10 15 20 25 30 35 40 45 50 55 60
Diameter (inches)
Cos
t per
Lin
ear F
oot (
Jan
2008
dol
lars
)
A comparison of the Region H cost data and the recent waterline project cost data for trenchless waterlines is shown in Figure 6. The Region H trenchless cost data tended to be somewhat more conservative than the recent project data that was collected. Because of the small amount of trenchless installation, the more conservative trenchless costs were used. Since only approximately 2 percent of the total installed 2015 pipeline length is anticipated to be installed by trenchless methods, the overall trenchless construction cost is not anticipated to have a significant impact on the overall project cost.

May 2008 Planning Level Study for Alternative Surface Water Pipeline Routing in Montgomery County Lone Star Groundwater Conservation District and San Jacinto River Authority
page 67
Figure 6 Trenchless Waterline Unit Cost Development
0
100
200
300
400
500
600
700
800
900
1,000
1,100
1,200
1,300
1,400
1,500
1,600
1,700
1,800
1,900
2,000
2,100
2,200
5 10 15 20 25 30 35 40 45 50 55 60
Diameter (inches)
Cos
t per
Lin
ear F
oot (
Jan
2008
dol
lars
)
As a result of all the cost input gathered from recent projects and Region H, the conclusion was drawn that the Region H unit cost data, as adjusted to January 2008 dollars, formed a representative basis for estimating proposed pipeline construction in the local area. However, the recommended alignment passes through downtown Conroe, The Woodlands, the IH-45 corridor, and the surrounding growing areas. These areas are expected to result in a higher level of pipeline installation complexity than would be expected in other parts of Region H.
The additional project complexity is generally due to the disruptions in these heavily developed areas and requirements that would be needed to protect or restore the area. Pipeline construction generally requires an open cut trench to install pipe or open cut access pits from which the pipe is constructed underground. Both of these open cut areas have the potential to disrupt traffic, buried utilities, landscaped or forested areas, or other surface improvements.
In addition to traffic and utilities throughout these areas, The Woodlands has a number of waterways, parks, and heavily forested areas and downtown Conroe has the adjacent railroad and historic buildings that will need to be protected.
The resulting additional utility adjustments/crossings, traffic control, protective measures, and surface restoration in these areas are expected to add approximately 10 percent to the pipeline construction cost. Both open cut and trenchless unit costs were adjusted to account for the additional complexity of working in these areas.

Planning Level Study for Alternative Surface Water Pipeline Routing in Montgomery CountyLone Star Groundwater Conservation District and San Jacinto River Authority page 68
Table 44 below summarizes the unit costs that were used for estimating pipeline construction costs on this project.
Table 44 Unit Costs for Waterline Construction
Pipe Diameter (inches)
Open Cut (Rural) ($/LF)
Open Cut (Urban) ($/LF)
Trenchless ($/LF)
6 70 125 835 8 75 130 855 10 80 135 900 12 85 140 890 14 95 165 16 115 190 1,005 18 130 220 1,100 20 150 245 1,080 24 185 310 1,250 27 210 355 30 245 410 1,390 33 275 450 36 300 505 1,545 42 360 595 1,735 48 425 705 1,915 54 490 820 2,115 60 560 935 2,320
1 Values as of January 2008.
3.5.2 Water Treatment Plant Unit Costs
The Region H conventional treatment plant unit cost curve, after adjustment to January 2008 dollars, varies from $4.65 to $2.71 per gallon per day (gpd) of treated water for a plant between 1 and 10 mgd and varies from $2.71 to $1.75 per gpd of treated water for a plant between 10 mgd and 50 mgd. For a plant larger than 50 mgd, the construction cost is approximately $1.75 per gpd of treated water. The reason for this variation is due to economy of scale.
The Region H water treatment plant costs, after adjustment to January 2008 dollars and without contingencies, are illustrated below in Figure 7.

May 2008 Planning Level Study for Alternative Surface Water Pipeline Routing in Montgomery County Lone Star Groundwater Conservation District and San Jacinto River Authority
page 69
Figure 7 Region H Water Treatment Plant Cost per GPD
$-
$0.25
$0.50
$0.75
$1.00
$1.25
$1.50
$1.75
$2.00
$2.25
$2.50
$2.75
$3.00
$3.25
$3.50
$3.75
$4.00
$4.25
$4.50
$4.75
0 20 40 60 80 100 120 140 160 180 200
Treatment Capacity (MGD)
Con
stru
ctio
n C
ost (
$/G
PD)
Construction costs are typically higher during the initial construction phase than during subsequent expansion phases. This factor is not reflected in the Region H estimating values which only reflect new construction and not expansion phases. Obviously, how much variation exists between the initial construction phase and subsequent expansion phases will vary from plant to plant and phase to phase, depending on how much infrastructure is put in with the initial phase that decreases the cost of subsequent phases. Generally, facilities such as administrative and maintenance facilities, site development, intakes, and pump stations are mostly constructed during the initial phase, resulting in a higher initial phase cost and substantial reduction in the cost per MGD in subsequent phases. The actual cost for the different phases of construction will be much better defined during the preliminary engineering phase of design when the facilities that will be constructed in each phase will be defined.
A contingency of 35 percent was added to the Region H costs after adjustment to January 2008 cost basis due to the lack of water quality data, the substantially higher cost of membrane technology which may be used, and the conceptual level of the study.
Table 45 below summarizes the unit costs that were used for estimating conventional water treatment plant construction costs on this project.

Planning Level Study for Alternative Surface Water Pipeline Routing in Montgomery CountyLone Star Groundwater Conservation District and San Jacinto River Authority page 70
Table 45 Unit Costs for Conventional Water Treatment Plant Phased Construction
Treatment Plant Capacity (MGD)
Conventional Treatment 2 ($)
1 6,281,000 6 23,122,000 8 29,858,000 10 36,594,000 12 40,662,000 18 52,868,000
22.5 62,022,000 50 117,965,000 75 176,945,000
100 235,926,000 1 Values as of January 2008. 2 Includes 35 percent contingency due to unknowns associated with lack of water quality data, potential inclusion of membrane technology, and conceptual study level.

May 2008 Planning Level Study for Alternative Surface Water Pipeline Routing in Montgomery County Lone Star Groundwater Conservation District and San Jacinto River Authority
page 71
Section 4 Planning Alternatives This section identifies where wholesale treated water is planned to be delivered by conversion phase, the conversion percentages by phase, and the proposed treatment plant and transmission pipeline alternatives. The capital costs, annual cost, and annual water rates are presented for each alternative. Finally, the major elements of a standard SJRA water supply contract are discussed.
4.1 Delivery of Wholesale Water
The most beneficial and efficient wholesale water system will result from delivering water to the largest areas of demand. The top two Montgomery County groundwater producers, and six of the top twenty groundwater producers are geographically situated on the I-45 corridor from the City of Conroe in central County to Southern Montgomery County MUD in southern County.
As a result of the relatively large populations and demands along the I-45 corridor, this area is also experiencing by far the largest declines in aquifer water levels anywhere in the County. A 2008 District study titled Montgomery County Surface Water Conversion Aquifer Study showed that surface water conversion along the I-45 corridor would halt water level declines.
4.1.1 Areas of Conversion Through 2025
The I-45 corridor is targeted for the initial conversion because it addresses the aquifer water level declines and it allows delivery of the largest amount of water using the least amount of transmission pipeline. There is enough demand in the corridor to meet the initial conversion in 2015 and the following conversion in 2025.
Table 46 lists the PWSs targeted for conversion in 2015 and 2025, along with their projected demands. There are currently no official contracts in place to serve these entities; this is a potential list only. There are a number of small PWSs nearby that could also receive wholesale water, but the systems listed here are sufficient to handle the first two conversion phases. Adding more PWSs will increase the pipeline costs, but will reduce the amount each entity will be required to convert.

Planning Level Study for Alternative Surface Water Pipeline Routing in Montgomery CountyLone Star Groundwater Conservation District and San Jacinto River Authority page 72
Table 46 Conversion Area Water Demands: 2015 - 2025
Projected Demand (ac-ft/yr) PWS
2015 2025
The Woodlands 25,270 28,330
City of Conroe 10,400 13,510
Rayford Road MUD 2,090 2,070
Southern Montgomery County MUD 1,970 2,140
City of Oak Ridge North 720 830
City of Shenandoah 510 510
Montgomery County MUD #19 460 460
Chateau Woods MUD 280 370
Woodlands Oaks Subdivision 320 320
TOTALS: 42,020 48,540
The minimum conversion amounts from Table 22 are 19,970 ac-ft/yr and 44,140 ac-ft/yr for 2015 and 2025 respectively.
4.1.1.1 Conversion Amounts in 2015 and 2025
To determine conversion amounts, monthly groundwater production data was compiled for the PWSs in Table 47 for the years 2004 to 2006. These three years represent a mix of wet years (2004, 2006) and one dry year (2005). The projected water demands for 2015 were distributed based on the monthly distribution of pumpage and compared to the volume of surface water available to determine, on a monthly basis, the relative volumes of surface water and groundwater projected to be consumed in aggregate. Table 47 shows, based on historical trends from 2004 to 2006, projected monthly demands, available surface water, surface water usage, and groundwater usage for the 2015 conversion.

May 2008 Planning Level Study for Alternative Surface Water Pipeline Routing in Montgomery County Lone Star Groundwater Conservation District and San Jacinto River Authority
page 73
Table 47 Projected Monthly Conversion in 2015 Based on Historical Trends
Projected Demand
Available Surface Water
Supply Surface Water
Used Groundwater
Used Month
(x 1,000 gal) (x 1,000 gal) (x 1,000 gal) (x 1,000 gal)
Percentage of Demand Met By Surface Water
Jan 832,169 691,852 691,852 140,317 83%Feb 781,142 624,899 624,899 156,243 80%Mar 906,067 691,852 691,852 214,215 76%Apr 1,036,758 669,534 669,534 367,224 65%May 1,155,346 691,852 691,852 463,494 60%Jun 1,153,656 669,534 669,534 484,122 58%Jul 1,486,358 691,852 691,852 794,506 47%Aug 1,632,516 691,852 691,852 940,664 42%Sep 1,520,624 669,534 669,534 851,090 44%Oct 1,385,316 691,852 691,852 693,464 50%Nov 955,040 669,534 669,534 285,506 70%Dec 818,008 691,852 691,852 126,156 85%Jan 704,334 691,852 691,852 12,481 98%Feb 608,914 624,899 608,914 0 100%Mar 751,817 691,852 691,852 59,965 92%Apr 1,040,839 669,534 669,534 371,305 64%May 1,328,799 691,852 691,852 636,946 52%Jun 1,648,668 669,534 669,534 979,134 41%Jul 1,451,811 691,852 691,852 759,959 48%Aug 1,348,065 691,852 691,852 656,213 51%Sep 1,418,903 669,534 669,534 749,369 47%Oct 1,443,954 691,852 691,852 752,102 48%Nov 1,060,652 669,534 669,534 391,117 63%Dec 856,245 691,852 691,852 164,393 81%Jan 902,147 691,852 691,852 210,295 77%Feb 733,470 624,899 624,899 108,572 85%Mar 1,007,244 691,852 691,852 315,392 69%Apr 1,225,419 669,534 669,534 555,885 55%May 1,270,283 691,852 691,852 578,431 54%Jun 1,294,248 669,534 669,534 624,714 52%Jul 1,344,357 691,852 691,852 652,505 51%Aug 1,653,692 691,852 691,852 961,840 42%Sep 1,410,475 669,534 669,534 740,941 47%Oct 1,091,842 691,852 691,852 399,990 63%Nov 917,814 669,534 669,534 248,280 73%Dec 812,008 691,852 691,852 120,156 85%
TOTALS: 40,989,000 24,438,000 24,422,015 16,566,985 60%
The results of the above table are shown graphically in Figure 8.

Planning Level Study for Alternative Surface Water Pipeline Routing in Montgomery CountyLone Star Groundwater Conservation District and San Jacinto River Authority page 74
Figure 8 Projected Monthly Conversion in 2015 Based on Historical Trends
0
200,000
400,000
600,000
800,000
1,000,000
1,200,000
1,400,000
1,600,000
1,800,000
Jan
MarMay Ju
lySep
tNov Ja
nMar
May July
Sept
Nov Jan
MarMay Ju
lySep
tNov
Wat
er U
se (x
100
0 ga
l)
Surface Water Supply Used (x 1000 gal) Groundwater Used (x 1000 gal)
25,000 af/yr SW supplied
17,000 af/yr GW used
The available monthly surface water supply is below the minimum month in 35 of 36 months. Almost 100% of the surface water supply is projected to be used, resulting in a conversion of 60% for supplied PWSs as shown in Table 47. This scenario will allow the water treatment plant to be operated at nearly steady-state throughout the year, which will help to reduce operating costs compared to a plant with large seasonal variations in production.
Table 48 shows, based on historical trends from 2004 to 2006, projected monthly demands, available surface water, surface water usage, and groundwater usage for the 2025 conversion.

May 2008 Planning Level Study for Alternative Surface Water Pipeline Routing in Montgomery County Lone Star Groundwater Conservation District and San Jacinto River Authority
page 75
Table 48 Projected Monthly Conversion in 2025 Based on Historical Trends
Projected Demand
Available Surface Water
Supply Surface Water
Used Groundwater
Used Month
(x 1,000 gal) (x 1,000 gal) (x 1,000 gal) (x 1,000 gal)
Percentage of Demand Met By Surface Water
Jan 961,961 1,394,830 961,961 0 100%Feb 902,976 1,259,847 902,976 0 100%Mar 1,047,385 1,394,830 1,047,385 0 100%Apr 1,198,460 1,349,836 1,198,460 0 100%May 1,335,544 1,394,830 1,335,544 0 100%Jun 1,333,590 1,349,836 1,333,590 0 100%Jul 1,718,183 1,394,830 1,394,830 323,353 81%Aug 1,887,137 1,394,830 1,394,830 492,307 74%Sep 1,757,793 1,349,836 1,349,836 407,958 77%Oct 1,601,382 1,394,830 1,394,830 206,552 87%Nov 1,103,997 1,349,836 1,103,997 0 100%Dec 945,592 1,394,830 945,592 0 100%Jan 814,187 1,394,830 814,187 0 100%Feb 703,886 1,259,847 703,886 0 100%Mar 869,076 1,394,830 869,076 0 100%Apr 1,203,177 1,349,836 1,203,177 0 100%May 1,536,049 1,394,830 1,394,830 141,219 91%Jun 1,905,808 1,349,836 1,349,836 555,973 71%Jul 1,678,248 1,394,830 1,394,830 283,418 83%Aug 1,558,321 1,394,830 1,394,830 163,491 90%Sep 1,640,207 1,349,836 1,349,836 290,372 82%Oct 1,669,166 1,394,830 1,394,830 274,335 84%Nov 1,226,080 1,349,836 1,226,080 0 100%Dec 989,793 1,394,830 989,793 0 100%Jan 1,042,854 1,394,830 1,042,854 0 100%Feb 847,869 1,259,847 847,869 0 100%Mar 1,164,343 1,394,830 1,164,343 0 100%Apr 1,416,546 1,349,836 1,349,836 66,710 95%May 1,468,407 1,394,830 1,394,830 73,577 95%Jun 1,496,110 1,349,836 1,349,836 146,274 90%Jul 1,554,035 1,394,830 1,394,830 159,205 90%Aug 1,911,616 1,394,830 1,394,830 516,786 73%Sep 1,630,465 1,349,836 1,349,836 280,630 83%Oct 1,262,135 1,394,830 1,262,135 0 100%Nov 1,060,964 1,349,836 1,060,964 0 100%Dec 938,656 1,394,830 938,656 0 100%
TOTALS: 47,382,000 49,269,000 42,999,840 4,382,160 91%
The results of the above table are shown graphically in Figure 9.
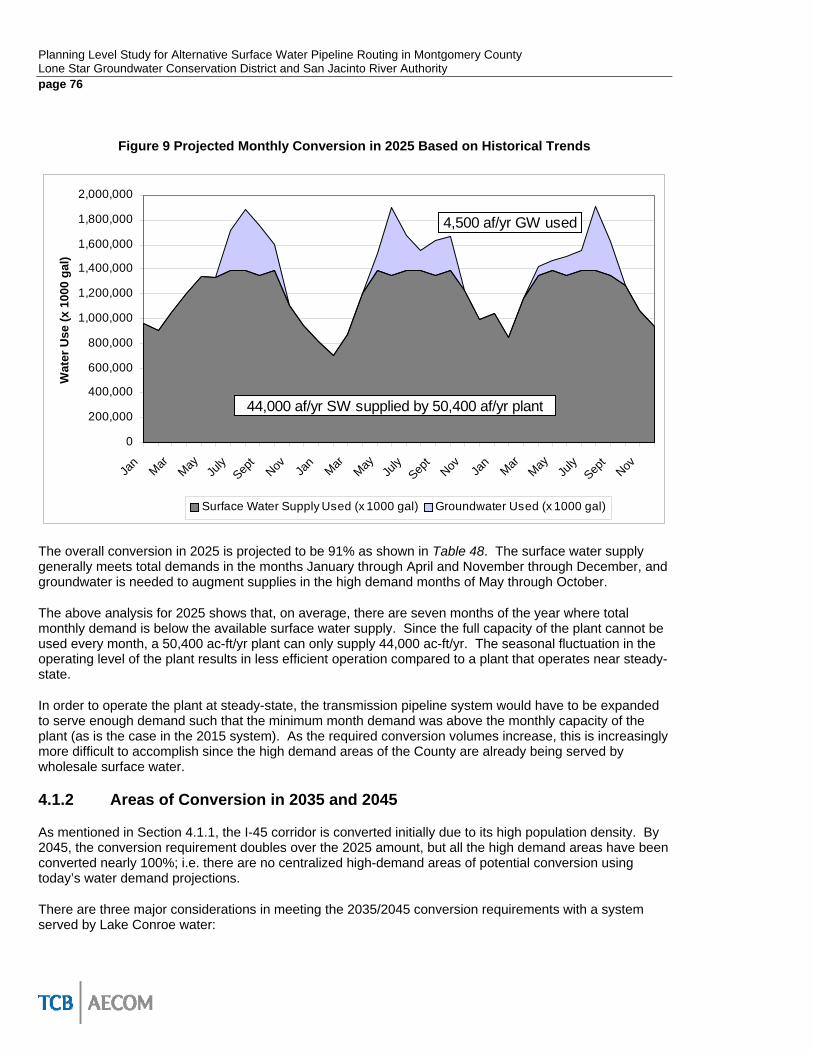
Planning Level Study for Alternative Surface Water Pipeline Routing in Montgomery CountyLone Star Groundwater Conservation District and San Jacinto River Authority page 76
Figure 9 Projected Monthly Conversion in 2025 Based on Historical Trends
0
200,000
400,000
600,000
800,000
1,000,000
1,200,000
1,400,000
1,600,000
1,800,000
2,000,000
Jan
MarMay Ju
lySep
tNov Ja
nMar
May July
Sept
Nov Jan
MarMay Ju
lySep
tNov
Wat
er U
se (x
100
0 ga
l)
Surface Water Supply Used (x 1000 gal) Groundwater Used (x 1000 gal)
4,500 af/yr GW used
44,000 af/yr SW supplied by 50,400 af/yr plant
The overall conversion in 2025 is projected to be 91% as shown in Table 48. The surface water supply generally meets total demands in the months January through April and November through December, and groundwater is needed to augment supplies in the high demand months of May through October.
The above analysis for 2025 shows that, on average, there are seven months of the year where total monthly demand is below the available surface water supply. Since the full capacity of the plant cannot be used every month, a 50,400 ac-ft/yr plant can only supply 44,000 ac-ft/yr. The seasonal fluctuation in the operating level of the plant results in less efficient operation compared to a plant that operates near steady-state.
In order to operate the plant at steady-state, the transmission pipeline system would have to be expanded to serve enough demand such that the minimum month demand was above the monthly capacity of the plant (as is the case in the 2015 system). As the required conversion volumes increase, this is increasingly more difficult to accomplish since the high demand areas of the County are already being served by wholesale surface water.
4.1.2 Areas of Conversion in 2035 and 2045
As mentioned in Section 4.1.1, the I-45 corridor is converted initially due to its high population density. By 2045, the conversion requirement doubles over the 2025 amount, but all the high demand areas have been converted nearly 100%; i.e. there are no centralized high-demand areas of potential conversion using today’s water demand projections.
There are three major considerations in meeting the 2035/2045 conversion requirements with a system served by Lake Conroe water:

May 2008 Planning Level Study for Alternative Surface Water Pipeline Routing in Montgomery County Lone Star Groundwater Conservation District and San Jacinto River Authority
page 77
1. The demand available for conversion, while significant, is spread over a large area with no large concentrations of demand near Lake Conroe;
2. The Southeast portion of the County is considered impractical to serve with water from Lake Conroe due to the length of transmission line required to serve a relatively low demand, eliminating a large portion of the County from consideration;
3. The spatial distribution of the 2006 Region H RWP demand projections (see details of the spatial distribution in the Phase I Study) do not reflect the presence of a surface water transmission system. The distribution of demand will likely change significantly as surface water becomes available.
Items 1 and 3 above are related: the demands are low in concentration and spread over a large area because of the assumptions in the distribution. Serving enough demand to meet the Phase III and Phase IV conversion requirements using the current demand distribution would result in extensive transmission systems to reach small far-flung pockets of demand. The approach for the Phases III and IV line expansions is to limit the extent of pipeline on the assumption that development will be drawn to the areas where transmission pipelines exist or are planned. Also, it is assumed that the total demand in these areas will be predominantly served by surface water; areas that require conversion are assumed to convert at a 90% rate. The usage patterns and relative volumes of surface water and groundwater supply will be similar to that shown in Figure 9.
4.1.3 Post-Conversion Peak Day Well Capacity Requirements
It is important for PWSs to have an understanding of how much water their wells will be required to produce after the initial conversion so they can determine if wells can be taken out of production, and if so, how many. As mentioned previously, the initial phase of conversion will require that, as a group, participating systems convert 60% of their demand from surface water to groundwater. Table 47 shows that the percentage of required groundwater production volume could be as high as 59% of the total demand in high-demand months.
It is necessary to look at the daily variation in demand to determine the peak day production required from groundwater wells. Since the combined water demand from The Woodlands and City of Conroe represents 85% of the total demand for the initial conversion, this analysis focuses on these two entities.
Figure 10 shows historic daily well production volumes for The Woodlands and City of Conroe for the years 2004 to 2006. The combined peak day during that period was July 5, 2005 in the amount of 44,729,000 gal.

Planning Level Study for Alternative Surface Water Pipeline Routing in Montgomery CountyLone Star Groundwater Conservation District and San Jacinto River Authority page 78
Figure 10 2004-2006 Daily Metered Well Production for The Woodlands and City of Conroe
0
5000
10000
15000
20000
25000
30000
35000
40000
45000
50000
1/1/20
043/1
/2004
5/1/20
047/1
/2004
9/1/20
0411
/1/20
041/1
/2005
3/1/20
055/1
/2005
7/1/20
059/1
/2005
11/1/
2005
1/1/20
063/1
/2006
5/1/20
067/1
/2006
9/1/20
0611
/1/20
06
Wat
er U
se (x
1000
gal
)
This daily production pattern was applied to 2015 projected demands and compared to the volume of surface water available assuming The Woodlands and City of Conroe would both convert at a rate of 60%. Figure 11 shows the projected volumes of surface water and groundwater required.

May 2008 Planning Level Study for Alternative Surface Water Pipeline Routing in Montgomery County Lone Star Groundwater Conservation District and San Jacinto River Authority
page 79
Figure 11 Projected 2015 Daily Conversion for The Woodlands and City of Conroe
0
10000
20000
30000
40000
50000
60000
1/1 2/1 3/1 4/1 5/1 6/1 7/1 8/1 9/1 10/1 11/1 12/1
Wat
er U
se (x
100
0 ga
l)
Surface Water Supply Used Daily (x 1000 gal) Groundwater Used Daily (x 1000 gal)
Table 49 shows, for the peak day, total demand, surface water supply, and groundwater supply requirements. It also shows the available daily well production capacity if all wells were left in service, and the percentage of total capacity required for peak day.
Table 49 Conroe and Woodlands 2015 Peak Day Well Production Requirements
Projected Peak Day Demand
Projected Daily Surface Water Supply
Peak Day Groundwater
Supply Required
Projected Daily Well
Production Capacity *
PWS
(x1000 gal) (x1000 gal) (x1000 gal) (x1000 gal)
Well Capacity
Required on Peak Day
(%)
City of Conroe 17,000 5,630 11,370 20,390 56%
SJRA (The Woodlands) 41,200 13,790 27,410 47,693 57%
TOTALS: 58,200 19,420 38,780 68,083 57%
* The total daily production capacity of the wells is based on an 80% duty cycle.

Planning Level Study for Alternative Surface Water Pipeline Routing in Montgomery CountyLone Star Groundwater Conservation District and San Jacinto River Authority page 80
The well production capacities are based on current values; they do not take into account loss in efficiency as aquifer water levels decline. Both Conroe and Woodlands would need to keep, at an absolute minimum, roughly 60% of their total well capacity after the surface water conversion.
The variability in daily demands versus supply should be reviewed further during subsequent preliminary engineering efforts and the results may impact the overall plan and costs.
4.2 Single Plant Alternative
Two planning alternatives were considered. The first alternative, known as the “Single Plant Alternative”, consists of a single proposed water treatment plant to be installed at a location near the Lake Conroe Dam in order to provide water to the entire Conroe System. A second alternative, known as the “Dual Plant Alternative” and discussed in later sections, would utilize two separate proposed water treatment plants instead of one plant.
4.2.1 Water Treatment Plant
4.2.1.1 Proposed Capacity and Phasing
As previously discussed, an ultimate plant treatment capacity of 90 mgd is required. Phasing is planned to provide a minimum number of trains that allows operational flexibility, redundancy, and constructability.
Based upon the anticipated Conroe System demands, four phases that each provide 22.5 mgd of treatment capacity would satisfy the required demands. Table 50 below shows how four 22.5 mgd phases would meet the anticipated demands.
Table 50 Single Plant Treatment Capacity versus Demand by Phase
Phase (Year) Anticipated System Demand (including losses 1)
Total Plant Capacity 1
I (2015) 18.3 MGD 22.5 MGD
II (2025) 40.6 MGD 45 MGD
III (2035) 62.4 MGD 67.5 MGD
IV (2045) 88.8 MGD 90 MGD
1 Assumes a water loss in the plant of 3 percent.
Use of paired trains in each phase would facilitate operational redundancy. Each train would be capable of independent operation. Eight equal 11.25 mgd trains are recommended, as shown in Table 51 below.
Table 51 Single Plant Treatment Capacity by Phase
Phase (Year) Added Capacity per Phase Total Plant Capacity I (2015) 22.5 MGD (2 train @ 11.25 MGD) 22.5 MGD (2 train @ 11.25 MGD) II (2025) 22.5 MGD (2 train @ 11.25 MGD) 45 MGD (4 trains @ 11.25 MGD) III (2035) 22.5 MGD (2 train @ 11.25 MGD) 67.5 MGD (6 trains @ 11.25 MGD) IV (2045) 22.5 MGD (2 train @ 11.25 MGD) 90 MGD (8 trains @ 11.25 MGD)

May 2008 Planning Level Study for Alternative Surface Water Pipeline Routing in Montgomery County Lone Star Groundwater Conservation District and San Jacinto River Authority
page 81
4.2.1.2 Site Assessment
Based upon previous water plant construction and initial site layouts, a minimum of 40-acres of useable property is recommended for construction of a conventional water treatment plant with an ultimate treatment and pumping capacity of 90 mgd. Some of the main design criteria and assumptions that this plant site layout is based on were previously described in Section 3.3.5. The 40 acres does not include any property for a forebay or buffer zones.
A conceptual analysis into the feasibility of constructing a 90-mgd water treatment plant at two alternative sites near the San Jacinto River Authority (SJRA) dam on Lake Conroe was conducted. The two sites were identified by SJRA for consideration and are hereafter referred to as the East Site and West Site.
The East Site is better suited to accommodate a 90-mgd plant of the two sites that SJRA identified. Further investigation, including geotechnical and floodplain analysis, is recommended to insure that all constraints are known prior to providing a more detailed layout. As the layout progresses, consideration of alternate raw water intake sites to avoid crossing through the dam needs to be considered. Purchasing of additional property adjacent to the site is recommended to allow additional flexibility for the project.
4.2.1.2.1 West Site
The West Site, shown in Exhibit 22, consists of approximately 34 acres. The approximate site boundaries were provided by SJRA. A large ditch, located along the southeast edge of the site, passes large volumes of flow coming from across Highway 105 during high rainfall periods, according to SJRA. Conversion of this ditch to a subsurface culvert is possible to allow facility development above-grade, but the facilities that could be constructed over this culvert would be limited. The useable area without this ditch is approximately 28 acres. The useable area is limited by the property lines (or the ditch) to the south, west, and east, and by the access road along the toe of the dam to the north. Highway 105 West and Dam Site Road are directly adjacent to the site along most of the perimeter. Much of the site is covered with storage buildings. Trees cover approximately 30 percent of the site.
The West Site (28-acre useable) is not considered to have enough useable land to accommodate a 90-mgd plant (40-acre minimum). Therefore, additional detailed consideration of this site was not provided.
4.2.1.2.2 East Site
The East Site, shown in Exhibits 14, 15, and 22, consists of approximately 79 acres of land. Of this, approximately 40 acres is useable area that is either not in the floodplain or part of the dam itself. The useable area is bounded to the north by the access road at the toe of the dam, by the 100-year floodplain to the west, and the existing property (and tree) line to the south and east. Minimal trees exist on the site itself.
Exhibits 13, 14, and 15 illustrate a possible layout of the 90-mgd ultimate plant across the site.
4.2.1.3 Site Specific Design Considerations
The following issues are recommended for further consideration as the site investigation proceeds:
4.2.1.3.1 Floodplain
The FEMA floodplain (as delineated on the FIRM panel maps) covers a significant portion of the site on the downstream side of the dam. Comparison of the base flood elevation (BFE) data to a recent topographic map suggests that the floodplain might actually cover less of the site than Zone A of the FIRM map shows.

Planning Level Study for Alternative Surface Water Pipeline Routing in Montgomery CountyLone Star Groundwater Conservation District and San Jacinto River Authority page 82
This is an issue that needs to be investigated during future work. A detailed floodplain analysis may be needed.
4.2.1.3.2 Geotechnical & Structural Analysis
The plant was laid out with no geotechnical information and without consideration of potentially significant site restrictions which could result from the plant being located behind the Lake Conroe Dam.
A detailed geotechnical investigation of the recommended site is considered to be critical prior to doing a more detailed layout. Recommended investigations include groundwater level monitoring, slope stability analysis for any high retaining walls or sloping excavations, evaluation of excavation behind the dam, and other detailed geotechnical investigations appropriate for a plant below a dam where significant excavation may be required.
Future geotechnical work could have a significant impact on the depth of excavation behind the dam and on the ability to use significant retaining walls to allow placement of ground storage tanks. It was assumed that these factors will have no impact on the plant layout, but the extent of the actual impact will not be known until significant geotechnical work has been performed behind the dam and detailed geotechnical and structural analysis is completed. The lack of information in these areas (geotechnical, structural and other development restrictions) is a major consideration in recommending that additional adjacent property be obtained to allow layout flexibility, envisioning design restrictions that are likely to occur once detailed geotechnical and structural engineering analysis are completed.
4.2.1.3.3 Raw Water Pump Station
As shown, the raw water lift station would require another intake to be constructed in the lake. That intake pipe would be constructed either under or through the dam. Following the completion of geotechnical investigation and additional layout studies or a preliminary engineering report (PER), alternative layouts for the raw water pump station and the resulting intake piping are recommended for further consideration. One possible alternative includes a lift station near the top of the dam, close to the existing turnaround, which would enable the intake line to be constructed without crossing through the dam.
The raw water pump station was located assuming that an additional intake and pipeline through the dam would be provided. The actual location of the raw water pump station will depend upon whether an additional line through the dam is practical. It is assumed that a raw water pump station will be required to feed the plant only during periods of low lake level.
4.2.1.3.4 Additional Property
All property from the existing dam access road (at the toe) to the fence line was assumed as useable.
There are a number of reasons to consider purchasing extra property adjacent to the current site. The existing property narrows on the east (highest) side, with approximately 600 feet of width available at the westernmost (lowest) useable portion. As a minimum the property could be “squared-off”, but ideally acquisition of additional adjoining property would allow greater flexibility in the design layout, room to allow plant buffers, ability to mitigate the impact on the dam of deeper filter structures at the lower end of the property, ability to mitigate the sharp drop-off in the middle of the site (drops 10 feet in a 160-feet reach and 20 feet in a 600-feet reach), and allowing additional space for potential future use.
Additionally, no buffer zone (for lighting, access, security, noise, etc.) was used in the conceptual layout for the Lake Conroe Dam site due to the shape of the property and the limited amount of property. It is recommended that additional property be considered to provide some buffer zone for the land located immediately south and east of the plant.

May 2008 Planning Level Study for Alternative Surface Water Pipeline Routing in Montgomery County Lone Star Groundwater Conservation District and San Jacinto River Authority
page 83
4.2.2 Proposed Alignments
4.2.2.1 Right of Way Issues
The right-of-way issues that the revised alignment corridor faces were discussed in Section 3.2.2.2. The Single Plant alternative utilizes all of the proposed alignment corridor except for the Sendera-Conroe (5) segment, the Woodlands Plant (6) segment, and the Research Forest Central (11) segment.
4.2.2.2 Conflict Identification
Table 52 below summarizes the major potential conflicts for the Single Plant pipeline alignment. Additional detail on the potential conflicts is found after Table 52. Each potential conflict is marked in bold letters to facilitate identifying the discussion.
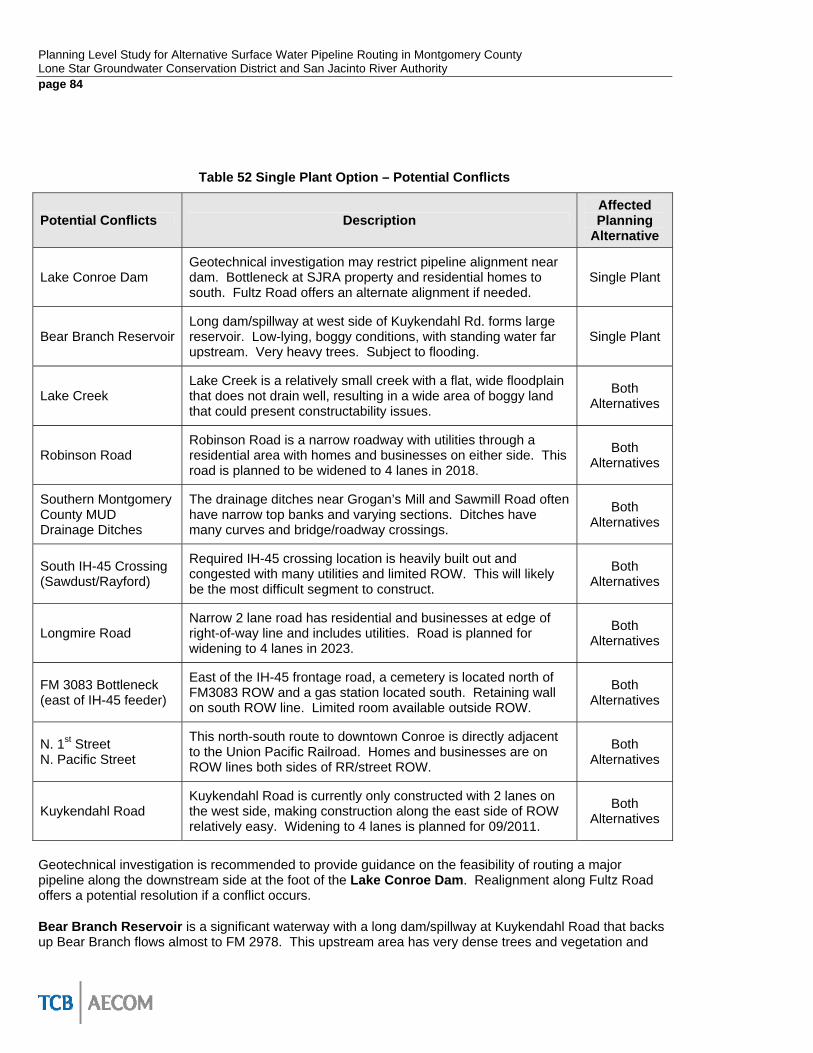
Planning Level Study for Alternative Surface Water Pipeline Routing in Montgomery CountyLone Star Groundwater Conservation District and San Jacinto River Authority page 84
Table 52 Single Plant Option – Potential Conflicts
Potential Conflicts Description Affected Planning
Alternative
Lake Conroe Dam Geotechnical investigation may restrict pipeline alignment near dam. Bottleneck at SJRA property and residential homes to south. Fultz Road offers an alternate alignment if needed.
Single Plant
Bear Branch Reservoir Long dam/spillway at west side of Kuykendahl Rd. forms large reservoir. Low-lying, boggy conditions, with standing water far upstream. Very heavy trees. Subject to flooding.
Single Plant
Lake Creek Lake Creek is a relatively small creek with a flat, wide floodplain that does not drain well, resulting in a wide area of boggy land that could present constructability issues.
Both Alternatives
Robinson Road Robinson Road is a narrow roadway with utilities through a residential area with homes and businesses on either side. This road is planned to be widened to 4 lanes in 2018.
Both Alternatives
Southern Montgomery County MUD Drainage Ditches
The drainage ditches near Grogan’s Mill and Sawmill Road often have narrow top banks and varying sections. Ditches have many curves and bridge/roadway crossings.
Both Alternatives
South IH-45 Crossing (Sawdust/Rayford)
Required IH-45 crossing location is heavily built out and congested with many utilities and limited ROW. This will likely be the most difficult segment to construct.
Both Alternatives
Longmire Road Narrow 2 lane road has residential and businesses at edge of right-of-way line and includes utilities. Road is planned for widening to 4 lanes in 2023.
Both Alternatives
FM 3083 Bottleneck (east of IH-45 feeder)
East of the IH-45 frontage road, a cemetery is located north of FM3083 ROW and a gas station located south. Retaining wall on south ROW line. Limited room available outside ROW.
Both Alternatives
N. 1st Street N. Pacific Street
This north-south route to downtown Conroe is directly adjacent to the Union Pacific Railroad. Homes and businesses are on ROW lines both sides of RR/street ROW.
Both Alternatives
Kuykendahl Road Kuykendahl Road is currently only constructed with 2 lanes on the west side, making construction along the east side of ROW relatively easy. Widening to 4 lanes is planned for 09/2011.
Both Alternatives
Geotechnical investigation is recommended to provide guidance on the feasibility of routing a major pipeline along the downstream side at the foot of the Lake Conroe Dam. Realignment along Fultz Road offers a potential resolution if a conflict occurs.
Bear Branch Reservoir is a significant waterway with a long dam/spillway at Kuykendahl Road that backs up Bear Branch flows almost to FM 2978. This upstream area has very dense trees and vegetation and

May 2008 Planning Level Study for Alternative Surface Water Pipeline Routing in Montgomery County Lone Star Groundwater Conservation District and San Jacinto River Authority
page 85
standing water. While the pipeline could feasibly be routed through this area, the construction costs to install the waterline and construct reliable access would likely be very high. An alternate alignment along Research Forest Drive is recommended. The majority of this roadway is not built or is only two lanes on one side of the right-of-way which would facilitate waterline installation with minimal disruptions. Installation of the missing sections of Research Forest Drive 2 lane road and widening to 4 lanes are planned for 2018, which would allow the pipeline to be installed prior to the remainder of the roadway being constructed.
Lake Creek is a relatively small creek, but it has a very wide floodplain due to the flat area on either side of the creek. As a result, a wide area of land has standing water or boggy conditions which will make pipe installation difficult. For the Single Plant Option, the Fish Creek Thoroughfare will install a raised roadway through this area that will generally address the access and constructability issues. Two lanes of the remaining sections of Fish Creek Thoroughfare are planned for installation in 2011. Pipeline construction will likely occur after this date, so these improvements can be utilized.
Robinson Road is an extension of Woodlands Parkway on the east side of IH-45. This roadway is planned for widening to 4 lanes in 2018. However, this roadway is currently fairly congested with residences and businesses in place very close to the right-of-way lines. Water, sewer, and other utilities were visible. Close coordination with Montgomery County will likely be needed to insure that this line can be placed in the right-of-way.
The drainage ditches near the intersection of Grogan’s Mill and Sawmill Road are the responsibility of Southern Montgomery County MUD. The ditch cross section varies considerably through this area, from relatively shallow (5-10 feet) to relatively deep (20-30 feet). The top of slope width also varies. A tree buffer strip is typically provided at the edge of this ditch. Where existing room is not available, this buffer may need to be removed and replanted to allow pipeline installation to occur. Additionally, the ditches have a number of curves, roadway crossings, and bridges which could increase the cost of construction.
The south IH-45 crossing (Sawdust/Rayford Roads) occurs at the location of existing water facilities for Montgomery county MUD and Southern Montgomery County MUD. The proposed crossing occurs at the site of an existing overhead transmission tower. However, this area is heavily developed and limited right-of-way is available at any location in this area. A large number of utilities occur throughout this area with numerous potential conflicts. Rayford Road is being widened by the County which will limit the available space for pipeline construction. To the east of IH-45, construction of the pipeline in the existing alleys and roadways surrounding the Southern Montgomery County MUD water facilities is anticipated to be disruptive.
Longmire Road is an existing 2 lane roadway that is planned for widening to 4 lanes in 2023. The existing roadway has many curves and very limited ROW in certain stretches, with homes and businesses built on the edge of the existing right-of-way. The presence of existing utilities and the limited ROW could result in potential conflicts.
A “bottleneck” was seen along FM 3083 along the east side of IH-45 at the frontage road. Garden Park Cemetery and Funeral Home is located on the north side of FM 3083. A gas station, fast-food restaurant, and shopping center are located on the south side of FM 3083, directly opposite the funeral home. The shopping center has a retaining wall located at the ROW line, with the parking lot constructed 5-10 feet lower than FM 3083. Additional trenchless construction beyond the IH-45 crossing may be necessary beneath the parking lot if the pipeline cannot be installed in the existing FM 3083 ROW.
The proposed alignment runs along N. 1st Street and N. Pacific Street from North Loop 336 E to downtown Conroe, in order to pick up two City of Conroe water facilities. The Union Pacific Railroad is located adjacent and immediately west of 1st Street and homes and businesses crowd the 1st Street ROW line to the east. Homes are also located adjacent and immediately west of the railroad. Further south, where the alignment crosses the railroad and follows Pacific Street, the railroad is adjacent and

Planning Level Study for Alternative Surface Water Pipeline Routing in Montgomery CountyLone Star Groundwater Conservation District and San Jacinto River Authority page 86
immediately east of the roadway, with historic buildings from downtown Conroe on the west side. Numerous busy streets cross Pacific Street in the vicinity of downtown. The railroad historically has allowed crossings, but has not allowed parallel waterlines to run within their ROW. As a result, the limited existing street right-of-way is likely all that is available – due to the bordering buildings. Limited ROW and the disruptions associated with construction in the downtown area of a growing city will likely result in a number of conflicts. One potential resolution to these conflicts is that if the City of Conroe is planning to add new wells further from downtown in the future, perhaps these older downtown wells could be abandoned. Connection to wells in a less heavily developed area is anticipated to be far less disruptive with more available room for pipeline construction.
Kuykendahl Road is a relatively easy alignment corridor in which to construct the waterline under current conditions because only 2 lanes of the future 4 lane divided roadway has been constructed. In some areas, none of the roadway has been built. The remaining segments of 2 lane road are planned for bid award in May 2009, with the widening to 4 lanes planned for September 2011. Ideally, this segment of pipe should be installed prior to the widening to facilitate construction and minimize disruptions. The possibility of including this segment of pipe with the roadway widening project should be considered if possible.
4.2.2.3 Environmental Impacts
The Single Plant Alternative includes a treatment facility located on the northern end of the project area south of the Lake Conroe Dam and the headwaters of the West Fork of the San Jacinto River (WFSJR). Transmission lines extend to the east and west of the treatment plant site. This alternative includes a treatment site (#1) and water transmission lines.
Archeological site records indicated a concentration of resources near Lake Creek where the proposed transmission line for the Single Plant Alternative traverses the creek. Record #100 was the closest site to the proposed alignment and may be impacted. An investigation was preformed under Texas Antiquities Permit #2979 of Record #100 (previously recorded Site 41MQ100) in 2004 in association with the Fish Creek Thoroughfare expansion project. The portion of this site (Record #100) located within the Fish Creek Thoroughfare right-of-way was shovel tested and appeared to have been impacted by previous construction activities. All artifacts were non-diagnostic, and therefore noted in the field and left in place. However, much of the site appears to be intact and located east of the Fish Creek Thoroughfare right-of-way on private property, therefore no shovel tests were preformed within this portion of the site. In this investigation, the archeologist recommended that no further work would be required on the portion of the site located within the Fish Creek Thoroughfare right-of-way. A field visit is recommended to determine the extent of impacts to this site and if additional archeological work would be necessary. Coordination with the THC is also recommended.
One cemetery was located in the vicinity of the common transmission line for the Single and Dual Plant Alternatives. Garden Park Cemetery is located near the northeast intersection of SH 45 and FM 3083 (Teas Road). The cemetery is approximately 1.3 acres and is owned by Cashner Funeral Home and Cemeteries in Conroe, Texas. The water transmission lines for both alternatives travel along the north side of FM 3083 and potentially encroach on the existing cemetery which has burial sites as close as 62 feet from the edge of pavement. Further analysis is recommended to determine impacts to the property. Consideration for shifting the alignment south or to the opposite side of the road may eliminate impacts to burial sites. Coordination is recommended with the property owner and THC.
Refer to the table below for a list of pipelines crossed by the Single Plant alternative. A concentration of crossings occurs in the City of Oak Ridge North where the water transmission lines for both alternatives are located. Approximately 1.5 miles of the water transmission line for the Single Plant Alternative between Gosling Road and College Park Drive follows a corridor containing the BP Pipelines and Magellan Pipeline Company pipelines. Depending on the proposed construction method for the water transmission lines, no interference may occur if the lines are constructed by tunneling around existing pipelines and the

May 2008 Planning Level Study for Alternative Surface Water Pipeline Routing in Montgomery County Lone Star Groundwater Conservation District and San Jacinto River Authority
page 87
appropriate coordination is conducted. Once the alignments are finalized, further research is recommended to confirm pipeline location, their ownership, and any easements associated with each line.
Table 53 Pipeline Crossings
Pipelines Single Plant
Koch Pipeline 1 Valero Logistics 1 Acacia Natural Gas 2 Trunkline Gas 1 Copano Pipeline/GP Gulf Coast Houston Pipeline Gulf South Pipeline Teppco Crude Pipeline 1 Exxon Mobil Pipeline Genesis Pipeline Texas BP Pipelines 1 Magellan Tennessee Gas Pipelines Kinder Morgan Texas Pipeline
Source: Railroad Commission of Texas, 2005.
Travis Intermediate School and Pathways School are in the Conroe Independent School District (ISD) and are located directly west of the proposed water transmission lines for both alternatives. The schools are on the opposite side of North Pacific Street from the lines off of West Austin Street. No impact is anticipated to these schools.
Houser Elementary is also in the Conroe ISD and is located in Oak Ridge. The proposed water transmission lines for both alternatives border the western edge of the school’s campus. Coordination with the City of Conroe and the Conroe ISD is recommended as the project design progresses and alignments are finalized to determine construction impacts to the Houser Elementary Campus.
Bear Branch Junior High is located west of FM 2978 on Oil Field Road in Magnolia. The school is in Magnolia ISD. The proposed water transmission lines for both alternatives are adjacent to the western border of the Bear Branch Junior High campus. Potential impacts to the property may occur and coordination with the Magnolia ISD and Bear Branch Junior High is recommended.
The proposed transmission lines for both alternatives are adjacent to Oak Ridge High School and CD York Junior high in Oak Ridge. Both schools are in the Conroe ISD. Potential impacts to CD York Junior High may occur along the northern and eastern ends of property where the transmission lines travel along Oak Ridge School Road.
The water transmission line for the Single Plant Alternative has 34 stream intersections (one tributary of Lake Creek, one on Fish Creek, one on Base Creek, two on unnamed tributaries draining into Lake Conroe, two on Bear Branch, one on Carters Slough, two on Nickaburr Branch, two on Panther Branch, one on Sam Bell Gully, one on a tributary of Dry Creek, two on unnamed tributaries into Foley Lake, ten on tributaries of Panther Branch, one on a tributary of Spring Creek, one tributary of Stone Branch, one on a tributary of the West Fork of the San Jacinto River, three on tributaries of White Oak Creek and one on

Planning Level Study for Alternative Surface Water Pipeline Routing in Montgomery CountyLone Star Groundwater Conservation District and San Jacinto River Authority page 88
White Oak Creek). The water transmission lines that are common to both the Single and Dual Plant Alternatives include 29 of the stream intersections mentioned above.
A portion of the proposed treatment plant (#1) for the Single Plant Alternative is located in an area mapped as wetlands. Throughout the project area wetlands are present and segments of the proposed water transmission lines cross these wetlands. Through initial desktop research of the proposed project an area of potential impact in acreage by the water transmission lines was estimated by establishing a 20’ buffer along the proposed lines. Approximately 9.09 acres of wetlands are impacted by the Single Plant Alternative.
The treatment plant site (#1) for both alternatives is located near the Conroe Dam and the beginning of the impaired segment of the WFSJR. The intake site for the Dual Plant Alternative is located on an impaired area of the WFSJR as well. The water transmission line for the Single Plant Alternative crosses the impaired segment of the WFSJR.
The water transmission line for the Dual Plant Alternative travels along and intersects the impaired portion of Panther Branch where it parallels FM 242 (College Park Drive). The water transmission lines for both the Single and Dual Plant Alternatives cross the impaired portion of Panther Branch west of the community of Shenandoah.
Water transmission lines for both the Single and Dual Plant Alternatives cross tributaries to Spring Creek. However, these intersections occur more than two miles upstream from the creek.
The proposed water treatment facilities, intake facility, and many segments of the water transmission lines are located in existing floodplains mapped as Zone A or AE by the Federal Emergency Management Agency (FEMA) on the Flood Insurance Rate Maps (FIRM). Construction and modification of these floodplains may require coordination with the local Montgomery County Floodplain Administrator.
One superfund site, United Creosoting, is located directly adjacent to the proposed transmission lines for both the Single and Dual Plant Alternatives. Refer to the Environmental Constraints Map in Appendix J for the location of this site. The site is on the west side of North First Street, near the intersection of Hilbig Road in the City of Conroe. The site is under the EPA Region 6 Office and is approximately 100 acres. The TCEQ is the lead for operations and maintenance of the ground water monitoring system and the EPA completed a second Five-Year Review in September 2005. A summary of the site’s description, status, and detailed location map can be found in Appendix K. A visual reconnaissance of the project limits is recommended to confirm the location of the listed regulatory facilities; look for evidence of underground or aboveground storage tanks; and look for ground stains or other indications that contaminated soils occur within the project.
4.2.3 Capital Costs
For the single plant option, the water treatment plant and the pipeline are the primary facilities to be constructed. Probable construction costs for the single-plant option are shown in Table 54. A total of $0.5M ($0.4M capital cost plus 25% contingency) connection cost per delivery point is added to the capital costs. This will cover disinfection, additional pumping capacity, tank modifications, additional piping, etc. See Appendix G for detailed capital cost development.

May 2008 Planning Level Study for Alternative Surface Water Pipeline Routing in Montgomery County Lone Star Groundwater Conservation District and San Jacinto River Authority
page 89
Table 54 Single Plant Option – Probable Construction Costs
Phase (Year) Construction Improvement
I (2015) (Million $)
II (2025) (Million $)
III (2035) (Million $)
IV (2045) (Million $)
Pipeline 2 $216 $0 $57 $52 Plant 3 $62 $62 $62 $62 Delivery Point Cost 4 $12 $0 $8 $4 TOTAL $290 $62 $127 $118 1 Values as of January 2008. 2 Pipeline cost includes 25% Contingency. 3 Plant cost includes 35% Contingency. 4 Delivery point cost comprises $0.5M ($0.4M capital cost plus 25% contingency) connection cost per delivery point.
The total project capital cost includes not just the probable construction costs, but all of the other “soft” costs for services and land to allow the construction to occur. Project engineering, program management, environmental studies and mitigation, construction management, financial, and legal services are all required to implement the construction project. Easements and surveying must be performed so that land can be obtained for installation of the facilities. The capital costs in January 2008 dollars, shown in Table 55, do not include any financing costs related to the project. The capital costs in future dollars for the single plant option are shown in Table 56.
Table 55 Single Plant Option – Probable Capital Costs in 2008 Dollars
Phase (Year) Capital Improvements
I (2015) (Million $)
II (2025) (Million $)
III (2035) (Million $)
IV (2045) (Million $)
Construction (Capital) Costs $290 $62 $127 $118Engineering, Financial, & Legal 2 $87 $19 $38 $36Land & Easements $8 $0 $6 $5TOTAL $385 $81 $171 $1591 Values as of January 2008. 2 Engineering, Financial, & Legal Services (30% of probable construction costs which include the following: Engineering 10%, Program Management 3%, Environmental Studies and Mitigation 5%, Surveying 1%, Construction Management 6%, Financial 3% and Legal 2%.).
Table 56 Single Plant Option – Probable Capital Costs in Future Dollars
Phase (Year) Capital Improvements
I (2015) (Million $)
II (2025) (Million $)
III (2035) (Million $)
IV (2045) (Million $)
Construction (Capital) Costs $408 $142 $472 $718Engineering, Financial, & Legal 2 $123 $43 $142 $216Land & Easements $11 $0 $23 $31TOTAL $542 $185 $637 $9641 Values as of the year cost will incur computed at a 5% annual inflation rate. 2 Engineering, Financial, & Legal Services (30% of probable construction costs which include the following: Engineering 10%, Program Management 3%, Environmental Studies and Mitigation 5%, Surveying 1%, Construction Management 6%, Financial 3% and Legal 2%.).

Planning Level Study for Alternative Surface Water Pipeline Routing in Montgomery CountyLone Star Groundwater Conservation District and San Jacinto River Authority page 90
4.2.4 Annual Costs
Annual costs are a sum of the cost to repay the construction loan debt (debt service) and the operations & maintenance (O&M) cost of the system. Debt service constitutes the majority of the annual cost and is dependent on the interest rate and the funding mechanism. The O&M costs, shown in Table 57, consist of consumables, chemical, and supplies, pumping energy costs, labor, and sludge hauling and disposal. See Appendix G for detailed O&M cost development.
Table 57 Single Plant Option – Operations & Maintenance Costs
Phase (Year) Operations & Maintenance Costs
I (2015) (Million $)
II (2025) (Million $)
III (2035) (Million $)
IV (2045) (Million $)
Pipeline 2 $2.2 $2.2 $2.8 $3.3Plant 3 $5.1 $9.1 $12.8 $17.3TOTAL $7.3 $11.4 $15.7 $20.71 Values as of January 2008. 2 Pipeline O&M (1% Pipeline construction costs). 3 Plant O&M costs based on prior experience.
The annual costs, including debt service and raw water purchase, are shown below in Table 58. The cost of raw water, $137/ac-ft, assumes the water in Lake Conroe is purchased from the City of Houston. If SJRA is required to import the water from another basin, the raw water cost can increase significantly.
Table 58 Single Plant Option – Annual Costs
Phase (Year) Annual Costs
I (2015) (Million $)
II (2025) (Million $)
III (2035) (Million $)
IV (2045) (Million $)
Debt Service $33.6 $40.7 $22.0 $28.8Operations & Maintenance $7.3 $11.4 $15.7 $20.7Raw Water Purchase $3.5 $6.9 $10.3 $13.7TOTAL $44.4 $59.0 $48.0 $63.21 Values as of January 2008.
4.2.5 Annual Water Rates
Alternate financing mechanisms were analyzed for the single plant alternative and the anticipated water rates necessary to support the operation and debt service requirements. In all alternative scenarios, it is assumed that engineering/legal services and land purchases must begin six years prior to the operational date of each respective phase. Construction is assumed to begin three years prior to the operational date of each phase. An inflation rate of 5% per year is also factored into the rate assumptions. Rates are adjusted every five years and groundwater pumping fees are assumed to be $0.40 less than the rate for wholesale surface water. The $0.40 differential between groundwater and surface water rates accounts for the operation and maintenance cost that groundwater providers must continue to bear, and is intended to equalize costs. Because of the lack of an initial revenue stream from sale of surface water, no financing scenarios were modeled without an additional revenue source sufficient to cover the debt service until revenues from the sale of surface water are available. For the purposes of this exercise, the additional revenues are assumed to be from pumping fees placed on municipal groundwater users throughout Montgomery County. Alternative sources of additional revenue would affect the projected rate in some

May 2008 Planning Level Study for Alternative Surface Water Pipeline Routing in Montgomery County Lone Star Groundwater Conservation District and San Jacinto River Authority
page 91
manner. Four bond issues, covering the cost of each of the operational phases, were contemplated to cover the capital expenses of engineering/legal services, land acquisition and construction.
Initial analysis was performed using 20 year conventional municipal bond financing at 6% interest. This is the most conservative case and requires the highest level of funding of all of the alternatives to meet operating and debt service requirements. To supply the debt service requirements, an initial groundwater pumping fee of $1.06 would be necessary starting in 2009, which would provide the entire revenue stream until the sale of surface water begins in 2015. A compilation of ground and surface water rates necessary to meet expenses as well as maintain minimal reserves under this scenario are listed in Table 59.
Table 59 Single Plant System Rates for Conventional 20 Year Municipal Financing
Groundwater Surface Water Year Demand
(mgd) Anticipated Rate
($/1,000 gal) Demand
(mgd) Anticipated Rate
($/1,000 gal) 2009 59.6 1.62 2015 49.3 1.77 21.0 2.17 2020 59.7 2.12 21.0 2.52 2025 48.6 2.66 41.0 3.06 2030 58.5 3.76 41.0 4.16 2035 48.0 5.10 61.0 5.50 2040 58.6 6.69 61.0 7.09 2045 46.7 8.18 86.0 8.58 2050 60.8 9.02 86.0 9.42 2055 76.1 10.17 86.0 10.57
Rates are in future dollars at a 5% annual inflation Rate
Conventional 30 year financing at a reduced interest rate of 5% would moderate the initial rates down about 30%. Under this scenario, the requirement to obtain initial revenues from groundwater pumping fees, or some other source would still be necessary to meet the revenue stream requirements. In the long run, the rates would actually increase due to longer term of the financing.
An advantageous initial financing option for the single plant option would be through utilization of the “deferred” Water Infrastructure Fund (WIF) loan program offered by the TWDB. This funding option allows the utility to defer both principal and interest payments for a period of up to ten years or through completion of construction, whichever is sooner for all of the costs associated with Engineering and legal services only. By deferring the payment, a significantly smaller revenue stream is needed from the groundwater pumping fee or other revenue source before surface water sale begins. An example scenario using an initial $0.40/1,000 gal groundwater pumping fee results in rates depicted in Table 60. This scenario utilizes the WIF with a six year deferment for the initial engineering and legal services for Phase I, a WIF 20 year loan at 3% for the Phase I construction activities and for the remaining phases. This allows for meeting all projected debt service and operations. While reducing the initial costs, those costs are only deferred, not avoided. Thus, when deferred payments come due, they actually become due at a higher cost than the annual debt service for a comparable non-deferred WIF loan.
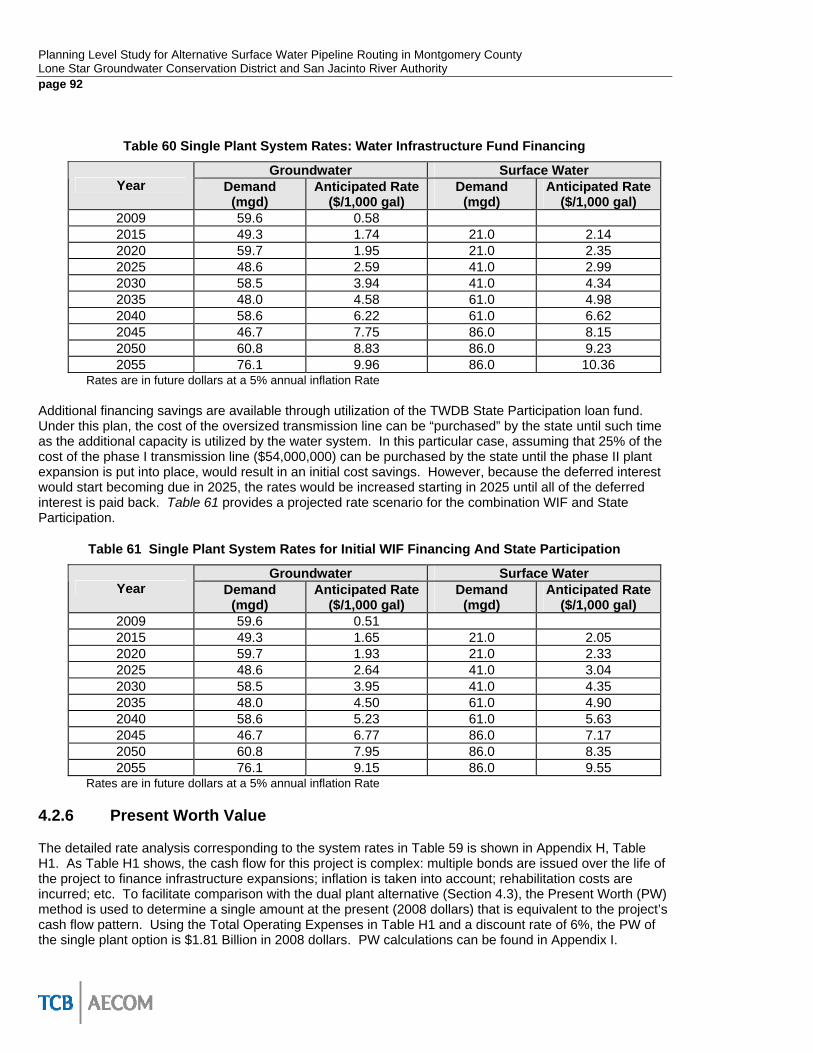
Planning Level Study for Alternative Surface Water Pipeline Routing in Montgomery CountyLone Star Groundwater Conservation District and San Jacinto River Authority page 92
Table 60 Single Plant System Rates: Water Infrastructure Fund Financing
Groundwater Surface Water Year Demand
(mgd) Anticipated Rate
($/1,000 gal) Demand
(mgd) Anticipated Rate
($/1,000 gal) 2009 59.6 0.58 2015 49.3 1.74 21.0 2.14 2020 59.7 1.95 21.0 2.35 2025 48.6 2.59 41.0 2.99 2030 58.5 3.94 41.0 4.34 2035 48.0 4.58 61.0 4.98 2040 58.6 6.22 61.0 6.62 2045 46.7 7.75 86.0 8.15 2050 60.8 8.83 86.0 9.23 2055 76.1 9.96 86.0 10.36
Rates are in future dollars at a 5% annual inflation Rate
Additional financing savings are available through utilization of the TWDB State Participation loan fund. Under this plan, the cost of the oversized transmission line can be “purchased” by the state until such time as the additional capacity is utilized by the water system. In this particular case, assuming that 25% of the cost of the phase I transmission line ($54,000,000) can be purchased by the state until the phase II plant expansion is put into place, would result in an initial cost savings. However, because the deferred interest would start becoming due in 2025, the rates would be increased starting in 2025 until all of the deferred interest is paid back. Table 61 provides a projected rate scenario for the combination WIF and State Participation.
Table 61 Single Plant System Rates for Initial WIF Financing And State Participation
Groundwater Surface Water Year Demand
(mgd) Anticipated Rate
($/1,000 gal) Demand
(mgd) Anticipated Rate
($/1,000 gal) 2009 59.6 0.51 2015 49.3 1.65 21.0 2.05 2020 59.7 1.93 21.0 2.33 2025 48.6 2.64 41.0 3.04 2030 58.5 3.95 41.0 4.35 2035 48.0 4.50 61.0 4.90 2040 58.6 5.23 61.0 5.63 2045 46.7 6.77 86.0 7.17 2050 60.8 7.95 86.0 8.35 2055 76.1 9.15 86.0 9.55
Rates are in future dollars at a 5% annual inflation Rate
4.2.6 Present Worth Value
The detailed rate analysis corresponding to the system rates in Table 59 is shown in Appendix H, Table H1. As Table H1 shows, the cash flow for this project is complex: multiple bonds are issued over the life of the project to finance infrastructure expansions; inflation is taken into account; rehabilitation costs are incurred; etc. To facilitate comparison with the dual plant alternative (Section 4.3), the Present Worth (PW) method is used to determine a single amount at the present (2008 dollars) that is equivalent to the project’s cash flow pattern. Using the Total Operating Expenses in Table H1 and a discount rate of 6%, the PW of the single plant option is $1.81 Billion in 2008 dollars. PW calculations can be found in Appendix I.

May 2008 Planning Level Study for Alternative Surface Water Pipeline Routing in Montgomery County Lone Star Groundwater Conservation District and San Jacinto River Authority
page 93
4.3 Dual Plant Alternative
4.3.1 Water Treatment Plant
4.3.1.1 Proposed Capacity and Phasing
As previously discussed, an ultimate combined plant treatment capacity of 90 mgd is required. The dual plant option consists of a northern plant and a southern plant that each serve different demand regions with separate pipeline systems. The north and south area existing demands are different and will likely increase at different rates, requiring that the treatment capacities of the two plants be different initially and expanded at different rates. Four phases will be utilized at each plant.
The demands for the north and south regions of the system were estimated to increase as shown in Table 62.
Table 62 Dual Plant Treatment Demand by Plant and Phase
Anticipated System Demand (including losses) Phase (Year) North South Total I (2015) 5.6 MGD 16.9 MGD 22.5 MGD II (2025) 12.4 MGD 32.6 MGD 45 MGD III (2035) 30 MGD 37.5 MGD 67.5 MGD IV (2045) 48 MGD 42 MGD 90 MGD
Based on the estimated demand allocations, the phasing of the north and south treatment plants capacities was determined such that enough treatment capacity was available to meet the required demands.
Table 63 Dual Plant Treatment Capacity by Plant and Phase
Proposed Plant Treatment Capacity Phase (Year) North Plant South Plant Both Plants I (2015) 6 MGD 18 MGD 24 MGD II (2025) 12 MGD 30 MGD 42 MGD III (2035) 30 MGD 36 MGD 66 MGD IV (2045) 48 MGD 42 MGD 90 MGD
Minor variations between the demand and the treatment capacity may require that one additional treatment train being constructed in an earlier or later phase to correctly align with actual growth patterns. The relatively small train size (6 mgd) will allow adjustments to be made between phases as needed to account for demand growth as it actually occurs throughout the system.
The northern plant site at the Lake Conroe Dam would serve the City of Conroe and demands in the northern service area of the system. Four phases that provide 6 mgd in each of the first two phases and 18 mgd in each of the second two phases would satisfy the required demands. Table 64 below shows how eight 6 mgd trains would meet the anticipated demands.
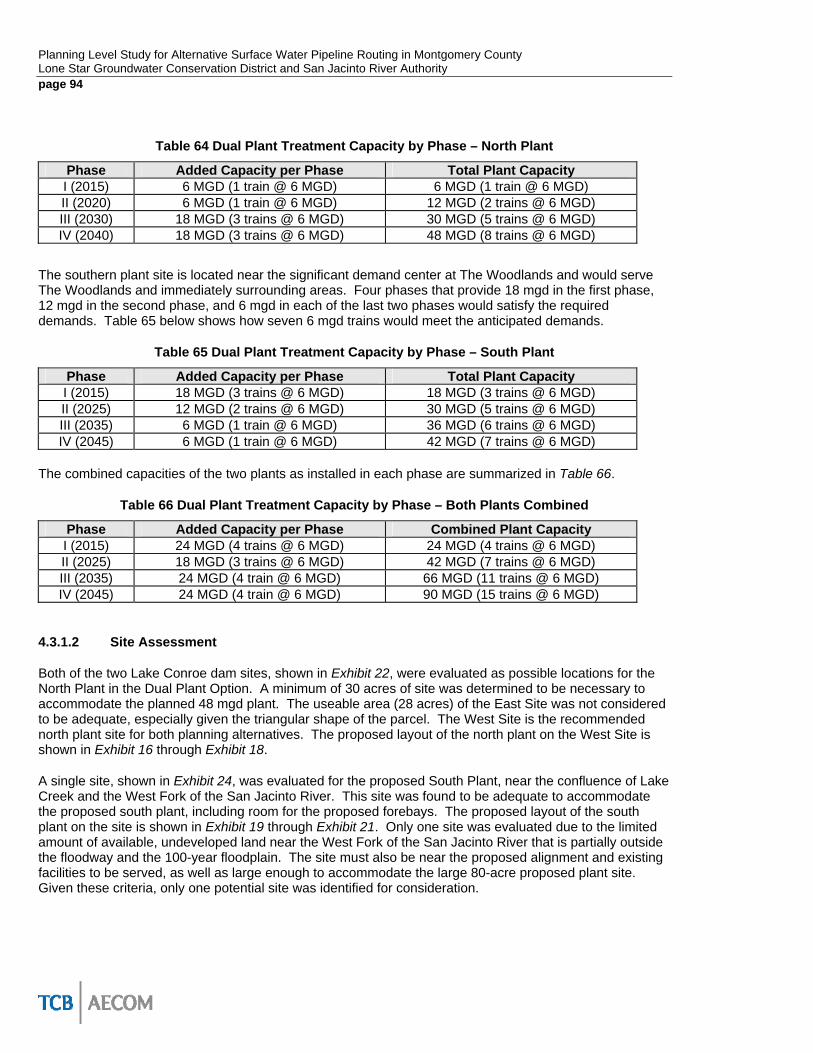
Planning Level Study for Alternative Surface Water Pipeline Routing in Montgomery CountyLone Star Groundwater Conservation District and San Jacinto River Authority page 94
Table 64 Dual Plant Treatment Capacity by Phase – North Plant
Phase Added Capacity per Phase Total Plant Capacity I (2015) 6 MGD (1 train @ 6 MGD) 6 MGD (1 train @ 6 MGD) II (2020) 6 MGD (1 train @ 6 MGD) 12 MGD (2 trains @ 6 MGD) III (2030) 18 MGD (3 trains @ 6 MGD) 30 MGD (5 trains @ 6 MGD) IV (2040) 18 MGD (3 trains @ 6 MGD) 48 MGD (8 trains @ 6 MGD)
The southern plant site is located near the significant demand center at The Woodlands and would serve The Woodlands and immediately surrounding areas. Four phases that provide 18 mgd in the first phase, 12 mgd in the second phase, and 6 mgd in each of the last two phases would satisfy the required demands. Table 65 below shows how seven 6 mgd trains would meet the anticipated demands.
Table 65 Dual Plant Treatment Capacity by Phase – South Plant
Phase Added Capacity per Phase Total Plant Capacity I (2015) 18 MGD (3 trains @ 6 MGD) 18 MGD (3 trains @ 6 MGD) II (2025) 12 MGD (2 trains @ 6 MGD) 30 MGD (5 trains @ 6 MGD) III (2035) 6 MGD (1 train @ 6 MGD) 36 MGD (6 trains @ 6 MGD) IV (2045) 6 MGD (1 train @ 6 MGD) 42 MGD (7 trains @ 6 MGD)
The combined capacities of the two plants as installed in each phase are summarized in Table 66.
Table 66 Dual Plant Treatment Capacity by Phase – Both Plants Combined
Phase Added Capacity per Phase Combined Plant Capacity I (2015) 24 MGD (4 trains @ 6 MGD) 24 MGD (4 trains @ 6 MGD) II (2025) 18 MGD (3 trains @ 6 MGD) 42 MGD (7 trains @ 6 MGD) III (2035) 24 MGD (4 train @ 6 MGD) 66 MGD (11 trains @ 6 MGD) IV (2045) 24 MGD (4 train @ 6 MGD) 90 MGD (15 trains @ 6 MGD)
4.3.1.2 Site Assessment
Both of the two Lake Conroe dam sites, shown in Exhibit 22, were evaluated as possible locations for the North Plant in the Dual Plant Option. A minimum of 30 acres of site was determined to be necessary to accommodate the planned 48 mgd plant. The useable area (28 acres) of the East Site was not considered to be adequate, especially given the triangular shape of the parcel. The West Site is the recommended north plant site for both planning alternatives. The proposed layout of the north plant on the West Site is shown in Exhibit 16 through Exhibit 18.
A single site, shown in Exhibit 24, was evaluated for the proposed South Plant, near the confluence of Lake Creek and the West Fork of the San Jacinto River. This site was found to be adequate to accommodate the proposed south plant, including room for the proposed forebays. The proposed layout of the south plant on the site is shown in Exhibit 19 through Exhibit 21. Only one site was evaluated due to the limited amount of available, undeveloped land near the West Fork of the San Jacinto River that is partially outside the floodway and the 100-year floodplain. The site must also be near the proposed alignment and existing facilities to be served, as well as large enough to accommodate the large 80-acre proposed plant site. Given these criteria, only one potential site was identified for consideration.

May 2008 Planning Level Study for Alternative Surface Water Pipeline Routing in Montgomery County Lone Star Groundwater Conservation District and San Jacinto River Authority
page 95
4.3.1.3 Site Specific Design Considerations
4.3.1.3.1 North Plant
The same design considerations that were discussed in Section 4.2.1.3, for the Single Plant alternative, will apply to the northern plant for the Dual Plant alternative. The actual constraints presented by the floodplain at the west edge of the useable property need to be further evaluated. Geotechnical and structural analysis is needed to determine what constraints are needed for a water treatment plant constructed downstream and adjacent to a major dam. A raw water intake, which may require a crossing through the dam, will be needed to draw water into the plant from the lake by gravity and by pumping when low lake levels may occur. Additional land is recommended to allow greater flexibility in the design layout, room to allow plant buffers, ability to mitigate the impact on the dam of deeper filter structures at the lower end of the property, ability to mitigate the steep contours, and allowing additional space for potential future use. Acquiring additional property is not as significant a consideration for the 48 mgd (Dual Plant alternative) plant as it is for the 90 mgd (Single Plant alternative) plant.
4.3.1.3.2 South River Intake Pump Station
The south plant will require a river intake pumping station to be constructed on the West Fork of the San Jacinto River. This stretch of the river is very shallow with minimal flows during normal conditions. A USGS monitoring station 08068000 indicates that the flow is typically 2 to 4 feet deep with average flows ranging up to 600 mgd. The City of Conroe Wastewater Treatment Plant, located at 2400 Sgt. Ed Holcomb Blvd, is located directly east and just north of the proposed south plant site. This plant is currently permitted by the TCEQ for a daily flow of 10 mgd. The proposed river intake pump station is recommended to be constructed upstream of this wastewater treatment plant in order to avoid receiving treated effluent discharges from the plant.
Construction of some form of impoundment or dam may be necessary in order to ensure that water levels are deep enough at the river intake structure to allow water to be pumped at the required rates at all times. Such an impoundment could potentially be temporary, such as an inflatable dam, to minimize impacts to the river and surrounding floodplain. However, such an impoundment would cause some level of modification to the natural course of the river and should be carefully considered along with any required permitting requirements prior to implementation.
The river intake pump station itself would be a relatively simple structure that consists of separate intake channels with mechanical screens or trash racks to keep river debris out of the channels. Vertical pumps are likely the best alternative to keep the motors and electrical components up out of the floodplain. The pumps would pump the water 0.7 mile through a pipeline to raise it some 30 feet into the forebays.
4.3.1.3.3 South Multiple Low Service Pumping Stations
The south plant site will require multiple low service pump stations to operate continuously in order to supply water due to the required configuration of the site.
Initially, water must be pumped from the river to the forebays. Gravity flow from the river to the forebays is not feasible since the elevation of the available plant site is approximately 30 feet higher than the river water surface.
After settling in the forebays, water would need to be pumped to the head of the plant. While it is potentially feasible to construct the forebays south of the plant at a higher elevation to allow for gravity flow into the plant, the entire south plant site would have to be moved much further to the south to keep the plant out of the 100-year floodplain. Such a move would push the forebays toward the top of the hill and into much steeper terrain which would result in much higher forebay construction costs. To facilitate
Planning Level Study for Alternative Surface Water Pipeline Routing in Montgomery CountyLone Star Groundwater Conservation District and San Jacinto River Authority page 96
forebay construction and keep the plant as close to the river intake station, pumping is required to move water from the forebays to the head of the plant.
Water must also be pumped to the 35-feet tall ground storage tanks after passing through the filters. Finally, a high service pump station is needed to pump water from the ground storage tanks to the pipeline distribution system. Both of these final two steps are typical and will be required at the north plant alternatives as well. However, the two low service pump stations that must be operated continuously to move water from the river into the plant will be costly to maintain and operate.
4.3.1.3.4 South Forebays
The layout of the two required forebays is discussed in the previous section. These forebays are necessary to equalize the water coming into the plant and reduce the high concentration of suspended solids that is expected in the normal river flows. A recommended detention time of 3 days is recommended at this conceptual level. A smaller forebay may be found to be acceptable, based on the treatability studies. Each forebay would hold approximately 126 million gallons (MG) if constructed 15 feet deep with a 10 feet side-water-depth (SWD). The required surface area of each forebay would be approximately 19.4 acres, or 38.7 acres total. Deeper forebay construction is possible in order to reduce the required footprint size, but would likely be more expensive to construct. Construction so that the tops of the perimeter slopes are above the 100-year floodplain is recommended to keep floodwaters from affecting the water quality. A substantial network of ponds, which may be abandoned sand-mining pits, is visible from the aerial photos immediately to the east of the site. Further investigation into this area should be provided as this area could potentially be modified to serve part of the forebay requirements.
4.3.1.3.5 Access
The south plant site is not easily accessible. The roadway to the east of the plant is blocked by a gate and signage indicates that the road is a private driveway to the east of the intersection of Old Smith Road and Old Conroe/Magnolia Road. Old Smith Road / Park Avenue provide public access to the west side of the plant. Park Avenue is a small residential road that does not appear to be well suited for high levels of truck and heavy machinery traffic. The site itself is almost entirely covered with trees.
4.3.1.3.6 Geotechnical and Structural Analysis
The topography consists of a high elevation of 200 feet at the top of a hill located near and along Park Avenue to the southwest of the site. Lake Creek flows at near elevation 115 feet at the north edge of the site. Geotechnical and structural analysis is recommended to determine what vertical arrangement of the plant components can be accommodated. Construction of the forebays to avoid flooding will require a balanced cut and fill to allow construction inside the 100-year floodplain. Slope stability and retaining wall analysis will likely be required to determine what layouts can be accommodated at this site.
4.3.1.3.7 Land Acquisition
As illustrated in Exhibit 18, the Montgomery County Appraisal District records show no recorded property ownership tracts in an approximately 1,700 acre area between existing subdivisions. The proposed site is located within this 1,700 acre area in a location with no apparent residential development on it. The actual property ownership needs to be researched to determine if this 80 acre portion of the property can be obtained and who the legal owner of the existing property is. A large number of trailer homes and other buildings are in place along the east side of Park Avenue without any clear property lines or fences being visible. More substantial stock ponds and buildings are visible on the west side of Park Avenue, but no clear fences or property lines are visible on this side of the road. The property to the east of the site that has a gated private driveway does not show up as a recorded tract in appraisal district records. An

May 2008 Planning Level Study for Alternative Surface Water Pipeline Routing in Montgomery County Lone Star Groundwater Conservation District and San Jacinto River Authority
page 97
abstract/title search is recommended to verify the issues associated with obtaining the property, should this alternative be considered further. 4.3.2 Proposed Alignments
4.3.2.1 Right of Way Issues
The right-of-way issues that the revised alignment corridor faces were discussed in Section 3.2.2.2. The Dual Plant alternative utilizes all of the proposed alignment corridor except for the Lake West (1) segment, the Fish Creek Thoroughfare North (2) segment, the Bear Branch Reservoir (7) / Research Forest West (7A) segment, the Kuykendahl (8) segment, and the Lakeland West (10) segment.
4.3.2.2 Conflict Identification
Table 67 below summarizes the major potential conflicts for the Dual Plant pipeline alignment. A discussion of the potential conflicts associated with the proposed alignments of both alternatives is discussed in Section 4.2.2.2 above. Since the common issues have been discussed, the issues associated only with the Dual Plant alternative are discussed in additional detail after Table 67. Each potential conflict is marked in bold letters to facilitate identifying the discussion.

Planning Level Study for Alternative Surface Water Pipeline Routing in Montgomery CountyLone Star Groundwater Conservation District and San Jacinto River Authority page 98
Table 67 Dual Plant Option – Potential Conflicts
Potential Conflicts Description Affected Planning
Alternative
Alden Bridge Park A residential park, with a large lake, 36’x48’ pavilion/ gazebo, swimming pool, playground, and other amenities. Located at Alden Bridge Road and Drainage Easement.
Dual Plant
Riding & Nature Trail (Sendera-Conroe)
Proposed alignment between residential lots coincides with horse riding and nature trail. Potential resistance from surrounding homeowners to construction in this corridor.
Dual Plant
Lake Creek Lake Creek is a relatively small creek with a flat, wide floodplain that does not drain well, resulting in a wide area of boggy land that could present constructability issues.
Both Alternatives
Robinson Road Robinson Road is a narrow roadway with utilities through a residential area with homes and businesses on either side. This road is planned to be widened to 4 lanes in 2018.
Both Alternatives
Montgomery Co. MUD Drainage Ditches (Woodlands area)
The drainage ditches near Grogan’s Mill and Sawmill Road often have narrow top banks and varying sections. Ditches have many curves and bridge/roadway crossings.
Both Alternatives
South IH-45 Crossing (Sawdust/Rayford)
Required IH-45 crossing location is heavily built out and congested with many utilities and limited ROW. This will likely be the most difficult segment to construct.
Both Alternatives
Longmire Road Narrow 2 lane road has residential and businesses at edge of right-of-way line and several utilities. Road is planned for widening to 4 lanes in 2023.
Both Alternatives
FM 3083 Bottleneck (east of IH-45 feeder)
Immediately east of the IH-45 frontage road, a cemetery/funeral home is located north of the ROW and a gas station located low with a retaining wall is to south. Limited room outside ROW.
Both Alternatives
N. 1st Street N. Pacific Street
This north-south route to downtown Conroe is directly adjacent to the Union Pacific Railroad. Homes and businesses are on ROW lines both sides of RR/street ROW.
Both Alternatives
Kuykendahl Road Kuykendahl Road is currently only constructed with 2 lanes on the west side, making construction along the east side of ROW relatively easy. Widening to 4 lanes is planned for 09/2011.
Both Alternatives
Alden Bridge Park is a park that is located on the existing creek greenbelt/drainage easement under the Alden Bridge Road bridge. The park consists of a large lake surrounded by paved walking trails, a 36’x48’ pavilion under a gazebo, sport fields, tennis courts, fishing, playground, swimming pool, and a parking lot with 77 parking spaces. The park extends under the bridge at Alden Bridge Road and spreads out to the north and south of the bridge, across the width of the drainage easement. Installation of a pipeline through this park is anticipated to be very disruptive and may encounter resistance from local residents. An alternative alignment is recommended that runs north along Kuykendahl Road, turns east on private property just south of FM 1488, and connects to the dual plant alignment at the transmission easement.
May 2008 Planning Level Study for Alternative Surface Water Pipeline Routing in Montgomery County Lone Star Groundwater Conservation District and San Jacinto River Authority
page 99
This Kuykendahl Road alignment would provide an alternative to using the drainage easement from Kuykendahl Road to Greenbridge Drive. The alternative would allow Alden Bridge Park and the surrounding area to be avoided.
A horse riding and nature trail currently exists along a significant portion of the Sendera-Conroe segment in the vicinity of Cattle Drive and Windcrest Drive. This riding and nature area is a cleared dirt trail, roughly 20 feet wide, that is located immediately adjacent to the east-west property fenceline. The deep residential lots have dense trees and vegetation. Markers are located at the roadway crossings. While this trail would make a good access area for constructing and maintaining the pipeline, construction of a waterline on this nature and riding trail would cause disruptions that could encounter local homeowner resistance. Close communication and coordination with the local homeowners to provide trail extensions and improvements as part of the pipeline construction could help address this potential conflict.
Lake Creek was discussed previously as a common issue to both alignments. For the Single Plant alternative, the construction of the raised Fish Creek Thoroughfare will help address the constructability and access issues that Lake Creek’s boggy floodplain area presents. For the Dual Plant alternative, the proposed alignment would cross Lake Creek and the adjacent West Fork of the San Jacinto River in a different location from the Single Plant alternative. This area is also very flat and subject to flooding and will likely encounter constructability and maintenance access issues. Fish Creek Thoroughfare will offer no improvements in this area. Fortunately, the length of alignment in this area is limited (0.7 miles), but construction and O&M costs are likely to be higher in this segment as a result.
4.3.2.3 Environmental Impacts
The Dual Plant Alternative includes a second treatment plant site (#2) which is located near Lake Creek close to its confluence with the West Fork of the San Jacinto River (WFSJR). The Dual Plant Alternative includes an intake facility on the WFSJR and a water transmission line that crosses Lake Creek to connect to the treatment plant (#2). The water transmission line extends from the plant south and then east and west. The Dual Plant Alternative includes treatment plant (#1), treatment plant (#2), an intake site for treatment plant (#2), and the water transmission lines.
One cemetery was located in the vicinity of the common transmission line for the Single and Dual Plant Alternatives. Garden Park Cemetery is located near the northeast intersection of SH 45 and FM 3083 (Teas Road). The cemetery is approximately 1.3 acres and is owned by Cashner Funeral Home and Cemeteries in Conroe, Texas. The water transmission lines for both alternatives travel along the north side of FM 3083 and potentially encroach on the existing cemetery which has burial sites as close as 62 feet from the edge of pavement. Further analysis is recommended to determine impacts to the property. Consideration for shifting the alignment south or to the opposite side of the road may eliminate impacts to burials sights. Coordination is recommended with the property owner and THC.
Refer to the Table 68 below for a list of pipelines crossed by the Dual Plant alternative. A concentration of crossings occurs in the City of Oak Ridge North where the water transmission lines for both alternatives are located. Approximately one mile of the Dual Plant Alternative south of Gosling Road in the Woodlands follows a corridor containing the BP Pipelines and Magellan Pipeline Company pipelines. Depending on the proposed construction method for the water transmission lines, no interference may occur if the lines are constructed by tunneling around existing pipelines and the appropriate coordination is conducted. Once the alignments are finalized, further research is recommended to confirm pipeline location, their ownership, and any easements associated with each line.

Planning Level Study for Alternative Surface Water Pipeline Routing in Montgomery CountyLone Star Groundwater Conservation District and San Jacinto River Authority page 100
Table 68 Pipeline Crossings
Pipelines Dual Plant
Koch Pipeline Valero Logistics Acacia Natural Gas Trunkline Gas Copano Pipeline/GP Gulf Coast 3 Houston Pipeline 1 Gulf South Pipeline 3 Teppco Crude Pipeline 3 Exxon Mobil Pipeline 8 Genesis Pipeline Texas 3 BP Pipelines 9 Magellan 1 Tennessee Gas Pipelines 2 Kinder Morgan Texas Pipeline 1
Source: Railroad Commission of Texas, 2005.
Travis Intermediate School and Pathways are in the Conroe Independent School District and are located directly west of the proposed water transmission lines for both alternatives. The schools are on the opposite side of North Pacific Street from the lines off of West Austin Street. No impact is anticipated to these schools.
Houser Elementary is also in the Conroe ISD and is located in Oak Ridge. The proposed water transmission lines for both alternatives border the western edge of the school’s campus. Coordination with the City of Conroe and the Conroe ISD is recommended as the project design progresses and alignments are finalized to determine construction impacts to the Houser Elementary Campus.
Bear Branch Junior High is located west of FM 2978 on Oil Field Road in Magnolia. The school is in Magnolia ISD. The proposed water transmission lines for both alternatives are adjacent to the western border of the Bear Branch Junior High campus. Potential impacts to the property may occur and coordination with the Magnolia ISD and Bear Branch Junior High is recommended.
The proposed transmission lines for both alternatives are adjacent to Oak Ridge High School and CD York Junior high in Oak Ridge. Potential impacts to CD York Junior High may occur along the northern and eastern ends of property where the transmission lines travel along Oak Ridge School Road.
The water transmission line for the Dual Plant Alternative has 40 stream intersections (three on tributaries of Lake Creek, two on Bear Branch, one on Carters Slough, two on Nickaburr Branch, one on Sam Bell Gully, one on a tributary of Dry Creek, two on unnamed tributaries into Foley Lake, 11 on tributaries of Panther Branch, eight on Panther Branch, one on a tributary of Spring Creek, one tributary of Stone Branch, one on a tributary of the WFSJR, one on the WFSJR, three on tributaries of White Oak Creek and one on White Oak Creek). The water transmission lines that are common to both the Single and Dual Plant Alternatives include 29 of the stream intersections mentioned above.

May 2008 Planning Level Study for Alternative Surface Water Pipeline Routing in Montgomery County Lone Star Groundwater Conservation District and San Jacinto River Authority
page 101
The proposed intake site on the WFSJR for treatment plant (#2) for the Dual Plant Alternative is located in an area mapped as wetland. Throughout the project area wetlands are present and segments of the proposed water transmission lines cross these wetlands. Through initial desktop research of the proposed project an area of potential impact in acreage by the water transmission lines was estimated by establishing a 20’ buffer along the proposed lines. Approximately seven acres of wetlands are impacted by the Dual Plant Alternative. The greatest concentrations of wetlands are mapped near the WFSJR, near Lake Conroe, and around Lake Creek.
The treatment plant site (#1) for both alternatives is located near the Conroe Dam and the beginning of the WFSJR in the impaired area. The intake site for the Dual Plant Alternative is also located on an impaired area of the WFSJR.
The water transmission line for the Dual Plant Alternative travels along and intersects Panther Branch where it parallels FM 242 (College Park Drive). The water transmission lines for both the Single and Dual Plant Alternatives cross Panther Branch west of the community of Shenandoah.
Water transmission lines for both the Single and Dual Plant Alternatives cross tributaries to Spring Creek. However, these intersections occur more than two miles upstream from the creek.
The proposed water treatment facilities, intake facility, and many segments of the water transmission lines are located in existing floodplains mapped as Zone A or AE by the Federal Emergency Management Agency (FEMA) on the Flood Insurance Rate Maps (FIRM). Construction and modification of these floodplains may require coordination with the local Montgomery County Floodplain Administrator.
One superfund site, United Creosoting, is located directly adjacent to the proposed transmission lines for both the Single and Dual Plant Alternatives. Refer to the Environmental Constraints Map in Appendix J for the location of this site. The site is on the west side of North First Street, near the intersection of Hilbig Road in the City of Conroe. The site is under the EPA Region 6 Office and is approximately 100 acres. The TCEQ is the lead for operations and maintenance of the ground water monitoring system and the EPA completed a second Five-Year Review in September 2005. A summary of the site’s description, status, and detailed location map can be found in Appendix K. A visual reconnaissance of the project limits is recommended to confirm the location of the listed regulatory facilities; look for evidence of underground or aboveground storage tanks; and look for ground stains or other indications that contaminated soils occur within the project.
4.3.3 Capital Costs
Capital costs are generally known as construction costs. For the dual plant option, additional facilities are required beyond just the water treatment plants and the pipelines. The south plant requires the construction of dual forebays and a river intake pump station and pipeline to convey water from the river to the forebays. A total of $0.5M ($0.4M capital cost plus 25% contingency) connection cost per delivery point is added to the capital costs. This will cover disinfection, additional pumping capacity, tank modifications, additional piping, etc. Probable construction costs for the dual-plant option are shown in Table 69.
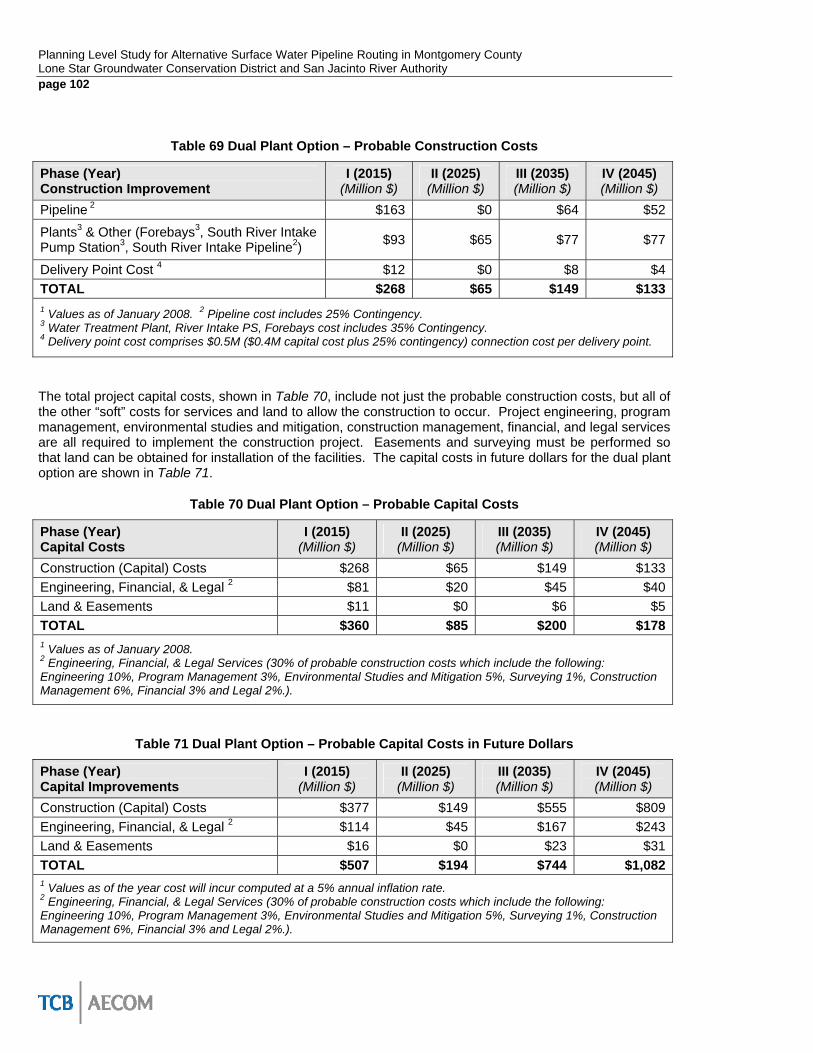
Planning Level Study for Alternative Surface Water Pipeline Routing in Montgomery CountyLone Star Groundwater Conservation District and San Jacinto River Authority page 102
Table 69 Dual Plant Option – Probable Construction Costs
Phase (Year) Construction Improvement
I (2015) (Million $)
II (2025) (Million $)
III (2035) (Million $)
IV (2045) (Million $)
Pipeline 2 $163 $0 $64 $52
Plants3 & Other (Forebays3, South River Intake Pump Station3, South River Intake Pipeline2) $93 $65 $77 $77
Delivery Point Cost 4 $12 $0 $8 $4TOTAL $268 $65 $149 $1331 Values as of January 2008. 2 Pipeline cost includes 25% Contingency. 3 Water Treatment Plant, River Intake PS, Forebays cost includes 35% Contingency. 4 Delivery point cost comprises $0.5M ($0.4M capital cost plus 25% contingency) connection cost per delivery point.
The total project capital costs, shown in Table 70, include not just the probable construction costs, but all of the other “soft” costs for services and land to allow the construction to occur. Project engineering, program management, environmental studies and mitigation, construction management, financial, and legal services are all required to implement the construction project. Easements and surveying must be performed so that land can be obtained for installation of the facilities. The capital costs in future dollars for the dual plant option are shown in Table 71.
Table 70 Dual Plant Option – Probable Capital Costs
Phase (Year) Capital Costs
I (2015) (Million $)
II (2025) (Million $)
III (2035) (Million $)
IV (2045) (Million $)
Construction (Capital) Costs $268 $65 $149 $133Engineering, Financial, & Legal 2 $81 $20 $45 $40Land & Easements $11 $0 $6 $5TOTAL $360 $85 $200 $1781 Values as of January 2008. 2 Engineering, Financial, & Legal Services (30% of probable construction costs which include the following: Engineering 10%, Program Management 3%, Environmental Studies and Mitigation 5%, Surveying 1%, Construction Management 6%, Financial 3% and Legal 2%.).
Table 71 Dual Plant Option – Probable Capital Costs in Future Dollars
Phase (Year) Capital Improvements
I (2015) (Million $)
II (2025) (Million $)
III (2035) (Million $)
IV (2045) (Million $)
Construction (Capital) Costs $377 $149 $555 $809Engineering, Financial, & Legal 2 $114 $45 $167 $243Land & Easements $16 $0 $23 $31TOTAL $507 $194 $744 $1,0821 Values as of the year cost will incur computed at a 5% annual inflation rate. 2 Engineering, Financial, & Legal Services (30% of probable construction costs which include the following: Engineering 10%, Program Management 3%, Environmental Studies and Mitigation 5%, Surveying 1%, Construction Management 6%, Financial 3% and Legal 2%.).
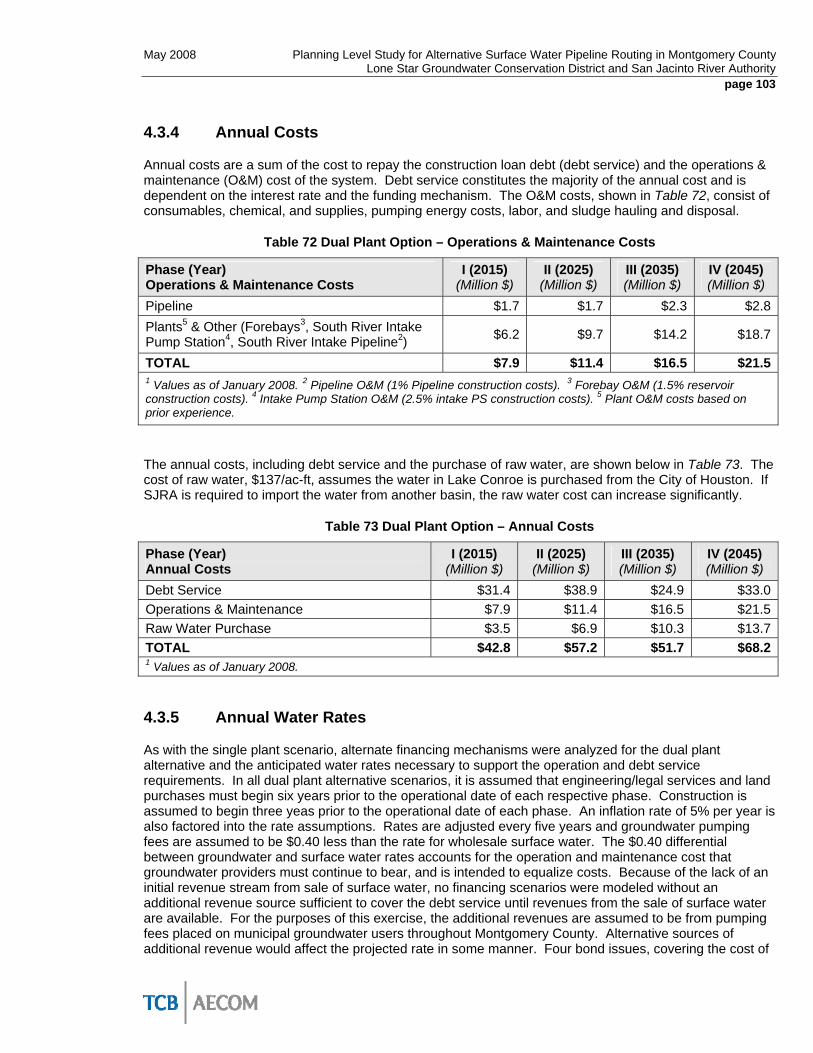
May 2008 Planning Level Study for Alternative Surface Water Pipeline Routing in Montgomery County Lone Star Groundwater Conservation District and San Jacinto River Authority
page 103
4.3.4 Annual Costs
Annual costs are a sum of the cost to repay the construction loan debt (debt service) and the operations & maintenance (O&M) cost of the system. Debt service constitutes the majority of the annual cost and is dependent on the interest rate and the funding mechanism. The O&M costs, shown in Table 72, consist of consumables, chemical, and supplies, pumping energy costs, labor, and sludge hauling and disposal.
Table 72 Dual Plant Option – Operations & Maintenance Costs
Phase (Year) Operations & Maintenance Costs
I (2015) (Million $)
II (2025) (Million $)
III (2035) (Million $)
IV (2045) (Million $)
Pipeline $1.7 $1.7 $2.3 $2.8Plants5 & Other (Forebays3, South River Intake Pump Station4, South River Intake Pipeline2) $6.2 $9.7 $14.2 $18.7
TOTAL $7.9 $11.4 $16.5 $21.51 Values as of January 2008. 2 Pipeline O&M (1% Pipeline construction costs). 3 Forebay O&M (1.5% reservoir construction costs). 4 Intake Pump Station O&M (2.5% intake PS construction costs). 5 Plant O&M costs based on prior experience.
The annual costs, including debt service and the purchase of raw water, are shown below in Table 73. The cost of raw water, $137/ac-ft, assumes the water in Lake Conroe is purchased from the City of Houston. If SJRA is required to import the water from another basin, the raw water cost can increase significantly.
Table 73 Dual Plant Option – Annual Costs
Phase (Year) Annual Costs
I (2015) (Million $)
II (2025) (Million $)
III (2035) (Million $)
IV (2045) (Million $)
Debt Service $31.4 $38.9 $24.9 $33.0Operations & Maintenance $7.9 $11.4 $16.5 $21.5Raw Water Purchase $3.5 $6.9 $10.3 $13.7TOTAL $42.8 $57.2 $51.7 $68.21 Values as of January 2008.
4.3.5 Annual Water Rates
As with the single plant scenario, alternate financing mechanisms were analyzed for the dual plant alternative and the anticipated water rates necessary to support the operation and debt service requirements. In all dual plant alternative scenarios, it is assumed that engineering/legal services and land purchases must begin six years prior to the operational date of each respective phase. Construction is assumed to begin three yeas prior to the operational date of each phase. An inflation rate of 5% per year is also factored into the rate assumptions. Rates are adjusted every five years and groundwater pumping fees are assumed to be $0.40 less than the rate for wholesale surface water. The $0.40 differential between groundwater and surface water rates accounts for the operation and maintenance cost that groundwater providers must continue to bear, and is intended to equalize costs. Because of the lack of an initial revenue stream from sale of surface water, no financing scenarios were modeled without an additional revenue source sufficient to cover the debt service until revenues from the sale of surface water are available. For the purposes of this exercise, the additional revenues are assumed to be from pumping fees placed on municipal groundwater users throughout Montgomery County. Alternative sources of additional revenue would affect the projected rate in some manner. Four bond issues, covering the cost of

Planning Level Study for Alternative Surface Water Pipeline Routing in Montgomery CountyLone Star Groundwater Conservation District and San Jacinto River Authority page 104
each of the operational phases, were contemplated to cover the capital expenses of engineering/legal services, land acquisition and construction.
Initial analysis was performed using 20 year conventional municipal bond financing at 6% interest. This is the most conservative case and requires the highest level of funding of all of the alternatives to meet operating and debt service requirements. To supply the debt service requirements, an initial groundwater pumping fee of $1.06 would be necessary starting in 2009, which would provide the entire revenue stream until the sale of surface water begins in 2015. A compilation of ground and surface water rates necessary to meet expenses as well as maintain reserves under this scenario are listed in Table 74.
Table 74 Dual Plant System Rates for Conventional 20 Year Municipal Financing
Groundwater Surface Water Year Demand
(mgd) Anticipated Rate
($/1,000 gal) Demand
(mgd) Anticipated Rate
($/1,000 gal) 2009 59.6 1.51 2015 49.3 1.73 21.0 2.13 2020 59.7 2.12 21.0 2.52 2025 48.6 2.66 41.0 3.06 2030 58.5 3.90 41.0 4.30 2035 48.0 5.31 61.0 5.71 2040 58.6 7.03 61.0 7.43 2045 46.7 8.49 86.0 8.89 2050 60.8 9.29 86.0 9.69 2055 76.1 10.47 86.0 10.87
Rates are in future dollars at a 5% annual inflation Rate
As this example demonstrates, the differential in rates needed to fund this scenario compared to the same type of funding for the single plant option, are noticeable, in the Range of $0.05 to $0.20 per 1,000 gal of water. This was found to be the same with all dual plant scenarios when compared to the single plant options.
The most advantageous initial financing for the dual plant option would be through utilization of the Water Infrastructure Fund (WIF) loan program offered by the TWDB. Unlike the single plant option, the dual plant alternative has no major capital expenditure where excess capacity of the constructed facility could be purchased by the state until needed. The WIF funding option allows the utility to defer both principal and interest payments for a period of up to ten years or through completion of construction, whichever is sooner for all of the costs associated with Engineering and legal services only. By deferring the payment under the WIF, a significantly smaller revenue stream is needed from the groundwater pumping fee or other revenue source before surface water sale begins. A compilation of ground and surface water rates necessary to meet expenses as well as maintain resources are listed in Table 75.
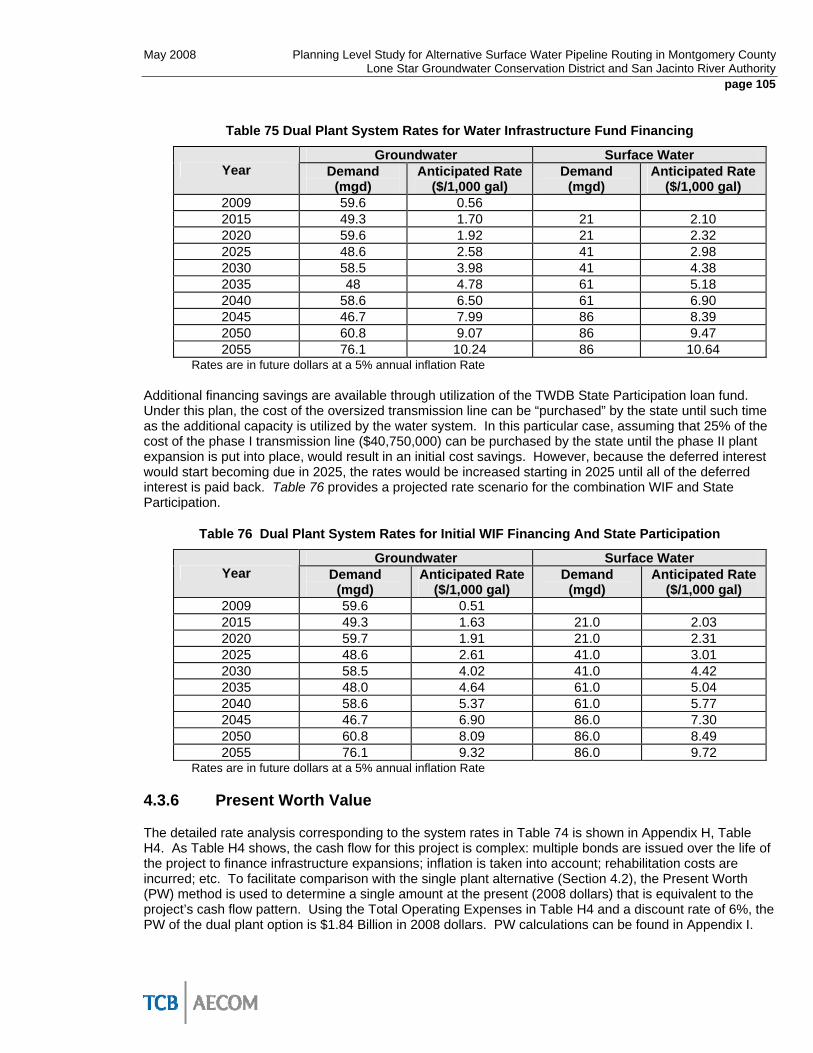
May 2008 Planning Level Study for Alternative Surface Water Pipeline Routing in Montgomery County Lone Star Groundwater Conservation District and San Jacinto River Authority
page 105
Table 75 Dual Plant System Rates for Water Infrastructure Fund Financing
Groundwater Surface Water Year Demand
(mgd) Anticipated Rate
($/1,000 gal) Demand
(mgd) Anticipated Rate
($/1,000 gal) 2009 59.6 0.56 2015 49.3 1.70 21 2.10 2020 59.6 1.92 21 2.32 2025 48.6 2.58 41 2.98 2030 58.5 3.98 41 4.38 2035 48 4.78 61 5.18 2040 58.6 6.50 61 6.90 2045 46.7 7.99 86 8.39 2050 60.8 9.07 86 9.47 2055 76.1 10.24 86 10.64
Rates are in future dollars at a 5% annual inflation Rate
Additional financing savings are available through utilization of the TWDB State Participation loan fund. Under this plan, the cost of the oversized transmission line can be “purchased” by the state until such time as the additional capacity is utilized by the water system. In this particular case, assuming that 25% of the cost of the phase I transmission line ($40,750,000) can be purchased by the state until the phase II plant expansion is put into place, would result in an initial cost savings. However, because the deferred interest would start becoming due in 2025, the rates would be increased starting in 2025 until all of the deferred interest is paid back. Table 76 provides a projected rate scenario for the combination WIF and State Participation.
Table 76 Dual Plant System Rates for Initial WIF Financing And State Participation
Groundwater Surface Water Year Demand
(mgd) Anticipated Rate
($/1,000 gal) Demand
(mgd) Anticipated Rate
($/1,000 gal) 2009 59.6 0.51 2015 49.3 1.63 21.0 2.03 2020 59.7 1.91 21.0 2.31 2025 48.6 2.61 41.0 3.01 2030 58.5 4.02 41.0 4.42 2035 48.0 4.64 61.0 5.04 2040 58.6 5.37 61.0 5.77 2045 46.7 6.90 86.0 7.30 2050 60.8 8.09 86.0 8.49 2055 76.1 9.32 86.0 9.72
Rates are in future dollars at a 5% annual inflation Rate
4.3.6 Present Worth Value
The detailed rate analysis corresponding to the system rates in Table 74 is shown in Appendix H, Table H4. As Table H4 shows, the cash flow for this project is complex: multiple bonds are issued over the life of the project to finance infrastructure expansions; inflation is taken into account; rehabilitation costs are incurred; etc. To facilitate comparison with the single plant alternative (Section 4.2), the Present Worth (PW) method is used to determine a single amount at the present (2008 dollars) that is equivalent to the project’s cash flow pattern. Using the Total Operating Expenses in Table H4 and a discount rate of 6%, the PW of the dual plant option is $1.84 Billion in 2008 dollars. PW calculations can be found in Appendix I.

Planning Level Study for Alternative Surface Water Pipeline Routing in Montgomery CountyLone Star Groundwater Conservation District and San Jacinto River Authority page 106

May 2008 Planning Level Study for Alternative Surface Water Pipeline Routing in Montgomery County Lone Star Groundwater Conservation District and San Jacinto River Authority
page 107
Section 5 Comparison of Alternatives
5.1 Advantages and Disadvantages
5.1.1 Water Treatment Plant Locations
The Single Plant and Dual Plant both make use of the same “East Site” at the existing SJRA property on the south side of the Lake Conroe Dam, so there really is not a significant difference in the alternatives for the “North Plant” location. The primary difference in the alternatives is the presence or absence of the South Plant site. The advantages of the Dual Plant alternative are summarized in Table 77.
Table 77 Dual Plant Advantages
Issue Description
North Plant Site The smaller Dual Plant alternative North Plant is easier to accommodate on the existing site owned by SJRA than the Single Plant alternative plant.
Proximity to Woodlands
The South Plant provides treatment capacity closer to the Woodlands and allows water to be pumped a shorter distance to the demand locations.
The disadvantages of the Dual Plant alternative are summarized in Table 78.
Table 78 Dual Plant Disadvantages
Issue Description
River Intake Pump Station
The South Plant requires a river intake pump station to be constructed on a very shallow stretch of the West Fork San Jacinto River. A dam may also be needed.
Dual Forebay The South Plant requires dual forebays, requiring 40 acres, to match water quality from the North Plant site. Requires pumping from the forebays to the Plant.
Land Acquisition The North Plant site is on existing SJRA property. The South Plant site (80 acres) is not. Ownership of the south site is unknown and may present acquisition issues.
Additional Operating Coordination
Releases from the dam, operation of the river intake pump station, and operation of the plant will need to be carefully coordinated to insure water is always available and not wasted downstream. The North and South Plants will have to be coordinated. Chemical stockpiles will have to be monitored at and delivered to two sites.
Demand Flexibility
The Single Plant can provide treatment capacity to any part of the pipeline system. The North Plant cannot feed the south pipeline, nor the South Plant the north pipeline.
Operations and Maintenance
The river intake pump station, forebays, forebay low service pump station, and multiple plants will require additional O&M costs to run.
Additional Staff Two plants will require more staff to operate and maintain.

Planning Level Study for Alternative Surface Water Pipeline Routing in Montgomery CountyLone Star Groundwater Conservation District and San Jacinto River Authority page 108
5.1.2 Proposed Alignment
The Single Plant and Dual Plant alternatives share much of the same alignment, but do have distinct differences in alignment in certain locations. The primary difference is that the Dual Plant alternative has two separate pipelines where the Single Plant alternative has only one. Additionally, the 55.8 miles of pipeline in the Single Plant alternative is roughly 5.8 miles more than the 50.0 miles of pipeline in the Dual Plant alternative. The additional pipeline is more expensive to install and maintain. However, differences in alignment result in different potential conflicts.
The advantages of the Dual Plant alternative pipeline alignment are summarized in Table 79.
Table 79 Dual Plant Pipeline Advantages
Issue Description
Fish Creek Thoroughfare
The entire length of pipeline along the proposed Fish Creek Thoroughfare does not serve any existing facilities and is not required in the Two Plant alternative.
Cost The Dual Plant alignment is 5.8 miles less than the Single Plant alignment. Less pipeline costs less to construct, operate, and maintain.
The disadvantages of the Dual Plant pipeline alignment are summarized in Table 80.
Table 80 Dual Plant Pipeline Disadvantages
Issue Description
Riding and Nature Trail
The Sendera-Conroe segment is only required in the Dual Plant alternative. This segment is located on an existing nature and riding trail and could encounter resistance from local residents. No alternate alignment is readily available.
Woodlands Plant Segment
The Woodlands Plant segment, including the pipeline feeding water from the West Fork San Jacinto River across the problematic Lake Creek floodway to the South Plant forebays, is only required by the Dual Plant alternative.
Redundancy & Flexibility
The Dual Plant pipeline is not interconnected and therefore is less redundant and has less operational flexibility than the Single Plant pipeline.
5.1.3 Environmental and Historical
Many of the impacts associated with the Single Plant alternative as opposed to the Dual Plant alternative would be the same however there are some differences. The Single Plant alternative would not require the construction of two facilities in different locations nor would it require two intakes. However there are some advantages to the Dual Plant alternative.
The advantages of the Dual Plant alternative pipeline alignment are summarized in Table 81.

May 2008 Planning Level Study for Alternative Surface Water Pipeline Routing in Montgomery County Lone Star Groundwater Conservation District and San Jacinto River Authority
page 109
Table 81 Dual Plant Pipeline Advantages
Issue Description
Water Crossings
The selection of the Dual Plant alternative would consist of 16 water crossings versus 20 intersections which would occur with selection of the Single Plant alternative. This would potentially reduce the amount of permitting required and would impact fewer natural resources.
Wetlands
The Dual Plant alternative would only impact approximately 7 acres of wetlands versus approximately 85 acres of wetlands associated with the Single Plant alternative. This would potentially reduce the amount of permitting required and would impact fewer natural resources.
Pipeline Crossings
The selection of the Dual Plant alternative would result in only 7 pipeline crossings versus 34 pipeline crossings associated with the single Plant alternative.
The disadvantages of the Dual Plant pipeline alignment are summarized in Table 82.
Table 82 Dual Plant Pipeline Disadvantages
Issue Description
Treatment Plant Facilities
The selection of the Dual Plant alternative would require the construction of the two treatment plants and two intakes. This alternative would require construction activities to occur in two locations and place water intakes in two locations. Since the footprints of these facilities are rather large, building two different facilities could potentially impact more natural and cultural resources than would the selection of the Single Plant alternative.
5.1.4 Relationship and Opportunity to Serve Future Planned Development
The opportunity to serve future planned development associated with the Single Plant alternative as opposed to the Dual Plant alternative would be the same for all but the area just to the west and southwest of Conroe. The Single Plant alternative pipe alignment proposes to take the transmission line down the proposed Fish Creek Thoroughfare between Hwy 105 and Sendera Ranch Road. The proposed Fish Creek Thoroughfare is expected to provide the accessibility necessary to further develop that area. Access to the high capacity line provides a convenient mechanism for expanding developments to provide connecting lines to existing, expanding or new pumping facilities in that area. This section of transmission is not included in the Dual Plant alternative.
There are no advantages related to the Dual Plant alternative pipeline alignment in relation to the opportunity to serve future development. The disadvantages of the Dual Plant pipeline alignment are summarized in Table 83.

Planning Level Study for Alternative Surface Water Pipeline Routing in Montgomery CountyLone Star Groundwater Conservation District and San Jacinto River Authority page 110
Table 83 Dual Plant Pipeline Disadvantages: Serving Future Development
Issue Description
Fish Creek Thoroughfare
The pipeline along the proposed Fish Creek Thoroughfare is not required in the Dual Plant alternative and access to surface water connections for future developments in that area would more difficult than with the Single Plant alternative, if not impractical.
5.2 Comparison of Costs
Table 84 summarizes the construction costs of the two planning alternatives.
Table 84 Alternative Comparison – Probable Construction Costs
Phase (Year) I (2015) (Million $)
II (2025) (Million $)
III (2035) (Million $)
IV (2045) (Million $)
Single Plant Alternative $290 $62 $127 $118Dual Plant Alternative $268 $65 $149 $1331 Values as of January 2008.
Table 85 summarizes the total project costs of the two planning alternatives in 2008 dollars. The Single Plant alternative is more expensive ($8M) to construct in 2015 than the Dual Plant alternative. However, the future Dual Plant phased expansions are expected to offset those savings and result in a significantly higher Dual Plant alternative total cost through 2045.
Table 85 Alternative Comparison – Probable Capital Costs
Phase (Year) I (2015) (Million $)
II (2025) (Million $)
III (2035) (Million $)
IV (2045) (Million $)
Single Plant Alternative $385 $81 $171 $159Dual Plant Alternative $360 $85 $200 $1781 Values as of January 2008.
Table 86 summarizes the total project costs of the two planning alternatives in future dollars.
Table 86 Alternative Comparison – Probable Capital Costs in Future Dollars
Phase (Year) I (2015) (Million $)
II (2025) (Million $)
III (2035) (Million $)
IV (2045) (Million $)
Single Plant Alternative $542 $185 $637 $964Dual Plant Alternative $507 $194 $744 $1,0821 Values as of the year cost will incur computed at a 5% annual inflation rate.

May 2008 Planning Level Study for Alternative Surface Water Pipeline Routing in Montgomery County Lone Star Groundwater Conservation District and San Jacinto River Authority
page 111
Table 87 summarizes the operations and maintenance costs of the two planning alternatives. In general, the O&M costs are higher for the dual plant alternative compared to its single plant counterpart.
Table 87 Alternative Comparison – Operation & Maintenance Costs
Phase (Year) I (2015) (Million $)
II (2025) (Million $)
III (2035) (Million $)
IV (2045) (Million $)
Single Plant Alternative $7.3 $11.4 $15.7 $20.7Dual Plant Alternative $7.9 $11.4 $16.5 $21.51 Values as of January 2008.
Table 88 summarizes the annual costs of the two planning alternatives, including financing (debt service).
Table 88 Alternative Comparison – Annual Costs
Phase (Year) I (2015) (Million $)
II (2025) (Million $)
III (2035) (Million $)
IV (2045) (Million $)
Single Plant Alternative $44.4 $59.0 $48.0 $63.2Dual Plant Alternative $42.8 $57.2 $51.7 $68.21 Values as of January 2008.
Table 89 compares the Present Worth of annual costs for each alternative.
Table 89 Alternative Comparison – Present Worth of Annual Costs
Year 2008 (Billion $)
Single Plant Alternative $1.81 Dual Plant Alternative $1.84

Planning Level Study for Alternative Surface Water Pipeline Routing in Montgomery CountyLone Star Groundwater Conservation District and San Jacinto River Authority page 112

May 2008 Planning Level Study for Alternative Surface Water Pipeline Routing in Montgomery County Lone Star Groundwater Conservation District and San Jacinto River Authority
page 113
Section 6 Preferred Alternative Two alternatives for the surface water system were compared; a single-plant option where the plant is located at the Lake Conroe dam, and a dual-plant option where a plant is located at the Lake Conroe dam (north plant) and a plant is located on the West Fork of the San Jacinto River (WFSJR) north of the Woodlands (south plant).
For the Lake Conroe treatment plant proposed for both the single-plant and dual-plant options, two sites were evaluated; a west site and an east site based on land parcels currently owned by SJRA. The east site is the only location along the dam that has enough room for the plant required for both the single and dual plant options, therefore the east site is the only location considered for both the single-plant and dual-plant options, simplifying the comparison.
The single plant option, with the treatment plant located at the Lake Conroe dam east location, is the preferred alternative. The criteria for selection and details of the single plant alternative are provided below.
6.1 Selection Criteria and Stakeholder Acceptance
6.1.1 Selection Criteria
The following comparisons were made in Section 5 for the single-plant and dual-plant options:
• Advantages / Disadvantages of treatment plant locations;
• Advantages / Disadvantages of proposed pipeline alignments;
• Advantages / Disadvantages related to environmental and historical considerations;
• Advantages / Disadvantages related to the opportunity to serve future developments;
• Present Worth Value (PWV) of annual costs.
The Present Worth Value of the annual costs for each alternative is the overriding criteria for selection. The major disadvantages of the dual-plant option are related to the operation of a second plant off-channel; these disadvantages are reflected in the higher operations and maintenance costs of the dual-plant option. In all cases the comparisons of advantages/disadvantages and costs were evaluated in the context of the study assumptions, limitations, and practical considerations of implementing a system by 2015.
6.1.2 Stakeholder Acceptance
The planning for conversion to surface water began in June 2004 when the District and SJRA obtained the Phase I Study grant from TWDB. Over the last several years the District has held a number of public meetings on conversion to surface water and has taken advantage of any opportunity to give presentations to city officials, water district boards, and system operators regarding their regulatory plans and the overall concept of the infrastructure required and cost to implement a regional conversion to surface water.
In August 2006, as part of the current study, the District invited representatives from over 30 cities and water districts in the Conroe/I-45 corridor/Woodlands area to attend a meeting that discussed the technical considerations of introducing surface water to their systems, requested input on preferred routes, and requested information on system problems and planned system expansions. In February 2008 the District

Planning Level Study for Alternative Surface Water Pipeline Routing in Montgomery CountyLone Star Groundwater Conservation District and San Jacinto River Authority page 114
held a public meeting to present the progress of the current study and discuss details of the single-plant and dual-plant options. No public comment was received after that meeting.
Over the last six months, as the District has developed and adopted its Phase II (A) regulatory plan, SJRA has been moving on several fronts; negotiating to secure a larger share of water rights in Lake Conroe, hiring a Program Manager to oversee the planning, design, and construction of a surface water system, and developing a Water Resources Assessment Plan (WRAP) to comply with the Districts’ Phase II (A) District Regulatory Plan (Phase II (A) DRP, adopted 2/12/2008). SJRA’s plan is to construct, maintain, and operate a surface water system that will become operational by January 1, 2015 and that will supply enough surface water to meet the overall goal of the District’s Phase II (A) DRP; a 30% countywide reduction of groundwater use by 2015.
As discussed in this study, relatively few PWSs would likely receive surface water from the SJRA system in 2015. District permittees that do not receive surface water from the SJRA system, or do not develop their own alternative supply that will replace 30% of their groundwater demand by 2015, still have to meet the Phase II (A) DRP requirements. Those permittees can accomplish this by joining the WRAP of another entity who is over-converting enough to handle their 30% reduction, whether it be SJRA or any other entity. SJRA is currently inviting districts to join their WRAP.
Every District permittee that is subject to the Phase II (A) DRP has the flexibility to adopt any solution that will meet the requirements; i.e. there is no requirement to accept the SJRA solution by joining their WRAP. It is SJRA’s goal to incorporate as many permittees as possible in their WRAP: towards that end SJRA has initiated meetings with permittees, welcomed any and all opportunities to discuss the process, and has held two workshops on the SJRA WRAP.
The preferred alternative presented in this study is based on a set of assumptions that may change as SJRA’s water supply options change and as they move forward beginning with the development of a WRAP. SJRA supports the general concepts of the preferred approach although route alignment, pipe sizes, delivery points, phase and plant capacities may change.
6.2 Identification and Phasing of Conversion for Existing Facilities
Overall conversion and phasing requirements are the same for both options. The minimum phasing requirements are given in Table 22. Minimum conversion amounts are 17.8, 39.4, 60.6, and 86.2 mgd for Phase I – IV respectively. The single plant treatment capacity and phasing is discussed in Section 4.2.1.1, and shown in Table 50 and Table 51. The initial treatment plant will be constructed with a capacity of 22.5 mgd, consisting of two 11.25 mgd trains. Plant expansions in 2025, 2035, and 2045 will consist of two 11.25 trains each. The treatment plant capacities by phase are 22.5 mgd, 45 mgd, 67.5 mgd, and 90 mgd.
The preferred pipeline route is predicated on the ability to deliver water to some of the largest groundwater permittees in the County in order to minimize the size of the pipeline network. Table 90 lists the PWSs identified for conversion in 2015 and 2025 along with the proposed delivery points for 2015 and 2025.

May 2008 Planning Level Study for Alternative Surface Water Pipeline Routing in Montgomery County Lone Star Groundwater Conservation District and San Jacinto River Authority
page 115
Table 90 Delivery Points for 2015 and 2025 Conversions
PWS Water Plants Served
The Woodlands All five water plants.
City of Conroe Plants at wells 4, 5, 6, 8, 12, and 14
Rayford Road MUD Both water plants
Southern Montgomery County MUD Both water plants
City of Oak Ridge North Robinson plant
City of Shenandoah Memorial Dr and Country Lane plants
Montgomery County MUD #19 All three plants
Chateau Woods MUD Both plants
Woodlands Oaks Subdivision Forest West plant
The conversion rate for each system will be 60% in 2015 and 90% in 2025.
The 2035 and 2045 conversions (Phases III and IV) expand the system to pick up PWSs on the east and west sides of Lake Conroe, west of the City of Conroe, south of the City of Conroe, southwest of The Woodlands, and west of Rayford Road MUD. The PWSs to be served are shown in Exhibit 6. All PWSs are anticipated to convert 90%.
6.3 Preferred Treatment Plant Location
The Single Plant option is the preferred surface water delivery alternative. The preferred option has the convenience of having to build and maintain one treatment plant and one intake point. The preferred treatment plant site is located at the “East Site” at the existing SJRA property on the south side of the Lake Conroe Dam which had enough land to situate a treatment plant with sufficient capacity. Detailed discussion on the preferred treatment plant site can be found in Section 4.2.1.2.2. The location of the preferred treatment plant site is shown in Exhibits 13, 14 and 15.
Probable capital cost for the single plant alternative is lower than the dual plant alternative for all of the phases; Phase I (2015), Phase II (2025), Phase III (2035) and Phase IV (2045). The single plant option has lower O &M and annual costs in all phases as well.
Environmental considerations did not suggest significant preference for any one of the alternatives. From the environmental perspective, many of the impacts associated with the Single Plant alternative as opposed to the Dual Plant alternative would be the same with some differences.

Planning Level Study for Alternative Surface Water Pipeline Routing in Montgomery CountyLone Star Groundwater Conservation District and San Jacinto River Authority page 116
6.4 Preferred Pipeline Alignment
The preferred pipeline alignment is the one with the single treatment plant option. This alignment is chosen for the same reasons discussed in Section 6.3. Detailed discussion on the preferred treatment plant site can be found in Section 3.2.2. The single plant pipeline alignment layout, timeline, segments and sizes are presented in Exhibits 6, 7, 8 and 11.
6.5 Final Capital Costs
The final capital cost for the preferred single plant alternative is presented in Table 91. Detailed information on the construction costs, capital costs, O &M and annual costs for the single plant option can be found in Sections 4.2.3 and 4.2.4.
Table 91 Single Plant Option – Probable Capital Costs
Phase (Year) Capital Improvements
I (2015) (Million $)
II (2025) (Million $)
III (2035) (Million $)
IV (2045) (Million $)
Construction (Capital) Costs $290 $62 $127 $118Engineering, Financial, & Legal 2 $87 $19 $38 $36Land & Easements $8 $0 $6 $5TOTAL $385 $81 $171 $1591 Values as of January 2008. 2 Engineering, Financial, & Legal Services (30% of probable construction costs which include the following: Engineering 10%, Program Management 3%, Environmental Studies and Mitigation 5%, Surveying 1%, Construction Management 6%, Financial 3% and Legal 2%.).
6.6 Rate Analysis
For each of the single and dual plant alternatives, multiple potential financing mechanisms were evaluated for the best overall resulting rate structure. The preferred single plant alternative produces the most advantageous rate structure when financed through a combination of Water Infrastructure Fund (WIF) loans and State Participation loans available through the Texas Water Development Board. The rates for the combination WIF/State Participation funding alternative are summarized in Table 92 below.

May 2008 Planning Level Study for Alternative Surface Water Pipeline Routing in Montgomery County Lone Star Groundwater Conservation District and San Jacinto River Authority
page 117
Table 92 Single Plant System Rates for Initial WIF Financing And State Participation
Groundwater Surface Water Year Demand
(mgd) Anticipated Rate
($/1,000 gal) Demand
(mgd) Anticipated Rate
($/1,000 gal) 2009 59.6 0.51 2015 49.3 1.65 21.0 2.05 2020 59.7 1.93 21.0 2.33 2025 48.6 2.64 41.0 3.04 2030 58.5 3.95 41.0 4.35 2035 48.0 4.50 61.0 4.90 2040 58.6 5.23 61.0 5.63 2045 46.7 6.77 86.0 7.17 2050 60.8 7.95 86.0 8.35 2055 76.1 9.15 86.0 9.55
Rates are in future dollars at a 5% annual inflation Rate
While funding for both the WIF and State participation loans may be limited in availability during any year, pursuit of these funds would provide the lowest overall rates as well as a significant initial rate reduction over conventional funding through municipal bond sales. The combination of below market interest rates for the WIF and the deferred up front costs available under both the WIF and State Participation fund make this combination the preferred funding and rate alternative. An additional benefit of utilizing these deferral options would be found if county wide pumping fees could not be utilized in the initial states. The reduction in up front revenue stream requirements would make this funding option preferable should only a subset of the groundwater users be charged a groundwater pumping fee or some other revenue limitation occur.
6.7 Conversion Incentives and Disincentives
Providing incentives to convert to surface water or disincentives for remaining tied exclusively to groundwater may provide a major component needed to promote participation in the regional surface water system. Monetary incentives or disincentives provide perhaps the most easily recognized motivator of change. However, other motivators such as public or environmental benefits are also useful.
Since the conversion to surface water is largely built upon regulatory requirements of the District, utilizing mechanisms available to the District to achieve the stated goals of the DRP Phase II (A) should be essential to providing monetary or other drivers. Since the District’s goal is to reduce groundwater demand by 30% by 2015, providing a monetary disincentive to any provider who fails to participate in the District’s Water Resource Assessment Plan requirements, should be a major step in promoting compliance with the DRP. Additional monetary drivers can be established through pumping fees for groundwater. Establishing groundwater pumping fees, at a rate that makes the overall cost of locally producing treated groundwater come very close to or even exceed the cost of producing and delivering treated surface water to the individual water systems, provides a disincentive to staying on groundwater. However, a balance must be struck so not to produce an excessive demand for surface water that cannot be met.
Additional motivators, in the form of subsidies, provide an extension of the pumping fee disincentive. This is the case used in the rate analysis in Section 4.2.5 and 4.3.5. This moves beyond just establishing fees which create increased costs for groundwater production, but moves that money to a fund which would subsidize the surface water capital expenses as well as production and treatment costs. This would provide an incentive in the form of cost reduction for purchasing surface water.
An economic incentive for joining the development of a regional surface water supply is the economy of scale provided to the participants in such a project. By comparison, individual projects to supply surface water from some source may require very high capital expenses in comparison to amount of water to be

Planning Level Study for Alternative Surface Water Pipeline Routing in Montgomery CountyLone Star Groundwater Conservation District and San Jacinto River Authority page 118
delivered. Regional water systems have the advantage of keeping those capital costs low by sharing the costs among a larger group of participants.
Providing incentives in the form of appealing to stakeholders’ sense of stewardship could be used as an additional driver. This usually takes the form of educational activities. Presenting the effects of extended long term over-drafting of the groundwater resource and its human and environmental impacts have proved to be useful tools for inspiring conservation and reduced water usage.
Studies by the SJRA Woodlands Division have estimated the loss in production over time attributed to falling groundwater levels. These studies indicate that wells producing water from the Evangeline aquifer are losing capacity at a rate of 2.2% per year and from the Jasper aquifer at a rate of 0.5% per year. The studies further indicate that at the projected growth of the Woodlands, the wells in one of the pressure planes would not have sufficient capacity to supply the maximum daily water demand by 2015. The cost of additional wells developed to the depth and pumping capacity needed to supply the anticipated water needs may run as high as $3 Million Million for this system. Smaller water systems with less capacity needs may not require as large a capacity, but the declining water levels would still require that wells be drilled (or re-drilled) to ever increasing depths if groundwater water use is not curtailed.
Future economic growth of the county could be in jeopardy if surface water conversion does not take place. Businesses looking to relocate frequently use water supply as a key factor in determining prospective locations. Failure to provide alternate water supplies other than an ever decreasing groundwater source could be a major disincentive for attracting future businesses to the area.
May 2008 Planning Level Study for Alternative Surface Water Pipeline Routing in Montgomery County Lone Star Groundwater Conservation District and San Jacinto River Authority
page 119
Section 7 References McMahan, C., Frye, R., Brown, K. 1984. The Vegetation Types of Texas. Texas Parks and Wildlife Department, Wildlife Division. Austin Texas.
Ramos, M., Plocheck, R. 1997. Texas Almanac. The Dallas Morning News, Inc., Dallas Texas.
Texas Commission on Environmental Quality (TCEQ). 2004. TCEQ Surface Water Quality Viewer. Available at http://gis3.tceq.state.tx.us/website/Segments/ (viewed November 2007).
Texas Commission on Environmental Quality (TCEQ). 2006. DRAFT 2006 Texas 303(d) List (June 17, 2007). Available at http://www.tceq.state.tx.us/assets/public/compliance/monops/water/06twqi/2006_303d.pdf
Texas Parks and Wildlife Department (TPWD). 2007. Montgomery County Annotated County List of Rare Species. Last revised August 8, 2007.
Texas State Data Center and Office of the State Demographer. 2007. Population Estimates and Projections. Available at http://texascenter.tamiu.edu/frame.asp?surl=http://txsdc.utsa.edu/ (viewed October 2007).


May 2008 Planning Level Study for Alternative Surface Water Pipeline Routing in Montgomery County Lone Star Groundwater Conservation District and San Jacinto River Authority
Appendix A Exhibits


May 2008 Planning Level Study for Alternative Surface Water Pipeline Routing in Montgomery County Lone Star Groundwater Conservation District and San Jacinto River Authority
Appendix B Raw Water Quality Data for Lake Conroe


May 2008 Planning Level Study for Alternative Surface Water Pipeline Routing in Montgomery County Lone Star Groundwater Conservation District and San Jacinto River Authority
Appendix C Alignment Narrative


May 2008 Planning Level Study for Alternative Surface Water Pipeline Routing in Montgomery County Lone Star Groundwater Conservation District and San Jacinto River Authority
Appendix D Computer Modeling Results for Pipe Sizing


May 2008 Planning Level Study for Alternative Surface Water Pipeline Routing in Montgomery County Lone Star Groundwater Conservation District and San Jacinto River Authority
Appendix E Utility Coordination


May 2008 Planning Level Study for Alternative Surface Water Pipeline Routing in Montgomery County Lone Star Groundwater Conservation District and San Jacinto River Authority
Appendix F Developed Unit Costs


May 2008 Planning Level Study for Alternative Surface Water Pipeline Routing in Montgomery County Lone Star Groundwater Conservation District and San Jacinto River Authority
Appendix G Capital Costs


May 2008 Planning Level Study for Alternative Surface Water Pipeline Routing in Montgomery County Lone Star Groundwater Conservation District and San Jacinto River Authority
Appendix H Rate Analysis


May 2008 Planning Level Study for Alternative Surface Water Pipeline Routing in Montgomery County Lone Star Groundwater Conservation District and San Jacinto River Authority
Appendix I Present Worth Analysis


May 2008 Planning Level Study for Alternative Surface Water Pipeline Routing in Montgomery County Lone Star Groundwater Conservation District and San Jacinto River Authority
Appendix J Environmental Constraints Map

May 2008 Planning Level Study for Alternative Surface Water Pipeline Routing in Montgomery County Lone Star Groundwater Conservation District and San Jacinto River Authority
Appendix K Environmental Constraints Reference Documents

May 2008 Planning Level Study for Alternative Surface Water Pipeline Routing in Montgomery County Lone Star Groundwater Conservation District and San Jacinto River Authority
Appendix L Stakeholder Meeting Minutes


May 2008 Planning Level Study for Alternative Surface Water Pipeline Routing in Montgomery County Lone Star Groundwater Conservation District and San Jacinto River Authority
Appendix M Public Comments


About AECOM AECOM is a global company providing design and management services in the transportation, facilities and environmen-tal markets through a family of operating companies. Through the combined efforts of over 35,000 people, AECOM offers a unique blend of global reach, local knowledge, innovation and technical excellence, creating a better world in which to work and live. TCB 400 West 15th Street, Suite 500 Austin, Texas 78701 T 512.472.4519 F 512.472.7519 www.tcb.aecom.com