Embed Size (px)
Citation preview
Alternative Propulsion Methods for Surface Combatants and Amphibious Warfare Ships James S. Webster, Visitor, Naval Sea Systems Command Howard Fireman, Member, Naval Sea Systems Command Dillon A. Allen, Visitor, Naval Sea Systems Command Adrian J. Mackenna, Visitor, Naval Sea Systems Command John C. Hootman, Associate Member, Naval Sea Systems Command
ABSTRACT
The US Navy has been studying the technical and cost impacts associated with the availability and cost of fossil fuel contrasted with nuclear energy alternatives for surface combatants and amphibious warfare ships. Over the past two years these efforts have grown in maturity to examine the tactical and strategic implications of our Navy’s dependence on fossil fuels from technical, economic, and military perspectives.
This paper describes the NAVSEA evaluation of alternative propulsion methods in Small, Medium, and Large Surface Combatants performed during FY2005 in response to Chief of Naval Operations Guidance, and the efforts conducted during FY2006 directed by Public Law that added Amphibious Warfare Ships.
Ship concepts were developed and analyzed in terms of acquisition cost, life-cycle cost, and operational effectiveness. Power and propulsion technologies including nuclear power, gas turbines, diesel engines, mechanical power transmission systems, hybrid power transmission systems, integrated power transmission systems, combined power plants (e.g., diesel and gas turbine), and various propulsor systems. Operational effectiveness in warfare, mobility and vulnerability areas are evaluated for alternative power and propulsion systems and associated architectures in non-program-of-record small (~7,500 to ~12,000 metric ton) and medium (~21,000 to ~26,000-metric ton) surface combatants and in amphibious warfare (~34,000 to ~38,000-metric tons) ship concept designs.
The techniques and models used in the studies are discussed, examples provided, and results presented. These results include a discussion of viable near term alternative power and propulsion system technologies and architectures, break-even cost of oil (where life cycle costs of nuclear and fossil powered ship concepts are equivalent), and correlation of alternative architectures with operational benefits.
KEY WORDS Ship Design, Ship Concepts, Ship Propulsion, Naval Surface Ships, Trade-off Study, Mechanical Power Transmission Systems, Hybrid Power Transmission Systems, Integrated Power Transmission Systems, Combined Power Plants, Nuclear Power, Gas Turbines, Diesel Engines, Surface Combatants, Amphibious Warfare Ships
NOMENCLATURE AoA Analysis of Alternatives ASSET Advanced Surface Ship Evaluation Tool ASW Antisubmarine Warfare AWS Amphibious Warfare Ship $B Dollars in Billions BBL Barrel of Oil (42 United States gallons) BSP Baseline Security Posture CG-47 Ticonderoga Class Guided Missile Cruisers CER Cost Estimating Relationship CH-46 Sea Knight Helicopter CH-53 Sea Stallion Helicopter CNO Chief of Naval Operations CODAG Combined Diesel and Gas Turbine CODLAG Combined Diesel Electric and Gas Turbine CODOG Combined Diesel or Gas Turbine COGAG Combined Gas Turbine and Gas Turbine CVN-21 21st Century Aircraft Carrier, now designated
CVN-78, formerly CVN(X) DC Direct Current DD-963 Spruance Class Destroyers
DDG-51 Arleigh Burke Class Guided Missile Destroyers DDG -1000 Zumwalt Class Guided Missile Destroyers
(Formerly called DD-21 and DD(X)) DESC Defense Energy Support Center DFM Diesel Fuel Marine DG Diesel Generator DRM Design Reference Mission DSL Diesel DoD Department of Defense DOE Design of Experiments DPS Defense Planning Scenarios F76 Diesel Fuel Marine FFG Oliver Hazard Perry Class Guided Missile
Frigates FP Full Power FPU Forward Propulsion Unit FY Fiscal Year GFE Government Furnished Equipment GT Gas Turbine GTG Gas Turbine Generator
HR House Resolution Hz Hertz IFTP Integrated Fight Through Power IPS Integrated Power System AWS Amphibious Warfare Ship Kts Knots, nautical miles per hour kV kilo-Volts LCC Life-cycle costs LCS Littoral Combat Ship LHA-1 Tarawa Class Amphibious Assault Ships LHA-6 LHA(R) Lead Ship LHA-7 Formerly LHA(R) Flight 1 LHD-1 Wasp Class Amphibious Assault Ships LHD-8 USS Makin Island $M Dollars in Millions MAPS Manpower Analysis and Prediction Systems MCO Major Combat Operation MIW Mine Warfare Ships MOE Measure of Performance MOP Measure of Effectiveness MSC Medium Surface Combatant MT Metric Ton MW Mega Watts NA Not Applicable NAVSEA Naval Sea Systems Command NPV Net Present Value NRE Nonrecurring Design and Engineering
NSWCCD Naval Surface Warfare Center Carderock Division
NSWCDD Naval Surface Warfare Center Dahlgren Division
O&S Operating and Support ONI Office of Naval Intelligence ONR Office of Naval Research OPNAV N81 Office of the CNO, Capability Analysis and
Assessment Division OPSITS Operational Situations OPTEMPO Operating Tempo OSD Office of the Secretary of Defense PDR Preliminary Design Review POM-08 FY 08 Program Objectives Memorandum POE Projected Operational Environment RDT&E Research, Development, Test, and Engineering ROC Required Operational Capability SC Surface Combatant SHU Steaming Hours Underway SSC Small Surface Combatant SSN-21 Seawolf Class Attack Submarines TACSITs Tactical Situations TBMD Theater Ballistic Missile Defense USN United States Navy V-22 Osprey Tilt-rotor Aircraft VAMOSC Visibility and Management of Operating and
Support Costs
INTRODUCTION One role of engineering in the US Navy is to provide quantifiable evidence supporting informed decisions between alternative solutions to complex problems. Naval surface combatant system complexity is a primary source of performance prediction uncertainty in early stage design. Innovative technologies with expected performance benefits are often represented as point solutions with little or no cost or performance validation data. System complexity aggregates the subsystem risk associated with integrating multiple unproven technologies, operating legacy technologies in different natural or warfare environments or a combination of both further reducing the attractiveness of new technology. Accordingly, Department of Defense (DoD) and the United States Navy (USN) have generally been restricted to procuring systems that are small technological excursions from existing technological baselines. Evidence supporting decisions at tactical, strategic and national policy levels is valued if provided in a timely manner with quantifiable levels of confidence. Congressional testimony provided by senior DoD representatives during the past two years has highlighted the importance of developing a national strategy that is responsive to the increasing price and reduced availability of fossil fuel. The FY2006 Report to Congress (RTC) (Public Law, 2006) was written in response to Section 130 of the FY2006 National Defense Authorization Act (Public Law, 2006) that directed the Navy to evaluate alternative propulsion methods for surface combatants and amphibious warfare ships. Alternate propulsion studies performed during the FY2005-2006 time frame exercised recently developed modeling techniques that quantify cost,
schedule, and operational effectiveness with acceptable confidence. Energy requirements were developed for each ship type based on Design Reference Missions (DRMs). The DRMs are comprised of Tactical and Operational Situations that suggest an employment of energy management systems (energy storage, conversion, distribution, and thrust generation systems) in ship energy states linked to mobility, survivability, and warfare mission system energy demands. The mission driven peak and lifetime energy demands were used in power and propulsion system architecting and systems engineering for each ship type and its associated energy management system component suite. The RTC study addressed power and propulsion technologies and architectures such as nuclear power, gas turbines, diesel engines, mechanical power transmission systems, hybrid power transmission systems, integrated power transmission systems, combined power plants (e.g., diesel and gas turbine), and various propulsor systems. It identified aspects of these technologies and architectures that are anticipated to mature in time to transition to ship acquisition programs within the next ten to twenty years. The study evaluated twenty-three different ship concepts. These concepts were variants of three ship baselines: Small Surface Combatant (SSC), Medium Surface Combatant (MSC), and Amphibious Warfare Ship (AWS). Mission systems for the ship concepts are similar to current or projected system architectures. The ships represent energy demand surrogates for the ships projected to comprise the US Navy
2020 fleet. The unique methodology developed in this study relates future warfighting needs to energy demand. Section 130 of the FY 2006 National Defense Act identifies several important and detailed matters to be addressed, including: the key assumptions used in carrying out the analysis; the methodology and techniques used in conducting the analysis; a description of current and future technology relating to surface ship propulsion; a description of each propulsion alternative and an analysis and evaluation of each such alternative from an operational and cost-effectiveness standpoint; a comparison of the life-cycle costs of each propulsion alternative; an analysis of when the nuclear propulsion alternative becomes cost effective as the price of a barrel of crude oil increases (“break even” analysis); conclusions and recommendations of the study; and the Secretary of the Navy’s intended actions, if any, for implementation of the conclusions and recommendations of the study.
STUDY METHODOLOGY AND TECHNIQUES: The US Navy study and evaluation of alternative propulsion systems for US Navy Ships has resulted in improvements in analytical techniques and modeling tools that increased resolution and reduced uncertainty in each succeeding study. The modeling development efforts culminated in the use of over 20 design/analysis tools being exercised during FY2006 in the systems architecting, systems engineering, ship synthesis, performance evaluation, cost estimation, and operational effectiveness assessments. Table 1, below, summarizes the modeling functions and modeling efforts exercised during the past two years. In the context of this table, historic implies the direct use of known designs, systems, or data; parametric implies the use of design models based upon data regression or other modeling techniques; and engineering implies the use of design based upon engineering principles and highly detailed modeling techniques.
Study Attribute
FY2005 Economic Analysis
FY2005 CNO Guidance
Study
FY06 Congressional
StudyConcepts: Historic Engineering Engineering Acquisition Costs: Historic / Parametric Eng./Parametric Eng./Parametric O&S Costs: Historic Parametric Parametric Fuel Costs: Historic Cost Engineering EngineeringDefuel / Deac: Historic Historic EngineeringEffectiveness Analysis: N/A N/A Capabilities Based Table 1: Evolution of Alternate Propulsion Studies
The FY05 Economic Analysis used historic data for amphibious warfare ships reflecting oil fired steam turbine mechanical drive propulsion plants. The FY2006 Report to Congress used a more modern combined gas turbine and diesel propulsion plant. These distinct propulsion types have significantly different efficiencies and therefore significantly different fossil fuel consumption profiles. For example, the LHD-8 diesel-electric drive with gas turbine boost propulsion plant consumes less than one-half the fuel of an LHD-1 oil fired boiler propulsion plant when operating with the same speed time profile.
The FY2006 study used a markedly higher ship service electric load for the MSC to meet mission requirements. This drove increased fossil fuel consumption rates for this ship. Consequently, the markedly increased fossil fuel usage spread the nuclear acquisition premium over a larger quantity of fossil fuel decreasing the per-barrel break-even cost. The differences in operational tempos between the ship concepts drove differences in fossil fuel consumption rates and therefore break-even costs. Studies performed during FY2006 reflect the current state of the art in modeling capability. The study process consisted of project elements executed in sequence to provide a response to public law directed products:
• Cost versus operational effectiveness • Break even costs of nuclear and fossil fuel plants • Survey of current and future technology
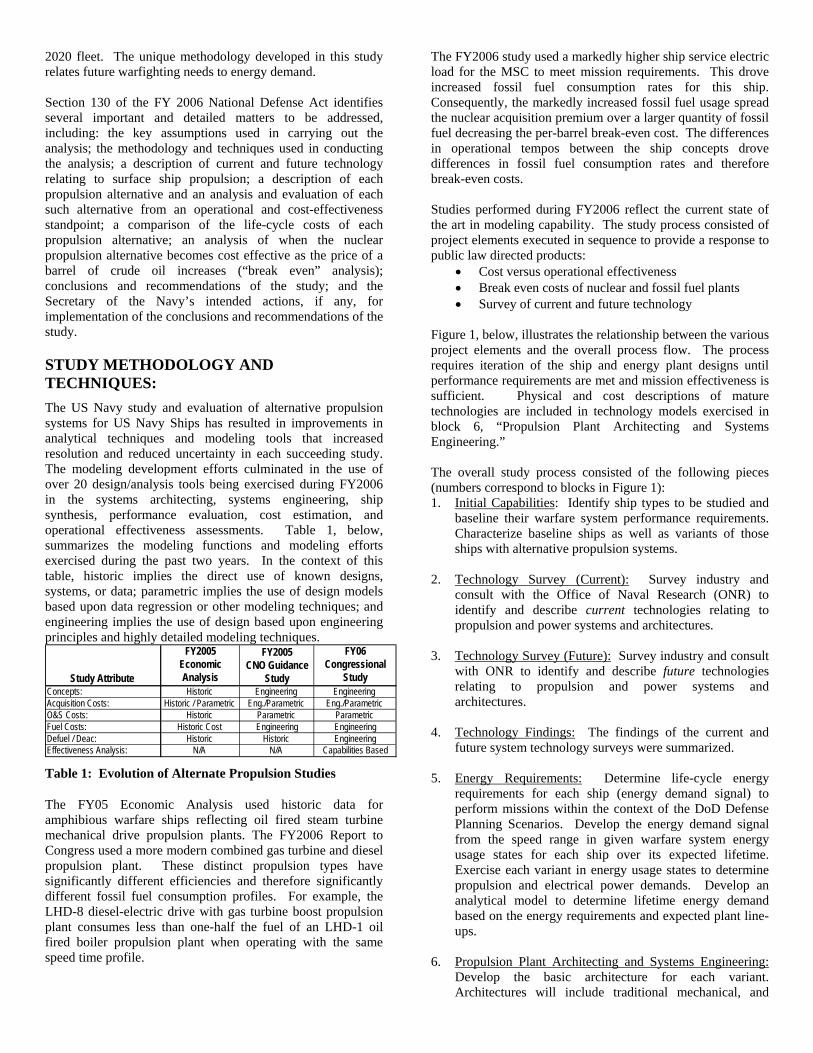
Figure 1, below, illustrates the relationship between the various project elements and the overall process flow. The process requires iteration of the ship and energy plant designs until performance requirements are met and mission effectiveness is sufficient. Physical and cost descriptions of mature technologies are included in technology models exercised in block 6, “Propulsion Plant Architecting and Systems Engineering.” The overall study process consisted of the following pieces (numbers correspond to blocks in Figure 1): 1. Initial Capabilities: Identify ship types to be studied and
baseline their warfare system performance requirements. Characterize baseline ships as well as variants of those ships with alternative propulsion systems.
2. Technology Survey (Current): Survey industry and
consult with the Office of Naval Research (ONR) to identify and describe current technologies relating to propulsion and power systems and architectures.
3. Technology Survey (Future): Survey industry and consult
with ONR to identify and describe future technologies relating to propulsion and power systems and architectures.
4. Technology Findings: The findings of the current and future system technology surveys were summarized.
5. Energy Requirements: Determine life-cycle energy requirements for each ship (energy demand signal) to perform missions within the context of the DoD Defense Planning Scenarios. Develop the energy demand signal from the speed range in given warfare system energy usage states for each ship over its expected lifetime. Exercise each variant in energy usage states to determine propulsion and electrical power demands. Develop an analytical model to determine lifetime energy demand based on the energy requirements and expected plant line-ups.
6. Propulsion Plant Architecting and Systems Engineering: Develop the basic architecture for each variant. Architectures will include traditional mechanical, and
electric propulsion architectures as well as “hybrid” architectures that blend integrated propulsion (electric and steam) with mechanical and electric transmissions to satisfy mobility, vulnerability and warfare system service demands. Characterize nuclear and fossil fuel power plants that meet peak, endurance, and, in the case of nuclear powered ships, the lifetime energy needs. Select the type, number, and general location of prime movers and
Figure 1: Alternate Propulsion Study Process Overview
propulsion equipment in the ship. Determine the sizes, weights, and costs associated with various propulsion plant options appropriately scaled for the surface combatants and amphibious warfare ships under study.
7. Ship Synthesis Model: Develop a total ship concept for
each variant that incorporates the alternate propulsion plants and defined mission systems that is suitable for cost estimating and operational effectiveness analysis. The ship synthesis model used for this effort is the Advanced Surface Ship Evaluation Tool (ASSET) V5.3. It is a design tool which balances area, volume, weight, and basic performance characteristics of a notional ship based on parametric analysis. The result of this effort is not a full-up ship design; rather it is an engineering estimation indicative of the potentially feasible design solutions.
8. Ship Performance Assessment: Evaluate the performance
of each ship baseline/variant in all energy management system areas: energy storage, energy conversion, energy distribution, energy transmission, and thrust generation. Relate the energy management system and architecture to ship speed, range, and service to warfare mission system performance areas.
9. Cost Models: Estimate fifth ship acquisition cost and Life
Cycle Cost (LCC) for each ship baseline and associated variants. Acquisition costs include actual cost return data or vendor quotes for power and propulsion system material, when possible, due to the maturity of power and propulsion system equipment. The LCC estimates incorporate the following costs: inactivation, defueling (nuclear variants only), disposal, burdened fuel costs,
manpower costs, and maintenance. Non-recurring costs are not specified as they are dependent on capability growth (both military and industrial) which is outside the scope of this study.
10. Breakeven Cost Model: Perform breakeven cost analyses
to compare the nuclear and fossil-fueled ship concepts. Perform a correlation analysis between the breakeven cost of oil with operational tempo, operational profile, and service life.
11. Effectiveness Models: Develop analytical models to
evaluate the vulnerability, operational, and mobility effectiveness of the ship variants in mission scenarios.
12. Operational Effectiveness Analysis: Evaluate each ship
concept in terms of mobility, survivability, and operational effectiveness in the context of operational scenarios and include attributes such as timeliness, percent mission complete, and endurance.
13. Cost and Operational Effectiveness Analysis: Quantify
the relationships between mission effectiveness and cost using a design of experiments (DOE) approach. Develop a DOE for performance versus cost and for performance versus operational effectiveness for each ship type.
ENERGY REQUIREMENTS Ships evaluated in the RTC are non-program-of-record ship concept designs serving as energy management system surrogates bound by the capabilities of ships programmed in the Navy's 2006 30-Year Shipbuilding Plan. Warfare mission capabilities, and therefore power loads, were kept constant across all variants in each class but are reflective of the warfare capabilities of the ships envisioned in the 30-Year Shipbuilding Plan. Thus, the ships of this study are considered ‘energy management system surrogates’ of the ships in the 30-Year Shipbuilding Plan.
Official Defense Planning Scenarios (DPS) are used to define the quantities and capabilities of the 313 ship future fleet. The DPS is a set of scenarios commonly used throughout the DoD for analysis and planning purposes. They form a consistent analytical baseline for the evaluation of potential warfare scenarios in an uncertain future context. These scenarios were also used to develop the warfare and mobility system energy requirements and operating tempos for the ships modeled.
The energy demand signal was derived from the speed range in given warfare system energy usage states for each ship over its expected lifetime. Each variant was exercised in energy usage states to determine propulsion and electrical power demands. An analytical model determined the lifetime energy demand based on the energy requirements and expected plant line-ups.
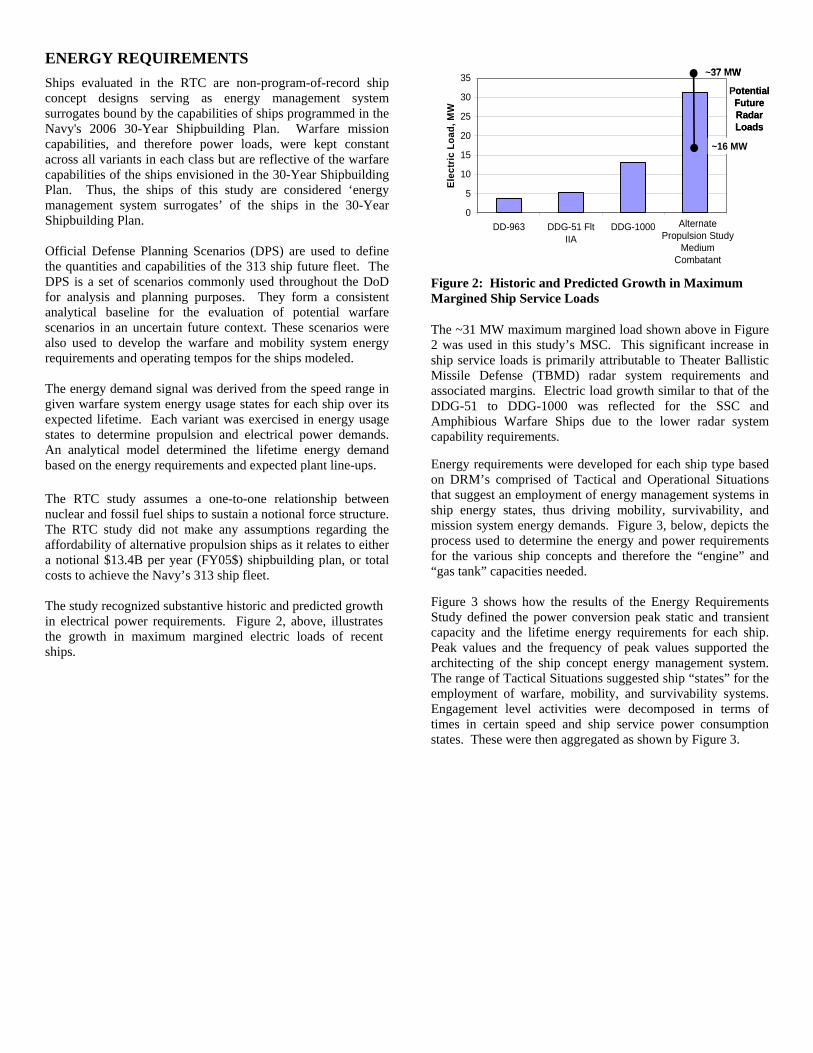
The RTC study assumes a one-to-one relationship between nuclear and fossil fuel ships to sustain a notional force structure. The RTC study did not make any assumptions regarding the affordability of alternative propulsion ships as it relates to either a notional $13.4B per year (FY05$) shipbuilding plan, or total costs to achieve the Navy’s 313 ship fleet. The study recognized substantive historic and predicted growth in electrical power requirements. Figure 2, above, illustrates the growth in maximum margined electric loads of recent ships.
0
5
10
15
20
25
30
35
DD-963 DDG-51 FltIIA
DDG-1000 AP StudyMedium
Combatant
Elec
tric
Loa
d, M
W
Alternate Propulsion Study
Medium Combatant
~37 MW
~16 MW
Potential Future Radar Loads
0
5
10
15
20
25
30
35
DD-963 DDG-51 FltIIA
DDG-1000 AP StudyMedium
Combatant
Elec
tric
Loa
d, M
W
Alternate Propulsion Study
Medium Combatant
0
5
10
15
20
25
30
35
DD-963 DDG-51 FltIIA
DDG-1000 AP StudyMedium
Combatant
Elec
tric
Loa
d, M
W
Alternate Propulsion Study
Medium Combatant
~37 MW
~16 MW
Potential Future Radar Loads
Figure 2: Historic and Predicted Growth in Maximum Margined Ship Service Loads
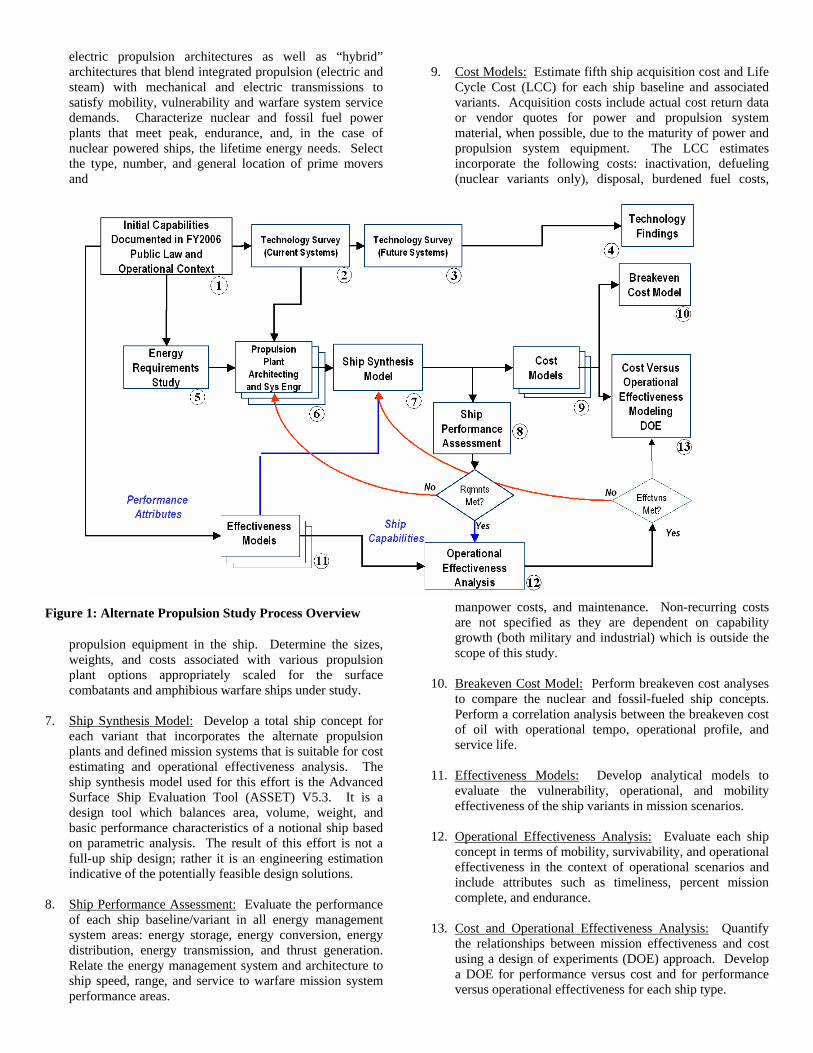
The ~31 MW maximum margined load shown above in Figure 2 was used in this study’s MSC. This significant increase in ship service loads is primarily attributable to Theater Ballistic Missile Defense (TBMD) radar system requirements and associated margins. Electric load growth similar to that of the DDG-51 to DDG-1000 was reflected for the SSC and Amphibious Warfare Ships due to the lower radar system capability requirements. Energy requirements were developed for each ship type based on DRM’s comprised of Tactical and Operational Situations that suggest an employment of energy management systems in ship energy states, thus driving mobility, survivability, and mission system energy demands. Figure 3, below, depicts the process used to determine the energy and power requirements for the various ship concepts and therefore the “engine” and “gas tank” capacities needed. Figure 3 shows how the results of the Energy Requirements Study defined the power conversion peak static and transient capacity and the lifetime energy requirements for each ship. Peak values and the frequency of peak values supported the architecting of the ship concept energy management system. The range of Tactical Situations suggested ship “states” for the employment of warfare, mobility, and survivability systems. Engagement level activities were decomposed in terms of times in certain speed and ship service power consumption states. These were then aggregated as shown by Figure 3.
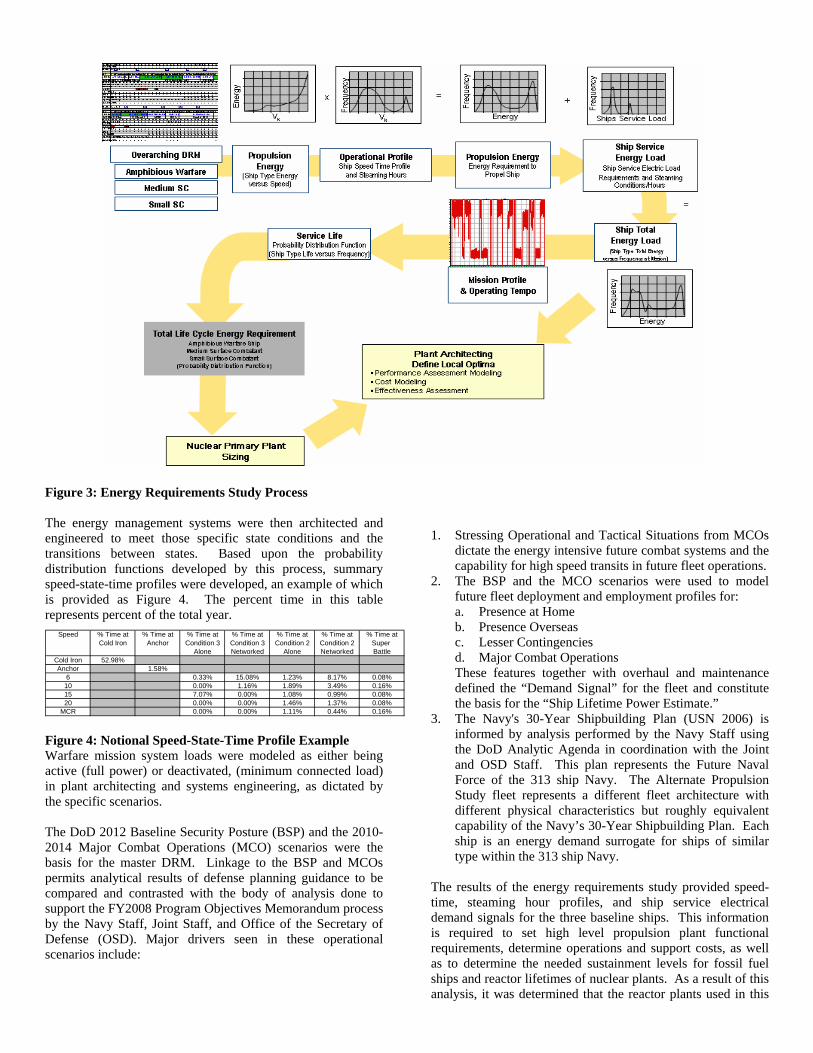
Figure 3: Energy Requirements Study Process The energy management systems were then architected and engineered to meet those specific state conditions and the transitions between states. Based upon the probability distribution functions developed by this process, summary speed-state-time profiles were developed, an example of which is provided as Figure 4. The percent time in this table represents percent of the total year.
Speed % Time at % Time at % Time at % Time at % Time at % Time at % Time atCold Iron Anchor Condition 3 Condition 3 Condition 2 Condition 2 Super
Alone Networked Alone Networked BattleCold Iron 52.98%Anchor 1.58%
6 0.33% 15.08% 1.23% 8.17% 0.08%10 0.00% 1.16% 1.89% 3.49% 0.16%15 7.07% 0.00% 1.08% 0.99% 0.08%20 0.00% 0.00% 1.46% 1.37% 0.08%
MCR 0.00% 0.00% 1.11% 0.44% 0.16%
Figure 4: Notional Speed-State-Time Profile Example Warfare mission system loads were modeled as either being active (full power) or deactivated, (minimum connected load) in plant architecting and systems engineering, as dictated by the specific scenarios. The DoD 2012 Baseline Security Posture (BSP) and the 2010-2014 Major Combat Operations (MCO) scenarios were the basis for the master DRM. Linkage to the BSP and MCOs permits analytical results of defense planning guidance to be compared and contrasted with the body of analysis done to support the FY2008 Program Objectives Memorandum process by the Navy Staff, Joint Staff, and Office of the Secretary of Defense (OSD). Major drivers seen in these operational scenarios include:
1. Stressing Operational and Tactical Situations from MCOs dictate the energy intensive future combat systems and the capability for high speed transits in future fleet operations.
2. The BSP and the MCO scenarios were used to model future fleet deployment and employment profiles for: a. Presence at Home b. Presence Overseas c. Lesser Contingencies d. Major Combat Operations
These features together with overhaul and maintenance defined the “Demand Signal” for the fleet and constitute the basis for the “Ship Lifetime Power Estimate.”
3. The Navy's 30-Year Shipbuilding Plan (USN 2006) is informed by analysis performed by the Navy Staff using the DoD Analytic Agenda in coordination with the Joint and OSD Staff. This plan represents the Future Naval Force of the 313 ship Navy. The Alternate Propulsion Study fleet represents a different fleet architecture with different physical characteristics but roughly equivalent capability of the Navy’s 30-Year Shipbuilding Plan. Each ship is an energy demand surrogate for ships of similar type within the 313 ship Navy.
The results of the energy requirements study provided speed-time, steaming hour profiles, and ship service electrical demand signals for the three baseline ships. This information is required to set high level propulsion plant functional requirements, determine operations and support costs, as well as to determine the needed sustainment levels for fossil fuel ships and reactor lifetimes of nuclear plants. As a result of this analysis, it was determined that the reactor plants used in this
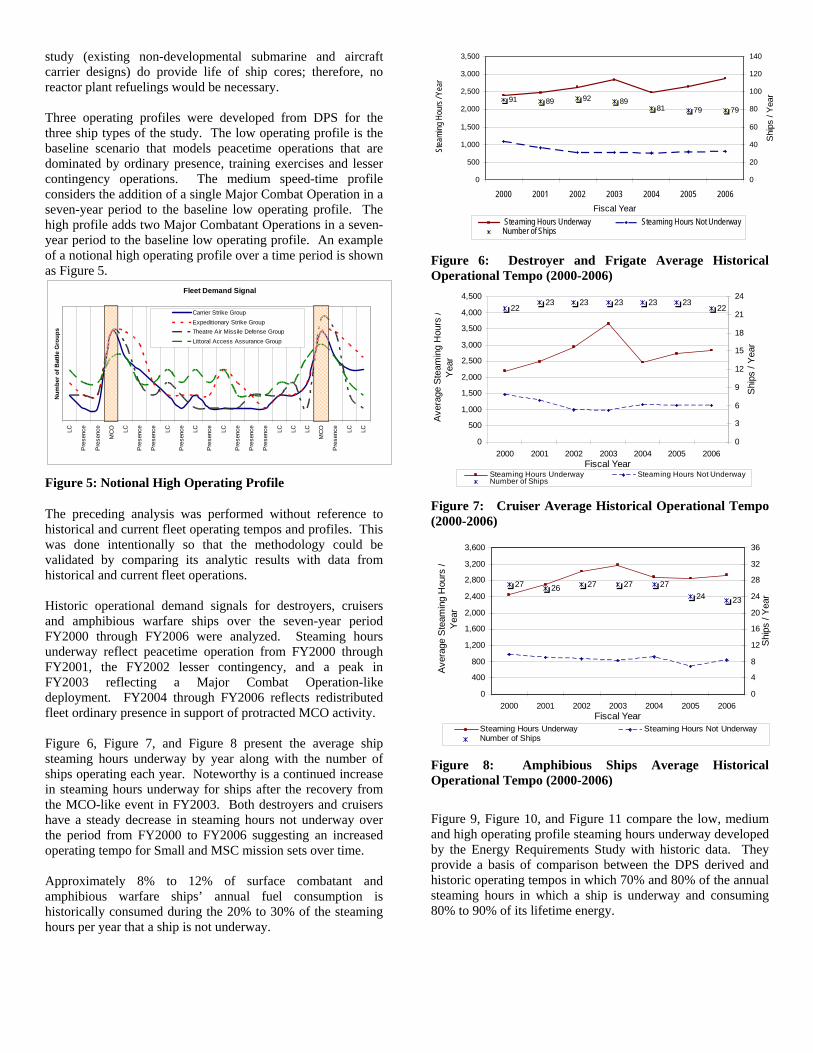
study (existing non-developmental submarine and aircraft carrier designs) do provide life of ship cores; therefore, no reactor plant refuelings would be necessary. Three operating profiles were developed from DPS for the three ship types of the study. The low operating profile is the baseline scenario that models peacetime operations that are dominated by ordinary presence, training exercises and lesser contingency operations. The medium speed-time profile considers the addition of a single Major Combat Operation in a seven-year period to the baseline low operating profile. The high profile adds two Major Combatant Operations in a seven-year period to the baseline low operating profile. An example of a notional high operating profile over a time period is shown as Figure 5.
Fleet Demand Signal
LC
Pre
senc
e
Pre
senc
e
MC
O LC
Pre
senc
e
Pre
senc
e
LC
Pre
senc
e
LC
Pre
senc
e
LC
Pre
senc
e
Pre
senc
e
Pre
senc
e
LC LC LC
MC
O
Pre
senc
e
LC LC
Num
ber o
f Bat
tle G
roup
s
Carrier Strike GroupExpeditionary Strike GroupTheatre Air Missile Defense GroupLittoral Access Assurance Group
Figure 5: Notional High Operating Profile
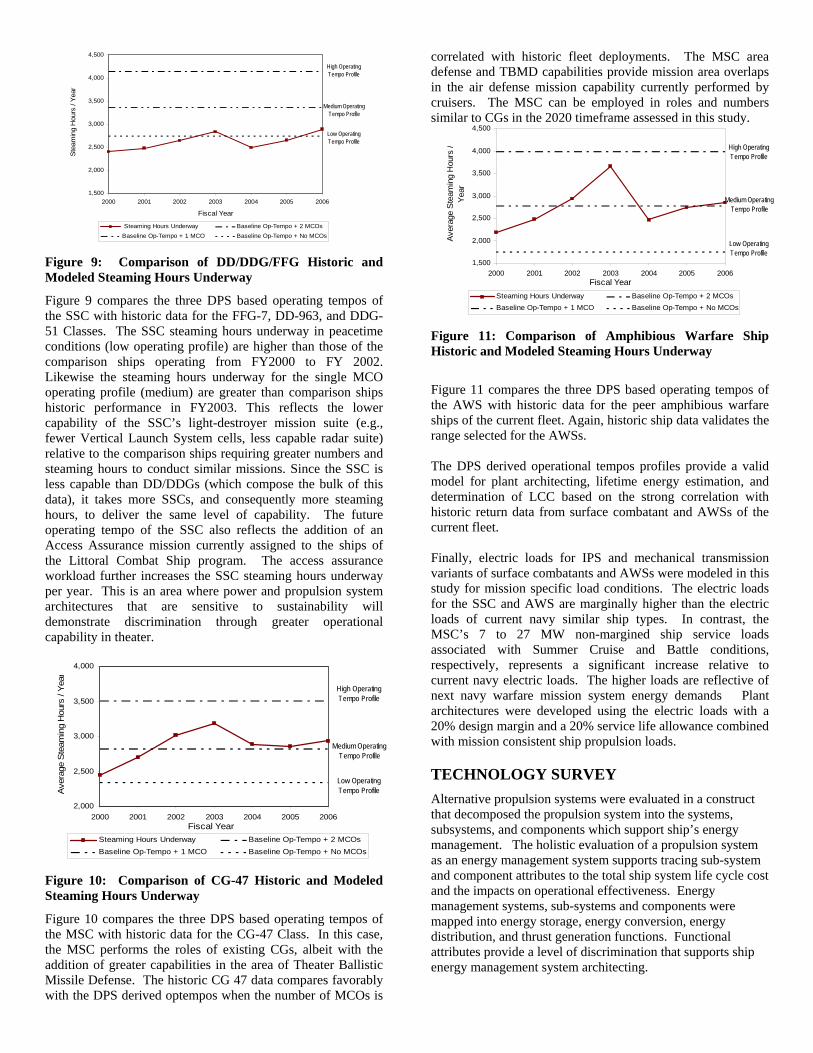
The preceding analysis was performed without reference to historical and current fleet operating tempos and profiles. This was done intentionally so that the methodology could be validated by comparing its analytic results with data from historical and current fleet operations. Historic operational demand signals for destroyers, cruisers and amphibious warfare ships over the seven-year period FY2000 through FY2006 were analyzed. Steaming hours underway reflect peacetime operation from FY2000 through FY2001, the FY2002 lesser contingency, and a peak in FY2003 reflecting a Major Combat Operation-like deployment. FY2004 through FY2006 reflects redistributed fleet ordinary presence in support of protracted MCO activity. Figure 6, Figure 7, and Figure 8 present the average ship steaming hours underway by year along with the number of ships operating each year. Noteworthy is a continued increase in steaming hours underway for ships after the recovery from the MCO-like event in FY2003. Both destroyers and cruisers have a steady decrease in steaming hours not underway over the period from FY2000 to FY2006 suggesting an increased operating tempo for Small and MSC mission sets over time. Approximately 8% to 12% of surface combatant and amphibious warfare ships’ annual fuel consumption is historically consumed during the 20% to 30% of the steaming hours per year that a ship is not underway.
91 89 92 8981 79 79
0
500
1,000
1,500
2,000
2,500
3,000
3,500
2000 2001 2002 2003 2004 2005 2006Fiscal Year
Stea
ming
Hou
rs / Y
ear
0
20
40
60
80
100
120
140
Ship
s / Y
ear
Steaming Hours Underway Steaming Hours Not Underway Number of Ships
Figure 6: Destroyer and Frigate Average Historical Operational Tempo (2000-2006)
2223 23 23 23 23
22
0
500
1,000
1,500
2,000
2,500
3,000
3,500
4,000
4,500
2000 2001 2002 2003 2004 2005 2006Fiscal Year
Aver
age
Stea
min
g H
ours
/Y
ear
0
3
6
9
12
15
18
21
24
Ship
s / Y
ear
Steaming Hours Underway Steaming Hours Not Underway Number of Ships
Figure 7: Cruiser Average Historical Operational Tempo (2000-2006)
27 26 27 27 2724 23
0
400
800
1,200
1,600
2,000
2,400
2,800
3,200
3,600
2000 2001 2002 2003 2004 2005 2006Fiscal Year
Aver
age
Ste
amin
g H
ours
/Ye
ar
0
4
8
12
16
20
24
28
32
36
Shi
ps /
Yea
r
Steaming Hours Underway Steaming Hours Not Underway Number of Ships
Figure 8: Amphibious Ships Average Historical Operational Tempo (2000-2006)
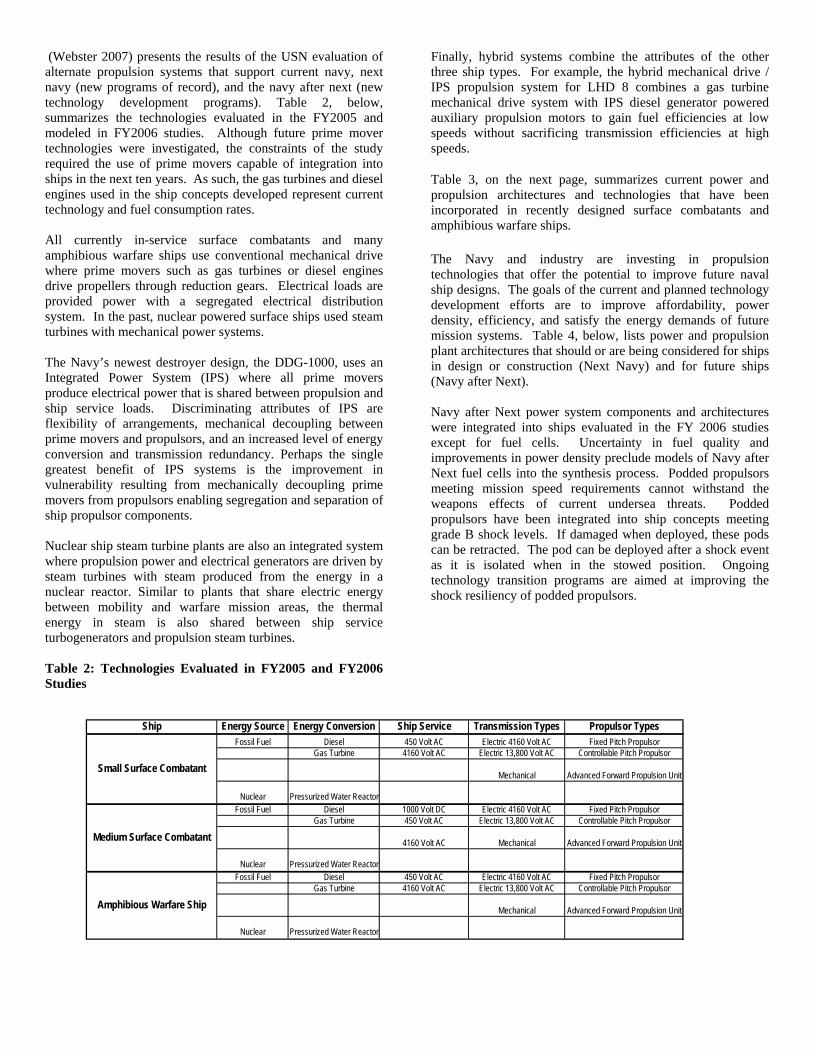
Figure 9, Figure 10, and Figure 11 compare the low, medium and high operating profile steaming hours underway developed by the Energy Requirements Study with historic data. They provide a basis of comparison between the DPS derived and historic operating tempos in which 70% and 80% of the annual steaming hours in which a ship is underway and consuming 80% to 90% of its lifetime energy.
1,500
2,000
2,500
3,000
3,500
4,000
4,500
2000 2001 2002 2003 2004 2005 2006
Fiscal Year
Stea
min
g H
ours
/ Y
ear
Steaming Hours Underway Baseline Op-Tempo + 2 MCOsBaseline Op-Tempo + 1 MCO Baseline Op-Tempo + No MCOs
High Operating Tempo Profile
Medium Operating Tempo Profile
Low Operating Tempo Profile
Figure 9: Comparison of DD/DDG/FFG Historic and Modeled Steaming Hours Underway
Figure 9 compares the three DPS based operating tempos of the SSC with historic data for the FFG-7, DD-963, and DDG-51 Classes. The SSC steaming hours underway in peacetime conditions (low operating profile) are higher than those of the comparison ships operating from FY2000 to FY 2002. Likewise the steaming hours underway for the single MCO operating profile (medium) are greater than comparison ships historic performance in FY2003. This reflects the lower capability of the SSC’s light-destroyer mission suite (e.g., fewer Vertical Launch System cells, less capable radar suite) relative to the comparison ships requiring greater numbers and steaming hours to conduct similar missions. Since the SSC is less capable than DD/DDGs (which compose the bulk of this data), it takes more SSCs, and consequently more steaming hours, to deliver the same level of capability. The future operating tempo of the SSC also reflects the addition of an Access Assurance mission currently assigned to the ships of the Littoral Combat Ship program. The access assurance workload further increases the SSC steaming hours underway per year. This is an area where power and propulsion system architectures that are sensitive to sustainability will demonstrate discrimination through greater operational capability in theater.
2,000
2,500
3,000
3,500
4,000
2000 2001 2002 2003 2004 2005 2006Fiscal Year
Ave
rage
Ste
amin
g H
ours
/ Ye
ar
Steaming Hours Underway Baseline Op-Tempo + 2 MCOsBaseline Op-Tempo + 1 MCO Baseline Op-Tempo + No MCOs
High Operating Tempo Profile
Medium Operating Tempo Profile
Low Operating Tempo Profile
Figure 10: Comparison of CG-47 Historic and Modeled Steaming Hours Underway
Figure 10 compares the three DPS based operating tempos of the MSC with historic data for the CG-47 Class. In this case, the MSC performs the roles of existing CGs, albeit with the addition of greater capabilities in the area of Theater Ballistic Missile Defense. The historic CG 47 data compares favorably with the DPS derived optempos when the number of MCOs is
correlated with historic fleet deployments. The MSC area defense and TBMD capabilities provide mission area overlaps in the air defense mission capability currently performed by cruisers. The MSC can be employed in roles and numbers similar to CGs in the 2020 timeframe assessed in this study.
1,500
2,000
2,500
3,000
3,500
4,000
4,500
2000 2001 2002 2003 2004 2005 2006Fiscal Year
Aver
age
Ste
amin
g H
ours
/Ye
ar
Steaming Hours Underway Baseline Op-Tempo + 2 MCOsBaseline Op-Tempo + 1 MCO Baseline Op-Tempo + No MCOs
Medium Operating Tempo Profile
High Operating Tempo Profile
Low Operating Tempo Profile
Figure 11: Comparison of Amphibious Warfare Ship Historic and Modeled Steaming Hours Underway
Figure 11 compares the three DPS based operating tempos of the AWS with historic data for the peer amphibious warfare ships of the current fleet. Again, historic ship data validates the range selected for the AWSs. The DPS derived operational tempos profiles provide a valid model for plant architecting, lifetime energy estimation, and determination of LCC based on the strong correlation with historic return data from surface combatant and AWSs of the current fleet. Finally, electric loads for IPS and mechanical transmission variants of surface combatants and AWSs were modeled in this study for mission specific load conditions. The electric loads for the SSC and AWS are marginally higher than the electric loads of current navy similar ship types. In contrast, the MSC’s 7 to 27 MW non-margined ship service loads associated with Summer Cruise and Battle conditions, respectively, represents a significant increase relative to current navy electric loads. The higher loads are reflective of next navy warfare mission system energy demands Plant architectures were developed using the electric loads with a 20% design margin and a 20% service life allowance combined with mission consistent ship propulsion loads.
TECHNOLOGY SURVEY Alternative propulsion systems were evaluated in a construct that decomposed the propulsion system into the systems, subsystems, and components which support ship’s energy management. The holistic evaluation of a propulsion system as an energy management system supports tracing sub-system and component attributes to the total ship system life cycle cost and the impacts on operational effectiveness. Energy management systems, sub-systems and components were mapped into energy storage, energy conversion, energy distribution, and thrust generation functions. Functional attributes provide a level of discrimination that supports ship energy management system architecting.
Ship Energy Source Energy Conversion Ship Service Transmission Types Propulsor TypesFossil Fuel Diesel 450 Volt AC Electric 4160 Volt AC Fixed Pitch Propulsor
Gas Turbine 4160 Volt AC Electric 13,800 Volt AC Controllable Pitch Propulsor
Mechanical Advanced Forward Propulsion Unit
Nuclear Pressurized Water ReactorFossil Fuel Diesel 1000 Volt DC Electric 4160 Volt AC Fixed Pitch Propulsor
Gas Turbine 450 Volt AC Electric 13,800 Volt AC Controllable Pitch Propulsor
4160 Volt AC Mechanical Advanced Forward Propulsion Unit
Nuclear Pressurized Water ReactorFossil Fuel Diesel 450 Volt AC Electric 4160 Volt AC Fixed Pitch Propulsor
Gas Turbine 4160 Volt AC Electric 13,800 Volt AC Controllable Pitch Propulsor
Mechanical Advanced Forward Propulsion Unit
Nuclear Pressurized Water Reactor
Small Surface Combatant
Medium Surface Combatant
Amphibious Warfare Ship
(Webster 2007) presents the results of the USN evaluation of alternate propulsion systems that support current navy, next navy (new programs of record), and the navy after next (new technology development programs). Table 2, below, summarizes the technologies evaluated in the FY2005 and modeled in FY2006 studies. Although future prime mover technologies were investigated, the constraints of the study required the use of prime movers capable of integration into ships in the next ten years. As such, the gas turbines and diesel engines used in the ship concepts developed represent current technology and fuel consumption rates. All currently in-service surface combatants and many amphibious warfare ships use conventional mechanical drive where prime movers such as gas turbines or diesel engines drive propellers through reduction gears. Electrical loads are provided power with a segregated electrical distribution system. In the past, nuclear powered surface ships used steam turbines with mechanical power systems. The Navy’s newest destroyer design, the DDG-1000, uses an Integrated Power System (IPS) where all prime movers produce electrical power that is shared between propulsion and ship service loads. Discriminating attributes of IPS are flexibility of arrangements, mechanical decoupling between prime movers and propulsors, and an increased level of energy conversion and transmission redundancy. Perhaps the single greatest benefit of IPS systems is the improvement in vulnerability resulting from mechanically decoupling prime movers from propulsors enabling segregation and separation of ship propulsor components. Nuclear ship steam turbine plants are also an integrated system where propulsion power and electrical generators are driven by steam turbines with steam produced from the energy in a nuclear reactor. Similar to plants that share electric energy between mobility and warfare mission areas, the thermal energy in steam is also shared between ship service turbogenerators and propulsion steam turbines. Table 2: Technologies Evaluated in FY2005 and FY2006 Studies
Finally, hybrid systems combine the attributes of the other three ship types. For example, the hybrid mechanical drive / IPS propulsion system for LHD 8 combines a gas turbine mechanical drive system with IPS diesel generator powered auxiliary propulsion motors to gain fuel efficiencies at low speeds without sacrificing transmission efficiencies at high speeds. Table 3, on the next page, summarizes current power and propulsion architectures and technologies that have been incorporated in recently designed surface combatants and amphibious warfare ships. The Navy and industry are investing in propulsion technologies that offer the potential to improve future naval ship designs. The goals of the current and planned technology development efforts are to improve affordability, power density, efficiency, and satisfy the energy demands of future mission systems. Table 4, below, lists power and propulsion plant architectures that should or are being considered for ships in design or construction (Next Navy) and for future ships (Navy after Next). Navy after Next power system components and architectures were integrated into ships evaluated in the FY 2006 studies except for fuel cells. Uncertainty in fuel quality and improvements in power density preclude models of Navy after Next fuel cells into the synthesis process. Podded propulsors meeting mission speed requirements cannot withstand the weapons effects of current undersea threats. Podded propulsors have been integrated into ship concepts meeting grade B shock levels. If damaged when deployed, these pods can be retracted. The pod can be deployed after a shock event as it is isolated when in the stowed position. Ongoing technology transition programs are aimed at improving the shock resiliency of podded propulsors.
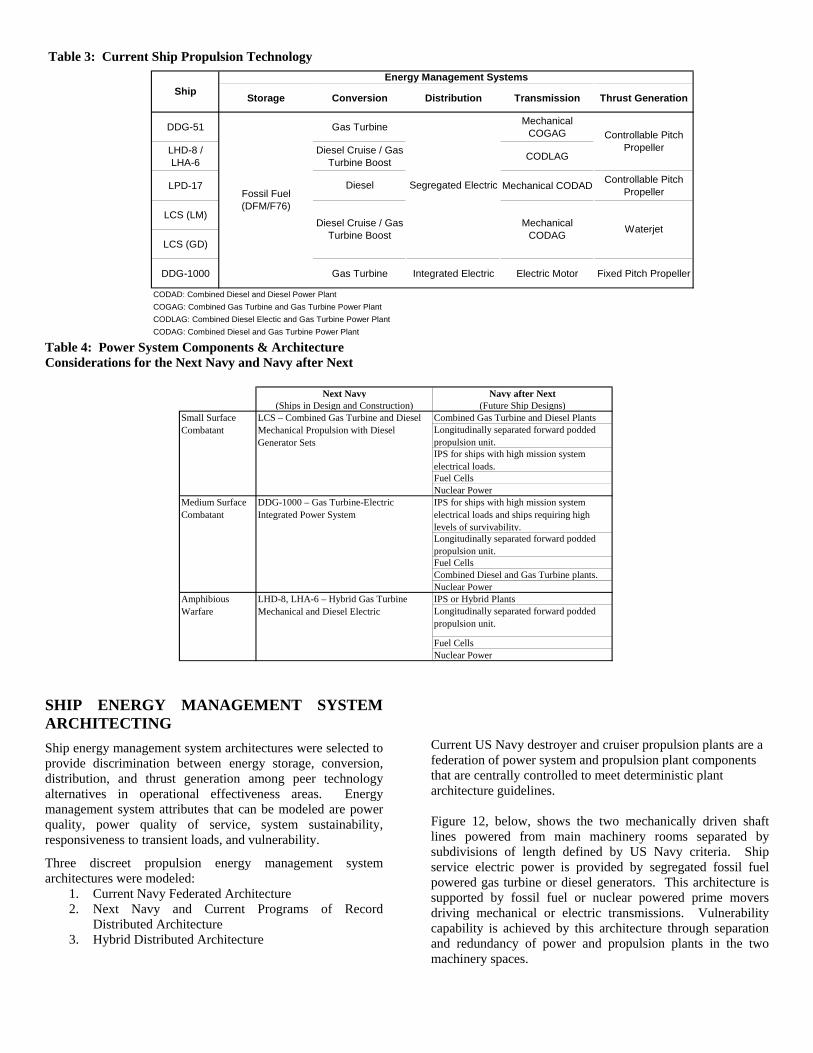
Table 3: Current Ship Propulsion Technology
Table 4: Power System Components & Architecture Considerations for the Next Navy and Navy after Next
SHIP ENERGY MANAGEMENT SYSTEM ARCHITECTING Ship energy management system architectures were selected to provide discrimination between energy storage, conversion, distribution, and thrust generation among peer technology alternatives in operational effectiveness areas. Energy management system attributes that can be modeled are power quality, power quality of service, system sustainability, responsiveness to transient loads, and vulnerability.
Three discreet propulsion energy management system architectures were modeled:
1. Current Navy Federated Architecture 2. Next Navy and Current Programs of Record
Distributed Architecture 3. Hybrid Distributed Architecture
Current US Navy destroyer and cruiser propulsion plants are a federation of power system and propulsion plant components that are centrally controlled to meet deterministic plant architecture guidelines. Figure 12, below, shows the two mechanically driven shaft lines powered from main machinery rooms separated by subdivisions of length defined by US Navy criteria. Ship service electric power is provided by segregated fossil fuel powered gas turbine or diesel generators. This architecture is supported by fossil fuel or nuclear powered prime movers driving mechanical or electric transmissions. Vulnerability capability is achieved by this architecture through separation and redundancy of power and propulsion plants in the two machinery spaces.
Storage Conversion Distribution Transmission Thrust Generation
DDG-51 Gas Turbine Mechanical COGAG
LHD-8 / LHA-6
Diesel Cruise / Gas Turbine Boost CODLAG
LPD-17 Mechanical CODAD Controllable Pitch Propeller
LCS (LM)
LCS (GD)
DDG-1000 Gas Turbine Integrated Electric Electric Motor Fixed Pitch Propeller
CODAD: Combined Diesel and Diesel Power PlantCOGAG: Combined Gas Turbine and Gas Turbine Power PlantCODLAG: Combined Diesel Electic and Gas Turbine Power PlantCODAG: Combined Diesel and Gas Turbine Power Plant
Energy Management Systems
Segregated Electric
Mechanical CODAG
Ship
Fossil Fuel (DFM/F76)
Diesel
Diesel Cruise / Gas Turbine Boost
Controllable Pitch Propeller
Waterjet
Next Navy Navy after Next(Ships in Design and Construction) (Future Ship Designs)
Combined Gas Turbine and Diesel PlantsLongitudinally separated forward podded propulsion unit.IPS for ships with high mission system electrical loads.Fuel CellsNuclear PowerIPS for ships with high mission system electrical loads and ships requiring high levels of survivability.Longitudinally separated forward podded propulsion unit.Fuel CellsCombined Diesel and Gas Turbine plants.Nuclear PowerIPS or Hybrid PlantsLongitudinally separated forward podded propulsion unit.
Fuel CellsNuclear Power
Amphibious Warfare
LHD-8, LHA-6 – Hybrid Gas Turbine Mechanical and Diesel Electric
Small Surface Combatant
LCS – Combined Gas Turbine and Diesel Mechanical Propulsion with Diesel Generator Sets
Medium Surface Combatant
DDG-1000 – Gas Turbine-Electric Integrated Power System
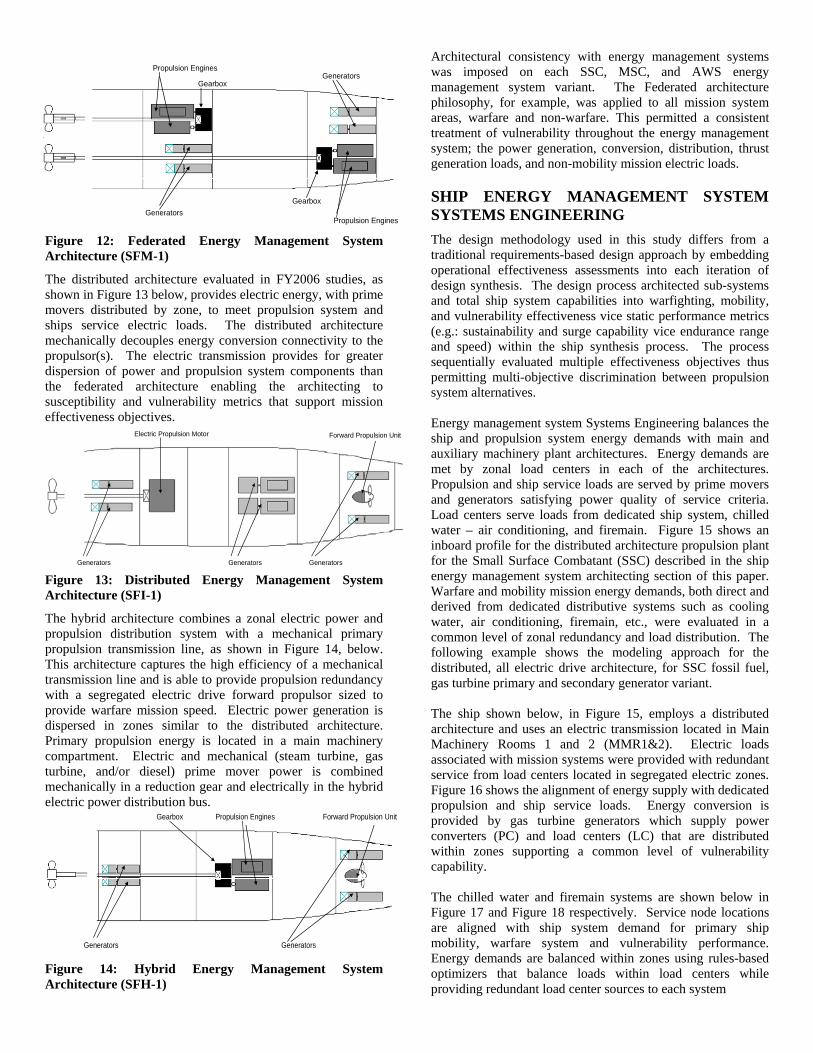
Propulsion Engines
Generators
GearboxGenerators
Propulsion Engines
Gearbox
Generators Generators Generators
Electric Propulsion Motor Forward Propulsion Unit
Figure 12: Federated Energy Management System Architecture (SFM-1)
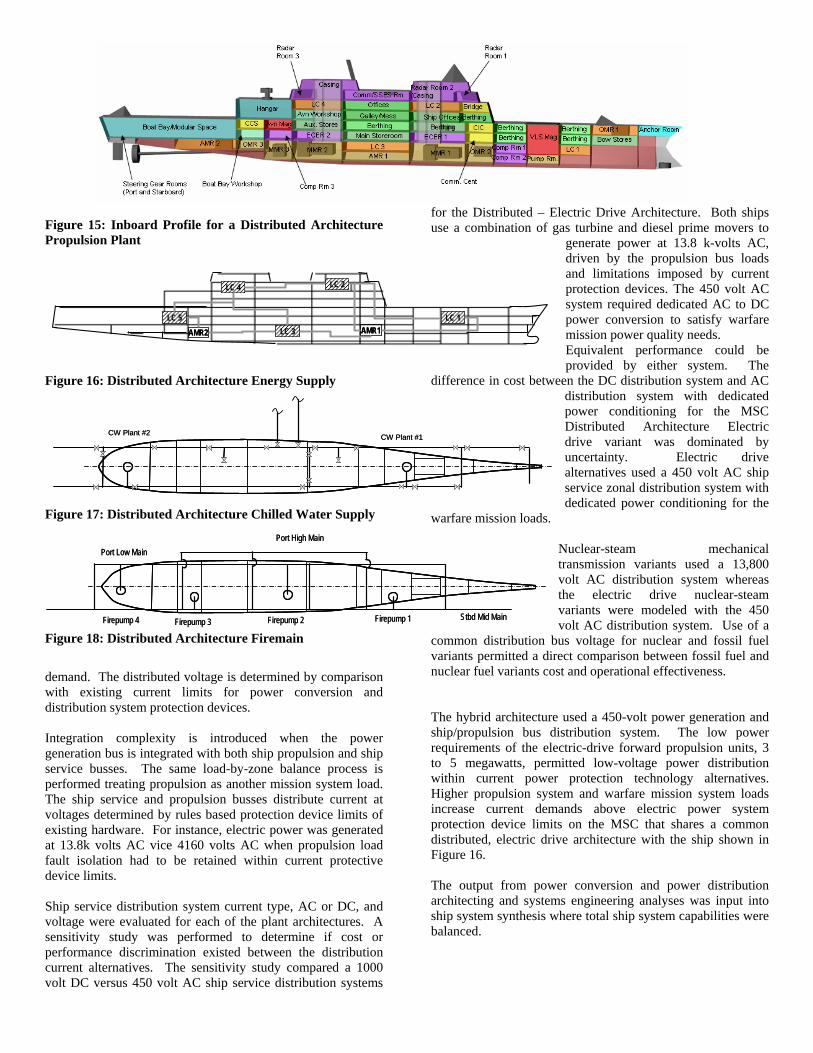
The distributed architecture evaluated in FY2006 studies, as shown in Figure 13 below, provides electric energy, with prime movers distributed by zone, to meet propulsion system and ships service electric loads. The distributed architecture mechanically decouples energy conversion connectivity to the propulsor(s). The electric transmission provides for greater dispersion of power and propulsion system components than the federated architecture enabling the architecting to susceptibility and vulnerability metrics that support mission effectiveness objectives.
Figure 13: Distributed Energy Management System Architecture (SFI-1)
The hybrid architecture combines a zonal electric power and propulsion distribution system with a mechanical primary propulsion transmission line, as shown in Figure 14, below. This architecture captures the high efficiency of a mechanical transmission line and is able to provide propulsion redundancy with a segregated electric drive forward propulsor sized to provide warfare mission speed. Electric power generation is dispersed in zones similar to the distributed architecture. Primary propulsion energy is located in a main machinery compartment. Electric and mechanical (steam turbine, gas turbine, and/or diesel) prime mover power is combined mechanically in a reduction gear and electrically in the hybrid electric power distribution bus.
Generators
Propulsion Engines
Generators
Forward Propulsion UnitGearbox
Figure 14: Hybrid Energy Management System Architecture (SFH-1)
Architectural consistency with energy management systems was imposed on each SSC, MSC, and AWS energy management system variant. The Federated architecture philosophy, for example, was applied to all mission system areas, warfare and non-warfare. This permitted a consistent treatment of vulnerability throughout the energy management system; the power generation, conversion, distribution, thrust generation loads, and non-mobility mission electric loads.
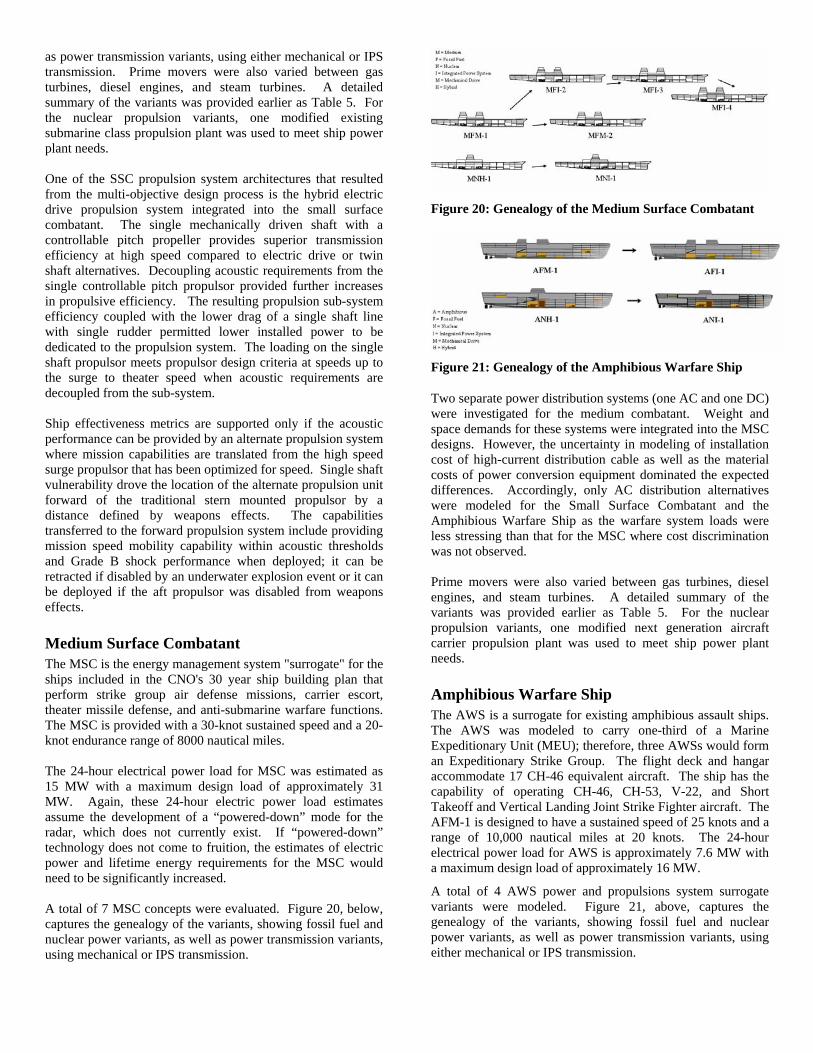
SHIP ENERGY MANAGEMENT SYSTEM SYSTEMS ENGINEERING The design methodology used in this study differs from a traditional requirements-based design approach by embedding operational effectiveness assessments into each iteration of design synthesis. The design process architected sub-systems and total ship system capabilities into warfighting, mobility, and vulnerability effectiveness vice static performance metrics (e.g.: sustainability and surge capability vice endurance range and speed) within the ship synthesis process. The process sequentially evaluated multiple effectiveness objectives thus permitting multi-objective discrimination between propulsion system alternatives. Energy management system Systems Engineering balances the ship and propulsion system energy demands with main and auxiliary machinery plant architectures. Energy demands are met by zonal load centers in each of the architectures. Propulsion and ship service loads are served by prime movers and generators satisfying power quality of service criteria. Load centers serve loads from dedicated ship system, chilled water – air conditioning, and firemain. Figure 15 shows an inboard profile for the distributed architecture propulsion plant for the Small Surface Combatant (SSC) described in the ship energy management system architecting section of this paper. Warfare and mobility mission energy demands, both direct and derived from dedicated distributive systems such as cooling water, air conditioning, firemain, etc., were evaluated in a common level of zonal redundancy and load distribution. The following example shows the modeling approach for the distributed, all electric drive architecture, for SSC fossil fuel, gas turbine primary and secondary generator variant. The ship shown below, in Figure 15, employs a distributed architecture and uses an electric transmission located in Main Machinery Rooms 1 and 2 (MMR1&2). Electric loads associated with mission systems were provided with redundant service from load centers located in segregated electric zones. Figure 16 shows the alignment of energy supply with dedicated propulsion and ship service loads. Energy conversion is provided by gas turbine generators which supply power converters (PC) and load centers (LC) that are distributed within zones supporting a common level of vulnerability capability. The chilled water and firemain systems are shown below in Figure 17 and Figure 18 respectively. Service node locations are aligned with ship system demand for primary ship mobility, warfare system and vulnerability performance. Energy demands are balanced within zones using rules-based optimizers that balance loads within load centers while providing redundant load center sources to each system
LC 5
LC 4
LC 3
LC 2
LC 1AMR1AMR2
LC 5
LC 4
LC 3
LC 2
LC 1AMR1AMR2
LC 5
LC 4
LC 3
LC 2
LC 1AMR1AMR2
Port Low MainPort High Main
Stbd Mid MainFirepump 4 Firepump 3 Firepump 2 Firepump 1
Port Low MainPort High Main
Stbd Mid MainFirepump 4 Firepump 3 Firepump 2 Firepump 1
CW Plant #2 CW Plant #1CW Plant #2 CW Plant #1
Figure 15: Inboard Profile for a Distributed Architecture Propulsion Plant
Figure 16: Distributed Architecture Energy Supply
Figure 17: Distributed Architecture Chilled Water Supply
Figure 18: Distributed Architecture Firemain
demand. The distributed voltage is determined by comparison with existing current limits for power conversion and distribution system protection devices. Integration complexity is introduced when the power generation bus is integrated with both ship propulsion and ship service busses. The same load-by-zone balance process is performed treating propulsion as another mission system load. The ship service and propulsion busses distribute current at voltages determined by rules based protection device limits of existing hardware. For instance, electric power was generated at 13.8k volts AC vice 4160 volts AC when propulsion load fault isolation had to be retained within current protective device limits. Ship service distribution system current type, AC or DC, and voltage were evaluated for each of the plant architectures. A sensitivity study was performed to determine if cost or performance discrimination existed between the distribution current alternatives. The sensitivity study compared a 1000 volt DC versus 450 volt AC ship service distribution systems
for the Distributed – Electric Drive Architecture. Both ships use a combination of gas turbine and diesel prime movers to
generate power at 13.8 k-volts AC, driven by the propulsion bus loads and limitations imposed by current protection devices. The 450 volt AC system required dedicated AC to DC power conversion to satisfy warfare mission power quality needs. Equivalent performance could be provided by either system. The
difference in cost between the DC distribution system and AC distribution system with dedicated power conditioning for the MSC Distributed Architecture Electric drive variant was dominated by uncertainty. Electric drive alternatives used a 450 volt AC ship service zonal distribution system with dedicated power conditioning for the
warfare mission loads. Nuclear-steam mechanical transmission variants used a 13,800 volt AC distribution system whereas the electric drive nuclear-steam variants were modeled with the 450 volt AC distribution system. Use of a
common distribution bus voltage for nuclear and fossil fuel variants permitted a direct comparison between fossil fuel and nuclear fuel variants cost and operational effectiveness.
The hybrid architecture used a 450-volt power generation and ship/propulsion bus distribution system. The low power requirements of the electric-drive forward propulsion units, 3 to 5 megawatts, permitted low-voltage power distribution within current power protection technology alternatives. Higher propulsion system and warfare mission system loads increase current demands above electric power system protection device limits on the MSC that shares a common distributed, electric drive architecture with the ship shown in Figure 16. The output from power conversion and power distribution architecting and systems engineering analyses was input into ship system synthesis where total ship system capabilities were balanced.
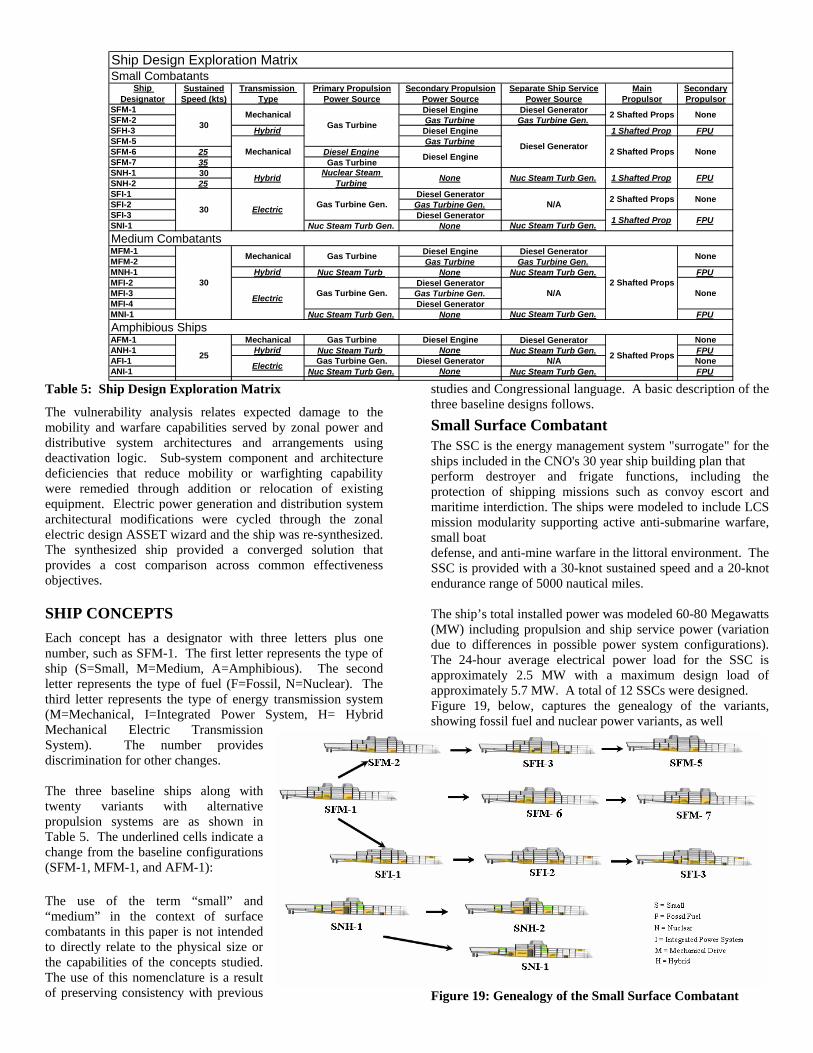
Table 5: Ship Design Exploration Matrix
The vulnerability analysis relates expected damage to the mobility and warfare capabilities served by zonal power and distributive system architectures and arrangements using deactivation logic. Sub-system component and architecture deficiencies that reduce mobility or warfighting capability were remedied through addition or relocation of existing equipment. Electric power generation and distribution system architectural modifications were cycled through the zonal electric design ASSET wizard and the ship was re-synthesized. The synthesized ship provided a converged solution that provides a cost comparison across common effectiveness objectives.
SHIP CONCEPTS Each concept has a designator with three letters plus one number, such as SFM-1. The first letter represents the type of ship (S=Small, M=Medium, A=Amphibious). The second letter represents the type of fuel (F=Fossil, N=Nuclear). The third letter represents the type of energy transmission system (M=Mechanical, I=Integrated Power System, H= Hybrid Mechanical Electric Transmission System). The number provides discrimination for other changes. The three baseline ships along with twenty variants with alternative propulsion systems are as shown in Table 5. The underlined cells indicate a change from the baseline configurations (SFM-1, MFM-1, and AFM-1): The use of the term “small” and “medium” in the context of surface combatants in this paper is not intended to directly relate to the physical size or the capabilities of the concepts studied. The use of this nomenclature is a result of preserving consistency with previous
studies and Congressional language. A basic description of the three baseline designs follows.
Small Surface Combatant The SSC is the energy management system "surrogate" for the ships included in the CNO's 30 year ship building plan that perform destroyer and frigate functions, including the protection of shipping missions such as convoy escort and maritime interdiction. The ships were modeled to include LCS mission modularity supporting active anti-submarine warfare, small boat defense, and anti-mine warfare in the littoral environment. The SSC is provided with a 30-knot sustained speed and a 20-knot endurance range of 5000 nautical miles. The ship’s total installed power was modeled 60-80 Megawatts (MW) including propulsion and ship service power (variation due to differences in possible power system configurations). The 24-hour average electrical power load for the SSC is approximately 2.5 MW with a maximum design load of approximately 5.7 MW. A total of 12 SSCs were designed. Figure 19, below, captures the genealogy of the variants, showing fossil fuel and nuclear power variants, as well
Figure 19: Genealogy of the Small Surface Combatant
Ship Design Exploration MatrixSmall Combatants
Sustained Transmission Primary Propulsion Secondary Propulsion Separate Ship Service Main SecondarySpeed (kts) Type Power Source Power Source Power Source Propulsor Propulsor
SFM-1 Diesel Engine Diesel GeneratorSFM-2 Gas Turbine Gas Turbine Gen.SFH-3 Hybrid Diesel Engine 1 Shafted Prop FPUSFM-5 Gas TurbineSFM-6 25 Diesel EngineSFM-7 35 Gas TurbineSNH-1 30SNH-2 25SFI-1 Diesel GeneratorSFI-2 Gas Turbine Gen.SFI-3 Diesel GeneratorSNI-1 Nuc Steam Turb Gen. NoneMedium CombatantsMFM-1 Diesel Engine Diesel GeneratorMFM-2 Gas Turbine Gas Turbine Gen.MNH-1 Hybrid Nuc Steam Turb None Nuc Steam Turb Gen. FPUMFI-2 Diesel GeneratorMFI-3 Gas Turbine Gen.MFI-4 Diesel GeneratorMNI-1 Nuc Steam Turb Gen. None FPUAmphibious ShipsAFM-1 Mechanical Gas Turbine Diesel Engine Diesel Generator NoneANH-1 Hybrid Nuc Steam Turb None Nuc Steam Turb Gen. FPUAFI-1 Gas Turbine Gen. Diesel Generator N/A NoneANI-1 Nuc Steam Turb Gen. None Nuc Steam Turb Gen. FPU
25
Ship Designator
2 Shafted Props None
2 Shafted Props None
30
FPU
N/A
None
Electric Gas Turbine Gen.
1 Shafted Prop FPU
2 Shafted Props None
1 Shafted Prop30
Diesel Generator
Nuc Steam Turb Gen.
Gas Turbine
Diesel Engine
Nuclear Steam Turbine
Nuc Steam Turb Gen.
Mechanical
Mechanical
30
None
None2 Shafted Props
N/AGas Turbine Gen.
Gas Turbine
Nuc Steam Turb Gen.
Hybrid
Electric2 Shafted Props
Electric
Mechanical
as power transmission variants, using either mechanical or IPS transmission. Prime movers were also varied between gas turbines, diesel engines, and steam turbines. A detailed summary of the variants was provided earlier as Table 5. For the nuclear propulsion variants, one modified existing submarine class propulsion plant was used to meet ship power plant needs. One of the SSC propulsion system architectures that resulted from the multi-objective design process is the hybrid electric drive propulsion system integrated into the small surface combatant. The single mechanically driven shaft with a controllable pitch propeller provides superior transmission efficiency at high speed compared to electric drive or twin shaft alternatives. Decoupling acoustic requirements from the single controllable pitch propulsor provided further increases in propulsive efficiency. The resulting propulsion sub-system efficiency coupled with the lower drag of a single shaft line with single rudder permitted lower installed power to be dedicated to the propulsion system. The loading on the single shaft propulsor meets propulsor design criteria at speeds up to the surge to theater speed when acoustic requirements are decoupled from the sub-system. Ship effectiveness metrics are supported only if the acoustic performance can be provided by an alternate propulsion system where mission capabilities are translated from the high speed surge propulsor that has been optimized for speed. Single shaft vulnerability drove the location of the alternate propulsion unit forward of the traditional stern mounted propulsor by a distance defined by weapons effects. The capabilities transferred to the forward propulsion system include providing mission speed mobility capability within acoustic thresholds and Grade B shock performance when deployed; it can be retracted if disabled by an underwater explosion event or it can be deployed if the aft propulsor was disabled from weapons effects.
Medium Surface Combatant The MSC is the energy management system "surrogate" for the ships included in the CNO's 30 year ship building plan that perform strike group air defense missions, carrier escort, theater missile defense, and anti-submarine warfare functions. The MSC is provided with a 30-knot sustained speed and a 20-knot endurance range of 8000 nautical miles. The 24-hour electrical power load for MSC was estimated as 15 MW with a maximum design load of approximately 31 MW. Again, these 24-hour electric power load estimates assume the development of a “powered-down” mode for the radar, which does not currently exist. If “powered-down” technology does not come to fruition, the estimates of electric power and lifetime energy requirements for the MSC would need to be significantly increased. A total of 7 MSC concepts were evaluated. Figure 20, below, captures the genealogy of the variants, showing fossil fuel and nuclear power variants, as well as power transmission variants, using mechanical or IPS transmission.
Figure 20: Genealogy of the Medium Surface Combatant
Figure 21: Genealogy of the Amphibious Warfare Ship
Two separate power distribution systems (one AC and one DC) were investigated for the medium combatant. Weight and space demands for these systems were integrated into the MSC designs. However, the uncertainty in modeling of installation cost of high-current distribution cable as well as the material costs of power conversion equipment dominated the expected differences. Accordingly, only AC distribution alternatives were modeled for the Small Surface Combatant and the Amphibious Warfare Ship as the warfare system loads were less stressing than that for the MSC where cost discrimination was not observed. Prime movers were also varied between gas turbines, diesel engines, and steam turbines. A detailed summary of the variants was provided earlier as Table 5. For the nuclear propulsion variants, one modified next generation aircraft carrier propulsion plant was used to meet ship power plant needs.
Amphibious Warfare Ship The AWS is a surrogate for existing amphibious assault ships. The AWS was modeled to carry one-third of a Marine Expeditionary Unit (MEU); therefore, three AWSs would form an Expeditionary Strike Group. The flight deck and hangar accommodate 17 CH-46 equivalent aircraft. The ship has the capability of operating CH-46, CH-53, V-22, and Short Takeoff and Vertical Landing Joint Strike Fighter aircraft. The AFM-1 is designed to have a sustained speed of 25 knots and a range of 10,000 nautical miles at 20 knots. The 24-hour electrical power load for AWS is approximately 7.6 MW with a maximum design load of approximately 16 MW.
A total of 4 AWS power and propulsions system surrogate variants were modeled. Figure 21, above, captures the genealogy of the variants, showing fossil fuel and nuclear power variants, as well as power transmission variants, using either mechanical or IPS transmission.
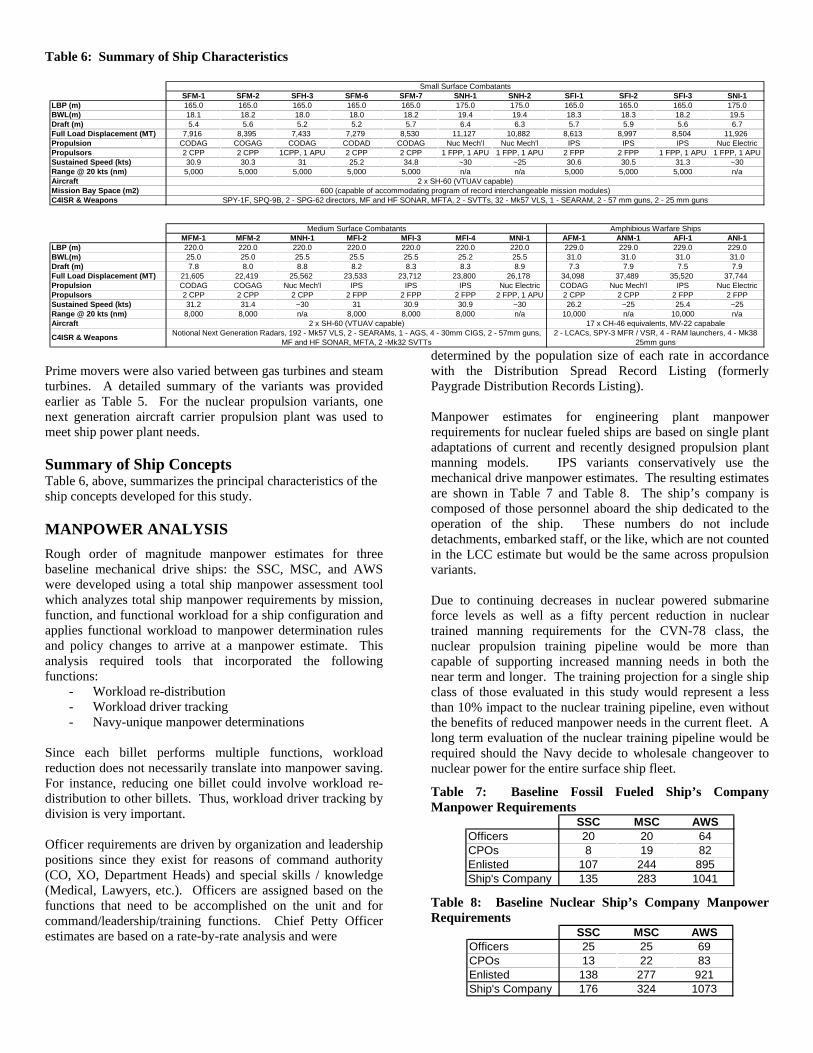
Table 6: Summary of Ship Characteristics
Prime movers were also varied between gas turbines and steam turbines. A detailed summary of the variants was provided earlier as Table 5. For the nuclear propulsion variants, one next generation aircraft carrier propulsion plant was used to meet ship power plant needs. Summary of Ship Concepts Table 6, above, summarizes the principal characteristics of the ship concepts developed for this study.
MANPOWER ANALYSIS Rough order of magnitude manpower estimates for three baseline mechanical drive ships: the SSC, MSC, and AWS were developed using a total ship manpower assessment tool which analyzes total ship manpower requirements by mission, function, and functional workload for a ship configuration and applies functional workload to manpower determination rules and policy changes to arrive at a manpower estimate. This analysis required tools that incorporated the following functions:
- Workload re-distribution - Workload driver tracking - Navy-unique manpower determinations
Since each billet performs multiple functions, workload reduction does not necessarily translate into manpower saving. For instance, reducing one billet could involve workload re-distribution to other billets. Thus, workload driver tracking by division is very important. Officer requirements are driven by organization and leadership positions since they exist for reasons of command authority (CO, XO, Department Heads) and special skills / knowledge (Medical, Lawyers, etc.). Officers are assigned based on the functions that need to be accomplished on the unit and for command/leadership/training functions. Chief Petty Officer estimates are based on a rate-by-rate analysis and were
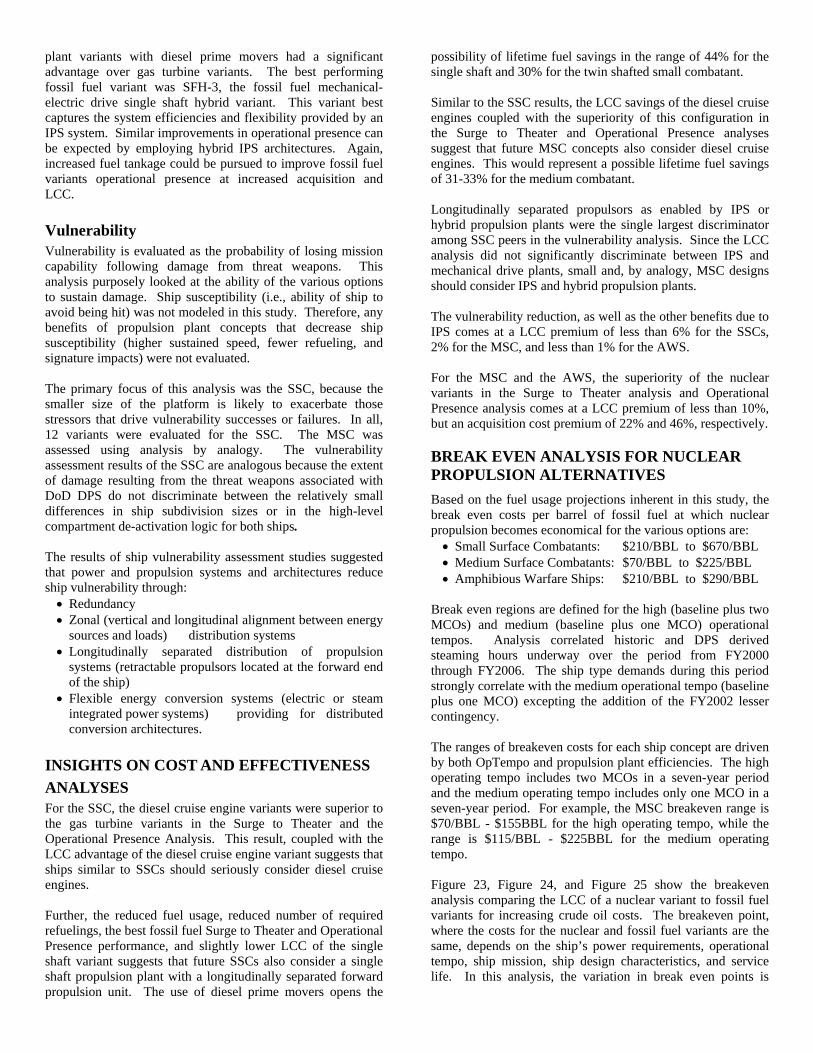
determined by the population size of each rate in accordance with the Distribution Spread Record Listing (formerly Paygrade Distribution Records Listing). Manpower estimates for engineering plant manpower requirements for nuclear fueled ships are based on single plant adaptations of current and recently designed propulsion plant manning models. IPS variants conservatively use the mechanical drive manpower estimates. The resulting estimates are shown in Table 7 and Table 8. The ship’s company is composed of those personnel aboard the ship dedicated to the operation of the ship. These numbers do not include detachments, embarked staff, or the like, which are not counted in the LCC estimate but would be the same across propulsion variants. Due to continuing decreases in nuclear powered submarine force levels as well as a fifty percent reduction in nuclear trained manning requirements for the CVN-78 class, the nuclear propulsion training pipeline would be more than capable of supporting increased manning needs in both the near term and longer. The training projection for a single ship class of those evaluated in this study would represent a less than 10% impact to the nuclear training pipeline, even without the benefits of reduced manpower needs in the current fleet. A long term evaluation of the nuclear training pipeline would be required should the Navy decide to wholesale changeover to nuclear power for the entire surface ship fleet.
Table 7: Baseline Fossil Fueled Ship’s Company Manpower Requirements
SSC MSC AWSOfficers 20 20 64CPOs 8 19 82Enlisted 107 244 895Ship's Company 135 283 1041
Table 8: Baseline Nuclear Ship’s Company Manpower Requirements
SSC MSC AWSOfficers 25 25 69CPOs 13 22 83Enlisted 138 277 921Ship's Company 176 324 1073
SFM-1 SFM-2 SFH-3 SFM-6 SFM-7 SNH-1 SNH-2 SFI-1 SFI-2 SFI-3 SNI-1LBP (m) 165.0 165.0 165.0 165.0 165.0 175.0 175.0 165.0 165.0 165.0 175.0BWL(m) 18.1 18.2 18.0 18.0 18.2 19.4 19.4 18.3 18.3 18.2 19.5Draft (m) 5.4 5.6 5.2 5.2 5.7 6.4 6.3 5.7 5.9 5.6 6.7Full Load Displacement (MT) 7,916 8,395 7,433 7,279 8,530 11,127 10,882 8,613 8,997 8,504 11,926Propulsion CODAG COGAG CODAG CODAD CODAG Nuc Mech'l Nuc Mech'l IPS IPS IPS Nuc ElectricPropulsors 2 CPP 2 CPP 1CPP, 1 APU 2 CPP 2 CPP 1 FPP, 1 APU 1 FPP, 1 APU 2 FPP 2 FPP 1 FPP, 1 APU 1 FPP, 1 APUSustained Speed (kts) 30.9 30.3 31 25.2 34.8 ~30 ~25 30.6 30.5 31.3 ~30Range @ 20 kts (nm) 5,000 5,000 5,000 5,000 5,000 n/a n/a 5,000 5,000 5,000 n/aAircraftMission Bay Space (m2)C4ISR & Weapons
MFM-1 MFM-2 MNH-1 MFI-2 MFI-3 MFI-4 MNI-1 AFM-1 ANM-1 AFI-1 ANI-1LBP (m) 220.0 220.0 220.0 220.0 220.0 220.0 220.0 229.0 229.0 229.0 229.0BWL(m) 25.0 25.0 25.5 25.5 25.5 25.2 25.5 31.0 31.0 31.0 31.0Draft (m) 7.8 8.0 8.8 8.2 8.3 8.3 8.9 7.3 7.9 7.5 7.9Full Load Displacement (MT) 21,605 22,419 25,562 23,533 23,712 23,800 26,178 34,098 37,489 35,520 37,744Propulsion CODAG COGAG Nuc Mech'l IPS IPS IPS Nuc Electric CODAG Nuc Mech'l IPS Nuc ElectricPropulsors 2 CPP 2 CPP 2 CPP 2 FPP 2 FPP 2 FPP 2 FPP, 1 APU 2 CPP 2 CPP 2 FPP 2 FPPSustained Speed (kts) 31.2 31.4 ~30 31 30.9 30.9 ~30 26.2 ~25 25.4 ~25Range @ 20 kts (nm) 8,000 8,000 n/a 8,000 8,000 8,000 n/a 10,000 n/a 10,000 n/aAircraft
Amphibious Warfare Ships
Small Surface Combatants
C4ISR & Weapons 2 - LCACs, SPY-3 MFR / VSR, 4 - RAM launchers, 4 - Mk38 25mm guns
17 x CH-46 equivalents, MV-22 capabale
2 x SH-60 (VTUAV capable)600 (capable of accommodating program of record interchangeable mission modules)
SPY-1F, SPQ-9B, 2 - SPG-62 directors, MF and HF SONAR, MFTA, 2 - SVTTs, 32 - Mk57 VLS, 1 - SEARAM, 2 - 57 mm guns, 2 - 25 mm guns
Notional Next Generation Radars, 192 - Mk57 VLS, 2 - SEARAMs, 1 - AGS, 4 - 30mm CIGS, 2 - 57mm guns, MF and HF SONAR, MFTA, 2 -Mk32 SVTTs
2 x SH-60 (VTUAV capable)
Medium Surface Combatants
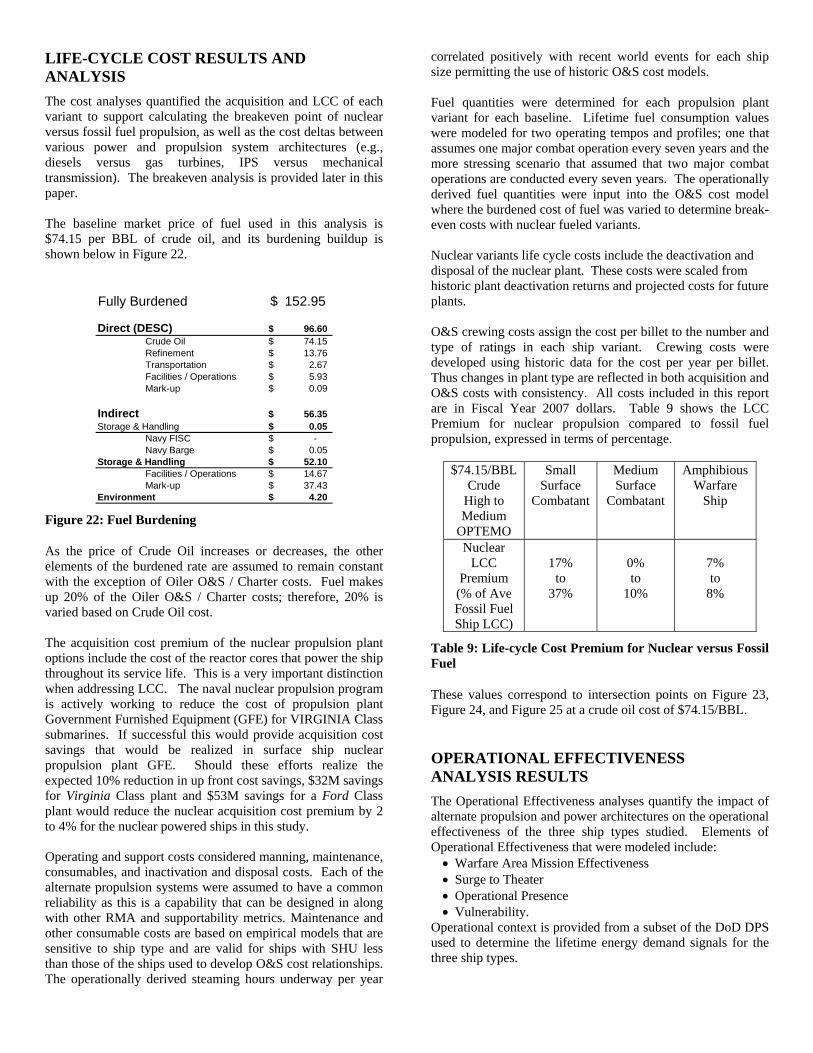
LIFE-CYCLE COST RESULTS AND ANALYSIS The cost analyses quantified the acquisition and LCC of each variant to support calculating the breakeven point of nuclear versus fossil fuel propulsion, as well as the cost deltas between various power and propulsion system architectures (e.g., diesels versus gas turbines, IPS versus mechanical transmission). The breakeven analysis is provided later in this paper. The baseline market price of fuel used in this analysis is $74.15 per BBL of crude oil, and its burdening buildup is shown below in Figure 22.
Fully Burdened 152.95$
Direct (DESC) 96.60$ Crude Oil 74.15$ Refinement 13.76$ Transportation 2.67$ Facilities / Operations 5.93$ Mark-up 0.09$
Indirect 56.35$ Storage & Handling 0.05$
Navy FISC -$ Navy Barge 0.05$
Storage & Handling 52.10$ Facilities / Operations 14.67$ Mark-up 37.43$
Environment 4.20$ Figure 22: Fuel Burdening
As the price of Crude Oil increases or decreases, the other elements of the burdened rate are assumed to remain constant with the exception of Oiler O&S / Charter costs. Fuel makes up 20% of the Oiler O&S / Charter costs; therefore, 20% is varied based on Crude Oil cost.
The acquisition cost premium of the nuclear propulsion plant options include the cost of the reactor cores that power the ship throughout its service life. This is a very important distinction when addressing LCC. The naval nuclear propulsion program is actively working to reduce the cost of propulsion plant Government Furnished Equipment (GFE) for VIRGINIA Class submarines. If successful this would provide acquisition cost savings that would be realized in surface ship nuclear propulsion plant GFE. Should these efforts realize the expected 10% reduction in up front cost savings, $32M savings for Virginia Class plant and $53M savings for a Ford Class plant would reduce the nuclear acquisition cost premium by 2 to 4% for the nuclear powered ships in this study. Operating and support costs considered manning, maintenance, consumables, and inactivation and disposal costs. Each of the alternate propulsion systems were assumed to have a common reliability as this is a capability that can be designed in along with other RMA and supportability metrics. Maintenance and other consumable costs are based on empirical models that are sensitive to ship type and are valid for ships with SHU less than those of the ships used to develop O&S cost relationships. The operationally derived steaming hours underway per year
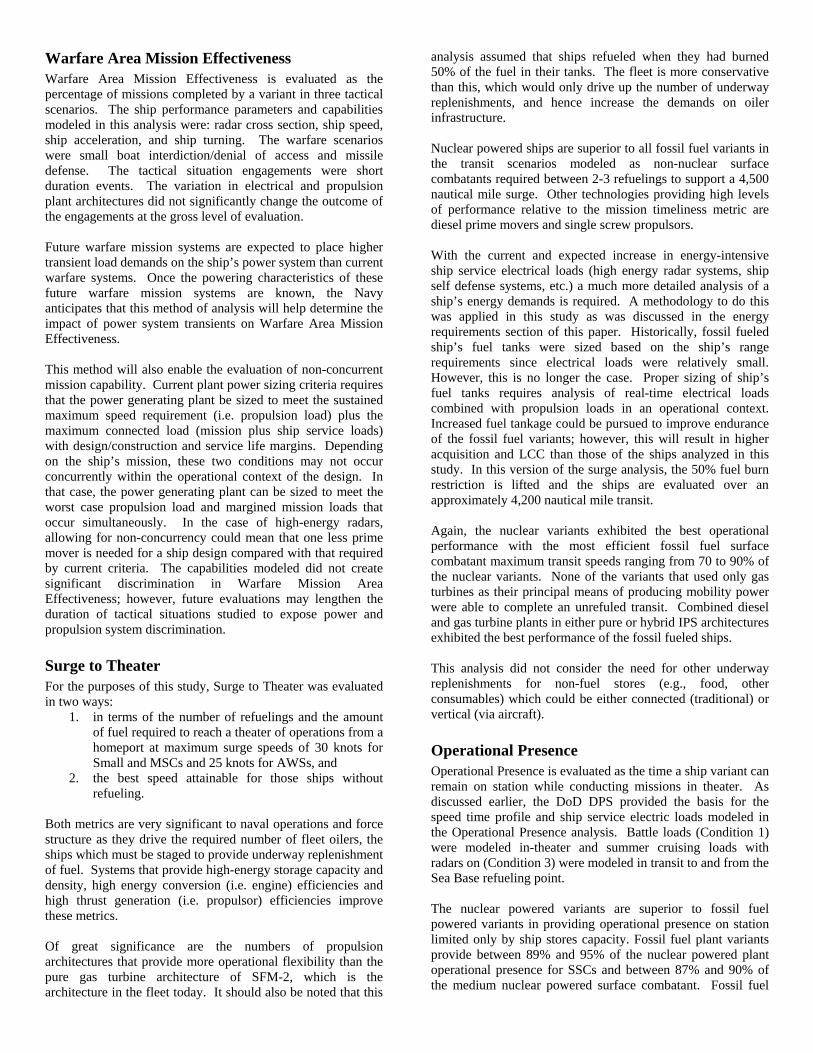
correlated positively with recent world events for each ship size permitting the use of historic O&S cost models. Fuel quantities were determined for each propulsion plant variant for each baseline. Lifetime fuel consumption values were modeled for two operating tempos and profiles; one that assumes one major combat operation every seven years and the more stressing scenario that assumed that two major combat operations are conducted every seven years. The operationally derived fuel quantities were input into the O&S cost model where the burdened cost of fuel was varied to determine break-even costs with nuclear fueled variants. Nuclear variants life cycle costs include the deactivation and disposal of the nuclear plant. These costs were scaled from historic plant deactivation returns and projected costs for future plants. O&S crewing costs assign the cost per billet to the number and type of ratings in each ship variant. Crewing costs were developed using historic data for the cost per year per billet. Thus changes in plant type are reflected in both acquisition and O&S costs with consistency. All costs included in this report are in Fiscal Year 2007 dollars. Table 9 shows the LCC Premium for nuclear propulsion compared to fossil fuel propulsion, expressed in terms of percentage.
$74.15/BBL Crude
High to Medium
OPTEMO
Small Surface
Combatant
Medium Surface
Combatant
Amphibious Warfare
Ship
Nuclear LCC
Premium (% of Ave Fossil Fuel Ship LCC)
17%
to 37%
0% to
10%
7% to
8%
Table 9: Life-cycle Cost Premium for Nuclear versus Fossil Fuel
These values correspond to intersection points on Figure 23, Figure 24, and Figure 25 at a crude oil cost of $74.15/BBL.
OPERATIONAL EFFECTIVENESS ANALYSIS RESULTS The Operational Effectiveness analyses quantify the impact of alternate propulsion and power architectures on the operational effectiveness of the three ship types studied. Elements of Operational Effectiveness that were modeled include: • Warfare Area Mission Effectiveness • Surge to Theater • Operational Presence • Vulnerability.
Operational context is provided from a subset of the DoD DPS used to determine the lifetime energy demand signals for the three ship types.
Warfare Area Mission Effectiveness Warfare Area Mission Effectiveness is evaluated as the percentage of missions completed by a variant in three tactical scenarios. The ship performance parameters and capabilities modeled in this analysis were: radar cross section, ship speed, ship acceleration, and ship turning. The warfare scenarios were small boat interdiction/denial of access and missile defense. The tactical situation engagements were short duration events. The variation in electrical and propulsion plant architectures did not significantly change the outcome of the engagements at the gross level of evaluation. Future warfare mission systems are expected to place higher transient load demands on the ship’s power system than current warfare systems. Once the powering characteristics of these future warfare mission systems are known, the Navy anticipates that this method of analysis will help determine the impact of power system transients on Warfare Area Mission Effectiveness. This method will also enable the evaluation of non-concurrent mission capability. Current plant power sizing criteria requires that the power generating plant be sized to meet the sustained maximum speed requirement (i.e. propulsion load) plus the maximum connected load (mission plus ship service loads) with design/construction and service life margins. Depending on the ship’s mission, these two conditions may not occur concurrently within the operational context of the design. In that case, the power generating plant can be sized to meet the worst case propulsion load and margined mission loads that occur simultaneously. In the case of high-energy radars, allowing for non-concurrency could mean that one less prime mover is needed for a ship design compared with that required by current criteria. The capabilities modeled did not create significant discrimination in Warfare Mission Area Effectiveness; however, future evaluations may lengthen the duration of tactical situations studied to expose power and propulsion system discrimination.
Surge to Theater For the purposes of this study, Surge to Theater was evaluated in two ways:
1. in terms of the number of refuelings and the amount of fuel required to reach a theater of operations from a homeport at maximum surge speeds of 30 knots for Small and MSCs and 25 knots for AWSs, and
2. the best speed attainable for those ships without refueling.
Both metrics are very significant to naval operations and force structure as they drive the required number of fleet oilers, the ships which must be staged to provide underway replenishment of fuel. Systems that provide high-energy storage capacity and density, high energy conversion (i.e. engine) efficiencies and high thrust generation (i.e. propulsor) efficiencies improve these metrics. Of great significance are the numbers of propulsion architectures that provide more operational flexibility than the pure gas turbine architecture of SFM-2, which is the architecture in the fleet today. It should also be noted that this
analysis assumed that ships refueled when they had burned 50% of the fuel in their tanks. The fleet is more conservative than this, which would only drive up the number of underway replenishments, and hence increase the demands on oiler infrastructure. Nuclear powered ships are superior to all fossil fuel variants in the transit scenarios modeled as non-nuclear surface combatants required between 2-3 refuelings to support a 4,500 nautical mile surge. Other technologies providing high levels of performance relative to the mission timeliness metric are diesel prime movers and single screw propulsors. With the current and expected increase in energy-intensive ship service electrical loads (high energy radar systems, ship self defense systems, etc.) a much more detailed analysis of a ship’s energy demands is required. A methodology to do this was applied in this study as was discussed in the energy requirements section of this paper. Historically, fossil fueled ship’s fuel tanks were sized based on the ship’s range requirements since electrical loads were relatively small. However, this is no longer the case. Proper sizing of ship’s fuel tanks requires analysis of real-time electrical loads combined with propulsion loads in an operational context. Increased fuel tankage could be pursued to improve endurance of the fossil fuel variants; however, this will result in higher acquisition and LCC than those of the ships analyzed in this study. In this version of the surge analysis, the 50% fuel burn restriction is lifted and the ships are evaluated over an approximately 4,200 nautical mile transit. Again, the nuclear variants exhibited the best operational performance with the most efficient fossil fuel surface combatant maximum transit speeds ranging from 70 to 90% of the nuclear variants. None of the variants that used only gas turbines as their principal means of producing mobility power were able to complete an unrefuled transit. Combined diesel and gas turbine plants in either pure or hybrid IPS architectures exhibited the best performance of the fossil fueled ships. This analysis did not consider the need for other underway replenishments for non-fuel stores (e.g., food, other consumables) which could be either connected (traditional) or vertical (via aircraft).
Operational Presence Operational Presence is evaluated as the time a ship variant can remain on station while conducting missions in theater. As discussed earlier, the DoD DPS provided the basis for the speed time profile and ship service electric loads modeled in the Operational Presence analysis. Battle loads (Condition 1) were modeled in-theater and summer cruising loads with radars on (Condition 3) were modeled in transit to and from the Sea Base refueling point. The nuclear powered variants are superior to fossil fuel powered variants in providing operational presence on station limited only by ship stores capacity. Fossil fuel plant variants provide between 89% and 95% of the nuclear powered plant operational presence for SSCs and between 87% and 90% of the medium nuclear powered surface combatant. Fossil fuel
plant variants with diesel prime movers had a significant advantage over gas turbine variants. The best performing fossil fuel variant was SFH-3, the fossil fuel mechanical-electric drive single shaft hybrid variant. This variant best captures the system efficiencies and flexibility provided by an IPS system. Similar improvements in operational presence can be expected by employing hybrid IPS architectures. Again, increased fuel tankage could be pursued to improve fossil fuel variants operational presence at increased acquisition and LCC.
Vulnerability Vulnerability is evaluated as the probability of losing mission capability following damage from threat weapons. This analysis purposely looked at the ability of the various options to sustain damage. Ship susceptibility (i.e., ability of ship to avoid being hit) was not modeled in this study. Therefore, any benefits of propulsion plant concepts that decrease ship susceptibility (higher sustained speed, fewer refueling, and signature impacts) were not evaluated. The primary focus of this analysis was the SSC, because the smaller size of the platform is likely to exacerbate those stressors that drive vulnerability successes or failures. In all, 12 variants were evaluated for the SSC. The MSC was assessed using analysis by analogy. The vulnerability assessment results of the SSC are analogous because the extent of damage resulting from the threat weapons associated with DoD DPS do not discriminate between the relatively small differences in ship subdivision sizes or in the high-level compartment de-activation logic for both ships. The results of ship vulnerability assessment studies suggested that power and propulsion systems and architectures reduce ship vulnerability through: • Redundancy • Zonal (vertical and longitudinal alignment between energy
sources and loads) distribution systems • Longitudinally separated distribution of propulsion
systems (retractable propulsors located at the forward end of the ship)
• Flexible energy conversion systems (electric or steam integrated power systems) providing for distributed conversion architectures.
INSIGHTS ON COST AND EFFECTIVENESS ANALYSES For the SSC, the diesel cruise engine variants were superior to the gas turbine variants in the Surge to Theater and the Operational Presence Analysis. This result, coupled with the LCC advantage of the diesel cruise engine variant suggests that ships similar to SSCs should seriously consider diesel cruise engines. Further, the reduced fuel usage, reduced number of required refuelings, the best fossil fuel Surge to Theater and Operational Presence performance, and slightly lower LCC of the single shaft variant suggests that future SSCs also consider a single shaft propulsion plant with a longitudinally separated forward propulsion unit. The use of diesel prime movers opens the
possibility of lifetime fuel savings in the range of 44% for the single shaft and 30% for the twin shafted small combatant. Similar to the SSC results, the LCC savings of the diesel cruise engines coupled with the superiority of this configuration in the Surge to Theater and Operational Presence analyses suggest that future MSC concepts also consider diesel cruise engines. This would represent a possible lifetime fuel savings of 31-33% for the medium combatant. Longitudinally separated propulsors as enabled by IPS or hybrid propulsion plants were the single largest discriminator among SSC peers in the vulnerability analysis. Since the LCC analysis did not significantly discriminate between IPS and mechanical drive plants, small and, by analogy, MSC designs should consider IPS and hybrid propulsion plants. The vulnerability reduction, as well as the other benefits due to IPS comes at a LCC premium of less than 6% for the SSCs, 2% for the MSC, and less than 1% for the AWS. For the MSC and the AWS, the superiority of the nuclear variants in the Surge to Theater analysis and Operational Presence analysis comes at a LCC premium of less than 10%, but an acquisition cost premium of 22% and 46%, respectively.
BREAK EVEN ANALYSIS FOR NUCLEAR PROPULSION ALTERNATIVES Based on the fuel usage projections inherent in this study, the break even costs per barrel of fossil fuel at which nuclear propulsion becomes economical for the various options are: • Small Surface Combatants: $210/BBL to $670/BBL • Medium Surface Combatants: $70/BBL to $225/BBL • Amphibious Warfare Ships: $210/BBL to $290/BBL
Break even regions are defined for the high (baseline plus two MCOs) and medium (baseline plus one MCO) operational tempos. Analysis correlated historic and DPS derived steaming hours underway over the period from FY2000 through FY2006. The ship type demands during this period strongly correlate with the medium operational tempo (baseline plus one MCO) excepting the addition of the FY2002 lesser contingency. The ranges of breakeven costs for each ship concept are driven by both OpTempo and propulsion plant efficiencies. The high operating tempo includes two MCOs in a seven-year period and the medium operating tempo includes only one MCO in a seven-year period. For example, the MSC breakeven range is $70/BBL - $155BBL for the high operating tempo, while the range is $115/BBL - $225BBL for the medium operating tempo. Figure 23, Figure 24, and Figure 25 show the breakeven analysis comparing the LCC of a nuclear variant to fossil fuel variants for increasing crude oil costs. The breakeven point, where the costs for the nuclear and fossil fuel variants are the same, depends on the ship’s power requirements, operational tempo, ship mission, ship design characteristics, and service life. In this analysis, the variation in break even points is
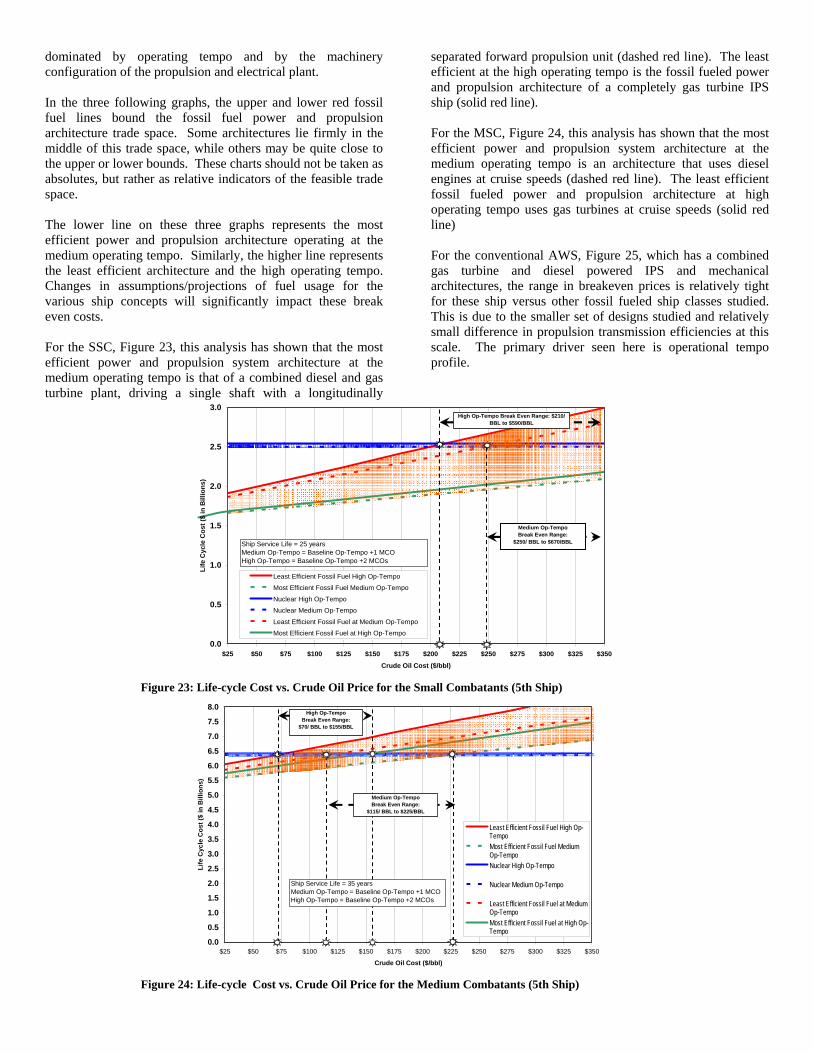
dominated by operating tempo and by the machinery configuration of the propulsion and electrical plant. In the three following graphs, the upper and lower red fossil fuel lines bound the fossil fuel power and propulsion architecture trade space. Some architectures lie firmly in the middle of this trade space, while others may be quite close to the upper or lower bounds. These charts should not be taken as absolutes, but rather as relative indicators of the feasible trade space. The lower line on these three graphs represents the most efficient power and propulsion architecture operating at the medium operating tempo. Similarly, the higher line represents the least efficient architecture and the high operating tempo. Changes in assumptions/projections of fuel usage for the various ship concepts will significantly impact these break even costs. For the SSC, Figure 23, this analysis has shown that the most efficient power and propulsion system architecture at the medium operating tempo is that of a combined diesel and gas turbine plant, driving a single shaft with a longitudinally
separated forward propulsion unit (dashed red line). The least efficient at the high operating tempo is the fossil fueled power and propulsion architecture of a completely gas turbine IPS ship (solid red line). For the MSC, Figure 24, this analysis has shown that the most efficient power and propulsion system architecture at the medium operating tempo is an architecture that uses diesel engines at cruise speeds (dashed red line). The least efficient fossil fueled power and propulsion architecture at high operating tempo uses gas turbines at cruise speeds (solid red line) For the conventional AWS, Figure 25, which has a combined gas turbine and diesel powered IPS and mechanical architectures, the range in breakeven prices is relatively tight for these ship versus other fossil fueled ship classes studied. This is due to the smaller set of designs studied and relatively small difference in propulsion transmission efficiencies at this scale. The primary driver seen here is operational tempo profile.
Figure 23: Life-cycle Cost vs. Crude Oil Price for the Small Combatants (5th Ship)
Figure 24: Life-cycle Cost vs. Crude Oil Price for the Medium Combatants (5th Ship)
0.0
0.5
1.0
1.5
2.0
2.5
3.0
3.5
4.0
4.5
5.0
5.5
6.0
6.5
7.0
7.5
8.0
$25 $50 $75 $100 $125 $150 $175 $200 $225 $250 $275 $300 $325 $350
Crude Oil Cost ($/bbl)
Life
Cyc
le C
ost (
$ in
Bill
ions
)
Least Efficient Fossil Fuel High Op-TempoMost Efficient Fossil Fuel MediumOp-TempoNuclear High Op-Tempo
Nuclear Medium Op-Tempo
Least Efficient Fossil Fuel at MediumOp-TempoMost Efficient Fossil Fuel at High Op-Tempo
High Op-Tempo Break Even Range:
$70/ BBL to $155/BBL
Ship Service Life = 35 yearsMedium Op-Tempo = Baseline Op-Tempo +1 MCOHigh Op-Tempo = Baseline Op-Tempo +2 MCOs
Medium Op-Tempo Break Even Range:
$115/ BBL to $225/BBL
0.0
0.5
1.0
1.5
2.0
2.5
3.0
$25 $50 $75 $100 $125 $150 $175 $200 $225 $250 $275 $300 $325 $350
Crude Oil Cost ($/bbl)
Life
Cyc
le C
ost (
$ in
Bill
ions
)
Least Efficient Fossil Fuel High Op-Tempo
Most Efficient Fossil Fuel Medium Op-Tempo
Nuclear High Op-Tempo
Nuclear Medium Op-Tempo
Least Efficient Fossil Fuel at Medium Op-Tempo
Most Efficient Fossil Fuel at High Op-Tempo
Ship Service Life = 25 yearsMedium Op-Tempo = Baseline Op-Tempo +1 MCOHigh Op-Tempo = Baseline Op-Tempo +2 MCOs
High Op-Tempo Break Even Range: $210/ BBL to $590/BBL
Medium Op-Tempo Break Even Range:
$250/ BBL to $670/BBL
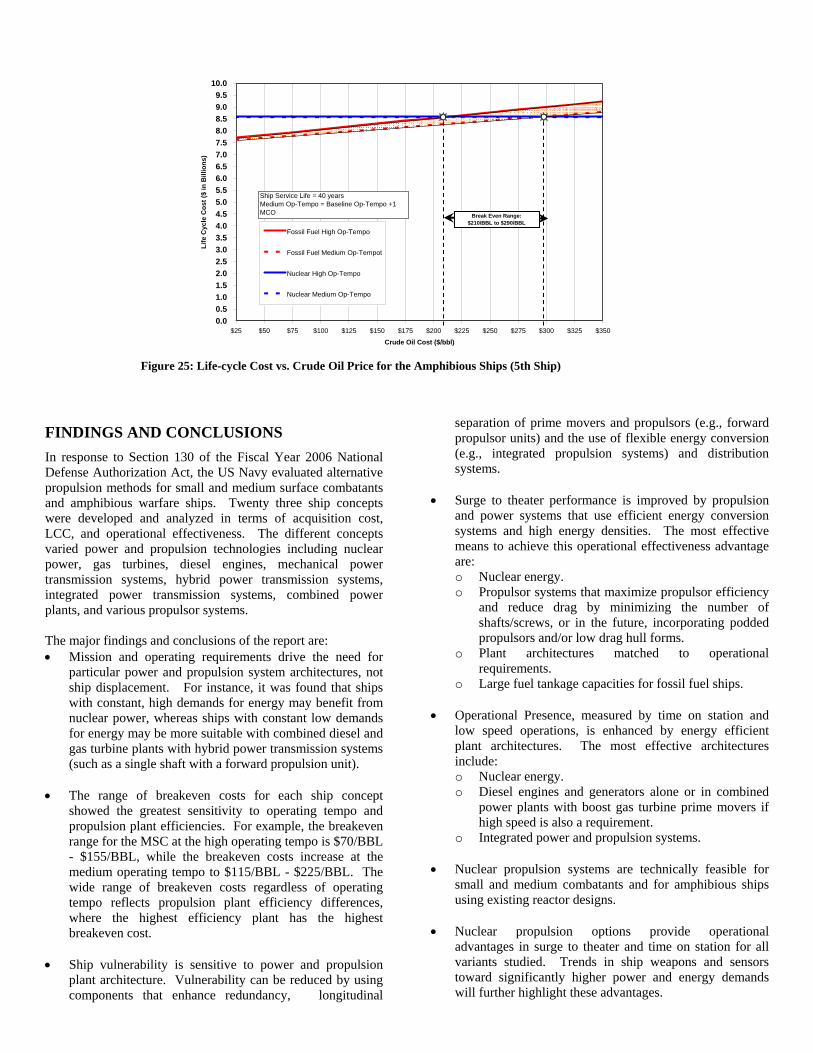
Figure 25: Life-cycle Cost vs. Crude Oil Price for the Amphibious Ships (5th Ship)
FINDINGS AND CONCLUSIONS In response to Section 130 of the Fiscal Year 2006 National Defense Authorization Act, the US Navy evaluated alternative propulsion methods for small and medium surface combatants and amphibious warfare ships. Twenty three ship concepts were developed and analyzed in terms of acquisition cost, LCC, and operational effectiveness. The different concepts varied power and propulsion technologies including nuclear power, gas turbines, diesel engines, mechanical power transmission systems, hybrid power transmission systems, integrated power transmission systems, combined power plants, and various propulsor systems. The major findings and conclusions of the report are: • Mission and operating requirements drive the need for
particular power and propulsion system architectures, not ship displacement. For instance, it was found that ships with constant, high demands for energy may benefit from nuclear power, whereas ships with constant low demands for energy may be more suitable with combined diesel and gas turbine plants with hybrid power transmission systems (such as a single shaft with a forward propulsion unit).
• The range of breakeven costs for each ship concept
showed the greatest sensitivity to operating tempo and propulsion plant efficiencies. For example, the breakeven range for the MSC at the high operating tempo is $70/BBL - $155/BBL, while the breakeven costs increase at the medium operating tempo to $115/BBL - $225/BBL. The wide range of breakeven costs regardless of operating tempo reflects propulsion plant efficiency differences, where the highest efficiency plant has the highest breakeven cost.
• Ship vulnerability is sensitive to power and propulsion
plant architecture. Vulnerability can be reduced by using components that enhance redundancy, longitudinal
separation of prime movers and propulsors (e.g., forward propulsor units) and the use of flexible energy conversion (e.g., integrated propulsion systems) and distribution systems.
• Surge to theater performance is improved by propulsion
and power systems that use efficient energy conversion systems and high energy densities. The most effective means to achieve this operational effectiveness advantage are: o Nuclear energy. o Propulsor systems that maximize propulsor efficiency
and reduce drag by minimizing the number of shafts/screws, or in the future, incorporating podded propulsors and/or low drag hull forms.
o Plant architectures matched to operational requirements.
o Large fuel tankage capacities for fossil fuel ships.
• Operational Presence, measured by time on station and low speed operations, is enhanced by energy efficient plant architectures. The most effective architectures include: o Nuclear energy. o Diesel engines and generators alone or in combined
power plants with boost gas turbine prime movers if high speed is also a requirement.
o Integrated power and propulsion systems. • Nuclear propulsion systems are technically feasible for
small and medium combatants and for amphibious ships using existing reactor designs.
• Nuclear propulsion options provide operational
advantages in surge to theater and time on station for all variants studied. Trends in ship weapons and sensors toward significantly higher power and energy demands will further highlight these advantages.
0.00.51.01.52.02.53.03.54.04.55.05.56.06.57.07.58.08.59.09.5
10.0
$25 $50 $75 $100 $125 $150 $175 $200 $225 $250 $275 $300 $325 $350
Crude Oil Cost ($/bbl)
Life
Cyc
le C
ost (
$ in
Bill
ions
)
Fossil Fuel High Op-Tempo
Fossil Fuel Medium Op-Tempot
Nuclear High Op-Tempo
Nuclear Medium Op-Tempo
Ship Service Life = 40 yearsMedium Op-Tempo = Baseline Op-Tempo +1 MCOHi h O T B li O T 2 MCO
Break Even Range: $210/BBL to $290/BBL
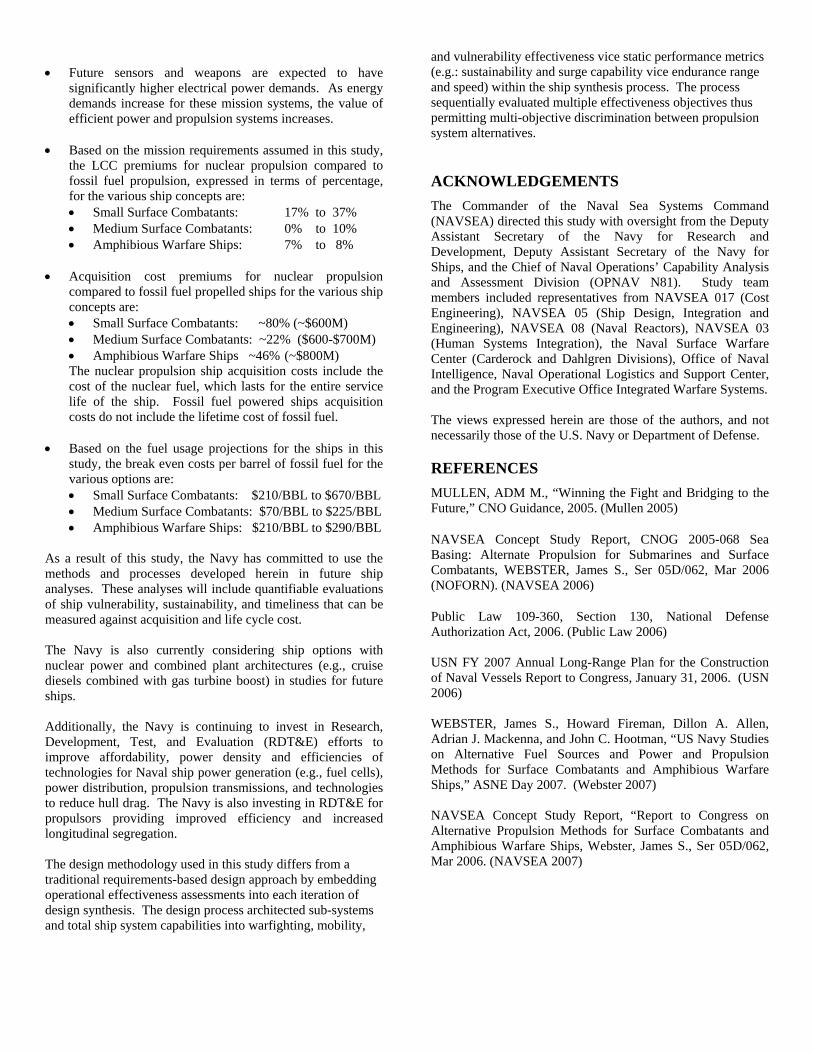
• Future sensors and weapons are expected to have
significantly higher electrical power demands. As energy demands increase for these mission systems, the value of efficient power and propulsion systems increases.
• Based on the mission requirements assumed in this study,
the LCC premiums for nuclear propulsion compared to fossil fuel propulsion, expressed in terms of percentage, for the various ship concepts are: • Small Surface Combatants: 17% to 37% • Medium Surface Combatants: 0% to 10% • Amphibious Warfare Ships: 7% to 8%
• Acquisition cost premiums for nuclear propulsion
compared to fossil fuel propelled ships for the various ship concepts are: • Small Surface Combatants: ~80% (~$600M) • Medium Surface Combatants: ~22% ($600-$700M) • Amphibious Warfare Ships ~46% (~$800M) The nuclear propulsion ship acquisition costs include the cost of the nuclear fuel, which lasts for the entire service life of the ship. Fossil fuel powered ships acquisition costs do not include the lifetime cost of fossil fuel.
• Based on the fuel usage projections for the ships in this
study, the break even costs per barrel of fossil fuel for the various options are: • Small Surface Combatants: $210/BBL to $670/BBL • Medium Surface Combatants: $70/BBL to $225/BBL • Amphibious Warfare Ships: $210/BBL to $290/BBL
As a result of this study, the Navy has committed to use the methods and processes developed herein in future ship analyses. These analyses will include quantifiable evaluations of ship vulnerability, sustainability, and timeliness that can be measured against acquisition and life cycle cost.
The Navy is also currently considering ship options with nuclear power and combined plant architectures (e.g., cruise diesels combined with gas turbine boost) in studies for future ships. Additionally, the Navy is continuing to invest in Research, Development, Test, and Evaluation (RDT&E) efforts to improve affordability, power density and efficiencies of technologies for Naval ship power generation (e.g., fuel cells), power distribution, propulsion transmissions, and technologies to reduce hull drag. The Navy is also investing in RDT&E for propulsors providing improved efficiency and increased longitudinal segregation. The design methodology used in this study differs from a traditional requirements-based design approach by embedding operational effectiveness assessments into each iteration of design synthesis. The design process architected sub-systems and total ship system capabilities into warfighting, mobility,
and vulnerability effectiveness vice static performance metrics (e.g.: sustainability and surge capability vice endurance range and speed) within the ship synthesis process. The process sequentially evaluated multiple effectiveness objectives thus permitting multi-objective discrimination between propulsion system alternatives.
ACKNOWLEDGEMENTS The Commander of the Naval Sea Systems Command (NAVSEA) directed this study with oversight from the Deputy Assistant Secretary of the Navy for Research and Development, Deputy Assistant Secretary of the Navy for Ships, and the Chief of Naval Operations’ Capability Analysis and Assessment Division (OPNAV N81). Study team members included representatives from NAVSEA 017 (Cost Engineering), NAVSEA 05 (Ship Design, Integration and Engineering), NAVSEA 08 (Naval Reactors), NAVSEA 03 (Human Systems Integration), the Naval Surface Warfare Center (Carderock and Dahlgren Divisions), Office of Naval Intelligence, Naval Operational Logistics and Support Center, and the Program Executive Office Integrated Warfare Systems. The views expressed herein are those of the authors, and not necessarily those of the U.S. Navy or Department of Defense.
REFERENCES MULLEN, ADM M., “Winning the Fight and Bridging to the Future,” CNO Guidance, 2005. (Mullen 2005)
NAVSEA Concept Study Report, CNOG 2005-068 Sea Basing: Alternate Propulsion for Submarines and Surface Combatants, WEBSTER, James S., Ser 05D/062, Mar 2006 (NOFORN). (NAVSEA 2006)
Public Law 109-360, Section 130, National Defense Authorization Act, 2006. (Public Law 2006) USN FY 2007 Annual Long-Range Plan for the Construction of Naval Vessels Report to Congress, January 31, 2006. (USN 2006) WEBSTER, James S., Howard Fireman, Dillon A. Allen, Adrian J. Mackenna, and John C. Hootman, “US Navy Studies on Alternative Fuel Sources and Power and Propulsion Methods for Surface Combatants and Amphibious Warfare Ships,” ASNE Day 2007. (Webster 2007) NAVSEA Concept Study Report, “Report to Congress on Alternative Propulsion Methods for Surface Combatants and Amphibious Warfare Ships, Webster, James S., Ser 05D/062, Mar 2006. (NAVSEA 2007)

AUTHORS’ INFORMATION SHEET James S. Webster Senior Naval Architect Naval Sea Systems Command Future Ship and Force Architecture Concepts Division, SEA 05D1 1333 Isaac Hull Ave, SE Washington Navy Yard, DC 20376 Phone: 202-781-1234 Fax: 202-781-4572 Email: [email protected] Howard Fireman Director, Future Concepts and Surface Ship Design Group Naval Sea Systems Command Future Concepts and Surface Ship Design Group, SEA 05D 1333 Isaac Hull Ave, SE Washington Navy Yard, DC 20376 Phone: 202-781-1113 Fax: 202-781-4572 Email: [email protected] Dillon A. Allen Dillon A. Allen Nuclear Power Engineer Naval Sea Systems Command Surface Ship Systems Division, Code 08J 1240 Isaac Hull Ave, SE Stop 8025 Washington Navy Yard, DC 20376 Phone: 202-781-6009 Email: [email protected] Adrian J. Mackenna Naval Architect Naval Sea Systems Command Future Ship and Force Architecture Concepts Division, SEA 05D1 1333 Isaac Hull Ave, SE Washington Navy Yard, DC 20376 Phone: 202-781-1649 Fax: 202-781-4572 Email: [email protected] John C. Hootman Naval Architect Naval Sea Systems Command Future Ship and Force Architecture Concepts Division, SEA 05D1 1333 Isaac Hull Ave, SE Washington Navy Yard, DC 20376 Phone: 202-781-4406
Fax: 202-781-4572 Email: [email protected]
AUTHORS’ BIOGRAPHIES James S. Webster Mr. James Webster is employed by Naval Sea Systems Command, in the surface ship design group, SEA 05D. He graduated from the State University of New York Maritime College with a Bachelors of Engineering in Naval Architecture in 1978. He completed his Masters in Systems Engineering at the University of Virginia in May of 2003. Mr. Webster began working with the firm Gibbs & Cox, Incorporated following graduation from SUNY Maritime College, rising to manage the Naval Architecture group in the New York office. During his 18 years at Gibbs & Cox, Incorporated, Mr. Webster lead the naval architecture group in the areas of ship hydrodynamics and loads, structural design, and weight control. Mr. Webster transferred to the Washington office of Gibbs & Cox, Inc. as the Department Manager of the Naval Architecture group and was a senior naval architect on the SC-21 program, the precursor to the DDG-1000, Zumwalt Class. Mr. Webster left private industry to lead the surface ship hydrodynamics team at Naval Sea Systems Command in 1996. There his duties included ship hydrodynamicist of the Arsenal Ship Program, the SC-21 program, and the DD-21 program. Mr. Webster performed studies and lead a team of NSWCCD hydrodynamicists in the research of tumblehome hull form ship hydrodynamic performance. Mr. Webster worked closely with the Office of Naval Research in managing the DD-21 accelerated hydrodynamics program. Mr. Webster was detailed from Naval Sea Systems Command to Code 33 of the Office of Naval Research in February 2002 as the Ship Design Manager of the X-Craft, now known as the “Sea Fighter”. Mr. Webster currently directs the study of alternate propulsion systems for the US Navy and is responsible for the development and management of the NAVSEA sponsored Warship Design Course. He has authored the definitive reports on this subject to the Chief of Naval Operations in 2005 and the Report to Congress in 2006. Howard Fireman Howard Fireman currently serves as Director, Future Concepts and Surface Ship Design Group in the Naval Sea Systems Command (NAVSEA 05D). He attended the University of Michigan and graduated with a BSE and MSE in Naval Architecture and Marine Engineering. In 1993 he earned a Masters Degree in Technical Management from Johns Hopkins University. Mr. Fireman has served as a Senior Ship Design Manager on several major ship programs. In 1994 he was reassigned as LPD 17 Acquisition Program Manager. In 1999, Mr. Fireman served as Science and Technology Advisor to COMSEVENTHFLT in Yokosuka, Japan. In 2001, he was selected as Special Assistant for Science and Technology to the Chief of Naval Operations (CNO) Executive Panel. Mr. Fireman was then selected to the Senior Executive Service as Director for In-Service Submarine Programs (NAVSEA 92B), where he remained in that capacity until his assignment as NAVSEA 05D. Mr. Fireman is a member of the Society of Naval Architects and Marine Engineers, American Society of Naval Engineers and the United States Naval Institute. In 2006, he was awarded the American Society of Naval Engineers Gold Medal. Dillon A. Allen Dillon Allen is an engineer at Naval Reactors. He holds a Bachelor of Science in Chemical Engineering from Mississippi State University (2000) and Masters of Science in Engineering Science, Mechanical Engineering (Thermal Hydraulics Focus) from the Naval Postgraduate School (2003). Since joining Naval Reactors in 2001, Dillon has primarily served as a fluid systems and ship integration engineer for VIRGINIA Class and GERALD
R. FORD Class ships. Dillon also supported Naval Reactors' regulatory affairs division. Dillon supports the Naval Sea Systems Command as a member of the US Navy Reserve, where he is an Engineering Duty Officer. Adrian J. Mackenna Adrian Mackenna is currently employed as a Naval Architect at the Naval Sea Systems Command in the Future Concepts and Surface Ship Design Group. Mr. Mackenna has earned a Bachelor degree in Ocean Engineering from the Florida Institute of Technology, and a Masters degree in Naval Architecture and Marine Engineering from the University of Michigan. Mr. Mackenna started his career in the year 2000 at the Naval Surface Warfare Center in Bethesda, Maryland as a Hydrodynamicist. In 2002 Mr. Mackenna worked on the conceptual design of the Littoral Combat Ship (LCS). In 2003 he became the Principal Naval Architect of the second LCS, the USS Independence, and served in that role until 2005. Since 2005 Mr. Mackenna has worked on fleet architecture for the Affordable Future Fleet Study and as a conceptual naval architect for the Alternate Propulsion Study. Mr. Mackenna currently lives in Washington, DC with his wife, Cara. John C. Hootman John C. Hootman is a naval architect and ship concept manager in the Naval Sea Systems Command’s Ship and Force Architecture Concepts Division (NAVEA 05D1). He holds a Bachelor of Science in Naval Architecture and Marine Engineering from Webb Institute (2001) and Masters of Science in Naval Architecture and Marine Engineering, as well as Ocean Systems Management from the Massachusetts Institute of Technology (2003). Since joining NAVSEA 05D1 in late 2005, John has primarily served as an action officer for COMNAVSEA or Congressional tasking. Principal efforts to date have included the Affordable Future Fleet (AFFS) and Alternate Propulsion (APS) Studies. John is currently a member of the Joint ASNE/SNAME Ship Design Committee, American Society of Naval Engineers, and Society of Naval Architects and Marine Engineers. He has been published in SNAME Transactions and received the 2005 ASNE Jimmie Hamilton Award. John is also an Operational Member of the McLean Volunteer Fire Department, Fairfax County, VA, where he is an Emergency Medical Technician, Ambulance Driver, and member of the Department’s Board of Directors.