Embed Size (px)
Citation preview
General rights Copyright and moral rights for the publications made accessible in the public portal are retained by the authors and/or other copyright owners and it is a condition of accessing publications that users recognise and abide by the legal requirements associated with these rights.
Users may download and print one copy of any publication from the public portal for the purpose of private study or research.
You may not further distribute the material or use it for any profit-making activity or commercial gain
You may freely distribute the URL identifying the publication in the public portal If you believe that this document breaches copyright please contact us providing details, and we will remove access to the work immediately and investigate your claim.
Downloaded from orbit.dtu.dk on: Feb 19, 2019
Planck Early Results: The thermal performance of Planck
Ade, P. A. R.; Aghanim, N.; Arnaud, M.; Ashdown, M.; Aumont, J.; Baccigalupi, C.; Baker, M.; Balbi, A.;Banday, A. J.; Barreiro, R. B.; Battaner, E.; Benabed, K.; Benoit, A.; Bernard, J. P.; Bersanelli, M.;Bhandari, P.; Bhatia, R.; Bock, J. J.; Bonaldi, A.; Bond, J. R.; Borders, J.; Borrill, J.; Bouchet, F. R.;Bowman, B.; Bradshaw, T.; Breelle, E.; Bucher, M.; Burigana, C.; Butler, R. C.; Cabella, P.; Camus, P.;Cantalupo, C. M.; Cappellini, B.; Cardoso, J. F.; Catalano, A.; Cayon, L.; Challinor, A.; Chamballu, A.;Chambelland, J. P.; Charra, J.; Charra, M.; Chiang, L. Y; Chiang, C.; Christensen, P. R.; Clements, D. L.;Collaudin, B.; Colombi, S.; Couchot, F.; Coulais, A.; Crill, B. P.; Crook, M.; Cuttaia, F.; Damasio, C.;Danese, L.; Davies, R. D.; Davis, R. J.; de Bernardis, P.; de Gasperis, G.; de Rosa, A.; Delabrouille, J.;Delouis, J. M.; Desert, F. -X.; Doerl, U.; Dolag, K.; Donzelli, S.; Dore, O.; Douspis, M.; Dupac, X.;Efstathiou, G.; Enslin, T. A.; Eriksen, H. K.; Finelli, F.; Foley, S.; Forni, O.; Fosalba, P.; Fourmond, J. J.;Frailis, M.; Franceschi, E.; Galeotta, S.; Ganga, K.; Gavila, E.; Giard, M.; Giardino, G.; Giraud-Heraud, Y.;Gonzalez-Nuevo, J.; Gorski, K. M.; Gratton, S.; Gregorio, A.; Gruppuso, A.; Guyot, G.; Harrison, D.;Helou, G.; Henrot-Versille, S.; Hernandez-Monteagudo, C.; Herranz, D.; Hildebrandt, S. R.; Hivon, E.;Hobson, M.; Holmes, W. A.; Hornstrup, Allan; Hovest, W.; Hoyland, R. J.; Huffenberger, K. M.; Israelsson,U.; Jaffe, A. H.; Jones, W. C.; Juvela, M.; Keihanen, E.; Keskitalo, R.; Kisner, T. S.; Kneissl, R.; Knox, L.;Kurki-Suonio, H.; Lagache, G.; Lamarre, J. M.; Lami, P.; Lasenby, A.; Laureijs, R. J.; Lawrence, C. R.;Leach, S.; Leonardi, R.; Leroy, C.; Lilje, P. B.; Lopez-Caniego, M.; Lubin, P. M.; Macias-Perez, J. F.;Maciaszek, T.; MacTavish, C. J.; Maffei, B.; Maino, D.; Mandolesi, N.; Mann, R.; Maris, M.; Martinez-Gonzalez, E.; Masi, S.; Matarrese, S.; Matthai, F.; Mazzotta, P.; McGehee, P.; Meinhold, P. R.; Melchiorri,A.; Melot, F.; Mendes, L.; Mennella, A.; Miville-Deschenes, M. -A.; Moneti, A.; Montier, L.; Mora, J.;Morgante, G.; Morisset, N.; Mortlock, D.; Munshi, D.; Murphy, A.; Naselsky, P.; Nash, A.; Natoli, P.;Netterfield, C. B.; Novikov, D.; Novikov, I.; O'Dwyer, I. J.; Osborne, S.; Pajot, F.; Pasian, F.; Patanchon,G.; Pearson, D.; Perdereau, O.; Perotto, L.; Perrotta, F.; Piacentini, F.; Piat, M.; Plaszczynski, S.; Platania,P.; Pointecouteau, E.; Polenta, G.; Ponthieu, N.; Poutanen, T.; Prezeau, G.; Prina, M.; Prunet, S.; Puget, J.L.; Rachen, J. P.; Rebolo, R.; Reinecke, M.; Renault, C.; Ricciardi, S.; Riller, T.; Ristorcelli, I.; Rocha, G.;Rosset, C.; Rubiino-Martin, J. A.; Rusholme, B.; Sandri, M.; Santos, D.; Schaefer, B. M.; Scott, D.;Seiffert, M. D.; Shellard, P.; Smoot, G. F.; Starck, J. -L.; Stassi, P.; Stivoli, F.; Stolyarov, V.; Stompor, R.;Sudiwala, R.; Sygnet, J. -F.; Tauber, J. A.; Terenzi, L.; Toffolatti, L.; Tomasi, M.; Torre, J. -P.; Tristram, M.;Tuovinen, J.; Valenziano, L.; Vibert, L.; Vielva, P.; Villa, F.; Vittorio, N.; Wade, L. A.; Wandelt, B. D.;Watson, C.; White, S. D. M.; Wilkinson, A.; Wilson, P.; Yvon, D.; Zacchei, A.; Zhang, B.; Zonca, A.Published in:Astronomy & Astrophysics
Publication date:2011
Document VersionPublisher's PDF, also known as Version of record
Link back to DTU Orbit

Citation (APA):Ade, P. A. R., Aghanim, N., Arnaud, M., Ashdown, M., Aumont, J., Baccigalupi, C., ... Zonca, A. (2011). PlanckEarly Results: The thermal performance of Planck. Astronomy & Astrophysics, Planck2011-1.3.
Astronomy & Astrophysics manuscript no. Planck2011-1.3 c© ESO 2011January 12, 2011
Planck Early Results: The thermal performance of PlanckPlanck Collaboration: P. A. R. Ade70, N. Aghanim43, M. Arnaud57, M. Ashdown55,75, J. Aumont43, C. Baccigalupi68, M. Baker30, A. Balbi25, A. J.
Banday47,62, R. B. Barreiro51, E. Battaner77, K. Benabed44, A. Benoıt44, J.-P. Bernard47, M. Bersanelli23,37, P. Bhandari53, R. Bhatia31, J. J.Bock53,7, A. Bonaldi33, J. R. Bond5, J. Borders53, J. Borrill61,71, F. R. Bouchet44, B. Bowman53, T. Bradshaw67, E. Breelle3, M. Bucher3, C.Burigana36, R. C. Butler36, P. Cabella25, P. Camus59, C. M. Cantalupo61, B. Cappellini37, J.-F. Cardoso58,3,44, A. Catalano3,56, L. Cayon16, A.
Challinor76,55,9, A. Chamballu41, J. P. Chambelland53, J. Charra43, M. Charra43, L.-Y Chiang48, C. Chiang15, P. R. Christensen65,26, D. L.Clements41, B. Collaudin73, S. Colombi44, F. Couchot60, A. Coulais56, B. P. Crill53,66, M. Crook67, F. Cuttaia36, C. Damasio31, L. Danese68, R. D.
Davies54, R. J. Davis54, P. de Bernardis22, G. de Gasperis25, A. de Rosa36, J. Delabrouille3, J.-M. Delouis44, F.-X. Desert46, U. Doerl62, K.Dolag62, S. Donzelli37,49, O. Dore53,7, M. Douspis43, X. Dupac29, G. Efstathiou76, T. A. Enßlin62, H. K. Eriksen49, F. Finelli36, S. Foley30, O.Forni47, P. Fosalba45, J.-J. Fourmond43, M. Frailis35, E. Franceschi36, S. Galeotta35, K. Ganga3,42, E. Gavila73, M. Giard47, G. Giardino31, Y.
Giraud-Heraud3, J. Gonzalez-Nuevo68, K. M. Gorski53,79, S. Gratton55,76, A. Gregorio24, A. Gruppuso36, G. Guyot39, D. Harrison76,55, G. Helou7,S. Henrot-Versille60, C. Hernandez-Monteagudo62, D. Herranz51, S. R. Hildebrandt7,59,50, E. Hivon44, M. Hobson75, W. A. Holmes53, A.
Hornstrup10, W. Hovest62, R. J. Hoyland50, K. M. Huffenberger78, U. Israelsson53, A. H. Jaffe41, W. C. Jones15, M. Juvela14, E. Keihanen14, R.Keskitalo53,14, T. S. Kisner61, R. Kneissl28,4, L. Knox18, H. Kurki-Suonio14,32, G. Lagache43, J.-M. Lamarre56, P. Lami43, A. Lasenby75,55, R. J.
Laureijs31, C. R. Lawrence53?, S. Leach68, R. Leonardi29,31,19, C. Leroy43,47, P. B. Lilje49,8, M. Lopez-Caniego51, P. M. Lubin19, J. F.Macıas-Perez59, T. Maciaszek6, C. J. MacTavish55, B. Maffei54, D. Maino23,37, N. Mandolesi36, R. Mann69, M. Maris35, E. Martınez-Gonzalez51,
S. Masi22, S. Matarrese21, F. Matthai62, P. Mazzotta25, P. McGehee42, P. R. Meinhold19, A. Melchiorri22, F. Melot59, L. Mendes29, A.Mennella23,35, M.-A. Miville-Deschenes43,5, A. Moneti44, L. Montier47, J. Mora53, G. Morgante36, N. Morisset40, D. Mortlock41, D. Munshi70,76,
A. Murphy64, P. Naselsky65,26, A. Nash53, P. Natoli25,2,36, C. B. Netterfield12, D. Novikov41, I. Novikov65, I. J. O’Dwyer53, S. Osborne72, F.Pajot43, F. Pasian35, G. Patanchon3, D. Pearson53, O. Perdereau60, L. Perotto59, F. Perrotta68, F. Piacentini22, M. Piat3, S. Plaszczynski60, P.Platania52, E. Pointecouteau47, G. Polenta2,34, N. Ponthieu43, T. Poutanen32,14,1, G. Prezeau7,53, M. Prina53, S. Prunet44, J.-L. Puget43, J. P.
Rachen62, R. Rebolo50,27, M. Reinecke62, C. Renault59, S. Ricciardi36, T. Riller62, I. Ristorcelli47, G. Rocha53,7, C. Rosset3, J. A.Rubino-Martın50,27, B. Rusholme42, M. Sandri36, D. Santos59, B. M. Schaefer74, D. Scott13, M. D. Seiffert53,7, P. Shellard9, G. F. Smoot17,61,3, J.-L.
Starck57, P. Stassi59, F. Stivoli38, V. Stolyarov75, R. Stompor3, R. Sudiwala70, J.-F. Sygnet44, J. A. Tauber31, L. Terenzi36, L. Toffolatti11, M.Tomasi23,37, J.-P. Torre43, M. Tristram60, J. Tuovinen63, L. Valenziano36, L. Vibert43, P. Vielva51, F. Villa36, N. Vittorio25, L. A. Wade53, B. D.
Wandelt44,20, C. Watson30, S. White62, A. Wilkinson54, P. Wilson53, D. Yvon57, A. Zacchei35, B. Zhang53, and A. Zonca19
(Affiliations can be found after the references)
Preprint online version: January 12, 2011
ABSTRACT
The performance of the Planck instruments in space is enabled by their low operating temperatures, 20 K for LFI and 0.1 K for HFI, achievedthrough a combination of passive radiative cooling and three active mechanical coolers. Active coolers were chosen to minimize straylight on thedetectors and to maximize lifetime. The scientific requirement for very broad frequency led to two detector technologies with widely differenttemperature and cooling needs. This made use of a helium cryostat, as used by previous cryogenic space missions (IRAS, COBE, ISO, SPITZER,AKARI), infeasible. Radiative cooling is provided by three V-groove radiators and a large telescope baffle. The active coolers are a hydrogensorption cooler (< 20 K), a 4He Joule-Thomson cooler (4.7 K), and a 3He-4He dilution cooler (1.4 K and 0.1 K). The flight system was at ambienttemperature at launch and cooled in space to operating conditions. The bolometer plate of the High Frequency Instrument reached 93 mK on 3July 2009, 50 days after launch. The solar panel always faces the Sun, shadowing the rest of Planck, and operates at a mean temperature of 384 K.At the other end of the spacecraft, the telescope baffle operates at 42.3 K and the telescope primary mirror operates at 35.9 K. The temperaturesof key parts of the instruments are stabilized by both active and passive methods. Temperature fluctuations are driven by changes in the distancefrom the Sun, sorption cooler cycling and fluctuations in gas-liquid flow, and fluctuations in cosmic ray flux on the dilution and bolometer plates.These fluctuations do not compromise the science data.
Key words. Cosmology – Cosmic microwave background – Space instrumentation – Instrument design and calibration
1. Introduction
Planck1 (Tauber et al. 2010; Planck Collaboration 2011a) is thethird generation space mission to measure the anisotropy of the
? Corresponding author: C. R. Lawrence <[email protected]>
1 Planck (http://www.esa.int/Planck) is a project of theEuropean Space Agency (ESA) with instruments provided by two sci-entific consortia funded by ESA member states (in particular the leadcountries France and Italy), with contributions from NASA (USA) and
cosmic microwave background (CMB). It observes the sky innine frequency bands covering 30–857 GHz with high sensitiv-ity and angular resolution from 31′ to 5′. The Low FrequencyInstrument (LFI; Mandolesi et al. 2010; Bersanelli et al. 2010;Mennella et al. 2011) covers the 30, 44, and 70 GHz bandswith amplifiers cooled to 20 K. The High Frequency Instrument(HFI; Lamarre et al. 2010; Planck HFI Core Team 2011a) coversthe 100, 143, 217, 353, 545, and 857 GHz bands with bolome-
telescope reflectors provided by a collaboration between ESA and a sci-entific consortium led and funded by Denmark.
arX
iv:1
101.
2023
v1 [
astr
o-ph
.IM
] 1
1 Ja
n 20
11
2 Planck Collaboration: The thermal performance of Planck
ters cooled to 0.1 K. Polarization is measured in all but thehighest two bands (Leahy et al. 2010; Rosset et al. 2010). Acombination of radiative cooling and three mechanical cool-ers produces the temperatures needed for the detectors and op-tics (Planck Collaboration 2011b). Two data processing centres(DPCs) check and calibrate the data and make maps of the sky(Planck HFI Core Team 2011b; Zacchei et al. 2011). Planck’ssensitivity, angular resolution, and frequency coverage make it apowerful instrument for galactic and extragalactic astrophysicsas well as cosmology. Early astrophysics results are given inPlanck Collaboration, 2011h–z.
The unprecedented performance of the Planck instrumentsin space is enabled by their low operating temperatures, 20 K forLFI and 0.1 K for HFI, achieved through a combination of pas-sive radiative cooling and three active coolers. This architectureis unlike that of the previous CMB space missions, the CosmicBackground Explorer (COBE) (Boggess et al. 1992) and theWilkinson Microwave Anisotropy Probe (WMAP)(Bennett et al.2003). WMAP relied on passive radiative cooling alone which,while simpler, resulted in a higher operating temperature for itsamplifiers and a higher noise temperature. Additionally, purelypassive cooling is unable to reach the sub-kelvin operating tem-peratures required by HFI’s high-sensitivity bolometers. By con-trast, COBE used a liquid helium cryostat to enable cooling ofthe bolometers on its Far-Infrared Absolute spectrophotometer(FIRAS) instrument (Mather et al. 1990) to 1.5 K. This approachwas not adopted for Planck as it would restrict the on-orbit life-time for the HFI, require additional coolers to reach sub-Kelvintemperatures, and be entirely infeasible for cooling the activeheat load from the LFI.
The thermal architecture for a CMB mission is critical to itssuccess, as is its implementation and performance. In this paperwe describe the design and in-flight performance of the mission-enabling Planck thermal system.
2. Thermal Design
2.1. Overview and philosophy
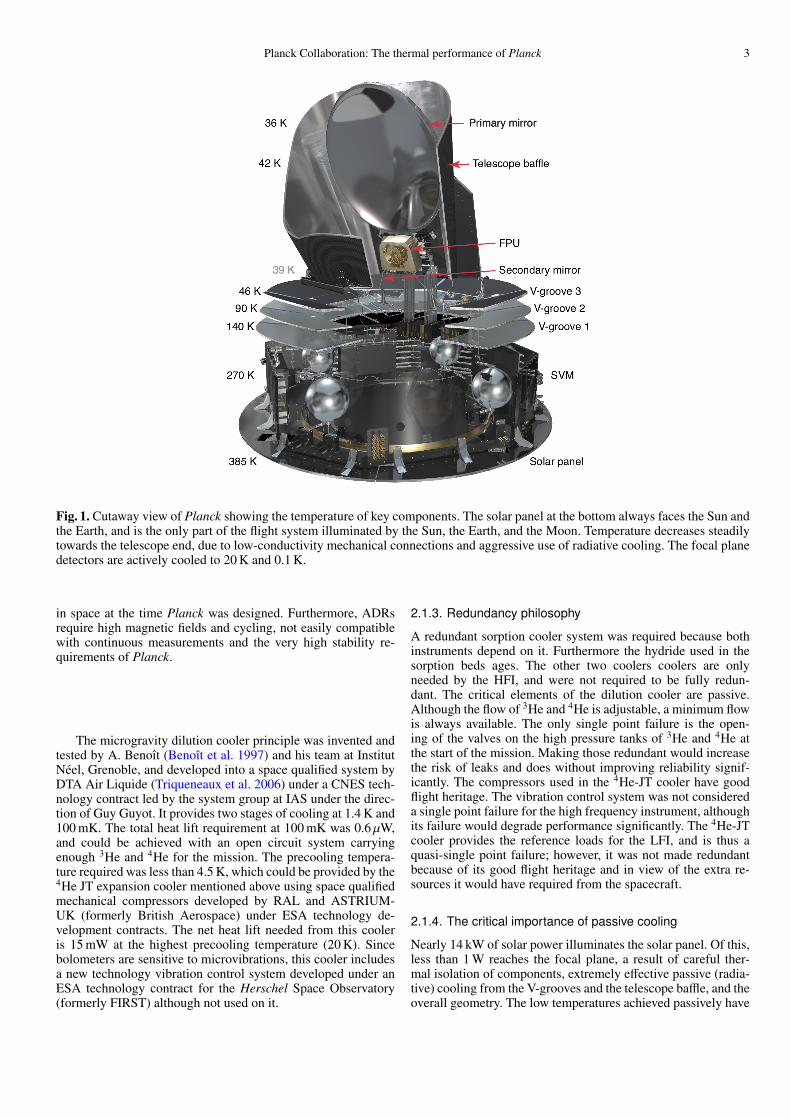
The overall thermal design of Planck can be understood fromFig. 1. The solar panel always faces the Sun and the Earth, theonly two significant sources of heat in the sky, and operates at385 K. The service vehicle module (SVM), containing all theusual electronic components of a spacecraft, operates at roomtemperature. The telescope at the opposite end of the flight sys-tem operates below 40 K. The detectors at the focus of the tele-scope are actively cooled to 20 K (amplifiers) or 0.1 K (bolome-ters). Between the SVM and the “cold end,” aggressive mea-sures are taken to minimize heat conduction and to maximizethe radiation of heat to cold space. These measures include low-conductivity support elements, three V-groove radiators, and atelescope baffle with low emissivity inside and high emissivityoutside.
2.1.1. Mission design, scientific requirements, and thermalarchitecture
Planck is designed to extract all information in the tempera-ture anisotropies of the CMB down to angular scales of 5′, andto provide a major advance in the measurement of polarizationanisotropies. This requires both extremely low noise and broadfrequency coverage from a few tens to several hundred gigahertzto separate foreground sources of radiation from the CMB. Thenecessary noise level can be reached only with cryogenically-
cooled detectors. The lowest noise is achieved with amplifierscooled to ≤ 20 K and bolometers cooled to ∼ 0.1 K. Temperaturefluctuations must not compromise the sensitivity. Additional re-quirements on Planck that affect the thermal design include:1) no deployables (e.g., a shield that could block the Sun overa large solid angle); 2) no optical elements such as windowsbetween the feed horns and telescope; 3) no cryostat or storedcryogens; 4) an off-axis telescope below 60 K; 5) feed horns forthe bolometers below 5 K, and a bolometer environment below2 K; and 6) reference targets (loads) for the pseudo-correlationamplifier radiometers below 5 K to minimize 1/ f noise.
These requirements led to a design that includes the follow-ing.
– The general architecture shown in Fig. 1, with the solar panelacting as a Sun shield, and temperature decreasing along thespin axis toward the cold end with a passively cooled tele-scope.
– Detectors based on amplifiers at 30, 44, and 70 GHz, and onbolometers at 100, 143, 217, 353, 545, and 857 GHz.
– Three active coolers.1. The “sorption cooler” (Fig. 2), a closed-cycle sorption
cooler using hydrogen as the working fluid with a Joule-Thomson (JT) expansion, which produces temperaturesbelow 20 K. The sorption cooler cools the LFI focalplane to < 20 K and provides precooling to lower tem-perature stages.
2. The “4He-JT cooler” (Fig. 3), a closed-cycle cooler usinga Stirling cycle compressor and 4He as the working fluidwith a JT expansion, which produces temperatures below5 K. The 4He-JT cooler cools the structure hosting theHFI focal plane and the LFI reference loads to < 5 K andprovides precooling to the dilution cooler.
3. The “dilution cooler” (Fig. 4), a 3He-4He dilution coolerthat vents combined 3He and 4He to space, and whichproduces temperatures of 1.4 K through JT expansion ofthe 3He and 4He, and ∼ 0.1 K for the bolometers.
– A “warm launch” scenario, in which the entire flight systemis at ambient temperature for launch, and the detectors arecooled in space by a combination of passive and active cool-ing.
2.1.2. Requirements on the coolers
The coolers were required to deliver temperatures of < 20 K,< 5 K, and 0.1 K, continuously. Although use of proven technol-ogy is preferred in space missions, the special requirements ofPlanck led to the choice of two new-technology coolers. The firstis a hydrogen sorption cooler developed by the Jet PropulsionLaboratory in California, which provides a large heat lift withno mechanical compressors (avoiding vibration). The sorptioncooler requires precooling of the hydrogen to ≤ 60 K. The pre-cooling temperature required by the 4He-JT cooler, which is sup-plied by the sorption cooler, is ≤ 20 K. This interface tempera-ture is critical in the cooling chain: the 4He-JT cooler heat loadincreases with the interface temperature when, at the same time,its heat lift decreases. Thus the goal for the precool temperaturesupplied by the sorption cooler was 18 K, with a strict require-ment of ≤ 19.5 K to leave enough margin to the cooling chain.
The second new-technology cooler is a 3He-4He dilu-tion cooler. In the laboratory, temperatures of 100 mK canbe achieved with both adiabatic demagnetization refrigerators(ADR) and dilution refrigerators. Space qualified ADRs weredeveloped in the 1980s, but none had been used successfully
Planck Collaboration: The thermal performance of Planck 3
Fig. 1. Cutaway view of Planck showing the temperature of key components. The solar panel at the bottom always faces the Sun andthe Earth, and is the only part of the flight system illuminated by the Sun, the Earth, and the Moon. Temperature decreases steadilytowards the telescope end, due to low-conductivity mechanical connections and aggressive use of radiative cooling. The focal planedetectors are actively cooled to 20 K and 0.1 K.
in space at the time Planck was designed. Furthermore, ADRsrequire high magnetic fields and cycling, not easily compatiblewith continuous measurements and the very high stability re-quirements of Planck.
The microgravity dilution cooler principle was invented andtested by A. Benoıt (Benoıt et al. 1997) and his team at InstitutNeel, Grenoble, and developed into a space qualified system byDTA Air Liquide (Triqueneaux et al. 2006) under a CNES tech-nology contract led by the system group at IAS under the direc-tion of Guy Guyot. It provides two stages of cooling at 1.4 K and100 mK. The total heat lift requirement at 100 mK was 0.6 µW,and could be achieved with an open circuit system carryingenough 3He and 4He for the mission. The precooling tempera-ture required was less than 4.5 K, which could be provided by the4He JT expansion cooler mentioned above using space qualifiedmechanical compressors developed by RAL and ASTRIUM-UK (formerly British Aerospace) under ESA technology de-velopment contracts. The net heat lift needed from this cooleris 15 mW at the highest precooling temperature (20 K). Sincebolometers are sensitive to microvibrations, this cooler includesa new technology vibration control system developed under anESA technology contract for the Herschel Space Observatory(formerly FIRST) although not used on it.
2.1.3. Redundancy philosophy
A redundant sorption cooler system was required because bothinstruments depend on it. Furthermore the hydride used in thesorption beds ages. The other two coolers coolers are onlyneeded by the HFI, and were not required to be fully redun-dant. The critical elements of the dilution cooler are passive.Although the flow of 3He and 4He is adjustable, a minimum flowis always available. The only single point failure is the open-ing of the valves on the high pressure tanks of 3He and 4He atthe start of the mission. Making those redundant would increasethe risk of leaks and does without improving reliability signif-icantly. The compressors used in the 4He-JT cooler have goodflight heritage. The vibration control system was not considereda single point failure for the high frequency instrument, althoughits failure would degrade performance significantly. The 4He-JTcooler provides the reference loads for the LFI, and is thus aquasi-single point failure; however, it was not made redundantbecause of its good flight heritage and in view of the extra re-sources it would have required from the spacecraft.
2.1.4. The critical importance of passive cooling
Nearly 14 kW of solar power illuminates the solar panel. Of this,less than 1 W reaches the focal plane, a result of careful ther-mal isolation of components, extremely effective passive (radia-tive) cooling from the V-grooves and the telescope baffle, and theoverall geometry. The low temperatures achieved passively have
4 Planck Collaboration: The thermal performance of Planck
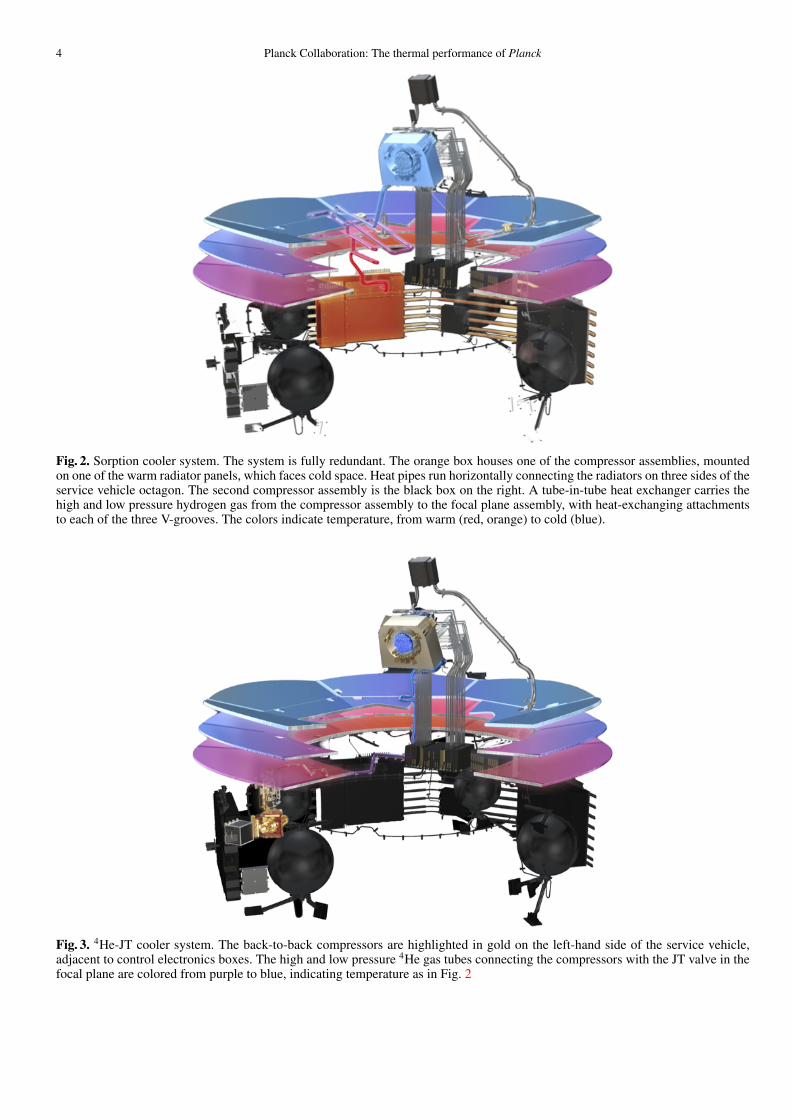
Fig. 2. Sorption cooler system. The system is fully redundant. The orange box houses one of the compressor assemblies, mountedon one of the warm radiator panels, which faces cold space. Heat pipes run horizontally connecting the radiators on three sides of theservice vehicle octagon. The second compressor assembly is the black box on the right. A tube-in-tube heat exchanger carries thehigh and low pressure hydrogen gas from the compressor assembly to the focal plane assembly, with heat-exchanging attachmentsto each of the three V-grooves. The colors indicate temperature, from warm (red, orange) to cold (blue).
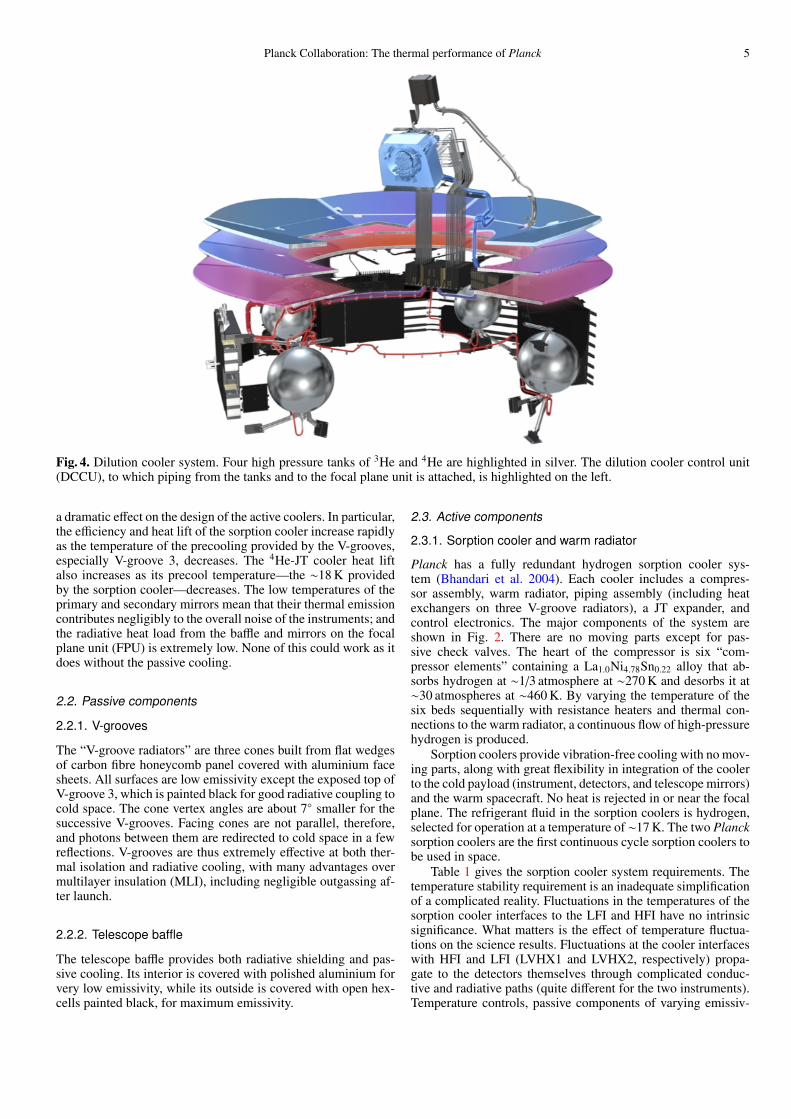
Fig. 3. 4He-JT cooler system. The back-to-back compressors are highlighted in gold on the left-hand side of the service vehicle,adjacent to control electronics boxes. The high and low pressure 4He gas tubes connecting the compressors with the JT valve in thefocal plane are colored from purple to blue, indicating temperature as in Fig. 2
Planck Collaboration: The thermal performance of Planck 5
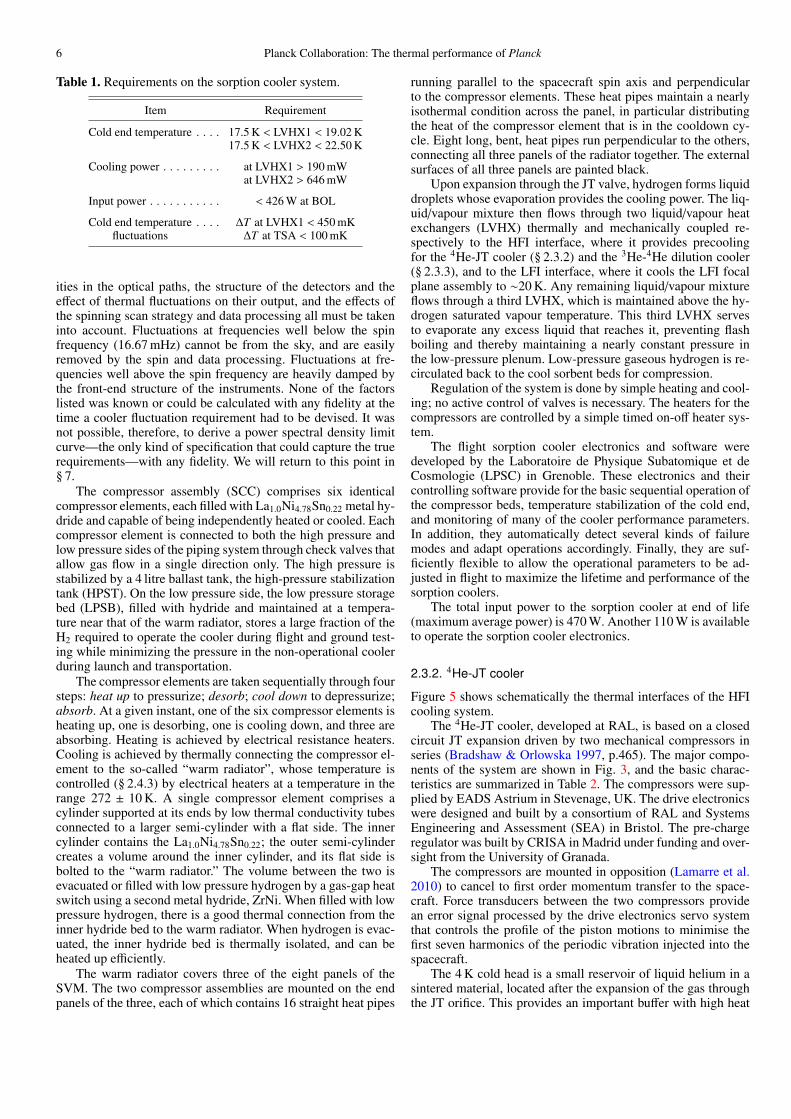
Fig. 4. Dilution cooler system. Four high pressure tanks of 3He and 4He are highlighted in silver. The dilution cooler control unit(DCCU), to which piping from the tanks and to the focal plane unit is attached, is highlighted on the left.
a dramatic effect on the design of the active coolers. In particular,the efficiency and heat lift of the sorption cooler increase rapidlyas the temperature of the precooling provided by the V-grooves,especially V-groove 3, decreases. The 4He-JT cooler heat liftalso increases as its precool temperature—the ∼18 K providedby the sorption cooler—decreases. The low temperatures of theprimary and secondary mirrors mean that their thermal emissioncontributes negligibly to the overall noise of the instruments; andthe radiative heat load from the baffle and mirrors on the focalplane unit (FPU) is extremely low. None of this could work as itdoes without the passive cooling.
2.2. Passive components
2.2.1. V-grooves
The “V-groove radiators” are three cones built from flat wedgesof carbon fibre honeycomb panel covered with aluminium facesheets. All surfaces are low emissivity except the exposed top ofV-groove 3, which is painted black for good radiative coupling tocold space. The cone vertex angles are about 7◦ smaller for thesuccessive V-grooves. Facing cones are not parallel, therefore,and photons between them are redirected to cold space in a fewreflections. V-grooves are thus extremely effective at both ther-mal isolation and radiative cooling, with many advantages overmultilayer insulation (MLI), including negligible outgassing af-ter launch.
2.2.2. Telescope baffle
The telescope baffle provides both radiative shielding and pas-sive cooling. Its interior is covered with polished aluminium forvery low emissivity, while its outside is covered with open hex-cells painted black, for maximum emissivity.
2.3. Active components
2.3.1. Sorption cooler and warm radiator
Planck has a fully redundant hydrogen sorption cooler sys-tem (Bhandari et al. 2004). Each cooler includes a compres-sor assembly, warm radiator, piping assembly (including heatexchangers on three V-groove radiators), a JT expander, andcontrol electronics. The major components of the system areshown in Fig. 2. There are no moving parts except for pas-sive check valves. The heart of the compressor is six “com-pressor elements” containing a La1.0Ni4.78Sn0.22 alloy that ab-sorbs hydrogen at ∼1/3 atmosphere at ∼270 K and desorbs it at∼30 atmospheres at ∼460 K. By varying the temperature of thesix beds sequentially with resistance heaters and thermal con-nections to the warm radiator, a continuous flow of high-pressurehydrogen is produced.
Sorption coolers provide vibration-free cooling with no mov-ing parts, along with great flexibility in integration of the coolerto the cold payload (instrument, detectors, and telescope mirrors)and the warm spacecraft. No heat is rejected in or near the focalplane. The refrigerant fluid in the sorption coolers is hydrogen,selected for operation at a temperature of ∼17 K. The two Plancksorption coolers are the first continuous cycle sorption coolers tobe used in space.
Table 1 gives the sorption cooler system requirements. Thetemperature stability requirement is an inadequate simplificationof a complicated reality. Fluctuations in the temperatures of thesorption cooler interfaces to the LFI and HFI have no intrinsicsignificance. What matters is the effect of temperature fluctua-tions on the science results. Fluctuations at the cooler interfaceswith HFI and LFI (LVHX1 and LVHX2, respectively) propa-gate to the detectors themselves through complicated conduc-tive and radiative paths (quite different for the two instruments).Temperature controls, passive components of varying emissiv-
6 Planck Collaboration: The thermal performance of Planck
Table 1. Requirements on the sorption cooler system.
Item Requirement
Cold end temperature . . . . 17.5 K < LVHX1 < 19.02 K17.5 K < LVHX2 < 22.50 K
Cooling power . . . . . . . . . at LVHX1 > 190 mWat LVHX2 > 646 mW
Input power . . . . . . . . . . . < 426 W at BOL
Cold end temperature . . . . ∆T at LVHX1 < 450 mKfluctuations ∆T at TSA < 100 mK
ities in the optical paths, the structure of the detectors and theeffect of thermal fluctuations on their output, and the effects ofthe spinning scan strategy and data processing all must be takeninto account. Fluctuations at frequencies well below the spinfrequency (16.67 mHz) cannot be from the sky, and are easilyremoved by the spin and data processing. Fluctuations at fre-quencies well above the spin frequency are heavily damped bythe front-end structure of the instruments. None of the factorslisted was known or could be calculated with any fidelity at thetime a cooler fluctuation requirement had to be devised. It wasnot possible, therefore, to derive a power spectral density limitcurve—the only kind of specification that could capture the truerequirements—with any fidelity. We will return to this point in§ 7.
The compressor assembly (SCC) comprises six identicalcompressor elements, each filled with La1.0Ni4.78Sn0.22 metal hy-dride and capable of being independently heated or cooled. Eachcompressor element is connected to both the high pressure andlow pressure sides of the piping system through check valves thatallow gas flow in a single direction only. The high pressure isstabilized by a 4 litre ballast tank, the high-pressure stabilizationtank (HPST). On the low pressure side, the low pressure storagebed (LPSB), filled with hydride and maintained at a tempera-ture near that of the warm radiator, stores a large fraction of theH2 required to operate the cooler during flight and ground test-ing while minimizing the pressure in the non-operational coolerduring launch and transportation.
The compressor elements are taken sequentially through foursteps: heat up to pressurize; desorb; cool down to depressurize;absorb. At a given instant, one of the six compressor elements isheating up, one is desorbing, one is cooling down, and three areabsorbing. Heating is achieved by electrical resistance heaters.Cooling is achieved by thermally connecting the compressor el-ement to the so-called “warm radiator”, whose temperature iscontrolled (§ 2.4.3) by electrical heaters at a temperature in therange 272 ± 10 K. A single compressor element comprises acylinder supported at its ends by low thermal conductivity tubesconnected to a larger semi-cylinder with a flat side. The innercylinder contains the La1.0Ni4.78Sn0.22; the outer semi-cylindercreates a volume around the inner cylinder, and its flat side isbolted to the “warm radiator.” The volume between the two isevacuated or filled with low pressure hydrogen by a gas-gap heatswitch using a second metal hydride, ZrNi. When filled with lowpressure hydrogen, there is a good thermal connection from theinner hydride bed to the warm radiator. When hydrogen is evac-uated, the inner hydride bed is thermally isolated, and can beheated up efficiently.
The warm radiator covers three of the eight panels of theSVM. The two compressor assemblies are mounted on the endpanels of the three, each of which contains 16 straight heat pipes
running parallel to the spacecraft spin axis and perpendicularto the compressor elements. These heat pipes maintain a nearlyisothermal condition across the panel, in particular distributingthe heat of the compressor element that is in the cooldown cy-cle. Eight long, bent, heat pipes run perpendicular to the others,connecting all three panels of the radiator together. The externalsurfaces of all three panels are painted black.
Upon expansion through the JT valve, hydrogen forms liquiddroplets whose evaporation provides the cooling power. The liq-uid/vapour mixture then flows through two liquid/vapour heatexchangers (LVHX) thermally and mechanically coupled re-spectively to the HFI interface, where it provides precoolingfor the 4He-JT cooler (§ 2.3.2) and the 3He-4He dilution cooler(§ 2.3.3), and to the LFI interface, where it cools the LFI focalplane assembly to ∼20 K. Any remaining liquid/vapour mixtureflows through a third LVHX, which is maintained above the hy-drogen saturated vapour temperature. This third LVHX servesto evaporate any excess liquid that reaches it, preventing flashboiling and thereby maintaining a nearly constant pressure inthe low-pressure plenum. Low-pressure gaseous hydrogen is re-circulated back to the cool sorbent beds for compression.
Regulation of the system is done by simple heating and cool-ing; no active control of valves is necessary. The heaters for thecompressors are controlled by a simple timed on-off heater sys-tem.
The flight sorption cooler electronics and software weredeveloped by the Laboratoire de Physique Subatomique et deCosmologie (LPSC) in Grenoble. These electronics and theircontrolling software provide for the basic sequential operation ofthe compressor beds, temperature stabilization of the cold end,and monitoring of many of the cooler performance parameters.In addition, they automatically detect several kinds of failuremodes and adapt operations accordingly. Finally, they are suf-ficiently flexible to allow the operational parameters to be ad-justed in flight to maximize the lifetime and performance of thesorption coolers.
The total input power to the sorption cooler at end of life(maximum average power) is 470 W. Another 110 W is availableto operate the sorption cooler electronics.
2.3.2. 4He-JT cooler
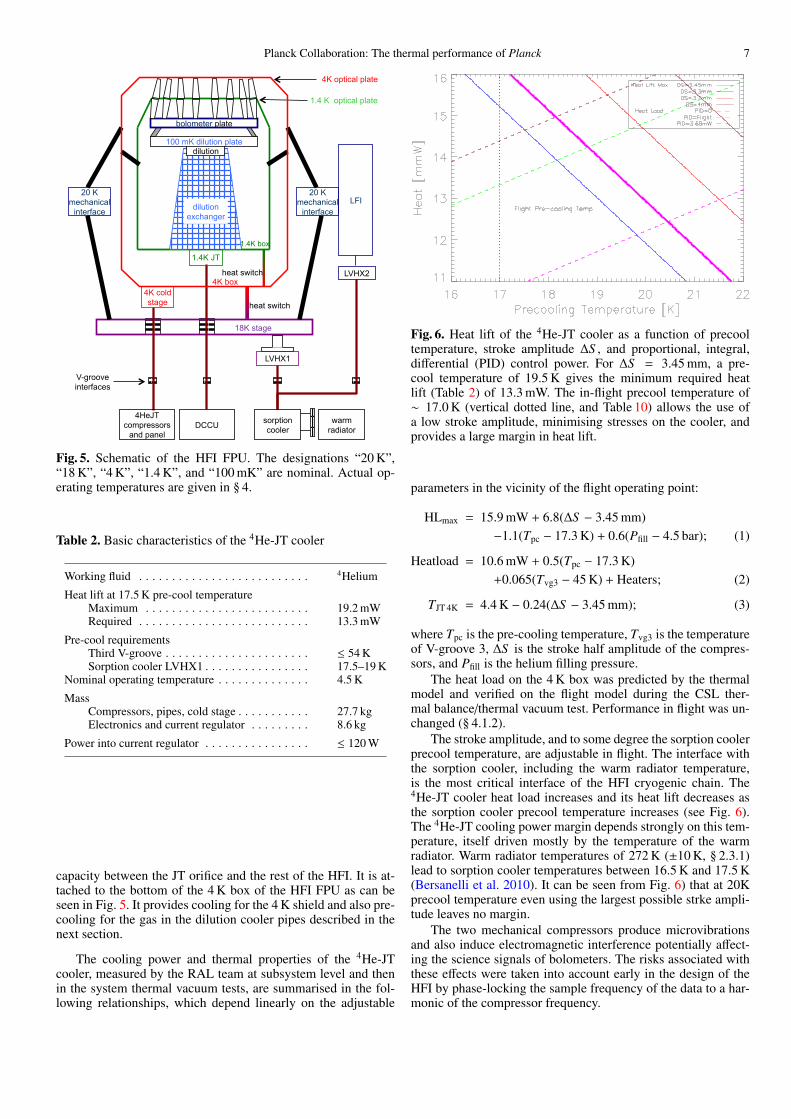
Figure 5 shows schematically the thermal interfaces of the HFIcooling system.
The 4He-JT cooler, developed at RAL, is based on a closedcircuit JT expansion driven by two mechanical compressors inseries (Bradshaw & Orlowska 1997, p.465). The major compo-nents of the system are shown in Fig. 3, and the basic charac-teristics are summarized in Table 2. The compressors were sup-plied by EADS Astrium in Stevenage, UK. The drive electronicswere designed and built by a consortium of RAL and SystemsEngineering and Assessment (SEA) in Bristol. The pre-chargeregulator was built by CRISA in Madrid under funding and over-sight from the University of Granada.
The compressors are mounted in opposition (Lamarre et al.2010) to cancel to first order momentum transfer to the space-craft. Force transducers between the two compressors providean error signal processed by the drive electronics servo systemthat controls the profile of the piston motions to minimise thefirst seven harmonics of the periodic vibration injected into thespacecraft.
The 4 K cold head is a small reservoir of liquid helium in asintered material, located after the expansion of the gas throughthe JT orifice. This provides an important buffer with high heat
Planck Collaboration: The thermal performance of Planck 7
DCCU
dilution 100 mK dilution plate
bolometer plate
4K box
1.4K box
dilution exchanger
LFI
LVHX2
1.4K JT
LVHX1
heat switch
heat switch
4K optical plate
1.4 K optical plate
20 K mechanical
interface
20 K mechanical
interface
4HeJT compressors
and panel
sorption cooler
warm radiator
18K stage
V-groove interfaces
4K cold stage
Fig. 5. Schematic of the HFI FPU. The designations “20 K”,“18 K”, “4 K”, “1.4 K”, and “100 mK” are nominal. Actual op-erating temperatures are given in § 4.
Table 2. Basic characteristics of the 4He-JT cooler
Working fluid . . . . . . . . . . . . . . . . . . . . . . . . . . 4Helium
Heat lift at 17.5 K pre-cool temperatureMaximum . . . . . . . . . . . . . . . . . . . . . . . . . 19.2 mWRequired . . . . . . . . . . . . . . . . . . . . . . . . . . 13.3 mW
Pre-cool requirementsThird V-groove . . . . . . . . . . . . . . . . . . . . . . ≤ 54 KSorption cooler LVHX1 . . . . . . . . . . . . . . . . 17.5–19 K
Nominal operating temperature . . . . . . . . . . . . . . 4.5 K
MassCompressors, pipes, cold stage . . . . . . . . . . . 27.7 kgElectronics and current regulator . . . . . . . . . 8.6 kg
Power into current regulator . . . . . . . . . . . . . . . . ≤ 120 W
capacity between the JT orifice and the rest of the HFI. It is at-tached to the bottom of the 4 K box of the HFI FPU as can beseen in Fig. 5. It provides cooling for the 4 K shield and also pre-cooling for the gas in the dilution cooler pipes described in thenext section.
The cooling power and thermal properties of the 4He-JTcooler, measured by the RAL team at subsystem level and thenin the system thermal vacuum tests, are summarised in the fol-lowing relationships, which depend linearly on the adjustable
Fig. 6. Heat lift of the 4He-JT cooler as a function of precooltemperature, stroke amplitude ∆S , and proportional, integral,differential (PID) control power. For ∆S = 3.45 mm, a pre-cool temperature of 19.5 K gives the minimum required heatlift (Table 2) of 13.3 mW. The in-flight precool temperature of∼ 17.0 K (vertical dotted line, and Table 10) allows the use ofa low stroke amplitude, minimising stresses on the cooler, andprovides a large margin in heat lift.
parameters in the vicinity of the flight operating point:
HLmax = 15.9 mW + 6.8(∆S − 3.45 mm)−1.1(Tpc − 17.3 K) + 0.6(Pfill − 4.5 bar); (1)
Heatload = 10.6 mW + 0.5(Tpc − 17.3 K)+0.065(Tvg3 − 45 K) + Heaters; (2)
TJT 4K = 4.4 K − 0.24(∆S − 3.45 mm); (3)
where Tpc is the pre-cooling temperature, Tvg3 is the temperatureof V-groove 3, ∆S is the stroke half amplitude of the compres-sors, and Pfill is the helium filling pressure.
The heat load on the 4 K box was predicted by the thermalmodel and verified on the flight model during the CSL ther-mal balance/thermal vacuum test. Performance in flight was un-changed (§ 4.1.2).
The stroke amplitude, and to some degree the sorption coolerprecool temperature, are adjustable in flight. The interface withthe sorption cooler, including the warm radiator temperature,is the most critical interface of the HFI cryogenic chain. The4He-JT cooler heat load increases and its heat lift decreases asthe sorption cooler precool temperature increases (see Fig. 6).The 4He-JT cooling power margin depends strongly on this tem-perature, itself driven mostly by the temperature of the warmradiator. Warm radiator temperatures of 272 K (±10 K, § 2.3.1)lead to sorption cooler temperatures between 16.5 K and 17.5 K(Bersanelli et al. 2010). It can be seen from Fig. 6) that at 20Kprecool temperature even using the largest possible strke ampli-tude leaves no margin.
The two mechanical compressors produce microvibrationsand also induce electromagnetic interference potentially affect-ing the science signals of bolometers. The risks associated withthese effects were taken into account early in the design of theHFI by phase-locking the sample frequency of the data to a har-monic of the compressor frequency.
8 Planck Collaboration: The thermal performance of Planck
Table 3. Helium flow.
4He 4He + 3He 3HeFlow Level [µmol s−1] [µmol s−1] [µmol s−1]
FMIN2 . . . . . . . . 14.5 19.8 5.4FMIN . . . . . . . . . 16.6 22.9 6.3FNOM1 . . . . . . . 20.3 27.8 7.5FNOM2 . . . . . . . 22.6 30.8 8.2
2.3.3. Dilution cooler
The dilution cooler operates on an open circuit using a largequantity of 4He and 3He stored in four high pressure tanks. Themajor components of the system are shown in Fig. 4, includinga JT expansion valve producing cooling power for the “1.4 Kstage” of the FPU and pre-cooling for the dilution cooler. Thegas from the tanks (300 bar at the start of the mission) is reducedto 19 bar through two pressure regulators, and the flow throughthe dilution circuits is regulated by a set of discrete restrictionschosen by telecommand. The flow rates for different configura-tions of the restrictions are given in Table 3 for the hot spacecraftcase. The flows depends on the restriction temperature throughchanges of the helium viscosity.
The heat lift margin HLmargin (available for temperature reg-ulation) is determined by:
– Heflow, the flow rate of the helium isotopes in µmol s−1 givenby the chosen restriction configuration; for each restrictionthe flow is expressed when the temperature of the dilutioncooler control unit (DCCU) is at 273 K.
– TDCCU, the temperature of the DCCU in flight– the heat loads from the bolometer plate, determined by the
temperature difference between Tbolo and Tdilu, and from the1.4 K stage at a temperature of T1.4K.
– Tdilu, the temperature of the dilution cold end
This margin is given by:
HLmargin [nW] = 3.2 × 10⁻³ × Heflow[µmol s−1]
× T 2dilu
(TDCCU
273− 1)1.5
− 250 (T1.4K − 1.28)− 20 (Tbolo − Tdilu)− 490 (4)
where the last three lines are, respectively, the heat loads fromthe 1.4 K stage, the bolometer plate, and fixed conduction para-sitics, all in nanowatts.
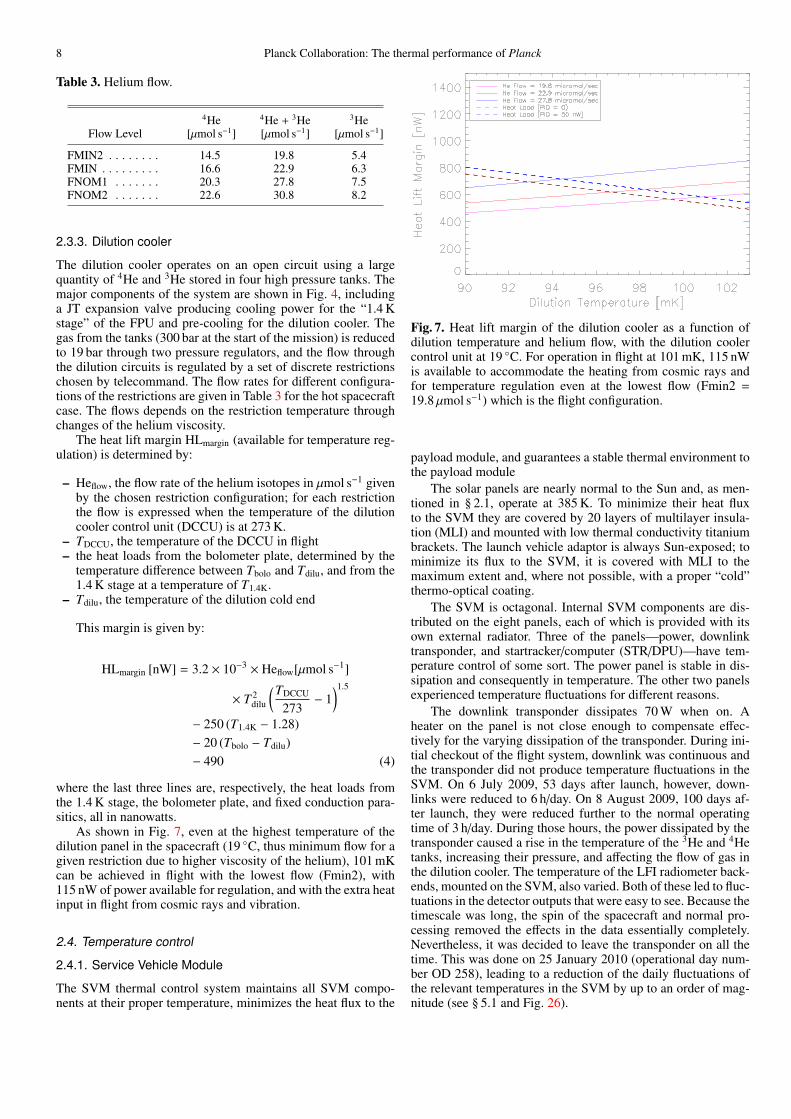
As shown in Fig. 7, even at the highest temperature of thedilution panel in the spacecraft (19 ◦C, thus minimum flow for agiven restriction due to higher viscosity of the helium), 101 mKcan be achieved in flight with the lowest flow (Fmin2), with115 nW of power available for regulation, and with the extra heatinput in flight from cosmic rays and vibration.
2.4. Temperature control
2.4.1. Service Vehicle Module
The SVM thermal control system maintains all SVM compo-nents at their proper temperature, minimizes the heat flux to the
Fig. 7. Heat lift margin of the dilution cooler as a function ofdilution temperature and helium flow, with the dilution coolercontrol unit at 19 ◦C. For operation in flight at 101 mK, 115 nWis available to accommodate the heating from cosmic rays andfor temperature regulation even at the lowest flow (Fmin2 =19.8 µmol s−1) which is the flight configuration.
payload module, and guarantees a stable thermal environment tothe payload module
The solar panels are nearly normal to the Sun and, as men-tioned in § 2.1, operate at 385 K. To minimize their heat fluxto the SVM they are covered by 20 layers of multilayer insula-tion (MLI) and mounted with low thermal conductivity titaniumbrackets. The launch vehicle adaptor is always Sun-exposed; tominimize its flux to the SVM, it is covered with MLI to themaximum extent and, where not possible, with a proper “cold”thermo-optical coating.
The SVM is octagonal. Internal SVM components are dis-tributed on the eight panels, each of which is provided with itsown external radiator. Three of the panels—power, downlinktransponder, and startracker/computer (STR/DPU)—have tem-perature control of some sort. The power panel is stable in dis-sipation and consequently in temperature. The other two panelsexperienced temperature fluctuations for different reasons.
The downlink transponder dissipates 70 W when on. Aheater on the panel is not close enough to compensate effec-tively for the varying dissipation of the transponder. During ini-tial checkout of the flight system, downlink was continuous andthe transponder did not produce temperature fluctuations in theSVM. On 6 July 2009, 53 days after launch, however, down-links were reduced to 6 h/day. On 8 August 2009, 100 days af-ter launch, they were reduced further to the normal operatingtime of 3 h/day. During those hours, the power dissipated by thetransponder caused a rise in the temperature of the 3He and 4Hetanks, increasing their pressure, and affecting the flow of gas inthe dilution cooler. The temperature of the LFI radiometer back-ends, mounted on the SVM, also varied. Both of these led to fluc-tuations in the detector outputs that were easy to see. Because thetimescale was long, the spin of the spacecraft and normal pro-cessing removed the effects in the data essentially completely.Nevertheless, it was decided to leave the transponder on all thetime. This was done on 25 January 2010 (operational day num-ber OD 258), leading to a reduction of the daily fluctuations ofthe relevant temperatures in the SVM by up to an order of mag-nitude (see § 5.1 and Fig. 26).
Planck Collaboration: The thermal performance of Planck 9
Another three panels are dedicated to the sorption coolers(§ 2.3.1). The sorption cooler compressor elements have inter-mittent high dissipation. To minimize the impact on the rest ofSVM, the sorption cooler cavity is internally wrapped by MLI.To maintain the sorption coolers above their minimum temper-ature limits (253 K non-operating and 260 K operating), severalheaters have been installed on the eight horizontal heat pipes andgrouped in seven heater lines working at different temperatures.Temperature control of the warm radiator is described in § 2.4.3below.
The warm compressors of the 4He-JT cooler are installedon another panel equipped with heaters to maintain a minimumtemperature.
The LFI radiometer electronic backend units (REBAs) andthe dilution cooler control unit (DCCU) are installed on the lastpanel. Heaters with PID control maintain the REBAs and theDCCU at a stable temperature at 2.75 ◦C.
The top surface of the SVM is covered with 20 layers of MLIto minimize radiation onto the payload.
2.4.2. Thrusters, STR switchover, SCS tuning
No attempt is made to control the temperature of the thrustersor their heating effect. Fig. 8 shows the temperature of the 20 Nthrusters at the time of orbit correction manoeuvre number 5 on26 February 2010. Fig. 8 shows the effect of the thruster fir-ings on the temperature of one of the 4He tanks. The manoeu-vre delta-V began at UT 23:01:50 and ended at 23:09:14, witha commanded size of 4.260966 cm s−1. The corresponding pres-sure increase in the helium tank leads to an increased flow ratefor a while, but the downstream controls on temperature adjustso there is no detectable thermal effect on the detectors.
During the first 18 months of the mission, three unexpectedstar tracker switchovers occurred, two of them during scienceoperations. The longest lasted 10 hr. It is expected that swap-ping electrical power from one star tracker to the other changesthe relative alignment of the star tracker platform with the fo-cal plane due to thermal effects. Alignment stability duringswitchover will be measured precisely by reobserving the samesky immediately after a scheduled switchover; then the effect canbe removed from the data if the redundant star tracker has to beused.
2.4.3. Warm radiator
The warm radiator plays a critical role in the operation of thesorption cooler. It is the means by which the heat generated in-side the compressor elements during heat-up and desorption isrejected to cold space. (Most of the heat lifted from the focalplane is rejected to space by the V-groove radiators.) The tem-perature of the warm radiator determines the temperature of thehydride beds during the absorption part of the cooler cycle. Thelower the temperature, the lower the pressure of hydrogen on thelow pressure side of the JT expansion, and therefore the lowerthe temperature of the thermal interfaces with the HFI and LFI(LVHX1 and LVHX2, respectively). The strict requirement onthe temperature of LVHX1 given in Table 1 translates into a re-quirement on the temperature of the warm radiator.
Temperature control of the warm radiator is achieved withseven independent heater lines. The temperature of the warm ra-diator depends on the total heat input from the sorption coolerplus the heaters. A listing of the heaters along with their controlbands is given in Table 4. The average of three warm radiator
Table 4. Power levels and temperature ranges of the seven in-dependent heater lines of the warm radiator temperature controlsystem. Heaters are either always on, always off, or controlledon-off (“bang-bang” control). The “sample configuration” showsa typical configuration during the first months of operation.
Power Sample T RangeLoop Number [W] Configuration [◦C]
13 . . . . . . . . . . . . . 75 On −8–−914 . . . . . . . . . . . . . 78 On −9–−10
8 . . . . . . . . . . . . . 91 On-Off −10–−1112 . . . . . . . . . . . . . 91 Off −11–−1232 . . . . . . . . . . . . . 91 Off −12–−1328 . . . . . . . . . . . . . 91 Off −13–−1427 . . . . . . . . . . . . . 91 Off −14–−15
thermistors, calculated once per minute for each loop, is usedfor control of all seven heaters.
2.4.4. 20 K stage
LVHX1 provides a temperature below 18 K, with fluctuationsdriven by the cooler (bed-to-bed variations, cycling, instabilitiesin the hydrogen liquid-gas flow after the JT, etc.). Stabilization ofthe temperature of this interface with the HFI is not necessary,as temperature control of the subsequent colder stages is moreefficient and very effective.
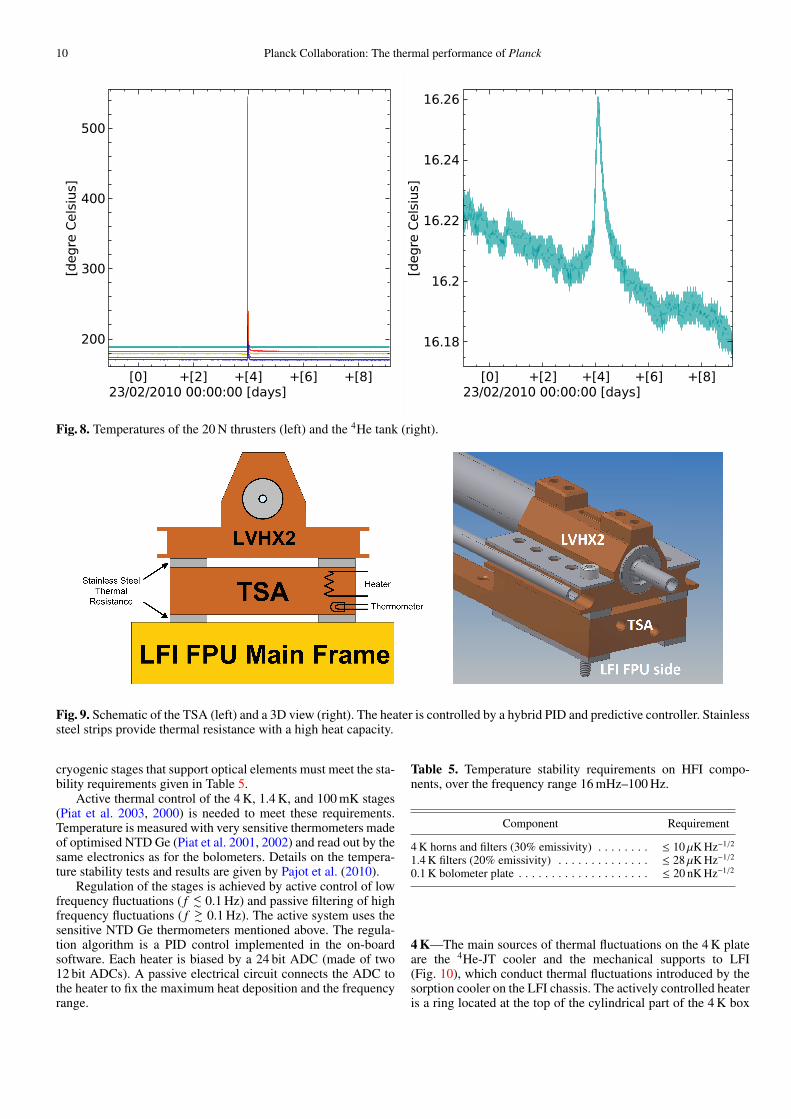
LVHX2 provides a temperature of about 18 K. To reducecold end fluctuations transmitted to the radiometers, an interme-diate stage, the temperature stabilization assembly (TSA, Fig. 9),is inserted between LVHX2 and the LFI FPU. The TSA com-prises a temperature sensor and heater controlled by a hybridPID and predictive controller, plus a high-heat-capacity thermalresistance. The set-point temperature of the TSA is an adjustableparameter of the sorption cooler system, chosen to provide dy-namic range for control, but not to require more than 150 mWof power from the heater. As the hydride in the sorption coolerages, the return gas pressure and thus the temperature of LVHX2rise slowly. The temperature of the warm radiator (§ 2.4.3) alsoaffects the temperature of LVHX2. Small adjustments of the set-point temperature are required now and then. There is no othertemperature regulation in the LFI focal plane.
The heater/thermometer is redundant. The thermal resis-tance between LVHX2 and the TSA causes a temperature dif-ference proportional to the heat flux through it; thus the stageis stabilized to (or above) the highest temperature expected forLVHX2. Thermal variation of the controlled stage is determinedby several factors, including thermometer resolution, thermome-ter sampling/feedback cycle time, heater power resolution, andheater power slew rate. Attached on the other side of the con-trolled stage is another thermal resistance, through which flowsall of the heat lifted from LFI. The transfer function of thermalnoise from the controlled stage to the LFI FPU is determined bythis resistance and by the effective heat capacity of LFI.
2.4.5. 4 K, 1.4 K, and 0.1 K stages
The noise produced by thermal fluctuations of sources of strayradiation should be small relative to the photon noise if no cor-rection is applied to the signal. This leads to a conservative re-quirement (Lamarre et al. 2003) that the temperatures of the
10 Planck Collaboration: The thermal performance of Planck
Fig. 8. Temperatures of the 20 N thrusters (left) and the 4He tank (right).
Fig. 9. Schematic of the TSA (left) and a 3D view (right). The heater is controlled by a hybrid PID and predictive controller. Stainlesssteel strips provide thermal resistance with a high heat capacity.
cryogenic stages that support optical elements must meet the sta-bility requirements given in Table 5.
Active thermal control of the 4 K, 1.4 K, and 100 mK stages(Piat et al. 2003, 2000) is needed to meet these requirements.Temperature is measured with very sensitive thermometers madeof optimised NTD Ge (Piat et al. 2001, 2002) and read out by thesame electronics as for the bolometers. Details on the tempera-ture stability tests and results are given by Pajot et al. (2010).
Regulation of the stages is achieved by active control of lowfrequency fluctuations ( f <∼ 0.1 Hz) and passive filtering of highfrequency fluctuations ( f >∼ 0.1 Hz). The active system uses thesensitive NTD Ge thermometers mentioned above. The regula-tion algorithm is a PID control implemented in the on-boardsoftware. Each heater is biased by a 24 bit ADC (made of two12 bit ADCs). A passive electrical circuit connects the ADC tothe heater to fix the maximum heat deposition and the frequencyrange.
Table 5. Temperature stability requirements on HFI compo-nents, over the frequency range 16 mHz–100 Hz.
Component Requirement
4 K horns and filters (30% emissivity) . . . . . . . . ≤ 10 µK Hz−1/2
1.4 K filters (20% emissivity) . . . . . . . . . . . . . . ≤ 28 µK Hz−1/2
0.1 K bolometer plate . . . . . . . . . . . . . . . . . . . . ≤ 20 nK Hz−1/2
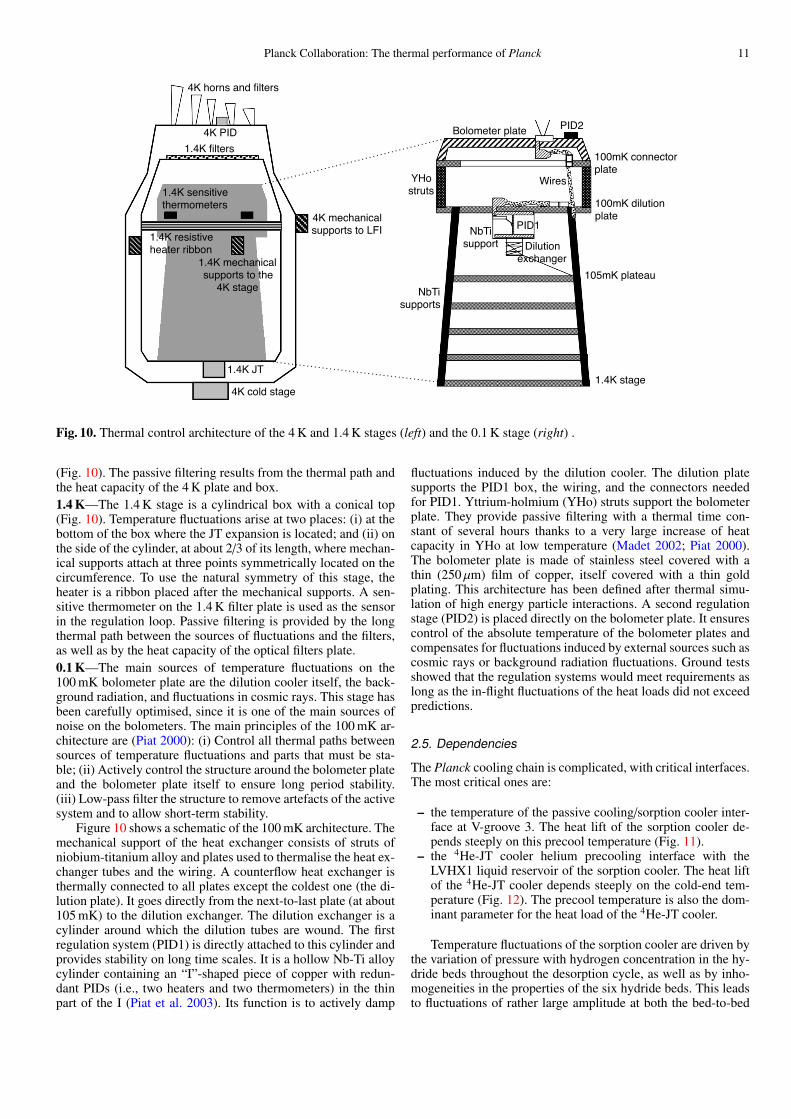
4 K—The main sources of thermal fluctuations on the 4 K plateare the 4He-JT cooler and the mechanical supports to LFI(Fig. 10), which conduct thermal fluctuations introduced by thesorption cooler on the LFI chassis. The actively controlled heateris a ring located at the top of the cylindrical part of the 4 K box
Planck Collaboration: The thermal performance of Planck 11
4K horns and filters!
4K PID!1.4K filters!
1.4K sensitive!thermometers!
1.4K resistive heater ribbon!
1.4K mechanical supports to the
4K stage!
1.4K JT!
4K cold stage!
4K mechanical supports to LFI!
Bolometer plate!
PID1!
Dilution!exchanger!
NbTi support!
Wires!
100mK connectorplate!
100mK dilution plate!
NbTi supports!
YHo struts!
105mK plateau!
1.4K stage!
PID2!
Fig. 10. Thermal control architecture of the 4 K and 1.4 K stages (left) and the 0.1 K stage (right) .
(Fig. 10). The passive filtering results from the thermal path andthe heat capacity of the 4 K plate and box.1.4 K—The 1.4 K stage is a cylindrical box with a conical top(Fig. 10). Temperature fluctuations arise at two places: (i) at thebottom of the box where the JT expansion is located; and (ii) onthe side of the cylinder, at about 2/3 of its length, where mechan-ical supports attach at three points symmetrically located on thecircumference. To use the natural symmetry of this stage, theheater is a ribbon placed after the mechanical supports. A sen-sitive thermometer on the 1.4 K filter plate is used as the sensorin the regulation loop. Passive filtering is provided by the longthermal path between the sources of fluctuations and the filters,as well as by the heat capacity of the optical filters plate.0.1 K—The main sources of temperature fluctuations on the100 mK bolometer plate are the dilution cooler itself, the back-ground radiation, and fluctuations in cosmic rays. This stage hasbeen carefully optimised, since it is one of the main sources ofnoise on the bolometers. The main principles of the 100 mK ar-chitecture are (Piat 2000): (i) Control all thermal paths betweensources of temperature fluctuations and parts that must be sta-ble; (ii) Actively control the structure around the bolometer plateand the bolometer plate itself to ensure long period stability.(iii) Low-pass filter the structure to remove artefacts of the activesystem and to allow short-term stability.
Figure 10 shows a schematic of the 100 mK architecture. Themechanical support of the heat exchanger consists of struts ofniobium-titanium alloy and plates used to thermalise the heat ex-changer tubes and the wiring. A counterflow heat exchanger isthermally connected to all plates except the coldest one (the di-lution plate). It goes directly from the next-to-last plate (at about105 mK) to the dilution exchanger. The dilution exchanger is acylinder around which the dilution tubes are wound. The firstregulation system (PID1) is directly attached to this cylinder andprovides stability on long time scales. It is a hollow Nb-Ti alloycylinder containing an “I”-shaped piece of copper with redun-dant PIDs (i.e., two heaters and two thermometers) in the thinpart of the I (Piat et al. 2003). Its function is to actively damp
fluctuations induced by the dilution cooler. The dilution platesupports the PID1 box, the wiring, and the connectors neededfor PID1. Yttrium-holmium (YHo) struts support the bolometerplate. They provide passive filtering with a thermal time con-stant of several hours thanks to a very large increase of heatcapacity in YHo at low temperature (Madet 2002; Piat 2000).The bolometer plate is made of stainless steel covered with athin (250 µm) film of copper, itself covered with a thin goldplating. This architecture has been defined after thermal simu-lation of high energy particle interactions. A second regulationstage (PID2) is placed directly on the bolometer plate. It ensurescontrol of the absolute temperature of the bolometer plates andcompensates for fluctuations induced by external sources such ascosmic rays or background radiation fluctuations. Ground testsshowed that the regulation systems would meet requirements aslong as the in-flight fluctuations of the heat loads did not exceedpredictions.
2.5. Dependencies
The Planck cooling chain is complicated, with critical interfaces.The most critical ones are:
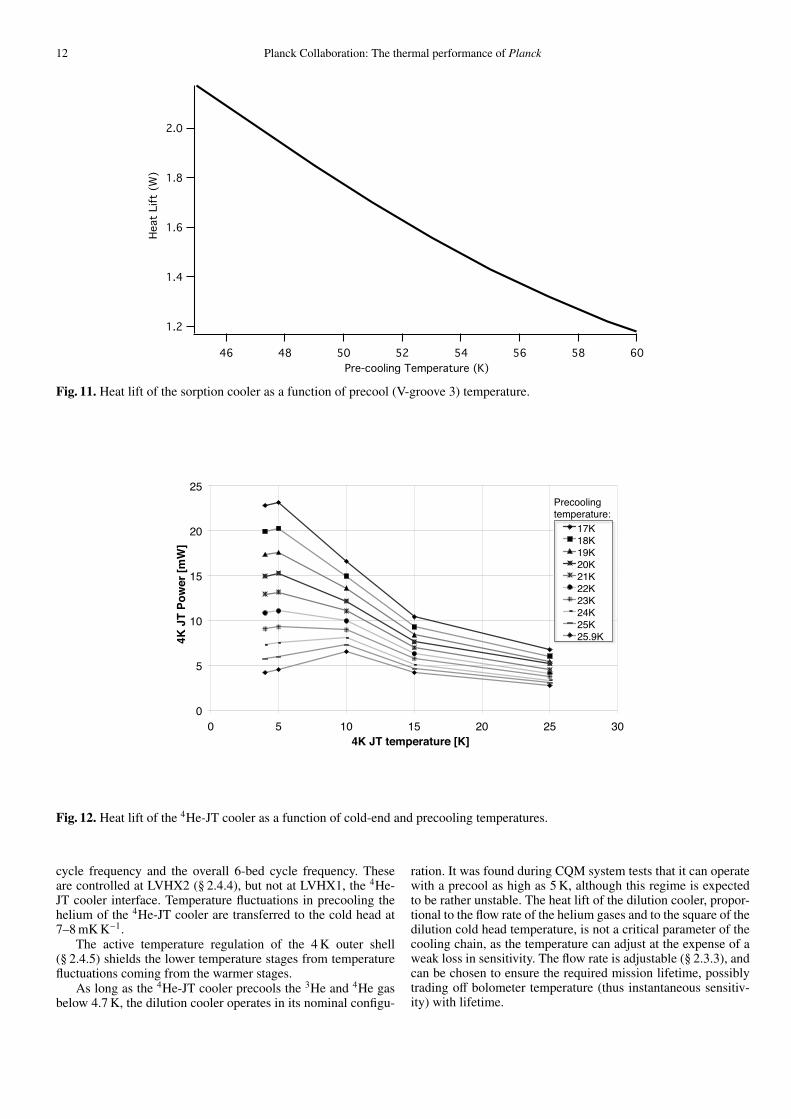
– the temperature of the passive cooling/sorption cooler inter-face at V-groove 3. The heat lift of the sorption cooler de-pends steeply on this precool temperature (Fig. 11).
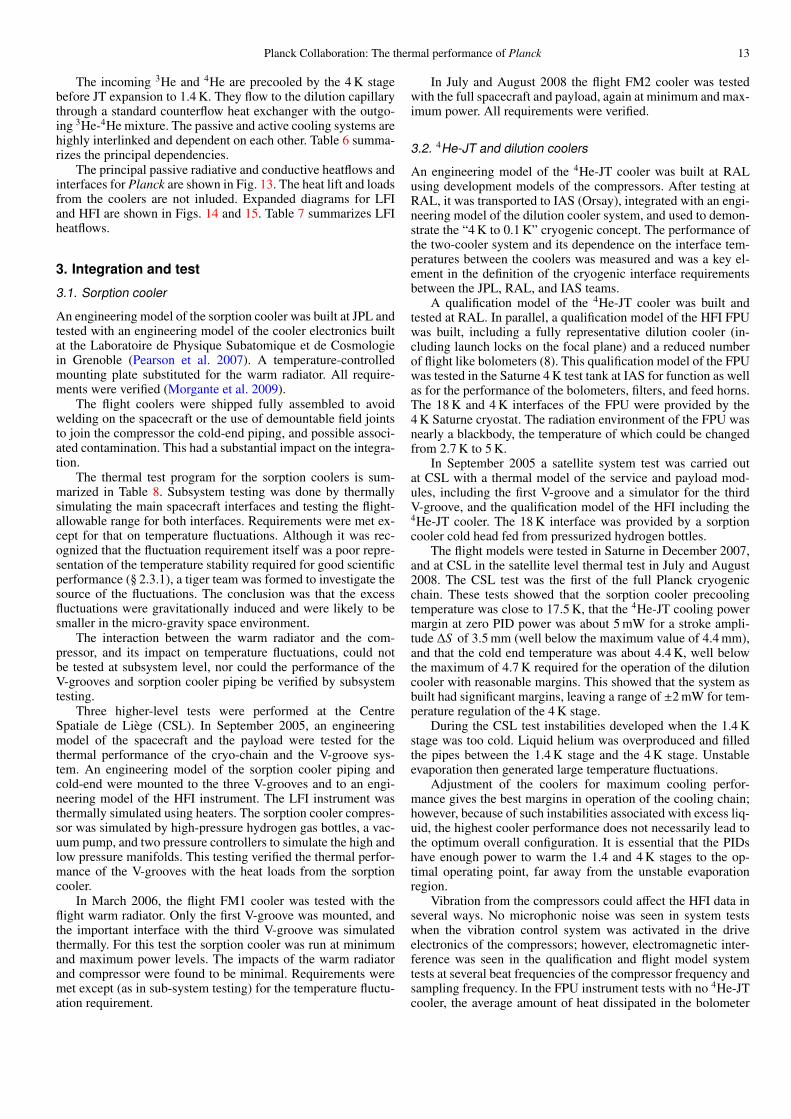
– the 4He-JT cooler helium precooling interface with theLVHX1 liquid reservoir of the sorption cooler. The heat liftof the 4He-JT cooler depends steeply on the cold-end tem-perature (Fig. 12). The precool temperature is also the dom-inant parameter for the heat load of the 4He-JT cooler.
Temperature fluctuations of the sorption cooler are driven bythe variation of pressure with hydrogen concentration in the hy-dride beds throughout the desorption cycle, as well as by inho-mogeneities in the properties of the six hydride beds. This leadsto fluctuations of rather large amplitude at both the bed-to-bed
12 Planck Collaboration: The thermal performance of Planck
Fig. 11. Heat lift of the sorption cooler as a function of precool (V-groove 3) temperature.
0
5
10
15
20
25
0 5 10 15 20 25 30
4K J
T Po
wer
[mW
]
4K JT temperature [K]
17K18K19K20K21K22K23K24K25K25.9K
Precooling temperature:
Fig. 12. Heat lift of the 4He-JT cooler as a function of cold-end and precooling temperatures.
cycle frequency and the overall 6-bed cycle frequency. Theseare controlled at LVHX2 (§ 2.4.4), but not at LVHX1, the 4He-JT cooler interface. Temperature fluctuations in precooling thehelium of the 4He-JT cooler are transferred to the cold head at7–8 mK K−1.
The active temperature regulation of the 4 K outer shell(§ 2.4.5) shields the lower temperature stages from temperaturefluctuations coming from the warmer stages.
As long as the 4He-JT cooler precools the 3He and 4He gasbelow 4.7 K, the dilution cooler operates in its nominal configu-
ration. It was found during CQM system tests that it can operatewith a precool as high as 5 K, although this regime is expectedto be rather unstable. The heat lift of the dilution cooler, propor-tional to the flow rate of the helium gases and to the square of thedilution cold head temperature, is not a critical parameter of thecooling chain, as the temperature can adjust at the expense of aweak loss in sensitivity. The flow rate is adjustable (§ 2.3.3), andcan be chosen to ensure the required mission lifetime, possiblytrading off bolometer temperature (thus instantaneous sensitiv-ity) with lifetime.
Planck Collaboration: The thermal performance of Planck 13
The incoming 3He and 4He are precooled by the 4 K stagebefore JT expansion to 1.4 K. They flow to the dilution capillarythrough a standard counterflow heat exchanger with the outgo-ing 3He-4He mixture. The passive and active cooling systems arehighly interlinked and dependent on each other. Table 6 summa-rizes the principal dependencies.
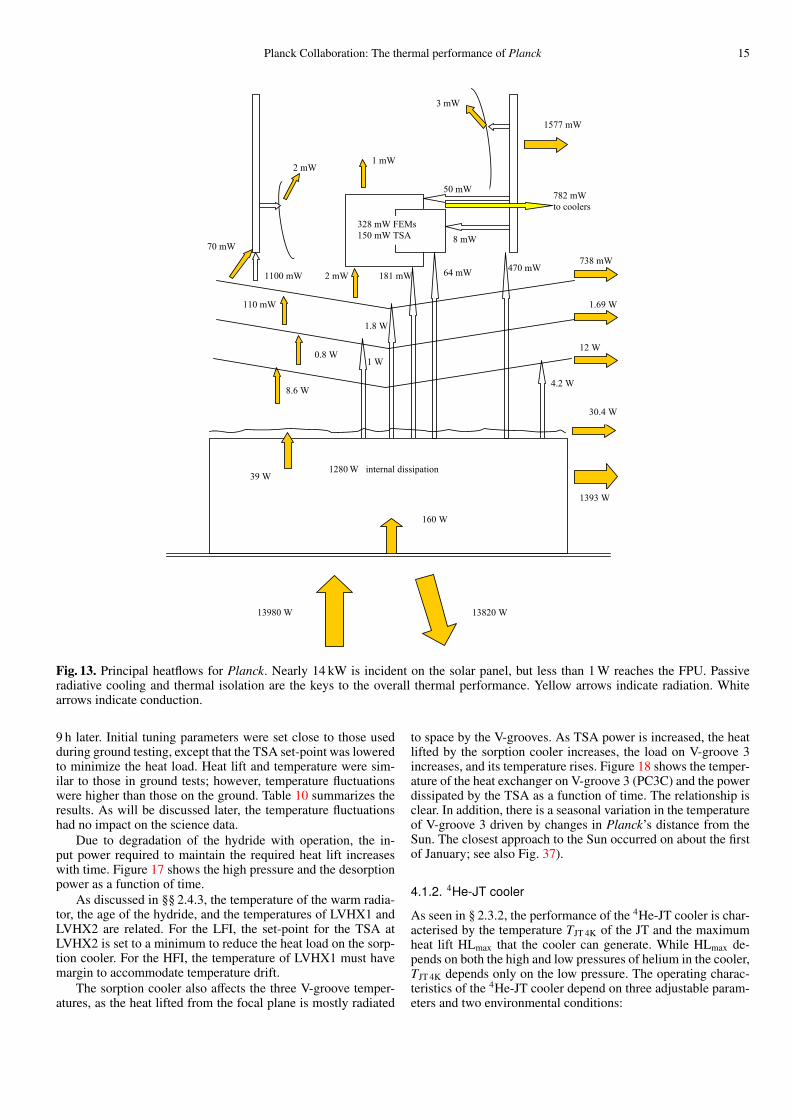
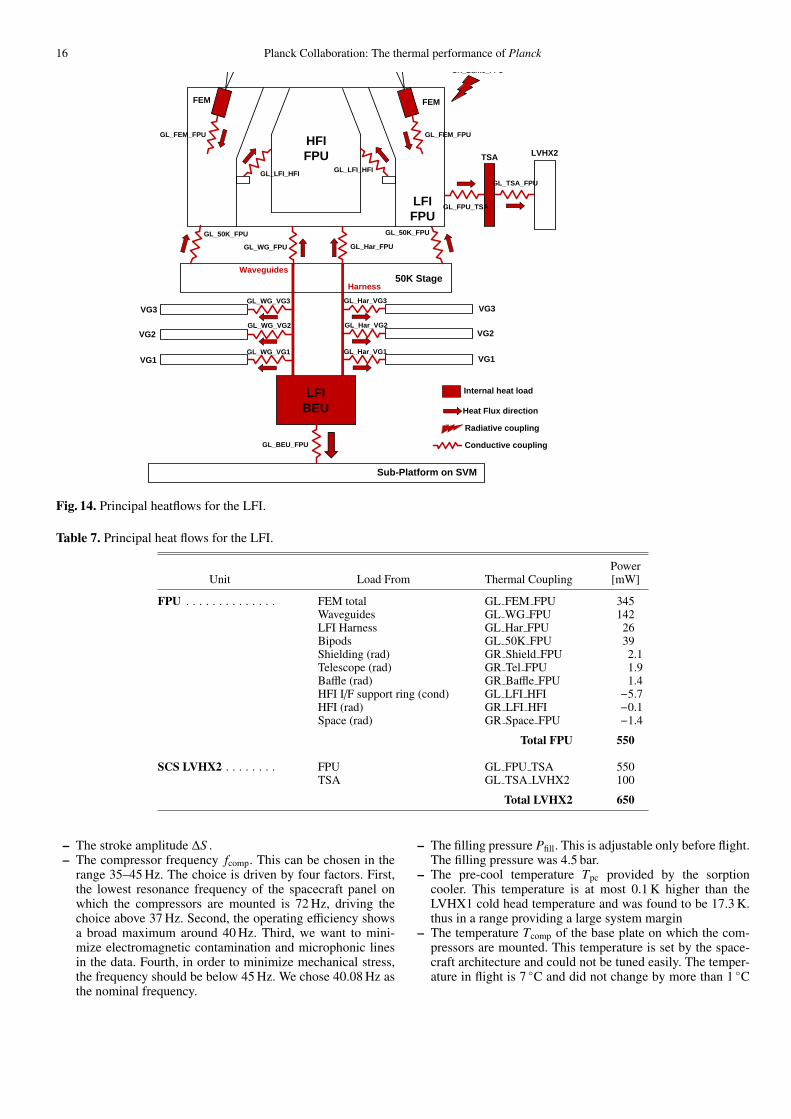
The principal passive radiative and conductive heatflows andinterfaces for Planck are shown in Fig. 13. The heat lift and loadsfrom the coolers are not inluded. Expanded diagrams for LFIand HFI are shown in Figs. 14 and 15. Table 7 summarizes LFIheatflows.
3. Integration and test
3.1. Sorption cooler
An engineering model of the sorption cooler was built at JPL andtested with an engineering model of the cooler electronics builtat the Laboratoire de Physique Subatomique et de Cosmologiein Grenoble (Pearson et al. 2007). A temperature-controlledmounting plate substituted for the warm radiator. All require-ments were verified (Morgante et al. 2009).
The flight coolers were shipped fully assembled to avoidwelding on the spacecraft or the use of demountable field jointsto join the compressor the cold-end piping, and possible associ-ated contamination. This had a substantial impact on the integra-tion.
The thermal test program for the sorption coolers is sum-marized in Table 8. Subsystem testing was done by thermallysimulating the main spacecraft interfaces and testing the flight-allowable range for both interfaces. Requirements were met ex-cept for that on temperature fluctuations. Although it was rec-ognized that the fluctuation requirement itself was a poor repre-sentation of the temperature stability required for good scientificperformance (§ 2.3.1), a tiger team was formed to investigate thesource of the fluctuations. The conclusion was that the excessfluctuations were gravitationally induced and were likely to besmaller in the micro-gravity space environment.
The interaction between the warm radiator and the com-pressor, and its impact on temperature fluctuations, could notbe tested at subsystem level, nor could the performance of theV-grooves and sorption cooler piping be verified by subsystemtesting.
Three higher-level tests were performed at the CentreSpatiale de Liege (CSL). In September 2005, an engineeringmodel of the spacecraft and the payload were tested for thethermal performance of the cryo-chain and the V-groove sys-tem. An engineering model of the sorption cooler piping andcold-end were mounted to the three V-grooves and to an engi-neering model of the HFI instrument. The LFI instrument wasthermally simulated using heaters. The sorption cooler compres-sor was simulated by high-pressure hydrogen gas bottles, a vac-uum pump, and two pressure controllers to simulate the high andlow pressure manifolds. This testing verified the thermal perfor-mance of the V-grooves with the heat loads from the sorptioncooler.
In March 2006, the flight FM1 cooler was tested with theflight warm radiator. Only the first V-groove was mounted, andthe important interface with the third V-groove was simulatedthermally. For this test the sorption cooler was run at minimumand maximum power levels. The impacts of the warm radiatorand compressor were found to be minimal. Requirements weremet except (as in sub-system testing) for the temperature fluctu-ation requirement.
In July and August 2008 the flight FM2 cooler was testedwith the full spacecraft and payload, again at minimum and max-imum power. All requirements were verified.
3.2. 4He-JT and dilution coolers
An engineering model of the 4He-JT cooler was built at RALusing development models of the compressors. After testing atRAL, it was transported to IAS (Orsay), integrated with an engi-neering model of the dilution cooler system, and used to demon-strate the “4 K to 0.1 K” cryogenic concept. The performance ofthe two-cooler system and its dependence on the interface tem-peratures between the coolers was measured and was a key el-ement in the definition of the cryogenic interface requirementsbetween the JPL, RAL, and IAS teams.
A qualification model of the 4He-JT cooler was built andtested at RAL. In parallel, a qualification model of the HFI FPUwas built, including a fully representative dilution cooler (in-cluding launch locks on the focal plane) and a reduced numberof flight like bolometers (8). This qualification model of the FPUwas tested in the Saturne 4 K test tank at IAS for function as wellas for the performance of the bolometers, filters, and feed horns.The 18 K and 4 K interfaces of the FPU were provided by the4 K Saturne cryostat. The radiation environment of the FPU wasnearly a blackbody, the temperature of which could be changedfrom 2.7 K to 5 K.
In September 2005 a satellite system test was carried outat CSL with a thermal model of the service and payload mod-ules, including the first V-groove and a simulator for the thirdV-groove, and the qualification model of the HFI including the4He-JT cooler. The 18 K interface was provided by a sorptioncooler cold head fed from pressurized hydrogen bottles.
The flight models were tested in Saturne in December 2007,and at CSL in the satellite level thermal test in July and August2008. The CSL test was the first of the full Planck cryogenicchain. These tests showed that the sorption cooler precoolingtemperature was close to 17.5 K, that the 4He-JT cooling powermargin at zero PID power was about 5 mW for a stroke ampli-tude ∆S of 3.5 mm (well below the maximum value of 4.4 mm),and that the cold end temperature was about 4.4 K, well belowthe maximum of 4.7 K required for the operation of the dilutioncooler with reasonable margins. This showed that the system asbuilt had significant margins, leaving a range of ±2 mW for tem-perature regulation of the 4 K stage.
During the CSL test instabilities developed when the 1.4 Kstage was too cold. Liquid helium was overproduced and filledthe pipes between the 1.4 K stage and the 4 K stage. Unstableevaporation then generated large temperature fluctuations.
Adjustment of the coolers for maximum cooling perfor-mance gives the best margins in operation of the cooling chain;however, because of such instabilities associated with excess liq-uid, the highest cooler performance does not necessarily lead tothe optimum overall configuration. It is essential that the PIDshave enough power to warm the 1.4 and 4 K stages to the op-timal operating point, far away from the unstable evaporationregion.
Vibration from the compressors could affect the HFI data inseveral ways. No microphonic noise was seen in system testswhen the vibration control system was activated in the driveelectronics of the compressors; however, electromagnetic inter-ference was seen in the qualification and flight model systemtests at several beat frequencies of the compressor frequency andsampling frequency. In the FPU instrument tests with no 4He-JTcooler, the average amount of heat dissipated in the bolometer

14 Planck Collaboration: The thermal performance of Planck
Table 6. Dependencies in the Planck cryosystem.
Component Affected By Affects Trade-off
V-groove 3 temp. . . . . . . . . . . . . Sorption cooler mass flow Efficiency of the sorption cooler system;sorption cooler required mass flow;sorption cooler power & cycle time.
Warm Radiator temp. . . . . . . . . Sorption cooler power TLVHX1,2
Warm radiator heater power 4He-JT cooler efficiency4He-JT cooler heat load
Warm Radiator stability . . . . . . . Warm radiator heater control TLVHX1,2 stability
Sorption Cooler System . . . . . . . V-groove 3 temperature Sorption cooler heat liftPowerCycle timeTSA powerLPSB
Warm radiator temperature Sorption cooler temperature; 4He-JTcooler efficiency; 1.4 K efficiency
Warm radiator stability Sorption cooler stabilitySorption cooler lifetimeTemperature stability of 4 K boxTemperature stability of 4 K loadsTemperature and stability of LFI
4He-JT Cooler . . . . . . . . . . . . . . LFI temperatureTLVHX1V-groove 3 temperature
T , heat lift
Fill pressure . . . . . . . . . . . . . 4He-JT cooler efficiency and temperature
Stroke frequency . . . . . . . . . . Could affect microphonics if vibrationcontrol system off. Small effect oncooling power.
Stroke amplitude . . . . . . . . . . Affects gas flow Heat lift, lifetimePID power . . . . . . . . . . . . . . Temperature and temperature stability;
margin on heat lift (found to be largein thermal balance/thermal vacuumtests).
T , T stability
Vibration control system . . . . Dilution (via microvibrations if vibrationcontrol system off)
Dilution Cooler . . . . . . . . . . . . . . 4 K and 1.4 K precool temp Instability of 4 K and 1.4 K if 1.4 K toocold (unstable evaporation)
Heat lift, T , lifetime
Flow rate1.4 K PID powerDilution plate PIDBolometer plate PID
SVM temperature Changes the isotope flow for a givenchoice of restrictions
T , T stability, margin(long timescale)
T , T stability, margin(short timescale)
plate was around 10 nW. In the system tests at CSL, it was be-tween 40 and 50 nW, a good indication that microvibrations wereheating the 100 mK stage, although it was not possible to sep-arate the contributions of the CSL test tank from those of the4He-JT cooler. These heat imput had negligible fluctuations andaffected only the heat loads in the Planck cryogenic system sta-bility and not its temperature fluctuations. The heat inputs onthe 100 mK stage were measured in flight and are discussed in§ 4.1.3.
The system tests also tested the cooldown, and defined thefull cooldown procedure in flight. This is very important. Onecould design a cooling chain with an operating point with mar-gins, but no way to reach it. The system tests had to demonstratenot only the final configuration and its margins, but also the mar-gins along the entire cooling path. We will return to this pointin § 7.
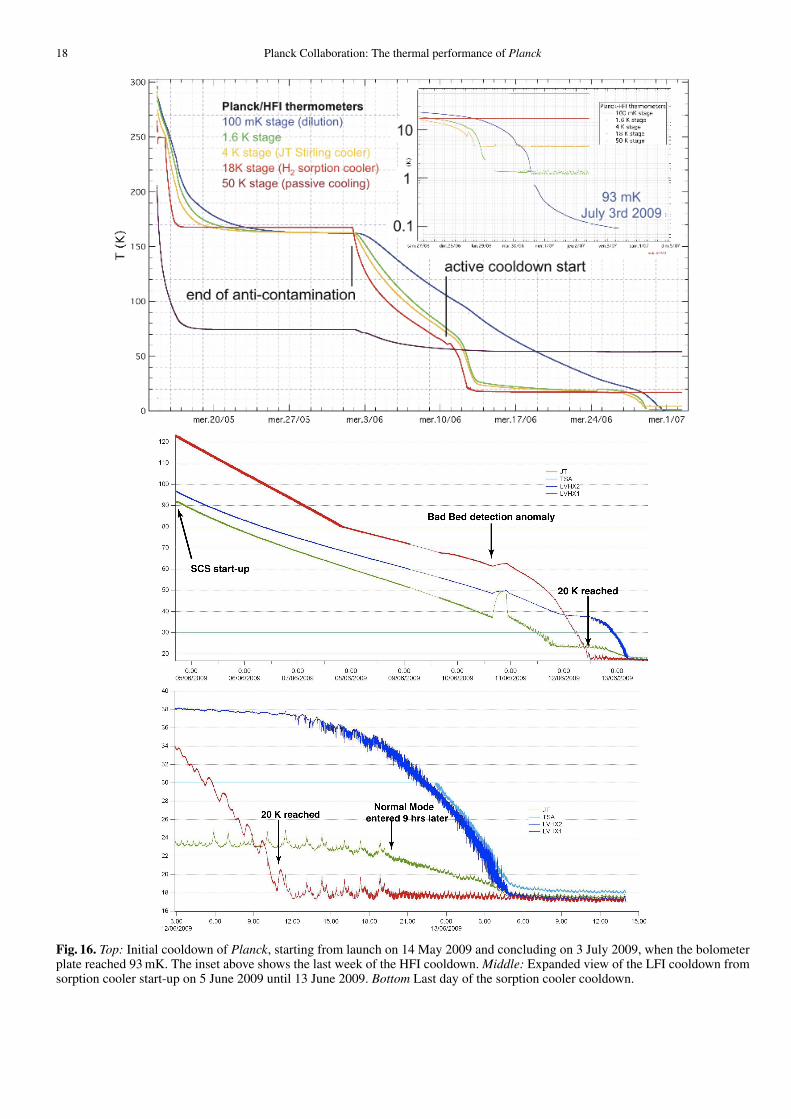
4. Performance: Temperature
4.1. Temperatures, heat lift, and tuning in space
Radiative cooling began immediately after launch on 14 May2009. Figure 16 shows the temperatures of the key elements asa function of time. The cooldown was completed on 3 July 2009after a cool down in agreement with the ground tests and simu-lations. Active cooling from 20 K to 4 K was deliberately sloweddown to allow calibration of the LFI.
4.1.1. Sorption cooler
The FM2 sorption cooler was activated on 2 June 2009 with theJT expander at a temperature of 90 K. Liquid hydrogen formedafter 187 h, and the cooler transitioned to normal operating mode
Planck Collaboration: The thermal performance of Planck 15
328 mW FEMs 150 mW TSA
1 mW 2 mW
3 mW
50 mW
8 mW
8.6 W
110 mW
0.8 W
1.8 W
2 mW 1100 mW
1 W
181 mW
13980 W 13820 W
1393 W
160 W
1280 W internal dissipation
30.4 W
39 W
4.2 W
12 W
1.69 W
738 mW 70 mW
470 mW
1577 mW
782 mW to coolers
64 mW
Fig. 13. Principal heatflows for Planck. Nearly 14 kW is incident on the solar panel, but less than 1 W reaches the FPU. Passiveradiative cooling and thermal isolation are the keys to the overall thermal performance. Yellow arrows indicate radiation. Whitearrows indicate conduction.
9 h later. Initial tuning parameters were set close to those usedduring ground testing, except that the TSA set-point was loweredto minimize the heat load. Heat lift and temperature were sim-ilar to those in ground tests; however, temperature fluctuationswere higher than those on the ground. Table 10 summarizes theresults. As will be discussed later, the temperature fluctuationshad no impact on the science data.
Due to degradation of the hydride with operation, the in-put power required to maintain the required heat lift increaseswith time. Figure 17 shows the high pressure and the desorptionpower as a function of time.
As discussed in §§ 2.4.3, the temperature of the warm radia-tor, the age of the hydride, and the temperatures of LVHX1 andLVHX2 are related. For the LFI, the set-point for the TSA atLVHX2 is set to a minimum to reduce the heat load on the sorp-tion cooler. For the HFI, the temperature of LVHX1 must havemargin to accommodate temperature drift.
The sorption cooler also affects the three V-groove temper-atures, as the heat lifted from the focal plane is mostly radiated
to space by the V-grooves. As TSA power is increased, the heatlifted by the sorption cooler increases, the load on V-groove 3increases, and its temperature rises. Figure 18 shows the temper-ature of the heat exchanger on V-groove 3 (PC3C) and the powerdissipated by the TSA as a function of time. The relationship isclear. In addition, there is a seasonal variation in the temperatureof V-groove 3 driven by changes in Planck’s distance from theSun. The closest approach to the Sun occurred on about the firstof January; see also Fig. 37).
4.1.2. 4He-JT cooler
As seen in § 2.3.2, the performance of the 4He-JT cooler is char-acterised by the temperature TJT 4K of the JT and the maximumheat lift HLmax that the cooler can generate. While HLmax de-pends on both the high and low pressures of helium in the cooler,TJT 4K depends only on the low pressure. The operating charac-teristics of the 4He-JT cooler depend on three adjustable param-eters and two environmental conditions:
16 Planck Collaboration: The thermal performance of Planck
Heat Flux direction
Radiative coupling
Conductive coupling
Internal heat load
GR_Baffle_FPU
GL_FEM_FPU
LFI
FPU
HFI
FPU
FEM
GL_LFI_HFI
GL_50K_FPU GL_50K_FPU
TSA
50K Stage
VG3
VG2
VG1
VG3
VG2
VG1
GL_BEU_FPU
LFI
BEU
GL_FEM_FPU
FEM
LVHX2
GL_FPU_TSA
GL_TSA_FPU
GL_LFI_HFI
Sub-Platform on SVM
Waveguides
Harness
GL_WG_VG3
GL_WG_VG2
GL_WG_VG1
GL_Har_VG3
GL_Har_VG2
GL_Har_VG1
GL_Har_FPUGL_WG_FPU
Fig. 14. Principal heatflows for the LFI.
Table 7. Principal heat flows for the LFI.
PowerUnit Load From Thermal Coupling [mW]
FPU . . . . . . . . . . . . . . FEM total GL FEM FPU 345Waveguides GL WG FPU 142LFI Harness GL Har FPU 26Bipods GL 50K FPU 39Shielding (rad) GR Shield FPU 2.1Telescope (rad) GR Tel FPU 1.9Baffle (rad) GR Baffle FPU 1.4HFI I/F support ring (cond) GL LFI HFI −5.7HFI (rad) GR LFI HFI −0.1Space (rad) GR Space FPU −1.4
Total FPU 550
SCS LVHX2 . . . . . . . . FPU GL FPU TSA 550TSA GL TSA LVHX2 100
Total LVHX2 650
– The stroke amplitude ∆S .– The compressor frequency fcomp. This can be chosen in the
range 35–45 Hz. The choice is driven by four factors. First,the lowest resonance frequency of the spacecraft panel onwhich the compressors are mounted is 72 Hz, driving thechoice above 37 Hz. Second, the operating efficiency showsa broad maximum around 40 Hz. Third, we want to mini-mize electromagnetic contamination and microphonic linesin the data. Fourth, in order to minimize mechanical stress,the frequency should be below 45 Hz. We chose 40.08 Hz asthe nominal frequency.
– The filling pressure Pfill. This is adjustable only before flight.The filling pressure was 4.5 bar.
– The pre-cool temperature Tpc provided by the sorptioncooler. This temperature is at most 0.1 K higher than theLVHX1 cold head temperature and was found to be 17.3 K.thus in a range providing a large system margin
– The temperature Tcomp of the base plate on which the com-pressors are mounted. This temperature is set by the space-craft architecture and could not be tuned easily. The temper-ature in flight is 7 ◦C and did not change by more than 1 ◦C

Planck Collaboration: The thermal performance of Planck 17
3mW
6 mW
0.1 mW
17.1 K
1.4 K
DCCU
dilution 100 mK dilution plate
bolometer plate
dilution exchanger
LFI
LVHX2
1.4K JT
LVHX1
heat switch
heat switch
1.4 K optical plate
20 K mechanical
interface
20 K mechanical
interface
4HeJT compressors
and panel
sorption cooler
warm radiator
18K stage
4K cold stage
V-groove interfaces
19.5 K
101 mK
103 mK
1.4 K
4.8 mK
19.5 K
4K box
1.4K box
Cosmic rays 10 nW
180 nW
DCCU
dilution 100 mK dilution plate
bolometer plate
dilution exchanger
LFI
LVHX2
1.4K JT
LVHX1
heat switch
heat switch
4K optical plate
1.4 K optical plate
20 K mechanical
interface
20 K mechanical
interface
4HeJT compressors
and panel
sorption cooler
warm radiator
18K stage
V-groove interfaces
4K cold stage
30 nW
vibrations
25 nW
250 nW
4K box
1.4K box
Fig. 15. Principal heatflows for the HFI “4 K” system (left) and dilution system (right).
Table 8. Sorption cooler test program.
Configuration
Test Cooler Interfaces Verification
Subsystem acceptance . . . . Actual FM1 and FM2 coolers,PACE, and compressors joinedin non-flight configuration.
Thermal simulation of the twointerfaces.
Verified performance over flight-allowable temperature range forwarm radiator and final pre-cooling stage.
FM1 CQM test . . . . . . . . . Engineering model of PACE,compressor simulated byhydrogen gas system
Engineering model of V-groovesystem (no compressor)
Heat load from sorption cooler toV-grooves.
FM1 spacecraft bus . . . . . . FM1 flight cooler Flight warm radiator, V-groove 1,pre-cooler thermally simulated
Interaction of sorption cooler andwarm radiator, minimum andmaximum power.
FM2 spacecraft . . . . . . . . . FM2 flight cooler Actual spacecraft interfaces Requirements verification withfull spacecraft and payload.
during the nominal mission. This leads to negligible changesof performance during the mission.
We end up finally with one parameter adjustable in flight, thestroke amplitude ∆S , and one environment parameter, the pre-cooling temperature provided by the sorption cooler. The per-formance of the 4He-JT cooler as measured in flight is fully inline with the ground based tests given in § 2.3.2.
No extra heat load on the 4 K box was identified with respectto the CSL thermal balance/thermal vacuum test, showing thatthe launch had not affected the cryogenic configuration.
In flight the unstable evaporation of helium between 1.4 Kand 4 K stages was seen but induces by the 4 K stage beingtoo cold. The 1.4 K–4 K temperature plane was then mapped
to find precisely the unstable zones which came out to beT1.4 K < 1.34 K and T4 K < 4.64 K. The best operating regionis 1.36 K < T1.4 K < 1.4 K and 4.7 K < T4 K < 4.75 K. Theoperating point for flight was chosen in this zone.
During the CPV phase, ∆S was reduced to 3.45 mm in or-der to decrease the power of the 4He-JT cooler and optimise itsoperating conditions keeping the temperature above the unsta-ble evaporation range. The vibration control system convergedquickly to a new stable configuration, demonstrating that adjust-ment of this important subsystem would be easy should it benecessary. No further adjustment has been required.
The 4 K PID flight configuration has fixed power of 840 µWon the redundant PID and regulating power of around 900 µWon the nominal PID. The in-flight operating temperature of the
18 Planck Collaboration: The thermal performance of Planck
Fig. 16. Top: Initial cooldown of Planck, starting from launch on 14 May 2009 and concluding on 3 July 2009, when the bolometerplate reached 93 mK. The inset above shows the last week of the HFI cooldown. Middle: Expanded view of the LFI cooldown fromsorption cooler start-up on 5 June 2009 until 13 June 2009. Bottom Last day of the sorption cooler cooldown.
Planck Collaboration: The thermal performance of Planck 19
Table 9. Temperatures of key components in flight.
Temperature
Number of Range MeanComponent Sensors [K] [K]
Solar panels . . . . . . . . . . . . . . . . . 6 377–398 384SVM . . . . . . . . . . . . . . . . . . . . . . 3 273–294 286Star trackers . . . . . . . . . . . . . . . . 2 262–272 267Helium tanks . . . . . . . . . . . . . . . . 3 287–290 289Dilution cooler control unit . . . . . .LFI radiometer backend unit . . . . .V-groove 1 . . . . . . . . . . . . . . . . . 2 135.6–140.2 137.9V-groove 2 . . . . . . . . . . . . . . . . . 2 91.7– 91.9 91.8V-groove 3 . . . . . . . . . . . . . . . . . 5 45.2– 47.7 46.1Telescope baffle . . . . . . . . . . . . . . 4 42.1– 42.7 42.3Primary mirror . . . . . . . . . . . . . . . 2 35.9– 35.9 35.9Secondary mirror . . . . . . . . . . . . . 3 39.6– 39.6 39.6LFI focal plane . . . . . . . . . . . . . . 3 19.8– 23.2 22.0HFI FPU . . . . . . . . . . . . . . . . . . . 3 18.2– 18.2 18.2HFI feeds . . . . . . . . . . . . . . . . . .HFI “4 K stage” . . . . . . . . . . . . . . 2 4.7– 4.8 4.75HFI “1.4 K stage” . . . . . . . . . . . . . 1 . . . 1.393HFI “100 mK stage” . . . . . . . . . . . 1 0.1028 0.1028
Table 10. Summary of sorption cooler system flight performance.
Characteristic CPVa Flight Result Ground Test Result Requirement
Cold end T . . . . . . . . . 17.0 K at LVHX1 17.1 K at LVHX1 LVHX1 < 19.02 K18.5 K at TSA 18.7 K at TSA LVHX2 < 22.50 K
Cooling power . . . . . . . 1125 ± 75 mW 1125 ± 75 mW at LVHX1 > 190 mWat LVHX2 > 646 mW
Input power . . . . . . . . . 301 W 304 W < 426 W at BOLCold end ∆T . . . . . . . . 580 mK at LVHX1 550 mK at LVHX1 at LVHX1 < 450 mK
140 mK at TSA 120 mK at TSA at LVHX2 < 100 mKa Calibration and performance verification phase.
4 K cold tip is 4.37 K. The PID for the 4 K feed horn plate wasset at 4.81 K.
4.1.3. Dilution cooler
The isotope flow was set to FNOM1 (Table 3) for the cooldown.The bolometer plate reached 93 mK and was still decreasing on3 July 2009 when the flow was changed to Fmin2, the lowestavailable. The 1.4 K stage reached 1.23 K. The flow for a givenrestriction is slightly higher than it was during ground tests be-cause the pressure regulators on the high pressure tanks had to bechanged after a leak was found in the system test. The replace-ment regulators provide 19 bar rather than the original 18 bar.
The dilution is stabilized by a PID control with a power ini-tially around 31 nW, providing a temperature near 101 mK. Thispower decreased slowly to a minimum of 24 nW in November2010, and then began to rise again. This trend was expected, andis due to a small nonlinearity of the pressure regulators. The reg-ulated pressure decreases slightly as the tank pressure drops toabout half its initial value, then increases again as the tank pres-sures goes lower. The amplitude of the effect is fully consistentwith the heat lift given in § 2.3.3.
The bolometer plate is stabilized at 102.8 mK with a PIDpower around 5 nW. The PID parameters give a very long timeconstant (about 0.5 h). This ensures that glitches induced by cos-
mic rays on the PID thermometer do not induce temperature fluc-tuations on the bolometer plate. Both PIDs show fluctuations ontime scales of days to weeks, discussed in § 5.3.
The heat inputs on the bolometer plate are: (i) the input fromthe bias current of the bolometers (less than 1 nW); (ii) the mi-crowave radiation reaching the bolometers (0.12 nW); (iii) cos-mic rays that penetrate the FPU box and deposit energy in thebolometer plate (variable); (iv) the heat dissipated by microvi-brations in the bolometer plate; and (v) heating from PID2.
The heat dissipated in the dilution and bolometer plates bymicro-vibrations from the 4 K compressors was not measuredprecisely during ground tests but was of order 30 nW on thebolometer plate. Once during flight the 4He-JT cooler was turnedoff by the charge regulator that controls the current call from thedrive electronics to the spacecraft. This single event allowed usto measure precisely the heat input from micro-vibrations fromthe compressors on the dilution plate. It was 26 nW. There wasalso evidence for a comparable amount of heat on the bolometerplate but it cannot be assessed accurately (the PID has a longtime constant and reacted slowly as can be seen on the figureFig. 19. The heat input from micro-vibrations is essentially con-stant.
Correlation of the bolometer plate temperature with both theSpace Radiation Environment Monitor (SREM) data and theglitch rate on the bolometers on periods of days to weeks (§ 5.3)

20 Planck Collaboration: The thermal performance of Planck
32
31
30
29
28
HP
ST
Pre
ssur
e (B
ar)
9/1/09 11/1/09 1/1/10 3/1/10 5/1/10Date
210
200
190
180
170
160
Desorption P
ower (W
)
High Pressure Desorption Power
Fig. 17. Sorption cooler high pressure and desorption power as a function of time.
46.6
46.4
46.2
46.0
9/1/09 11/1/09 1/1/10 3/1/10 5/1/10dat
0.20
0.15
0.10
0.05
PC3C Q_TSA
Fig. 18. Temperature of the sorption cooler heat exchanger on V-groove 3 (PC3C) and TSA power as a function of time. The sorptioncooler including the TSA is the dominant heat load on V-groove 3. As TSA power is increased, the heat lifted by the sorption coolerincreases, the load on V-groove 3 increases, and its temperature rises. A smaller seasonal effect of the distance of Planck from theSun is superimposed on this general trend. The closest approach to the Sun occurred at the beginning of January.
shows that cosmic rays also heat the bolometer plate. The vari-able part of the power input from the cosmic rays can be cali-brated using the PID response on long periods. This allows esti-mation of the the total power input from cosmic rays, which wasabout 12 nW on the bolometer plate and 8 nW on the dilutionplate for the first 100 days of the survey. These numbers couldbe checked using the small solar flare on 5–7 April 2010, andwithin uncertainties the powers agree. In January 2010 the in-crease of Solar activity brought these numbers slowly down by1.5 and 1 nW respectively. There is thus a consistent picture inwhich the galactic cosmic rays detected by the SREM accountfor both the temperature fluctuations discussed in § 5.3 and theextra heating seen in flight on the bolometer and dilution plate.
In summary, the bolometer plate receives 10–12 nW (de-pending on the period) from cosmic rays and about 30 nW fromthe micro-vibration from the 4He-JT cooler. This agrees with
the 40 nW obtained empirically from the gradients within the100 mK stage. The dilution plate receives 26 nW from micro-vibration from the 4He-JT cooler and 7–8 nW from the cosmicrays, in very good agreement with the 35 nW obtained from thetemperature gradients.
The heating by cosmic rays is higher than expected beforeflight by almost an order of magnitude. The period following thePlanck launch was a period of exceptionally weak solar activ-ity, resulting in very weak solar modulation of cosmic rays at1 AU (Mewaldt et al. 2010) and references therein. They showthat the flux of low energy (200 MeV/nucleon) nuclei from car-bon to iron was four times higher than in the period 2001–2003, and 20% higher than in previous solar minima over thelast 40 years. Nevertheless, the total flux of galactic cosmic rayprotons, which dominates and peaks around 200 MeV, gives atotal proton flux of 3 − 4 × 10³ particles m−2 sr−1 s−1 MeV−1.
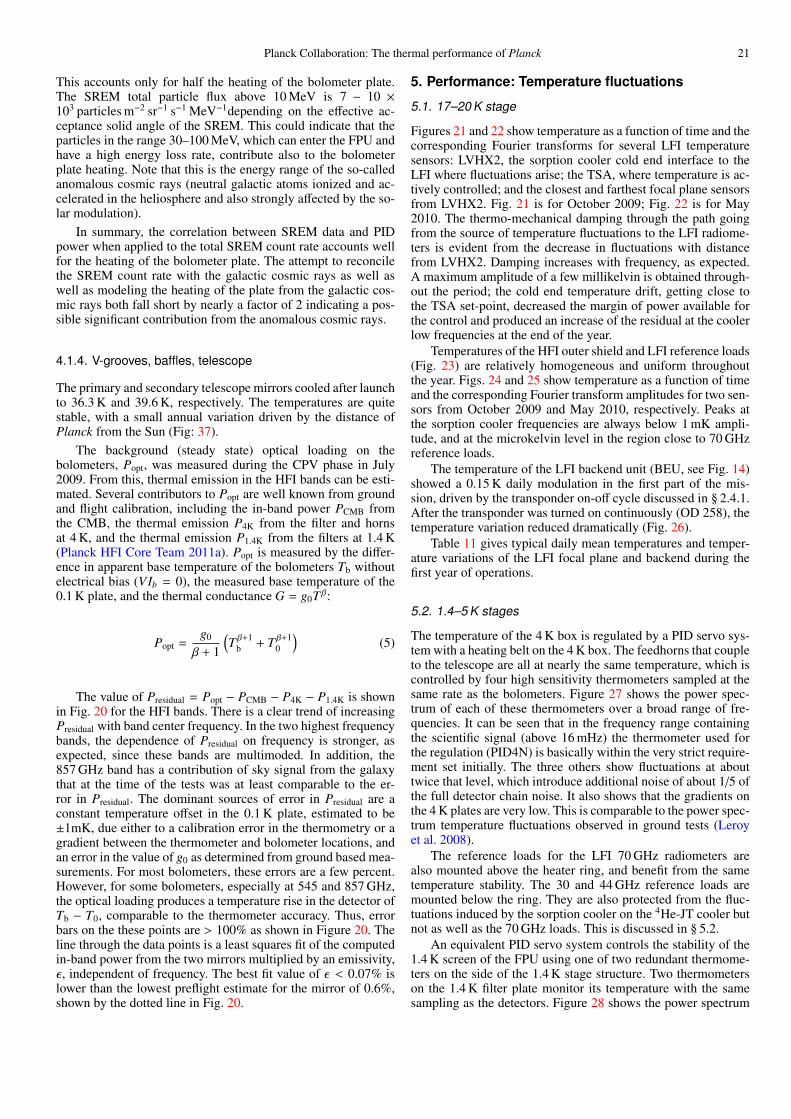
Planck Collaboration: The thermal performance of Planck 21
This accounts only for half the heating of the bolometer plate.The SREM total particle flux above 10 MeV is 7 − 10 ×103 particles m−2 sr−1 s−1 MeV−1depending on the effective ac-ceptance solid angle of the SREM. This could indicate that theparticles in the range 30–100 MeV, which can enter the FPU andhave a high energy loss rate, contribute also to the bolometerplate heating. Note that this is the energy range of the so-calledanomalous cosmic rays (neutral galactic atoms ionized and ac-celerated in the heliosphere and also strongly affected by the so-lar modulation).
In summary, the correlation between SREM data and PIDpower when applied to the total SREM count rate accounts wellfor the heating of the bolometer plate. The attempt to reconcilethe SREM count rate with the galactic cosmic rays as well aswell as modeling the heating of the plate from the galactic cos-mic rays both fall short by nearly a factor of 2 indicating a pos-sible significant contribution from the anomalous cosmic rays.
4.1.4. V-grooves, baffles, telescope
The primary and secondary telescope mirrors cooled after launchto 36.3 K and 39.6 K, respectively. The temperatures are quitestable, with a small annual variation driven by the distance ofPlanck from the Sun (Fig: 37).
The background (steady state) optical loading on thebolometers, Popt, was measured during the CPV phase in July2009. From this, thermal emission in the HFI bands can be esti-mated. Several contributors to Popt are well known from groundand flight calibration, including the in-band power PCMB fromthe CMB, the thermal emission P4K from the filter and hornsat 4 K, and the thermal emission P1.4K from the filters at 1.4 K(Planck HFI Core Team 2011a). Popt is measured by the differ-ence in apparent base temperature of the bolometers Tb withoutelectrical bias (VIb = 0), the measured base temperature of the0.1 K plate, and the thermal conductance G = g0T β:
Popt =g0
β + 1
(T β+1
b + T β+10
)(5)
The value of Presidual = Popt − PCMB − P4K − P1.4K is shownin Fig. 20 for the HFI bands. There is a clear trend of increasingPresidual with band center frequency. In the two highest frequencybands, the dependence of Presidual on frequency is stronger, asexpected, since these bands are multimoded. In addition, the857 GHz band has a contribution of sky signal from the galaxythat at the time of the tests was at least comparable to the er-ror in Presidual. The dominant sources of error in Presidual are aconstant temperature offset in the 0.1 K plate, estimated to be±1mK, due either to a calibration error in the thermometry or agradient between the thermometer and bolometer locations, andan error in the value of g0 as determined from ground based mea-surements. For most bolometers, these errors are a few percent.However, for some bolometers, especially at 545 and 857 GHz,the optical loading produces a temperature rise in the detector ofTb − T0, comparable to the thermometer accuracy. Thus, errorbars on the these points are > 100% as shown in Figure 20. Theline through the data points is a least squares fit of the computedin-band power from the two mirrors multiplied by an emissivity,ε, independent of frequency. The best fit value of ε < 0.07% islower than the lowest preflight estimate for the mirror of 0.6%,shown by the dotted line in Fig. 20.
5. Performance: Temperature fluctuations
5.1. 17–20 K stage
Figures 21 and 22 show temperature as a function of time and thecorresponding Fourier transforms for several LFI temperaturesensors: LVHX2, the sorption cooler cold end interface to theLFI where fluctuations arise; the TSA, where temperature is ac-tively controlled; and the closest and farthest focal plane sensorsfrom LVHX2. Fig. 21 is for October 2009; Fig. 22 is for May2010. The thermo-mechanical damping through the path goingfrom the source of temperature fluctuations to the LFI radiome-ters is evident from the decrease in fluctuations with distancefrom LVHX2. Damping increases with frequency, as expected.A maximum amplitude of a few millikelvin is obtained through-out the period; the cold end temperature drift, getting close tothe TSA set-point, decreased the margin of power available forthe control and produced an increase of the residual at the coolerlow frequencies at the end of the year.
Temperatures of the HFI outer shield and LFI reference loads(Fig. 23) are relatively homogeneous and uniform throughoutthe year. Figs. 24 and 25 show temperature as a function of timeand the corresponding Fourier transform amplitudes for two sen-sors from October 2009 and May 2010, respectively. Peaks atthe sorption cooler frequencies are always below 1 mK ampli-tude, and at the microkelvin level in the region close to 70 GHzreference loads.
The temperature of the LFI backend unit (BEU, see Fig. 14)showed a 0.15 K daily modulation in the first part of the mis-sion, driven by the transponder on-off cycle discussed in § 2.4.1.After the transponder was turned on continuously (OD 258), thetemperature variation reduced dramatically (Fig. 26).
Table 11 gives typical daily mean temperatures and temper-ature variations of the LFI focal plane and backend during thefirst year of operations.
5.2. 1.4–5 K stages
The temperature of the 4 K box is regulated by a PID servo sys-tem with a heating belt on the 4 K box. The feedhorns that coupleto the telescope are all at nearly the same temperature, which iscontrolled by four high sensitivity thermometers sampled at thesame rate as the bolometers. Figure 27 shows the power spec-trum of each of these thermometers over a broad range of fre-quencies. It can be seen that in the frequency range containingthe scientific signal (above 16 mHz) the thermometer used forthe regulation (PID4N) is basically within the very strict require-ment set initially. The three others show fluctuations at abouttwice that level, which introduce additional noise of about 1/5 ofthe full detector chain noise. It also shows that the gradients onthe 4 K plates are very low. This is comparable to the power spec-trum temperature fluctuations observed in ground tests (Leroyet al. 2008).
The reference loads for the LFI 70 GHz radiometers arealso mounted above the heater ring, and benefit from the sametemperature stability. The 30 and 44 GHz reference loads aremounted below the ring. They are also protected from the fluc-tuations induced by the sorption cooler on the 4He-JT cooler butnot as well as the 70 GHz loads. This is discussed in § 5.2.
An equivalent PID servo system controls the stability of the1.4 K screen of the FPU using one of two redundant thermome-ters on the side of the 1.4 K stage structure. Two thermometerson the 1.4 K filter plate monitor its temperature with the samesampling as the detectors. Figure 28 shows the power spectrum
22 Planck Collaboration: The thermal performance of Planck
Fig. 19. Thermal behaviour of the 100 mK stage during the 4 K shutdown on 6 August 2009. The vibration level of the 4 K propagatedto the dilution is measured from the step in the blue curve (signal of the active regulation of the dilution) after the rapid drop of the4 K. It is equal to 26 nW.
of each of these thermometers over the same range of frequen-cies. They stay well below -10–30 times - the requirement of28 µK Hz−1/2 (0.016–100 Hz) in the frequency range containingthe scientific signal. The additional noise is typically smallerthan 2% of the detector chain noise in line with ground mea-surements (Pajot et al. 2010).
In summary, these two stages behave exactly as designed andas tested on the ground. They do not add any significant noise tothe measurements.
5.3. 0.1 K stage
In ground tests the natural fluctuations of the dilution cold headwere essentially eliminated by PID control (low frequencies) andpassive filtering (high frequencies). The PIDs on the dilutionplate and bolometer plate inject variable but known heat inputswith average values of 28 and 5 nW, respectively. Fluctuationswere basically within requirements during the ground tests Pajotet al. (2010), but perturbations from the test setting such as vi-brations associated with helium transfer limited our ability to testvery precisely this requirement .
In flight, the microwave radiation reaching the bolometers isvariable but so small (0.12 nW) that it does not affect thermalbehaviour.
In flight, cosmic rays above about 30 MeV penetrate theFPU box, causing glitches in the PID thermometers and deposit-ing energy in the bolometer and dilution plates as discussed in§ 4.1.3. The bolometer plate PID had to be set with long enoughtime constants that it did not generate temperature fluctuations
from the glitch signals. As discussed in §§ 4.1.3 and 5.3.1, theflux of galactic cosmic rays is modulated by the solar wind. Thisis a significant variable heat source not present in ground tests.
Figure 31 shows the bolometer plate temperature and the cor-responding power spectrum, for ground tests and in flight. Thetemperature data have been “deglitched” (cosmic ray hits pro-ducing a signal significantly larger than the noise have been de-tected and removed). It is clear that in the frequency range below10 mHz there is an excess of fluctuations in flight with respect toground testing but not affecting the science data. There is smallerexcess in the 16–40 mHz range above the requirements and af-fecting the data. This noise component is not fully correlatedacross the bolometer plate.
5.4. Bolometer Plate—Particle Contribution
Big solar flares—typically 10 to 20 per solar cycle or at mostthree during the mission—are expected to heat up the bolometerplate from 100 mK to 500 mK. This will create gaps in the surveyof a few days. None has been seen in the nominal mission (andup to end 2010).
The particle flux on the satellite is monitored by the SREMas discussed in § 4.1.3. Although mainly aimed at monitoringsolar particles during flares, it also detects galactic cosmic rays,which dominate in periods of low solar activity. Protons dom-inate (electrons are only 1% of the protons of a given energyand can be ignored). The protons are detected in the range 20–600 MeV, the range in which the energy deposited in matter isdominated by ionization. Figure 29 shows the excellent corre-
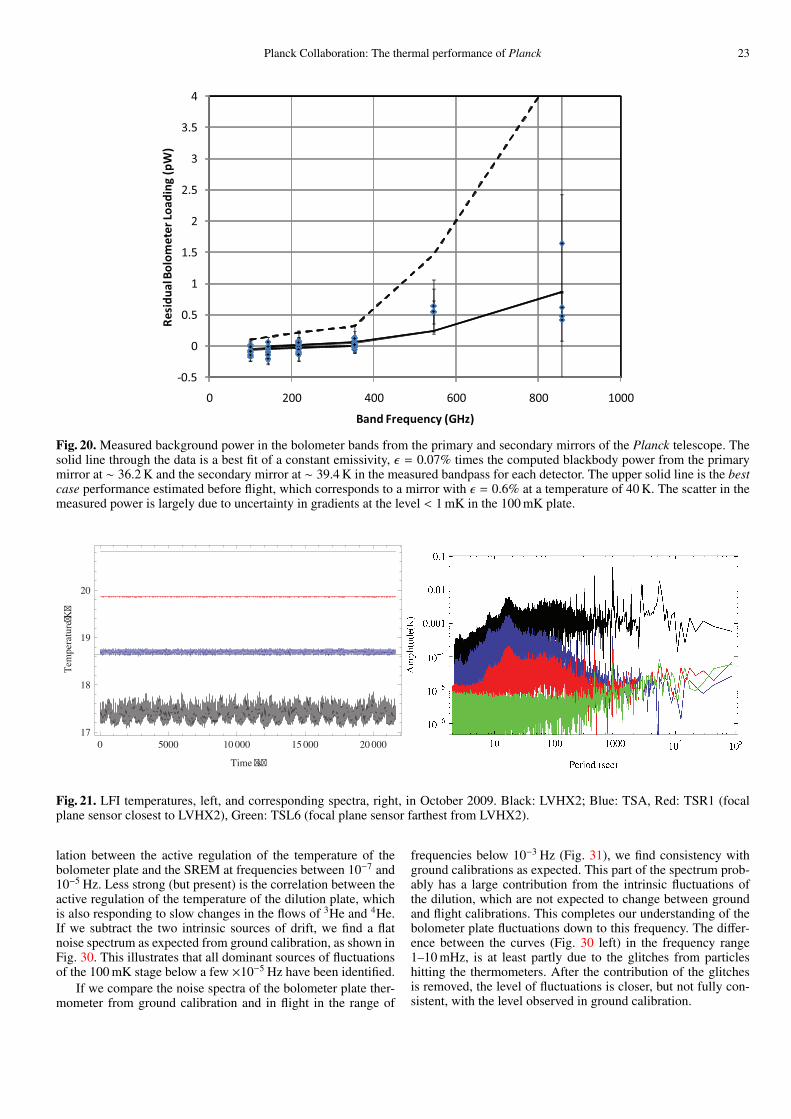
Planck Collaboration: The thermal performance of Planck 23
-0.5
0
0.5
1
1.5
2
2.5
3
3.5
4
0 200 400 600 800 1000
Resi
dual
Bol
omet
er Lo
adin
g (p
W)
Band Frequency (GHz)
Fig. 20. Measured background power in the bolometer bands from the primary and secondary mirrors of the Planck telescope. Thesolid line through the data is a best fit of a constant emissivity, ε = 0.07% times the computed blackbody power from the primarymirror at ∼ 36.2 K and the secondary mirror at ∼ 39.4 K in the measured bandpass for each detector. The upper solid line is the bestcase performance estimated before flight, which corresponds to a mirror with ε = 0.6% at a temperature of 40 K. The scatter in themeasured power is largely due to uncertainty in gradients at the level < 1 mK in the 100 mK plate.
0 5000 10 000 15 000 20 000
17
18
19
20
Time �s�
Temperature�K
�
Fig. 21. LFI temperatures, left, and corresponding spectra, right, in October 2009. Black: LVHX2; Blue: TSA, Red: TSR1 (focalplane sensor closest to LVHX2), Green: TSL6 (focal plane sensor farthest from LVHX2).
lation between the active regulation of the temperature of thebolometer plate and the SREM at frequencies between 10−7 and10−5 Hz. Less strong (but present) is the correlation between theactive regulation of the temperature of the dilution plate, whichis also responding to slow changes in the flows of 3He and 4He.If we subtract the two intrinsic sources of drift, we find a flatnoise spectrum as expected from ground calibration, as shown inFig. 30. This illustrates that all dominant sources of fluctuationsof the 100 mK stage below a few ×10−5 Hz have been identified.
If we compare the noise spectra of the bolometer plate ther-mometer from ground calibration and in flight in the range of
frequencies below 10−3 Hz (Fig. 31), we find consistency withground calibrations as expected. This part of the spectrum prob-ably has a large contribution from the intrinsic fluctuations ofthe dilution, which are not expected to change between groundand flight calibrations. This completes our understanding of thebolometer plate fluctuations down to this frequency. The differ-ence between the curves (Fig. 30 left) in the frequency range1–10 mHz, is at least partly due to the glitches from particleshitting the thermometers. After the contribution of the glitchesis removed, the level of fluctuations is closer, but not fully con-sistent, with the level observed in ground calibration.

24 Planck Collaboration: The thermal performance of Planck
0 5000 10 000 15 000 20 000
17.5
18.0
18.5
19.0
19.5
20.0
20.5
21.0
Time �s�
Temperature�K
�
Fig. 22. LFI focal plane temperatures, left, and corresponding Fourier transform amplitude, right, in May 2010. Black: LVHX2;Blue: TSA, Red: TSR1, Green: TSL6.
Fig. 23. Position of thermometers near the LFI reference loads.
In summary, in flight, the 100 mK temperature fluctuationsinduced by the modulation of galactic cosmic rays dominate,but they do not affect the signal. In the frequency range be-tween 16 mHz and 300 mHz, excess noise with respect to groundmeasurements is seen on the bolometers and thermometers.Furthermore any common thermal mode affecting all thermome-ters and bolometers that is not fully corrected by the bolometerplate PID is easily removed using the dark bolometer signals (seePlanck HFI Core Team 2011b).
Showers of particles affecting more than 20 bolometerswithin a few milliseconds are also seen. (For fewer than 20bolometers, the probability of physically unrelated but tempo-rally correlated fluctuations becomes non negligible). Their ar-rival is followed by an increase in the temperature of the bolome-ter plate by up to 10 µK. The strongest showers occur at a rateof about one per day. Smaller temperature increases of order0.01–0.1 µK occur at a rate of one per hour. These showersare likely to be induced by high energy particles interacting
with parts of the payload, leaving energy in the bolometers andalso in the 100 mK stage. The detailed physics of these eventsis not yet understood, but their phenomenological behaviour iswell known. The temperature increases of the bolometer platelast up to one hour, in agreement with the time constant of theyttrium-holmium link to the dilution. The bolometer plate itself,coated with copper and gold, becomes isothermal in millisec-onds. Fluctuations induced by these particles on the bolometerplate itself are therefore removed along with the other commonmodes. However, the bolometer housings have time constantsrelative to the bolometer plate of 1–2 s. The bolometers (and re-lated housings) directly touched by the shower particles heat upsuddenly, then cool down while the bolometers and housings un-touched by the shower heat up under the influence of the bolome-ter plate. This induces for a short time interval of a few seconds anon-uniform thermal behaviour of the bolometer housings. Thissystematic effect is not yet treated in the pipeline used for theearly papers and is not a dominant effect. It is still one of the
Planck Collaboration: The thermal performance of Planck 25
Fig. 24. Daily behaviour of temperatures in the HFI outer shield in October 2009, left, and corresponding Fourier transform ampli-tude, right. Black: 4KL1 sensor (close to 30 and 44 GHz loads); Blue: PIDN sensor (close to 70 GHz loads.
Fig. 25. Daily behaviour of temperatures in the HFI outer shield in May 2010, left, and corresponding Fourier transform amplitude,right. Black: 4KL1 sensor (close to 30 and 44 GHz loads); Blue: PIDN sensor (close to 70 GHz loads.
1000 104
105
10�5
10�4
0.001
0.01
Period �sec�
Amplitude�K�
Fig. 26. Left plot: LFI backend temperatures (black: Left BEM1 sensor, blue: Left BEM2 sensor, red: Right BEM1 sensor, green:Right BEM2 sensor) around operational day (OD) 258 of flight operations, when the transition to an always-on condition for thetransponder was implemented. Right plot: comparison of the Fourier transform amplitude of the Left BEM1 sensor before (black)and after (blue) transition to stable, showing the daily time scale peaks disappearing.
26 Planck Collaboration: The thermal performance of Planck
Table 11. Mean values and daily stability of the main LFI temperature sensors in two cases representative of the best and worstcase. The early phase was the best case for the focal plane and the worst case for the backend; the late phase was the opposite.
Early Phasea Late Phaseb
T σT ∆Tp−p T σT ∆Tp−pSensor [K] [K] [K] [K] [K] [K]
TS1R . . . . . . . . . . . . . . . . 19.865 0.0036 0.026 20.007 0.0169 0.127TS2R . . . . . . . . . . . . . . . . 20.506 0.0008 0.007 20.639 0.0075 0.050TS3R . . . . . . . . . . . . . . . . 20.399 0.0008 0.007 20.532 0.0077 0.052TS4R . . . . . . . . . . . . . . . . 20.037 0.0014 0.011 20.176 0.0118 0.085TS5R . . . . . . . . . . . . . . . . 20.388 0.0005 0.005 20.521 0.0078 0.053TS6R . . . . . . . . . . . . . . . . 20.587 0.0005 0.004 20.719 0.0053 0.031TS1L . . . . . . . . . . . . . . . . 20.635 0.0008 0.006 20.771 0.0038 0.022TS2L . . . . . . . . . . . . . . . . 20.480 0.0008 0.007 20.614 0.0051 0.032TS3L . . . . . . . . . . . . . . . . 20.090 0.0012 0.009 20.227 0.0098 0.072TS4L . . . . . . . . . . . . . . . . 20.755 0.0008 0.006 20.891 0.0038 0.022TS5L . . . . . . . . . . . . . . . . 20.569 0.0005 0.004 20.705 0.0044 0.025TS6L . . . . . . . . . . . . . . . . 20.826 0.0005 0.004 20.964 0.0039 0.021
L-BEM1 . . . . . . . . . . . . . . 289.232 0.040 0.177 289.899 0.0156 0.095L-BEM2 . . . . . . . . . . . . . . 291.694 0.041 0.198 292.380 0.0158 0.100R-BEM1 . . . . . . . . . . . . . . 291.923 0.045 0.179 292.709 0.0141 0.080R-BEM2 . . . . . . . . . . . . . . 289.366 0.044 0.181 290.137 0.0144 0.085
a “Early Phase” means sorption cooler FM2 operating, transponder cycling. “Late Phase” means sorption cooler FM1 operating, transponderalways on.
Fig. 27. Power spectrum of thermal fluctuations measured at the feedhorns that couple to the telescope.
possible contributors of the remaining low frequency noise seenin flight which was not present in ground tests (see Planck HFICore Team 2011a).
5.5. Transients, cooldown timescale
At the end of the CPV phase a set of tests were performed tocharacterize the timescales and propagation of thermal fluctua-tions, as well as the response of the radiometers to changes intemperature.
The dynamic response of the LFI focal plane to turningoff the TSA was measured, along with the transfer functions
Planck Collaboration: The thermal performance of Planck 27
Fig. 28. Power spectrum of thermal fluctuations measured at the 1.4 K filter plate.
Fig. 29. Correlation between the signal of the SREM (in red) and the inverse signal of the active regulation of the temperature ofthe plate stage (in green) for the frequency range 10−7–10−5 Hz. The signal of the active regulation of the dilution plate in shown inblue.

28 Planck Collaboration: The thermal performance of Planck
Fig. 30. Correction of the signal of the active regulation of the temperature of the bolometer plate stage with the SREM (firstcorrection in green) signal and the active regulation of the dilution stage (second correction in blue) in time domain (left) andfrequency domain (right).
Fig. 31. Comparison of the signal of the thermometer of the bolometer plate stage between ground calibration and flight in timedomain (left) and in frequency domain (right). The requirements are calculated for one bolometer.
between the various thermal sensors in the LFI focal plane.Figure 32 shows the locations of the sensors. Figure 33 showsthe response of the system when the TSA is turned off.
The focal plane temperature is quite stable over time(Fig. 34), showing a long term drift caused by the orbital varia-tion in the Earth’s distance from the Sun. Starting at about day350, changes in the TSA control set-point were needed in orderto keep the stability within acceptable limits.
The temperature of the LFI backend unit, mounted in theSVM, was much less stable, showing a strong daily variationdriven by the transponder. As described in § 2.4.1, the solutionwas to keep the transponder on continuously; in the second partof the first year of operations the only residual effect was thecommon SVM seasonal drift, with some further discontinuityrelated with major sorption cooler operations (Fig. 35).
The LFI reference loads (Valenziano et al. 2009) are ther-mally connected to the HFI outer shield. Temperature fluctua-tions in the lower part of the shield are transmitted to the 30 and44 GHz reference targets. Temperature fluctuations in the upper
part of the shield are almost entirely damped by the PID controls(§ 2.4.5). The temperature shows a 1 mK peak-to-peak fluctua-tion amplitude at the typical time scales of the sorption coolerand the overall seasonal drift (Fig. 36).
5.6. Seasonal effects
The dominant seasonal effect comes from the annual variation inthe distance of Planck from the Sun. Figure 37 shows the temper-atures of the solar array, VG3, and the primary mirror for about500 days starting 22 June 2009 (i.e., during the initial cooldown).
5.7. Interactions between systems and instruments
5.7.1. Behavior of liquid hydrogen at 20 K
Temperature and temperature fluctuations are shown for two dif-ferent regimes in the cold end. On the left side of Fig. 38, thefluctuations are much “cleaner” than on the right side, i.e., with
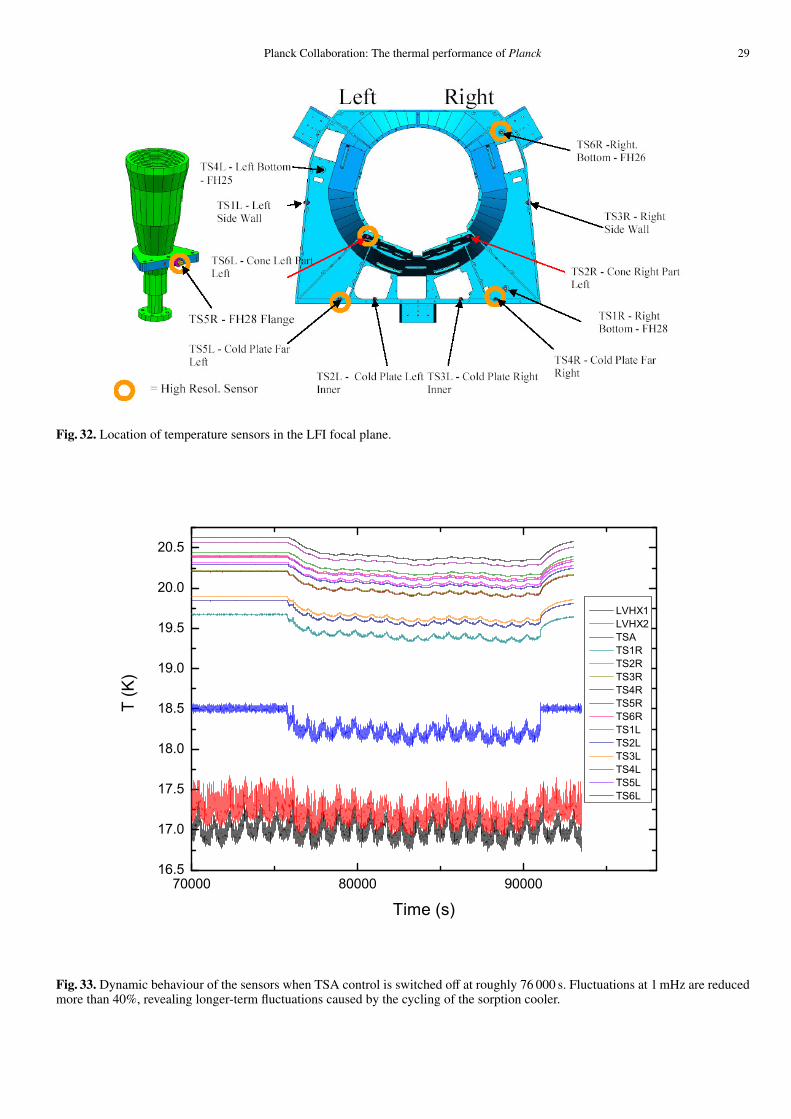
Planck Collaboration: The thermal performance of Planck 29
Fig. 32. Location of temperature sensors in the LFI focal plane.
70000 80000 9000016.5
17.0
17.5
18.0
18.5
19.0
19.5
20.0
20.5
T (K
)
Time (s)
LVHX1 LVHX2 TSA TS1R TS2R TS3R TS4R TS5R TS6R TS1L TS2L TS3L TS4L TS5L TS6L
Fig. 33. Dynamic behaviour of the sensors when TSA control is switched off at roughly 76 000 s. Fluctuations at 1 mHz are reducedmore than 40%, revealing longer-term fluctuations caused by the cycling of the sorption cooler.

30 Planck Collaboration: The thermal performance of Planck
Fig. 34. Temperature from LFI focal plane sensors TSL1 to TSL6 in the period from 125 to 389 days after launch. Until intentionalchanges in TSA setpoint started around day 350, the temperature shows only a slow drift correlated with distance from the Sun. Seealso Fig. 37
Fig. 35. Temperature of the LFI backend sensors (left back end block sensors) in the period going from 125 to 389 days after launch.Until day 260, the transponder was on only during downlinks. This approximately diurnal variation drove a large periodic variationin temperature. After day 260, the transponder was left on continuously, and the daily temperature variations became much smaller.
lower fluctuation levels especially at high frequencies. This be-havior is well understood and was observed during ground test-ing. The cold-end, in the left regime, is in a balanced state (heatlift = power dissipation) where the liquid interface is drawn intothe LVHX2 body. In contrast, the cold end in the right regime isin an unbalanced state (heat lift > power dissipation) in whichexcess liquid forms. The increased fluctuations are due to plug-
flow events as the liquid interface moves into the counter-flowheat exchanger just past the LVHX2 body.
5.7.2. Behavior of liquid helium at 4 K and 1.4 K
Liquid 4He is generated at the 4 K precool and at the 1.4 K JT.Instabilities developed during the CQM CSL test (§ 3.2) whenthe 1.4 K stage was too cold, and in flight when the 4 K stage was
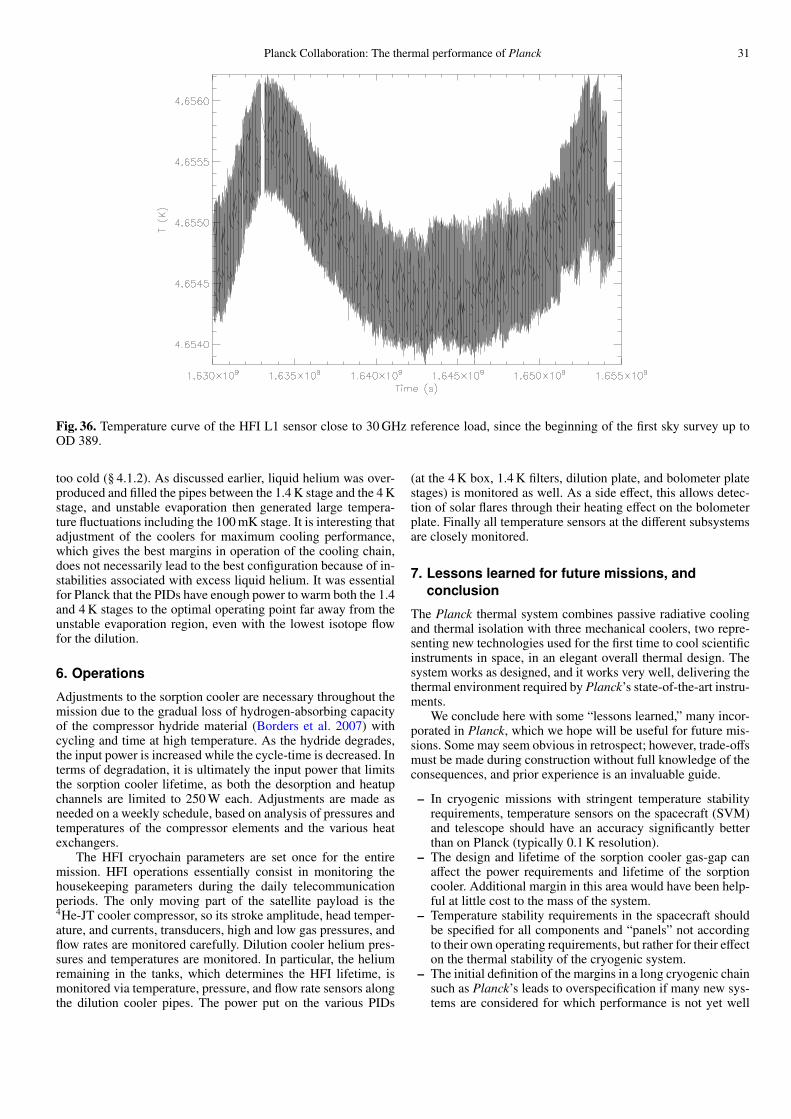
Planck Collaboration: The thermal performance of Planck 31
Fig. 36. Temperature curve of the HFI L1 sensor close to 30 GHz reference load, since the beginning of the first sky survey up toOD 389.
too cold (§ 4.1.2). As discussed earlier, liquid helium was over-produced and filled the pipes between the 1.4 K stage and the 4 Kstage, and unstable evaporation then generated large tempera-ture fluctuations including the 100 mK stage. It is interesting thatadjustment of the coolers for maximum cooling performance,which gives the best margins in operation of the cooling chain,does not necessarily lead to the best configuration because of in-stabilities associated with excess liquid helium. It was essentialfor Planck that the PIDs have enough power to warm both the 1.4and 4 K stages to the optimal operating point far away from theunstable evaporation region, even with the lowest isotope flowfor the dilution.
6. Operations
Adjustments to the sorption cooler are necessary throughout themission due to the gradual loss of hydrogen-absorbing capacityof the compressor hydride material (Borders et al. 2007) withcycling and time at high temperature. As the hydride degrades,the input power is increased while the cycle-time is decreased. Interms of degradation, it is ultimately the input power that limitsthe sorption cooler lifetime, as both the desorption and heatupchannels are limited to 250 W each. Adjustments are made asneeded on a weekly schedule, based on analysis of pressures andtemperatures of the compressor elements and the various heatexchangers.
The HFI cryochain parameters are set once for the entiremission. HFI operations essentially consist in monitoring thehousekeeping parameters during the daily telecommunicationperiods. The only moving part of the satellite payload is the4He-JT cooler compressor, so its stroke amplitude, head temper-ature, and currents, transducers, high and low gas pressures, andflow rates are monitored carefully. Dilution cooler helium pres-sures and temperatures are monitored. In particular, the heliumremaining in the tanks, which determines the HFI lifetime, ismonitored via temperature, pressure, and flow rate sensors alongthe dilution cooler pipes. The power put on the various PIDs
(at the 4 K box, 1.4 K filters, dilution plate, and bolometer platestages) is monitored as well. As a side effect, this allows detec-tion of solar flares through their heating effect on the bolometerplate. Finally all temperature sensors at the different subsystemsare closely monitored.
7. Lessons learned for future missions, andconclusion
The Planck thermal system combines passive radiative coolingand thermal isolation with three mechanical coolers, two repre-senting new technologies used for the first time to cool scientificinstruments in space, in an elegant overall thermal design. Thesystem works as designed, and it works very well, delivering thethermal environment required by Planck’s state-of-the-art instru-ments.
We conclude here with some “lessons learned,” many incor-porated in Planck, which we hope will be useful for future mis-sions. Some may seem obvious in retrospect; however, trade-offsmust be made during construction without full knowledge of theconsequences, and prior experience is an invaluable guide.
– In cryogenic missions with stringent temperature stabilityrequirements, temperature sensors on the spacecraft (SVM)and telescope should have an accuracy significantly betterthan on Planck (typically 0.1 K resolution).
– The design and lifetime of the sorption cooler gas-gap canaffect the power requirements and lifetime of the sorptioncooler. Additional margin in this area would have been help-ful at little cost to the mass of the system.
– Temperature stability requirements in the spacecraft shouldbe specified for all components and “panels” not accordingto their own operating requirements, but rather for their effecton the thermal stability of the cryogenic system.
– The initial definition of the margins in a long cryogenic chainsuch as Planck’s leads to overspecification if many new sys-tems are considered for which performance is not yet well
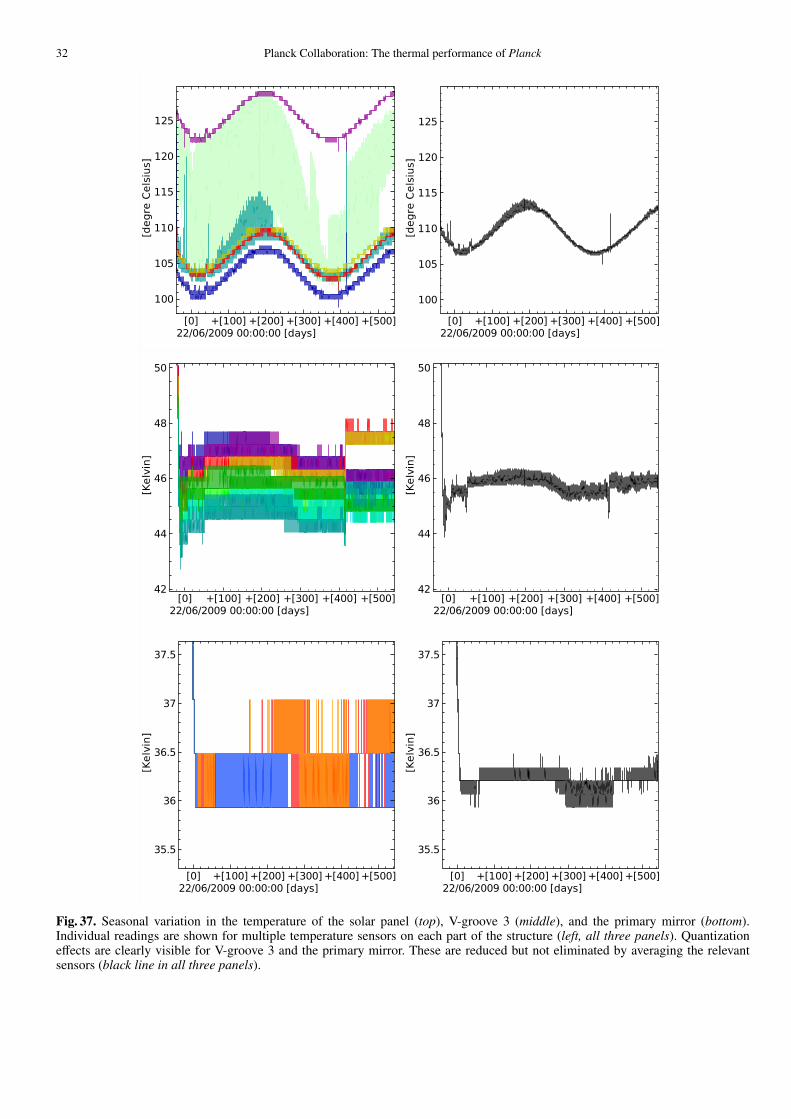
32 Planck Collaboration: The thermal performance of Planck
Fig. 37. Seasonal variation in the temperature of the solar panel (top), V-groove 3 (middle), and the primary mirror (bottom).Individual readings are shown for multiple temperature sensors on each part of the structure (left, all three panels). Quantizationeffects are clearly visible for V-groove 3 and the primary mirror. These are reduced but not eliminated by averaging the relevantsensors (black line in all three panels).
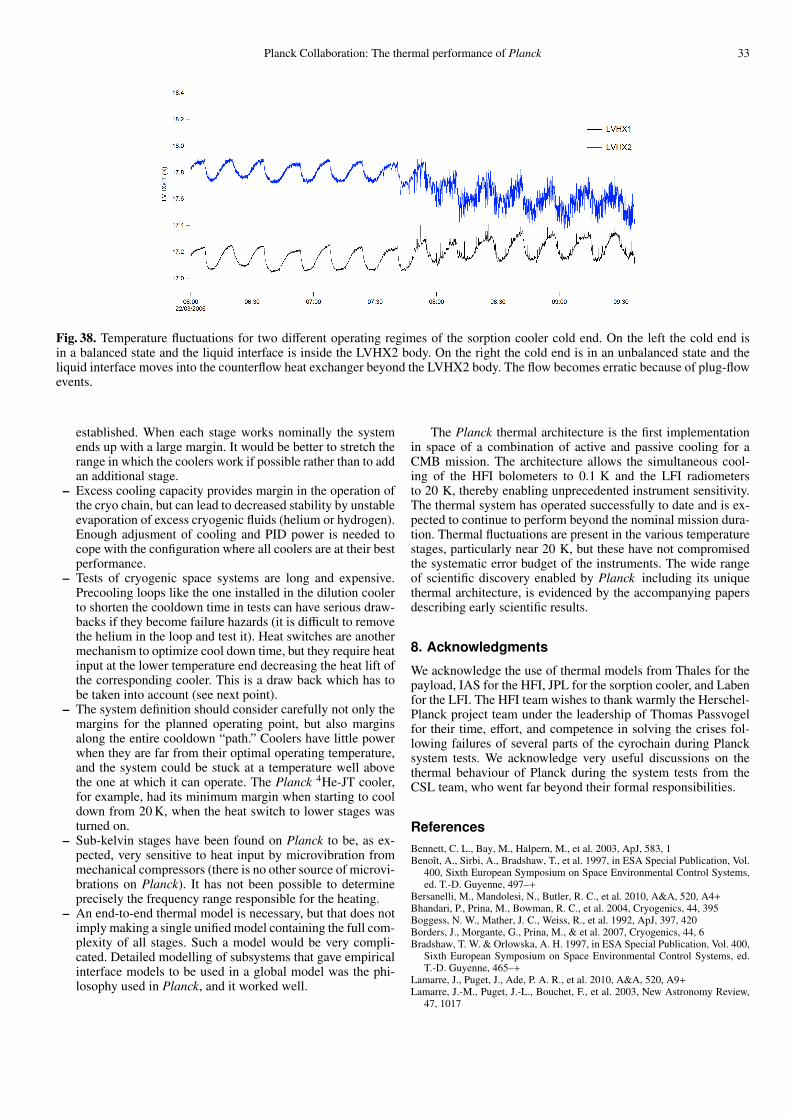
Planck Collaboration: The thermal performance of Planck 33
!Fig. 38. Temperature fluctuations for two different operating regimes of the sorption cooler cold end. On the left the cold end isin a balanced state and the liquid interface is inside the LVHX2 body. On the right the cold end is in an unbalanced state and theliquid interface moves into the counterflow heat exchanger beyond the LVHX2 body. The flow becomes erratic because of plug-flowevents.
established. When each stage works nominally the systemends up with a large margin. It would be better to stretch therange in which the coolers work if possible rather than to addan additional stage.
– Excess cooling capacity provides margin in the operation ofthe cryo chain, but can lead to decreased stability by unstableevaporation of excess cryogenic fluids (helium or hydrogen).Enough adjusment of cooling and PID power is needed tocope with the configuration where all coolers are at their bestperformance.
– Tests of cryogenic space systems are long and expensive.Precooling loops like the one installed in the dilution coolerto shorten the cooldown time in tests can have serious draw-backs if they become failure hazards (it is difficult to removethe helium in the loop and test it). Heat switches are anothermechanism to optimize cool down time, but they require heatinput at the lower temperature end decreasing the heat lift ofthe corresponding cooler. This is a draw back which has tobe taken into account (see next point).
– The system definition should consider carefully not only themargins for the planned operating point, but also marginsalong the entire cooldown “path.” Coolers have little powerwhen they are far from their optimal operating temperature,and the system could be stuck at a temperature well abovethe one at which it can operate. The Planck 4He-JT cooler,for example, had its minimum margin when starting to cooldown from 20 K, when the heat switch to lower stages wasturned on.
– Sub-kelvin stages have been found on Planck to be, as ex-pected, very sensitive to heat input by microvibration frommechanical compressors (there is no other source of microvi-brations on Planck). It has not been possible to determineprecisely the frequency range responsible for the heating.
– An end-to-end thermal model is necessary, but that does notimply making a single unified model containing the full com-plexity of all stages. Such a model would be very compli-cated. Detailed modelling of subsystems that gave empiricalinterface models to be used in a global model was the phi-losophy used in Planck, and it worked well.
The Planck thermal architecture is the first implementationin space of a combination of active and passive cooling for aCMB mission. The architecture allows the simultaneous cool-ing of the HFI bolometers to 0.1 K and the LFI radiometersto 20 K, thereby enabling unprecedented instrument sensitivity.The thermal system has operated successfully to date and is ex-pected to continue to perform beyond the nominal mission dura-tion. Thermal fluctuations are present in the various temperaturestages, particularly near 20 K, but these have not compromisedthe systematic error budget of the instruments. The wide rangeof scientific discovery enabled by Planck including its uniquethermal architecture, is evidenced by the accompanying papersdescribing early scientific results.
8. Acknowledgments
We acknowledge the use of thermal models from Thales for thepayload, IAS for the HFI, JPL for the sorption cooler, and Labenfor the LFI. The HFI team wishes to thank warmly the Herschel-Planck project team under the leadership of Thomas Passvogelfor their time, effort, and competence in solving the crises fol-lowing failures of several parts of the cyrochain during Plancksystem tests. We acknowledge very useful discussions on thethermal behaviour of Planck during the system tests from theCSL team, who went far beyond their formal responsibilities.
ReferencesBennett, C. L., Bay, M., Halpern, M., et al. 2003, ApJ, 583, 1Benoıt, A., Sirbi, A., Bradshaw, T., et al. 1997, in ESA Special Publication, Vol.
400, Sixth European Symposium on Space Environmental Control Systems,ed. T.-D. Guyenne, 497–+
Bersanelli, M., Mandolesi, N., Butler, R. C., et al. 2010, A&A, 520, A4+Bhandari, P., Prina, M., Bowman, R. C., et al. 2004, Cryogenics, 44, 395Boggess, N. W., Mather, J. C., Weiss, R., et al. 1992, ApJ, 397, 420Borders, J., Morgante, G., Prina, M., & et al. 2007, Cryogenics, 44, 6Bradshaw, T. W. & Orlowska, A. H. 1997, in ESA Special Publication, Vol. 400,
Sixth European Symposium on Space Environmental Control Systems, ed.T.-D. Guyenne, 465–+
Lamarre, J., Puget, J., Ade, P. A. R., et al. 2010, A&A, 520, A9+Lamarre, J.-M., Puget, J.-L., Bouchet, F., et al. 2003, New Astronomy Review,
47, 1017

34 Planck Collaboration: The thermal performance of Planck
Leahy, J. P., Bersanelli, M., D’Arcangelo, O., et al. 2010, A&A, 520, A8+Leroy, C., Maisonneuve, M., Piat, M., et al. 2008, in Society of Photo-Optical
Instrumentation Engineers (SPIE) Conference Series, Vol. 7017, Society ofPhoto-Optical Instrumentation Engineers (SPIE) Conference Series
Madet, K. 2002, PhD thesis, Universite Joseph Fourier (Grenoble 1)Mandolesi, N., Bersanelli, M., Butler, R. C., et al. 2010, A&A, 520, A3+Mather, J. C., Cheng, E. S., Eplee, Jr., R. E., et al. 1990, ApJ, 354, L37Mennella et al. 2011, Planck early results 03: First assessment of the Low
Frequency Instrument in-flight performance (Submitted to A&A)Mewaldt, R. A., Davis, A. J., Lave, K. A., et al. 2010, ApJ, 723, L1Morgante, G., Pearson, D., Melot, F., et al. 2009, Journal of Instrumentation, 4,
2016Pajot, F., Ade, P. A. R., Beney, J., et al. 2010, A&A, 520, A10+Pearson, D., Zhang, B., M., P., & et al. 2007, Cryocoolers, 14Piat, M. 2000, PhD thesis, Universite de Paris-Sud (Paris XI)Piat, M., Lamarre, J.-M., Meissonnier, J., et al. 2003, in Society of Photo-Optical
Instrumentation Engineers (SPIE) Conference Series, Vol. 4850, Society ofPhoto-Optical Instrumentation Engineers (SPIE) Conference Series, ed. J. C.Mather, 740–748
Piat, M., Leriche, B., Torre, J.-P., et al. 2000, Nuclear Instruments and Methodsin Physics Research A, 444, 413
Piat, M., Torre, J.-P., Lamarre, J.-M., Beeman, J. W., & Bhatia, R. S. 2001,Journal of Low Temperature Physics, 125
Piat, M., Torre, J.-P., Lamarre, J.-M., et al. 2002, Low Temperature Detectors,605, 79
Planck Collaboration. 2011a, Planck early results 01: The Planck mission(Submitted to A&A)
Planck Collaboration. 2011b, Planck early results 02: The thermal performanceof Planck (Submitted to A&A)
Planck Collaboration. 2011c, Planck early results 07: The Early ReleaseCompact Source Catalogue (Submitted to A&A)
Planck Collaboration. 2011d, Planck early results 08: The all-sky early Sunyaev-Zeldovich cluster sample (Submitted to A&A)
Planck Collaboration. 2011e, Planck early results 09: XMM-Newton follow-upfor validation of Planck cluster candidates (Submitted to A&A)
Planck Collaboration. 2011f, Planck early results 10: Statistical analysis ofSunyaev-Zeldovich scaling relations for X-ray galaxy clusters (Submitted toA&A)
Planck Collaboration. 2011g, Planck early results 11: Calibration of the localgalaxy cluster Sunyaev-Zeldovich scaling relations (Submitted to A&A)
Planck Collaboration. 2011h, Planck early results 12: Cluster Sunyaev-Zeldovich optical Scaling relations (Submitted to A&A)
Planck Collaboration. 2011i, Planck early results 13: Statistical properties ofextragalactic radio sources in the Planck Early Release Compact SourceCatalogue (Submitted to A&A)
Planck Collaboration. 2011j, Planck early results 14: Early Release CompactSource Catalogue validation and extreme radio sources (Submitted to A&A)
Planck Collaboration. 2011k, Planck early results 15: Spectral energy distri-butions and radio continuum spectra of northern extragalactic radio sources(Submitted to A&A)
Planck Collaboration. 2011l, Planck early results 16: The Planck view of nearbygalaxies (Submitted to A&A)
Planck Collaboration. 2011m, Planck early results 17: Origin of the submillime-tre excess dust emission in the Magellanic Clouds (Submitted to A&A)
Planck Collaboration. 2011n, Planck early results 18: The power spectrum ofcosmic infrared background anisotropies (Submitted to A&A)
Planck Collaboration. 2011o, Planck early results 19: All-sky temperature anddust optical depth from Planck and IRAS — constraints on the “dark gas” inour Galaxy (Submitted to A&A)
Planck Collaboration. 2011p, Planck early results 20: New light on anomalousmicrowave emission from spinning dust grains (Submitted to A&A)
Planck Collaboration. 2011q, Planck early results 21: Properties of the interstel-lar medium in the Galactic plane (Submitted to A&A)
Planck Collaboration. 2011r, Planck early results 22: The submillimetre proper-ties of a sample of Galactic cold clumps (Submitted to A&A)
Planck Collaboration. 2011s, Planck early results 23: The Galactic cold corepopulation revealed by the first all-sky survey (Submitted to A&A)
Planck Collaboration. 2011t, Planck early results 24: Dust in the diffuse inter-stellar medium and the Galactic halo (Submitted to A&A)
Planck Collaboration. 2011u, Planck early results 25: Thermal dust in nearbymolecular clouds (Submitted to A&A)
Planck Collaboration. 2011v, The Explanatory Supplement to the Planck EarlyRelease Compact Source Catalogue (ESA)
Planck HFI Core Team. 2011a, Planck early results 04: First assessment of theHigh Frequency Instrument in-flight performance (Submitted to A&A)
Planck HFI Core Team. 2011b, Planck early results 06: The High FrequencyInstrument data processing (Submitted to A&A)
Rosset, C., Tristram, M., Ponthieu, N., et al. 2010, A&A, 520, A13+
Tauber, J. A., Mandolesi, N., Puget, J., et al. 2010, A&A, 520, A1+Triqueneaux, S., Sentis, L., Camus, P., Benoıt, A., & Guyot, G. 2006,
Cryogenics, 46, 288Valenziano, L., Cuttaia, F., De Rosa, A., et al. 2009, Journal of Instrumentation,
4, 2006Zacchei et al. 2011, Planck early results 05: The Low Frequency Instrument data
processing (Submitted to A&A)
1 Aalto University Metsahovi Radio Observatory, Metsahovintie114, FIN-02540 Kylmala, Finland
2 Agenzia Spaziale Italiana Science Data Center, c/o ESRIN, viaGalileo Galilei, Frascati, Italy
3 Astroparticule et Cosmologie, CNRS (UMR7164), UniversiteDenis Diderot Paris 7, Batiment Condorcet, 10 rue A. Domon etLeonie Duquet, Paris, France
4 Atacama Large Millimeter/submillimeter Array, ALMA SantiagoCentral Offices Alonso de Cordova 3107, Vitacura, Casilla 7630355, Santiago, Chile
5 CITA, University of Toronto, 60 St. George St., Toronto, ONM5S 3H8, Canada
6 CNES, 18 avenue Edouard Belin, 31401 Toulouse Cedex 9,France
7 California Institute of Technology, Pasadena, California, U.S.A.
8 Centre of Mathematics for Applications, University of Oslo,Blindern, Oslo, Norway
9 DAMTP, Centre for Mathematical Sciences, Wilberforce Road,Cambridge CB3 0WA, U.K.
10 DTU Space, National Space Institute, Juliane Mariesvej 30,Copenhagen, Denmark
11 Departamento de Fısica, Universidad de Oviedo, Avda. CalvoSotelo s/n, Oviedo, Spain
12 Department of Astronomy and Astrophysics, University ofToronto, 50 Saint George Street, Toronto, Ontario, Canada
13 Department of Physics & Astronomy, University of BritishColumbia, 6224 Agricultural Road, Vancouver, British Columbia,Canada
14 Department of Physics, Gustaf Hallstromin katu 2a, University ofHelsinki, Helsinki, Finland
15 Department of Physics, Princeton University, Princeton, NewJersey, U.S.A.
16 Department of Physics, Purdue University, 525 NorthwesternAvenue, West Lafayette, Indiana, U.S.A.
17 Department of Physics, University of California, Berkeley,California, U.S.A.
18 Department of Physics, University of California, One ShieldsAvenue, Davis, California, U.S.A.
19 Department of Physics, University of California, Santa Barbara,California, U.S.A.
20 Department of Physics, University of Illinois at Urbana-Champaign, 1110 West Green Street, Urbana, Illinois, U.S.A.

Planck Collaboration: The thermal performance of Planck 35
21 Dipartimento di Fisica G. Galilei, Universita degli Studi diPadova, via Marzolo 8, 35131 Padova, Italy
22 Dipartimento di Fisica, Universita La Sapienza, P. le A. Moro 2,Roma, Italy
23 Dipartimento di Fisica, Universita degli Studi di Milano, ViaCeloria, 16, Milano, Italy
24 Dipartimento di Fisica, Universita degli Studi di Trieste, via A.Valerio 2, Trieste, Italy
25 Dipartimento di Fisica, Universita di Roma Tor Vergata, Via dellaRicerca Scientifica, 1, Roma, Italy
26 Discovery Center, Niels Bohr Institute, Blegdamsvej 17,Copenhagen, Denmark
27 Dpto. Astrofısica, Universidad de La Laguna (ULL), E-38206 LaLaguna, Tenerife, Spain
28 European Southern Observatory, ESO Vitacura, Alonso deCordova 3107, Vitacura, Casilla 19001, Santiago, Chile
29 European Space Agency, ESAC, Planck Science Office, Caminobajo del Castillo, s/n, Urbanizacion Villafranca del Castillo,Villanueva de la Canada, Madrid, Spain
30 European Space Agency, ESOC, Robert-Bosch-Str. 5, Darmstadt,Germany
31 European Space Agency, ESTEC, Keplerlaan 1, 2201 AZNoordwijk, The Netherlands
32 Helsinki Institute of Physics, Gustaf Hallstromin katu 2,University of Helsinki, Helsinki, Finland
33 INAF - Osservatorio Astronomico di Padova, Vicolodell’Osservatorio 5, Padova, Italy
34 INAF - Osservatorio Astronomico di Roma, via di Frascati 33,Monte Porzio Catone, Italy
35 INAF - Osservatorio Astronomico di Trieste, Via G.B. Tiepolo11, Trieste, Italy
36 INAF/IASF Bologna, Via Gobetti 101, Bologna, Italy
37 INAF/IASF Milano, Via E. Bassini 15, Milano, Italy
38 INRIA, Laboratoire de Recherche en Informatique, UniversiteParis-Sud 11, Batiment 490, 91405 Orsay Cedex, France
39 INSU, Institut des sciences de l’univers, CNRS, 3, rue Michel-Ange, 75794 Paris Cedex 16, France
40 ISDC Data Centre for Astrophysics, University of Geneva, ch.d’Ecogia 16, Versoix, Switzerland
41 Imperial College London, Astrophysics group, BlackettLaboratory, Prince Consort Road, London, SW7 2AZ, U.K.
42 Infrared Processing and Analysis Center, California Institute ofTechnology, Pasadena, CA 91125, U.S.A.
43 Institut d’Astrophysique Spatiale, CNRS (UMR8617) UniversiteParis-Sud 11, Batiment 121, Orsay, France
44 Institut d’Astrophysique de Paris, CNRS UMR7095, UniversitePierre & Marie Curie, 98 bis boulevard Arago, Paris, France
45 Institut de Ciencies de l’Espai, CSIC/IEEC, Facultat de Ciencies,Torre C5 par-2, Barcelona 08193, Spain
46 Institut de Planetologie et d’Astrophysique de Grenoble BP 53,414 rue de la piscine, 38041 Grenoble Cedex 9, France
47 Institut de Recherche en Astrophysique et Planetologie,Universite de Toulouse - CNRS, 9, av. du Colonel Roche, BP44346, F 31028 Toulouse Cedex 4, France
48 Institute of Astronomy and Astrophysics, Academia Sinica,Taipei, Taiwan
49 Institute of Theoretical Astrophysics, University of Oslo,Blindern, Oslo, Norway
50 Instituto de Astrofısica de Canarias, C/Vıa Lactea s/n, La Laguna,Tenerife, Spain
51 Instituto de Fısica de Cantabria (CSIC-Universidad de Cantabria),Avda. de los Castros s/n, Santander, Spain
52 Istituto di Fisica del Plasma, CNR-ENEA-EURATOMAssociation, Via R. Cozzi 53, Milano, Italy
53 Jet Propulsion Laboratory, California Institute of Technology,4800 Oak Grove Drive, Pasadena, California, U.S.A.
54 Jodrell Bank Centre for Astrophysics, Alan Turing Building,School of Physics and Astronomy, The University of Manchester,Oxford Road, Manchester, M13 9PL, U.K.
55 Kavli Institute for Cosmology Cambridge, Madingley Road,Cambridge, CB3 0HA, U.K.
56 LERMA, CNRS, Observatoire de Paris, 61 Avenue del’Observatoire, Paris, France
57 Laboratoire AIM, CEA/DSM-CNRS, IRFU, SPP, Centre deSaclay, F-91191 Gif- sur-Yvette Cedex, France
58 Laboratoire Traitement et Communication de l’Information,CNRS (UMR 5141) and Telecom ParisTech, 46 rue Barrault F-75634 Paris Cedex 13, France
59 Laboratoire de Physique Subatomique et de Cosmologie, CNRS,Universite Joseph Fourier Grenoble I, 53 rue des Martyrs, Grenoble,France
60 Laboratoire de l’Accelerateur Lineaire, Universite Paris-Sud 11,CNRS/IN2P3, Orsay, France
61 Lawrence Berkeley National Laboratory, Berkeley, California,U.S.A.
62 Max-Planck-Institut fur Astrophysik, Karl-Schwarzschild-Str. 1,85741 Garching, Germany
63 MilliLab, VTT Technical Research Centre of Finland, Tietotie 3,Espoo, Finland
64 National University of Ireland, Department of ExperimentalPhysics, Maynooth, Co. Kildare, Ireland
65 Niels Bohr Institute, Blegdamsvej 17, Copenhagen, Denmark
66 Observational Cosmology, Mail Stop 367-17, California Instituteof Technology, Pasadena, CA, 91125, U.S.A.

36 Planck Collaboration: The thermal performance of Planck
67 Rutherford Appleton Laboratory, Chilton, Didcot, U.K.
68 SISSA-ISAS, Astrophysics Sector, via Bonomea 265, 34136,Trieste, Italy
69 SUPA, Institute for Astronomy, University of Edinburgh, RoyalObservatory, Blackford Hill, Edinburgh EH9 3HJ, U.K.
70 School of Physics and Astronomy, Cardiff University, QueensBuildings, The Parade, Cardiff, CF24 3AA, U.K.
71 Space Sciences Laboratory, University of California, Berkeley,California, U.S.A.
72 Stanford University, Dept of Physics, Varian Physics Bldg, 382Via Pueblo Mall, Stanford, California, U.S.A.
73 Thales Alenia Space France, 100 Boulevard du Midi, Cannes laBocca, France
74 Universitat Heidelberg, Institut fur Theoretische Astrophysik,Albert-Uberle-Str. 2, 69120, Heidelberg, Germany
75 University of Cambridge, Cavendish Laboratory, Astrophysicsgroup, J J Thomson Avenue, Cambridge, U.K.
76 University of Cambridge, Institute of Astronomy, MadingleyRoad, Cambridge, U.K.
77 University of Granada, Departamento de Fısica Teorica y delCosmos, Facultad de Ciencias, Granada, Spain
78 University of Miami, Knight Physics Building, 1320 CampoSano Dr., Coral Gables, Florida, U.S.A.
79 Warsaw University Observatory, Aleje Ujazdowskie 4, 00-478Warszawa, Poland