Embed Size (px)
Citation preview
A&A 396, 895–910 (2002)DOI: 10.1051/0004-6361:20021386c© ESO 2002
Astronomy&
Astrophysics
The census of cataclysmic variables in the ROSAT Bright Survey?
A. D. Schwope1, H. Brunner1,3, D. Buckley2, J. Greiner1,3, K. v.d. Heyden2,4, S. Neizvestny5,S. Potter2, and R. Schwarz1,6??
1 Astrophysikalisches Institut Potsdam, An der Sternwarte 16, 14482 Potsdam, Germany2 South African Astronomical Observatory, PO Box 9, Observatory 7935, Cape Town, RSA3 Max-Planck Institut fur extraterrestrische Physik, Giessenbachstrasse, 85740 Garching, Germany4 SRON, Sorbonnelaan 2, 3584 CA Utrecht, The Netherlands5 SAO RAS, Nizhnij Arkhyz, Zelenchukskaya, Karachaevo-Cherkesia, Russia, 3571476 Universitats-Sternwarte Gottingen, Geismarlandstr. 11, 37083 Gottingen, Germany
Received 7 August 2002 / Accepted 19 September 2002
Abstract. We give an identification summary and results of polarimetric, photometric and spectroscopic follow-up observationsof new, X-ray bright cataclysmic variables. These were identified as optical counterparts of high galactic latitude sources in theROSAT All-Sky Survey. This optical identification programme is termed the ROSAT Bright Survey (RBS) and representsthe first complete soft X-ray selected, flux-limited sample of CVs at high galactic latitude (survey area ∼20400 sq.deg.). Thesystems described here escaped previous identification programmes since these surveys were designed to identify even brighterthan ours or particularly soft X-ray sources. Among the 11 new RBS-CVs we find 6 magnetic systems of AM Herculis type,4 dwarf novae (among them one candidate), and one particularly bright system of uncertain nature, tentatively identified asdwarf nova or symbiotic binary. Orbital periods could be determined for all magnetic systems which range from 87.1 minto 187.7 min. Three of the new dwarf novae have moderate to high inclination and two of them might be eclipsing. Usingnon-magnetic systems only we derive a space density of CVs of ∼3 × 10⁻⁵ pc−3. This limit rests on the two new nearby,low-luminosity systems RBS0490 and RBS1955, with estimated distances of 30 pc only and luminosities below 1030 erg s−1.
Key words. Surveys – X-rays: binaries – stars: cataclysmic variables
1. Introduction
In the ROSAT Bright Survey (RBS) we have completely op-tically identified all high-galactic latitude sources detected inthe ROSAT All-Sky Survey with mean count rate above 0.2 s−1
(Schwope et al. 2000). About one third of all sources areof galactic origin. Most of them are stars with active coro-nae. Minority populations among the galactic constituents areinteracting binaries of different flavour (neutron star accre-tors, white dwarf accretors, magnetic and non-magnetic sys-tems, super-soft sources SSSs). With a survey area of morethan 20 000 square degrees and its flux limit of about 2.5 ×10⁻¹² erg cm−2 s−1 the RBS represents the deepest complete,soft X-ray selected, flux-limited sample of CVs (and othertypes of X-ray emitters) at high galactic latitude, important forpopulation statistics and evolution scenarios of various kindsof X-ray emitters (see e.g. Miyaji et al. 2001 for the X-ray
Send offprint requests to: A. D. Schwope, e-mail: [email protected]? Based in part on observations performed at the Eurpean Southern
Observatory, La Silla, Chile, under programmes 60.B-0107 and66.A-0664.?? Visiting astronomer, German-Spanish Astronomical Center,Calar Alto, operated by the Max-Planck-Institut fur Astronomie,Heidelberg, jointly with the Spanish National Commission forAstronomy.
luminosity function of AGNs based on the RBS and other X-ray surveys).
Due to the soft spectral band of the PSPC detector, ROSATidentifications revealed a large number of new magnetic CVs,most of AM Herculis subtype (polars), and the SSSs as a newclass of X-ray emitters. Polars are strongly magnetic CV wherethe magnetic field keeps both stars (in most cases) in syn-chronous rotation, inhibits the formation of an accretion diskand leads to intensive cyclotron radiation in the optical andX-ray radiation from the accretion hot spot on the white dwarf.Compared to pre-ROSAT times with less than 20 systems, thenumber of polars has increased to almost 70, most of themidentified as counterparts of very soft RASS or WFC-sources(Pye et al. 1995; Thomas et al. 1998; Beuermann et al. 1999).The discovery of new systems and the determination of theirbasic parameters (orbital period, masses) is of importance forthe evolution of this kind of binary. The number density of theCVs in general is still highly uncertain. Their observed mini-mum period is far from being compatible with current theoret-ical models and the presence or absence of the 2–3 hour periodgap and the likely causes for its presence or absence are a mat-ter of debate.
However the restriction to soft X-ray sources a priori ex-cludes the vast majority of CVs to be detected: normal disksystems in quiescence which have intrinsically hard spectra.
896 A. D. Schwope et al.: The census of cataclysmic variables in the ROSAT Bright Survey
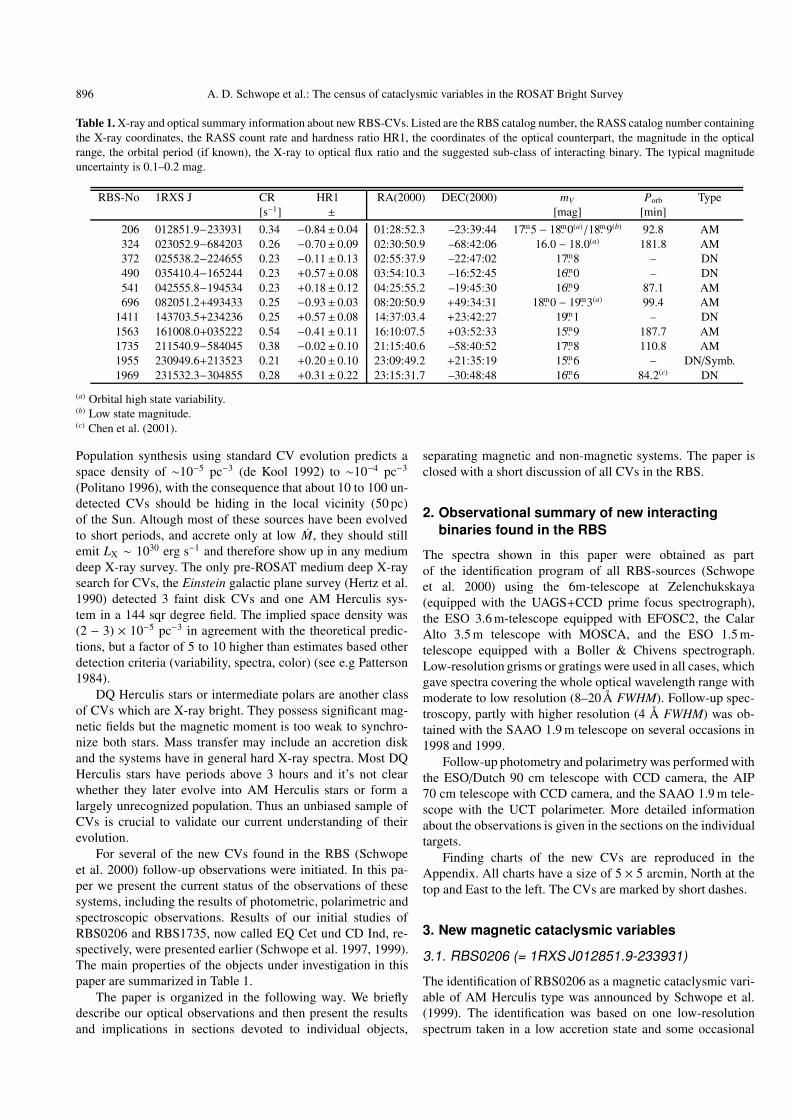
Table 1. X-ray and optical summary information about new RBS-CVs. Listed are the RBS catalog number, the RASS catalog number containingthe X-ray coordinates, the RASS count rate and hardness ratio HR1, the coordinates of the optical counterpart, the magnitude in the opticalrange, the orbital period (if known), the X-ray to optical flux ratio and the suggested sub-class of interacting binary. The typical magnitudeuncertainty is 0.1–0.2 mag.
RBS-No 1RXS J CR HR1 RA(2000) DEC(2000) mV Porb Type[s−1] ± [mag] [min]
206 012851.9−233931 0.34 −0.84± 0.04 01:28:52.3 –23:39:44 17.m5 − 18.m0(a)/18.m9(b) 92.8 AM324 023052.9−684203 0.26 −0.70± 0.09 02:30:50.9 –68:42:06 16.0 − 18.0(a) 181.8 AM372 025538.2−224655 0.23 −0.11± 0.13 02:55:37.9 –22:47:02 17.m8 – DN490 035410.4−165244 0.23 +0.57± 0.08 03:54:10.3 –16:52:45 16.m0 – DN541 042555.8−194534 0.23 +0.18± 0.12 04:25:55.2 –19:45:30 16.m9 87.1 AM696 082051.2+493433 0.25 −0.93± 0.03 08:20:50.9 +49:34:31 18.m0 − 19.m3(a) 99.4 AM
1411 143703.5+234236 0.25 +0.57± 0.08 14:37:03.4 +23:42:27 19.m1 – DN1563 161008.0+035222 0.54 −0.41± 0.11 16:10:07.5 +03:52:33 15.m9 187.7 AM1735 211540.9−584045 0.38 −0.02± 0.10 21:15:40.6 –58:40:52 17.m8 110.8 AM1955 230949.6+213523 0.21 +0.20± 0.10 23:09:49.2 +21:35:19 15.m6 – DN/Symb.1969 231532.3−304855 0.28 +0.31± 0.22 23:15:31.7 –30:48:48 16.m6 84.2(c) DN
(a) Orbital high state variability.(b) Low state magnitude.(c) Chen et al. (2001).
Population synthesis using standard CV evolution predicts aspace density of ∼10−5 pc−3 (de Kool 1992) to ∼10−4 pc−3
(Politano 1996), with the consequence that about 10 to 100 un-detected CVs should be hiding in the local vicinity (50 pc)of the Sun. Altough most of these sources have been evolvedto short periods, and accrete only at low M, they should stillemit LX ∼ 1030 erg s−1 and therefore show up in any mediumdeep X-ray survey. The only pre-ROSAT medium deep X-raysearch for CVs, the Einstein galactic plane survey (Hertz et al.1990) detected 3 faint disk CVs and one AM Herculis sys-tem in a 144 sqr degree field. The implied space density was(2 − 3) × 10−5 pc−3 in agreement with the theoretical predic-tions, but a factor of 5 to 10 higher than estimates based otherdetection criteria (variability, spectra, color) (see e.g Patterson1984).
DQ Herculis stars or intermediate polars are another classof CVs which are X-ray bright. They possess significant mag-netic fields but the magnetic moment is too weak to synchro-nize both stars. Mass transfer may include an accretion diskand the systems have in general hard X-ray spectra. Most DQHerculis stars have periods above 3 hours and it’s not clearwhether they later evolve into AM Herculis stars or form alargely unrecognized population. Thus an unbiased sample ofCVs is crucial to validate our current understanding of theirevolution.
For several of the new CVs found in the RBS (Schwopeet al. 2000) follow-up observations were initiated. In this pa-per we present the current status of the observations of thesesystems, including the results of photometric, polarimetric andspectroscopic observations. Results of our initial studies ofRBS0206 and RBS1735, now called EQ Cet und CD Ind, re-spectively, were presented earlier (Schwope et al. 1997, 1999).The main properties of the objects under investigation in thispaper are summarized in Table 1.
The paper is organized in the following way. We brieflydescribe our optical observations and then present the resultsand implications in sections devoted to individual objects,
separating magnetic and non-magnetic systems. The paper isclosed with a short discussion of all CVs in the RBS.
2. Observational summary of new interactingbinaries found in the RBS
The spectra shown in this paper were obtained as partof the identification program of all RBS-sources (Schwopeet al. 2000) using the 6m-telescope at Zelenchukskaya(equipped with the UAGS+CCD prime focus spectrograph),the ESO 3.6 m-telescope equipped with EFOSC2, the CalarAlto 3.5 m telescope with MOSCA, and the ESO 1.5 m-telescope equipped with a Boller & Chivens spectrograph.Low-resolution grisms or gratings were used in all cases, whichgave spectra covering the whole optical wavelength range withmoderate to low resolution (8–20 Å FWHM). Follow-up spec-troscopy, partly with higher resolution (4 Å FWHM) was ob-tained with the SAAO 1.9 m telescope on several occasions in1998 and 1999.
Follow-up photometry and polarimetry was performed withthe ESO/Dutch 90 cm telescope with CCD camera, the AIP70 cm telescope with CCD camera, and the SAAO 1.9 m tele-scope with the UCT polarimeter. More detailed informationabout the observations is given in the sections on the individualtargets.
Finding charts of the new CVs are reproduced in theAppendix. All charts have a size of 5 × 5 arcmin, North at thetop and East to the left. The CVs are marked by short dashes.
3. New magnetic cataclysmic variables
3.1. RBS0206 (= 1RXS J012851.9-233931)
The identification of RBS0206 as a magnetic cataclysmic vari-able of AM Herculis type was announced by Schwope et al.(1999). The identification was based on one low-resolutionspectrum taken in a low accretion state and some occasional
A. D. Schwope et al.: The census of cataclysmic variables in the ROSAT Bright Survey 897
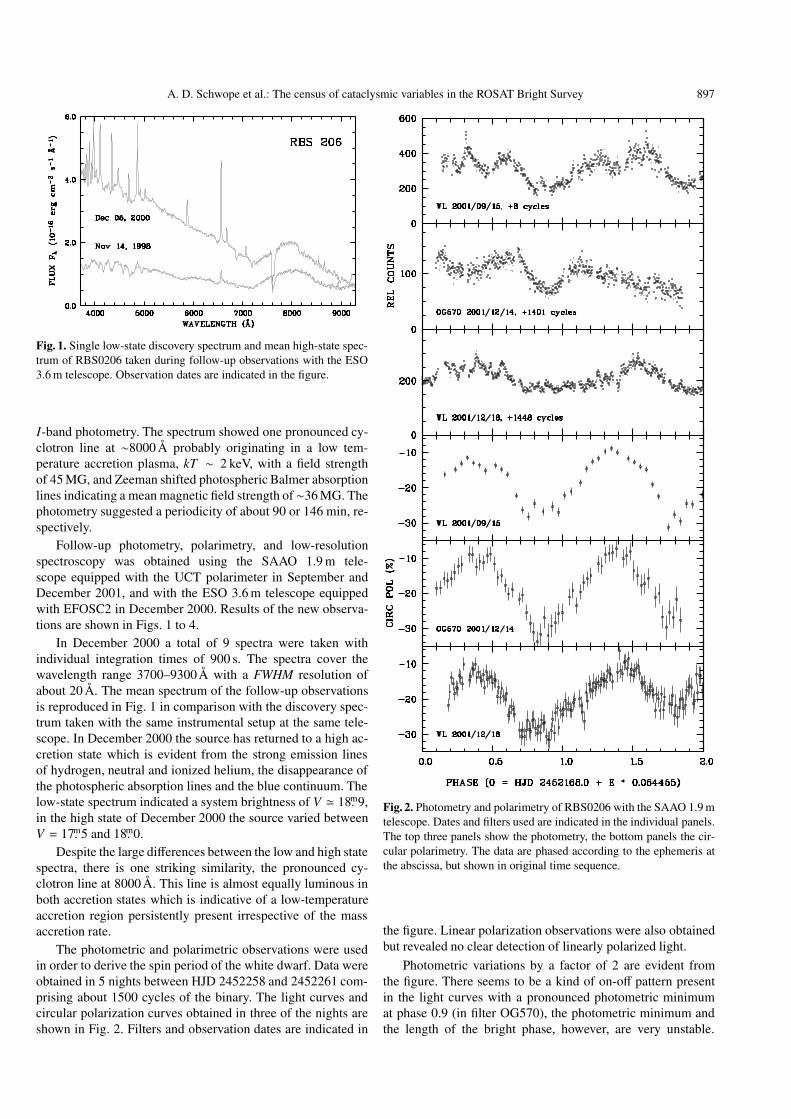
Fig. 1. Single low-state discovery spectrum and mean high-state spec-trum of RBS0206 taken during follow-up observations with the ESO3.6 m telescope. Observation dates are indicated in the figure.
I-band photometry. The spectrum showed one pronounced cy-clotron line at ∼8000 Å probably originating in a low tem-perature accretion plasma, kT ∼ 2 keV, with a field strengthof 45 MG, and Zeeman shifted photospheric Balmer absorptionlines indicating a mean magnetic field strength of ∼36 MG. Thephotometry suggested a periodicity of about 90 or 146 min, re-spectively.
Follow-up photometry, polarimetry, and low-resolutionspectroscopy was obtained using the SAAO 1.9 m tele-scope equipped with the UCT polarimeter in September andDecember 2001, and with the ESO 3.6 m telescope equippedwith EFOSC2 in December 2000. Results of the new observa-tions are shown in Figs. 1 to 4.
In December 2000 a total of 9 spectra were taken withindividual integration times of 900 s. The spectra cover thewavelength range 3700–9300 Å with a FWHM resolution ofabout 20 Å. The mean spectrum of the follow-up observationsis reproduced in Fig. 1 in comparison with the discovery spec-trum taken with the same instrumental setup at the same tele-scope. In December 2000 the source has returned to a high ac-cretion state which is evident from the strong emission linesof hydrogen, neutral and ionized helium, the disappearance ofthe photospheric absorption lines and the blue continuum. Thelow-state spectrum indicated a system brightness of V ' 18.m9,in the high state of December 2000 the source varied betweenV = 17.m5 and 18.m0.
Despite the large differences between the low and high statespectra, there is one striking similarity, the pronounced cy-clotron line at 8000 Å. This line is almost equally luminous inboth accretion states which is indicative of a low-temperatureaccretion region persistently present irrespective of the massaccretion rate.
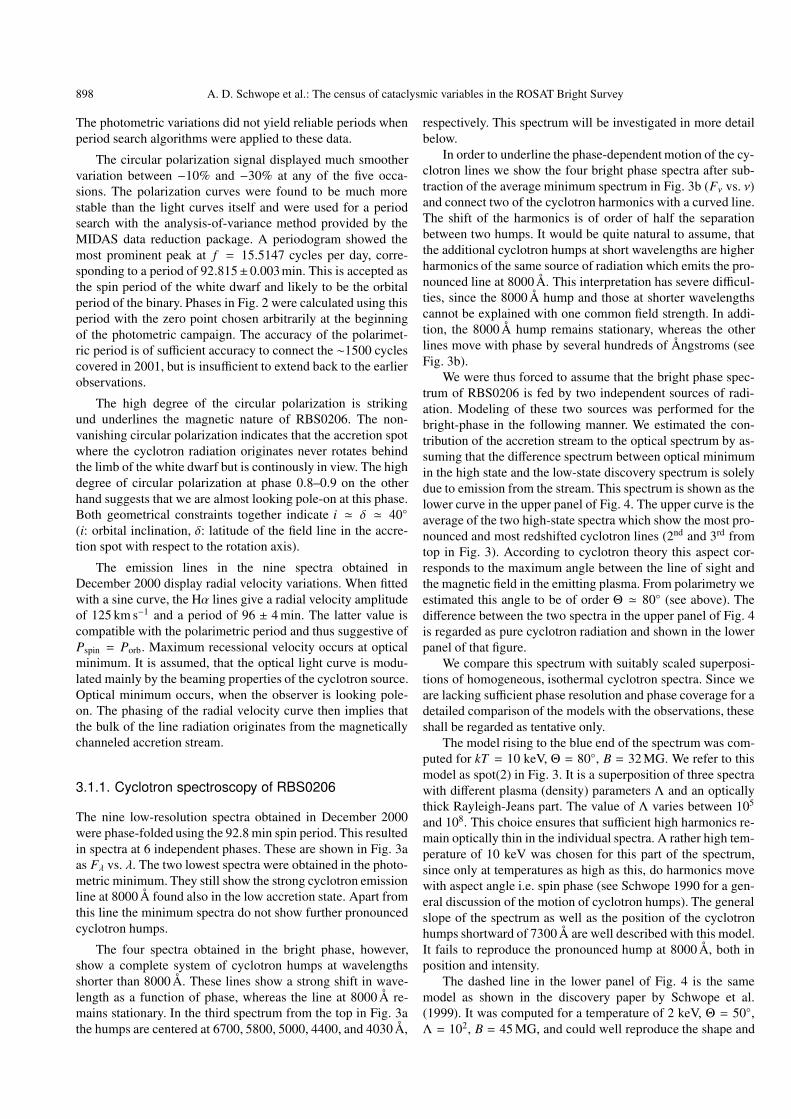
The photometric and polarimetric observations were usedin order to derive the spin period of the white dwarf. Data wereobtained in 5 nights between HJD 2452258 and 2452261 com-prising about 1500 cycles of the binary. The light curves andcircular polarization curves obtained in three of the nights areshown in Fig. 2. Filters and observation dates are indicated in
Fig. 2. Photometry and polarimetry of RBS0206 with the SAAO 1.9 mtelescope. Dates and filters used are indicated in the individual panels.The top three panels show the photometry, the bottom panels the cir-cular polarimetry. The data are phased according to the ephemeris atthe abscissa, but shown in original time sequence.
the figure. Linear polarization observations were also obtainedbut revealed no clear detection of linearly polarized light.
Photometric variations by a factor of 2 are evident fromthe figure. There seems to be a kind of on-off pattern presentin the light curves with a pronounced photometric minimumat phase 0.9 (in filter OG570), the photometric minimum andthe length of the bright phase, however, are very unstable.
898 A. D. Schwope et al.: The census of cataclysmic variables in the ROSAT Bright Survey
The photometric variations did not yield reliable periods whenperiod search algorithms were applied to these data.
The circular polarization signal displayed much smoothervariation between −10% and −30% at any of the five occa-sions. The polarization curves were found to be much morestable than the light curves itself and were used for a periodsearch with the analysis-of-variance method provided by theMIDAS data reduction package. A periodogram showed themost prominent peak at f = 15.5147 cycles per day, corre-sponding to a period of 92.815±0.003 min. This is accepted asthe spin period of the white dwarf and likely to be the orbitalperiod of the binary. Phases in Fig. 2 were calculated using thisperiod with the zero point chosen arbitrarily at the beginningof the photometric campaign. The accuracy of the polarimet-ric period is of sufficient accuracy to connect the ∼1500 cyclescovered in 2001, but is insufficient to extend back to the earlierobservations.
The high degree of the circular polarization is strikingund underlines the magnetic nature of RBS0206. The non-vanishing circular polarization indicates that the accretion spotwhere the cyclotron radiation originates never rotates behindthe limb of the white dwarf but is continously in view. The highdegree of circular polarization at phase 0.8–0.9 on the otherhand suggests that we are almost looking pole-on at this phase.Both geometrical constraints together indicate i ' δ ' 40(i: orbital inclination, δ: latitude of the field line in the accre-tion spot with respect to the rotation axis).
The emission lines in the nine spectra obtained inDecember 2000 display radial velocity variations. When fittedwith a sine curve, the Hα lines give a radial velocity amplitudeof 125 km s−1 and a period of 96 ± 4 min. The latter value iscompatible with the polarimetric period and thus suggestive ofPspin = Porb. Maximum recessional velocity occurs at opticalminimum. It is assumed, that the optical light curve is modu-lated mainly by the beaming properties of the cyclotron source.Optical minimum occurs, when the observer is looking pole-on. The phasing of the radial velocity curve then implies thatthe bulk of the line radiation originates from the magneticallychanneled accretion stream.
3.1.1. Cyclotron spectroscopy of RBS0206
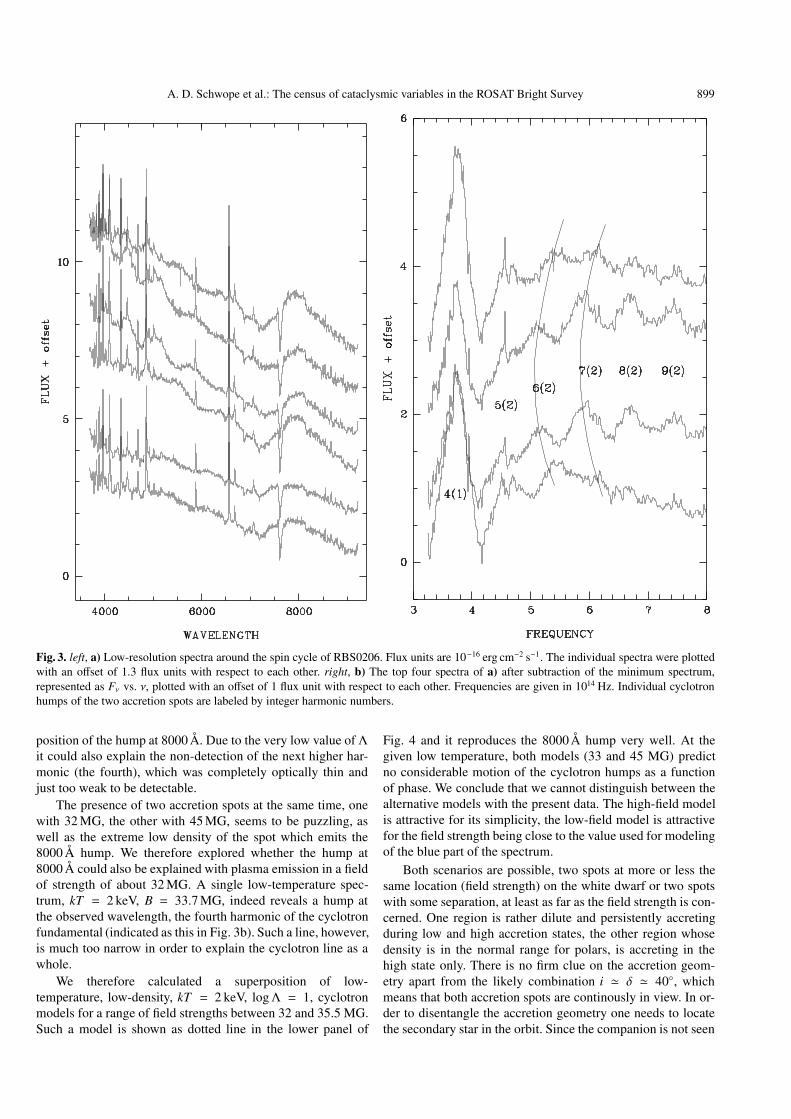
The nine low-resolution spectra obtained in December 2000were phase-folded using the 92.8 min spin period. This resultedin spectra at 6 independent phases. These are shown in Fig. 3aas Fλ vs. λ. The two lowest spectra were obtained in the photo-metric minimum. They still show the strong cyclotron emissionline at 8000 Å found also in the low accretion state. Apart fromthis line the minimum spectra do not show further pronouncedcyclotron humps.
The four spectra obtained in the bright phase, however,show a complete system of cyclotron humps at wavelengthsshorter than 8000 Å. These lines show a strong shift in wave-length as a function of phase, whereas the line at 8000 Å re-mains stationary. In the third spectrum from the top in Fig. 3athe humps are centered at 6700, 5800, 5000, 4400, and 4030 Å,
respectively. This spectrum will be investigated in more detailbelow.
In order to underline the phase-dependent motion of the cy-clotron lines we show the four bright phase spectra after sub-traction of the average minimum spectrum in Fig. 3b (Fν vs. ν)and connect two of the cyclotron harmonics with a curved line.The shift of the harmonics is of order of half the separationbetween two humps. It would be quite natural to assume, thatthe additional cyclotron humps at short wavelengths are higherharmonics of the same source of radiation which emits the pro-nounced line at 8000 Å. This interpretation has severe difficul-ties, since the 8000 Å hump and those at shorter wavelengthscannot be explained with one common field strength. In addi-tion, the 8000 Å hump remains stationary, whereas the otherlines move with phase by several hundreds of Ångstroms (seeFig. 3b).
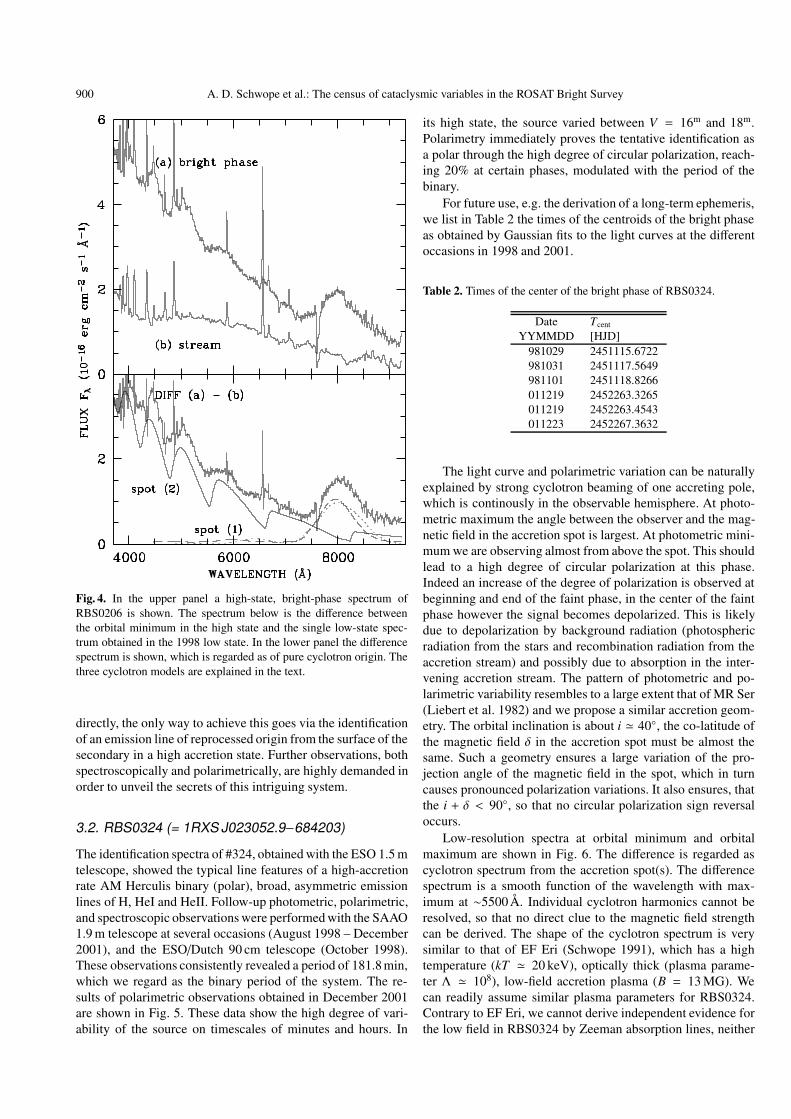
We were thus forced to assume that the bright phase spec-trum of RBS0206 is fed by two independent sources of radi-ation. Modeling of these two sources was performed for thebright-phase in the following manner. We estimated the con-tribution of the accretion stream to the optical spectrum by as-suming that the difference spectrum between optical minimumin the high state and the low-state discovery spectrum is solelydue to emission from the stream. This spectrum is shown as thelower curve in the upper panel of Fig. 4. The upper curve is theaverage of the two high-state spectra which show the most pro-nounced and most redshifted cyclotron lines (2nd and 3rd fromtop in Fig. 3). According to cyclotron theory this aspect cor-responds to the maximum angle between the line of sight andthe magnetic field in the emitting plasma. From polarimetry weestimated this angle to be of order Θ ' 80 (see above). Thedifference between the two spectra in the upper panel of Fig. 4is regarded as pure cyclotron radiation and shown in the lowerpanel of that figure.
We compare this spectrum with suitably scaled superposi-tions of homogeneous, isothermal cyclotron spectra. Since weare lacking sufficient phase resolution and phase coverage for adetailed comparison of the models with the observations, theseshall be regarded as tentative only.
The model rising to the blue end of the spectrum was com-puted for kT = 10 keV, Θ = 80, B = 32 MG. We refer to thismodel as spot(2) in Fig. 3. It is a superposition of three spectrawith different plasma (density) parameters Λ and an opticallythick Rayleigh-Jeans part. The value of Λ varies between 105
and 108. This choice ensures that sufficient high harmonics re-main optically thin in the individual spectra. A rather high tem-perature of 10 keV was chosen for this part of the spectrum,since only at temperatures as high as this, do harmonics movewith aspect angle i.e. spin phase (see Schwope 1990 for a gen-eral discussion of the motion of cyclotron humps). The generalslope of the spectrum as well as the position of the cyclotronhumps shortward of 7300 Å are well described with this model.It fails to reproduce the pronounced hump at 8000 Å, both inposition and intensity.
The dashed line in the lower panel of Fig. 4 is the samemodel as shown in the discovery paper by Schwope et al.(1999). It was computed for a temperature of 2 keV, Θ = 50,Λ = 102, B = 45 MG, and could well reproduce the shape and
A. D. Schwope et al.: The census of cataclysmic variables in the ROSAT Bright Survey 899
Fig. 3. left, a) Low-resolution spectra around the spin cycle of RBS0206. Flux units are 10−16 erg cm−2 s−1. The individual spectra were plottedwith an offset of 1.3 flux units with respect to each other. right, b) The top four spectra of a) after subtraction of the minimum spectrum,represented as Fν vs. ν, plotted with an offset of 1 flux unit with respect to each other. Frequencies are given in 1014 Hz. Individual cyclotronhumps of the two accretion spots are labeled by integer harmonic numbers.
position of the hump at 8000 Å. Due to the very low value ofΛit could also explain the non-detection of the next higher har-monic (the fourth), which was completely optically thin andjust too weak to be detectable.
The presence of two accretion spots at the same time, onewith 32 MG, the other with 45 MG, seems to be puzzling, aswell as the extreme low density of the spot which emits the8000 Å hump. We therefore explored whether the hump at8000 Å could also be explained with plasma emission in a fieldof strength of about 32 MG. A single low-temperature spec-trum, kT = 2 keV, B = 33.7 MG, indeed reveals a hump atthe observed wavelength, the fourth harmonic of the cyclotronfundamental (indicated as this in Fig. 3b). Such a line, however,is much too narrow in order to explain the cyclotron line as awhole.
We therefore calculated a superposition of low-temperature, low-density, kT = 2 keV, logΛ = 1, cyclotronmodels for a range of field strengths between 32 and 35.5 MG.Such a model is shown as dotted line in the lower panel of
Fig. 4 and it reproduces the 8000 Å hump very well. At thegiven low temperature, both models (33 and 45 MG) predictno considerable motion of the cyclotron humps as a functionof phase. We conclude that we cannot distinguish between thealternative models with the present data. The high-field modelis attractive for its simplicity, the low-field model is attractivefor the field strength being close to the value used for modelingof the blue part of the spectrum.
Both scenarios are possible, two spots at more or less thesame location (field strength) on the white dwarf or two spotswith some separation, at least as far as the field strength is con-cerned. One region is rather dilute and persistently accretingduring low and high accretion states, the other region whosedensity is in the normal range for polars, is accreting in thehigh state only. There is no firm clue on the accretion geom-etry apart from the likely combination i ' δ ' 40, whichmeans that both accretion spots are continously in view. In or-der to disentangle the accretion geometry one needs to locatethe secondary star in the orbit. Since the companion is not seen
900 A. D. Schwope et al.: The census of cataclysmic variables in the ROSAT Bright Survey
Fig. 4. In the upper panel a high-state, bright-phase spectrum ofRBS0206 is shown. The spectrum below is the difference betweenthe orbital minimum in the high state and the single low-state spec-trum obtained in the 1998 low state. In the lower panel the differencespectrum is shown, which is regarded as of pure cyclotron origin. Thethree cyclotron models are explained in the text.
directly, the only way to achieve this goes via the identificationof an emission line of reprocessed origin from the surface of thesecondary in a high accretion state. Further observations, bothspectroscopically and polarimetrically, are highly demanded inorder to unveil the secrets of this intriguing system.
3.2. RBS0324 (= 1RXS J023052.9−684203)
The identification spectra of #324, obtained with the ESO 1.5 mtelescope, showed the typical line features of a high-accretionrate AM Herculis binary (polar), broad, asymmetric emissionlines of H, HeI and HeII. Follow-up photometric, polarimetric,and spectroscopic observations were performed with the SAAO1.9 m telescope at several occasions (August 1998 – December2001), and the ESO/Dutch 90 cm telescope (October 1998).These observations consistently revealed a period of 181.8 min,which we regard as the binary period of the system. The re-sults of polarimetric observations obtained in December 2001are shown in Fig. 5. These data show the high degree of vari-ability of the source on timescales of minutes and hours. In
its high state, the source varied between V = 16m and 18m.Polarimetry immediately proves the tentative identification asa polar through the high degree of circular polarization, reach-ing 20% at certain phases, modulated with the period of thebinary.
For future use, e.g. the derivation of a long-term ephemeris,we list in Table 2 the times of the centroids of the bright phaseas obtained by Gaussian fits to the light curves at the differentoccasions in 1998 and 2001.
Table 2. Times of the center of the bright phase of RBS0324.
Date Tcent
YYMMDD [HJD]981029 2451115.6722981031 2451117.5649981101 2451118.8266011219 2452263.3265011219 2452263.4543011223 2452267.3632
The light curve and polarimetric variation can be naturallyexplained by strong cyclotron beaming of one accreting pole,which is continously in the observable hemisphere. At photo-metric maximum the angle between the observer and the mag-netic field in the accretion spot is largest. At photometric mini-mum we are observing almost from above the spot. This shouldlead to a high degree of circular polarization at this phase.Indeed an increase of the degree of polarization is observed atbeginning and end of the faint phase, in the center of the faintphase however the signal becomes depolarized. This is likelydue to depolarization by background radiation (photosphericradiation from the stars and recombination radiation from theaccretion stream) and possibly due to absorption in the inter-vening accretion stream. The pattern of photometric and po-larimetric variability resembles to a large extent that of MR Ser(Liebert et al. 1982) and we propose a similar accretion geom-etry. The orbital inclination is about i ' 40, the co-latitude ofthe magnetic field δ in the accretion spot must be almost thesame. Such a geometry ensures a large variation of the pro-jection angle of the magnetic field in the spot, which in turncauses pronounced polarization variations. It also ensures, thatthe i + δ < 90, so that no circular polarization sign reversaloccurs.
Low-resolution spectra at orbital minimum and orbitalmaximum are shown in Fig. 6. The difference is regarded ascyclotron spectrum from the accretion spot(s). The differencespectrum is a smooth function of the wavelength with max-imum at ∼5500 Å. Individual cyclotron harmonics cannot beresolved, so that no direct clue to the magnetic field strengthcan be derived. The shape of the cyclotron spectrum is verysimilar to that of EF Eri (Schwope 1991), which has a hightemperature (kT ' 20 keV), optically thick (plasma parame-ter Λ ' 108), low-field accretion plasma (B = 13 MG). Wecan readily assume similar plasma parameters for RBS0324.Contrary to EF Eri, we cannot derive independent evidence forthe low field in RBS0324 by Zeeman absorption lines, neither

A. D. Schwope et al.: The census of cataclysmic variables in the ROSAT Bright Survey 901
Fig. 5. Polarimetry of RBS0324 obtained December 2001 with the 1.9 m SAAO. Shown are relative brightness (top) and the degree of circularpolarization. Data are shown in original sequence and were not phase-folded. The data on December 19 were taken in white light, those atDecember 23 through a blue BG39 filter.
Fig. 6. Identification spectra of RBS0324, obtained with the ESO1.5 m telescope on December 1997. The two spectra represent the or-bital minimum and maximum, respectively.
from the accretion halo nor from the white dwarf’s photosphere(Ostreicher et al. 1990).
The spectra of Fig. 6 display TiO absorption bands fromthe secondary star in the near infrared. The low signal to noiseratio of the spectra prevents us from properly determining thespectral type. At the orbital period of #324, a Roche-lobe fill-ing dwarf star secondary has a spectral type dM4 (see e.g. thefit by Gansicke et al. (1995) to the secondary in AM Her atthe same orbital period). We determined the contribution of thesecondary to the spectral hump at 7520 Å to 20–25%, whichimplies a distance to RBS0324 of about d = 250 pc.
Fig. 7. Discovery spectrum of RBS0541, obtained October 7, 1996, atZelenchukskaya.
The small number of 70 photons was detected during theRASS only. The RASS X-ray spectrum is very soft and com-patible with one blackbody-like component only (kT ' 30 eV).Such a fit is similar to the soft component of many AM Herstars (Beuermann & Schwope 1994) including the prototype(Paerels et al. 1994).
3.3. RBS0541 (= 1RXS J042555.8−194534)
The low-resolution discovery spectrum of RBS0541, takenat Zelenchukskaya, shows a smooth blue continuum and
902 A. D. Schwope et al.: The census of cataclysmic variables in the ROSAT Bright Survey
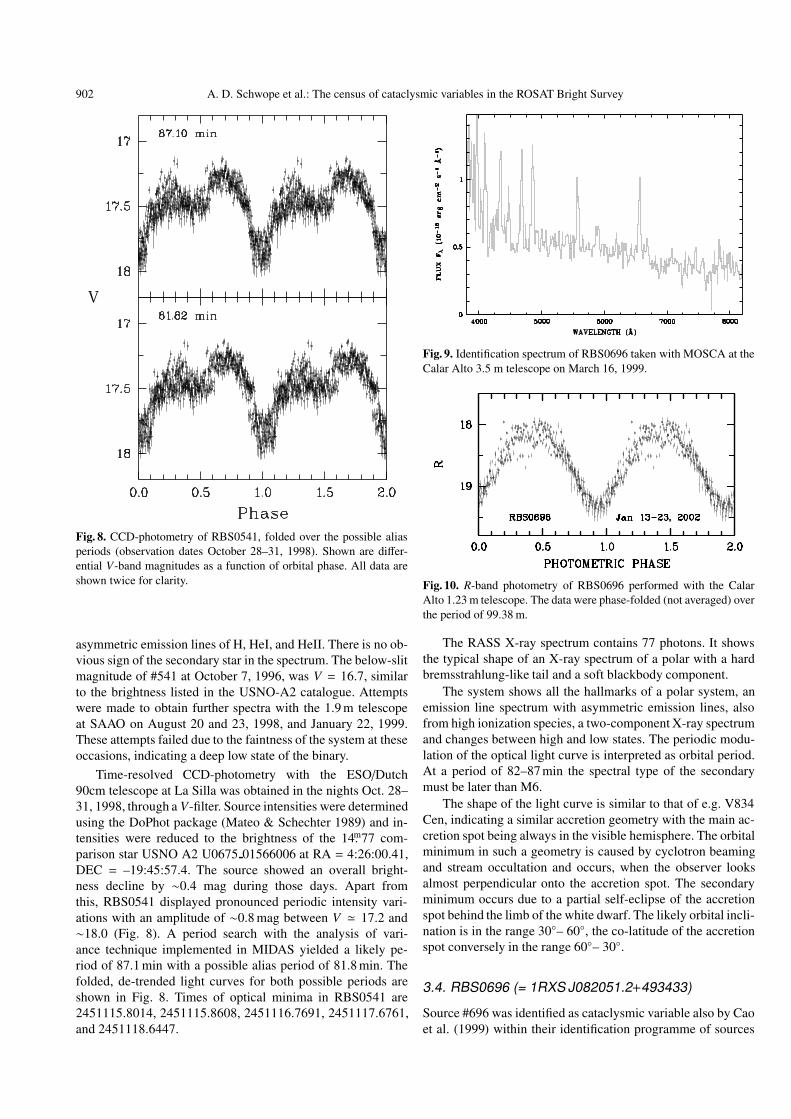
Fig. 8. CCD-photometry of RBS0541, folded over the possible aliasperiods (observation dates October 28–31, 1998). Shown are differ-ential V-band magnitudes as a function of orbital phase. All data areshown twice for clarity.
asymmetric emission lines of H, HeI, and HeII. There is no ob-vious sign of the secondary star in the spectrum. The below-slitmagnitude of #541 at October 7, 1996, was V = 16.7, similarto the brightness listed in the USNO-A2 catalogue. Attemptswere made to obtain further spectra with the 1.9 m telescopeat SAAO on August 20 and 23, 1998, and January 22, 1999.These attempts failed due to the faintness of the system at theseoccasions, indicating a deep low state of the binary.
Time-resolved CCD-photometry with the ESO/Dutch90cm telescope at La Silla was obtained in the nights Oct. 28–31, 1998, through a V-filter. Source intensities were determinedusing the DoPhot package (Mateo & Schechter 1989) and in-tensities were reduced to the brightness of the 14.m77 com-parison star USNO A2 U0675 01566006 at RA = 4:26:00.41,DEC = –19:45:57.4. The source showed an overall bright-ness decline by ∼0.4 mag during those days. Apart fromthis, RBS0541 displayed pronounced periodic intensity vari-ations with an amplitude of ∼0.8 mag between V ' 17.2 and∼18.0 (Fig. 8). A period search with the analysis of vari-ance technique implemented in MIDAS yielded a likely pe-riod of 87.1 min with a possible alias period of 81.8 min. Thefolded, de-trended light curves for both possible periods areshown in Fig. 8. Times of optical minima in RBS0541 are2451115.8014, 2451115.8608, 2451116.7691, 2451117.6761,and 2451118.6447.
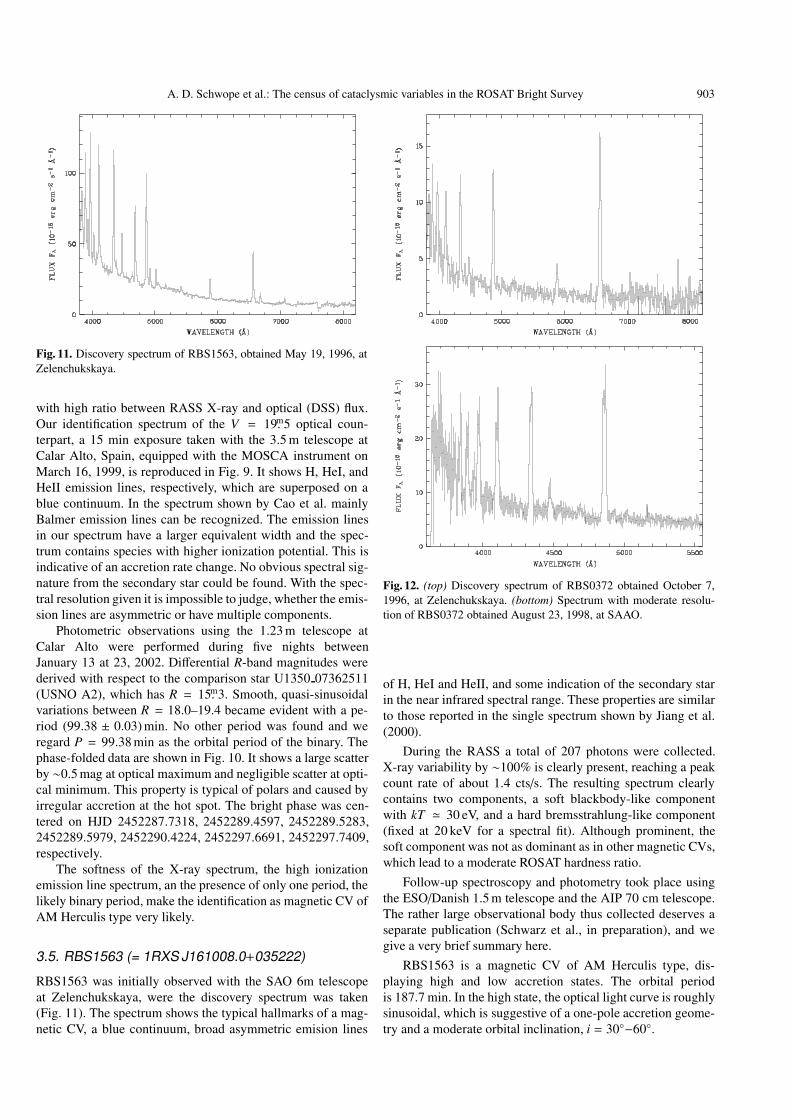
Fig. 9. Identification spectrum of RBS0696 taken with MOSCA at theCalar Alto 3.5 m telescope on March 16, 1999.
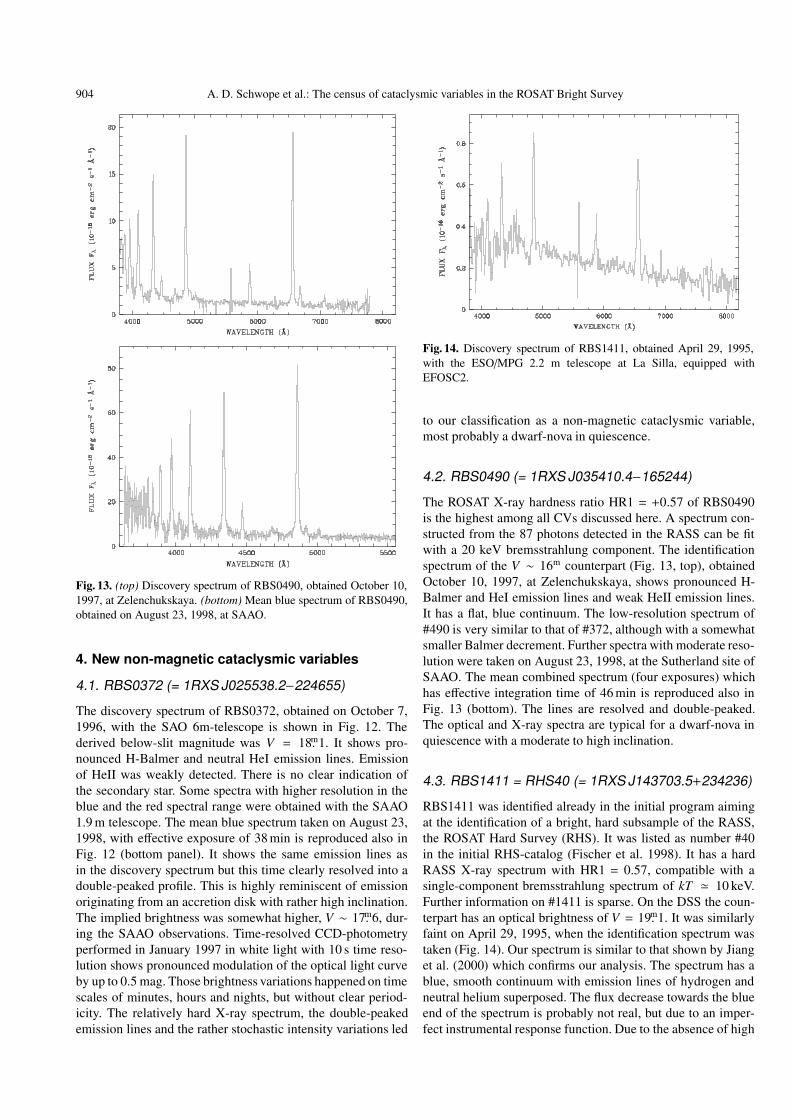
Fig. 10. R-band photometry of RBS0696 performed with the CalarAlto 1.23 m telescope. The data were phase-folded (not averaged) overthe period of 99.38 m.
The RASS X-ray spectrum contains 77 photons. It showsthe typical shape of an X-ray spectrum of a polar with a hardbremsstrahlung-like tail and a soft blackbody component.
The system shows all the hallmarks of a polar system, anemission line spectrum with asymmetric emission lines, alsofrom high ionization species, a two-component X-ray spectrumand changes between high and low states. The periodic modu-lation of the optical light curve is interpreted as orbital period.At a period of 82–87 min the spectral type of the secondarymust be later than M6.
The shape of the light curve is similar to that of e.g. V834Cen, indicating a similar accretion geometry with the main ac-cretion spot being always in the visible hemisphere. The orbitalminimum in such a geometry is caused by cyclotron beamingand stream occultation and occurs, when the observer looksalmost perpendicular onto the accretion spot. The secondaryminimum occurs due to a partial self-eclipse of the accretionspot behind the limb of the white dwarf. The likely orbital incli-nation is in the range 30– 60, the co-latitude of the accretionspot conversely in the range 60– 30.
3.4. RBS0696 (= 1RXS J082051.2+493433)
Source #696 was identified as cataclysmic variable also by Caoet al. (1999) within their identification programme of sources
A. D. Schwope et al.: The census of cataclysmic variables in the ROSAT Bright Survey 903
Fig. 11. Discovery spectrum of RBS1563, obtained May 19, 1996, atZelenchukskaya.
with high ratio between RASS X-ray and optical (DSS) flux.Our identification spectrum of the V = 19.m5 optical coun-terpart, a 15 min exposure taken with the 3.5 m telescope atCalar Alto, Spain, equipped with the MOSCA instrument onMarch 16, 1999, is reproduced in Fig. 9. It shows H, HeI, andHeII emission lines, respectively, which are superposed on ablue continuum. In the spectrum shown by Cao et al. mainlyBalmer emission lines can be recognized. The emission linesin our spectrum have a larger equivalent width and the spec-trum contains species with higher ionization potential. This isindicative of an accretion rate change. No obvious spectral sig-nature from the secondary star could be found. With the spec-tral resolution given it is impossible to judge, whether the emis-sion lines are asymmetric or have multiple components.
Photometric observations using the 1.23 m telescope atCalar Alto were performed during five nights betweenJanuary 13 at 23, 2002. Differential R-band magnitudes werederived with respect to the comparison star U1350 07362511(USNO A2), which has R = 15.m3. Smooth, quasi-sinusoidalvariations between R = 18.0–19.4 became evident with a pe-riod (99.38 ± 0.03) min. No other period was found and weregard P = 99.38 min as the orbital period of the binary. Thephase-folded data are shown in Fig. 10. It shows a large scatterby ∼0.5 mag at optical maximum and negligible scatter at opti-cal minimum. This property is typical of polars and caused byirregular accretion at the hot spot. The bright phase was cen-tered on HJD 2452287.7318, 2452289.4597, 2452289.5283,2452289.5979, 2452290.4224, 2452297.6691, 2452297.7409,respectively.
The softness of the X-ray spectrum, the high ionizationemission line spectrum, an the presence of only one period, thelikely binary period, make the identification as magnetic CV ofAM Herculis type very likely.
3.5. RBS1563 (= 1RXS J161008.0+035222)
RBS1563 was initially observed with the SAO 6m telescopeat Zelenchukskaya, were the discovery spectrum was taken(Fig. 11). The spectrum shows the typical hallmarks of a mag-netic CV, a blue continuum, broad asymmetric emision lines
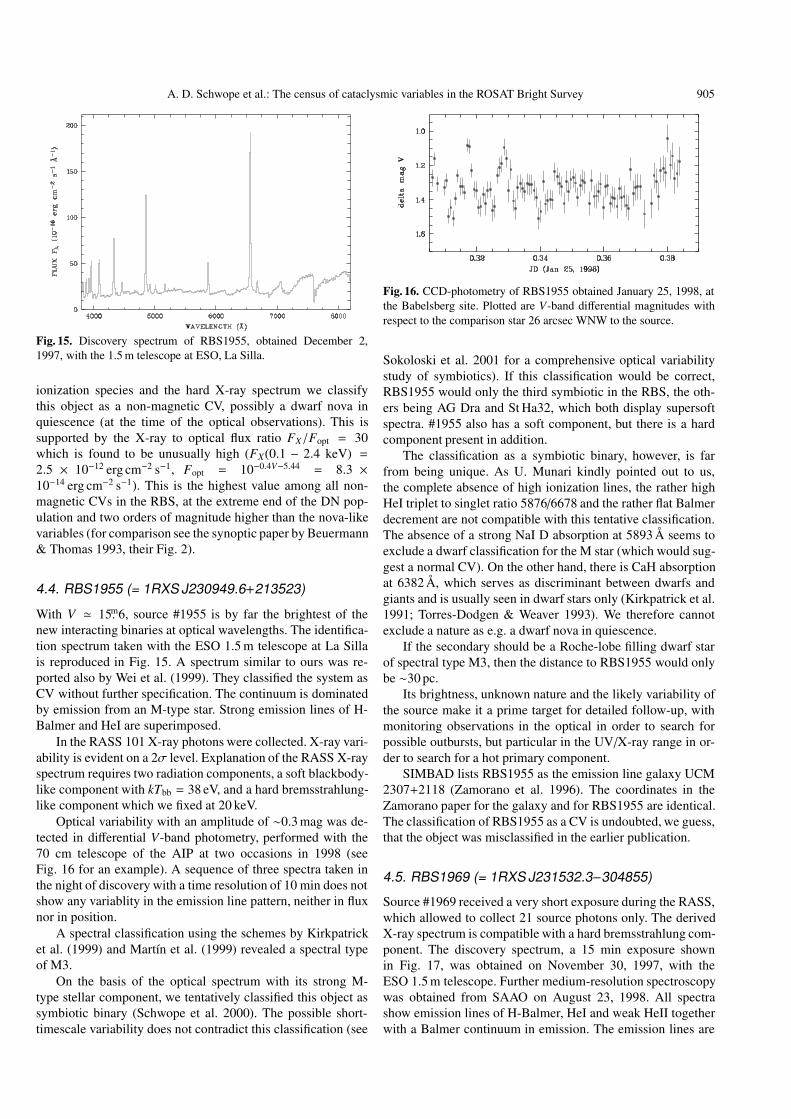
Fig. 12. (top) Discovery spectrum of RBS0372 obtained October 7,1996, at Zelenchukskaya. (bottom) Spectrum with moderate resolu-tion of RBS0372 obtained August 23, 1998, at SAAO.
of H, HeI and HeII, and some indication of the secondary starin the near infrared spectral range. These properties are similarto those reported in the single spectrum shown by Jiang et al.(2000).
During the RASS a total of 207 photons were collected.X-ray variability by ∼100% is clearly present, reaching a peakcount rate of about 1.4 cts/s. The resulting spectrum clearlycontains two components, a soft blackbody-like componentwith kT ' 30 eV, and a hard bremsstrahlung-like component(fixed at 20 keV for a spectral fit). Although prominent, thesoft component was not as dominant as in other magnetic CVs,which lead to a moderate ROSAT hardness ratio.
Follow-up spectroscopy and photometry took place usingthe ESO/Danish 1.5 m telescope and the AIP 70 cm telescope.The rather large observational body thus collected deserves aseparate publication (Schwarz et al., in preparation), and wegive a very brief summary here.
RBS1563 is a magnetic CV of AM Herculis type, dis-playing high and low accretion states. The orbital periodis 187.7 min. In the high state, the optical light curve is roughlysinusoidal, which is suggestive of a one-pole accretion geome-try and a moderate orbital inclination, i = 30−60.
904 A. D. Schwope et al.: The census of cataclysmic variables in the ROSAT Bright Survey
Fig. 13. (top) Discovery spectrum of RBS0490, obtained October 10,1997, at Zelenchukskaya. (bottom) Mean blue spectrum of RBS0490,obtained on August 23, 1998, at SAAO.
4. New non-magnetic cataclysmic variables
4.1. RBS0372 (= 1RXS J025538.2−224655)
The discovery spectrum of RBS0372, obtained on October 7,1996, with the SAO 6m-telescope is shown in Fig. 12. Thederived below-slit magnitude was V = 18.m1. It shows pro-nounced H-Balmer and neutral HeI emission lines. Emissionof HeII was weakly detected. There is no clear indication ofthe secondary star. Some spectra with higher resolution in theblue and the red spectral range were obtained with the SAAO1.9 m telescope. The mean blue spectrum taken on August 23,1998, with effective exposure of 38 min is reproduced also inFig. 12 (bottom panel). It shows the same emission lines asin the discovery spectrum but this time clearly resolved into adouble-peaked profile. This is highly reminiscent of emissionoriginating from an accretion disk with rather high inclination.The implied brightness was somewhat higher, V ∼ 17.m6, dur-ing the SAAO observations. Time-resolved CCD-photometryperformed in January 1997 in white light with 10 s time reso-lution shows pronounced modulation of the optical light curveby up to 0.5 mag. Those brightness variations happened on timescales of minutes, hours and nights, but without clear period-icity. The relatively hard X-ray spectrum, the double-peakedemission lines and the rather stochastic intensity variations led
Fig. 14. Discovery spectrum of RBS1411, obtained April 29, 1995,with the ESO/MPG 2.2 m telescope at La Silla, equipped withEFOSC2.
to our classification as a non-magnetic cataclysmic variable,most probably a dwarf-nova in quiescence.
4.2. RBS0490 (= 1RXS J035410.4−165244)
The ROSAT X-ray hardness ratio HR1 = +0.57 of RBS0490is the highest among all CVs discussed here. A spectrum con-structed from the 87 photons detected in the RASS can be fitwith a 20 keV bremsstrahlung component. The identificationspectrum of the V ∼ 16m counterpart (Fig. 13, top), obtainedOctober 10, 1997, at Zelenchukskaya, shows pronounced H-Balmer and HeI emission lines and weak HeII emission lines.It has a flat, blue continuum. The low-resolution spectrum of#490 is very similar to that of #372, although with a somewhatsmaller Balmer decrement. Further spectra with moderate reso-lution were taken on August 23, 1998, at the Sutherland site ofSAAO. The mean combined spectrum (four exposures) whichhas effective integration time of 46 min is reproduced also inFig. 13 (bottom). The lines are resolved and double-peaked.The optical and X-ray spectra are typical for a dwarf-nova inquiescence with a moderate to high inclination.
4.3. RBS1411 = RHS40 (= 1RXS J143703.5+234236)
RBS1411 was identified already in the initial program aimingat the identification of a bright, hard subsample of the RASS,the ROSAT Hard Survey (RHS). It was listed as number #40in the initial RHS-catalog (Fischer et al. 1998). It has a hardRASS X-ray spectrum with HR1 = 0.57, compatible with asingle-component bremsstrahlung spectrum of kT ' 10 keV.Further information on #1411 is sparse. On the DSS the coun-terpart has an optical brightness of V = 19.m1. It was similarlyfaint on April 29, 1995, when the identification spectrum wastaken (Fig. 14). Our spectrum is similar to that shown by Jianget al. (2000) which confirms our analysis. The spectrum has ablue, smooth continuum with emission lines of hydrogen andneutral helium superposed. The flux decrease towards the blueend of the spectrum is probably not real, but due to an imper-fect instrumental response function. Due to the absence of high
A. D. Schwope et al.: The census of cataclysmic variables in the ROSAT Bright Survey 905
Fig. 15. Discovery spectrum of RBS1955, obtained December 2,1997, with the 1.5 m telescope at ESO, La Silla.
ionization species and the hard X-ray spectrum we classifythis object as a non-magnetic CV, possibly a dwarf nova inquiescence (at the time of the optical observations). This issupported by the X-ray to optical flux ratio FX/Fopt = 30which is found to be unusually high (FX(0.1 − 2.4 keV) =2.5 × 10⁻¹² erg cm−2 s−1, Fopt = 10−0.4V−5.44 = 8.3 ×10⁻¹⁴ erg cm−2 s−1). This is the highest value among all non-magnetic CVs in the RBS, at the extreme end of the DN pop-ulation and two orders of magnitude higher than the nova-likevariables (for comparison see the synoptic paper by Beuermann& Thomas 1993, their Fig. 2).
4.4. RBS1955 (= 1RXS J230949.6+213523)
With V ' 15.m6, source #1955 is by far the brightest of thenew interacting binaries at optical wavelengths. The identifica-tion spectrum taken with the ESO 1.5 m telescope at La Sillais reproduced in Fig. 15. A spectrum similar to ours was re-ported also by Wei et al. (1999). They classified the system asCV without further specification. The continuum is dominatedby emission from an M-type star. Strong emission lines of H-Balmer and HeI are superimposed.
In the RASS 101 X-ray photons were collected. X-ray vari-ability is evident on a 2σ level. Explanation of the RASS X-rayspectrum requires two radiation components, a soft blackbody-like component with kTbb = 38 eV, and a hard bremsstrahlung-like component which we fixed at 20 keV.
Optical variability with an amplitude of ∼0.3 mag was de-tected in differential V-band photometry, performed with the70 cm telescope of the AIP at two occasions in 1998 (seeFig. 16 for an example). A sequence of three spectra taken inthe night of discovery with a time resolution of 10 min does notshow any variablity in the emission line pattern, neither in fluxnor in position.
A spectral classification using the schemes by Kirkpatricket al. (1999) and Martın et al. (1999) revealed a spectral typeof M3.
On the basis of the optical spectrum with its strong M-type stellar component, we tentatively classified this object assymbiotic binary (Schwope et al. 2000). The possible short-timescale variability does not contradict this classification (see
Fig. 16. CCD-photometry of RBS1955 obtained January 25, 1998, atthe Babelsberg site. Plotted are V-band differential magnitudes withrespect to the comparison star 26 arcsec WNW to the source.
Sokoloski et al. 2001 for a comprehensive optical variabilitystudy of symbiotics). If this classification would be correct,RBS1955 would only the third symbiotic in the RBS, the oth-ers being AG Dra and St Ha32, which both display supersoftspectra. #1955 also has a soft component, but there is a hardcomponent present in addition.
The classification as a symbiotic binary, however, is farfrom being unique. As U. Munari kindly pointed out to us,the complete absence of high ionization lines, the rather highHeI triplet to singlet ratio 5876/6678 and the rather flat Balmerdecrement are not compatible with this tentative classification.The absence of a strong NaI D absorption at 5893 Å seems toexclude a dwarf classification for the M star (which would sug-gest a normal CV). On the other hand, there is CaH absorptionat 6382 Å, which serves as discriminant between dwarfs andgiants and is usually seen in dwarf stars only (Kirkpatrick et al.1991; Torres-Dodgen & Weaver 1993). We therefore cannotexclude a nature as e.g. a dwarf nova in quiescence.
If the secondary should be a Roche-lobe filling dwarf starof spectral type M3, then the distance to RBS1955 would onlybe ∼30 pc.
Its brightness, unknown nature and the likely variability ofthe source make it a prime target for detailed follow-up, withmonitoring observations in the optical in order to search forpossible outbursts, but particular in the UV/X-ray range in or-der to search for a hot primary component.
SIMBAD lists RBS1955 as the emission line galaxy UCM2307+2118 (Zamorano et al. 1996). The coordinates in theZamorano paper for the galaxy and for RBS1955 are identical.The classification of RBS1955 as a CV is undoubted, we guess,that the object was misclassified in the earlier publication.
4.5. RBS1969 (= 1RXS J231532.3−304855)
Source #1969 received a very short exposure during the RASS,which allowed to collect 21 source photons only. The derivedX-ray spectrum is compatible with a hard bremsstrahlung com-ponent. The discovery spectrum, a 15 min exposure shownin Fig. 17, was obtained on November 30, 1997, with theESO 1.5 m telescope. Further medium-resolution spectroscopywas obtained from SAAO on August 23, 1998. All spectrashow emission lines of H-Balmer, HeI and weak HeII togetherwith a Balmer continuum in emission. The emission lines are
906 A. D. Schwope et al.: The census of cataclysmic variables in the ROSAT Bright Survey
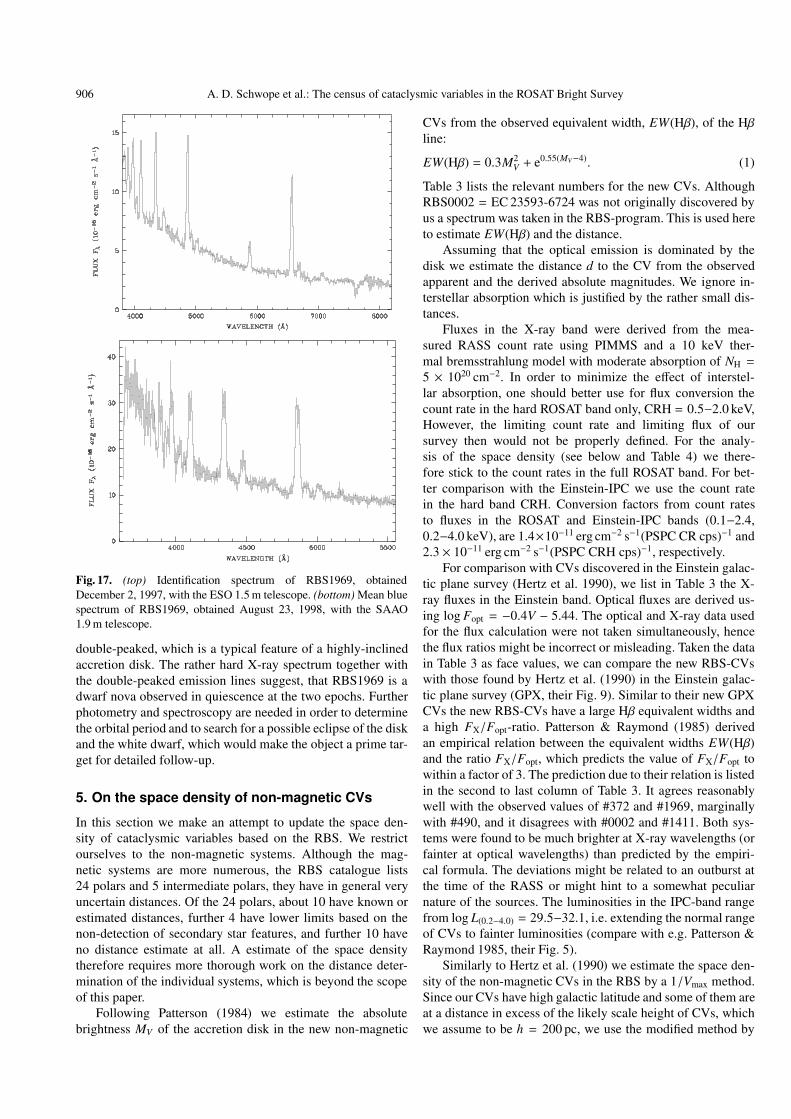
Fig. 17. (top) Identification spectrum of RBS1969, obtainedDecember 2, 1997, with the ESO 1.5 m telescope. (bottom) Mean bluespectrum of RBS1969, obtained August 23, 1998, with the SAAO1.9 m telescope.
double-peaked, which is a typical feature of a highly-inclinedaccretion disk. The rather hard X-ray spectrum together withthe double-peaked emission lines suggest, that RBS1969 is adwarf nova observed in quiescence at the two epochs. Furtherphotometry and spectroscopy are needed in order to determinethe orbital period and to search for a possible eclipse of the diskand the white dwarf, which would make the object a prime tar-get for detailed follow-up.
5. On the space density of non-magnetic CVs
In this section we make an attempt to update the space den-sity of cataclysmic variables based on the RBS. We restrictourselves to the non-magnetic systems. Although the mag-netic systems are more numerous, the RBS catalogue lists24 polars and 5 intermediate polars, they have in general veryuncertain distances. Of the 24 polars, about 10 have known orestimated distances, further 4 have lower limits based on thenon-detection of secondary star features, and further 10 haveno distance estimate at all. A estimate of the space densitytherefore requires more thorough work on the distance deter-mination of the individual systems, which is beyond the scopeof this paper.
Following Patterson (1984) we estimate the absolutebrightness MV of the accretion disk in the new non-magnetic
CVs from the observed equivalent width, EW(Hβ), of the Hβline:
EW(Hβ) = 0.3M2V + e0.55(MV−4). (1)
Table 3 lists the relevant numbers for the new CVs. AlthoughRBS0002 = EC 23593-6724 was not originally discovered byus a spectrum was taken in the RBS-program. This is used hereto estimate EW(Hβ) and the distance.
Assuming that the optical emission is dominated by thedisk we estimate the distance d to the CV from the observedapparent and the derived absolute magnitudes. We ignore in-terstellar absorption which is justified by the rather small dis-tances.
Fluxes in the X-ray band were derived from the mea-sured RASS count rate using PIMMS and a 10 keV ther-mal bremsstrahlung model with moderate absorption of NH =
5 × 1020 cm−2. In order to minimize the effect of interstel-lar absorption, one should better use for flux conversion thecount rate in the hard ROSAT band only, CRH = 0.5−2.0 keV,However, the limiting count rate and limiting flux of oursurvey then would not be properly defined. For the analy-sis of the space density (see below and Table 4) we there-fore stick to the count rates in the full ROSAT band. For bet-ter comparison with the Einstein-IPC we use the count ratein the hard band CRH. Conversion factors from count ratesto fluxes in the ROSAT and Einstein-IPC bands (0.1−2.4,0.2−4.0 keV), are 1.4×10⁻¹¹ erg cm−2 s−1(PSPC CR cps)−1 and2.3 × 10−11 erg cm−2 s−1(PSPC CRH cps)−1, respectively.
For comparison with CVs discovered in the Einstein galac-tic plane survey (Hertz et al. 1990), we list in Table 3 the X-ray fluxes in the Einstein band. Optical fluxes are derived us-ing log Fopt = −0.4V − 5.44. The optical and X-ray data usedfor the flux calculation were not taken simultaneously, hencethe flux ratios might be incorrect or misleading. Taken the datain Table 3 as face values, we can compare the new RBS-CVswith those found by Hertz et al. (1990) in the Einstein galac-tic plane survey (GPX, their Fig. 9). Similar to their new GPXCVs the new RBS-CVs have a large Hβ equivalent widths anda high FX/Fopt-ratio. Patterson & Raymond (1985) derivedan empirical relation between the equivalent widths EW(Hβ)and the ratio FX/Fopt, which predicts the value of FX/Fopt towithin a factor of 3. The prediction due to their relation is listedin the second to last column of Table 3. It agrees reasonablywell with the observed values of #372 and #1969, marginallywith #490, and it disagrees with #0002 and #1411. Both sys-tems were found to be much brighter at X-ray wavelengths (orfainter at optical wavelengths) than predicted by the empiri-cal formula. The deviations might be related to an outburst atthe time of the RASS or might hint to a somewhat peculiarnature of the sources. The luminosities in the IPC-band rangefrom log L(0.2−4.0) = 29.5−32.1, i.e. extending the normal rangeof CVs to fainter luminosities (compare with e.g. Patterson &Raymond 1985, their Fig. 5).
Similarly to Hertz et al. (1990) we estimate the space den-sity of the non-magnetic CVs in the RBS by a 1/Vmax method.Since our CVs have high galactic latitude and some of them areat a distance in excess of the likely scale height of CVs, whichwe assume to be h = 200 pc, we use the modified method by
A. D. Schwope et al.: The census of cataclysmic variables in the ROSAT Bright Survey 907
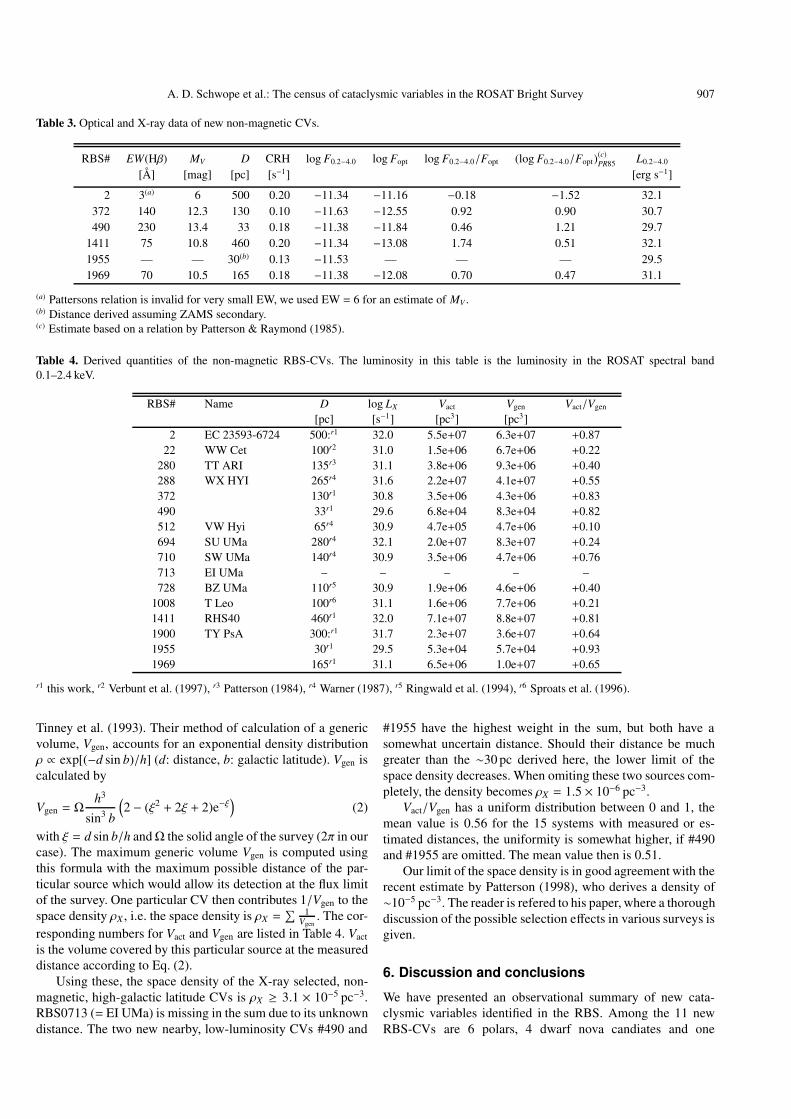
Table 3. Optical and X-ray data of new non-magnetic CVs.
RBS# EW(Hβ) MV D CRH log F0.2−4.0 log Fopt log F0.2−4.0/Fopt (log F0.2−4.0/Fopt)(c)PR85 L0.2−4.0
[Å] [mag] [pc] [s−1] [erg s−1]
2 3(a) 6 500 0.20 −11.34 −11.16 −0.18 −1.52 32.1372 140 12.3 130 0.10 −11.63 −12.55 0.92 0.90 30.7490 230 13.4 33 0.18 −11.38 −11.84 0.46 1.21 29.7
1411 75 10.8 460 0.20 −11.34 −13.08 1.74 0.51 32.11955 — — 30(b) 0.13 −11.53 — — — 29.51969 70 10.5 165 0.18 −11.38 −12.08 0.70 0.47 31.1
(a) Pattersons relation is invalid for very small EW, we used EW = 6 for an estimate of MV .(b) Distance derived assuming ZAMS secondary.(c) Estimate based on a relation by Patterson & Raymond (1985).
Table 4. Derived quantities of the non-magnetic RBS-CVs. The luminosity in this table is the luminosity in the ROSAT spectral band0.1–2.4 keV.
RBS# Name D log LX Vact Vgen Vact/Vgen
[pc] [s−1] [pc3] [pc3]2 EC 23593-6724 500:r1 32.0 5.5e+07 6.3e+07 +0.87
22 WW Cet 100r2 31.0 1.5e+06 6.7e+06 +0.22280 TT ARI 135r3 31.1 3.8e+06 9.3e+06 +0.40288 WX HYI 265r4 31.6 2.2e+07 4.1e+07 +0.55372 130r1 30.8 3.5e+06 4.3e+06 +0.83490 33r1 29.6 6.8e+04 8.3e+04 +0.82512 VW Hyi 65r4 30.9 4.7e+05 4.7e+06 +0.10694 SU UMa 280r4 32.1 2.0e+07 8.3e+07 +0.24710 SW UMa 140r4 30.9 3.5e+06 4.7e+06 +0.76713 EI UMa – – – – –728 BZ UMa 110r5 30.9 1.9e+06 4.6e+06 +0.40
1008 T Leo 100r6 31.1 1.6e+06 7.7e+06 +0.211411 RHS40 460r1 32.0 7.1e+07 8.8e+07 +0.811900 TY PsA 300:r1 31.7 2.3e+07 3.6e+07 +0.641955 30r1 29.5 5.3e+04 5.7e+04 +0.931969 165r1 31.1 6.5e+06 1.0e+07 +0.65
r1 this work, r2 Verbunt et al. (1997), r3 Patterson (1984), r4 Warner (1987), r5 Ringwald et al. (1994), r6 Sproats et al. (1996).
Tinney et al. (1993). Their method of calculation of a genericvolume, Vgen, accounts for an exponential density distributionρ ∝ exp[(−d sin b)/h] (d: distance, b: galactic latitude). Vgen iscalculated by
Vgen = Ωh3
sin3 b
(2 − (ξ2 + 2ξ + 2)e−ξ
)(2)
with ξ = d sin b/h andΩ the solid angle of the survey (2π in ourcase). The maximum generic volume Vgen is computed usingthis formula with the maximum possible distance of the par-ticular source which would allow its detection at the flux limitof the survey. One particular CV then contributes 1/Vgen to thespace density ρX , i.e. the space density is ρX =
∑ 1Vgen
. The cor-responding numbers for Vact and Vgen are listed in Table 4. Vact
is the volume covered by this particular source at the measureddistance according to Eq. (2).
Using these, the space density of the X-ray selected, non-magnetic, high-galactic latitude CVs is ρX ≥ 3.1 × 10⁻⁵ pc−3.RBS0713 (= EI UMa) is missing in the sum due to its unknowndistance. The two new nearby, low-luminosity CVs #490 and
#1955 have the highest weight in the sum, but both have asomewhat uncertain distance. Should their distance be muchgreater than the ∼30 pc derived here, the lower limit of thespace density decreases. When omiting these two sources com-pletely, the density becomes ρX = 1.5 × 10⁻⁶ pc−3.
Vact/Vgen has a uniform distribution between 0 and 1, themean value is 0.56 for the 15 systems with measured or es-timated distances, the uniformity is somewhat higher, if #490and #1955 are omitted. The mean value then is 0.51.
Our limit of the space density is in good agreement with therecent estimate by Patterson (1998), who derives a density of∼10−5 pc−3. The reader is refered to his paper, where a thoroughdiscussion of the possible selection effects in various surveys isgiven.
6. Discussion and conclusions
We have presented an observational summary of new cata-clysmic variables identified in the RBS. Among the 11 newRBS-CVs are 6 polars, 4 dwarf nova candiates and one
908 A. D. Schwope et al.: The census of cataclysmic variables in the ROSAT Bright Survey
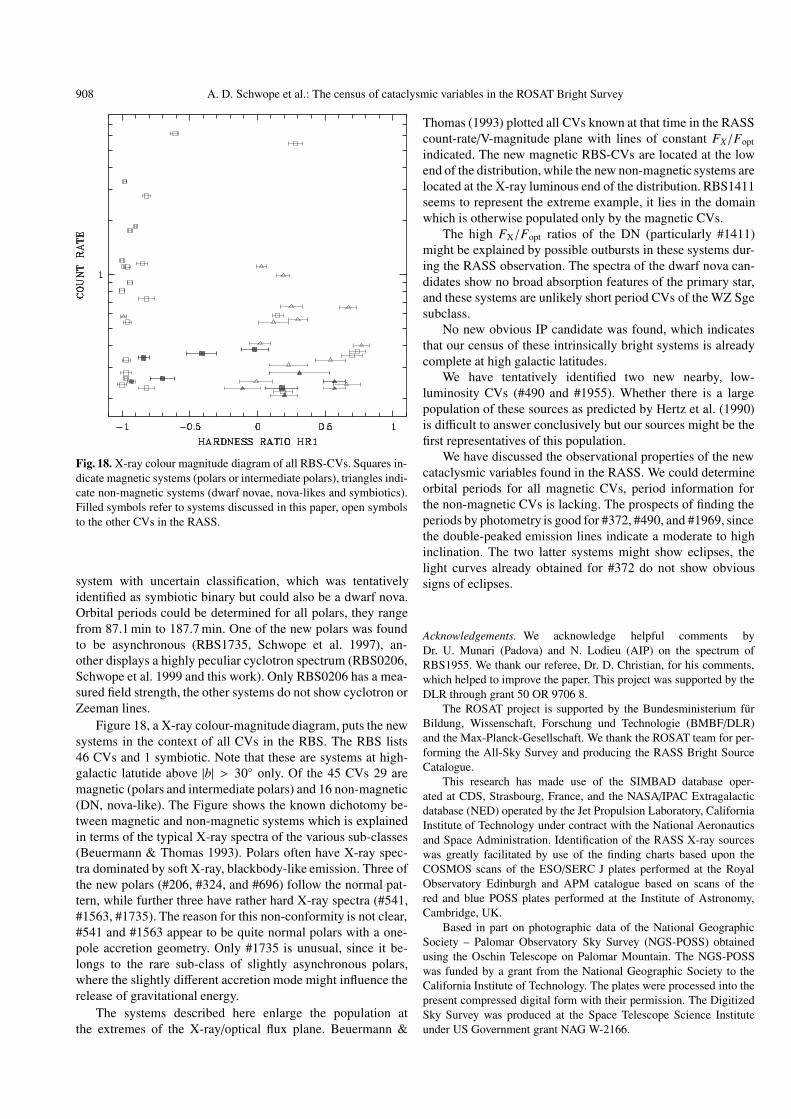
Fig. 18. X-ray colour magnitude diagram of all RBS-CVs. Squares in-dicate magnetic systems (polars or intermediate polars), triangles indi-cate non-magnetic systems (dwarf novae, nova-likes and symbiotics).Filled symbols refer to systems discussed in this paper, open symbolsto the other CVs in the RASS.
system with uncertain classification, which was tentativelyidentified as symbiotic binary but could also be a dwarf nova.Orbital periods could be determined for all polars, they rangefrom 87.1 min to 187.7 min. One of the new polars was foundto be asynchronous (RBS1735, Schwope et al. 1997), an-other displays a highly peculiar cyclotron spectrum (RBS0206,Schwope et al. 1999 and this work). Only RBS0206 has a mea-sured field strength, the other systems do not show cyclotron orZeeman lines.
Figure 18, a X-ray colour-magnitude diagram, puts the newsystems in the context of all CVs in the RBS. The RBS lists46 CVs and 1 symbiotic. Note that these are systems at high-galactic latutide above |b| > 30 only. Of the 45 CVs 29 aremagnetic (polars and intermediate polars) and 16 non-magnetic(DN, nova-like). The Figure shows the known dichotomy be-tween magnetic and non-magnetic systems which is explainedin terms of the typical X-ray spectra of the various sub-classes(Beuermann & Thomas 1993). Polars often have X-ray spec-tra dominated by soft X-ray, blackbody-like emission. Three ofthe new polars (#206, #324, and #696) follow the normal pat-tern, while further three have rather hard X-ray spectra (#541,#1563, #1735). The reason for this non-conformity is not clear,#541 and #1563 appear to be quite normal polars with a one-pole accretion geometry. Only #1735 is unusual, since it be-longs to the rare sub-class of slightly asynchronous polars,where the slightly different accretion mode might influence therelease of gravitational energy.
The systems described here enlarge the population atthe extremes of the X-ray/optical flux plane. Beuermann &
Thomas (1993) plotted all CVs known at that time in the RASScount-rate/V-magnitude plane with lines of constant FX/Fopt
indicated. The new magnetic RBS-CVs are located at the lowend of the distribution, while the new non-magnetic systems arelocated at the X-ray luminous end of the distribution. RBS1411seems to represent the extreme example, it lies in the domainwhich is otherwise populated only by the magnetic CVs.
The high FX/Fopt ratios of the DN (particularly #1411)might be explained by possible outbursts in these systems dur-ing the RASS observation. The spectra of the dwarf nova can-didates show no broad absorption features of the primary star,and these systems are unlikely short period CVs of the WZ Sgesubclass.
No new obvious IP candidate was found, which indicatesthat our census of these intrinsically bright systems is alreadycomplete at high galactic latitudes.
We have tentatively identified two new nearby, low-luminosity CVs (#490 and #1955). Whether there is a largepopulation of these sources as predicted by Hertz et al. (1990)is difficult to answer conclusively but our sources might be thefirst representatives of this population.
We have discussed the observational properties of the newcataclysmic variables found in the RASS. We could determineorbital periods for all magnetic CVs, period information forthe non-magnetic CVs is lacking. The prospects of finding theperiods by photometry is good for #372, #490, and #1969, sincethe double-peaked emission lines indicate a moderate to highinclination. The two latter systems might show eclipses, thelight curves already obtained for #372 do not show obvioussigns of eclipses.
Acknowledgements. We acknowledge helpful comments byDr. U. Munari (Padova) and N. Lodieu (AIP) on the spectrum ofRBS1955. We thank our referee, Dr. D. Christian, for his comments,which helped to improve the paper. This project was supported by theDLR through grant 50 OR 9706 8.
The ROSAT project is supported by the Bundesministerium furBildung, Wissenschaft, Forschung und Technologie (BMBF/DLR)and the Max-Planck-Gesellschaft. We thank the ROSAT team for per-forming the All-Sky Survey and producing the RASS Bright SourceCatalogue.
This research has made use of the SIMBAD database oper-ated at CDS, Strasbourg, France, and the NASA/IPAC Extragalacticdatabase (NED) operated by the Jet Propulsion Laboratory, CaliforniaInstitute of Technology under contract with the National Aeronauticsand Space Administration. Identification of the RASS X-ray sourceswas greatly facilitated by use of the finding charts based upon theCOSMOS scans of the ESO/SERC J plates performed at the RoyalObservatory Edinburgh and APM catalogue based on scans of thered and blue POSS plates performed at the Institute of Astronomy,Cambridge, UK.
Based in part on photographic data of the National GeographicSociety – Palomar Observatory Sky Survey (NGS-POSS) obtainedusing the Oschin Telescope on Palomar Mountain. The NGS-POSSwas funded by a grant from the National Geographic Society to theCalifornia Institute of Technology. The plates were processed into thepresent compressed digital form with their permission. The DigitizedSky Survey was produced at the Space Telescope Science Instituteunder US Government grant NAG W-2166.
A. D. Schwope et al.: The census of cataclysmic variables in the ROSAT Bright Survey 909
Appendix A: Finding charts of the new CVs
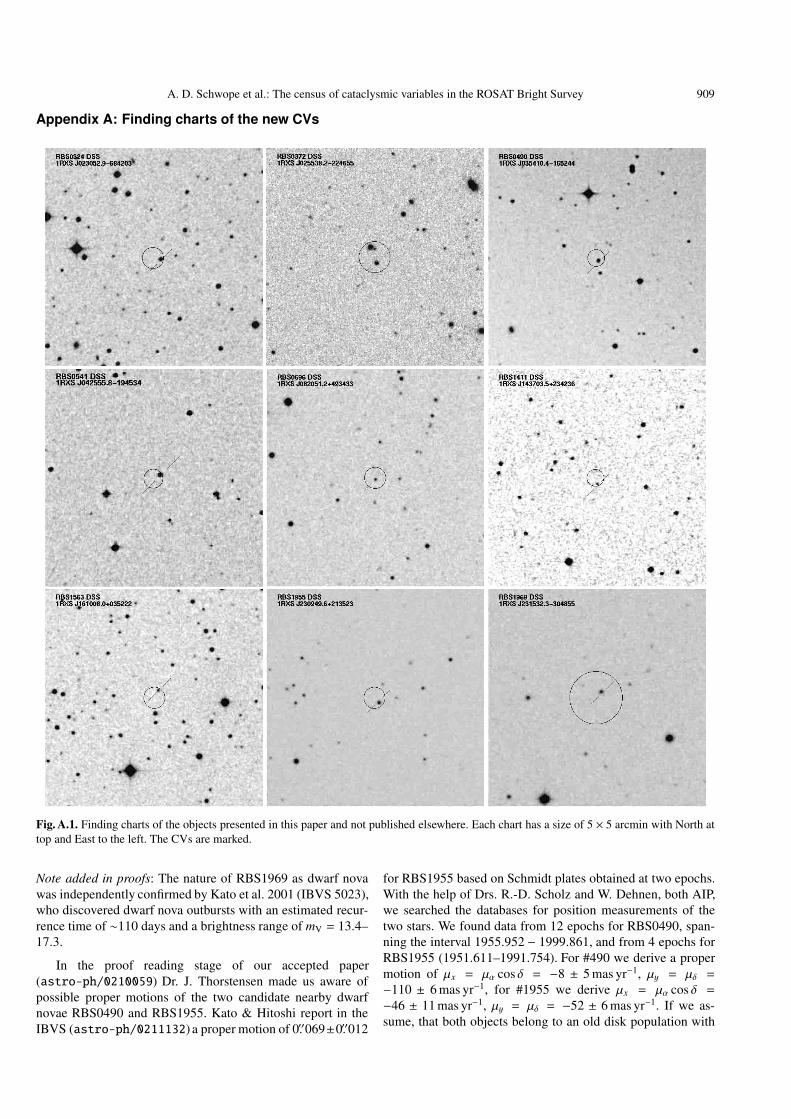
Fig. A.1. Finding charts of the objects presented in this paper and not published elsewhere. Each chart has a size of 5 × 5 arcmin with North attop and East to the left. The CVs are marked.
Note added in proofs: The nature of RBS1969 as dwarf novawas independently confirmed by Kato et al. 2001 (IBVS 5023),who discovered dwarf nova outbursts with an estimated recur-rence time of ∼110 days and a brightness range of mV = 13.4–17.3.
In the proof reading stage of our accepted paper(astro-ph/0210059) Dr. J. Thorstensen made us aware ofpossible proper motions of the two candidate nearby dwarfnovae RBS0490 and RBS1955. Kato & Hitoshi report in theIBVS (astro-ph/0211132) a proper motion of 0.′′069±0.′′012
for RBS1955 based on Schmidt plates obtained at two epochs.With the help of Drs. R.-D. Scholz and W. Dehnen, both AIP,we searched the databases for position measurements of thetwo stars. We found data from 12 epochs for RBS0490, span-ning the interval 1955.952 − 1999.861, and from 4 epochs forRBS1955 (1951.611–1991.754). For #490 we derive a propermotion of µx = µα cos δ = −8 ± 5 mas yr−1, µy = µδ =−110 ± 6 mas yr−1, for #1955 we derive µx = µα cos δ =−46 ± 11 mas yr−1, µy = µδ = −52 ± 6 mas yr−1. If we as-sume, that both objects belong to an old disk population with
910 A. D. Schwope et al.: The census of cataclysmic variables in the ROSAT Bright Survey
σr ' 40 km s−1 and a Schwarzschild distribution function, onederives for the given position and proper motion a distance of31±63 km s−1 and 24±112 km s−1 for RBS0490 and RBS1955,respectively. Although these estimates are not very constrain-ing they support the spectroscopic parallax made in the paper.They exclude a giant nature of the secondary in RBS1955.
Photometry of RBS1955 through an I-filter was obtainedduring three nights in October 2002 using the Calar Alto 1.23 mtelescope with CCD camera. Variability of up to 0.25 magwas evident. A period search with the analysis-of-variancetechnique revealed possible periods at 3.8, 4.5, and 5.6 hours.Longer periods cannot be excluded. The shortest periodsare roughly compatible with a Roche-lobe filling M3 dwarf.Detailed photometric and spectroscopic follow-up is necessaryin order to determine the true nature of this interesting source.
References
Beuermann, K., & Schwope, A. D. 1994, in Interacting binary stars,ed. A. W. Shafter, San Francisco, Calif. Astronomical Society ofthe Pacific, 56, 119
Beuermann, K., & Thomas, H.-C. 1993, Adv. Sp. Res., 13(12), 115Beuermann, K., Thomas, H.-C., Reinsch, K., et al. 1999, A&A, 347,
47Cao, L., Wei, J.-Y., & Hu, J.-Y. 1999, A&AS, 135, 243Fischer, J.-U., Hasinger, G., Schwope, A. D., et al. 1998, AN, 319,
347Gansicke, B., Beuermann, K., & de Martino, D. 1995, A&A, 303, 127Hertz, P., Bailyn, C. D., Grindlay, J. E., et al. 1990, ApJ, 364, 251van der Heyden, K. 2000, Ph.D. Thesis, Univ. Cape TownJiang, X. J., Engels, D., Wei, J. Y., Tesch, F., & Hu, J. Y. 2000, A&A,
362, 263Kirkpatrick, J. D., Henry, T. J., & McCarthy, Jr., D. 1991, ApJS, 77,
417Kirkpatrick, J. D., Reid, I. N., Liebert, J., et al. 1999, ApJ, 519, 802
de Kool, M. 1992, A&A, 261, 188Liebert, J., Stockman, H. S., Williams, R. E., et al. 1982, ApJ, 256,
594Martın, E. L., Delfosse, X., Basri, G., et al. 1999, AJ, 118, 2466Mateo, M., & Schechter, P. 1989, in 1st ESO/ST-ECF Data Analysis
Workshop, ed. P. J. Grosbol, F. Murtagh, & R. H. Warmels, 69Miyaji, T., Hasinger, G., & Schmidt, M. 2001, A&A, 369, 49Ostreicher, R., Seifert, W., Wunner, G., & Ruder, H. 1990, ApJ, 350,
324Paerels, F., Heise, J., & v. Teeseling, A. 1994, ApJ, 426, 313Patterson, J. 1984, ApJS, 54, 443Patterson, J. 1998, PASP, 110, 1132Patterson, J., & Raymond, J. C. 1985, ApJ, 292, 535Politano, M. 1996, ApJ, 465, 338Pye, J. P., McGale, P. A., Allan, D. J., et al. 1995, MNRAS, 274, 1165Ringwald, F., Thorstensen, J. R., & Hamwey, R. M. 1994, MNRAS,
271, 323Schwope, A. D. 1990, Rev. Mod. Astron., 3, 44Schwope, A. D. 1991, Ph.D. Thesis, TU BerlinSchwope, A. D., Hasinger, G., Lehmann, I., et al. 2000, AN, 321, 1Schwope, A. D., Schwarz, R., & Greiner, J. 1999, A&A, 348, 861Schwope, A. D., Buckley, D. A. H., O’Donoghue, D., et al. 1997,
A&A, 326, 195Sokoloski, J. L., Bildsten, L., & Ho, W. C. G. 2001, MNRAS, 326,
553Sproats, L., Howell, S. B., & Mason, K. O. 1996, MNRAS, 282, 1211Thomas, H.-C., Beuermann, K., Reinsch, K., et al. 1998, A&A, 335,
467Tinney, C. G., Reid, I. N., & Mould, J. R. 1993, ApJ, 414, 254Torres-Dodgen, A. V., & Weaver, W. B. 1993, AJ, 105, 693Verbunt, F., Bunk, W. H., Ritter, H., & Pfeffermann, E. 1997, A&A,
327, 602Warner, B. 1987, MNRAS, 227, 23Wei, J. Y., Xu, D. W., Dong, X. Y., & Hu, J. Y. 1999, A&AS, 139, 575Zamorano, J., Gallego, J., Rego, M., Vitores, A. G., & Alonso, O.
1996, ApJS, 105, 343