Embed Size (px)
Citation preview

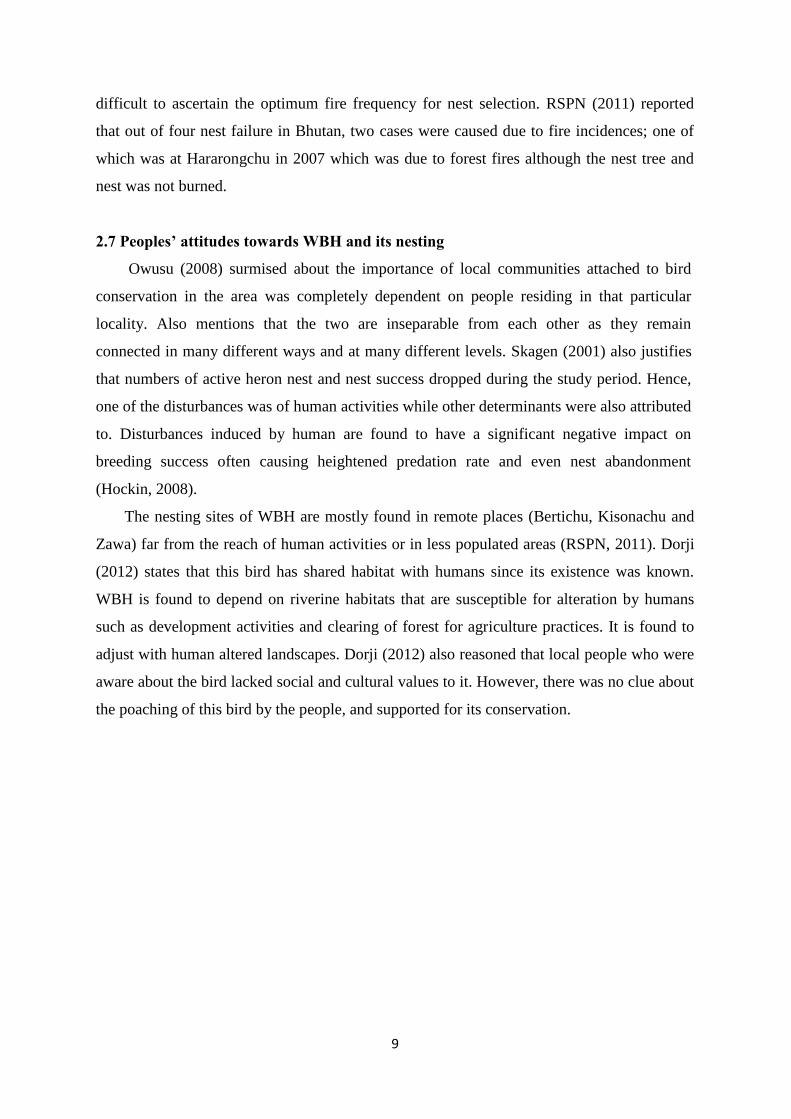
PLAGIARISM DECLARATION FORM
I declare that this is an original work and I have not committed, to my knowledge, any academic
dishonesty or resorted to plagiarism in writing the dissertation titled “Influence of Forest Fires
on Nest Selection Pattern by White-Bellied Heron along Punatshangchhu Basin under
Wangdue Phodrang and Punakha Districts”. All the sources of information and assistance
received during the course of the study are duly acknowledged.
Sonam Yonten
B.Sc. Forestry
College of Natural Resources
Royal University of Bhutan
Punakha: Bhutan
February 13, 2017

i
ACRONYMS
ANOVA : Analysis of variance
BBSAP
BBIRD
:
:
Bhutan Biodiversity Strategic Action Plan
Breeding Biology Research and Monitoring Database
cm : Centimeter
CNR : College of Natural Resources
DBH : Diameter at Breast Height
DoFPS : Department of Forests & Park Services
GPS : Global Positioning System
H‟ : Shanon-Wiener Diversity Index
IUCN : International Union for Conservation of Nature
LSGM : Local Support Group Members
m.a.s.l : Meter above sea level
m3 : Cubic meter
MoAF : Ministry of Agriculture & Forest
RBA : Relative Basal Area
RC : Relative Cover
RF : Relative Frequency
RGoB : Royal Government of Bhutan
RSPN : Royal Society for the Protection of Nature
S : Species richness
SFD : Social Forest Division
SPSS : Statistical Package for Social Sciences
WBH : White-bellied Heron

ii
ACKNOWLEDGEMENT
This study was possible because of the contributions of many people and organizations.
First and foremost, I would thank Mr. Jane Raymond and Mr. Josh Cole of Rufford, United
Kingdom for supporting my research with generous funding, without which this study would not
have materialized.
I wish to thank my referee Mr. Yonten Dorji, Lecturer, CNR for his continuous supervision,
encouragement and guidance during this research project. I would remain grateful to Dr. Kinley
Tenzin, Executive Director, Royal Society for Protection of Nature (RSPN), Thimphu for
facilitating me to finally get to this particular topic. I will always remember the support of
Madam Rebecca Pradhan, Ecologist, RSPN for sharing her knowledge and experiences on WBH
and also helping in identification of plant specimens collected from the field. Mr. Sonam
Tshering, Research Assistant, RSPN is also genuinely thanked for guiding us to the nest trees of
Zawa and Nangzina, and for providing the necessary data of WBH. I would also express my
gratitude to Dr. Purna Bahadur Chettri, RNR-RDC, Yusipang, Thimphu for providing me with
the necessary research inputs.
I would eternally be grateful to my colleagues of CNR; Mr. Rabten, Mr. Ngawang Tenzin
and Mr. Jambay Dhendup for accompanying me in a chase to find the nests of WBH on steep
cliffs of Tshekhathang and Athang in Punakha and Wangdi Phodrang districts respectively. I
would thank Mr.Tashi Phuntsho, Mr. Rinchen Dorji and Mr. Damber Kumar Ghemiray, Forest
Rangers, DoFPS for helping with the observational and social data collection. I would also thank
Mr. Sangay Tshewang, Forest Ranger, Athang Gewog for providing the logistic support and
helping with botanization of plants during the data collection. I sincerely thank the family of Mr.
Wangchuk, Mr. Kinley and Mr. Penjor, Local Support Group Members (LSGM) for being a
wonderful host and for guiding us to the nest trees of WBH.
I would like to acknowledge the staff of Divisional Forest Office of Punakha and Wangdi
Phodrang districts and Mr. Kinley Tshering, Forest Fire Management Section of the Department
of Forests and Park Services (DoFPS) for furnishing fire data of these areas.

iii
ABSTRACT
This study is a first attempt in entire home ranges of White-bellied Heron (Ardea insignis
Hume), to assess the effects of forest fire frequency on vegetation structure and
composition in its nesting habitats. Subsequently, to understand the trade-offs of fire
frequency on nest-selection and nest-use of White-bellied heron (WBH). The study was
conducted in Chhubu and Athang Gewog in Punakha and Wangdiphodrang districts
respectively at five sites. The sites were categorized into 3 classes as; i) once burnt ii)
twice burnt and iii) frequently burnt sites, in the last 10 years. The vegetation survey was
conducted by laying 10 quadrats (10 m X 10 m each) in four transects of 100 m each.
Transects were established in four cardinal directions with nest tree as the center point.
Social survey was carried out within 500 m buffer from the nest tree. The research findings
showed that, twice burnt site had the maximum number of nests built of 66.7% (n = 8) and
active nests of 78.6% (n = 11). Twice burnt site revealed approximately four times more
nest presence over once and frequently burnt sites. It was observed that there was a
significant relationship of WBH nest-site selection to forest structures such as stem
density, canopy cover, tree height and DBH. It is recommended to protect mature Chirpine
stands along the water bodies from frequent fires, and creating fire breaks around the nest
trees during breeding and nesting seasons. This would help to conserve the nest-sites of
WBH.
Keywords: Active nest, fire frequency, nest- site selection, vegetation structure

iv
Table of Contents
PLAGIARISM DECLARATION FORM ........................................................................................... i
ACRONYMS ...................................................................................................................................... ii
ACKNOWLEDGEMENT ................................................................................................................. iii
ABSTRACT ....................................................................................................................................... iii
CHAPTER ONE ................................................................................................................................. 1
1.1. Background .................................................................................................................................. 1
1.2. Problem statement ........................................................................................................................ 2
1.3. Rationale ...................................................................................................................................... 2
1.4. Hypothesis.................................................................................................................................... 3
1.5. Research objectives ...................................................................................................................... 3
1.6. Research questions ....................................................................................................................... 3
1.7. Scope and limitation .................................................................................................................... 4
CHAPTER TWO ................................................................................................................................ 5
Literature review ................................................................................................................................. 5
2.1. General Description and status of WBH ...................................................................................... 5
2.2. Disturbance and threats to WBH ................................................................................................. 5
2.3. Nesting and breeding ecology of WBH ....................................................................................... 6
2.4. Impacts of forest fires on vegetation structure and composition ................................................. 6
2.5. Association of bird communities and vegetation in the fire altered habitats ............................... 7
2.6. Fire influence on the vegetation and bird nests in context to WBH ............................................ 7
2.7. Peoples‟ attitudes towards WBH and its nesting ......................................................................... 9
CHAPTER THREE .......................................................................................................................... 10
Materials and methods ...................................................................................................................... 10
3.1. Study area................................................................................................................................... 10
3.2. Survey methods and sampling design ........................................................................................ 12
3.2.1. Vegetation survey ............................................................................................................ 12
3.2.2. Social survey .................................................................................................................... 13
3.2.3. Secondary data collection ............................................................................................... 14
3.2.4. Field Equipment .............................................................................................................. 14

v
3.3. Data analyzing ........................................................................................................................... 14
3.3.1. Vegetation data analyzing ............................................................................................... 14
3.3.2. Dominance analysis ......................................................................................................... 15
3.3.3. Nest and fire analysis ...................................................................................................... 15
3.3.4. Survey questionnaire analysis ......................................................................................... 16
CHAPTER FOUR ............................................................................................................................. 17
Results and Discussion ..................................................................................................................... 17
4.1. Nesting site description .............................................................................................................. 17
4.2. Nest presence and active nest in different sites ......................................................................... 17
4.3. Characteristics of the Nest tree of WBH .................................................................................... 18
4.4. Tree Species composition, life forms and dominance ............................................................... 19
4.5. Shrub Layer composition, life forms and dominance ................................................................ 19
4.6. Ground Cover Composition, Life forms and dominance........................................................... 20
4.7. Species diversity and richness ................................................................................................... 21
4.8. Forest structural traits of nesting habitat of WBH ..................................................................... 21
4.8.1. Influence of tree Height on nest-site selection................................................................. 22
4.8.2. Influence of tree diameter on nest-site selection ............................................................. 23
4.8.3. Influence of stem density and basal area on nest-site selection ...................................... 24
4.8.4. Influence of canopy cover on nest-site selection ............................................................. 25
4.8.5. Effects of shrub height and frequency on nest-site selection ........................................... 26
4.9. Trend of active nesting by WBH in response to fire incidence ................................................. 27
4.10. Peoples Attitude towards WBH and its nest ............................................................................ 31
4.11. Disturbances in the Nesting habitat ......................................................................................... 31
4.12. Causes of fire and local attitude to WBH ................................................................................ 32
4.13. Nest Use after fire and Return Interval of WBH ..................................................................... 33
CHAPTER FIVE .............................................................................................................................. 34
Conclusion ........................................................................................................................................ 34
Reference .......................................................................................................................................... 35

vi
List of Tables
Table 3.1. Classification of study sites in relation to fire frequency ............................................ 16
Table 4.1. Description of WBH nest sites..................................................................................... 17
Table 4.2. Nest tree characteristics ............................................................................................... 17
Table 4.3. Indices for trees and shrubs species ............................................................................. 22
Table 4.5. Correlation between sites and shrub height and frequency ......................................... 26

vii
List of Figures
Figure 3.1. Location map of the study area: (A) Bhutan map showing the Dzongkhag map,
(B) Dzongkhag map indicating the Gewog, (C) Gewog map indicating the study sites (D)
Google earth showing study sites ................................................................................................. 11
Figure 3.2. Location map of the study area: (A) Dzongkhag map indicating the Gewog, (B)
Gewog map indicating the study site …………………………………………………………...12
Figure 3.3. Plot layout around the nest tree .................................................................................. 13
Figure 4.1. Showing total number of nests and active nests in last 10 years of WBH ................. 18
Figure 4.2. Showing the life forms of the tree layer ..................................................................... 19
Figure 4.3. Showing the life forms of shrub layer ........................................................................ 20
Figure 4.4. Showing the life forms of ground layer ...................................................................... 21
Figure 4.5. Height class distribution in different sites .................................................................. 23
Figure 4.6. Diameter class distribution of trees in different sites ................................................. 24
Figure 4.7. Stem density per plot in different sites ....................................................................... 25
Figure 4.8. Canopy cover percent in different sites ...................................................................... 26
Figure 4.9. Shrub frequency in different sites ............................................................................... 27
Figure 4.10. Trend of active nest in once burnt (Lopkha) ............................................................ 27
Figure 4.11. Trend of active nest in twice burnt (Harachu) .......................................................... 28
Figure 4.12. Trend of active nest in twice burnt (Nangzina) ........................................................ 28
Figure 4.13. Trend of active nest in twice burnt (Tshekhathang) ................................................. 29
Figure 4.14. Trend of active nest in frequently burnt (Zawa) ....................................................... 29
Figure 4.15. Carcass of WBH found at Harachu .......................................................................... 31
Figure 4.16. Disturbances in WBH's nesting habitat .................................................................... 32
Figure 4.17. Causes of fires in nesting habitat .............................................................................. 33
Figure 4.18. People‟s attitude towards WBH ............................................................................... 33
Figure 4.19. Nest use by WBH after fire ...................................................................................... 33
Figure 4.20. Post-fire return interval of WBH .............................................................................. 33

viii
List of Appendices
Appendix I - Household Survey Questionnaires .......................................................................... 40
Appendix II -Tree Data format ..................................................................................................... 42
Appendix III - Shrub data format.................................................................................................. 43
Appendix IV - Ground data format ............................................................................................... 44
Appendix V - Nest Data format .................................................................................................... 45
Appendix VI - Tree vegetation composition ................................................................................ 46
Appendix VII - Shrub vegetation composition ............................................................................. 47
Appendix VIII - Ground vegetation composition of the study sites ............................................. 48
Appendix IX - Field photographs ................................................................................................. 49

1
CHAPTER ONE
Introduction
1.1 Background
In 1988, Bhutan was identified as one of the ten biodiversity hotspot of the world.
Bhutan is a repository to more than 700 species of birds including 221 global endemic birds,
18 of which are globally threatened, 4 are critically endangered and 28 numbers of White-
bellied Heron from the global population of 50-200 birds (BBSAP, 2014). Krishna et al.
(2012) puts forth that global distribution of WBH is restricted to eastern Himalaya in India
(West Bengal, Assam, Arunachal Pradesh, and Nagaland), northeastern Bangladesh, Burma
and Bhutan (Punakha, Wangdue and Zhemgang). It is a large and long-necked heron
measuring 127 cm in height. It is scientifically known as Ardea insignis Hume belonging to
the family ardeidae. It is the second largest heron in the world (BirdLife, 2015). Since 2007,
IUCN declared it as a critically endangered species. It is classified as a Critically
Endangered bird owing to extremely small and declining population. The decline is
predicted to increase with multiple agents of disturbance (BirdLife, 2001).
In recent decades, there has been notable decline in the population of White-bellied
Heron. In Bhutan, RSPN (2015) reported the drop in population as well. Though the specific
cause of this decline lack in-depth studies, however, it is attributed towards predator, habitat
loss, fire incidence, water-based recreation, and the alike. In the study by Woinarski and
Recher (1997), the main threat behind declining bird species in many environment is the
inappropriate fire regime. The reproductive output and dispersal ability is low in fire
sensitive threatened species. The author further emphasized on the isolated colonies of birds,
wherein, a single fire would wipe enormous proportion of the population.
Punatshangchhu and its tributaries are the permanent habitats of WBH. It includes rivers
from Mochu, Phochu, Zawachu, Digchu, Kamichu, Ada, Kisonachu, Hararongchu, Cerichu,
Burichu and Dagachu (RSPN, 2011). In the study conducted by RSPN from 2003 to 2011,
they found 26 WBHs regularly residing the Punatshangchhu basin and tributaries.
Wangdiphodrang Dzongkhag lies in warm-dry conifers which are principally dominated
by Chirpine stands. Therefore, fire has been the part of natural consequence and as well as of
anthropogenic origin in these regions. Nests of the WBH are particularly found in the tall
Chirpine (Pinus roxburghii Sarg) trees at an altitude range of 700-1000 m.a.s.l. (RSPN,
2011). Chirpine stands and its related plant communities are prone to fire mostly during the

2
dry seasons. RSPN (2011) also studied that WBH prefers sparsely dispersed trees without
any understory near them. This is found to be strongly evident from the fact that most
nesting areas were located on the trees with fire scars, limited ground debris and without
mid-story. Thus, the interaction between fire frequency and large open Chir pine trees were
probable. There were at least two cases during which nest was destroyed and abandoned in
the following year
There is paucity of information regarding the study on WBH and its relationship
towards the forest fire as of now (RSPN, 2011). The present study tries to find the impacts of
forest fire frequency on nest-site selection by WBH in Punakha and Wangdue Phodrang
Dzongkhag along the Punatshangchhu basin. The study will generate benchmark information
concerning the interplay between WBH and fire frequency in these areas.
1.2 Problem statement
Punatshangchhu and its tributaries have been identified as a permanent habitat of WBH
among the river systems of Bhutan; nevertheless, the noticeable disturbance along this stretch
of river basin is forest fire among many others. Fire is known to alter their habitat and other
associated ecological functions. RSPN has recorded few instances where the wild fire
destroyed the nest and abandoned the following year. Therefore, this study on fire frequency
influences on WBH nesting pattern along Punatshangchhu River is felt timely to address the
issues related to declining population of WBH due to fire.
1.3 Rationale
It has become inevitable truth of the declining population of White-bellied heron within
its global home range owing to disturbances emanating from various natural and artificial
sources. In Bhutan also, out of many disturbances fire is perceived to be the prominent one
as this region is mostly dominated by Chir pine stands that are susceptible to fire during the
winter and spring seasons. There is also a common trend and practice by the community of
using fires within this continuum in order to manage grazing ground for their cattle.
Exacerbating the scenario people are not cautious about the fires in this locality, which is
also the permanent habitat of WBH. On the other hand, birds are considered to be good
indicators of environmental monitoring, hence, birds‟ population have been monitored in
many countries. Though only few thorough studies had been conducted on use of birds as a
tool in environmental monitoring (Koskimies, 1989). Nath and Shamlai (n.d) asserts on the

3
study of WBH as a potential tool for monitoring environment, which still remains
unexplored.
Recently burned forest would help to reduce the population of nest predators; therefore,
it is likely that reduced predators would allow higher reproduction success and their
dispersal (Saab and Vierling, 2001). Fire also changes the nesting requirements of avifauna
due to their preference for moderately burned forests on temporal scales, thus the population
is predicted to decline as the risk of fire severity increases (Bull and Jackson, 1995). Fire
creates short-term habitat conditions that are dynamic and change over with plant succession
(Saab et al., 2007). The sighting of WBH‟s nests in some of the Chir pine trees along these
river substantiate the possible interaction between this bird and the habitats developed due to
fire incidences.
1.4 Hypothesis
Null Hypothesis: There is no significant difference in WBH nesting pattern as a result of
varying fire frequency.
Alternate Hypothesis: The nest selection by WBH decreases with increase in fire frequency
in its habitat.
1.5 Research objectives
1. To assess the structure and composition of vegetation in the nesting habitat of WBH
in once burnt, twice burnt and frequently burnt sites in past 10 years in Punakha and
Wangdi Phodrang districts.
2. To document the trend of active nesting pattern of WBH in response to fire over the
last 10 years in Punakha and Wangdi Phodrang districts.
3. To determine the causes of fire in the nesting habitats of WBH in Punakha and
Wangdi Phodrang districts.
1.6 Research questions
1. Do nest selections by WBH depend on different fire frequencies?
2. How does the different vegetation structure and composition from fire, impact the
active nesting of WBH?
3. What is the difference in active nesting pattern of WBH with different fire frequencies
in the last 1 decade?
4. What is the cause of fire in the nesting habitat of WBH?

4
1.7 Scope and limitation
This research is the first attempt to understand the influence of forest fires to the nest
selection behaviour of White-bellied Heron. None of the range countries have conducted any
research pertaining to nesting of this bird in response to forest fires except for the RSPN; it
has in general described the nesting characteristics of birds which are perceived to be due to
the influence of fires. There is an extreme literature deficit on this topic. The bird is found to
select a strategic location to limit the danger from its immediate predators, fires and also to
comfort its normal activities (RSPN, 2011). Thus, understanding the vegetation structures
altered due the effects of fire may not be the single attribute that determine the nest selection.
It is important to consider the above aspects along with the other disturbance regimes to fully
understand the nest ecology of this bird. Information generated thus could help to know their
specific nesting requirements and adopt appropriate regulation and monitoring approaches to
protect these habitats. Moreover, the scarcity of nesting sites of WBH and rugged topography
added to the constraints of the study. So, a long term studies is indispensable to know about
the impacts of fire regimes inclusive of fire frequency, season, extent, intensity and severity
on the nest ecology and biology of the WBH. The study could not cover the impact of fire
frequency beyond 10 years, which is also important factor to consider to study the nesting
pattern of the bird.

5
CHAPTER TWO
Literature review
2.1 General Description and status of WBH
White-bellied Heron (Ardea insignis Hume) is the second largest heron in the world. It is
a Critically Endangered heron and has a very small population (BirdLife, 2015). Apart from
the study of a few characteristics, status and distribution, not much information has been
documented on its biology and ecology so far (Hancock and Kushlan, 1984). WBH is found
in the eastern Himalayan foothills in Bhutan, north-east India, north Myanmar and
Bangladesh (RSPN, 2011; BirdLife, 2015). It is usually sighted as a single bird, pairs and
rarely in groups of 4-5. By early 1990s it was not found in some of its former ranges and
thought to be extinct from Nepal, Tibet and northern India, however, the reasons for its
decline remains vague (Mashewaran 2007, as cited in RSPN, 2011). Krishna et al. (2012)
also describes that WBH is a “solitary, wild and wary” bird and prefers habitats such as river
banks with gravel and sand within the subtropical forest and found to breed and roost in Chir
pine forest. RSPN (2011) puts forth that, Phochu, Mochu, Punatshangchu, Sunkoshchu,
Dagachu and its tributaries in the west and Mangdechu, Bertichu and its tributaries in central
region are river systems having a potential habitats of WBH in Bhutan.
2.2 Disturbance and threats to WBH
The population of WBH is declining due to direct exploitation and disturbance
(BirdLife, 2015). The decline is suspected to increase due to habitat degradation and
pervading disturbances, which do not spare even the remote parts of the species range
(Duckworth, 2006 as cited in BirdLife, 2015). In most of the range countries the eminent
disturbances reported are from pollution, over-exploitation of resources and rapid growth of
aquatic vegetation. Disturbances emerge also from settlements, conversion to agriculture
land, harvesting of wetland resources and poaching. In Bhutan, hydroelectric power, road
construction and forest fires are the perceived disturbances to this species in its habitat range
(BirdLife, 2015). RSPN (2011) found it questionable to whether this bird will recover in its
former ranges, since most of the habitat seems densely populated by humans with immense
alteration taking place.

6
2.3 Nesting and breeding behaviour of WBH
WBHs are found in large inland swamp forests and forested rivers and often in sub-
montane grassland. It is apparent to depend on mature forest with large trees that are used for
nesting. Nesting sites are usually associated with wetlands, rivers or lakes. Information
available suggest of nesting taking place around April in Myanmar and July to August in the
Himalayas during the peak monsoon (BirdLife, 2001). Generally the herons are found to nest
on numerous sites, from pristine forest to disturbed forest (Kushlan and Hafner, 2000). RSPN
(2011) discussed that breeding and nesting processes of WBH is complicated. However, they
found the bird engaged in courtship displays from January to February. The nest building
starts in last week of February through March. The young ones are hatched during first week
of May and takes 72 days to fledge.
The first nest of WBH was found at Zawa in Athang Gewog, Wangdiphodrang in 2003.
A total of eleven nests were recorded from 2003 to 2009 along the Punatshangchu basin. The
birds were found to use the nest for three years consecutively before abandoning. In some
instances nests were used only for once and moved to different sites. So, it still remains
vague to understand about the nesting pattern of this bird. The repeated survey efforts
increased the nests from 1 active nest in 2003 to 5 in 2011 all along the Punatshangchu basin
(RSPN, 2011). It is understood that the nesting and breeding are important habitat
components which determine long term sustainability and viability of this species and
therefore forms important basis of study (Dorji, 2012).
2.4 Impacts of forest fires on vegetation structure and composition
Kenny et al. (2004) supports that the habitat suitability of fauna changes over the time as
vegetation and composition structure changes. The fire interval creates a continuum of
vegetation formation corresponded by a wide range of vegetation structures. (Whelan, 1995;
Keane et al., 1990; Kenny, 2003) reported of a severe burning and cumulative impacts of
frequent fires influencing vegetation composition, structure and successional dynamics over
space and time. Frost and Robertson (1987) highlighted that frequent fires decrease
recruitment of the young tree into higher classes. Fire also determines the length of time
plants require to recuperate before the outset of another one. The slower rate to recover will
change the structure and composition of vegetation particular where the fire is found to be
frequent.

7
2.5 Association of bird communities and vegetation in the fire altered habitats
Butchart et al. (2010) found that habitat degradation and fragmentation is a major cause
in population decline in many taxa, including the birds. “Wildfire is an important disturbance
regime that can structure wildlife community and their habitat for many years” (Stephen,
2015). Kenny et al. (2004) supports the above studies as adverse fires may lead to loss of
species from the landscape, and when restricted to a habitat of particular species, it may
result in localized loss.
Brawn et al. (2001) also observed many bird species abundance adapted to disturbance-
mediated habitats declining. However, abundance of some bird abundance were found to be
associated with the vegetation, signaling the forest fires which occurred a year earlier can
reduce plant richness and, in turn denote an improvement in habitat quality for some birds
(Ponce-Calderon, 2013). The study by Silk and Balen (2006) also revealed twice burned
forest had much higher number of birds that prefer open and degraded forest types. Similar
research by Smith (2000) and Marx et al. (2008) found that fire strongly influence structure
and composition of plant communities, which openly alters habitat value of species thriving
in it. Further study by Barlow and Peres (2004) revealed that after the fire incidence, the
open-forest birds‟ increases and closed-forest birds‟ decreases in abundance due to the
increase in abundance of habitat generalist and decrease in habitat specialist. The bird may
increase or decrease depending on the nature of the species, and their population abundance
are found to vary depending upon the fire frequency and regime of the fire. So,
understanding about association between viability of bird population, scale of disturbance
relating to their spatial distribution, nature of disturbance (natural or anthropogenic) and
intensity and frequency of disturbance converts to an important component.
2.6 Fire influence on the vegetation and bird nests in context to WBH
Saab et al. (2007) concluded that retention of post-fire habitat offers suitable nesting
conditions for the bird species. Kotliar et al. (2002) also investigated that fire not only lead to
alteration of landscape patterns and processes but also bird communities. While different
birds prefer different types of nesting but most prefer habitats not burned by fires.
Nevertheless, in the long run birds will respond accordingly to the fire and develop
adaptability. Warren et al. (2005) on the other hand, found the level of nest site selection in
the habitats and distribution pattern of birds contrast owing to the local conditions of
predators, distribution of food, competitor and other conditions. Similar finding by (Block
and Brennan, 1993; Perry et al., 2011) also showed that bird distinguish among habitat types

8
is governed by factors which effects availability of food, risk of predation (to adults or nests),
and availability of nest sites. Accordingly, vegetation structure, floristic composition and
microclimate are the key factors influencing very trait of birds. Vierling and Lentile (2008)
discussed that varying fire intensity plays an influential role in shaping the demographic
pattern of birds nesting in the habitat. Lance et al. (2015) supports the above findings that
nest-site selection is also dependent on vertical nesting cover and patches shaped by forest
fires. Contrarily, Ladrach (2009) investigated the effect of single spring burn on a bird and
revealed that, in general nesting success was not affected but had a substantial impact on nest
site selection.
The study by Vogl (1974) stressed on survival of some large birds and as well small
birds are dependent upon fire in order to maintain the necessary habitat conditions. Olmstead
(2013) found many ecological factors have collective roles in either increasing or decreasing
the nesting success of birds. Hence, it becomes imperative to study these mechanisms in
order to understand the conservation and nesting habitat requirements of a given species.
Brooker and Rowley (1991) described the effects of wild fires on nesting pattern of some
birds at Heathland in Australia. Majority of the birds were attracted to the post-fire habitat for
nesting, but some with different placement in a favoured substrate, some delayed due to the
storage of nesting materials and food for reproduction, while some showed nest failure.
In Bhutan, the nest trees of WBH are seen in the forest with sparse understory and little
to no mid-story vegetation. Nesting habitat selection was mostly preferred in a very open
forest structure with low densities of large trees nearby. The bird mostly built nests on Chir
pine trees unlike in habitat range of other countries where it is found to nest on broad-leaved
trees. Chirpine forests are fire adapted communities with many adaptations to tolerate fires
and the ability of the trees to withstand strong winds in this region by offering a perfect
elasticity than other broad-leaved species (RSPN, 2011). Darabant et al. (2012) further
reiterated that Chir pine trees with characteristics such as thick bark, deep roots, high self‐
pruning, long needles, loose crown and tall growth habit prevent permanent damage by
surface fires of high intensity. Gupta et al. (2009) supports the above conclusions that Chir
tree typically occupy dry sites which are frequented by fire. It has an ability to survive low
intensity occasional fire in the community. WBH are therefore found to particularly select
this species for nesting in this region for its suitable characteristics in this fire prone and
windy area. RSPN (2011) further stressed that nesting areas had a strong evidence of fire
scars on the trees. Fires are found to maintain the structure of Chir pine forest. So confirms
the interaction between the fire frequency and the nesting pattern of WBH, though it was
9
difficult to ascertain the optimum fire frequency for nest selection. RSPN (2011) reported
that out of four nest failure in Bhutan, two cases were caused due to fire incidences; one of
which was at Hararongchu in 2007 which was due to forest fires although the nest tree and
nest was not burned.
2.7 Peoples’ attitudes towards WBH and its nesting
Owusu (2008) surmised about the importance of local communities attached to bird
conservation in the area was completely dependent on people residing in that particular
locality. Also mentions that the two are inseparable from each other as they remain
connected in many different ways and at many different levels. Skagen (2001) also justifies
that numbers of active heron nest and nest success dropped during the study period. Hence,
one of the disturbances was of human activities while other determinants were also attributed
to. Disturbances induced by human are found to have a significant negative impact on
breeding success often causing heightened predation rate and even nest abandonment
(Hockin, 2008).
The nesting sites of WBH are mostly found in remote places (Bertichu, Kisonachu and
Zawa) far from the reach of human activities or in less populated areas (RSPN, 2011). Dorji
(2012) states that this bird has shared habitat with humans since its existence was known.
WBH is found to depend on riverine habitats that are susceptible for alteration by humans
such as development activities and clearing of forest for agriculture practices. It is found to
adjust with human altered landscapes. Dorji (2012) also reasoned that local people who were
aware about the bird lacked social and cultural values to it. However, there was no clue about
the poaching of this bird by the people, and supported for its conservation.
10
CHAPTER THREE
Materials and methods
3.1 Study area
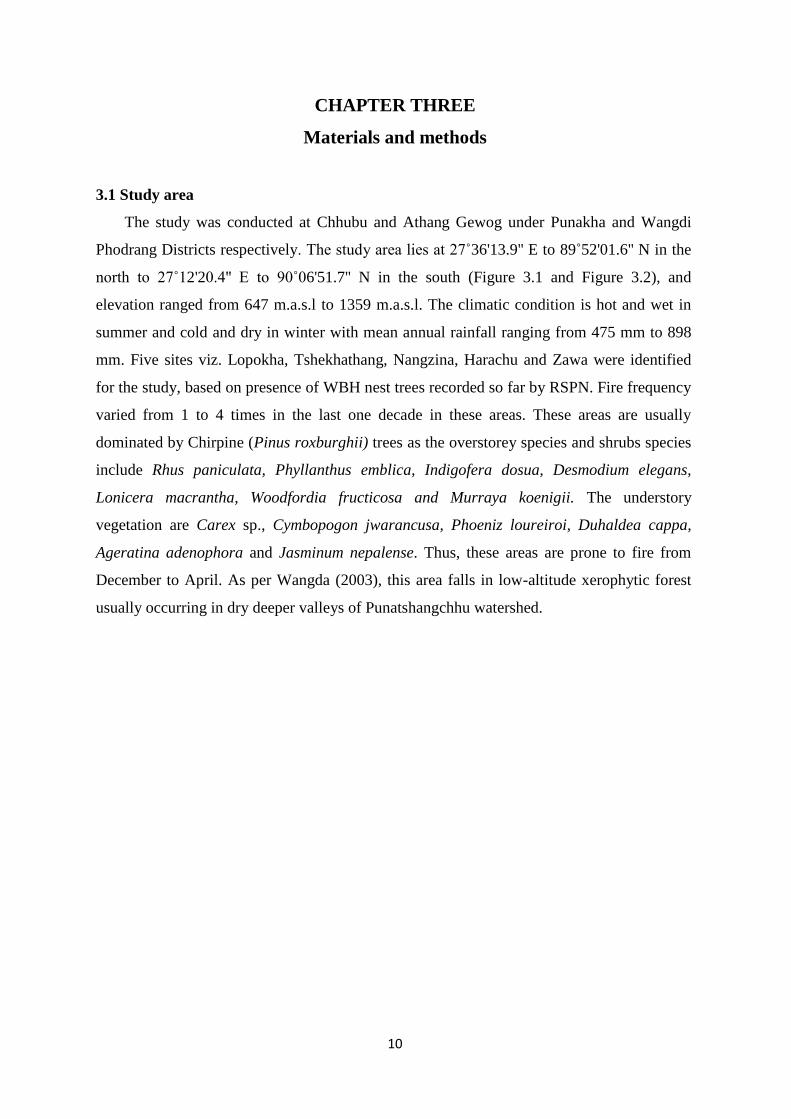
The study was conducted at Chhubu and Athang Gewog under Punakha and Wangdi
Phodrang Districts respectively. The study area lies at 27˚36'13.9'' E to 89˚52'01.6'' N in the
north to 27˚12'20.4'' E to 90˚06'51.7'' N in the south (Figure 3.1 and Figure 3.2), and
elevation ranged from 647 m.a.s.l to 1359 m.a.s.l. The climatic condition is hot and wet in
summer and cold and dry in winter with mean annual rainfall ranging from 475 mm to 898
mm. Five sites viz. Lopokha, Tshekhathang, Nangzina, Harachu and Zawa were identified
for the study, based on presence of WBH nest trees recorded so far by RSPN. Fire frequency
varied from 1 to 4 times in the last one decade in these areas. These areas are usually
dominated by Chirpine (Pinus roxburghii) trees as the overstorey species and shrubs species
include Rhus paniculata, Phyllanthus emblica, Indigofera dosua, Desmodium elegans,
Lonicera macrantha, Woodfordia fructicosa and Murraya koenigii. The understory
vegetation are Carex sp., Cymbopogon jwarancusa, Phoeniz loureiroi, Duhaldea cappa,
Ageratina adenophora and Jasminum nepalense. Thus, these areas are prone to fire from
December to April. As per Wangda (2003), this area falls in low-altitude xerophytic forest
usually occurring in dry deeper valleys of Punatshangchhu watershed.

11
Figure 3.1. Location map of the study area: (A) Bhutan map showing the Dzongkhag map,
(B) Dzongkhag map indicating the Gewog, (C) Gewog map indicating the study sites (D)
Google earth showing study sites
A
B
C
D

12
Figure 3.2. Location map of the study area: (A) Dzongkhag map indicating the Gewog, (B)
Gewog map indicating the study site
3.2 Survey methods and sampling design
3.2.1 Vegetation survey
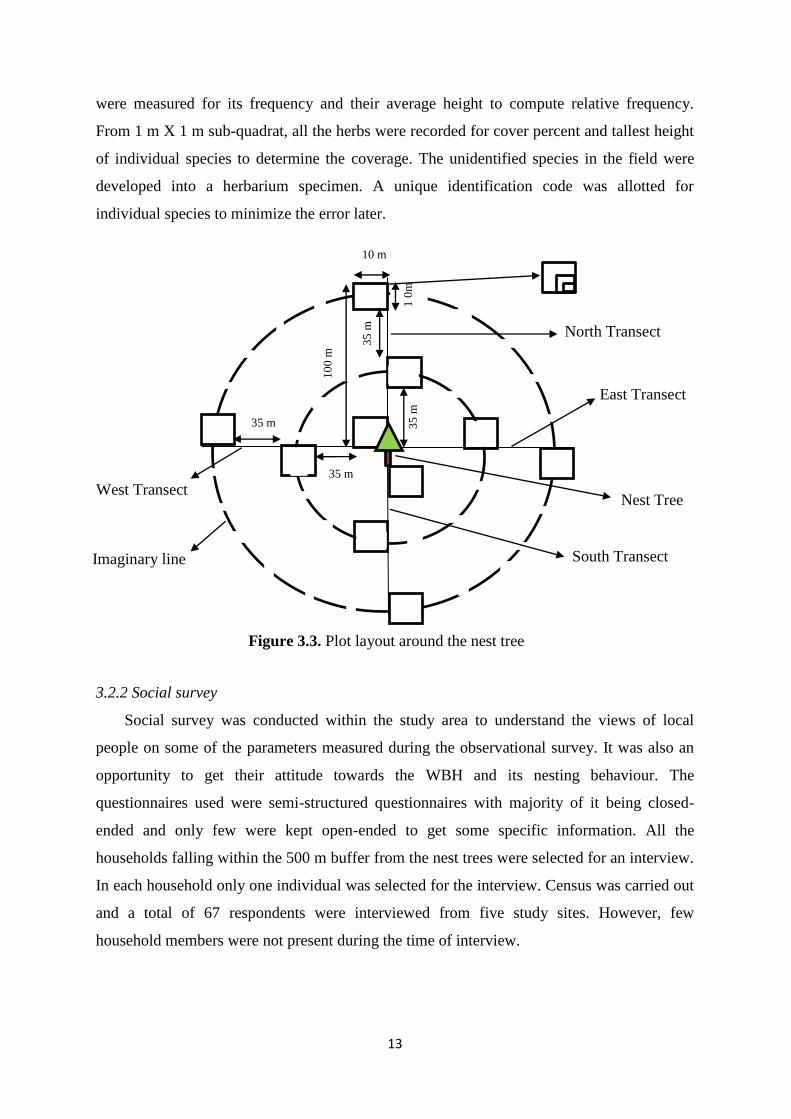
The field works were conducted from June 2016 to November 2016. A modified version
of the Breeding Biology Research and Monitoring Database (BBIRD) protocol for vegetation
measurement was used (Martin et al., 1997). The plots were laid out in targeted nest trees of
WBH with fire history. Four transects of 100 m each were established in four cardinal
directions with the nest tree as a center point. North and south transects were established
perpendicular to the slope and east and west transects were parallel to the slope. A total of 10
quadrats of 10 m X 10 m each were placed around the nest tree. Each quadrant has sub-
quadrants of 5 m X 5 m and 1 m X 1 m. 3 quadrats each were placed alternately along the
north and south running transects, with one quadrat placed at each end of transect and one at
the mid-point separated at an interval of 35 m. Two quadrats, one at the mid-point and other
at the end of transect away from the nest tree were placed alternately at the east and west
aligned transects at interval of 35 m (Figure 3.3). Vegetation measurement was carried out on
three different layers; tree, shrub and ground. All the tree species above 1.3 m in height were
enumerated for height and diameter from 10 m X 10 m quadrat size. Heights of trees were
used to determine the height class distribution and diameter at breast height (DBH) were used
to determine the basal area and DBH distribution class. In 5 m X 5 m, all the shrub species
A B
C
A B
13
were measured for its frequency and their average height to compute relative frequency.
From 1 m X 1 m sub-quadrat, all the herbs were recorded for cover percent and tallest height
of individual species to determine the coverage. The unidentified species in the field were
developed into a herbarium specimen. A unique identification code was allotted for
individual species to minimize the error later.
3.2.2 Social survey
Social survey was conducted within the study area to understand the views of local
people on some of the parameters measured during the observational survey. It was also an
opportunity to get their attitude towards the WBH and its nesting behaviour. The
questionnaires used were semi-structured questionnaires with majority of it being closed-
ended and only few were kept open-ended to get some specific information. All the
households falling within the 500 m buffer from the nest trees were selected for an interview.
In each household only one individual was selected for the interview. Census was carried out
and a total of 67 respondents were interviewed from five study sites. However, few
household members were not present during the time of interview.
10
0 m
35
m
1 0
m
35
m
North Transect
South Transect
East Transect
West Transect Nest Tree
Imaginary line
10 m
35 m
35 m
Figure 3.3. Plot layout around the nest tree

14
3.2.3 Secondary data collection
The data on forest fires were gathered from the Fire Section, Social Forestry Division
(SFD) under Ministry of Agriculture and Forests (MoAF) and Divisional Forest Office of
Punakha and Wangdue Phodrang districts. The WBH nesting and nest use data was obtained
from RSPN office.
3.2.4 Field Equipment
Global Positioning System (GPS), Sunto compass, clinometer, diameter tape,
binocular, survey datasheets and Cannon digital camera were used during the data
collection in the field. The field guide books such as “Flora of Bhutan” and “Know the
plants of Bhutan” were used for plant identification.
3.3 Data analyzing
3.3.1 Vegetation data analyzing
Microsoft Office Excel was used for data compilation and sorting of raw data. Basal area
was calculated from the DBH data of individual tree and Relative Basal Area (RBA%) was
calculated for each species. The RBA of each species was considered as an abundance
measure. Formulae used for computing were;
1. Basal Area (BA) = π d2/4
2. Relative Basal Area [RBA %] = [BA of individual species / Total BA of all the
species] * 100
Frequency of all the shrub species were used to calculate the relative frequency;
3. Relative Frequency (RF %) = [Frequency of individual species / Total Frequency of
all the species] *100
Tallest height (cm) and cover percent of each ground species was used to find cover
volume (m3), from it the relative density (RD %) for each species was calculated as thus;
4. Volume = Maximum Height (cm) X Cover percent (%)
Shannon-wiener formulae was adopted for computation of species diversity (H’) and
richness (S), it is given by;
5. Diversity index (H’)= -∑
Where „pi ‟= Fraction of the entire population made up of species
15
„i’ = number of individuals of ith
species divided by total number of individuals of
all species
„ln’ = natural logarithm and Species Richness (N) = Total number of species.
For the statistical analysis the data were first checked for normality using Kolmogorov-
Smirnov in SPSS. For analyzing the difference among sites in structural parameters of
vegetation, one-way ANOVA and Krushal-Wallis tests were performed depending upon the
nature of data. Spearman rho correlation test was also conducted to find the association of
shrub species height and frequency to different sites. The outcomes of the statistical test in
SPSS was reported by presenting the probability (P value) of being true at a significance
level α = 0.05.
3.3.2 Dominance analysis
For dominance analysis of the tree and shrub species a relative dominance of 100% was
assigned to a species, if that species dominated the community. When two species share the
dominance in that community, then the relative dominance were quantified as 50% for each
species present and for three co-dominants species a relative dominance is 33.3% for
individual species Ohsawa (1984). The dominance was calculated until the dominance
species is generated. The deviation (d) is calculated by the following equation:
∑ jET (x- ̅)
2 ∑jEU x
}
N is total number of species. Where χi is the actual percent share (relative basal area is
adopted) of the top species (T), i.e., in the top dominant in the one-dominant model, or the
two top dominants in the two-dominant model and so on; χ‟ is the ideal percent share based
on the model as mentioned above and χj is the percent share of the remaining species (U).
3.3.3 Nest and fire analysis
The sites were classified into three categories depending upon varying fire frequencies
(number of fires) that has occurred over the last 10 years. Out of five study sites: one site had
been burnt only once, three sites had been burnt two times and one site had suffered four times of
fire (Table 3.1).

16
Table 3.1. Classification of study sites in relation to fire frequency
3.3.4 Survey questionnaire analysis
Questionnaires required for analyzing were assigned with distinct identity number. All
questions and responses were coded accordingly. Data processed were summarized and
compiled. Different graphs were produced to show the results.
Name of location Classes
Fire
Frequency
(no. of times)
Ada Once Burnt
1
Tshekhathang
Nangzina
and Twice Burnt 2
Harachu
Zawa
Frequently Burnt
4

17
CHAPTER FOUR
Results and Discussion
4.1 Nesting site description
Most of the nests of WBH were located on steep slopes or sometimes on other side of
gigantic water bodies in the study areas. Habitats of only two nest trees were surveyed in
Nangzina out of four nests as the remaining nests were located on steep cliffs making it
extremely inaccessible to carry out the survey. Two nests each were surveyed from Harachu
and Zawa and one each from Lopokha and Tshekhathang. Although Tshekhathang in
Punakha district has two nesting sites, but since one site had no records of fire incidence in
last one decade so it was excluded from the study. Nests were located on a gentle rolling
slope of 20% to steep slope of 70% at an altitude ranges from 647 m.a.s.l to 1359 m.a.s.l.
(Table 4.1).
Coordinates
Plot
No
Altitude
(m.a.s.l) Latitude Longitude Slope % Aspect Remarks
Nest 1 1299 27˚17'58.4'' 90˚06'18.1'' 60 S Active
Nest 2 1359 27˚36'13.9'' 89˚52'01.6'' 65 S Abandoned
Nest 3 647 27˚14'03.0'' 90˚05'20.2'' 20 SW Abandoned
Nest 4 663 27˚14'03.6'' 90˚05'19.4'' 25 SW Abandoned
Nest 5 749 27˚12'20.4'' 90˚06'51.7'' 70 NE Active
Nest 6 770 27˚12'36.9'' 90˚07'03.9'' 55 NW Abandoned
Nest 7 997 27˚17'44.8'' 90˚02'52.2'' 25 NE Abandoned
Nest 8 937 27˚17'40.4'' 90˚03'03.0'' 35 SW Abandoned
4.2 Nest presence and active nest in different sites
In the past 10 years, twice burnt site has the maximum record of nest built (66.7%, n = 8)
and active nest (78.6%, n = 11), while once burnt has total nests (16.7 %, n = 2) and active
nests (14.3%, n = 2), and frequently burnt has total nests (16.7 %, n = 2) and active nest (7.1
%, n = 1). Twice burnt sites have approximately four times more of nest built compared to
once and frequently burnt sites, with a marked difference in the number of nest success as
well (Figure 4.1).
Table 4.1. Description of WBH Nest Sites

18
Figure 4.1. Showing total number of nests and active nests in last 10 years of WBH
4.3 Characteristics of the Nest tree of WBH
The mean height of nest trees of WBH were 27.5 m ± 6.8 and mean DBH of 65.4 cm ±
15.5 m. It was found that WBH prefer tall and live mature Chirpine trees as the nest
substrate. Though, only few mature trees (DBH > 80 cm) were found in proximity to the nest
trees. Most of the occasion lower branches were preferred for nesting with 1 to 3 supporting
branches of mean diameter ranging from 4.5 to 11 cm. Nesting limbs were typically chosen
based on limited to no concealment by branches above the nest position. Nest was built at the
height of 15.4 m ± 5 m from the ground and distance of the nest from the main stem was 5.4
m ± 3.5 (Table 4.2). Nests were situated within a distance of 100 m from the edge of the
water source and were solitary in nature.
Table 4.2. Nest tree characteristics
0
10
20
30
40
50
60
70
80
90
Once Burnt Twice Burnt Frequently Burnt
Tota
l N
est
an
d a
ctiv
e n
esti
ng
(%)
Sites
Total Nest
Active Nest
Nest
Tree
Tree
DBH
(cm)
Tree
Height
(m)
Nest
Height
(m)
Distance of
nest from
stem (m)
Number of
supporting
branches
Mean
diameter of
supporting
branches (m)
Total
branches
Branch
position*
Obscurity
by
branches
Nest 1 65 20 15 10 3 5 20 2nd No
Nest 2 48.2 24 12 4.5 3 8.2 18 4th No
Nest 3 47.2 25 8.5 3 3 7.7 15 5th No
Nest 4 74 25 14 2 1 9 12 1st No
Nest 5 53.5 27 17 10 2 6.5 9 5th No
Nest 6 63.8 28 19 1 2 7.5 12 1st No
Nest 7 88.1 28 12.5 5 2 11 17 7th No
Nest 8 83.5 43 25 7.5 2 4.5 37 13th No

19
4.4 Tree Species composition, life forms and dominance
The quantitative study of vegetation recorded a total of 20 families with 23 tree species.
Trees were classified into five major life forms; conifer (1 species), evergreen (10 species),
deciduous (10 species), palm (1 species) and semi-deciduous tree (1 species). Tree vegetation
in the study sites were composed of 64.86 % conifer, 20.19 % evergreen, 10.79 % deciduous,
4.04 % palm and 0.12 % semi-deciduous (Figure 4.2). Overall, dominant analysis showed 2
dominant species (Pinus roxburghii and Quercus lanata) in the single burnt site and only 1
species (Pinus roxburghii) in twice and frequently burnt sites. Evergreen life form in twice
burnt sites was approximately two times more than other sites. Whereas, frequently burnt site
contains the major portion of deciduous life form compared to once and twice bunt sites. It
also shows that tree dominance decreases with increase in fire frequency.
Figure 4.2. Showing the life forms of the tree layer
4.5 Shrub Layer composition, life forms and dominance
Shrub species comprised of 21 species from 15 families. It has four categories of life
forms: deciduous shrub (14 species), evergreen (4 species), climbing shrubs (2 species) and
woody shrubs (1 species). Two dominant species (Indigofera dosua and Phyllanthus
emblica) were recorded from once burnt. Woodfordia fructicosa and Rhus paniculata were
common dominant species in both the twice and frequently burnt sites. Addition to it,
Indigofera dosua was observed dominating twice burnt and Murraya koenigii in the
0 10 20 30 40 50 60 70 80 90 100
Nest 1
Nest 2
Nest 3
Nest 4
Nest 5
Nest 6
Nest 7
Nest 8
Relative Basal Area (%)
Conifer
Evergreen Tree
Deciduous Tree
Palm
Semi-deciduousTree

20
frequently burnt site. Once burnt was only dominated by deciduous species, whereas, twice
and frequently burnt was dominated by both the deciduous and evergreen life forms (Figure
4.3).
Figure 4.3. Showing the life forms of shrub layer
4.6 Ground Cover Composition, Life forms and dominance
Ground layer comprised of 12 families with 26 species. Out of that, 8 species were found
to be grass, 6 species were annual herb, 4 species were perennial herb, 1 species of biennial
herb, 4 fern species and 3 climber species (Figure 4.4). Carex. sp. showed dominance in all
the three sites. Maximum number of ground vegetation dominance was recorded in
frequently burnt site with species such as; Graminae (Cynodon dactylon and Grass sp.),
Compositae (Ageratina adenophora) and Compositae (Artemisia mariantha) including Carex
sp. This result shows the degree of fire frequency favouring the growth of diverse ground
vegetation by making the environment more conducive, but once or twice fire frequency
showed to limit the dominance. This could be that repeated fire ameliorates the environment
for invasion by resistant species. Lyon (2000) supports the study as fire burning infrequently
results in sparse fuel arrangements which lead to invasion by weedy species altering the
vegetation; consequently burning was observed to be more frequent. Annual herbs life form
was found maximum in the twice burnt and maximum of perennial was in the frequently
burnt site. Yogi (1974) also found the fires encouraging the growth of native annuals and
perennial plants. From 26 species, grass life form consisted of 62.03 %, 26.65 % were
0 10 20 30 40 50 60 70 80 90 100
Nest 1
Nest 2
Nest 3
Nest 4
Nest 5
Nest 6
Nest 7
Nest 8
Relative frequency (%)
Deciduous Shrubs
Evergreen Shrubs
Climbing Shrubs
Woody Shrubs

21
perennial herb, 8.04 % were annual herb, 2.05 % of climber, 1.18% fern and 0.05% were
biennial herb.
Figure 4.4. Showing the life forms of ground layer
4.7 Species diversity and richness
Shanon-Wiener diversity index (H‟) varies from 1.06 to 0.62 for trees and 0.86 to 2.05
for shrubs in different sites. Indices in the twice burnt site were higher compared to the single
and frequently burnt sites. Species richness (S = 23) for trees species and (S = 18) for shrub
species was also observed to be more in twice burnt than the other two sites (Table. 4.3).
Yogi (1974) supports with similar findings, where an optimum number of fire times increases
the species diversity. In contrast, Weaver (2010) concluded of species composition are
sometimes also influenced by the environmental factors. However, the Krushal-Wallis test
did not show any significant differences between tree and shrub diversity indices to the sites,
H(2) = 1.37, p > .05 for trees, and H(2) = 2.43, p > .05 for shrubs. This indicates that there
is no effect on nest-site selection by WBH in relation to tree and shrub diversity in the study
sites.
0 10 20 30 40 50 60 70 80 90 100
Nest 1
Nest 2
Nest 3
Nest 4
Nest 5
Nest 6
Nest 7
Nest 8
Relative Volume (%)
Grass
Annual Herbs
PerennialHerbs
BiennialHerbs
Ferns
Climbers

22
Table 4.3. Indices for trees and shrubs species
Location
Tree
Diversity
Index (H')
Tree Species
Richness (S)
Shrub
Diversity
Index (H')
Shrub
Species
Richness (S)
Once Burnt 1.07 6 0.86 4
Twice Burnt 1.61 23 2.14 18
Frequently Burnt 1.06 6 1.7 8
4.8 Forest structural traits of nesting habitat of WBH
4.8.1 Influence of tree Height on nest-site selection
The maximum height of Chir pine tree was 35 m recorded in once burnt site. It was
followed by 30.5 m in the twice burnt site and 20 m in the frequently burnt site. The mean
height of trees in once burnt was 10.37 m ± 2.41, 7.9 m ± 2.3 in twice burnt and 7.6 m ± 3.02
in frequently burnt site. Moreover, the ANOVA test revealed that there were significant
differences in mean tree height among three different sites, F(2, 71) = 5.08, p < .05. RSPN
(2011) describes WBH as a high canopy nesting bird which has a mean nest height of 15.34
m from the ground surface. So, it is apparent that short trees do not fulfill this particular
requirement of the bird. Burhans and Thompson (2006) documented a positive interaction
between nest height and nest survival. The taller trees occurring in once and twice burnt are
the much preferred tree height for nesting by WBH. The result corresponds with the findings
of RSPN (2011) and Dorji (2012), where the bird preferred tall and mature Chir pine trees of
mean height 31.08 m ± 5.91 and 29.9 m ± 9.03 respectively for nesting. However, number of
trees were maximum in the height class of 8 m in the twice burnt and frequently burnt sites,
whereas, once burnt has maximum trees in height class of 12 m (Figure 4.5). Fires
suppressing the height of trees were also recorded by Gandiwa (2011), where trees were
comparatively recorded shorter in height due to the effect of burning.

23
Figure 4.5. Height class distribution in different sites
4.8.2 Influence of tree diameter on nest-site selection
The maximum diameter of Chir pine tree was 79.4 cm noted in once burnt site,
followed by 68.5 cm in twice burnt site and 45.9 cm in frequently burnt site. The mean
DBH of trees were 17.97 cm ± 5.06 in once burnt, 18.01 cm ± 5.1 in twice burnt and 13.85
cm ± 5.34 in frequently burnt site. Krushal-Wallis test showed a statistically significant
difference of mean DBH to different sites, H(2) = 13.63, p < .05. The once and twice burnt
sites were found with larger diameter classes compared to frequently burnt sites that are
preferred by WBH for nesting (Figure 4.6). It was found to be congruent with findings of
RSPN (2011) and Dorji (2012), which showed that WBH preferred large Chir pine trees of
diameter 66.76 cm ± 18.26 and 67.62 cm ± 25.22 respectively as a nest substrate. The
results further substantiate the relationship between twice burnt sites of having Chir pine
trees of specific diameter to maximum number of nests and active nesting of WBH in the
study area. Fire is found to impact the lateral development of trees in the study sites. Kellas
et al. (1987) also observed that diameter increment of tree decreased following more and
severe fires.
0
10
20
30
40
50
60
2 6 10 14 18 22 26 30 34 38
No. of
Tre
es
Once Burnt
2 6 10 14 18 22 26 30 34 38
Twice Burnt
2 6 10 14 18 22 26 30 34 38
Frequently Burnt
Height Class (m)

24
4.8.3 Influence of stem density and basal area on nest-site selection
Density of stems in once burnt site were 740 ha-1
, 441 ha-1
in twice burnt site and 388
ha-1
in frequently burnt site (plot wise stem density is shown in the Figure 4.7). This result
shows that increase in fire frequency causes the stem density to reduce. Similar findings were
recorded by Renwald (1978), that plots showing an average of 33.6 stem ha
-1 were much
preferred for nest-site selection by birds to plot average of 212.1 stem ha
-1. Site used for
maximum nesting was found to be six times less in stem density than least used site. The
outcomes of Michael et al., (2007) also showed a negative impact of high fire frequency on
the occurrence of larger trees, and significantly fewer woody species numbers were recorded
at high fire frequency. Krushal-Wallis test on mean stem density revealed a significant
difference on sites, H(2) = 8.68, p < .05. Similar result yielded in study by Lentile et al.,
(2005), where more number of fire incidences decreased the basal area. Reduction in density
of trees of all sizes leading to decreased total basal area and increased spacing of trees were
observed due to frequent fires. But trees of larger size survived following repeated fires
(Byrne et al., 1991; Lewis, 1993). Purcell and Stephens (2005) studied of some bird species
showing preference for open areas with low tree density, which was apparently due to the
result of frequent and low-intensity fires. RSPN (2011) supports with similar findings where
nest trees were located in a very open forest structure with limited mid-story or understory
vegetation which is perceived to be due to the impact of fires. WBH is found to prefer
0
5
10
15
20
25
30
35
5 15 25 35 45 55 65 75 85
No. of
Tre
es
Once Burnt
5 15 25 35 45 55 65 75 85
Twice Burnt
Diameter Class (cm)
5 15 25 35 45 55 65 75 85
Frequently Burnt
Figure 4.6. Diameter class distribution of trees in different sites

25
reduced stem density but not severe reduction of stems caused due to repeated fires as to
reduce the predation risk. Similar was described by Thogmartin and Schaeffer (2000) of birds
preferring reduced woody stems as that aids in greater sight distance, thereby decreases risk
of predators. WBH is also found to prefer nesting sites with moderately reduced stem
density.
Figure 4.7. Stem density per plot in different sites
4.8.4 Influence of canopy cover on nest-site selection
The canopy cover was classified into four classes viz. < 20%, 20-45%, 45-65% and >
65% and reading was assigned based on visual estimate. The once burnt site showed mean
cover 63.25 % ± 18.63, 45.15 % ± 24.35 in the twice burnt and 59.5 % ± 20.79 in the
frequently burnt site. Least cover percent was observed in the twice burnt site compared to
once and frequently burnt sites. Krushal Wallis test, H (2) = 11.44, p < .05, showed a
significant difference among the sites of the canopy percent. Therefore, result indicates that
bird prefers nest selection with less canopy cover. This result is in line with finding of RSPN
(2011), in which this heron species was found to require very open canopy to fly without
danger of any obstruction. Cerasoli and Penteriani (1996) suggested that tree nesting birds
select trees based on their sizes and structural features such as tall and open canopy to offer
unobstructed access to nest. Results also showed that WBH was found to prefer a canopy
cover less than 20% (Figure 4.8). The cover of woody species was found to be generally
greater in areas less frequently burnt (Waldrop et al., 1992; Peterson, 1998). Although the
N 1 N2 N3 N4 N5 N6 N7 N8
66
37
47
41 46
49
30 33
0
10
20
30
40
50
60
70
Once Burnt Twice Burnt Frequently Burnt
Den
sity
of
stem
/ h
a
Plot Name

26
increase in cover in frequently burnt over twice burnt could be due to other environmental
factors. Wangda et al. (2006) deduced that structural parameter of vegetation are also
influenced by environmental gradients, variations in rainfall, wind, humidity and light.
Figure 4.8. Canopy cover percent in different sites
4.8.5 Effects of shrub height and frequency on nest-site selection
The mean height of shrub was 3.73 m ± 1.82 recorded in once burnt site, 3.81 m ± 2.01
in twice burnt and followed by 4.14 m ± 2.19 in frequently burnt site. Spearman rho
correlation, r (62) = .084, p > .05, showed insignificant association between shrub height
and sites. The result shows that nest-site selection is least impacted by the height of the
shrubs. However, a significant inverse correlation, r (62) = - 0.25, p < .05 was examined
between the sites and the shrub frequency
Table 4.4. Correlation between sites and shrub height and frequency
Site Shrub height Shrub frequency
Site 1 0.084 -.25*
Shrub height 72 1 .550**
Shrub frequency 72 72 1
* Correlation is significant at the 0.05 level (2-tailed)
** Correlation is significant at the 0.01 level (2-tailed)
0%
5%
10%
15%
20%
25%
30%
35%
40%
45%
<20 20-45 45-65 >65
Ca
no
py
Co
ver
in
(%
)
Cover Class in different Sites
Once Burnt
Twice Burnt
FrequentlyBurnt

27
The once burnt revealed the maximum shrub frequency of 44% followed by 31.1% in
twice burnt and 24.9% in frequently burnt site. The increase in shrubs frequency was due to
reduction in fire frequency (Figure 4.9). Anguyi (2010) also concluded that number of shrubs
recorded decreased with fire frequency.
Figure 4.9. Shrub frequency in different sites
4.9 Trend of active nesting by WBH in response to fire incidence
In 2007 there was a forest fire in the locality of Lopokha were nest is located. The nest
was not used the following year after the fire. However, after one year of abandoning, the
nest was reused in 2009. The nest was again abandoned for four years and it was reused in
2015 (Figure 4.10).
Figure 4.10. Trend of active nest in once burnt (Lopokha)
0
10
20
30
40
50
60
70
Once Burnt Twice Burnt Frequently Burnt
Mea
n S
hru
b F
req
uen
cy (
No
)
Sites
2007 2008 2009 2010 2011 2012 2013 2014 2015 2016
Active nest 0 0 1 0 0 0 0 0 1 0
Fire incidence 1 0 0 0 0 0 0 0 0 0
0
1
2
No
. o
f A
ctiv
e N
est
an
d F
ire
Inci
den
ce
Active nest
Fire incidence

28
The nest used in Harachu seems constant in the last one decade even though fire
occurred in 2007 during the nest use season and also in 2013 (Table 4.11). In the finding by
RSPN (2011), however, mentioned that during the fire instance of 2007 at Harachu, the nest
was nearly consumed by fire and was not used in the following years.
Figure 4.11. Trend of active nest in twice burnt (Harachu)
Active nests of 3,2,3,3 and 1 were recorded in 2007, 2009, 2011, 2013 and 2015
respectively at Nangzina. Nangzina has the maximum nest success in the last 10 years. There
was fire for two consecutive years in 2014 and 2015 when the nest-use suddenly dropped to
one (Figure 4.12).
Figure 4.12. Trend of active nest in twice burnt (Nangzina)
2007 2008 2009 2010 2011 2012 2013 2014 2015 2016
Active nest 1 0 0 0 1 0 0 1 1 0
Fire incidence 1 0 0 0 0 0 1 0 0 0
0
1
2
No
. o
f A
ctiv
eNest
an
d
Fir
e In
cid
ence
Active nest
Fire incidence
2007 2008 2009 2010 2011 2012 2013 2014 2015 2016
Active nest 3 0 2 0 3 0 3 0 1 0
Fire incidence 0 0 0 0 0 0 0 1 1 0
0
1
2
3
4
No
. o
f A
ctiv
e N
est
an
d F
ire
Inci
den
ce
Active nest
Fire incidence

29
The nest use in Tshekhathang is same as that of Harachu, as the number of nest use does
not fluctuate much with the fire incidence of 2008 and 2013 in the last one decade (Figure
14.13)
Figure 4.13. Trend of active nest in twice burnt (Tshekhathang)
Different case was observed in Zawa where after the fire occurrence there was no sign of
using the nest again leading to permanently abandonment (Figure 4.14). The study shows the
impacts of fire to the nesting behaviour of WBH in this site.
Figure 4.14. Trend of active nest in frequently burnt (Zawa)
2007 2008 2009 2010 2011 2012 2013 2014 2015 2016
Active nest 0 0 0 0 1 0 0 1 0 0
Fire incidence 0 1 0 0 0 0 1 0 0 0
0
1
2
No
. o
f A
ctiv
e N
est
an
d F
ire
Inci
den
ce
Active nest
Fire incidence
2007 2008 2009 2010 2011 2012 2013 2014 2015 2016
Active nest 1 0 0 0 0 0 0 0 0 0
Fire incidence 1 0 0 0 0 0 1 0 1 0
0
1
2
No
. o
f A
ctiv
e N
est
an
d F
ire
Inci
den
ce
Active nest
Fire incidence

30
Only two cases were encountered in Bhutan where forest fire destroyed heron nests. One
was in 2007 at Basochu, Wangdiphodrang. The location of where heron nest was present
were found to be without fire for more than 10 years and fire was very severe as the fuel
depth was approximately 30 cm high. Forest fires are usually found to be severe due to the
exclusion of fires as it leads to accumulation of the fuel on the forest floor. Higher fuel depth
accelerates the burn severity which causes mortality of the woody vegetation (personal
communication with Madam Rebecca Pradhan, 2016). Great amount of fuel loads could have
catalyzed the burning and have led to destruction of the nest. Lyon (2000) stressed on similar
result of fire occurring at the interval greater than 10 years caused substantial changes in the
forest structure and birds. Lyon (2000) also observed some birds preferring a moderate
frequent understory fires. Since the study sites are known for experiencing fires, the fuel
loads accumulation was noted to be narrow on the ground. There is not an event of nest
damage reported due to forest fires in the study sites. This underscores the necessity of
moderate fire frequency to maintain the vegetation in and around the nesting habitat of the
WBH. Yet overlapping the fire incidence with the breeding and nesting seasons of the bird
may however may be lethal to the birds. Fire may act as a source of abiotic stressor to the
bird leading to abandonment of the nests permanently. However, nest abandonment should
not be entirely attributed to influence of fire as to understand nesting pattern of this bird, the
detail ecology of the bird should be known. During data collection a carcass of WBH was
found on the river bank at an approximate distance of 200 m from the upstream nest tree at
Harachu (Figure 14.15). The reasons for its mortality could not be ascertained due to absence
of damage signs on the bird. On top the corpse was found almost disintegrated.

31
Figure 4.15. Carcass of WBH found at Harachu
4.10 Peoples Attitude towards WBH and its nest
Social survey showed that 83 % of the respondents were aware about the existence of
nest in their vicinity. Out of 67 respondents, 43 were male and 24 were female. Within the
last 10 years, 16 % of the respondent (n =11) felt that population of the heron in their locality
has decreased, 47 % (n = 31) felt the increase in population and 37 % (n = 25) indicated that
population is constant. This is in line with the findings of RSPN (2011), where nest count has
increased over the years. An increase in nests count is found to be relative with increase in
the population of bird over the years.
4.11 Disturbances in the Nesting habitat
Forest fire and predator together exhibited the highest intensity of threat factor in the
nesting habitat of WBH (27%, n =18) followed by forest fire and hydropower (19%, n = 13),
and fishing (13%, n = 9). Overall, the major disturbance in the nesting habitat was found to
be forest fires (Figure 4.16). However, forest fire is not the sole determinant to be considered
as a disturbance. The impacts of hydroelectric dam, predators and fishing activities were the
collective disturbances happening along with forest fires.

32
Figure 4.16. Disturbances in nesting habitat
In the study by Dorji (2012), it reports about fire as one of the factors that has a
significant disturbance to the WBH. RSPN (2011) supports that, forest fires are a direct threat
to heron nest unless an appropriate fire management are applied.
4.12 Causes of fire and local attitude to WBH
The result showed a thin margin about the basis or cause of fire incidences in the nesting
habitats of WBH. Some responded that fire is of natural origin in their area, while others
pointed that fire occurred mostly due to children setting up accidentally (10%, n = 7) or at
times from electric short circuit (7%, n = 5). Major portion of the respondents did not have
idea about it (58%, n = 39). This huge negligence on the part of the people could be due to
the lack of social value attached to the bird (n =34). Still, a positive pointer is, some of the
respondents see the bird as a source of community benefits (n = 15), aesthetic value (n = 7)
and symbol of good omen (n = 5). So, it is yet another challenge to make local people come
forward to work towards the conservation of the bird alongside with RSPN and other relevant
line departments by providing reasonable incentives.
Forest Fire, 4% Hydro-power,
9%
Predator, 10%
Fishing, 13%
Forest fire & Hydro-power,
19%
Forest fire & Predator, 27%
Forest fire & Fishing, 3%
No idea, 13%

33
Figure 4.17. Causes of fires in nesting habitat Figure 4.18. People‟s attitude towards WBH
4.13 Nest Use after fire and Return Interval of WBH
Twelve percent (n = 8) of the respondents had seen the bird reusing the nest after the
fire. While 27% (n = 18) responded that birds do not use and 61% (n = 41) were not aware.
The reuse of nest could possibly be due to the vegetation getting reinstated after fire
occurrence. Similar result was stated by Lyon (2000), birds escape during burning to avoid
from injury, but some are found to return back to take the advantage of the altered habitat.
Marks (1986) deliberated that nesting sites by birds are more probable to be reoccupied in
following years with successful nesting attempts, while it abandoned after nest failures.
Figure 4.20. Post-fire return interval of WBH
0
5
10
15
20
25
30
35
40
Aestheticvalue
Comuunitybenefit
No Belief GoodOmen
No Idea
Nu
mb
er o
f R
esp
on
den
ts
Yes No No Idea
0
5
10
15
20
25
30
35
40
45
50
<1 year 2-3 years 3-5 years No idea
Res
po
nd
ents
(%
)
Years
Figure 4.19. Nest use by WBH after fire
7% 10%
58%
12%
7% 4%
Electric ShortCircuit
Children Playing
Unknown
Electric & NaturalCauses
No idea
Grazing

34
CHAPTER FIVE
Conclusion
On basis of the results of this research, it can be concluded that the vegetation structure and
composition were altered as a result of different fire frequencies in the nesting habitat of
WBH in Athang. The post-fire impacts on structural aspects such as; stem density, tree
height, diameter and canopy covers were found to be the major attributes preferred by the
bird for nest-site selection. It prefers tall and mature Chirpine trees as a nest substrate in an
open forest with less canopy coverage.
As it is a critically endangered bird, fires should be strictly monitored in their nesting
habitats, so as to assure that fire does not disturb its nest and nest-sites. Moderate fire
frequency may not harm the nest and its substrate, however care should be taken to avoid fire
occurrence during the breeding and nesting seasons of the bird. It is very important to protect
mature Chirpine trees along the water bodies in their habitats from frequent fires. Also
creating of fire breaks around the nest tree during nesting season would help to protect the
bird and improve their nesting success.
The bird is also found to abandon the nest even in absence of fire. So, it is found crucial
to have a large scale and long term research on fire regime inclusive of fire frequency,
intensity, severity, season and extent, and other disturbances such as food resources
availability and predators. So as to identify all the underlying mechanisms that influences the
nest-site selection by WBH. This will help in creating more holistic guidelines that can be
prescribed to protect the specific nesting habitat requirements of WBH.

35
Reference
Anguyi, A.G. (2010). Effects of fire frequency on plant species diversity and composition in
Queen Elizabeth National Park, Southwestern Uganda. Dissertation, Makerere
University, Uganda.
Barlow, J. & Peres, C.A. (2004). Ecological responses to el Niño-induced surface fires in
central Brazilian Amazonia: management implications for flammable tropical
forests. Biological Sciences. 359 (1443): 367-380.
BBSAP. (2014). Bhutan Biodiversity Strategic Action Plan. National Biodiversity Centre,
Ministry of Agriculture, Royal Government of Bhutan. Thimphu: Bhutan.
BirdLife International. (2001). Species factsheet: Ardea insignis. <http://www.birdlife.org>.
Accessed 15 November 2015.
BirdLife International. (2015). Threatened birds of Asia: the BirdLife International Red Data
Book. BirdLife International. United Kingdom: Cambridge.
Block, W.M. & Brennan, L.A. (1993). The habitat concept in ornithology: Theory and
applications. Current Ornithology. 11: 35-91.
Brawn, J.D., Robinson, S.K. & Thompson, F.R. (2001).The role of disturbance in the
ecology and conservation of birds. Annul Ecology System. 32: 51-76.
Brooker, M.G. & Rowley, I. (1991). Impact of wildfire on the nesting behaviour of birds in
Heathland. Wildlife Research. 18: 249-263.
Burhans, D.E. & Thompson III, F.R. (2006). Songbird abundance and parasitism differ
between urban and rural shrublands. Ecological Applications. 16: 394-405.
Butchart, S.H., Walpole, M., Collen, B., Van, S.A., Scharlemann, J.P., Almond, R.E. &
Carpenter, K.E. (2010). Global biodiversity: indicators of recent
declines. Science. 328 (5982): 1164-1168.
Byrne, R., Edlund, E. & Mensing, S. (1991). Holocene changes in the distribution and
abundance of oaks in California. Proceedings of the symposium for oak woodlands
and hardwood rangeland management. General Technical Report. 182-188.
Cerasoli, M. & Penteriani, V. (1996). Nest-site and aerial point selection by common
buzzards (Buteo buteo) in Central Italy. Raptor Res. 30: 130-13.
Cody, M.L. (1985). Habitat Selection in Birds. Orlando: Academic Press.
Darabant, A., Rai, P.B. & Dorji. (2012). Fire as a land management tool in Chir Pine forests
with Lemon Grass understory. Department of Livestock, Ministry of Agriculture and
Forests, RNR-RDC, Jakar.

36
Dorji, J. (2012). Protecting White-Bellied Heron habitat: extent of anthropogenic threats
and people’s attitude towards their conservation in Bhutan along Punatshangchu
and Mangdechu basins. Dissertation, Royal University of Bhutan, College of
Natural Resources, Lobesa, Punakha.
Frost, P.G.H. & Robertson, F. (1987). Fire- The ecological effects of fire in savannas. IUBS
MONOGR. SER. ecology.4 (2): 46-6.
Gandiwa, E. (2011). Effects of repeated burning on woody vegetation structure and
composition in a semi-arid southern African savanna. International Journal of
Environmental Sciences. 2 (2): 458- 471.
Gupta, B., Mehta, R. & Mishra, V.K. (2009). Fire ecology of ground vegetation in Pinus
roxburghii sargent plantations in north-west Himalaya - floristic composition and
species diversity. Caspian Journal of Environmental Sciences. 7 (2): 71-78.
Hancock, J. & Kushlan, J.A. (1984). The heron’s handbook. New York: Croom Helm.
Hockin, D., Ounsted, M., Gorman, D.H., Keller, V. & Barker, M.A. (2008). Examination of
the effects of disturbance on birds with reference to its importance in ecological
assessments. Journal of Environmental Management. 36 (4): 253-286.
Keane, R.E., Arno, S.F. & Brown, J.K. (1990). Simulating cumulative fire effects in
ponderosa pine/ Douglas-fir forests. Ecology. 71: 189-203.
Kellas, T.D., Edgar, J.G. & Squire, R.O. (1987). Response of messmate stringy bark
regrowth to release in irregular stands of mixed eucalypts. 50: 253-259.
Kenny, B., Sutherland, E., Tasker, E. & Bradstock, R. (2004). Guidelines for Ecologically
Sustainable Fire Management. Australia: Hurstville press.
Koskimies, P. (1989). Birds as a tool in environmental monitoring. Annual Zoology Fennici.
26: 153-166.
Kotliar, N. B., Hejl, S. J., Hutto, R.L., Saab, V.A., Melcher, C.P. & McFadzen, M.E. (2002).
Effects of fire and post-fire salvage logging on avian communities in conifer-
dominated forests of the western United States. USDA press.
Krishna, C.M., Ray, P.C., Sarma, K. & Kumar, A. (2012). Conservation of White-bellied
Heron Ardea insignis (Hume, 1878) habitat in Namdapha National Park, Arunachal
Pradesh, India. Correspondence Current Science. 102 (8).
Kushlan, J.A. & Hafner, H. (2000). Heron Conservation. London: U.K. Academic Press.
Ladrach, W. (2009). The effects of fire in agriculture and forest ecosystems. ISTF News.
USA: Grosvenor Lane Bethesda.

37
Lance, B. M., Winder, V. L., Pitman, J. C. & Sandercock, B. K. (2015). Alternative
rangeland management strategies and the nesting ecology of greater prairie-
chickens. Rangeland Ecology & Management. 68: 298-304.
Lewis, H.T. (1993). Patterns of Indian burning in California: ecology and ethno-history. In
Before the wilderness: environmental management by native Californians. eds. T. C.
Blackburn & K. Anderson, pp. 55-116. Menlo Park: Ballena Press.
Lyon, L.J., Huff, M.H., Hooper, R.G., Telfer, E.S., Schreiner, D.S. & Smith, J.K.
(2000). Wildland fire in ecosystems: effects of fire on fauna. USDA Forest Service:
JFSP.
Marks, J.S. (1986). Nest-site characteristics and reproductive success of long-eared owls in
southwestern Idaho. Wilson Bull. 98: 547-560.
Martin, T.E., Paine, C., Conway, C.J., Hochachka W.M., Allen, P. & Jenkins, W. (1997).
The Breeding Biology Research and Monitoring Database (BBIRD) - Field
Protocol. Missoula: Montana.
Marx, D.E., Hejl, S.J. & Hering, J. (2008). Wintering grassland bird habitat selection
following summer prescribed fire in a Texaz Gulf coast tall grass pairie. Fire
ecology. 4 (2): 46-62.
Michael, H., Jan, S., Budzanani, T. & Michael, M.H. (2007). The relevance of fire
frequency for the floodplain vegetation of the Okavango Delta, Botswana. African
Journal of Ecology. 46: 350-358.
Nath, L. & Shamlai. (n.d). New Horizon rescues the Critically Endangered avian species
White bellied Heron (Ardea insignis) from Koilamoila. New Horizon. 24 (2).
Ohsawa, M. (1984). Differentiation of vegetation zones and species strategies in the
subalpine region of Mt. Fuji. Vegetatio. 57: 15-52.
Olmstead, M. (2014). Nesting Ecology of White-throated Sparrows (Zonotrichia albicollis):
The Effects of Variation in Clutch-initiation Date and the Application of Prescribed
Fire on Nesting Success. Ecological journal. 22 (1).
Owusu, E. H. (2008). The perceptions of local communities towards the conservation of
birds in an important bird area in Ghana. West African Journal of Applied Ecology.
13 (1): 111-116.
Perry, J.J., Kutt, A.S., Garnett S.T., Crowley G.M., Vanderduys, E.P. & Perkins. (2011). The
relative effects of fire, vegetation type and climate. The Emu. (111): 120–131.
Peterson, D.W. (1998). Fire effects on oak savanna and wood- land vegetation in Minnesota.
Dissertation. University of Minnesota. USA: Saint Paul.

38
Ponce-Calderon, L.P, Rodriguez-Trejo, D.A., Aguilar-Valdez, B.C. & Lopez-Perezysis, E.
(2013). Forest fire impact on bird habitat in a mixed oak-pine forest in Puebla,
Mexico. Albany: USDA Forest Service.
Purcell, K.L. & Stephens, S.L. (2005). Natural and anthropogenic fire regimes, vegetation
effects, and potential impacts on the avifauna of California oak woodlands. USDA
Forest Service General Technical Report. 191.
Renwald, J.D. (1978). The effects of fire on woody plant selection by nesting nongame
birds. Journal of rangeland management. 27 (8): 468.
Royal Society for Protection of Nature. (2011). The critically endangered White-bellied
Heron. Thimphu, Bhutan.
Royal Society Protection of Nature. (2015). <http://www.rspnbhutan.org>. Accessed on 20
February 2016.
Saab, V.A, Kotliar, N.B. & William, M. (2005). Relationships of fire ecology and avian
communities in North America. USDA Forest Service General Technical Report.
191.
Saab, V.A. & Vierling, K.T. (2001). Reproductive success of Lewis's Woodpecker in burned
pine and cottonwood riparian forests. The Condor.103: 491–501.
Saab, V.A., William, B., Robin, R., John, L., Lisa, B. & Rachel, W. (2007). Birds and burns
of the interior west: descriptions, habitats, and management in western forests.
General Technical Report. 712 (23).
Silk, J.W.F. & Balen, S.V. (2006). Bird community changes in response to single and
repeated Fires. Alcoy press.
Skagen, S.K., Melcher, C.P. & Muths, E. (2001). The interplay of habitat change, human
disturbance and species interactions in a waterbird colony. The American Midland
Naturalist. 145 (1): 18-28.
Stephens, J.L. (2015). Fire severity affects mixed broadleaf-conifer forest bird. The Condor.
27: 430-446.
Thogmartin, W.E. & Schaeffer, B.A. (2000). Landscape attributes associated with mortality
events of wild turkeys in Arkansas. Wildlife Society Bulletin. 28 (4): 865-874.
Vierling, K., & Lentile, L. (2008). Indirect effects of fire severity on avian communities in
ponderosa pine and aspen forests in western North America: A review. Fire Ecology
Special Issue. 4: 133-149.
Vogl, R.J. (1974). Effects of fire on grasslands. In Fire and ecosystem, eds. T.T. Kozlowski
& C.E. Ahlgren, 1st edn., pp.139- 194. New York: Academic Press.

39
Waldrop, T.A., White, D.L. & Jones, S.M. (1992). Fire regimes for pine-grassland
communities in the southeastern United States. Ecology Management. 47: 195-210.
Wangda, P. (2003). Forest zonation along the complex altitudinal gradients in a dry valley
of Punatsangchu, Bhutan. Masters, The University of Tokyo, Japan.
Wangdi, T. (2014). Landuse change effect on habitat and White-bellied Heron population by
hydropower project along Punatshangchhu. Dissertation, Royal University of
Bhutan, College of Natural. Lobesa, Punakha.
Warren, K.A. & Anderson, J.T. (2005). Grassland songbird nest-site selection and response
to mowing in West Virginia. Wildlife Society Bulletin. 33 (1): 285-292.
Watts, B.D. (1989). Nest-Site Characteristics of Yellow-Crowned Night-Herons in
Virginia. The Condor. 91 (4): 979–983.
Whelan, R.J. (1995). The ecology of fire. United Kingdom: Cambridge University of Press.
Woinarski, J. C. Z. & Recher, H. F. (1997). Impact and response: a review of the effects of
fire on the Australian avifauna. Pacific Conservation Biology. 3 (3): 183-205.
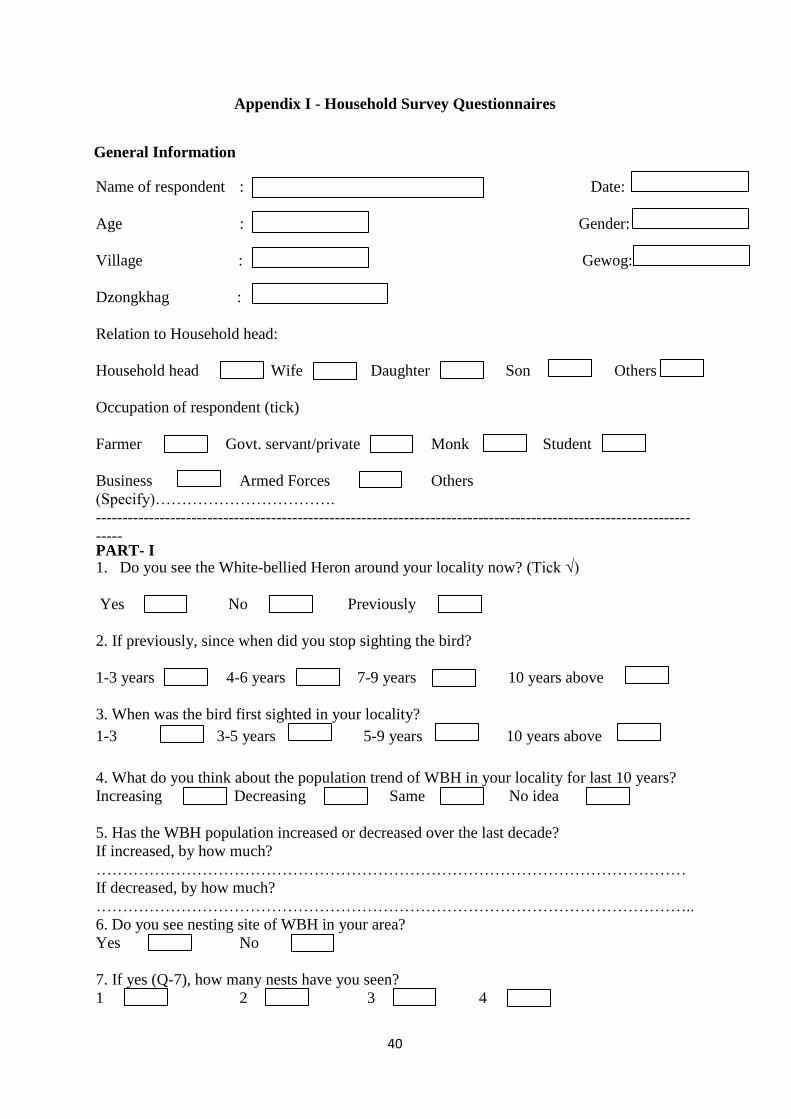
40
Appendix I - Household Survey Questionnaires
General Information
Name of respondent : Date:
Age : Gender:
Village : Gewog:
Dzongkhag :
Relation to Household head:
Household head Wife Daughter Son Others
Occupation of respondent (tick)
Farmer Govt. servant/private Monk Student
Business Armed Forces Others
(Specify)…………………………….
----------------------------------------------------------------------------------------------------------------
----- PART- I 1. Do you see the White-bellied Heron around your locality now? (Tick √)
Yes No Previously
2. If previously, since when did you stop sighting the bird?
1-3 years 4-6 years 7-9 years 10 years above
3. When was the bird first sighted in your locality?
1-3 3-5 years 5-9 years 10 years above
4. What do you think about the population trend of WBH in your locality for last 10 years?
Increasing Decreasing Same No idea
5. Has the WBH population increased or decreased over the last decade?
If increased, by how much?
…………………………………………………………………………………………………
If decreased, by how much?
…………………………………………………………………………………………………..
6. Do you see nesting site of WBH in your area?
Yes No
7. If yes (Q-7), how many nests have you seen?
1 2 3 4

41
8. In which year was the nest first seen?
………………………………………………………………………………………………….
9. Is the nest still used or abandoned?
Active Abandoned
10. If abandoned, in which year was it abandoned?
…………………………………………………………………………………………..............
11. Do you know that WBH is a Critically Endangered bird in the world?
Yes No
PART- II
1. What are the disturbances or threats in the habitat of WBH in your locality?
Forest fire Hydro-power Predator Fishing
Others (specify)……………………………..
Proceed to next question only if the disturbance or threat is FOREST FIRE
2. How often do the fires occur in their habitat?
Once in every 5years Twice in every 5 years Once in 10 years
Other (Specify) ………………………..
3. What are the causes of fire?
Burning Agriculture debris Electric short circuit Children playing
Construction worker Others (Specify)……………………………………
PART- III 1. What was the population status of WBH after fire incident?
Increasing Decreasing Same No idea
2. Does WBH abandon their nesting habitat following the fire occurrence?
Yes No No Idea
3. If yes (Q-2), where do they move to after fire in their habitat?
…...……………………………………………………………………………………………
4. Do you see any WBH returning back to previous nesting habitat area after the fire
disturbed area is reinstated with vegetation ?
Yes No No Idea
5. If yes (Q-4), how many years do they take to return back to their nesting habitat?
1-2 years 3-5 years 5 years above
Thank You

42
Plot No.:
Quadrat No.: Transect no. :
Coordinates :- Northing : . Location :
Easting : Altitude :
Slope % : Aspect :
Forest Type :
Trees
Sl.
No. Species Name
Height
(m)
DBH
(cm) % cover Remarks
Appendix II - Tree Data format

43
Appendix III - Shrub data format
Plot No:
Quadrat No.:
Coordinates :-Northing : Location :
Easting : Altitude :
Slope % : Aspect :
Forest Type :
Shrubs
Sl. No. Species
Name
Height
(m) Frequency (Nos.) Remarks

44
Appendix IV - Ground data format
Plot
No:
Quadrat No.:
Coordinates :-Northing :
Location :
Easting :
Altitude :
Slope % :
Aspect :
Forest Type :
Sl. No. Species Name
Height
(m)
%
cover
Frequency
(Nos.) Remarks

45
Appendix V - Nest Data format
Date:
Location: GPS : Way point Name:
Nest No / Plot No.: Latitude:
Wheather Condition: Longitude:
Slope %: Aspect:
Elevation:
Yes NO L MA MA D
N=
S =
E=
W=
Uniform
=
CR=
Note: * L=Live, MA=Mostly Alive, MD=Mostly Dead, D=Dead
Nest Information
Distance
of nest
Distance of nest to
the foilage edge
No. of
supportin
Diamter
of
Obscure
d by Orientation
Distance between the Nest
Trees (m)
Temperature :
Tree Information
Nest
Tree
Nesting
Height of
DBH
(cm)
Canopy
Inclinatio
Top broken Total
Branches
Branch
Position
Health*

46
Appendix VI - Tree vegetation composition
(The shaded portion of the relative basal area represents the dominant & co-dominant
species)
Species Name Family Acronym Lifeform N1 N2 N3 N4 N5 N6 N7 N8
Once Burnt
Relative Basal Area (% ) RBA RBA RBA RBA RBA RBA RBA RBA
Conifer
Pinus roxburghii Pinaceae CT Conifer 64.69 70.84 75.23 76.27 35.11 65.65 83.83 47.22
Sub-Total 64.69 70.84 75.23 76.27 35.11 65.65 83.83 47.22
Evergreen Tree
Quercus lanata Fagaceae ET Evergreen Tree 15.01 20.60 1.78 1.68
Schima wallichi Theaceae ET Evergreen Tree 13.87
Aesandra butyracea Sapotaceae ET Evergreen Tree 2.08 4.30
Quercus glauca Fagaceae ET Evergreen Tree 1.93 4.73 1.66 3.69
Mallotus philippensis Euphorbiaceae ET Evergreen Tree 1.87
Celtis tetendra Cannabaceae ET Evergreen Tree 0.97
Wrightia coccinea Apocynaceae ET Evergreen Tree 4.02 14.43 8.58
Pterospermum acerifolium Sterculiaceae ET Evergreen Tree 17.98
Daubanga grandiflora Lythraceae ET Evergreen Tree 9.76
Boehmeria rugulosa Urticaceae ET Evergreen Tree 7.26 7.50
Sub-Total 28.89 24.61 13.66 7.36 49.43 16.08 3.69
Deciduous Tree
Lyonia ovalifolia Ericaceae DT Deciduous Tree 1.77 1.23
Bridelia retusa Phyllanthaceae DT Deciduous Tree 0.34 0.18 5.63 0.58 0.21 5.83 26.49
Quercus griffithii Fagaceae DT Deciduous Tree 3.31 6.65 7.73
Casearia graveolens Salicaceae DT Deciduous Tree 0.56 0.54
Albizia lebbeck Fabaceae DT Deciduous Tree 0.07 0.03
Terminalia chebula Combretaceae DT Deciduous Tree 2.01 17.79
Grewia eriocarpa Tiliaceae DT Deciduous Tree 8.95 8.15
Engelhardia spicata Juglandaceae DT Deciduous Tree 3.37
Bombax ceiba Malvaceae DT Deciduous Tree 1.66
Sterculia villosa Malvaceae DT Deciduous Tree 0.90 0.16
Sub-Total 2.10 4.55 0.81 8.21 15.45 8.52 12.48 52.02
Palm
Phoenix loureiroi Arecaceae P Palm 4.32 9.38 8.15 9.75 0.77
Sub-Total 4.32 9.38 8.15 9.75 0.77
Semi-deciduous Tree
Heynea trijuga Meliaceae SDT Semi-deciduous Tree 0.92
Sub-Total 0.92
Grand Total 100 100 100 100 100 100 100 100
Twice Burnt Frequently Burnt

47
Appendix VII - Shrub vegetation composition
(The shaded portion of the relative basal area represents the dominant & co-dominant
species)
Species Name Family Acronym Lifeform Nest 1 Nest 2 Nest 3 Nest 4 Nest 5 Nest 6 Nest 7 Nest 8
Once Burnt
Relative Frequency (% ) RF RF RF RF RF RF RF RF
Deciduous Shrub
Indigofera dosua Leguminosae DS Deciduous Shrub 68.97 48.48 25.00 36.00 14.29 28.99 8.82
Phyllanthus emblica Phyllanthaceae DS Deciduous Shrub 20.69 18.18 7.50 4.00 7.14 8.82 9.09
Rhus paniculata Anacardiaceae DS Deciduous Shrub 8.62 4.55 2.50 36.00 32.14 23.19 23.53 31.82
Rhus chinensis Anacardiaceae DS Deciduous Shrub 10.61 17.86
Desmodium elegans Leguminosae DS Deciduous Shrub 6.06 7.50 4.55
Desmodium sp. Leguminosae DS Deciduous Shrub 1.52
Lonicera macrantha Caprifoliaceae DS Deciduous Shrub 22.50
Holarrhena pubescens Apocynaceae DS Deciduous Shrub 7.50
Cryopteris bicolor Lamiaceae DS Deciduous Shrub 5.00
Wendlandia pendula Rubiaceae DS Deciduous Shrub 5.00
Desmodium confertum Leguminosae DS Deciduous Shrub 10.14 8.82
Indegofera heterantha Fabaceae DS Deciduous Shrub 2.94
Murraya koenigii Rutaceae DS Deciduous Shrub 3.57 38.64
Indigofera heterantha Fabaceae DS Deciduous Shrub 4.55
Sub-total 98.28 89.39 82.50 76.00 75.00 62.32 52.94 88.64
Evergreen Shrub
Ficus sp. Moraceae ES Evergreen Shrub 1.72
Berberis asiatica Berberideceae ES Evergreen Shrub 10.61
Woodfordia fructicosa Lythraceae ES Evergreen Shrub 5.00 21.43 37.68 47.06 11.36
Eriolena spectibilis Malvaceae ES Evergreen Shrub 2.50
Sub-total 1.72 10.61 7.50 21.43 37.68 47.06 11.36
Climbing Shrub
Capparis olacifolia Capparaceae CS Climbing Shrub 7.50 24.00
Butea parviflora Fabaceae CS Climbing Shrub 3.57
Sub-total 7.50 24.00 3.57
Woody Shrub
Tetrastigma leucostaphylum Vitaceae WS Woody Climber 2.50
Sub-total 2.50
Grand Total 100 100 100 100 100 100 100 100
Twice Burnt Frequently Burnt

48
Appendix VIII - Ground vegetation composition
(The shaded portion of the relative basal area represents the dominant & co-dominant
species)
Species Name Family Name Acronym Lifeform Nest 1 Nest 2 Nest 3 Nest 4 Nest 5 Nest 6 Nest 7 Nest 8
Once Burnt
Relative Dominance (% ) RD RD RD RD RD RD RD RD
Grass
Carex sp. Cyperaceae Gr Grass 71.73 67.06 54.82 69.15 78.05 21.86 4.75
Eragrostic uniloides Gramineae Gr Grass 0.16
Grass sp.1 Gramineae Gr Grass 27.88 8.03 6.22 23.56 11.96
Cymbopogon flexuosus Gramineae Gr Grass 2.18
Grass sp.2 Gramineae Gr Grass 0.11
Cymbopogon jwarancus Gramineae Gr Grass 13.68 17.60
Cynodon dactylon Gramineae Gr Grass 0.81 3.45 9.42
Cymbopogon sp. Gramineae Gr Grass 3.77
Sub-total 71.89 30.17 81.55 76.19 77.18 87.72 54.85 16.71
Annual Herb
Duhaldea cappa Asteraceae AH Annual Herb 10.26 36.38 4.03 7.62 4.44
Bidens pilosa Compositae AH Annual Herb 0.65
Oxalis corniculata Oxalidaceae AH Annual Herb 0.23
Anisomeles sp. Labiatae AH Annual Herb 0.41
Spergula arvensis Caryophyllaceae AH Annual Herb 0.14
Spermadictyon suaveolens Rubiaceae AH Annual Herb 0.17
Sub-total 10.26 37.26 4.03 7.62 0.17 0.54
Perennial Herbs
Ageratina adenophora Compositae PH Perennial Herb 9.03 21.59 3.87 10.66 22.65 6.63 28.35 72.21
Chromolaena odorata Asteraceae PH Perennial Herb 0.66 3.27 2.49 5.53
Artemesia mariantha Compositae PH Perennial Herb 14.92 11.08
Isodon ternifolius Labiatae PH Perennial Herb 0.24
Sub-total 9.70 24.85 6.35 16.19 22.65 6.87 43.27 83.29
Biennial Herb
Gnaphalum affine Asteraceae BH Biennial Herb 0.43
Sub-total 0.43
Climber
Jasminum nepalense Oleaceae C Climber 3.03 2.94
Climatis sp. Ranunculaceae C Climber 0.97
Argyreia venusata Convolvulaceae C Climber 7.56 1.88
Sub-total 3.03 3.91 7.56 1.88
Fern
Fern sp.1 Fr Fern 2.66 2.61
Nephrolepis cordifolia Lomariopsidaceae Fr Fern 2.26 0.50
Pteredium sp. Fr Fern 0.21 0.65
Fern sp.2 Fr Fern 0.54
Sub-total 5.13 3.81 0.50
Grand Total 100 100 100 100 100 100 100 100
Frequently BurntTwice Burnt

49
Appendix IX - Field photographs
Nest at once burnt (Athang) Nest tree at twice burnt (Zawa)
Fire evidence on a nest tree in twice burnt site
Nest tree data in once burnt site
Fire evidence on a nest tree in frequently burnt site
Data collection in twice burnt site
Nest at frequently burnt site


![Chapter 3 Mr. Buttell WBHS. New York Settling the Middle [or “Restoration”] Colonies](https://img.pdfslide.us/doc/110x75/56649e545503460f94b4b359/chapter-3-mr-buttell-wbhs-new-york-settling-the-middle-or-restoration.jpg)