Embed Size (px)
Citation preview

Goldman Sachs Group UK Limited
Pillar 3
Disclosures
For the year ended December 31, 2016

GOLDMAN SACHS GROUP UK LIMITED
Pillar 3 Disclosures
December 2016 | Pillar 3 Disclosures 1
TABLE OF CONTENTS
Page No.
Introduction ....................................................................................................................................................................... 3 Capital Framework ............................................................................................................................................................ 6 Regulatory Capital ............................................................................................................................................................ 7 Risk Management ............................................................................................................................................................. 8 Risk-Weighted Assets ..................................................................................................................................................... 10 Credit Risk ...................................................................................................................................................................... 10 Equity Exposures in the Banking Book ........................................................................................................................... 17 Securitisations ................................................................................................................................................................ 18 Market Risk ..................................................................................................................................................................... 20 Operational Risk ............................................................................................................................................................. 24 Model Risk Management ................................................................................................................................................ 26 Interest Rate Sensitivity .................................................................................................................................................. 27 Asset Encumbrance ........................................................................................................................................................ 27 Leverage Ratio ............................................................................................................................................................... 29 Capital Adequacy ............................................................................................................................................................ 31 Own Funds Transitional Template .................................................................................................................................. 32 Countercyclical Capital Buffer Template ........................................................................................................................ 33 Capital Instruments ......................................................................................................................................................... 33 Governance Arrangements ............................................................................................................................................ 36 Cautionary Note on Forward-Looking Statements ......................................................................................................... 37 Glossary .......................................................................................................................................................................... 38 UK Remuneration Disclosures ....................................................................................................................................... 40
GOLDMAN SACHS GROUP UK LIMITED
Pillar 3 Disclosures
December 2016 | Pillar 3 Disclosures 2
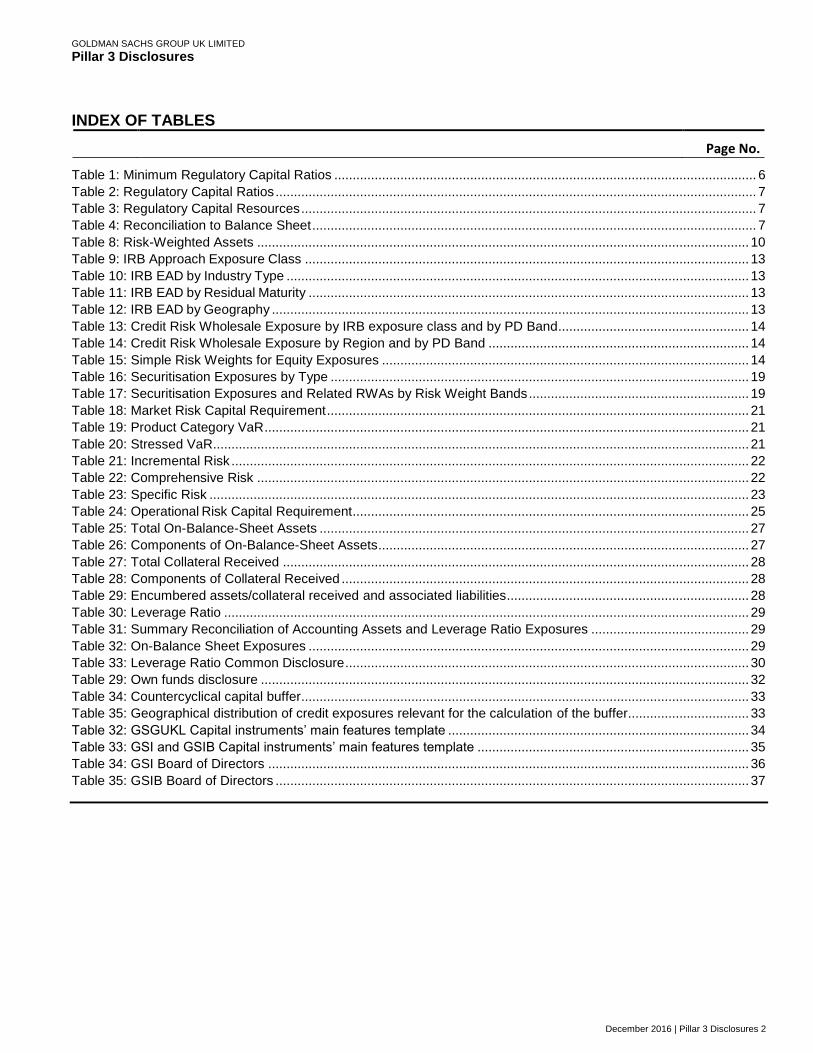
INDEX OF TABLES
Page No.
Table 1: Minimum Regulatory Capital Ratios ................................................................................................................... 6 Table 2: Regulatory Capital Ratios ................................................................................................................................... 7 Table 3: Regulatory Capital Resources ............................................................................................................................ 7 Table 4: Reconciliation to Balance Sheet ......................................................................................................................... 7 Table 8: Risk-Weighted Assets ...................................................................................................................................... 10 Table 9: IRB Approach Exposure Class ......................................................................................................................... 13 Table 10: IRB EAD by Industry Type .............................................................................................................................. 13 Table 11: IRB EAD by Residual Maturity ........................................................................................................................ 13 Table 12: IRB EAD by Geography .................................................................................................................................. 13 Table 13: Credit Risk Wholesale Exposure by IRB exposure class and by PD Band.................................................... 14 Table 14: Credit Risk Wholesale Exposure by Region and by PD Band ....................................................................... 14 Table 15: Simple Risk Weights for Equity Exposures .................................................................................................... 14 Table 16: Securitisation Exposures by Type .................................................................................................................. 19 Table 17: Securitisation Exposures and Related RWAs by Risk Weight Bands ............................................................ 19 Table 18: Market Risk Capital Requirement ................................................................................................................... 21 Table 19: Product Category VaR .................................................................................................................................... 21 Table 20: Stressed VaR.................................................................................................................................................. 21 Table 21: Incremental Risk ............................................................................................................................................. 22 Table 22: Comprehensive Risk ...................................................................................................................................... 22 Table 23: Specific Risk ................................................................................................................................................... 23 Table 24: Operational Risk Capital Requirement ............................................................................................................ 25 Table 25: Total On-Balance-Sheet Assets ..................................................................................................................... 27 Table 26: Components of On-Balance-Sheet Assets ..................................................................................................... 27 Table 27: Total Collateral Received ............................................................................................................................... 28 Table 28: Components of Collateral Received ............................................................................................................... 28 Table 29: Encumbered assets/collateral received and associated liabilities .................................................................. 28 Table 30: Leverage Ratio ............................................................................................................................................... 29 Table 31: Summary Reconciliation of Accounting Assets and Leverage Ratio Exposures ........................................... 29 Table 32: On-Balance Sheet Exposures ........................................................................................................................ 29 Table 33: Leverage Ratio Common Disclosure .............................................................................................................. 30 Table 29: Own funds disclosure ..................................................................................................................................... 32 Table 34: Countercyclical capital buffer .......................................................................................................................... 33 Table 35: Geographical distribution of credit exposures relevant for the calculation of the buffer................................. 33 Table 32: GSGUKL Capital instruments’ main features template .................................................................................. 34 Table 33: GSI and GSIB Capital instruments’ main features template .......................................................................... 35 Table 34: GSI Board of Directors ................................................................................................................................... 36 Table 35: GSIB Board of Directors ................................................................................................................................. 37
GOLDMAN SACHS GROUP UK LIMITED
Pillar 3 Disclosures
December 2016 | Pillar 3 Disclosures 3
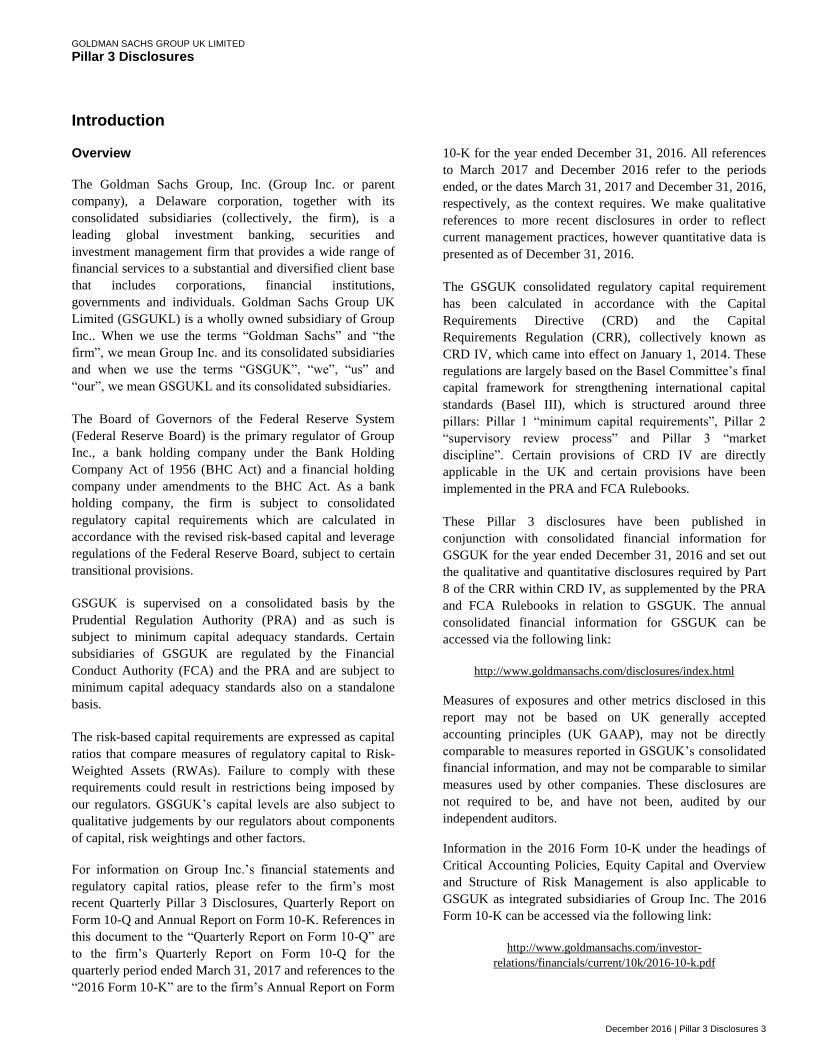
Introduction
Overview
The Goldman Sachs Group, Inc. (Group Inc. or parent
company), a Delaware corporation, together with its
consolidated subsidiaries (collectively, the firm), is a
leading global investment banking, securities and
investment management firm that provides a wide range of
financial services to a substantial and diversified client base
that includes corporations, financial institutions,
governments and individuals. Goldman Sachs Group UK
Limited (GSGUKL) is a wholly owned subsidiary of Group
Inc.. When we use the terms “Goldman Sachs” and “the
firm”, we mean Group Inc. and its consolidated subsidiaries
and when we use the terms “GSGUK”, “we”, “us” and
“our”, we mean GSGUKL and its consolidated subsidiaries.
The Board of Governors of the Federal Reserve System
(Federal Reserve Board) is the primary regulator of Group
Inc., a bank holding company under the Bank Holding
Company Act of 1956 (BHC Act) and a financial holding
company under amendments to the BHC Act. As a bank
holding company, the firm is subject to consolidated
regulatory capital requirements which are calculated in
accordance with the revised risk-based capital and leverage
regulations of the Federal Reserve Board, subject to certain
transitional provisions.
GSGUK is supervised on a consolidated basis by the
Prudential Regulation Authority (PRA) and as such is
subject to minimum capital adequacy standards. Certain
subsidiaries of GSGUK are regulated by the Financial
Conduct Authority (FCA) and the PRA and are subject to
minimum capital adequacy standards also on a standalone
basis.
The risk-based capital requirements are expressed as capital
ratios that compare measures of regulatory capital to Risk-
Weighted Assets (RWAs). Failure to comply with these
requirements could result in restrictions being imposed by
our regulators. GSGUK’s capital levels are also subject to
qualitative judgements by our regulators about components
of capital, risk weightings and other factors.
For information on Group Inc.’s financial statements and
regulatory capital ratios, please refer to the firm’s most
recent Quarterly Pillar 3 Disclosures, Quarterly Report on
Form 10-Q and Annual Report on Form 10-K. References in
this document to the “Quarterly Report on Form 10-Q” are
to the firm’s Quarterly Report on Form 10-Q for the
quarterly period ended March 31, 2017 and references to the
“2016 Form 10-K” are to the firm’s Annual Report on Form
10-K for the year ended December 31, 2016. All references
to March 2017 and December 2016 refer to the periods
ended, or the dates March 31, 2017 and December 31, 2016,
respectively, as the context requires. We make qualitative
references to more recent disclosures in order to reflect
current management practices, however quantitative data is
presented as of December 31, 2016.
The GSGUK consolidated regulatory capital requirement
has been calculated in accordance with the Capital
Requirements Directive (CRD) and the Capital
Requirements Regulation (CRR), collectively known as
CRD IV, which came into effect on January 1, 2014. These
regulations are largely based on the Basel Committee’s final
capital framework for strengthening international capital
standards (Basel III), which is structured around three
pillars: Pillar 1 “minimum capital requirements”, Pillar 2
“supervisory review process” and Pillar 3 “market
discipline”. Certain provisions of CRD IV are directly
applicable in the UK and certain provisions have been
implemented in the PRA and FCA Rulebooks.
These Pillar 3 disclosures have been published in
conjunction with consolidated financial information for
GSGUK for the year ended December 31, 2016 and set out
the qualitative and quantitative disclosures required by Part
8 of the CRR within CRD IV, as supplemented by the PRA
and FCA Rulebooks in relation to GSGUK. The annual
consolidated financial information for GSGUK can be
accessed via the following link:
http://www.goldmansachs.com/disclosures/index.html
Measures of exposures and other metrics disclosed in this
report may not be based on UK generally accepted
accounting principles (UK GAAP), may not be directly
comparable to measures reported in GSGUK’s consolidated
financial information, and may not be comparable to similar
measures used by other companies. These disclosures are
not required to be, and have not been, audited by our
independent auditors.
Information in the 2016 Form 10-K under the headings of
Critical Accounting Policies, Equity Capital and Overview
and Structure of Risk Management is also applicable to
GSGUK as integrated subsidiaries of Group Inc. The 2016
Form 10-K can be accessed via the following link:
http://www.goldmansachs.com/investor-
relations/financials/current/10k/2016-10-k.pdf

GOLDMAN SACHS GROUP UK LIMITED
Pillar 3 Disclosures
December 2016 | Pillar 3 Disclosures 4
Basis of Consolidation
GSGUKL is the holding company for a group that provides
a wide range of financial services to clients located
worldwide. The company’s functional currency is US
dollars and these disclosures are prepared in that currency.
The following UK-regulated subsidiaries are included in the
regulatory consolidation:
Goldman Sachs International (GSI)
Goldman Sachs International Bank (GSIB)
Goldman Sachs Asset Management International
(GSAMI)
Goldman Sachs Asset Management Global Services
Limited
Goldman Sachs MB Services Limited
The scope of consolidation for regulatory capital purposes is
consistent with the UK GAAP consolidation.
CRD IV requires significant subsidiaries to make certain
capital disclosures on an individual or subconsolidated
basis. The significant subsidiaries of GSGUK are GSI and
GSIB. GSI is the firm’s broker dealer in the Europe, Middle
East and Africa (EMEA) region and its risk profile is
materially the same as GSGUK. GSIB is GSGUK’s
deposit-taking subsidiary. Risk management policies and
procedures are applied consistently to GSI, GSIB and to
GSGUK as a whole. The remaining entities have minimal
balance sheet activity and have not been determined
material subsidiaries for the purposes of these disclosures.
Restrictions on the Transfer of Funds or Regulatory Capital within the Firm
Group Inc. is a holding company and, therefore, utilises
dividends, distributions and other payments from its
subsidiaries to fund dividend payments and other payments
on its obligations, including debt obligations. Regulatory
capital requirements as well as provisions of applicable law
and regulations restrict Group Inc.’s ability to withdraw
capital from its regulated subsidiaries. Within GSGUK,
capital is provided by GSGUKL to subsidiary entities.
Capital is considered transferable to other entities within the
GSGUK Group without any significant restriction except to
the extent it is required for regulatory purposes.
For information about restrictions on the transfer of funds
within Group Inc. and its subsidiaries, see “Note 20.
Regulation and Capital Adequacy” in Part II, Item 8
“Financial Statements and Supplementary Data” and “Risk
Management – Liquidity Risk Management” and “Equity
Capital Management and Regulatory Capital” in Part II,
Item 7 “Management’s Discussion and Analysis of
Financial Condition and Results of Operations” in the firm’s
2016 Form 10-K.
Definition of Risk-Weighted Assets
The risk weights that are used in the calculation of RWAs
reflect an assessment of the riskiness of our assets and
exposures. These risk weights are based on either
predetermined levels set by regulators or on internal models
which are subject to various qualitative and quantitative
parameters that are subject to approval by our regulators.
The relationship between available capital and capital
requirements can be expressed in the form of a ratio, and
capital requirements are arrived at by dividing RWAs by
12.5. In this document, minimum capital ratios set out in
Table 1 are expressed including the impact of additional
buffers.

GOLDMAN SACHS GROUP UK LIMITED
Pillar 3 Disclosures
December 2016 | Pillar 3 Disclosures 5
Fair Value
The inventory amounts reflected on our consolidated
balance sheet as “Financial instruments owned” and
“Financial instruments sold, but not yet purchased” as well
as certain other financial assets and financial liabilities, are
accounted for at fair value (i.e., marked-to-market), with
related gains or losses generally recognised in our
consolidated profit and loss account and, therefore, in
capital. The fair value of a financial instrument is the
amount that would be received to sell an asset or paid to
transfer a liability in an orderly transaction between market
participants at the measurement date. The use of fair value
to measure financial instruments is fundamental to risk
management practices and is our most critical accounting
policy. The daily discipline of marking substantially all of
our inventory to current market levels is an effective tool for
assessing and managing risk and provides transparent and
realistic insight into our financial exposures. The use of fair
value is an important aspect to consider when evaluating our
capital base and our capital ratios; it is also a factor used to
determine the classification of positions into the banking
book and trading book.
For additional information regarding the determination of
fair value under accounting principles generally accepted in
the United States (US GAAP) and controls over valuation of
inventory, see “Note 3. Significant Accounting Policies” in
Part II, Item 8 “Financial Statements and Supplementary
Data” and “Critical Accounting Policies – Fair Value” in
Part II, Item 7 “Management’s Discussion and Analysis of
Financial Condition and Results of Operations” in the firm’s
2016 Form 10-K.
For additional information regarding the determination of
fair value under UK GAAP and controls over valuation of
inventory, please refer to “Note 1. Summary of Significant
Accounting Policies” in GSGUK’s consolidated financial
information.
Banking Book / Trading Book Classification
In order to determine the appropriate regulatory capital
treatment for our exposures, positions must be first
classified into either “banking book” or “trading book”.
Positions are classified as banking book unless they qualify
to be classified as trading book.
Banking book positions may be accounted for at amortised
cost, fair value or in accordance with the equity method;
they are not generally positions arising from client servicing
and market making, positions intended to be resold in the
short term, or positions intended to benefit from actual or
expected short-term price differences between buying and
selling prices or from other price or interest rate variations1.
Banking book positions are subject to credit risk regulatory
capital requirements. Credit risk represents the potential for
loss due to the default or deterioration in credit quality of a
counterparty (e.g., an OTC derivatives counterparty or a
borrower) or an issuer of securities or other instruments we
hold. See “Credit Risk” for additional details.
Trading book positions generally meet the following
criteria: they are assets or liabilities that are accounted for at
fair value; they are risk managed using a Value-at-Risk
(VaR) internal model; they are held as part of our market-
making and underwriting businesses and are intended to be
resold in the short term, or positions intended to benefit
from actual or expected short-term price differences
between buying and selling prices or from other price or
interest rate variations1. Trading book positions are subject
to market risk regulatory capital requirements, as are foreign
exchange and commodity positions, whether or not they
meet the other criteria for classification as trading book
positions. Market risk is the risk of loss in the value of our
inventory due to changes in market prices. See “Market
Risk” section for further details. Some trading book
positions, such as derivatives, are also subject to
counterparty credit risk regulatory capital requirements.
1 As defined in point (85) of Article 4(1) in CRD IV.
GOLDMAN SACHS GROUP UK LIMITED
Pillar 3 Disclosures
December 2016 | Pillar 3 Disclosures 6
Capital Framework
For CRD IV regulatory purposes, a company’s total
available capital has the following components:
Common Equity Tier 1 capital (CET1), which is
comprised of common shareholders’ equity, after
giving effect to deductions for disallowed items and
other adjustments;
Tier 1 capital which is comprised of CET1 capital and
other qualifying capital instruments; and
Tier 2 capital, which is comprised of Tier 1 capital and
includes long term qualifying subordinated debt
Certain components of our regulatory capital are subject to
regulatory limits and restrictions under CRD IV. In general,
to qualify as Tier 1 or Tier 2 capital, an instrument must be
fully paid and unsecured. A qualifying Tier 1 or Tier 2
capital instrument must also be subordinated to all senior
indebtedness of the organisation.
Under CRD IV, the minimum CET1, Tier 1 capital and
Total capital ratios (collectively the Pillar 1 capital
requirements) are supplemented by:
A capital conservation buffer, consisting entirely of
capital that qualifies as CET1, began to phase in on
January 1, 2016, and will continue to do so in increments
of 0.625% per year until it reaches 2.5% of RWAs on
January 1, 2019.
A countercyclical capital buffer of up to 2.5% (and also
consisting entirely of CET1) in order to counteract
excessive credit growth. The buffer only applies to
GSGUK’s exposures to certain types of counterparties
based in jurisdictions which have announced a
countercyclical buffer. Since these exposures are not
currently material, the buffer adds less than 0.01% to the
capital ratio and has an immaterial impact on the capital
of GSGUK. The countercyclical capital buffer
applicable to GSGUK could change in the future and, as
a result, the minimum ratios could increase. Further
information on the buffer can be found in Table 32 and
Table 33.
Individual capital guidance under Pillar 2A (an
additional amount to cover risks not adequately captured
in Pillar 1). The PRA performs a periodic supervisory
review of GSI’s and GSIB’s Internal Capital Adequacy
Assessment Process (ICAAP), which leads to a final
determination by the PRA of individual capital guidance
under Pillar 2A. This is a point in time assessment of the
minimum amount of capital the PRA considers that an
entity should hold.
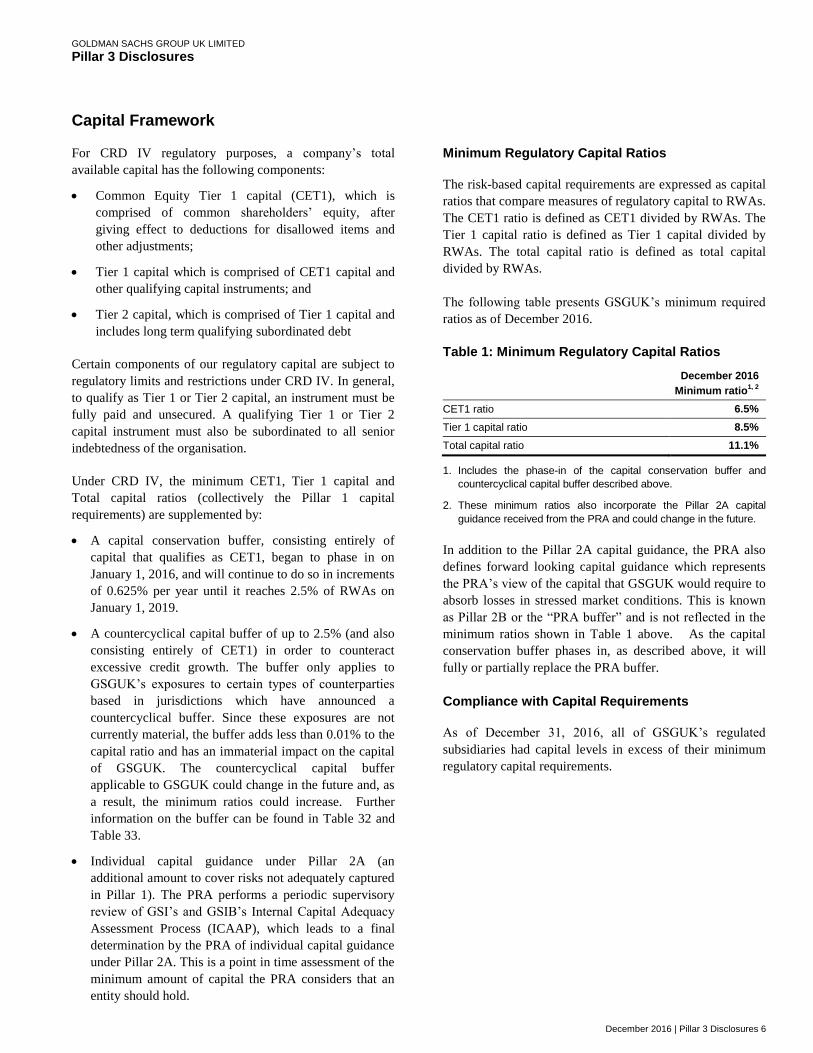
Minimum Regulatory Capital Ratios
The risk-based capital requirements are expressed as capital
ratios that compare measures of regulatory capital to RWAs.
The CET1 ratio is defined as CET1 divided by RWAs. The
Tier 1 capital ratio is defined as Tier 1 capital divided by
RWAs. The total capital ratio is defined as total capital
divided by RWAs.
The following table presents GSGUK’s minimum required
ratios as of December 2016.
Table 1: Minimum Regulatory Capital Ratios
December 2016
Minimum ratio1, 2
CET1 ratio 6.5%
Tier 1 capital ratio 8.5%
Total capital ratio 11.1%
1. Includes the phase-in of the capital conservation buffer and
countercyclical capital buffer described above.
2. These minimum ratios also incorporate the Pillar 2A capital
guidance received from the PRA and could change in the future.
In addition to the Pillar 2A capital guidance, the PRA also
defines forward looking capital guidance which represents
the PRA’s view of the capital that GSGUK would require to
absorb losses in stressed market conditions. This is known
as Pillar 2B or the “PRA buffer” and is not reflected in the
minimum ratios shown in Table 1 above. As the capital
conservation buffer phases in, as described above, it will
fully or partially replace the PRA buffer.
Compliance with Capital Requirements
As of December 31, 2016, all of GSGUK’s regulated
subsidiaries had capital levels in excess of their minimum
regulatory capital requirements.

GOLDMAN SACHS GROUP UK LIMITED
Pillar 3 Disclosures
December 2016 | Pillar 3 Disclosures 7
Regulatory Capital
Overview
The following table presents a breakdown of GSGUK’s
capital ratios under CRD IV as of December 31, 2016,
including those for our significant subsidiaries GSI and
GSIB.
Table 2: Regulatory Capital Ratios
$ in millions As of December 2016
GSGUK GSI GSIB
CET1 Capital $ 30,470 $ 26,453 $ 2,681
Tier 1 Capital 30,470 26,453 2,681
Tier 2 Capital 9,621 8,910 711
Total Capital $ 40,091 $ 35,363 $ 3,392
RWAs $ 221,909 $ 205,092 $ 10,179
CET1 Ratio 13.7% 12.9% 26.3%
Tier 1 Capital Ratio 13.7% 12.9% 26.3%
Total Capital Ratio 18.1% 17.2% 33.3%
Capital Structure
Certain CRD IV rules are subject to final technical standards
and clarifications, which will be issued by the European
Banking Authority (EBA) and adopted by the European
Commission and PRA. All capital, RWAs and estimated
ratios are based on current interpretation, expectations and
understanding of CRD IV and may evolve as its
interpretation and application is discussed with our
regulators.
Assets that are deducted from capital in computing the
numerator of the capital ratios are excluded from the
computation of RWAs in the denominator of the ratios. The
following tables contain information on the components of
our regulatory capital structure based on CRD IV, as
implemented by the PRA. The capital resources of GSGUK
are based on audited, consolidated non-statutory financial
information and those of GSI and GSIB are based on
audited statutory financial statements.
Table 3: Regulatory Capital Resources
$ in millions As of December 2016
GSGUK GSI GSIB
Ordinary Share Capital $ 4,935 $ 582 $ 63
Share Premium Account Including Reserves
388 4,864 2,094
Audited Retained Earnings 26,040 22,087 762
CET1 Capital Before Deductions
$ 31,363 $ 27,533 $ 2,919
Net Pension Assets (53) (53) -
CVA and DVA (95) (95) (2)
Prudent Valuation Adjustments
(376) (323) (2)
Expected Loss Deduction and Loan Loss Provision
(14) (4) (36)
Other Adjustments (250) (500) (198)1
Intangibles (105) (105) -
CET1 Capital After Deductions
$ 30,470 $ 26,453 $ 2,681
Tier 1 Capital After Deductions
30,470 26,453 2,681
Tier 2 Capital Before Deductions
2
9,736 8,910 826
Other Adjustments (115) - (115)1
Tier 2 Capital After Deductions
9,621 8,910 711
Total Capital Resources $ 40,091 $ 35,363 $ 3,392
1. Other Adjustments within the CET1 and Tier 2 capital of GSIB
primarily represent the excess capital attributed to certain branch
operations.
2. Tier 2 Capital represents subordinated debt with an original term
to maturity of five years or greater. The outstanding amount of
subordinated debt qualifying for Tier 2 Capital is reduced, or
discounted, upon reaching a remaining maturity of five years.
A further breakdown of the deductions from regulatory
capital can be found in Table 31. We set out below a
reconciliation between the capital resources of each entity
and their respective balance sheets.
Table 4: Reconciliation to Balance Sheet
$ in millions As of December 2016
GSGUK GSI GSIB
Total Shareholders’ Funds per Balance Sheet
$ 31,363 $ 27,533 $ 2,919
Regulatory deductions (893) (1,080) (238)
Tier 2 Capital After Deductions 9,621 8,910 711
Total Capital Resources $ 40,091 $ 35,363 $ 3,392

GOLDMAN SACHS GROUP UK LIMITED
Pillar 3 Disclosures
December 2016 | Pillar 3 Disclosures 8
Risk Management
Overview
Effective risk management plays a key role in the overall
success of the firm and of GSGUK. Accordingly, we have
comprehensive risk management processes through which
we monitor, evaluate and manage the risks we assume in
conducting our activities. These risks include liquidity,
market, credit, operational, model, legal, compliance,
regulatory and reputational risk exposures. The following
section covers our philosophy in respect of risk
management.
Risk Profile and Strategy
In the normal course of activities in serving clients, we
commit capital, engage in derivative transactions, and
otherwise incur risk as an inherent part of our business.
However, we endeavour not to undertake risk in form or
amount that could potentially and materially impair our
capital and liquidity position or the ability to generate
revenues, even in a stressed environment.
Consistent with this objective, we pay particular attention to
evaluating risks that are concentrated, correlated, illiquid, or
have other adverse characteristics. The intention is to
mitigate or eliminate these risks, limiting them to such an
extent that they could not, individually or collectively,
materially and adversely affect GSGUK. GSGUKL’s
principal subsidiaries, GSI and GSIB, regularly review risk
exposure and risk appetite, and take into consideration the
key external constituencies, in particular their clients,
shareholders, creditors, rating agencies, and regulators. The
long-term success of our business model is directly linked to
the preservation of strong relationships with each of these
key constituents.
The GSI and GSIB Boards of Directors both have their own
Board Risk Committees, with the responsibility of assisting
each Board in overseeing the implementation of the
companies’ risk appetite and strategy. Each committee held
three scheduled meetings in 2016.
The Boards of Directors of both GSI and GSIB, as well as
their respective Board Risk Committees, are actively
engaged in reviewing and approving our overall risk
appetite, as well as in reviewing the risk profile. Risk
appetite statements are reviewed in the first instance by the
respective company’s Risk Committee, followed by the
Board Risk Committees and finally, are endorsed by the
Boards annually. The Board Risk Committees also approve
any amendment to the risk appetite statements outside of the
annual approval process. The Boards of Directors receive
quarterly updates on risk as well as ad-hoc updates, as
appropriate.
Our overall risk appetite is established through an
assessment of opportunities relative to potential loss, and is
calibrated to GSI and GSIB’s respective capital, liquidity
and earnings capability. The primary means of evaluating
loss-taking capacity is through the ICAAP. The key aspects
of risk management documented through the ICAAP
process also form part of GSGUK’s day-to-day decision
making culture.
Structure
The oversight of risk is ultimately the responsibility of the
Boards of Directors, who oversee risk both directly and
through delegation to various committees. A series of
committees within our significant subsidiaries with specific
risk management mandates covering important aspects of
each entity’s businesses also have oversight or decision-
making responsibilities. The key committees with oversight
of our activities are described below.
European Management Committee. The European
Management Committee (EMC) has been established by the
Boards of Directors of the firm’s principal regulated entities
in EMEA to oversee the activities in the region. Its
membership includes executive directors of GSI and GSIB
and senior managers from the revenue-producing divisions
and control and support functions.
GSI and GSIB Board Audit Committees. The GSI and
GSIB Board Audit Committees assist the Boards of
Directors in the review of processes for ensuring the
suitability and effectiveness of the systems and controls in
the region. The committees also have responsibility for
overseeing the external audit arrangements and review of
internal audit activities. Their membership includes non-
executive directors of GSI and GSIB. The Board Audit
Committees report to the GSI and GSIB Boards.
GSI and GSIB Board Risk Committees. The GSI and
GSIB Board Risk Committees are responsible for providing
advice to the GSI and GSIB Boards of Directors on the
overall current and future risk appetite and assisting the
boards of directors in overseeing the implementation of that
risk appetite and strategy by senior management. This
includes reviewing and advising on each company’s risk
strategy and oversight of the capital, liquidity and funding
position. Their membership includes non-executive
directors of GSI and GSIB. The Board Risk Committees
report to the GSI and GSIB Boards.
GOLDMAN SACHS GROUP UK LIMITED
Pillar 3 Disclosures
December 2016 | Pillar 3 Disclosures 9
EMEA Conduct Risk Committee. The EMEA Conduct
Risk Committee has oversight responsibility for conduct
risk, business standards and practices. Its membership
includes senior managers from the revenue-producing
divisions and independent control and support functions.
The EMEA Conduct Risk Committee reports to the EMC
and to GS Group’s Firmwide Client and Business Standards
Committee.
GSI and GSIB Risk Committees. The GSI and GSIB Risk
Committees are management committees, which are
responsible for the on-going monitoring and control of all
financial risks associated with the activities of each entity.
This includes reviewing key financial and risk metrics,
including but not limited to profit and loss, capital
(including ICAAP), funding, liquidity, credit risk, market
risk, operational risk, price verification and stress tests. The
GSI and GSIB Risk Committees approve market risk, credit
risk, liquidity and regulatory capital limits. Their
membership includes senior managers from the revenue-
producing divisions and independent control and support
functions. The Risk Committees report to the GSI and GSIB
Boards.
Risk Measurement
On a day-to-day basis risk measurement plays an important
role in articulating the risk appetite of the firm and GSGUK
and in defending the capital target expressed in the risk
appetite statements. Risk may be monitored against
firmwide, product, divisional or business level thresholds or
against a combination of such attributes. These risks are
tracked, monitored and reported to the relevant Board on a
regular basis.
A number of specialist committees and governance bodies
sit within the broader risk management framework with
responsibilities for the monitoring of specific risks against
limits or tolerances and the escalation of any breaches.
Specific governance bodies are in place for the management
of credit, market, liquidity, model and operational risk.
In addition to these committees and governance bodies,
functions that are independent of the revenue-producing
units, such as compliance, finance, legal, internal audit and
operations perform risk management functions, which
include monitoring, analysing and evaluating risk.
GSGUK Risk Management
The consideration of risk appetite and the underlying risk
management framework ensures that GSGUK’s businesses
are congruent with our strategy under both normal and
stressed environments. We believe that the risk management
arrangements in place are adequate with regard to our
profile and strategy.
For an overview of the firm’s risk management framework,
including Board governance, processes and committee
structure, see “Risk Management – Overview and Structure
of Risk Management” in Part II, Item 7 “Management’s
Discussion and Analysis of Financial Condition and Results
of Operations” in the firm’s 2016 Form 10-K.
Michael Michael
GOLDMAN SACHS GROUP UK LIMITED
Pillar 3 Disclosures
December 2016 | Pillar 3 Disclosures 10
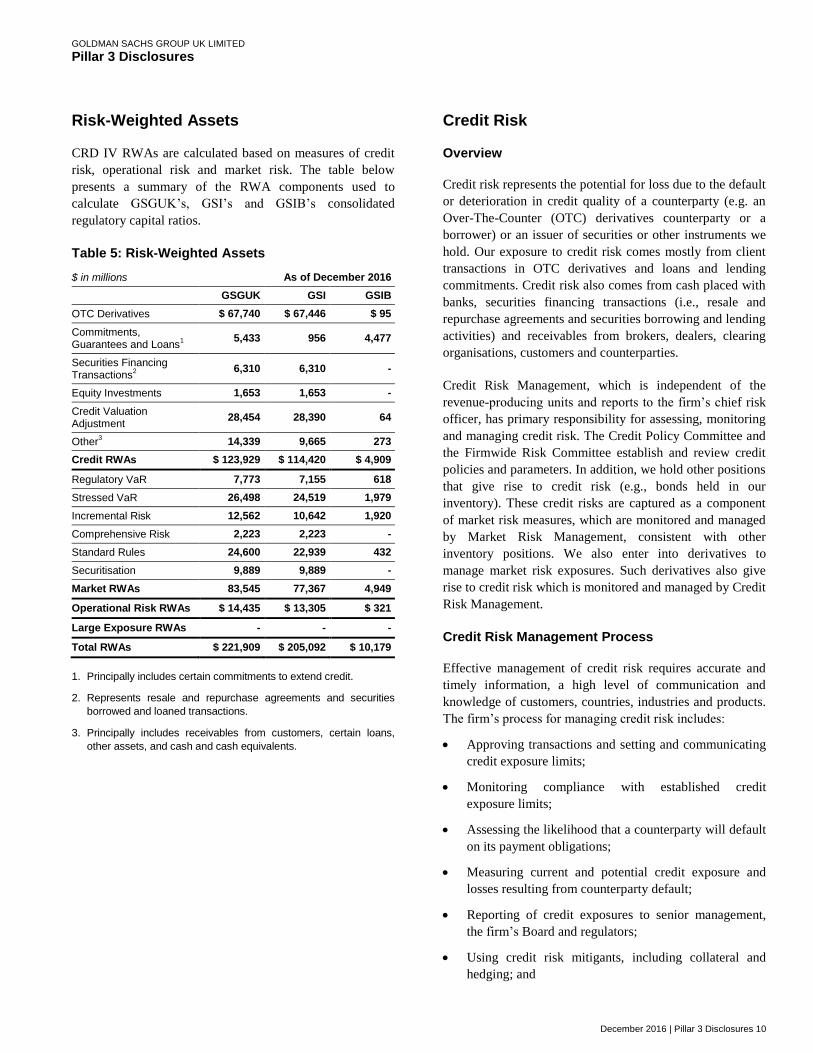
Risk-Weighted Assets
CRD IV RWAs are calculated based on measures of credit
risk, operational risk and market risk. The table below
presents a summary of the RWA components used to
calculate GSGUK’s, GSI’s and GSIB’s consolidated
regulatory capital ratios.
Table 5: Risk-Weighted Assets
$ in millions As of December 2016
GSGUK GSI GSIB
OTC Derivatives $ 67,740 $ 67,446 $ 95
Commitments, Guarantees and Loans
1
5,433 956 4,477
Securities Financing Transactions
2
6,310 6,310 -
Equity Investments 1,653 1,653 -
Credit Valuation Adjustment
28,454 28,390 64
Other3 14,339 9,665 273
Credit RWAs $ 123,929 $ 114,420 $ 4,909
Regulatory VaR 7,773 7,155 618
Stressed VaR 26,498 24,519 1,979
Incremental Risk 12,562 10,642 1,920
Comprehensive Risk 2,223 2,223 -
Standard Rules 24,600 22,939 432
Securitisation 9,889 9,889 -
Market RWAs 83,545 77,367 4,949
Operational Risk RWAs $ 14,435 $ 13,305 $ 321
Large Exposure RWAs - - -
Total RWAs $ 221,909 $ 205,092 $ 10,179
1. Principally includes certain commitments to extend credit.
2. Represents resale and repurchase agreements and securities
borrowed and loaned transactions.
3. Principally includes receivables from customers, certain loans,
other assets, and cash and cash equivalents.
Credit Risk
Overview
Credit risk represents the potential for loss due to the default
or deterioration in credit quality of a counterparty (e.g. an
Over-The-Counter (OTC) derivatives counterparty or a
borrower) or an issuer of securities or other instruments we
hold. Our exposure to credit risk comes mostly from client
transactions in OTC derivatives and loans and lending
commitments. Credit risk also comes from cash placed with
banks, securities financing transactions (i.e., resale and
repurchase agreements and securities borrowing and lending
activities) and receivables from brokers, dealers, clearing
organisations, customers and counterparties.
Credit Risk Management, which is independent of the
revenue-producing units and reports to the firm’s chief risk
officer, has primary responsibility for assessing, monitoring
and managing credit risk. The Credit Policy Committee and
the Firmwide Risk Committee establish and review credit
policies and parameters. In addition, we hold other positions
that give rise to credit risk (e.g., bonds held in our
inventory). These credit risks are captured as a component
of market risk measures, which are monitored and managed
by Market Risk Management, consistent with other
inventory positions. We also enter into derivatives to
manage market risk exposures. Such derivatives also give
rise to credit risk which is monitored and managed by Credit
Risk Management.
Credit Risk Management Process
Effective management of credit risk requires accurate and
timely information, a high level of communication and
knowledge of customers, countries, industries and products.
The firm’s process for managing credit risk includes:
Approving transactions and setting and communicating
credit exposure limits;
Monitoring compliance with established credit
exposure limits;
Assessing the likelihood that a counterparty will default
on its payment obligations;
Measuring current and potential credit exposure and
losses resulting from counterparty default;
Reporting of credit exposures to senior management,
the firm’s Board and regulators;
Using credit risk mitigants, including collateral and
hedging; and

GOLDMAN SACHS GROUP UK LIMITED
Pillar 3 Disclosures
December 2016 | Pillar 3 Disclosures 11
Communicating and collaborating with other
independent control and support functions such as
operations, legal and compliance.
As part of the risk assessment process, Credit Risk
Management performs credit reviews which include initial
and ongoing analyses of the firm’s counterparties. For
substantially all credit exposures, the core of the process is
an annual counterparty credit review. A credit review is an
independent analysis of the capacity and willingness of a
counterparty to meet its financial obligations, resulting in an
internal credit rating. The determination of internal credit
ratings also incorporates assumptions with respect to the
nature of and outlook for the counterparty’s industry, and
the economic environment. Senior personnel within Credit
Risk Management, with expertise in specific industries,
inspect and approve credit reviews and internal credit
ratings.
The firm’s risk assessment process may also include, where
applicable, reviewing certain key metrics, such as
delinquency status, collateral values, credit scores and other
risk factors.
The firm’s global credit risk management systems capture
credit exposure to individual counterparties and on an
aggregate basis to counterparties and their subsidiaries
(economic groups). These systems also provide
management with comprehensive information on the firm’s
aggregate credit risk by product, internal credit rating,
industry, country and region.
Credit Risk Measures and Limits
The firm measures credit risk based on the potential loss in
an event of non-payment by a counterparty using current
and potential exposure. For derivatives and securities
financing transactions, current exposure represents the
amount presently owed after taking into account applicable
netting and collateral arrangements while potential exposure
represents the firm’s estimate of the future exposure that
could arise over the life of a transaction based on market
movements within a specified confidence level. Potential
exposure also takes into account netting and collateral
arrangements. For loans and lending commitments, the
primary measure of credit risk is a function of the notional
amount of the position.
The firm uses credit limits at various levels (counterparty,
economic group, industry, country) as well as underwriting
standards to control the size and nature of credit exposures.
Limits for counterparties and economic groups are reviewed
regularly and revised to reflect changing risk appetites for a
given counterparty or group of counterparties. Limits for
industries and countries are based on risk tolerance and are
designed to allow for regular monitoring, review, escalation
and management of credit risk concentrations. The Risk
Committee of the Goldman Sachs Board and the Risk
Governance Committee (through delegated authority from
the Firmwide Risk Committee) approve credit risk limits at
the firmwide, business and product levels. The Board Risk
Committees of GSI and GSIB approve the risk appetite of
each company and credit risk limits at the company level.
Credit Risk Management (through delegated authority from
the Risk Committees of GSI and GSIB) sets credit
concentration limits at the GSI firm level for counterparty
groups, industries and countries. In addition, Credit Risk
Management (through delegated authority from the Risk
Governance Committee) sets credit limits for individual
counterparties, economic groups, industries and countries.
Policies authorised by the Firmwide Risk Committee, the
Risk Governance Committee and the Credit Policy
Committee prescribe the level of formal approval required
for the firm to assume credit exposure to a counterparty
across all product areas, taking into account any applicable
netting provisions, collateral or other credit risk mitigants.
Credit Exposures
For information on the firm’s credit exposures, including the
gross fair value, netting benefits and current exposure of the
firm’s derivative exposures and the firm’s securities
financing transactions, see “Note 7. Derivatives and
Hedging Activities” and “Note 10. Collateralized
Agreements and Financings” in Part II, Item 8 “Financial
Statements and Supplementary Data” and “Credit Risk
Management” in Part II, Item 7 “Management’s Discussion
and Analysis of Financial Condition and Results of
Operations” in the firm’s 2016 Form 10-K.
Allowance for Losses on Loans and Lending Commitments
For information on the firm’s impaired loans and loans on
non-accrual status, and allowance for losses on loans and
lending commitments, see “Note 9. Loans Receivable” in
Part II, Item 8 "Financial Statements and Supplementary
Data” in the firm’s 2016 Form 10-K.
Credit Risk RWAs
Credit RWAs are calculated based upon measures of credit
exposure which are then risk weighted. Below is a
description of the methodology used to calculate RWAs for
Wholesale exposures, which generally include credit
exposures to corporates, sovereigns or government entities
GOLDMAN SACHS GROUP UK LIMITED
Pillar 3 Disclosures
December 2016 | Pillar 3 Disclosures 12
(other than securitisation or equity exposures, which are
covered in later sections). GSGUK has regulatory
permission from the PRA to compute risk weights in
accordance with the Advanced Internal Ratings Based
(AIRB) approach which utilises internal assessments of each
counterparty’s creditworthiness.
Exposure at Default (EAD). For on-balance-sheet assets,
such as receivables and cash, the EAD is generally based on
the carrying value. For the calculation of EAD for off-
balance-sheet exposures, including commitments and
guarantees, a credit equivalent exposure amount is
calculated based on the notional amount of each transaction
multiplied by a credit conversion factor in accordance with
Article 166 of CRD IV.
For the measurement of counterparty credit exposure on
OTC, cleared and listed derivative and securities financing
transactions, GSGUK has regulatory permission from the
PRA to use the Internal Model Method (IMM). GSGUK
uses IMM for substantially all of the counterparty credit risk
arising from OTC derivatives, exchange-traded derivatives
and securities financing transactions. The models estimate
Expected Exposures (EE) at various points in the future
using risk factor simulations. The model parameters are
derived from historical data using the most recent three-year
period. The models also estimate the Effective Expected
Positive Exposure (EEPE) over the first year of the
portfolio, which is the time-weighted average of non-
declining positive credit exposure over the EE simulation.
EAD is calculated by multiplying the EEPE by a standard
regulatory alpha factor of 1.4.
The EAD detailed in the following tables represents the
exposures used in computing capital requirements and is not
a directly comparable metric to balance sheet amounts
presented in the consolidated financial information of
GSGUK for the year ended December 31, 2016 due to
differences in measurement methodology, counterparty
netting and collateral offsets used.
As GSGUK calculates the majority of its credit exposure
under the IMM, the impacts of netting and collateral are
integral to the calculation of the exposure. The exposures
disclosed below are presented on a net and collateralised
basis where there is a legally enforceable netting and
collateral opinion. They do not include the effect of any
credit protection purchased on counterparties.
Advanced IRB Approach. RWAs are calculated by
multiplying EAD by the counterparty’s risk weight. In
accordance with the Advanced IRB approach, risk-weights
are a function of the counterparty’s Probability of Default
(PD), Loss Given Default (LGD) and the maturity of the
trade or portfolio of trades, where:
PD is an estimate of the probability that an obligor will
default over a one-year horizon. For the majority of
Wholesale exposures, the PD is assigned using an
approach where quantitative factors are combined with
a qualitative assessment to determine internal credit
rating grades. For each internal credit rating grade, over
5 years of historical empirical data is used to calculate a
long run average annual PD which is assigned to each
counterparty with that credit rating grade.
Internal credit rating grades each have external public
rating agency equivalents. The scale that is employed
for internal credit ratings corresponds to that used by
the major rating agencies and the internal credit ratings,
while arrived at independently of public ratings, are
assigned using definitions of each rating grade that are
consistent with the definitions used by the major rating
agencies for their equivalent credit rating grades. As a
result, default data published by the major rating
agencies for obligors with public ratings can be mapped
to counterparties with equivalent internal credit ratings
for quantification and validation of risk parameters.
LGD is an estimate of the economic loss rate if a
default occurs during economic downturn conditions.
For Wholesale exposures, the LGD is determined using
recognised vendor models, and, where applicable and
enforceable, the LGD parameter incorporates the
benefit of security status.
The definition of maturity depends on the nature of the
exposure. For OTC, cleared and listed derivatives,
maturity is an average time measure weighted by credit
exposure (based on EE and EEPE) as required by
applicable capital regulation. For securities financing
transactions, maturity represents the notional weighted
average number of days to maturity. Maturity is floored
at one year and capped at five years except where the
rules allow a maturity of less than one year to be used
as long as certain criteria are met.

GOLDMAN SACHS GROUP UK LIMITED
Pillar 3 Disclosures
December 2016 | Pillar 3 Disclosures 13
The following four tables represent a summary of
GSGUK’s, GSI’s and GSIB’s credit exposure by IRB
exposure class, industry type, residual maturity and
geography as of December 31, 2016.
Table 6: IRB Approach Exposure Class
$ in millions As of December 2016
EAD RWA
Central Governments and Central Banks $ 28,890 $ 9,394
Credit Institutions and Investment Firms 58,652 37,205
Corporates 69,127 36,466
Securitisation 44 25
Equity 447 1,653
Non-credit obligation assets 184 184
GSGUK Total Credit Risk $ 157,344 $ 84,927
Central Governments and Central Banks 28,640 9,366
Credit Institutions and Investment Firms 57,634 36,792
Corporates 64,910 32,104
Securitisation 14 14
Equity 447 1,653
Non-credit obligation assets 177 177
GSI Total Credit Risk $ 151,822 $ 80,106
Central Governments and Central Banks 250 28
Credit Institutions and Investment Firms 1,018 413
Corporates 4,217 4,362
Securitisation 30 11
Equity - -
Non-credit obligation assets 7 7
GSIB Total Credit Risk $ 5,522 $ 4,821
Table 7: IRB EAD by Industry Type
$ in millions As of December 2016
GSGUK GSI GSIB
Agriculture, Forestry & Fishing $ 107 $ 29 $ 78
Construction 174 40 134
Finance Industry - Banks 28,471 27,519 952
Finance Industry - Non-Banks 70,732 68,997 1,735
Finance Industry - Pension Funds
13,818 13,818 -
Manufacturing 2,418 1,612 806
Mining & Quarrying 916 708 208
Real Estate 459 308 151
Retail / Wholesale trade 429 82 347
Services and others 4,080 3,620 460
Sovereigns 32,680 32,477 203
Transport, Utilities & Storage 3,060 2,612 448
Total $ 157,344 $ 151,822 $ 5,522
Table 8: IRB EAD by Residual Maturity
$ in millions As of December 2016
Less than One
Year
One to Five
Years
Over Five
Years Total
Central Governments and Central Banks
$ 4,935 $ 14,410 $ 9,545 $ 28,890
Credit Institutions and Investment Firms
12,211 39,289 7,290 58,790
Corporates 14,350 31,661 23,653 69,664
GSGUK Total Exposures
$ 31,496 $ 85,360 $ 40,488 $157,344
Central Governments and Central Banks
4,935 14,160 9,545 28,640
Credit Institutions and Investment Firms
12,211 38,287 7,274 57,772
Corporates 14,257 27,700 23,453 65,410
GSI Total Exposures $ 31,403 $ 80,147 $ 40,272 $151,822
Central Governments and Central Banks
- 250 - 250
Credit Institutions and Investment Firms
- 1,002 16 1,018
Corporates 93 3,961 200 4,254
GSIB Total Exposures $ 93 $ 5,213 $ 216 $ 5,522
Table 9: IRB EAD by Geography
$ in millions As of December 2016
America Asia EMEA Total
Central Governments and Central Banks
$ 368 $ 1,192 $ 27,331 $ 28,891
Credit Institutions and Investment Firms
18,212 15,819 24,758 58,789
Corporates 17,795 12,234 39,635 69,664
GSGUK Total Exposures
$ 36,375 $ 29,245 $ 91,724 $157,344
Central Governments and Central Banks
368 1,087 27,186 28,641
Credit Institutions and Investment Firms
17,675 15,545 24,552 57,772
Corporates 16,983 12,229 36,197 65,409
GSI Total Exposures $35,026 $ 28,861 $ 87,935 $151,822
Central Governments and Central Banks
- 105 145 250
Credit Institutions and Investment Firms
537 274 206 1,017
Corporates 812 5 3,438 4,255
GSIB Total Exposures $ 1,349 $ 384 $ 3,789 $ 5,522

GOLDMAN SACHS GROUP UK LIMITED
Pillar 3 Disclosures
December 2016 | Pillar 3 Disclosures 14
Tables 10 and 11 below show our distribution of EAD and
Exposure-Weighted Average Risk Weight by credit quality
(PD band) as of December 31, 2016 across Wholesale
exposure class and geography. EAD balances are shown
post the application of Credit Risk Mitigation (CRM) as
discussed on the following page. Table 12 shows the
distribution of our equity exposures as measured by risk
weight for regulatory capital purposes.
Table 10: Credit Risk Wholesale Exposure by IRB exposure class and by PD Band
$ in millions As of December 2016
Sovereigns Institutions Corporates
PD Band Range EAD Post CRM $m1
Exposure-Weighted Average
Risk Weight %
RWA Post CRM $m
EAD Post CRM $m1
Exposure-Weighted Average
Risk Weight %
RWA Post CRM $m
EAD Post CRM $m1
Exposure-Weighted Average
Risk Weight %
RWA Post CRM $m
Undrawn Commitments
and Guarantees
EAD
0 to <0.05% $ 24,373 23% $ 5,522 $ 8,870 23% $ 2,031 $ 24,741 24% $ 6,022 $ 42
0.05% to <0.25% 4,455 85% 3,795 42,496 53% 22,687 35,815 40% 14,285 2,313
0.25% to <0.75% 56 110% 62 4,676 146% 6,841 4,413 128% 5,645 723
0.75% to <5.0% - 173% - 2,177 173% 3,763 2,684 195% 5,242 201
5.0% to <20% 6 262% 15 85 321% 273 871 305% 2,655 279
20% to <100% - 0% - 348 462% 1,610 603 434% 2,617 7
100% (default) - 0% - - 0% - - 0% - -
GSGUK Total $ 28,890 33% $ 9,394 $ 58,652 63% $ 37,205 $ 69,127 53% $ 36,466 $ 3,565
1. Collateral is generally factored into the EAD for OTC derivatives and securities financing transactions using the IMM.
Table 11: Credit Risk Wholesale Exposure by Region and by PD Band
$ in millions As of December 2016
America Asia EMEA
PD Band Range EAD Post CRM $m
Exposure-Weighted Average
Risk Weight %
RWA Post CRM $m
EAD Post CRM $m
Exposure-Weighted Average
Risk Weight %
RWA Post CRM $m
EAD Post CRM $m
Exposure-Weighted Average
Risk Weight %
RWA Post CRM $m
Undrawn Commitments
and Guarantees
EAD
0 to <0.05% $ 7,366 20% $ 1,478 $ 6,927 13% $ 867 $ 43,691 26% $ 11,231 $ 42
0.05% to <0.25% 24,062 41% 9,855 20,875 43% 9,028 37,827 58% 21,884 2,313
0.25% to <0.75% 3,220 154% 4,964 830 111% 920 5,096 131% 6,663 723
0.75% to <5.0% 1,455 196% 2,858 226 199% 449 3,181 179% 5,698 201
5.0% to <20% 39 301% 118 35 286% 100 888 307% 2,725 279
20% to <100% 205 433% 889 253 401% 1,013 493 472% 2,325 7
100% (default) - - - - - - - - - -
GSGUK Total $ 36,347 55% $ 20,162 $ 29,146 42% $ 12,377 $ 91,176 55% $ 50,526 $ 3,565
Table 12: Simple Risk Weights for Equity Exposures
$ in millions As of December 2016
EAD RWA
Total EAD Total RWA America Asia EMEA America Asia EMEA
RW(290%) $ - $ - $ - $ - $ - $ - $ - $ -
RW(370%) 28 101 318 103 374 1,176 447 1,653
GSGUK Total1 $ 28 $ 101 $ 318 $ 103 $ 374 $ 1,176 $ 447 $ 1,653
RW(290%) - - - - - - - -
RW(370%) 28 101 318 103 374 1,176 447 1,653
GSI Total $ 28 $ 101 $ 318 $ 103 $ 374 $ 1,176 $ 447 $ 1,653
1. GSIB did not have any equity exposures as of December 31, 2016

GOLDMAN SACHS GROUP UK LIMITED
Pillar 3 Disclosures
December 2016 | Pillar 3 Disclosures 15
Governance and Validation of Risk Parameters
Committees within Credit Risk Management that ultimately
report to the firm’s chief credit risk officer or the Credit
Policy Committee oversee the approaches and
methodologies for quantifying PD, LGD, and EAD.
To assess the performance of the PD parameters used, on an
annual basis the firm performs a benchmarking and
validation exercise which includes comparisons of realised
annual default rates to the expected annual default rates for
each credit rating band and comparisons of the internal
realised long-term average default rates to the empirical
long-term average default rates assigned to each credit
rating band. For the year ended December 2016, as well as
in previous annual periods, the PDs used for regulatory
capital calculations were higher (i.e., more conservative)
than the firm’s actual internal realised default rate.
During the year ended December 2016, the total number of
counterparty defaults remained low, representing less than
0.5% of all counterparties, and such defaults primarily
occurred within loans and lending commitments. Estimated
losses associated with counterparty defaults were not
material.
To assess the performance of LGD parameters used, on an
annual basis the firm compares recovery rates following
counterparty defaults to the recovery rates based on LGD
parameters assigned to the corresponding exposures prior to
default. While the actual realised recovery on each defaulted
exposure varies due to transaction and other situation-
specific factors, on average, recovery rates remain higher
than those implied by the LGD parameters used in
regulatory capital calculations.
The performance of each IMM model used to quantify EAD
is assessed quarterly via backtesting procedures, performed
by comparing the predicted and realised exposure of a set of
representative trades and portfolios at certain horizons. The
firm’s models are monitored and enhanced in response to
backtesting.
Models used for regulatory capital are subject to
independent review and validation by Model Risk
Management. For further information, see “Model Risk
Management”.
Credit Risk Mitigation
To reduce credit exposures on derivatives and securities
financing transactions, the firm may enter into master
netting agreements or similar arrangements (collectively,
netting agreements) with counterparties that permit the firm
to offset receivables and payables with such counterparties.
A netting agreement is a contract with a counterparty that
permits net settlement of multiple transactions with that
counterparty, including upon the exercise of termination
rights by a non-defaulting party. Upon exercise of such
termination rights, all transactions governed by the netting
agreement are terminated and a net settlement amount is
calculated.
We may also reduce credit risk with counterparties by
entering into agreements that enable us to receive and post
cash and securities collateral with respect to our derivatives
and securities financing transactions, subject to the terms of
the related credit support agreements or similar
arrangements (collectively, credit support agreements). An
enforceable credit support agreement grants the non-
defaulting party exercising termination provisions the right
to liquidate collateral and apply the proceeds to any amounts
owed. In order to assess enforceability of our right to setoff
under netting and credit support agreements, we evaluate
various factors, including applicable bankruptcy laws, local
statutes and regulatory provisions in the jurisdiction of the
parties to the agreement. The collateral we hold consists
primarily of cash and securities of high quality government
bonds (mainly US and EU).
Our collateral is managed by an independent control
function within the Operations Division. This function is
responsible for reviewing exposure calculations, making
margin calls with relevant counterparties, and ensuring
subsequent settlement of collateral movements. We monitor
the fair value of the collateral on a daily basis to ensure that
our credit exposures are appropriately collateralised.
For additional information about the firm’s derivatives
(including collateral and the impact of the amount of
collateral required in the event of a ratings downgrade), see
“Note 7. Derivatives and Hedging Activities” in Part II,
Item 8 “Financial Statements and Supplementary Data” in
the firm’s 2016 Form 10-K. See “Note 10. Collateralized
Agreements and Financings” in Part II, Item 8 “Financial
Statements and Supplementary Data” in the firm’s 2016
Form 10-K for further information about collateralised
agreements and financings.
Michael
GOLDMAN SACHS GROUP UK LIMITED
Pillar 3 Disclosures
December 2016 | Pillar 3 Disclosures 16
For loans and lending commitments, depending on the credit
quality of the borrower and other characteristics of the
transaction, we employ a variety of potential risk mitigants.
Risk mitigants include: collateral provisions, guarantees,
covenants, structural seniority of the bank loan claims and,
for certain lending commitments, provisions in the legal
documentation that allow us to adjust loan amounts, pricing,
structure and other terms as market conditions change. The
type and structure of risk mitigants employed can
significantly influence the degree of credit risk involved in a
loan or lending commitment.
When we do not have sufficient visibility into a
counterparty’s financial strength or when we believe a
counterparty requires support from its parent, we may obtain
third-party guarantees of the counterparty’s obligations. We
may also mitigate our credit risk using credit derivatives or
participation agreements.
Credit Derivatives
We enter into credit derivative transactions primarily to
facilitate client activity and to manage the credit risk
associated with market-making, including to hedge
counterparty exposures arising from OTC derivatives
(intermediation activities).
We also use credit derivatives to hedge counterparty
exposure associated with investing and lending activities.
Some of these hedges qualify as credit risk mitigants for
regulatory capital purposes using the PD and LGD
substitution approach (and subject to the regulatory haircuts
for maturity and currency mismatch where applicable).
Where the aggregate notional of credit derivative hedges is
less than the notional loan exposure to the obligor, the
substitution approach is only employed for the percentage of
loan exposure covered by eligible credit derivatives.
For further information regarding the firm’s credit
derivative transactions, see “Note 7. Derivatives and
Hedging Activities” in Part II, Item 8 “Financial Statements
and Supplementary Data” in the firm’s 2016 Form 10-K.
For information regarding credit risk concentrations, see
“Note 26. Credit Concentrations” in Part II, Item 8
“Financial Statements and Supplementary Data” in the
firm’s 2016 Form 10-K.
Wrong-way Risk
We seek to minimise exposures where there is a significant
positive correlation between the creditworthiness of our
counterparties and the market value of the collateral we
receive, which is known as “wrong-way risk”. Wrong-way
risk is commonly categorised into two types: specific
wrong-way risk and general wrong-way risk. We categorise
exposure as specific wrong-way risk when our counterparty
and the issuer of the reference asset of the transaction are
the same entity or are affiliates, or if the collateral
supporting a transaction is issued by the counterparty or its
affiliates. General wrong-way risk arises when there is a
significant positive correlation between the probability of
default of a counterparty and general market risk factors
affecting the exposure to that counterparty. We have
procedures in place to actively monitor and control specific
and general wrong-way risk, beginning at the inception of a
transaction and continuing through its life, including
assessing the level of risk through stress tests. We ensure
that material wrong-way risk is mitigated using collateral
agreements or increases to initial margin, where appropriate.
Credit Valuation Adjustment Risk-Weighted Assets
RWAs for CVA address the risk of losses related to changes
in counterparty credit risk arising from market-based credit
spreads and from the EE of OTC derivatives with those
counterparties. We calculate RWAs for CVA primarily
using the Advanced CVA approach set out in CRD IV,
which permits the use of regulator approved VaR models.
Consistent with our Regulatory VaR calculation (see
“Market Risk” for further details), the CVA RWAs are
calculated at a 99% confidence level over a 10-day time
horizon. The CVA RWAs also include a Stressed CVA
component, which is also calculated at a 99% confidence
level over a 10-day horizon using both a stressed VaR
period and stressed EEs. The CVA VaR model estimates the
impact on our credit valuation adjustments from simulated
changes to our counterparties’ credit spreads. It reflects
eligible CVA hedges (as defined in CRD IV), but it
excludes those hedges that, although used for risk-
management purposes, are ineligible for inclusion in the
regulatory CVA VaR model. Examples of such excluded
hedges are interest rate hedges, or those that do not
reference the specific exposures they are intended to
mitigate, but are nevertheless highly correlated to the
underlying credit risk.

GOLDMAN SACHS GROUP UK LIMITED
Pillar 3 Disclosures
December 2016 | Pillar 3 Disclosures 17
Other Credit Risk-Weighted Assets
Credit RWAs also include the following components:
Cleared Transactions
RWAs for cleared transactions and default fund
contributions (defined as payments made by clearing
members to central clearing agencies pursuant to mutualised
loss arrangements) are calculated based on specific rules
within CRD IV. A majority of our exposures on centrally
cleared transactions are to counterparties that are considered
to be Qualifying Central Counterparties (QCCPs) in
accordance with the European Market Infrastructure
Regulation (EMIR). CRD IV includes a transitional rule
which allows all CCPs applying for authorisation or
recognition under EMIR to be treated as QCCPs. The
European Commission has adopted an implementing act that
extends the transitional phase to June 15, 2017. Such
exposures arise from OTC derivatives, exchange-traded
derivatives, securities financing transactions and long
settlement transactions and are required to be risk weighted
at either 2% or 4% based on the specified criteria.
Retail Exposures
As of December 31, 2016, we did not have any retail
exposures (defined as residential mortgage exposures,
qualifying revolving exposures, or other retail exposures
that are managed as part of a segment of exposures with
homogeneous risk characteristics, not on an individual
exposure basis).
Other Assets
Other assets primarily include property, leasehold
improvements and equipment, deferred tax assets, and assets
for which there is no defined capital methodology or that are
not material. RWAs for other assets are generally based on
the carrying value plus a percentage of the notional amount
of off-balance-sheet exposures, and are typically risk
weighted at 100%.
Equity Exposures in the Banking Book
The firm makes direct investments in public and private
equity securities; it also makes investments, through funds
that it manages (some of which are consolidated), in debt
securities and loans, public and private equity securities and
real estate entities. These investments are typically longer-
term in nature and are primarily held for capital appreciation
purposes; they are therefore classified for regulatory capital
purposes as banking book equity investments. The firm also
makes commitments to invest, primarily in private equity,
real estate and other assets. Such commitments are made
both directly and through funds that the firm raises and
manages. Equity exposures held in GSGUK’s banking book
are included in the Credit RWAs in Table 5 and were not
material as of December 31, 2016.

GOLDMAN SACHS GROUP UK LIMITED
Pillar 3 Disclosures
December 2016 | Pillar 3 Disclosures 18
Securitisations
Overview
CRD IV defines certain activities as securitisation
transactions which attract capital requirements under the
“Securitisation Framework.” Under CRD IV rules, a
securitisation is defined as a transaction or scheme, whereby
the credit risk associated with an exposure or pool of
exposures is tranched, having both of the following
characteristics:
Payments in the transaction or scheme are dependent
upon the performance of the exposure or pool of
exposures; and
The subordination of tranches determines the
distribution of losses during the ongoing life of the
transaction or scheme.
The rules also distinguish between traditional and synthetic
securitisations, the primary difference being that a
traditional securitisation involves the transfer of assets from
a bank’s balance sheet into a securitisation vehicle, whereas
a synthetic securitisation involves the transfer of credit risk
through credit derivatives or guarantees.
Within the GSGUK group, we securitise commercial
mortgages, loans and other types of financial assets by
selling these assets to securitisation vehicles (e.g., trusts and
special purpose vehicles). GSGUK acts as underwriter of
the beneficial interests that are sold to investors.
Beneficial interests issued by securitisation entities are debt
or equity securities that give the investors rights to receive
all or portions of specified cash inflows to a securitisation
vehicle and include senior and subordinated interests in
principal, interest and/or other cash inflows. The proceeds
from the sale of beneficial interests are used to pay the
transferor for the financial assets sold to the securitisation
vehicle or to purchase securities which serve as collateral.
A portion of our positions that meet the regulatory definition
of a securitisation are classified in our trading book, and
capital requirements for these positions are calculated under
the market risk capital rules. However, we also have certain
banking book positions that meet the regulatory definition
of a securitisation.
Banking Book Activity
Within the banking book, GSGUK did not originate, or
sponsor, any new securitisations in 2016 and exposures
classified in the banking book were not material as of
December 31, 2016.
The small amount of securitisation exposures in the banking
book within the GSGUK group that meet the regulatory
definition of a securitisation fall into the following
categories:
Warehouse Financing and Lending. We provide
financing to clients who warehouse financial assets.
These arrangements are secured by the warehoused
assets, primarily consisting of corporate loans and
commercial mortgage loans.
Other. We have certain other banking book
securitisation activities such as holding securities issued
by securitisation vehicles.
By engaging in the banking book securitisation activities
noted above, we are primarily exposed to credit risk and to
the performance of the underlying assets.
Trading Book Activity
Our securitisation exposures classified as trading book
comprise mortgage-backed securities (MBS) and other
asset-backed securities (ABS), derivatives referencing MBS
or ABS, or derivatives referencing indices of MBS or ABS,
which are held in inventory. The population also includes
credit correlation positions, which are discussed in the
“Comprehensive Risk” section of the “Market Risk”
chapter.
The primary risks included in beneficial interests and other
interests from our involvement with securitisation vehicles
are the performance of the underlying collateral, the position
of our investment in the capital structure of the
securitisation vehicle and the market yield for the security.
These interests are accounted for at fair value and are
incorporated into the overall risk management approach for
financial instruments. For a detailed discussion of the firm’s
risk management process and practices, see “Risk
Management – Market Risk Management” and “Risk
Management – Credit Risk Management” in Part II, Item 7
“Management’s Discussion and Analysis of Financial
Condition and Results of Operations” in the firm’s 2016
Form 10-K.

GOLDMAN SACHS GROUP UK LIMITED
Pillar 3 Disclosures
December 2016 | Pillar 3 Disclosures 19
Calculation of Risk-Weighted Assets
Under the Ratings Based Approach (RBA), the risk
weighted exposure amount of a rated securitisation position
or resecuritisation position is calculated by applying to the
exposure value a risk weight that depends on the associated
external credit rating. The External Credit Assessment
Institutions (ECAIs) used are S&P, Moody’s and Fitch for
all types of exposures.
The RWAs for trading book securitisation positions are
calculated by multiplying the exposure amount by the
specific risk-weighting factors assigned and then
multiplying by the specified regulatory factor of 1.06. The
exposure amount is defined as the carrying value for
securities, or the market value of the effective notional of
the instrument or indices underlying derivative positions.
The securitisation capital requirements are capped at the
maximum loss that could be incurred on any given
transaction.
RWAs for banking book securitisation exposures (including
counterparty credit risk exposures that arise from trading
book derivative positions) are calculated using the RBA
capped at the maximum amount that could be lost on the
position.
The tables below show our securitisation exposures in the
trading book by type of exposure and risk weight band as of
December 31, 2016.
Table 13: Securitisation Exposures by Type
$ in millions As of December 2016
On-balance-sheet
Exposures
Off-balance-sheet
Exposures
Total Exposure
Amount Traditional Synthetic
Residential mortgages $ 364 $ 956 $ 1,320
Commercial mortgages 273 - 273
Corporates 2 2,137 2,139
Asset-backed and other 628 4,441 5,069
GSGUK Total $ 1,267 $ 7,534 $ 8,801
Table 14: Securitisation Exposures and Related RWAs by Risk Weight Bands
$ in millions As of December 2016
Ratings Based Approach (RBA)
Long Exposure
Amount
Short Exposure
Amount
Total
RWAs
0% - 25% $ 2,214 $ 1,162 $ 795
26% - 100% 666 423 713
101% - 250% 65 - 327
251% - 650% 112 - 657
651% - 1,250% 534 3,625 7,397
GSGUK Total $ 3,591 $ 5,210 $ 9,889
We account for a securitisation as a sale when we have
relinquished control over the transferred assets. Prior to
securitisation, we account for assets pending transfer at fair
value and therefore do not typically recognise significant
gains or losses upon the transfer of assets. GSGUK did not,
as of December 31, 2016 have material assets held with the
intent to securitise.
GOLDMAN SACHS GROUP UK LIMITED
Pillar 3 Disclosures
December 2016 | Pillar 3 Disclosures 20
Market Risk
Overview
Market risk is the risk of loss in the value of inventory, as
well as certain other financial assets and financial liabilities,
due to changes in market conditions. Categories of market
risk include the following:
Interest rate risk: results from exposures to changes in
the level, slope and curvature of yield curves, the
volatilities of interest rates, mortgage prepayment
speeds and credit spreads;
Equity price risk: results from exposures to changes
in prices and volatilities of individual equities,
baskets of equities and equity indices;
Currency rate risk: results from exposures to changes
in spot prices, forward prices and volatilities of
currency rates; and
Commodity price risk: results from exposures to
changes in spot prices, forward prices and volatilities of
commodities, such as crude oil, petroleum products,
natural gas, electricity, and precious and base metals.
Market Risk Management, which is independent of the
revenue-producing units and reports to the firm’s chief risk
officer, has primary responsibility for assessing, monitoring
and managing market risk. The firm monitors and controls
risks through strong firmwide oversight and independent
control and support functions across global businesses.
Managers in revenue-producing units and Market Risk
Management discuss market information, positions and
estimated risk and loss scenarios on an ongoing basis.
Managers in revenue-producing units are accountable for
managing risk within prescribed limits. These managers
have in-depth knowledge of their positions, markets and the
instruments available to hedge their exposures.
Market Risk Management Process
The firm manages market risk by diversifying exposures,
controlling position sizes and establishing economic hedges
in related securities or derivatives. This process includes:
Accurate and timely exposure information
incorporating multiple risk metrics;
A dynamic limit setting framework; and
Constant communication among revenue-producing
units, risk managers and senior management.
Market Risk Management produces risk measures and
monitors them against established market risk limits. These
measures reflect an extensive range of scenarios and the
results are aggregated at product, business and firmwide
levels. For additional information regarding the firm’s
market risk measures and risk limits, see “Risk Management
– Market Risk Management” in Part II, Item 7
“Management’s Discussion and Analysis of Financial
Condition and Results of Operations” in the firm’s 2016
Form 10-K.
Market Risk-Weighted Assets
Trading book positions are subject to market risk capital
requirements which are designed to cover the risk of loss in
value of these positions due to changes in market
conditions. These capital requirements are determined either
by applying prescribed risk weighting factors, or they are
based on internal models which are subject to various
qualitative and quantitative parameters. The CRD IV market
risk capital rules require that a firm obtains prior written
permission from its regulators before using any internal
model to calculate its risk-based capital requirement. As our
permission applies to GSI and GSIB separately, we calculate
model-based requirements as the sum across those entities.
RWAs for market risk are calculated based on measures of
exposure which include the following internal models:
Value-at-Risk (VaR), Stressed VaR (SVaR), Incremental
Risk Charge (IRC), and Comprehensive Risk Measure
(CRM), which for PRA purposes is called the All Price Risk
Measure (APRM) and is subject to a floor. In addition,
Standardised Rules, in accordance with Title IV of Part
Three of CRD IV, are used to compute RWAs for market
risk for certain securitised and non-securitised positions by
applying risk-weighting factors predetermined by
regulators, to positions after applicable netting is performed.
RWAs for market risk are the sum of each of these measures
multiplied by 12.5.

GOLDMAN SACHS GROUP UK LIMITED
Pillar 3 Disclosures
December 2016 | Pillar 3 Disclosures 21
Table 15: Market Risk Capital Requirement
$ in millions As of December 2016
GSGUK GSI GSIB
Regulatory VaR1 $ 621 $ 572 $ 49
Stressed VaR1 2,120 1,962 158
Incremental Risk Charge 1,005 851 154
Comprehensive Risk Measure 178 178 -
Model-Based Rules $ 3,924 $ 3,563 $ 361
Interest Rate Risk 1,172 1,172 -
Equity Risk 306 306 -
Collective Investment Scheme Risk 68 68 -
Commodity Risk 131 86 -
Foreign Exchange Risk 292 203 35
Standardised Rules $ 1,969 $ 1,835 $ 35
Securitisation 791 $ 791 $ -
Total Market Risk Capital Requirement $ 6,684 $ 6,189 $ 396
1. Regulatory VaR is subject to a regulatory multiplier that is set at a
minimum of three and can be increased up to four, depending
upon the number of backtesting exceptions. See “Regulatory VaR
Backtesting Results.” This result is further multiplied by 12.5 to
convert into RWAs. The figures include Risks not in VaR.
Regulatory VaR
VaR is the potential loss in value of inventory positions, as
well as certain other financial assets and financial liabilities,
due to adverse market movements over a defined time
horizon with a specified confidence level. The VaR model
captures risks including interest rates, equity prices,
currency rates and commodity prices. As such, VaR
facilitates comparison across portfolios of different risk
characteristics. VaR also captures the diversification of
aggregated risk at the firmwide level.
For both risk management purposes (positions subject to
VaR limits) and regulatory capital calculations we use a
single VaR model. However, VaR used for regulatory
capital requirements (Regulatory VaR) differs from risk
management VaR due to different time horizons and
confidence levels (10-day and 99% for Regulatory VaR vs.
one-day and 95% for risk management VaR), as well as
differences in the scope of positions on which VaR is
calculated.
In accordance with the CRD IV market risk regulatory
capital requirements, we evaluate the accuracy of our VaR
model through daily backtesting. The results of the
backtesting determine the size of the VaR multiplier used to
compute RWAs.
The table below presents by risk category our period-end,
high, low and mean of the daily GSGUK 99% one day
Regulatory VaR.
Table 16: Product Category VaR
$ in millions As of
December 2016 Year Ended
December 2016
High Low Mean
GSGUK $ 465 $ 526 $ 402 $ 473
Interest rates 435 455 347 410
Equity prices 214 246 196 227
Currency rates 107 174 101 131
Commodity prices 26 26 11 17
Diversification 1 $ (317)
1. Diversification in the table above represents the difference
between total VaR and the sum of the VaRs for the four risk
categories. This effect arises because the four market risk
categories are not perfectly correlated.
Stressed VaR
SVaR is the potential loss in value of inventory positions, as
well as certain other financial assets and financial liabilities,
during a period of significant market stress. SVaR is
calculated at a 99% confidence level over a 10-day horizon
using market data inputs from a continuous 12-month period
of stress. We identify the stressed period by comparing VaR
using market data inputs from different historical periods.
The table below presents our period-end, high, low and
mean of the average weekly SVaR for the year ended
December 2016. Average, per the market risk regulatory
capital requirements, is determined based on the average
weekly amount for the preceding 12 weeks.
Table 17: Stressed VaR
$ in millions As of
December 2016 Year Ended
December 2016
GSGUK High Low Mean
SVaR $ 467 $ 486 $ 330 $ 413
SVaR x Multiplier 1,4011
RWAs $ 17,515
1. SVaR is subject to the same regulatory multiplier used for
Regulatory VaR and is further multiplied by 12.5 to convert into
RWAs

GOLDMAN SACHS GROUP UK LIMITED
Pillar 3 Disclosures
December 2016 | Pillar 3 Disclosures 22
Incremental Risk
Incremental risk is the potential loss in value of non-
securitised inventory positions due to the default or credit
migration of issuers of financial instruments over a one-
year time horizon. As required by the CRD IV market risk
regulatory capital rules, this measure is calculated at a
99.9% confidence level over a one-year time horizon. It
uses a multi-factor model assuming a constant level of
risk. When assessing the risk, we take into account
market and issuer-specific concentration, credit quality,
liquidity horizons and correlation of default and migration
risk. The liquidity horizon is calculated based upon the size
of exposures and the speed at which we can reduce risk by
hedging or unwinding positions, given our experience
during a historical stress period, and is subject to the
prescribed regulatory minimum. Our average liquidity
horizon as of December 31, 2016 was 3.3 months.
The table below presents our period-end, high, low and
mean of the maximum of the average weekly Incremental
risk measure or the point-in-time measure. Average, per
the market risk regulatory capital requirements, is
determined based on the average weekly amount over the
preceding 12 weeks.
Table 18: Incremental Risk
$ in millions As of
December 2016 Year Ended
December 2016
GSGUK High Low Mean
Incremental Risk $ 1,0051 $ 1,242 $ 712 $ 924
RWAs $ 12,562
1. In order to convert the results of Incremental risk into RWAs, it is multiplied
by 12.5.
Comprehensive Risk
Comprehensive risk is the potential loss in value, due to
price risk and defaults, within our credit correlation
positions. A credit correlation position is defined as a
securitisation position for which all or substantially all of
the value of the underlying exposures is based on the credit
quality of a single company for which a two-way market
exists, or indices based on such exposures for which a two-
way market exists, or hedges of these positions (which are
typically not securitisation positions).
As required under the CRD IV market risk capital rules, the
Comprehensive Risk Measure comprises a model-based
measure, which is subject to a floor based on the minimum
capital requirement of 8% of RWA calculated under the
standard rules for the portfolio. The model-based measure is
calculated at a 99.9% confidence level over a one-year time
horizon applying a constant level of risk. The model
comprehensively covers price risks including nonlinear
price effects and takes into account contractual structure of
cash flows, the effect of multiple defaults, credit spread risk,
volatility of implied correlation, recovery rate volatility and
basis risk. The liquidity horizon is based upon our
experience during a historical stress period, subject to the
prescribed regulatory minimum.
As of December 2016, we had credit correlation positions,
subject to the Comprehensive Risk Measure, with a fair
value under US GAAP of $1 million in net assets and $132
million in net liabilities and under UK GAAP of $406
million in net assets and $266 million in net liabilities.
The table below presents our period-end, high, low and
mean of the maximum of the average weekly
Comprehensive risk measure or the point-in-time measure,
inclusive of both modeled and non-modeled components for
the year ended December 2016. Average, per the market
risk regulatory capital requirements, is determined based on
the average weekly amount for the preceding 12 weeks.
Table 19: Comprehensive Risk
$ in millions As of
December 2016 Year End
December 2016
GSGUK High Low Mean
Comprehensive Risk $ 1781 $ 314 $ 157 $ 222
RWAs 2,223
1. In order to convert the Comprehensive risk measure into RWAs, it is
multiplied by 12.5.
Model Review and Validation
The models discussed above, which are used to determine
Regulatory VaR, SVaR, Incremental risk and
Comprehensive risk, are subject to independent review and
validation by Model Risk Management. For more
information, see “Model Risk Management.”
These models are regularly reviewed and enhanced in order
to incorporate changes in the composition of positions
included in market risk measures, as well as variations in
market conditions. Prior to implementing significant
changes to our assumptions and/or models, Model Risk
Management performs model validations. Significant
changes to models are reviewed with the firm’s chief risk
officer and chief financial officer, and approved by the
Firmwide Risk Committee.

GOLDMAN SACHS GROUP UK LIMITED
Pillar 3 Disclosures
December 2016 | Pillar 3 Disclosures 23
Regulatory VaR Backtesting Results
As required by the CRD IV market risk capital rules, we
validate the accuracy of our Regulatory VaR models by
backtesting the output of such models against daily loss
results. The number of exceptions (that is, the number of
overshootings based on comparing the higher of positional or
actual losses to the corresponding 99% one-day Regulatory
VaR) over the most recent 250 business days is used to
determine the size of the VaR multiplier, which could
increase from a minimum of three to a maximum of four,
depending on the number of exceptions.
As defined in the CRD IV market risk capital rules,
positional net revenues for any given day represent the
impact of that day’s price variation on the value of
positions held at the close of business the previous day. As
a consequence, these results exclude certain revenues
associated with market-making businesses, such as
bid/offer net revenues, which by their nature are more
likely than not to be positive. In addition, positional net
revenues used in our Regulatory VaR backtesting relate
only to positions which are included in Regulatory VaR
and, as noted above, differ from positions included in our
risk management VaR. This measure of positional net
revenues is used to evaluate the performance of the
Regulatory VaR model and is not comparable to our actual
daily trading net revenues. See “Risk Management —
Market Risk Management” in Part II, Item 7
“Management’s Discussion and Analysis of Financial
Condition and Results of Operations” in the firm’s
2016 Form 10-K.
Overall the backtesting results were within the expected
threshold over the year. For GSI, there was no change in the
VaR multiplier used to calculate Market RWAs and for
GSIB this multiplier ranged between 3 and 3.5. Note that,
although a one-day time horizon is used for backtesting
purposes, a 10-day time horizon is used, as described
earlier, to determine RWAs associated with Regulatory
VaR.
Stress Testing
Stress testing is a method of determining the effect of
various hypothetical stress scenarios on the firm and GSI
and GSIB individually. We use stress testing to examine
risks of specific portfolios as well as the potential impact of
significant risk exposures across GSI and GSIB. We use a
variety of stress testing techniques to calculate the potential
loss from a wide range of market moves on our portfolios,
including sensitivity analysis, scenario analysis and
firmwide stress tests.
For a detailed description of the firm’s stress testing
practices, see “Risk Management – Market Risk
Management – Market Risk Management Process – Stress
Testing” in Part II, Item 7 “Management’s Discussion and
Analysis of Financial Condition and Results of Operations”
in the firm’s 2016 10-K.
Specific Risk
The standard specific risk add-on for debt positions ranges
from 0.25% to 12%, other than for certain sovereign and
supranational positions which have a 0% add-on. The add-
on for sovereigns, public sector entities, depository
institutions and corporate entities that have issued public
financial instruments is based on the public credit ratings
and the remaining contractual maturity of the position. All
other types of debt positions are subject to an 8% add-on.
The standard specific risk add-on for equity positions will
generally be 8%, but this could decrease to 2% for well-
diversified portfolios of equities, certain indices, and certain
futures-related arbitrage strategies.
The standard specific risk RWAs for debt and equity
positions are calculated by multiplying the exposure amount
by the appropriate standard specific risk add-on, and then
multiplying by 12.5. The exposure amount is defined as the
carrying value for securities and loans, or the market value
of the effective notional of the instrument or indices
underlying derivative positions. The specific risk capital
requirements are capped at the maximum loss that could be
incurred on any given position.
Table 20: Specific Risk
$ in millions As of December
2016
Securitisation positions1 $ 9,889
Other specific risk positions2
11,826
Specific Risk Total $ 21,715
1. Securitisations in the above table represent positions outside the
correlation trading portfolio subject to the RBA.
2. Other positions include Debt, Equity and Collective Investment
Securities.

GOLDMAN SACHS GROUP UK LIMITED
Pillar 3 Disclosures
December 2016 | Pillar 3 Disclosures 24
Operational Risk
Overview
Operational risk is the risk of loss resulting from inadequate
or failed internal processes, people and systems or from
external events. The firm’s exposure to operational risk
arises from routine processing errors as well as
extraordinary incidents, such as major systems failures or
legal and regulatory matters.
Potential types of loss events related to internal and external
operational risk include:
Clients, products and business practices;
Execution, delivery and process management;
Business disruption and system failures;
Employment practices and workplace safety;
Damage to physical assets;
Internal fraud; and
External fraud
The firm maintains a comprehensive control framework
designed to provide a well-controlled environment to
minimise operational risks. The Firmwide Operational Risk
Committee, along with the EMEA Operational Risk
Committee, provide oversight of the ongoing development
and implementation of operational risk policies and
framework. Operational Risk Management is a risk
management function independent of revenue-producing
units, reports to the firm’s chief risk officer, and is
responsible for developing and implementing policies,
methodologies and a formalised framework for operational
risk management with the goal of minimising the exposure
to operational risk.
Operational Risk Management Process
Managing operational risk requires timely and accurate
information as well as a strong control culture. The firm
seeks to manage its operational risk through:
Training, supervision and development of people;
Active participation of senior management in
identifying and mitigating key operational risks across
the firm;
Independent control and support functions that monitor
operational risk on a daily basis, and implementation of
extensive policies, procedures and controls designed to
prevent the occurrence of operational risk events;
Proactive communication between revenue-producing
units and the firm’s independent control and support
functions; and
A network of systems to facilitate the collection of data
used to analyse and assess operational risk exposure.
The firm combines top-down and bottom-up approaches to
manage and measure operational risk. From a top-down
perspective, senior management assesses firmwide and
business-level operational risk profiles. From a bottom-up
perspective, revenue-producing units and independent
control and support functions are responsible for risk
identification and risk management on a day-to-day basis,
including escalating operational risks to senior management.
The firm’s operational risk management framework has
evolved based on the changing needs of its businesses and
regulatory guidance. The framework comprises the
following practices:
Risk identification and assessment;
Risk measurement; and
Risk monitoring and reporting.
Internal Audit performs an independent review of the firm’s
operational risk framework, including key controls,
processes and applications, on an annual basis to assess the
effectiveness of the framework.

GOLDMAN SACHS GROUP UK LIMITED
Pillar 3 Disclosures
December 2016 | Pillar 3 Disclosures 25
Risk Identification and Assessment
The core of the firm’s operational risk management
framework is risk identification and assessment. The firm
has a comprehensive data collection process, including
firmwide policies and procedures, for operational risk
events.
The firm has established policies that require revenue-
producing units and independent control and support
functions to report and escalate operational risk events.
When operational risk events are identified, the policies
require that the events be documented and analysed to
determine whether changes are required in systems and/or
processes to further mitigate the risk of future events.
In addition, the firmwide systems capture internal
operational risk event data, key metrics such as transaction
volumes, and statistical information such as performance
trends. The firm use an internally developed operational risk
management application to aggregate and organise this
information. One of our key risk identification and
assessment tools is an operational risk and control self-
assessment process which is performed by managers from
both revenue-producing units and independent control and
support functions. This process consists of the identification
and rating of operational risks, on a forward-looking basis,
and the related controls. The results from this process are
analysed to evaluate operational risk exposures and identify
businesses, activities or products with heightened levels of
operational risk.
Risk Measurement
The firm measures operational risk exposure over a twelve-
month time horizon using both statistical modeling and
scenario analyses through a Scenario Based Approach
(SBA), which involves qualitative assessments of the
frequency and extent of potential operational risk losses, for
each of our businesses. Operational risk measurement
incorporates qualitative and quantitative assessments of
factors including:
Internal and external operational risk event data;
Assessments of internal controls;
Evaluations of the complexity of business activities;
The degree of and potential for automation in
processes;
New product information;
The legal and regulatory environment;
Changes in the markets for products and services,
including the diversity and sophistication of customers
and counterparties; and
Liquidity of the capital markets and the reliability of the
infrastructure that supports the capital markets.
The results from these scenario analyses are used to monitor
changes in operational risk and to determine business lines
that may have heightened exposure to operational risk.
These analyses ultimately are used in the determination of
the appropriate level of operational risk capital to hold.
Risk Monitoring and Reporting
The firm evaluates changes in the operational risk profile of
businesses, including changes in business mix or
jurisdictions in which the firm operates, by monitoring the
factors noted above. The firm has both preventive and
detective internal controls, which are designed to reduce the
frequency and severity of operational risk losses and the
probability of operational risk events. The firm monitors the
results of assessments and independent internal audits of
these internal controls.
The SBA model which is used to calculate the operational
risk capital requirement is subject to review and validation
by Model Risk Management. For additional information, see
“Model Risk Management”.
Capital Requirements
The consolidated operational risk capital requirements for
GSGUK are currently calculated under the Standardised
Approach in accordance with CRD IV. GSI also follows this
method. GSIB applies the Basic Indicator Approach in
accordance with CRD IV.
Table 21: Operational Risk Capital Requirement
$ in millions As of December 2016
GSGUK GSI GSIB
Standardised Approach $ 1,155 $ 1,064 -
Basic Indicator Approach - - $ 26

GOLDMAN SACHS GROUP UK LIMITED
Pillar 3 Disclosures
December 2016 | Pillar 3 Disclosures 26
Model Risk Management
Overview
Model risk is the potential for adverse consequences from
decisions made based on model outputs that may be
incorrect or used inappropriately. The firm relies on
quantitative models across business activities primarily to
value certain financial assets and liabilities, to monitor and
manage risk, and to measure and monitor regulatory capital.
The firm’s model risk management framework is managed
through a governance structure and risk management
controls, which encompass standards designed to ensure we
maintain a comprehensive model inventory, including risk
assessment and classification, sound model development
practices, independent review and model-specific usage
controls. The Firmwide Risk Committee and the Firmwide
Model Risk Control Committee oversee the model risk
management framework. Model Risk Management, which is
independent of model developers, model owners and model
users, reports to the firm’s chief risk officer, is responsible
for identifying and reporting significant risks associated
with models, and provides periodic updates to senior
management, risk committees and the Risk Committee of
the GS Board. GSGUK’s framework for managing model
risk is consistent with and part of GS Group’s framework.
Model Review and Validation
Model Risk Management consists of quantitative
professionals who perform an independent review,
validation and approval of the firm’s models. This review
includes an analysis of the model documentation,
independent testing, an assessment of the appropriateness of
the methodology used, and verification of compliance with
model development and implementation standards. Model
Risk Management reviews all existing models on an annual
basis, as well as new models or significant changes to
models.
The model validation process incorporates a review of
models and trade and risk parameters across a broad range
of scenarios (including extreme conditions) in order to
critically evaluate and verify:
The model’s conceptual soundness, including the
reasonableness of model assumptions, and suitability
for intended use;
The testing strategy utilised by the model developers to
ensure that the models function as intended;
The suitability of the calculation techniques
incorporated in the model;
The model’s accuracy in reflecting the characteristics of
the related product and its significant risks;
The model’s consistency with models for similar
products; and
The model’s sensitivity to input parameters and
assumptions.
For more information regarding the use of models within
these areas, see “Critical Accounting Policies – Fair Value –
Review of Valuation Models,” “Risk Management –
Liquidity Risk Management,” “Risk Management – Market
Risk Management,” “Risk Management – Credit Risk
Management” and “Risk Management – Operational Risk
Management” in Part II, Item 7 “Management’s Discussion
and Analysis of Financial Condition and Results of
Operations” in the firm’s 2016 Form 10-K and “Credit
Risk,” “Market Risk,” and “Operational Risk” in this
document
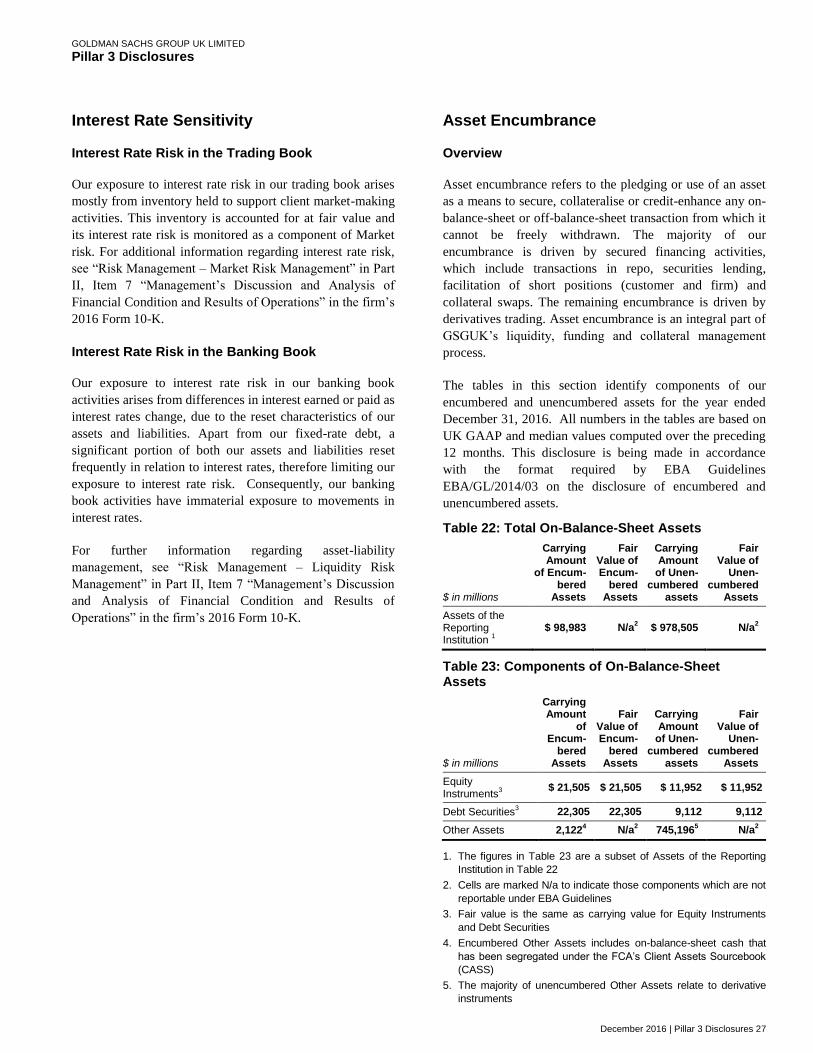
GOLDMAN SACHS GROUP UK LIMITED
Pillar 3 Disclosures
December 2016 | Pillar 3 Disclosures 27
Interest Rate Sensitivity
Interest Rate Risk in the Trading Book
Our exposure to interest rate risk in our trading book arises
mostly from inventory held to support client market-making
activities. This inventory is accounted for at fair value and
its interest rate risk is monitored as a component of Market
risk. For additional information regarding interest rate risk,
see “Risk Management – Market Risk Management” in Part
II, Item 7 “Management’s Discussion and Analysis of
Financial Condition and Results of Operations” in the firm’s
2016 Form 10-K.
Interest Rate Risk in the Banking Book
Our exposure to interest rate risk in our banking book
activities arises from differences in interest earned or paid as
interest rates change, due to the reset characteristics of our
assets and liabilities. Apart from our fixed-rate debt, a
significant portion of both our assets and liabilities reset
frequently in relation to interest rates, therefore limiting our
exposure to interest rate risk. Consequently, our banking
book activities have immaterial exposure to movements in
interest rates.
For further information regarding asset-liability
management, see “Risk Management – Liquidity Risk
Management” in Part II, Item 7 “Management’s Discussion
and Analysis of Financial Condition and Results of
Operations” in the firm’s 2016 Form 10-K.
Asset Encumbrance
Overview
Asset encumbrance refers to the pledging or use of an asset
as a means to secure, collateralise or credit-enhance any on-
balance-sheet or off-balance-sheet transaction from which it
cannot be freely withdrawn. The majority of our
encumbrance is driven by secured financing activities,
which include transactions in repo, securities lending,
facilitation of short positions (customer and firm) and
collateral swaps. The remaining encumbrance is driven by
derivatives trading. Asset encumbrance is an integral part of
GSGUK’s liquidity, funding and collateral management
process.
The tables in this section identify components of our
encumbered and unencumbered assets for the year ended
December 31, 2016. All numbers in the tables are based on
UK GAAP and median values computed over the preceding
12 months. This disclosure is being made in accordance
with the format required by EBA Guidelines
EBA/GL/2014/03 on the disclosure of encumbered and
unencumbered assets.
Table 22: Total On-Balance-Sheet Assets
$ in millions
Carrying Amount
of Encum-bered
Assets
Fair Value of Encum-
bered Assets
Carrying Amount
of Unen-cumbered
assets
Fair Value of
Unen-cumbered
Assets
Assets of the Reporting Institution
1
$ 98,983 N/a2 $ 978,505 N/a
2
Table 23: Components of On-Balance-Sheet Assets
$ in millions
Carrying Amount
of Encum-
bered Assets
Fair Value of Encum-
bered Assets
Carrying Amount
of Unen-cumbered
assets
Fair Value of
Unen-cumbered
Assets
Equity Instruments
3
$ 21,505 $ 21,505 $ 11,952 $ 11,952
Debt Securities3 22,305 22,305 9,112 9,112
Other Assets 2,1224 N/a
2 745,196
5 N/a
2
1. The figures in Table 23 are a subset of Assets of the Reporting
Institution in Table 22
2. Cells are marked N/a to indicate those components which are not
reportable under EBA Guidelines
3. Fair value is the same as carrying value for Equity Instruments
and Debt Securities
4. Encumbered Other Assets includes on-balance-sheet cash that
has been segregated under the FCA’s Client Assets Sourcebook
(CASS)
5. The majority of unencumbered Other Assets relate to derivative
instruments
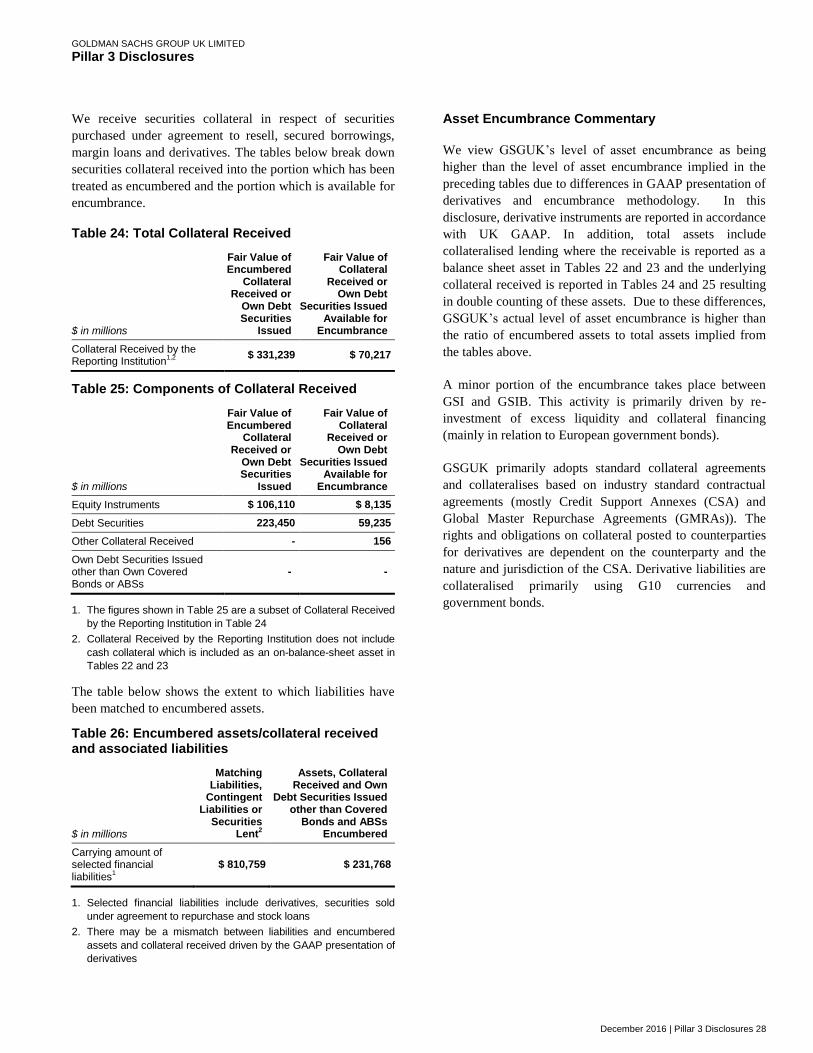
GOLDMAN SACHS GROUP UK LIMITED
Pillar 3 Disclosures
December 2016 | Pillar 3 Disclosures 28
We receive securities collateral in respect of securities
purchased under agreement to resell, secured borrowings,
margin loans and derivatives. The tables below break down
securities collateral received into the portion which has been
treated as encumbered and the portion which is available for
encumbrance.
Table 24: Total Collateral Received
$ in millions
Fair Value of Encumbered
Collateral Received or
Own Debt Securities
Issued
Fair Value of Collateral
Received or Own Debt
Securities Issued Available for
Encumbrance
Collateral Received by the Reporting Institution
1,2
$ 331,239 $ 70,217
Table 25: Components of Collateral Received
$ in millions
Fair Value of Encumbered
Collateral Received or
Own Debt Securities
Issued
Fair Value of Collateral
Received or Own Debt
Securities Issued Available for
Encumbrance
Equity Instruments $ 106,110 $ 8,135
Debt Securities 223,450 59,235
Other Collateral Received - 156
Own Debt Securities Issued other than Own Covered Bonds or ABSs
- -
1. The figures shown in Table 25 are a subset of Collateral Received
by the Reporting Institution in Table 24
2. Collateral Received by the Reporting Institution does not include
cash collateral which is included as an on-balance-sheet asset in
Tables 22 and 23
The table below shows the extent to which liabilities have
been matched to encumbered assets.
Table 26: Encumbered assets/collateral received and associated liabilities
$ in millions
Matching Liabilities,
Contingent Liabilities or
Securities Lent
2
Assets, Collateral Received and Own
Debt Securities Issued other than Covered
Bonds and ABSs Encumbered
Carrying amount of selected financial liabilities
1
$ 810,759 $ 231,768
1. Selected financial liabilities include derivatives, securities sold
under agreement to repurchase and stock loans
2. There may be a mismatch between liabilities and encumbered
assets and collateral received driven by the GAAP presentation of
derivatives
Asset Encumbrance Commentary
We view GSGUK’s level of asset encumbrance as being
higher than the level of asset encumbrance implied in the
preceding tables due to differences in GAAP presentation of
derivatives and encumbrance methodology. In this
disclosure, derivative instruments are reported in accordance
with UK GAAP. In addition, total assets include
collateralised lending where the receivable is reported as a
balance sheet asset in Tables 22 and 23 and the underlying
collateral received is reported in Tables 24 and 25 resulting
in double counting of these assets. Due to these differences,
GSGUK’s actual level of asset encumbrance is higher than
the ratio of encumbered assets to total assets implied from
the tables above.
A minor portion of the encumbrance takes place between
GSI and GSIB. This activity is primarily driven by re-
investment of excess liquidity and collateral financing
(mainly in relation to European government bonds).
GSGUK primarily adopts standard collateral agreements
and collateralises based on industry standard contractual
agreements (mostly Credit Support Annexes (CSA) and
Global Master Repurchase Agreements (GMRAs)). The
rights and obligations on collateral posted to counterparties
for derivatives are dependent on the counterparty and the
nature and jurisdiction of the CSA. Derivative liabilities are
collateralised primarily using G10 currencies and
government bonds.

GOLDMAN SACHS GROUP UK LIMITED
Pillar 3 Disclosures
December 2016 | Pillar 3 Disclosures 29
Leverage Ratio
GSGUK is required to monitor and disclose its leverage
ratio using CRD IV’s definition of exposure as amended by
the European Commission Leverage Ratio Delegated Act.
This leverage ratio compares CRD IV’s definition of Tier 1
capital to a measure of leverage exposure, defined as the
sum of assets plus certain off-balance-sheet exposures
(which include a measure of derivatives exposures,
securities financing transactions and commitments), less
Tier 1 capital deductions. Any required minimum ratio is
expected to become effective no earlier than January 1,
2018. This leverage ratio is based on our current
interpretation and understanding of this rule and may evolve
as the interpretation and application of this rule is discussed
with our regulators.
Table 27: Leverage Ratio
$ in millions As of December 2016
GSGUK GSI GSIB
Tier 1 Capital $ 30,470 $ 26,453 $ 2,681
Leverage Ratio Exposure 715,038 697,402 17,262
Leverage Ratio 4.3% 3.8% 15.5%
The following tables present further information on the
leverage ratio. Table 28 reconciles the exposure measure to
the balance sheets of GSGUK, GSI and GSIB. Table 29
breaks down the exposures from on-balance sheet assets by
trading and banking book. Table 30 gives further details on
the adjustments and drivers of the leverage ratio.
Table 28: Summary Reconciliation of Accounting Assets and Leverage Ratio Exposures
$ in millions As of December 2016
GSGUK GSI GSIB
Total assets as per balance sheet $ 941,132 $ 934,322 $ 42,351
Adjustment for entities which are consolidated for accounting purposes but are outside the scope of regulatory consolidation
- - -
Adjustment for fiduciary assets recognised on the balance sheet pursuant to the applicable accounting framework but excluded from the leverage ratio exposure measure in accordance with Article 429(13) of Regulation (EU) No 575/2013 "CRR"
- - -
Adjustments for derivative financial instruments1 (255,103) (254,148) (1,438)
Adjustments for securities financing transactions1 24,148 24,148 -
Adjustment for off-balance sheet items 1 7,600 4,759 2,841
Adjustment for intragroup exposures excluded from the leverage ratio exposure measure in accordance with Article 429 (7) of Regulation (EU) No 575/2013
1
- (9,162) (26,318)
Adjustment for exposures excluded from the leverage ratio exposure measure in accordance with Article 429 (14) of Regulation (EU) No 575/2013
- - -
Other adjustments (2,739) (2,517) (173)
Total leverage ratio exposure $ 715,038 $ 697,402 $ 17,262
1. Differences between the accounting values recognised as assets on the balance sheet and the leverage ratio exposure values. A further
breakdown of these amounts can be found in Table 30.
Table 29: On-Balance Sheet Exposures
$ in millions As of December 2016
GSGUK GSI GSIB
Total on-balance sheet exposures (excluding derivatives, SFTs, and exempted exposures), of which: $ 114,221 $ 105,438 $ 8,066
Trading book exposures $ 84,848 $ 80,964 $ 6,266
Banking book exposures, of which: $ 29,373 $ 24,474 $ 1,800
Covered bonds - - -
Exposures treated as sovereigns 13,221 12,960 250
Exposures to regional governments, MDB, international organisations and PSE not treated as sovereigns - - -
Institutions 4,903 3,910 547
Secured by mortgages of immovable properties - - -
Retail exposures - - -
Corporate 9,450 6,039 985
Exposures in default 164 164 -
Other exposures 1,635 1,401 18
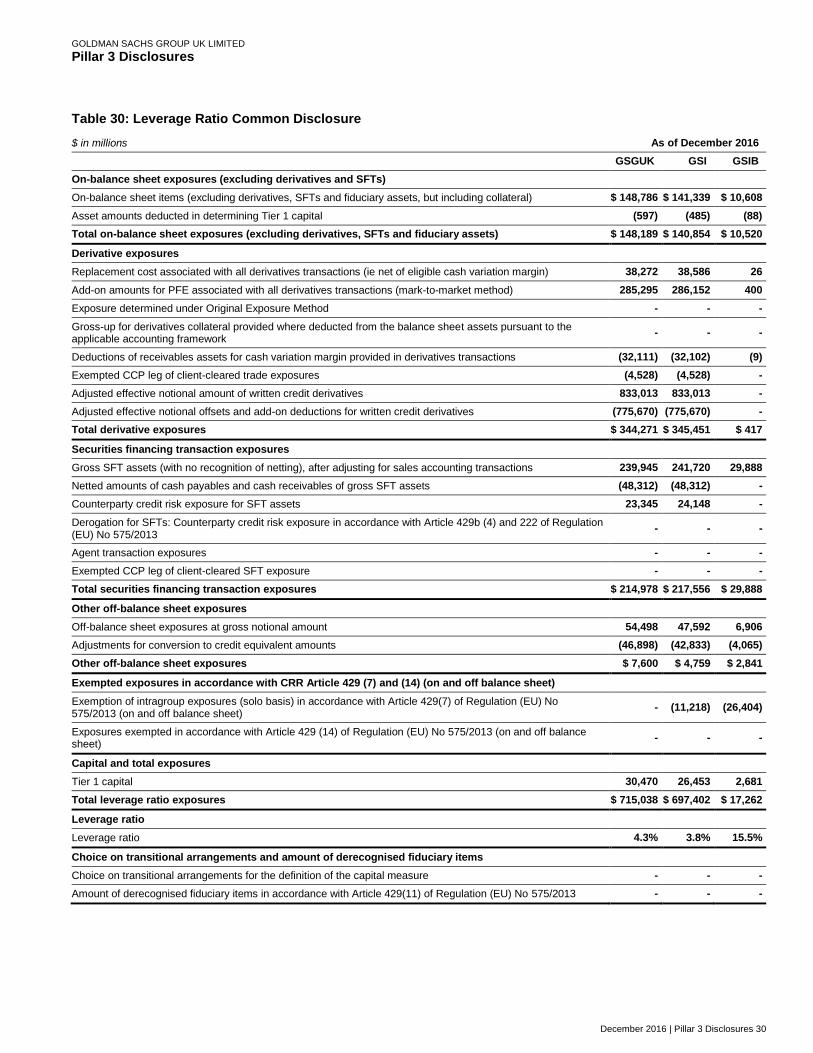
GOLDMAN SACHS GROUP UK LIMITED
Pillar 3 Disclosures
December 2016 | Pillar 3 Disclosures 30
Table 30: Leverage Ratio Common Disclosure
$ in millions As of December 2016
GSGUK GSI GSIB
On-balance sheet exposures (excluding derivatives and SFTs)
On-balance sheet items (excluding derivatives, SFTs and fiduciary assets, but including collateral) $ 148,786 $ 141,339 $ 10,608
Asset amounts deducted in determining Tier 1 capital (597) (485) (88)
Total on-balance sheet exposures (excluding derivatives, SFTs and fiduciary assets) $ 148,189 $ 140,854 $ 10,520
Derivative exposures
Replacement cost associated with all derivatives transactions (ie net of eligible cash variation margin) 38,272 38,586 26
Add-on amounts for PFE associated with all derivatives transactions (mark-to-market method) 285,295 286,152 400
Exposure determined under Original Exposure Method - - -
Gross-up for derivatives collateral provided where deducted from the balance sheet assets pursuant to the applicable accounting framework
- - -
Deductions of receivables assets for cash variation margin provided in derivatives transactions (32,111) (32,102) (9)
Exempted CCP leg of client-cleared trade exposures (4,528) (4,528) -
Adjusted effective notional amount of written credit derivatives 833,013 833,013 -
Adjusted effective notional offsets and add-on deductions for written credit derivatives (775,670) (775,670) -
Total derivative exposures $ 344,271 $ 345,451 $ 417
Securities financing transaction exposures
Gross SFT assets (with no recognition of netting), after adjusting for sales accounting transactions 239,945 241,720 29,888
Netted amounts of cash payables and cash receivables of gross SFT assets (48,312) (48,312) -
Counterparty credit risk exposure for SFT assets 23,345 24,148 -
Derogation for SFTs: Counterparty credit risk exposure in accordance with Article 429b (4) and 222 of Regulation (EU) No 575/2013
- - -
Agent transaction exposures - - -
Exempted CCP leg of client-cleared SFT exposure - - -
Total securities financing transaction exposures $ 214,978 $ 217,556 $ 29,888
Other off-balance sheet exposures
Off-balance sheet exposures at gross notional amount 54,498 47,592 6,906
Adjustments for conversion to credit equivalent amounts (46,898) (42,833) (4,065)
Other off-balance sheet exposures $ 7,600 $ 4,759 $ 2,841
Exempted exposures in accordance with CRR Article 429 (7) and (14) (on and off balance sheet)
Exemption of intragroup exposures (solo basis) in accordance with Article 429(7) of Regulation (EU) No 575/2013 (on and off balance sheet)
- (11,218) (26,404)
Exposures exempted in accordance with Article 429 (14) of Regulation (EU) No 575/2013 (on and off balance sheet)
- - -
Capital and total exposures
Tier 1 capital 30,470 26,453 2,681
Total leverage ratio exposures $ 715,038 $ 697,402 $ 17,262
Leverage ratio
Leverage ratio 4.3% 3.8% 15.5%
Choice on transitional arrangements and amount of derecognised fiduciary items
Choice on transitional arrangements for the definition of the capital measure - - -
Amount of derecognised fiduciary items in accordance with Article 429(11) of Regulation (EU) No 575/2013 - - -

GOLDMAN SACHS GROUP UK LIMITED
Pillar 3 Disclosures
December 2016 | Pillar 3 Disclosures 31
Factors impacting the Leverage Ratio
The leverage ratio has increased over the year from 4.1% on
December 31, 2015 to 4.3% on December 31, 2016. This
was mainly driven by increased capital as a result of profits
made during the year.
Risk of Excessive Leverage
The risk of excessive leverage is the risk resulting from a
vulnerability due to leverage or contingent leverage that
may require unintended corrective measures to our business
plan, including distressed selling of assets which might
result in losses or in valuation adjustments to our remaining
assets.
The GSI and GSIB Asset and Liability Committees (GSI
and GSIB ALCOs) are the primary governance committees
for the management of the UK material subsidiaries’
balance sheets. The GSI and GSIB ALCOs are delegated
specific responsibility by the GSI and GSIB Risk
Committees for maintaining leverage ratios in accordance
with the levels expressed in each entity’s risk appetite
statement.
We monitor the leverage ratio as calculated above and have
processes in place to dynamically manage our assets and
liabilities. These processes include:
Monthly leverage ratio monitoring is conducted for
GSGUK, GSI and GSIB. Leverage ratio monitoring
thresholds have been established for GSI and GSIB and
reported to the respective ALCOs, CROs, CFOs, CEOs,
Risk Committees and Boards depending on size of
movement.
Quarterly leverage ratio planning which combines our
projected leverage ratio assets (on- and off-balance
sheet) and Tier 1 capital of GSGUK, GSI and GSIB.
Potential new transactions which could have a material
impact on GSGUK’s capital and/or leverage position
are escalated to and approved by Controllers, Corporate
Treasury and other managers from independent control
and support functions.
Capital Adequacy
Overview
Capital adequacy is of critical importance to us. We have in
place a comprehensive capital management policy that
provides a framework, defines objectives and establishes
guidelines to assist us in maintaining the appropriate level
and composition of capital in both business-as-usual and
stressed conditions.
We determine the appropriate level and composition of
capital by considering multiple factors including current
and future consolidated regulatory capital requirements, our
Internal Capital Adequacy Assessment Process (ICAAP),
results of stress tests, and other factors such as rating
agency guidelines, subsidiary capital requirements and the
business and financial market environment. We maintain a
capital plan which projects sources and uses of capital given
a range of business environments, and a contingency
capital plan which provides a framework for analysing and
responding to an actual or perceived capital shortfall.
Internal Capital Adequacy Assessment Process
We perform an ICAAP with the objective of ensuring that
GSGUK is appropriately capitalised relative to the risks
in our business. The ICAAP is a comprehensive assessment
of the risks to which we are exposed and covers both the
risks for which we consider capital to be an appropriate
mitigant, and those for which we consider mitigants other
than capital to be appropriate.
As part of our ICAAP, we perform an internal risk-based
capital assessment. We evaluate capital adequacy based on
the result of our internal risk-based capital assessment and
our regulatory capital ratios, supplemented with the results
of stress tests. Stress testing is an integral component of
our ICAAP. It is designed to measure our estimated
performance under various stressed market conditions and
assists us in analysing whether GSGUK holds an
appropriate amount of capital relative to the risks of our
businesses. Our goal is to hold sufficient capital to ensure
we remain adequately capitalised after experiencing a
severe stress event. Our assessment of capital adequacy is
viewed in tandem with our assessment of liquidity
adequacy and is integrated into the overall risk
management structure, governance and policy framework
of the firm. For further details please refer to the ‘Risk
Management’ pages in this document.

GOLDMAN SACHS GROUP UK LIMITED
Pillar 3 Disclosures
December 2016 | Pillar 3 Disclosures 32
Own Funds Transitional Template
The table below presents further information on the detailed
capital position of GSGUK, GSI and GSIB, in accordance
with the format prescribed by the Commission
Implementing Regulation (EU) No 1423/2013.
The amounts shown in this template reflect components of
regulatory capital under both a transitional and fully loaded
basis.
Table 31: Own funds disclosure
$ in millions As of December 2016
GSGUK GSI GSIB
Capital instruments and the related share premium accounts $ 5,323 $ 5,446 $ 2,157
Paid up capital instruments 4,935 582 63
Share premium 388 4,864 2,094
Retained earnings 26,042 22,356 761
Accumulated other comprehensive income (and other reserves, to include unrealised gains and losses under the applicable accounting standards)
(2) (269) 1
Common Equity Tier 1 (CET1) capital before regulatory adjustments $ 31,363 $ 27,533 $ 2,919
Additional value adjustments (376) (323) (2)
Intangible assets (net of related tax liability) (105) (105) -
Negative amounts resulting from the calculation of expected loss amounts (14) (4) (36)
Gains or losses on liabilities valued at fair value resulting from changes in own credit standing (95) (95) (2)
Deferred tax assets (49) - (49)
Defined-benefit pension fund assets (53) (53) -
Non qualifying CET1 capital instruments1 (201) (500) (149)
Total regulatory adjustments to Common equity Tier 1 (CET1) $ (900) $ (1,080) $ (238)
Common Equity Tier 1 (CET1) capital $ 30,470 $ 26,453 $ 2,681
Additional Tier 1 (AT1) capital - - -
Tier 1 capital (T1 = CET1 + AT1) $ 30,470 $ 26,453 $ 2,681
Capital instruments and the related share premium accounts 9,736 8,910 826
Qualifying own funds instruments included in consolidated T2 capital issued by subsidiaries and held by third parties
- - -
Of which: Instruments issued by subsidiaries subject to phase out - - -
Non qualifying T2 capital instruments (115) - (115)
Tier 2 (T2) capital before regulatory adjustments $ 9,621 $ 8,910 $ 711
Tier 2 (T2) capital $ 9,621 $ 8,910 $ 711
Total capital (TC = T1 + T2) $ 40,091 $ 35,363 $ 3,392
Total risk weighted assets $ 221,909 $ 205,092 $ 10,179
Common Equity Tier 1 (as a percentage of risk exposure amount) 13.7% 12.9% 26.3%
Tier 1 (as a percentage of risk exposure amount) 13.7% 12.9% 26.3%
Total capital (as a percentage of risk exposure amount) 18.1% 17.2% 33.3%
Institution specific buffer requirement (CET1 requirement in accordance with article 92 (1) (a) plus capital conservation and countercyclical buffer requirements, plus systemic risk buffer, plus the systemically important institution buffer (G-SII or O-SII buffer), expressed as a percentage of risk exposure amount)
5.13% 5.13% 5.15%
Of which: Capital conservation buffer requirement 0.63% 0.63% 0.63%
Of which: Counter cyclical buffer requirement 0.01% 0.01% 0.03%
Common Equity Tier 1 available to meet buffers (as a percentage of risk exposure amount) 7.05% 6.23% 19.73%
Direct and indirect holdings of the capital of financial sector entities where the institution does not have a significant investment in those entities (amount below 10% threshold and net of eligible short positions)
$ 2,080 $ 2,080 -
Direct and indirect holdings by the institution of the CET 1 instruments of financial sector entities where the institution has a significant investment in those entities (amount below 10% threshold and net of eligible short positions)
$ 908 - -
1. Includes the issuance in December 2016 of 815,166,360 ordinary shares of $0.01 each for a total consideration of $52 million not recognised in
regulatory capital.

GOLDMAN SACHS GROUP UK LIMITED
Pillar 3 Disclosures
December 2016 | Pillar 3 Disclosures 33
Countercyclical Capital Buffer Template
The following tables present information on the impact of
the countercyclical capital buffer as prescribed under CRR
440 which came into force from January 1, 2016.
Table 32: Countercyclical capital buffer
$ in millions As of December 2016
GSGUK GSI GSIB
Total risk exposure amount 17,753 16,407 814
Countercyclical buffer rate 0.01% 0.01% 0.03%
Countercyclical buffer requirement 1 1 -
The geographical distribution of credit exposures relevant
for the calculation of the countercyclical capital buffer is
broken down in Table 33.
As of December 31, 2016 the Financial Policy Committee
(FPC) had recognised exposures of UK institutions from
Norway, Sweden and Hong Kong as implemented in the
calculation of this buffer. These are shown as separate rows
below with their respective contributions to own funds
requirements for GSGUK, GSI and GSIB.
Table 33: Geographical distribution of credit exposures relevant for the calculation of the buffer
$ in millions As of December 2016
General credit
exposures
Trading book exposure1
Securitisation exposure
Own funds requirements
Own funds
require-ment
weights
Counter-cyclical capital
buffer rate
Breakdown by Country
Exposure
value for
SA
Exposure value for
IRB
Sum of long
and short position of
trading book
Value of trading book exposure for
internal models
Exposure value
for SA
Exposure value
for IRB
Of which:
General credit
exposures
Of which:
Trading
book
exposures
Of which:
Securiti-sation
exposures
Total
Norway - 308 24 139 - - 22 2 - 24 0.3% 1.50%
Sweden - 579 111 758 - - 11 29 - 40 0.6% 1.50%
Hong Kong - 176 54 1,053 - - 43 14 - 57 0.9% 0.63%
GSGUK Total - $ 1,063 $ 189 $ 1,950 - - $ 76 $ 45 - $ 121
Norway - 245 24 139 - - 10 2 - 12 0.2% 1.50%
Sweden - 567 111 758 - - 9 29 - 38 0.7% 1.50%
Hong Kong - 175 54 1,053 - - 43 14 - 57 1.0% 0.63%
GSI Total - $ 987 $ 189 $ 1,950 - - $ 62 $ 45 - $ 107
Norway - 63 - - - - 12 - - 12 2.4% 1.50%
Sweden - 12 - - - - 2 - - 2 0.4% 1.50%
Hong Kong - 1 - - - - - - - - - 0.63%
GSIB Total - $ 76 - - - - $ 14 - - $ 14
1. The value of trading book exposures for both internal models and standard approach has been reported on a gross basis in line with the reporting
requirements however does not form the basis for the capital calculation.
Capital Instruments
GSGUKL has issued 493,468,400,601 ordinary A class
shares at a par value of $0.01 for a total value of
$4,934,684,006. GSI and GSIB have issued ordinary A
class shares only to GSGUKL and are 100% wholly owned
subsidiaries of GSGUKL. Neither GSGUKL, GSI nor GSIB
has any other share classes in issue at this time. All other
accounting shareholders’ funds relates to share premium of
the A class shares in issue, retained earnings and reserves.
These items satisfy the conditions laid out under Article 26
of the CRR and are recognised as CET1 capital.
Neither GSGUKL, GSI nor GSIB had issued an instrument
which would meet the definition of an Additional Tier 1
instrument under Article 52 of CRD IV as of December 31,
2016. Subordinated liabilities rank junior to senior
obligations and generally count towards the capital base of
GSGUK. Capital securities may be called and redeemed by
the issuing entity, subject to notification and consent of the
PRA.
The following tables summarise the capital instruments
issued by GSGUKL, GSI and GSIB. The terms of the Tier 2
instruments have been amended, where required, to meet the
eligibility requirements of CRD IV under Articles 62-64.
New
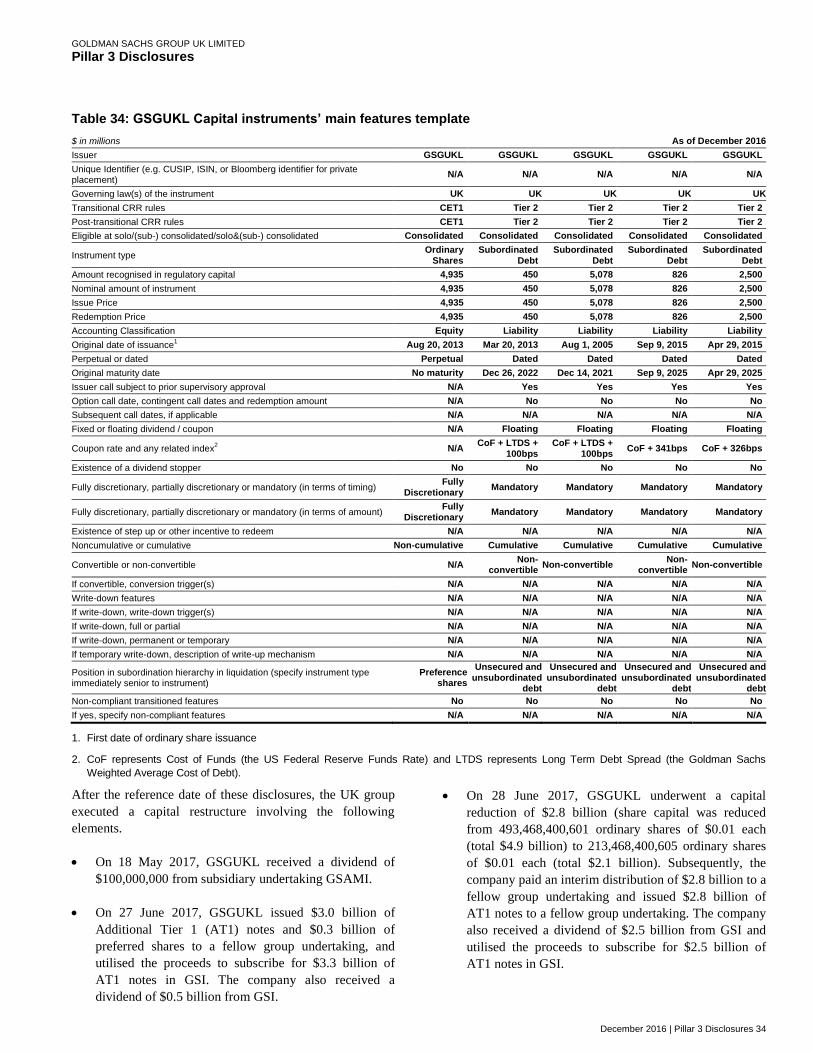
GOLDMAN SACHS GROUP UK LIMITED
Pillar 3 Disclosures
December 2016 | Pillar 3 Disclosures 34
Table 34: GSGUKL Capital instruments’ main features template
$ in millions As of December 2016
Issuer GSGUKL GSGUKL GSGUKL GSGUKL GSGUKL
Unique Identifier (e.g. CUSIP, ISIN, or Bloomberg identifier for private placement)
N/A N/A N/A N/A N/A
Governing law(s) of the instrument UK UK UK UK UK
Transitional CRR rules CET1 Tier 2 Tier 2 Tier 2 Tier 2
Post-transitional CRR rules CET1 Tier 2 Tier 2 Tier 2 Tier 2
Eligible at solo/(sub-) consolidated/solo&(sub-) consolidated Consolidated Consolidated Consolidated Consolidated Consolidated
Instrument type Ordinary
Shares Subordinated
Debt Subordinated
Debt Subordinated
Debt Subordinated
Debt
Amount recognised in regulatory capital 4,935 450 5,078 826 2,500
Nominal amount of instrument 4,935 450 5,078 826 2,500
Issue Price 4,935 450 5,078 826 2,500
Redemption Price 4,935 450 5,078 826 2,500
Accounting Classification Equity Liability Liability Liability Liability
Original date of issuance1 Aug 20, 2013 Mar 20, 2013 Aug 1, 2005 Sep 9, 2015 Apr 29, 2015
Perpetual or dated Perpetual Dated Dated Dated Dated
Original maturity date No maturity Dec 26, 2022 Dec 14, 2021 Sep 9, 2025 Apr 29, 2025
Issuer call subject to prior supervisory approval N/A Yes Yes Yes Yes
Option call date, contingent call dates and redemption amount N/A No No No No
Subsequent call dates, if applicable N/A N/A N/A N/A N/A
Fixed or floating dividend / coupon N/A Floating Floating Floating Floating
Coupon rate and any related index2 N/A
CoF + LTDS + 100bps
CoF + LTDS + 100bps
CoF + 341bps CoF + 326bps
Existence of a dividend stopper No No No No No
Fully discretionary, partially discretionary or mandatory (in terms of timing) Fully
Discretionary Mandatory Mandatory Mandatory Mandatory
Fully discretionary, partially discretionary or mandatory (in terms of amount) Fully
Discretionary Mandatory Mandatory Mandatory Mandatory
Existence of step up or other incentive to redeem N/A N/A N/A N/A N/A
Noncumulative or cumulative Non-cumulative Cumulative Cumulative Cumulative Cumulative
Convertible or non-convertible N/A Non-
convertible Non-convertible
Non-convertible
Non-convertible
If convertible, conversion trigger(s) N/A N/A N/A N/A N/A
Write-down features N/A N/A N/A N/A N/A
If write-down, write-down trigger(s) N/A N/A N/A N/A N/A
If write-down, full or partial N/A N/A N/A N/A N/A
If write-down, permanent or temporary N/A N/A N/A N/A N/A
If temporary write-down, description of write-up mechanism N/A N/A N/A N/A N/A
Position in subordination hierarchy in liquidation (specify instrument type immediately senior to instrument)
Preference shares
Unsecured and unsubordinated
debt
Unsecured and unsubordinated
debt
Unsecured and unsubordinated
debt
Unsecured and unsubordinated
debt
Non-compliant transitioned features No No No No No
If yes, specify non-compliant features N/A N/A N/A N/A N/A
1. First date of ordinary share issuance
2. CoF represents Cost of Funds (the US Federal Reserve Funds Rate) and LTDS represents Long Term Debt Spread (the Goldman Sachs
Weighted Average Cost of Debt).
After the reference date of these disclosures, the UK group
executed a capital restructure involving the following
elements.
On 18 May 2017, GSGUKL received a dividend of
$100,000,000 from subsidiary undertaking GSAMI.
On 27 June 2017, GSGUKL issued $3.0 billion of
Additional Tier 1 (AT1) notes and $0.3 billion of
preferred shares to a fellow group undertaking, and
utilised the proceeds to subscribe for $3.3 billion of
AT1 notes in GSI. The company also received a
dividend of $0.5 billion from GSI.
On 28 June 2017, GSGUKL underwent a capital
reduction of $2.8 billion (share capital was reduced
from 493,468,400,601 ordinary shares of $0.01 each
(total $4.9 billion) to 213,468,400,605 ordinary shares
of $0.01 each (total $2.1 billion). Subsequently, the
company paid an interim distribution of $2.8 billion to a
fellow group undertaking and issued $2.8 billion of
AT1 notes to a fellow group undertaking. The company
also received a dividend of $2.5 billion from GSI and
utilised the proceeds to subscribe for $2.5 billion of
AT1 notes in GSI.

GOLDMAN SACHS GROUP UK LIMITED
Pillar 3 Disclosures
December 2016 | Pillar 3 Disclosures 35
Table 35: GSI and GSIB Capital instruments’ main features template
$ in millions As of December 2016
Issuer GSI GSI GSI GSI GSI GSI GSIB GSIB
Unique Identifier (e.g. CUSIP, ISIN, or Bloomberg identifier for private placement)
N/A N/A N/A N/A N/A N/A N/A N/A
Governing law(s) of the instrument UK UK UK UK UK UK UK UK
Transitional CRR rules CET1 Tier 2 Tier 2 Tier 2 Tier 2 Tier 2 CET1 Tier 2
Post-transitional CRR rules CET1 Tier 2 Tier 2 Tier 2 Tier 2 Tier 2 CET1 Tier 2
Eligible at solo/(sub-) consolidated/solo&(sub-) consolidated
Consolidated Consolidated Consolidated Consolidated Consolidated Consolidated Consolidated Consolidated
Instrument type Ordinary
Shares
Sub-ordinated
Debt
Sub-ordinated
Debt
Sub-ordinated
Debt
Sub-ordinated
Debt
Sub-ordinated
Debt
Ordinary Shares
Sub-ordinated
Debt
Amount recognised in regulatory capital 582 255 5,078 675 2,500 450 63 826
Nominal amount of instrument 582 255 5,078 675 2,500 450 63 826
Issue Price 582 255 5,078 675 2,500 450 63 826
Redemption Price 582 255 5,078 675 2,500 450 63 826
Accounting Classification Equity Liability Liability Liability Liability Liability Equity Liability
Original date of issuance1
May 18,
1988 Nov 29, 1996 July 31, 2003
June 26, 2012
Apr 29, 2015 Mar 20, 2013 Jun 28,
1973 Sep 9, 2015
Perpetual or dated Perpetual Perpetual Dated Dated Dated Dated Perpetual Dated
Original maturity date No maturity 5 years from
notice Dec 14, 2021 Dec 26, 2024 Apr 29, 2025 Dec 26, 2024 No maturity
10 years from
agreement
Issuer call subject to prior supervisory approval
N/A Yes Yes Yes Yes Yes N/A Yes
Option call date, contingent call dates and redemption amount
N/A No No No No No N/A No
Subsequent call dates, if applicable N/A N/A N/A N/A N/A N/A N/A N/A
Fixed or floating dividend / coupon N/A Floating Floating Floating Floating Floating N/A Floating
Coupon rate and any related index2 N/A
3m LIBOR + 150bps
CoF + LTDS + 100bps
CoF + LTDS + 100bps
CoF + LTDS + 326bps
CoF + LTDS + 100bps
N/A CoF +
341bps
Existence of a dividend stopper No No No No No No No No
Fully discretionary, partially discretionary or mandatory (in terms of timing)
Fully discretionary
Mandatory Mandatory Mandatory Mandatory Mandatory Fully
discretionary Mandatory
Fully discretionary, partially discretionary or mandatory (in terms of amount)
Fully discretionary
Mandatory Mandatory Mandatory Mandatory Mandatory Fully
discretionary Mandatory
Existence of step up or other incentive to redeem
N/A N/A N/A N/A N/A N/A N/A N/A
Noncumulative or cumulative Non-
cumulative Cumulative Cumulative Cumulative Cumulative Cumulative
Non-cumulative
Cumulative
Convertible or non-convertible N/A Non-
Convertible Non-
Convertible Non-
Convertible Non-
Convertible Non-
Convertible N/A
Non- Convertible
If convertible, conversion trigger(s) N/A N/A N/A N/A N/A N/A N/A N/A
Write-down features N/A N/A N/A N/A N/A N/A N/A N/A
If write-down, write-down trigger(s) N/A N/A N/A N/A N/A N/A N/A N/A
If write-down, full or partial N/A N/A N/A N/A N/A N/A N/A N/A
If write-down, permanent or temporary N/A N/A N/A N/A N/A N/A N/A N/A
If temporary write-down, description of write-up mechanism
N/A N/A N/A N/A N/A N/A N/A N/A
Position in subordination hierarchy in liquidation (specify instrument type immediately senior to instrument)
Preference shares
Unsecured and
unsubord-inated debt
Unsecured and
unsubord-inated debt
Unsecured and
unsubord-inated debt
Unsecured and
unsubord-inated debt
Unsecured and
unsubord-inated debt
Preference shares
Unsecured and
unsubord-inated debt
Non-compliant transitioned features No No No No No No No No
If yes, specify non-compliant features N/A N/A N/A N/A N/A N/A N/A N/A
1. First date of ordinary share issuance
2. CoF represents Cost of Funds (the US Federal Reserve Funds Rate) and LTDS represents Long Term Debt Spread (the Goldman Sachs Weighted Average Cost of Debt).

GOLDMAN SACHS GROUP UK LIMITED
Pillar 3 Disclosures
December 2016 | Pillar 3 Disclosures 36
Governance Arrangements
Directors of GSI and GSIB are selected based primarily on
the following criteria: (i) judgement, character, expertise,
skills and knowledge useful to the oversight of the
companies’ businesses; (ii) diversity of viewpoints,
backgrounds, experiences, and other demographics; (iii)
business or other relevant experience; and (iv) the extent to
which the interplay of the candidate’s expertise, skills,
knowledge and experience with that of other Board
members will build a Board that is effective, collegial and
responsive to the needs of the companies.
In selecting new directors, we consider a number of factors
in seeking to develop a Board that, as a whole, reflects a
range of skills, diversity, experience and expertise. It is our
aim that at least 25% of the members of the Boards of the
regulated entities in our UK group are women.
As of December 31, 2016, 22% of the members of the
Board of GSI and 20% of the members of the Board of
GSIB were female.
We have set out below information on the members of the
Boards of Directors of GSI and GSIB as of December 31,
2016, together with the number of directorships they held at
that date. We have excluded appointments held with
organisations which do not pursue predominantly
commercial objectives, such as charitable, educational and
religious community organisations and counted
directorships held within the same group as a single
directorship in accordance with the PRA’s Senior
Management Arrangements, Systems and Controls (SYSC)
handbook under requirement 4.3A.7.
Table 36: GSI Board of Directors1
Name Role Background Director-
ships
J. M. D. Barroso Non-executive director and chair
José Manuel joined the firm in 2016 as chairman and non-executive director of GSI and an advisor to the firm. In 2004, he was elected as President of the European Commission, where he served two five-year terms and played an influential role over a number of European Union initiatives, such as the passing of the Treaty of Lisbon. Prior to this, José Manuel held the office of the Prime Minister of Portugal from 2002 to 2004.
1
I. Ealet Executive director
Isabelle was appointed as a director of GSI in June 2016. Isabelle is global co-head of the Securities Division. She is a member of the Firmwide Management Committee, European Management Committee, Firmwide Risk Committee and EMEA Conduct Risk Committee, as well as co-chair of the Securities Division Executive Committee and Securities Division Volcker Committee and chair of the EMEA Securities Division Operating Committee. She joined the firm in 1991.
1
R. J. Gnodde Executive director and chief executive officer
Richard is chief executive officer of GSI and co-head of the firm’s Investment Banking Division. He has been a member of the firm’s Management Committee since 2003. Richard also serves on the Firmwide Client and Business Standards Committee, Firmwide Reputational Risk Committee and chairs the European Management Committee. He served on the firm’s Partnership Committee from 1999 to 2004. Richard joined Goldman Sachs in 1987.
1
Lord Grabiner QC Non-executive director
Lord Grabiner joined the Board of Directors of GSI in June 2015 and is Chairman of the GSI Board Remuneration Committee and the GSI Board Nominations Committee. He is a leading barrister, having worked for more than 40 years on high-profile commercial litigation. He sits as a deputy High Court Judge and is head of Chambers at One Essex Court in the Temple. Lord Grabiner also serves as non-executive director of The University of Law Limited.
3
Lord Griffiths of Fforestfach
Non-executive director
Lord Griffiths joined the firm in 1990 and is an International Advisor to the firm concerned with strategic issues relating to the UK and Asian operations, business development activities worldwide, and private equity. He is chairman of the GSI Board Risk Committees and also served as chairman of the Board Audit Committee from May 2016
2. Prior to 1990, Lord Griffiths was a director of the Bank of England from 1983 until 1985 and served at
Number 10 Downing Street as Head of the Prime Minister’s Policy Unit from 1985 until 1990.
2
N. Harman Non-executive director
Nigel joined the Board of Directors of GSI in December 2016. He was formerly a partner at KPMG for over 20 years, and has spent his entire career in financial services. Nigel also led significant advisory work before and during the financial crisis, as well as large scale investigation work, particularly in trading misconduct and regulatory compliance.
2
S. S. Kilsby Non-executive director
Susan joined the Board of Directors of GSI in May 2016 and is a member of the GSI Board Audit Committee and the GSI Board Risk Committee. Susan serves as chair of global biopharmaceutical company Shire plc. She assumed this role in 2014, having served as an independent non-executive director of the company since 2011. She is also a non-executive director of BBA Aviation plc and Fortune Brands Home & Security, Inc.
1
D. W. McDonogh Executive director
Dermot joined the Board of Directors of GSI in December 2016 and is chief operating officer and chief financial officer for EMEA. He serves on the Firmwide New Activity Committee, Firmwide Risk Committee and the firm’s Structured Products Committee. Additionally, Dermot chairs the Regional New Activity Committee for EMEA and co-chairs the GSI Risk Committee, the EMEA Conduct Risk Committee and EMEA Operational Risk Committee. Dermot joined Goldman Sachs in 1994.
1
M. O. Winkelman Non-executive director
Mark joined the Board of Directors of GSI in June 2016 and is a member of the GSI Board Remuneration Committee and the GSI Board Risk Committee. He has served as a director of The Goldman Sachs Group, Inc. since 2014 and is a member of the Audit and Risk Committees. Mark previously held several leadership positions at Goldman Sachs, including as a member of the Management Committee, co-head of the Fixed Income Division and head of the J. Aron Division. Prior to joining Goldman Sachs in 1978, he was a senior investment officer at the World Bank from 1974.
1
1. Michael Sherwood, who acted as vice chairman and co-chief executive officer of GSI, retired from the firm in December 2016.
2. Nigel Harman will succeed Lord Griffiths as chairman of the GSI Board Audit Committee subject to regulatory approval.
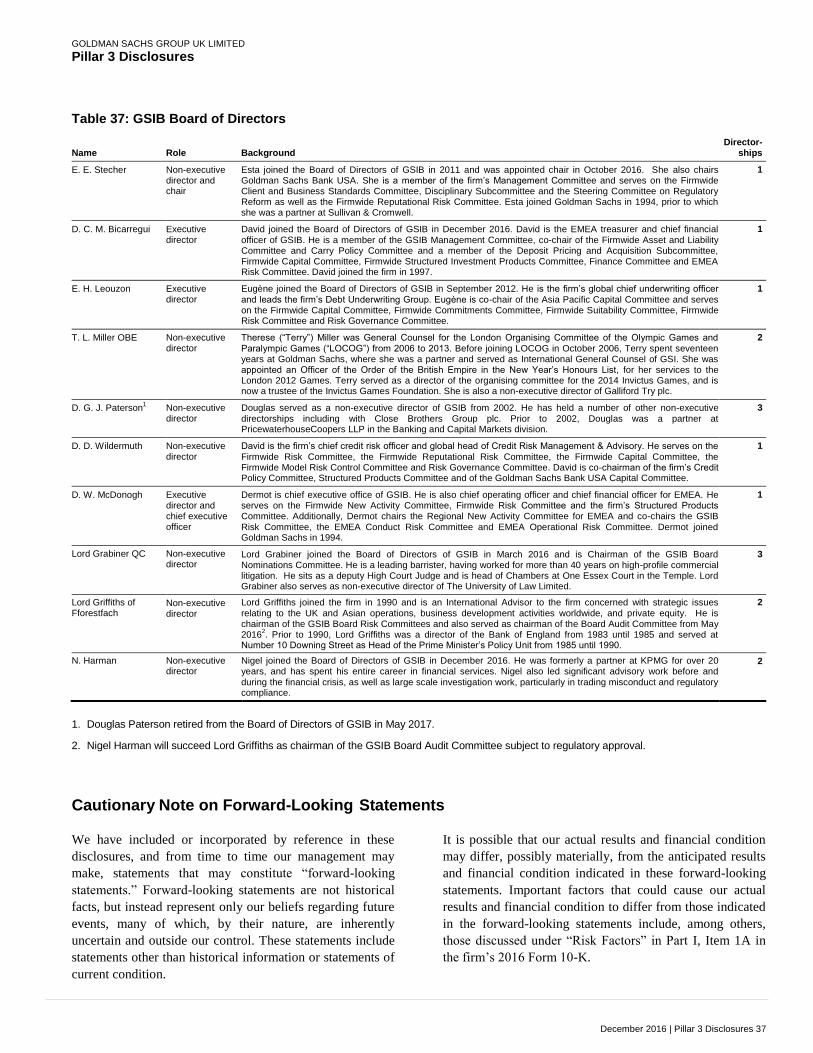
GOLDMAN SACHS GROUP UK LIMITED
Pillar 3 Disclosures
December 2016 | Pillar 3 Disclosures 37
Table 37: GSIB Board of Directors
Name Role Background Director-
ships
E. E. Stecher Non-executive director and chair
Esta joined the Board of Directors of GSIB in 2011 and was appointed chair in October 2016. She also chairs Goldman Sachs Bank USA. She is a member of the firm’s Management Committee and serves on the Firmwide Client and Business Standards Committee, Disciplinary Subcommittee and the Steering Committee on Regulatory Reform as well as the Firmwide Reputational Risk Committee. Esta joined Goldman Sachs in 1994, prior to which she was a partner at Sullivan & Cromwell.
1
D. C. M. Bicarregui Executive director
David joined the Board of Directors of GSIB in December 2016. David is the EMEA treasurer and chief financial officer of GSIB. He is a member of the GSIB Management Committee, co-chair of the Firmwide Asset and Liability Committee and Carry Policy Committee and a member of the Deposit Pricing and Acquisition Subcommittee, Firmwide Capital Committee, Firmwide Structured Investment Products Committee, Finance Committee and EMEA Risk Committee. David joined the firm in 1997.
1
E. H. Leouzon Executive director
Eugène joined the Board of Directors of GSIB in September 2012. He is the firm’s global chief underwriting officer and leads the firm’s Debt Underwriting Group. Eugène is co-chair of the Asia Pacific Capital Committee and serves on the Firmwide Capital Committee, Firmwide Commitments Committee, Firmwide Suitability Committee, Firmwide Risk Committee and Risk Governance Committee.
1
T. L. Miller OBE Non-executive director
Therese (“Terry”) Miller was General Counsel for the London Organising Committee of the Olympic Games and Paralympic Games (“LOCOG”) from 2006 to 2013. Before joining LOCOG in October 2006, Terry spent seventeen years at Goldman Sachs, where she was a partner and served as International General Counsel of GSI. She was appointed an Officer of the Order of the British Empire in the New Year’s Honours List, for her services to the London 2012 Games. Terry served as a director of the organising committee for the 2014 Invictus Games, and is now a trustee of the Invictus Games Foundation. She is also a non-executive director of Galliford Try plc.
2
D. G. J. Paterson1 Non-executive
director Douglas served as a non-executive director of GSIB from 2002. He has held a number of other non-executive directorships including with Close Brothers Group plc. Prior to 2002, Douglas was a partner at PricewaterhouseCoopers LLP in the Banking and Capital Markets division.
3
D. D. Wildermuth Non-executive director
David is the firm’s chief credit risk officer and global head of Credit Risk Management & Advisory. He serves on the Firmwide Risk Committee, the Firmwide Reputational Risk Committee, the Firmwide Capital Committee, the Firmwide Model Risk Control Committee and Risk Governance Committee. David is co-chairman of the firm’s Credit Policy Committee, Structured Products Committee and of the Goldman Sachs Bank USA Capital Committee.
1
D. W. McDonogh Executive director and chief executive officer
Dermot is chief executive office of GSIB. He is also chief operating officer and chief financial officer for EMEA. He serves on the Firmwide New Activity Committee, Firmwide Risk Committee and the firm’s Structured Products Committee. Additionally, Dermot chairs the Regional New Activity Committee for EMEA and co-chairs the GSIB Risk Committee, the EMEA Conduct Risk Committee and EMEA Operational Risk Committee. Dermot joined Goldman Sachs in 1994.
1
Lord Grabiner QC Non-executive director
Lord Grabiner joined the Board of Directors of GSIB in March 2016 and is Chairman of the GSIB Board Nominations Committee. He is a leading barrister, having worked for more than 40 years on high-profile commercial litigation. He sits as a deputy High Court Judge and is head of Chambers at One Essex Court in the Temple. Lord Grabiner also serves as non-executive director of The University of Law Limited.
3
Lord Griffiths of Fforestfach
Non-executive director
Lord Griffiths joined the firm in 1990 and is an International Advisor to the firm concerned with strategic issues relating to the UK and Asian operations, business development activities worldwide, and private equity. He is chairman of the GSIB Board Risk Committees and also served as chairman of the Board Audit Committee from May 2016
2. Prior to 1990, Lord Griffiths was a director of the Bank of England from 1983 until 1985 and served at
Number 10 Downing Street as Head of the Prime Minister’s Policy Unit from 1985 until 1990.
2
N. Harman Non-executive director
Nigel joined the Board of Directors of GSIB in December 2016. He was formerly a partner at KPMG for over 20 years, and has spent his entire career in financial services. Nigel also led significant advisory work before and during the financial crisis, as well as large scale investigation work, particularly in trading misconduct and regulatory compliance.
2
1. Douglas Paterson retired from the Board of Directors of GSIB in May 2017.
2. Nigel Harman will succeed Lord Griffiths as chairman of the GSIB Board Audit Committee subject to regulatory approval.
Cautionary Note on Forward-Looking Statements
We have included or incorporated by reference in these
disclosures, and from time to time our management may
make, statements that may constitute “forward-looking
statements.” Forward-looking statements are not historical
facts, but instead represent only our beliefs regarding future
events, many of which, by their nature, are inherently
uncertain and outside our control. These statements include
statements other than historical information or statements of
current condition.
It is possible that our actual results and financial condition
may differ, possibly materially, from the anticipated results
and financial condition indicated in these forward-looking
statements. Important factors that could cause our actual
results and financial condition to differ from those indicated
in the forward-looking statements include, among others,
those discussed under “Risk Factors” in Part I, Item 1A in
the firm’s 2016 Form 10-K.
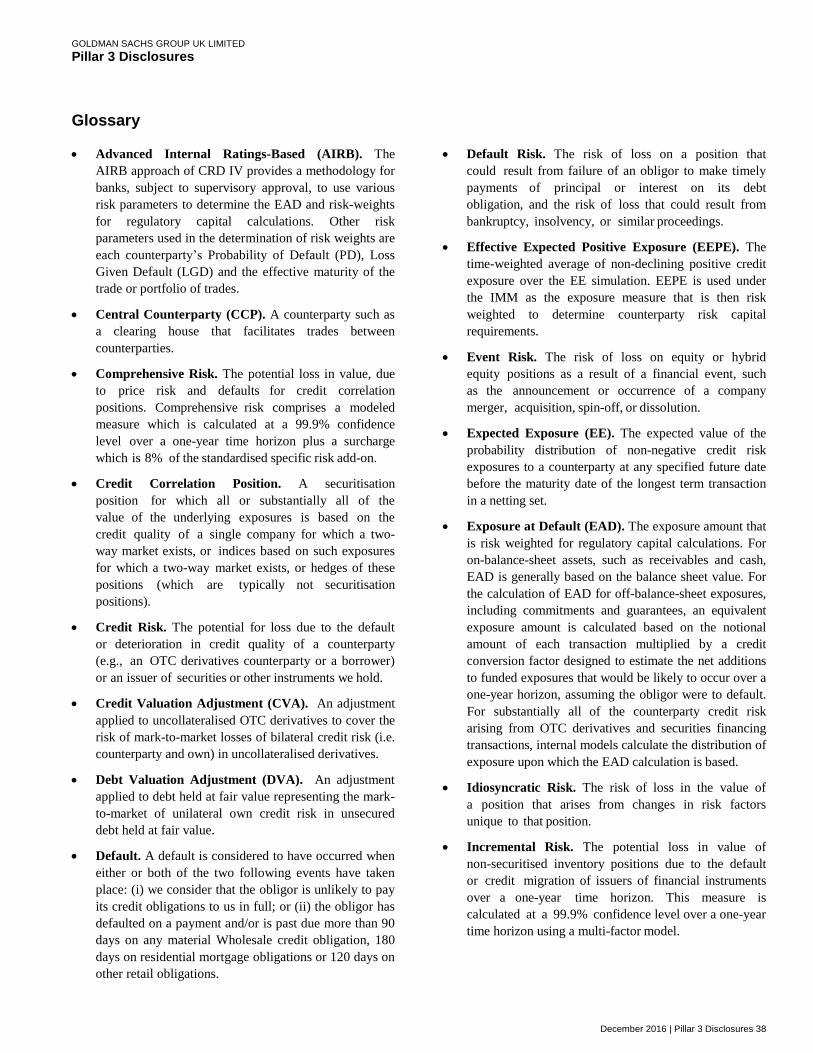
GOLDMAN SACHS GROUP UK LIMITED
Pillar 3 Disclosures
December 2016 | Pillar 3 Disclosures 38
Glossary
Advanced Internal Ratings-Based (AIRB). The
AIRB approach of CRD IV provides a methodology for
banks, subject to supervisory approval, to use various
risk parameters to determine the EAD and risk-weights
for regulatory capital calculations. Other risk
parameters used in the determination of risk weights are
each counterparty’s Probability of Default (PD), Loss
Given Default (LGD) and the effective maturity of the
trade or portfolio of trades.
Central Counterparty (CCP). A counterparty such as
a clearing house that facilitates trades between
counterparties.
Comprehensive Risk. The potential loss in value, due
to price risk and defaults for credit correlation
positions. Comprehensive risk comprises a modeled
measure which is calculated at a 99.9% confidence
level over a one-year time horizon plus a surcharge
which is 8% of the standardised specific risk add-on.
Credit Correlation Position. A securitisation
position for which all or substantially all of the
value of the underlying exposures is based on the
credit quality of a single company for which a two-
way market exists, or indices based on such exposures
for which a two-way market exists, or hedges of these
positions (which are typically not securitisation
positions).
Credit Risk. The potential for loss due to the default
or deterioration in credit quality of a counterparty
(e.g., an OTC derivatives counterparty or a borrower)
or an issuer of securities or other instruments we hold.
Credit Valuation Adjustment (CVA). An adjustment
applied to uncollateralised OTC derivatives to cover the
risk of mark-to-market losses of bilateral credit risk (i.e.
counterparty and own) in uncollateralised derivatives.
Debt Valuation Adjustment (DVA). An adjustment
applied to debt held at fair value representing the mark-
to-market of unilateral own credit risk in unsecured
debt held at fair value.
Default. A default is considered to have occurred when
either or both of the two following events have taken
place: (i) we consider that the obligor is unlikely to pay
its credit obligations to us in full; or (ii) the obligor has
defaulted on a payment and/or is past due more than 90
days on any material Wholesale credit obligation, 180
days on residential mortgage obligations or 120 days on
other retail obligations.
Default Risk. The risk of loss on a position that
could result from failure of an obligor to make timely
payments of principal or interest on its debt
obligation, and the risk of loss that could result from
bankruptcy, insolvency, or similar proceedings.
Effective Expected Positive Exposure (EEPE). The
time-weighted average of non-declining positive credit
exposure over the EE simulation. EEPE is used under
the IMM as the exposure measure that is then risk
weighted to determine counterparty risk capital
requirements.
Event Risk. The risk of loss on equity or hybrid
equity positions as a result of a financial event, such
as the announcement or occurrence of a company
merger, acquisition, spin-off, or dissolution.
Expected Exposure (EE). The expected value of the
probability distribution of non-negative credit risk
exposures to a counterparty at any specified future date
before the maturity date of the longest term transaction
in a netting set.
Exposure at Default (EAD). The exposure amount that
is risk weighted for regulatory capital calculations. For
on-balance-sheet assets, such as receivables and cash,
EAD is generally based on the balance sheet value. For
the calculation of EAD for off-balance-sheet exposures,
including commitments and guarantees, an equivalent
exposure amount is calculated based on the notional
amount of each transaction multiplied by a credit
conversion factor designed to estimate the net additions
to funded exposures that would be likely to occur over a
one-year horizon, assuming the obligor were to default.
For substantially all of the counterparty credit risk
arising from OTC derivatives and securities financing
transactions, internal models calculate the distribution of
exposure upon which the EAD calculation is based.
Idiosyncratic Risk. The risk of loss in the value of
a position that arises from changes in risk factors
unique to that position.
Incremental Risk. The potential loss in value of
non-securitised inventory positions due to the default
or credit migration of issuers of financial instruments
over a one-year time horizon. This measure is
calculated at a 99.9% confidence level over a one-year
time horizon using a multi-factor model.

GOLDMAN SACHS GROUP UK LIMITED
Pillar 3 Disclosures
December 2016 | Pillar 3 Disclosures 39
Internal Models Methodology (IMM). The IMM
under CRD IV rules establishes a methodology for
entities to use their internal models to estimate
exposures arising from OTC derivatives, securities
financing transactions and cleared transactions, subject
to qualitative and quantitative requirements and
supervisory approval.
Loss Given Default (LGD). An estimate of the
economic loss rate if a default occurs during economic
downturn conditions.
Market Risk. The risk of loss in the value of our
inventory, as well as certain other financial assets and
financial liabilities, due to changes in market conditions.
Operational Risk. The risk of loss resulting from
inadequate or failed internal processes, people and
systems or from external events.
Other Systemically Important Institutions.
Institutions identified by national regulators as those
whose failure or malfunction could potentially lead to
serious negative consequences for the domestic financial
systems and real economy.
Prudent Valuation Adjustment (PVA). A deduction
from CET1 capital where the prudent value of trading
assets or other financial assets measured at fair value is
materially lower than the fair value recognised in the
consolidated financial information.
Probability of Default (PD). Estimate of the
probability that an obligor will default over a one-year
horizon.
Ratings Based Approach. Under the ratings based
method, the risk weighted exposure amount of a rated
securitisation position or resecuritisation position are
calculated by applying to the exposure value the risk
weight associated with the credit quality step as
prescribed in CRD IV multiplied by 1.06.
Regulatory Value-at-Risk (VaR). The potential loss
in value of trading positions due to adverse market
movements over a 10-day time horizon with a 99%
confidence level.
Regulatory VaR Backtesting. Comparison of daily
positional loss results to the Regulatory VaR measure
calculated as of the end of the prior business day.
Resecuritisation Position. Represents an on or off-
balance sheet transaction in which the risk associated
with an underlying pool of exposures is tranched and at
least one of the underlying exposures is a securitisation
position.
Securitisation Position. Represents a transaction or
scheme in which the credit risk associated with an
exposure or pool of exposures is tranched and both
payments in the transaction or scheme are dependent
upon the performance of the exposure or pool of
exposures and the subordination of tranches determines
the distribution of losses during the ongoing life of the
transaction or scheme.
Specific Risk. The risk of loss on a position that
could result from factors other than broad market
movements and includes event risk, default risk and
idiosyncratic risk. The specific risk add-on is applicable
for both securitisation positions and for certain non-
securitised debt and equity positions, to supplement the
model-based measures.
Stress Testing. Stress testing is a method of
determining the effect of various hypothetical stress
scenarios.
Stressed VaR (SVaR). The potential loss in value of
inventory positions, as well as certain other financial
assets and financial liabilities, during a period of
significant market stress. SVaR is calculated at a 99%
confidence level over a 10-day horizon using market
data inputs from a continuous 12-month period of
stress.
Synthetic Securitisation. Defined as a securitisation
transaction in which the tranching is achieved by the
use of credit derivatives or guarantees, and the pool of
exposures is not removed from the balance sheet of the
originator.
Traditional Securitisation. Defined as a securitisation
transaction which involves the economic transfer of the
exposures being securitised to a securitisation special
purpose entity which issues securities; and so that this
must be accomplished by the transfer of ownership of
the securitised exposures from the originator or through
sub-participation; and the securities issued do not
represent payment obligations of the originator.
Value-at-Risk (VaR). The potential loss in value of
inventory positions, as well as certain other financial
assets and financial liabilities, due to adverse market
movements over a defined time horizon with a
specified confidence level. Risk management VaR is
calculated at a 95% confidence level over a one-day
horizon.
Wholesale Exposure. A term used to refer collectively
to credit exposures to companies, sovereigns or
government entities (other than Securitisation, Retail or
Equity exposures).

GOLDMAN SACHS GROUP UK LIMITED
Pillar 3 Disclosures
December 2016 | Pillar 3 Disclosures 40
UK Remuneration Disclosures
The following disclosures are made by Goldman Sachs
Group UK Limited in accordance with Article 450 of the
EU Capital Requirements Regulation No. 575/2013 (CRR)
in respect of Goldman Sachs International (“GSI”) and
Goldman Sachs International Bank and in accordance with
the Prudential Sourcebooks of the Financial Conduct
Authority in respect of Goldman Sachs Asset Management
International and Montague Place Custody Services
(together, the “UK Companies”1).
Remuneration Programme Philosophy
Retention of talented employees is critical to executing the
firm’s business strategy successfully. Remuneration is,
therefore, a key component of the costs the firm incurs to
generate revenues, similar to cost of goods sold or
manufacturing costs in other industries.
The remuneration philosophy and the objectives of the
remuneration programme for the firm are reflected in the
Compensation Principles for The Goldman Sachs Group,
Inc. (“GS Group”), as posted on the Goldman Sachs public
website:
http://www.goldmansachs.com/investor-relations/corporate-
governance/corporate-governance-documents/compensation-
principles.pdf
The firm’s Compensation Principles were approved by
shareholders at the 2010 annual shareholders’ meeting. In
particular, effective remuneration practices should:
(i) Encourage a real sense of teamwork and
communication, binding individual short-term interests
to the institution’s long-term interests;
(ii) Evaluate performance on a multi-year basis;
(iii) Discourage excessive or concentrated risk-taking;
(iv) Allow an institution to attract and retain proven talent;
and
(v) Align aggregate remuneration for the firm with
performance over the cycle.
1 These disclosures include any employees assigned from time to time
to Goldman Sachs Bank (USA) London branch.
Remuneration Governance
The Compensation Committee
The Board of Directors of GS Group (the “Board”) oversees
the development, implementation and effectiveness of the
firm’s global remuneration practices, which it generally
exercises directly or through delegation to the
Compensation Committee of the Board (the “Compensation
Committee”). The responsibilities of the Compensation
Committee include:
Review and approval of (or recommendation to the Board
to approve) the firm’s variable remuneration structure,
including the portion to be paid as equity-based awards,
all year-end equity-based grants for eligible employees
(including those employed by the UK Companies), and
the terms and conditions of such awards.
Assisting the Board in its oversight of the development,
implementation and effectiveness of policies and
strategies relating to the Human Capital Management
(HCM) function, including recruiting, retention, career
development and progression, management succession
(other than that within the purview of the Corporate
Governance and Nominating Committee) and diversity.
The Compensation Committee held 9 meetings in 2016 to
discuss and make determinations regarding remuneration.
The members of the Compensation Committee at the end of
2016 were James A. Johnson (Chair), M. Michele Burns,
William W. George, Ellen J. Kullman, Lakshmi N. Mittal,
Debora L. Spar and Adebayo O. Ogunlesi (ex-officio). None
of the members of the Compensation Committee was an
employee of the firm. All members of the Compensation
Committee were “independent” within the meaning of the
New York Stock Exchange Rules and the firm’s Director
Independence Policy.
The Remuneration Committee
Starting in the 2016 fiscal year, the Board Remuneration
Committee of GSI (the “Remuneration Committee”) was
established by the Board of Directors of GSI. The
responsibilities of the Remuneration Committee include:
Overseeing the development and implementation of the
remuneration policies of GSI insofar as they relate to
employees of GSI whose remuneration is subject to the
relevant provisions of the PRA Rulebook or FCA
Handbook.

GOLDMAN SACHS GROUP UK LIMITED
Pillar 3 Disclosures
December 2016 | Pillar 3 Disclosures 41
To take steps to satisfy itself that the remuneration
policies of GSI are in accordance with the relevant
provisions of the PRA Rulebook and FCA Handbook,
including in particular that:
the remuneration policies of GSI appropriately
take into account the long-term interests of
shareholders, investors and other stakeholders in
GSI;
the remuneration policies of GSI are consistent
with and promote sound and effective risk
management and do not encourage risk-taking that
exceeds the level of tolerated risk of GSI.
Making recommendations to the GSI Board for
approval and adoption of the remuneration policies of
GSI once satisfied that the policies are in accordance
with the relevant provisions of the PRA Rulebook or
FCA Handbook.
The Remuneration Committee held 3 meetings in 2016 to
discuss and make determinations regarding the
remuneration policies of GSI.
The members of the Remuneration Committee at the end of
2016 were Lord Anthony S. Grabiner QC (Chair) and Mark
O. Winkelman. None of the members of the Remuneration
Committee was an employee of the firm.
Other Stakeholders
In carrying out the responsibilities of the Compensation
Committee, individual members of the Compensation
Committee met multiple times with senior management
during the year. In addition, the Chair of the Compensation
Committee met frequently with the firm’s Chief Financial
Officer (CFO) and other members of senior management.
The firm’s Chief Risk Officer (CRO) presented an annual
compensation-related risk assessment to the Compensation
Committee, meeting jointly with the Risk Committee of the
Board, to assist the Compensation Committee in its
assessment of the effectiveness of the firm’s remuneration
programme in addressing risk, and particularly, whether the
programme is consistent with regulatory guidance that
financial services firms ensure variable remuneration does
not encourage employees to expose the firm to imprudent
risk.
The firm’s EMEA Conduct Risk Committee also assists
senior management of the UK Companies in the oversight
of conduct risk and business standards.
External Consultants
The Compensation Committee has for several years
recognised the importance of using an independent
remuneration consultant that is appropriately qualified and
that provides services solely to the Compensation
Committee and not to the firm. The Compensation
Committee continued to retain Semler Brossy Consulting
Group LLC (Semler Brossy) as its independent
remuneration consultant in 2016. Consistent with past
practice, the Compensation Committee asked Semler Brossy
to assess the remuneration programme for Participating
Managing Directors (PMDs), the firm’s approximately 400
most senior employees as of December 31, 2016.
In connection with its work for the Compensation
Committee, Semler Brossy reviewed the information
provided to the Compensation Committee by the CFO,
HCM, and the firm’s remuneration consultants. In its
assessment of the 2016 remuneration programme for PMDs,
Semler Brossy confirmed that, consistent with prior years,
the programme has been aligned with, and is sensitive to,
firm performance, contains features that reinforce
significant alignment with shareholders and a long-term
focus, and utilises policies and procedures, including
subjective determinations that facilitate the firm’s approach
to risk-taking and risk management by supporting the
mitigation of known and perceived risks.
Semler Brossy also reviewed and participated in the CRO’s
annual compensation-related risk assessment that was
presented to the Compensation Committee, meeting jointly
with the Risk Committee of the Board, in December 2016.
Global Remuneration Determination Process
The firm’s global process for setting variable remuneration
(including the requirement to consider risk and compliance
issues) applies to employees of the UK Companies in the
same way as to employees in other regions and is subject to
oversight by the senior management of the firm in the
region. The firm uses a highly disciplined and robust
process for setting variable remuneration across all divisions
and regions, which occurs prior to the Compensation
Committee’s review and approval. The process involves
divisional compensation managers, divisional compensation
committees, division heads, HCM, the Firmwide
Management Committee (the firm’s most senior
executives), senior management (e.g., the firm’s Chief
Executive Officer (CEO), the Chief Operating Officer
(COO), the CFO and the Head of HCM and/or the
Compensation Committee, as appropriate.
GOLDMAN SACHS GROUP UK LIMITED
Pillar 3 Disclosures
December 2016 | Pillar 3 Disclosures 42
In addition, as part of the remuneration determination
process, members of the firm’s Compliance, Risk,
Employment Law Group and Employee Relations functions
make arrangements for divisional management to take into
consideration any compliance, risk or control matters when
determining remuneration of individuals. Before any
remuneration decisions are finalised, Employee Relations
and the Employment Law Group assess the recommended
remuneration for relevant individuals in the context of
overall performance and other factors, and
recommendations are reviewed with respect to comparators.
Link Between Pay and Performance
In 2016, annual remuneration for employees generally
comprised fixed remuneration (including base salary) and
variable remuneration. The firm’s remuneration practices
provide for variable remuneration determinations to be
made on a discretionary basis. Variable remuneration is
based on multiple factors and is not set as a fixed percentage
of revenue or by reference to any other formula. Firmwide
performance is a key factor in determining variable
remuneration.
The firm is committed to aligning variable remuneration
with performance. In order to do so, the performance of the
firm, division and individual over the past year, as well as
over prior years, are taken into account. The firm believes
that the firm’s senior leaders have responsibility for overall
performance and, as a result, senior employees have
experienced more volatility in their remuneration year-over-
year, particularly in periods when the firm’s performance
declined significantly.
The firm believes that multi-year guarantees should be
avoided entirely to avoid misaligning remuneration and
performance, and guaranteed remuneration in employment
contracts should be used only in exceptional circumstances
(for example, for certain new hires).
Performance Measurement
In connection with making remuneration decisions for 2016,
the Compensation Committee reviewed with the CFO
certain firmwide financial metrics and year-on-year changes
in those metrics, including the following:
Return on average common shareholders’ equity (ROE);
Diluted earnings per common share;
Book value per share (BVPS);
Net earnings;
Net revenues;
Remuneration and benefits expense;
Ratio of remuneration and benefits to net revenues; and
Non-remuneration expense
No specific goals for these metrics were used, nor were any
specific weights ascribed to them, in making remuneration
determinations.
Additionally, each revenue-producing division, in
coordination with the CRO, identified the quantitative
and/or qualitative metrics (none of which are given specific
weight in determining remuneration) specific to the
division, its business units and, where applicable, desks to
be used to evaluate the performance of the division and its
employees. Metrics included, but were not limited to:
For the Investment Bank (comprising the Investment
Banking Division, Merchant Banking Division, Securities
Division and Global Investment Research Division): Pre-
tax income, return on attributed equity, lost business,
revenue and backlog, client team and activity, relationship
lending history, principalling, key transactions, as well as
franchise accretion.
For the Investment Manager (comprising the Investment
Management Division): Revenues, pre-tax profit, pre-tax
margin, assets under supervision and net sales (including
gross sales and redemptions), as well as business-specific
measures such as client metrics for distribution channels
and investment performance and risk measures for the
portfolio management business units.
Employees are evaluated annually as part of the
performance review feedback process. This process reflects
input from a number of employees, including supervisors,
peers and those who are junior to the employee, regarding
an array of performance measures for 2016. The
performance evaluations for 2016 included assessments of
risk management and firm reputation, culture and conduct,
and compliance with firm policies, as well as teamwork,
citizenship and communication. Certain employees are also
assessed on sensitivity to risk and control (revenue-
producing employees), and control side empowerment
(control functions).
Risk Adjustment
Prudent risk management is a hallmark of the firm’s culture
and sensitivity to risk and risk management are key
elements in assessing employee performance, including as
part of the performance review feedback process noted
above.

GOLDMAN SACHS GROUP UK LIMITED
Pillar 3 Disclosures
December 2016 | Pillar 3 Disclosures 43
The firm takes risk into account in setting the amount and
form of variable remuneration for employees. Different
lines of business have different risk profiles and these are
taken into account when determining remuneration. These
include credit, market, liquidity, operational, reputational,
legal and compliance risks. Guidelines are provided to assist
compensation managers when applying discretion during
the remuneration process to promote consistent
consideration of the different risks presented by the firm’s
businesses. Further, to ensure the independence of control
function employees, remuneration for those employees is
not determined by individuals in revenue-producing
positions but rather by the management of the relevant
control function.
For 2016, all employees with total remuneration above a
particular threshold were subject to deferral of part of their
variable remuneration in the form of an equity-based award.
As in prior years, all 2016 equity-based awards were subject
to a number of terms and conditions that could result in
forfeiture or recapture. For further details, see “Structure of
Remuneration” below.
In the 2016 annual compensation-related risk assessment
presented to the Compensation Committee, meeting jointly
with the Risk Committee of the Board, the CRO presented
his view that the various components of the firm’s
remuneration programmes and policies (for example,
process, structure and governance) worked together to
balance risk and incentives in a manner that does not
encourage imprudent risk-taking. In addition, the CRO
stated that the firm has a risk management process that,
among other things, is consistent with the safety and
soundness of the firm and focuses on our:
(i) Risk management culture: the firm’s culture emphasises
continuous and prudent risk management
(ii) Risk-taking authority: there is a formal process for
identifying employees who, individually or as part of a
group, have the ability to expose the firm to material
amounts of risk
(iii) Upfront risk management: the firm has tight controls on
the allocation, utilisation and overall management of
risk-taking, as well as comprehensive profit and loss
and other management information which provide
ongoing performance feedback. In addition, in
determining variable remuneration, the firm reviews
performance metrics that incorporate ex ante risk
adjustments.
(iv) Governance: the oversight of the Board, management
structure and the associated processes all contribute to a
strong control environment and control functions have
input into remuneration structure and design
Structure of Remuneration
The shareholders of Goldman Sachs Group UK Limited
have resolved that, with effect from performance years
beginning on or after 1 January 2014, the variable
component of remuneration paid to Code Staff of Goldman
Sachs International and Goldman Sachs International Bank
shall not exceed 200% of the fixed component.
Fixed Remuneration
The firm has a global salary approach to ensure consistency
in salary levels and to achieve an appropriate balance
between fixed and variable remuneration.
For certain employees, identified as Code Staff in
accordance with Commission Delegated Regulation
(Regulation 604/2016) with regard to regulatory technical
standards on criteria to identify categories of staff whose
professional activities have a material impact on an
institution’s risk profile under Article 94(2) of Directive
2013/36/EU, additional fixed remuneration is awarded in
the form of an allowance generally paid in cash except for
certain employees whose awards included an equity-based
element. Recipients and the value of allowances are
determined as a result of an evaluation of the professional
experience and level of organisational responsibility of
employees, as well as the nature of their role and the terms
on which they are employed.
Variable Remuneration
For employees with total remuneration and variable
remuneration above specific thresholds, variable
remuneration is generally paid in a combination of cash and
equity-based remuneration. In general, the portion paid in
the form of an equity-based award increases as variable
remuneration increases and, for Code Staff, is set to ensure
compliance with Principles 12(f) and 12(g) of the
Remuneration Code.
The variable remuneration programme is flexible to allow
the firm to respond to changes in market conditions and to
maintain its pay-for-performance approach. Variable
remuneration is discretionary (even if paid consistently over
a period of years).
Equity-Based Remuneration
The firm believes that remuneration should encourage a
long-term, firmwide approach to performance and
discourage imprudent risk-taking. Paying a significant
portion of variable remuneration in the form of equity-based
GOLDMAN SACHS GROUP UK LIMITED
Pillar 3 Disclosures
December 2016 | Pillar 3 Disclosures 44
remuneration that delivers over time, changes in value
according to the price of shares of common stock (shares) of
GS Group, and is subject to forfeiture or recapture
encourages a long-term, firmwide focus because its value is
realised through long-term responsible behavior and the
financial performance of the firm.
The firm imposes transfer restrictions, retention
requirements and anti-hedging policies to further align the
interests of the firm’s employees with those of the firm’s
shareholders. The firm’s retention policies, coupled with the
practice of paying senior employees a significant portion of
variable remuneration in the form of equity-based awards,
leads to a considerable investment in shares of GS Group
over time.
In addition, from time to time, the firm may make awards
consisting of unfunded, unsecured promises to deliver other
instruments on terms and conditions that are substantially
similar to those applicable to Restricted Stock Units (RSUs)
described below.
Deferral Policy: The deferred portion of fiscal year 2016
annual variable remuneration was generally awarded in
the form of RSUs. An RSU is an unfunded, unsecured
promise to deliver a share on a predetermined date. RSUs
awarded in respect of fiscal year 2016 generally deliver in
three equal instalments on or about each of the first,
second and third anniversaries of the grant date, assuming
the employee has satisfied the terms and conditions of the
award at each such date. Where required under the
Remuneration Code, RSUs awarded in respect of fiscal
year 2016 for certain Code Staff deliver in five equal
instalments, either on or about each of the first, second,
third, fourth and fifth anniversaries of the grant date, or,
for Code Staff who perform a PRA senior management
function, on or about each of the third, fourth, fifth, sixth
and seventh anniversaries of the grant date, assuming in
each case, the employee has satisfied the terms and
conditions of the award at each such date.
Transfer Restrictions: The firm generally requires all
individuals to hold, until the expiration of a period of up
to five years from grant, a material portion of the shares
they receive in respect of RSUs granted as part of their
year-end remuneration according to the firm’s global
deferral table. These transfer restrictions apply to the
lower of 50% of the shares delivered before reduction for
tax withholding, or the number of shares received after
reduction for tax withholding. Because combined tax and
social security rates in the United Kingdom are close to
50%, transfer restrictions apply to substantially all net
shares delivered to employees resident in the United
Kingdom.
An employee generally cannot sell, exchange, transfer,
assign, pledge, hedge or otherwise dispose of any RSUs
or shares that are subject to transfer restrictions.
Retention Requirement: All shares delivered to
employees designated as Code Staff in relation to their
variable remuneration are subject to retention in
accordance with Principle 12(f) of the Remuneration
Code. In addition, for 2016, the firm required the CEO of
GS Group, for so long as he holds such position, to retain
sole beneficial ownership (including, in certain cases,
ownership through his spouse or estate planning entities
established by them) of a number of shares equal to at
least 75% of certain shares received (net of payment of
any option exercise price and taxes) as remuneration since
becoming a senior executive. The firm required the CFO,
COO and Vice Chairmen to retain a number of shares
equal to at least 50% of certain shares received. The firm
imposes a similar retention requirement, equal to 25%, on
other PMDs. These shares are referred to as “retention
shares”.
Forfeiture and Recapture Provisions: The RSUs and
shares delivered thereunder in relation to variable
remuneration are subject to forfeiture or recapture if the
Compensation Committee determines that during 2016
the employee participated (which could include,
depending on the circumstances, participation in a
supervisory role) in the structuring or marketing of any
product or service, or participated on behalf of the firm or
any of its clients in the purchase or sale of any security or
other property, in any case without appropriate
consideration of the risk to the firm or the broader
financial system as a whole (for example, if the employee
were to improperly analyse risk or fail sufficiently to raise
concerns about such risk) and, as a result of such action or
omission, the Compensation Committee determines there
has been, or reasonably could be expected to be, a
material adverse impact on the firm, the employee’s
business unit or the broader financial system.
This provision is not limited to financial risks and is
designed to encourage the consideration of the full range
of risks associated with the activities (for example, legal,
compliance or reputational). The provision also does not
require that a material adverse impact actually occur, but
rather may be triggered if the firm determines that there is
a reasonable expectation of such an impact.
The Compensation Committee previously adopted
guidelines that set forth a formal process regarding
determinations to forfeit or recapture awards for improper
risk analysis upon the occurrence of certain pre-
determined events (for example, in the event of annual
GOLDMAN SACHS GROUP UK LIMITED
Pillar 3 Disclosures
December 2016 | Pillar 3 Disclosures 45
firmwide, divisional, business unit or individual losses).
The review of whether forfeiture or recapture is
appropriate includes input from the CRO, as well as
representatives from Finance, Legal and Compliance.
Determinations are made by the Compensation
Committee or its delegates, with any determinations made
by delegates reported to the Compensation Committee.
RSUs granted to all Code Staff in relation to variable
remuneration are generally subject to forfeiture until
delivery of the underlying shares if GS Group is
determined by US bank regulators to be “in default” or
“in danger of default” as defined under the US Dodd-
Frank Wall Street Reform and Consumer Protection Act
2010, or fails to maintain for 90 consecutive business
days, the required “minimum tier 1 capital ratio” (as
defined under Federal Reserve Board regulations). RSUs
awarded in relation to variable remuneration are also
subject to forfeiture if the firm or the relevant business
unit suffers a material downturn in financial performance.
All variable remuneration granted to Code Staff is
generally subject to forfeiture or recapture in the event of
a material failure of risk management, or in the event that
the employee engages in “serious misconduct”, at any
time during the 7 year period after grant (equity-based
awards) or payment (cash).
Additionally, RSUs and shares delivered thereunder in
relation to variable remuneration are generally subject to
forfeiture or recapture if it is appropriate to hold a Code
Staff accountable in whole or in part for “serious
misconduct” related to compliance, control or risk that
occurred during 2016 by an individual for whom the Code
Staff had supervisory responsibility as a result of direct or
indirect reporting lines or management responsibility for
an office, division or business.
An employee’s RSUs may also be forfeited, and shares
delivered thereunder recaptured if the employee engages
in conduct constituting “cause” at any time before the
RSUs are delivered and any applicable transfer
restrictions lapse. Cause includes, among other things,
any material violation of any firm policy, any act or
statement that negatively reflects on the firm’s name,
reputation or business interests and any conduct
detrimental to the firm.
With respect to all of the forfeiture conditions, if the firm
determines after delivery or release of transfer restrictions
that an RSU or share delivered thereunder should have
been forfeited or recaptured, the firm can require return of
any shares delivered or repayment to the firm of the fair
market value of the shares when delivered (including
those withheld to pay taxes) or any other amounts paid or
delivered in respect thereof.
The Sarbanes Oxley (SOX) clawback provisions apply to
all variable compensation (whether cash- or equity-based)
paid to any senior executives. The SOX provisions
provide the following: If GS Group is required to prepare
an accounting restatement due to material noncompliance,
as a result of misconduct, with any financial reporting
requirement under the securities laws described in Section
304 of the Sarbanes-Oxley Act of 2002, the grantee will
be required to forfeit or repay awards received during the
12-months after the initial incorrect filing.
Hedging: The firm’s anti-hedging policy ensures
employees maintain the intended exposure to the firm’s
stock performance. In particular, all employees are
prohibited from hedging RSUs and shares that are subject
to transfer restrictions and, in the case of PMDs, retention
shares. In addition, executive officers of GS Group are
prohibited from hedging any shares that they can freely
sell. Employees, other than executive officers, may hedge
only shares that they can otherwise sell. However, no
employee may enter into uncovered hedging transactions
or sell short any shares. Employees may only enter into
transactions or otherwise make investment decisions with
respect to shares during applicable “window periods.”
Treatment upon Termination or Change-in-Control:
As a general matter, delivery schedules are not
accelerated, and transfer restrictions are not removed,
when an employee leaves the firm. The limited exceptions
include death and “conflicted employment”. In addition, a
change in control alone is not sufficient to trigger
acceleration of any deliveries or removal of transfer
restrictions; only if the change in control is followed
within 18 months by a termination of employment by the
firm without “cause” or by the employee for “good
reason” will delivery and release of transfer restrictions be
accelerated.

GOLDMAN SACHS GROUP UK LIMITED
Pillar 3 Disclosures
December 2016 | Pillar 3 Disclosures 46
Long-Term Performance Incentive Plan (LTIP)
In January 2016, the Compensation Committee approved a
limited number of awards under the LTIP to certain
executive officers of GS Group. The LTIP is based on
specific performance metrics and is intended to incentivise
long-term performance in a manner that does not encourage
imprudent risk-taking. Awards are not considered part of
annual remuneration.
Both the performance metrics and thresholds of awards
made under this plan are meant to provide an appropriate
focus on long-term shareholder returns over a multi-year
period.
After consideration of various factors, including stakeholder
feedback, the Compensation Committee decided not to
make any LTIP awards in 2017.
Quantitative Disclosures
The following tables show aggregate quantitative
remuneration information for 724 employees, categorised as
Code Staff for the purposes of the Remuneration Code in
respect of their duties for the UK Companies. The PRA was
consulted on these awards as part of their normal assessment
of remuneration.
Code Staff are also eligible to receive certain general non-
discretionary ancillary payments and benefits on a similar
basis to other employees. These payments and benefits are
not included in the disclosures below.
Aggregate remuneration by business area
The amounts below include fixed and variable remuneration
paid or awarded for the financial year ended December 31,
2016:
Investment
Bank1 Investment Manager2
Control Function
Total
Non-equity remuneration ($ in millions)
558.1 62.2 59.1 679.5
Restricted Stock Units (number of RSUs in 000s)
1,325 165 140 1,630
1. Reflects Code Staff in the Investment Banking Division, Merchant
Banking Division, Securities Division and Global Investment
Research Division
2. Reflects Code Staff in the Investment Management Division
Aggregate remuneration: split between fixed and variable
remuneration and forms of variable remuneration
Remuneration paid or awarded for the financial year ended
December 31, 2016 comprised fixed remuneration (salaries,
allowances and director fees) and variable remuneration.
The figures in the table below are split into “Senior
Management” and “Other Code Staff” according to the
following definitions:
Senior Management: members of the Boards of
Directors of the UK Companies, members of the
Management Committees for the Europe, Middle East and
Africa (EMEA) region and Goldman Sachs International
Bank, the head of each revenue-producing division in the
EMEA region and heads of significant business lines in
the EMEA region who perform a significant management
function corresponding to PRA and FCA Senior
Managers of the UK Companies or FCA controlled
function CF29.
Other Code Staff: other employees whose activities have
a material impact on the risk profile of the firm.
As required by Article 450(2) of CRR, the quantitative
information referred to in Article 450(1)(h) of CRR has also
been provided at the level of the management body of
Goldman Sachs International. Amounts disclosed in this
respect are also included in the amounts for senior
management.
Form of Remuneration
Senior Manage-
ment
Other Code Staff
Total Manage-
ment Body1
Fixed, of which:
Non-equity remuneration ($ in millions)
115.6 491.6 607.2 27.4
Restricted Stock Units (number of RSUs in 000s)
51 0 51 45
Variable, of which:
Non-equity remuneration ($ in millions)
12.3 60.0 72.3 6.8
Restricted Stock Units (number of RSUs in 000s)
347 1,232 1,579 100
1. Reflects internal and independent members of the Board of
Directors of Goldman Sachs International

GOLDMAN SACHS GROUP UK LIMITED
Pillar 3 Disclosures
December 2016 | Pillar 3 Disclosures 47
Deferred Remuneration
The table below includes remuneration subject to the
deferral requirements in Principle 12 of the Remuneration
Code. The amounts relate only to those employees who
were Code Staff at the end of the fiscal year, December 31,
2016.
Restricted Stock Units (number of RSUs in 000s)
Senior Manage-
ment
Other Code Staff
Total Manage-
ment Body
Outstanding unvested as at 1 January 20161
1,273 2,459 3,732 426
Awarded during 20161 754 1,815 2,568 244
Paid out during 2016 683 1,063 1,746 217
Reduced through performance adjustments during 2016
0 0 0 0
Outstanding unvested as at 31 December 20161
1,343 3,211 4,553 454
Sign-on and Severance Payments
One sign-on payment was awarded to Code Staff during
2016. Three Code Staff were awarded severance payments
during 2016.
Senior Manage-
ment
Other Code Staff
Total Highest
Individual Award
Severance payment - Cash awards ($ in millions)
0 0.8 0.8 0.4
Sign-on award – Restricted Stock Units (number of RSUs in 000s)
0 4 4 4
No sign-on or severance payments were awarded to
members of the Management body.
1 Amounts disclosed above do not include awards made under the
Long-Term Performance Incentive Plan described on page 46 because the forward-looking period for calculating the metrics against which any payouts are assessed is ongoing.
Code Staff with Total Compensation above One Million
Euros
The following table shows the number of Code Staff with
total compensation above EUR 1 million arranged by
remuneration band for the financial year ended December
31, 2016.
Total Compensation Band (EUR)
Number of
Individuals
> 1,000,000 to < 1,500,000 111
> 1,500,000 to < 2,000,000 54
> 2,000,000 to < 2,500,000 30
> 2,500,000 to < 3,000,000 17
> 3,000,000 to < 3,500,000 19
> 3,500,000 to < 4,000,000 4
> 4,000,000 to < 4,500,000 4
> 4,500,000 to < 5,000,000 7
> 5,000,000 to < 6,000,000 6
> 6,000,000 to < 7,000,000 10
> 7,000,000 to < 8,000,000 2
> 8,000,000 to < 9,000,000 4
> 9,000,000 10
Total 278