Embed Size (px)
Citation preview
Standard Chartered PLC Pillar 3 Disclosures 31 December 2011
Incorporated in England with registered number 966425 Registered Office: 1 Aldermanbury Square, London, EC2V 7SB, England
Standard Chartered
Pillar 3 Disclosures
31 December 2011
2
Overview
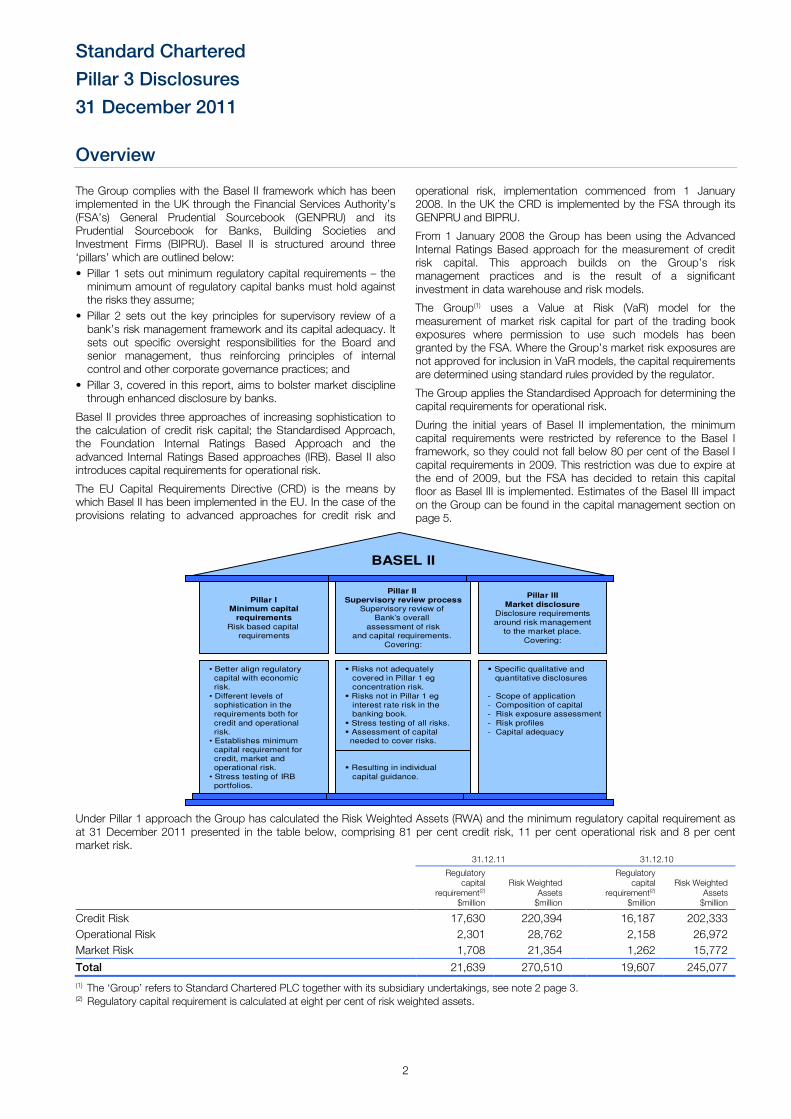
The Group complies with the Basel II framework which has been implemented in the UK through the Financial Services Authority’s (FSA’s) General Prudential Sourcebook (GENPRU) and its Prudential Sourcebook for Banks, Building Societies and Investment Firms (BIPRU). Basel II is structured around three ‘pillars’ which are outlined below:
• Pillar 1 sets out minimum regulatory capital requirements – the minimum amount of regulatory capital banks must hold against the risks they assume;
• Pillar 2 sets out the key principles for supervisory review of a bank’s risk management framework and its capital adequacy. It sets out specific oversight responsibilities for the Board and senior management, thus reinforcing principles of internal control and other corporate governance practices; and
• Pillar 3, covered in this report, aims to bolster market discipline through enhanced disclosure by banks.
Basel II provides three approaches of increasing sophistication to the calculation of credit risk capital; the Standardised Approach, the Foundation Internal Ratings Based Approach and the advanced Internal Ratings Based approaches (IRB). Basel II also introduces capital requirements for operational risk.
The EU Capital Requirements Directive (CRD) is the means by which Basel II has been implemented in the EU. In the case of the provisions relating to advanced approaches for credit risk and
operational risk, implementation commenced from 1 January 2008. In the UK the CRD is implemented by the FSA through its GENPRU and BIPRU.
From 1 January 2008 the Group has been using the Advanced Internal Ratings Based approach for the measurement of credit risk capital. This approach builds on the Group’s risk management practices and is the result of a significant investment in data warehouse and risk models.
The Group(1) uses a Value at Risk (VaR) model for the measurement of market risk capital for part of the trading book exposures where permission to use such models has been granted by the FSA. Where the Group’s market risk exposures are not approved for inclusion in VaR models, the capital requirements are determined using standard rules provided by the regulator.
The Group applies the Standardised Approach for determining the capital requirements for operational risk.
During the initial years of Basel II implementation, the minimum capital requirements were restricted by reference to the Basel I framework, so they could not fall below 80 per cent of the Basel I capital requirements in 2009. This restriction was due to expire at the end of 2009, but the FSA has decided to retain this capital floor as Basel III is implemented. Estimates of the Basel III impact on the Group can be found in the capital management section on page 5.
Under Pillar 1 approach the Group has calculated the Risk Weighted Assets (RWA) and the minimum regulatory capital requirement as at 31 December 2011 presented in the table below, comprising 81 per cent credit risk, 11 per cent operational risk and 8 per cent market risk. 31.12.11 31.12.10
Regulatory capital
requirement(2) $million
Risk Weighted Assets $million
Regulatory capital
requirement(2) $million
Risk Weighted Assets $million
Credit Risk 17,630 220,394 16,187 202,333
Operational Risk 2,301 28,762 2,158 26,972
Market Risk 1,708 21,354 1,262 15,772
Total 21,639 270,510 19,607 245,077
(1) The ‘Group’ refers to Standard Chartered PLC together with its subsidiary undertakings, see note 2 page 3. (2) Regulatory capital requirement is calculated at eight per cent of risk weighted assets.
Pillar IMinimum capital
requirements
Risk based capital
requirements
• Better align regulatory
capital with economic
risk.
• Different levels of
sophistication in the
requirements both for
credit and operational
risk.• Establishes minimum
capital requirement for
credit, market and
operational risk.
• Stress testing of IRB
portfolios.
Pillar III
Market disclosure
Disclosure requirements
around risk management
to the market place.
Covering:
Pillar II
Supervisory review processSupervisory review of
Bank’s overall
assessment of risk
and capital requirements.
Covering:
� Risks not adequately
covered in Pillar 1 eg
concentration risk.
� Risks not in Pillar 1 eg
interest rate risk in the
banking book.
� Stress testing of all risks.
� Assessment of capital needed to cover risks.
� Resulting in individual
capital guidance.
BASEL II
� Specific qualitative and
quantitative disclosures
- Scope of application
- Composition of capital
- Risk exposure assessment
- Risk profiles
- Capital adequacy
Standard Chartered
Pillar 3 Disclosures
31 December 2011
3
Contents Page 1. Scope of Basel II framework .......................................................................................................................... 4 2. Capital management .................................................................................................................................... 5
2.1. Capital structure .................................................................................................................................... 6 3. Risk management ....................................................................................................................................... 12 4. Credit risk .................................................................................................................................................... 15
4.1. Internal Ratings Based Approach to credit risk .................................................................................. 17
4.2. Standardised Approach to credit risk ................................................................................................ 17
4.3. Regulatory capital requirements ........................................................................................................ 18
4.4. Exposure values ................................................................................................................................ 20
4.5. Credit risk mitigation ........................................................................................................................ 25
4.6. Internal Ratings Based models ......................................................................................................... 27
4.7. Risk grade profile .............................................................................................................................. 30
4.8. Problem credit management and provisioning .................................................................................. 34
4.9. Counterparty credit risk in the trading book ...................................................................................... 39
4.10. Securitisation ................................................................................................................................... 41 5. Market risk ................................................................................................................................................. 46 6. Operational risk .......................................................................................................................................... 50 7. Remuneration .............................................................................................................................................. 51 8. Group entities .............................................................................................................................................. 54 9. Immaterial portfolios .................................................................................................................................... 54 10. Forward looking statements ........................................................................................................................ 54 11. Acronyms .................................................................................................................................................... 55 (1) Standard Chartered PLC is headquartered in London where it is regulated by the UK’s FSA. (2) Within this document ‘the Group’ refers to Standard Chartered PLC together with its subsidiary undertakings. The Hong Kong Special Administrative Region of the People’s Republic of China is referred to as Hong Kong and includes Macau; India includes Nepal; The Republic of Korea is referred to as Korea; Middle East and Other South Asia (MESA) includes, amongst others: Afghanistan, Bahrain, Bangladesh, Egypt, Jordan, Lebanon, Oman, Pakistan, Qatar, Sri Lanka, United Arab Emirates (UAE); and Other Asia Pacific includes, amongst others: Australia, Brunei, Cambodia, China, Indonesia, Japan, Laos, Malaysia, Mauritius, the Philippines, Taiwan, Thailand and Vietnam.
(3) Throughout this document, unless another currency is specified, the word ‘dollar’ or symbol $ means United States dollar. (4) Throughout this document IRB refers to internal ratings based models used. The Group does not use the Foundation IRB approach. (5) In January 2012 the Group’s subsidiary in Korea, SC First Bank Korea Ltd was rebranded to Standard Chartered Bank Korea Ltd, and will be referred to as such throughout this document.
Standard Chartered
Pillar 3 Disclosures
31 December 2011
4
1. Scope of Basel II framework
Pillar 1 The Group’s lead supervisor, the FSA, formally approved the Group’s use of the IRB approach for calculating regulatory capital in 2007 and since 1 January 2008, the Group has been using the IRB approach for the measurement of credit risk capital. The IRB models cover 79 per cent of the Group’s credit RWA (2010: 78 per cent). Although the FSA’s approval covers the Group’s global operations, the Group also continues to work closely with other regulators and anticipates making further IRB applications to local regulators as and when permitted, and where it is considered appropriate to do so.
The Group applies a VaR model for the measurement of market risk capital in accordance with the scope of the permission to use such a model granted by the FSA. Where the Group’s market risk exposures are not approved for inclusion in its VaR model, capital requirements are based on standard rules provided by the regulator which are less risk sensitive.
The Group is also required to calculate a capital charge to cover operational risk for which the Group applies the Standardised Approach.
Pillar 2 Pillar 2 requires banks to undertake a comprehensive assessment of their risks and to determine the appropriate amounts of capital to be held against these risks where other suitable mitigants are not available. This risk and capital assessment is commonly referred to as the Internal Capital Adequacy Assessment Process (ICAAP). The range of risks that need to be covered by the ICAAP is much broader than Pillar 1, which covers only credit risk, market risk and operational risk.
The Group has developed an ICAAP framework which closely integrates the risk and capital assessment processes, and ensures that adequate levels of capital are maintained to support the Group’s current and projected demand for capital under expected and stressed conditions.
The ICAAP framework has been designed to be applied consistently across the organisation to meet the Pillar 2 requirements of local regulators. A description of the risk management framework is set out in section 3 Risk Management.
Under Pillar 2, regulators are required to undertake a review of banks’ ICAAPs. This is referred to as the Supervisory Review and Evaluation Process (SREP). The SREP forms part of the FSA’s
Advanced Risk Response Operating Framework (ARROW) and determines the minimum regulatory capital requirements of the Group, referred to as Individual Capital Guidance (ICG).
Pillar 3 Pillar 3 aims to provide a consistent and comprehensive disclosure framework that enhances comparability between banks and further promotes improvements in risk practices. The Group has implemented a Pillar 3 policy and procedure framework to address the requirements laid down for Pillar 3 disclosure. The information provided here has been reviewed and validated by senior management and is in accordance with the rules in force at the time of publication and laid out in the FSA Handbook and BIPRU chapter 11, covering both the qualitative and quantitative items. Disclosure relating to remuneration follows the requirements of FSA Policy Statement PS10/21 issued in December 2010. Further details and disclosure of risk, liquidity, capital management and remuneration are presented in the Annual Report and Accounts. In accordance with the Group’s policy the full Pillar 3 disclosures will be made annually as at 31 December, and will be published on the Standard Chartered PLC website www.standardchartered.com as soon as is practical after the Group announces its annual results.
Accounting and prudential treatment The full Pillar 3 disclosures are made for the consolidated Standard Chartered PLC Group. Additional disclosures of the capital requirements of the Group’s significant subsidiaries are shown in section 2.1 on page 11.
The accounting policy for consolidation is provided in the notes to the financial statements, published in the Annual Report and Accounts. All subsidiaries are fully consolidated and the treatment is the same for both regulatory and accounting purposes. For associates, the regulatory treatment differs from the accounting policy, which applies the equity accounting method. Investments in associates that are between 20 and 50 per cent owned are proportionally consolidated for regulatory purposes and the investment in associates that are between 10 and 20 per cent owned are deducted from capital resources. Joint ventures are proportionally consolidated for both accounting and regulatory purposes.
Section 8. Group entities on page 54, lists the entities where regulatory treatment differs from the accounting treatment. The Group’s principal subsidiary undertakings are also detailed in this section.
Standard Chartered
Pillar 3 Disclosures
31 December 2011
5
2. Capital management
The Group’s approach to capital management is driven by its desire to maintain a strong capital base to support the development of its business, to meet regulatory capital requirements at all times and to maintain good credit ratings.
Strategic, business and capital plans are drawn up annually covering a five year horizon and are approved by the Board. The capital plan ensures that adequate levels of capital and an optimum mix of the different components of capital are maintained to support the Group’s strategy.
The capital plan takes the following into account:
• current regulatory capital requirements and the Group’s assessment of future standards;
• demand for capital due to business growth forecasts, loan impairment outlook and market shocks or stresses;
• forecast demand for capital to support credit ratings and as a signalling tool to the market;
• available supply of capital and capital raising options.
The Group formulates a capital plan with the help of internal models and other quantitative techniques. The models help to estimate potential future losses arising from credit, market and other risks, and using regulatory formulae the amount of capital required to support them. In addition, the models enable the Group to gain an enhanced understanding of its risk profile, e.g. by identifying potential concentrations and assessing the impact of portfolio management actions. Stress testing and scenario analysis are used to ensure that the Group’s internal capital assessment considers the impact of extreme but plausible scenarios on its risk profile and capital position. They provide an insight into the potential impact of significant adverse events and how these could be mitigated.
The Group uses a capital model to assess the capital requirement for material risks, and support its internal capital adequacy assessment. Each material risk is assessed, relevant mitigants considered, and appropriate levels of capital determined. The capital modelling process is a key part of the Group’s management disciplines.
A strong governance and process framework is embedded in the capital planning and assessment methodology. Overall responsibility for the effective management of risk rests with the Board. The Board Risk Committee (BRC) reviews specific risk areas and the key issues discussed at the capital management committees, namely the Capital Management Committee and the Group Asset and Liability Committee (GALCO)
At a country level, capital is monitored by the local Asset and Liability Committee (ALCO), which is responsible for managing
the country level balance sheet, capital and liquidity. Appropriate policies are in place governing the transfer of capital within the Group. These ensure that capital is remitted as appropriate, subject to complying with local regulatory requirements and statutory and contractual restrictions. There are no current material practical or legal impediments to the prompt transfer of capital resources in excess of those required for regulatory purposes or repayment of liabilities between the parent company, Standard Chartered PLC and its subsidiaries when due.
Group Treasury is responsible for the ongoing assessment of the demand for capital and the updating of the Group’s capital plan.
Current Compliance with Capital Adequacy Regulations The Group’s lead supervisor is the FSA. The capital that the Group is required to hold by the FSA is determined by the Group’s balance sheet, off-balance sheet, counterparty and other risk exposures.
Capital in branches and subsidiaries is maintained on the basis of host regulator’s requirements and the Group’s assessment of capital requirements under normal and stress conditions. Suitable processes and controls are in place to monitor and manage capital adequacy and ensure compliance with local regulatory ratios in all legal entities of the Group. These processes are designed to ensure that the Group has sufficient capital available to meet local regulatory capital requirements at all times.
Basel III The Basel III rules text published in December 2010 by the Basel Committee on Banking Supervision (BCBS) serves to bring together the details of global regulatory standards on bank capital adequacy and liquidity. While these give us greater clarity on the global regulatory standards and the various timelines for transition, significant uncertainty remains around the specific application and the combined impact of these proposals, in particular their effect at Group level via the implementation of changes to European Union legislation (the package of reforms commonly referred to as the Capital Requirements Directive IV (“CRD IV”).
The Group estimates that the impact of adjustments to risk-weighted assets and regulatory capital as a result of Basel III will reduce the Group’s future Core Tier 1 capital ratio by around 100 basis points. On a Basel III basis the Group’s capital position remains strong. The actual outcome will depend on how the emerging rules are implemented, what the future shape of the Group is and the extent to which the Group’s regulators give recognition to the Group’s schedule of model-based calculation of risk weighted assets (RWA).
Standard Chartered
Pillar 3 Disclosures
31 December 2011
6
2.1. Capital structure
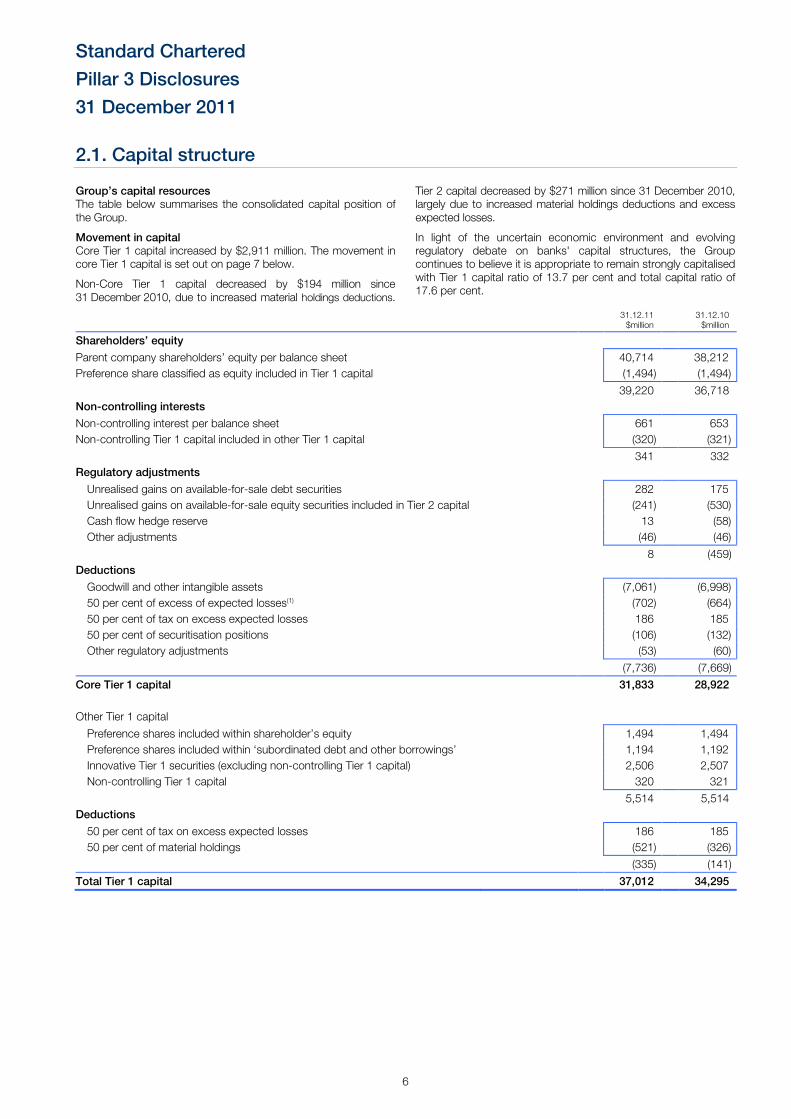
Group’s capital resources The table below summarises the consolidated capital position of the Group.
Movement in capital Core Tier 1 capital increased by $2,911 million. The movement in core Tier 1 capital is set out on page 7 below.
Non-Core Tier 1 capital decreased by $194 million since 31 December 2010, due to increased material holdings deductions.
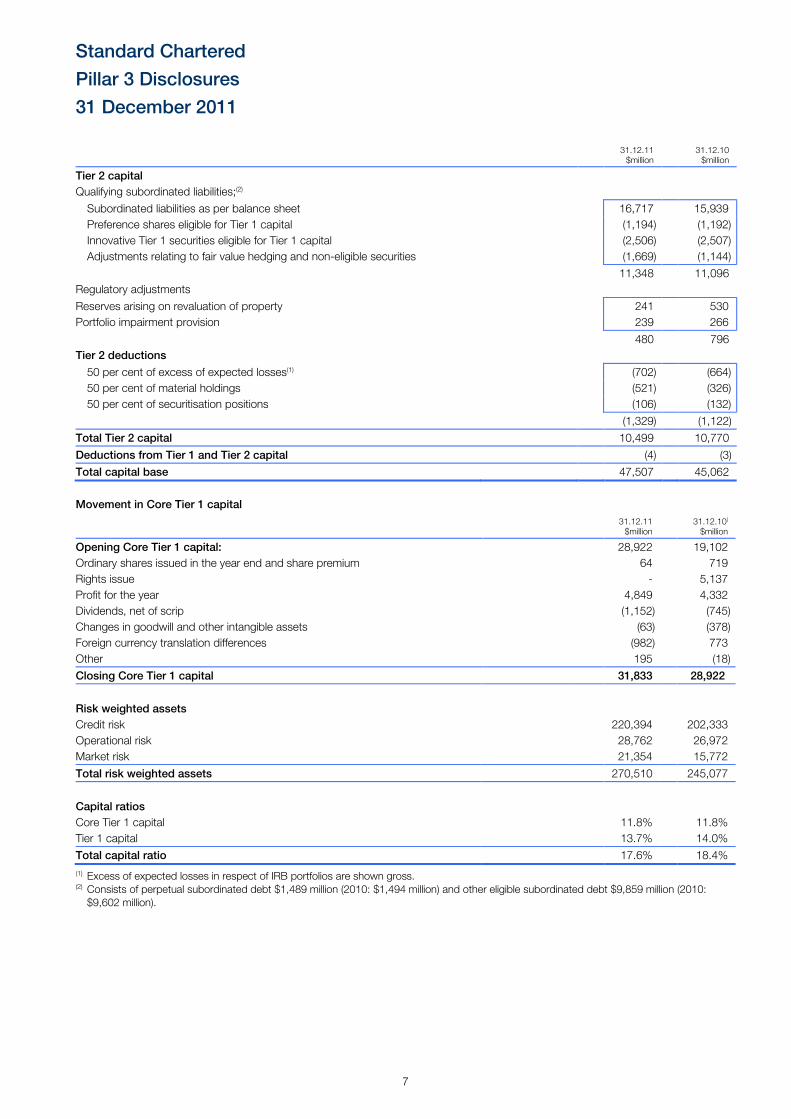
Tier 2 capital decreased by $271 million since 31 December 2010, largely due to increased material holdings deductions and excess expected losses.
In light of the uncertain economic environment and evolving regulatory debate on banks' capital structures, the Group continues to believe it is appropriate to remain strongly capitalised with Tier 1 capital ratio of 13.7 per cent and total capital ratio of 17.6 per cent.
31.12.11 $million
31.12.10 $million
Shareholders’ equity
Parent company shareholders’ equity per balance sheet 40,714 38,212
Preference share classified as equity included in Tier 1 capital (1,494) (1,494)
39,220 36,718
Non-controlling interests
Non-controlling interest per balance sheet 661 653
Non-controlling Tier 1 capital included in other Tier 1 capital (320) (321)
341 332
Regulatory adjustments
Unrealised gains on available-for-sale debt securities 282 175
Unrealised gains on available-for-sale equity securities included in Tier 2 capital (241) (530)
Cash flow hedge reserve 13 (58)
Other adjustments (46) (46)
8 (459)
Deductions
Goodwill and other intangible assets (7,061) (6,998)
50 per cent of excess of expected losses(1) (702) (664)
50 per cent of tax on excess expected losses 186 185
50 per cent of securitisation positions (106) (132)
Other regulatory adjustments (53) (60)
(7,736) (7,669)
Core Tier 1 capital 31,833 28,922
Other Tier 1 capital
Preference shares included within shareholder’s equity 1,494 1,494
Preference shares included within ‘subordinated debt and other borrowings’ 1,194 1,192
Innovative Tier 1 securities (excluding non-controlling Tier 1 capital) 2,506 2,507
Non-controlling Tier 1 capital 320 321
5,514 5,514
Deductions
50 per cent of tax on excess expected losses 186 185
50 per cent of material holdings (521) (326)
(335) (141)
Total Tier 1 capital 37,012 34,295
Standard Chartered
Pillar 3 Disclosures
31 December 2011
7
31.12.11 $million
31.12.10 $million
Tier 2 capital
Qualifying subordinated liabilities;(2)
Subordinated liabilities as per balance sheet 16,717 15,939
Preference shares eligible for Tier 1 capital (1,194) (1,192)
Innovative Tier 1 securities eligible for Tier 1 capital (2,506) (2,507)
Adjustments relating to fair value hedging and non-eligible securities (1,669) (1,144)
11,348 11,096
Regulatory adjustments
Reserves arising on revaluation of property 241 530
Portfolio impairment provision 239 266
480 796
Tier 2 deductions
50 per cent of excess of expected losses(1) (702) (664)
50 per cent of material holdings (521) (326)
50 per cent of securitisation positions (106) (132)
(1,329) (1,122)
Total Tier 2 capital 10,499 10,770
Deductions from Tier 1 and Tier 2 capital (4) (3)
Total capital base 47,507 45,062
Movement in Core Tier 1 capital
31.12.11 $million
31.12.10( $million
Opening Core Tier 1 capital: 28,922 19,102
Ordinary shares issued in the year end and share premium 64 719
Rights issue - 5,137
Profit for the year 4,849 4,332
Dividends, net of scrip (1,152) (745)
Changes in goodwill and other intangible assets (63) (378)
Foreign currency translation differences (982) 773
Other 195 (18)
Closing Core Tier 1 capital 31,833 28,922
Risk weighted assets
Credit risk 220,394 202,333
Operational risk 28,762 26,972
Market risk 21,354 15,772
Total risk weighted assets 270,510 245,077
Capital ratios
Core Tier 1 capital 11.8% 11.8%
Tier 1 capital 13.7% 14.0%
Total capital ratio 17.6% 18.4%
(1) Excess of expected losses in respect of IRB portfolios are shown gross. (2) Consists of perpetual subordinated debt $1,489 million (2010: $1,494 million) and other eligible subordinated debt $9,859 million (2010: $9,602 million).
Standard Chartered
Pillar 3 Disclosures
31 December 2011
8
Capital instruments issued by the Group All capital instruments included in the capital base have been issued in accordance with the rules and guidance in GENPRU. For regulatory purposes, capital is categorised into two main categories, or tiers, depending on the degree of permanency and loss absorbency exhibited. These are Tier 1 and Tier 2 capital which are described below where relevant.
Tier 1 capital Tier 1 capital is comprised of permanent share capital, profit and loss account and other eligible reserves, equity non-controlling interests, perpetual non-cumulative preference shares and innovative Tier 1 instruments, after the deduction of certain regulatory adjustments.
Permanent share capital is an item of capital issued by an organisation to an investor, which is fully paid-up and where the proceeds of issue are immediately and fully available. There is no obligation to pay a coupon or dividend to the shareholder. The
capital is available for unrestricted and immediate use to cover risks and losses, and enable the organisation to continue trading. It can only be redeemed on the winding-up of the organisation.
Profit and loss account and other eligible reserves are accumulated resources included in shareholders’ funds in an organisation’s balance sheet, with certain regulatory adjustments applied.
Equity non-controlling interests represent the equity stakes held by non-controlling shareholders in the Group’s undertakings.
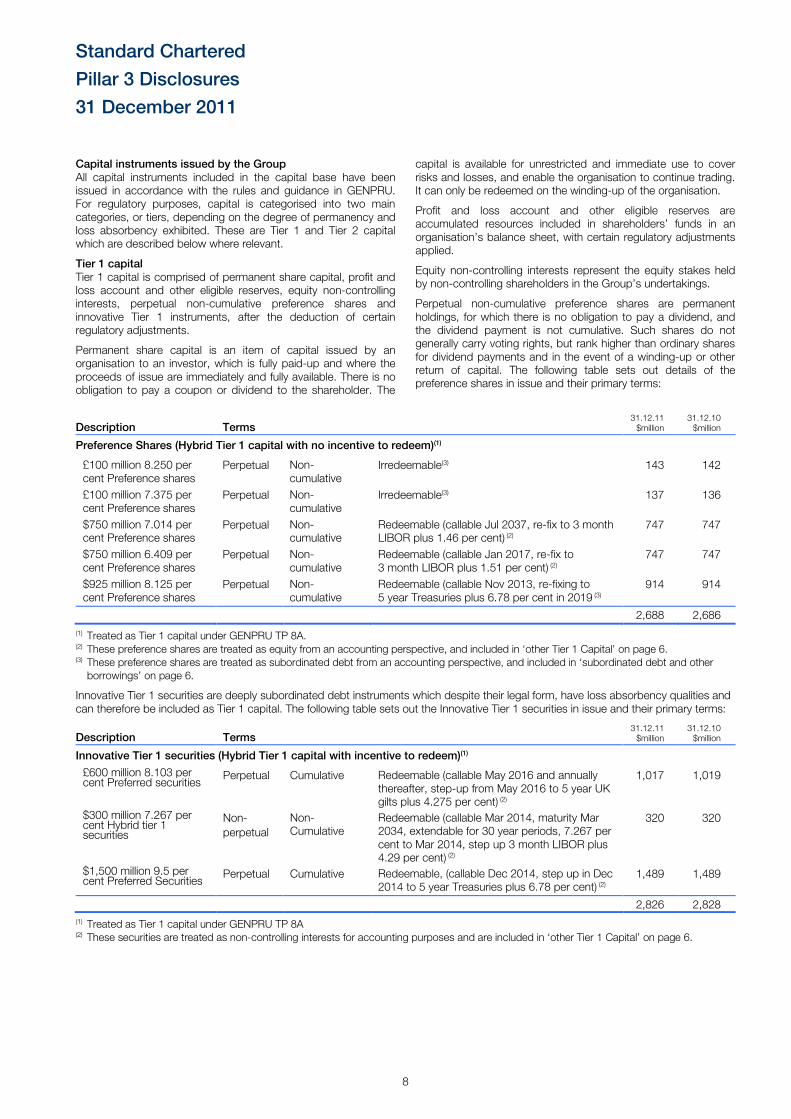
Perpetual non-cumulative preference shares are permanent holdings, for which there is no obligation to pay a dividend, and the dividend payment is not cumulative. Such shares do not generally carry voting rights, but rank higher than ordinary shares for dividend payments and in the event of a winding-up or other return of capital. The following table sets out details of the preference shares in issue and their primary terms:
Description Terms 31.12.11 $million
31.12.10 $million
Preference Shares (Hybrid Tier 1 capital with no incentive to redeem)(1)
£100 million 8.250 per cent Preference shares
Perpetual Non-cumulative
Irredeemable(3) 143 142
£100 million 7.375 per cent Preference shares
Perpetual Non-cumulative
Irredeemable(3) 137 136
$750 million 7.014 per cent Preference shares
Perpetual Non-cumulative
Redeemable (callable Jul 2037, re-fix to 3 month LIBOR plus 1.46 per cent) (2)
747 747
$750 million 6.409 per cent Preference shares
Perpetual Non-cumulative
Redeemable (callable Jan 2017, re-fix to 3 month LIBOR plus 1.51 per cent) (2)
747 747
$925 million 8.125 per cent Preference shares
Perpetual Non-cumulative
Redeemable (callable Nov 2013, re-fixing to 5 year Treasuries plus 6.78 per cent in 2019 (3)
914 914
2,688 2,686
(1) Treated as Tier 1 capital under GENPRU TP 8A. (2) These preference shares are treated as equity from an accounting perspective, and included in ‘other Tier 1 Capital’ on page 6. (3) These preference shares are treated as subordinated debt from an accounting perspective, and included in ‘subordinated debt and other borrowings’ on page 6.
Innovative Tier 1 securities are deeply subordinated debt instruments which despite their legal form, have loss absorbency qualities and can therefore be included as Tier 1 capital. The following table sets out the Innovative Tier 1 securities in issue and their primary terms:
Description Terms 31.12.11 $million
31.12.10 $million
Innovative Tier 1 securities (Hybrid Tier 1 capital with incentive to redeem)(1)
£600 million 8.103 per cent Preferred securities
Perpetual
Cumulative Redeemable (callable May 2016 and annually thereafter, step-up from May 2016 to 5 year UK gilts plus 4.275 per cent) (2)
1,017 1,019
$300 million 7.267 per cent Hybrid tier 1 securities
Non-
perpetual
Non-Cumulative
Redeemable (callable Mar 2014, maturity Mar 2034, extendable for 30 year periods, 7.267 per cent to Mar 2014, step up 3 month LIBOR plus 4.29 per cent) (2)
320 320
$1,500 million 9.5 per cent Preferred Securities
Perpetual Cumulative Redeemable, (callable Dec 2014, step up in Dec 2014 to 5 year Treasuries plus 6.78 per cent) (2)
1,489 1,489
2,826 2,828
(1) Treated as Tier 1 capital under GENPRU TP 8A (2) These securities are treated as non-controlling interests for accounting purposes and are included in ‘other Tier 1 Capital’ on page 6.
Standard Chartered
Pillar 3 Disclosures
31 December 2011
9
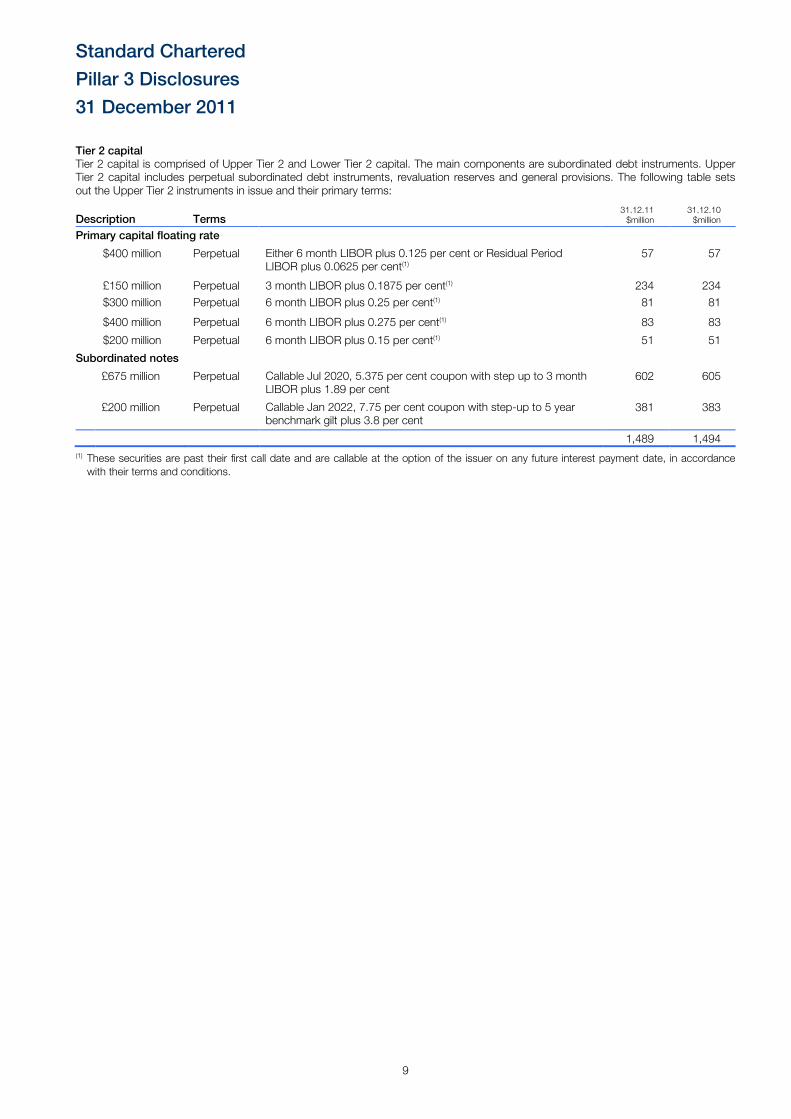
Tier 2 capital Tier 2 capital is comprised of Upper Tier 2 and Lower Tier 2 capital. The main components are subordinated debt instruments. Upper Tier 2 capital includes perpetual subordinated debt instruments, revaluation reserves and general provisions. The following table sets out the Upper Tier 2 instruments in issue and their primary terms:
Description Terms 31.12.11
$million 31.12.10 $million
Primary capital floating rate noes:
$400 million Perpetual Either 6 month LIBOR plus 0.125 per cent or Residual Period LIBOR plus 0.0625 per cent(1)
57 57
£150 million Perpetual 3 month LIBOR plus 0.1875 per cent(1) 234 234
$300 million Perpetual 6 month LIBOR plus 0.25 per cent(1) 81 81
$400 million Perpetual 6 month LIBOR plus 0.275 per cent(1) 83 83
$200 million Perpetual 6 month LIBOR plus 0.15 per cent(1) 51 51
Subordinated notes
£675 million Perpetual Callable Jul 2020, 5.375 per cent coupon with step up to 3 month LIBOR plus 1.89 per cent
602 605
£200 million Perpetual Callable Jan 2022, 7.75 per cent coupon with step-up to 5 year benchmark gilt plus 3.8 per cent
381 383
1,489 1,494
(1) These securities are past their first call date and are callable at the option of the issuer on any future interest payment date, in accordance with their terms and conditions.
Standard Chartered
Pillar 3 Disclosures
31 December 2011
10
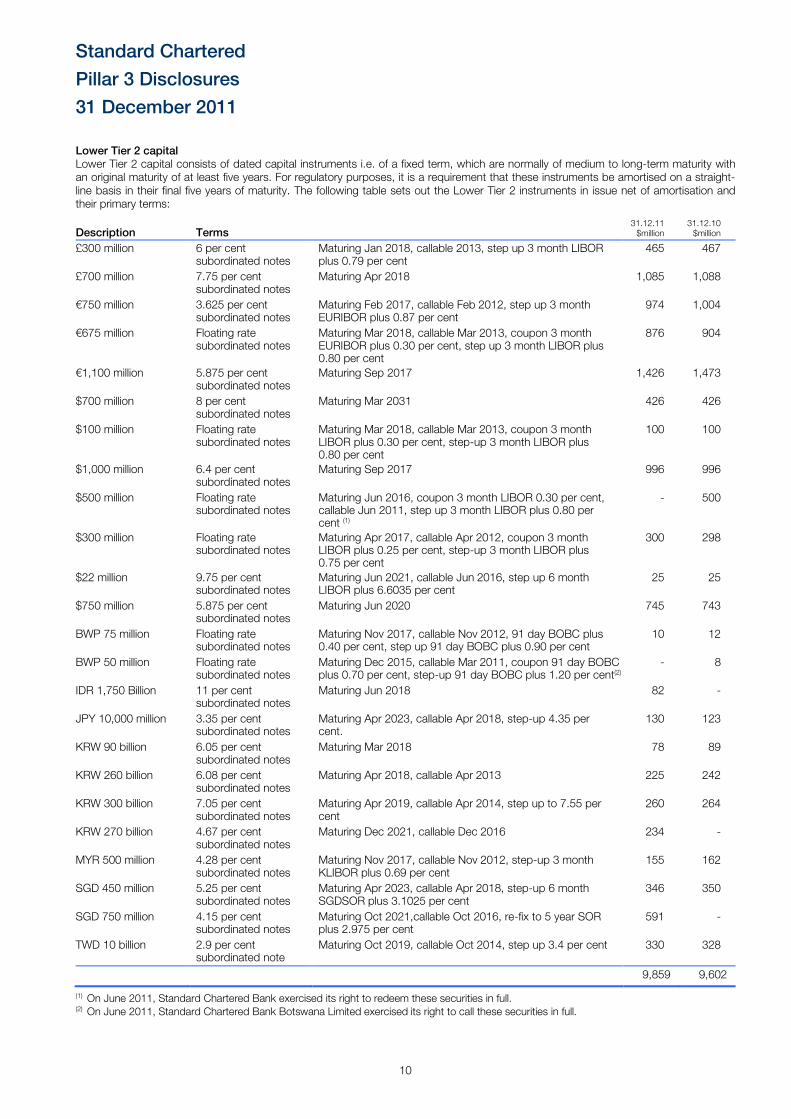
Lower Tier 2 capital Lower Tier 2 capital consists of dated capital instruments i.e. of a fixed term, which are normally of medium to long-term maturity with an original maturity of at least five years. For regulatory purposes, it is a requirement that these instruments be amortised on a straight-line basis in their final five years of maturity. The following table sets out the Lower Tier 2 instruments in issue net of amortisation and their primary terms:
Description Terms 31.12.11 $million
31.12.10 $million
£300 million 6 per cent subordinated notes
Maturing Jan 2018, callable 2013, step up 3 month LIBOR plus 0.79 per cent
465 467
£700 million 7.75 per cent subordinated notes
Maturing Apr 2018 1,085 1,088
€750 million 3.625 per cent subordinated notes
Maturing Feb 2017, callable Feb 2012, step up 3 month EURIBOR plus 0.87 per cent
974 1,004
€675 million Floating rate subordinated notes
Maturing Mar 2018, callable Mar 2013, coupon 3 month EURIBOR plus 0.30 per cent, step up 3 month LIBOR plus 0.80 per cent
876 904
€1,100 million 5.875 per cent subordinated notes
Maturing Sep 2017 1,426 1,473
$700 million 8 per cent subordinated notes
Maturing Mar 2031 426 426
$100 million Floating rate subordinated notes
Maturing Mar 2018, callable Mar 2013, coupon 3 month LIBOR plus 0.30 per cent, step-up 3 month LIBOR plus 0.80 per cent
100 100
$1,000 million 6.4 per cent subordinated notes
Maturing Sep 2017 996 996
$500 million Floating rate subordinated notes
Maturing Jun 2016, coupon 3 month LIBOR 0.30 per cent, callable Jun 2011, step up 3 month LIBOR plus 0.80 per cent (1)
- 500
$300 million Floating rate subordinated notes
Maturing Apr 2017, callable Apr 2012, coupon 3 month LIBOR plus 0.25 per cent, step-up 3 month LIBOR plus 0.75 per cent
300 298
$22 million 9.75 per cent subordinated notes
Maturing Jun 2021, callable Jun 2016, step up 6 month LIBOR plus 6.6035 per cent
25 25
$750 million 5.875 per cent subordinated notes
Maturing Jun 2020 745 743
BWP 75 million Floating rate subordinated notes
Maturing Nov 2017, callable Nov 2012, 91 day BOBC plus 0.40 per cent, step up 91 day BOBC plus 0.90 per cent
10 12
BWP 50 million Floating rate subordinated notes
Maturing Dec 2015, callable Mar 2011, coupon 91 day BOBC plus 0.70 per cent, step-up 91 day BOBC plus 1.20 per cent(2)
- 8
IDR 1,750 Billion 11 per cent subordinated notes
Maturing Jun 2018 82 -
JPY 10,000 million 3.35 per cent subordinated notes
Maturing Apr 2023, callable Apr 2018, step-up 4.35 per cent.
130 123
KRW 90 billion 6.05 per cent subordinated notes
Maturing Mar 2018 78 89
KRW 260 billion 6.08 per cent subordinated notes
Maturing Apr 2018, callable Apr 2013 225 242
KRW 300 billion 7.05 per cent subordinated notes
Maturing Apr 2019, callable Apr 2014, step up to 7.55 per cent
260 264
KRW 270 billion 4.67 per cent subordinated notes
Maturing Dec 2021, callable Dec 2016 234 -
MYR 500 million 4.28 per cent subordinated notes
Maturing Nov 2017, callable Nov 2012, step-up 3 month KLIBOR plus 0.69 per cent
155 162
SGD 450 million 5.25 per cent subordinated notes
Maturing Apr 2023, callable Apr 2018, step-up 6 month SGDSOR plus 3.1025 per cent
346 350
SGD 750 million 4.15 per cent subordinated notes
Maturing Oct 2021,callable Oct 2016, re-fix to 5 year SOR plus 2.975 per cent
591 -
TWD 10 billion 2.9 per cent subordinated note
Maturing Oct 2019, callable Oct 2014, step up 3.4 per cent 330 328
9,859 9,602
(1) On June 2011, Standard Chartered Bank exercised its right to redeem these securities in full. (2) On June 2011, Standard Chartered Bank Botswana Limited exercised its right to call these securities in full.
Standard Chartered
Pillar 3 Disclosures
31 December 2011
11
Regulatory deductions The FSA requires deductions and prudential filters to be applied in calculating capital for regulatory purposes. The following items are deducted from Core Tier 1 capital:
• Goodwill, which is the accounting adjustment recognised in the preparation of a group’s consolidated accounts arising on an acquisition; and
• Intangible assets such as software licences.
The following are deducted from Core Tier 1 and Tier 2 capital in equal proportions:
• The excess of expected loss over related provisions;
• The retained portion of the securitisation asset pool which has been assigned a risk weighting of 1250 per cent; and
• Material holdings (being investments in excess of 10 per cent of the share capital of a credit or financial institution) are deducted from Tier 1 and Tier 2 capital in equal proportions.
Lending of a capital nature to a connected party or guarantees provided to such a party is deducted from total Tier 1 and Tier 2 capital.
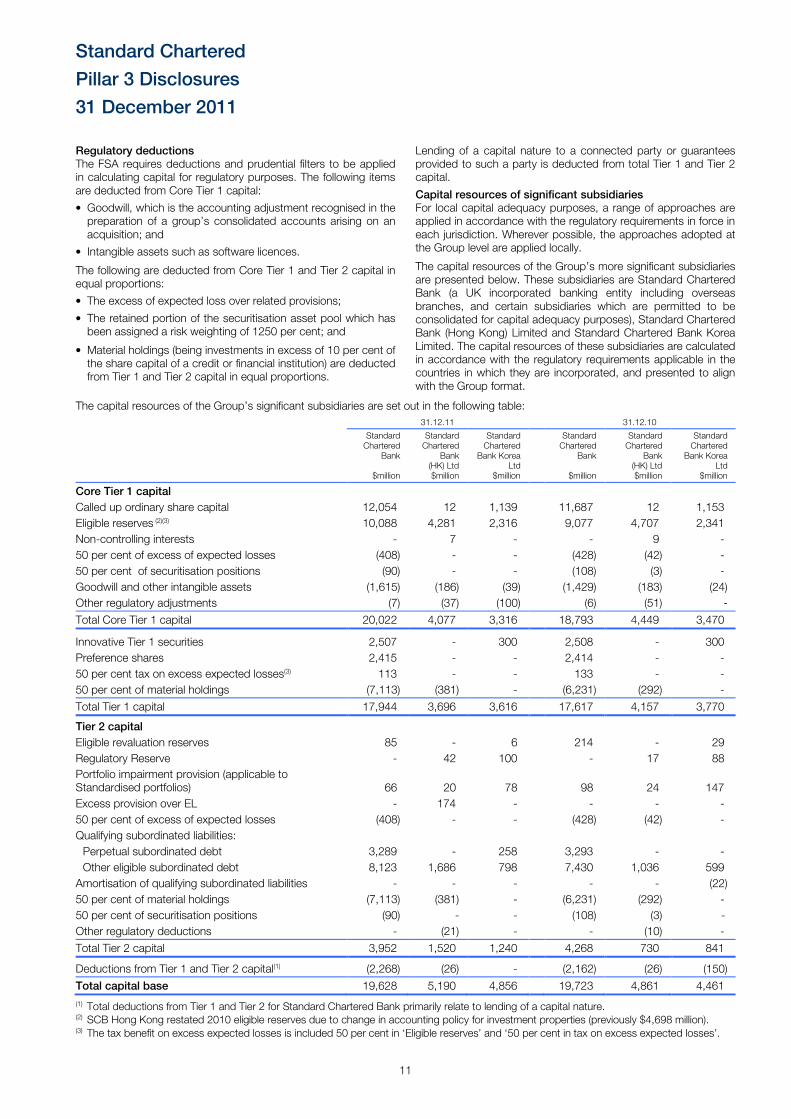
Capital resources of significant subsidiaries For local capital adequacy purposes, a range of approaches are applied in accordance with the regulatory requirements in force in each jurisdiction. Wherever possible, the approaches adopted at the Group level are applied locally.
The capital resources of the Group’s more significant subsidiaries are presented below. These subsidiaries are Standard Chartered Bank (a UK incorporated banking entity including overseas branches, and certain subsidiaries which are permitted to be consolidated for capital adequacy purposes), Standard Chartered Bank (Hong Kong) Limited and Standard Chartered Bank Korea Limited. The capital resources of these subsidiaries are calculated in accordance with the regulatory requirements applicable in the countries in which they are incorporated, and presented to align with the Group format. .
The capital resources of the Group’s significant subsidiaries are set out in the following table:
31.12.11 31.12.10
Standard Chartered
Bank
$million
Standard Chartered
Bank (HK) Ltd $million
Standard Chartered
Bank Korea Ltd
$million
Standard Chartered
Bank
$million
Standard Chartered
Bank (HK) Ltd $million
Standard Chartered
Bank Korea Ltd
$million
Core Tier 1 capital
Called up ordinary share capital 12,054 12 1,139 11,687 12 1,153
Eligible reserves (2)(3) 10,088 4,281 2,316 9,077 4,707 2,341
Non-controlling interests - 7 - - 9 -
50 per cent of excess of expected losses (408) - - (428) (42) -
50 per cent of securitisation positions (90) - - (108) (3) -
Goodwill and other intangible assets (1,615) (186) (39) (1,429) (183) (24)
Other regulatory adjustments (7) (37) (100) (6) (51) -
Total Core Tier 1 capital 20,022 4,077 3,316 18,793 4,449 3,470
Innovative Tier 1 securities 2,507 - 300 2,508 - 300
Preference shares 2,415 - - 2,414 - -
50 per cent tax on excess expected losses(3) 113 - - 133 - -
50 per cent of material holdings (7,113) (381) - (6,231) (292) -
Total Tier 1 capital 17,944 3,696 3,616 17,617 4,157 3,770
Tier 2 capital
Eligible revaluation reserves 85 - 6 214 - 29
Regulatory Reserve - 42 100 - 17 88
Portfolio impairment provision (applicable to Standardised portfolios) 66 20 78 98 24 147
Excess provision over EL - 174 - - - -
50 per cent of excess of expected losses (408) - - (428) (42) -
Qualifying subordinated liabilities:
Perpetual subordinated debt 3,289 - 258 3,293 - -
Other eligible subordinated debt 8,123 1,686 798 7,430 1,036 599
Amortisation of qualifying subordinated liabilities - - - - - (22)
50 per cent of material holdings (7,113) (381) - (6,231) (292) -
50 per cent of securitisation positions (90) - - (108) (3) -
Other regulatory deductions - (21) - - (10) -
Total Tier 2 capital 3,952 1,520 1,240 4,268 730 841
Deductions from Tier 1 and Tier 2 capital(1) (2,268) (26) - (2,162) (26) (150)
Total capital base 19,628 5,190 4,856 19,723 4,861 4,461
(1) Total deductions from Tier 1 and Tier 2 for Standard Chartered Bank primarily relate to lending of a capital nature. (2) SCB Hong Kong restated 2010 eligible reserves due to change in accounting policy for investment properties (previously $4,698 million). (3) The tax benefit on excess expected losses is included 50 per cent in ‘Eligible reserves’ and ‘50 per cent in tax on excess expected losses’.
Standard Chartered
Pillar 3 Disclosures
31 December 2011
12
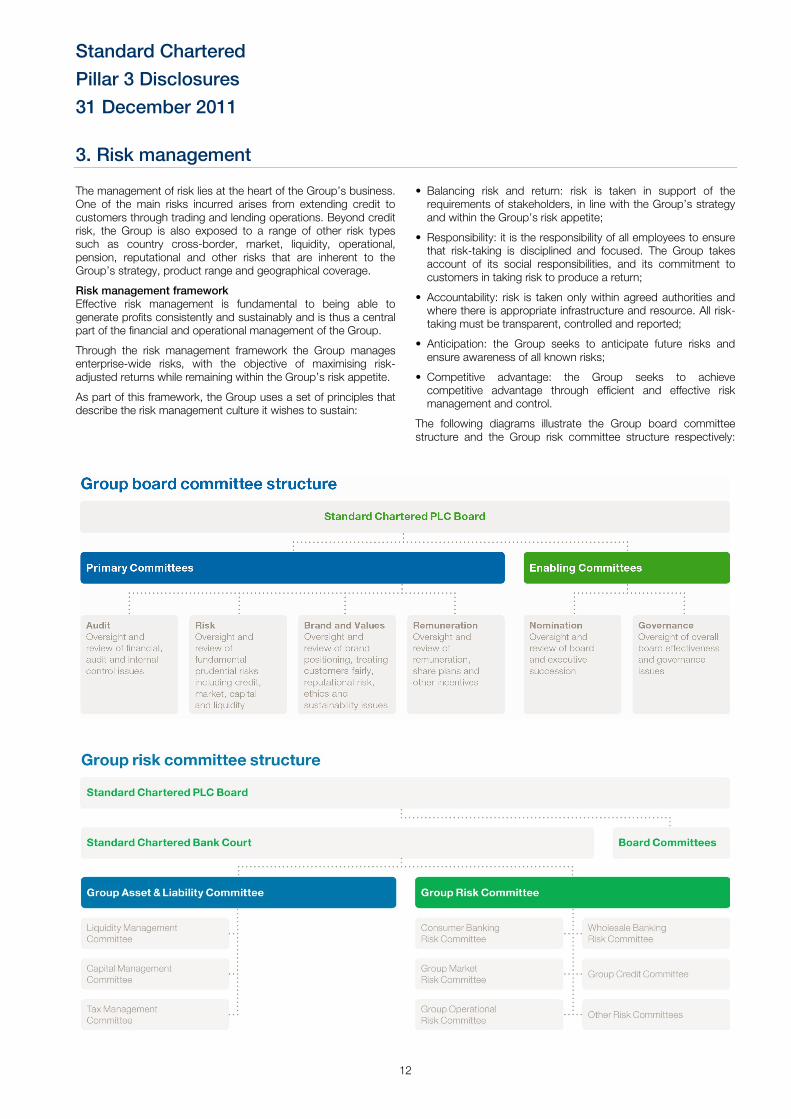
3. Risk management
The management of risk lies at the heart of the Group’s business. One of the main risks incurred arises from extending credit to customers through trading and lending operations. Beyond credit risk, the Group is also exposed to a range of other risk types such as country cross-border, market, liquidity, operational, pension, reputational and other risks that are inherent to the Group’s strategy, product range and geographical coverage.
Risk management framework Effective risk management is fundamental to being able to generate profits consistently and sustainably and is thus a central part of the financial and operational management of the Group.
Through the risk management framework the Group manages enterprise-wide risks, with the objective of maximising risk-adjusted returns while remaining within the Group’s risk appetite.
As part of this framework, the Group uses a set of principles that describe the risk management culture it wishes to sustain:
• Balancing risk and return: risk is taken in support of the requirements of stakeholders, in line with the Group’s strategy and within the Group’s risk appetite;
• Responsibility: it is the responsibility of all employees to ensure that risk-taking is disciplined and focused. The Group takes account of its social responsibilities, and its commitment to customers in taking risk to produce a return;
• Accountability: risk is taken only within agreed authorities and where there is appropriate infrastructure and resource. All risk-taking must be transparent, controlled and reported;
• Anticipation: the Group seeks to anticipate future risks and ensure awareness of all known risks;
• Competitive advantage: the Group seeks to achieve competitive advantage through efficient and effective risk management and control.
The following diagrams illustrate the Group board committee structure and the Group risk committee structure respectively:
Standard Chartered
Pillar 3 Disclosures
31 December 2011
13
Risk governance Ultimate responsibility for setting the Group’s risk appetite and for the effective management of risk rests with the Board.
Acting within an authority delegated by the Board, the Board Risk Committee (BRC), whose membership is comprised exclusively of non-executive directors of the Group, has responsibility for oversight and review of prudential risks including but not limited to credit, market, capital, liquidity, operational and reputational. It reviews the Group’s overall risk appetite and makes recommendations thereon to the Board. Its responsibilities also include reviewing the appropriateness and effectiveness of the Group’s risk management systems and controls, considering the implications of material regulatory change proposals, ensuring effective due diligence on material acquisitions and disposals, and monitoring the activities of the Group Risk Committee (GRC) and the Group Asset and Liability Committtee (GALCO).
The BRC receives regular reports on risk management, including the Group’s portfolio trends, policies and standards, stress testing, liquidity and capital adequacy, and is authorised to investigate or seek any information relating to an activity within its term of reference.
The Board Brand and Values Committee (BVC) oversees the brand, values and good reputation of the Group. It ensures that the management of reputational risk is consistent with the risk appetite approved by the Board and with the creation of long term shareholder value.
The role of the Board Audit Committee is to have oversight and review of financial, audit and internal control issues.
Overall accountability for risk management is held by the Standard Chartered Bank Court (the Court) which comprises the group executive directors and other senior executives of Standard Chartered Bank.
The Court is the highest executive body of the Group and its terms of reference are approved by the Board of Standard Chartered PLC. The Court delegates authority for the management of risk to the GRC and the GALCO.
The GRC is responsible for the management of all risks other than those delegated by the Court to the GALCO. The GRC is responsible for the establishment of, and compliance with, policies relating to credit risk, country cross-border risk, market risk, operational risk, pension risk and reputational risk. The GRC also defines the overall risk management framework.
The GALCO is responsible for the management of capital and the establishment of, and compliance with, policies relating to balance sheet management, including management of liquidity, capital adequacy and structural foreign exchange and interest rate risk.
Members of the Court are also members of both the GRC and the GALCO. The GRC is chaired by the Group Chief Risk Officer (GCRO). The GALCO is chaired by the Group Finance Director.
Risk limits and risk exposure approval authority frameworks are set by the GRC in respect of credit risk, country cross-border risk, market risk and operational risk. The GALCO sets the approval authority framework in respect of liquidity risk. Risk approval authorities may be exercised by risk committees or authorised individuals.
The committee governance structure ensures that risk-taking authority and risk management policies are cascaded down from the Board through to the appropriate functional, divisional and country-level committees. Information regarding material risk issues and compliance with policies and standards is
communicated to the country, business, functional and Group-level committees.
Roles and responsibilities for risk management are defined under a Three Lines of Defence model. Each line of defence describes a specific set of responsibilities for risk management and control.
The first line of defence is that all employees are required to ensure the effective management of risks within the scope of their direct organisational responsibilities. Business, function and geographic governance heads are accountable for risk management in their respective businesses and functions, and for countries where they have governance responsibilities.
The second line of defence comprises the Risk Control Owners, supported by their respective control functions. Risk Control Owners are responsible for ensuring that the risks within the scope of their responsibilities remain within appetite. The scope of a Risk Control Owner’s responsibilities is defined by a given Risk Type and the risk management processes that relate to that Risk Type. These responsibilities cut across the Group and are not constrained by functional, business and geographic boundaries. The major risk types are described individually in the following sections.
The third line of defence is the independent assurance provided by the Group Internal Audit (GIA) function. Its role is defined and overseen by the Board Audit Committee.
The findings from the GIA’s audits are reported to all relevant management and governance bodies – accountable line managers, relevant oversight function or committee and committees of the Board.
GIA provides independent assurance of the effectiveness of management’s control of its own business activities (the first line) and of the processes maintained by the Risk Control Functions (the second line). As a result, GIA provides assurance that the overall system of control effectiveness is working as required within the risk management framework.
The Risk function The GCRO directly manages a Risk function that is separate from the origination, trading and sales functions of the businesses. The GCRO also chairs the GRC and is a member of the Group Management Committee.
The role of the Risk function is:
• to maintain the risk management framework, ensuring it remains appropriate to the Group’s activities, is effectively communicated and implemented across the Group and for administering related governance and reporting processes;
• to uphold the overall integrity of the Group’s risk/return decisions, and in particular for ensuring that risks are properly assessed, that risk/return decisions are made transparently on the basis of this proper assessment, and are controlled in accordance with the Group’s standards;
• to exercise direct Risk Control Ownership for Credit, Market, Country Cross-Border, Short-Term Liquidity and Operational Risk types.
The Group appoints Chief Risk Officers (CROs) for its two business divisions and principal countries and regions. CROs at all levels of the organisation, fulfil the same role as the GCRO, in respect of the business, geography or legal entity for which they are responsible. The roles of CROs are aligned at each level.
The Risk function is independent of the origination, trading and sales functions to ensure that the necessary balance in risk/return decisions is not compromised by short-term pressures to
Standard Chartered
Pillar 3 Disclosures
31 December 2011
14
generate revenues. This is particularly important given that revenues are recognised from the point of sale while losses arising from risk positions typically manifest themselves over time.
In addition, the Risk function is a centre of excellence that provides specialist capabilities of relevance to risk management processes in the wider organisation.
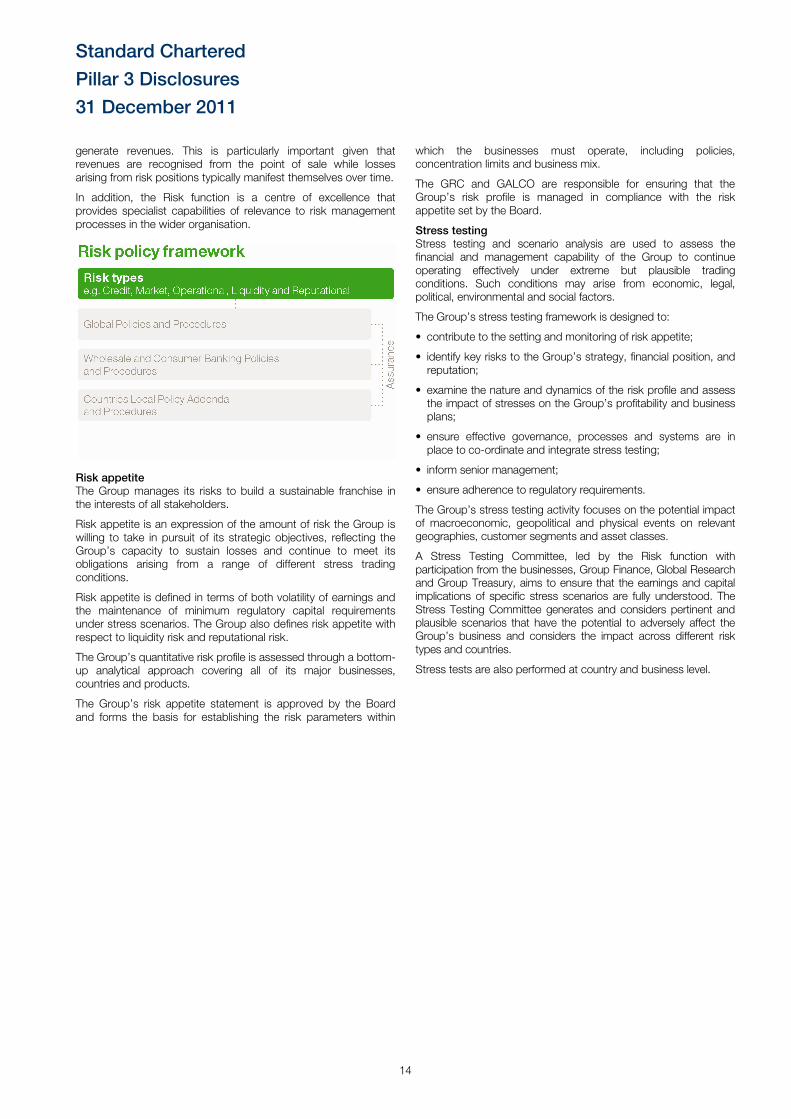
Risk appetite The Group manages its risks to build a sustainable franchise in the interests of all stakeholders.
Risk appetite is an expression of the amount of risk the Group is willing to take in pursuit of its strategic objectives, reflecting the Group’s capacity to sustain losses and continue to meet its obligations arising from a range of different stress trading conditions.
Risk appetite is defined in terms of both volatility of earnings and the maintenance of minimum regulatory capital requirements under stress scenarios. The Group also defines risk appetite with respect to liquidity risk and reputational risk.
The Group’s quantitative risk profile is assessed through a bottom-up analytical approach covering all of its major businesses, countries and products.
The Group’s risk appetite statement is approved by the Board and forms the basis for establishing the risk parameters within
which the businesses must operate, including policies, concentration limits and business mix.
The GRC and GALCO are responsible for ensuring that the Group’s risk profile is managed in compliance with the risk appetite set by the Board.
Stress testing Stress testing and scenario analysis are used to assess the financial and management capability of the Group to continue operating effectively under extreme but plausible trading conditions. Such conditions may arise from economic, legal, political, environmental and social factors.
The Group’s stress testing framework is designed to:
• contribute to the setting and monitoring of risk appetite;
• identify key risks to the Group’s strategy, financial position, and reputation;
• examine the nature and dynamics of the risk profile and assess the impact of stresses on the Group’s profitability and business plans;
• ensure effective governance, processes and systems are in place to co-ordinate and integrate stress testing;
• inform senior management;
• ensure adherence to regulatory requirements.
The Group’s stress testing activity focuses on the potential impact of macroeconomic, geopolitical and physical events on relevant geographies, customer segments and asset classes.
A Stress Testing Committee, led by the Risk function with participation from the businesses, Group Finance, Global Research and Group Treasury, aims to ensure that the earnings and capital implications of specific stress scenarios are fully understood. The Stress Testing Committee generates and considers pertinent and plausible scenarios that have the potential to adversely affect the Group’s business and considers the impact across different risk types and countries.
Stress tests are also performed at country and business level.
Standard Chartered
Pillar 3 Disclosures
31 December 2011
15
4. Credit risk
Credit risk is the potential for loss due to the failure of a counterparty to meet its obligations to pay the Group in accordance with agreed terms. Credit exposures may arise from both the banking and trading books.
Credit risk is managed through a framework that sets out policies and procedures covering the measurement and management of credit risk. There is a clear segregation of duties between transaction originators in the businesses and approvers in the Risk function. All credit exposure limits are approved within a defined credit approval authority framework.
Credit policies Group-wide credit policies and standards are considered and approved by the GRC, which also oversees the delegation of credit approval and loan impairment provisioning authorities.
Policies and procedures specific to each business are established by authorised risk committees within Wholesale and Consumer Banking. These are consistent with Group-wide credit policies, but are more detailed and adapted to reflect the different risk environments and portfolio characteristics.
Credit rating and measurement Risk measurement plays a central role, along with judgment and experience, in informing risk taking and portfolio management decisions. It is a primary area for sustained investment and senior management attention.
Since 1 January 2008, Standard Chartered has used the advanced Internal Ratings Based (IRB) approach under the Basel II regulatory framework to calculate credit risk capital.
For IRB portfolios, a standard alphanumeric credit risk grade (CG) system is used in both Wholesale and Consumer Banking. The grading is based on the Group’s internal estimate of probability of default over a one-year horizon, with customers or portfolios assessed against a range of quantitative and qualitative factors. The numeric grades run from 1 to 14 and some of the grades are further sub-classified A, B or C. Lower credit grades are indicative of a lower likelihood of default. Credit grades 1A to 12C are assigned to performing customers or accounts, while credit grades 13 and 14 are assigned to non-performing or defaulted customers.
The Group’s credit grades in Wholesale Banking are not intended to replicate external credit grades, and ratings assigned by external ratings agencies are not used in determining the Group’s internal credit grades. Nonetheless, as the factors used to grade a borrower may be similar, a borrower rated poorly by an external rating agency is typically assigned a worse internal credit grade.
Advanced IRB models cover a substantial majority of the Group’s exposures and are used extensively in assessing risks at a customer and portfolio level, setting strategy and optimising the Group’s risk-return decisions.
IRB risk measurement models are approved by the responsible risk committee, on the recommendation of the Group Model Assessment Committee (MAC). The MAC supports risk committees in ensuring risk identification and measurement capabilities are objective and consistent, so that risk control and risk origination decisions are properly informed. Prior to review by the MAC, all IRB models are validated in detail by a model validation team, which is separate from the teams that develop and maintain the models. Models undergo a detailed annual review. Reviews are also triggered if the performance of a model deteriorates materially against predetermined thresholds during the ongoing model performance monitoring process.
Credit approval Major credit exposures to individual counterparties, groups of connected counterparties and portfolios of retail exposures are reviewed and approved by the Group Credit Committee (GCC). The GCC derives its authority from the GRC.
All other credit approval authorities are delegated by the GRC to individuals based both on their judgment and experience and a risk-adjusted scale that takes account of the estimated maximum potential loss from a given customer or portfolio. Credit origination and approval roles are segregated in all but a very few authorised cases. In those very few exceptions where they are not, originators can only approve limited exposures within defined risk parameters.
Credit risk mitigation The Group’s credit risk mitigation policy, processes and amounts of collateral held are discussed in section 4.5 Credit risk mitigation on page 25.
Concentration risk Credit concentration risk is managed within concentration caps set by counterparty or groups of connected counterparties, by country and industry in Wholesale Banking and tracked by product and country in Consumer Banking. Additional targets are set and monitored for concentrations by credit rating.
Credit concentrations are monitored by the responsible risk committees in each of the businesses and concentration limits that are material to the Group are reviewed and approved at least annually by the GCC.
Credit monitoring The Group regularly monitors credit exposures, portfolio performance, and external trends that may impact risk management outcomes.
Internal risk management reports are presented to risk committees, containing information on key environmental, political and economic trends across major portfolios and countries; portfolio delinquency and loan impairment performance; and IRB portfolio metrics including credit grade migration.
The Wholesale Banking Credit Issues Forum (WBCIF) is a sub-committee of the Wholesale Banking Risk Committee, which in turn is a sub-committee of and derives its authority from the GRC. The WBCIF meets regularly to assess the impact of external events and trends on the Wholesale Banking credit risk portfolio and to define and implement the response in terms of appropriate changes to portfolio shape, portfolio and underwriting standards, risk policy and procedures.
Clients or portfolios are placed on early alert when they display signs of actual or potential weakness. For example, where there is a decline in the client’s position within the industry, financial deterioration, a breach of covenants, non-performance of an obligation within the stipulated period, or there are concerns relating to ownership or management.
Such accounts and portfolios are subjected to a dedicated process overseen by Early Alert Committees in countries. Client account plans and credit grades are re-evaluated. In addition, remedial actions are agreed and monitored. Remedial actions include, but are not limited to, exposure reduction, security enhancement, exiting the account or immediate movement of the account into the control of Group Special Assets Management (GSAM), the Group’s specialist recovery unit.
Standard Chartered
Pillar 3 Disclosures
31 December 2011
16
In Consumer Banking, portfolio delinquency trends are monitored continuously at a detailed level. Individual customer behaviour is also tracked and is considered for lending decisions. Accounts that are past due are subject to a collections process, managed independently by the Risk function. Charged-off accounts are managed by specialist recovery teams. In some countries, aspects of collections and recovery functions are outsourced.
The Small and Medium-sized Enterprise (SME) business is managed within Consumer Banking in two distinct customer sub-segments: small businesses and medium enterprises, differentiated by the annual turnover of the counterparty. The credit processes are further refined based on exposure at risk. Larger exposures are managed through the Discretionary Lending approach, in line with Wholesale Banking procedures, and smaller exposures are managed through Programmed Lending, in line with Consumer Banking procedures. Discretionary Lending and Private Banking past due accounts are managed by GSAM.
Traded products Credit risk from traded products is managed within the overall credit risk appetite for corporates and financial institutions.
The credit risk exposure from traded products is derived from the positive mark-to-market value of the underlying instruments, and an additional component to cater for potential market movements.
For derivative contracts, the Group limits exposure to credit losses in the event of default by entering into master netting
agreements with certain counterparties. As required by IAS 32, exposures are not presented net in the financial statements.
In addition, the Group enters into Credit Support Annexes (CSAs) with counterparties where collateral is deemed a necessary or desirable mitigant to the exposure.
Securities Within Wholesale Banking, the Underwriting Committee approves the portfolio limits and parameters by business unit for the underwriting and purchase of all pre-defined securities assets to be held for sale. The Underwriting Committee is established under the authority of the GRC. Wholesale Banking operates within set limits, which include country, single issuer, holding period and credit grade limits.
Day to day credit risk management activities for traded securities are carried out by Traded Credit Risk Management whose activities include oversight and approval within the levels delegated by the Underwriting Committee. Issuer credit risk, including settlement and pre-settlement risk, is controlled by Wholesale Banking Risk, while price risk is controlled by Group Market Risk.
The Underwriting Committee approves individual proposals to underwrite new security issues for our clients. Where an underwritten security is held for a period longer than the target sell-down period, the final decision on whether to sell the position rests with the Risk function.
Standard Chartered
Pillar 3 Disclosures
31 December 2011
17
4.1. Internal Ratings Based Approach to credit risk
The Group uses the IRB approach to manage credit risk for the majority of its portfolios. This allows the Group to use its own internal estimates of Probability of Default (PD), Loss Given Default (LGD), Exposure at Default (EAD) and Credit Conversion Factor (CCF) to determine an asset risk weighting.
PD is the likelihood that an obligor will default on an obligation. All banks utilising an IRB approach must assign internal PD to all borrowers in each borrower grade. EAD is the expected amount of exposure to a particular obligor at the point of default. CCF is an internally modeled parameter based on historical experience to determine the amount that is expected to be further drawn down from the undrawn portion in a committed facility. LGD is the percentage of EAD that a lender expects to lose in the event of obligor default.
All assets under the IRB approach have sophisticated PD, LGD and EAD/CCF models developed to support the credit decision making process. RWA under the IRB approach is determined by regulatory specified formulae dependent on the Group’s estimates of PD, LGD, EAD and CCF. The development, use and governance of models under the IRB approach is covered in more detail in section 4.6 Internal Ratings Based models.
Regulation BIPRU 4.2.30 allows IRB banks to elect to permanently exclude certain exposures from the IRB approach and use the Standardised Approach. These are known as permanent exemptions, and are required to be no greater than 15 per cent of the Group’s credit RWA.
The permanent exemptions for Consumer Banking include:
• Africa – all retail portfolios;
• Private Banking; and
• Portfolios where the size or nature makes application of the advanced approach inefficient.
For Wholesale Banking, permanent exemptions apply to:
• Private Equity;
• Development Organisations;
• Jordan and Lebanon;
• Purchased receivables.
The Group also applies the Standardised Approach to portfolios that are currently being transitioned to the IRB approach in accordance with the Group’s ‘IRB Roll Out Plan’. Direct comparability between current and prior year data for certain portfolios may not be possible during this transition period.
The Group has developed and is waiting approval from the FSA on a number of models.
4.2. Standardised Approach to credit risk
The Standardised Approach is applied to portfolios that are classified as permanently exempt from the IRB approach, and those portfolios that are currently under transition to the IRB approach in accordance with the Group’s ‘IRB Roll Out Plan’.
The Standardised Approach to credit risk measures credit risk pursuant to fixed risk weights and is the least sophisticated of the capital calculation methodologies. The risk weight applied under the Standardised Approach is given by the FSA and is based on the asset class to which the exposure is assigned.
For sovereigns, corporates and institutions, external ratings are used to assign risk weights. These external ratings must come
from FSA approved rating agencies, known as External Credit Assessment Institutions (ECAI); namely Moody’s, Standard & Poor’s and Fitch. The Group uses ratings from these agencies as part of its day to day business. External ratings for the counterparty are determined as soon as a relationship is established and these ratings are tracked and kept updated. Assessments provided by approved ECAI are mapped to credit quality steps as prescribed by the FSA.
The Group currently does not use assessments provided by export credit agencies for the purpose of evaluating RWA in the Standardised Approach.
Standard Chartered
Pillar 3 Disclosures
31 December 2011
18
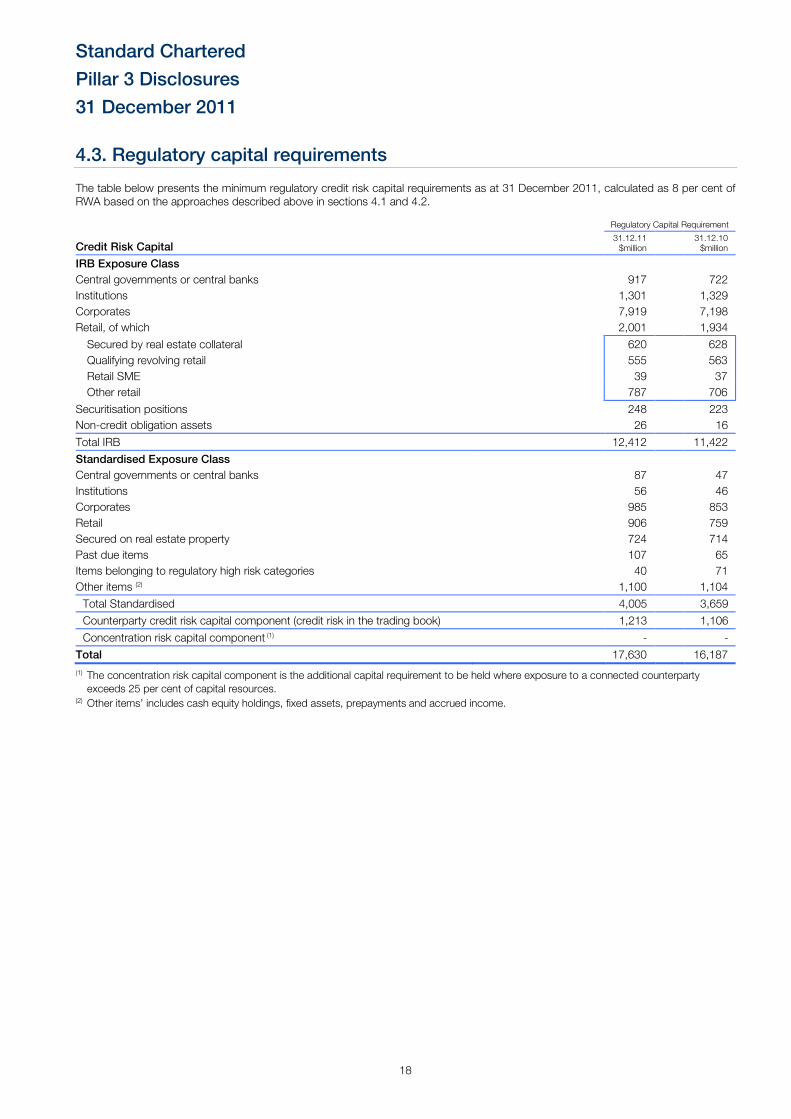
4.3. Regulatory capital requirements The table below presents the minimum regulatory credit risk capital requirements as at 31 December 2011, calculated as 8 per cent of RWA based on the approaches described above in sections 4.1 and 4.2.
Regulatory Capital Requirement
Credit Risk Capital 31.12.11 $million
31.12.10 $million
IRB Exposure Class
Central governments or central banks 917 722
Institutions 1,301 1,329
Corporates 7,919 7,198
Retail, of which 2,001 1,934
Secured by real estate collateral 620 628
Qualifying revolving retail 555 563
Retail SME 39 37
Other retail 787 706
Securitisation positions 248 223
Non-credit obligation assets 26 16
Total IRB 12,412 11,422
Standardised Exposure Class
Central governments or central banks 87 47
Institutions 56 46
Corporates 985 853
Retail 906 759
Secured on real estate property 724 714
Past due items 107 65
Items belonging to regulatory high risk categories 40 71
Other items (2) 1,100 1,104
Total Standardised 4,005 3,659
Counterparty credit risk capital component (credit risk in the trading book) 1,213 1,106
Concentration risk capital component (1) - -
Total 17,630 16,187
(1) The concentration risk capital component is the additional capital requirement to be held where exposure to a connected counterparty exceeds 25 per cent of capital resources.
(2) Other items’ includes cash equity holdings, fixed assets, prepayments and accrued income.
Standard Chartered
Pillar 3 Disclosures
31 December 2011
19
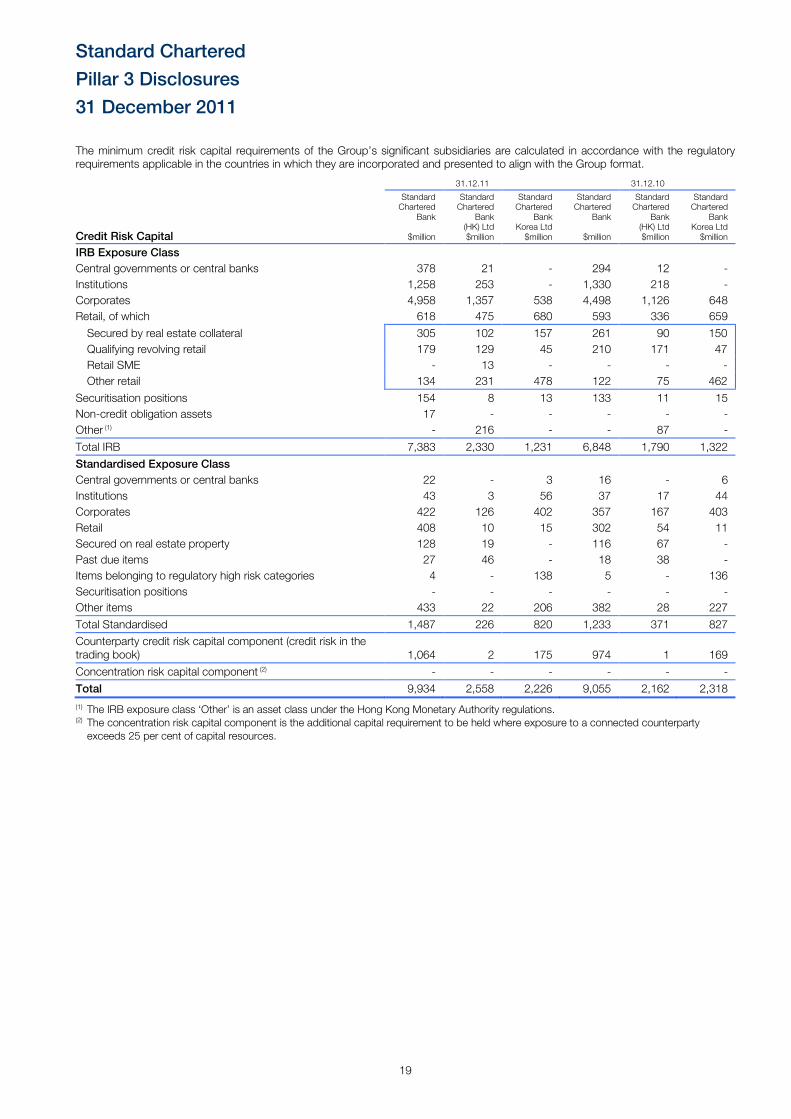
The minimum credit risk capital requirements of the Group’s significant subsidiaries are calculated in accordance with the regulatory requirements applicable in the countries in which they are incorporated and presented to align with the Group format.
31.12.11 31.12.10
Credit Risk Capital
Standard Chartered
Bank
$million
Standard Chartered
Bank (HK) Ltd $million
Standard Chartered
Bank Korea Ltd $million
Standard Chartered
Bank
$million
Standard Chartered
Bank (HK) Ltd $million
Standard Chartered
Bank Korea Ltd $million
IRB Exposure Class
Central governments or central banks 378 21 - 294 12 -
Institutions 1,258 253 - 1,330 218 -
Corporates 4,958 1,357 538 4,498 1,126 648
Retail, of which 618 475 680 593 336 659
Secured by real estate collateral 305 102 157 261 90 150
Qualifying revolving retail 179 129 45 210 171 47
Retail SME - 13 - - - -
Other retail 134 231 478 122 75 462
Securitisation positions 154 8 13 133 11 15
Non-credit obligation assets 17 - - - - -
Other (1) - 216 - - 87 -
Total IRB 7,383 2,330 1,231 6,848 1,790 1,322
Standardised Exposure Class
Central governments or central banks 22 - 3 16 - 6
Institutions 43 3 56 37 17 44
Corporates 422 126 402 357 167 403
Retail 408 10 15 302 54 11
Secured on real estate property 128 19 - 116 67 -
Past due items 27 46 - 18 38 -
Items belonging to regulatory high risk categories 4 - 138 5 - 136
Securitisation positions - - - - - -
Other items 433 22 206 382 28 227
Total Standardised 1,487 226 820 1,233 371 827
Counterparty credit risk capital component (credit risk in the trading book) 1,064 2 175 974 1 169
Concentration risk capital component (2) - - - - - -
Total 9,934 2,558 2,226 9,055 2,162 2,318
(1) The IRB exposure class ‘Other’ is an asset class under the Hong Kong Monetary Authority regulations. (2) The concentration risk capital component is the additional capital requirement to be held where exposure to a connected counterparty exceeds 25 per cent of capital resources.
Standard Chartered
Pillar 3 Disclosures
31 December 2011
20
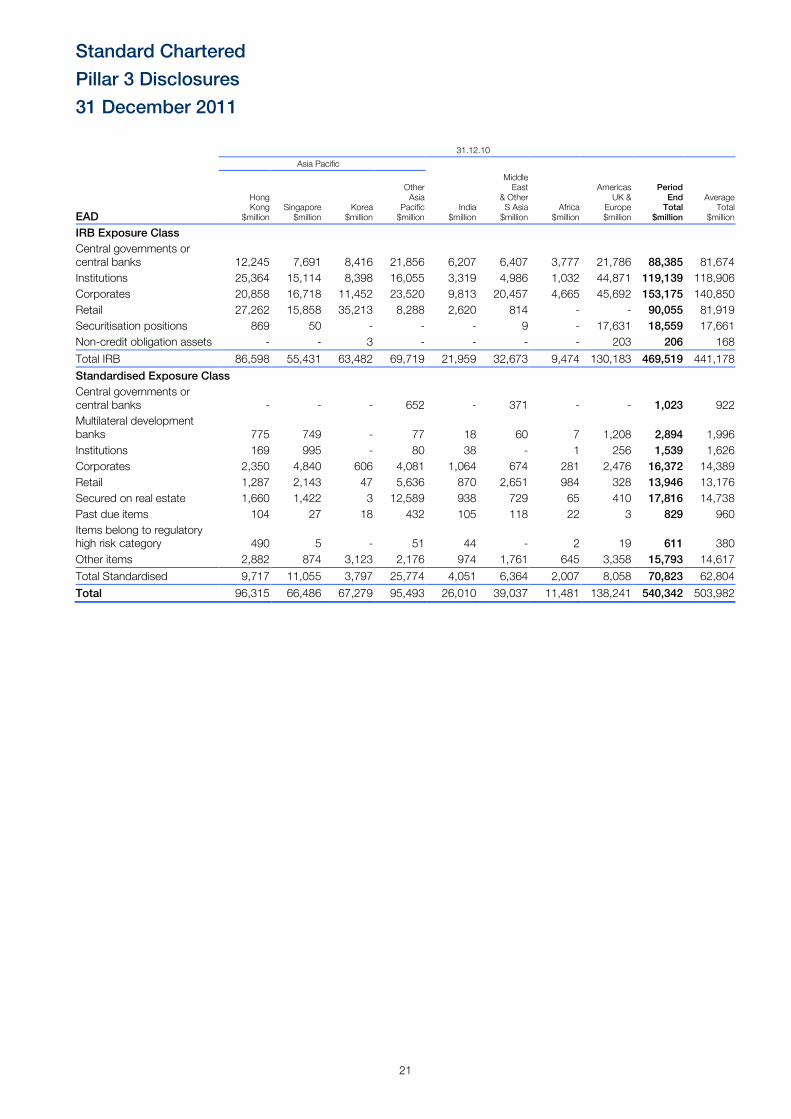
4.4. Exposure values
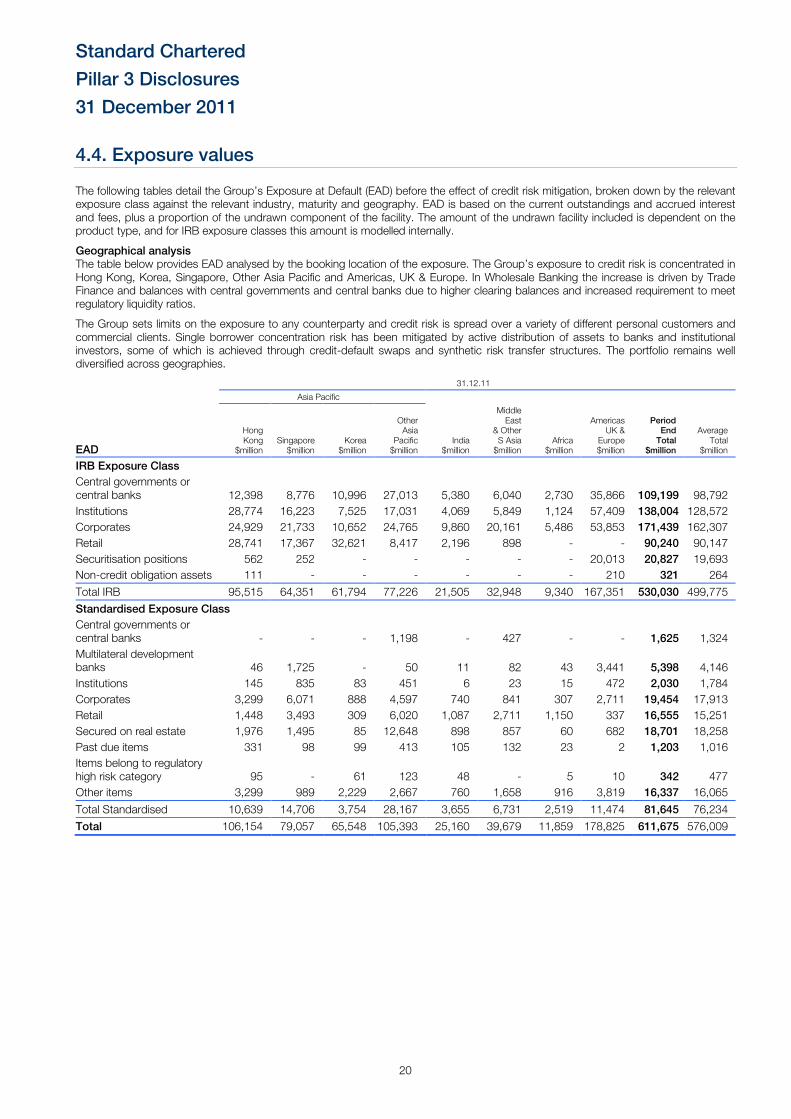
The following tables detail the Group’s Exposure at Default (EAD) before the effect of credit risk mitigation, broken down by the relevant exposure class against the relevant industry, maturity and geography. EAD is based on the current outstandings and accrued interest and fees, plus a proportion of the undrawn component of the facility. The amount of the undrawn facility included is dependent on the product type, and for IRB exposure classes this amount is modelled internally.
Geographical analysis The table below provides EAD analysed by the booking location of the exposure. The Group’s exposure to credit risk is concentrated in Hong Kong, Korea, Singapore, Other Asia Pacific and Americas, UK & Europe. In Wholesale Banking the increase is driven by Trade Finance and balances with central governments and central banks due to higher clearing balances and increased requirement to meet regulatory liquidity ratios.
The Group sets limits on the exposure to any counterparty and credit risk is spread over a variety of different personal customers and commercial clients. Single borrower concentration risk has been mitigated by active distribution of assets to banks and institutional investors, some of which is achieved through credit-default swaps and synthetic risk transfer structures. The portfolio remains well diversified across geographies.
31.12.11
Asia Pacific
EAD
Hong Kong
$million Singapore $million
Korea $million
Other Asia
Pacific $million
India $million
Middle East
& Other S Asia $million
Africa $million
Americas UK &
Europe $million
Period End
Total $million
Average Total
$million
IRB Exposure Class
Central governments or central banks 12,398 8,776 10,996 27,013 5,380 6,040 2,730 35,866 109,199 98,792
Institutions 28,774 16,223 7,525 17,031 4,069 5,849 1,124 57,409 138,004 128,572
Corporates 24,929 21,733 10,652 24,765 9,860 20,161 5,486 53,853 171,439 162,307
Retail 28,741 17,367 32,621 8,417 2,196 898 - - 90,240 90,147
Securitisation positions 562 252 - - - - - 20,013 20,827 19,693
Non-credit obligation assets 111 - - - - - - 210 321 264
Total IRB 95,515 64,351 61,794 77,226 21,505 32,948 9,340 167,351 530,030 499,775
Standardised Exposure Class
Central governments or central banks - - - 1,198 - 427 - - 1,625 1,324
Multilateral development banks 46 1,725 - 50 11 82 43 3,441 5,398 4,146
Institutions 145 835 83 451 6 23 15 472 2,030 1,784
Corporates 3,299 6,071 888 4,597 740 841 307 2,711 19,454 17,913
Retail 1,448 3,493 309 6,020 1,087 2,711 1,150 337 16,555 15,251
Secured on real estate 1,976 1,495 85 12,648 898 857 60 682 18,701 18,258
Past due items 331 98 99 413 105 132 23 2 1,203 1,016
Items belong to regulatory high risk category 95 - 61 123 48 - 5 10 342 477
Other items 3,299 989 2,229 2,667 760 1,658 916 3,819 16,337 16,065
Total Standardised 10,639 14,706 3,754 28,167 3,655 6,731 2,519 11,474 81,645 76,234
Total 106,154 79,057 65,548 105,393 25,160 39,679 11,859 178,825 611,675 576,009
Standard Chartered
Pillar 3 Disclosures
31 December 2011
21
31.12.10
Asia Pacific
EAD
Hong Kong
$million Singapore $million
Korea $million
Other Asia
Pacific $million
India $million
Middle East
& Other S Asia $million
Africa $million
Americas UK &
Europe $million
Period End
Total $million
Average Total
$million
IRB Exposure Class
Central governments or central banks 12,245 7,691 8,416 21,856 6,207 6,407 3,777 21,786 88,385 81,674
Institutions 25,364 15,114 8,398 16,055 3,319 4,986 1,032 44,871 119,139 118,906
Corporates 20,858 16,718 11,452 23,520 9,813 20,457 4,665 45,692 153,175 140,850
Retail 27,262 15,858 35,213 8,288 2,620 814 - - 90,055 81,919
Securitisation positions 869 50 - - - 9 - 17,631 18,559 17,661
Non-credit obligation assets - - 3 - - - - 203 206 168
Total IRB 86,598 55,431 63,482 69,719 21,959 32,673 9,474 130,183 469,519 441,178
Standardised Exposure Class
Central governments or central banks - - - 652 - 371 - - 1,023 922
Multilateral development banks 775 749 - 77 18 60 7 1,208 2,894 1,996
Institutions 169 995 - 80 38 - 1 256 1,539 1,626
Corporates 2,350 4,840 606 4,081 1,064 674 281 2,476 16,372 14,389
Retail 1,287 2,143 47 5,636 870 2,651 984 328 13,946 13,176
Secured on real estate 1,660 1,422 3 12,589 938 729 65 410 17,816 14,738
Past due items 104 27 18 432 105 118 22 3 829 960
Items belong to regulatory high risk category 490 5 - 51 44 - 2 19 611 380
Other items 2,882 874 3,123 2,176 974 1,761 645 3,358 15,793 14,617
Total Standardised 9,717 11,055 3,797 25,774 4,051 6,364 2,007 8,058 70,823 62,804
Total 96,315 66,486 67,279 95,493 26,010 39,037 11,481 138,241 540,342 503,982
Standard Chartered
Pillar 3 Disclosures
31 December 2011
22
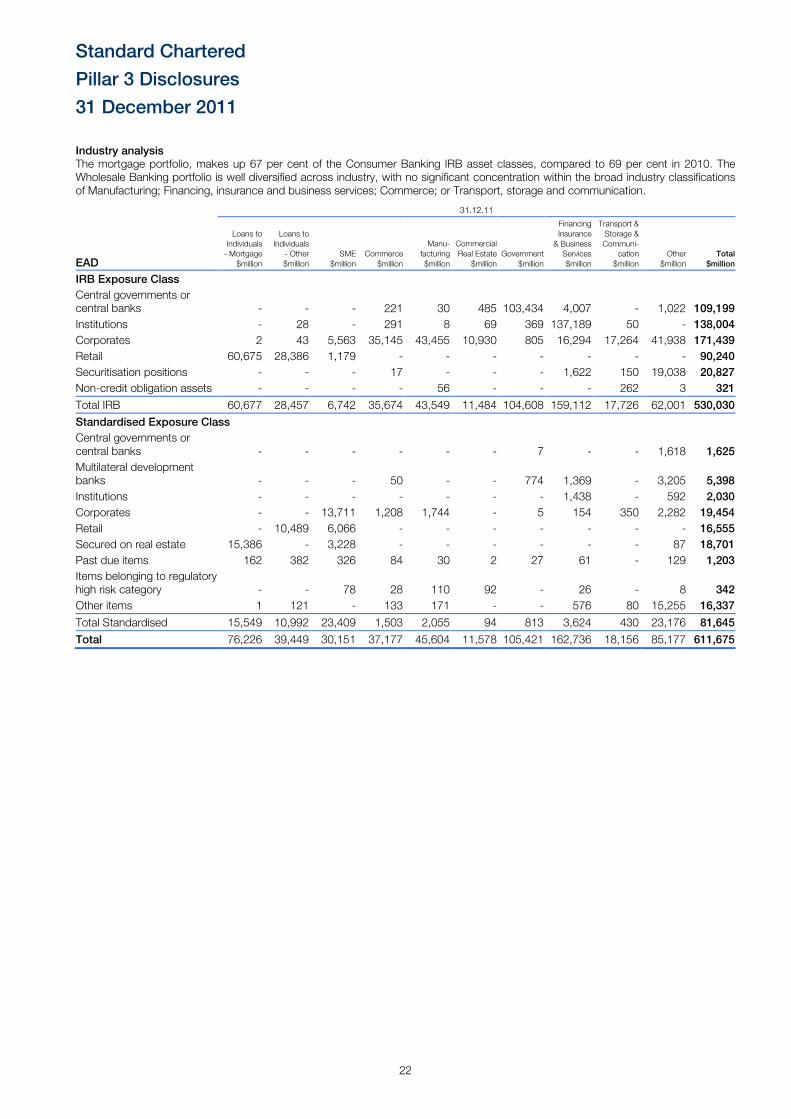
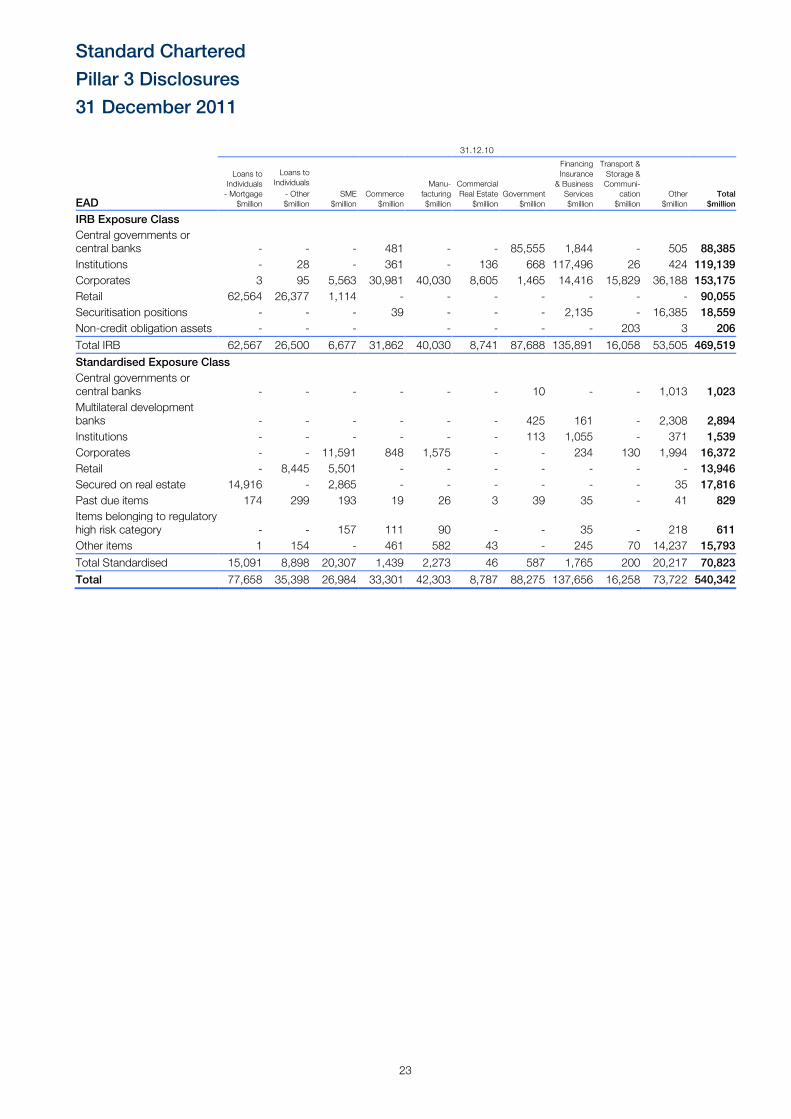
Industry analysis The mortgage portfolio, makes up 67 per cent of the Consumer Banking IRB asset classes, compared to 69 per cent in 2010. The Wholesale Banking portfolio is well diversified across industry, with no significant concentration within the broad industry classifications of Manufacturing; Financing, insurance and business services; Commerce; or Transport, storage and communication.
31.12.11
EAD
Loans to Individuals - Mortgage
$million
Loans to Individuals
- Other $million
SME $million
Commerce $million
Manu-facturing $million
Commercial Real Estate
$million Government
$million
Financing Insurance & Business Services $million
Transport & Storage & Communi-
cation $million
Other $million
Total $million
IRB Exposure Class
Central governments or central banks - - - 221 30 485 103,434 4,007 - 1,022 109,199
Institutions - 28 - 291 8 69 369 137,189 50 - 138,004
Corporates 2 43 5,563 35,145 43,455 10,930 805 16,294 17,264 41,938 171,439
Retail 60,675 28,386 1,179 - - - - - - - 90,240
Securitisation positions - - - 17 - - - 1,622 150 19,038 20,827
Non-credit obligation assets - - - - 56 - - - 262 3 321
Total IRB 60,677 28,457 6,742 35,674 43,549 11,484 104,608 159,112 17,726 62,001 530,030
Standardised Exposure Class
Central governments or central banks - - - - - - 7 - - 1,618 1,625
Multilateral development banks - - - 50 - - 774 1,369 - 3,205 5,398
Institutions - - - - - - - 1,438 - 592 2,030
Corporates - - 13,711 1,208 1,744 - 5 154 350 2,282 19,454
Retail - 10,489 6,066 - - - - - - - 16,555
Secured on real estate 15,386 - 3,228 - - - - - - 87 18,701
Past due items 162 382 326 84 30 2 27 61 - 129 1,203
Items belonging to regulatory high risk category - - 78 28 110 92 - 26 - 8 342
Other items 1 121 - 133 171 - - 576 80 15,255 16,337
Total Standardised 15,549 10,992 23,409 1,503 2,055 94 813 3,624 430 23,176 81,645
Total 76,226 39,449 30,151 37,177 45,604 11,578 105,421 162,736 18,156 85,177 611,675
Standard Chartered
Pillar 3 Disclosures
31 December 2011
23
31.12.10
EAD
Loans to Individuals - Mortgage
$million
Loans to Individuals
- Other $million
SME $million
Commerce $million
Manu-facturing $million
Commercial Real Estate
$million Government
$million
Financing Insurance & Business Services $million
Transport & Storage & Communi-
cation $million
Other $million
Total $million
IRB Exposure Class
Central governments or central banks - - - 481 - - 85,555 1,844 - 505 88,385
Institutions - 28 - 361 - 136 668 117,496 26 424 119,139
Corporates 3 95 5,563 30,981 40,030 8,605 1,465 14,416 15,829 36,188 153,175
Retail 62,564 26,377 1,114 - - - - - - - 90,055
Securitisation positions - - - 39 - - - 2,135 - 16,385 18,559
Non-credit obligation assets - - - - - - - 203 3 206
Total IRB 62,567 26,500 6,677 31,862 40,030 8,741 87,688 135,891 16,058 53,505 469,519
Standardised Exposure Class
Central governments or central banks - - - - - - 10 - - 1,013 1,023
Multilateral development banks - - - - - - 425 161 - 2,308 2,894
Institutions - - - - - - 113 1,055 - 371 1,539
Corporates - - 11,591 848 1,575 - - 234 130 1,994 16,372
Retail - 8,445 5,501 - - - - - - - 13,946
Secured on real estate 14,916 - 2,865 - - - - - - 35 17,816
Past due items 174 299 193 19 26 3 39 35 - 41 829
Items belonging to regulatory high risk category - - 157 111 90 - - 35 - 218 611
Other items 1 154 - 461 582 43 - 245 70 14,237 15,793
Total Standardised 15,091 8,898 20,307 1,439 2,273 46 587 1,765 200 20,217 70,823
Total 77,658 35,398 26,984 33,301 42,303 8,787 88,275 137,656 16,258 73,722 540,342
Standard Chartered
Pillar 3 Disclosures
31 December 2011
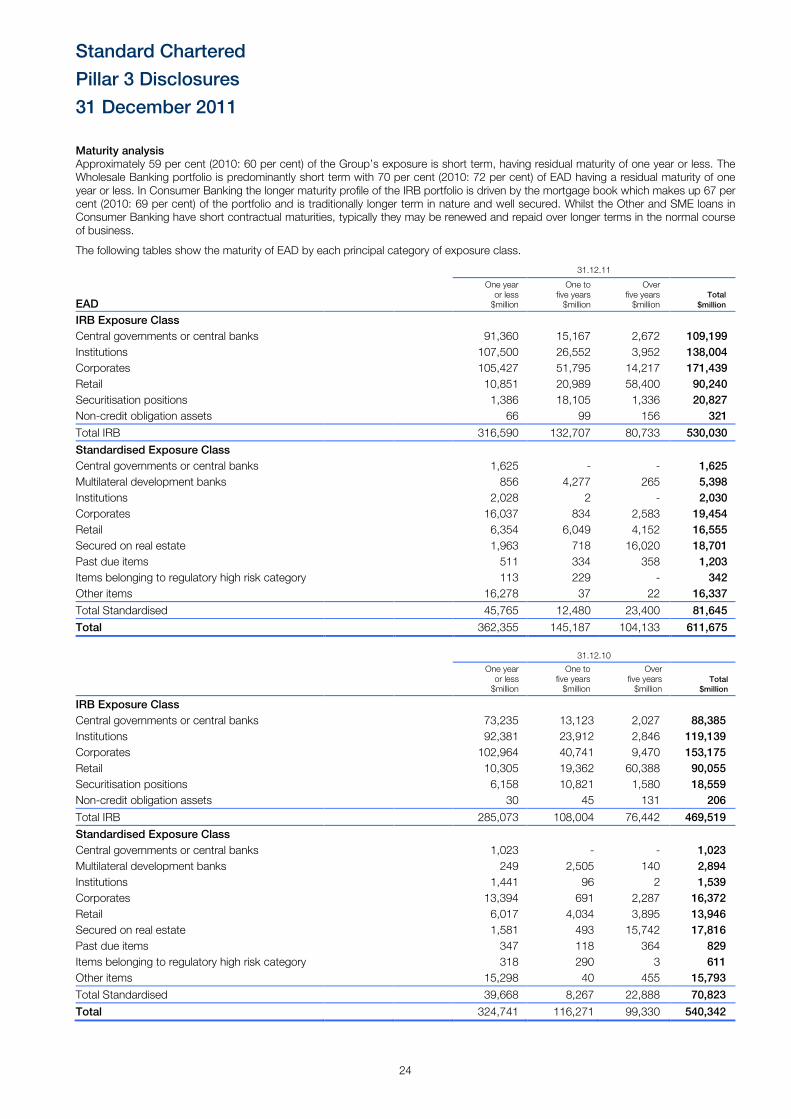
24
Maturity analysis Approximately 59 per cent (2010: 60 per cent) of the Group’s exposure is short term, having residual maturity of one year or less. The Wholesale Banking portfolio is predominantly short term with 70 per cent (2010: 72 per cent) of EAD having a residual maturity of one year or less. In Consumer Banking the longer maturity profile of the IRB portfolio is driven by the mortgage book which makes up 67 per cent (2010: 69 per cent) of the portfolio and is traditionally longer term in nature and well secured. Whilst the Other and SME loans in Consumer Banking have short contractual maturities, typically they may be renewed and repaid over longer terms in the normal course of business.
The following tables show the maturity of EAD by each principal category of exposure class.
31.12.11
EAD
One year or less $million
One to five years $million
Over five years $million
Total $million
IRB Exposure Class
Central governments or central banks 91,360 15,167 2,672 109,199
Institutions 107,500 26,552 3,952 138,004
Corporates 105,427 51,795 14,217 171,439
Retail 10,851 20,989 58,400 90,240
Securitisation positions 1,386 18,105 1,336 20,827
Non-credit obligation assets 66 99 156 321
Total IRB 316,590 132,707 80,733 530,030
Standardised Exposure Class
Central governments or central banks 1,625 - - 1,625
Multilateral development banks 856 4,277 265 5,398
Institutions 2,028 2 - 2,030
Corporates 16,037 834 2,583 19,454
Retail 6,354 6,049 4,152 16,555
Secured on real estate 1,963 718 16,020 18,701
Past due items 511 334 358 1,203
Items belonging to regulatory high risk category 113 229 - 342
Other items 16,278 37 22 16,337
Total Standardised 45,765 12,480 23,400 81,645
Total 362,355 145,187 104,133 611,675
31.12.10
One year or less $million
One to five years $million
Over five years $million
Total $million
IRB Exposure Class
Central governments or central banks 73,235 13,123 2,027 88,385
Institutions 92,381 23,912 2,846 119,139
Corporates 102,964 40,741 9,470 153,175
Retail 10,305 19,362 60,388 90,055
Securitisation positions 6,158 10,821 1,580 18,559
Non-credit obligation assets 30 45 131 206
Total IRB 285,073 108,004 76,442 469,519
Standardised Exposure Class
Central governments or central banks 1,023 - - 1,023
Multilateral development banks 249 2,505 140 2,894
Institutions 1,441 96 2 1,539
Corporates 13,394 691 2,287 16,372
Retail 6,017 4,034 3,895 13,946
Secured on real estate 1,581 493 15,742 17,816
Past due items 347 118 364 829
Items belonging to regulatory high risk category 318 290 3 611
Other items 15,298 40 455 15,793
Total Standardised 39,668 8,267 22,888 70,823
Total 324,741 116,271 99,330 540,342
Standard Chartered
Pillar 3 Disclosures
31 December 2011
25
4.5. Credit risk mitigation
Potential credit losses from any given account, customer or portfolio are mitigated using a range of tools such as collateral, netting agreements, credit insurance, credit derivatives and other guarantees. The reliance that can be placed on these mitigants is carefully assessed in light of issues such as legal certainty and enforceability, market valuation correlation and counterparty risk of the guarantor. Where appropriate, credit derivatives are used to reduce credit risks in the portfolio. Due to their potential impact on income volatility, such derivatives are used in a controlled manner with reference to their expected volatility. Risk mitigation policies determine the eligibility of collateral types.
Collateral Collateral is held to mitigate credit risk exposures and risk mitigation policies determine the eligibility of collateral types. Collateral types that are eligible for risk mitigation include: cash; residential, commercial and industrial property; fixed assets such as motor vehicles, aircraft, plant and machinery; marketable securities; commodities; bank guarantees and letters of credit. The Group also enters into collateralised reverse repurchase agreements.
For certain types of lending – typically mortgages, asset financing – the right to take charge over physical assets is significant in terms of determining appropriate pricing and recoverability in the event of default.
Collateral is reported in accordance with the Group’s risk mitigation policy, which prescribes the frequency of valuation for different collateral types, based on the level of price volatility of each type of collateral and the nature of the underlying product or risk exposure. Where appropriate, collateral values are adjusted to reflect, current market conditions, the probability of recovery and the period of time to realise the collateral in the event of possession. The collateral values reported are also adjusted for the effects of over-collateralisation.
Loans and advances The requirement for collateral is not a substitute for the ability to pay, which is the primary consideration for any lending decisions. In determining the financial effect of collateral held against loans neither past due or impaired, the Group has assessed the significance of the collateral held in relation to the type of lending.
Where guarantees or credit derivatives are used as Credit Risk Mitigation (CRM) the creditworthiness of the guarantor is assessed and established using the credit approval process in addition to that of the obligor or main counterparty. The main types of guarantors include bank guarantees, insurance companies, parent companies, shareholders and export credit agencies. Credit derivatives, due to their potential impact on income volatility are used in a controlled manner with reference to their expected volatility.
The Group uses bilateral and multilateral netting to reduce pre-settlement and settlement counterparty risk. Pre-settlement risk exposures are normally netted using the bilateral netting documentation in legally approved jurisdictions. Settlement exposures are generally netted using Delivery versus Payments or Payment versus Payments systems.
Wholesale Banking The process of managing and recognising credit risk mitigation is governed by policies which set out the eligibility criteria that must be met. The credit risk mitigation policy sets out clear criteria that must be satisfied if the mitigation is to be considered effective:
• excessive exposure to any particular risk mitigants or counter-parties should be avoided. Collateral concentration mitigation standards are maintained at both the portfolio and counterparty level;
• risk mitigants should not be correlated with the underlying assets such that default would coincide with a lowering of the Forced Sale Value (FSV) of the collateral;
• where there is a currency mismatch, haircuts should be applied to protect against currency fluctuations;
• legal opinions and documentation must be in place; and
• ongoing review and controls exist where there is a maturity mismatch between the collateral and exposure.
For all credit risk mitigants that meet the policy criteria, a clear set of procedures are applied to ensure that the value of the underlying collateral is appropriately recorded and updated regularly.
For further information regarding credit risk mitigation in the trading book see section 4.9 Counterparty credit risk in the trading book on page 39.
Consumer Banking The effective use of collateral is a key tool by which credit risk is mitigated in Consumer Banking. All eligible collateral accepted by Consumer Banking is covered by a product proposal approved by senior credit officers delegated with the relevant authority. New collateral types have to be vetted through a stringent ‘New Business Approval’ process and approved by the Consumer Banking Risk Committee.
In order to be recognised as security and for the loan to be classified as secured, all items pledged must be valued and an active secondary resale market must exist for the collateral. Documentation must be held to enable Consumer Banking to realise the asset without the cooperation of the asset owner in the event that this is necessary.
Regular valuation of collateral is required in accordance with the Group’s risk mitigation policy, which prescribes both the process of valuation and the frequency of valuation for different collateral types. The valuation frequency is driven by the level of price volatility of each type of collateral and the nature of the underlying product or risk exposure. Stress tests are performed on changes in collateral values for key portfolios to assist senior management in managing the risks in those portfolios. Physical collateral is required to be insured at all times and against all risks, with the Group as the loss payee under the insurance policy. Detailed procedures over collateral management must be in place for each business at the country level.
The following table discloses the amount of exposure after the effect of CRM (excluding the impact of guarantees and credit derivatives) in the IRB portfolio. For the IRB portfolios, there is no requirement to disclose the value of collateral as this is typically captured within the LGD models. The amount of the exposure that is covered by guarantees/credit derivatives is also shown by asset class.
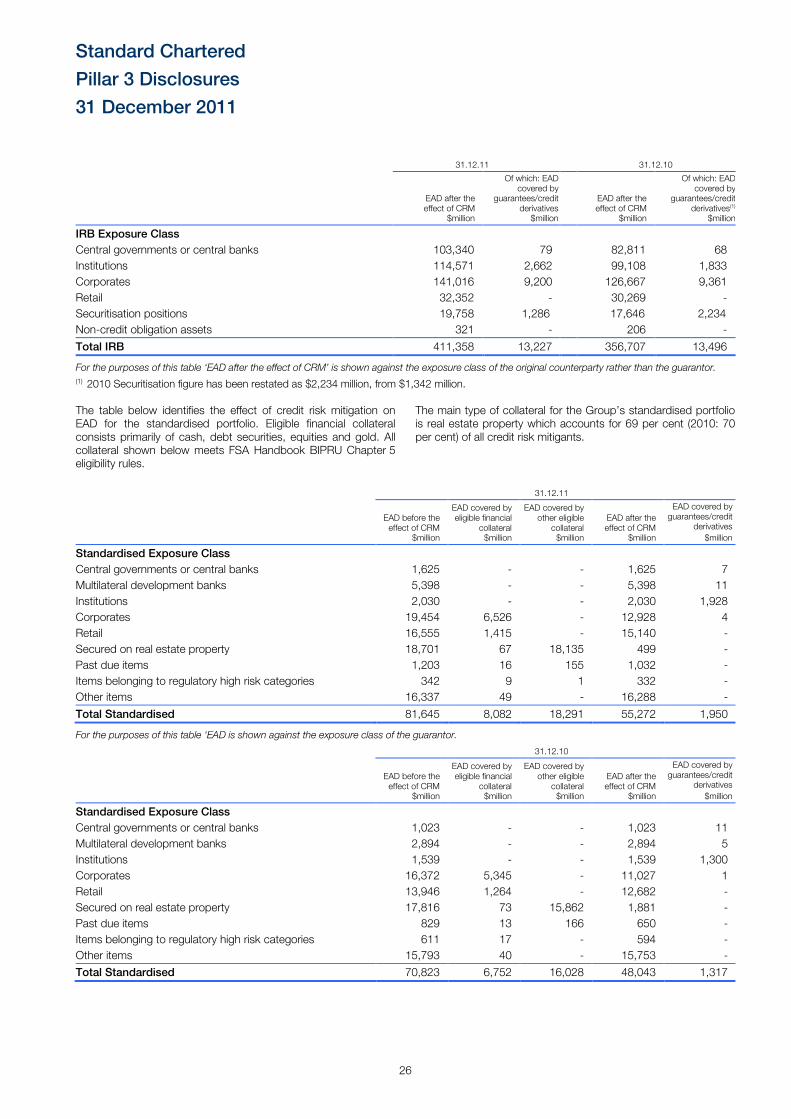
Standard Chartered
Pillar 3 Disclosures
31 December 2011
26
31.12.11 31.12.10
EAD after the effect of CRM
$million
Of which: EAD covered by
guarantees/credit derivatives $million
EAD after the effect of CRM
$million
Of which: EAD covered by
guarantees/credit derivatives(1)
$million
IRB Exposure Class
Central governments or central banks 103,340 79 82,811 68
Institutions 114,571 2,662 99,108 1,833
Corporates 141,016 9,200 126,667 9,361
Retail 32,352 - 30,269 -
Securitisation positions 19,758 1,286 17,646 2,234
Non-credit obligation assets 321 - 206 -
Total IRB 411,358 13,227 356,707 13,496
For the purposes of this table ‘EAD after the effect of CRM’ is shown against the exposure class of the original counterparty rather than the guarantor.
(1) 2010 Securitisation figure has been restated as $2,234 million, from $1,342 million. The table below identifies the effect of credit risk mitigation on EAD for the standardised portfolio. Eligible financial collateral consists primarily of cash, debt securities, equities and gold. All collateral shown below meets FSA Handbook BIPRU Chapter 5 eligibility rules.
The main type of collateral for the Group’s standardised portfolio is real estate property which accounts for 69 per cent (2010: 70 per cent) of all credit risk mitigants.
31.12.11
EAD before the effect of CRM
$million
EAD covered by eligible financial
collateral $million
EAD covered by other eligible
collateral $million
EAD after the effect of CRM
$million
EAD covered by guarantees/credit
derivatives
$million
Standardised Exposure Class
Central governments or central banks 1,625 - - 1,625 7
Multilateral development banks 5,398 - - 5,398 11
Institutions 2,030 - - 2,030 1,928
Corporates 19,454 6,526 - 12,928 4
Retail 16,555 1,415 - 15,140 -
Secured on real estate property 18,701 67 18,135 499 -
Past due items 1,203 16 155 1,032 -
Items belonging to regulatory high risk categories 342 9 1 332 -
Other items 16,337 49 - 16,288 -
Total Standardised 81,645 8,082 18,291 55,272 1,950
For the purposes of this table ‘EAD is shown against the exposure class of the guarantor.
31.12.10
EAD before the effect of CRM
$million
EAD covered by eligible financial
collateral $million
EAD covered by other eligible
collateral $million
EAD after the effect of CRM
$million
EAD covered by guarantees/credit
derivatives
$million
Standardised Exposure Class
Central governments or central banks 1,023 - - 1,023 11
Multilateral development banks 2,894 - - 2,894 5
Institutions 1,539 - - 1,539 1,300
Corporates 16,372 5,345 - 11,027 1
Retail 13,946 1,264 - 12,682 -
Secured on real estate property 17,816 73 15,862 1,881 -
Past due items 829 13 166 650 -
Items belonging to regulatory high risk categories 611 17 - 594 -
Other items 15,793 40 - 15,753 -
Total Standardised 70,823 6,752 16,028 48,043 1,317
Standard Chartered
Pillar 3 Disclosures
31 December 2011
27
4.6. Internal Ratings Based models
Model governance The IRB models used by the Group calculate a conservative Probability of Default (PD), Loss Given Default (LGD) and Exposure at Default (EAD), as borne out by the model performance data contained in this section. The product of this is a conservative view of Regulatory Expected Loss, which is considered necessary for the prudent calculation of regulatory capital.
Models are developed by analytics teams within the Consumer Banking and Wholesale Banking risk functions. The model development process is conducted and documented in line with specific criteria setting out the minimum standards for model development. All IRB models are validated annually by a model validation team reporting to the Group Chief Credit Officer, thereby maintaining independence from the model build processes. Model validation findings are presented to the Group Model Assessment Committee (MAC) which in turn makes approval recommendations to the Consumer Banking and Wholesale Banking Risk Committees. These decision making bodies are comprised of divisional senior management whose role is to challenge model assumptions and performance and agree on appropriate model use for business decision making. The GRC and BRC periodically review overall model performance.
The model validation process involves a qualitative and quantitative assessment of the model, data, systems and governance. This would typically include an assessment of the:
• model assumptions;
• validity of the technical approach used;
• statistical and empirical measures of performance;
• appropriateness of intended model use;
• model application and infrastructure;
• data integrity and history;
• model response to changes in internal and external environment - the extent to which the model provides point in time or through the cycle measures of risk;
• model monitoring standards and triggers; and
• levels of conservatism applied.
Statistical testing is used to determine a model’s discriminatory power, predicted versus actual performance and stability over time with pre-defined thresholds for passing such tests.
PD model development The Group employs a variety of techniques to develop its PD models. In each case the appropriate approach is dictated by the availability and appropriateness of both internal and external data.
If there is a perceived weakness in the data, for example shorter histories or fewer instances of default, an appropriate amount of conservatism is applied to predicted default rates.
The general approaches fall into three categories:
Default History Based (‘Good-Bad’) – where a sufficient number of defaults are available, the Group deploys a variety of statistical methods to determine the likelihood of default on existing exposures. These methods afford very high discriminatory power by identifying exposure characteristics that have a significant predictive ability. The majority of the Group’s consumer and corporate exposures are rated under such an approach.
Shadow Rating Approach – if it is determined that the Group’s internal data does not provide a sufficient default history (for example, so called ‘low default portfolios’), then the Group
develops models which are designed to be comprobable to the ranking of PD ratings assigned by established external credit assessment institutions, to avail of those agencies having access to large databases of defaults on a variety of credit obligations.
Constrained Expert Judgement – for certain types of exposure there is little or no internal default history, and no reliable external ratings. In such rare cases, the Group develops quantitative frameworks which include the expert opinions of the Group’s credit risk management personnel. These frameworks are also called ‘knowledge based systems’ and regularly reviewed with respect to historical outcomes.
LGD model development The Group develops LGD models by assessing recoveries and the forced sale value of collateral together with the economic costs in securing these recoveries, and the timing with which such cash flows occur. All such cash flows are then measured at net present value using a suitable discount rate to derive a recovery rate. LGD is therefore the EAD less these estimated recoveries.
Recoveries are estimated based upon empirical evidence which has shown that factors such as customer segment, product and geography have predictive content.
All LGD models are conservatively calibrated to a ‘downturn’ – with lower collateral values and recoveries on exposures, compared to those estimated over the long run.
EAD model development An EAD model is developed for uncertain exposure products such as lines of credit, credit cards, overdrafts and other commitments. Based on the Group’s experience (and supplemented by external data), EAD models assess changes to limits and the likely draw-down of committed and uncommitted limits as an exposure approaches default. The factor generated by the model and applied to the undrawn limit is referred to as the credit conversion factor (CCF).
The Group has used conservative assumptions in assessing EAD, in keeping with the expected experience in an economic downturn.
Model use In addition to supporting credit decisions, IRB models also support risk-based pricing methodologies and measures used to assess business performance such as Economic Capital, Economic Revenue and Economic Profit.
The use of models is governed by a suite of policies:
• each model is governed by a separate policy and procedure which defines the applicability of that model and details the procedure for use;
• the Group Model Risk Policy - IRB Models specifies that models are subject to regular monitoring and review with the underlying Group Model Standards for IRB Credit Risk Models specifying statistical thresholds and other triggers which determine when models need to be redeveloped;
• the model override policy sets the conditions and approval authority required to override model output; and
• the parental support policy, for Wholesale Banking, determines the extent to which parental support may be utilised to adjust the credit grade of corporates’ and financial institutions’ subsidiaries.
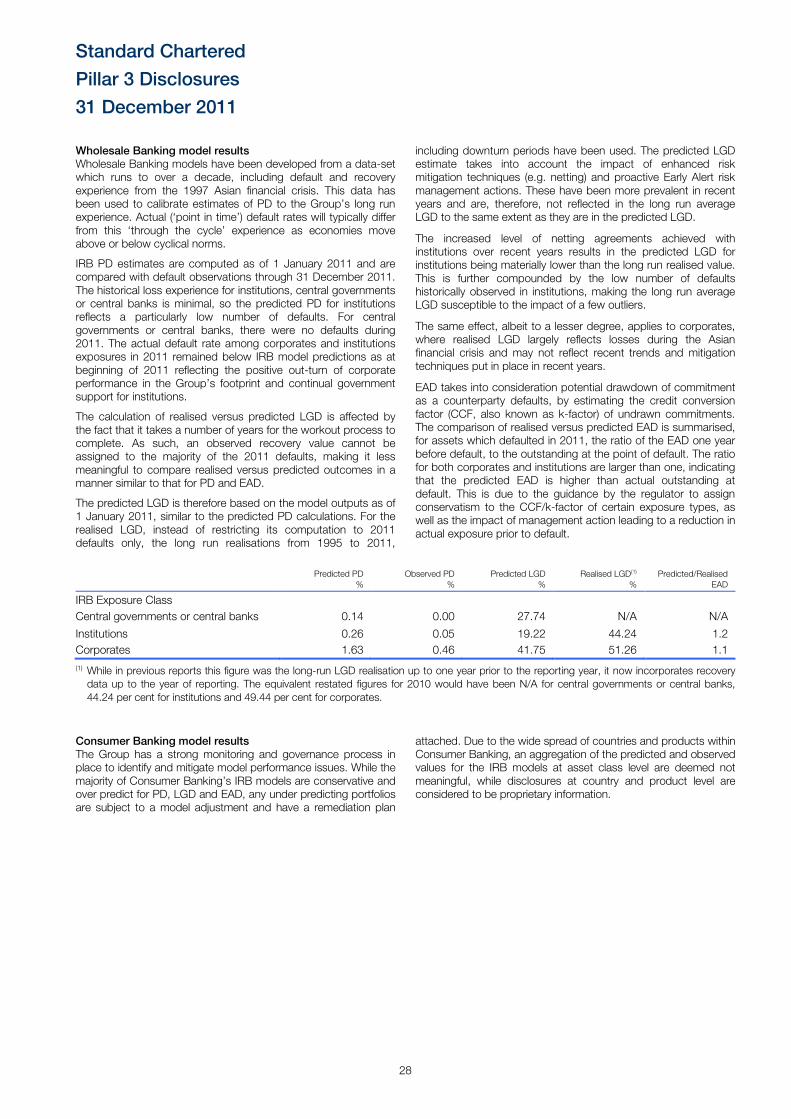
Standard Chartered
Pillar 3 Disclosures
31 December 2011
28
Wholesale Banking model results Wholesale Banking models have been developed from a data-set which runs to over a decade, including default and recovery experience from the 1997 Asian financial crisis. This data has been used to calibrate estimates of PD to the Group’s long run experience. Actual (‘point in time’) default rates will typically differ from this ‘through the cycle’ experience as economies move above or below cyclical norms.
IRB PD estimates are computed as of 1 January 2011 and are compared with default observations through 31 December 2011. The historical loss experience for institutions, central governments or central banks is minimal, so the predicted PD for institutions reflects a particularly low number of defaults. For central governments or central banks, there were no defaults during 2011. The actual default rate among corporates and institutions exposures in 2011 remained below IRB model predictions as at beginning of 2011 reflecting the positive out-turn of corporate performance in the Group’s footprint and continual government support for institutions.
The calculation of realised versus predicted LGD is affected by the fact that it takes a number of years for the workout process to complete. As such, an observed recovery value cannot be assigned to the majority of the 2011 defaults, making it less meaningful to compare realised versus predicted outcomes in a manner similar to that for PD and EAD.
The predicted LGD is therefore based on the model outputs as of 1 January 2011, similar to the predicted PD calculations. For the realised LGD, instead of restricting its computation to 2011 defaults only, the long run realisations from 1995 to 2011,
including downturn periods have been used. The predicted LGD estimate takes into account the impact of enhanced risk mitigation techniques (e.g. netting) and proactive Early Alert risk management actions. These have been more prevalent in recent years and are, therefore, not reflected in the long run average LGD to the same extent as they are in the predicted LGD.
The increased level of netting agreements achieved with institutions over recent years results in the predicted LGD for institutions being materially lower than the long run realised value. This is further compounded by the low number of defaults historically observed in institutions, making the long run average LGD susceptible to the impact of a few outliers.
The same effect, albeit to a lesser degree, applies to corporates, where realised LGD largely reflects losses during the Asian financial crisis and may not reflect recent trends and mitigation techniques put in place in recent years.
EAD takes into consideration potential drawdown of commitment as a counterparty defaults, by estimating the credit conversion factor (CCF, also known as k-factor) of undrawn commitments. The comparison of realised versus predicted EAD is summarised, for assets which defaulted in 2011, the ratio of the EAD one year before default, to the outstanding at the point of default. The ratio for both corporates and institutions are larger than one, indicating that the predicted EAD is higher than actual outstanding at default. This is due to the guidance by the regulator to assign conservatism to the CCF/k-factor of certain exposure types, as well as the impact of management action leading to a reduction in actual exposure prior to default.
Predicted PD
% Observed PD
% Predicted LGD
% Realised LGD(1)
% Predicted/Realised
EAD
IRB Exposure Class
Central governments or central banks 0.14 0.00 27.74 N/A N/A
Institutions 0.26 0.05 19.22 44.24 1.2
Corporates 1.63 0.46 41.75 51.26 1.1
(1) While in previous reports this figure was the long-run LGD realisation up to one year prior to the reporting year, it now incorporates recovery data up to the year of reporting. The equivalent restated figures for 2010 would have been N/A for central governments or central banks, 44.24 per cent for institutions and 49.44 per cent for corporates.
Consumer Banking model results The Group has a strong monitoring and governance process in place to identify and mitigate model performance issues. While the majority of Consumer Banking’s IRB models are conservative and over predict for PD, LGD and EAD, any under predicting portfolios are subject to a model adjustment and have a remediation plan
attached. Due to the wide spread of countries and products within Consumer Banking, an aggregation of the predicted and observed values for the IRB models at asset class level are deemed not meaningful, while disclosures at country and product level are considered to be proprietary information.
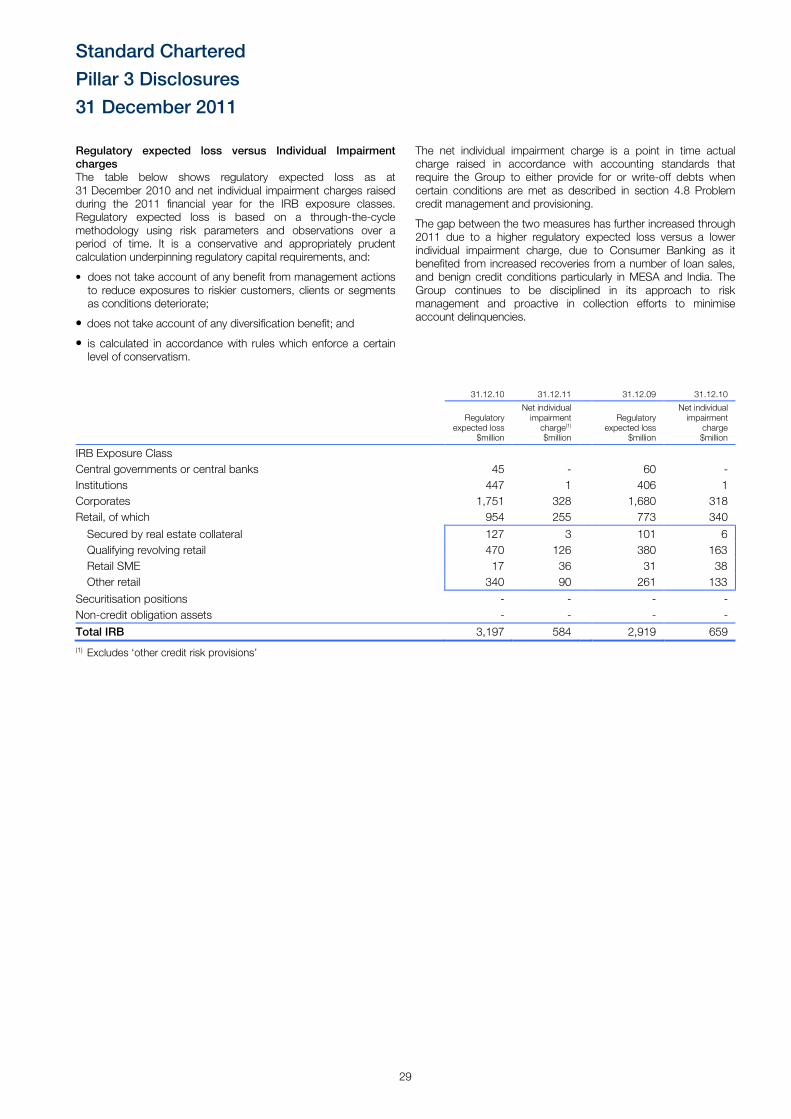
Standard Chartered
Pillar 3 Disclosures
31 December 2011
29
Regulatory expected loss versus Individual Impairment charges The table below shows regulatory expected loss as at 31 December 2010 and net individual impairment charges raised during the 2011 financial year for the IRB exposure classes. Regulatory expected loss is based on a through-the-cycle methodology using risk parameters and observations over a period of time. It is a conservative and appropriately prudent calculation underpinning regulatory capital requirements, and:
• does not take account of any benefit from management actions to reduce exposures to riskier customers, clients or segments as conditions deteriorate;
• does not take account of any diversification benefit; and
• is calculated in accordance with rules which enforce a certain level of conservatism.
The net individual impairment charge is a point in time actual charge raised in accordance with accounting standards that require the Group to either provide for or write-off debts when certain conditions are met as described in section 4.8 Problem credit management and provisioning.
The gap between the two measures has further increased through 2011 due to a higher regulatory expected loss versus a lower individual impairment charge, due to Consumer Banking as it benefited from increased recoveries from a number of loan sales, and benign credit conditions particularly in MESA and India. The Group continues to be disciplined in its approach to risk management and proactive in collection efforts to minimise account delinquencies.
31.12.10 31.12.11 31.12.09 31.12.10
Regulatory expected loss
$million
Net individual impairment charge(1) $million
Regulatory expected loss
$million
Net individual impairment
charge $million
IRB Exposure Class
Central governments or central banks 45 - 60 -
Institutions 447 1 406 1
Corporates 1,751 328 1,680 318
Retail, of which 954 255 773 340
Secured by real estate collateral 127 3 101 6
Qualifying revolving retail 470 126 380 163
Retail SME 17 36 31 38
Other retail 340 90 261 133
Securitisation positions - - - -
Non-credit obligation assets - - - -
Total IRB 3,197 584 2,919 659
(1) Excludes ‘other credit risk provisions’
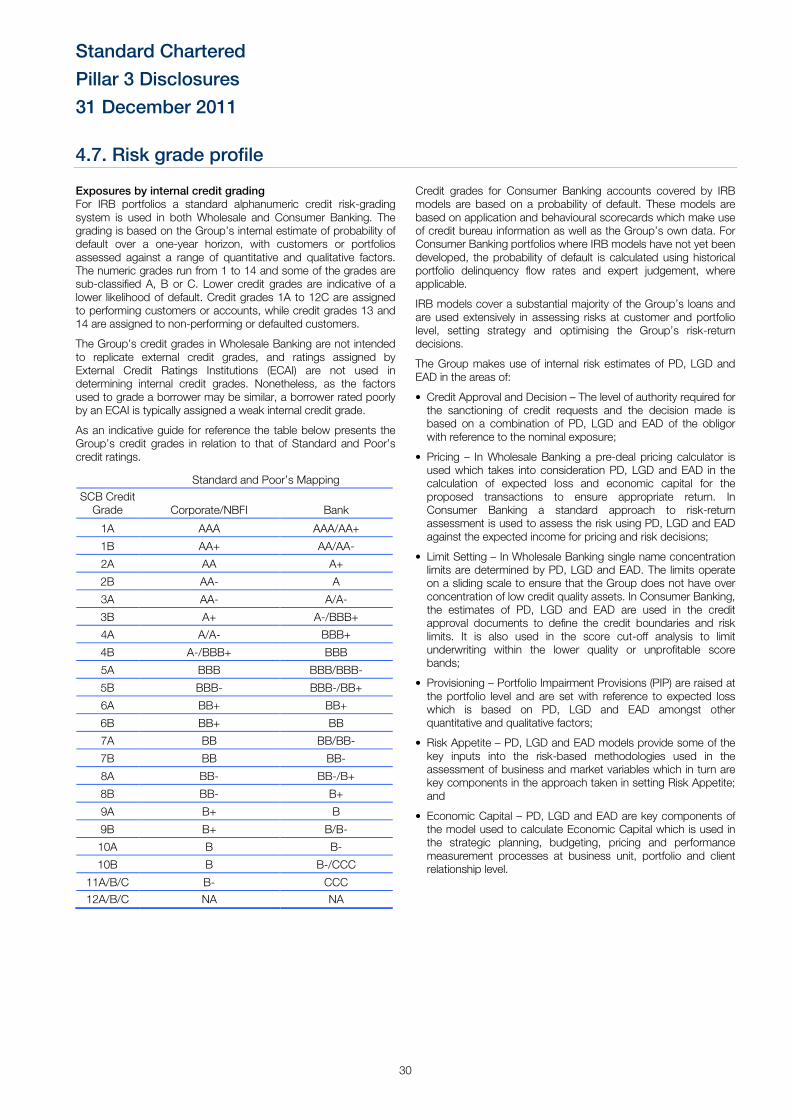
Standard Chartered
Pillar 3 Disclosures
31 December 2011
30
4.7. Risk grade profile
Exposures by internal credit grading For IRB portfolios a standard alphanumeric credit risk-grading system is used in both Wholesale and Consumer Banking. The grading is based on the Group’s internal estimate of probability of default over a one-year horizon, with customers or portfolios assessed against a range of quantitative and qualitative factors. The numeric grades run from 1 to 14 and some of the grades are sub-classified A, B or C. Lower credit grades are indicative of a lower likelihood of default. Credit grades 1A to 12C are assigned to performing customers or accounts, while credit grades 13 and 14 are assigned to non-performing or defaulted customers.
The Group’s credit grades in Wholesale Banking are not intended to replicate external credit grades, and ratings assigned by External Credit Ratings Institutions (ECAI) are not used in determining internal credit grades. Nonetheless, as the factors used to grade a borrower may be similar, a borrower rated poorly by an ECAI is typically assigned a weak internal credit grade.
As an indicative guide for reference the table below presents the Group’s credit grades in relation to that of Standard and Poor’s credit ratings.
Standard and Poor’s Mapping
SCB Credit Grade Corporate/NBFI Bank
1A AAA AAA/AA+
1B AA+ AA/AA-
2A AA A+
2B AA- A
3A AA- A/A-
3B A+ A-/BBB+
4A A/A- BBB+
4B A-/BBB+ BBB
5A BBB BBB/BBB-
5B BBB- BBB-/BB+
6A BB+ BB+
6B BB+ BB
7A BB BB/BB-
7B BB BB-
8A BB- BB-/B+
8B BB- B+
9A B+ B
9B B+ B/B-
10A B B-
10B B B-/CCC
11A/B/C B- CCC
12A/B/C NA NA
Credit grades for Consumer Banking accounts covered by IRB models are based on a probability of default. These models are based on application and behavioural scorecards which make use of credit bureau information as well as the Group’s own data. For Consumer Banking portfolios where IRB models have not yet been developed, the probability of default is calculated using historical portfolio delinquency flow rates and expert judgement, where applicable.
IRB models cover a substantial majority of the Group’s loans and are used extensively in assessing risks at customer and portfolio level, setting strategy and optimising the Group’s risk-return decisions.
The Group makes use of internal risk estimates of PD, LGD and EAD in the areas of:
• Credit Approval and Decision – The level of authority required for the sanctioning of credit requests and the decision made is based on a combination of PD, LGD and EAD of the obligor with reference to the nominal exposure;
• Pricing – In Wholesale Banking a pre-deal pricing calculator is used which takes into consideration PD, LGD and EAD in the calculation of expected loss and economic capital for the proposed transactions to ensure appropriate return. In Consumer Banking a standard approach to risk-return assessment is used to assess the risk using PD, LGD and EAD against the expected income for pricing and risk decisions;
• Limit Setting – In Wholesale Banking single name concentration limits are determined by PD, LGD and EAD. The limits operate on a sliding scale to ensure that the Group does not have over concentration of low credit quality assets. In Consumer Banking, the estimates of PD, LGD and EAD are used in the credit approval documents to define the credit boundaries and risk limits. It is also used in the score cut-off analysis to limit underwriting within the lower quality or unprofitable score bands;
• Provisioning – Portfolio Impairment Provisions (PIP) are raised at the portfolio level and are set with reference to expected loss which is based on PD, LGD and EAD amongst other quantitative and qualitative factors;
• Risk Appetite – PD, LGD and EAD models provide some of the key inputs into the risk-based methodologies used in the assessment of business and market variables which in turn are key components in the approach taken in setting Risk Appetite; and
• Economic Capital – PD, LGD and EAD are key components of the model used to calculate Economic Capital which is used in the strategic planning, budgeting, pricing and performance measurement processes at business unit, portfolio and client relationship level.

Standard Chartered
Pillar 3 Disclosures
31 December 2011
31
The following table sets out analysis of EAD within the IRB portfolios by internal credit grading and Basel II exposure classes. EAD has been calculated after taking into account the impact of credit risk mitigation. Where exposure is guaranteed or covered by credit derivatives, exposure is shown against the asset class of the guarantor or derivative counterparty 75 per cent (2010: 73 per cent) of exposures are classified as credit grades 1 to 5.
31.12.11
EAD
Grades 1-5 $million
Grades 6-8 $million
Grades 9-11 $million
Grade 12 $million
Grades 13-14 $million
Total $million
Total exposure
Central government and central banks 102,331 3,950 1,855 1 - 108,137
Institutions 105,166 9,696 959 250 582 116,653
Corporates 69,519 48,727 11,515 1,633 2,743 134,137
Retail, of which 14,005 9,918 7,333 596 500 32,352
Retail exposures secured by real estate collateral 1,519 989 210 16 52 2,786
Qualifying revolving retail 9,587 4,035 3,349 400 236 17,607
Retail SME 401 676 76 9 17 1,179
Other retail 2,498 4,218 3,698 171 195 10,780
Securitisation positions (1) 19,573 124 61 - - 19,758
Non-credit obligation assets 169 106 25 21 - 321
Total IRB 310,763 72,521 21,748 2,501 3,825 411,358 (1) For securitisations the ratings of the tranches within the programmes have been mapped to internal credit grade buckets, previously the rating was per the Special Purpose Entity (SPE).
31.12.10
EAD
Grades 1-5 $million
Grades 6-8 $million
Grades 9-11 $million
Grade 12 $million
Grades 13-14 $million
Total $million
Total exposure
Central government and central banks 80,720 3,541 1,400 - - 85,661
Institutions 89,459 11,277 1,067 250 665 102,718
Corporates 59,397 45,729 10,943 1,509 2,629 120,207
Retail, of which 12,924 9,294 6,957 615 479 30,269
Retail exposures secured by real estate collateral 1,543 841 330 14 49 2,777
Qualifying revolving retail 8,575 3,769 3,346 434 250 16,374
Retail SME 361 648 77 10 19 1,115
Other retail 2,445 4,036 3,204 157 161 10,003
Securitisation positions (1) 17,297 162 187 - - 17,646
Non-credit obligation assets 83 81 31 11 - 206
Total IRB 259,880 70,084 20,585 2,385 3,773 356,707
(1) 2010 securitisation positions have been represented to reflect a revised approach, where the ratings of the tranches within the programmes have been mapped to internal credit grade buckets; previously the rating was per the SPE.
The following table sets out analysis of undrawn commitments by internal credit grading and Basel II exposure classes.
31.12.11
Grades 1-5 $million
Grades 6-8 $million
Grades 9-11 $million
Grade 12 $million
Grades 13-14 $million
Total $million
Undrawn commitments
Central government and central banks 38 17 47 - - 102
Institutions 3,115 626 13 35 9 3,798
Corporates 30,931 11,726 2,910 38 51 45,656
Retail, of which 4,206 2,463 666 14 2 7,351
Retail exposures secured by real estate collateral 2,548 1,025 467 2 1 4,043
Qualifying revolving retail - - - - - -
Retail SME 13 153 1 - - 167
Other retail 1,645 1,285 198 12 1 3,141
Securitisation positions - - - - - -
Non-credit obligation assets - - - - - -
Total IRB 38,290 14,832 3,636 87 62 56,907
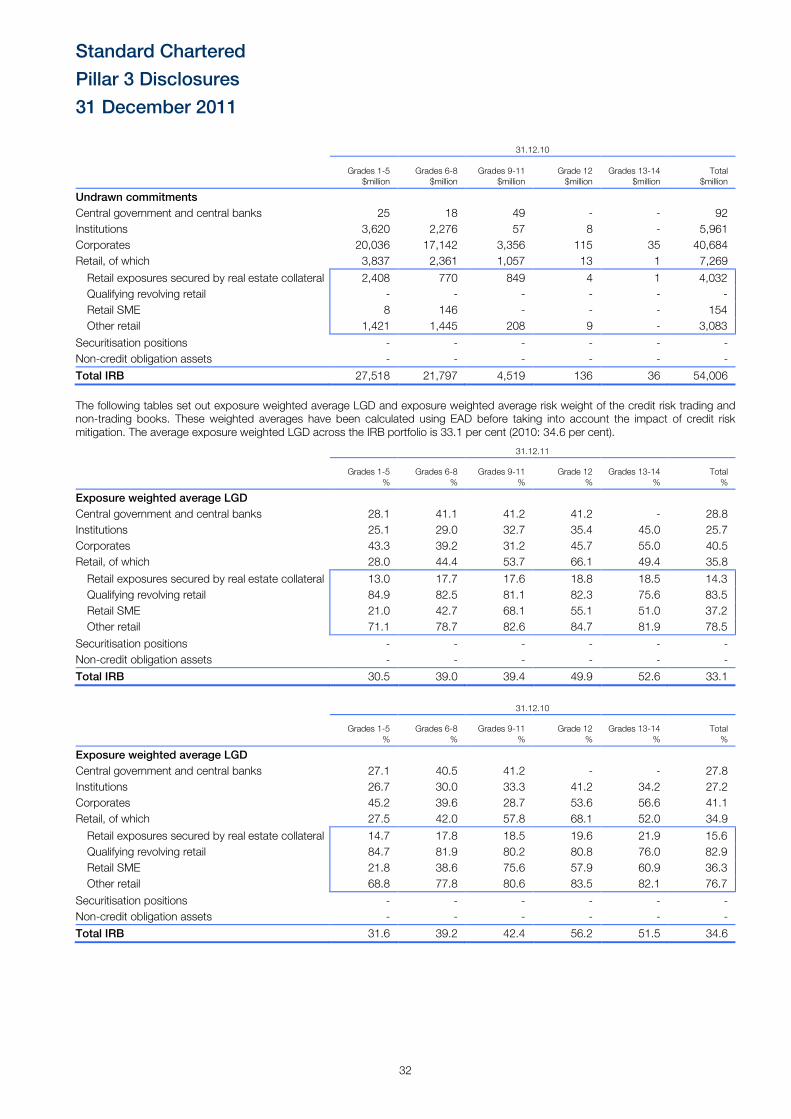
Standard Chartered
Pillar 3 Disclosures
31 December 2011
32
31.12.10
Grades 1-5 $million
Grades 6-8 $million
Grades 9-11 $million
Grade 12 $million
Grades 13-14 $million
Total $million
Undrawn commitments
Central government and central banks 25 18 49 - - 92
Institutions 3,620 2,276 57 8 - 5,961
Corporates 20,036 17,142 3,356 115 35 40,684
Retail, of which 3,837 2,361 1,057 13 1 7,269
Retail exposures secured by real estate collateral 2,408 770 849 4 1 4,032
Qualifying revolving retail - - - - - -
Retail SME 8 146 - - - 154
Other retail 1,421 1,445 208 9 - 3,083
Securitisation positions - - - - - -
Non-credit obligation assets - - - - - -
Total IRB 27,518 21,797 4,519 136 36 54,006
The following tables set out exposure weighted average LGD and exposure weighted average risk weight of the credit risk trading and non-trading books. These weighted averages have been calculated using EAD before taking into account the impact of credit risk mitigation. The average exposure weighted LGD across the IRB portfolio is 33.1 per cent (2010: 34.6 per cent).
31.12.11
Grades 1-5 %
Grades 6-8 %
Grades 9-11 %
Grade 12 %
Grades 13-14 %
Total %
Exposure weighted average LGD
Central government and central banks 28.1 41.1 41.2 41.2 - 28.8
Institutions 25.1 29.0 32.7 35.4 45.0 25.7
Corporates 43.3 39.2 31.2 45.7 55.0 40.5
Retail, of which 28.0 44.4 53.7 66.1 49.4 35.8
Retail exposures secured by real estate collateral 13.0 17.7 17.6 18.8 18.5 14.3
Qualifying revolving retail 84.9 82.5 81.1 82.3 75.6 83.5
Retail SME 21.0 42.7 68.1 55.1 51.0 37.2
Other retail 71.1 78.7 82.6 84.7 81.9 78.5
Securitisation positions - - - - - -
Non-credit obligation assets - - - - - -
Total IRB 30.5 39.0 39.4 49.9 52.6 33.1
31.12.10
Grades 1-5 %
Grades 6-8 %
Grades 9-11 %
Grade 12 %
Grades 13-14 %
Total %
Exposure weighted average LGD
Central government and central banks 27.1 40.5 41.2 - - 27.8
Institutions 26.7 30.0 33.3 41.2 34.2 27.2
Corporates 45.2 39.6 28.7 53.6 56.6 41.1
Retail, of which 27.5 42.0 57.8 68.1 52.0 34.9
Retail exposures secured by real estate collateral 14.7 17.8 18.5 19.6 21.9 15.6
Qualifying revolving retail 84.7 81.9 80.2 80.8 76.0 82.9
Retail SME 21.8 38.6 75.6 57.9 60.9 36.3
Other retail 68.8 77.8 80.6 83.5 82.1 76.7
Securitisation positions - - - - - -
Non-credit obligation assets - - - - - -
Total IRB 31.6 39.2 42.4 56.2 51.5 34.6
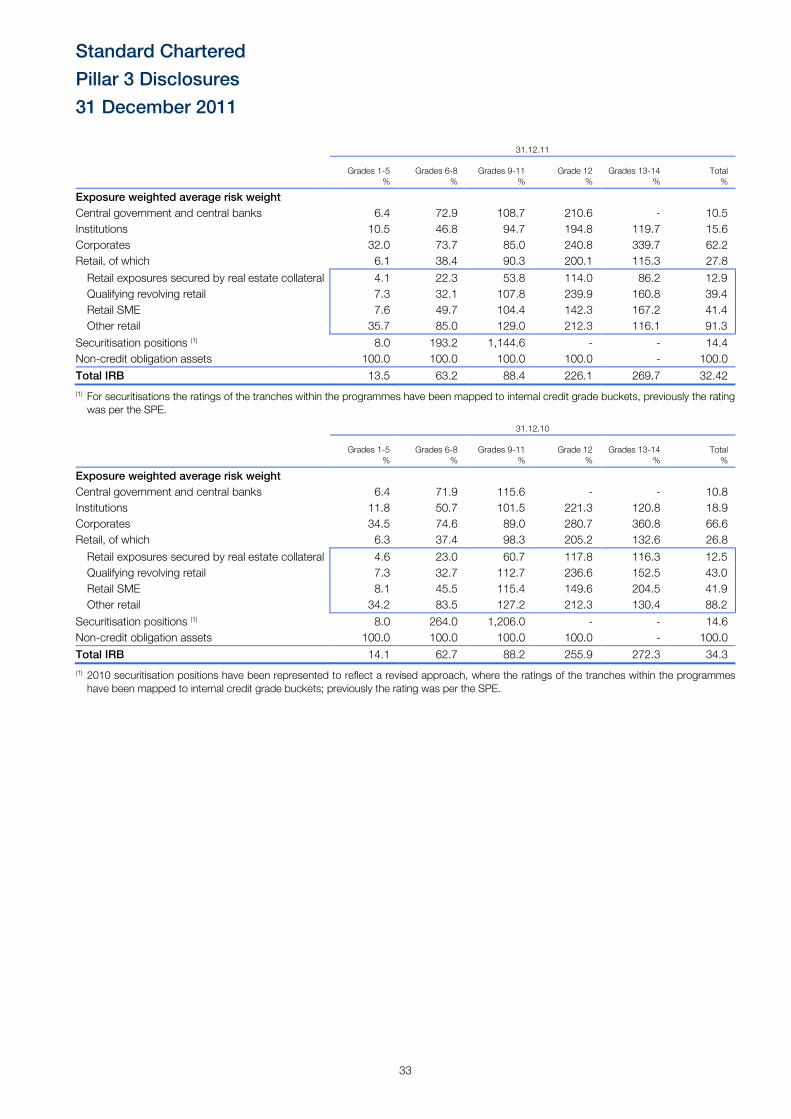
Standard Chartered
Pillar 3 Disclosures
31 December 2011
33
31.12.11
Grades 1-5 %
Grades 6-8 %
Grades 9-11 %
Grade 12 %
Grades 13-14 %
Total %
Exposure weighted average risk weight
Central government and central banks 6.4 72.9 108.7 210.6 - 10.5
Institutions 10.5 46.8 94.7 194.8 119.7 15.6
Corporates 32.0 73.7 85.0 240.8 339.7 62.2
Retail, of which 6.1 38.4 90.3 200.1 115.3 27.8
Retail exposures secured by real estate collateral 4.1 22.3 53.8 114.0 86.2 12.9
Qualifying revolving retail 7.3 32.1 107.8 239.9 160.8 39.4
Retail SME 7.6 49.7 104.4 142.3 167.2 41.4
Other retail 35.7 85.0 129.0 212.3 116.1 91.3
Securitisation positions (1) 8.0 193.2 1,144.6 - - 14.4
Non-credit obligation assets 100.0 100.0 100.0 100.0 - 100.0
Total IRB 13.5 63.2 88.4 226.1 269.7 32.42
(1) For securitisations the ratings of the tranches within the programmes have been mapped to internal credit grade buckets, previously the rating was per the SPE.
31.12.10
Grades 1-5 %
Grades 6-8 %
Grades 9-11 %
Grade 12 %
Grades 13-14 %
Total %
Exposure weighted average risk weight
Central government and central banks 6.4 71.9 115.6 - - 10.8
Institutions 11.8 50.7 101.5 221.3 120.8 18.9
Corporates 34.5 74.6 89.0 280.7 360.8 66.6
Retail, of which 6.3 37.4 98.3 205.2 132.6 26.8
Retail exposures secured by real estate collateral 4.6 23.0 60.7 117.8 116.3 12.5
Qualifying revolving retail 7.3 32.7 112.7 236.6 152.5 43.0
Retail SME 8.1 45.5 115.4 149.6 204.5 41.9
Other retail 34.2 83.5 127.2 212.3 130.4 88.2
Securitisation positions (1) 8.0 264.0 1,206.0 - - 14.6
Non-credit obligation assets 100.0 100.0 100.0 100.0 - 100.0
Total IRB 14.1 62.7 88.2 255.9 272.3 34.3
(1) 2010 securitisation positions have been represented to reflect a revised approach, where the ratings of the tranches within the programmes have been mapped to internal credit grade buckets; previously the rating was per the SPE.
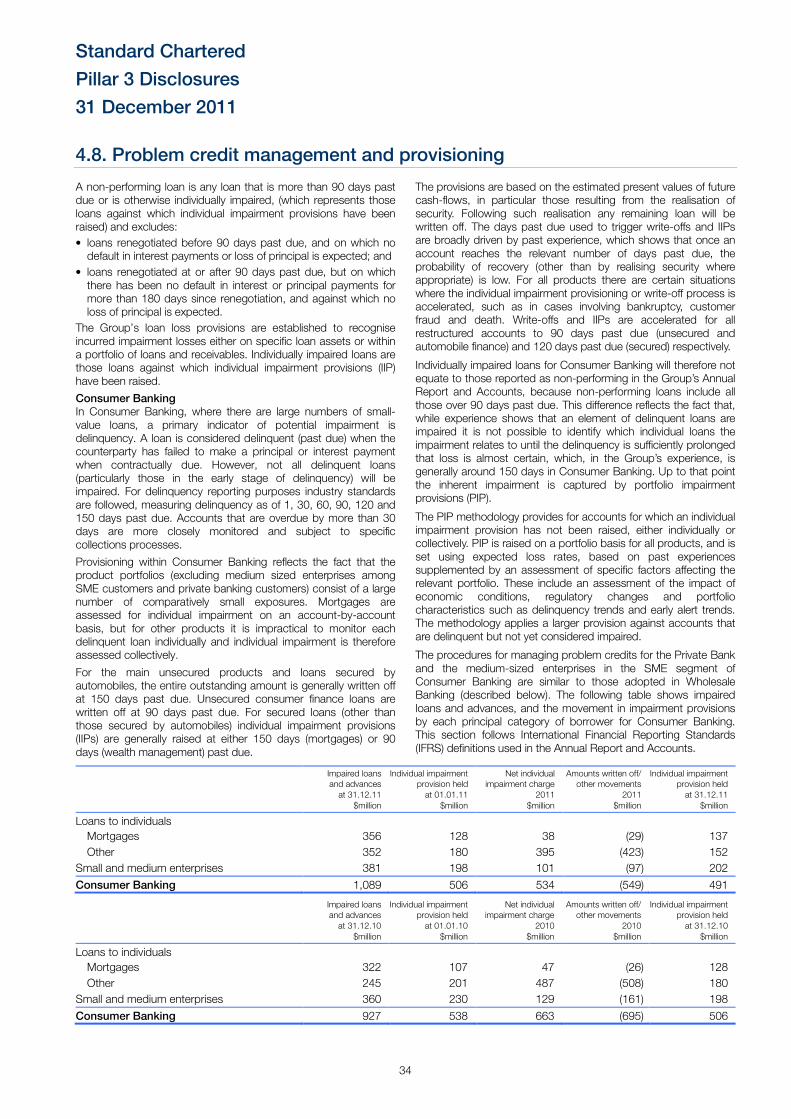
Standard Chartered
Pillar 3 Disclosures
31 December 2011
34
4.8. Problem credit management and provisioning A non-performing loan is any loan that is more than 90 days past due or is otherwise individually impaired, (which represents those loans against which individual impairment provisions have been raised) and excludes:
• loans renegotiated before 90 days past due, and on which no default in interest payments or loss of principal is expected; and
• loans renegotiated at or after 90 days past due, but on which there has been no default in interest or principal payments for more than 180 days since renegotiation, and against which no loss of principal is expected.
The Group’s loan loss provisions are established to recognise incurred impairment losses either on specific loan assets or within a portfolio of loans and receivables. Individually impaired loans are those loans against which individual impairment provisions (IIP) have been raised.
Consumer Banking In Consumer Banking, where there are large numbers of small- value loans, a primary indicator of potential impairment is delinquency. A loan is considered delinquent (past due) when the counterparty has failed to make a principal or interest payment when contractually due. However, not all delinquent loans (particularly those in the early stage of delinquency) will be impaired. For delinquency reporting purposes industry standards are followed, measuring delinquency as of 1, 30, 60, 90, 120 and 150 days past due. Accounts that are overdue by more than 30 days are more closely monitored and subject to specific collections processes.
Provisioning within Consumer Banking reflects the fact that the product portfolios (excluding medium sized enterprises among SME customers and private banking customers) consist of a large number of comparatively small exposures. Mortgages are assessed for individual impairment on an account-by-account basis, but for other products it is impractical to monitor each delinquent loan individually and individual impairment is therefore assessed collectively.
For the main unsecured products and loans secured by automobiles, the entire outstanding amount is generally written off at 150 days past due. Unsecured consumer finance loans are written off at 90 days past due. For secured loans (other than those secured by automobiles) individual impairment provisions (IIPs) are generally raised at either 150 days (mortgages) or 90 days (wealth management) past due.
The provisions are based on the estimated present values of future cash-flows, in particular those resulting from the realisation of security. Following such realisation any remaining loan will be written off. The days past due used to trigger write-offs and IIPs are broadly driven by past experience, which shows that once an account reaches the relevant number of days past due, the probability of recovery (other than by realising security where appropriate) is low. For all products there are certain situations where the individual impairment provisioning or write-off process is accelerated, such as in cases involving bankruptcy, customer fraud and death. Write-offs and IIPs are accelerated for all restructured accounts to 90 days past due (unsecured and automobile finance) and 120 days past due (secured) respectively.
Individually impaired loans for Consumer Banking will therefore not equate to those reported as non-performing in the Group’s Annual Report and Accounts, because non-performing loans include all those over 90 days past due. This difference reflects the fact that, while experience shows that an element of delinquent loans are impaired it is not possible to identify which individual loans the impairment relates to until the delinquency is sufficiently prolonged that loss is almost certain, which, in the Group’s experience, is generally around 150 days in Consumer Banking. Up to that point the inherent impairment is captured by portfolio impairment provisions (PIP).
The PIP methodology provides for accounts for which an individual impairment provision has not been raised, either individually or collectively. PIP is raised on a portfolio basis for all products, and is set using expected loss rates, based on past experiences supplemented by an assessment of specific factors affecting the relevant portfolio. These include an assessment of the impact of economic conditions, regulatory changes and portfolio characteristics such as delinquency trends and early alert trends. The methodology applies a larger provision against accounts that are delinquent but not yet considered impaired.
The procedures for managing problem credits for the Private Bank and the medium-sized enterprises in the SME segment of Consumer Banking are similar to those adopted in Wholesale Banking (described below). The following table shows impaired loans and advances, and the movement in impairment provisions by each principal category of borrower for Consumer Banking. This section follows International Financial Reporting Standards (IFRS) definitions used in the Annual Report and Accounts.
Impaired loans
and advances at 31.12.11
$million
Individual impairment provision held at 01.01.11
$million
Net individual impairment charge
2011 $million
Amounts written off/ other movements
2011 $million
Individual impairment provision held at 31.12.11
$million
Loans to individuals
Mortgages 356 128 38 (29) 137
Other 352 180 395 (423) 152
Small and medium enterprises 381 198 101 (97) 202
Consumer Banking 1,089 506 534 (549) 491
Impaired loans and advances at 31.12.10
$million
Individual impairment provision held at 01.01.10
$million
Net individual impairment charge
2010 $million
Amounts written off/ other movements
2010 $million
Individual impairment provision held at 31.12.10
$million
Loans to individuals
Mortgages 322 107 47 (26) 128
Other 245 201 487 (508) 180
Small and medium enterprises 360 230 129 (161) 198
Consumer Banking 927 538 663 (695) 506
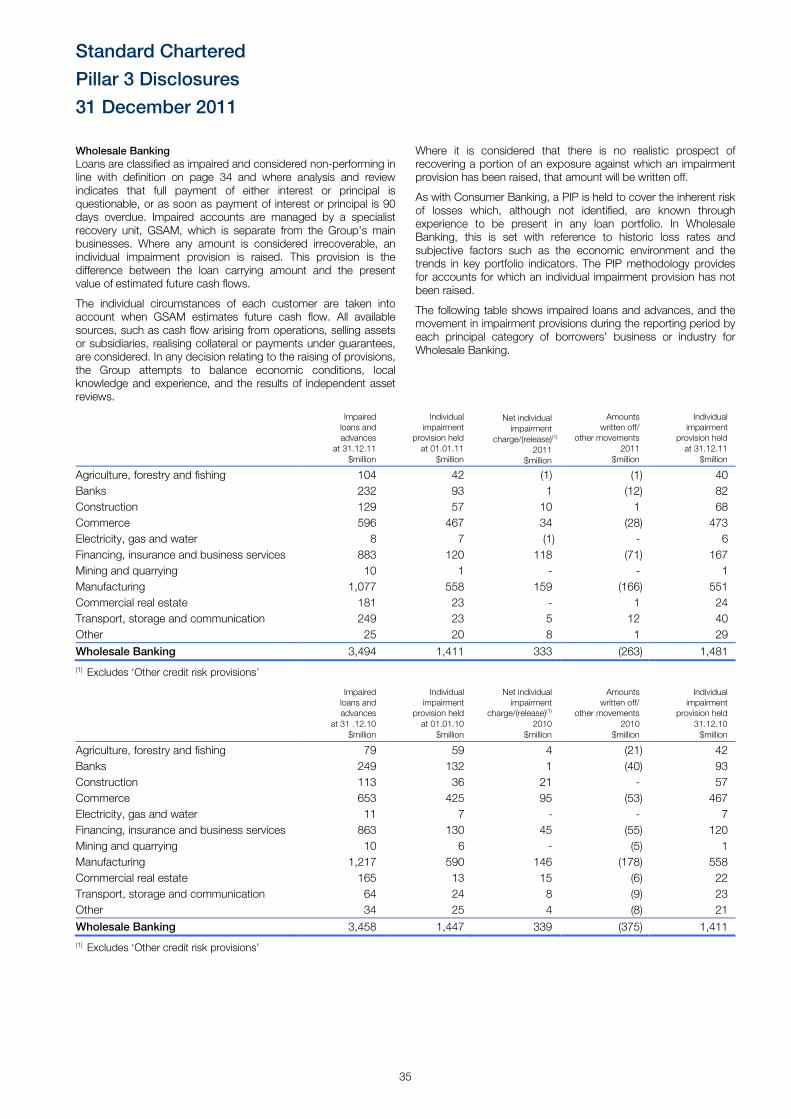
Standard Chartered
Pillar 3 Disclosures
31 December 2011
35
Wholesale Banking Loans are classified as impaired and considered non-performing in line with definition on page 34 and where analysis and review indicates that full payment of either interest or principal is questionable, or as soon as payment of interest or principal is 90 days overdue. Impaired accounts are managed by a specialist recovery unit, GSAM, which is separate from the Group’s main businesses. Where any amount is considered irrecoverable, an individual impairment provision is raised. This provision is the difference between the loan carrying amount and the present value of estimated future cash flows.
The individual circumstances of each customer are taken into account when GSAM estimates future cash flow. All available sources, such as cash flow arising from operations, selling assets or subsidiaries, realising collateral or payments under guarantees, are considered. In any decision relating to the raising of provisions, the Group attempts to balance economic conditions, local knowledge and experience, and the results of independent asset reviews.
Where it is considered that there is no realistic prospect of recovering a portion of an exposure against which an impairment provision has been raised, that amount will be written off.
As with Consumer Banking, a PIP is held to cover the inherent risk of losses which, although not identified, are known through experience to be present in any loan portfolio. In Wholesale Banking, this is set with reference to historic loss rates and subjective factors such as the economic environment and the trends in key portfolio indicators. The PIP methodology provides for accounts for which an individual impairment provision has not been raised.
The following table shows impaired loans and advances, and the movement in impairment provisions during the reporting period by each principal category of borrowers’ business or industry for Wholesale Banking.
Impaired loans and advances
at 31.12.11 $million
Individual impairment
provision held at 01.01.11
$million
Net individual impairment
charge/(release)(1)
2011 $million
Amounts written off/
other movements 2011
$million
Individual impairment
provision held at 31.12.11
$million
Agriculture, forestry and fishing 104 42 (1) (1) 40
Banks 232 93 1 (12) 82
Construction 129 57 10 1 68
Commerce 596 467 34 (28) 473
Electricity, gas and water 8 7 (1) - 6
Financing, insurance and business services 883 120 118 (71) 167
Mining and quarrying 10 1 - - 1
Manufacturing 1,077 558 159 (166) 551
Commercial real estate 181 23 - 1 24
Transport, storage and communication 249 23 5 12 40
Other 25 20 8 1 29
Wholesale Banking 3,494 1,411 333 (263) 1,481
(1) Excludes ‘Other credit risk provisions’
Impaired loans and advances
at 31 .12.10 $million
Individual impairment
provision held at 01.01.10
$million
Net individual impairment
charge/(release)(1) 2010
$million
Amounts written off/
other movements 2010
$million
Individual impairment
provision held 31.12.10 $million
Agriculture, forestry and fishing 79 59 4 (21) 42
Banks 249 132 1 (40) 93
Construction 113 36 21 - 57
Commerce 653 425 95 (53) 467
Electricity, gas and water 11 7 - - 7
Financing, insurance and business services 863 130 45 (55) 120
Mining and quarrying 10 6 - (5) 1
Manufacturing 1,217 590 146 (178) 558
Commercial real estate 165 13 15 (6) 22
Transport, storage and communication 64 24 8 (9) 23
Other 34 25 4 (8) 21
Wholesale Banking 3,458 1,447 339 (375) 1,411
(1) Excludes ‘Other credit risk provisions’
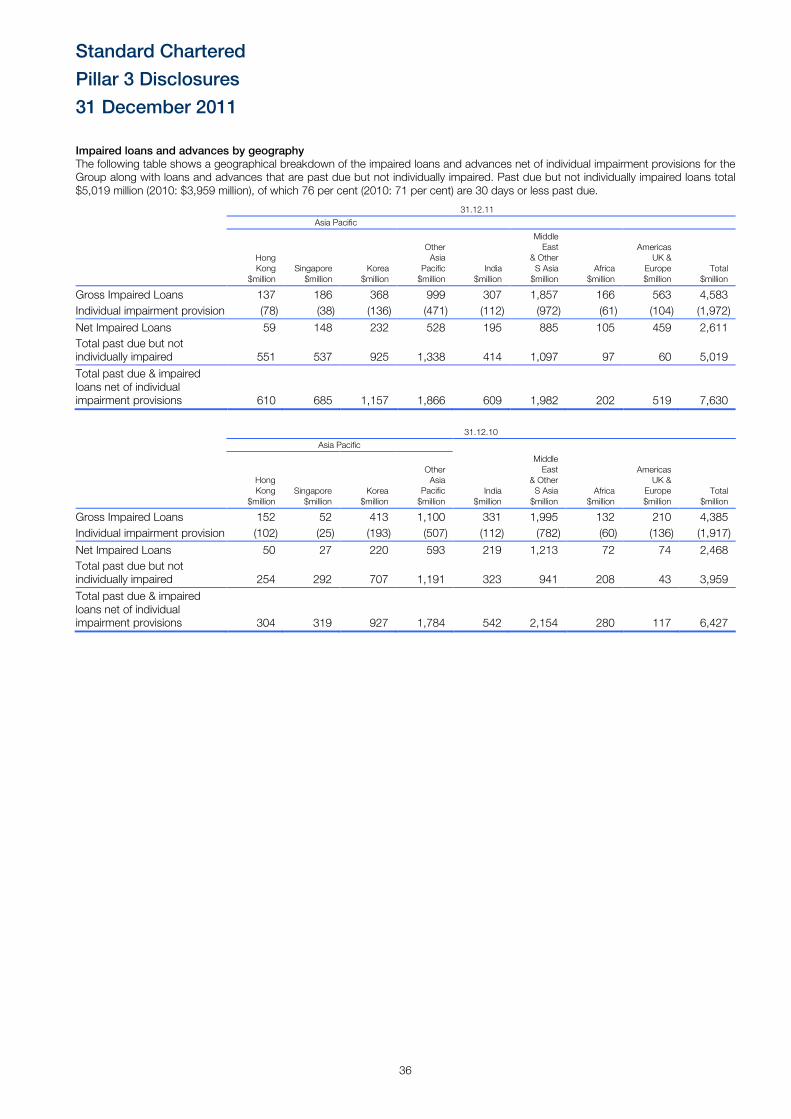
Standard Chartered
Pillar 3 Disclosures
31 December 2011
36
Impaired loans and advances by geography The following table shows a geographical breakdown of the impaired loans and advances net of individual impairment provisions for the Group along with loans and advances that are past due but not individually impaired. Past due but not individually impaired loans total $5,019 million (2010: $3,959 million), of which 76 per cent (2010: 71 per cent) are 30 days or less past due.
31.12.11
Asia Pacific
Hong Kong
$million Singapore $million
Korea $million
Other Asia
Pacific $million
India $million
Middle East
& Other S Asia $million
Africa $million
Americas UK &
Europe $million
Total $million
Gross Impaired Loans 137 186 368 999 307 1,857 166 563 4,583
Individual impairment provision (78) (38) (136) (471) (112) (972) (61) (104) (1,972)
Net Impaired Loans 59 148 232 528 195 885 105 459 2,611
Total past due but not individually impaired 551 537 925 1,338 414 1,097 97 60 5,019
Total past due & impaired loans net of individual impairment provisions 610 685 1,157 1,866 609 1,982 202 519 7,630
31.12.10
Asia Pacific
Hong Kong
$million Singapore $million
Korea $million
Other Asia
Pacific $million
India $million
Middle East
& Other S Asia $million
Africa $million
Americas UK &
Europe $million
Total $million
Gross Impaired Loans 152 52 413 1,100 331 1,995 132 210 4,385
Individual impairment provision (102) (25) (193) (507) (112) (782) (60) (136) (1,917)
Net Impaired Loans 50 27 220 593 219 1,213 72 74 2,468
Total past due but not individually impaired 254 292 707 1,191 323 941 208 43 3,959
Total past due & impaired loans net of individual impairment provisions 304 319 927 1,784 542 2,154 280 117 6,427
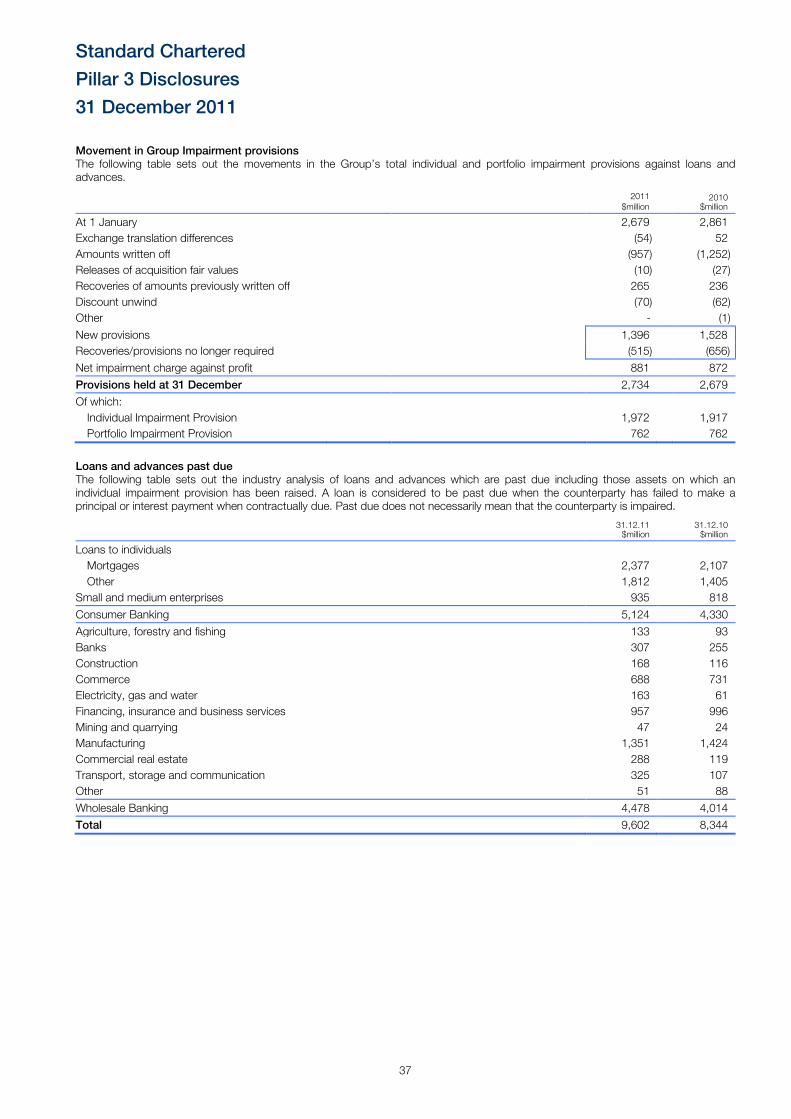
Standard Chartered
Pillar 3 Disclosures
31 December 2011
37
Movement in Group Impairment provisions The following table sets out the movements in the Group’s total individual and portfolio impairment provisions against loans and advances.
2011
$million 2010
$million
At 1 January 2,679 2,861
Exchange translation differences (54) 52
Amounts written off (957) (1,252)
Releases of acquisition fair values (10) (27)
Recoveries of amounts previously written off 265 236
Discount unwind (70) (62)
Other - (1)
New provisions 1,396 1,528
Recoveries/provisions no longer required (515) (656)
Net impairment charge against profit 881 872
Provisions held at 31 December 2,734 2,679
Of which:
Individual Impairment Provision 1,972 1,917
Portfolio Impairment Provision 762 762
Loans and advances past due The following table sets out the industry analysis of loans and advances which are past due including those assets on which an individual impairment provision has been raised. A loan is considered to be past due when the counterparty has failed to make a principal or interest payment when contractually due. Past due does not necessarily mean that the counterparty is impaired.
31.12.11 $million
31.12.10 $million
Loans to individuals
Mortgages 2,377 2,107
Other 1,812 1,405
Small and medium enterprises 935 818
Consumer Banking 5,124 4,330
Agriculture, forestry and fishing 133 93
Banks 307 255
Construction 168 116
Commerce 688 731
Electricity, gas and water 163 61
Financing, insurance and business services 957 996
Mining and quarrying 47 24
Manufacturing 1,351 1,424
Commercial real estate 288 119
Transport, storage and communication 325 107
Other 51 88
Wholesale Banking 4,478 4,014
Total 9,602 8,344
Standard Chartered
Pillar 3 Disclosures
31 December 2011
38
Forbearance and other renegotiated loans Forbearance Forbearance strategies assist customers that are temporarily in financial distress and are unable to meet their original contractual repayment terms. Forbearance can be initiated by the customer, the bank or a third party (including government sponsored programmes or a conglomerate of credit institutions) and includes debt restructuring, such as a new repayment schedule, payment deferrals, tenor extensions and interest only payments.
The Group’s impairment policy generally requires higher impairment charges for restructured assets than for fully performing assets. A discount provision is raised if there is a shortfall when comparing the present value of future cash flows under the revised terms and the carrying value of the loan before restructuring. Individual impairment recognition is accelerated compared to those under normal contractual policy.
In Consumer Banking excluding Medium Enterprises and Private Banking, all loans subject to forbearance (in addition to other renegotiated loans) are managed within a separate portfolio. If such loans subsequently become past due, write off and IIP is accelerated to 90 days past due (unsecured loans and automobile finance) or 120 days past due (secured loans). The accelerated loss rates applied to this portfolio are derived from experience with other renegotiated loans, rather than the Consumer Banking portfolio as a whole, to recognise the greater degree of inherent risk.
At 31 December 2011, $708 million (2010: $747 million) of Consumer Banking loans were subject to forbearance programmes, which represents 0.5 per cent of total loans and advances to Consumer Banking customers. These loans were largely concentrated in countries that have active government sponsored forbearance programmes. Provision coverage against these loans was 16 per cent (2010: 18 per cent); reflecting collateral held and expected recovery rates.
For Wholesale Banking and Medium Enterprise and Private Banking accounts, forbearance and other renegotiations are applied on a case-by-case basis and are not subject to business wide programmes. In some cases, a new loan is granted as part of the restructure and in others, the contractual terms and repayment of the existing loans are changed or extended (for example, interest only for a period).
These accounts are managed by GSAM even if they are not impaired (that is the present value of the new cash flows is the same or greater than the present value of the original cash flows) and are reviewed at least quarterly to assess and confirm the client’s ability to adhere to the restructured repayment strategy. Accounts are also reviewed if there is a significant event that could result in deterioration in their ability to repay.
If the terms of the restructure are such that an independent party in the same geographic area would not be prepared to provide financing on substantially the same terms and conditions, or where the present value of the new cash flows is lower than the present value of the original cash flows, the loan would be considered to be impaired and at a minimum a discount provision would be raised.
Renegotiated loans that would otherwise be past due or impaired Renegotiated loans, which are included within forborne loans, that would otherwise be past due or impaired if their terms had not been renegotiated were $834 million (2010: $1,475 million), $225 million (2010: $312 million) of which relates to Consumer Banking loans to customers and $609 million (2010: $1,163 million) of which relates to Wholesale Banking loans to customers. Loans whose terms have been renegotiated to include concessions that the Group would not ordinarily make will usually be classified as impaired. Renegotiated loans that have not defaulted on interest or principal payments for 180 days post renegotiation and against which no loss of principal is expected are excluded from non-performing loans but remain impaired because they are subject to discount provisions.
Standard Chartered
Pillar 3 Disclosures
31 December 2011
39
4.9. Counterparty credit risk in the trading book
Counterparty credit risk (CCR) is the risk that the Group’s counterparty in a foreign exchange, interest rate, commodity, equity or credit derivative contract defaults prior to maturity date of the contract and that the Group at the time has a claim on the counterparty. CCR arises predominantly in the trading book, but also arises in the non-trading book due to hedging of external funding.
The credit risk arising from all financial derivatives is managed as part of the overall lending limits to banks and customers.
The Group will seek to negotiate Credit Support Annexes (CSAs) with counterparties on a case by case basis, where collateral is deemed a necessary or desirable mitigant to the exposure. The credit terms of the CSA are specific to each legal document and determined by the credit risk approval unit responsible for the counterparty. The nature of the collateral will be specified in the legal document and will typically be cash or highly liquid securities.
The Group further reduces its credit exposures to counterparties by entering into contractual netting agreements which result in a single amount owed by or to the counterparty through netting the sum of the positive (amounts owed by the counterparty) and negative (amounts owed by the Group) mark-to-market (MTM) values of these transactions. Following International Accounting Standard (IAS) 32 requirements, exposures are however presented on a gross basis in the financial statements as such transactions are not intended to be settled net in the ordinary course of business.
A daily operational process takes place to calculate the MTM on all trades captured under the CSA. Additional collateral will be called from the counterparty if total uncollateralised MTM exposure exceeds the threshold and minimum transfer amount specified in the CSA. Additional collateral may be required from the counterparty to provide an extra buffer to the daily variation margin process.
Credit reserves Using risk factors such as PD and LGD a Regulatory Expected Loss is calculated for each counterparty across the CCR portfolio, and based on this calculation credit reserves are set aside for traded products. The reserve is a dynamic calculation based on the EAD risk profile for each counterparty, alongside PD and LGD factors.
In line with market convention, the Group negotiates CSA terms for certain counterparties where the thresholds related to each party are dependent on their External Credit Assessment Institutions (ECAI) long term rating. Such clauses are typically mutual in nature. It is therefore recognised that a downgrade in the Group’s rating could result in counterparties seeking additional collateral calls to cover negative MTM portfolios where thresholds are lowered.
Wrong way risk Wrong way risk occurs when an EAD increase is coupled with a decrease in the credit quality of the obligor. For example, as the MTM on a derivative contract increases in favour of the Group, the counterparty may increasingly be unable to meet its payment, margin call or collateral posting requirements. The Group employs various policies and procedures to ensure that wrong way risk exposures are recognised upfront and monitored.
Exposure value calculation Exposure values for regulatory capital purposes on over the counter traded products are calculated according to the CCR mark to market method. This is calculated as the sum of the current replacement cost and the potential future credit exposure. The current replacement cost is the USD equivalent amount owed by the counterparty to the Group for various financial derivative transactions. The potential future credit exposure is an add-on based on a percentage of the notional principal of each transaction. Such percentages are prescribed by the FSA in the BIPRU guidelines and vary according to the underlying asset class and tenor of each trade. The benefit from master netting agreements is applied to the portfolio of counterparty trades in the CCR calculation according to the Net to Gross Ratio rules provided in the FSA Handbook BIPRU 13 guidelines.
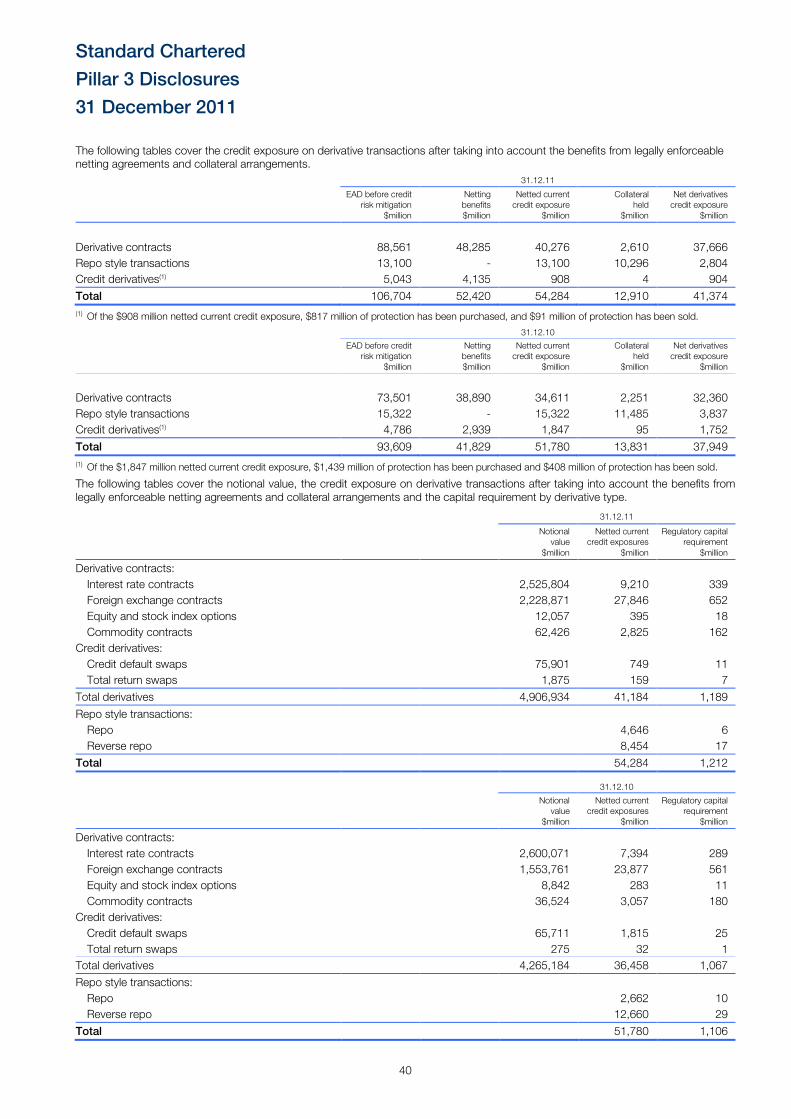
Standard Chartered
Pillar 3 Disclosures
31 December 2011
40
The following tables cover the credit exposure on derivative transactions after taking into account the benefits from legally enforceable netting agreements and collateral arrangements.
31.12.11
EAD before credit risk mitigation
$million
Netting benefits $million
Netted current credit exposure
$million
Collateral held
$million
Net derivatives credit exposure
$million
Derivative contracts 88,561 48,285 40,276 2,610 37,666
Repo style transactions 13,100 - 13,100 10,296 2,804
Credit derivatives(1) 5,043 4,135 908 4 904
Total 106,704 52,420 54,284 12,910 41,374
(1) Of the $908 million netted current credit exposure, $817 million of protection has been purchased, and $91 million of protection has been sold.
31.12.10
EAD before credit risk mitigation
$million
Netting benefits $million
Netted current credit exposure
$million
Collateral held
$million
Net derivatives credit exposure
$million
Derivative contracts 73,501 38,890 34,611 2,251 32,360
Repo style transactions 15,322 - 15,322 11,485 3,837
Credit derivatives(1) 4,786 2,939 1,847 95 1,752
Total 93,609 41,829 51,780 13,831 37,949
(1) Of the $1,847 million netted current credit exposure, $1,439 million of protection has been purchased and $408 million of protection has been sold.
The following tables cover the notional value, the credit exposure on derivative transactions after taking into account the benefits from legally enforceable netting agreements and collateral arrangements and the capital requirement by derivative type.
31.12.11
Notional value
$million
Netted current credit exposures
$million
Regulatory capital requirement
$million
Derivative contracts:
Interest rate contracts 2,525,804 9,210 339
Foreign exchange contracts 2,228,871 27,846 652
Equity and stock index options 12,057 395 18
Commodity contracts 62,426 2,825 162
Credit derivatives:
Credit default swaps 75,901 749 11
Total return swaps 1,875 159 7
Total derivatives 4,906,934 41,184 1,189
Repo style transactions:
Repo 4,646 6
Reverse repo 8,454 17
Total 54,284 1,212
31.12.10
Notional value
$million
Netted current credit exposures
$million
Regulatory capital requirement
$million
Derivative contracts:
Interest rate contracts 2,600,071 7,394 289
Foreign exchange contracts 1,553,761 23,877 561
Equity and stock index options 8,842 283 11
Commodity contracts 36,524 3,057 180
Credit derivatives:
Credit default swaps 65,711 1,815 25
Total return swaps 275 32 1
Total derivatives 4,265,184 36,458 1,067
Repo style transactions:
Repo 2,662 10
Reverse repo 12,660 29
Total 51,780 1,106
Standard Chartered
Pillar 3 Disclosures
31 December 2011
41
4.10. Securitisation
Securitisation is defined as a structure where the cash flow from a pool of assets is used to service obligations to at least two different tranches or classes of creditors.
Securitisations may be categorised as either:
• traditional securitisation: assets are sold to a Special Purpose Entity (SPE), which finances the purchase by issuing notes in different tranches with different risk and return profiles. Cash flow arising from those assets is used by the SPE to service its debt obligations, or:
• synthetic transaction: a securitisation whereby only the credit risk, or part of the credit risk of a pool of assets is transferred to a third party via credit derivatives. The pool of assets remains on the Group’s balance sheet.
Securitisation activities undertaken by the Group are for a variety of purposes, by various businesses acting in a different capacity:
• Risk Mitigation, Funding and Capital Management (as Originator);
• Fee Generation (as Arranger/ Lead Manager);
• Risk Taking (as Investor).
The Group has $20.8 billion (2010: $18.6 billion) of EAD classified as securitisation positions, as shown in Section 4.4 Exposure Values. These transactions meet the criteria to qualify as securitisation positions under the FSA’s securitisation framework and the particulars of these transactions are discussed below. In addition to these positions, the Group has transferred the rights to any collection of principal and interest on customer loan assets with a face value of $2.2 billion (2010: $3.1 billion), which do not qualify as securitisation positions under the FSA framework and are not detailed within this section.
Asset Backed Securities Wholesale Banking through the Capital Markets unit has purchased as investments or arranged for clients and held Asset Backed Securities (ABS) of $2.4 billion (2010: $2.7 billion), the carrying value of which represents 0.3 per cent of the Group’s total assets (2009 0.5 per cent).
The credit quality of the ABS exposures remains strong. With the exception of those securities which have been subject to an impairment charge, 67 per cent of the overall portfolio is rated A, or better, and 15 per cent of the overall portfolio is rated as AAA. The portfolio is broadly diversified across asset classes and geographies, and there is no direct exposure to the US sub-prime market. The portfolio has an average credit grade of A.
32 per cent of the overall portfolio is invested in Residential Mortgage Backed Securities (RMBS), with a weighted average credit rating of AA- (AA in 2010). 38 per cent of the RMBS exposures were originated in 2005 or earlier.
26 per cent of the overall portfolio is in Commercial Mortgage Backed Securities (CMBS), of which $120 million is in respect of US CMBS with a weighted average credit grade of AA- (AA in 2010). The weighted average credit rating of the remaining CMBS exposure is BBB.
13 per cent of the overall portfolio is in Collateralised Debt Obligations (CDOs). This includes $30 million of exposures to CDOs of ABS (Mezzanine and High Grade), of which $20 million have been impaired. The remainder of the other CDOs amounting to $278 million has a weighted average credit rating of A+.
29 per cent of the overall portfolio is in Other ABS, which includes securities backed by loans to corporates or corporate SMEs, student loans, auto loans, and diversified payment types, with a weighted credit rating of A.
The notional and carrying value of the asset backed securities purchased or retained by the Group are shown in the table below analysed by underlying asset type, alongside any recognised net gain or loss on sale in the period. ABS are accounted for as financial assets. For further details regarding recognition and impairment refer to Note 1 of the Group’s Annual Report and Accounts. The ABS portfolio is assessed frequently for objective evidence of impairment. In 2011, $16 million of mezzanine CMBS, US RMBS and Trust Preferred CDO’s were impaired.
Valuation of retained interest is initially and subsequently determined using market price quotations where available or internal pricing models that utilise variables such as yield curves, prepayment speeds, default rates, loss severity, interest rate volatilities and spreads. The assumptions used for valuation are based on observable transactions in similar securities and are verified by external pricing sources, where available.
The ABS portfolio is closely managed by a centralised dedicated team. This team has all the capabilities (Legal, Risk, GSAM, Credit Analysis, Asset Surveillance, Trading and Distribution) and authority to manage this portfolio effectively. The team has developed a detailed analysis and reporting framework of the underlying portfolio to allow senior management to make an informed holding decision with regards to specific assets, asset classes or parts of an asset class.
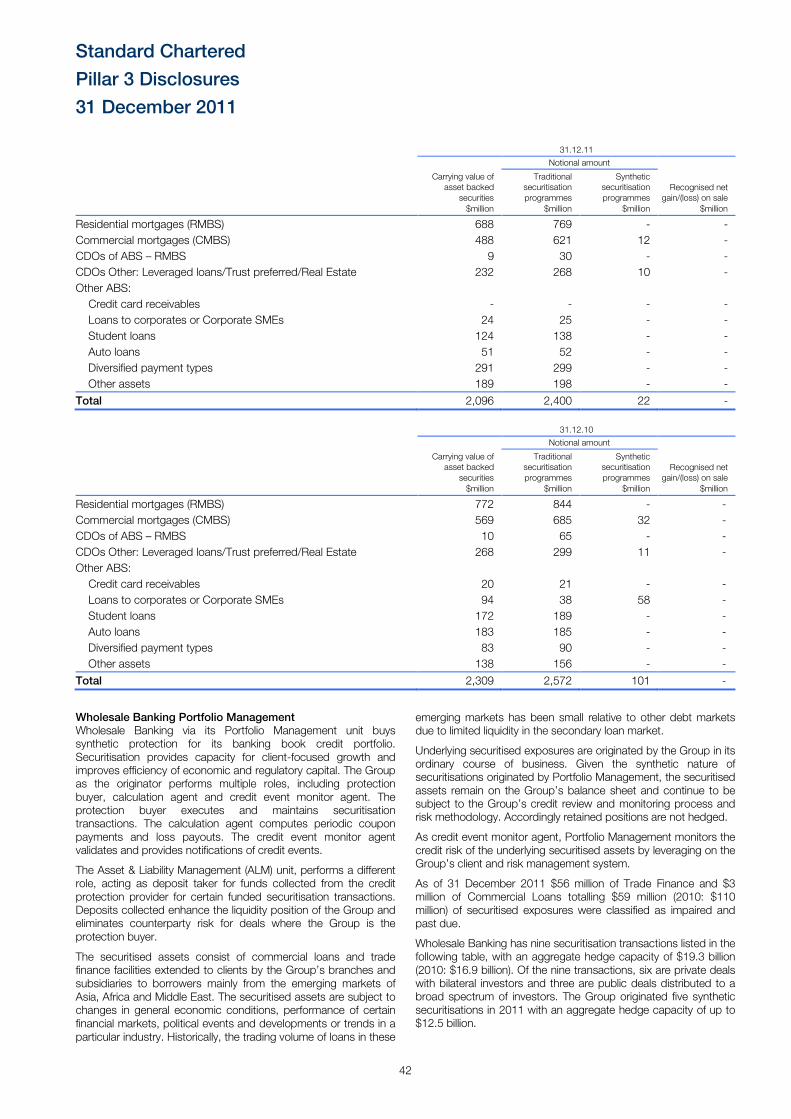
Standard Chartered
Pillar 3 Disclosures
31 December 2011
42
31.12.11
Notional amount
Carrying value of asset backed
securities $million
Traditional securitisation programmes
$million
Synthetic securitisation programmes
$million
Recognised net gain/(loss) on sale
$million
Residential mortgages (RMBS) 688 769 - -
Commercial mortgages (CMBS) 488 621 12 -
CDOs of ABS – RMBS 9 30 - -
CDOs Other: Leveraged loans/Trust preferred/Real Estate 232 268 10 -
Other ABS:
Credit card receivables - - - -
Loans to corporates or Corporate SMEs 24 25 - -
Student loans 124 138 - -
Auto loans 51 52 - -
Diversified payment types 291 299 - -
Other assets 189 198 - -
Total 2,096 2,400 22 -
31.12.10
Notional amount
Carrying value of asset backed
securities $million
Traditional securitisation programmes
$million
Synthetic securitisation programmes
$million
Recognised net gain/(loss) on sale
$million
Residential mortgages (RMBS) 772 844 - -
Commercial mortgages (CMBS) 569 685 32 -
CDOs of ABS – RMBS 10 65 - -
CDOs Other: Leveraged loans/Trust preferred/Real Estate 268 299 11 -
Other ABS:
Credit card receivables 20 21 - -
Loans to corporates or Corporate SMEs 94 38 58 -
Student loans 172 189 - -
Auto loans 183 185 - -
Diversified payment types 83 90 - -
Other assets 138 156 - -
Total 2,309 2,572 101 -
Wholesale Banking Portfolio Management Wholesale Banking via its Portfolio Management unit buys synthetic protection for its banking book credit portfolio. Securitisation provides capacity for client-focused growth and improves efficiency of economic and regulatory capital. The Group as the originator performs multiple roles, including protection buyer, calculation agent and credit event monitor agent. The protection buyer executes and maintains securitisation transactions. The calculation agent computes periodic coupon payments and loss payouts. The credit event monitor agent validates and provides notifications of credit events.
The Asset & Liability Management (ALM) unit, performs a different role, acting as deposit taker for funds collected from the credit protection provider for certain funded securitisation transactions. Deposits collected enhance the liquidity position of the Group and eliminates counterparty risk for deals where the Group is the protection buyer.
The securitised assets consist of commercial loans and trade finance facilities extended to clients by the Group’s branches and subsidiaries to borrowers mainly from the emerging markets of Asia, Africa and Middle East. The securitised assets are subject to changes in general economic conditions, performance of certain financial markets, political events and developments or trends in a particular industry. Historically, the trading volume of loans in these
emerging markets has been small relative to other debt markets due to limited liquidity in the secondary loan market.
Underlying securitised exposures are originated by the Group in its ordinary course of business. Given the synthetic nature of securitisations originated by Portfolio Management, the securitised assets remain on the Group’s balance sheet and continue to be subject to the Group’s credit review and monitoring process and risk methodology. Accordingly retained positions are not hedged.
As credit event monitor agent, Portfolio Management monitors the credit risk of the underlying securitised assets by leveraging on the Group’s client and risk management system.
As of 31 December 2011 $56 million of Trade Finance and $3 million of Commercial Loans totalling $59 million (2010: $110 million) of securitised exposures were classified as impaired and past due.
Wholesale Banking has nine securitisation transactions listed in the following table, with an aggregate hedge capacity of $19.3 billion (2010: $16.9 billion). Of the nine transactions, six are private deals with bilateral investors and three are public deals distributed to a broad spectrum of investors. The Group originated five synthetic securitisations in 2011 with an aggregate hedge capacity of up to $12.5 billion.
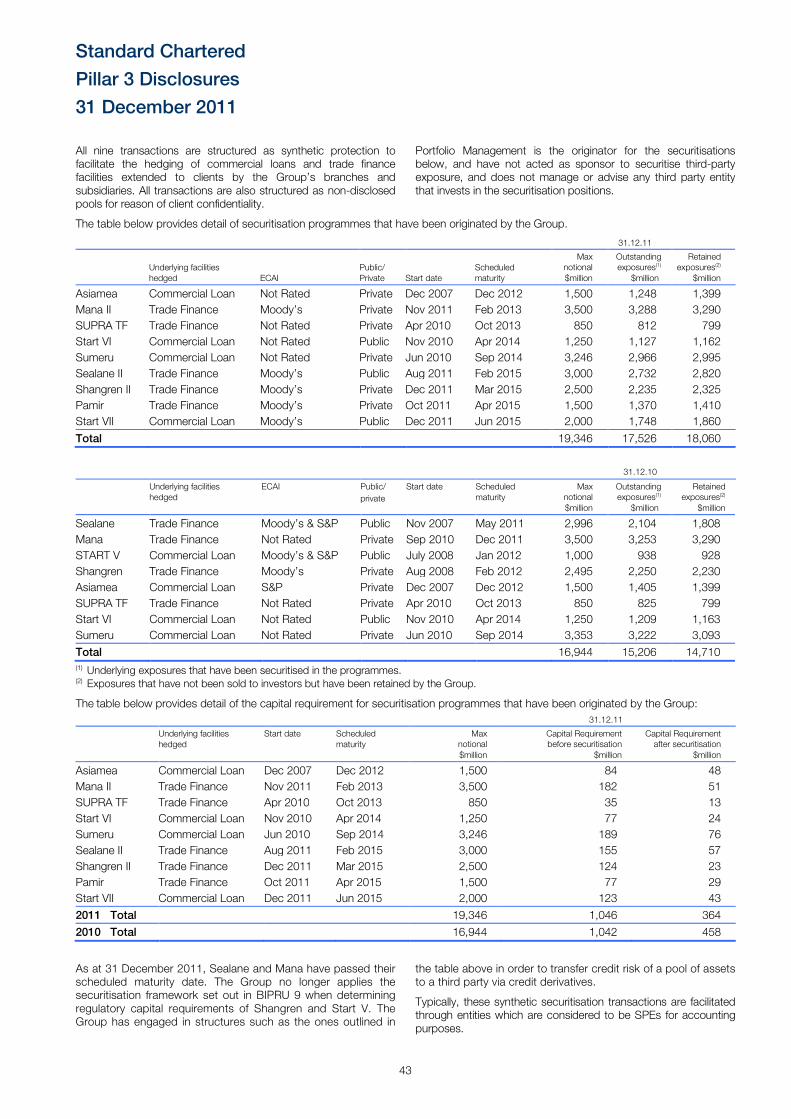
Standard Chartered
Pillar 3 Disclosures
31 December 2011
43
All nine transactions are structured as synthetic protection to facilitate the hedging of commercial loans and trade finance facilities extended to clients by the Group’s branches and subsidiaries. All transactions are also structured as non-disclosed pools for reason of client confidentiality.
Portfolio Management is the originator for the securitisations below, and have not acted as sponsor to securitise third-party exposure, and does not manage or advise any third party entity that invests in the securitisation positions.
The table below provides detail of securitisation programmes that have been originated by the Group.
31.12.11
Underlying facilities hedged ECAI
Public/ Private Start date
Scheduled maturity
Max notional $million
Outstanding exposures(1)
$million
Retained exposures(2)
$million
Asiamea Commercial Loan Not Rated Private Dec 2007 Dec 2012 1,500 1,248 1,399
Mana II Trade Finance Moody’s Private Nov 2011 Feb 2013 3,500 3,288 3,290
SUPRA TF Trade Finance Not Rated Private Apr 2010 Oct 2013 850 812 799
Start VI Commercial Loan Not Rated Public Nov 2010 Apr 2014 1,250 1,127 1,162
Sumeru Commercial Loan Not Rated Private Jun 2010 Sep 2014 3,246 2,966 2,995
Sealane II Trade Finance Moody’s Public Aug 2011 Feb 2015 3,000 2,732 2,820
Shangren II Trade Finance Moody’s Private Dec 2011 Mar 2015 2,500 2,235 2,325
Pamir Trade Finance Moody’s Private Oct 2011 Apr 2015 1,500 1,370 1,410
Start VII Commercial Loan Moody’s Public Dec 2011 Jun 2015 2,000 1,748 1,860
Total 19,346 17,526 18,060
31.12.10
Underlying facilities hedged
ECAI Public/
private
Start date Scheduled maturity
Max notional $million
Outstanding exposures(1)
$million
Retained exposures(2)
$million
Sealane Trade Finance Moody’s & S&P Public Nov 2007 May 2011 2,996 2,104 1,808
Mana Trade Finance Not Rated Private Sep 2010 Dec 2011 3,500 3,253 3,290
START V Commercial Loan Moody’s & S&P Public July 2008 Jan 2012 1,000 938 928
Shangren Trade Finance Moody’s Private Aug 2008 Feb 2012 2,495 2,250 2,230
Asiamea Commercial Loan S&P Private Dec 2007 Dec 2012 1,500 1,405 1,399
SUPRA TF Trade Finance Not Rated Private Apr 2010 Oct 2013 850 825 799
Start VI Commercial Loan Not Rated Public Nov 2010 Apr 2014 1,250 1,209 1,163
Sumeru Commercial Loan Not Rated Private Jun 2010 Sep 2014 3,353 3,222 3,093
Total 16,944 15,206 14,710 (1) Underlying exposures that have been securitised in the programmes. (2) Exposures that have not been sold to investors but have been retained by the Group.
The table below provides detail of the capital requirement for securitisation programmes that have been originated by the Group:
31.12.11
Underlying facilities hedged
Start date Scheduled maturity
Max notional $million
Capital Requirement before securitisation
$million
Capital Requirement after securitisation
$million
Asiamea Commercial Loan Dec 2007 Dec 2012 1,500 84 48
Mana II Trade Finance Nov 2011 Feb 2013 3,500 182 51
SUPRA TF Trade Finance Apr 2010 Oct 2013 850 35 13
Start VI Commercial Loan Nov 2010 Apr 2014 1,250 77 24
Sumeru Commercial Loan Jun 2010 Sep 2014 3,246 189 76
Sealane II Trade Finance Aug 2011 Feb 2015 3,000 155 57
Shangren II Trade Finance Dec 2011 Mar 2015 2,500 124 23
Pamir Trade Finance Oct 2011 Apr 2015 1,500 77 29
Start VII Commercial Loan Dec 2011 Jun 2015 2,000 123 43
2011 Total 19,346 1,046 364
2010 Total 16,944 1,042 458
As at 31 December 2011, Sealane and Mana have passed their scheduled maturity date. The Group no longer applies the securitisation framework set out in BIPRU 9 when determining regulatory capital requirements of Shangren and Start V. The Group has engaged in structures such as the ones outlined in
the table above in order to transfer credit risk of a pool of assets to a third party via credit derivatives.
Typically, these synthetic securitisation transactions are facilitated through entities which are considered to be SPEs for accounting purposes.
Standard Chartered
Pillar 3 Disclosures
31 December 2011
44
In these transactions, the underlying assets are not sold into the relevant SPE. Instead, the credit risk of the underlying assets is transferred to the SPEs synthetically via credit default swaps whereby the SPEs act as sellers of credit protection and receive premiums paid by the Group in return. The SPEs in turn issue credit-linked notes to third party investors who fund the credit protection in exchange for coupon on the notes purchased. The premium received by the SPEs and interest earned on the funded amount of the purchased notes are passed through to the third party investors as coupon on the purchased notes. Payment to the third party investors is made in accordance with the priority of payments stipulated in the transaction documents.
These securitisation transactions are outlined in the table above. For all transactions except Mana II, notes were issued by SPEs. For the Mana II transaction, notes were issued directly by Standard Chartered Bank under its Structured Product Programme.
Accounting policy The SPEs associated with the programmes above are not consolidated into the Group. SPEs are only consolidated when the Group has control of the SPE. Control is assessed based on the Group’s exposure to the majority of the risks of the SPE and the right to obtain the majority of the benefits of the SPE. The assessment of risks and benefits is based on the assessed risk exposures at inception and these risks and benefits are re-considered if and when circumstances change. These circumstances may include situations when the Group acquires additional interests in the SPE, or the Group acquires control of the financial and operating policies of the SPE.
In the synthetic securitisation tranches such as those listed above, the underlying assets are not transferred into the associated SPE. Since the Group continues to own or hold all of the risks and returns relating to these assets and the credit protection afforded by the synthetic securitisation only serves to protect the Group against losses upon the occurrence of certain credit events, the assets are not de-recognised from the Group balance sheet. The assets will be fully de-recognised from the Group balance sheet if all the risks and returns relating to the assets have been transferred to the relevant SPE, and this typically entails a true sale of the assets to the SPE. Alternatively, the assets can be partially de-recognised from the Group balance sheet if a significant portion of risks and returns relating to the assets are transferred to the SPE and only a portion of the assets that commensurate with the retained risk and return of the assets is recognised on the Group balance sheet.
Retained notes are initially valued at cost and subsequently determined using market price quotations where available, or in their absence, dealer quotes. The assumptions used for valuation are based on observable transactions in similar securities and are verified by external pricing sources, where available.
Governance of securitisation activities Securitisation transactions proposed for funding and capital management must first obtain support from the respective Balance Sheet Committee (BSC), which manages the capital requirements of the business, before going to Group Capital Management Committee (GCMC) for final approval and Liquidity Management Committee (LMC) for noting.
Execution of each securitisation transaction must either be under an individual Transaction Programme Authorisation or Product Program Framework; such that all relevant support, control and risk functions are involved in the transaction. Specifically, Compliance covers issues like confidentiality of clients’ information and insider information, Finance advises on the accounting treatment, Credit Risk advises on the regulatory treatment, Group Tax provides an opinion on taxation and Group Regulatory Reporting facilitates communication with the regulator.
Basel II for securitisation positions The calculation of risk-weighted exposure amounts for securitisation positions is based on the following two calculation methods advised by the FSA:
• IRB method for third party senior securitisation positions bought and securitisation positions originated and retained by SCB (including haircuts due to currency and collateral mismatch); and
• Standardised Approach for the residual risk-weighted exposure amounts for all other securitisation positions originated by the Group and sold.
All existing securitisation transactions originated by Wholesale Banking, in the table above, meet the credit risk transfer requirement to be accounted for as securitisation under the Basel II regulatory capital regime.
The table below presents a summary of the securitisation positions retained and the carrying value of ABS purchased or arranged by the Group, analysed by risk weight band. The majority of the exposures are rated AAA.
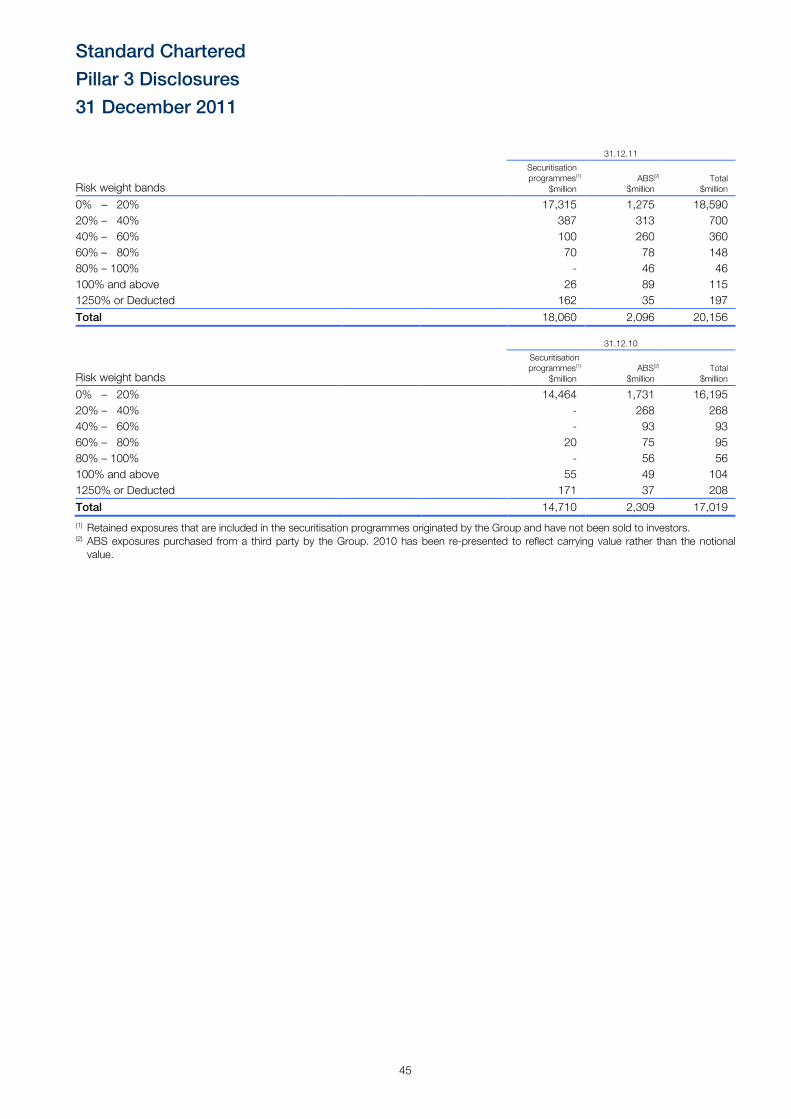
Standard Chartered
Pillar 3 Disclosures
31 December 2011
45
31.12.11
Risk weight bands
Securitisation programmes(1)
$million ABS(2)
$million Total
$million
0% – 20% 17,315 1,275 18,590
20% – 40% 387 313 700
40% – 60% 100 260 360
60% – 80% 70 78 148
80% – 100% - 46 46
100% and above 26 89 115
1250% or Deducted 162 35 197
Total 18,060 2,096 20,156
31.12.10
Risk weight bands
Securitisation programmes(1)
$million ABS(2)
$million Total
$million
0% – 20% 14,464 1,731 16,195
20% – 40% - 268 268
40% – 60% - 93 93
60% – 80% 20 75 95
80% – 100% - 56 56
100% and above 55 49 104
1250% or Deducted 171 37 208
Total 14,710 2,309 17,019
(1) Retained exposures that are included in the securitisation programmes originated by the Group and have not been sold to investors. (2) ABS exposures purchased from a third party by the Group. 2010 has been re-presented to reflect carrying value rather than the notional value.
Standard Chartered
Pillar 3 Disclosures
31 December 2011
46
5. Market risk
Standard Chartered recognises market risk as the potential for loss of earnings or economic value due to adverse changes in financial market rates or prices. The Group is exposed to market risk arising principally from customer-driven transactions. The objective of the Group’s market risk policies and processes is to obtain the best balance of risk and return while meeting customers’ requirements.
The primary categories of market risk for Standard Chartered are:
• interest rate risk: arising from changes in yield curves, credit spreads and implied volatilities on interest rate options;
• currency exchange rate risk: arising from changes in exchange rates and implied volatilities on foreign exchange options;
• commodity price risk: arising from changes in commodity prices and commodity option implied volatilities; covering energy, precious metals, base metals and agriculture; and
• equity price risk: arising from changes in the prices of equities, equity indices, equity baskets and implied volatilities on related options.
Market risk governance The GRC approves the Group’s market risk appetite taking account of market volatility, the range of products and asset classes, business volumes and transaction sizes. Market risk exposures have remained broadly stable in 2011.
The Group Market Risk Committee (GMRC), under authority delegated by the GRC, is responsible for setting VaR and stress loss triggers for market risk within the Group’s risk appetite. The GMRC is also responsible for policies and other standards for the control of market risk and overseeing their effective implementation. These policies cover both trading and non-trading books of the Group. The trading book is defined as per the FSA’s Handbook BIPRU. This is more restrictive than the broader definition within IAS 39 ‘Financial Instruments: Recognition and Measurement’, as the FSA only permits certain types of financial instruments or arrangements to be included within the trading book. Limits by location and portfolio are proposed by the businesses within the terms of agreed policy.
Group Market Risk (GMR) approves the limits within delegated authorities and monitors exposures against these limits. Additional limits are placed on specific instruments and position concentrations where appropriate. Sensitivity measures are used in addition to VaR as risk management tools. For example, interest rate sensitivity is measured in terms of exposure to a one basis point increase in yields, whereas foreign exchange, commodity and equity sensitivities are measured in terms of the underlying values or amounts involved. Option risks are controlled through revaluation limits on underlying price and volatility shifts, limits on volatility risk and other variables that determine the options’ value.
Value at Risk
The Group measures the risk of losses arising from future potential adverse movements in market rates, prices and volatilities using a VaR methodology. VaR, in general, is a quantitative measure of market risk that applies recent historical market conditions to estimate the potential future loss in market value that will not be exceeded in a set time period at a set statistical confidence level. VaR provides a consistent measure that can be applied across trading businesses and products over
time and can be set against actual daily trading profit and loss outcome.
VaR is calculated for expected movements over a minimum of one business day and to a confidence level of 97.5 per cent. This confidence level suggests that potential daily losses, in excess of the VaR measure, are likely to be experienced six times per year.
The Group applies two VaR methodologies:
• historical simulation: involves the revaluation of all existing positions to reflect the effect of historically observed changes in market risk factors on the valuation of the current portfolio. This approach is applied for general market risk factors;
• Monte Carlo simulation: this methodology is similar to historical simulation but with considerably more input risk factor observations. These are generated by random sampling techniques, but the results retain the essential variability and correlations of historically observed risk factor changes. This approach is applied for credit spread VaR.
In both methods a historical observation period of one year is chosen and applied.
VaR is calculated as the Group’s exposure as at the close of business, generally London time. Intra-day risk levels may vary from those reported at the end of the day.
Back testing
To assess their predictive power, VaR models are back tested against actual results. In 2011 there have been four exceptions in the regulatory back testing, compared with one in 2010. This is within the ‘green zone’ applied internationally to internal models by bank supervisors, and implies that model reliability is statistically greater than 95 per cent.
Back testing is conducted daily against clean profit and loss, which is the actual profit and loss for a given business day adjusted to remove the effect of certain items unrelated to market risk. Back testing is also conducted against clean hypothetical profit and loss which is the clean profit and loss that would have occurred for a given business day if the portfolio on which the VaR number for that business day is based remained unchanged.
Stress testing Losses beyond the confidence interval are not captured by a VaR calculation, which therefore gives no indication of the size of unexpected losses in these situations.
GMR complements the VaR measurement by weekly stress testing of market risk exposures to highlight the potential risk that may arise from extreme market events that are rare but plausible.
Stress testing is an integral part of the market risk management framework and considers both historical market events and forward-looking scenarios. A consistent stress testing methodology is applied to trading and non-trading books. The stress testing methodology assumes that scope for management action would be limited during a stress event, reflecting the decrease in market liquidity that often occurs.
Stress scenarios are regularly updated to reflect changes in risk profile and economic events. The GMRC has responsibility for reviewing stress exposures and, where necessary, enforcing reductions in overall market risk exposure. The GRC considers the results of stress tests as part of its supervision of risk appetite.
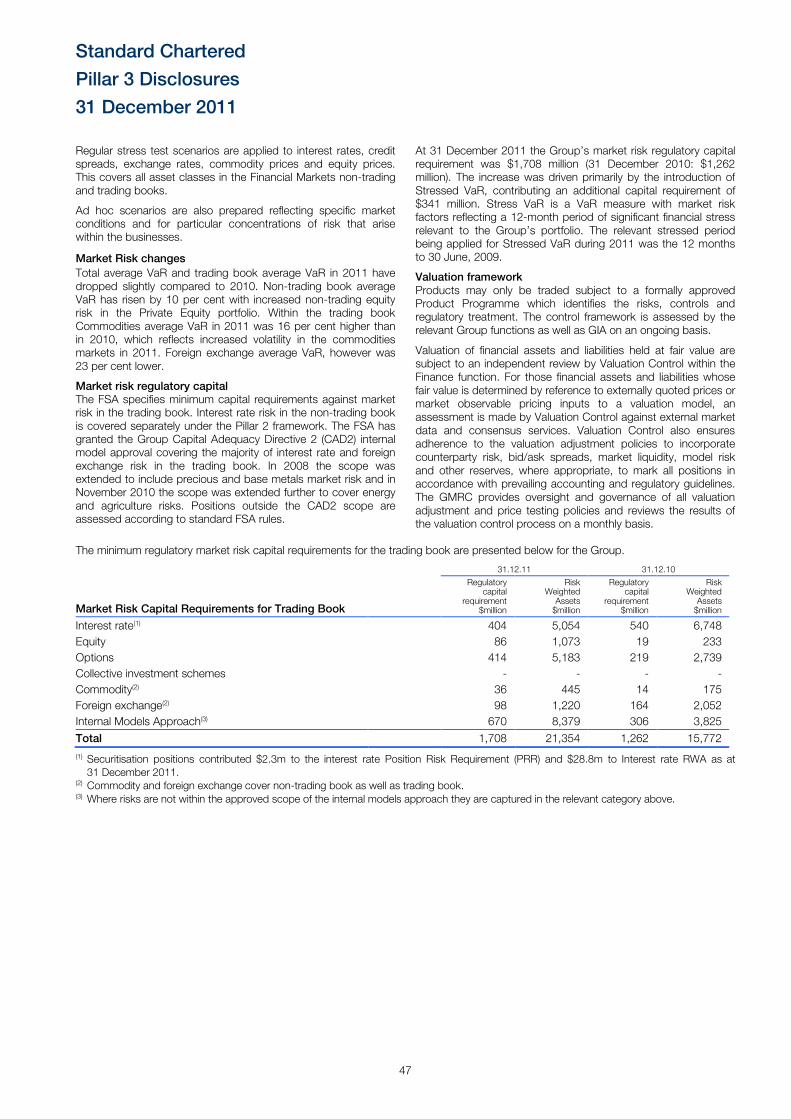
Standard Chartered
Pillar 3 Disclosures
31 December 2011
47
Regular stress test scenarios are applied to interest rates, credit spreads, exchange rates, commodity prices and equity prices. This covers all asset classes in the Financial Markets non-trading and trading books.
Ad hoc scenarios are also prepared reflecting specific market conditions and for particular concentrations of risk that arise within the businesses.
Market Risk changes
Total average VaR and trading book average VaR in 2011 have dropped slightly compared to 2010. Non-trading book average VaR has risen by 10 per cent with increased non-trading equity risk in the Private Equity portfolio. Within the trading book Commodities average VaR in 2011 was 16 per cent higher than in 2010, which reflects increased volatility in the commodities markets in 2011. Foreign exchange average VaR, however was 23 per cent lower.
Market risk regulatory capital The FSA specifies minimum capital requirements against market risk in the trading book. Interest rate risk in the non-trading book is covered separately under the Pillar 2 framework. The FSA has granted the Group Capital Adequacy Directive 2 (CAD2) internal model approval covering the majority of interest rate and foreign exchange risk in the trading book. In 2008 the scope was extended to include precious and base metals market risk and in November 2010 the scope was extended further to cover energy and agriculture risks. Positions outside the CAD2 scope are assessed according to standard FSA rules.
At 31 December 2011 the Group’s market risk regulatory capital requirement was $1,708 million (31 December 2010: $1,262 million). The increase was driven primarily by the introduction of Stressed VaR, contributing an additional capital requirement of $341 million. Stress VaR is a VaR measure with market risk factors reflecting a 12-month period of significant financial stress relevant to the Group’s portfolio. The relevant stressed period being applied for Stressed VaR during 2011 was the 12 months to 30 June, 2009.
Valuation framework Products may only be traded subject to a formally approved Product Programme which identifies the risks, controls and regulatory treatment. The control framework is assessed by the relevant Group functions as well as GIA on an ongoing basis.
Valuation of financial assets and liabilities held at fair value are subject to an independent review by Valuation Control within the Finance function. For those financial assets and liabilities whose fair value is determined by reference to externally quoted prices or market observable pricing inputs to a valuation model, an assessment is made by Valuation Control against external market data and consensus services. Valuation Control also ensures adherence to the valuation adjustment policies to incorporate counterparty risk, bid/ask spreads, market liquidity, model risk and other reserves, where appropriate, to mark all positions in accordance with prevailing accounting and regulatory guidelines. The GMRC provides oversight and governance of all valuation adjustment and price testing policies and reviews the results of the valuation control process on a monthly basis.
The minimum regulatory market risk capital requirements for the trading book are presented below for the Group.
31.12.11 31.12.10
Market Risk Capital Requirements for Trading Book
Regulatory capital
requirement $million
Risk Weighted Assets $million
Regulatory capital
requirement $million
Risk Weighted Assets $million
Interest rate(1) 404 5,054 540 6,748
Equity 86 1,073 19 233
Options 414 5,183 219 2,739
Collective investment schemes - - - -
Commodity(2) 36 445 14 175
Foreign exchange(2) 98 1,220 164 2,052
Internal Models Approach(3) 670 8,379 306 3,825
Total 1,708 21,354 1,262 15,772
(1) Securitisation positions contributed $2.3m to the interest rate Position Risk Requirement (PRR) and $28.8m to Interest rate RWA as at 31 December 2011.
(2) Commodity and foreign exchange cover non-trading book as well as trading book. (3) Where risks are not within the approved scope of the internal models approach they are captured in the relevant category above.
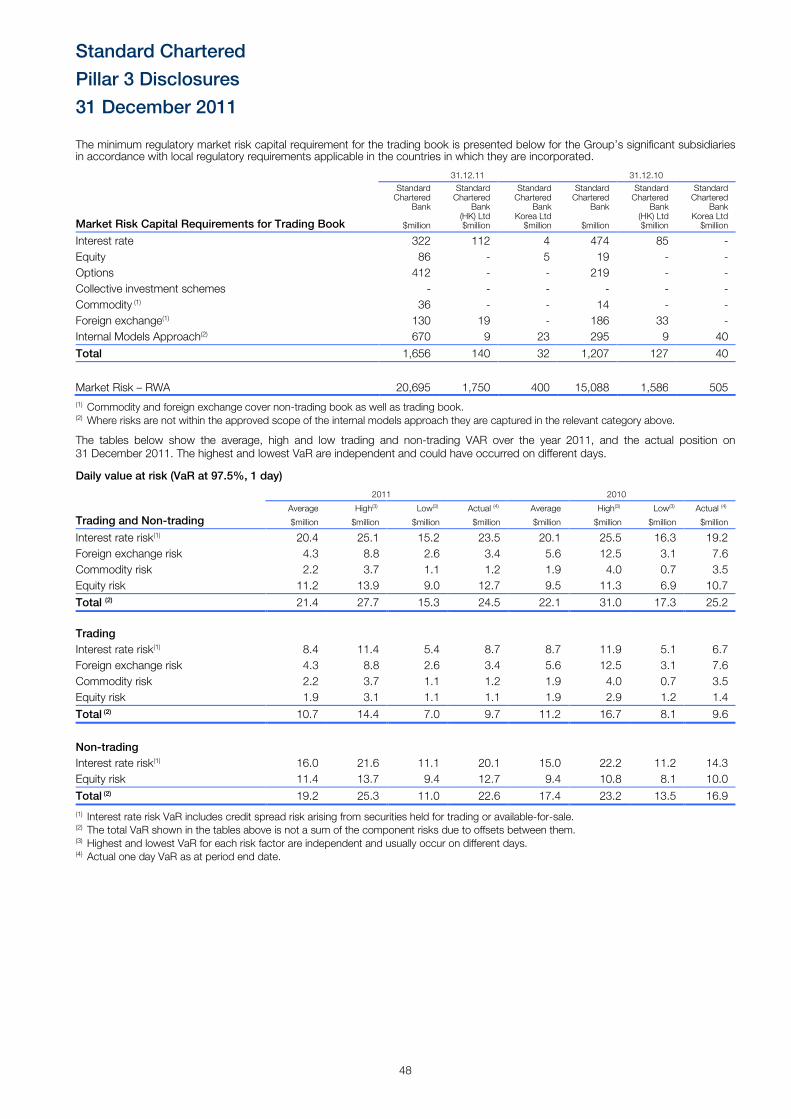
Standard Chartered
Pillar 3 Disclosures
31 December 2011
48
The minimum regulatory market risk capital requirement for the trading book is presented below for the Group’s significant subsidiaries in accordance with local regulatory requirements applicable in the countries in which they are incorporated.
31.12.11 31.12.10
Market Risk Capital Requirements for Trading Book
Standard Chartered
Bank
$million
Standard Chartered
Bank (HK) Ltd $million
Standard Chartered
Bank Korea Ltd $million
Standard Chartered
Bank
$million
Standard Chartered
Bank (HK) Ltd $million
Standard Chartered
Bank Korea Ltd $million
Interest rate 322 112 4 474 85 -
Equity 86 - 5 19 - -
Options 412 - - 219 - -
Collective investment schemes - - - - - -
Commodity (1) 36 - - 14 - -
Foreign exchange(1) 130 19 - 186 33 -
Internal Models Approach(2) 670 9 23 295 9 40
Total 1,656 140 32 1,207 127 40
Market Risk – RWA 20,695 1,750 400 15,088 1,586 505
(1) Commodity and foreign exchange cover non-trading book as well as trading book. (2) Where risks are not within the approved scope of the internal models approach they are captured in the relevant category above.
The tables below show the average, high and low trading and non-trading VAR over the year 2011, and the actual position on 31 December 2011. The highest and lowest VaR are independent and could have occurred on different days.
Daily value at risk (VaR at 97.5%, 1 day) 2011 2010
Trading and Non-trading
Average High(3) Low(3) Actual (4) Average High(3) Low(3) Actual (4)
$million $million $million $million $million $million $million $million
Interest rate risk(1) 20.4 25.1 15.2 23.5 20.1 25.5 16.3 19.2
Foreign exchange risk 4.3 8.8 2.6 3.4 5.6 12.5 3.1 7.6
Commodity risk 2.2 3.7 1.1 1.2 1.9 4.0 0.7 3.5
Equity risk 11.2 13.9 9.0 12.7 9.5 11.3 6.9 10.7
Total (2) 21.4 27.7 15.3 24.5 22.1 31.0 17.3 25.2
Trading
Interest rate risk(1) 8.4 11.4 5.4 8.7 8.7 11.9 5.1 6.7
Foreign exchange risk 4.3 8.8 2.6 3.4 5.6 12.5 3.1 7.6
Commodity risk 2.2 3.7 1.1 1.2 1.9 4.0 0.7 3.5
Equity risk 1.9 3.1 1.1 1.1 1.9 2.9 1.2 1.4
Total (2) 10.7 14.4 7.0 9.7 11.2 16.7 8.1 9.6
Non-trading
Interest rate risk(1) 16.0 21.6 11.1 20.1 15.0 22.2 11.2 14.3
Equity risk 11.4 13.7 9.4 12.7 9.4 10.8 8.1 10.0
Total (2) 19.2 25.3 11.0 22.6 17.4 23.2 13.5 16.9
(1) Interest rate risk VaR includes credit spread risk arising from securities held for trading or available-for-sale.
(2) The total VaR shown in the tables above is not a sum of the component risks due to offsets between them. (3) Highest and lowest VaR for each risk factor are independent and usually occur on different days. (4) Actual one day VaR as at period end date.
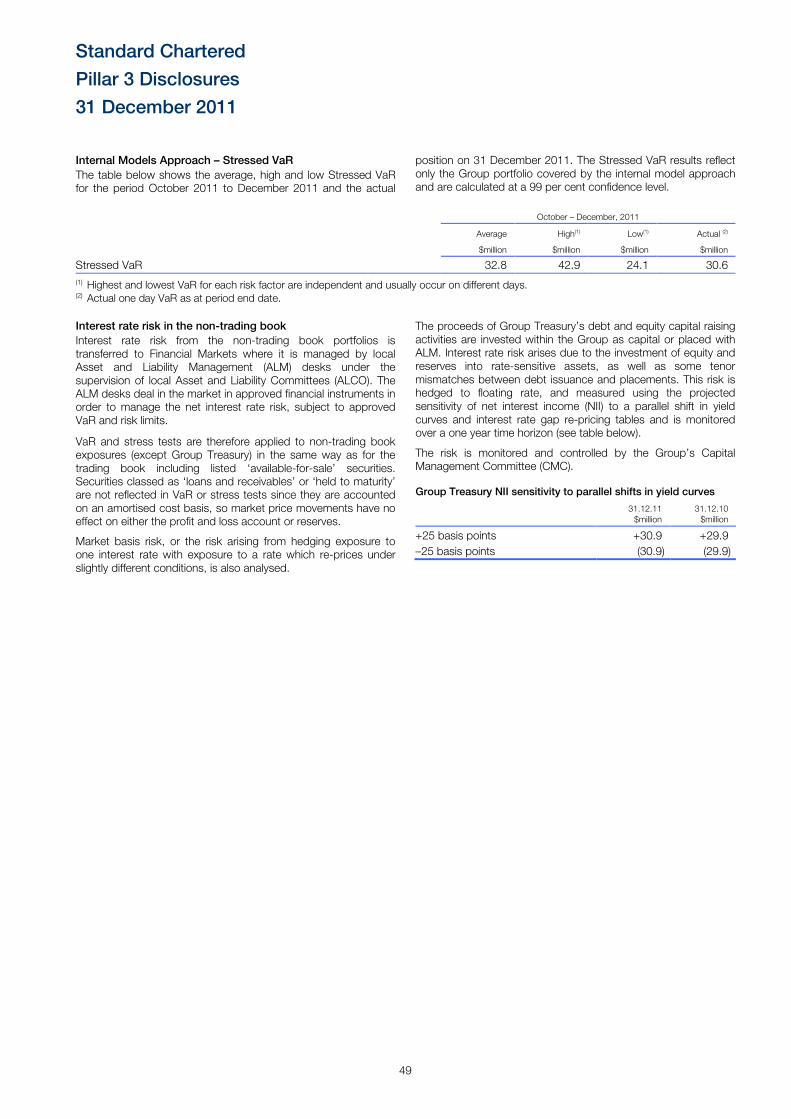
Standard Chartered
Pillar 3 Disclosures
31 December 2011
49
Internal Models Approach – Stressed VaR
The table below shows the average, high and low Stressed VaR for the period October 2011 to December 2011 and the actual
position on 31 December 2011. The Stressed VaR results reflect only the Group portfolio covered by the internal model approach and are calculated at a 99 per cent confidence level.
October – December, 2011
Average High(1) Low(1) Actual (2)
$million $million $million $million
Stressed VaR 32.8 42.9 24.1 30.6
(1) Highest and lowest VaR for each risk factor are independent and usually occur on different days. (2) Actual one day VaR as at period end date.
Interest rate risk in the non-trading book
Interest rate risk from the non-trading book portfolios is transferred to Financial Markets where it is managed by local Asset and Liability Management (ALM) desks under the supervision of local Asset and Liability Committees (ALCO). The ALM desks deal in the market in approved financial instruments in order to manage the net interest rate risk, subject to approved VaR and risk limits.
VaR and stress tests are therefore applied to non-trading book exposures (except Group Treasury) in the same way as for the trading book including listed ‘available-for-sale’ securities. Securities classed as ‘loans and receivables’ or ‘held to maturity’ are not reflected in VaR or stress tests since they are accounted on an amortised cost basis, so market price movements have no effect on either the profit and loss account or reserves.
Market basis risk, or the risk arising from hedging exposure to one interest rate with exposure to a rate which re-prices under slightly different conditions, is also analysed.
The proceeds of Group Treasury’s debt and equity capital raising activities are invested within the Group as capital or placed with ALM. Interest rate risk arises due to the investment of equity and reserves into rate-sensitive assets, as well as some tenor mismatches between debt issuance and placements. This risk is hedged to floating rate, and measured using the projected sensitivity of net interest income (NII) to a parallel shift in yield curves and interest rate gap re-pricing tables and is monitored over a one year time horizon (see table below).
The risk is monitored and controlled by the Group’s Capital Management Committee (CMC).
Group Treasury NII sensitivity to parallel shifts in yield curves
31.12.11 $million
31.12.10 $million
+25 basis points +30.9 +29.9
–25 basis points (30.9) (29.9)
Standard Chartered
Pillar 3 Disclosures
31 December 2011
50
6. Operational risk
Operational risk is defined as the ‘potential for loss arising from the failure of people, process or technology or the impact of external events’.
Objective The Group’s exposure to operational risk arises as a consequence of the Group’s business activities. It is the Group’s objective to minimise exposure to operational risk, subject to cost trade-offs.
Governance The Group Operational Risk Committee (GORC) oversees the management of operational risks across the Group, supported by business, functional and country-level committees. All operational risk committees operate on the basis of a defined structure of delegated authorities and terms of reference, derived from the GRC.
Risk Management Operational risk exposures are managed through consistent policies and procedures that drive risk identification, assessment, control and monitoring. These policies and procedures are challenged and revised regularly to ensure their ongoing effectiveness.
Responsibility for the management of operational risk rests with business and function management as an integral component of their first line risk management responsibilities.
Group Operational Risk is responsible for setting and maintaining standards for operational risk management and measurement. In
addition, specialist operational Risk Control Owners have responsibility for the management of operational risk arising from the following activities Group-wide: legal processes, people management, technology management, vendor management, property management, security management, accounting and financial control, tax management, corporate authorities and structure and regulatory compliance. Each Risk Control Owner is responsible for identifying risks that are material to the Group and for maintaining an effective control environment, which includes defining appropriate policies and procedures for approval by authorised risk committees.
Identified operational risk exposures are classified as ‘Low’, ‘Medium’, ‘High’ or ‘Very High’ in accordance with standard risk assessment criteria. Risks which are outside of set materiality thresholds receive a differential level of management attention and are reported to senior management and risk committees up to Board level.
Measurement The Group uses the Standardised Approach consistent with the FSA’s BIPRU 6.4 requirements to assess its regulatory and internal capital requirements for operational risk. Under the Standardised Approach, a pre-determined beta co-efficient is applied to the average income for the previous three years across each of the eight business lines prescribed in FSA’s BIPRU, to determine the operational risk capital requirement. The table below details the operational risk capital requirement for the Group:
31.12.11 31.12.10
Operational risk capital
requirement
$million
Operational risk capital
requirement
$million
Consumer Banking 744 776
Wholesale Banking 1,557 1,382
Total 2,301 2,158
The table below details the operational risk capital requirement for the Group’s significant subsidiaries presented in accordance with the regulatory requirements applicable in the countries in which they are incorporated.
31.12.11 31.12.10
Operational risk capital
requirement
$million
Operational risk capital
requirement
$million
Standard Chartered Bank 1,259 977
Standard Chartered Bank (HK) Ltd 355 326
Standard Chartered Bank Korea Ltd 237 249
Standard Chartered
Pillar 3 Disclosures
31 December 2011
51
7. Remuneration
The following tables show the remuneration decisions made by the Group in respect of 2011 and the subsequent sections provide brief information on the decision-making policies for remuneration and the links between pay and performance. More detailed information on the Group’s remuneration process and
policies is contained in the Directors’ Remuneration Report (DRR) of the Group’s Annual Report and Accounts.
These disclosures reflect the requirements of the Financial Services Authority (FSA) Prudential Sourcebook for Banks, Building Societies and Investment Firms (BIPRU) 11.5.18 (1) - (7).
Aggregate remuneration expenditure for Code Staff (1) Consumer Banking $000’s
Wholesale Banking $000’s
Other (2) $000’s
2011 18,676 124,759 97,479
2010 15,001 138,369 92,572
(1) Code staff are those Group employees whose professional activities could have a material impact on the Group’s risk profile. Further information is shown below.
(2) Includes all support functions and general management positions, executive and non-executive directors.
2011 2010
Analysis of remuneration for Code Staff employees
split between fixed and variable compensation
Senior Management(4)
$000’s
Other Code Staff Employees
$000’s
Senior Management(4)
$000’s
Other Code Staff Employees
$000’s
Fixed compensation (1) 41,357 14,794 37,036 14,442
Variable compensation 112,816 71,946 108,541 85,923
Up front cash 21,041 15,691 19,773 17,448
Up front shares 20,095 14,208 19,773 17,448
Deferred awards (2) 46,816 35,713 46,372 47,101
Performance shares (3) 24,864 6,334 22,623 3,926
Number of code staff 77 35 73 33 (1) Fixed compensation includes base salary and other cash allowances, and in the case of non-executive directors, any fees.
(2) Includes any element of deferred cash in 2011 for senior management ($8,537,280) and other code staff employees ($14,172,362). (3) Includes the expected value of any performance shares award to be granted in respect of 2011 and 2010 performance respectively. (4) Senior Management is defined below in the section on Code Staff on page 53.
2011 2010
Analysis of deferred remuneration(1) Senior Management
$000’s
Other Code Staff Employees
$000’s
Senior Management
$000’s
Other Code Staff Employees
$000’s
Start of the year (1 January) 254,916 110,869 179,489 53,630
Awarded during the financial year(2) 84,928 46,417 88,841 51,266
Vested during the year(3) 67,547 38,171 32,776 5,079
Non vested due to performance adjustments(4) 7,480 123 5,002 104
Close of the year (31 December)(5) (6) 223,718 101,155 261,294 109,264 (1) Deferred remuneration includes both deferred awards and performance shares. Code staff population in 2011 and 2010 differ.
(2) Value of deferred remuneration awarded during the year is based on the share price at grant.
(3) Value of vested deferred remuneration during the year is based on the share price as at 31 December in that year. (4) Value of deferred remuneration which has lapsed as a result of (i) performance conditions not being satisfied or (ii) claw-back policy. (5) Value of deferred remuneration as at 31 December is based on the share price at the respective dates in that year.
(6) The closing balance for deferred remuneration as at 31 December 2010 for senior management was incorrectly stated as $262,631 in 2010. The correct amount is $261,294.
Standard Chartered
Pillar 3 Disclosures
31 December 2011
52
2011 2010
Analysis of sign-on payments and severance
Senior Management
$000’s
Other Code Staff Employees
$000’s
Senior Management
$000’s
Other Code Staff Employees
$000’s
Sign-on payments (1) 700 - 671 7,158
Severance payments(2) 381 - 1,826 -
(1) Includes the value of any guaranteed performance awards (cash or shares) which were made on appointment. In 2011 there was one employee who received a sign on payment.
(2) In 2011 this relates to one employee.
Governance and alignment to regulatory best practice The Board Remuneration Committee (the Committee) has oversight of all reward policies for the Group’s employees. It is responsible for setting the principles and governance framework for all compensation decisions.
In particular the Committee:
• determines and agrees the remuneration of the senior executives and employees with the potential to have a material impact on the risk profile of the Group;
• approves any proposal to award a high remuneration package to new recruits or a high level individual bonus award to a Group employee;
• ensures that the remuneration policy is appropriate and consistent with effective risk management; with the Group Chief Risk Officer attending key meetings of the Committee during the year;
• approves the overall total variable compensation paid globally on an annual basis.
The Committee’s terms of reference are available at www.standardchartered.com
To ensure there is appropriate, formal input to the decision making process there are a number of business specific Reward Plan Committees (RPCs) responsible for making sure that information from the risk, compliance and human resources functions are taken into account. The accuracy of the finance data used in the decision making process is overseen by risk and finance representatives jointly.
Decision on reward for control function employees are determined independently of the business and they do not personally participate in any business specific plan to maintain independence.
The Group Reward Plan Committee (GRPC), which includes the Group Chief Executive, the Group Finance Director, the Group Head of Human Resources and Communications and the Group Chief Risk Officer (GCRO), oversees each of the business specific RPCs to ensure consistency across the Group. The GRPC ensures compensation decision making is in accordance with the Group’s established performance and reward strategy and acts as a link to the Committee, providing feedback to the other RPCs as necessary.
Further information on how the Group’s remuneration practices are aligned to regulatory best practice are set out in the DRR in the Group’s Annual Report and Accounts.
Performance and reward philosophy and principles The Group’s success depends upon the performance and commitment of talented employees. The Group’s performance, reward and benefits approach supports and drives the Group’s business strategy and reinforces values in the context of a clearly articulated risk appetite and a Group wide framework.
The Group’s approach:
• supports a strong performance-oriented culture, ensuring that individual reward and incentives are aligned with: (i) the performance and behaviour of the individual; (ii) the performance of the business; and (iii) the interests of shareholders;
• ensures a competitive reward package that reflects the Group’s international nature and enables us to attract, retain and motivate employees;
• reflects the fact that many of the Group’s employees bring international experience and expertise, and the Group recruits from a global marketplace;
• encourages an appropriate mix of fixed and variable compensation based on: (i) the individual’s accountability; and (ii) the individual’s business’ risk profile.
The Committee reviews the policy on a regular basis against significant regulatory developments, market practice and shareholder views and makes appropriate adjustments.
Aligning performance and reward The Group’s One Bank philosophy and approach to remuneration applies consistently to all employees including Code Staff and is central to the Group’s performance and reward philosophy. This ensures that behaviours, including prudent risk management and values are rewarded as well as business performance. The Group believes that performance and related reward outcomes should be a consequence of both how performance is delivered and what is delivered. This is taken into account in all personal objectives, performance assessments and reward decisions made within the Group and has a tangible impact on the reward that employees receive.
Target total compensation is determined with reference to the market in which the individual is employed, while the potential total compensation is set at upper quartile or higher for excellent individual and business performance.
All employees have the opportunity to receive an element of performance-related compensation, subject to their contractual entitlement. Typically, the higher the total compensation, the greater the proportion delivered in variable compensation (through a mix of cash and shares, both upfront and deferred, depending on the individual and quantum of the award).
The variable compensation element is differentiated by performance. The Group’s aim is to achieve a high performance culture in which every employee has a clear set of objectives, receives ongoing feedback on performance and behaviour and is appropriately rewarded for their individual contribution. Differentiating performance and values ratings at all levels enables targeting of spend towards those who have made the most effective contribution to the Group’s performance and unique culture, recognises and aids retention of the Group’s highest performers and balances this with affordability considerations. There is no direct formulaic link between business income generated by an individual and that individual’s reward.
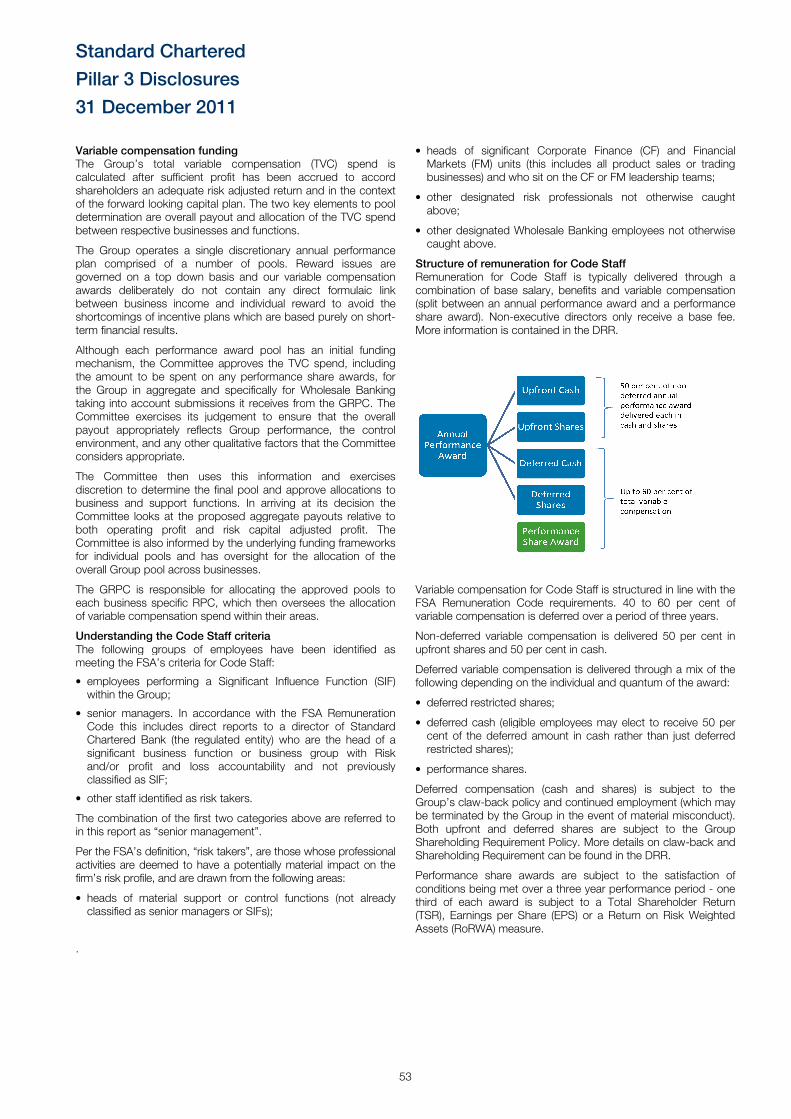
Standard Chartered
Pillar 3 Disclosures
31 December 2011
Variable compensation funding The Group’s total variable compensation (TVC) spend is calculated after sufficient profit has been accrued to shareholders an adequate risk adjusted returnof the forward looking capital plan. The two key elements to pool determination are overall payout and allocation of the TVC spend between respective businesses and functions.
The Group operates a single discretionary annual performance plan comprised of a number of pools. Rewardgoverned on a top down basis and our variable awards deliberately do not contain any direct formulaic link between business income and individual reward to avoid the shortcomings of incentive plans which are based purely on shortterm financial results.
Although each performance award pool has an initial funding mechanism, the Committee approves the the amount to be spent on any performance share awards, for the Group in aggregate and specifically for Wholesale Bankingtaking into account submissions it receives froCommittee exercises its judgement to ensure that the overall payout appropriately reflects Group performance, the control environment, and any other qualitative factors that the Committee considers appropriate.
The Committee then uses this informationdiscretion to determine the final pool and approve allocations to business and support functions. In arriving at its decisionCommittee looks at the proposed aggregate payouts relative to both operating profit and risk capital Committee is also informed by the underlying funding frameworks for individual pools and has oversight for the allocation of the overall Group pool across businesses.
The GRPC is responsible for allocating the approved pools to each business specific RPC, which then overseeof variable compensation spend within their
Understanding the Code Staff criteria The following groups of employees have been identified as meeting the FSA’s criteria for Code Staff:
• employees performing a Significant Influence Functionwithin the Group;
• senior managers. In accordance with the FSA Remuneration Code this includes direct reports to a director of Standard Chartered Bank (the regulated entity) who are the head of a significant business function or business group with Risk and/or profit and loss accountability and not previously classified as SIF;
• other staff identified as risk takers.
The combination of the first two categories above arein this report as “senior management”.
Per the FSA’s definition, “risk takers”, are those whose activities are deemed to have a potentially material impact on the firm’s risk profile, and are drawn from the following areas:
• heads of material support or control functions (notclassified as senior managers or SIFs);
.
53
’s total variable compensation (TVC) spend is calculated after sufficient profit has been accrued to accord hareholders an adequate risk adjusted return and in the context
The two key elements to pool overall payout and allocation of the TVC spend
between respective businesses and functions.
The Group operates a single discretionary annual performance . Reward issues are
governed on a top down basis and our variable compensation awards deliberately do not contain any direct formulaic link between business income and individual reward to avoid the shortcomings of incentive plans which are based purely on short-
pool has an initial funding TVC spend, including
the amount to be spent on any performance share awards, for in aggregate and specifically for Wholesale Banking
it receives from the GRPC. The its judgement to ensure that the overall
payout appropriately reflects Group performance, the control environment, and any other qualitative factors that the Committee
information and exercises discretion to determine the final pool and approve allocations to business and support functions. In arriving at its decision the Committee looks at the proposed aggregate payouts relative to
adjusted profit. The derlying funding frameworks
pools and has oversight for the allocation of the
The GRPC is responsible for allocating the approved pools to then oversees the allocation
areas.
The following groups of employees have been identified as
Significant Influence Function (SIF)
In accordance with the FSA Remuneration Code this includes direct reports to a director of Standard
Bank (the regulated entity) who are the head of a gnificant business function or business group with Risk
accountability and not previously
The combination of the first two categories above are referred to
are those whose professional material impact on the
, and are drawn from the following areas:
of material support or control functions (not already
• heads of significant Corporate Markets (FM) units (this includes all product sales or trading businesses) and who sit on the CF or FM
• other designated risk professionals not otherwise caught above;
• other designated Wholesale Bcaught above.
Structure of remuneration for Code StaffRemuneration for Code Staff is typically delivered combination of base salary, benefits and variable compensation (split between an annual performance award and a performance share award). Non-executive directors only receive a base fee.More information is contained in the DRR.
Variable compensation for Code Staff is structured in line with the FSA Remuneration Code requirements. 40 to 60 per cent of variable compensation is deferred over a period of three years.
Non-deferred variable compensation is delivered 50 per cent in upfront shares and 50 per cent in cash.
Deferred variable compensation is delivered through a mix of the following depending on the individual
• deferred restricted shares;
• deferred cash (eligible employees may elect to receive 50 per cent of the deferred amount in cash rather than just deferred restricted shares);
• performance shares.
Deferred compensation (cash and shares) is subject to the Group’s claw-back policy and continued employment (which may be terminated by the Group in the event of maBoth upfront and deferred shares are subject to the Group Shareholding Requirement Policy. More details on clawShareholding Requirement can be found in the DRR.
Performance share awards are subject to the satisfaction of conditions being met over a three year performance period third of each award is subject to a Total Shareholder Return (TSR), Earnings per Share (EPS) or a Return on Risk Weighted Assets (RoRWA) measure.
orporate Finance (CF) and Financial arkets (FM) units (this includes all product sales or trading
businesses) and who sit on the CF or FM leadership teams;
ther designated risk professionals not otherwise caught
Banking employees not otherwise
Structure of remuneration for Code Staff Remuneration for Code Staff is typically delivered through a combination of base salary, benefits and variable compensation (split between an annual performance award and a performance
executive directors only receive a base fee. More information is contained in the DRR.
compensation for Code Staff is structured in line with the FSA Remuneration Code requirements. 40 to 60 per cent of variable compensation is deferred over a period of three years.
deferred variable compensation is delivered 50 per cent in s and 50 per cent in cash.
Deferred variable compensation is delivered through a mix of the following depending on the individual and quantum of the award:
(eligible employees may elect to receive 50 per e deferred amount in cash rather than just deferred
Deferred compensation (cash and shares) is subject to the back policy and continued employment (which may
be terminated by the Group in the event of material misconduct). Both upfront and deferred shares are subject to the Group Shareholding Requirement Policy. More details on claw-back and Shareholding Requirement can be found in the DRR.
Performance share awards are subject to the satisfaction of tions being met over a three year performance period - one
third of each award is subject to a Total Shareholder Return (TSR), Earnings per Share (EPS) or a Return on Risk Weighted
Standard Chartered
Pillar 3 Disclosures
31 December 2011
54
8. Group entities
At 31 December 2011, the principal subsidiary undertakings, all indirectly held and principally engaged in the business of banking and provision of other financial services, were as follows:
Country and place of incorporation or registration Main areas of operation
Group interest in ordinary
share capital %
Standard Chartered Bank, England and Wales United Kingdom, Middle East, South Asia, Asia Pacific, Americas and, through Group companies, Africa
100.00
Standard Chartered Bank Korea Limited, Korea Korea 100.00
Standard Chartered Bank Malaysia Berhad, Malaysia Malaysia 100.00
Standard Chartered Bank (Pakistan) Limited, Pakistan Pakistan 98.99
Standard Chartered Bank (Taiwan) Limited, Taiwan Taiwan 100.00
Standard Chartered Bank (Hong Kong) Limited, Hong Kong Hong Kong 100.00
Standard Chartered Bank (China) Limited, China China 100.00
Standard Chartered Bank (Thai) Public Company Limited, Thailand Thailand 99.99
Standard Chartered Bank Nigeria Limited Nigeria 100.00
Standard Chartered Bank Kenya Limited Kenya 73.90
Standard Chartered Private Equity Limited, Hong Kong Hong Kong 100.00
The table below lists the entities where accounting treatment differs from the prudential treatment as described on page 4.
Accounted for as an associate Prudential treatment Main areas of operation
Group interest in ordinary
share capital %
Asia Commercial Bank Deducted from capital resources Vietnam 15.00
China Bohai Bank Deducted from capital resources China 19.99
Corsair IV Deducted from capital resources Hong Kong 19.66
Fleming Family & Partners Proportionally consolidated Asia 20.00
9. Immaterial portfolios
Non Trading Book Equities & Specialised Lending Exposures For the purposes of BIPRU requirements 11.5.15 and 11.5.11 the holdings of non-trading book equities and the specialised lending portfolio are considered immaterial. At 31 December 2011, non-trading book equity holdings amount to $2.2 billion (2010: $2.2 billion) and specialised lending exposure total $3.9 billion (2010: $3.0 billion), which together total less than 1 per cent of the Group’s total exposure.
10. Forward looking statements
It is possible that this document could or may contain forward-looking statements that are based on current expectations or beliefs, as well as assumptions about future events. These forward-looking statements can be identified by the fact that they do not relate only to historical or current facts. Forward-looking statements often use words such as anticipate, target, expect, estimate, intend, plan, goal, believe, will, may, should, would, could or other words of similar meaning. Undue reliance should not be placed on any such statements because, by their very nature, they are subject to known and unknown risks and uncertainties and can be affected by other factors that could cause actual results, and the Group’s plans and objectives, to differ materially from those expressed or implied in the forward-looking statements.
There are several factors that could cause actual results to differ materially from those expressed or implied in forward looking statements. Among the factors that could cause actual results to differ materially from those described in the forward looking statements are changes in the global, political, economic, business, competitive, market and regulatory forces, future exchange and interest rates, changes in tax rates and future business combinations or dispositions.
The Group undertakes no obligation to revise or update any forward looking statement contained within this document, regardless of whether those statements are affected as a result of new information, future events or otherwise.
Standard Chartered
Pillar 3 Disclosures
31 December 2011
55
11. Acronyms ABS Asset Backed Securities
ALCO Asset and Liability Committee
ALM Asset and Liability Management
ARROW Advanced Risk Response Operating Framework
BIPRU Prudential Sourcebook for Banks, Building Societies and Investment Firms
BRC Board Risk Committee
CAD2 Capital Adequacy Directive 2
CCF Credit Conversion Factor
CCR Counterparty Credit Risk
CDOs Collateralised Debt Obligations
CMBS Commercial Mortgage Backed Securities
CMC Capital Management Committee
CRD Capital Requirements Directive
CRM Credit Risk Mitigation
CRO Chief Risk Officer
CSA Credit Support Annex
DRR Directors Remuneration Report
EAD Exposure at Default
ECAI External Credit Assessment Institutions
FSA Financial Services Authority (UK)
FSV Forced Sale Value
GALCO Group Asset and Liability Committee
GCC Group Credit Committee
GCMC Group Capital Management Committee
GCRO Group Chief Risk Officer
GENPRU General Prudential Sourcebook for Banks, Building Societies, Insurers, and Investment Firms
GIA Group Internal Audit
GMR Group Market Risk
GMRC Group Market Risk Committee
GORC Group Operational Risk Committee
GRC Group Risk Committee
GRPC Group Reward Plan Committee
GSAM Group Special Asset Management
IAS International Accounting Standard
ICAAP Internal Capital Adequacy Assessment Process
ICG Individual Capital Guidance
IIP Individual Impairment Provision
IRB advanced Internal Ratings Based approaches
IFRS International Financial Reporting Standards
LGD Loss Given Default
LMC Liquidity Management Committee
MAC Model Assessment Committee
MTM Mark-to-Market
NII Net Interest Income
PD Probability of Default
PIP Portfolio Impairment Provision
PRR Position Risk Requirement
RMBS Residential Mortgage Backed Securities
RPC Reward Plan Committee
RWA Risk Weighted Assets
SIF Significant Influence Function
SME Small and Medium - sized Enterprise
SPE Special Purpose Entity
SREP Supervisory Review and Evaluation Process
VaR Value at Risk