Embed Size (px)
Citation preview

www.icbcstandard.com
Pillar 3 Disclosures
for the year ended 31 December 2018
ICBC Standard Bank | Pillar 3 Disclosures 2018
2
Contents
Statement on Ownership ..................................................................................................................................................................... 5
1. Foreword ...................................................................................................................................................................................... 6
1.1 Introduction ........................................................................................................................................................................ 6 1.2 ICBCS Disclosure Policy ..................................................................................................................................................... 6
1.2.1 Basis of Preparation ........................................................................................................................................................ 6 1.2.2 Frequency of Disclosure .................................................................................................................................................. 7 1.2.3 Verification ....................................................................................................................................................................... 7
1.3 Risk Profile Disclosure ....................................................................................................................................................... 7 1.4 Statement of ICBC Support ................................................................................................................................................ 7
2. Overview ....................................................................................................................................................................................... 8
2.1 Risk types ........................................................................................................................................................................... 8 2.2 Highlights for 2018 ............................................................................................................................................................ 8
2.2.1 General ............................................................................................................................................................................. 8 2.2.2 Risk appetite and stress testing ..................................................................................................................................... 9 2.2.3 Credit risk ......................................................................................................................................................................... 9 2.2.4 Market risk ....................................................................................................................................................................... 9 2.2.5 Operational risk .............................................................................................................................................................. 10 2.2.6 Capital Management ..................................................................................................................................................... 10
3. Regulatory Consolidation ......................................................................................................................................................... 11
3.1 Scope of Consolidation .................................................................................................................................................... 11 3.2 Sub Group Disclosures .................................................................................................................................................... 11 3.3 Solo Consolidation ........................................................................................................................................................... 12 3.4 Consolidated Balance Sheet under Regulatory Consolidation ...................................................................................... 12 3.5 Group Structure ................................................................................................................................................................ 12
4. Risk and Capital Management ................................................................................................................................................ 13
4.1 Board Responsibility ........................................................................................................................................................ 13 4.1.1 Board Recruitment......................................................................................................................................................... 13 4.1.2 Diversity and Composition ............................................................................................................................................. 14 4.1.3 Board Review ................................................................................................................................................................. 14
4.2 Risk Management Framework......................................................................................................................................... 15 4.2.1 Risk Governance committees ....................................................................................................................................... 15
4.3 Approaches to Risk Management ................................................................................................................................... 17 4.4 Risk Appetite .................................................................................................................................................................... 18 4.5 Capital Management ........................................................................................................................................................ 18
4.5.1 Objective ......................................................................................................................................................................... 18 4.5.2 Governance .................................................................................................................................................................... 18 4.5.3 Capital Transferability .................................................................................................................................................... 19
4.6 Regulatory Capital ............................................................................................................................................................ 19 4.6.1 Minimum Capital Adequacy ........................................................................................................................................... 19 4.6.2 Pillar 2A Requirements .................................................................................................................................................. 20 4.6.3 Capital Buffers ............................................................................................................................................................... 20 4.6.4 Regulatory approaches adopted for capital purposes ................................................................................................ 22
4.7 ICBCS Group’s Approach to Managing Capital ............................................................................................................... 22 4.7.1 External requirements ................................................................................................................................................... 22 4.7.2 Internal requirements .................................................................................................................................................... 23 4.7.3 Measurement and Planning .......................................................................................................................................... 23 4.7.4 Monitoring ...................................................................................................................................................................... 23
4.8 Capital Position ................................................................................................................................................................ 24 4.8.1 Summary ........................................................................................................................................................................ 24 4.8.2 Capital Resources .......................................................................................................................................................... 25 4.8.3 Capital Requirements .................................................................................................................................................... 26
4.9 Regulatory Capital Instruments ....................................................................................................................................... 26
ICBC Standard Bank | Pillar 3 Disclosures 2018
3
4.10 Liquidity Risk Management ............................................................................................................................................. 27 4.10.1 Liquidity Management Framework ............................................................................................................................. 27 4.10.2 Organisational structure ............................................................................................................................................. 28 4.10.3 Liquidity stress testing ................................................................................................................................................ 28 4.10.4 Meeting Liquidity Requirements ................................................................................................................................. 29 4.10.5 Liquidity and funding risk monitoring ......................................................................................................................... 29 4.10.6 Reporting ..................................................................................................................................................................... 29 4.10.7 Liquidity Coverage Ratio (LCR).................................................................................................................................... 29
5. Credit Risk ................................................................................................................................................................................. 31
5.1 Definition .......................................................................................................................................................................... 31 5.2 Approach to managing credit risk ................................................................................................................................... 31
5.2.1 Governance Committees ............................................................................................................................................... 32 5.2.2 Regulatory Capital Approach for Credit Risk ................................................................................................................ 32 5.2.3 Scope of Risk Reporting Systems ................................................................................................................................. 32
5.3 Credit Risk Adjustments ................................................................................................................................................... 33 5.3.1 Performing loans ............................................................................................................................................................ 33 5.3.2 Non-performing loans and impairments ....................................................................................................................... 33 5.3.3 IFRS 9 Adoption ............................................................................................................................................................. 34
5.4 Credit Risk Portfolio Characteristics ................................................................................................................................ 35 5.4.1 Analysis of Credit Portfolio............................................................................................................................................. 35 5.4.2 Concentration risk.......................................................................................................................................................... 37
5.5 Use of Credit Ratings ....................................................................................................................................................... 39 5.6 Counterparty Credit Risk .................................................................................................................................................. 40 5.7 Approach to managing counterparty credit risk ............................................................................................................. 40
5.7.1 Measuring Exposures for Counterparty Credit Risk ..................................................................................................... 40 5.7.2 Internal Credit Limits ..................................................................................................................................................... 40 5.7.3 Securing Collateral and Establishing Credit Reserves ................................................................................................. 40 5.7.4 Wrong Way Risk ............................................................................................................................................................. 41 5.7.5 Collateral requirements in the event of a downgrade ................................................................................................. 42 5.7.6 Derivative Valuation Adjustments ................................................................................................................................. 42
5.8 Governance committees .................................................................................................................................................. 42 5.9 Counterparty Risk Portfolio Characteristics .................................................................................................................... 43
5.9.1 Credit Derivatives ........................................................................................................................................................... 44
6. Credit Risk Mitigation .............................................................................................................................................................. 45
6.1 Use of Credit Risk Mitigation ........................................................................................................................................... 45 6.2 Internal Policies and Controls .......................................................................................................................................... 45
6.2.1 Credit principles, policy and collateral management ................................................................................................... 45 6.2.2 Controls over rating systems ......................................................................................................................................... 45 6.2.3 Concentration risk.......................................................................................................................................................... 45 6.2.4 Cross-border exposures ................................................................................................................................................. 46 6.2.5 Stress testing and scenario analysis ............................................................................................................................ 46 6.2.6 Valuation ........................................................................................................................................................................ 47
6.3 Principal types of Credit Risk Mitigation ......................................................................................................................... 47 6.3.1 Derivative Netting .......................................................................................................................................................... 47 6.3.2 Master Netting Agreements .......................................................................................................................................... 47 6.3.3 Guarantees and Standby Letters of Credit ................................................................................................................... 47 6.3.4 Credit Derivatives ........................................................................................................................................................... 48 6.3.5 Collateral ........................................................................................................................................................................ 48
6.4 Regulatory Capital Approach for Credit Risk Mitigation ................................................................................................. 48 6.4.1 Application of Credit Risk Mitigation under the Standardised Approach .................................................................... 49 6.4.2 Credit Risk Mitigation Recognised ................................................................................................................................ 50
7. Country Risk .............................................................................................................................................................................. 51
7.1 Definition .......................................................................................................................................................................... 51 7.2 Approach to Managing Country Risk ............................................................................................................................... 51
7.2.1 Scope of Risk Reporting Systems ................................................................................................................................. 51

ICBC Standard Bank | Pillar 3 Disclosures 2018
4
8. Market risk ................................................................................................................................................................................ 52
8.1 Definition .......................................................................................................................................................................... 52 8.2 Governance Committees ................................................................................................................................................. 52
8.2.1 Market and Liquidity Risk Committee ........................................................................................................................... 52 8.2.2 Risk Methodology Approval Committee ........................................................................................................................ 52 8.2.3 Risk Technical Forum .................................................................................................................................................... 53
8.3 Market Risk in the Trading Book ..................................................................................................................................... 53 8.3.1 Definition ........................................................................................................................................................................ 53 8.3.2 Approach to managing market risk in the trading book .............................................................................................. 53 8.3.3 Output from the Internal Market Risk Models .............................................................................................................. 58
8.4 Market Risk in the Banking Book .................................................................................................................................... 60 8.4.1 Interest rate risk in the banking book ........................................................................................................................... 60 8.4.2 Equity Risk in the Banking Book ................................................................................................................................... 62
8.4.3 Foreign Currency Risk in the Banking Book ................................................................................................................. 63
9. Operational risk ......................................................................................................................................................................... 64
9.1 Definition .......................................................................................................................................................................... 64 9.2 Approach to managing operational risk .......................................................................................................................... 64 9.3 Governance committees .................................................................................................................................................. 65
9.3.1 Business Continuity Management Framework............................................................................................................. 66 9.3.2 Scope of Risk Reporting Systems ................................................................................................................................. 66
9.4 Regulatory capital approach ............................................................................................................................................ 66 9.5 Operational risk sub-types ............................................................................................................................................... 67
9.5.1 Information Technology Risk Management .................................................................................................................. 67 9.5.2 Information Risk Management ..................................................................................................................................... 67 9.5.3 Model Risk Management .............................................................................................................................................. 67 9.5.4 Tax Risk Management ................................................................................................................................................... 67 9.5.5 Legal Risk Management ................................................................................................................................................ 68 9.5.6 Compliance Risk Management ..................................................................................................................................... 68 9.5.7 Financial Crime Risk Management ............................................................................................................................... 68 9.5.8 Change Risk Management ............................................................................................................................................ 69 9.5.9 Environmental Risk Management ................................................................................................................................. 69
10. Leverage ........................................................................................................................................................................... 70
10.1 Factors that had an impact on the leverage ratio during 2018 .................................................................................... 70 10.2 Approaches to managing the risk of excessive leverage ............................................................................................... 70
11. Asset Encumbrance ........................................................................................................................................................ 71
11.1 Asset encumbrance as at 31 December 2018 .............................................................................................................. 72
12. Remuneration .................................................................................................................................................................. 74
12.1 Material Risk Takers ........................................................................................................................................................ 74 12.2 Remuneration Philosophy ................................................................................................................................................ 74 12.3 Reward Framework .......................................................................................................................................................... 75 12.4 Remuneration Committee ............................................................................................................................................... 76 12.5 Remuneration Policy Governance ................................................................................................................................... 76 12.6 Remuneration Strategy .................................................................................................................................................... 76 12.7 Analysis of 2018 Remuneration ...................................................................................................................................... 77
12.7.1 Outstanding Deferred Remuneration ......................................................................................................................... 78 12.7.2 Remuneration by band ................................................................................................................................................ 78 12.7.3 Sign on and severance payments .............................................................................................................................. 78
Annex A: Main Features of Capital Instruments ............................................................................................................................. 79
Annex B: Transitional Own funds Disclosure Template .................................................................................................................. 80
Annex C: Geographical Distribution of Credit Exposures............................................................................................................... 83
Annex D: Leverage Ratio ................................................................................................................................................................... 86
Annex E: Glossary ............................................................................................................................................................................... 88
Annex F: List of Tables & Graphs Included ...................................................................................................................................... 96
Acronyms and abbreviations ............................................................................................................................................................. 97

ICBC Standard Bank | Pillar 3 Disclosures 2018
5
Statement on Ownership
Industrial and Commercial Bank of China Limited (ICBC) and Standard Bank London Holdings Limited (SBLH), a wholly owned
subsidiary of Standard Bank Group Limited (SBG), hold 60% and 40% respectively of the issued share capital of ICBC Standard
Bank Plc (ICBCS).
ICBC Group Profile
On 28 October 2005, ICBC was restructured to a joint-stock limited company. On 27 October 2006, ICBC was listed on both the
Shanghai and Hong Kong stock exchanges and has developed into one of the largest listed banks in the world, possessing a
significant customer base, a diversified business structure, strong innovation capabilities and market competitiveness. ICBC
has a presence on six continents and its overseas network spans 42 countries and regions.
ICBC provides a comprehensive suite of financial products and services to over five million corporate customers and over 500
million personal customers through its various distribution channels. These consist of domestic institutions, overseas
institutions and correspondent banks worldwide, as well as the e-banking network comprising a range of internet and
telephone banking services and self-service banking centres. These form a diversified and international operating structure
focusing on commercial banking business while maintaining a leading position in ICBC’s domestic market.
Standard Bank Group Profile
Standard Bank Group Limited, listed on the Johannesburg Stock Exchange, is the ultimate holding company for the global
activities of SBG. SBG is one of Africa’s leading banking and financial services organisations. In 2007, SBG entered into a
major strategic partnership with ICBC which resulted in ICBC becoming a 20% shareholder in SBG.
SBG operates in three key business segments: Personal & Business Banking (PBB), Corporate & Investment Banking (CIB), and
Investment Management & Life Insurance. These global business segments operate across South Africa, other African
countries and selected international locations outside of Africa.
The Consolidated Pillar 3 Disclosures presented in this document are shown as at 31 December 2018, and relate to ICBC
Standard Bank Plc (ICBCS) Group.
References to ICBC Standard Bank Plc Annual Financial Statements 2018 are shown in gold text.
6
1. Foreword
1.1 INTRODUCTION .................................................................................................................................................................................... 6
1.2 DISCLOSURE POLICY ........................................................................................................................................................................... 6
1.3 RISK PROFILE DISCLOSURE ................................................................................................................................................................. 7
1.4 STATEMENT OF ICBC SUPPORT ............................................................................................................................................................ 7
1.1 Introduction
This document comprises ICBC Standard Bank Plc’s (ICBCS) Pillar 3 disclosures on capital and risk management as at 31 December
2018. The disclosures are prepared in accordance with the amended European Capital Requirements Directive (CRD) and the
European Capital Requirements Regulation (CRR), collectively, referred to as the ‘CRD IV legislative package’ or ‘CRD IV’. In particular,
articles 431 to 455 of the CRR specify the Pillar 3 disclosure requirements. The CRD IV legislative package has been in force since 1
January 2014.
ICBCS is subject to regulation and supervision by the Prudential Regulation Authority (PRA) and the Financial Conduct Authority (FCA),
as a UK bank and an EU consolidating parent entity.
1.2 ICBCS Disclosure Policy
The following sets out a summary of the disclosure policy applied to the ICBCS Pillar 3 Disclosures. The policy covers the basis of
preparation, frequency of disclosure, media and location of disclosures, verification and risk profile disclosures.
1.2.1 Basis of Preparation
These Pillar 3 disclosures have been prepared in accordance with the specific requirements of CRD IV.
In satisfaction of certain disclosure requirements, reference has been made to the ICBC Standard Bank Plc Consolidated Annual
Report (the “Annual Report”). As such, this document should be read in conjunction with the published Annual Report which are both
available on the ICBC Standard Bank Plc website: http://www.icbcstandard.com
ICBCS, as an EU parent institution, is subject to the consolidated disclosure requirements under CRD IV. The information and
disclosures presented in this document therefore specifically relate to ICBCS on a consolidated basis i.e. including all subsidiaries
(referred to herein as “ICBCS Group” or “Group”) – See section 3.3 for details.
ICBCS is the primary risk taking entity within the consolidated ICBCS Group. Separate individual disclosures for ICBCS have not been
made on a standalone basis due to the immateriality of risks contained within the other subsidiaries in the ICBCS Group.
Note: The risk weighted assets of ICBCS Plc (solo-consolidated) account for 99.70% of the total RWAs of the ICBCS Group as at 31
December 2018.
No Pillar 3 disclosure requirements have been excluded due to confidentiality or for proprietary reasons.
Zero values in all the tables included in this document are shown as “-“ in order to distinguish these from non-zero values, which may
appear as zeros due to rounding differences.
It is important to note that a number of significant differences could exist between accounting disclosures published in accordance
with International Financial Reporting Standards ('IFRS') and Pillar 3 disclosures, which are provided in accordance with prudential
requirements. See section 3.1, on scope of consolidation, for details.

7
1.2.2 Frequency of Disclosure
In accordance with Pillar 3 disclosure requirements and the ICBCS Pillar 3 Disclosure Policy, ICBCS Group makes available its
consolidated Pillar 3 disclosures on an annual basis.
1.2.3 Verification
The disclosures presented within this document have been verified and approved through internal governance procedures in line with
the ICBCS Pillar 3 Disclosure Policy. This includes the review and approval of all disclosures by the ICBCS Board, following the receipt
of written attestations in respect of the both the quantitative and qualitative disclosures from the most senior functional heads of the
relevant areas within the Group.
1.3 Risk Profile Disclosure
In accordance with the requirements under CRD IV and the ICBCS Pillar 3 Disclosure Policy, ICBCS Group is required to assess whether
its external disclosures (including the Annual Report and Pillar 3 Disclosures) comprehensively portray the Group’s risk profile.
The Pillar 3 disclosures included herein focus on capital risk and the key risk drivers behind the ICBCS Group’s Pillar 1 capital
requirements (i.e. credit, market and operational risks), providing granular information and analysis in addition to that already
presented within the Annual Report. The ICBCS Board is satisfied that the disclosures contained within this document, are appropriate
to convey the risk profile of the firm. Additional disclosures are also provided in respect of liquidity risk.
1.4 Statement of ICBC Support
Industrial and Commercial Bank of China Limited (ICBC), and Standard Bank London Holdings Limited (SBLH), a wholly-owned
subsidiary of Standard Bank Group (SBG), hold 60% and 40% respectively of the issued share capital of ICBC Standard Bank Plc
(ICBCS).
ICBC has provided ICBCS with a letter of support stating that ICBC intend to financially support ICBCS in ensuring that it meets all of its
financial obligations as they fall due, including the maintenance of a minimum level of capital adequacy.
The most recent statement of support from ICBC, which remains in force until ICBC ceases to be the controlling shareholder of the
Group, states:
“We confirm ICBC Standard Bank Plc (ICBCS) is viewed as a long-term investment and is an integral part of our overall operational
strategy. Our goal is to develop ICBCS into a major link in our international network, and therefore, we undertake to support its
development and growth.
ICBC hereby confirms that it intends to financially support ICBCS in ensuring that it meets all of its financial obligations as they fall
due, including the maintenance of a minimum capital adequacy level in ICBCS.
Specifically, ICBC intends to provide funding and capital support to ICBCS and commits its intention to subscribe for certain ‘qualifying
instruments’ as and when ICBC receives written notice from ICBCS that its capital and reserve funds amount to (or will foreseeably in
the near term amount to) less than the minimum required amount of capital and reserve funds as determined in accordance with the
rules and regulations of the Prudential Regulation Authority (or its successor).”

8
2. Overview
2.1 RISK TYPES ........................................................................................................................................................................................ 8
2.2 HIGHLIGHTS FOR 2018 ....................................................................................................................................................................... 8
The risk profile of the ICBCS Group (Group) is underpinned by the core philosophy of maintaining a strong liquidity and capital position.
All activities carried out by the ICBCS Group involve, to varying degrees, the measurement, evaluation, acceptance and management
of risk or combinations of risks. The risk management framework, employed at all levels of the organisation, ensures that our risk
profile remains aligned to our risk appetite and strategy.
2.1 Risk types
The Group’s activities give rise to various risks. The principal material risks can predominantly be grouped into the following
categories:
Liquidity risk (see section 4.10)
Credit risk (see section 5)
Counterparty risk (see section 5.6)
Market risk (see section 8)
Operational risk (see section 9)
Each risk is defined within the relevant section, together with an explanation of the application of the governance framework to the
particular risk, and if applicable, a description of the relevant portfolio characteristics both in terms of prescribed disclosure and the
Group’s business model.
2.2 Highlights for 2018
2.2.1 General
US president Donald Trump’s tax cuts had provided an added boost for investors heading into 2018, and US GDP growth accelerated
to 4.2 per cent on an annualised quarterly basis in Q2. However, economic growth elsewhere, notably in the Eurozone, decelerated
and global growth became less synchronised.
Meanwhile the prospect of fading US policy support in 2019, together with escalation in the US-China trade conflict, reduced monetary
stimulus and global growth concerns eventually took their toll on investor confidence.
Stock markets, in particular, have suffered in 2018. Stocks have been a major beneficiary of the low interest rate and loose monetary
policy environment since the global financial crisis. Companies have been able to borrow money cheaply to strengthen their balance
sheets while also benefiting from a pick-up in demand as the global economy recovered. As interest rates have risen and monetary
policy began to tighten, volatility picked up.
During the last three months of the year the Chicago Board Options Exchange Volatility Index (VIX), hit its highest level (25.2%) since
February 2018 when concerns over economic growth in China caused stock markets to retreat.

9
2.2.2 Risk appetite and stress testing
2.2.2.1 Year in brief
ICBCS operated within its Board Approved risk appetite throughout 2018.
Macroeconomic stress testing was carried out across the entire ICBCS Group during 2018, with scenarios designed to specifically
target relevant portfolios for ICBCS i.e. Commodities and Emerging Markets. In addition, ICBCS undertook the annual Reverse Stress
Testing programme which aims to simulate ‘point of failure’ scenarios that could impact ICBCS’s business model. Output from the
programme was approved by the Board in November 2018.
2.2.2.2 Focus areas for 2019
The ICBCS risk management areas will continue to support the ICBCS business model and strategy whilst conforming with any
regulatory obligations. This will include:
Analysis of new product and counterparty requests
Continuing to move towards exiting Service Level Agreements (SLAs) currently in place with Standard Bank of South Africa (SBSA),
where practical and possible
Enhancing the relationship with, and understanding of, ICBC’s Risk management team and processes.
Enhancing stress testing methodologies in line with evolving business strategy
2.2.3 Credit risk
2.2.3.1 Year in brief
Total Credit Risk exposure was 5% lower year-on-year, driven primarily by lower balances held at the Bank of England and lower levels
of gold leases/consignments (mainly to Chinese banks) at the end of 2018. The move into structured lending/solutions products,
including equity-backed margined loans, remained a theme. During 2018 Credit Risk continued to move services provided by SBSA
under SLAs back to ICBCS.
2.2.3.2 Focus areas for 2019
The ICBCS Credit and Country Risk team will continue to provide support for the Group’s business origination strategies, by ensuring
appropriate second line risk management is in place and building required expertise where necessary.
There is ongoing engagement with ICBC to determine the potential joint initiatives (especially in the credit models areas) and
additional support capabilities available within ICBC Head Office.
2.2.4 Market risk
2.2.4.1 Year in brief
Throughout 2018, the ICBCS trading book market risk, including VaR, Stressed VaR, and Stress Testing remained well within approved
limits, with market risk exposures remaining subdued in volatile market conditions. The Group’s banking book interest rate risk also
remained well within approved limits.
2.2.4.2 Focus areas for 2019
The emphasis for Market Risk in 2019 is to continue to focus on the implementation of the new requirements arising from the
standards for minimum capital requirements for market risk. The Basel Committee of Banking Supervision released the final version
of the “Fundamental Review of the Trading Book” in January 2019.

10
2.2.5 Operational risk
2.2.5.1 Year in brief
Operational Risk losses for the year were within risk appetite. Legal expenses continue to be incurred for the material incidents of
2014 and 2015.
During 2018 the Operational Risk function has extended its independent assurance reviews to include significant transactions. The
Operational Risk function has also developed its on-line training.
2.2.5.2 Focus areas for 2019
In 2019, the Operational Risk function will continue to enhance the Group’s Operational Risk Management framework, including the
completion of the Group’s process mapping initiative. The Operational Risk function will also continue to contribute to the roll-out and
embedding of the Group’s Operational Resilience framework.
2.2.6 Capital Management
2.2.6.1 Year in brief
The Group remains sufficiently capitalised, above minimum regulatory capital adequacy and leverage ratio requirements. ICBCS had a
CET1 ratio of 18.52% and a total capital ratio of 22.25% as at 31 December 2018. The ICBCS leverage ratio as at 31 December 2018
was 5.02%.
2.2.6.2 Focus areas for 2019
Capital resources will continue to be managed to ensure there is sufficient capital to meet business requirements over the planning
horizon, whilst taking account of potential stress. This will include:
Ensuring an optimal capital mix for the ICBCS Group, taking into account the different forms of capital resources (e.g. Tier 1 and
Tier 2 capital) available to ICBCS
Continuing to ensure that the Group is adequately positioned to respond to regulatory capital rules under CRD IV and developing
EU regulations (CRD V).

11
3. Regulatory Consolidation
3.1 SCOPE OF CONSOLIDATION ................................................................................................................................................................. 11
3.2 SUB GROUP DISCLOSURES ................................................................................................................................................................ 11
3.3 SOLO CONSOLIDATION ....................................................................................................................................................................... 12
3.4 CONSOLIDATED BALANCE SHEET UNDER REGULATORY CONSOLIDATION ................................................................................................... 12
3.5 GROUP STRUCTURE .......................................................................................................................................................................... 12
3.1 Scope of Consolidation
As an EU parent institution, ICBCS is required to calculate consolidated capital requirements and maintain consolidated capital
resources based on the regulatory consolidation guidelines applicable under CRD IV. Accordingly, ICBCS complies with the disclosure
obligations of CRD IV on a consolidated basis.
The scope of regulatory consolidation for the purposes of quantifying consolidated capital requirements and consolidated capital
resources extends across all operations of the ICBCS Group. All entities included within the scope of accounting consolidation are also
included within the scope of regulatory consolidation. However, there can be a number of differences in the methods by which certain
undertakings are consolidated for regulatory purposes, as described below:
Subsidiary undertakings included within the regulatory consolidation are fully consolidated, with capital resources determined on
a line-by-line (accounting) consolidation basis. Risk capital requirements are determined either on a line-by-line (accounting)
consolidation basis or by aggregating individual subsidiaries' risk capital requirements, where relevant.
Undertakings in which ICBCS or its subsidiaries hold a ’participation’, where it is deemed that the ICBCS Group exerts significant
influence over the undertaking, are generally consolidated within the regulatory calculations on a proportional (pro-rata) basis.
This follows line-by-line (accounting) consolidation based on the ownership share in the particular undertaking. Such undertakings
may include joint ventures and associates, as defined under IFRS accounting standards, and specified venture capital
investments. In certain circumstances, participations are deducted from capital rather than proportionally consolidated.
Investments held by the ICBCS Group in respect of which it does not have the ability to exert significant influence are included
within the calculation of capital requirements, being treated as equity exposures. The underlying assets of these investments are
neither consolidated nor deducted.
In 2018, ICBCS and its subsidiaries did not hold any participation or investments where they could exert significant influence. As a
result, there are no differences in the basis of consolidation for accounting and prudential purposes within ICBCS.
The ICBCS Board ensures that capital adequacy is maintained at all levels of banking consolidation within the ICBCS Group in
accordance with the relevant regulatory requirements.
The legal and regulatory structure of ICBCS and its subsidiaries is simple, and provides a capability for the transfer of surplus capital
resources over and above regulatory requirements or repayment of liabilities when due. See solo consolidation described in section
3.3, for details.
Subject to obtaining the appropriate regulatory approvals, there are no current or foreseeable material impediments to such transfers
or repayments.
3.2 Sub Group Disclosures
ICBC Standard Bank Plc is the most significant entity within the ICBCS Group. As a result, disclosures within this document have been
provided in fulfilment of significant subsidiary disclosure requirements.

12
3.3 Solo Consolidation
The ICBCS Group makes use of the individual (solo) consolidation provisions as permitted under CRR Article 9. The solo consolidation
requirements allow a parent institution to incorporate the capital resources and requirements of a subsidiary undertaking, within the
calculation of the capital resources and capital requirement of the parent, subject to permission from the PRA.
For this purpose, ICBCS has obtained permission from the PRA for the use of solo consolidation in respect of its wholly owned
subsidiary – ICBC Standard Resources (China) Ltd (SRC). This permission enables ICBC Standard Bank Plc to incorporate the capital
resources and requirements of SRC with its own, on a solo-consolidated basis. SRC is a commodity trading company incorporated in
China. SRC is not subject to any local regulatory capital or liquidity requirements.
3.4 Consolidated Balance Sheet under Regulatory Consolidation
For full details of the own funds requirements, please refer to Annex B.
The consolidated balance sheet for ICBC Standard Bank Plc is shown on page 36 of the ICBCS Annual Financial Statements
2018.
3.5 Group Structure

13
4. Risk and Capital Management
4.1 BOARD RESPONSIBILITY ................................................................................................................................................................... 13
4.2 RISK MANAGEMENT FRAMEWORK ...................................................................................................................................................... 15
4.3 APPROACHES TO RISK MANAGEMENT ................................................................................................................................................. 17
4.4 RISK APPETITE ................................................................................................................................................................................. 18
4.5 CAPITAL MANAGEMENT ..................................................................................................................................................................... 18
4.6 REGULATORY CAPITAL ....................................................................................................................................................................... 19
4.7 ICBCS GROUP’S APPROACH TO MANAGING CAPITAL ........................................................................................................................... 22
4.8 CAPITAL POSITION ............................................................................................................................................................................ 24
4.9 REGULATORY CAPITAL INSTRUMENTS .................................................................................................................................................. 26
4.10 LIQUIDITY RISK MANAGEMENT ........................................................................................................................................................... 27
4.1 Board Responsibility
The Group Board of Directors (ICBCS Board) has the ultimate responsibility for the oversight of risk and capital management.
The Board also ensure that the firm complies with all regulatory requirements set by the regulatory bodies. The Group, led by
the Chairman, ensures that all directors commit sufficient time to perform their functions in the Group.
Members of the Board are subject to additional rules dictated by the Senior Managers and Certification Regime (SMCR). ICBCS
has adopted a framework to ensure compliance with the SMCR, and the firm remains compliant with these requirements.
4.1.1 Board Recruitment
As ICBCS currently has a majority shareholder (ICBC) and a minority shareholder (SBLH), certain directors may be appointed to
the Board by the shareholders as ICBC Directors or Standard Bank Directors, respectively, based upon the level of the
shareholding, as determined in the Shareholder Agreement between ICBC, SBG, SBLH and ICBCS. All directors nominated by
the shareholders to be appointed in such a way will be subject to any necessary internal review process (including review by
the Remuneration Committee of skills and experience, and screening as part of ICBCS’s ‘fit and proper’ review procedures).
Regulatory approvals will be sought, or notifications made in accordance with the SMCR Regime as required.
Candidates for independent non-executive director roles of ICBCS are sourced externally through the engagement of a
specialist third party executive search consultancy. A role profile and person specification detailing the specific requirements
including meeting attendance, time commitment and regulatory considerations will be drafted and approved. The Board will
only engage executive search consultants who have signed up to the voluntary code of conduct addressing diversity and best
practice in search assignments.
All applicants are required to submit a CV detailing their skills and experience and demonstrate that they possess adequate
knowledge to perform the required function. In addition, applicants need to prove a genuine understanding of the firm's
activities and the principal areas of risk. All candidates shall be evaluated in the same manner and must disclose whether any
of their activities or Directorships may lead to a conflict of interest. The Group also ensures that the recruitment process is
compliant with the Senior Managers and Certification Regime.
The Group adopts a fair and transparent selection process, led by the Chairman, whereby shortlisted independent non-
executive director candidates are interviewed by current members of the Board including the CEO, Chairman and where
applicable, other independent non-executive Directors.

14
4.1.2 Diversity and Composition
The Group has a Diversity Policy that recognises the importance of diversity and that it is a much wider issue than gender. It
recognises and embraces the benefits of having a diverse Board and management body, and views the increasing of diversity
at Board and executive management body level as an essential element in maintaining a competitive advantage. Diversity will
continue to be an active consideration whenever changes to the Board and executive management body are contemplated.
The Board believes that its members should collectively possess the broad range of skills, expertise and industry knowledge,
business and other experience necessary for the effective oversight of the Group. The Board and management body will
include and make use of differences in the skills, regional and industry experience, background and other qualities of Directors
and members of the executive management body. These differences will be considered in determining the optimum
composition of the Board and senior management team and where possible will be balanced appropriately.
All Board and executive management body appointments are to be made on merit, in the context of the skills, experience,
independence and knowledge which the Board and executive management body as a whole requires to be effective.
The current members of the Board have a wide range of backgrounds and experience, with expertise across a number of areas
including Banking, Finance, Audit and Risk Management. The members also possess a diverse range of geographical
understanding including experience of operations in Asia, Europe and Africa. Several of the directors have a detailed
knowledge and understanding of one or both of the company’s ultimate parents ICBC and SBG, as well as a strong knowledge
of the relevant legal and regulatory frameworks of China and South Africa gained in their roles as executives of ICBC or the
SBG respectively. The company’s independent non-executive directors also have other general board-level experience.
The Chairman is responsible for leading the development of and monitoring the effective implementation of policies and
procedures for the induction, training and professional development of all members of the Board. In this regard, a training
programme for board members covering both technical and company specific matters has been delivered during 2018.
The table below shows the number of directorship held by the members of the Board as at 31 December 2018.
Table 1: Number of Directorships for Directors of ICBC Standard Bank Plc at 31 December 2018
Director's Name Directorships within ICBCS Group of
Companies (includes ICBC Standard Bank Plc)
External Directorships of other Commercial
Companies*
Ms Judith Elizabeth EDEN 1 3
Mr Edward Joseph GIERA ** 1 4
Mr Andrew HALL 1 1
Mr Ruixiang HAN 1 1
Mr Binliang JIN 1 -
Mr Barend Johannes (Ben) KRUGER 1 2
Mr Andrew Warwick SIMMONDS 1 2
Mr Marc Martin VAN DER SPUY 1 -
Ms Hailu WANG 1 -
Mr Lubin WANG 1 1
Dr Shoujian WANG 1 -
Mr Wenbin WANG 1 -
Mr Ruwan Upendra WEERASEKERA 1 3
* Excludes charities, trusts, non-commercial purpose entities and organisations and other dormant companies. More than one directorship in the same corporate group of companies counts as a single external directorship. ** Resigned as a Director on 31 December 2018.
4.1.3 Board Review
For the period under review, the Board is satisfied that the Group’s risk, compliance, treasury, capital management and
internal audit processes generally operated effectively, that the Group’s business activities have been managed within the
Board-approved risk appetite, and that the Group was adequately funded and capitalised to support the execution of the
Group’s strategy.

15
The ICBCS Group manages its capital base to achieve a prudent balance between maintaining capital ratios to support
business growth and depositor confidence, and supporting the strategic objectives of the shareholders. The capital
management process ensures that each ICBCS Group entity maintains sufficient capital levels for legal and regulatory
compliance purposes.
4.2 Risk Management Framework
The Board of ICBCS represents the highest authority responsible for risk management within ICBC Standard Bank Plc; however,
the Board delegates certain functions to the Board Risk Management Committee.
The diagram below illustrates the various governance committees within the risk management framework, in place over 2018.
4.2.1 Risk Governance committees
4.2.1.1 Board Risk Management Committee
The primary risk management committee is the BRMC which reports to the Board of ICBCS on all matters of significance
pertaining to risk management. It provides the Board with advice on risk strategy including the oversight of current risk
exposures.
Mr A W Simmonds was the chairman of BRMC throughout 2018. Other members of the committee during 2018 were, Ms J E
Eden, Mr E J Giera (ceased to be a member when he resigned as a director on 31 December 2018), Mr A Hall, Mr B J Kruger,
Mr L Wang, Dr W Wang and Mr R U Weerasekera.
The BRMC is the highest authority on risk management below the Board. The Board has delegated to the Committee broad
functions to provide independent and objective oversight of risk management and compliance across the Group. In order to
achieve this, the Committee must:

16
Ensure that risk management and compliance policies and standards are well documented, up to date and support the
Group’s strategic objectives by being fit for purpose;
Review, assess and challenge the appropriateness of the risk management and compliance control frameworks;
Review and assess the adequacy and appropriateness of the risk appetite including the state of compliance with current
and known future legal and regulatory obligations, to support the delivery of current strategic objectives;
Support a climate of discipline and control that will reduce the opportunity for fraud;
Provide challenge to management in their review and oversight of risk and compliance;
Hold management to account against the matters delegated and be able to challenge the executive effectively and
promptly;
Monitor effective communication between the Head of Compliance, the management and the regulators; and,
Maintain a continuing liaison with the Chief Risk Officer (CRO) and Head of Compliance who report to the Committee on
risk exposures and compliance with legal and regulatory obligations relative to risk appetite and tolerance.
The Committee performs specific review of Credit, Market, Operational, Country, Liquidity and Physical Commodity Risk
inherent within ICBCS and also has responsibility for Compliance Risk oversight.
Information flow
The primary responsibility for updating the BRMC on risk matters resides with the CRO. In advance of each BRMC meeting, a
comprehensive risk management pack (reviewed and approved by the CRO) that covers all risks overseen by the risk
department is distributed to each member. At the meeting the CRO will present the key contents, and if necessary, highlight
any emerging risks that may not feature in the pack due to timing differences, with a verbal update to the members.
The Head of Compliance provides a report to each BRMC meeting detailing key matters and updates from each function within
the Compliance department together with reports on compliance monitoring and issues raised by regulators.
If the BRMC members request an update to a risk or compliance related matter outside of a meeting, the CRO or Head of
Compliance will facilitate the response before updating all the members.
BRMC Governance during 2018
A total of four meetings of the BRMC were held during 2018.
The BRMC considered the current and future risk profile in relation to risk appetite. The committee reported to the Board
following each meeting on its consideration of the risk profile of the Group and any concerns that it may have had. The BRMC
was satisfied that, as far as it was aware, there were no material risks that presently threaten the sustainability of the Group. It
also considered the Group’s exposure to country, single name obligor and sector concentration risk on an ongoing basis.
At each meeting of the BRMC, the CRO provided the committee with an overview of the key risk issues both current and
emerging. An update was also given by the Chief Financial Officer (CFO) on the Group’s capital and liquidity position.
Any relevant risk standards and policies were approved by the BRMC, including the annual Reverse Stress Testing programme
output.
4.2.1.2 Governance Committee
The ICBCS Governance Committee (GovCo) is the executive governance committee with oversight of all business lines within
ICBCS. It ensures that any additional policies and controls (in addition to the core risk framework) are put in place to ensure
adherence to local regulatory requirements and best practice.
Key risk related responsibilities include:
Ensuring business contingency management frameworks are in place

17
Agreeing the risk appetite (which forms a recommendation to Board) and delegated authority to sub-committees;
Reviewing operational risk and key risk indicators where referred up from Risk Management Committee;
Noting any reputational risk matters escalated to Govco and initiating remedial action where necessary;
Ensuring that ICBCS has an effective compliance programme covering regulatory and financial crime risk (including, but
not limited to anti-money laundering, anti-bribery and corruption, counter terrorist financing, fraud, sanctions and any
other financial crimes);
Reviewing and approving terms of reference for and membership of executive sub-committees;
Noting the minutes of sub-committees and monitoring their work.
The GovCo also receives reports on the status of progress and outcomes of Internal Audits from the Head of Internal Audit and
monitors progress in closing resulting Internal Audit actions.
4.2.1.3 Risk Management Committee
The Committee’s primary responsibility is to monitor and control liquidity risk, credit risk, market risk (including interest rate
risk in the banking book) and operational risk and oversee adherence of ICBCS to the agreed risk appetite.
Key responsibilities include:
Notifying the GovCo, Board Risk Management Committee (BRMC), and relevant Group stakeholders of any event involving
ICBCS breaching its agreed risk appetite, and proposing corrective actions/responsibilities
Setting risk appetite (for approval by the Board) for ICBCS, primarily from a Liquidity, Credit, Market (including IRRBB) and
Operational Risk perspective, in line with ICBCS’s overall risk appetite
Reviewing and challenging risk information relating to credit risk, country risk, market risk, liquidity risk, interest rate risk
in the banking book and operational risk
Overseeing and reviewing stress testing , and escalating, as necessary, any matters relating to stress testing to the GovCo
and the BRMC
Setting risk control policy, as appropriate
Requiring and approving any new risk approaches, methodologies, metrics and controls
Details of other risk committees which have explicit mandates to cover specific risk types are provided in the relevant sections
discussing credit, market and operational risk.
4.3 Approaches to Risk Management
ICBCS operates a prudent approach to risk with rigorous management controls to protect the Group, support sustainable
business growth and ensure that any losses remain within the Group’s risk appetite. The Board has ultimate responsibility for
risk oversight.
For this purpose, the Group has a strong and independent risk function with a mission to maintain a robust control framework,
identify and escalate emerging risks and support sustainable business growth within its risk appetite through good risk reward
decision making.
The Board ensures that senior management implements risk policies and risk appetites that either limit or, where appropriate,
prohibit activities, relationships and situations that could be detrimental to the Group’s risk profile.

18
4.4 Risk Appetite
The Group defines risk appetite as ‘the amount, type and tenor of risk that our organisation is prepared to seek, accept or
tolerate’ in pursuit of its financial and strategic objectives.
The approved risk appetite is embedded within principles, policies, authorities and limits across the Group. The Group
optimises performance by allowing business units to operate within approved risk appetite and limits. The Group’s risk appetite
will continue to evolve to reflect external market developments and the composition of the Group.
The ICBCS Risk Appetite is defined by the following metrics:
Earnings at Risk: Pre-tax earnings at risk over the next 12 months will be no greater than $210 million at a 90%
confidence interval.
Regulatory Capital: After absorbing the impact of stress events contained in the macroeconomic scenarios used for capital
stress testing, and after taking account of the effect of mitigating management actions, the CET1 ratio, Tier 1 ratio and the
total regulatory capital adequacy ratio will not be lower than the level imposed by the regulator. In addition to this, ICBCS
Group also holds an internal buffer of $75m.
Economic Capital: After absorbing the impact of stress events contained in the macroeconomic scenarios used for capital
stress testing, if necessary, after taking account of the effect of mitigating management actions, the economic capital
adequacy ratio over the 4 year planning horizon will not be lower than an internally specified ratio of 110%.
Liquidity: Liquidity Risk appetite for the Bank is defined through two limits which are calculated as the higher of:
– Regulatory surplus: Total Liquid Asset Buffer (LAB) holdings less the LAB requirement as calculated as per the
Group’s Individual Liquidity Guidance (ILG).
– Internal Stress surplus: Total LAB holdings less the LAB requirement over a 91 day survival horizon, as
calculated by the Internal Stress Test.
In order to ensure that there is sufficient time to react to a potential breach of liquidity risk appetite, ICBCS has set a
headroom amber trigger of $500m above the minimum LAB requirement, which is based on the most constraining of
the two measures above.
Unacceptable Risk: ICBCS will use its best endeavours to avoid exposure to unacceptable risk events, such as activities
that may result in adverse reputational damage, illegal activities, breaches of regulation and breaches of customer
mandates. Where such events are identified, they will be addressed through management actions with appropriate
urgency.
4.5 Capital Management
4.5.1 Objective
ICBCS Group’s capital management function ensures that regulatory capital requirements are met at all times both under
business as usual conditions and under stressed conditions. The function advises senior management on the quantum and
form of capital required, and when the required capital should be raised in line with business requirements.
4.5.2 Governance
The Capital Management Committee (CapCom) is a subcommittee of the GovCo. CapCom is the primary forum for maintaining
oversight of the size and composition of the balance sheet, including the capital and liquidity positions. CapCom is responsible
for reviewing the current capital, large exposures, liquidity, funding, leverage, encumbrance and bank levy positions and where
also appropriate, the projected positions. It is also responsible for making appropriate operational level decisions regarding
these matters.
19
CapCom’s responsibilities in relation to financial resources include, but are not restricted to, the following:
Ensuring appropriate management arrangements are in place to ensure compliance, in relation to capital and liquidity,
with both internal risk appetite and external regulatory minimum requirements;
Reviewing internal assessments of the overall adequacy of capital and liquidity resources;
Ensuring there are appropriate contingency management frameworks in place for capital and liquidity management;
Reviewing opportunities for raising capital and liquidity resources as required, including review of the funding plans and
strategy;
Reviewing and monitoring relevant future / emerging legislation and regulation and ensure appropriate arrangements are
in place to ensure compliance with these requirements as they come into force;
Providing governance oversight of relevant projects where appropriate;
Providing governance oversight of the integrity of the firm’s regulatory reporting in respect of its regulated activities where
appropriate;
Reviewing and endorsing the ICAAP and ILAAP documents for approval by the Board.
Reviewing and endorsing the Recovery and Resolution Plan (RRP) for approval by the Board
Developing such strategies as the Committee may deem appropriate for the hedging of the Group’s capital resources
where denominated in a currency other than USD, and for the hedging of the Group’s cost base where costs are incurred
in currencies other than USD.
Reviewing reports setting out any capital or cost hedges which have been executed, and their effectiveness in achieving
the objectives set.
Managing the large exposures position of the firm.
The Capital Sub Committee (CSC) is responsible for instituting a response to early signs of risk to the Group’s capital adequacy
and large exposures as part of the Early Warning Indicators (EWI) escalation mechanism. The CSC is mandated to take a
number of defined actions with a view to improving the capital and large exposures position of the Group. Should the actions
within the CSC mandate be considered insufficient, the CSC may decide to escalate the position to Contingency Capcom.
4.5.3 Capital Transferability
Subject to compliance with the corporate laws and the required regulatory approvals of relevant jurisdictions, no significant
restrictions exist on the transfer of funds and regulatory capital within the ICBCS Group.
4.6 Regulatory Capital
The Group manages its capital levels to support business growth, maintain depositor and creditor confidence, and ensure
regulatory compliance on an ongoing basis.
4.6.1 Minimum Capital Adequacy
Minimum capital requirements are referred to as Pillar 1 requirements. These requirements apply to the credit, market and
operational risk generated by ICBCS. Regulatory capital adequacy is measured through three risk-based ratios i.e. CET1, Tier 1
and Total Capital ratios (see section 4.8 for details):
CET 1: ordinary share capital, share premium and retained earnings less impairments and other capital deductions,
divided by total risk-weighted assets.

20
Tier 1: CET 1 plus perpetual, non-cumulative instruments with principal loss absorption features issued under the CRD IV
rules less capital deductions, divided by total risk-weighted assets.
Total capital adequacy: Tier 1 plus other items such as the general allowance for credit impairments and subordinated
debt with principal loss-absorption features issued under CRD IV less capital deductions, divided by total risk-weighted
assets.
Total risk-weighted assets are determined by multiplying the capital requirements for market risk and operational risk by the
reciprocal of the minimum total capital ratio and adding the resulting figures to the sum of risk-weighted assets for credit risk
and counterparty risk. Included in the overall credit risk-weighted assets are both the on- and off-balance sheet exposures risk
weighted according to the relative credit risk of the counterparty, and capital requirements for concentration risk calculated
under the CRR requirements, where required.
Under CRD IV, the minimum CET1, Tier 1 and Total capital adequacy ratios are supplemented by a number of capital buffers.
The capital buffers applicable to ICBCS are collectively referred to as the Combined Buffer Requirement.
4.6.2 Pillar 2A Requirements
The Pillar 2 capital framework is intended to ensure that firms have adequate capital to support the relevant risks in their
businesses. In addition to the Pillar 1 and the Combined Buffer Requirement mentioned above, the PRA performs a periodic
supervisory review of ICBCS’s Internal Capital Adequacy Assessment Process (ICAAP), which leads to a final determination by
the PRA of Individual Capital Guidance (ICG) amount under Pillar 2A. The Pillar 2A requirement is an additional capital
requirement that a firm needs to hold to cover risks that are not adequately captured in Pillar 1. This is a point in time
assessment of the minimum amount of capital the PRA considers that an entity should hold.
4.6.3 Capital Buffers
The PRA also requires firms to hold capital buffers to meet additional regulatory requirements. There are three main buffers
that apply to ICBCS – the PRA Buffer, Capital Conservation Buffer and the Countercyclical Buffer. Systemic buffers are not
applicable to ICBCS as the Group is not systemically important in the UK (see above diagram).
4.6.3.1 Capital Conservation Buffer
The Capital Conservation Buffer (CCB) introduced under CRD IV is designed to ensure that banks build up capital buffers
outside periods of stress which can be drawn down as losses are incurred. The CCB was subject to phased implementation at
25% per annum from 2016 with the buffer coming into full effect at 2.5%, from 2019. As per the phased implementation, the

21
CCB was set at 1.875% for 2018, increasing to 2.5% in 2019. The PRA buffer may be set by the PRA after taking account of
the existing capital conservation buffer held by the firm, if this is thought to be insufficient to cover capital requirements in
periods of stress. The PRA buffer is subject to a phasing in period, which requires 100% of the buffer to be made up of CET1
capital by 2019. In 2018, 75% of this buffer was to be made up from CET1 capital.
4.6.3.2 Countercyclical Capital Buffer
CRD IV also introduced a cyclical buffer in line with Basel III, in the form of an institution- specific countercyclical capital buffer
requirement (‘CCyB’). The CCyB is an extension of the CCB and aims to achieve a broader macroprudential goal of protecting
the banking sector from periods of excess aggregate credit growth.
The UK Financial Policy Committee (FPC) is responsible for setting the UK CCyB rate (for credit exposures located in the UK),
and have indicated that this rate would be set at 1% under normal economic conditions. Post the Brexit vote in June 2016 and
in light of economic uncertainty, the FPC set the UK CCyB to 0%. In June 2017, the UK CCyB rate was subsequently increased
to 0.5% and increased further in November 2017 to 1% in line with the long term FPC expectation. These rate increases
applied from 27 June 2018 and 28 November 2018, respectively.
CRD IV as implemented in the UK includes a transitional period, during which the FPC is responsible for deciding whether CCyB
rates set by EEA States should be recognised and for taking certain decisions about third country (non EEA) rates, including
whether a higher rate should be set for the purposes of UK institutions calculating their CCyBs.
As at 31 December 2018, the FPC has recognised the following CCyB rates:
0.5% for Lithuania
1% for the Czech Republic
1% for the United Kingdom
1.25% for Slovakia
1.25 % for Iceland
1.875% for Hong Kong
2% for Sweden
2% for Norway
Each institution’s specific countercyclical capital buffer rate is a weighted average of the countercyclical capital buffers that
apply in the jurisdictions where the relevant credit exposures are located. Currently, the ICBCS’s CCyB rate, calculated based
on exposures as at 31 December 2018 is 0.29%.
Appendix C shows a breakdown of the Geographical distribution of credit exposures relevant for the calculation of the
countercyclical capital buffer applicable as at 31 December 2018. The table below also shows the corresponding capital (own
funds) requirement, to be held in CET1 capital for CCyB is $18.6m.
Table 2: Countercyclical buffer requirements
As at 31 December 2018
Total risk weighted exposure amount $6,500.2m
ICBCS countercyclical buffer rate 0.29%
ICBCS countercyclical buffer requirement $18.6m

22
4.6.4 Regulatory approaches adopted for capital purposes
CRD IV provides various approaches for the calculation of regulatory capital to be held against credit, market and operational
risk. In general, there are three approaches:
a basic approach
an intermediate approach or standardised approach
an advanced or model based approach.
The regulators approve the approaches adopted on a case by case basis, both at a solo regulated entity and consolidated
regulated entity level.
The Group does not adopt advanced approaches for certain portfolios and exposures because it has chosen, on a materiality
basis, to adopt the intermediate or basic approaches. In these cases, the Group nevertheless adopts practices similar to the
advanced approach for its internal economic capital, risk measurement and management purposes where deemed
appropriate.
The Group currently only has model permission for certain market risk portfolios.
4.6.4.1 Risk Based Capital Requirements
The CRD IV capital requirements for ICBCS are calculated and disclosed in accordance with the risk based approaches
described in the Table on the next page.
Table 3: Risk Based Capital Requirements
Risk Type Approach
Credit Risk Standardised Approach
Counterparty Credit Risk Standardised (Mark-to-Market Method)
Operational Risk The Standardised Approach (TSA)
Market Risk Internal Model Approach (Value-at Risk) & Standardised Approach
Further details on the approaches per risk type approved by regulators are provided in the relevant credit, market and
operational risk sections.
4.7 ICBCS Group’s Approach to Managing Capital
4.7.1 External requirements
During the period under review, the ICBCS Group complied with all externally imposed capital requirements, and in particular to
the relevant regulatory requirements of the PRA.
EU banking regulations applicable to ICBCS are based on the global guidelines developed by the Basel committee under the
auspices of the Bank for International Settlements. The latest guidelines issued by the Basel committee (referred to as Basel
III), as implemented by the EU CRD IV package, were fully implemented by the Group from 1 January 2014 for PRA reporting.
The impacts of these regulatory requirements, including any relevant transitional requirements have been reviewed by the
Group and have been factored into all internal capital projections.
The requirement to maintain adequate financial resources is assessed both by the ICBCS Group and the PRA in relation to the
ICBCS Group’s activities and the risks to which they give rise. The capital adequacy ratio, which reflects the capital strength of
an entity compared to the minimum regulatory requirement, is calculated by dividing the capital held by that entity by its risk-
weighted assets. ICBCS maintains a healthy capital adequacy ratio, in excess of the regulatory requirements.

23
4.7.2 Internal requirements
The ICBCS Group assesses its capital adequacy against the capital requirement to absorb unexpected losses that may arise
from the risks inherent in the business. Regulatory capital requirements are determined on the basis of prescribed regulatory
approaches that apply to each of the main risk types and in each of the jurisdictions in which the Group operates. In addition,
the Group adopts an Internal Capital Adequacy Assessment Process (ICAAP) which reflects management’s internal assessment
of risk. The ICAAP requires capital to be held for risks as assessed by management instead of a prescribed regulatory formula,
and as such encompasses a wide spectrum of risks.
The ICBCS Group’s governance process includes a robust assessment of capital forecasts and stress testing, allowing for
capital raising and usage reductions to be expedited in a timely manner. This ensures that minimum capital ratios are
maintained in all jurisdictions in which the ICBCS Group operates.
4.7.3 Measurement and Planning
The Group measures the amount of capital it holds using the regulatory framework, as per the requirements under the Capital
Requirements Directive and Regulation (CRD IV). These requirements are implemented in the UK by the Prudential Regulatory
Authority.
As part of the capital planning process, capital positions are subjected to stress analysis to determine the adequacy of the
Group’s capital resources against the minimum requirements, including the ICBCS specific Total Capital Requirement (‘TCR’)
set by the PRA, over the forecast period. The outputs from some of these stress analyses are used by the PRA to review and set
an additional PRA Buffer for the Group (see section 4.6.3). This PRA buffer comprises a minimum level of capital buffer over
and above the minimum regulatory requirements that should be maintained in non-stressed conditions as mitigation against
potential future periods of stress. The PRA buffer is set after taking into account the overall level of capital, including the
capital conservation buffer that firms need to hold.
The Group has a capital management framework including policies and procedures that are designed to ensure that it
operates within its risk appetite, continues to comply with regulatory requirements on an ongoing basis as well as under stress,
and is positioned to meet anticipated future changes to its capital requirements.
Regulatory capital ratios are also a key factor in the Group’s planning processes and stress analyses.
Four year forecasts of the Group’s capital position are produced at least annually to inform the Group’s capital strategy. The
capital plans are tested for capital adequacy using a range of stress scenarios covering adverse economic conditions and the
Group maintains a Recovery Plan which sets out a range of potential mitigating actions that could be taken in response to a
stress.
Capital policies and procedures are subject to independent oversight. Regular reporting of actual and projected ratios,
including those in stressed scenarios, is undertaken, including submissions to the BRMC and CapCom.
4.7.4 Monitoring
ICBCS uses Early Warning Indicators (EWIs), which are monitored on a daily basis to ensure that minimum regulatory capital
requirements are not likely to be breached. In addition, the ICBCS Risk Appetite Statement metrics are reviewed on a monthly
basis.
In the event that a particular concern needs to be escalated to senior management, the prominence of the metric is
considered together with the time available to the Group to remediate the issue. For example, a problem with the current
capital position would be treated with more urgency to one with a forecast capital position in three years’ time. Under the
framework, relevant capital issues are escalated to the CapCom which can operate under its contingency management terms
of reference if required by the escalation framework. This allows the Group to select the most appropriate management action
to remediate the issue. If a particular action fails to have the desired impact, further escalation to the contingency GovCo and

24
ultimately to the Board will take place, where increasingly severe actions can be selected and actioned. This process is subject
to annual review and approval by the Board.
The Recovery Plan EWI and escalation frameworks were tested by way of a fire drill exercise in December 2018 involving
members of CapCom and GovCo under their contingency terms of reference. The exercise was conducted in conjunction with
external consultants and feedback was positive.
4.8 Capital Position
4.8.1 Summary
The Group's capital position applying prevailing rules as at 31 December 2018 is set out in the following sections. The Group
complied with all externally imposed capital requirements during the current and prior year.
The Group’s CET 1 capital was $1,204.0 million as at 31 December 2018 (2017: $1,229.7 million). The Group’s total capital
was $1,446.1 million as at 31 December 2018 (2017: $1,575.4 million).
The ratios are measured against the regulatory minimum requirements. The table below shows the capital position of ICBCS
Group as at 31 December 2018.
Table 4: ICBCS - Minimum capital adequacy ratios and buffers
As at 31 December 2018 As at disclosure date
Minimum Regulatory
Ratios & Buffers
Capital ratios and buffers
Common Equity Tier 1 (as a percentage of risk exposure amount) 18.52% 4.50%
Tier 1 (as a percentage of risk exposure amount) 18.52% 6.00%
Total capital (as a percentage of risk exposure amount) 22.25% 8.00%
Institution specific buffer requirement (CET1 requirement in accordance with CRR Article
92 (1) (a) plus buffers, expressed as a percentage of risk exposure amount:
2.165% Not applicable
of which: capital conservation buffer requirement 1.875% 1.875%
of which: countercyclical buffer requirement 0.29% Firm specific
of which: systemic risk buffer requirement Not applicable to ICBCS Not applicable to ICBCS
of which: Global Systemically Important Institution (G-SII) or Other Systemically Important
Institution (O-SII) buffer
Not applicable to ICBCS Not applicable to ICBCS
The total capital adequacy ratio, based on the EU Capital Requirements Regulations as at 31 December 2018, was 22.25%
(2017: 19.97%).
ICBCS has not issued any Additional Tier 1 capital instruments. The current regulatory minimum CET1 and Tier 1 capital ratios
of 4.5% and 6% respectively (see section 4.6.1), are therefore met with CET1 capital.
In addition, ICBCS is subject to a Pillar 2A requirement as per the PRA’s Total Capital Requirement (TCR) for 2018. The
requirement is based on a point in time assessment, of which 56% of the requirement needs to be met in CET1 form. The Pillar
2A requirement is subject to at least an annual review.
The PRA refers to the amount and quality of capital (CET1, Tier 1 and Tier 2) that a firm must maintain in order to comply with
the minimum capital requirements under the CRR (Pillar 1) and the Pillar 2A requirements as the Total Capital Requirement
(TCR). The TCR for ICBCS was set as 11.4% for 2018, of which 8.55% was met with CET1 capital.

25
4.8.2 Capital Resources
The capital position for ICBCS Group on a consolidated basis as at 31 December 2018 is shown in the tables below.
The capital position is calculated by applying the CRD IV rules, including the relevant transitional arrangements based on PRA
guidance.
Table 5: ICBCS - Capital Resources
Regulatory Capital 2018
($m)
2017
($m)
Common Equity Tier I
Share capital 1,083.5 1,083.5
Share premium 996.0 996.0
Reserves (821.6) (797.2)
Less regulatory deductions (53.9) (52.8)
Total Common Equity Tier I 1,204.0 1,229.5
Additional Tier I
Total Additional Tier I - -
Total Tier I 1,204.0 1,229.5
Tier II
Subordinated debt instruments 242.1 342.1
Credit impairment against performing loans - 3.8
Less regulatory deductions - -
Total Tier II 242.1 345.9
Total eligible capital 1,446.1 1,575.4
2018 2017
Risk Weighted Assets 6,500.2 7,887.7
Tier 1 Risk Asset Ratio 18.52% 15.6%
Capital Adequacy ratio 22.25% 20.0%
For full details of the own funds requirements and all deductions, please refer to Annex B.

26
4.8.3 Capital Requirements
The capital requirements for ICBCS Group on a consolidated basis as at 31 December 2018 are shown in the table below.
Table 6: ICBCS - Capital Requirements
Capital Requirements Calculated as per Regulation (EU) 575/2013 (CRR) 2018
($m)
2017
($m)
Credit, counterparty credit and dilution risks (standardised approach) 249.3 271.7
Central governments or central banks 19.6 2.4
Regional governments or local authorities - -
Public sector entities 0.5 0.5
Multilateral development banks - -
International organisations - -
Institutions 80.3 90.1
Corporates 144.2 173.5
Retail - -
Secured by mortgages on immovable property - -
Exposures in default 0.5 0.0
Items associated with particularly high risk - -
Covered bonds - -
Claims on institutions and corporate with a short-term credit assessment - -
Claims in the form of CIU - -
Equity exposures 0.3 0.3
Other items 3.9 5.0
Securitisation positions - -
Settlement/delivery risk 0.2 0.2
Credit Valuation Adjustment (CVA) Capital Requirements 48.1 25.0
Market Risk : Position, foreign exchange and commodity risks (standardised approach) 13.8 16.7
Position risk 5.9 12.7
Foreign exchange 6.3 4.1
Collective Investment Undertakings 1.7 0.0
Commodities - -
Market Risk : Position, foreign exchange and commodity risks (internal models) 145.5 272.3
Operational risk (standardised approach) 63.2 36.8
Large exposures in the trading book - 8.3
Total capital @ at 8% minimum capital requirement 520.0 631.0
Total Risk Weighted Assets 6,500.2 7,887.7
4.9 Regulatory Capital Instruments
As at 31 December 2018, the recognition, classification and valuation of securities included within the Group's regulatory
capital resources were subject to the requirements of CRD IV.
This can lead to a different treatment from the IFRS accounting approach upon which the disclosures within the ICBC Standard
Bank Plc Consolidated Annual Report are based. For subordinated liabilities, differences can arise in the treatment of fair value
hedge accounting adjustments, accrued interest and regulatory requirements surrounding amortisation of dated securities.
Annex A discloses the main characteristics of all capital instruments issued by ICBC Standard Bank Plc.
The use of non-equity forms of regulatory capital plays an important role in the ICBCS Group’s capital management process.
The main features of all capital instruments are shown in Annex A.

27
4.10 Liquidity Risk Management
Liquidity risk means the risk that the Group, although solvent, does not have available sufficient financial resources to enable it
to meet its obligations as they fall due. The Group’s liquidity risk framework also captures funding risk, as the two horizons
overlap due to the short and liquid dated nature of the trading focused business model. Funding risk is the risk that the Group
does not have stable sources of funding in the medium and long term to enable it to meet its financial obligations, as they fall
due, either at all or only at excessive cost.
4.10.1 Liquidity Management Framework
The Group’s liquidity risk management framework is documented in the Internal Liquidity Adequacy Assessment Process
(ILAAP), which is reviewed and approved by the Board.
The core objectives of the framework are:
To ensure that the Group has adequate liquidity resources for both regulatory and internal purposes on a daily and
forward-looking basis, both under normal and stressed conditions;
To ensure strong policies, governance and escalation mechanisms exist, in line with the risk and control monitoring
framework and
To maintain a prudent funding profile, with early warning indicators (EWIs) and stress testing methodologies in place to
alert management to potential liquidity and funding deterioration and have sufficient time for mitigating actions
The Group incorporates various elements into its cohesive liquidity risk management and monitoring framework including
robust policies, methodologies and processes.
Risk Appetite Statement and Framework: Establish the funding and liquidity risk appetite, ensuring alignment to the
Group’s strategy, resource availability and business requirements. The RAS prescribes the LAB surplus to be maintained
to meet regulatory ILG and the Group’s internal stress testing liquidity requirements.
Liquidity Stress Testing Policy: Helps management understand potential vulnerabilities to severe stress events across all
applicable liquidity risk drivers. This assists in determining business-as-usual risk management actions and constructing
the Recovery Plan.
Liquid asset investment policy: Defines the asset classes that can be included in the Liquid Asset Buffer (LAB) and the
procedures for controlling and monitoring them.
Short-term and long-term cash flow management and forecasting: Provides daily monitoring of the Group’s funding and
liquidity positions, supplemented by active monitoring of the Group’s forecast liquidity position to ensure that funding and
liquidity is managed within the Group’s RAS limits.
Liquidity Limit/Early warning indicators monitoring policy: Uses Bank-specific and macroeconomic indicators to alert
senior management to potential liquidity deficiencies and details the escalation procedures to be followed in the event of
non-adherence to maximise the time available to execute appropriate mitigating actions.
Funds transfer pricing and contingent liquidity charge mechanism: Ensures appropriate reallocation of the cost of funding
the LAB according to the desks’ funding and contingent liquidity consumption.
Recovery plan: Establishes a framework to respond to liquidity stress events; includes a suite of management actions and
roles and responsibilities for their enactment.
Funding plan: Articulates the Group’s funding strategy across the four year planning horizon, while ensuring alignment
with the overall budget process and RAS.

28
4.10.2 Organisational structure
The Group has a clear three lines of defence structure operating model for the management and monitoring of liquidity risk:
First Line: The Capital Management Committee (CapCom) is the primary forum for managing liquidity. CapCom delegates
responsibility to the Liquidity Sub-Committee (LSC) for overseeing liquidity risk management in business-as-usual (BAU) and
early signs of stressed conditions.
Treasury is the functional area responsible for the day to day liquidity and funding management. Treasury:
Ensures that the Group’s liquidity and funding positions are actively and efficiently managed within the constraints
of the RAS;
Produces funding and liquidity reports including: internal liquidity management information and regulatory returns;
Owns the ILAAP, liquidity sections of the Recovery and Resolution Pack, and internal liquidity policy documents (e.g.
the Liquid Asset Investment Policy);
Maintains the funding plan;
Is responsible for Treasury P&L;
Maintains the Group’s methodologies for liquidity stress testing, funds transfer pricing and recharge of liquidity risk
(i.e. the contingent liquidity charge); and
Ensures compliance with changes in funding and liquidity regulations and ensures that the impact on the Group’s
business model is articulated and effectively communicated to senior management
Second line: The Board Risk Management Committee (BRMC) provides the primary non-executive committee oversight and
delegates responsibility to the GovCo’s sub-committees, the Risk Management Committee (RMC) and the Market and Liquidity
Risk Committee (MLRC). The RMC and MLRC ensure liquidity risk is monitored appropriately in BAU and stressed conditions,
including monitoring breaches of the RAS. The Risk Methodologies Approval Committee (RMAC) is responsible for the technical
and quantitative reviews of liquidity models.
These executive committees are supported at the functional level by Liquidity Risk on a daily basis.
Liquidity Risk’s main responsibilities are to:
Own the Liquidity and Funding Section of the RAS, the Liquidity limit/EWI monitoring policy and are responsible for
the annual update of associated sections of the ILAAP;
Monitor the Group’s adherence to the Board approved RAS;
Report the daily Limit/EWI dashboard and monitor and escalate dashboards as required;
Perform the second line review of regulatory returns prior to submission, and of associated adjustments and
Business Requirement Documentation (BRD);
Provide robust feedback, challenge and formal review the internal liquidity stress testing methodology;
Undertake the second line review of Treasury owned policies and the ILAAP.
Third line: Internal Audit provides independent, objective assurance as a third line of defence and is mandated by the Board
Audit Committee (BAC) to assess the adequacy and effectiveness of the risk management framework.
4.10.3 Liquidity stress testing
The Group’s Risk Appetite Statement based internal stress test is a combined market and Bank-specific stress test with a
survival period of 91-days; however, the Group also runs separate market and Bank-specific stresses to ensure that the
Group’s survival horizon is tested across a range of severe but plausible stress scenarios. Each of the stresses is
parameterised to ensure that all material on- and off-balance sheet funding and liquidity risks are captured and mitigated.
The Group’s reverse stress testing framework supplements the stress testing framework and informs the RAS calibration and
pre-emptive management actions to mitigate against reaching the point of non-viability.
The stress testing and reverse stress testing policies are approved annually by the Board.

29
4.10.4 Meeting Liquidity Requirements
The Group’s liquidity RAS limits are measured through two metrics:
LAB surplus over the PRA’s Internal Liquidity Guidance (ILG) requirement.
LAB surplus over the Group’s internal stress test requirement.
These limits ensure that the Group holds sufficient LAB to meet both regulatory requirements and the anticipated stressed net
contractual and contingent outflows as determined by the Group’s internal stress tests. Given the short dated nature of the
balance sheet, the Group’s liquidity and funding risks are captured by the 91 day survival horizon of the internal stress tests.
As at 31 December 2018, the LCR position was 224% (2017: 230%), and the Group held surplus LAB of:
US$2,329 million over the ILG requirement, measured at calendar day 30 (2017: US$3,170 million).
US$1,571 million over the internal stress test requirement, measured at the low point of the 91-day survival horizon
(2017: US$2,153 million); and
4.10.5 Liquidity and funding risk monitoring
In addition to RAS limits, the Group has further EWIs that can identify the emergence of increased liquidity risk based on the
assumptions and liquidity risk drivers which are of particular relevance to the Group’s business model e.g. funding
concentration, currency conversion gaps and ratings downgrade thresholds.
ICBCS monitors the composition of its funding base on an ongoing basis. The Group’s monitoring procedures include the daily
reporting of EWIs designed to detect changes in the funding base, including new areas of concentration. Where concentrations
are identified, the Group ensures that they are appropriately parameterised within its internal stress testing framework to
ensure the risk of funding withdrawal is adequately mitigated.
As the business model evolves, the Group remains mindful of liquidity and funding risk, with daily management by Treasury,
and monitoring by Risk as the second line of defence, while committee level oversight is provided by CapCom and RMC and
BRMC. This is supplemented by the annual review of the Liquidity Limit/EWI monitoring policy and the stress testing
methodologies, to inform the setting of RAS.
4.10.6 Reporting
The Group’s main liquidity measurement reporting system is the Assets and Liabilities Database (ALDB). The ALDB provides the
Group with an effective liquidity tool to enable daily monitoring of the funding and liquidity position.
All liquidity regulatory returns and management information for the Group, including all material branches and subsidiaries, are
sourced from this in-house system, which is subject to the Group’s robust IT governance and controls to ensure continuous
completeness and accuracy of data.
Liquidity management information is produced in accordance with regulatory liquidity and internal management reporting
requirements to ensure appropriate monitoring of the Group’s liquidity and funding risks. These range from daily reports (e.g.
the Limit/EWI dashboard), packs provided to the main executive and non-executive committees and regulatory returns.
4.10.7 Liquidity Coverage Ratio (LCR)
The EBA guidelines on LCR disclosure specify the uniform disclosure tables and templates required to be to be disclosed. The
tables below provide a quarterly breakdown of the LCR for ICBCS at an individual and Group (Consolidated) level. The tables
show the averages of month end observations over the twelve months preceding the end of each quarter, as required under
the guidelines.

30
Disclosures at both levels are provided in compliance with the disclosure requirements. ICBCS Treasury manages the funding
and liquidity risk for the consolidated ICBCS Group.
Table 7: Individual Liquidity Coverage Ratio for ICBCS
31 March 2018 30 June 2018 30 September 2018 31 December 2018
Liquidity buffer 4,235 4,136 4,268 4,458
Total net cash outflows 2,785 2,364 2,068 2,068
Liquidity coverage ratio 161% 181% 209% 217%
The tables above show the averages of month end observations over the twelve months preceding the end of each quarter.
Table 8: Consolidated Liquidity Coverage Ratio for ICBCS
31 March 2018 30 June 2018 30 September 2018 31 December 2018
Liquidity buffer 4,235 4,136 4,268 4,458
Total net cash outflows 2,750 2,346 2,062 2,062
Liquidity coverage ratio 162% 182% 209% 217%
The tables above show the averages of month end observations over the twelve months preceding the end of each quarter.
As required by the LCR Delegated Act, the Group’s LAB composition is aligned to the currency denomination of net cash
outflows.
The Group’s derivative trading activity also generates the risk of margin calls which are likely to increase in the event of stress.
The Group’s LCR calculation incorporates the Historical Look Back Approach’s cash outflows for stressed margin calls to
ensure that this risk is adequately mitigated. The risk is also reflected accordingly in the internal stress test.

31
5. Credit Risk
5.1 DEFINITION .......................................................................................................................................................................... 31
5.2 APPROACH TO MANAGING CREDIT RISK .................................................................................................................................... 31
5.3 CREDIT RISK ADJUSTMENTS................................................................................................................................................... 33
5.4 CREDIT RISK PORTFOLIO CHARACTERISTICS ............................................................................................................................ 35
5.5 USE OF CREDIT RATINGS ....................................................................................................................................................... 38
5.6 COUNTERPARTY CREDIT RISK ................................................................................................................................................ 39
5.7 APPROACH TO MANAGING COUNTERPARTY CREDIT RISK ............................................................................................................. 40
5.8 GOVERNANCE COMMITTEES .................................................................................................................................................... 42
5.9 COUNTERPARTY RISK PORTFOLIO CHARACTERISTICS ................................................................................................................ 43
5.1 Definition
Credit Risk is the risk of loss arising out of failure of counterparties to meet their financial or contractual obligations when due.
Credit risk includes counterparty risk (composed of primary, pre-settlement, issuer and settlement risk) and concentration risk.
5.2 Approach to managing credit risk
ICBCS’s credit risk arises mainly from deposits placed, commodity leasing, financing transactions related to commodities and
securities and derivative contracts entered into with our clients and market counterparties.
The Group manages credit risk through:
maintaining a strong culture of responsible risk taking and a robust risk policy and control framework;
identifying, assessing and measuring credit risk clearly and accurately across ICBCS, from the level of individual facilities
up to the total portfolio;
defining, implementing and re-evaluating our risk appetite under actual and stress conditions;
monitoring credit risk relative to limits;
ensuring that there is expert scrutiny and independent approval of credit risks and their mitigation.
First line responsibility for credit risk management resides with the business lines, which is in turn supported by the
overarching risk function.
As part of ICBCS’s trading and derivative activity, the firm is exposed to counterparty credit risk, which arises as a result of
movements in the fair value of securities and commodities financing and derivative contracts. The risk amounts reflect the
estimated aggregate replacement or exit costs that would be incurred by the Group in the event of counterparties defaulting on
their obligations.
The exposure to counterparty risk is affected by the nature of the trades, after recognition of any eligible netting and collateral
arrangements. See section 5.9 for additional details on counterparty credit risk management.

32
5.2.1 Governance Committees
The Credit Committee is convened as a sub-committee of the Risk Management Committee (RMC) with a mandate to:
Exercise responsibility for the independent assessment, approval, review, and monitoring of credit and country risk limits
and exposures relating to the ICBCS business under a Delegated Authority framework;
Ensure that the origination and management of credit and country exposure (including structured transactions) in the
portfolio is done in line with the Credit policy and any other guidance given to it by RMC from time to time;
Escalate matters to RMC as appropriate, including breaches of risk appetite and proposed corrective actions;
Monitor and review Non-Performing Loan and Watchlist exposures;
Review and approve counterparty trading documentation (e.g. ISDA Master Agreements, Global Master Repurchase
Agreements, etc.) and Legal opinions on Netting, Collateral and other forms of credit risk mitigation;
Approve any underwriting commitments related to Primary Markets transactions.
5.2.2 Regulatory Capital Approach for Credit Risk
The Group applies a standardised approach for the calculation of credit risk capital.
This calculation of regulatory capital for credit risk is based on applying a risk weighting to the net counterparty exposures after
recognising a limited set of qualifying collateral. The risk weighting is based on the exposure characteristics and, in the case of
corporate, bank and sovereign exposures, the external agency credit rating applicable to the counterparty. In the case of
counterparties for which there are no credit ratings available, exposures are classified as unrated for determining regulatory
capital requirements.
5.2.3 Scope of Risk Reporting Systems
The Group uses third party software to monitor and measure credit risk limits and exposures.
Credit risk reports are produced on a monthly basis for the Risk Management Committee and Portfolio Credit Committee.
Reports are also provided to the Board Risk Management Committee on a quarterly basis. Additional reporting is provided on
an ad-hoc basis as requested by either internal or external stakeholders.
Typical reporting to Board will include an analysis of counterparty exposures by sector, region and ratings. Additional reports
provide an overview of significant exposures by economic group across both Financial Institutions and Corporates.
Ad-hoc reporting can include granular analysis of specific counterparties or sectors, excesses, products and risk mitigation
measures.

33
5.3 Credit Risk Adjustments
5.3.1 Performing loans
Performing loans are defined as neither past due nor specifically impaired loans that are current and fully compliant with all
contractual terms and conditions.
Early arrears but not specifically impaired loans include those loans where the counterparty has failed to make contractual
payments and payments are less than 90 days past due, but it is expected that the full carrying value will be recovered when
considering future cash flows, including collateral. Ultimate loss is not expected but could occur if the adverse conditions
persist.
5.3.2 Non-performing loans and impairments
Non-performing but not specifically impaired loans are not specifically impaired due to the expected recoverability of the full
carrying value when considering the recoverability of future cash flows, including collateral. In this case, ultimate loss is not
expected but could occur if the adverse condition persists.
Non-performing specifically impaired loans are those loans that are regarded as non-performing and for which there has been
a measurable decrease in estimated future cash flows. This includes objective evidence such as known cash flow difficulties,
breach of covenants, granting of concessions due to downgrades in credit rating etc.
Specifically impaired loans are further analysed into the following categories:
Sub-standard: Items that show underlying well-defined weaknesses and are considered to be specifically impaired.
Doubtful: Items that are not yet considered final losses due to some pending factors that may strengthen the quality of the
items.
Loss: Items that are considered to be uncollectible in whole or in part. ICBCS provides fully for its anticipated loss, after
taking collateral into account.
Non-performing loans are those loans for which:
The Group has identified objective evidence of default, such as a breach of a material loan covenant or condition, or
Instalments are due and unpaid for 90 days or more.

34
5.3.3 IFRS 9 Adoption
IFRS 9 Financial Instruments was adopted by the Group from 1 January 2018. This introduced an expected credit loss (ECL)
impairment requirement, providing timelier recognition of credit losses. Implementation of IFRS 9 required the development of
models for estimating credit losses, incorporating multiple scenarios and forward looking macro-economic information. The
new standard also introduced a principles based approach for classification and measurement of financial assets, based on
the underlying business model and their contractual cash flow characteristics.
The Group has adopted the regulatory transitional arrangements published by the EU on 27 December 2017 for IFRS 9:
Financial Instruments. These permit Banks to add back to their capital base a proportion of the impact that IFRS 9 has upon
their loan loss allowances during the first five years of use. The proportion that banks may add back starts at 95% in 2018 and
reduces to 25% by 2022.
The impact of these transitional arrangements on the ICBCS capital base can be seen in Table 9, and also in Appendix B.
Table 9: IFRS9 Transitionals
As at
31st December 2018
Available capital (amounts)
1 Common Equity Tier 1 (CET1) capital 1,204.0
2 Common Equity Tier 1 (CET1) capital as if IFRS 9 or analogous ECLs transitional arrangements had not been applied 1,203.7
3 Tier 1 capital 1,204.0
4 Tier 1 capital as if IFRS 9 or analogous ECLs transitional arrangements had not been applied 1,203.7
5 Total capital 1,446.1
6 Total capital as if IFRS 9 or analogous ECLs transitional arrangements had not been applied 1,445.8
Risk weighted assets (amounts)
7 Total risk-weighted assets 6,345.6
8 Total risk-weighted assets as if IFRS 9 or analogous ECLs transitional arrangements had not been applied 6,345.6
Capital Ratios
9 Common Equity Tier 1 (as a percentage of risk exposure amount) 18.97%
10 Common Equity Tier 1 (as a percentage of risk exposure amount) as if IFRS 9 or analogous ECLs transitional arrangements
had not been applied 18.97%
11 Tier 1 (as a percentage of risk exposure amount) 18.97%
12 Tier 1 (as a percentage of risk exposure amount) as if IFRS 9 or analogous ECLs transitional arrangements had not been
applied 18.97%
13 Total capital (as a percentage of risk exposure amount) 22.79%
14 Total capital (as a percentage of risk exposure amount) as if IFRS 9 or analogous ECLs transitional arrangements had not
been applied 22.78%
Leverage Ratio
15 Leverage ratio total exposure measure 24,256.4
16 Leverage ratio 5.02%
17 Leverage ratio as if IFRS 9 or analogous ECLs transitional arrangements had not been applied 5.02%
Additional disclosures on impairments are included on pages 87 and 103-104 of the ICBC Standard Bank Plc
Consolidated Annual Report 2018.

35
5.4 Credit Risk Portfolio Characteristics
The credit risk exposures presented in this section relate to positions which attract a credit risk regulatory capital charge on a
standardised basis. This excludes the credit risk exposures in the banking and trading book which generate counterparty credit
risk, which are addressed separately in section 5.6.
5.4.1 Analysis of Credit Portfolio
The credit portfolio subject to credit risk in the non-trading book is analysed in the tables that follow in terms of the exposure
class. The average credit risk exposure by exposure class over 2018 is shown in the table below.
Table 10: Credit Risk Exposures by Exposure Class
As at 31 December 2018 Average exposure over the year
($m)
Exposure pre-mitigation as at
31 December 2018
($m)
Central governments or central banks 3,441 3,730
Regional governments or local authorities - -
Public sector entities 309 301
Multilateral development banks 788 1,064
International organisations 0 0
Institutions 995 824
Corporates 1,371 1,911
Retail 0 0
Secured by mortgages on immovable property 0 0
Exposures in default 10 21
Items associated with particularly high risk 3 3
Covered bonds 0 0
Claims on institutions and corporate with a short-term credit assessment 0 0
Claims in the form of CIU 0 0
Equity exposures 4 4
Other items 52 49
Securitisation positions 0 0
Total 6,972 7,906
As at 31 December 2018, the credit risk exposures of ICBCS Group before credit risk mitigation were predominantly to central
governments and central banks, multilateral development banks, corporates and institutions, as shown in the table above.
ICBCS places a large number of short dated deposits at the Bank of England, which result in large exposure to central banks. In
addition, ICBCS held a significant amount of debt securities issued by multilateral development banks in 2018 as part of the
Liquid Asset Buffer.
5.4.1.1 Specialised Lending Exposures
The PRA requires that specialised lending exposures arising through the Group's business streams are separately identified
from general corporate exposures.
Specialised lending exposures are those possessing all the following characteristics, either in legal form or economic
substance:
the exposure is typically to an entity, often a structured entity, which was created specifically to finance and/or operate
physical assets;
the terms of the obligation give the lender a substantial degree of control over the asset(s) and the income that it
generates; and
as a result of the preceding factors, the primary source of repayment of the obligation is the income generated by the
asset(s), rather than the independent capacity of a broader commercial enterprise.

36
There are four sub-classes of specialised lending recognised under the EBA Regulatory Technical Standards (RTS) on
specialised lending exposures. These are project finance, object finance, commodities finance and income-producing real
estate ('IPRE'). Each of these sub-classes is defined under the RTS.
As at 31 December 2018, the ICBCS Group had no specialised lending exposures.
5.4.1.2 Retail Exposures
Retail exposures are defined as exposures to either a natural person or persons, or to a small or medium-sized enterprise
(SME) where the total amount owed to ICBCS Group is less than €1 million. Such exposures are typically one of a significant
number of exposures with similar characteristics such that the risks associated with such lending are substantially reduced.
The following exposures are generally considered to be retail exposures under the Basel framework:
Retail exposures secured by real estate collateral (e.g. residential mortgages)
Qualifying revolving retail exposures (e.g. overdrafts and credit cards)
Exposures to retail SMEs (e.g. retail business banking)
Other retail exposures (e.g. unsecured personal lending)
As at 31 December 2018, the ICBCS Group had no retail exposures.
5.4.1.3 Exposures to Securitisations
A securitisation is a transaction whereby the credit risk associated with an exposure, or pool of exposures, is tranched and
where payments to investors in the transaction are dependent upon the performance of the exposure or pool of exposures.
As at 31 December 2018, ICBCS Group has no securitisation exposures. Additionally, there are no impaired or past due assets
securitised or losses recognised by the Group during the current period.

37
5.4.2 Concentration risk
The Group actively aims to prevent undue concentration and long tail-risks (large unexpected losses) by ensuring a diversified
credit portfolio. Single obligor, industry, geography and product specific concentrations are actively assessed and managed
against risk appetite limits.
Other credit risk concentrations that are managed are type of collateral, type of security, maturity, physical inventory exposures
and trading book issuer risk.
5.4.2.1 Industry
A breakdown of exposures by industry is shown below. The exposures to central banks predominantly related to cash balances
held with the Bank of England.
Table 11: Distribution of Credit Exposure by Industry
Credit Risk
Adjustments
As at 31 December
2018
Central
governments or
central banks
($m)
Corporates
($m)
Institutions
($m)
Multi-lateral
Development
Banks
Public
Sector
Entities
Other
($m)
Total exposure
post-mitigation
($m)
Of which:
impaired and past
due exposures
($m)
Specific
($m)
Agriculture 0 0 0 0 0 0 0 - 0
Electricity 0 25 0 0 0 0 25 - 0
Finance: banks 0 21 902 1,064 301 0 2,288 - 0
Finance: non-bank
financial institutions
0 86 58 0 0 3 146 - 0
Individuals 0 0 0 0 0 0 0 - 0
Manufacturing 0 244 0 0 0 0 244 6 14
Mining 0 285 0 0 0 0 285 - 1
Transport 0 0 0 0 0 0 0 - 0
Wholesale 0 274 0 0 0 1 274 - 1
Government and
Public
Administration
2,464 0 0 0 0 0 2,464 - 0
Other 0 0 0 0 0 49 49 -
Total 2,464 934 960 1,064 301 53 5,775 6 18

38
5.4.2.2 Geographic Region
A breakdown of exposures by geographic regions is shown below.
Table 12: Geographical Distribution of Credit Exposures
Credit Risk
Adjustments
As at 31
December 2018
Central
governments
or central
banks
($m)
Corporates
($m)
Institutions
($m)
Multi-lateral
Development
Banks
($m)
Public
Sector
Entities
($m)
Other
($m)
Total exposure
post-mitigation
($m)
Of which:
impaired and
past due
exposures
($m)
Specific
($m)
United Kingdom 1,957 87 102 66 0 52 2,264 - 1
Eurozone 45 211 161 229 271 0 917 - 1
Rest of Europe 0 126 67 0 30 0 224 - 0
Asia-Pacific 6 153 501 95 0 1 757 - 2
Middle East &
North Africa
0 198 0 0 0 0 199 - 1
Sub-Saharan
Africa
21 9 5 0 0 0 35 - 0
North America 431 150 122 673 0 0 1,377 6 14
Latin America 3 0 0 0 0 0 3 - 0
Total 2,464 934 960 1,064 301 53 5,775 6 18
5.4.2.3 Maturity
The credit exposures of ICBC Standard Bank Plc are predominantly short dated (less than 1 year residual maturity), as shown
in the table below.
Table 13: Credit Risk Exposures by Residual Maturity
As at 31 December 2018 Less than 1 year
($m)
1 to 5 years
($m)
Greater than 5 years
($m)
Total exposure post-
mitigation
($m)
Central governments or central
banks
1,990 472 2 2,464
Regional governments or local
authorities
- - - -
Public sector entities 100 201 0 301
Multilateral development banks 75 989 0 1,064
International organisations 0 0 0 0
Institutions 864 96 0 960
Corporates 621 291 16 928
Retail - - - -
Secured by mortgages on
immovable property
- - - -
Exposures in default 6 0 0 6
Items associated with particularly
high risk
0 0 0 0
Covered bonds - - - -
Claims on institutions and
corporate with a short-term
credit assessment
- - - -
Claims in the form of CIU - - - -
Equity exposures 4 0 0 4
Other items 49 0 0 49
Securitisation positions - - - -
Total 3,709 2,048 18 5,775

39
5.5 Use of Credit Ratings
The nominated External Credit Assessment Institutions (ECAIs) used by the ICBCS Group for regulatory capital purposes are
Moody’s and Fitch Ratings. These agencies are used to source ratings for all credit exposure classes. The Group has not
nominated any export credit agencies to determine credit ratings.
For counterparty and credit risk purposes, the Group contracts a specialist external supplier to source ratings issued by
Moody's and Fitch for specified companies. The Group produces a request list containing all counterparties and guarantors to
which the Group has current exposure, for which the external supplier sources current ratings.
Credit ratings are applied as per the requirements under the CRR, and are applied based on the credit quality steps published
per the credit quality assessment scale on the PRA's website.
Table 14: Credit risk exposures by credit quality step
As at 31 December 2018
Credit Quality Step Fitch Moody's Exposure pre-mitigation
($m)
Exposure post-mitigation
($m)
Unrated 1,938 830
1 AAA to AA- Aaa to Aa3 3,994 4,085
2 A+ to A- A1 to A3 488 686
3 BBB+ to BBB- Baa1 to Baa3 76 88
4 BB+ to BB- Ba1 to Ba3 23 23
5 B+ to B- B1 to B3 1,380 57
6 CCC+ and below Caa1 and below 7 7
Deductions 0 0
Total 7,906 5,775
Where the post-mitigation exposure value is greater than the pre-mitigation exposure value, this reflects the application of
guarantees.
The level of exposures shown as "Unrated" by ECAIs is a reflection of the Group’s emerging markets focus and the nature of the
client base that have typically sought bank financing rather than accessing debt capital markets and therefore do not have a
need to carry an external rating.
The unrated exposures are allocated internal ratings using a bank wide probability of default scale that can be mapped to
equivalent external ratings. 28% of these exposures carry an internal rating equivalent to BBB- or better (investment grade),
23% are in the BB category, 45% single-B and the remaining 4% are CCC or below, including Past Due Items.

40
5.6 Counterparty Credit Risk
Counterparty credit risk is the risk that the counterparty to a transaction could default before the final settlement of the
transaction's cash flows. Such transactions relate to contracts for financial instruments and may include derivative and repo
contracts. The amounts at risk reflect the aggregate replacement costs that would be incurred in the event that the
counterparties default on their obligations.
5.7 Approach to managing counterparty credit risk
The Group’s exposure to counterparty risk is affected by the nature of the underlying trades, the creditworthiness of the
counterparty, and any netting and collateral arrangements.
Counterparty credit risk takes into account any potential future exposure and is recognised on a net basis where netting
agreements are in place and are legally recognised, or otherwise on a gross basis. Exposures are generally marked-to-market
daily. Cash or near cash collateral is recognised where contractually provided for.
In 2017, the EU introduced rules governing the mandatory posting of collateral for derivatives that are not cleared. These rules
require in-scope counterparties to post variation margin for derivatives not cleared via a clearing house. A phased-in
implementation is in place for initial margin over a period from 1 September 2017 through to 1 September 2020. ICBCS
adheres to these new requirements and has variation margin agreements in place with in-scope counterparties.
5.7.1 Measuring Exposures for Counterparty Credit Risk
The Group applies the mark-to-market method for the calculation of counterparty credit risk exposures for regulatory purposes.
Under the mark-to-market method, EAD is based on the balance sheet value of the instrument plus a regulatory prescribed
add-on for potential future exposure.
5.7.2 Internal Credit Limits
Counterparty credit risk exposures are subject to explicit credit limits which are formulated and approved for each counterparty
and economic group, with specific reference to its credit rating and other existing credit exposures.
The maximum credit risk appetite for counterparties is determined through a combination of credit quality (expressed as an
internal credit rating) and nature of exposure, including risk mitigants. Internal credit ratings are mapped to internally modelled
probabilities of default (PDs).
Additionally, a number of product specific, obligor quality limit guidelines and counterparty specific policies also serve to
determine risk management and credit limit setting. Credit limits are established through the Group’s credit approval
framework on the basis of the projected maximum potential future exposure of anticipated derivative transaction volumes,
generally based on 95th percentile assumptions.
Credit limits take into account the type of documentation held for netting or collateral management purposes. Outstanding
exposures are calculated on a potential future exposure basis, based upon the transaction characteristics and documentation.
5.7.3 Securing Collateral and Establishing Credit Reserves
Collateral, guarantees, derivatives and on- and off-balance sheet netting are widely used to mitigate credit and counterparty
credit risk. The ICBCS credit policy outlines risk mitigants that may be applied to minimise risk and that may be considered as
part of the credit process.

41
Collateral arrangements are typically governed by industry standard agreements (such as Global Master Repurchase
Agreements and Credit Support Annexes to ISDA Master Agreements). Internal policies require that appropriate documentation
is put in place for all clients prior to trading.
Guarantees and related legal contracts are often required, particularly in support of credit extension to groups of companies
and weaker counterparties. Guarantor counterparties include banks, parent companies, shareholders and associated
counterparties. Creditworthiness is established for the guarantor as for other counterparty credit approvals.
Reverse repurchase agreements are underpinned by the assets being financed, which are mostly liquid and tradable financial
instruments and commodities.
For derivative transactions, the Group typically uses ISDA agreements, with a credit support annexure, where collateral support
is considered necessary. Other credit protection terms may be stipulated, such as limitations on the amount of unsecured
credit exposure acceptable, collateralisation if mark-to-market credit exposure exceeds acceptable limits, and termination of
the contract if certain credit events occur, for example, downgrade of the counterparty’s public credit rating.
For certain derivative transactions which meet eligibility for clearing at a Central Counterparty (‘CCP’), the transactions are
cleared with the CCP and the counterparty credit risk is replaced by an exposure against the CCP.
The management of concentration risk is outlined in credit policies, incorporating guideline limit frameworks at both a risk-
weighted and notional level. Such guidelines are calibrated to the firm’s available financial resources and exist to manage
counterparty concentrations. Requests for limits to exceed the guidelines are only considered at Credit Committee.
Furthermore, sector concentrations are monitored against a portion of the firm’s overall Economic Capital and Earnings at Risk
amounts. Sector concentrations are monitored each month at Risk Management Committee and provide a view as to which
sectors the firm’s financial resources are being utilised.
See section 6, for additional details of credit risk mitigation.
5.7.4 Wrong Way Risk
Wrong Way Risk (WWR) is defined as the risk that arises due to adverse correlation between counterparty credit exposure and
credit quality. WWR is present where the risk of default by the counterparty increases as the Group’s credit exposure to the
counterparty increases or as the value of the collateral held by the Group decreases.
This risk is addressed by taking into consideration the high correlation between the default event and exposure to the
counterparty when calculating the potential exposure and security margin requirements on these transactions. Where
appropriate, consideration is given to factors which may mitigate the high degree of correlation.
As a general principle, credit risk exposures whether in the Banking or Trading Book should be right way risk and significant
WWR exposures are avoided where possible. It is acknowledged that WWR may be inherent in certain forms of primary credit,
and franchise or relationship considerations may require an element of business with a particular counterparty to carry some
degree of WWR. This is in line with the Group’s business strategy and is monitored through the WWR framework and reporting.
WWR needs to be managed both at an individual obligor level and at an aggregate country and portfolio level given the
potential for positive correlation between defaults by obligors in the same country or sector. Exceptions to these general
principles may be considered where warranted, but should be subject to appropriately rigorous policy application and
oversight, with due regard for capital and risk appetite constraints at a legal entity and portfolio level.
The Group’s WWR policy contains two distinctions of WWR, defined below.
5.7.4.1 Specific Wrong Way Risk (SWWR)
Specific Wrong Way Risk occurs where there is a direct or very strong positive correlation between a counterparty exposure and
the probability of default of the counterparty due to:

42
Legal relationship, or
Economic group relationship in the absence of a diversified portfolio, or
Other factors of a substantial similar nature
The Group has limited appetite for SWWR and such risk will only be considered in the most exceptional circumstances.
Any credit risk mitigation received is specifically assessed to ensure that it does not exhibit material positive correlation
between the collateral and the borrower. Where such correlation is considered to be material, the benefits of such mitigation
are not recognised for capital purposes. This assessment of materiality is undertaken at the Credit Committee, as part of
transaction approval.
5.7.4.2 General Wrong Way Risk (GWWR)
General Wrong Way Risk occurs where there is a positive correlation between the counterparty exposure and the probability of
default of the counterparty, arising from macro factors rather than a direct relationship. For example, buying credit protection
on a financial institution (reference entity) from another bank that operates within the same country or geographic region as
the reference entity.
A status of High, Medium or Low GWWR is assigned to a transaction based off variables that take into account aspects such as
sector, geography and currency. These aggregate High, Medium and Low WWR exposures arising from OTC Derivatives are
managed and monitored under the approved WWR framework.
5.7.5 Collateral requirements in the event of a downgrade
Collateral arrangements entered into with external counterparties, which are governed by industry standard legal and
contractual agreements, may also require the Group to post eligible collateral.
Based on existing contractual agreements in place as at 31 December 2018, ICBCS would be required to post a maximum of
$6.3 million in additional collateral, arising specifically as a result of a hypothetical idiosyncratic two notch downgrade of
ICBCS’s current long-term debt rating and any accompanying short-term downgrade implemented simultaneously by all major
rating agencies.
5.7.6 Derivative Valuation Adjustments
Credit and Debit Valuation Adjustments (CVA and DVA) are incorporated into derivative valuations to reflect the impact on fair
value of counterparty credit risk and ICBCS’s own credit quality, respectively. Details on the application of derivative valuation
adjustments, including CVA and DVA are provided in the ICBCS Annual Report [as referenced below].
CRD IV introduced a new regulatory capital charge to cover the risk of mark-to-market losses on expected counterparty risk to
derivatives, the Credit Valuation Adjustment (CVA) risk capital charge.
Additional disclosures on derivative valuation adjustments are included on page 77 (Note 23.4) of the ICBC Standard
Bank Plc Consolidated Annual Financial Statements 2018.
5.8 Governance committees
The governance arrangements for counterparty credit risk are identical to the governance of credit risk as described in section
5.2.1.
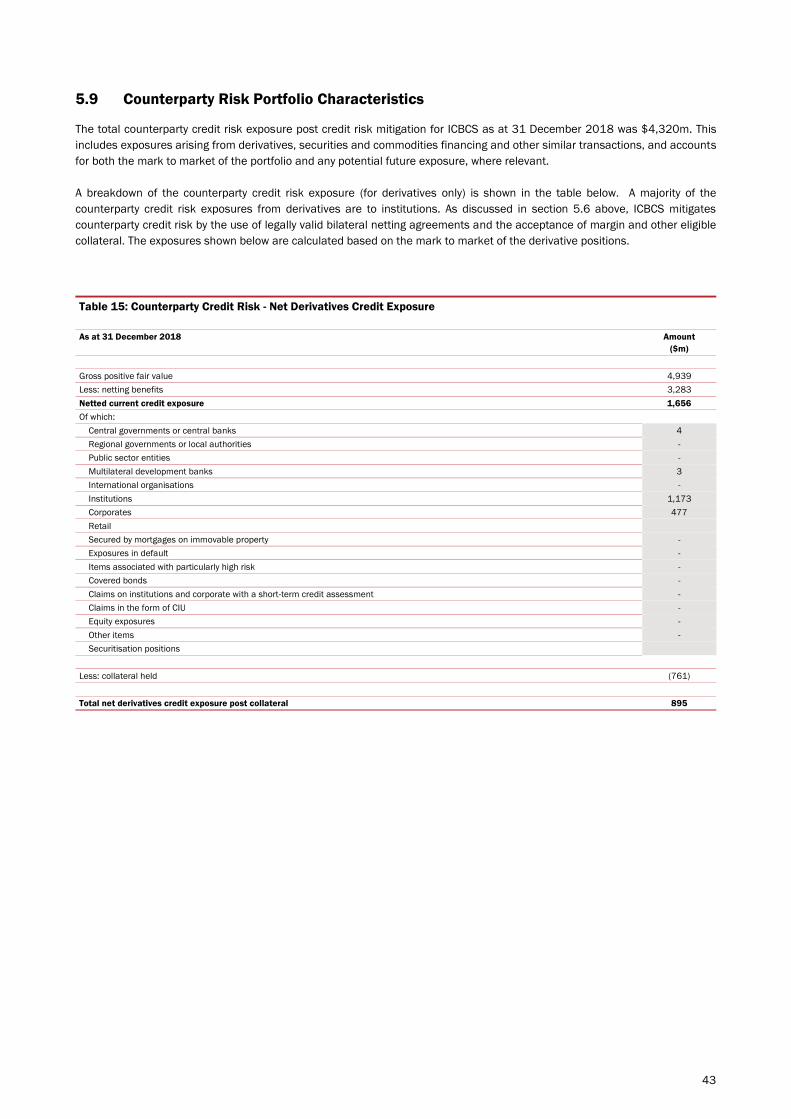
43
5.9 Counterparty Risk Portfolio Characteristics
The total counterparty credit risk exposure post credit risk mitigation for ICBCS as at 31 December 2018 was $4,320m. This
includes exposures arising from derivatives, securities and commodities financing and other similar transactions, and accounts
for both the mark to market of the portfolio and any potential future exposure, where relevant.
A breakdown of the counterparty credit risk exposure (for derivatives only) is shown in the table below. A majority of the
counterparty credit risk exposures from derivatives are to institutions. As discussed in section 5.6 above, ICBCS mitigates
counterparty credit risk by the use of legally valid bilateral netting agreements and the acceptance of margin and other eligible
collateral. The exposures shown below are calculated based on the mark to market of the derivative positions.
Table 15: Counterparty Credit Risk - Net Derivatives Credit Exposure
As at 31 December 2018 Amount
($m)
Gross positive fair value 4,939
Less: netting benefits 3,283
Netted current credit exposure 1,656
Of which:
Central governments or central banks 4
Regional governments or local authorities -
Public sector entities -
Multilateral development banks 3
International organisations -
Institutions 1,173
Corporates 477
Retail
Secured by mortgages on immovable property -
Exposures in default -
Items associated with particularly high risk -
Covered bonds -
Claims on institutions and corporate with a short-term credit assessment -
Claims in the form of CIU -
Equity exposures -
Other items -
Securitisation positions
Less: collateral held (761)
Total net derivatives credit exposure post collateral 895

44
5.9.1 Credit Derivatives
Credit derivatives are a method of transferring credit risk from one counterparty (the protection buyer) to another (the
protection seller). In return for a risk premium, the protection seller agrees to make a payment (or series of payments) to the
protection buyer in the event of the occurrence of a stipulated event.
The following table shows the use of credit derivatives by ICBCS, split by protection bought and protections sold.
Table 16: Counterparty Credit Risk on Credit Derivative Transactions
As at 31 December 2018 Protection bought ($m) Protection sold ($m) Total
($m)
Credit derivative products used for own credit portfolio
Credit default swaps 201 248 449
Total return swaps 267 6 273
Total notional value 468 254 722
Credit derivative products used for intermediation
Credit default swaps 677 677 1,354
Total return swaps 750 750 1,500
Total notional value 1,427 1,427 2,854
Total Notional Value of Credit Derivatives 1,895 1,681 3,576
The table above shows that exposures to credit derivatives arise predominantly as a result of intermediation activities for
clients.

45
6. Credit Risk Mitigation
6.1 USE OF CREDIT RISK MITIGATION ........................................................................................................................................... 45
6.2 INTERNAL POLICIES AND CONTROLS ........................................................................................................................................ 45
6.3 PRINCIPAL TYPES OF CREDIT RISK MITIGATION ........................................................................................................................ 47
6.4 REGULATORY CAPITAL APPROACH FOR CREDIT RISK MITIGATION ............................................................................................... 48
6.1 Use of Credit Risk Mitigation
The Group uses a range of approaches to mitigate credit risk.
Collateral, guarantees, derivatives and netting are widely used to mitigate credit risk. The Credit policy outlines risk mitigants
that may be applied within ICBCS to minimise risk and that may be considered as part of the Credit process. The policy also
outlines the use of legally approved Master Trading Agreements when executing derivative transactions.
6.2 Internal Policies and Controls
6.2.1 Credit principles, policy and collateral management
The Credit Policy sets out the credit principles and policy according to which credit risk is managed. Principles and policies are
reviewed regularly and at least annually, and any changes are subject to a review and approval process. Policies, where
appropriate, are supported by guidelines, which also define the responsibilities of credit officers and provide a disciplined and
focused benchmark for credit decisions. Policies cover core aspects of the credit process including the measurement,
management and quantification of Credit risk as well as governance. Oversight and reviews are also undertaken by Internal
Audit.
The policy outlines the application of credit risk mitigation by ICBCS, including the monitoring and reporting associated with the
provision of collateral. It also highlights the key considerations that ICBCS adheres to in relation to the liquidity and volatility of
collateral, and the legal enforceability of all such credit risk mitigation arrangements.
6.2.2 Controls over rating systems
ICBCS outsources the controls over rating systems to an independent team in the Risk Division of Standard Bank Group (SBG)
that sets common minimum standards, designed to ensure risk models and associated rating systems are developed
consistently, and are of sufficient quality to support business decisions and meet regulatory requirements. Internal rating
systems are developed and owned by the SBG Risk Division. The ICBCS Risk Technical Committee and Risk Methodology
Approval Committees retain oversight and review all validation of the rating systems.
6.2.3 Concentration risk
The management of concentration risk is undertaken via the Credit Policy which incorporates Credit Limit Appetite Guidelines.
This framework provides guidelines as to the maximum amount of unsecured credit risk that ICBCS is willing to take on any
single counterparty. The guideline limit frameworks are calibrated to the Group’s available financial resources. Any exceptions
to the guidelines are only considered at Credit Committee and may be granted for strategic purposes.

46
Credit risk management also includes controls on sectors and product lines reflecting the Group’s risk appetite, in addition to
the individual limit guidelines. Exposures are monitored to prevent an excessive concentration of risk and single name
concentrations. In addition, sectoral concentrations are monitored monthly by the Risk Management Committee.
The Notional Inventory Risk Framework (NIRF) specifically covers commodity product concentrations and specific policies and
procedures are in place to manage concentrations to warehouses/locations that are utilised to store physical commodity
inventories owned by the Group.
The Group has Notional Inventory Limit Guidelines in place for its commodity repo business to manage counterparty
concentration risk in terms of absolute transaction volumes, even if direct credit exposure is modest. This control framework is
principally based on counterparty credit rating and storage locations of the underlying commodity. Exceptions to these notional
guideline limits may be approved by Credit Committee for certain strategic counterparties, if sufficient mitigation is in place,
including diversification of location / product concentration risks and enhanced control processes.
The Group also considers risk concentrations by collateral providers and collateral types, as appropriate, with a view to
ensuring that any potential undue concentrations of risk are identified and suitably managed by changes to strategy, policy and
/or business plans.
The Group’s large exposures are reported in accordance with regulatory reporting requirements.
Guarantees that are treated as eligible credit risk mitigation are marked as an exposure against the guarantor and aggregated
with the credit exposure to the guarantor. Limit monitoring at the counterparty level is then used for monitoring of
concentrations in line with credit policy.
6.2.4 Cross-border exposures
Country limits are authorised by the Credit Committee, taking into account economic, financial, political and social factors.
Policies stipulate that these limits must be consistent with, and support the approved business and strategic plans of the
Group.
6.2.5 Stress testing and scenario analysis
The ICBCS credit portfolio is subject to stress testing, with stressed scenario assessments run at least monthly. This covers the
following:
6.2.5.1 Counterparty Stressed Expected Exposures
Expected exposures are modelled on a daily basis under Business as Usual (BAU) assessments. These assessments are based
on a Monte Carlo simulation of the underlying risk factors across all asset classes (e.g. FX, Interest rates, equity, commodity
and credit). All individual transactions are priced under this framework and the aggregated exposure is calculated based on the
legal agreements in place (e.g. considering the presence of an ISDA netting agreement and a corresponding credit support
annex) with individual counterparties.
Assessments for stress testing involve the determination of macroeconomic scenarios which are translated into a term
structure of risk factors by an external service provider. A Monte Carlo simulation is undertaken by applying these risk factor
stresses across the term structure (applied as stressed market rates). This process repeated for all points across the scenario
term structure resulting in modelled counterparty stressed expected exposures for each macro-economic scenario.
6.2.5.2 Credit Rating Migration
Under Business as Usual (BAU) assessments, credit managers assign country and counterparty ratings to exposures based on
internal assessments of the probability of default (PD) and the loss given defaults (LGD). The assessments are carried out
using a combination of internally developed credit models based on scorecards, and detailed knowledge of the client and
market.

47
These ratings are frequently reviewed, typically annually and more frequently if input data (e.g. financials) is out of date.
Internally modelled ratings and assessments can only be overridden with the appropriate level of oversight and authorisation.
The process for a stressed assessment is undertaken based on internally determined macroeconomic stress scenarios as
follows:
The top credit counterparties (Financial Institutions, Corporates and Sovereigns) are individually reviewed and ratings
migrations (notches) are assigned to match the severity and nature of each macroeconomic stress scenario.
For the remaining counterparties, the sectors and geographies are reviewed and ratings migrations (notches) are assigned
to match severity and nature of each macroeconomic stress scenarios.
In order to mitigate the risks associated with expert judgement, a variety of stakeholders are approached to provide input and
recommendations. This leads to discussion and robust challenge regarding the proposed stressed parameters to be applied.
Once the assessments are consolidated, the results are redistributed to the expert stakeholders, who review the output to
ensure that individual inputs used amounted in a final result that is plausible.
6.2.6 Valuation
ICBCS ensures that collateral should always be realistically valued by an appropriately qualified source, independent of both
the credit decision process and the customer, at the time of borrowing. Collateral is reviewed on a regular basis and will vary
according to the type of lending and collateral involved. In order to minimise the credit loss, ICBCS may seek additional
collateral from the counterparty as soon as impairment indicators are identified for the relevant individual loans and advances.
6.3 Principal types of Credit Risk Mitigation
6.3.1 Derivative Netting
For derivative transactions, the Group typically uses internationally recognised and enforceable International Swaps and
Derivatives Association (ISDA) agreements, with a credit support annexure, where collateral support is considered necessary.
Other credit protection terms may be stipulated, such as limitations on the amount of unsecured credit exposure acceptable,
collateralisation if mark-to-market credit exposure exceeds acceptable limits, and termination of the contract if certain credit
events occur, for example, downgrade of the counterparty’s external credit rating.
6.3.2 Master Netting Agreements
Where it is appropriate and likely to be effective, the Group seeks to enter into master netting agreements. Although master
netting agreements do not generally result in an offset of balance sheet assets and liabilities for accounting purposes, as
transactions are usually settled on a gross basis, they do reduce the credit risk to the extent that, if an event of default occurs,
all transactions with the counterparty are terminated and settled on a net basis. The Group’s overall exposure to credit risk on
derivative instruments subject to master netting agreements can change substantially within a short period, since this is the
net position of all trades under the master netting agreement.
6.3.3 Guarantees and Standby Letters of Credit
A guarantee is a contract whereby a third party guarantor promises to recompense the lender in the event of failure by a
customer to meet their obligations. Regulatory capital relief is only taken through the use of risk weight substitution for
guarantees provided by appropriate central governments, central banks, institutions & corporates. Where regulatory capital
relief is sought to reflect the risk mitigating effect of a guarantee, there are minimum operational and legal requirements which
are required to be met. On the basis that these are met, alternative forms of protection, for example indemnities and standby
letters of credit, may be classified as a guarantee for regulatory capital purposes.

48
6.3.4 Credit Derivatives
Credit derivatives are a method of transferring credit risk from one counterparty (the protection buyer) to another (the
protection seller). In return for a risk premium, the protection seller agrees to make a payment (or series of payments) to the
protection buyer in the event of the occurrence of a stipulated event. Further details are included within the Counterparty
Credit Risk section of the document.
Capital relief under regulatory requirements is restricted to the following types of credit derivative: Credit Default Swaps; Total
Return Swaps; and Credit Linked Notes (to the extent of their cash funding).
In respect of a Credit Default Swap, various credit events defined in the International Swap and Derivatives Association (ISDA)
(including bankruptcy, failure to pay and restructuring) affecting the obligor, can trigger settlement. Settlement usually takes
place by the protection buyer being paid by the protection seller the notional amount minus the recovery as determined by an
auction of the eligible securities of the obligor governed by ISDA.
Under a Total Return Swap, the protection buyer will pass on to the seller all payments it receives in return for an interest
related payment (market rate and spread), plus any decrease in the market value of the credit obligation. Where the
deterioration in the value of the asset that is protected is not recorded (either through reductions in fair value or by an addition
to reserves), the credit protection must not be recognised as eligible.
Under a Credit Linked Note, the protection buyer will issue a bond or note which is linked to the creditworthiness of an obligor
and backed by certain collateral. The bond or note is purchased by the protection seller and the investor will receive a coupon
on the bond or note (market rate and spread). If a credit event occurs in either the obligor or the collateral, the bond or note is
redeemed by the protection buyer with the recovery value being the redemption amount. If no credit event occurs, the bond or
note will be redeemed at par by the protection buyer.
6.3.5 Collateral
Collateral may be obtained against credit exposure, depending on the creditworthiness of the counterparty and/or nature of
the transaction. Any collateral taken may be subject to a ‘haircut’, which is negotiated at the time of signing the collateral
agreement. A haircut is the reduction factor in the valuation applicable to each type of collateral and will be largely based on
liquidity and price volatility of the underlying security.
Collateral obtained for derivatives is predominantly cash. The collateral document gives ICBCS the power to realise any
collateral in the event of the failure of the counterparty.
As a consequence of the jurisdictions that the Group operates in, an additional risk which may arise is that collateral
enforceability is protracted through the legal process. This manifests itself through an impact on the profit and loss of the firm,
which is only recovered once full settlement occurs. This risk is partially mitigated through various limits frameworks around
inventory held, country limits and enhanced due diligence.
6.4 Regulatory Capital Approach for Credit Risk Mitigation
Credit risk mitigation applied in regulatory capital calculations by ICBCS typically takes the form of one or more of the following:
Eligible financial collateral
Other eligible collateral
Guarantees
Credit derivatives
Netting
49
Only certain types of collateral are deemed eligible for regulatory capital purposes. Eligible financial collateral typically includes
cash on deposit within the Group, gold, rated debt securities (subject to certain restrictions), equities or convertible bonds
included in a main index and units in certain collective investment undertakings or mutual funds. Other types of collateral are
also used, provided the criteria for regulatory capital recognition are met.
The recognition of eligible collateral requires a number of factors to be considered including, legal certainty of charge,
frequency and independency of revaluation and correlation of the value of the underlying asset to the obligor.
The amount and type of credit risk mitigation depends on the circumstances of each case. Credit risk mitigation policies and
procedures ensure that credit risk mitigation techniques are acceptable, used consistently, valued appropriately and regularly,
and meet the risk requirements of operational management for legal, practical and timely enforceability. Detailed processes
and procedures are in place to guide each type of mitigation used.
The amount and type of collateral required depends on the nature of the underlying risk, an assessment of the credit risk of
the counterparty as well as requirements or intentions with respect to reductions in capital requirements. Guidelines are in
place regarding the acceptability of types of collateral, their strength as credit risk mitigation and valuation parameters.
Guarantees and related legal contracts are often required, particularly in support of credit extension to groups of companies
and weaker counterparties. Guarantor counterparties include banks, parent companies, shareholders and associated
counterparties. Creditworthiness is established for the guarantors, as for other counterparty credit approvals.
6.4.1 Application of Credit Risk Mitigation under the Standardised Approach
Where a credit risk exposure is mitigated by a form of eligible financial collateral the exposure value is adjusted accordingly
under the Financial Collateral Comprehensive Method. Where guarantees or credit derivatives apply, the risk weight applied to
the portion of the exposure covered by the protection provider is based on the risk weight attached to the provider. The
covered portion is determined after the application of ‘haircuts’ for currency and maturity mismatch applied to the protection
provided. The risk weight applied to the uncovered portion of the exposure is not impacted.
Collateral is generally accepted in the form of cash or government bonds. Collateral concentrations are generally inherent
within the securities financing portfolio due to the types of clients being financed. Often collateral posted by a client will be
government bonds of its own domicile, which can generate WWR (see WWR section for management) as well as concentrations
should a number of clients within that domicile be financed at the same time. Such concentrations will be assessed on a case-
by-case basis to ensure overall appetite is not breached and will be viewed in line with current market conditions for that
client’s domicile. Typically there would be insistence on trades being margined daily, trades may be short dated and sufficient
haircuts will be applied to manage gap risk and enable a close out to take place to minimise potential losses.

50
6.4.2 Credit Risk Mitigation Recognised
The table below shows the use of credit risk mitigation in the banking book, by underlying exposures. The primary issuers of
guarantees and credit derivatives used by ICBCS for credit risk mitigation are other corporates and institutions. All guarantees
and credit derivatives recognised for credit risk mitigation were from counterparties rated BBB- and above.
Table 17: Credit Risk Mitigation Received by Exposure Class
As at 31 December 2018 Eligible financial collateral
($m)
Guarantees and credit derivatives
($m)
Central governments or central banks 1,168 45
Regional governments or local authorities - -
Public sector entities - -
Multilateral development banks - -
International organisations - -
Institutions 204 396
Corporates 673 112
Retail - -
Secured by mortgages on immovable property - -
Exposures in default - -
Items associated with particularly high risk 3 -
Covered bonds - -
Claims on institutions and corporate with a short-term credit assessment - -
Claims in the form of CIU - -
Equity exposures - -
Other items - -
Securitisation positions - -
Total 2,048 553
The table above illustrates that the majority of financial collateral in the banking book is received under secured lending
transactions undertaken with central banks.
6.4.2.1 Counterparty credit risk mitigation
Eligible collateral post regulatory haircuts recognised for securities financing and other similar transactions included in the
banking and trading book was $4,795m, of which $852m was placed by corporates, $1,992m was placed by institutions and
$1,951m placed by central governments and central banks.
The collateral recognised as counterparty credit risk mitigation against derivative exposures in the trading book ($761m) is
shown in table 15. This collateral was primarily received in the form of cash margin.

51
7. Country Risk
7.1 DEFINITION .......................................................................................................................................................................... 51
7.2 APPROACH TO MANAGING COUNTRY RISK ............................................................................................................................... 51
7.1 Definition
Cross-border country risk is the uncertainty that obligors (including the relevant sovereign, and including the obligations of the
Group’s branches and subsidiaries in a country) may not be able to fulfil their obligations to the Group outside the host country
because of political or economic conditions in the host country. This includes Group equity investments and physical
inventories owned by the Group in a host country.
7.2 Approach to Managing Country Risk
All countries to which the group is exposed are reviewed at least annually. Internal rating models are employed to determine
ratings for jurisdiction (on a rating scale JRaaa to JRc), sovereign, and transfer and convertibility risk (on a rating scale RG01 to
RG25). In determining the ratings, extensive use is made of the group’s network of operations and external information
sources. These internal ratings are also a key input into the group’s credit rating models.
Country risk may be mitigated through a number of methods, including:
political and commercial risk insurance
co-financing with multilateral institutions
structures to mitigate transferability and convertibility risk such as collection, collateral and margining deposits outside
the jurisdiction in question.
7.2.1 Scope of Risk Reporting Systems
The Group uses third party software (Adaptiv) to monitor and measure country risk limits and exposures.
Country risk reporting provided to the BRMC focuses on exposures across country risk grades and region. Exposures to
countries on an internal watch-list are also monitored separately, with greater scrutiny.
Additional disclosures on country risk are included on pages 108-110 (Note 37.5) of the ICBC Standard Bank Plc
Consolidated Annual Financial Statements 2018.

52
8. Market risk
8.1 DEFINITION .......................................................................................................................................................................... 52
8.2 GOVERNANCE COMMITTEES ................................................................................................................................................... 52
8.3 MARKET RISK IN THE TRADING BOOK ...................................................................................................................................... 53
8.4 MARKET RISK IN THE BANKING BOOK ..................................................................................................................................... 60
8.1 Definition
Market Risk can be defined as the risk of losses in on- and off-balance sheet positions arising from adverse movements in
market prices. Market prices include currency exchange rates, interest rates, credit spreads, recovery rates, correlations and
implied volatilities within these variables.
Within ICBCS, this consists of:
Market risks arising from trading activity in financial instruments and commodities
Interest rate risk from interest rate sensitive positions held in the banking book (IRRBB).
Issuer risks in credit and equity instruments held in the banking book
Foreign currency risk in the banking book
8.2 Governance Committees
8.2.1 Market and Liquidity Risk Committee
The Market and Liquidity Risk Committee’s (MLRC) primary responsibility is to monitor and control market risk for the Group,
and oversee adherence to the agreed risk appetite. The MLRC is a sub-committee of the Risk Management Committee (RMC),
as described in Section 4.2.1.
Key responsibilities of this committee include:
Monitoring and reviewing the market and liquidity risk profile and establishing a proper control framework to manage
market and liquidity risk across the Group in line with the agreed risk appetite
Recommend Level 1 limits (legal entity or business unit level) across the Group, to be ratified by RMC and approved at
Board level committees
Developing, managing and implementing a framework of sub limits (level 2 limits)
Monitoring VaR, SVaR, EWI and stress testing exposures against limits across the Group
Monitoring Market Risk Economic Capital and Market Risk Internal Model Approach (IMA) Regulatory Capital usage across
the Group
Approving transactions with material market risk and structured transactions
Reviewing Market and Liquidity risk policies (at least annually)
8.2.2 Risk Methodology Approval Committee
The purpose of the Risk Methodologies Approval Committee (RMAC) is to provide assurance to the RMC that the technical
aspect aspects of model development and quantitative methodologies, model monitoring and model validation results are
53
assessed and independently reviewed to ensure models and methodologies are technically sound, robust, accurate and
appropriate.
Models and methodologies presented to the Committee include pricing (front office) and risk generation models used for
monitoring the Group’s positions as well as models used for market, credit, counterparty and operational risk functions,
regulatory and economic capital purposes, including rating models, pricing models, stress testing models and collateral
valuation models. The Committee also reviews other models and methodologies that are referred to it by RMC from time to
time.
8.2.3 Risk Technical Forum
The Risk Technical Forum (RTF) is a sub-forum of the RMAC.
The purpose of the RTF is to provide assurance to the RMAC that the technical aspects of model development and quantitative
methodologies, model monitoring and model validation results are debated and independently reviewed before the RMAC
takes place. Pure technical assessments are undertaken at the RTF level, whilst the RMAC would review the analysis of the
RTC in order to ensure that models and methodologies are technically sound, robust, accurate and appropriate.
8.3 Market Risk in the Trading Book
8.3.1 Definition
Trading book market risk arises from financial instruments, including commodities, held in the trading book, arising out of
normal global markets trading activity.
8.3.2 Approach to managing market risk in the trading book
The market risk function is independent of trading operations and accountable to the Chief Risk Officer (CRO), the MLRC and
the RMC.
The Board sets the risk appetite for each risk category, typically in terms of earnings at risk (EaR) and approves the entity level
1 limits, in terms of VaR, SVaR and Stress testing. The MLRC sets limits at lower level, typically level 2 Value at Risk (VaR),
Stressed VaR (SVaR) and other risk factor limits. Market risk teams are responsible for identifying, measuring, managing,
monitoring and reporting market risk as outlined in the Market Risk policy.
Exposures and excesses are monitored and reported daily as per Market Risk policy. Where breaches in limits and triggers
occur, actions are taken by market risk to move exposures back in line with approved market risk appetite, with such breaches
being reported to management and the appropriate governance committees.
8.3.2.1 Model Permissions
The Group requires specific permission from the PRA in order to use internal models for the determination of market risk
regulatory capital requirements.
The scope of the Group’s model permission includes the calculation of Value at Risk (VaR) and Stressed Value at Risk (SVaR)
for foreign exchange, commodities, credit trading, equity trading and interest rate risk trading businesses, covering most
products in named trading locations. In addition, the Group calculates an ‘Incremental Risk Charge’ (IRC) as part of the model
permission to determine the market risk regulatory capital of credit trading positions.

54
8.3.2.2 Model Validation
The models used to determine VaR, SVaR (including the Risk not in VaR and Proxy framework) and the Incremental Risk
Charge are subject to review and validation by a model validation team, which is independent from both Market Risk and the
model developers. This validation includes:
an evaluation of the theoretical soundness and adequacy of the model for its intended use; and
the verification of the calculation methodologies incorporated in the model, and implementation of the model
These models are regularly reviewed to ensure they remain appropriate in the context of variations in the composition of the
trading portfolio and changes in market conditions.
All changes to the models are approved at the RMAC.
8.3.2.3 Measurement
The techniques used to measure and control trading book market risk and trading volatility include VaR and SVaR, stop-loss
triggers, stress tests, backtesting and specific business unit and product controls.
8.3.2.3.1 VaR and SVaR
The Group uses the historical VaR and SVaR approach to quantify market risk under normal and stressed conditions,
respectively.
For risk management purposes VaR is based on 251 days of unweighted recent historical data, a holding period of one day
and a confidence level of 95%. The historical VaR results are calculated in four steps:
Calculate 250 daily market price movements based on 251 days’ historical data.
Calculate hypothetical daily profit or loss for each day using these daily market price movements.
Aggregate all hypothetical profits or losses for day one across all positions, giving daily hypothetical profit or loss, and then
repeat for all other days.
VaR is the 95th percentile selected from the 250 days of daily hypothetical total profit or loss.
Daily losses exceeding the VaR are likely to occur, on average, 13 times in every 250 days.
SVaR uses a similar methodology to VaR, but is based on a period of financial stress and assumes a 10-day holding period and
a 99% confidence interval.
Where the Group has received internal model approval, the market risk regulatory capital requirement is based on VaR and
SVaR, both of which use a confidence level of 99% and a 10-day holding period.
Management are aware of the limitations of the use of historic VaR as it is based on historical correlations and volatilities in
market prices and assumes that future prices will follow the observed historical distribution.
These limitations include:
The use of one year historical data as a proxy for estimating future events may not encompass all potential events,
particularly those which are extreme in nature.
The use of a one-day holding period assumes that all positions can be liquidated or the risk offset in one day. This may not
fully reflect the market risk arising at times of severe illiquidity, when a one-day holding period may be insufficient to
liquidate or hedge all positions fully.
The use of a 95% confidence level, by definition, does not take into account losses that might occur beyond this level of
confidence.

55
VaR is calculated on the basis of exposures outstanding at the close of business and, therefore, does not necessarily
reflect intraday exposures.
VaR is unlikely to reflect loss potential on exposures that only arise under significant market moves.
8.3.2.3.2 Incremental Risk Charge (IRC)
Incremental risk is the estimated loss in value of un-securitised traded credit positions due to the default or credit migration of
issuers of financial instruments over a one-year time horizon. As required by the market risk regulatory capital rules, this
measure is calculated at a confidence level of 99.9% over a one-year time horizon. It uses a multi-factor model assuming a
constant level of risk.
The model incorporates issuer-specific concentration, credit quality, liquidity horizons and correlation of default and migration
risk. The liquidity horizon is determined by an assessment of the length of time it would take to hedge or unwind the exposures
in stressed market conditions and is floored at a prescribed regulatory minimum.
8.3.2.3.3 Stop-loss triggers
Stop loss triggers are designed to contain losses for individual trading desks by enforcing management intervention at
predetermined loss levels.
The Group uses stop-loss triggers to protect the profitability of the trading desks, and are monitored by market risk on a daily
basis. The triggers constrain cumulative or daily trading losses by acting as a prompt to review or close-out positions.
8.3.2.3.4 Stress tests
Stress testing provides an indication of the potential losses that could occur under extreme but plausible market conditions,
including where longer holding periods may be required to exit positions. Stress tests comprise individual market risk factor
testing, combinations of market factors per trading desk and combinations of trading desks using a range of historical,
hypothetical and Monte Carlo simulations.
Daily losses experienced during the year ended 31 December 2018 did not exceed the maximum tolerable losses as
represented by the Group’s stress scenario limits.
8.3.2.3.5 Backtesting
The Group backtests its VaR models to verify the predictive ability of the VaR calculations and ensure the appropriateness of
the models within the inherent limitations of VaR. Backtesting compares the daily hypothetical profit and losses under the one-
day buy and hold assumption to the prior day’s calculated VaR.
Regulators qualify a VaR model as green, amber or red and assign regulatory capital multipliers based partly on this
categorisation. A green model is consistent with a satisfactory VaR model and is achieved for models that have four or less
backtesting exceptions in a 12-month period. All of the Group’s approved models were assigned green status for the year
ended 31 December 2018 (2017: green).
The graph below shows the hypothetical Profit and Loss and VaR for the business.

56
Graph 18: Hypothetical Profit and Loss and VaR
8.3.2.3.6 Specific business unit and product controls
Other controls specific to individual business units include permissible instruments, concentration of exposures, price
validation and balance sheet substantiation.
8.3.2.4 Scope of Risk Reporting Systems
The Group uses internal software (Vespa) to monitor and measure VaR and SVaR.
Market risk reports are produced on a daily basis for internal monitoring and on a monthly basis for the Risk Management
Committee and the Market and Liquidity Risk Committee. Quarterly reports are produced for the Board Risk Management
Committee. Additional reporting is provided on an ad-hoc basis as requested by either internal or external stakeholders.
Standard reporting into relevant forums will cover 95% VaR utilisation, Stressed VaR, backtesting, limit breaches, stress testing
(macroeconomic and point of weakness scenarios), P&L analysis and regulatory capital charge.
8.3.2.5 Valuation
The Group’s valuation policy and financial asset classification is governed by IFRS and changes in asset classification is
subject to IFRS requirements. Valuations are the responsibility of the risk owners and they are accountable for the timely
revaluation of assets and liabilities according to the methodologies and procedures applying to their particular business area.
Accounting and regulatory rules require held for trading positions to be recorded at fair value on the balance sheet. Fair value
standard IFRS13 was adopted in 2013 and is the amount at which the instrument could be exchanged in a current transaction
between knowledgeable, willing parties. The key definition of fair value is the exit price. The best evidence of fair value of
financial instruments is quoted prices in an active market. A financial instrument is regarded as quoted in an active market if
quoted prices are readily and regularly available and these prices represent actual and regularly occurring market transactions
on an arm’s length basis.

57
All trading book positions are subject to the standards for prudent valuation as per the requirements under CRR. The product
control function is accountable for the independent valuation process and is independent of the Front Office. Policies and
procedures exist to ensure all valuations are independently verified.
Trading positions are revalued on a daily basis and profits or losses on the revaluation of positions are recognised in the
income statement. Traders can either mark a position directly to observable prices in an actively quoted market or indirectly
through the use of an independently approved model, where the inputs to the model are observable. Independent price
verification acts as a control mechanism to ensure accuracy and validity of prices.
For markets or instruments which exhibit low trading volumes or intermittent trading patterns, it can be difficult to establish if a
price reflects a fully active market. If the market for financial investments is not active or has little transparency, the Group
establishes fair value using valuation techniques. The fair value may be less objective and requires varying degrees of
judgement depending on liquidity, concentration, uncertainty of market factors, pricing assumptions and other risks affecting
the specific instrument. Pricing assumptions include risk premiums, liquidity discount rates, credit risk, volatilities and
correlations. Changes in these assumptions could affect the reported fair values of the financial instruments. Financial
instruments measured at fair value are classified according to a fair value hierarchy which reflects the spread of valuation
methodologies used.
Independent model validation is performed in order to validate and document new internal pricing models and ensures an
annual review of existing models to ascertain they are still relevant and behaving within expectations.
8.3.2.5.1 Independent Price Verification
Independent price verification is the process by which the prices and model inputs used for valuation purposes are verified
against independently sourced data.
The Product Control department within Finance performs daily reviews of liquid price inputs and at least a monthly review of
less liquid prices. Where material differences occur mark-to-market adjustments are made. For products where no
independent price is obtainable, Product Control test the inputs to the model, use suitable approved proxies and/or fully
provision for valuation uncertainty. This process is a key control over the marking of positions and operates to validate both the
daily profit and loss and the fair value of trading book assets and liabilities.
Product Control also calculates Additional Valuation Adjustments that would be required to move the fair valued inventory from
fair value to prudent valuation.
8.3.2.6 Inclusion in the trading book
The Group employs internal policies and strict controls around all activities which are defined as forming part of the “trading
book” for regulatory capital purposes. The controls include the determination of whether a position or instrument forms part of
the trading or banking book.
When deciding whether a book is Trading or Banking consideration is given to the underlying nature of and rationale for the
trades booked in it. The capital requirements that arise from the allocation of the book are not a driver for but rather a
consequence of such decisions. The finance function is responsible for maintaining the relevant book structure and ensuring
that there is clear distinction between banking and trading books.
Transfers between the regulatory trading and banking books require a clear justification and approval from the Capital
Management Committee.
8.3.2.7 Risk Mitigation
Where the Group considers the level of market risk to be unacceptable based on internal limits, the risk of adverse price
movements is usually hedged. Hedges are usually transacted in a risk offsetting position, in a related asset. Typical hedges
employed by the Group include forwards, swaps, options and future contracts.

58
On-going monitoring of hedges takes place at regular review meetings between the business and the market risk function,
which takes into account hedge effectiveness and prevailing market conditions.
8.3.3 Output from the Internal Market Risk Models
Internal market risk models for trading book activities comprise VaR, Stressed VaR and Incremental Risk Charge.
8.3.3.1 VaR for the period under review
Trading book market risk exposures arise mainly from residual exposures from client transactions and limited trading for the
Group’s own account. In general, the Group’s trading desks have run moderate to low levels of market risk throughout the year
ended 31 December 2018.
Based on the 1-day 95 per cent confidence level, assuming positions are held overnight and using observation periods of the
preceding 250 business days, the VaR for the year based on the last trading day of 31 December 2018, calculated based on
the Group’s global trading positions are detailed in the table below.
The risk of loss measured by the VaR model is the potential loss in earnings given the confidence level, time horizon and
assumptions noted above. The Group internally uses VaR as the primary measure for all trading book positions arising from
short term market facing activity.
Table 19: Normal VaR (1 day 95%)
Maximum ($m) Minimum ($m) Average ($m) Year end ($m)
Commodities 2.6 0.8 1.5 1.7
Foreign Exchange 1.2 0.4 0.8 1.1
Equities 1.6 0.5 0.7 0.7
Debt Securities 1.8 0.1 1.2 1.1
Diversification benefit* - - - (2.1)
Total (including diversification) 3.6 1.6 2.4 2.4
* Diversification benefit is the benefit of measuring the VaR of the portfolio as a whole, i.e. the difference between the sum of the individual VaRs and measuring
the VaR of the whole trading portfolio.
The Group’s stressed VaR (based on a 10-day 99 per cent confidence level) measures are presented on a similar basis to the
VaR measures above. These are detailed in the table below, as at 31 December 2018.
Table 20: Stressed VaR (10 days 99%)
Maximum Minimum Average Year end
$m $m $m $m
Commodities 18.4 2.8 8.0 4.4
Foreign exchange 13.7 2.7 6.1 8.0
Equities 5.3 1.8 2.9 2.4
Debt securities 42.4 1.5 21.1 27.7
Diversification benefit* - - - (17.1)
Total (including diversification) 39.4 11.1 22.8 25.3
* Diversification benefit is the benefit of measuring the stressed VaR of the portfolio as a whole, i.e. the difference between the sum of the individual stressed VaRs
and measuring the stressed VaR of the whole trading portfolio.

59
The Group’s Incremental Risk Charge over the reporting period is presented below:
Table 21: Incremental Risk Charge
Maximum Minimum Average Year end
$m $m $m $m
Total 181.3 11.2 68.3 41.1
The IRC floors its liquidity horizon requirement at 3 months and each asset in the IRC is assigned a horizon from 3m to 1y
depending on the liquidity of a particular asset. The weighted average liquidity horizon for incremental default and migration
risk, included within the incremental risk charge model as at close of business on 31 December 2018 was 5.1 months.
8.3.3.2 Analysis of trading profit
The graph below shows the distribution of daily profit and losses for the period. It captures trading volatility and shows the
number of days in which the Group’s trading-related revenues fell within particular ranges. The distribution is skewed
favourably to the profit side.
For the year ended 31 December 2018, trading profit was positive for 205 out of 253 days (2017: for 203 out of 255 days).
Graph 22: Analysis of Trading Profit

60
8.3.3.3 Market Risk Capital Requirements
The table below shows the breakdown of bank’s market risk capital requirements, split by modelled and non-modelled
components. The capital requirements for the modelled population account for 91.3% of the total market risk capital charge.
Table 23: Market Risk Capital Requirements at 8%
Market Risk Capital Requirements @ 8% ($m) 31-Dec-18
VaR Charge 99% - 10 day holding 26.0
Stressed VaR 51.7
Incremental Risk Charge (IRC) based on a 12 week average 43.4
Risks not captured in modelled VaR (Stress type) 24.4
Capital requirement for modelled population 145.5
Standardised Market Risk Capital Requirements 13.8
Total Market Risk Capital requirement 159.3
8.4 Market Risk in the Banking Book
The primary market risks within the banking book include interest rate risk, equity risk and foreign exchange risk.
8.4.1 Interest rate risk in the banking book
8.4.1.1 Definition
Interest Rate Risk in the Banking Book (IRRBB) is the risk that results from the different re-pricing characteristics of banking
book assets and liabilities.
IRRBB is further divided into the following sub-risk types:
Re-pricing Risk: arising from timing differences in the maturity (fixed rate) and re-pricing (floating rate) of assets and
liabilities.
Yield Curve Risk: arising when unanticipated shifts in the yield curve have adverse effects on the Group’s income or
underlying economic value.
Basis Risk: arising from the imperfect correlation in the adjustment of the rates earned and paid on different instruments
with otherwise similar re-pricing characteristics.
Optionality Risk: arising from the options embedded in asset and liability portfolios, providing the holder with the right, but
not the obligation, to buy, sell or in some manner alter, the cash flow of an instrument or financial contract.
8.4.1.2 Approach to managing IRRBB
Treasury are responsible for developing the framework for managing IRRBB and interpreting IRRBB regulatory requirements.
The Group’s Risk team monitor banking book interest rate risk operating under the oversight of RMC and CapCom.
Under the existing business model, the Group does not run substantial interest rate risk in its banking book. The Group’s
monitoring of IRRBB currently primarily addresses re-pricing and yield curve risk which are relevant to the Group’s business
model. The approach taken is deemed appropriate for the assessed quantum of risk.

61
8.4.1.2.1 Measurement
In considering IRRBB within the Group, the Group uses the internal model for Economic Value of Equity measure (which is
owned by Risk) to quantify the potential loss of earnings. The Economic Value of Equity is at a confidence interval of 99.92%
and is scaled down to a confidence interval of 90% to translate into Earnings at Risk.
The Group currently uses the following measures for earnings and economic value, for the purpose of IRRBB:
Economic Value of Equity: Considers the adverse impact of a parallel +/- 200bps shock of the interest rate curve on the
Group’s economic value at a confidence interval of 99.92%
Net Interest Income (NII) or Earnings: Considers the impact of a parallel +/- 200bps shock of the interest rate curve on the
Group’s refinancing profile at a 90% confidence level.
In 2018 the Group has also included additional prescribed interest rate shocks to the Groups Economic Value of Equity (EVE)
metric. The additional interest rates shock scenarios added were, short rates up, short rates down, Steepener (short rates
down and long rates up), flattener (short rates up and long rates down).
The results obtained assist in evaluating and monitoring the interest rate risk run by the Group. Desired changes to a particular
interest rate risk profile are achieved through the restructuring of the balance sheet and, where possible, the use of derivative
instruments, such as interest rate swaps. Interest rate risk limits are set in terms of change in economic value.
8.4.1.2.2 Limits
Interest rate risk limits are set in relation to changes in forecast banking book earnings and the economic value. The economic
value sensitivity is calculated as the net present value of aggregate asset cash flows less the net present value of aggregate
liability cash flows.
All assets, liabilities and derivative instruments are allocated to gap intervals based on either their re-pricing or maturity
characteristics. Assets and liabilities for which no identifiable contractual re-pricing or maturity dates exist are allocated to gap
intervals based on behavioural profiling.
The Economic Value of Equity limits are set at a confidence interval of 99.92%. These triggers are set to prompt mitigating
action should interest rate risk in the banking book increase. Such mitigating actions may include transacting interest rate
hedges.
IRRBB is incorporated into the Group’s risk appetite framework through the Earnings at Risk (EaR) metric, one of the key risk
appetite metrics. EaR is calculated by reference to six risk types (Credit Risk, Market Risk, Operational Risk, IRRBB, Liquidity
Risk and Business Risk).
Earnings at Risk are calibrated to represent a financial loss over a one year horizon and provide a directly comparable risk
metric across risk classes, relevant for the annual budget. Earning at risk express the quantum of financial loss the Group is
likely to sustain at the 90th percentile, or 1-in-10 years (i.e. at a 90% confidence interval).
These limits and triggers are part of the stated risk appetite of the Group, and are reviewed annually
8.4.1.2.3 Limit Breaches
Internal limit breaches are monitored by MLRC and are escalated to the RMC, where appropriate remedial actions are
discussed and actioned.
Any breach in the overall EaR risk appetite is managed through the RMC and notified to CapCom. A specific IRRBB EaR breach
is managed by MLRC with oversight by the RMC.

62
8.4.1.3 Banking book interest rate exposure characteristics
The table below indicates the Group’s market value sensitivities to an instantaneous parallel yield curve shock of 200 basis
points, applied to all interest rates, as at 31 December 2018.
Table 24: Market sensitivities to interest rate in the banking book
Underlying Currency Up 2% Down 2%
Impact in ($m) Impact in ($m)
USD 1.23 -1.43
GBP -5.45 4.50
EUR -0.69 0.26
CNH -0.04 0.04
NGN 0.00 0.01
Others -0.01 0.00
8.4.2 Equity Risk in the Banking Book
8.4.2.1 Definition
Equity Risk is the risk of loss arising from a decline in the value of any equity instrument held, whether caused by deterioration
in the performance, net asset, or enterprise value of the issuing entity, or by a decline in the market price of the instrument
itself. For risk governance purposes, Equity Risk is classified into three sub-categories:
‘Subsidiary Equity Risk’, which describes the risk inherent in equity held in any subsidiary, defined as any entity in which
any other Group entity holds a controlling interest for strategic reasons, to deliver Group services to the public, or to
support Group business operations, and for which there was no foreseen intent for disposal at the time of acquisition or
inception.
‘Associate Equity Risk’, which describes the risk inherent in the equity held by any Group entity, in any associate
company or joint venture, which was acquired for strategic purposes, or to support or complement Group business
operations, and for which there was no foreseen intent to dispose of the investment at the time of acquisition.
‘Banking Book Equity Risk’ covers any equity investment not specifically falling into one of the above two categories.
8.4.2.2 Approach to managing equity risk in the banking book
The Group may hold equity positions in the banking book for the purpose of long term investment. As with trading book equity
investments, listed and unlisted investments are approved by the Credit Committee, in accordance with the delegated
authority limits. Periodic reviews and reassessments are undertaken on the performance of the investment.
All instances of Banking Book Equity Risk are notionally regarded as presenting credit risk for management purposes. All
origination, rating, approval, exposure monitoring, and annual review of such equity investments will therefore be managed
under the general ambit of the Credit Risk Policy.
The Group designates financial assets (other than those held for trading) at fair value through profit or loss and in doing so
eliminates or significantly reduces measurement or recognition inconsistencies that would otherwise arise from measuring
financial assets or recognising gains and losses on them on different bases.
The fair value though profit and loss designation, once made, is irrevocable. Subsequent to initial recognition, the fair values
are re-measured and gains and losses arising from changes therein are recognised in other revenue within non-interest
revenue for all undated financial assets. Fair value is based on available market prices or where no prices are available,
appropriate valuation methodologies are applied.
In certain instances, the Group also designates equity positions as non-trading financial assets designated at fair value through
profit and loss.

63
8.4.2.3 Banking book equity portfolio characteristics
Equity investments included in the banking book as at 31 December 2018 consisted entirely of Unlisted Equities ($6.2m as at
31 December 2018). All of the $6.2m equities were non-trading financial assets designated at fair value through profit and
loss, as disclosed in the Annual Financial Statements of the Group. These include equity investments required for business
reasons, such as SWIFT shares and LME shares, which are held to operate the business.
The cumulative net realised gains and losses from the sale or liquidation of equity positions in the banking book in 2018 were
negligible.
Additional disclosures on non-trading financial assets at fair value through P&L are included on page 64 (Note 6) of the
ICBC Standard Bank Plc Consolidated Annual Report 2018. The statement of changes in shareholders’ equity is shown on
page 39.
8.4.3 Foreign Currency Risk in the Banking Book
8.4.3.1 Definition
Foreign currency risk in the banking book is the risk that arises as a result of changes in the fair value or future cash flows of
financial exposures as a result of changes in foreign exchange rates. This excludes foreign exchange risk that is included and
managed in the Trading Book.
8.4.3.2 Approach to foreign currency risk in the banking book
The Group’s policy is not to hold open exposures in respect of the banking book of any significance. Gains or losses on
derivatives that have been designated in terms of cash flow hedging relationships are reported directly in equity, with all other
gains and losses on derivatives being reported in profit or loss.
CapCom manages the strategies for the hedging of the Group’s capital resources where these are denominated in a currency
other than USD, and the hedging of the Group’s cost base where the costs are incurred in currencies other than USD, with a
view to reducing volatility in the Group’s available financial resources and earnings, respectively.
In executing these hedging strategies, CapCom considers the cost, effectiveness and the accounting impact of the proposed
strategies, as well as the economic rationale. CapCom may delegate the execution of transactions within the scope of this
hedging mandate, where appropriate.
CapCom also monitors all capital or cost hedges which have been executed, and reviews the effectiveness of such hedges in
achieving the stated objectives.

64
9. Operational risk
9.1 DEFINITION .......................................................................................................................................................................... 64
9.2 APPROACH TO MANAGING OPERATIONAL RISK ........................................................................................................................... 64
9.3 GOVERNANCE COMMITTEES .................................................................................................................................................... 65
9.4 REGULATORY CAPITAL APPROACH ........................................................................................................................................... 66
9.5 OPERATIONAL RISK SUBTYPES ................................................................................................................................................ 66
9.1 Definition
Operational risk is defined as the risk of loss suffered as a result of the inadequacy of, or a failure in, internal processes,
people and/or systems or from external events.
Operational risk event types are in line with the Basel Event Categories namely:
Business Disruption and System Failure - The risk of losses arising from disruption of business or system failures. This
includes disruption or failure arising from the use of, or reliance on, computer hardware, software, electronic devices,
online networks and internal telecommunications systems and disruption or failure arising from utilities failure, changes in
organisational structure, people and processes.
Damage to Physical Assets - The risk of losses arising from loss or damage to physical assets from natural disaster or
other events. It includes environmental risk.
Execution, Delivery and Process Management - The risk of losses from failed transaction processing or process
management, from relations with trade counterparties and vendors. This also includes tax risk and model risk.
Internal Fraud - The risk of losses due to acts of a type intended to defraud, misappropriate property or circumvent
regulation, the law or company policy, which involves at least one internal party. This also includes financial crime risk.
External Fraud - The risk of losses due to acts of a type intended to defraud, misappropriate property or circumvent the
law, by a third party including theft from transport/warehouse, collusion in the form of theft or misappropriation and
custodian risk.
Clients Products and Business Practices – The risk of losses arising from an unintentional or negligent failure to meet a
professional obligation to specific clients (including fiduciary and suitability requirements), or from the nature or design of
a product. This includes compliance / conduct risks and legal risks.
Employment Practices and Workplace Safety – The risk of losses arising from acts inconsistent with employment, health
or safety laws or agreements regulation.
9.2 Approach to managing operational risk
The Group has developed an Operational Risk Management framework intended to keep the firm within appetite. The
framework comprises:
A formal risk appetite for operational risk that includes both financial and non-financial measures;
Common taxonomies including an event / risk taxonomy; a causal taxonomy and an effect / impact taxonomy;
Operational risk incident / near miss and loss data capture, including root cause analysis;
A portfolio of Key Risk and Control Indicators which are tracked against thresholds;
Risk & Control Self-Assessments to identify and assess the Group’s inherent and residual risks;
Scenario Analysis, to assess the Group’s exposure to “severe but plausible” events;

65
Purchasing insurance to transfer specific operational risks (see below);
Tracking of remedial actions;
Targeted reviews;
Induction training and annual awareness training; and
Review of external events (the Group subscribes to ORX’s news service), in order to learn lessons and to assist with
Scenario Analysis.
The Operational Risk Management function is independent from business line management and is part of the second line of
defence i.e. it reports directly into the Chief Risk Officer. It is responsible for:
Developing and maintaining the operational risk governance framework;
Facilitating business’ adoption of the framework;
Overseeing and reporting, as well as, monitoring and challenging the management of the operational risk profile; and
Identifying emerging threats
Additionally, an independent team, reporting directly to the Chief Risk Officer, has responsibility for second line assurance of
the Physical Commodities business. The function based in London and Shanghai manages physical commodities transactions
executed within the Group. The role of the team is to focus on the risks embedded in each trade, on a pre- and post-trade
basis, and to ensure they are understood, tracked, controlled and escalated if appropriate. The team works with approved third
parties who play a key role in the provision of related services such as shipbrokers, insurers, warehouse providers and security
companies.
The Group buys insurance to mitigate operational risk. This cover is reviewed on an annual basis.
Ensuring that appropriate insurance cover for specific risks is in place is the first line’s responsibility. The Group’s Insurance
Forum provides independent oversight and challenge.
9.3 Governance committees
The Operational Risk Committee is responsible for monitoring and reviewing exposures to operational risk and for providing
focused and corrective oversight of Operational Risk Management across ICBCS, in line with agreed ICBCS risk appetite.
Key responsibilities of the Operational Risk Committee include:
Ensuring the Operational Risk framework is fit for purpose and adequately embedded in the ICBCS legal entity and across
international locations
Promoting a robust control and Operational Risk Management culture via the three lines of defence model
Reporting potential breaches of operational risk appetite and tolerance
Monitoring and ensuring the appropriate levels of quality control are applied by support infrastructure
Reviewing the impact of new products and the capacity of the infrastructure to handle them
Reviewing the effectiveness of the business support areas and infrastructure groups and evaluating the impact of any
changes on operational risk
Ensuring that an effective Business Continuity Planning process is in place for all business units in all locations of the
business, supported by the Group’s standards and procedures.

66
9.3.1 Business Continuity Management Framework
Business Continuity Management (BCM) is a critical part of ICBCS’s (‘the Group’s’) control environment and enables our
business units to effectively continue critical business functions following significant disruption. BCM is regarded as having
three distinct purposes:
Protection of the company assets, earning capacity, information, reputation, the brand and value of the organisation.
Reduction in the likelihood and impact of potential business interruption(s) to an acceptable level and to ensure that we
have a resilient organisation.
Compliance with Legal and Regulatory obligations
The Business Continuity capability that the Group maintains and continues to develop is relative to the nature, scale and
complexity of the organisation and is aligned to external best practice. The Group has a Crisis Management Team (CMT)
supported by a Crisis Management Plan (CMP) that is chaired by senior management. The primary responsibility of this team is
to lead, manage and communicate the overall response to a crisis. The CMT are supplemented by a number of functional
specialists, who are experts within specific areas e.g. Disaster Recovery, Human Resources, and Corporate Communications.
During any material business interruption, one of the Group’s key objectives will be to proactively communicate its position with
clients and stakeholders in an expedient fashion. Existing under the direction of the CMT are a number of departmental
Business Recovery Teams) and associated Business Continuity Plans (BCPs) which are responsible for delivering the recovery
of critical business processes, within pre-defined timescales. The Group has a number of recovery strategies and solutions in
place to respond to a business interruption including but not limited to:
Third Party Work Area Recovery
Remote Working
Virtual Transfer of operations
Reciprocal arrangements with other ICBC Standard Bank offices
9.3.2 Scope of Risk Reporting Systems
The Operational Risk function uses an in-house developed Operational Risk Management system for recording:
Operational risk loss events and near misses;
Key Risk and Control Indicators and the associated thresholds;
Risk & Control Self-Assessments;
Remedial actions.
Operational risk reporting is provided to the Operational Risk Committee and Risk Management Committee on a monthly basis
and to the Board Risk Management Committee on a quarterly basis.
All incidents are rated and the escalation within the Group reflects these ratings. The Operational Risk function reviews all
incidents to validate the appropriateness of the ratings and any resulting remedial actions
9.4 Regulatory capital approach
The ICBCS Group calculates its Pillar 1 operational risk capital requirement under The Standardised Approach (TSA). This
approach is known not to be risk sensitive. In particular TSA does not adequately reflect either emerging risks or the very
remote risks associated with the bank’s commodities’ business. Consequently, the bank additionally uses an internal model to
calculate its Operational Risk utilising both internal and external loss data, as well as the outputs of scenario analysis, with
consideration for the bank’s Business Environment and Internal Control Factors. In assessing the appropriateness of its
capital, the bank considers the effectiveness of its various insurance policies in mitigating specific operational risks. These
insurance policies cover a range of risks, and include, goods and cargo insurance for physical commodities; crime; and
environmental risks.

67
9.5 Operational risk sub-types
Given the broad and diverse nature of the above definition, there are specialist operational risk sub-types which are governed
under specific policies or equivalent documents and are enforced through independent dedicated specialist functions. These
are:
9.5.1 Information Technology Risk Management
Information Technology Risk is the risk associated with the use, ownership, operation, involvement, influence and adoption of
Information Technology within the Group. It consists of Information Technology related events and conditions that could
potentially impact the business by impacting service availability, performance or function.
9.5.2 Information Risk Management
Information Risk is the risk of accidental or intentional unauthorised use, modification, disclosure or destruction of information
resources, which would compromise the confidentiality, integrity or availability of information and which could potentially harm
the business. This risk principally concerns electronic information and data however it also covers hardcopy formats.
9.5.3 Model Risk Management
Model risk arises from potential weaknesses in a model that is used in the measurement, pricing and management of risk.
These weaknesses include incorrect assumptions, incomplete information, flawed implementation, limited model
understanding, inappropriate use or inappropriate methodologies leading to incorrect conclusions by the user.
Model Risk is focused on “three pillars”
1. Correctness of the mathematics and implementation of the model.
2. Applicability of the model, including all the assumptions and approximations relative to a model’s usage.
3. Data i.e. the impact of subjectivity and uncertainty around employed data, e.g. for calibration of the model
Internal credit risk based (IRB) models and operational risk capital models are validated at initial development and at least
annually thereafter by the SBG validation function. All models validated by SBG under an SLA are subject to review and
approval through the ICBCS Risk Methodologies Approval Committee.
Other models are validated at initial development and reviewed at fixed intervals or intervals determined by materiality and
performance criteria. Validation techniques test the appropriateness and effectiveness of the models, and indicate if the model
is fit-for-purpose.
Models are recommended by the relevant technical committee for approval or ongoing use to the relevant model approval
committee.
9.5.4 Tax Risk Management
Tax risk is the risk of financial or other loss resulting from (among others) the following:
An incorrect technical position being taken on the treatment of any item in the tax return and / or forming part of the
calculation of a tax liability;
Tax authority challenge of a filed position taken in a tax return;
Failure to submit a tax return or to make a tax payment within the relevant statutory deadline;
Errors in the computation of a tax liability or in the submitted return;
Change in tax law or practice affecting a filed position;
Operational / process errors in the computation of the Group’s tax assets or liabilities;
Missing claims / elections / deadlines, etc.; and

68
Incorrect financial accounting information being used in the tax return or the calculation of a tax liability.
The approach to tax risk is governed by policies dealing with specific aspects of tax risk such as, for example, transfer pricing,
indirect taxes, withholding taxes and remuneration taxes.
9.5.5 Legal Risk Management
Legal Risk is risk of any of the following descriptions, namely:
That business is or may be carried on otherwise than in accordance with applicable laws and regulations;
That contractual arrangements either are or may not be binding or enforceable as intended against counterparties or are
or may be binding or enforceable against the Group otherwise than as intended; and
That property rights of any descriptions are or may be infringed; or that liability to others may be incurred
9.5.6 Compliance Risk Management
This is the risk of legal or regulatory sanctions, financial loss or loss to reputation that the Group may suffer as a result of its
failure to comply with laws, regulations, codes of conduct and standards of good practice applicable to its business activities.
This includes the exposure to new laws as well as changes in interpretations of existing laws by appropriate authorities.
The approach to managing compliance risk is proactive and premised on internationally accepted principles of compliance risk
management. A robust risk management reporting and escalation procedure requires business unit and functional area
compliance heads to report on the status of compliance risk management in the Group.
Employees, including their senior management, are made aware of their statutory compliance responsibilities through ongoing
training and awareness initiatives.
9.5.6.1 Conflicts of Interest Policy
The Group conducts its business according to the principles that (i) it must take all appropriate steps to identify and to prevent
or manage conflicts of interest that may arise in the course of the Group conducting its business and (ii) it maintains and
operates effective organisational and administrative arrangements designed to prevent such conflicts of interest
The Group’s conflict of interest policy details the Group’s control framework that is designed to help staff identify and to
prevent or manage conflicts of interest as well as examples of the types of conflicts of interest that could arise within their
department/business units.
9.5.7 Financial Crime Risk Management
Financial Crime Risk consists of:
(i) The risk that criminal parties will abuse the products and services of the Group;
(ii) The risk that regulators/law enforcement authorities will apply civil sanctions, civil penalties and/or criminal penalties
against the Group for failure to comply with Anti-Money Laundering, Counter Terrorist Financing, Anti-Bribery & Corruption, Tax
Evasion, Fraud and Sanctions laws, regulations, codes of conduct and regulatory/industry standards of good practice that are
applicable to the Group’s activities; and
(iii) The risk that through the markets and/or through media outlets, the good reputation of the Group is harmed by
unfavourable adverse media or market word-of-mouth, as a result of financial crime risk events, allegations, or the actions of
regulators/law enforcement authorities
9.5.7.1 Approach to Managing Money Laundering and Terrorist Financing
Legislation pertaining to money laundering and terrorist financing control imposes significant requirements in terms of
customer due diligence, record keeping, staff training and the obligation to detect, prevent and report suspected money
laundering and terrorist financing.

69
Minimum standards are required to be implemented throughout the Group, taking into account local jurisdictional
requirements where these may be more stringent.
9.5.7.2 Approach to managing Bribery and Corruption Risk
Bribery and corruption risk arises as a result of a failure by the Group to prevent persons performing services for or on its
behalf (including staff, business partners and stakeholders) from bribing in order to obtain business or business benefits for
the Group, or as a result of failing to have effective anti-bribery and corruption procedures in place. The Group has
implemented a programme of policies, procedures and other controls to combat bribery and corruption risk.
9.5.7.3 Approach to managing Fraud Risk (Internal and External)
Fraud Risk arises where internal or external parties (or a combination) commit acts intended to defraud, misappropriate
property or circumvent anti-fraud laws or internal policies. The Group has implemented procurement-related controls, as well
as wider financial controls intended to combat fraud.
9.5.7.4 Approach to managing Sanctions Risk
The Group actively manages the legal, regulatory, reputational and operational risks associated with doing business in
jurisdictions or with clients that are subject to embargoes or sanctions imposed by competent authorities. The Financial Crime
Compliance team is responsible for providing advice on all sanctions-related matters in a fluid sanctions environment.
9.5.7.5 Approach to managing Tax Evasion Risk
The risk of the criminal facilitation of tax evasion arises when an associated person of the Group knowingly and dishonestly
assists a person or entity in illegally evading taxes. The Group has various policies and procedures in place that mitigate the
risk of the criminal facilitation of tax evasion, including the Tax Strategy which prohibits any member of Staff from providing tax
advice to clients.
9.5.8 Change Risk Management
Change Risk is defined as a risk that emerges through changes, updates or alterations made to operational processes across
the Group due to changes in people, process or technology. Change, whether internal in the form of people, process and
technology or external in the form of market conditions or regulations, is a significant driver of operational risk.
Significant change is approved through the Integration and Change Committee which has representation from across business
areas. Once approved, projects have dedicated steering committees and project managers which ensure appropriate testing
and due diligence has been performed before go-live. Post implementation reviews are performed to assess whether there
were any lessons to be learnt for future initiatives.
9.5.8.1 Approach to Managing Regulatory Change
The Group operates in a highly regulated industry across multiple jurisdictions and is increasingly subject to international
legislation with extra-territorial reach.
The Group aims to embed regulatory best practice in our operations in a way that balances the interests of various
stakeholders, while supporting the long-term stability and growth in the markets where we have a presence.
The Group regularly assesses the impact that emerging policy and regulation will have on the business. The approach adopted
is to engage with government policymakers, legislators and regulators in a constructive manner.
9.5.9 Environmental Risk Management
Environmental risk is the risk of financial loss suffered due to environmental damage resulting directly from the bank’s
activities, products and services. Environmental risk is primarily relevant in relation to the bank’s Energy business.

70
10. Leverage
10.1 FACTORS THAT HAD AN IMPACT ON THE LEVERAGE RATIO DURING 2018 ...................................................................................... 70
10.2 APPROACHES TO MANAGING THE RISK OF EXCESSIVE LEVERAGE ................................................................................................ 70
The leverage ratio was introduced as a non-risk based capital requirement to complement the risk-based capital requirements.
The ratio is generally based on the accounting value as the relevant exposure measure for assets. Specific regulatory exposure
measures which apply to derivatives and securities financing transactions and off-balance sheet exposures must be added to
determine the total leverage exposure.
The amended Article 429 of the CRR specifies the methodology that banks are required to adopt for calculating the leverage
ratio, as per the EU’s latest Delegated Act no. 2015/62 of 10 October 2014. The publication of the ratio is mandatory under
the CRR disclosure requirements.
An observation period had been introduced for the leverage ratio running from 2014 to 2017 to monitor the components and
the behaviour of the leverage ratio relative to the requirements based on risk. The European Commission was then required to
report to the European Parliament and Council and put forward a regulatory proposal covering the methods for applying and
calculating the ratio. The proposals for the introduction of a binding leverage ratio were included in the revised proposals for
the amended Capital Requirements Regulation issued in November 2016, which is yet to be finalised. Firms will be expected to
continue to manage the risks of excessive leverage until the ratio becomes binding. The group is not expected to be subject to
binding leverage ratio regulatory requirements until 2021, but remains above the scheduled minimum requirement of 3%.
The leverage ratio is defined as the Tier 1 capital divided by the exposure measure, i.e. balance sheet and off-balance-sheet
assets after certain restatements of derivatives, intragroup transactions, and securities financing transactions, items deducted
from the numerator, and off-balance-sheet items. At 31 December 2018, ICBCS’s leverage ratio stood at 5.02%.
The template in Annex D shows the breakdown of the leverage ratio exposure for ICBCS.
A breakdown of the on balance sheet exposures used in the leverage ratio calculation and the reconciliation of the accounting
balance sheet to the leverage ratio exposure measure are also shown in the appendix.
10.1 Factors that had an impact on the leverage ratio during 2018
The leverage ratio increased from 4.91% to 5.02%. The balance sheet assets declined at a higher relative rate to Tier 1 capital,
primarily due to a decrease in cash balances placed at the Bank of England, a reduction in derivative exposure and a reduction
in reverse repurchase agreements in 2018. The reduction in Tier 1 Capital is a result of losses for the year 2018.
10.2 Approaches to managing the risk of excessive leverage
The ICBCS Group aims to ensure that the leverage ratio always remains above the prescribed regulatory minimum, by actively
monitoring and managing the quantity of capital and exposures within the firm. The ICBCS leverage ratio is monitored by
CapCom on a monthly basis and is subject to an Early Warning Indicator (EWI) framework. The EWI framework ensures that the
Group maintains adequate capital to withstand the impact of the risks that may arise under the stressed conditions analysed
by the Group.
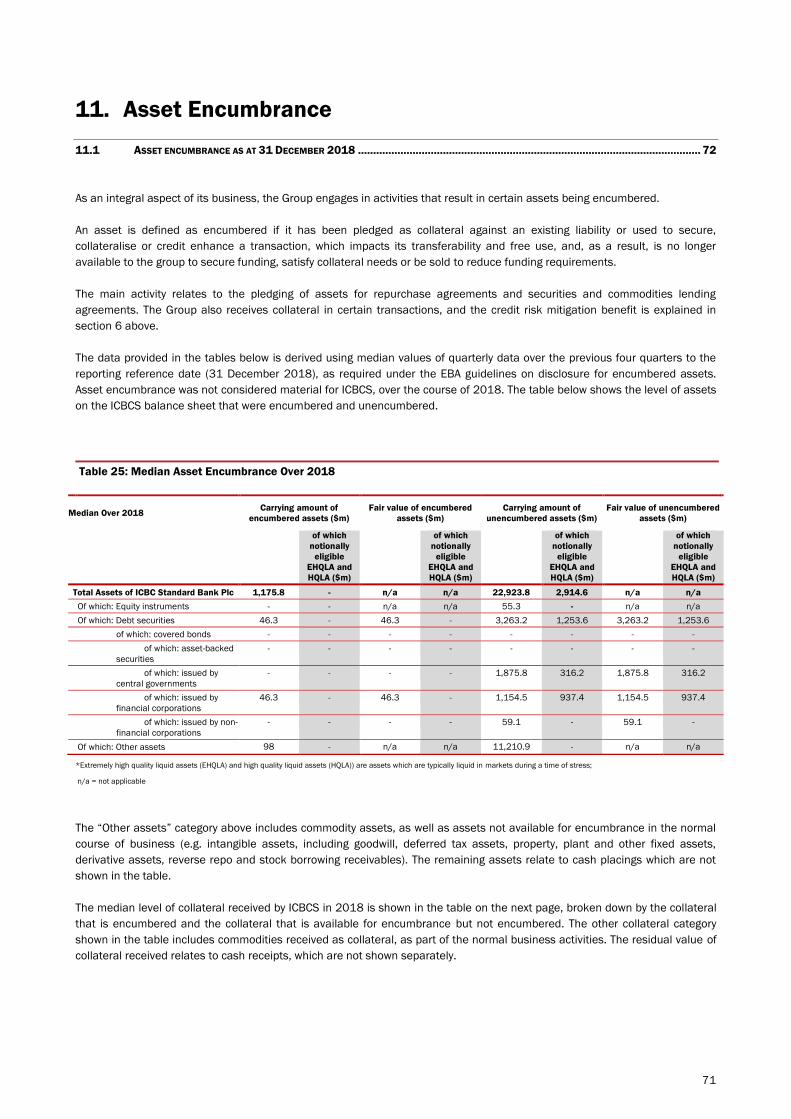
71
11. Asset Encumbrance
11.1 ASSET ENCUMBRANCE AS AT 31 DECEMBER 2018 ................................................................................................................. 72
As an integral aspect of its business, the Group engages in activities that result in certain assets being encumbered.
An asset is defined as encumbered if it has been pledged as collateral against an existing liability or used to secure,
collateralise or credit enhance a transaction, which impacts its transferability and free use, and, as a result, is no longer
available to the group to secure funding, satisfy collateral needs or be sold to reduce funding requirements.
The main activity relates to the pledging of assets for repurchase agreements and securities and commodities lending
agreements. The Group also receives collateral in certain transactions, and the credit risk mitigation benefit is explained in
section 6 above.
The data provided in the tables below is derived using median values of quarterly data over the previous four quarters to the
reporting reference date (31 December 2018), as required under the EBA guidelines on disclosure for encumbered assets.
Asset encumbrance was not considered material for ICBCS, over the course of 2018. The table below shows the level of assets
on the ICBCS balance sheet that were encumbered and unencumbered.
Table 25: Median Asset Encumbrance Over 2018
Median Over 2018 Carrying amount of
encumbered assets ($m)
Fair value of encumbered
assets ($m)
Carrying amount of
unencumbered assets ($m)
Fair value of unencumbered
assets ($m)
of which
notionally
eligible
EHQLA and
HQLA ($m)
of which
notionally
eligible
EHQLA and
HQLA ($m)
of which
notionally
eligible
EHQLA and
HQLA ($m)
of which
notionally
eligible
EHQLA and
HQLA ($m)
Total Assets of ICBC Standard Bank Plc 1,175.8 - n/a n/a 22,923.8 2,914.6 n/a n/a
Of which: Equity instruments - - n/a n/a 55.3 - n/a n/a
Of which: Debt securities 46.3 - 46.3 - 3,263.2 1,253.6 3,263.2 1,253.6
of which: covered bonds - - - - - - - -
of which: asset-backed
securities
- - - - - - - -
of which: issued by
central governments
- - - - 1,875.8 316.2 1,875.8 316.2
of which: issued by
financial corporations
46.3 - 46.3 - 1,154.5 937.4 1,154.5 937.4
of which: issued by non-
financial corporations
- - - - 59.1 - 59.1 -
Of which: Other assets 98 - n/a n/a 11,210.9 - n/a n/a
*Extremely high quality liquid assets (EHQLA) and high quality liquid assets (HQLA)) are assets which are typically liquid in markets during a time of stress;
n/a = not applicable
The “Other assets” category above includes commodity assets, as well as assets not available for encumbrance in the normal
course of business (e.g. intangible assets, including goodwill, deferred tax assets, property, plant and other fixed assets,
derivative assets, reverse repo and stock borrowing receivables). The remaining assets relate to cash placings which are not
shown in the table.
The median level of collateral received by ICBCS in 2018 is shown in the table on the next page, broken down by the collateral
that is encumbered and the collateral that is available for encumbrance but not encumbered. The other collateral category
shown in the table includes commodities received as collateral, as part of the normal business activities. The residual value of
collateral received relates to cash receipts, which are not shown separately.
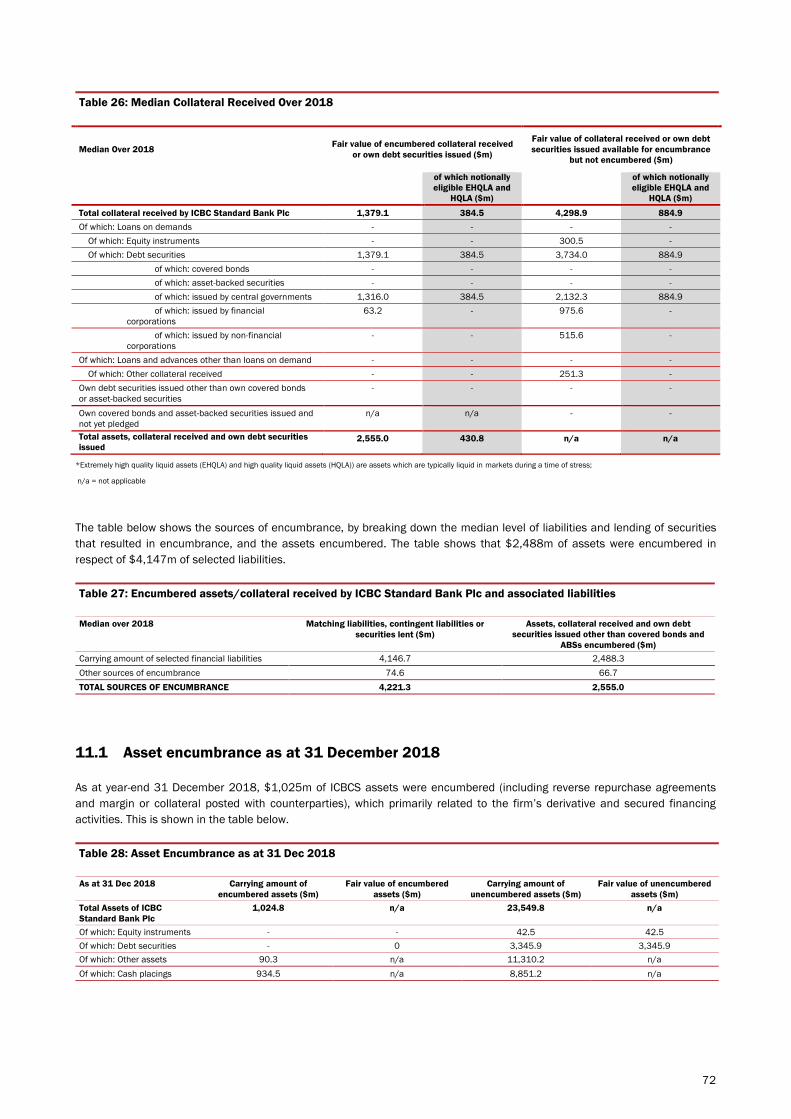
72
Table 26: Median Collateral Received Over 2018
Median Over 2018 Fair value of encumbered collateral received
or own debt securities issued ($m)
Fair value of collateral received or own debt
securities issued available for encumbrance
but not encumbered ($m)
of which notionally
eligible EHQLA and
HQLA ($m)
of which notionally
eligible EHQLA and
HQLA ($m)
Total collateral received by ICBC Standard Bank Plc 1,379.1 384.5 4,298.9 884.9
Of which: Loans on demands - - - -
Of which: Equity instruments - - 300.5 -
Of which: Debt securities 1,379.1 384.5 3,734.0 884.9
of which: covered bonds - - - -
of which: asset-backed securities - - - -
of which: issued by central governments 1,316.0 384.5 2,132.3 884.9
of which: issued by financial
corporations
63.2 - 975.6 -
of which: issued by non-financial
corporations
- - 515.6 -
Of which: Loans and advances other than loans on demand - - - -
Of which: Other collateral received - - 251.3 -
Own debt securities issued other than own covered bonds
or asset-backed securities
- - - -
Own covered bonds and asset-backed securities issued and
not yet pledged
n/a n/a - -
Total assets, collateral received and own debt securities
issued 2,555.0 430.8 n/a n/a
*Extremely high quality liquid assets (EHQLA) and high quality liquid assets (HQLA)) are assets which are typically liquid in markets during a time of stress;
n/a = not applicable
The table below shows the sources of encumbrance, by breaking down the median level of liabilities and lending of securities
that resulted in encumbrance, and the assets encumbered. The table shows that $2,488m of assets were encumbered in
respect of $4,147m of selected liabilities.
Table 27: Encumbered assets/collateral received by ICBC Standard Bank Plc and associated liabilities
Median over 2018 Matching liabilities, contingent liabilities or
securities lent ($m)
Assets, collateral received and own debt
securities issued other than covered bonds and
ABSs encumbered ($m)
Carrying amount of selected financial liabilities 4,146.7 2,488.3
Other sources of encumbrance 74.6 66.7
TOTAL SOURCES OF ENCUMBRANCE 4,221.3 2,555.0
11.1 Asset encumbrance as at 31 December 2018
As at year-end 31 December 2018, $1,025m of ICBCS assets were encumbered (including reverse repurchase agreements
and margin or collateral posted with counterparties), which primarily related to the firm’s derivative and secured financing
activities. This is shown in the table below.
Table 28: Asset Encumbrance as at 31 Dec 2018
As at 31 Dec 2018 Carrying amount of
encumbered assets ($m)
Fair value of encumbered
assets ($m)
Carrying amount of
unencumbered assets ($m)
Fair value of unencumbered
assets ($m)
Total Assets of ICBC
Standard Bank Plc
1,024.8 n/a 23,549.8 n/a
Of which: Equity instruments - - 42.5 42.5
Of which: Debt securities - 0 3,345.9 3,345.9
Of which: Other assets 90.3 n/a 11,310.2 n/a
Of which: Cash placings 934.5 n/a 8,851.2 n/a

73
The total collateral received which was available for encumbrance is shown in the table below, split by assets that were
encumbered and those that remain available for encumbrance.
Of the $5,628m of debt and equity instruments received as collateral that were available for encumbrance, $1,107m of
securities were pledged onwards. This is shown in the table below. A significant majority of the $1,107m collateral that was
encumbered related to matched-book activity where reverse repurchase agreements are matched by repurchase agreements
entered into to facilitate client activity.
Table 29: Collateral received by ICBC Standard Bank Plc as at 31 Dec 2018
As at 31 Dec 2018 Fair value of encumbered collateral received or
own debt securities issued ($m)
Fair value of collateral received or own debt
securities issued available for encumbrance ($m)
Total collateral received by ICBC Standard Bank
Plc
1,107.2 4,666.1
Of which: Equity instruments - 253.7
Of which: Debt securities 1,107.2 4,266.7
Of which: Other collateral received - 145.7
Of which: Cash received - -
Own debt securities issued other than own covered
bonds or ABSs
- -
The asset encumbrance ratio as at year-end 31 December 2018 was 7.02% as shown below.
Table 30: Asset Encumbrance Ratio
Encumbered Assets and Collateral 31-Dec-18
Encumbered Assets 1,024.8
Encumbered Collateral Received 1,107.2
Total Encumbered Assets and Collateral (A) 2,131.9
Total Assets and Collateral
Total Assets of ICBCS (Encumbered and Unencumbered) 24,574.5
Total Collateral Received by ICBCS (Encumbered & Available for Encumbrance) 5,773.4
Total Assets and Collateral Received (B) 30,347.9
Asset Encumbrance Ratio (A/B) 7.02%
Additional disclosures on pledged and encumbered financial assets are included on pages 122 (notes 39 and 40) of the
ICBC Standard Bank Plc Consolidated Annual Report 2018.

74
12. Remuneration
12.1 MATERIAL RISK TAKERS........................................................................................................................................................ 74
12.2 REMUNERATION PHILOSOPHY ................................................................................................................................................. 74
12.3 REWARD FRAMEWORK .......................................................................................................................................................... 75
12.4 REMUNERATION COMMITTEE.................................................................................................................................................. 76
12.5 REMUNERATION POLICY GOVERNANCE .................................................................................................................................... 76
12.6 REMUNERATION STRATEGY .................................................................................................................................................... 76
12.7 ANALYSIS OF 2018 REMUNERATION ...................................................................................................................................... 77
These disclosures contain remuneration awards made by ICBC Standard Bank Plc Group (the “Group”) for the 62 (including
non-executives and leavers) employees deemed Material Risk Takers (MRTs) in respect of the 2018 performance year and
provide a summary of the Group’s decision-making policies.
12.1 Material Risk Takers
Identification of MRTs, historically referred to as “Code Staff”, is based on definition provided under the European Banking
Authority (EBA) regulatory technical standards EU Regulation No 604/2014, and is a combination of qualitative and
quantitative criteria.
Qualitative criteria is role-based for employees who are assessed as having a material impact on the firm’s risk profile
Quantitative criteria includes employees with total compensation of €500,000 or more in the previous financial year,
individuals who are in the top 0.3% earning employees in the previous financial year and individuals whose total
remuneration in the previous financial year was higher than that of the lowest paid MRT in the same category.
Roles classified as MRTs include:
Senior Leadership (including Supervision, Management and Governance)
Members of committees managing risk
Individuals with management responsibility reporting directly to the head of a “material” business unit or to the respective
heads of risk, compliance and internal audit
Other designated roles
12.2 Remuneration Philosophy
The Group’s remuneration philosophy adopts the principle that an individual’s compensation should be determined after
taking into account a number of factors. These include individual performance (comprising financial and non-financial
measures), the overall performance of the employee’s business unit and the overall performance of ICBCS Group.
The remuneration policy is designed to be both competitive and compliant with regulatory requirements and ensure that an
assessment of risk is a key element of the policy and process. The compensation structure as a whole is designed to deliver a
globally consistent compensation structure reflective of local market pay and the role and experience of the individual. It is
also designed to have transparency for the individual, with linkage to business, team and their own performance.
A strategic focus of the remuneration philosophy is to implement designs and practices that only reward value delivered on a
pay for performance basis within the context of control management and sustainability, adjusted appropriately for risk
assumed. Additionally, it should offer competitive remuneration in the global marketplace for skills and seek to reward all its

75
employees in a manner that is fair, both to the individual and to shareholders, while avoiding a bonus-centric culture that
distorts motivations and may encourage excessive risk-taking. A final vital component of the remuneration strategy is that
scheme designs and performance evaluation processes must recognise strong and sustained performance within teams whilst
being forward looking to motivate for business plan delivery.
12.3 Reward Framework
The reward framework comprises the following key elements:
Base salary;
Employee benefits; and
Annual discretionary incentive (including both cash and deferred elements);
These three elements are managed together to ensure that total reward is appropriate and aligned with our business
objectives, strategy and risk appetite.
Base salaries are set by reference to market rates and reviewed, although not necessarily changed, annually. Increases are
typically to ensure appropriate pay positioning relative to the market range and relative pay of others doing the same or similar
role.
Benefits are designed to be market competitive and assist employees in making appropriate health and lifestyle decisions and
in managing personal risk. It is important that these elements of “fixed” pay are market competitive to attract and retain
employees in the long-term interests of the business.
Annual discretionary incentive awards (both cash and deferred) are based on an individual’s performance and contribution -
both what is delivered and how it is delivered. Discretionary incentives are awarded for delivering against agreed objectives
(both financial and non-financial), and recognising when employees go above and beyond the call of duty in terms of efforts
and/or results. Awards whilst primarily recognising past performance should also be forward looking and motivate for business
plan delivery and retention. Discretionary incentive awards are based on the performance of the Group, business unit, team
and individual.
Funding for discretionary incentives awards is determined annually following consideration of risk-adjusted results. The Group
does not operate any desk based or business unit formulae based compensation plans and all discretionary incentives are
funded from centrally determined (following consideration of risk-adjustment) pools for each of the business units and
supporting functions.
A proportion of discretionary incentive compensation is deferred over a three, five or seven year period via awards under the
ICBCS Quanto Plan. The objective of the deferral is to ensure that employees have a proportion of their compensation “at risk”
for an extended period [and also enables ICBCS to comply with regulatory requirements including deferral, malus and
clawback]. Additionally, it reinforces the alignment of interests between employees and shareholders as a consequence of the
linkage to the share price of ICBC (as listed on the Hong Kong Exchange) – the value of units in the ICBCS Quanto Plan moves
in step with the ICBC share price performance, ensuring that the value of the deferral is linked to overall performance of
ICBC.
The combination of inputs to the individuals’ performance assessment, the subsequent compensation award decision and the
extended deferral programme all seek to generate risk behaviours that are aligned with our values, our firm-wide risk appetite
and focused on managing risk over a multi-year period. This provides clear linkage and transparency for the individual between
the ICBC share price performance, the impact of business units, and ultimately the value of the individual’s deferred
compensation.

76
12.4 Remuneration Committee
The members of the Remuneration Committee (Remco) during 2018 were Mr R U Weerasekera (Chairman) Ms J E Eden, Mr B J
Kruger, Mr W Wang, Mr L Wang and Mr R Han.
During 2018, the Committee met five times and considered the following principal matters:
Remuneration philosophy including fixed pay ratios and strategic performance goals (Balanced Scorecard, weightings and
metrics)
Approval of senior executive appointments
Determination of bonus pools based on Group performance within the context of control management and sustainability,
adjusted appropriately for risk assumed
Bonus and salary awards for key executives
Approval of remuneration and terms of service that fall within the Committee’s terms of reference
With effect from FY2018 ICBCS became a “Proportionality Level 2 Firm” for the purposes of the Remuneration part of the PRA
Rulebook and SYSC 19D of the FCA Handbook. Mercer Kepler as independent remuneration consultants to the Remuneration
Committee have supported the Group throughout 2018 with a review of its remuneration policy and structure as part of the
transition from a Level 3 to a Level 2 regulated UK bank.
Additional disclosures on remuneration are included on pages 25-26 and 88-90 of the ICBC Standard Bank Plc
Consolidated Annual Report 2018.
12.5 Remuneration Policy Governance
The governance of remuneration policy including policies, structures and practices is delegated to the ICBCS Remuneration
Committee (RemCo). There are no sub committees of the Remuneration Committee.
The RemCo include representatives from Board Audit and Risk Management Committees who bring their relevant experience
to the process. The RemCo are comprised of executives who have experience in evaluating risk and the requirements of the
Group to operate commercially and sustainably in a competitive environment. Members of the RemCo attend the ICBCS Board
meetings where the results of the Risk Committee are summarised and shared with the Board. This communication plus the
membership of the committees ensures that ICBCS’s RemCo can arrive at a decision on the discretionary incentive pool after
full consideration of the risk profile of the Group.
12.6 Remuneration Strategy
As a means of developing the Group’s human capital, RemCo annually reviews its remuneration policies, structures and
practices, to ensure the principles behind the reward strategy and the elements of the strategy itself, are effective.
The Group’s remuneration strategy includes the following:
Reward strategies and remuneration down to an individual level must enable the ICBCS Group, in a highly competitive
environment, to attract, motivate and retain high-calibre people at all levels of the organisation.
Remuneration designs must motivate strong and sustained performance in teams, but also promote risk management in
line with the ICBCS Group’s stated strategy and risk tolerance.
The balance between fixed and variable pay is appropriately structured according to seniority and roles, with particular
care being given to risk and control areas. The intention is to provide both total compensation, and its composition, at
market-competitive levels, drawing on relevant information from various sources, including external advisers.
RemCo annually approves the ICBCS Group’s bonus pools and oversees the principles applied in allocating these pools to
business units and individual employees. These pools are shaped by a combination of ICBCS Group and business unit

77
profitability and multi-year financial metrics, taking account of capital utilised, risks assumed and an evaluation of the
business area’s future development and growth prospects.
Individual performance is measured according to an appropriate range of absolute and relative criteria, including the
person’s quantitative delivery against specific metrics, qualitative individual behaviour and competitive performance. This
measurement is integral to our pay for performance remuneration practices and underpins strong differentiation in
individual pay.
A portion of annual discretionary incentive, typically above a certain threshold, is deferred into a vehicle with multi-year
vesting and malus (forfeiture) provisions. Clawback also applies to awards where required under the FCA/PRA regulations.
A significant portion of senior management reward is awarded in deferred instruments.
No remuneration schemes are linked by formula to revenue generation.
No multi-year guaranteed minimum bonus arrangements are permitted.
Transparency on remuneration designs and processes is maintained with employees and increasingly with shareholders.
Wherever available and relevant, market information is used to inform remuneration decisions.
Stakeholders must be enabled to make a reasonable assessment of reward practices, and members of Remco have
unrestricted access to information that informs their independent judgements on the possible effects that remuneration
may have on compliance with risk, regulatory and behavioural controls across the Group.
The Group aims to pay competitively against the local market for both fixed and variable compensation, but also needs to
ensure positioning against local markets is fair across geographies.
This strategy forms the basis for reward processes within the Group and all reward designs and practices are consistent with
this strategy.
12.7 Analysis of 2018 Remuneration
The table below shows the analysis of remuneration paid and awarded to MRTs, split between the fixed and variable amounts.
Table 31: Remuneration to MRTs
Performance Year 2018 Performance Year 2017
Performance Year 2018 Senior
Management
FICE Commodities Investment
Banking
Other Total Senior
Management
FICE Commodities Investment
Banking
Other Total
Number of MRTs 17 10 7 2 26 62 16 16 7 6 34 79
Base Salary ($'m) 9.1 4.4 2.8 0.8 4.9 21.9 7.4 5.5 2.2 2.2 6.3 23.7
Variable compensation ($'m) 10.0 6.0 3.9 0.4 2.3 22.6 13.2 9.6 3.5 1.4 3.4 31.0
Of which: Cash ($’m) 4.8 3.1 1.8 O.2 1.4 11.3 8.1 6.2 2.4 1.2 3.1 21.0
Deferred Cash ($’m) 2.6 1.5 1.0 0.1 0.5 5.6 2.5 1.7 0.5 0.1 0.1 5.0
Deferred Shares ($’m) 2.6 1.5 1.0 0.1 0.5 5.6 2.5 1.7 0.5 0.1 0.1 5.0
Notes: Base salary includes fees for Non-Executive Directors where appropriate.

78
12.7.1 Outstanding Deferred Remuneration
The analysis of the deferred remuneration for MRTs is shown below (amount shown in $m).
Table 32: Deferred Remuneration to MRTs
Performance Year 2018 Performance Year 2017
Category of Deferred
Remuneration ($’m)
Senior
Management
FICE Commodities Investment
Banking
Other Total Senior
Management
FICE Commodities Investment
Banking
Other Total
Unvested from prior year* 14.1 6.0 3.3 0.1 1.0 24.5 14.7 4.2 3.6 0.4 1.4 24.4
Awarded during the financial
year
5.2 2.9 2.0 0.2 0.9 11.3 5.0 3.4 1.1 0.2 0.3 10.0
Paid out 3.8 1.0 1.0 0.0 0.3 6.2 4.9 1.1 1.2 0.1 0.6 7.9
Unvested at year end 15.5 7.9 4.3 0.2 1.6 29.5 14.9 6.5 3.4 0.5 1.1 26.5
* Includes unvested historic awards for individuals that were classified as MRT in FY18 but NOT in FY17
Notes:
There may be a disconnect between the closing position on the FY2017 table and the opening position of the FY2018 table caused by:
- the inclusion of unvested historic awards for individuals that were classified as MRT in 2018 but were not identified as MRTs in 2017;
- change of MRT status in FY2018 relative to the prior year; and
- leavers who were not granted "good leaver" status and therefore forfeited their awards
12.7.2 Remuneration by band
The European capital requirements regulation (CRR) requires the disclosure of the total remuneration over EUR 1 million paid
to MRTs by band (Euros). Of the 62 MRTs, 14 MRTs received total remuneration of over EUR 1 million. The breakdown is
shown below.
Table 33: Remuneration Bands
No. of Employees
Remuneration > €1m 2018 2017
EUR 1m -1.5m 12 8
EUR 1.5m -2m 0 2
EUR 2m -2.5m 1 1
EUR 2.5m -3m 1 0
EUR 3m -3.5m 0 0
EUR 3.5m -4m 0 2
EUR >4m 0 0
Total 14 13
12.7.3 Sign on and severance payments
There were no severance payments, sign-on payments or guaranteed incentives made to MRTs in the performance year 2018.

79
Annex A: Main Features of Capital Instruments
Disclosure According to Article 3 in Commission Implementing Regulation (EU) No 1423/2013
Issuer ICBC Standard Bank Plc ICBC Standard Bank Plc ICBC Standard Bank Plc
Unique identifier (e.g. CUSIP, ISIN or Bloomberg
identifier for private placement)
Unlisted Bloomberg ID: AN7413650 XS0470473231
Governing law(s) of the instrument English Law English Law English Law
Transitional CRR rules Common equity Tier 1 Tier 2 Tier 2
Post-transitional CRR rules Common equity Tier 1 Tier 2 Tier 2
Eligible at solo/(sub-)consolidated/solo & (sub-)
consolidated
Solo and (Sub) Consolidated Solo and (Sub) Consolidated Solo and (Sub) Consolidated
Instrument type Common equity Tier 1 as published
in Regulation (EU) No 575/2013
Article 26 (3)
Tier 2 as published in Regulation (EU)
No 575/2013 -Article 63
Tier 2 as published in Regulation
(EU) No 575/2013 -Article 63
Amount recognised in regulatory capital
(currency in million, as of most recent reporting
date)
$1,083.5m $150m $92.1m
Nominal amount of instrument $1 $150m $500m
Issue price Ongoing Issuances 100% of Nominal Amount 99.16% of Nominal Amount
Redemption price N/A 100% of Nominal Amount 100% of Nominal Amount
Accounting classification Equity attributable to ordinary
shareholders
Liability - Amortised cost Liability - Amortised cost
Original date of issuance Ongoing Issuances 15th June 2017 2nd December 2009
Perpetual or dated N/A Dated Dated
Original maturity date N/A 15th June 2027 2nd December 2019
Issuer call subject to prior supervisory approval N/A Yes N/A
Optional call date, contingent call dates, and
redemption amount
N/A 5 year call and Redemption at par
based on capital disqualification
event
Redemption at par based on capital
disqualification event
Subsequent call dates, if applicable N/A N/A N/A
Fixed or floating dividend/coupon N/A Floating Fixed
Coupon rate and any related index N/A 3 Month USD LIBOR + 3.67%, per
annum, paid quarterly
8.125% per annum
Existence of a dividend stopper N/A No No
Fully discretionary, partially discretionary or
mandatory (in terms of timing)
N/A Mandatory Mandatory
Fully discretionary, partially discretionary or
mandatory (in terms of amount)
N/A Mandatory Mandatory
Existence of step up or other incentive to
redeem
N/A No No
Non-cumulative or cumulative N/A Cumulative Cumulative
Convertible or non-convertible N/A Non-convertible Non-convertible
If convertible, conversion trigger (s) N/A N/A N/A
If convertible, fully or partially N/A N/A N/A
If convertible, conversion rate N/A N/A N/A
If convertible, mandatory or optional conversion N/A N/A N/A
If convertible, specify instrument type
convertible into
N/A N/A N/A
If convertible, specify issuer of instrument it
converts into
N/A N/A N/A
Write-down features N/A N/A No
If write-down, write-down trigger (s) N/A N/A N/A
If write-down, full or partial N/A N/A N/A
If write-down, permanent or temporary N/A N/A N/A
If temporary write-down, description of write-up
mechanism
N/A N/A N/A
Position in subordination hierarchy in
liquidation ( specify instrument type
immediately senior to instrument)
N/A Pari passu with claims of all
subordinated creditors, subordinated
to senior creditors and senior to
Ordinary shares and junior
subordinated creditors
Pari passu with claims of all
subordinated creditors,
subordinated to senior creditors
and senior to Ordinary shares and
junior subordinated creditors
Non-compliant transitioned features N/A No No
If yes, specify non-compliant features N/A N/A N/A

80
Annex B: Transitional Own funds Disclosure Template
Transitional Own Funds Disclosure Template
As at 31 December 2018 Amount
($m)
CRR Prescribed
Residual
Amount
Common Equity Tier 1 capital: Instruments and Reserves
1 Capital instruments and the related share premium accounts 2,079.4
of which: ordinary share capital and related share premium accounts 2,079.4
2 Retained earnings (802.7)
3 Accumulated other comprehensive income (and other reserves, to include unrealised gains and losses under the applicable accounting
standards)
(4.1)
3a Funds for general banking risk -
4 Amount of qualifying items referred to in Article 484 (3) and the related share premium accounts subject to phase out from CET1 -
Public sector capital injections grandfathered until 1 January 2018 -
5 Minority Interests (amount allowed in consolidated CET1) - -
5a Independently reviewed interim profits net of any foreseeable charge or dividend -
6 Common Equity Tier 1 (CET1) capital before regulatory adjustments 1,272.6
Common Equity Tier 1 (CET1) capital: regulatory adjustments -
7 Additional value adjustments (negative amount) (14.7)
8 Intangible assets (net of related tax liability) (negative amount) (38.2) -
9 Empty Set in the EU -
10 Deferred tax assets that rely on future profitability excluding those arising from temporary differences (net of related tax liability where the
conditions in Article 38 (3) are met) (negative amount)
- -
11 Fair value reserves related to gains or losses on cash flow hedges 1.8
12 Negative amounts resulting from the calculation of expected loss amounts - -
13 Any increase in equity that results from securitised assets (negative amount) -
14 Gains or losses on liabilities valued at fair value resulting from changes in own credit standing (3.0) -
15 Defined-benefit pension fund assets (negative amount) - -
16 Direct and indirect holdings by an institution of own CET1 instruments (negative amount) - -
17 Holdings of the CET1 instruments of financial sector entities where those entities have reciprocal cross holdings with the institution
designed to inflate artificially the own funds of the institution (negative amount)
- -
18 Direct , indirect and synthetic holdings by the institution of the CET1 instruments of financial sector entities where the institution does not
have a significant investment in those entities (amount above the 10% threshold and net of eligible short positions) (negative amount)
- -
19 Direct, indirect and synthetic holdings by the institution of the CET1 instruments of financial sector entities where the institution has a
significant investment in those entities (amount above 10% threshold and net of eligible short positions) (negative amount)
- -
20 Empty Set in the EU -
20a Exposure amount of the following items which qualify for a RW of 1250%, where the institution opts for the deduction alternative -
20b of which: qualifying holdings outside the financial sector (negative amount) -
20c of which: securitisation positions (negative amount) -
20d of which: free deliveries (negative amount) -
21 Deferred tax assets arising from temporary differences (amount above 10% threshold, net of related tax liability where the conditions in
38 (3) are met) (negative amount)
-
22 Amount exceeding the 15% threshold (negative amount) - -
23 of which: direct and indirect holdings by the institution of the CET1 instruments of financial sector entities where the institution has a
significant investment in those entities
- -
24 Empty Set in the EU -
25 of which: deferred tax assets arising from temporary differences - -
25a Losses for the current financial year (negative amount) (14.8) -
25b Foreseeable tax charges relating to CET1 items (negative amount) - -
Adjustment under IFRS 9 transitional arrangements 0.2
26 Regulatory adjustments applied to Common Equity Tier 1 in respect of amounts subject to pre-CRR treatment -
26a Regulatory adjustments relating to unrealised gains and losses pursuant to Articles 467 and 468 -
Of which: filter for unrealised gains on equity instruments -
26b Amount to be deducted from or added to Common Equity Tier 1 capital with regard to additional filters and deductions required pre CRR -
27 Qualifying AT1 deductions that exceed the AT1 capital of the institution (negative amount) -
28 Total regulatory adjustments to Common equity Tier 1 (CET1) (68.6)
29 Common Equity Tier 1 (CET1) capital 1,204.0

81
Additional Tier 1 (AT1) capital: instruments -
30 Capital instruments and the related share premium accounts -
31 of which: classified as equity under applicable accounting standards -
32 of which: classified as liabilities under applicable accounting standards -
33 Amount of qualifying items referred to in Article 484 (4) and the related share premium accounts subject to phase out from AT1 -
Public sector capital injections grandfathered until 1 January 2018 -
34 Qualifying Tier 1 capital included in consolidated AT1 capital (including minority interests not included in row 5) issued by subsidiaries and
held by third parties
- -
35 of which: instruments issued by subsidiaries subject to phase out -
36 Additional Tier 1 (AT1) capital before regulatory adjustments -
Additional Tier 1 (AT1) capital: regulatory adjustments -
37 Direct and indirect holdings by an institution of own AT1 Instruments (negative amount) - -
38 Direct , Indirect and synthetic holdings of the AT1 instruments of financial sector entities where those entities have reciprocal cross
holdings with the institution designed to inflate artificially the own funds of the institution (negative amount)
- -
39 Direct and indirect holdings of the AT1 instruments of financial sector entities where the institution does not have a significant investment
in those entities (amount above the 10% threshold and net of eligible short positions) (negative amount)
- -
40 Direct and indirect holdings by the institution of the AT1 instruments of financial sector entities where the institution has a significant
investment in those entities (amount above the 10% threshold net of eligible short positions) (negative amount)
- -
Regulatory adjustments applied to additional tier 1 in respect of amounts subject to pre-CRR treatment and transitional treatments
subject to phase out as prescribed in Regulation (EU) No 575/2013 (i.e. CRR residual amounts)
-
Residual amounts deducted from Additional Tier 1 capital with regard to deduction from Common Equity Tier 1 capital during the
transitional period pursuant to article 472 of Regulation (EU) No 575/2013
-
Residual amounts deducted from Additional Tier 1 capital with regard to deduction from Tier 2 capital during the transitional period
pursuant to article 475 of Regulation (EU) No 575/2013
-
Of which: direct holdings of non-significant investments in the Tier 2 capital of other financial sector entities -
Amount to be deducted from or added to Additional Tier 1 capital with regard to additional filters and deductions required pre CRR -
42 Qualifying T2 deductions that exceed the T2 capital of the institution (negative amount) -
43 Total regulatory adjustments to Additional Tier 1 (AT1) capital -
44 Additional Tier 1 (AT1) capital -
45 Tier 1 capital (T1 = CET1 + AT1) 1,204.0
Tier 2 (T2) capital: instruments and provisions -
46 Capital instruments and the related share premium accounts 242.1
47 Amount of qualifying items referred to in Article 484 (5) and the related share premium accounts subject to phase out from T2 -
Public sector capital injections grandfathered until 1 January 2018 -
48 Qualifying own funds instruments included in consolidated T2 capital (including minority interests and AT1 instruments not included in
rows 5 or 34) issued by subsidiaries and held by third parties
- -
49 of which: instruments issued by subsidiaries subject to phase out -
50 Credit risk adjustments -
-
51 Tier 2 (T2) capital before regulatory adjustments 242.1
Tier 2 (T2) capital: regulatory adjustments
52 Direct and indirect holdings by an institution of own T2 instruments and subordinated loans (negative amount) - -
53 Holdings of the T2 instruments and subordinated loans of financial sector entities where those entities have reciprocal cross holdings
with the institution designed to inflate artificially the own funds of the institution (negative amount)
- -
54 Direct and indirect holdings of the T2 instruments and subordinated loans of financial sector entities where the institution does not have
a significant investment in those entities (amount above 10% threshold and net of eligible short positions) (negative amount)
- -
Of which new holdings not subject to transitional arrangements - -
Of which holdings existing before 1 January 2013 and subject to transitional arrangements - -
55 Direct and indirect holdings by the institution of the T2 instruments and subordinated loans of financial sector entities where the
institution has a significant investment in those entities (net of eligible short positions) (negative amount)
- -
Regulatory adjustments applied to tier 2 in respect of amounts subject to pre-CRR treatment and transitional treatments subject to phase
out as prescribed in Regulation (EU) No 575/2013 (i.e. CRR residual amounts)
-
Residual amounts deducted from Tier 2 capital with regard to deduction from Common Equity Tier 1 capital during the transitional period
pursuant to article 472 of Regulation (EU) No 575/2013
-
Residual amounts deducted from Tier 2 capital with regard to deduction from Additional Tier 1 capital during the transitional period -

82
pursuant to article 475 of Regulation (EU) No 575/2013
Amount to be deducted from or added to Tier 2 capital with regard to additional filters and deductions required pre CRR -
57 Total regulatory adjustments to Tier 2 (T2) capital -
58 Tier 2 (T2) capital 242.1
59 Total capital (TC = T1 + T2) 1,446.1
Risk weighted assets
Risk weighted assets in respect of amounts subject to pre-CRR treatment and transitional treatments subject to phase out as prescribed
in Regulation (EU) No 575/2013(i.e. CRR residual amounts)
-
60 Total risk weighted assets 6,500.2
Capital ratios and buffers
61 Common Equity Tier 1 (as a percentage of risk exposure amount) 18.52%
62 Tier 1 (as a percentage of risk exposure amount) 18.52%
63 Total capital (as a percentage of risk exposure amount) 22.25%
64 Institution specific buffer requirement (CET1 requirement in accordance with article 92 (1) (a) plus 2.165%
65 of which: capital conservation buffer requirement 1.875%
66 of which: countercyclical buffer requirement 0.29%
67 of which: systemic risk buffer requirement -
67a of which: Global Systemically Important Institution (G-SII) or Other Systemically Important Institution (O-SII) buffer -
68 Common Equity Tier 1 available to meet buffers (as a percentage of risk exposure amount) 12.52%
69 [non relevant in EU regulation]
70 [non relevant in EU regulation]
71 [non relevant in EU regulation]
Amounts below the thresholds for deduction (before risk weighting)
72 Direct and indirect holdings of the capital of financial sector entities where the institution does not have a significant investment in those
entities (amount below 10% threshold and net of eligible short positions)
14.6
73 Direct and indirect holdings by the institution of the CET 1 instruments of financial sector entities where the institution has a significant
investment in those entities (amount below 10% threshold and net of eligible short positions)
-
74 Empty Set in the EU -
75 Deferred tax assets arising from temporary differences (amount below 10% threshold, net of related tax liability where the conditions in
Article 38 (3) are met)
0.3
Applicable caps on the inclusion of provisions in Tier 2
76 Credit risk adjustments included in T2 in respect of exposures subject to standardized approach (prior to the application of the cap) -
77 Cap on inclusion of credit risk adjustments in T2 under standardised approach 58.3
78 Credit risk adjustments included in T2 in respect of exposures subject to internal ratings-based approach (prior to the application of the
cap)
-
79 Cap for inclusion of credit risk adjustments in T2 under internal ratings-based approach -
Capital instruments subject to phase-out arrangements (only applicable between 1 Jan 2013 and 1 Jan 2022)
80 Current cap on CET1 instruments subject to phase out arrangements -
81 Amount excluded from CET1 due to cap (excess over cap after redemptions and maturities) -
82 Current cap on AT1 instruments subject to phase out arrangements -
83 Amount excluded from AT1 due to cap (excess over cap after redemptions and maturities) -
84 Current cap on T2 instruments subject to phase out arrangements 186.7
85 Amount excluded from T2 due to cap (excess over cap after redemptions and maturities) -

83
Annex C: Geographical Distribution of Credit Exposures
Geographical distribution of credit exposures relevant for the calculation of the countercyclical buffer for ICBCS
Own funds requirements
As at 31 December 2018 Exposure value
of credit
exposures
($m)
Sum of net long
and short
positions of
trading book
exposures
($m)
Value of trading
book exposures
for internal
models
($m)
Exposure
value of
securitisation
exposures
($m)
of which:
Credit
exposures
($m)
of which:
Trading book
exposures
($m)
of which:
Securitisation
exposures
($m)
Total
($m)
Own funds
requirements
weights
Countercyclic
al buffer rate
(%)
1 Angola 0.1 0.0 0.0 0.0 0.0 0.0 0.0 0.0 0.0 0.0%
2 Argentina 0.3 0.0 0.0 0.0 0.0 0.0 0.0 0.0 0.0 0.0%
3 Austria 0.3 0.0 0.6 0.0 0.0 0.3 0.0 0.3 0.0 0.0%
4 Bahamas 11.5 0.0 0.0 0.0 0.9 0.0 0.0 0.9 0.0 0.0%
5 Bahrain 15.0 0.0 0.0 0.0 1.2 0.0 0.0 1.2 0.0 0.0%
6 Barbados 0.0 0.0 0.0 0.0 0.0 0.0 0.0 0.0 0.0 0.0%
7 Belgium 15.9 0.0 1.2 0.0 1.3 0.4 0.0 1.6 0.0 0.0%
8 Bolivia 2.1 0.0 0.0 0.0 0.2 0.0 0.0 0.2 0.0 0.0%
9 Botswana 14.9 0.0 0.0 0.0 1.2 0.0 0.0 1.2 0.0 0.0%
10 Brazil 6.3 0.1 0.3 0.0 0.5 0.2 0.0 0.7 0.0 0.0%
11 Bulgaria 0.1 0.0 0.0 0.0 0.0 0.0 0.0 0.0 0.0 0.0%
12 Cameroon 0.0 0.0 0.0 0.0 0.0 0.0 0.0 0.0 0.0 0.0%
13 Canada 0.5 0.0 0.0 0.0 0.0 0.0 0.0 0.0 0.0 0.0%
14 Cayman Islands 44.0 0.0 0.0 0.0 3.5 0.0 0.0 3.5 0.0 0.0%
15 Chile 2.9 0.1 0.0 0.0 0.2 0.0 0.0 0.3 0.0 0.0%
16 China 94.5 0.1 0.9 0.0 6.3 0.0 0.0 6.3 0.0 0.0%
17 Czech Republic 5.3 0.0 0.0 0.0 0.4 0.0 0.0 0.4 0.0 1.0%
18 Egypt 4.8 0.0 0.0 0.0 0.6 0.0 0.0 0.6 0.0 0.0%
19 Ethiopia 0.0 0.0 0.0 0.0 0.0 0.0 0.0 0.0 0.0 0.0%
20 Finland 11.6 0.0 0.6 0.0 0.9 0.3 0.0 1.2 0.0 0.0%
21 France 14.0 0.0 14.7 0.0 1.1 2.9 0.0 4.1 0.0 0.0%
22 Georgia 0.0 0.0 0.4 0.0 0.0 0.2 0.0 0.2 0.0 0.0%
23 Germany 17.4 0.0 9.8 0.0 1.2 2.0 0.0 3.2 0.0 0.0%
24 Ghana 0.0 0.0 0.0 0.0 0.0 0.0 0.0 0.0 0.0 0.0%
25 Great Britain 172.4 0.0 14.1 0.0 12.6 3.3 0.0 15.8 0.1 1.0%
26 Greece 0.9 0.0 0.0 0.0 0.1 0.0 0.0 0.1 0.0 0.0%
27 Guinea 0.0 0.0 0.0 0.0 0.0 0.0 0.0 0.0 0.0 0.0%
28 Hong Kong 203.0 0.0 0.0 0.0 14.6 0.0 0.0 14.6 0.1 1.9%
29 India 45.1 0.0 0.0 0.0 3.6 0.0 0.0 3.6 0.0 0.0%
30 Indonesia 8.8 0.0 0.2 0.0 0.7 0.1 0.0 0.8 0.0 0.0%
31 Ireland 2.4 0.0 0.0 0.0 0.2 0.0 0.0 0.2 0.0 0.0%
32 Israel 0.0 0.0 0.0 0.0 0.0 0.0 0.0 0.0 0.0 0.0%

84
As at 31 December 2018 Exposure value
of credit
exposures
($m)
Sum of net long
and short
positions of
trading book
exposures
($m)
Value of trading
book exposures
for internal
models
($m)
Exposure
value of
securitisation
exposures
($m)
of which:
Credit
exposures
($m)
of which:
Trading book
exposures
($m)
of which:
Securitisation
exposures
($m)
Total
($m)
Own funds
requirements
weights
Countercyclic
al buffer rate
(%)
33 Italy 9.8 0.0 1.8 0.0 0.8 0.5 0.0 1.3 0.0 0.0%
34 Ivory Coast 11.2 0.0 0.0 0.0 0.9 0.0 0.0 0.9 0.0 0.0%
35 Japan 84.1 0.0 0.0 0.0 6.5 0.0 0.0 6.5 0.0 0.0%
36 Jersey , C.I. 3.7 0.0 0.0 0.0 0.3 0.0 0.0 0.3 0.0 0.0%
37 Jordan 3.2 0.0 0.0 0.0 0.3 0.0 0.0 0.3 0.0 0.0%
38 Kazakhstan 8.5 4.2 0.0 0.0 0.7 0.3 0.0 1.0 0.0 0.0%
39 Kenya 1.0 0.0 0.0 0.0 0.1 0.0 0.0 0.1 0.0 0.0%
40 Korea, Republic Of 12.9 0.0 0.0 0.0 1.0 0.0 0.0 1.0 0.0 0.0%
41 Kuwait 0.1 0.0 0.0 0.0 0.0 0.0 0.0 0.0 0.0 0.0%
42 Lesotho 0.0 0.0 0.0 0.0 0.0 0.0 0.0 0.0 0.0 0.0%
43 Luxembourg 132.4 0.0 1.2 0.0 10.6 0.4 0.0 11.0 0.1 0.0%
44 Madagascar 0.0 0.0 0.0 0.0 0.0 0.0 0.0 0.0 0.0 0.0%
45 Malawi 0.2 0.0 0.0 0.0 0.0 0.0 0.0 0.0 0.0 0.0%
46 Malta 0.1 0.0 0.0 0.0 0.0 0.0 0.0 0.0 0.0 0.0%
47 Mauritius 0.2 0.0 0.0 0.0 0.0 0.0 0.0 0.0 0.0 0.0%
48 Morocco 0.1 0.0 0.0 0.0 0.0 0.0 0.0 0.0 0.0 0.0%
49 Mozambique 0.0 0.0 0.0 0.0 0.0 0.0 0.0 0.0 0.0 0.0%
50 Namibia 0.0 0.0 0.0 0.0 0.0 0.0 0.0 0.0 0.0 0.0%
51 Netherlands 33.9 0.0 4.9 0.0 2.7 1.4 0.0 4.1 0.0 0.0%
52 Nigeria 117.1 0.1 0.0 0.0 11.2 0.0 0.0 11.2 0.1 0.0%
53 Pakistan 0.0 0.0 0.0 0.0 0.0 0.0 0.0 0.0 0.0 0.0%
54 Panama 1.1 0.0 0.0 0.0 0.1 0.0 0.0 0.1 0.0 0.0%
55 Qatar 52.7 0.0 0.0 0.0 2.1 0.0 0.0 2.1 0.0 0.0%
56 Russian Federation 27.0 0.0 0.6 0.0 2.2 0.3 0.0 2.5 0.0 0.0%
57 Rwanda 0.0 0.0 0.0 0.0 0.0 0.0 0.0 0.0 0.0 0.0%
58 Saudi Arabia 5.0 0.0 0.0 0.0 0.4 0.0 0.0 0.4 0.0 0.0%
59 Senegal 0.2 0.0 0.0 0.0 0.0 0.0 0.0 0.0 0.0 0.0%
60 Serbia 0.0 0.0 0.0 0.0 0.0 0.0 0.0 0.0 0.0 0.0%
61 Seychelles Islands 0.0 0.0 0.0 0.0 0.0 0.0 0.0 0.0 0.0 0.0%
62 Sierra Leone 0.1 0.0 0.0 0.0 0.0 0.0 0.0 0.0 0.0 0.0%
63 Singapore 60.3 0.2 0.0 0.0 4.8 0.0 0.0 4.8 0.0 0.0%
64 South Africa 3.6 0.3 0.7 0.0 0.3 0.4 0.0 0.7 0.0 0.0%
65 Spain 33.8 0.0 2.5 0.0 2.7 0.7 0.0 3.4 0.0 0.0%
66 Sri Lanka 0.0 0.0 0.0 0.0 0.0 0.0 0.0 0.0 0.0 0.0%
67 Swaziland 0.0 0.0 0.0 0.0 0.0 0.0 0.0 0.0 0.0 0.0%
68 Sweden 70.3 0.0 1.8 0.0 1.1 0.4 0.0 1.5 0.0 2.0%

85
As at 31 December 2018 Exposure value
of credit
exposures
($m)
Sum of net long
and short
positions of
trading book
exposures
($m)
Value of trading
book exposures
for internal
models
($m)
Exposure
value of
securitisation
exposures
($m)
of which:
Credit
exposures
($m)
of which:
Trading book
exposures
($m)
of which:
Securitisation
exposures
($m)
Total
($m)
Own funds
requirements
weights
Countercyclic
al buffer rate
(%)
69 Switzerland
158.0 0.0 2.5 0.0 12.6 0.7 0.0 13.3 0.1 0.0%
70 Taiwan
0.7 0.0 0.0 0.0 0.1 0.0 0.0 0.1 0.0 0.0%
71 Tajikistan
97.3 0.0 0.0 0.0 7.8 0.0 0.0 7.8 0.1 0.0%
72 Tanzania, United Republic Of
0.5 0.0 0.0 0.0 0.0 0.0 0.0 0.0 0.0 0.0%
73 Thailand
6.2 0.0 0.0 0.0 0.5 0.0 0.0 0.5 0.0 0.0%
74 Tunisia
0.1 0.0 0.0 0.0 0.0 0.0 0.0 0.0 0.0 0.0%
75 Turkey
28.2 5.1 0.0 0.0 2.3 0.4 0.0 2.7 0.0 0.0%
76 Uganda
1.4 0.0 0.0 0.0 0.2 0.0 0.0 0.2 0.0 0.0%
77 United Arab Emirates
95.1 0.0 0.0 0.0 5.7 0.0 0.0 5.7 0.0 0.0%
78 United States
223.0 0.0 0.0 0.0 15.3 0.0 0.0 15.3 0.1 0.0%
79 Uruguay
0.0 0.0 0.0 0.0 0.0 0.0 0.0 0.0 0.0 0.0%
80 Virgin Islands (British)
45.1 0.0 0.0 0.0 3.6 0.0 0.0 3.6 0.0 0.0%
81 Zambia
4.6 0.0 0.0 0.0 0.6 0.0 0.0 0.6 0.0 0.0%
82 Zimbabwe
0.1 0.0 0.0 0.0 0.0 0.0 0.0 0.0 0.0 0.0%
Total
2,027.3 10.5 60.2 0.0 148.9 15.5 0.0 164.4 1.0 10.4%
Only exposures to countries relevant to ICBCS are shown in the table above.

86
Annex D: Leverage Ratio
Leverage Ratio Common Disclosure Template
As at 31 December 2018 CRR Leverage Ratio
Exposure
($m)
On-balance sheet exposures (excluding derivatives and SFTs)
1 On-balance sheet items (excluding derivatives, SFTs and fiduciary assets, but including collateral) 16,340
2 (Asset amounts deducted in determining Tier 1 capital) (38)
3 Total on-balance sheet exposures (excluding derivatives, SFTs and fiduciary assets) (sum of lines 1 and 2) 16,301
Derivative exposures
4 Replacement cost associated with all derivatives transactions (i.e. net of eligible cash variation margin) 851
5 Add-on amounts for PFE associated with all derivatives transactions (mark-to-market method) 2,624
EU-5a Exposure determined under Original Exposure Method -
6 Gross-up for derivatives collateral provided where deducted from the balance sheet assets pursuant to the applicable
accounting framework
-
7 (Deductions of receivables assets for cash variation margin provided in derivatives transactions) (485)
8 (Exempted CCP leg of client-cleared trade exposures) -
9 Adjusted effective notional amount of written credit derivatives 1,856
10 (Adjusted effective notional offsets and add-on deductions for written credit derivatives) (1,484)
11 Total derivative exposures (sum of lines 4 to 10) 3,362
Securities financing transaction exposures
12 Gross SFT assets (with no recognition of netting), after adjusting for sales accounting transactions 4,215
13 (Netted amounts of cash payables and cash receivables of gross SFT assets) -
14 Counterparty credit risk exposure for SFT assets 22
EU-14a Derogation for SFTs: Counterparty credit risk exposure in accordance with Article 429b (4) and 222 of Regulation (EU) No
575/2013
-
15 Agent transaction exposures -
EU-15a (Exempted CCP leg of client-cleared SFT exposure) -
16 Total securities financing transaction exposures (sum of lines 12 to 15a) 4,237
Other off-balance sheet exposures
17 Off-balance sheet exposures at gross notional amount 372
18 (Adjustments for conversion to credit equivalent amounts) (276)
19 Other off-balance sheet exposures (sum of lines 17 to 18) 95
Exempted exposures in accordance with CRR Article 429 (7) and (14) (on and off balance sheet)
EU-19a (Exemption of intragroup exposures (solo basis) in accordance with Article 429(7) of Regulation (EU) No 575/2013 (on and
off balance sheet))
-
EU-19b (Exposures exempted in accordance with Article 429 (14) of Regulation (EU) No 575/2013 (on and off balance sheet)) -
Capital and total exposures
20 Tier 1 capital 1,204
21 Total leverage ratio exposures (sum of lines 3, 11, 16, 19, EU-19a and EU-19b) 23,996
Leverage ratio
22 Leverage ratio 5.02%
Choice on transitional arrangements and amount of derecognised fiduciary items
EU-23 Choice on transitional arrangements for the definition of the capital measure -
EU-24 Amount of derecognised fiduciary items in accordance with Article 429(11) of Regulation (EU) NO 575/2013 -
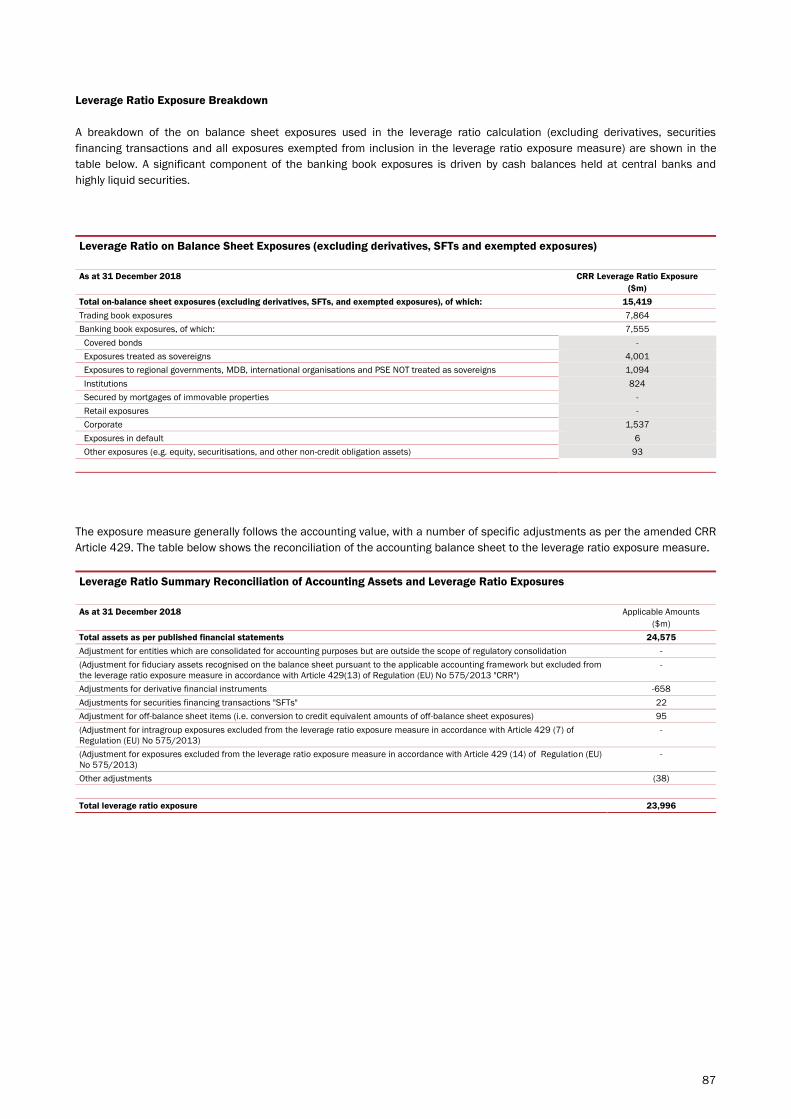
87
Leverage Ratio Exposure Breakdown
A breakdown of the on balance sheet exposures used in the leverage ratio calculation (excluding derivatives, securities
financing transactions and all exposures exempted from inclusion in the leverage ratio exposure measure) are shown in the
table below. A significant component of the banking book exposures is driven by cash balances held at central banks and
highly liquid securities.
Leverage Ratio on Balance Sheet Exposures (excluding derivatives, SFTs and exempted exposures)
As at 31 December 2018 CRR Leverage Ratio Exposure
($m)
Total on-balance sheet exposures (excluding derivatives, SFTs, and exempted exposures), of which: 15,419
Trading book exposures 7,864
Banking book exposures, of which: 7,555
Covered bonds -
Exposures treated as sovereigns 4,001
Exposures to regional governments, MDB, international organisations and PSE NOT treated as sovereigns 1,094
Institutions 824
Secured by mortgages of immovable properties -
Retail exposures -
Corporate 1,537
Exposures in default 6
Other exposures (e.g. equity, securitisations, and other non-credit obligation assets) 93
The exposure measure generally follows the accounting value, with a number of specific adjustments as per the amended CRR
Article 429. The table below shows the reconciliation of the accounting balance sheet to the leverage ratio exposure measure.
Leverage Ratio Summary Reconciliation of Accounting Assets and Leverage Ratio Exposures
As at 31 December 2018 Applicable Amounts
($m)
Total assets as per published financial statements 24,575
Adjustment for entities which are consolidated for accounting purposes but are outside the scope of regulatory consolidation -
(Adjustment for fiduciary assets recognised on the balance sheet pursuant to the applicable accounting framework but excluded from
the leverage ratio exposure measure in accordance with Article 429(13) of Regulation (EU) No 575/2013 "CRR")
-
Adjustments for derivative financial instruments -658
Adjustments for securities financing transactions "SFTs" 22
Adjustment for off-balance sheet items (i.e. conversion to credit equivalent amounts of off-balance sheet exposures) 95
(Adjustment for intragroup exposures excluded from the leverage ratio exposure measure in accordance with Article 429 (7) of
Regulation (EU) No 575/2013)
-
(Adjustment for exposures excluded from the leverage ratio exposure measure in accordance with Article 429 (14) of Regulation (EU)
No 575/2013)
-
Other adjustments (38)
Total leverage ratio exposure 23,996

ICBC Standard Bank|
88
Annex E: Glossary
Arrears
A customer is in arrears when they are behind in fulfilling their obligations with the result that an outstanding loan is unpaid or
overdue. Such a customer is also said to be in a state of delinquency and the entire outstanding balance is delinquent.
Asset Encumbrance
Asset encumbrance refers to the existence of bank assets securing liabilities in the event that an institution fails to meet its
financial obligations.
Backtesting
Application of an analytical method where historical data is used to determine how accurately the model has predicted actual
results
Basel III
The capital reforms and introduction of a global liquidity standard proposed by the Basel Committee on Banking Supervision in
2010 and due to be phased in, through CRD IV, from 1 January 2014 onward.
Basis point
One hundredth of a per cent (0.01 per cent). 100 basis points is 1 per cent. Used in quoting movements in interest rates or
yields on securities
Capital resources
Eligible capital held by the Group in order to satisfy its capital requirements.
Central Counterparty (CCP)
An institution mediating between the buyer and the seller in a financial transaction, such as a derivative contract or repurchase
agreement (repo). Where a CCP is used, a single bilateral contract between the buyer and the seller is replaced with two
contracts, one between the buyer and the CCP and one between the CCP seller.
Contractual maturities
Contractual maturity refers to the final payment date of a loan or other financial instrument, at which point all the remaining
outstanding principal will be repaid and interest is due to be paid.
Common equity tier 1 capital
The highest quality form of regulatory capital under CRD IV that comprises common shares issued and related share premium,
retained earnings and other reserves excluding the cash flow hedging reserve, less specified regulatory adjustments.
Common equity tier 1 ratio
Common equity tier 1 capital as a percentage of risk weighted assets.
Counterparty credit risk
Counterparty credit risk is the risk that the counterparty to a transaction could default before the final settlement of the
transaction's cash flows. Such transactions relate to contracts for financial instruments and may include derivative contracts
and repo contracts.
CRD
See CRD IV
CRD IV
In June 2013, the European Commission published legislation for a Capital Requirements Directive (CRD) and Capital
Requirements Regulation (CRR) which form the CRD IV package. The package implements the Basel III proposals in addition to
the inclusion of new proposals on sanctions for non-compliance with prudential rules, corporate governance and remuneration.
The rules are implemented in the UK via the PRA policy statement PS7/13 and are in force from 1 January 2014, with certain
sections subject to transitional phase in.

ICBC Standard Bank|
89
Credit quality step
A step in the PRA’s credit quality assessment scale which is based on the credit ratings applied by ECAIs. The scale is used to
assign risk weights to exposures under the Standardised Approach.
Credit Conversion Factor (CCF)
Credit conversion factors (CCF) are used in determining the exposure at default (EAD) in relation to a credit risk exposure. The
CCF is an estimate of the proportion of undrawn commitments expected to be drawn down at the point of default.
Credit Default Swaps (CDS)
A credit default swap is a type of credit derivative. It is an arrangement whereby the credit risk of an asset (the reference asset)
is transferred from the buyer to the seller of protection. The entity selling protection receives premium or interest-related
payments in return for contracting to make payments to the protection buyer upon a defined credit event. Credit events
normally include bankruptcy, payment default on a reference asset or assets, or downgrades by a rating agency.
Credit derivatives
A credit derivative is a financial instrument that derives its value from the credit rating of an underlying instrument carrying the
credit risk of the issuing entity. The principal type of credit derivatives are credit default swaps, which are used by the Group as
part of its trading activity and to manage its own exposure to credit risk.
Credit risk
The risk that parties with whom the Group has contracted fails to meet their obligations (both on and off-balance sheet).
Credit risk mitigation
A technique used to reduce the credit risk associated with an exposure (which continues to be held) by application of credit risk
mitigants such as collateral, guarantees and credit protection.
Credit risk spread (or credit spread)
The credit spread is the yield spread between securities with the same currency and maturity structure but with different
associated credit risks, with the yield spread rising as the credit rating worsens. It is the premium over the benchmark or risk-
free rate required by the market to take on a lower credit quality.
Credit Valuation Adjustments (CVA)
These are adjustments to the fair values of derivative assets to reflect the creditworthiness of the counterparty.
CRR
See CRD IV
Debit Valuation Adjustment (DVA)
An adjustment to the measurement of derivative liabilities to reflect default risk of the entity
Debt securities
Debt securities are assets held by the Group representing certificates of indebtedness of credit institutions, public bodies or
other undertakings, excluding those issued by Central Banks.
Debt securities in issue
These are unsubordinated debt securities issued by the Group. They include commercial paper, certificates of deposit, bonds
and medium-term notes.
Equity risk
The financial risk involved in holding equity in a particular investment.
Expected Loss (EL)
Expected loss (EL) represents the anticipated loss, in the event of default, on a credit risk exposure modelled under the
internal ratings based approach. EL is determined by multiplying the associated PD%, LGD% and EAD together and assumes a
12 month time horizon.
ICBC Standard Bank|
90
Exposure
An asset, off-balance sheet item or position which carries a risk of financial loss
Exposure at Default (EAD)
Exposure at default (EAD) represents the estimated exposure to a customer in the event of default. In determining EAD
amounts, consideration is made of the extent to which undrawn commitments may be drawn down at the point of default (see
Credit Conversion Factors) and the application of credit risk mitigation (i.e. eligible financial collateral). Analysis of credit risk
exposures under Pillar 3 is typically based on EAD amounts, prior to the application of credit risk mitigation.
External Credit Assessment Institutions (ECAI)
External Credit Assessment Institutions (ECAIs) include external credit rating agencies such as Standard & Poor's, Moody's and
Fitch.
Fair value adjustment
Fair value adjustments arise on acquisition when assets and liabilities are acquired at fair values that are different from the
carrying values in the acquired company. In respect of the Group’s acquisition of HBOS the principal adjustments were write-
downs in respect of loans and advances to customers and debt issued.
Financial Collateral Comprehensive Method (FCCM)
An approach to regulatory credit risk mitigation, whereby the collateral adjusted value is deducted from the risk exposure
(before assigning a risk weight).
Forbearance
Forbearance takes place when a concession is made on the contractual terms of a loan in response to an obligor’s financial
difficulties.
Group
Refers to ICBCS Group
Historical Look Back Approach (HLBA)
Method for calculating additional liquidity outflows corresponding to collateral needs resulting from the impact of an adverse
market scenario on a firm's derivatives transactions, financing transactions and other contracts.
Impaired loans
Impaired loans are loans where the Group does not expect to collect all the contractual cash flows or to collect them when they
are contractually due.
Impairment charge and impairment allowances
Impairment allowances are a provision held on the balance sheet as a result of the raising of an impairment charge against
profit for the incurred loss inherent in the lending book. An impairment allowance may either be individual or collective.
Impairment losses
An impairment loss is the reduction in value that arises following an impairment review of an asset that determines that the
asset’s value is lower than its carrying value. For impaired financial assets measured at amortised cost, impairment losses are
the difference between the carrying value and the present value of estimated future cash flows, discounted at the asset’s
original effective interest rate.
Incremental Risk Charge
Incremental risk charge (‘IRC’) The IRC model captures the potential distribution of profit and loss due to default and migration
for a portfolio of credit positions. For credit positions held on the trading book, and subject to specific interest rate risk VAR for
regulatory capital, an IRC based on the 99.9th percentile of the IRC distribution, over a one-year capital horizon, is used as a
capital add-on to VAR.
Individually / collectively assessed
Impairment is measured individually for assets that are individually significant, and collectively where a portfolio comprises
homogenous assets and where appropriate statistical techniques are available.

ICBC Standard Bank|
91
Interest rate risk (IRR)
Interest rate risk in arises from the different repricing characteristics of the Group’s non-trading assets, liabilities and off-
balance sheet positions of the Group. Interest rate risk arises predominantly from the mismatch between interest rate
sensitive assets and liabilities, but also to the investment term of capital and reserves, and the need to minimise income
volatility.
Internal Assessment Approach (IAA)
The Internal Assessment Approach is an IRB approach for securitisations whereby a firm applies its internal assessment of the
credit quality of the positions in the risk weighted asset calculations. A firm must apply to the PRA for permission to use this
approach and must satisfy the PRA of its internal assessment processes. The Internal Assessment Approach may only be
applied to exposures arising from asset backed commercial paper programmes.
Internal Capital Adequacy Assessment Process (ICAAP)
The Group’s own assessment, based on Basel III requirements, of the levels of capital that it needs to hold in respect of its
regulatory capital requirements (for credit, market and operational risks) and for other risks including stress events as they
apply on a solo level and on a consolidated level.
Internal Liquidity Adequacy Assessment Process (ILAAP)
The Group’s own assessment of the processes for the identification, measurement, management and monitoring of liquidity.
Internal Model Method (IMM)
The Internal Model Method is one of three methods available to calculate exposure values for counterparty credit risk. A firm
must only apply the IMM if it has counterparty credit risk IMM permission from the PRA.
Investment grade
This refers to the highest range of credit ratings, from ‘AAA’ to ‘BBB’ as measured by external credit rating agencies.
International Swaps and Derivatives Association (ISDA) master agreement
A standardised contract developed by the ISDA which is used as an umbrella contract for bilateral derivative contracts.
Leverage Ratio
A capital leverage measure, introduced under the Basel III reforms, that is defined as the ratio of tier 1 capital to total
exposures, where total exposures equal the sum of all balance sheet assets and off-balance sheet items not deducted in
determining tier 1 capital. The leverage ratio is intended to reinforce risk based capital requirements with a simple, non-risk
based ‘backstop’ measure.
Loans past due
Loans are past due when a counterparty has failed to make a payment when contractually due.
Loss Given Default (LGD)
Loss given default (LGD) represents the estimated proportion of an EAD amount that will be lost in the event of default. It is
calculated after taking account of credit risk mitigation and includes the cost of recovery.
Mark-to-Market (MTM) Approach
The Mark-to-Market Approach is one of three methods available to calculate exposure values for counterparty credit risk. The
method adjusts daily to account for profits and losses in the value of related assets and liabilities.
Market risk
The risk that unfavourable market moves (including changes in and increased volatility of interest rates, market-implied
inflation rates, credit spreads and bond prices, foreign exchange rates, equity, property and commodity prices and other
instruments) lead to reductions in earnings and / or value.
Master netting agreement
An agreement between two counterparties that have multiple derivative contracts with each other that provides for the net
settlement of all contracts through a single payment, in a single currency, in the event of default on, or termination of, any one
contract.

ICBC Standard Bank|
92
Minimum capital requirement
The minimum regulatory capital that must be held in accordance with Pillar 1 requirements for credit, market and operational
risk
Model validation
The process of assessing and providing evidence that the Group’s models perform as planned and adequately reflect the risk
profile of the business, and that there are no material misstatements of the capital requirement See also Backtesting
Multilateral Development Banks
Institutions created by groups of countries to provide finance and professional advice for development.
Operational risk
The risk of loss resulting from inadequate or failed internal processes, people and systems or from external events
Over-the-Counter (OTC) derivatives
Over the counter derivatives are derivatives for which the terms and conditions can be freely negotiated by the counterparties
involved, unlike exchange traded derivatives which have standardised terms.
Past due items
An exposure class under the Standardised Approach that recognises exposures that are more than 90 days past due
Pillar 1
The first pillar of the Basel III framework sets out the minimum regulatory capital requirements for credit, operational and
market risks.
Pillar 2
The second pillar of the Basel III framework is known as the Supervisory Review Process, and sets out the review process for a
bank’s capital and liquidity adequacy; the process under which the supervisors evaluate how well financial institutions are
assessing their risks and the actions taken as a result of these assessments.
Pillar 3
The third pillar of the Basel III framework aims to encourage market discipline by setting out disclosure requirements for banks
on their capital, liquidity and risk exposures and risk assessment processes. These disclosures are aimed at improving the
information made available to the market.
Potential Future Exposure (PFE)
A regulatory add-on for the potential future credit exposure on derivatives contracts as calculated under the Mark-to-Market
Approach.
Private equity investments
Private equity is equity securities in operating companies not quoted on a public exchange. Investment in private equity often
involves the investment of capital in private companies or the acquisition of a public company that results in the delisting of
public equity. Capital for private equity investment is raised by retail or institutional investors and used to fund investment
strategies such as leveraged buyouts, venture capital, growth capital, distressed investments and mezzanine capital.
Prudent Valuation Adjustment (PVA)
A regulatory deduction applied to CRD IV common equity tier 1 capital based upon the difference between the prudent values
of trading book assets or other financial assets measured at fair value with the fair values recognised for these assets in the
financial statements.
Point-in-Time (PIT)
Estimates of PD (or other measures) made on a Point-in-Time (PIT) basis generally cover a short time horizon (usually a 12
month period) and are sensitive to changes in the economic cycle. This differs from a Through-the-Cycle (TTC) basis which uses
long run average economic and risk data to reduce such sensitivity.

ICBC Standard Bank|
93
Probability of Default (PD)
Probability of default (PD) represents an estimate of the likelihood that a customer will default on their obligation within a 12
month time horizon.
Ratings Based Approach (RBA)
The Ratings Based Approach is an IRB approach for securitisations applied to rated securitisation and re-securitisation
positions. The approach applies risk weightings to positions based on a combination of ECAI ratings, the granularity of the
underlying pool, the seniority of the position and whether the position is a re-securitisation position.
Regulatory capital
The amount of capital that the Group holds, determined in accordance with rules established by the PRA for the consolidated
Group and by local regulators for individual Group companies.
Re-securitisations
A securitisation where the risk associated with an underlying pool of exposures is tranched and at least one of the underlying
exposures is a securitisation position.
Renegotiated loans
Loans and advances are generally renegotiated either as part of an ongoing customer relationship or in response to an
adverse change in the circumstances of the borrower. In the latter case renegotiation can result in an extension of the due
date of payment or repayment plans under which the Group offers a concessionary rate of interest to genuinely distressed
borrowers. This will result in the asset continuing to be overdue and will be impaired where the renegotiated payments of
interest and principal will not recover the original carrying amount of the asset. In other cases, renegotiation will lead to a new
agreement, which is treated as a new loan.
Repurchase agreements or ‘repos’
Short-term funding agreements which allow a borrower to sell a financial asset, such as ABS or Government bonds as collateral
for cash. As part of the agreement the borrower agrees to repurchase the security at some later date, usually less than 30
days, repaying the proceeds of the loan.
Residual maturity
The length of time remaining from present date until the maturity of the exposure
Risk appetite
The amount and type of risk that the Group is prepared to seek, accept or tolerate.
Risk weighted assets (RWAs)
A measure of a bank’s assets adjusted for their associated risks. Risk weightings are established in accordance with PRA rules.
Securities financing transactions (SFTs)
Securities financing transactions are repurchase and reverse repurchase agreements, buy / sell backs and securities lending.
For the lender (seller) of the securities it is usually a way to raise funds to finance the securities positions. For the borrower
(buyer) of the securities it is a way to invest short–term funds or to cover short (bond) positions.
Securitisation
Securitisation is a process by which a group of assets, usually loans, are aggregated into a pool, which is used to back the
issuance of new securities. Securitisation is the process by which ABS are created. A company sells assets to a structured
entity which then issues securities backed by the assets. This allows the credit quality of the assets to be separated from the
credit rating of the original company and transfers risk to external investors. Assets used in securitisations include mortgages
to create mortgage backed securities or residential mortgage-backed securities (RMBS) as well as commercial mortgage
backed securities (CMBS). The Group has established several securitisation structures as part of its funding and capital
management activities. These generally use mortgages, corporate loans and credit cards as asset pools.
Securitisation position
A retained or purchased position (exposure) in the securities issued by a securitisation

ICBC Standard Bank|
94
Senior Managers & Certification Regime (SM&CR)
The aim of the Senior Managers and Certification Regime (SM&CR) is to reduce harm to consumers and strengthen market
integrity by making individuals more accountable for their conduct and competence.
Sovereign exposures
Exposures to central governments and central government departments, central banks and entities owned or guaranteed by
the aforementioned.
Standardised Approach
The Standardised Approach to calculating credit risk capital requirements requires the use of a standard set of risk weights
prescribed by the regulator. Use may be made of external credit ratings supplied by ECAIs to assign risk weights to exposures.
Standardised approaches, following prescribed methodologies, also exist for calculating market risk and operational risk
capital requirements.
Stressed VaR (SVaR)
Stressed VaR is a one year forward looking measure of VaR where certain parameters of the portfolio are calculated under a
period of stress.
Stress testing
Stress and scenario testing is the term used to describe techniques where plausible events are considered as vulnerabilities to
ascertain how this will impact the capital resources which are required to be held.
Subordinated liabilities
Liabilities which, in the event of insolvency or liquidation of the issuer, are subordinated to the claims of depositors and other
creditors of the issuer
The Standardised Approach (TSA)
A standardised measure for calculating operational risk capital requirements based on the three year average of the aggregate
risk weighted relevant indicators of the underlying business. The relevant indicators are derived from total income.
Through-the-cycle (TTC)
See Point-in-time (PIT)
Tier 1 capital
A measure of a bank’s financial strength defined by the PRA. It captures common equity tier 1 capital plus other tier 1
securities in issue, but is subject to a deduction in respect of material holdings in financial companies.
Tier 1 capital ratio
Tier 1 capital as a percentage of risk weighted assets.
Tier 2 capital
A component of regulatory capital defined by the PRA, mainly comprising qualifying subordinated loan capital, certain non-
controlling interests and eligible collective impairment allowances
Total Capital Requirement (TCR)
The amount and quality of capital a firm must maintain to comply with the minimum capital requirements under the Capital
Requirements Regulation and the Pillar 2A capital requirement.
Trading book
Positions in financial instruments and commodities held for trading purposes or to hedge other elements of the trading book.
Value-at-Risk (VaR)
Value-at-Risk is an estimate of the potential loss in earnings which might arise from market movements under normal market
conditions, if the current positions were to be held unchanged for one business day. It is measured to specified level of
confidence, often 95 per cent or 99 per cent.

ICBC Standard Bank|
95
Write downs
The depreciation or lowering of the value of an asset in the books to reflect a decline in their value, or expected cash flows.
Write-off
The reduction of the value of an asset to zero, reflecting the inability to recover any residual value
Wrong way risk (WWR)
The risk that arises from the correlation between a counterparty exposure and the credit quality of the counterparty. It is
therefore the risk that the probability of default of the counterparty increases with the exposure.

ICBC Standard Bank|
96
Annex F: List of Tables & Graphs Included
Table No Title Page
1 No. of Directorships for Directors of ICBC Standard Bank Plc 14
2 Countercyclical Buffer Requirements 22
3 Regulatory approach by risk type 23
4 ICBCS– Minimum Capital Adequacy Ratios and Buffers 25
5 Capital resources of ICBCS as at 31 December 2018 26
6 Capital requirements of ICBCS as at 31 December 2018 27
7 Individual Liquidity Coverage Ratio for ICBCS 31
8 Consolidated Liquidity Coverage Ratio for ICBCS 31
9 IFRS 9 Transitionals 35
10 Credit Risk Exposure by Exposure Class 36
11 Credit Risk Exposures by Industry 38
12 Geographical Distribution of Credit Exposures 39
13 Credit Risk Exposures by Residual Maturity 39
14 Credit Risk Exposure by Credit Quality Steps 40
15 Counterparty Credit Risk Exposure for Derivatives 44
16 Counterparty Credit Risk on Credit Derivative Transactions 45
17 Credit Risk Mitigation by Exposure Class 51
18 Hypothetical Profit and Loss and VaR (Graph) 57
19 Normal VaR (1 day 95%) 59
20 Stressed VaR (10 day 99%) 59
21 Incremental Risk Charge for ICBCS 60
22 Analysis of trading profit (Graph) 60
23 Market risk capital requirements at 8% 61
24 Market sensitivities to interest rate in the banking book 63
25 Median Asset Encumbrance Over 2018 72
26 Median Collateral received by ICBC Standard Bank Plc over 2018 73
27 Encumbered assets/collateral received by ICBC Standard Bank Plc and associated liabilities 73
28 Asset Encumbrance as at 31 Dec 2018 73
29 Collateral received by ICBC Standard Bank Plc as at 31 Dec 2018 74
30 Asset Encumbrance Ratio 74
31 Analysis of remuneration by base and variable pay 78
32 Outstanding Deferred Remuneration 79
33 Remuneration breakdown by band 79
34 Annex A: Main features of capital instruments 80
35 Annex B: Transitional Own Funds Disclosure Template 81
36 Annex C: Geographical Distribution of Credit Exposures 84
37 Annex D: Leverage Ratio Common Disclosure Template 87
38 Annex D: Leverage Ratio - On Balance Sheet Exposures (excluding derivatives, SFTs and exempted exposures) 88
39 Annex D: Leverage Ratio - Summary Reconciliation of Accounting Assets and Leverage Ratio Exposures 88

97
Acronyms and abbreviations
ALDB Assets and Liabilities Database
BAC Board audit committee
BCM Business Continuity Management
BCP Business Continuity Plan
BRMC Board risk management committee
CapCom Capital and liquidity management committee
CCP Central Clearing Counterparty
CCyB Countercyclical Buffer
CEO Chief Executive Officer
CMT Crisis Management Team
Company ICBC Standard Bank Plc company
CRD Capital requirement directive
CRO Chief Risk Officer
CSC Capital Sub Committee
CVA Credit valuation adjustment
DVA Debit valuation adjustments
EAD Exposure at default
EAR Earnings at Risk
EBA European Banking Authority
ECAI External Credit Assessment Institutions
EL Expected loss
EU European Union
EWI Early warning indicator
FCA Financial Conduct Authority
FIRB Foundation internal ratings based
FOA Futures and Options Association
FPC Financial Policy Committee
Group ICBC Standard Bank Plc, its subsidiaries and CSEs
GWWR General Wrong Way Risk
ICAAP Internal Capital Adequacy Assessment Process
ICBC Industrial and Commercial Bank of China Limited
ICBCS ICBC Standard Bank Plc
IFRS International Financial Reporting Standards as adopted by the EU
ILAAP Internal Liquidity Adequacy Assessment Process
ILG Individual liquidity guidance
IRC Incremental Risk Charge
IRRBB Interest Rate Risk in the Banking Book
ISDA International Swap Dealers Association
LAB Liquid Asset Buffer
LGD Loss given default
LME London Metal Exchange
LSC Liquidity sub-committee
MLRC Market and Liquidity Risk Committee
MRT Material Risk Taker
NIRF Notional Inventory Risk Framework
OTC Over-the-counter
PBB Personal and Business Banking
PD Probability of default
PFE Potential future exposure
PIT Point in time
PRA Prudential Regulation Authority
RAS Risk Appetite Statement
Remco Remuneration committee of the group
Repos Repurchase agreements
RMAC Risk Methodologies Approval Committee
RMC Risk management committee
RRP Recovery and Resolution Plan
RTF Risk Technical Forum
SBG Standard Bank Group Limited and subsidiaries
SBLH Standard Bank London Holdings Limited
SBSA Standard Bank of South Africa Limited
SLA Service Level Agreement
SMCR Senior Managers and Certification Regime
SME Small and Medium Sized Enterprises
SVaR Stressed VaR
SWWR Specific Wrong Way Risk
TSA The Standardised Approach
TTC Through the cycle
UL Unexpected loss
VaR Value-at-risk
WWR Wrong Way Risk

98
Contact information
CHINA
ICBC Standard Resources (China) Limited
Unit 705, Tower 1
Century Link, No. 1198
Shanghai 200122
The People's Republic of China
C Gong
General Manager
HONG KONG
ICBC Standard Bank Plc – Hong Kong branch
Suite 3218, Level 32
Two Pacific Place
88 Queensway
Hong Kong
W Chou
Chief Executive
JAPAN
ICBC Standard Bank Plc – Tokyo branch
11th Floor, Ark Mori Building, Akasaka
1-12-32, Minato-ku
Tokyo 107-6011
Japan
Y Ikemizu
Branch Manager
SINGAPORE
ICBC Standard Bank Plc – Singapore branch
One George Street
No. 16-04
Singapore 049145
V Yu
Chief Executive
UNITED ARAB EMIRATES
ICBC Standard Bank Plc – DIFC branch
AI Fattan Currency Tower
15th Floor
Office 1501, Dubai International Financial Centre (DIFC)
PO BOX 506962
Dubai, UAE
H Chawki
Senior Executive
UNITED KINGDOM
ICBC Standard Bank Plc
20 Gresham street
London
EC2V 7JE
England
M van der Spuy
Chief Executive
UNITED STATES OF AMERICA
ICBC Standard NY Holdings, Inc. group
28th Floor, 520 Madison Avenue
New York
NY 10022
USA
A Maartens
Chief Executive

99
Disclaimer
This is a marketing communication which has been prepared by a trader, sales person or analyst of ICBC Standard Bank Plc, or its affiliates (ICBCS) and is provided for
informational purposes only. The material does not constitute, nor should it be regarded as, investment research. It has not been prepared in accordance with the full legal
requirements designed to promote independence of research and is not subject to any prohibition on dealing ahead of the dissemination of investment research.
Additional information with respect to any security, commodity or other financial instrument, referred to herein may be made available on request. This material is for the
general information of institutional and market professional clients of ICBCS and should not be considered to be investment advice. It does not take into account the particular
investment objectives, financial situation or needs of individual clients. The information, tools and material presented in this marketing communication are provided to you for
information purposes only and are not to be used or considered as an offer or the solicitation of an offer to sell or to buy or subscribe for securities, commodities or other
financial instruments, or to participate in any particular trading strategy, nor shall it, or the fact of its distribution, form the basis of, or be relied upon in connection with, any
contract relating to such action. This material is based on information that we consider reliable, but ICBCS does not warrant or represent (expressly or impliedly) that it is
accurate, complete, not misleading or as to its fitness for the purpose intended and it should not be relied upon as such. The information and opinions contained in this
document were produced by ICBCS as per the date stated and may be subject to change without prior notification. Opinions expressed are our current opinions as of the date
appearing on this material only. We endeavour to update the material in this report on a timely basis, but regulatory compliance or other reasons may prevent us from doing so.
ICBCS or its employees may from time to time have long or short positions in securities, commodities, warrants, futures, options, derivatives or other financial instruments
referred to in this material. ICBCS does and seeks to do business with companies covered in this communication. As a result, investors should be aware that ICBCS may have a
conflict of interest that could affect the objectivity of this communication. Investors should consider this communication as only a single factor in making their investment
decision.
None of the material, nor its content, nor any copy of it, may be altered in any way, transmitted to, copied or distributed to any other party, without the prior express written
permission of ICBCS. All trademarks, service marks and logos used in this communication are trademarks or service marks or registered trademarks or service marks of ICBCS.
Information and opinions presented in this communication were obtained or derived from sources ICBCS believes are reliable, but ICBCS makes no representations as to their
accuracy or completeness. Additional information is available upon request. ICBCS accepts no liability for loss, either directly or indirectly, arising from the use of the material
presented in this communication, except that this exclusion of liability does not apply to the extent that liability arises under specific statutes or regulations applicable to ICBCS.
The services, securities and investments discussed in this material may not be available to nor suitable for all investors. Investors should make their own investment decisions
based upon their own financial objectives and financial resources, and if necessary, should seek professional advice. It should be noted that investment involves risk,
including, but not limited to, the risk of capital loss. Past performance is no guide to future performance. In relation to securities denominated in foreign currency, movements
in exchange rates will have an effect on the value, either favourable or unfavourable, of such securities. Some investments discussed in this marketing communication may
have a high level of volatility. High volatility investments may experience sudden and large falls in their value causing losses when that investment is realised. Those losses may
equal your original investment. Indeed, in the case of some investments, the potential losses may exceed the amount of initial investment, and in such circumstances, you may
be required to pay more money to support those losses. Income yields from investments may fluctuate and, in consequence, initial capital paid for such investments may be
used as part of that income yield. Some investments may not be readily realisable and it may be difficult to sell or realize those investments, similarly it may prove difficult for
you to obtain reliable information about the value, or risks, to which such an investment is exposed.
In Europe, this communication is distributed by ICBC Standard Bank Plc. 20 Gresham Street, London EC2V 7JE which is authorised by the Prudential Regulation Authority (PRA)
and regulated by the PRA and the Financial Conduct Authority (FCA), and is provided to Professional Investors only.
In Hong Kong, this communication is distributed by ICBC Standard Bank Plc, Hong Kong Branch, and is intended solely for use by Professional Investor (as defined in the Hong
Kong Securities and Futures Ordinance and its subsidiary legislation) clients and prospective clients of members of ICBC Standard Bank Plc Group. This communication may
not be relied on by retail customers or persons to whom this communication may not be provided by law. All enquiries by recipients in Hong Kong must be directed to an ICBC
Standard Bank Plc, Hong Kong Branch contact. ICBC Standard Bank Plc, Hong Kong Branch is a fully licensed bank under the Banking Ordinance and is a registered institution
under the Securities and Futures Ordinance in Hong Kong. Any investments and services contained or referred to in this presentation may not be suitable for you and it is
recommended that you consult an independent investment advisor if you are in doubt about such investments or investment services.
In Singapore, the provision of Financial Advisory Services is regulated under the Financial Advisers Act (Cap. 110). Accordingly (and where applicable), this material is provided
by ICBC Standard Bank Plc, Singapore Branch pursuant to Regulation 32C of the Financial Advisers Regulations. The material contained in this document is intended solely for
Accredited Investors, Expert Investors, or Institutional Investors, as defined under the Securities and Futures Act (Cap. 289) of Singapore. Recipients in Singapore should
contact an ICBC Standard Bank Plc, Singapore Branch representative in respect of any matters arising from, or in connection with this material. ICBC Standard Bank Plc,
Singapore Branch is regulated by the Monetary Authority of Singapore.
If distributed into the United States, this communication is issued by a member of the sales and trading department of ICBCS. Sales and trading department personnel are not
research analysts, and the information in this communication is not intended to constitute “research” as that term is defined by applicable regulations. Unless otherwise
indicated, any reference to a research report or research recommendation is not intended to represent the whole report and is not in itself considered a recommendation or
research report. All views, opinions and estimates expressed in this communication (i) may change without notice and (ii) may differ from those views, opinions and estimates
held or expressed by ICBCS or other ICBCS personnel. This communication is being provided to you without regard to your particular circumstances, and any decision to
purchase or sell a financial instrument must be made by you independently without reliance on ICBCS. Any decision to purchase or subscribe for any financial instrument in any
offering must be based solely on existing public information on such financial instrument and not on this communication. This material is not intended to provide personal
investment advice and it does not take into account the specific investment objectives, financial situation and the particular needs of any specific person. This communication
is for informational purposes only and should not be regarded as an offer to sell or as a solicitation of an offer to buy any financial product, an official confirmation of any
transaction, or as an official statement of ICBCS, or any of its affiliates. While every care has been taken in preparing this communication, no representation, warranty or
undertaking (express or implied) is given and no responsibility or liability is accepted by ICBCS, its subsidiaries, holding companies or affiliates as to the accuracy or
completeness of the information contained herein. All opinions and estimates contained in this communication may be changed after publication at any time without notice.
Any included projections, opinions, assumptions or estimates are for example only, and they may not represent current or future performance. The information in this
communication may not be updated or otherwise revised. Members of ICBCS, their directors, officers and employees may have a long or short position in the instruments
mentioned in this communication or related investments, and may add to, dispose of or effect transactions for their own account and ICBCS may perform or seek to perform
advisory or banking services in relation thereto. This communication is not intended for the use of private or retail customers. Any communication may be inconsistent, and
reach different conclusions, with other ICBCS communications. ICBCS is under no obligation to bring such communications to the attention of recipients of this information.
In jurisdictions where ICBCS is not already registered or licensed to trade in securities, transactions will only be effected in accordance with applicable securities legislation,
which will vary from jurisdiction to jurisdiction and may require that the trade be made in accordance with applicable exemptions from registration or licensing requirements.
Copyright 2016 ICBC Standard. All rights reserved. This communication or any portion hereof may not be reprinted, sold or redistributed without the written consent of ICBC
Standard Bank Plc.

ICBC Standard Bank Plc | Financial Markets and Commodities
20 Gresham Street | London EC2V 7JE, United Kingdom


![[[Pillar 3 Disclosures Quarterly Statutory Return]]](https://img.pdfslide.us/doc/110x75/625c032c23894d2dce57fb27/pillar-3-disclosures-quarterly-statutory-return.jpg)