Embed Size (px)
Citation preview

Pillar 3 Disclosures CriteriaCaixa Group
at 31 December 2016
(*) This English version is a translation, for information purposes only, of the original document issued and prepared in Spanish. In the event of a discrepancy, the original Spanish-language version prevails.
2
Introduction
The Basel regulatory framework for banking is based on three pillars:
Pillar 1: Minimum capital requirements
Pillar 2: Supervisory review
Pillar 3: Market discipline
This report complies with the requirements of Part Eight of EU Regulation 575/2013 of the European Parliament and of the Council (hereinafter, the CRR), which constitutes Pillar 3 of the Basel regulations, with regard to public disclosure of the entity's risk profile, risk management system, control of own funds and solvency levels. In preparing this report, we have also taken into consideration a number of additional developments and best practices, established by the EBA (European Banking Authority).
The report was prepared taking into consideration Article 432.2 of the CRR concerning information regarded as confidential. The purpose of this report is to provide market players with an assessment of the capital adequacy of the CriteriaCaixa Group (Criteria Group) at 31 December 2016. Specifically, it contains disclosures on own funds, exposures and risk assessment processes in the scope of prudential consolidation at the Criteria Group. As the CaixaBank Group, which forms part of the Criteria Group, is also subject to Regulation (EU) No 575/2013 and has its own “Pillar 3 Disclosures” report (attached in Appendix IV), the purpose of this report is to provide additional information on the contribution made by Criteria, as the parent company of CaixaBank, to the scope of prudential consolidation of the Criteria Group, other than the contribution made by the CaixaBank Group.
In compliance with Regulation (EU) No 575/2013, in February 2015, the Board of Directors approved the adaptation of the formal policy for disclosing the “Pillar 3 Disclosures” report to the regulatory requirements.
At its 28 April 2017 meeting and following the review carried out by the Audit and Control Committee, Criteria's Board approved the present “Pillar 3 Disclosures”.
The report is published in the economic-financial information section of Criteria’s website.
3
Contents Contents .................................................................................................................. 3
1. General disclosure requirements .......................................................................... 7
1.1. Scope of application .............................................................................................................. 7
1.1.1. Accounting reconciliation between the Public Balance Sheet and the Confidential Balance Sheet ............................................................................................ 9
1.1.2. Description of the consolidated group ........................................................................ 11
1.1.3. Other general information ........................................................................................... 12
1.1.4. Nature of the investment in CaixaBank ....................................................................... 13
1.2. Governance and organisation ............................................................................................. 14
1.2.1. Criteria Internal governance ........................................................................................ 14
1.2.1.1. Board of Directors ................................................................................................. 14
1.2.1.2. Audit and Control Committee ............................................................................... 15
1.2.1.3. Appointments and Remuneration Committee ..................................................... 16
1.2.1.4. Risk management .................................................................................................. 17
1.2.2. Risk management structure and objectives ................................................................ 17
1.2.2.1 Structural organisation of the risk function .......................................................... 20
1.2.2.2. Corporate Risk Map............................................................................................... 22
1.2.2.3. Risk Appetite Framework (RAF) ............................................................................ 23
1.2.3. Risk assessment and planning ..................................................................................... 27
1.2.4. Financial conglomerate................................................................................................ 27
1.2.5. Internal Control Model ................................................................................................ 28
1.3. Risk management policies and objectives ........................................................................... 30
1.3.1. Risk associated with equity investments ..................................................................... 30
1.3.2. Real estate risk ............................................................................................................. 34
1.3.3. Market risk ................................................................................................................... 36
1.3.4. Operational risk ........................................................................................................... 36
1.3.5. Liquidity risk ................................................................................................................. 37
1.3.6. Business risk ................................................................................................................. 39
1.3.7. Regulatory Compliance Risk ........................................................................................ 39
1.3.8. Legal / regulatory risk .................................................................................................. 41
2. Information on eligible own funds ...................................................................... 41
2.1. Regulatory framework ......................................................................................................... 41
2.2. Capital management ........................................................................................................... 43
2.3. Capital buffers ..................................................................................................................... 44
2.3.1. Pillar 2: Internal Capital Adequacy Assessment........................................................... 44
4
2.3.2. Capital buffers .............................................................................................................. 46
2.3.3. Stress test .................................................................................................................... 47
2.4. Leverage ratio ...................................................................................................................... 48
2.5. Indicators of global systemic importance ........................................................................... 48
3. Information concerning eligible own funds requirements ................................... 49
3.1. Minimum own funds requirements for credit risk .............................................................. 50
3.1.1. Credit risk ..................................................................................................................... 50
3.1.2. Counterparty risk ......................................................................................................... 51
3.2. Minimum own funds requirements for risk from the equity portfolio ............................... 51
3.2.1. Description, accounting recognition and measurement ............................................. 52
3.2.2. Fair value and carrying amount of equity investments ............................................... 54
3.2.3. Value of equity exposures ........................................................................................... 55
3.2.4. Valuation adjustments to available-for-sale equity instruments ................................ 57
3.3. Minimum own funds requirements for market risk ............................................................ 58
3.4. Minimum own funds requirements for operational risk ..................................................... 59
3.5. Internal capital adequacy assessment procedure ............................................................... 59
4. Information concerning remuneration ............................................................... 61
Appendix I. Main features of capital instruments .................................................... 69
Appendix II. Transitional own funds ........................................................................ 71
Appendix III. Information on leverage ratio............................................................. 74
Appendix IV. CaixaBank Group's Pillar 3 Disclosures - 2016 ..................................... 77
5
Acronyms Acronym Description
RWA
Risk-weighted assets. Weighting of assets under Basel Regulations according to their associated credit risk. The value is obtained by multiplying the exposure to a customer or counterparty by a specific factor to adjust for this risk.
(RWA)
ECB European Central Bank
(ECB)
BoS Bank of Spain
BRRD
The Directive establishing the framework for the recovery and resolution of credit institutions.
(Bank Recovery and Resolution Directive)
CaR Amount of capital reserved to cover potential risks.
(Capital at Risk)
CET1
Capital comprising the higher quality items of own funds. Including shares, undistributed earnings and minority interests
(Common Equity Tier One)
CRD IV Capital requirements directive
(36/2013 Capital Requirements Directive)
CRR
Regulation No. 575/2013 of the European Parliament and of the Council, of 26 June 2013. Directly applicable to all credit institutions of member states, with no need for transposition. Created with the purpose of holding all regulations in a “single rule book”
(Capital Requirements Regulation)
CVA Credit Valuation Adjustment. The difference between the value of the risk-free portfolio and the market value of the portfolio factoring in counterparty risk.
DCF
Discounted cash flow. Valuation method to determine the present value of future fund flows by discounting them at a rate that reflects the cost of capital.
DDM Dividend discount model. Method to value to price of a share using predicted dividends and discounting them back to the present value.
EBA European Banking Authority
G-SII Global Systemically Important Institutions
EW
In the RAF, the EW alert (amber traffic light) is the tolerance interval between the target and the limit, where there is room to take decisions when the metric is deteriorating.
(Early warning)
FBLC La Caixa Banking Foundation
FROB Fund for Orderly Bank Restructuring
GAV Gross asset value
ICAAP Internal Capital Adequacy Assessment Process
ILAAP Internal Liquidity Adequacy Assessment Process
IRB
Internal rating model used to calculate own funds requirements according to risk
(Internal Rating Based)
IRC Incremental default and migration risk
(Incremental Risk Charge)
IRP Pillar 3 Disclosures Report
6
Acronym Description
LGD Loss Given Default. Percentage of exposure to risk that is not expected to be recovered in the event of default
MDA
Maximum distributable amount payable in the form of dividends
(Maximum distributable amount)
MREL
Requirement that entities must have sufficient eligible instruments to absorb losses, and where applicable, recapitalise the entity
(Minimum Requirement of Eligible Liabilities)
SRM
Single Resolution Mechanism
EU system to manage crises in unviable financial institutions, to ensure an orderly resolution of failing banks with minimal costs to taxpayers and to the real economy
SSM Single Supervisory Mechanism
Comprising the ECB and supervisory authorities in participant EU countries
NAV Net Asset Value
IFRS International Financial Reporting Standards
O-SII Other Systemically Important Institution
PD Credit rating measurement to assess the probability of default on a one year horizon
(Probability of Default)
RAF Risk Appetite Framework
ICFRS
Internal Control over Financial Reporting System. A series of processes carried out by the Board of Directors, the Audit Committee, Senior Management and relevant employees to provide reasonable assurance of the reliability of the financial information disclosed to the markets.
SREP Supervisory Review and Evaluation Process
Additional TIER1 (AT1)
Capital mainly comprising hybrid instruments able to absorb losses on a going concern basis They must meet the following requirements: 1. Subordinated instruments, 2. Non-cumulative discretionary coupons or dividends, 3. No maturity date or incentive to redeem, 4. Retail products meeting requirements 1, 2 and 3, with quantitative limits
(Additional Tier 1 Capital)
TIER2 - T2
Capital mainly comprising hybrid instruments able to absorb losses on a gone concern basis They must meet the following requirements: 1. Subordinated instruments, 2. With a minimum residual life of 5 years, and 3. The investor has no rights to step up the payment of future flows (coupons or principal) except in the event of failure and liquidation
EU European Union
VaR Value at Risk
7
1. General disclosure requirements
1.1. Scope of application
The financial information set out in this report concerns the Criteria Group, the parent company of which is Criteria Caixa, SAU (hereinafter, “Criteria”), which at 31 December 2016 held a 45.32% stake in CaixaBank, SA.
Criteria forms part of Grupo Fundación Bancaria Caixa d’Estalvis i Pensions de Barcelona “la Caixa” (formerly Grupo Caixa d’Estalvis i Pensions de Barcelona) (hereinafter, the “la Caixa” Group), the parent company of which is Fundació Bancària “la Caixa”, Criteria's sole shareholder (hereinafter, “FBLC”).
Following completion of the corporate restructuring process in October 2014, FBLC is primarily engaged in the direct management of its welfare projects and, through Criteria (a wholly-owned company), manages the “la Caixa” Group's business assets, essentially comprising shareholdings in strategic sectors, including domestic and international banking, through its stake in CaixaBank (the leading financial group in the Spanish retail banking market), energy, infrastructure, services and real estate.
It should be pointed out that by consolidating a banking group such as CaixaBank using the full consolidation method (the CaixaBank Group contributes 96% of the total assets of the Criteria Group), most risks faced and managed by the Criteria Group relate to the CaixaBank Group's banking and insurance business. Since the CaixaBank Group has its own “Pillar 3 Disclosures” report, attached in Appendix IV, setting out all the risks arising from its business and associated capital requirements, the purpose of this report is to disclose additional information on the contribution made by Criteria, as the parent company of CaixaBank, to the scope of prudential consolidation of the Criteria Group, other than the contribution made by the CaixaBank Group (see scope of application in Chart 1). CaixaBank's Senior Management and governance bodies manage the risks arising from the CaixaBank Group's business activities.
8
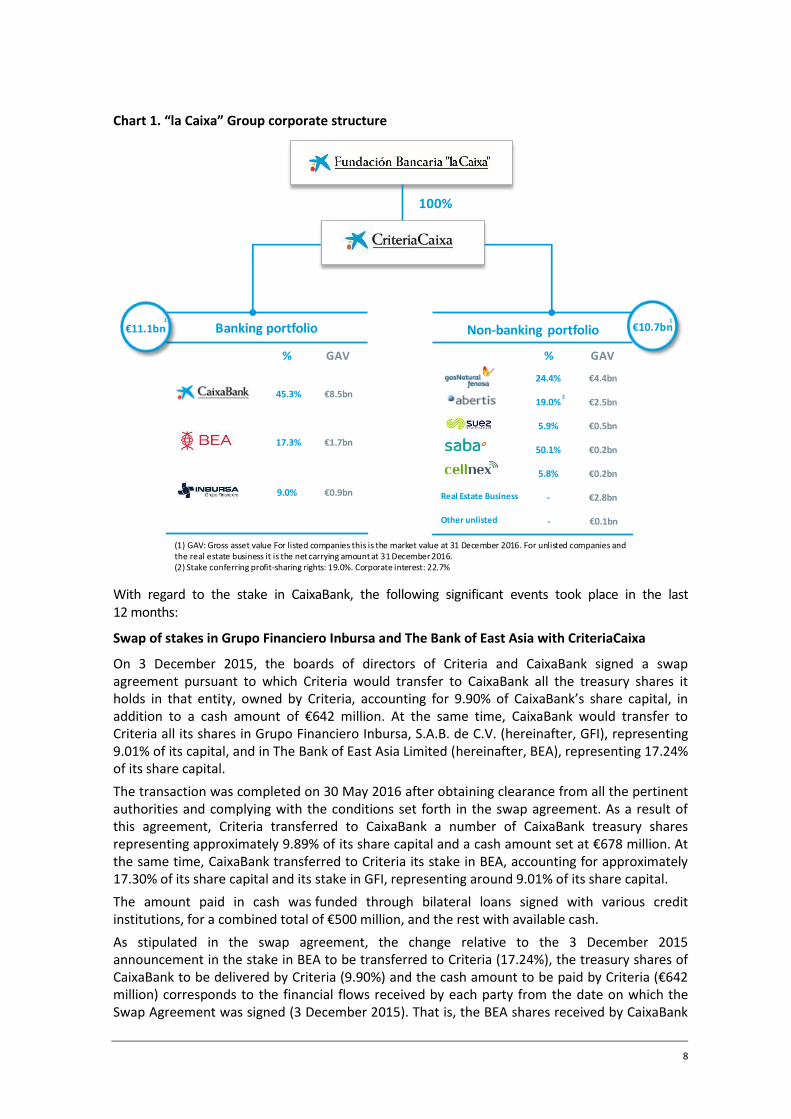
Chart 1. “la Caixa” Group corporate structure
With regard to the stake in CaixaBank, the following significant events took place in the last 12 months:
Swap of stakes in Grupo Financiero Inbursa and The Bank of East Asia with CriteriaCaixa
On 3 December 2015, the boards of directors of Criteria and CaixaBank signed a swap agreement pursuant to which Criteria would transfer to CaixaBank all the treasury shares it holds in that entity, owned by Criteria, accounting for 9.90% of CaixaBank’s share capital, in addition to a cash amount of €642 million. At the same time, CaixaBank would transfer to Criteria all its shares in Grupo Financiero Inbursa, S.A.B. de C.V. (hereinafter, GFI), representing 9.01% of its capital, and in The Bank of East Asia Limited (hereinafter, BEA), representing 17.24% of its share capital.
The transaction was completed on 30 May 2016 after obtaining clearance from all the pertinent authorities and complying with the conditions set forth in the swap agreement. As a result of this agreement, Criteria transferred to CaixaBank a number of CaixaBank treasury shares representing approximately 9.89% of its share capital and a cash amount set at €678 million. At the same time, CaixaBank transferred to Criteria its stake in BEA, accounting for approximately 17.30% of its share capital and its stake in GFI, representing around 9.01% of its share capital.
The amount paid in cash was funded through bilateral loans signed with various credit institutions, for a combined total of €500 million, and the rest with available cash.
As stipulated in the swap agreement, the change relative to the 3 December 2015 announcement in the stake in BEA to be transferred to Criteria (17.24%), the treasury shares of CaixaBank to be delivered by Criteria (9.90%) and the cash amount to be paid by Criteria (€642 million) corresponds to the financial flows received by each party from the date on which the Swap Agreement was signed (3 December 2015). That is, the BEA shares received by CaixaBank
Banking portfolio
45.3%
17.3%
9.0%
Non-banking portfolio
24.4%
19.0%
5.9%
5.8%
50.1%
€11.1bn €10.7bn
€8.5bn
€1.7bn
€0.9bn
€4.4bn
€2.5bn
€0.5bn
€0.2bn
€0.2bn
€2.8bnReal Estate Business -
% GAV % GAV
€0.1bnOther unlisted -
100%
2
1 1
(1) GAV: Gross asset value For listed companies this is the market value at 31 December 2016. For unlisted companies andthe real estate business it is the net carrying amount at 31 December 2016.(2) Stake conferring profit-sharing rights: 19.0%. Corporate interest: 22.7%
9
as a scrip dividend, the CaixaBank shares received by Criteria as a scrip dividend and the net adjustment for the dividends received in cash by Criteria and CaixaBank corresponding to the shares being transferred under the swap agreement.
As a result of the swap, the shareholder agreements relating to BEA and GFI were amended accordingly in order for Criteria to take over CaixaBank’s position as the new shareholder. CaixaBank will remain as a banking partner to both banks to continue cooperating with them in commercial activities. When making strategic investments in banks that operate on the American continent and in the Asia-Pacific area, Criteria and CaixaBank will continue to operate through GFI and BEA, respectively, except where GFI decides not to take part in the investment.
CaixaBank’s takeover bid for Banco BPI
The acceptance period for CaixaBank’s takeover bid for Banco BPI, S.A. ended on 7 February 2017. Acceptance of the offer totalled 568,362,308 Banco BPI, S.A. shares, representing 39.01% of its share capital. The price offered was €1.134 per share, with a total pay-out of €644,522,857.27.
As a result of the bid, CaixaBank’s stake in Banco BPI, S.A. has increased from 45.5% to 84.51% of its share capital.
The impact of this transaction has not been included in this report. For further information, see Appendix IV. CaixaBank Group's Pillar 3 Disclosures report.
1.1.1. Accounting reconciliation between the Public Balance Sheet and the Confidential Balance Sheet
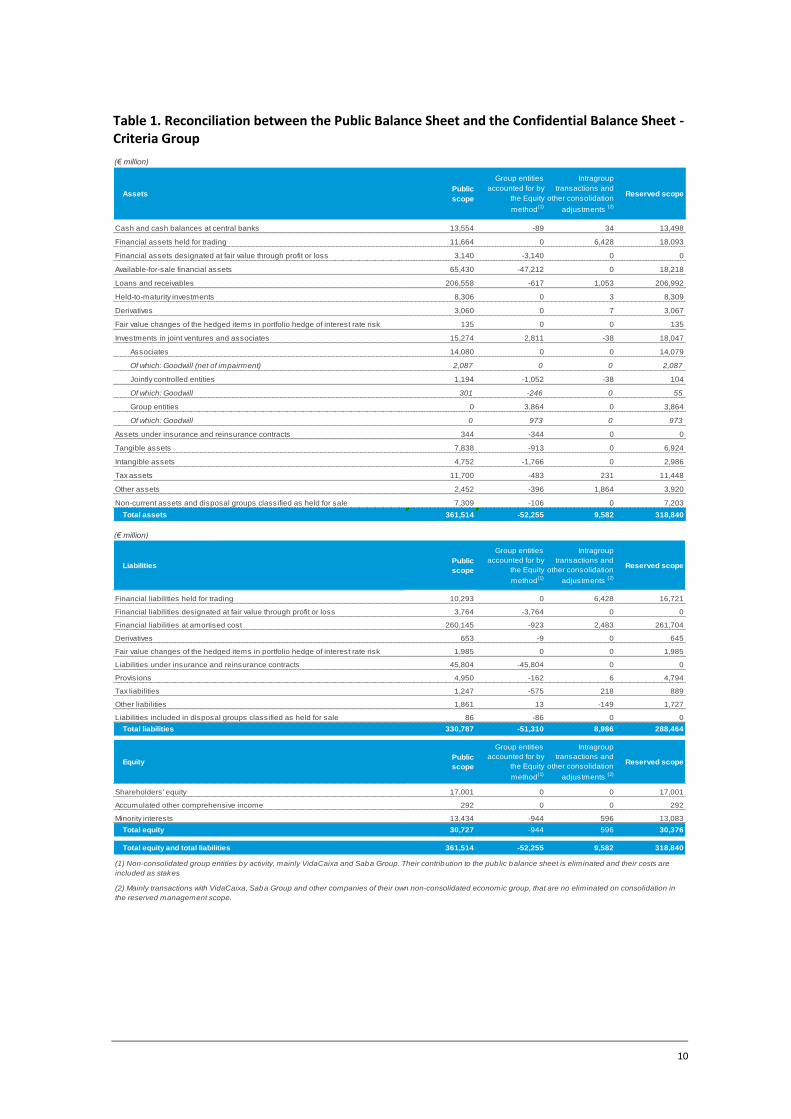
As set out in Annex I of Commission Implementing Regulation (EU) 1423/2013, the following table reconciles the balance sheet items used to calculate eligible own funds and regulatory own funds, comparing the accounting information disclosed in the financial statements with the confidential balance sheet regulatory information included in this report.
10
Table 1. Reconciliation between the Public Balance Sheet and the Confidential Balance Sheet - Criteria Group
Amounts in millions of euros
AssetsPublic
scope
Group entities
accounted for by
the Equity
method(1)
Intragroup
transactions and
other consolidation
adjustments (2)
Reserved scope
Cash and cash balances at central banks 13,554 -89 34 13,498
Financial assets held for trading 11,664 0 6,428 18,093
Financial assets designated at fair value through profit or loss 3,140 -3,140 0 0
Available-for-sale financial assets 65,430 -47,212 0 18,218
Loans and receivables 206,558 -617 1,053 206,992
Held-to-maturity investments 8,306 0 3 8,309
Derivatives 3,060 0 7 3,067
Fair value changes of the hedged items in portfolio hedge of interest rate risk 135 0 0 135
Investments in joint ventures and associates 15,274 2,811 -38 18,047
Associates 14,080 0 0 14,079
Of which: Goodwill (net of impairment) 2,087 0 0 2,087
Jointly controlled entities 1,194 -1,052 -38 104
Of which: Goodwill 301 -246 0 55
Group entities 0 3,864 0 3,864
Of which: Goodwill 0 973 0 973
Assets under insurance and reinsurance contracts 344 -344 0 0
Tangible assets 7,838 -913 0 6,924
Intangible assets 4,752 -1,766 0 2,986
Tax assets 11,700 -483 231 11,448
Other assets 2,452 -396 1,864 3,920
Non-current assets and disposal groups classified as held for sale 7,309 -106 0 7,203
Total assets 361,514 -52,255 9,582 318,840
Amounts in millions of euros
LiabilitiesPublic
scope
Group entities
accounted for by
the Equity
method(1)
Intragroup
transactions and
other consolidation
adjustments (2)
Reserved scope
Financial liabilities held for trading 10,293 0 6,428 16,721
Financial liabilities designated at fair value through profit or loss 3,764 -3,764 0 0
Financial liabilities at amortised cost 260,145 -923 2,483 261,704
Derivatives 653 -9 0 645
Fair value changes of the hedged items in portfolio hedge of interest rate risk 1,985 0 0 1,985
Liabilities under insurance and reinsurance contracts 45,804 -45,804 0 0
Provisions 4,950 -162 6 4,794
Tax liabilities 1,247 -575 218 889
Other liabilities 1,861 13 -149 1,727
Liabilities included in disposal groups classified as held for sale 86 -86 0 0
Total liabilities 330,787 -51,310 8,986 288,464
EquityPublic
scope
Group entities
accounted for by
the Equity
method(1)
Intragroup
transactions and
other consolidation
adjustments (2)
Reserved scope
Shareholders' equity 17,001 0 0 17,001
Accumulated other comprehensive income 292 0 0 292
Minority interests 13,434 -944 596 13,083
Total equity 30,727 -944 596 30,376
Total equity and total liabilities 361,514 -52,255 9,582 318,840
(1) Non-consolidated group entities by activity, mainly VidaCaixa and Saba Group. Their contribution to the public balance sheet is eliminated and their costs are
included as stakes
(2) Mainly transactions with VidaCaixa, Saba Group and other companies of their own non-consolidated economic group, that are no eliminated on consolidation in
the reserved management scope.
(€ million)
(€ million)
11
1.1.2. Description of the consolidated group
The following provides a summary of the main differences in relation to the consolidation scope and methods applied to prepare information on the Criteria Group in this report and to prepare its consolidated financial statements:
1. For the preparation of the Criteria Group's consolidated financial statements, all the subsidiary undertakings (companies controlled by the parent undertaking) were fully consolidated. Jointly controlled entities (undertakings managed jointly) were accounted for using the equity method, with the exception of financial holding undertakings, which were consolidated using proportionate consolidation.
2. For the purposes of solvency, subsidiary undertakings with a different activity to that of a credit institution or of investment undertakings as defined in Directive 2013/36/EU and Regulation (EU) 575/2013, both of 26 June 2013, are accounted for using the equity method. Jointly controlled entities that are financial institutions were proportionately consolidated, regardless of the method applied in the financial statements.
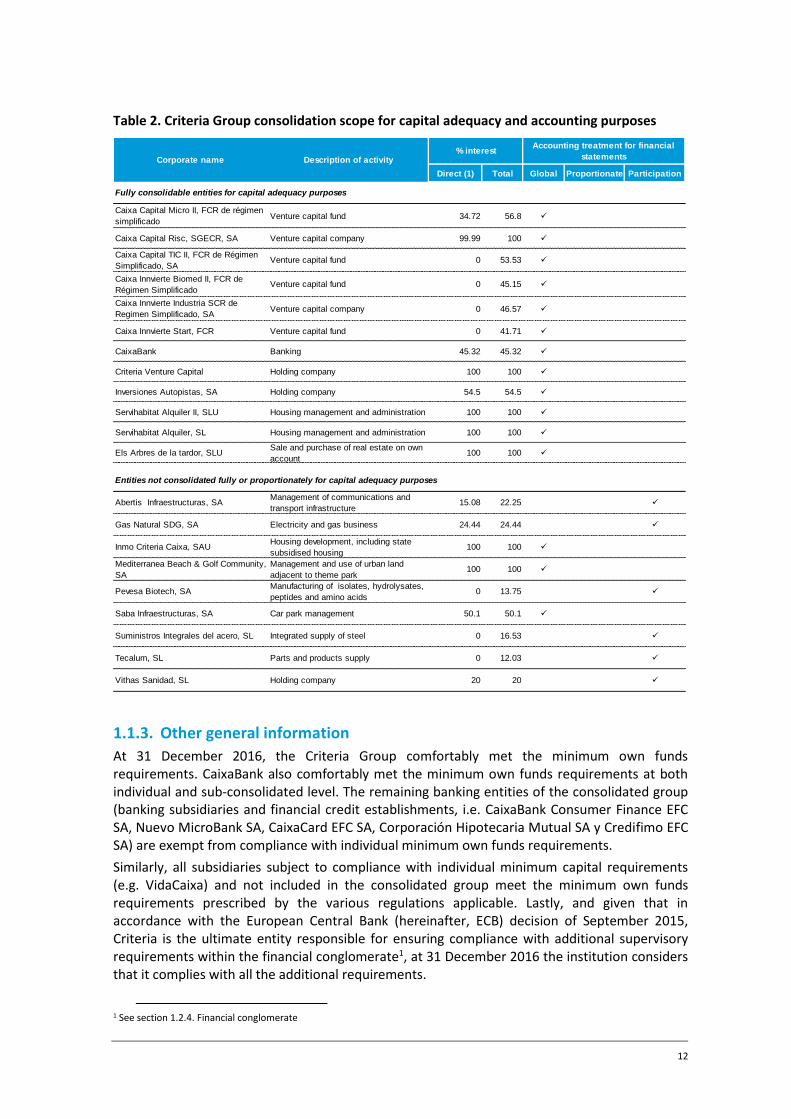
Table 1 details the treatment applied to each of the undertakings comprising the consolidation scope of the Criteria Group that do not form part of the CaixaBank Group (listed in Appendix IV), for the purposes of determining capital adequacy and preparing their consolidated financial statements.
12
Table 2. Criteria Group consolidation scope for capital adequacy and accounting purposes
1.1.3. Other general information
At 31 December 2016, the Criteria Group comfortably met the minimum own funds requirements. CaixaBank also comfortably met the minimum own funds requirements at both individual and sub-consolidated level. The remaining banking entities of the consolidated group (banking subsidiaries and financial credit establishments, i.e. CaixaBank Consumer Finance EFC SA, Nuevo MicroBank SA, CaixaCard EFC SA, Corporación Hipotecaria Mutual SA y Credifimo EFC SA) are exempt from compliance with individual minimum own funds requirements.
Similarly, all subsidiaries subject to compliance with individual minimum capital requirements (e.g. VidaCaixa) and not included in the consolidated group meet the minimum own funds requirements prescribed by the various regulations applicable. Lastly, and given that in accordance with the European Central Bank (hereinafter, ECB) decision of September 2015, Criteria is the ultimate entity responsible for ensuring compliance with additional supervisory requirements within the financial conglomerate1, at 31 December 2016 the institution considers that it complies with all the additional requirements.
1 See section 1.2.4. Financial conglomerate
Direct (1) Total Global Proportionate Participation
Caixa Capital Micro II, FCR de régimen
simplificadoVenture capital fund 34.72 56.8
Caixa Capital Risc, SGECR, SA Venture capital company 99.99 100
Caixa Capital TIC II, FCR de Régimen
Simplificado, SAVenture capital fund 0 53.53
Caixa Innvierte Biomed II, FCR de
Régimen SimplificadoVenture capital fund 0 45.15
Caixa Innvierte Industria SCR de
Regimen Simplificado, SAVenture capital company 0 46.57
Caixa Innvierte Start, FCR Venture capital fund 0 41.71
CaixaBank Banking 45.32 45.32
Criteria Venture Capital Holding company 100 100
Inversiones Autopistas, SA Holding company 54.5 54.5
Servihabitat Alquiler II, SLU Housing management and administration 100 100
Servihabitat Alquiler, SL Housing management and administration 100 100
Els Arbres de la tardor, SLUSale and purchase of real estate on own
account100 100
Abertis Infraestructuras, SAManagement of communications and
transport infrastructure15.08 22.25
Gas Natural SDG, SA Electricity and gas business 24.44 24.44
Inmo Criteria Caixa, SAUHousing development, including state
subsidised housing100 100
Mediterranea Beach & Golf Community,
SA
Management and use of urban land
adjacent to theme park100 100
Pevesa Biotech, SAManufacturing of isolates, hydrolysates,
peptides and amino acids0 13.75
Saba Infraestructuras, SA Car park management 50.1 50.1
Suministros Integrales del acero, SL Integrated supply of steel 0 16.53
Tecalum, SL Parts and products supply 0 12.03
Vithas Sanidad, SL Holding company 20 20
Accounting treatment for financial
statements% interest
Description of activityCorporate name
Entities not consolidated fully or proportionately for capital adequacy purposes
Fully consolidable entities for capital adequacy purposes
13
1.1.4. Nature of the investment in CaixaBank
In May 2016, the Board of Trustees of FBLC and Criteria’s Board of Directors agreed to place on record their intent to comply, before the end of 2017, with the requirements announced by the ECB in order for Criteria to effectively relinquish control of CaixaBank for prudential deconsolidation purposes, in view also of the fact that the European banking resolution authorities will likely decide that the scope of resolution lies at the Criteria Group level, which would effectively tie all of Criteria’s sole shareholder’s net worth to one single investment.
The conditions and requirements established by the ECB are essentially threefold:
a) Criteria’s stake in CaixaBank
Limited to 40% for both voting and dividend rights.
b) Corporate governance
Various measures to be implemented to limit Criteria’s influence on CaixaBank’s governance bodies.
c) Intra-group financing
Restrictions to be placed on CaixaBank lending to the Criteria Group/FBLC and its investees, and a first limit must be complied with in order to achieve deconsolidation, which must be reduced in the year after deconsolidation.
If the conditions set by the ECB are met, then the ECB will determine whether Criteria has effectively relinquished control of CaixaBank for prudential purposes. If the ECB confirms that control over CaixaBank has been relinquished and in the absence of other controlling stakes in other banks, Criteria would cease to be a mixed financial holding company for the purposes of Regulation (EU) No 575/2013, and consequently Criteria would no longer be required to comply with the capital requirements set out in that regulation.
Under International Financial Reporting Standards (IFRS 10 Consolidated Financial Statements) the fulfilment of the above-mentioned conditions, which would lead to the loss of control of CaixaBank by Criteria, would also imply the accounting deconsolidation.
At 31 December 2016, Criteria continued to consider CaixaBank as a subsidiary because none of the conditions that would imply a change of Criteria's control over CaixaBank had been met.
At 31 December 2016, the Company’s Directors had not started to formalise an active plan to monitor and comply with the conditions established by the ECB. In light of this and the materiality and uncertainty surrounding the changes required for compliance and to obtain the necessary regulatory approvals, at this date it is not considered highly probable that compliance will be achieved in 2017. That said, this situation does not undermine the Company’s commitment to try to complete the deconsolidation in 2017. Consequently, at 31 December 2016 the conditions set down in IFRS 5 for classification as a non-current asset held for sale have not been fulfilled.
After the reporting date, at a meeting in early February 2017, Criteria’s Audit and Control Committee responded to the improved financial market conditions at the beginning of 2017 by instructing Criteria’s CEO to start exploring the best alternative for reducing the economic stake in CaixaBank. As a result, on 6 February 2017, 318,305,355 shares representing approximately 5.322% of CaixaBank’s share capital were sold, thus bringing Criteria’s economic stake in CaixaBank to 40% (see section on Subsequent events). The CEO was also authorised in February 2017 to initiate a period for analysing the implications of the other deconsolidation conditions established by the European Central Bank, to enable the Board of Directors and/or the Audit and Control Committee to evaluate whether, given those implications, Criteria would be in a position to draw up an active plan to achieve the deconsolidation, entailing a substantial
14
change in the nature of the investment in CaixaBank. Ultimately, authorisation is required from the ECB.
1.2. Governance and organisation
1.2.1. Criteria Internal governance
By virtue of the provisions of the Law, Criteria's governing bodies are the Annual General Meeting and the Board of Directors.
At 31 December 2016 there was no executive or delegate committee. Nor is there a strategy and investment committee, or any committees other than the Audit and Control Committee and the Appointments and Remuneration Committee.
However, since Criteria is controlled by FBLC, its Governing Bodies are also influenced by the Board of Trustees, the supreme body of FBLC and several of its trustees sit on Criteria’s Board of Directors. The function of the Board of Trustees is to meet FBLC's objectives and carefully administer its assets and rights, maintaining their profitability and utility. It is also responsible for control and supervision, and reports to the Bank of Spain (hereinafter, BoS).
1.2.1.1. Board of Directors
With the exception of issues reserved for Annual General Meetings, the Board of Directors is Criteria's supreme decision-making body. Its duties are described in the company bylaws. Through the CEO, in turn advised by the Management Committee, it is responsible for reviewing and approving the organisational structure and reporting lines.
The Board of Directors' risk management responsibilities include the following:
Setting suitable internal control policies and basic risk management policies.
Supervising performance of the investee portfolio.
Approving and regularly updating Criteria's Risk Appetite Framework (hereinafter, the “RAF”), which lays down the limits and alerts for measuring and managing risk (at least once a year), as well as supervising and monitoring the effective risk profile.
Approving the Recovery Plan and other regulatory documents, and updating these at least once a year. For the Recovery Plan specifically, the Board of Directors bears the ultimate responsibility for approving the activation phase, as well as its deactivation, in the pertinent circumstances, and for transmitting this decision to the Supervisor.
Complying with the consolidated obligations as a Financial Conglomerate.2
The Board of Directors may appoint an executive committee and one or more chief executives from among its number. It may also create other committees formed by directors to carry out any functions it may deem appropriate.
Members of the Board of Directors need not be shareholders. The Annual General Meeting is responsible for appointing the members of the Board of Directors.
The breakdown of the Board of Directors is as follows:
2 See section 1.2.4. Financial conglomerate
15
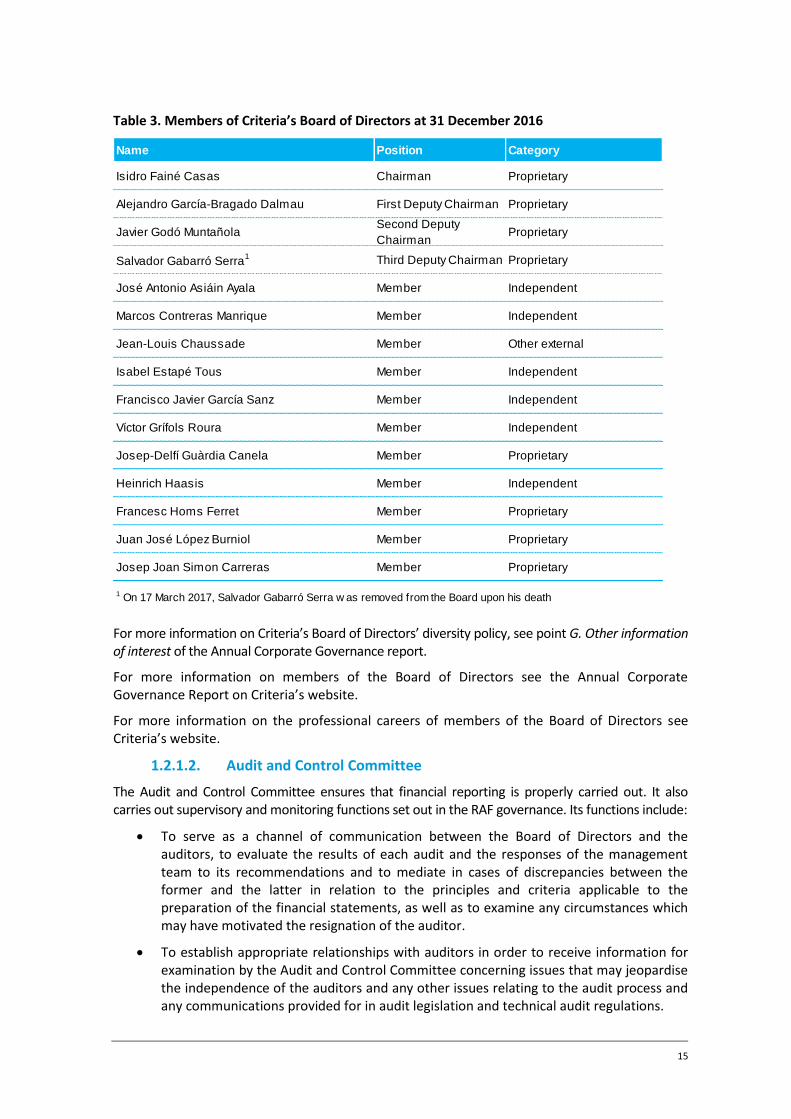
Table 3. Members of Criteria’s Board of Directors at 31 December 2016
For more information on Criteria’s Board of Directors’ diversity policy, see point G. Other information of interest of the Annual Corporate Governance report.
For more information on members of the Board of Directors see the Annual Corporate Governance Report on Criteria’s website.
For more information on the professional careers of members of the Board of Directors see Criteria’s website.
1.2.1.2. Audit and Control Committee
The Audit and Control Committee ensures that financial reporting is properly carried out. It also carries out supervisory and monitoring functions set out in the RAF governance. Its functions include:
To serve as a channel of communication between the Board of Directors and the auditors, to evaluate the results of each audit and the responses of the management team to its recommendations and to mediate in cases of discrepancies between the former and the latter in relation to the principles and criteria applicable to the preparation of the financial statements, as well as to examine any circumstances which may have motivated the resignation of the auditor.
To establish appropriate relationships with auditors in order to receive information for examination by the Audit and Control Committee concerning issues that may jeopardise the independence of the auditors and any other issues relating to the audit process and any communications provided for in audit legislation and technical audit regulations.
Name Position Category
Isidro Fainé Casas Chairman Proprietary
Alejandro García-Bragado Dalmau First Deputy Chairman Proprietary
Javier Godó MuntañolaSecond Deputy
Chairman Proprietary
Salvador Gabarró Serra1 Third Deputy Chairman Proprietary
José Antonio Asiáin Ayala Member Independent
Marcos Contreras Manrique Member Independent
Jean-Louis Chaussade Member Other external
Isabel Estapé Tous Member Independent
Francisco Javier García Sanz Member Independent
Víctor Grífols Roura Member Independent
Josep-Delfí Guàrdia Canela Member Proprietary
Heinrich Haasis Member Independent
Francesc Homs Ferret Member Proprietary
Juan José López Burniol Member Proprietary
Josep Joan Simon Carreras Member Proprietary
1 On 17 March 2017, Salvador Gabarró Serra w as removed from the Board upon his death
16
To supervise compliance with the auditing contract, striving to ensure that the opinion on the financial statements and the main contents of the audit report are drafted clearly and precisely.
To review the company’s accounts and periodic financial reporting that the Board must furnish to the markets and their supervisory bodies and, in general, to monitor compliance with legal requisites on this subject matter and the correct application of generally accepted accounting principles, and to report on proposals for modification of accounting principles and criteria suggested by management.
To supervise the internal auditing services, verifying the adequacy and integrity thereof, and proposing the selection, appointment and substitution of the persons responsible for said services, to propose the budget for such services, and to verify that Senior Management bears in mind the conclusions and recommendations of their reports.
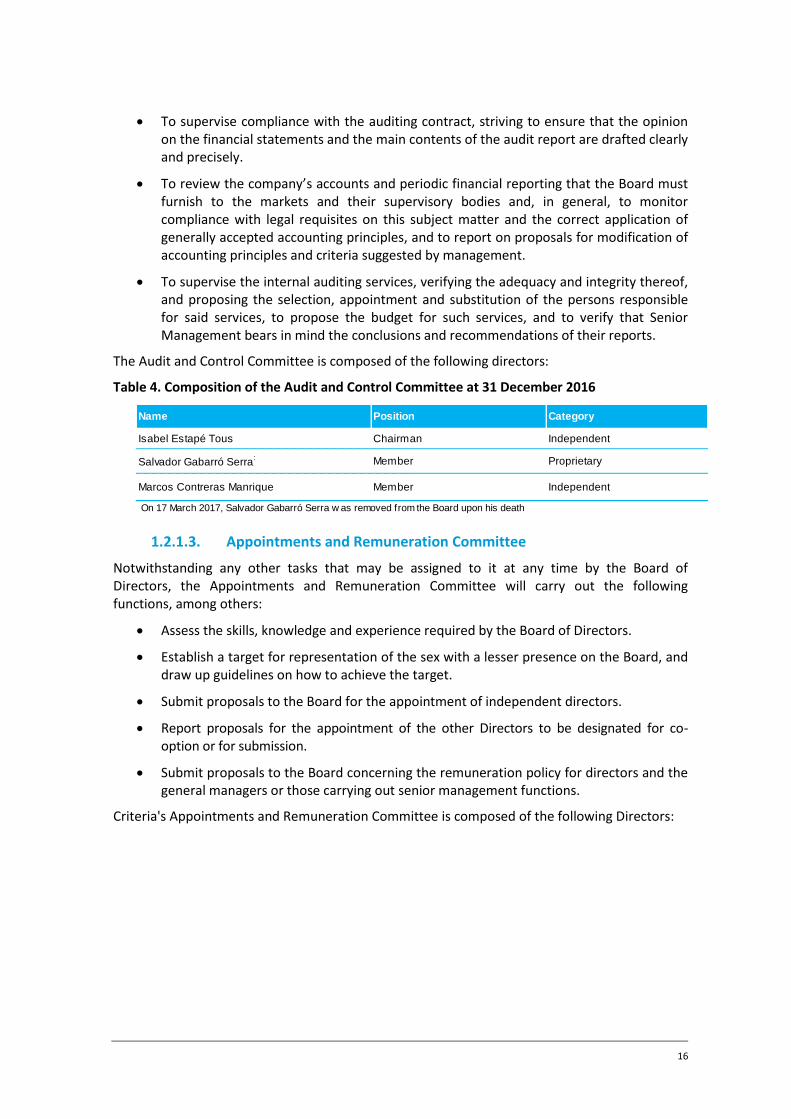
The Audit and Control Committee is composed of the following directors:
Table 4. Composition of the Audit and Control Committee at 31 December 2016
1.2.1.3. Appointments and Remuneration Committee
Notwithstanding any other tasks that may be assigned to it at any time by the Board of Directors, the Appointments and Remuneration Committee will carry out the following functions, among others:
Assess the skills, knowledge and experience required by the Board of Directors.
Establish a target for representation of the sex with a lesser presence on the Board, and draw up guidelines on how to achieve the target.
Submit proposals to the Board for the appointment of independent directors.
Report proposals for the appointment of the other Directors to be designated for co-option or for submission.
Submit proposals to the Board concerning the remuneration policy for directors and the general managers or those carrying out senior management functions.
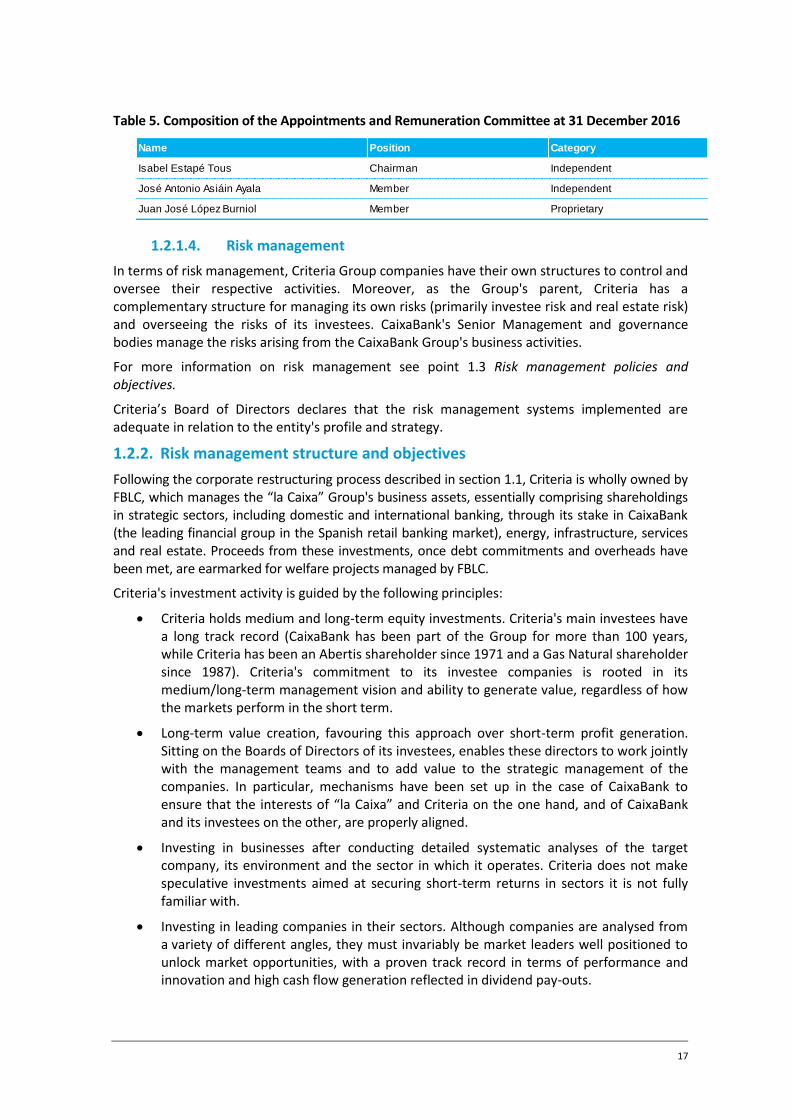
Criteria's Appointments and Remuneration Committee is composed of the following Directors:
Name Position Category
Isabel Estapé Tous Chairman Independent
Salvador Gabarró Serra: Member Proprietary
Marcos Contreras Manrique Member Independent
On 17 March 2017, Salvador Gabarró Serra w as removed from the Board upon his death
17
Table 5. Composition of the Appointments and Remuneration Committee at 31 December 2016
1.2.1.4. Risk management
In terms of risk management, Criteria Group companies have their own structures to control and oversee their respective activities. Moreover, as the Group's parent, Criteria has a complementary structure for managing its own risks (primarily investee risk and real estate risk) and overseeing the risks of its investees. CaixaBank's Senior Management and governance bodies manage the risks arising from the CaixaBank Group's business activities.
For more information on risk management see point 1.3 Risk management policies and objectives.
Criteria’s Board of Directors declares that the risk management systems implemented are adequate in relation to the entity's profile and strategy.
1.2.2. Risk management structure and objectives
Following the corporate restructuring process described in section 1.1, Criteria is wholly owned by FBLC, which manages the “la Caixa” Group's business assets, essentially comprising shareholdings in strategic sectors, including domestic and international banking, through its stake in CaixaBank (the leading financial group in the Spanish retail banking market), energy, infrastructure, services and real estate. Proceeds from these investments, once debt commitments and overheads have been met, are earmarked for welfare projects managed by FBLC.
Criteria's investment activity is guided by the following principles:
Criteria holds medium and long-term equity investments. Criteria's main investees have a long track record (CaixaBank has been part of the Group for more than 100 years, while Criteria has been an Abertis shareholder since 1971 and a Gas Natural shareholder since 1987). Criteria's commitment to its investee companies is rooted in its medium/long-term management vision and ability to generate value, regardless of how the markets perform in the short term.
Long-term value creation, favouring this approach over short-term profit generation. Sitting on the Boards of Directors of its investees, enables these directors to work jointly with the management teams and to add value to the strategic management of the companies. In particular, mechanisms have been set up in the case of CaixaBank to ensure that the interests of “la Caixa” and Criteria on the one hand, and of CaixaBank and its investees on the other, are properly aligned.
Investing in businesses after conducting detailed systematic analyses of the target company, its environment and the sector in which it operates. Criteria does not make speculative investments aimed at securing short-term returns in sectors it is not fully familiar with.
Investing in leading companies in their sectors. Although companies are analysed from a variety of different angles, they must invariably be market leaders well positioned to unlock market opportunities, with a proven track record in terms of performance and innovation and high cash flow generation reflected in dividend pay-outs.
Name Position Category
Isabel Estapé Tous Chairman Independent
José Antonio Asiáin Ayala Member Independent
Juan José López Burniol Member Proprietary
18
Criteria maintains a financial structure that allows it to obtain financing whenever investment opportunities arise and to guarantee continuity of the company.
To comply with these policies, Criteria's Board of Directors carries out supervisory functions to oversee the performance of its investees and periodically monitors the internal control and risk management systems in place for these investees.
In addition, Criteria's management monitors these holdings on an ongoing case-by-case basis to be able, at any time, to take the most appropriate decisions on the basis of predicted and observed market performance and of Criteria’s business plan.
To provide the necessary information, Criteria has set up specialised teams that continually monitor the operations of its investees, with the extent of this oversight depending on the degree of influence Criteria has over these companies. The teams use a combination of indicators that are updated periodically. By way of example, every six months the team tests all its investments for impairment and recognises any corrections to their carrying amounts required.
As explained earlier, the objective of this is the disclosure of additional information regarding Criteria's contribution, as the parent of CaixaBank, to the Criteria Group's scope of prudential consolidation, other than the contribution by the CaixaBank Group. CaixaBank's Senior Management and Governance Bodies manage the risks arising from the CaixaBank Group's business activities.
This two-fold nature is reflected in the reference scope for Criteria's risk analysis, using Criteria's consolidated figures without fully consolidating CaixaBank, which coincides with the risk management perimeter. This is known as the “management scope” and is the most suitable and representative view for managing the Company's risks.
Meanwhile, the consolidated scope of the Criteria Group, including CaixaBank, is used to calculate the regulatory limits that must be met by the company as an entity under prudential supervision and as a financial conglomerate3.
The composition of Criteria's assets on an individual basis is presented below, expressed in terms of market value or Gross Asset Value (GAV), demonstrating the extent to which each investee/asset contributes to the Company.
3 See section 1.2.4. Financial conglomerate
19
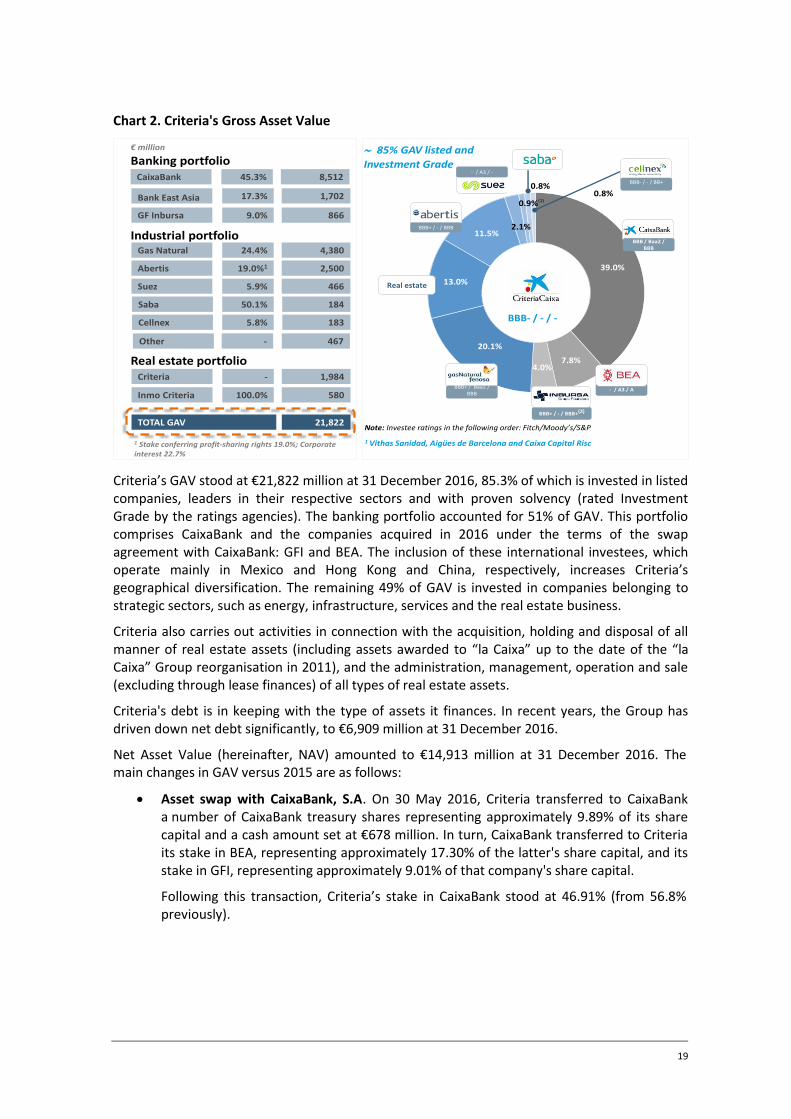
Chart 2. Criteria's Gross Asset Value
Criteria’s GAV stood at €21,822 million at 31 December 2016, 85.3% of which is invested in listed companies, leaders in their respective sectors and with proven solvency (rated Investment Grade by the ratings agencies). The banking portfolio accounted for 51% of GAV. This portfolio comprises CaixaBank and the companies acquired in 2016 under the terms of the swap agreement with CaixaBank: GFI and BEA. The inclusion of these international investees, which operate mainly in Mexico and Hong Kong and China, respectively, increases Criteria’s geographical diversification. The remaining 49% of GAV is invested in companies belonging to strategic sectors, such as energy, infrastructure, services and the real estate business.
Criteria also carries out activities in connection with the acquisition, holding and disposal of all manner of real estate assets (including assets awarded to “la Caixa” up to the date of the “la Caixa” Group reorganisation in 2011), and the administration, management, operation and sale (excluding through lease finances) of all types of real estate assets.
Criteria's debt is in keeping with the type of assets it finances. In recent years, the Group has driven down net debt significantly, to €6,909 million at 31 December 2016.
Net Asset Value (hereinafter, NAV) amounted to €14,913 million at 31 December 2016. The main changes in GAV versus 2015 are as follows:
Asset swap with CaixaBank, S.A. On 30 May 2016, Criteria transferred to CaixaBank a number of CaixaBank treasury shares representing approximately 9.89% of its share capital and a cash amount set at €678 million. In turn, CaixaBank transferred to Criteria its stake in BEA, representing approximately 17.30% of the latter's share capital, and its stake in GFI, representing approximately 9.01% of that company's share capital.
Following this transaction, Criteria’s stake in CaixaBank stood at 46.91% (from 56.8% previously).
CaixaBank 45.3% 8,512
Gas Natural 24.4% 4,380
Industrial portfolio
Abertis 19.0%1 2,500
Suez 5.9% 466
Cellnex 183
Real estate portfolioCriteria - 1,984
Inmo Criteria 100.0% 580
TOTAL GAV 21,822
€ million
1 Stake conferring profit-sharing rights 19.0%; Corporate interest 22.7%
Banking portfolio
Saba 50.1% 184
1 Vithas Sanidad, Aigües de Barcelona and Caixa Capital Risc
85% GAV listed and
Investment Grade
Note: Investee ratings in the following order: Fitch/Moody’s/S&P
Other - 467
5.8%
Bank East Asia 17.3% 1,702
GF Inbursa 9.0% 866
39.0%
7.8%4.0%
20.1%
13.0%
11.5%2.1%
0.9%
0.8%0.8%
BBB- / - / -
Real estate
BBB+ / - / BBB
- / A3 / -
BBB- / - / BB+
BBB / Baa2 /BBB
BBB+ / Baa2 / BBB
- / A3 / A
BBB+ / - / BBB+(2)
(1)
20
Sale of Gas Natural SDG, S.A. On 21 September 2016, Criteria and Repsol sold to GIP III Canary 1, S.À R.L shares representing 20% (10% corresponding to Criteria and 10% to Repsol) of the share capital of Gas Natural SDG, S.A for an amount of €1,901 million, equivalent to a price of €19 per share.
Following this transaction, Criteria’s stake in Gas Natural stands at 24.44% (from 34.44% previously).
Sale of CaixaBank S.A. shares. On 13 December 2016, Criteria carried out an accelerated bookbuild among institutional and/or qualified investors for a package of 100,000,000 CaixaBank shares representing 1.7% of the Bank's share capital. The share placement amounted to €315 million, at a sale price of €3.15 per share.
Following this transaction, Criteria’s stake in CaixaBank stands at 45.32% (from 46.91% previously).
1.2.2.1 Structural organisation of the risk function
In terms of risk management, Criteria Group companies have their own structures to control and oversee their respective activities. Moreover, as the Group's parent, Criteria has a complementary structure for managing its own risks (primarily investee risk and real estate risk) and overseeing the risks of its investees. CaixaBank's Senior Management and Governance Bodies manage the risks arising from the CaixaBank Group's business activities.
In accordance with prevailing legislation, Criteria's governance bodies are the Annual General Meeting and the Board of Directors.
However, since Criteria is controlled by FBLC, its governance bodies are also influenced by the Board of Trustees, the supreme body of FBLC. The function of the Board of Trustees is to meet FBLC's objectives and carefully administer its assets and rights, maintaining their profitability and utility. It is also responsible for control and supervision, and reports to the BoS.
For more information on the Board of Directors' risk management responsibilities see point 1.2.1.1. The Board of Directors.
Criteria's Audit and Control Committee is entrusted with supervising the preparation and presentation of the regulated financial information4 and the efficacy of the Company's internal control and risk management systems. It also carries out the supervisory and monitoring functions set out in the RAF Governance5.
Criteria’s Management Committee is composed of the Company’s senior executives and the CEO. It meets as a minimum every two weeks. Its duties are to advise the Chief Executive Management and guarantee coordination between its members.
The responsibilities of the Management Committee in relation to risk management include (i) reviewing and approving the methodology, processes and results of regulatory reports and their subsequent submission to the Board for approval; (ii) reviewing the RAF and coordinating control over compliance with limits and approved risk targets at least once a month; and (iii) within the framework of Regulatory Compliance, fostering a culture of compliance across the company, in addition to monitoring compliance risk and established mitigation measures.
The appointment of senior managers is the exclusive responsibility of the Board of Directors, which receives advice and a report from the Appointments Committee.
The composition of the Management Committee is as follows:
4 See information on ICFR in section 1.2.5. Internal control framework 5 and 7 See section 1.2.3. Risk Appetite Framework
21
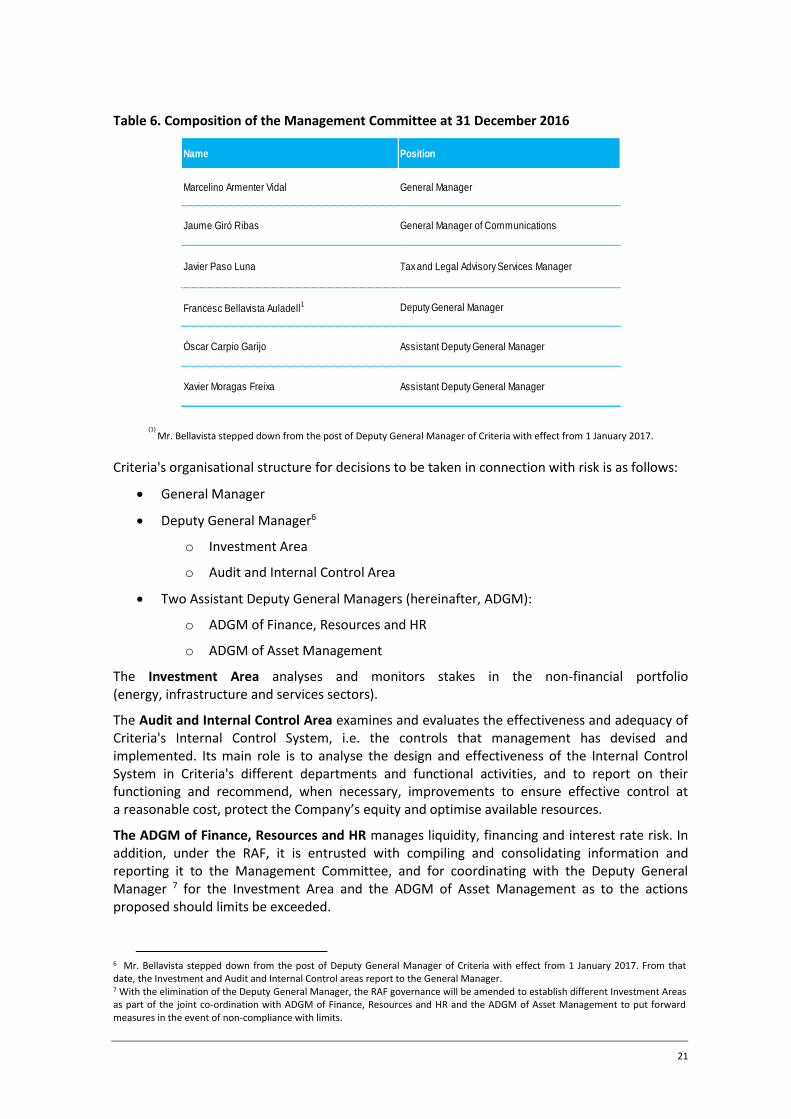
Table 6. Composition of the Management Committee at 31 December 2016
(1) Mr. Bellavista stepped down from the post of Deputy General Manager of Criteria with effect from 1 January 2017.
Criteria's organisational structure for decisions to be taken in connection with risk is as follows:
General Manager
Deputy General Manager6
o Investment Area
o Audit and Internal Control Area
Two Assistant Deputy General Managers (hereinafter, ADGM):
o ADGM of Finance, Resources and HR
o ADGM of Asset Management
The Investment Area analyses and monitors stakes in the non-financial portfolio (energy, infrastructure and services sectors).
The Audit and Internal Control Area examines and evaluates the effectiveness and adequacy of Criteria's Internal Control System, i.e. the controls that management has devised and implemented. Its main role is to analyse the design and effectiveness of the Internal Control System in Criteria's different departments and functional activities, and to report on their functioning and recommend, when necessary, improvements to ensure effective control at a reasonable cost, protect the Company’s equity and optimise available resources.
The ADGM of Finance, Resources and HR manages liquidity, financing and interest rate risk. In addition, under the RAF, it is entrusted with compiling and consolidating information and reporting it to the Management Committee, and for coordinating with the Deputy General Manager 7 for the Investment Area and the ADGM of Asset Management as to the actions proposed should limits be exceeded.
6 Mr. Bellavista stepped down from the post of Deputy General Manager of Criteria with effect from 1 January 2017. From that date, the Investment and Audit and Internal Control areas report to the General Manager. 7 With the elimination of the Deputy General Manager, the RAF governance will be amended to establish different Investment Areas as part of the joint co-ordination with ADGM of Finance, Resources and HR and the ADGM of Asset Management to put forward measures in the event of non-compliance with limits.
Name Position
Marcelino Armenter Vidal General Manager
Jaume Giró Ribas General Manager of Communications
Javier Paso Luna Tax and Legal Advisory Services Manager
Francesc Bellavista Auladell1 Deputy General Manager
Óscar Carpio Garijo Assistant Deputy General Manager
Xavier Moragas Freixa Assistant Deputy General Manager
(1) Mr. Bellavista stepped dow n from the post of Deputy General Manager of Criteria w ith effect from 1 January 2017.
22
The ADGM of Asset Management8: monitors investments in the financial portfolio (formed by CaixaBank, BEA and GFI) and actively manages the real estate portfolio and supervises the services received by Servihabitat Servicios Inmobiliarios.
In the context of Criteria’s action plan for compliance with obligations relating to the Financial Conglomerate9, a new risk control function was created under this ADGM. Its basic mandate is to ensure compliance with the obligations and requirements established at any time by the prudential regulations applicable to Criteria.
In order to fulfil this mandate, the function will coordinate with CaixaBank's Executive Global Risk Management Division, its Planning and Capital Division and potentially with other CaixaBank teams that are involved in the function's objective, namely to ensure compliance with the prudential regulations applicable to Criteria.
1.2.2.2. Corporate Risk Map
The Internal Control Area has developed Criteria's Corporate Risk Map to identify, measure, monitor, control and report the different risks affecting the Company. This map offers a comprehensive vision of the risks associated with corporate activities and the control environment.
The Activities Map and the Corporate Risks Catalogue were approved by the Board of Directors in July 2015. The Catalogue was updated in July 2016.
Activities Map: map of the main activities associated with key areas in Criteria.
Corporate Risks Catalogue: facilitates monitoring and internal and external reporting of the Company's risks, based on whether they are specific risks of the financial activity or risks for continuity of the activity. Criteria's Catalogue is in line with the Single Supervisory Mechanism (SSM) Risk Catalogue.
Although Criteria's Catalogue reflects the risks arising from the Company's assets (“financial risks”), it also includes other risks that, due to their nature, could affect continuity of the business itself.
The main risks included in this Catalogue and periodically reported to Management and the Governance Bodies are:
Financial risks
o Credit
o Impairment of assets, both of equity holdings and of non-financial assets (primarily real estate)
o Interest rate risk in the banking book and currency risk
o Liquidity
o Market
o Business profitability
o Regulatory own funds
Non-financial risks
o Compliance
8 After 31 December 2016, the analysis, monitoring and management of stakes in the financial portfolio (banking stakes) and the risk control function (Financial Conglomerate) were separated from the ADGM of Asset Management. 9 See section 1.2.4. Financial conglomerate
23
o Reliability of financial reporting
o Legal/Regulatory
o Operational
o Reputational
Further information on the main risks in this list is provided in section 1.3.1. “Risk associated with equity investments” and the following sections.
1.2.2.3. Risk Appetite Framework (RAF)
The RAF enables all prudential obligations to be monitored and controlled. This framework sets out the policies, governance processes and indicators used to establish, disclose and monitor Criteria's risk appetite. The representative scope for the RAF is the Criteria consolidated management scope without fully consolidating CaixaBank, which coincides with the risk management scope. However, as Criteria is the head of the Financial Conglomerate and subject to prudential supervision requirements, the RAF includes regulatory indicators.
The RAF is a key risk management tool that enables the Board to determine the risk types and thresholds that Criteria, as an unlisted investment holding company that manages the assets of FBLC, can tolerate in order to achieve its business targets, while always seeking to keep a balance between risk and return.
Criteria’s RAF is a comprehensive and forward-looking tool based the best corporate governance practices and standards applicable10 to financial institutions, factoring in the Company's status as a holding company.
Governance of the RAF includes an annual updating process, except where sufficiently significant changes in the situation occur that may require the risk appetite to be changed at particular moments in time.
In 2016, the Board of Directors updated the RAF in terms of regulatory capital requirements by adapting to the new minimum capital requirements stipulated by the ECB, within the Supervisory Review and Evaluation Process (hereinafter, “SREP”11). The Management Committee performs a monthly follow up of the RAF, reviewing the RAF metrics scorecard.
10 Principles for an Effective Risk Appetite Framework, FSB (2013) and Report on Risk Appetite Frameworks and IT Infrastructure, SSG (2010) 11 Further information is provided in section 2.1. Regulatory Framework and in section 2.3.1. Pillar II: Internal Capital Adequacy Assessment
24
1. Risk appetite statement
Through the RAF, the Board has determined Criteria's risk appetite statement, focused on achieving a medium-low risk profile through prudent management and a business model of a holding company under the aforementioned principles.
Criteria's objective is to comply with all legal and compliance requirements, financial information reliability and regulatory requirements, and to minimise the incidence of operational and reputational risk, in order to avoid activities that may involve a negative reputational impact on the Group.
2. RAF Risk Map
As mentioned in section 1.2.2 Risk management objectives and structure, it is important to note that Criteria's risk analysis has a different reference scope depending on the particular focus given, either (1) the Company's management scope (Criteria consolidated scope, without fully consolidating CaixaBank), known as the “management scope”, which is the most appropriate and representative view for managing the Company's risks; or (ii) the calculation and analysis of mandatory regulatory ratios as an entity under prudential supervision and as a financial conglomerate, using the Criteria Group's consolidated scope including CaixaBank.
For the purposes of the RAF, Criteria’s risk map is drawn on the risk factors contained in its management scope and those relating to its prudential obligations and obligations as a financial conglomerate. Risks are also grouped according to the following dimensions:
Management indicators (management scope): Liquidity; Profitability; Impairment of investees; Market and interest and currency rates.
Regulatory indicators (consolidated perimeter): Own funds, credit and liquidity.
Risks are based on the Risks Catalogue, although certain risks, such as asset impairment, are excluded based on the specific classification of assets.
3. RAF structure
The RAF is based on a series of metrics with thresholds. The metrics, which synthesise the objectives defined in the risk appetite statement set by the Board of Directors, are standardised throughout the entity. Thresholds are defined and calibrated for each metric, specifying the risk tolerance levels acceptable by Criteria.
“Target”, “Alert” and “Limit” thresholds are established for each of the metrics through a system of warning traffic lights:
Target (“green traffic light”): represents the desired level of risk at which Criteria wishes to conduct its activities and business.
Early warning or EW (“amber traffic light”): The EW alert is the tolerance interval between the target and the limit, where there is room to take decisions when the metric is deteriorating.
If the EW threshold is crossed, the Management Committee is informed to assess whether an action plan should be implemented to remedy the situation. The Audit and Control Committee is also informed accordingly.
Limit (“red traffic light”): If this threshold is crossed, the risk has exceeded the limits of compliance.
In this scenario, the Management Committee reports the breach of limit, and proposed response, to the Board of Directors and the Audit and Control Committee. Once the response has been approved by the Board, the Management Committee will give the necessary instructions to carry out the measures approved.
25
The metrics defined in Criteria’s Recovery Plan have also been included, defining a Recovery Indicator (“black traffic light”) which, when activated, triggers a series of communications and governance processes predefined in the communication plan, in accordance with the severity of the situation.
The periodic metric calibration process has become a key process, as it leads to the (re)establishment of the thresholds described. The calibration is revised at least once a year as part of the RAF update process and whenever the Board considers it necessary. All changes must be approved by Criteria’s Board of Directors. Therefore, on 19 December 2016, the Board of Directors approved the recalibration to adapt the metrics and threshold values to the SREP's12 decision of November 2016.
The foregoing serves to ensure a comprehensive and gradual process for monitoring and scaling potential impairment in Criteria's risk profile, by proactively and progressively managing the possible impairment of the Company's financial position, while affording greater flexibility and prevention and reaction capacity in the event of a crisis scenario.
At year-end 2016, none of the RAF metrics had fallen in beyond the limit zone (red traffic light).
4. Reporting and governance of the RAF
The RAF scorecard, showing metrics trends, is submitted each month to Criteria's Management Committee and at least every six months to the Audit and Control Committee meetings and Board of Directors meetings, unless an ad hoc report is submitted earlier as a result of a request from the governance bodies or as required by the framework governance (non-compliance in metrics).
The reporting and governance framework linked to RAF thresholds allows the entity to proactively identify possible defaults and guarantees specific actions allowing it to attain the target levels of returns.
In this regard, Criteria’s Board of Directors approved the Group Recovery Plan (which includes the CaixaBank Recovery Plan as an Appendix) in September 2016. Issues addressed in this plan include a wide range of different types of measures (sale of assets, margin loans, etc.) that could raise capital and contingent liquidity and restore Criteria’s financial position in different crisis scenarios proposed and analysed.
The measures defined in Criteria’s Recovery Plan offer specific additional guarantees to ensure that the levels defined in the RAF are restored.
In line with the above, Criteria’s Board of Directors is responsible for updating and approving the RAF (at least annually) and for supervising and monitoring the effective risk profile. It is also responsible for ensuring that the risk culture is suitably transmitted.
Criteria’s Audit and Control Committee is tasked with supervising the process to prepare, approve, review and update the RAF and revise the RAF proposal submitted by the Management Committee, transmitting its opinion to the Board of Directors. Similarly:
In a normal situation, the Audit and Control Committee verifies that the RAF is being correctly monitored.
If there is a breach of the thresholds set down in the RAF, it evaluates and reviews the mode of action proposed by the Management Committee and submits opinion and recommendation reports to the Board of Directors.
12 Further information is provided in section 2.1. Regulatory Framework et al
26
Criteria’s Management Committee is responsible for reviewing the information on the RAF submitted by the ADGM of Finance, Resources and HR and coordinating control over compliance with the thresholds and targets approved in the RAF on a quarterly basis as a minimum. In particular:
In a normal situation, the Management Committee coordinates the monitoring of the RAF and refers the information reported by the ADGM of Finance, Resources and HR to the Audit and Control Committee and the Board of Directors on a half-yearly basis or whenever any of the indicators exceeds the established limit.
If the protocol for a breach of the alert levels is activated (“amber traffic light”), the Management Committee is responsible for approving the action to be taken by the ADGM of Finance, Resources and HR in coordination with the Deputy General Manager 13 for the Investment Area, and the ADGM of Asset Management, and report to the Audit and Control committee, in addition to instructing the execution of the measures approved and controlling their implementation.
If the protocol for a breach of limits is activated (“red traffic light”), the Management Committee is responsible for proposing the measures required to remedy the situation to the Audit and Control Committee and the Board of Directors. Once the response has been approved by the Board, the Management Committee will give the necessary instructions to carry out the measures approved and monitor their implementation.
The ADGM of Finance, Resources and HR prepares the draft during the process to prepare, approve, review or update the RAF and refers it to the Management Committee. This area is also responsible for compiling and consolidating the information necessary to monitor RAF indicators:
In a normal situation, the ADGM of Finance, Resources and HR reports to the Management Committee on a monthly basis.
If the protocol is activated due to a breach of either early warning levels (“amber traffic light”) or limits (“red traffic light”), the ADGM of Finance, Resources and HR scales this breach and, in coordination with the Deputy General Manager 14 for Investment and the ADGM of Asset Management, submits a proposal to the Management Committee on the mode of action to be taken. In either case, once the response is approved (by the Management Committee or by the Board of Directors, as appropriate):
o The ADGM of Finance, Resources and HR measures and reports the results of the implementation of these measures.
o The ADGM of Asset Management and the Deputy General Manager15 for the Investment Area participate in the implementation of the measures.
The governance system described ensures the involvement of both Criteria’s Senior Management and its Board of Directors and the latter is ultimately responsible for defining, updating and supervising the risk profile and monitoring the effective risk profile. Additionally, monitoring the RAF and regularly reporting to Senior Management ensures that the RAF is integrated into the Company’s risk management.
13 Following the elimination of the Deputy General Manager, the RAF governance will be amended to establish different Investment Areas as part of the joint co-ordination with ADGM of Finance, Resources and HR and the ADGM of Asset Management to put forward measures in the event of activation of the protocol for a breach of alert levels. 14 Following the elimination of the Deputy General Manager, the RAF governance will be amended to establish different Investment Areas as part of the joint co-ordination with ADGM of Finance, Resources and HR and the ADGM of Asset Management to put forward measures in the event of activation of the protocol for a breach of alert levels. 15 Following the elimination of the Deputy General Manager, RAF governance will be amended to include the different Investment Areas as parties involved in the implementation of measures.
27
The RAF is factored into the preparation of the ICAAP and ILAAP, which project the main RAF management metrics in the different scenarios. In particular, for the baseline scenario an exercise is carried out to confirm that the RAF indicators obtained are consistent with the stated appetite.
1.2.3. Risk assessment and planning
As a complement and reinforcement that feeds back into both the Corporate Risk Map and the Risk Appetite Framework, Criteria has put in place institutional processes and mechanisms to evaluate both the evolution of the risk profile (recent, future and hypothetical in stress scenarios), and to evaluate its own ability to ensure appropriate governance, management and control.
Risk Assessment
Annual procedure in which the Entity seeks to:
Identify, assess, classify and internally report significant changes in inherent risks assumed by the Entity in its environment and business model, due to changes in the level of risk (evolving) or to the appearance of other risks that could potentially become significant (emerging), and
Make a self-assessment of its risk management, control and governance capacity, as a tool to help detect best practices and weaknesses in relation to risks. All with the aim of maximising internal transparency and the risk culture, and to prioritise efforts and investments with a larger potential impact on the Group’s residual risk profile.
The scope and depth of this process, which originated in the context of the Internal Capital Adequacy Assessment (ICAAP) report, has been evolving in line with the self-defined goal of continuous improvement, and through the inclusion of the guidelines and recommendations published by European regulatory and supervisory bodies in recent years. These include the EBA consultation document on Draft Guidelines on internal governance and the EBA's Final Guidelines for consistent ICAAP assessments by supervision teams.
It is currently performed on a stand-alone basis, using quantitative information (based on compliance with RAF thresholds) and qualitative input provided by the internal representatives of internal areas involved in risk management and input from control areas. This information is supplemented with an external view from the Investor Relations area based on its knowledge of external stakeholders (e.g. rating agencies), providing an objective view of the self-assessments carried out by the areas taking part in risk management and control. This exercise is presented to the entity's governance bodies for review and approval, with the Board of Directors having the ultimate responsibility for approval, within the framework of the ICAAP report.
At 31 December 2016, Criteria had a medium-low risk profile, in line with the business model and risk tolerance defined by its Board of Directors. Its levels of solvency and leverage are also consistent with this profile and strategy.
The risk profile is consistent with the risk appetite statement issued by the Board. See Risk appetite statement
1.2.4. Financial conglomerate
In addition to the foregoing, in September 2015 the ECB stated that following the corporate modification carried out in 2014 (see section 1.1), FBLC (until that time the head of the “la Caixa” financial conglomerate) could no longer be considered a mixed financial holding company and, therefore, able to be the parent of the financial conglomerate. The ECB stated that, instead, Criteria is a mixed financial holding company and the parent of the “Criteria Group” financial conglomerate, including within the CaixaBank Group. This implies that, firstly, Criteria is subject to the CaixaBank Group's scope for prudential supervision, as determined in the applicable regulations16 (with CaixaBank as the Entity ultimately responsible for compliance with
16 Further information is provided in section 2.1. Regulatory framework
28
this prudential supervision) and, secondly, Criteria is the entity responsible for ensuring compliance with certain additional supervisory requirements at financial conglomerate level.
These additional requirements are derived from Law 5/2005 of 22 April, on supervision of financial conglomerates and modifying other financial sector laws, Royal Decree 1332/2005 of 11 November, implementing the aforementioned law, and its subsequent amendments. All of the above transposing Directive 2002/87/EC into Spanish law.
In particular, these requirements are as follows:
Provision of additional capital, calculated pursuant to articles 6 and 7 of the aforementioned Royal Decree. At 31 December 2016, the financial conglomerate's ratio was 146.2%.
Control of significant intragroup transactions within the financial conglomerate. Those transactions amounting to over 5% of the financial conglomerate's eligible own funds are considered significant.
Control of significant risk concentration in the financial conglomerate. Those risks amounting to over 10% of the financial conglomerate's eligible own funds are considered significant.
Ensuring internal control mechanism and risk management procedures in line with the conglomerate level.
To strengthen the internal control mechanism and risk management procedures, Criteria constantly collaborates with CaixaBank on an improvement framework. To do so, it has implemented a series of governance, risk control and internal control procedures to strengthen the standards of regulatory compliance for Financial Conglomerates.
At the date of this report, all these obligations are deemed to be met. 1.2.5. Internal Control Model
Developments in the financial system, macroeconomic trends and the transformation of the regulatory framework indicate the growing importance of assessing risk and the control environment of entities, imposing greater demands and responsibility on Senior Management and Governance Bodies.
Following the same criteria as CaixaBank and using the same corporate risk monitoring and internal control model, Criteria's model provides reasonable assurance that the Company will meet its objectives. This internal control model is based on the methodology and infrastructure designed for the CaixaBank Group, as detailed in Appendix IV.
Criteria's internal control environment operates in accordance with guidelines issued by the regulator and best practices in the financial sector, and is structured in accordance with the Three Lines of Defence model:
The first line of defence comprises the business units and support areas, which are responsible for identifying, measuring, controlling, mitigating and reporting the key risks affecting the Company as it carries out its business.
The second line of defence acts independently and is designed to identify, measure, monitor and report all material risks, as well as to establish and develop management and control systems for these risks, and design compliance policies. The second line of defence includes, inter alia, the Risk Control function (financial conglomerate), Regulatory Compliance and Internal Control.
The second line of defence was reinforced in 2016 through the inclusion of an additional resource in the Internal Control area.
29
The third line of defence, which comprises Internal Audit, is responsible for assessing the effectiveness and efficiency of risk management and the internal control systems, applying principles of independence and objectivity.
Audit and Internal Control
Criteria's Audit and Internal Control Area is in charge of ensuring the correct performance of and supervising the Entity's internal control system. It reports to Criteria's Chief Executive Management and the Audit and Control Committee, the body responsible for overseeing Criteria's Internal Control System.
Internal Control and Internal Audit operate independently from other Criteria Group areas and companies in accordance with guidelines issued by Regulatory and Supervisory Authorities.
The objective of Criteria's Internal Control area is to analyse and ensure, with reasonable assurance, that correctly designed and effectively applied Policies and Procedures are in place in the organisation, along with an appropriate internal control system at Criteria in order to inform the Audit and Control Committee of the status thereof.
Its main duties include:
Coordinating the Corporate Risk Map.
Advising Senior Management on the control protocols and action plans needed to resolve any control deficiencies.
Regularly reporting on Criteria’s control environment to Chief Executive Management and Governance Bodies
In performing its duties, this area provides a transversal view of the main risks assumed by the Entity and assesses its control environment.
The remit of Criteria's Internal Control Function is to inform the Audit and Control Committee of the performance of the internal control system at the Company and propose improvements at a reasonable cost.
Pursuant to the principles of independence and objectivity, and applying a systematic and disciplined approach, Internal Audit performs assurance and consulting services that add value to the Entity.
Internal Audit's main responsibilities include:
Assessing the effectiveness and efficiency of the Internal Control Systems established to mitigate the risks associated with the Company's activities, with a special focus on:
o Compliance with prevailing external legislation and requirements of supervisors.
o Compliance with internal policies and regulations, and alignment with best sector practices and uses.
o The reliability and integrity of financial and operational information, including the effectiveness of Internal Control over Financial Reporting (ICFR).
o Economical and efficient use of resources by the Company
Adding value by proposing recommendations to address weakness detected in reviews conducted and monitoring their implementation by the appropriate centres; and
Regularly reporting relevant information to the Chief Executive Management and the Audit and Control Committee on the conclusions of tasks carried out, weaknesses identified and recommendations made.
30
Criteria's Internal Control over Financial Reporting (ICFR) System
Since Criteria began issuing debt instruments traded on official over-the-counter markets (14 October 2014, the date on which the reorganisation of the “la Caixa” Group was completed), Criteria's Board has been responsible for ensuring that an adequate and effective ICFR system is in place. Then Audit and Control Committee is responsible for assessing whether the ICFR system works correctly. Lastly, Criteria's ADGM of Finance, Resources and HR is responsible for the system's design, implementation and performance.
Given that this is a group-wide responsibility and given CaixaBank's importance in financial reporting within the Criteria Group, Criteria has subcontracted various ICFR duties to the Internal Control over Financial Reporting Unit (hereinafter, ICFR Unit), part of the Internal Control over Financial Reporting and Models Management area17, which reports to the Executive Financial Accounting, Control and Capital (FACC) Division at CaixaBank.
The model is based on the international standards developed by the “Committee of Sponsoring Organizations of the Treadway Commission” (COSO), as well as a number of general principles and best practices developed by a group of experts and published in June 2010 by the Spanish Securities Market Regulator (CNMV) in the report entitled “Guidelines on Internal Control over Financial Reporting in Listed Companies”.
The mechanisms comprising the risk management and control systems regarding the process of publishing the Entity’s financial information are explained in more detail in the Criteria Annual Corporate Governance Report.
1.3. Risk management policies and objectives
The policies and objectives relating to the main risks in the Corporate Risks Catalogue are detailed below.
1.3.1. Risk associated with equity investments
1. Definition
The risk associated with equity investments entails the possible loss or impairment in the economic profitability of Criteria's business activities through equity instruments, caused by adverse movements in market prices, potential sales or investee insolvency (default).
From a management perspective, this is considered the most significant risk, as investments in equity instruments account for 88% of Criteria's total assets (GAV).
2. Description
At 31 December 2016, Criteria’s corporate structure was as follows:
17 After the publication date of this report, the Management changed the name to the Internal Financial Control Department.
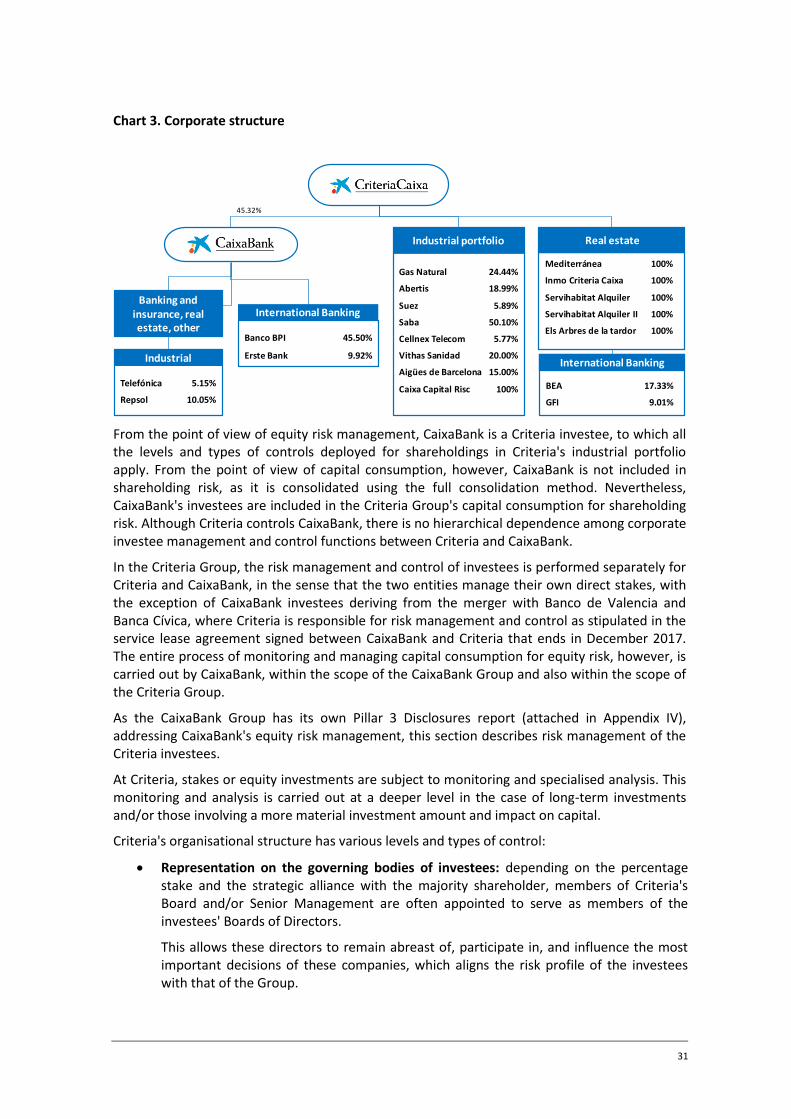
31
Chart 3. Corporate structure
From the point of view of equity risk management, CaixaBank is a Criteria investee, to which all the levels and types of controls deployed for shareholdings in Criteria's industrial portfolio apply. From the point of view of capital consumption, however, CaixaBank is not included in shareholding risk, as it is consolidated using the full consolidation method. Nevertheless, CaixaBank's investees are included in the Criteria Group's capital consumption for shareholding risk. Although Criteria controls CaixaBank, there is no hierarchical dependence among corporate investee management and control functions between Criteria and CaixaBank.
In the Criteria Group, the risk management and control of investees is performed separately for Criteria and CaixaBank, in the sense that the two entities manage their own direct stakes, with the exception of CaixaBank investees deriving from the merger with Banco de Valencia and Banca Cívica, where Criteria is responsible for risk management and control as stipulated in the service lease agreement signed between CaixaBank and Criteria that ends in December 2017. The entire process of monitoring and managing capital consumption for equity risk, however, is carried out by CaixaBank, within the scope of the CaixaBank Group and also within the scope of the Criteria Group.
As the CaixaBank Group has its own Pillar 3 Disclosures report (attached in Appendix IV), addressing CaixaBank's equity risk management, this section describes risk management of the Criteria investees.
At Criteria, stakes or equity investments are subject to monitoring and specialised analysis. This monitoring and analysis is carried out at a deeper level in the case of long-term investments and/or those involving a more material investment amount and impact on capital.
Criteria's organisational structure has various levels and types of control:
Representation on the governing bodies of investees: depending on the percentage stake and the strategic alliance with the majority shareholder, members of Criteria's Board and/or Senior Management are often appointed to serve as members of the investees' Boards of Directors.
This allows these directors to remain abreast of, participate in, and influence the most important decisions of these companies, which aligns the risk profile of the investees with that of the Group.
International Banking
Banco BPI 45.50%
Erste Bank 9.92%Industrial
Telefónica 5.15%
Repsol 10.05%
Gas Natural 24.44%
Abertis 18.99%
Suez 5.89%
Saba 50.10%
Cellnex Telecom 5.77%
Vithas Sanidad 20.00%
Aigües de Barcelona 15.00%
Caixa Capital Risc 100%
Industrial portfolio
Mediterránea 100%
Inmo Criteria Caixa 100%
Servihabitat Alquiler 100%
Servihabitat Alquiler II 100%
Els Arbres de la tardor 100%
Real estate
Banking and insurance, real estate, other
45.32%
International Banking
BEA 17.33%
GFI 9.01%
32
Controlling and financial analysis, through specialists solely responsible for monitoring changes in economic and financial data (hereinafter, “analysts”) as well as understanding and issuing alerts in the event of changes in regulations and competition in the countries and sectors in which the investees operate. The consolidation process is carried out on a monthly basis, and actual data on investees' contributions to the income statement and shareholders' equity are updated. In these processes, the outlook for securities markets and analysts’ opinions (e.g. recommendations, target prices, ratings) are shared with Senior Management for regular comparison with the market. Forecasts of the results of major investees are also updated regularly.
In line with accounting regulations, these teams have established a methodology for determining the recoverable amounts and potential impairment of stakes in associates and joint ventures. This methodology involves performing a valuation of the stakes held every six months and comparing this with figures on the balance sheet. Generally accepted valuation methods are employed, including discounted cash flow (DCF) models, dividend discount models (DDM), and other equivalent methods. This leads to a decision on the need to either increase or reduce the provisioning recognised for the stakes. Further, in March and September, the variables used as assumptions in the impairment test performed in each six monthly period are revised to determine if there are any indications of impairment or other material changes.
These financial analysts also liaise with listed investees' investor relations departments and, where applicable, other departments and gather the information, including reports by third parties (e.g. investment banks, rating agencies) needed for an overview of possible risks to the value of the stakes.
The conclusions on the accounting profit and loss and the most relevant alerts of changes in the contributions of equity investments are submitted to Senior Management and shared with the Criteria Group's Governance Bodies, generally each quarter.
Analysts also draw up annual year-end forecasts for investees and their respective dividends, as part of Criteria's budget planning process.
Accounting recognition: The ADGM of Finance, Resources and HR ensures that all information meets the relevant quality requirements, that it reaches the Company's accounting systems within the required deadlines, and that the subsequent external reporting is carried out. As a supplement, a set of controls are established within the process in accordance with Criteria's internal control over financial reporting (ICFR) system.
Calculation of exposure and capital charge: CaixaBank's Control of Major Risks and Planning and Capital Division monitors the exposure and regulatory capital consumption associated with both CaixaBank's and Criteria's equity investments, within the scope of the Criteria Group.
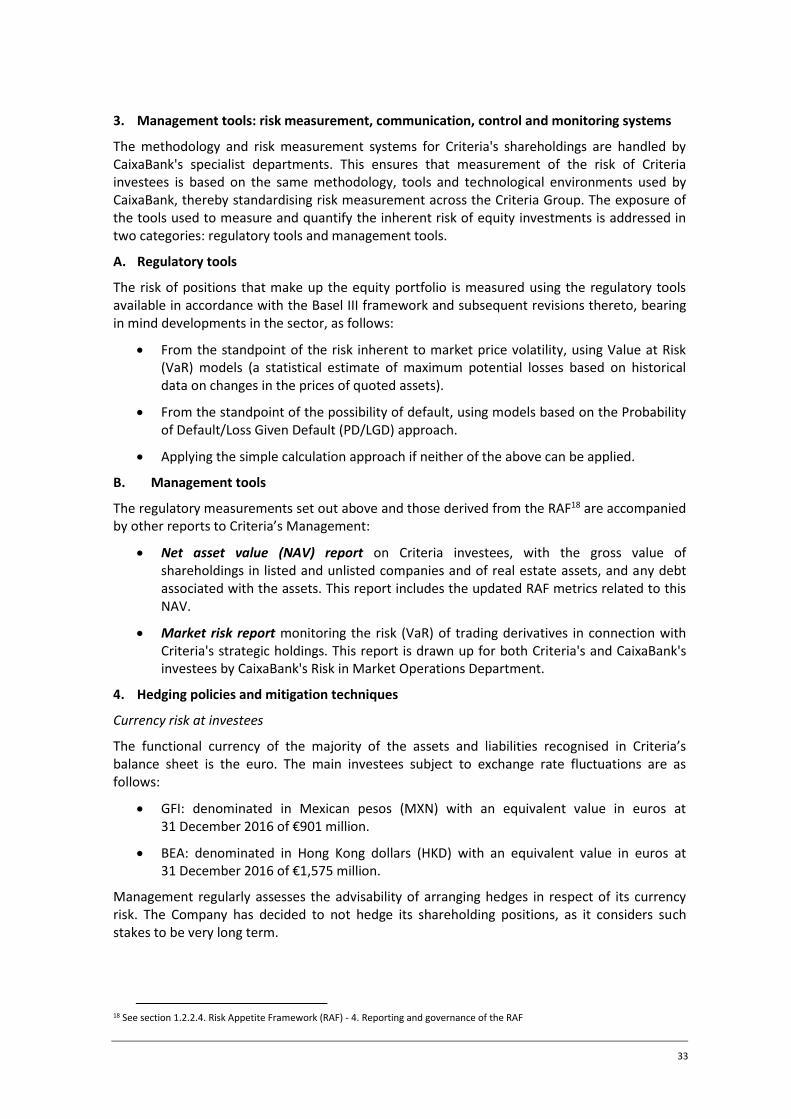
33
3. Management tools: risk measurement, communication, control and monitoring systems
The methodology and risk measurement systems for Criteria's shareholdings are handled by CaixaBank's specialist departments. This ensures that measurement of the risk of Criteria investees is based on the same methodology, tools and technological environments used by CaixaBank, thereby standardising risk measurement across the Criteria Group. The exposure of the tools used to measure and quantify the inherent risk of equity investments is addressed in two categories: regulatory tools and management tools.
A. Regulatory tools
The risk of positions that make up the equity portfolio is measured using the regulatory tools available in accordance with the Basel III framework and subsequent revisions thereto, bearing in mind developments in the sector, as follows:
From the standpoint of the risk inherent to market price volatility, using Value at Risk (VaR) models (a statistical estimate of maximum potential losses based on historical data on changes in the prices of quoted assets).
From the standpoint of the possibility of default, using models based on the Probability of Default/Loss Given Default (PD/LGD) approach.
Applying the simple calculation approach if neither of the above can be applied.
B. Management tools
The regulatory measurements set out above and those derived from the RAF18 are accompanied by other reports to Criteria’s Management:
Net asset value (NAV) report on Criteria investees, with the gross value of shareholdings in listed and unlisted companies and of real estate assets, and any debt associated with the assets. This report includes the updated RAF metrics related to this NAV.
Market risk report monitoring the risk (VaR) of trading derivatives in connection with Criteria's strategic holdings. This report is drawn up for both Criteria's and CaixaBank's investees by CaixaBank's Risk in Market Operations Department.
4. Hedging policies and mitigation techniques
Currency risk at investees
The functional currency of the majority of the assets and liabilities recognised in Criteria’s balance sheet is the euro. The main investees subject to exchange rate fluctuations are as follows:
GFI: denominated in Mexican pesos (MXN) with an equivalent value in euros at 31 December 2016 of €901 million.
BEA: denominated in Hong Kong dollars (HKD) with an equivalent value in euros at 31 December 2016 of €1,575 million.
Management regularly assesses the advisability of arranging hedges in respect of its currency risk. The Company has decided to not hedge its shareholding positions, as it considers such stakes to be very long term.
18 See section 1.2.2.4. Risk Appetite Framework (RAF) - 4. Reporting and governance of the RAF
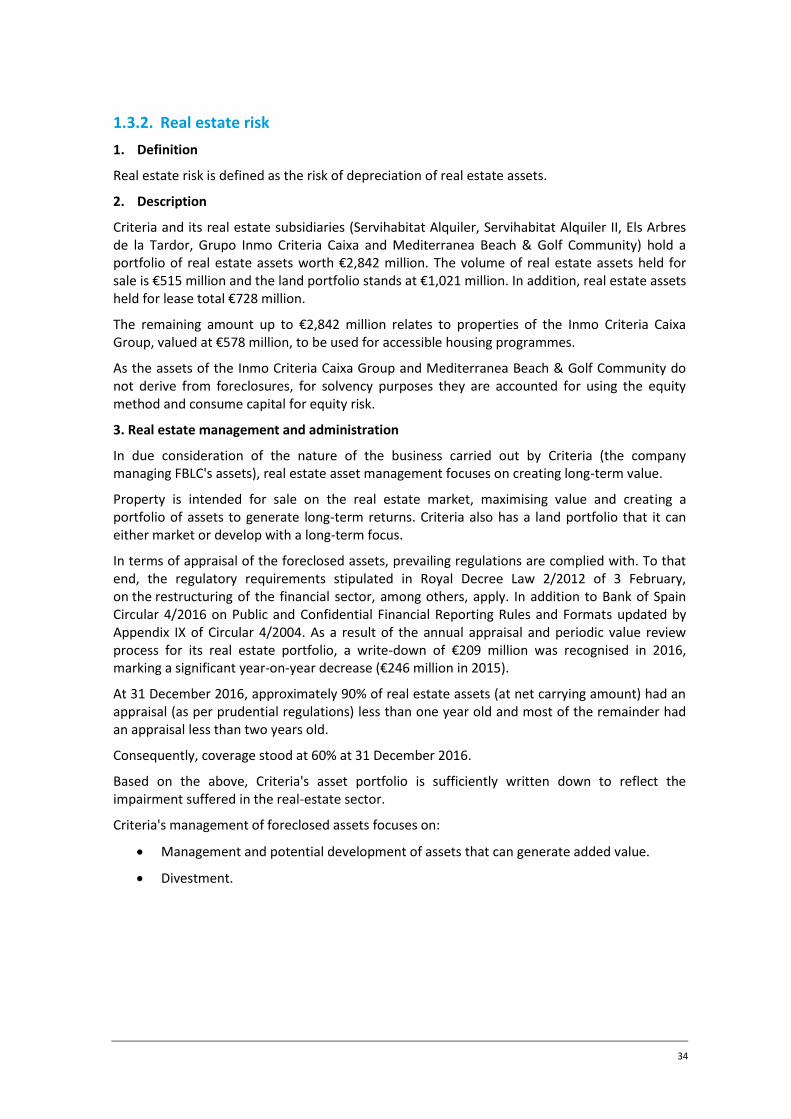
34
1.3.2. Real estate risk
1. Definition
Real estate risk is defined as the risk of depreciation of real estate assets.
2. Description
Criteria and its real estate subsidiaries (Servihabitat Alquiler, Servihabitat Alquiler II, Els Arbres de la Tardor, Grupo Inmo Criteria Caixa and Mediterranea Beach & Golf Community) hold a portfolio of real estate assets worth €2,842 million. The volume of real estate assets held for sale is €515 million and the land portfolio stands at €1,021 million. In addition, real estate assets held for lease total €728 million.
The remaining amount up to €2,842 million relates to properties of the Inmo Criteria Caixa Group, valued at €578 million, to be used for accessible housing programmes.
As the assets of the Inmo Criteria Caixa Group and Mediterranea Beach & Golf Community do not derive from foreclosures, for solvency purposes they are accounted for using the equity method and consume capital for equity risk.
3. Real estate management and administration
In due consideration of the nature of the business carried out by Criteria (the company managing FBLC's assets), real estate asset management focuses on creating long-term value.
Property is intended for sale on the real estate market, maximising value and creating a portfolio of assets to generate long-term returns. Criteria also has a land portfolio that it can either market or develop with a long-term focus.
In terms of appraisal of the foreclosed assets, prevailing regulations are complied with. To that end, the regulatory requirements stipulated in Royal Decree Law 2/2012 of 3 February, on the restructuring of the financial sector, among others, apply. In addition to Bank of Spain Circular 4/2016 on Public and Confidential Financial Reporting Rules and Formats updated by Appendix IX of Circular 4/2004. As a result of the annual appraisal and periodic value review process for its real estate portfolio, a write-down of €209 million was recognised in 2016, marking a significant year-on-year decrease (€246 million in 2015).
At 31 December 2016, approximately 90% of real estate assets (at net carrying amount) had an appraisal (as per prudential regulations) less than one year old and most of the remainder had an appraisal less than two years old.
Consequently, coverage stood at 60% at 31 December 2016.
Based on the above, Criteria's asset portfolio is sufficiently written down to reflect the impairment suffered in the real-estate sector.
Criteria's management of foreclosed assets focuses on:
Management and potential development of assets that can generate added value.
Divestment.
35
Chart 4. Management processes for real estate assets
Criteria relies on Servihabitat Servicios Inmobiliarios (51%-owned by the North American fund TPG and 49%-owned by CaixaBank) as the main party entrusted with selling and managing the majority of the portfolio throughout all the real-estate process phases.
To guarantee proper management and achieve its objectives, Criteria has defined protocols to give Servihabitat Servicios Inmobiliarios criteria for action to be taken and levels of autonomy. Main protocols in place at 31 December 2016 are as follows:
Sale of assets
Asset rentals
Management of asset procurement
Management of appraisals
Maintenance, repairs, insurance and supervision of properties
Promotions
Land management
Anti-Money Laundering and Counter Terrorist Financing
Criteria’s ADGM of Asset Management holds fortnightly meetings with the management of Servihabitat Servicios Inmobiliarios to follow up the protocols, analyse any incidents and report new courses of action.
Any major decisions concerning specific assets or any aspects that may affect a considerable portion of the real estate portfolio are referred to the Criteria Management Committee.
In early 2017, an agreement was reached with Servihabitat Servicios Inmobiliarios to cease providing these services during 2017, which will be transferred to a Criteria Group company to internalise administration tasks and focus on the long-term management of the portfolio.
For more information Real Estate risk management, see:
Point 7. Investment property, and 8 Leases in Criteria's Financial Statements published on the Criteria website.
Point 3.3.6 Information regarding financing for property development, home purchasing, and foreclosed assets; 3.3.3.7 Recoveries; and Note 18 Tangible assets -
(1) Includes developments in progress / plots ready for development with demand / land under management(2) Includes after-sales processes involving rental management and and handling and resolving grievances and incidents
MarketingManagement and development
Management Control and Administrative, Accounting and Reporting Processes
Foreclosure
• No significant additions to Criteria’s real estate asset
portfolio from the lending business
• Commercial preparation‐ Controlling, monitoring and managing new
foreclosed assets• Asset valuations
‐ Appraising the value of real estate assets, both at initial foreclosure and over the life of the asset through to sale or divestment
• Administrative management and management control‐ Administration services in relation to the
assets‐ Monitoring and management control
• Development and real estate development(1)
‐ Completion of work in progress‐ Zoning development of land‐ Selecting and advancing developments
• Retail sales‐ Management of the marketable
asset portfolio‐ Structuring of marketing and sales
channels‐ Fixing selling prices
• Portfolio sales‐ Portfolio design
Price analysisRelations and negotiations with investors
• Rental(2)
‐ Decision-making on assets to be rented
‐ Fixing rental prices‐ Arranging contracts
Sale
sR
en
t
36
investment properties in the consolidated financial statements published on Criteria’s website.
1.3.3. Market risk
1. Definition, description and management
The risk that the value of a financial instrument may vary as a result of changes to interest rates or exchange rates:
A. Interest rate risk
Interest rate risk relates mainly to changes in borrowing costs on debt. Therefore, the risk lies basically in the Company’s indebtedness. As part of its efforts to manage interest rate risk, the Company assesses the sensitivity of the fair value of assets and liabilities to changes in the structure of the market rate curve.
The market interest rate affects financial profit since certain financial liabilities and financial assets are arranged at a floating rate (tied to Euribor). Accordingly, there is considerable exposure to interest rate changes.
In order to mitigate the risk of fluctuations in interest rates on floating rate borrowings, Criteria's management evaluates whether or not to arrange swaps (cash flow hedges) depending on current and forecast interest rates. In that regard, Criteria has entered into certain floating-to-fixed interest rate swaps. At 31 December 2016, ~81% of gross debt bore a fixed interest rate.
With regard to the structure and organisation of this risk management function, the ADGM of Finances, Resources and HR is responsible for the management, monitoring and control of liquidity, funding and interest rates in alignment with the risk strategies approved by the Board.
B. Currency risk
At 31 December 2016, Criteria was exposed to currency risk through the integration of its international investees BEA and GFI, in terms of both market value and possible dividend payments.
Senior Management regularly assesses the advisability of arranging hedges in respect of its currency risks. The Company has decided to not hedge its shareholding positions, as it considers such stakes to be very long term.
It may also be indirectly exposed to this risk through foreign currency investments by investees due to their major international presence. Moreover, the business activities of most of Criteria’s investees are highly diverse geographically, and a large percentage of recurring profits is obtained in countries other than Spain.
Criteria’s policies, on the basis of the overall quantification of risk, take into account the advisability of arranging either derivative financial instruments or debt in the same currency or currencies of the economic environment as the assets in which the investment is made.
1.3.4. Operational risk
Operational risk is defined as the possibility of incurring financial losses due to the failure or unsuitability of processes, people, internal systems and external events.
The risk management process covers aspects relating to the following areas:
Technological
Risks of losses due to hardware or software inadequacies or failures in technical infrastructure that could compromise the availability, integrity, accessibility and security of the infrastructures and data.
37
Criteria receives maintenance and management services for specific IT applications from Serveis Informàtics la Caixa, S.A. (Silk), wholly owned by CaixaBank.
Operating processes and external events
Risk of loss or damage caused by operational errors in processes related to the Entity’s activity, due to external events beyond its control, or due to third parties outside the Entity, both accidentally and fraudulently.
All of the Group's areas and companies are responsible for the operational risks that arise from operating processes and external events within their respective remits.
Reliability of financial reporting
Risk of deficiencies in the accuracy, integrity and criteria of the process used when preparing the data necessary to evaluate the financial and equity situation of the Criteria Group.
This risk is managed using the 3 lines of defence model. The ADGM of Finance, Resources and HR is responsible for preparing financial information, while the Internal Control over Financial Information unit (ICFRS) and the Internal Audit function act as a second and third line of defence, respectively, to ensure the quality of the information reported both internally and to supervisors and the markets. Specifically, the Internal Control function is subcontracted to the Internal Control over Financial Reporting and Models Management area that reports to CaixaBank’s Financial Accounting, Control and Capital (FACC) division.
Further, CaixaBank renders services to Criteria involving preparation of the consolidated financial statements, capital planning and management, internal control over financial reporting, risk management, tax advice, legal advice and research services, among others.
For more information on the mechanisms making up the risk control and management systems relating to the process of preparing financial information for publication, see Criteria’s Annual Corporate Governance report on the entity’s website.
For more information on the structure and organisation of the Operational Risk management function see point 8.1. Operational risk management in Appendix IV. CaixaBank's Pillar 3 Disclosures report.
For more information on the Operational Risk management strategies and processes see point 8.3. Operational Risk Management Levers and 8.4 Link with the Corporate Risk Map in Appendix IV.
1.3.5. Liquidity risk
Liquidity risk relates to the possibility of a company not being able to meet its payment obligations because it cannot sell a financial instrument sufficiently quickly without incurring significant additional costs or needing additional finance. The liquidity risk associated with the possibility of converting financial investments into cash is of little significance, as these investments are generally quoted on deep and active markets.
As Criteria manages the assets of FBLC, it manages liquidity risk in accordance with its own asset management activity, prioritising the need to maintain a suitable long-term funding structure while guaranteeing the liquidity of its investments.
The liquidity risk to which Criteria is exposed is quite different to banking liquidity risk in that:
Criteria, as an investment holding company, is not authorised to receive money on deposit or grant loans to the general public, and therefore is not exposed to retail financing risks.
Its leverage structure is that of a non-financial company, and therefore it is far less reliant on borrowing than a bank.

38
Criteria does not offer customers collection and payment services, nor does it provide other services or products typical of a credit institution, such as trading on financial markets. As a result, intraday liquidity risk has no material bearing on its business.
Criteria and CaixaBank manage their liquidity on an independent and separate basis. Nevertheless, there is a free transfer of funds, and all the financial transactions between the entities and their respective subsidiaries are carried out at arm's length, pursuant to the FBLC-Criteria-CaixaBank Protocol of Internal Relations. This protocol was updated on 19 December 2016.
The liquidity risk management strategy essentially rests on the following pillars:
Ongoing active management of the maturity structure of liabilities, seeking a medium and long-term structure.
Streamlining the cost of funding by relying on a range of different available sources, and hedging against interest rate risk to avoid volatility in the cost of financial debt.
Diversifying sources of funding by partnering with domestic and international lending institutions (largely through senior unsecured bilateral arrangements) and issuing debt on the institutional market (senior unsecured).
Eliminating all direct debt with CaixaBank.
Eliminating the subordinated debt held by CaixaBank's retail investors with other sources of funding secured from institutional investors. It should be noted that in January 2017 the last subordinated debt issuance with these characteristics matured, for an amount of €1,505 million.
Ensuring the availability of contingent sources of funding to guard against a potential liquidity crisis.
Generating unrestricted positive cash flows, allowing Criteria to make the required dividend payments to FBLC.
Retaining a relevant volume of liquid assets in the balance sheet, with the bulk of these assets held in listed companies trading on deep liquid markets.
Maintaining an investment grade rating to ensure more favourable access to the financial markets.
For the purposes of measuring liquidity risk, the main indicators used by Criteria to monitor material liquidity risks are the RAF indicators (management and regulatory). The RAF is updated monthly; however, RAF metrics are updated more frequently (on a daily, weekly or monthly basis depending on the indicator).
With regard to liquidity risk data, the RAF scorecard, showing metrics trends, is submitted each month to Criteria's Management Committee and at least at one of every two Audit and Control Committee meetings and Board of Directors meetings, unless an ad hoc report is submitted earlier as a result of a request from the governance bodies or as required by the framework governance (non-compliance in metrics).
For more information on measurement and liquidity risk see point 1.2.2.3 Risk Appetite Framework (RAF) in this report.
39
1.3.6. Business risk
1. Description
Business risk relates to the inability to obtain a high enough return on capital to cover operating expenses (overheads and finance costs) and to sustainably distribute dividends to FBLC.
2. Assessment
Criteria’s business results depend mainly on the results reported by its investees. Criteria’s investment portfolio is diversified and includes investments in both cyclical and non-cyclical sectors. During the economic crisis and given the performance marked by the financial sector in Spain, the diversity of the investments made by Criteria mitigated the reduced profitability of the banking sector. Accordingly, the portfolio of energy, infrastructure, services and real estate stakes has acted as an additional buffer to ensure a permanent, significant flow of earnings to guarantee the Criteria’s own funds and, therefore, the returns expected by shareholders.
1.3.7. Regulatory Compliance Risk
Regulatory Compliance supervises compliance risk, which is defined as risk arising from deficient procedures that generate actions or omissions that are not aligned with the legal, regulatory framework, or with the internal codes and rules, and which could result in administrative or judicial sanctions or reputational damage.
Oversight of compliance risk is carried out through the establishment of second-tier controls, which allows for the detection of potential deficiencies in the procedures implemented in Criteria to ensure compliance with regulations in all its areas of activity. When deficiencies are detected, it develops, together with the areas affected, proposals for improvement initiatives, which are monitored regularly until they are effectively implemented. Best practices in integrity and rules of conduct are also followed at the Entity, such as the Ethics Code, the Internal Rules of Conduct on Matters Relating to the Securities Market, the Sanctions and International Financial Countermeasures Policy, the Code of Information Systems Use, and the Internal Control over Financial Reporting (ICFR) System.
Criteria's Board of Directors also approved an Anti-Money Laundering and Counter Terrorist Financing Manual laying down the obligations stipulated in Law 10/2010, of 28 April, on Anti-Money Laundering and Counter Terrorist Financing, and Royal Decree 304/2014, of 5 May, regulating this law.
Compliance risk is managed by all Company employees and divisions.
Criteria's objective is to minimise the probability of this risk occurring and, if it does, to detect, report and address the weaknesses promptly.
Compliance risk is managed through the following structure:
Board of Directors: The duties of which include overseeing risks (including compliance risk, in addition to any other risk).
The Audit and Control Committee: Its functions include supervising compliance with Internal Rules of Conduct on Matters Related to the Securities Market and other obligatory corporate policies, codes and manuals approved by the Entity, as well as, in general, applicable rules on corporate governance.
Management Committee: Fosters the compliance culture across the organisation, and controls and monitors compliance risk and the measures put in place to mitigate this risk.
40
Business and management areas: The ultimate exponent of the top tier control of the Company's activity, establishing controls over these risks as experts in this area. Its main duties include:
o Apply current regulations and identify potential compliance risks, developing and rolling out mitigation measures.
o Implement appropriate first level controls to ensure compliance with the aforementioned obligations.
Advisory functions: Carried out by the internal and external experts who advise on specialist areas. These include Legal Advisory, the Board Secretary's Office, external advisors, etc. The functions include:
o Advise business and management areas on keeping internal regulations up-to-date with current regulations.
o Interpret laws and regulations.
o Provide knowledge and analysis of current and planned regulations, projecting their potential impact on Criteria.
Supervision: This is mainly the role of Internal Audit, the functions of which include:
o Report on performance and put forward, when necessary, value proposals on improvements to ensure effective internal control at a reasonable cost.
o Conduct internal audits of Criteria and oversee internal audits of its investees.
o Provide information on the compliance risks identified in its audits and research undertaken at the behest of Regulatory Compliance.
Regulatory compliance risk is not limited to any specific area, but rather the entire Company. All employees must ensure compliance with prevailing regulations, applying procedures that capture regulations in their activity.
In order to manage compliance risk, the management and governance bodies encourage the dissemination and promotion of the values and principles set out in the Code of Business Conduct and Ethics and other policies and rules of conduct, and its members, as well as other employees and Senior Management must ensure their compliance as a core criteria guiding their day-to-day activities.
Criteria has also set up a whistle-blowing channel on its corporate intranet, the rules of use of which were approved by the Board of Directors on 29 April 2016. This channel can be used to submit enquiries about interpretation and application of the Code of Business Conduct and Ethics, Code of Information Systems Use, and the Internal Control over Financial Reporting (ICFR) System, and to report any breaches of the aforesaid internal rules.
Therefore, the areas whose business is exposed to compliance risk implement and manage a first level of risk indicators and controls to detect potential non-compliance risks and act effectively to mitigate them. They must also ensure that their regulations are at all times consistent with current legislation, regulatory standards and codes of conduct and standards, putting in place mechanisms to prevent issues arising, detect trends and understand new developments as they arise. Cooperation with advisory functions is therefore essential.
Under the auspices of Audit and Internal Control, Internal Control's duties include coordinating the Corporate Risk Map, which includes compliance risk, carrying out independent reviews.
Criteria Group companies have their own structures for the control and oversight of their respective activities. However, as the Group's Parent, Criteria offers a complementary structure for managing its own risks and overseeing the risks of its investees.
41
1.3.8. Legal / regulatory risk
Risk defined as the possibility of a loss or decrease in Criteria’s profitability as a result of changes to the regulatory framework or court rulings that are unfavourable to the Company. It encompasses risk relating to legislative or regulatory changes and the risk of legal or administrative claims. The former arises from possible amendments to the general legal framework or in the specific sector regulations that cause a loss or decrease in Criteria’s profitability. While the latter derives from possible claims filed by public administrations, customers, bondholders, suppliers or employees alleging non-compliance or illegal actions, violation of contractual clauses, or a lack of transparency.
2. Information on eligible own funds This section provides details of the Criteria Group's eligible own funds at 31 December 2016 and compares these to the eligible own funds of the CaixaBank Group, already disclosed in the CaixaBank Group's Pillar 3 Disclosures report (see Appendix IV).
2.1. Regulatory framework In 2010, the Basel Committee on Banking Supervision approved the reform of the global regulatory framework known as Basel III in the aftermath of the international financial crisis. The package of legislation transposing this framework came into force in the European Union with effect from 1 January 2014. It comprised Regulation 575/2013 (CRR) and Directive 2013/36 (CRD IV). These modifications sought to improve the banking sector’s ability to absorb the impact of economic and financial crises, whilst enhancing risk management and governance, transparency and information disclosure. Specifically, these improvements called for stricter requirements for the quantity and quality of capital, and the introduction of liquidity and leverage measures.
The CRR was applied immediately in Spain, with CRD IV being implemented through Royal Decree-Law 14/2013, Law 10/2014 and Royal Decree 84/2015, in addition to other lower level provisions, such as Bank of Spain Circular 2/2016. The CRR establishes a progressive implementation schedule for the new requirements in the European Union. Bank of Spain Circulars 2/2014, partially repealed by Circular 2/2016, and 3/2014 implemented the regulatory options applicable during the Basel III phase-in period. However, on 1 October 2016 these Circulars were replaced by European Regulation 2016/445 of the ECB, which sought to standardise various significant national discretions and options.
In 2014, the ECB took responsibility for supervision of the euro area, following Regulation 1024/2013 of the Council and ECB regulation 468/2014 coming into effect, giving rise to the creation of the Single Supervisory Mechanism (SSM). Under the SSM, the ECB takes direct responsibility for supervision of the most significant entities, including CaixaBank, and indirect responsibility for other entities, which are supervised directly by national authorities (including the Bank of Spain).
In 2015, the ECB completed the first cycle of the SREP process since the creation of the SSM, in implementation of Pillar 2 of the Basel Accord.
The SREP was designed by the EBA as a supervisory process to evaluate the adequacy of capital, liquidity, corporate governance, and risk management and control through a standardised European process based on the guidance published by the EBA in December. The SREP process may require additional capital or liquidity, or other qualitative measures in response to any risks and weaknesses detected by the supervisor in an entity. The SREP seeks to assess the viability of entities on an individual basis, also considering comparisons against their peers.
42
Any additional capital requirements under the SREP process (“Pillar 2” requirements) may also be complemented by combined capital buffer requirements (CBR), comprising capital conservation, anti-cyclical capital and systemic risk buffers.
In addition to the potential supervisory actions mentioned above, in 2014 Directive 2014/59/EU - otherwise known as the BRRD (Bank Recovery and Resolution Directive) - was approved, establishing a framework for the restructuring and resolution of credit institutions. In 2015, the BRRD was transposed into the Spanish regulatory framework through Law 11/2015 and others legislation. The BRRD, together with Directive 2014/49, on the Deposit Guarantee System, enhances the capacity of the banking sector to absorb the impact of economic and financial crises, and the capacity of entities to wind up their business in an orderly fashion, while maintaining financial stability, protecting depositors and avoiding the need for public bail-outs.
The BRRD requires Member States to ensure that institutions prepare and regularly update a recovery plan setting out the measures that may be taken by those institutions to restore their financial position following a significant deterioration thereof. In addition to the BRRD and national legislation, the EBA has issued several guidelines on the definition of a recovery plan.
The BRRD also introduced the framework to create a Single Resolution Mechanism (SRM), which was subsequently developed through Regulation EU 806/2014. Under the SRM, decisions are taken by the Single Resolution Board and executed by the National Resolution Authority (FROB and BoS in Spain), which also prepare the resolution plan in collaboration with each entity (which provides the information required).
The BRRD also introduces a new Minimum Requirement for Own Funds and Eligible Liabilities (MREL) ratio. The SRM came into effect on 1 January 2016 and will set MREL requirements for entities, probably in 2017, following assessment of their resolution plans. The MREL requirements must be covered by eligible own funds and other eligible liabilities.
On 23 November 2016, the European Commission put forward a package of reforms to address a series of banking regulations that will be submitted to the European Parliament and to the Council for approval. The objective of these reforms is to supplement the current prudential and resolution framework for the banking sector through a series of measures to reduce the risks to entities in the event of shocks, in accordance with the conclusions of the ECOFIN meeting in June 2016 and G-20 international standards. The reforms factor in the size, complexity and business profile of the banks. Measures are also included to support SME financing and boost investment in infrastructure.
The process of adapting applicable regulations is expected to continue throughout 2017, with the exception of the amendment to the BRRD relating to the hierarchy of lenders, which will be transposed into the legislation of member states in the first half of 2017, coming into force in July 2017.
In addition to capital regulations, in 2016 various pieces of legislation were published applicable to financial institutions. In particular, BoS Circular 4/2016, of 27 April introduces amendments to the content of Annex IX of Circular 4/2004, among others, on the calculation of impairment of debt instruments in the separate financial statements of financial institutions, to bring it into line with the latest developments in banking regulation, while remaining fully compatible with the IFRS accounting framework.
A number of international regulatory developments are also expected in 2017, emanating from both the Basel Committee and the EBA. These include: further progress on the review of capital consumption requirements for credit, market and operational risk; the treatment of sovereign debt in a prudential framework; review of credit valuation adjustment (CVA) risk in the development of IFRS 9 and IFRS 16, among other initiatives.
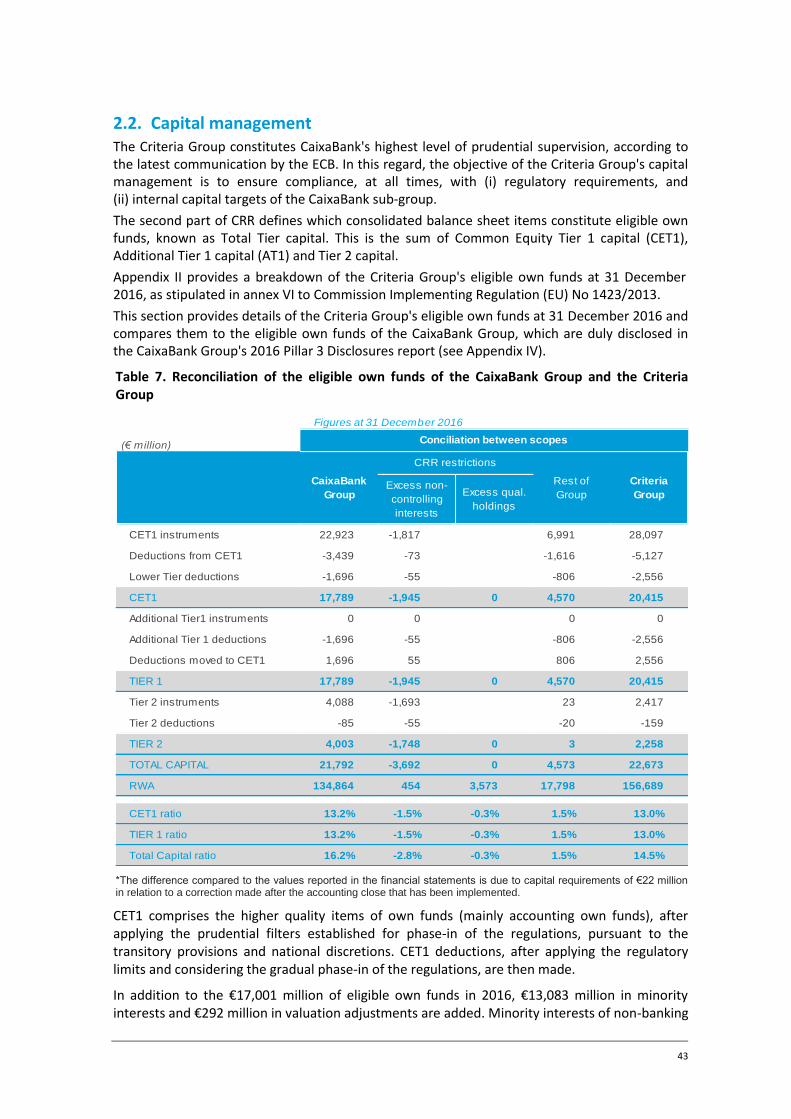
43
2.2. Capital management The Criteria Group constitutes CaixaBank's highest level of prudential supervision, according to the latest communication by the ECB. In this regard, the objective of the Criteria Group's capital management is to ensure compliance, at all times, with (i) regulatory requirements, and (ii) internal capital targets of the CaixaBank sub-group.
The second part of CRR defines which consolidated balance sheet items constitute eligible own funds, known as Total Tier capital. This is the sum of Common Equity Tier 1 capital (CET1), Additional Tier 1 capital (AT1) and Tier 2 capital.
Appendix II provides a breakdown of the Criteria Group's eligible own funds at 31 December 2016, as stipulated in annex VI to Commission Implementing Regulation (EU) No 1423/2013.
This section provides details of the Criteria Group's eligible own funds at 31 December 2016 and compares them to the eligible own funds of the CaixaBank Group, which are duly disclosed in the CaixaBank Group's 2016 Pillar 3 Disclosures report (see Appendix IV).
Table 7. Reconciliation of the eligible own funds of the CaixaBank Group and the Criteria Group
*The difference compared to the values reported in the financial statements is due to capital requirements of €22 million in relation to a correction made after the accounting close that has been implemented.
CET1 comprises the higher quality items of own funds (mainly accounting own funds), after applying the prudential filters established for phase-in of the regulations, pursuant to the transitory provisions and national discretions. CET1 deductions, after applying the regulatory limits and considering the gradual phase-in of the regulations, are then made.
In addition to the €17,001 million of eligible own funds in 2016, €13,083 million in minority interests and €292 million in valuation adjustments are added. Minority interests of non-banking
Figures at 31 December 2016
(€ million)
Excess non-
controlling
interests
Excess qual.
holdings
CET1 instruments 22,923 -1,817 6,991 28,097
Deductions from CET1 -3,439 -73 -1,616 -5,127
Lower Tier deductions -1,696 -55 -806 -2,556
CET1 17,789 -1,945 0 4,570 20,415
Additional Tier1 instruments 0 0 0 0
Additional Tier 1 deductions -1,696 -55 -806 -2,556
Deductions moved to CET1 1,696 55 806 2,556
TIER 1 17,789 -1,945 0 4,570 20,415
Tier 2 instruments 4,088 -1,693 23 2,417
Tier 2 deductions -85 -55 -20 -159
TIER 2 4,003 -1,748 0 3 2,258
TOTAL CAPITAL 21,792 -3,692 0 4,573 22,673
RWA 134,864 454 3,573 17,798 156,689
CET1 ratio 13.2% -1.5% -0.3% 1.5% 13.0%
TIER 1 ratio 13.2% -1.5% -0.3% 1.5% 13.0%
Total Capital ratio 16.2% -2.8% -0.3% 1.5% 14.5%
Conciliation between scopes
CaixaBank
Group
CRR restrictions
Rest of
Group
Criteria
Group
44
subsidiaries must be gradually excluded from the CET1 calculation, as should the portion of the CaixaBank Group's capital in excess of the applicable 9.3125% minimum attributable to minority interests. Overall, a total of €1,817 million in minority interests from the confidential consolidated balance sheet should excluded from the regulatory calculation. In addition, valuation adjustments can only considered to the extent of the phase-in percentage permitted for the year of application. It should be noted that from October 2016, with the entry into force of ECB guidance on national discretions and options in the implementation of EU prudential regulations, the filter for the valuation of public debt is no longer applied. Since then, public debt has been included in the regulatory ratio at the corresponding percentage. In 2016, additional prudential valuation adjustments (AVAs) were included. Lastly, CET1 is reduced to reflect other elements, primarily the forecast cash dividends to be charged against the year in question.
At 31 December 2016, CET1-eligible instruments amounted to €28,097 million for regulatory purposes (€1,092 million more than in 2015).
Additional Tier 1 capital (AT1) comprises issuances of eligible hybrid instruments less AT1 deductions. The Criteria Group's AT1 was zero at 31 December 2016 because it did not have any such issuances. AT1 deductions are transferred to CET1, as there are no AT1 instruments to absorb them.
In regulatory CET1 capital, deductions for intangible assets stood at €5,991 million, of which €2,986 million are for on-balance sheet intangible assets and €3,005 million are for goodwill of investees, net of impairment. In December 2016, the calculation did not include any tax assets for temporary differences although there was a buffer of €340 million in material financial investments (>10%) above the minimum capital requirements (The Bank of East Asia Limited). In relation to other deductions, there was a €266 million shortfall in provisions in relation to expected losses on the loan portfolio processed under the IRB approach, and €138 million relating to expected losses on the equity and securitisations portfolio.
In conclusion, regulatory CET1 stood at €20,415 million (€53 million more than in 2015), placing the CET1 regulatory ratio at 13.0%.
Tier 2 capital components include subordinated loans and, where applicable, the portion of provisions in excess 19 of expected losses on loan portfolios assessed using the IRB approach.
At 31 December 2016, Criteria held an eligible subordinated debt issue in the total amount of €23 million, considering the loss of eligibility as per the regulatory calendar. The detail of these issues is provided in Appendix I of this document, as set out in Annex III of Commission Implementing Regulation (EU) 1423/2013. Further, at Criteria Group level, 5 eligible CaixaBank subordinated debt issues are added, for an amount of €4,088 million. Details of these issues are provided in the “CaixaBank Pillar 3 Disclosures” report (Appendix IV).
For more information on the terms and conditions of Criteria’s CET1, Tier 1 and Tier 2 instruments see the Programmes and Issuances section of the financial-economic information on the corporate website.
2.3. Capital buffers
2.3.1. Pillar 2: Internal Capital Adequacy Assessment
In the context of Basel Pillar II, the Criteria Group carries out an annual Internal Capital Adequacy Assessment Process (ICAAP), which includes: (i) financial planning over a three-year horizon, in a range of stress scenarios; (ii) risk assessment to identify significant risks; and (iii)
19 As of 31 December 2016, there was no surplus of provisions over expected loss on the IRB portfolio.
45
analysis of capital adequacy, in terms of own funds and capital requirements, under a purely internal approach (economic). In particular, this assesses potential requirements for risks other than credit, operational and market risk, such as interest rate and business risk.
The ICAAP process is thoroughly integrated into the entity's management, and is carried out in accordance with guidance from the supervisor and the EBA. The results of the ICAAP process are reported to the supervisor every year.
The ICAAP is a key input in the ECB SREP process.
Based on the SREP, the ECB sets minimum capital requirements for each entity every year. These requirements comprise the sum of the minimum common level for all entities (“Pillar I”, as per article 92 CRR) and a specific minimum level (“Pillar II”, as per article 104 CRD IV). Pillar 2 must be complied with in full through CET1 in 2016.
The ECB required Criteria to maintain a regulatory CET1 ratio of 9.25% in 2016. This comprised the general minimum CET1 requirement for Pillar 1 of 4.5%, plus an additional net 4.75% for specific Pillar 2 requirements (2.25%) and the entire capital conservation buffer (2.5%).
The current transposition of CRD IV into applicable legislation in Spain envisages that this buffer will be applied progressively over four years from 2016: 0.625% in 2016 and 1.25% in 2017.
In 2015, Criteria received a BoS decision on the capital buffer required due its status as an Other Systemically Important Institution (O-SII) from 1 January 2016 (0.25% to be phased in over a period of 4 years, to 2019): 0.0625% in 2016 and 0.125% in 2017.
Together, these decisions required Criteria to maintain a CET1 ratio of 9.3125% in 2016.
In November 2016, Criteria received an update of the ECB's decision on minimum regulatory capital requirements. This required the Criteria Group to maintain a phase-in Common Equity Tier 1 (CET1) ratio of 7.375% in 2017, including: the minimum required by Pillar 1 (4.5%); the Pillar 2 requirement (1.5%); the capital conservation buffer (1.25%); and the O-SII buffer (0.125%). Similarly, taking the 8% Pillar 1 requirement, the minimum Total Capital requirements would be 10.875% (phase-in).
The ECB decision implies that the phase-in CET1 level below which the Criteria Group would be obliged in 2017 to limit distributions in the form of dividends, variable remuneration and interest payments to holders of Additional Tier 1 capital instruments - commonly referred to as the maximum distributable amount (MDA) trigger - would be 7.375%. Compared to current CET1 ratio levels, this requirement means that the requirements applicable to Criteria will not entail any limitation whatsoever of the types referred to in the solvency regulations.
The following table reflects the present and future capital requirements as per the prevailing ECB and BoS capital and buffer regulations.
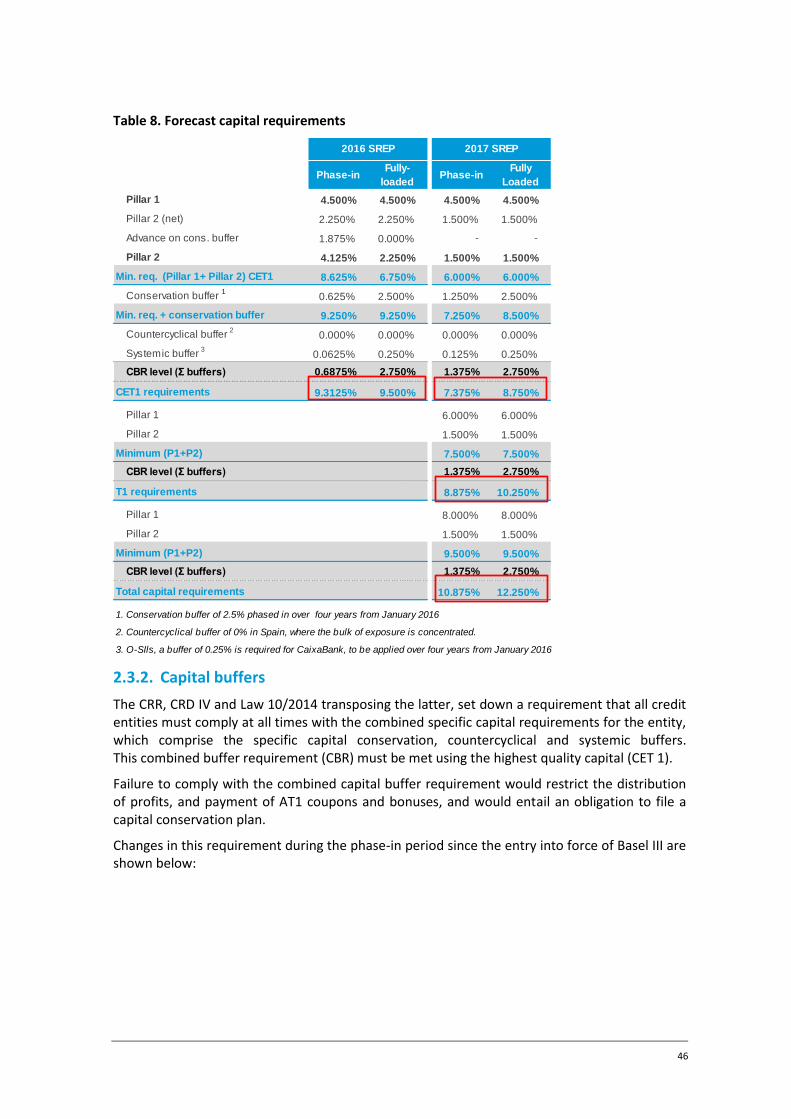
46
Table 8. Forecast capital requirements
2.3.2. Capital buffers
The CRR, CRD IV and Law 10/2014 transposing the latter, set down a requirement that all credit entities must comply at all times with the combined specific capital requirements for the entity, which comprise the specific capital conservation, countercyclical and systemic buffers. This combined buffer requirement (CBR) must be met using the highest quality capital (CET 1).
Failure to comply with the combined capital buffer requirement would restrict the distribution of profits, and payment of AT1 coupons and bonuses, and would entail an obligation to file a capital conservation plan.
Changes in this requirement during the phase-in period since the entry into force of Basel III are shown below:
Phase-inFully-
loadedPhase-in
Fully
Loaded
Pillar 1 4.500% 4.500% 4.500% 4.500%
Pillar 2 (net) 2.250% 2.250% 1.500% 1.500%
Advance on cons. buffer 1.875% 0.000% - -
Pillar 2 4.125% 2.250% 1.500% 1.500%
Min. req. (Pillar 1+ Pillar 2) CET1 8.625% 6.750% 6.000% 6.000%
Conservation buffer 1
0.625% 2.500% 1.250% 2.500%
Min. req. + conservation buffer 9.250% 9.250% 7.250% 8.500%
Countercyclical buffer 2
0.000% 0.000% 0.000% 0.000%
Systemic buffer 3
0.0625% 0.250% 0.125% 0.250%
CBR level (Σ buffers) 0.6875% 2.750% 1.375% 2.750%
CET1 requirements 9.3125% 9.500% 7.375% 8.750%
Pillar 1 6.00% 6.00% 6.000% 6.000%
Pillar 2 1.500% 1.500%
Minimum (P1+P2) 6.00% 6.00% 7.500% 7.500%
CBR level (Σ buffers) 0.69% 2.75% 1.375% 2.750%
T1 requirements 6.69% 8.75% 8.875% 10.250%
Pillar 1 8.00% 8.00% 8.000% 8.000%
Pillar 2 1.500% 1.500%
Minimum (P1+P2) 8.00% 8.00% 9.500% 9.500%
CBR level (Σ buffers) 0.69% 2.75% 1.375% 2.750%
Total capital requirements 8.69% 10.75% 10.875% 12.250%
1. Conservation buffer of 2.5% phased in over four years from January 2016
2. Countercyclical buffer of 0% in Spain, where the bulk of exposure is concentrated.
3. O-SIls, a buffer of 0.25% is required for CaixaBank, to be applied over four years from January 2016
2016 SREP 2017 SREP
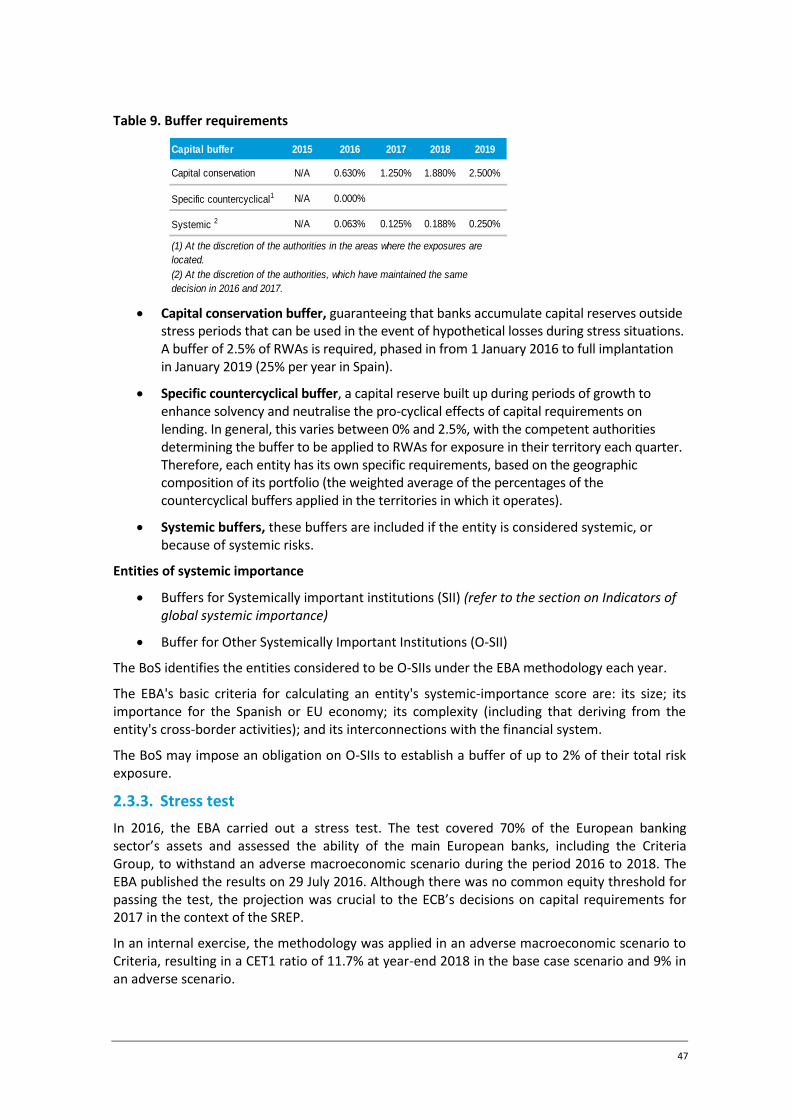
47
Table 9. Buffer requirements
Capital conservation buffer, guaranteeing that banks accumulate capital reserves outside stress periods that can be used in the event of hypothetical losses during stress situations. A buffer of 2.5% of RWAs is required, phased in from 1 January 2016 to full implantation in January 2019 (25% per year in Spain).
Specific countercyclical buffer, a capital reserve built up during periods of growth to enhance solvency and neutralise the pro-cyclical effects of capital requirements on lending. In general, this varies between 0% and 2.5%, with the competent authorities determining the buffer to be applied to RWAs for exposure in their territory each quarter. Therefore, each entity has its own specific requirements, based on the geographic composition of its portfolio (the weighted average of the percentages of the countercyclical buffers applied in the territories in which it operates).
Systemic buffers, these buffers are included if the entity is considered systemic, or because of systemic risks.
Entities of systemic importance
Buffers for Systemically important institutions (SII) (refer to the section on Indicators of global systemic importance)
Buffer for Other Systemically Important Institutions (O-SII)
The BoS identifies the entities considered to be O-SIIs under the EBA methodology each year.
The EBA's basic criteria for calculating an entity's systemic-importance score are: its size; its importance for the Spanish or EU economy; its complexity (including that deriving from the entity's cross-border activities); and its interconnections with the financial system.
The BoS may impose an obligation on O-SIIs to establish a buffer of up to 2% of their total risk exposure.
2.3.3. Stress test
In 2016, the EBA carried out a stress test. The test covered 70% of the European banking sector’s assets and assessed the ability of the main European banks, including the Criteria Group, to withstand an adverse macroeconomic scenario during the period 2016 to 2018. The EBA published the results on 29 July 2016. Although there was no common equity threshold for passing the test, the projection was crucial to the ECB’s decisions on capital requirements for 2017 in the context of the SREP.
In an internal exercise, the methodology was applied in an adverse macroeconomic scenario to Criteria, resulting in a CET1 ratio of 11.7% at year-end 2018 in the base case scenario and 9% in an adverse scenario.
Capital buffer 2015 2016 2017 2018 2019
Capital conservation N/A 0.630% 1.250% 1.880% 2.500%
Specific countercyclical1 N/A 0.000%
Systemic 2 N/A 0.063% 0.125% 0.188% 0.250%
(1) At the discretion of the authorities in the areas where the exposures are
located.
(2) At the discretion of the authorities, which have maintained the same
decision in 2016 and 2017.
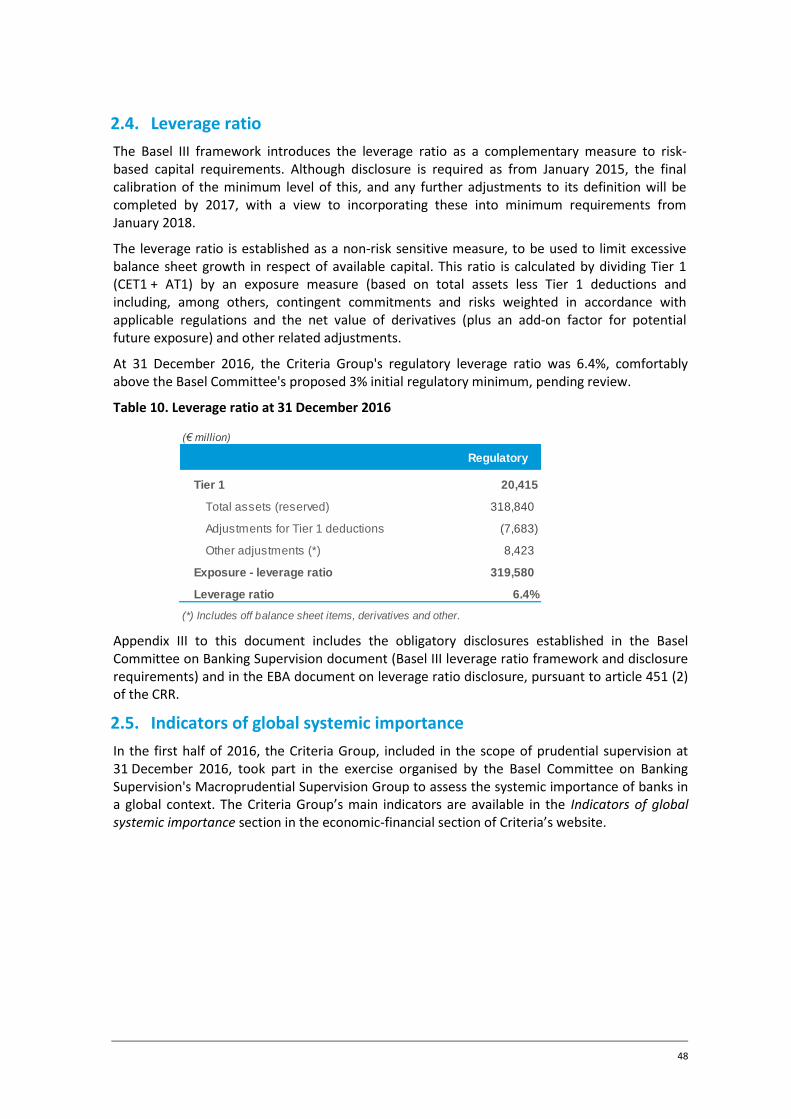
48
2.4. Leverage ratio
The Basel III framework introduces the leverage ratio as a complementary measure to risk-based capital requirements. Although disclosure is required as from January 2015, the final calibration of the minimum level of this, and any further adjustments to its definition will be completed by 2017, with a view to incorporating these into minimum requirements from January 2018.
The leverage ratio is established as a non-risk sensitive measure, to be used to limit excessive balance sheet growth in respect of available capital. This ratio is calculated by dividing Tier 1 (CET1 + AT1) by an exposure measure (based on total assets less Tier 1 deductions and including, among others, contingent commitments and risks weighted in accordance with applicable regulations and the net value of derivatives (plus an add-on factor for potential future exposure) and other related adjustments.
At 31 December 2016, the Criteria Group's regulatory leverage ratio was 6.4%, comfortably above the Basel Committee's proposed 3% initial regulatory minimum, pending review.
Table 10. Leverage ratio at 31 December 2016
Appendix III to this document includes the obligatory disclosures established in the Basel Committee on Banking Supervision document (Basel III leverage ratio framework and disclosure requirements) and in the EBA document on leverage ratio disclosure, pursuant to article 451 (2) of the CRR.
2.5. Indicators of global systemic importance
In the first half of 2016, the Criteria Group, included in the scope of prudential supervision at 31 December 2016, took part in the exercise organised by the Basel Committee on Banking Supervision's Macroprudential Supervision Group to assess the systemic importance of banks in a global context. The Criteria Group’s main indicators are available in the Indicators of global systemic importance section in the economic-financial section of Criteria’s website.
(€ million)
Regulatory
Tier 1 20,415
Total assets (reserved) 318,840
Adjustments for Tier 1 deductions (7,683)
Other adjustments (*) 8,423
Exposure - leverage ratio 319,580
Leverage ratio 6.4%
(*) Includes off balance sheet items, derivatives and other.
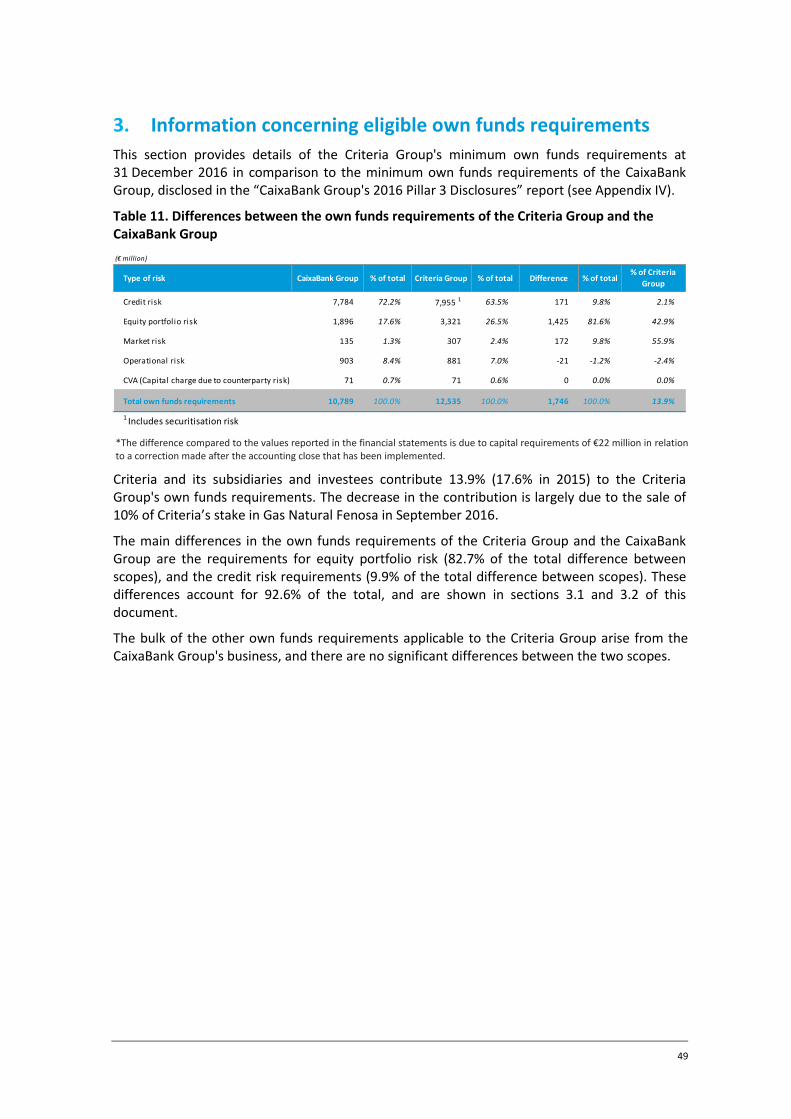
49
3. Information concerning eligible own funds requirements
This section provides details of the Criteria Group's minimum own funds requirements at 31 December 2016 in comparison to the minimum own funds requirements of the CaixaBank Group, disclosed in the “CaixaBank Group's 2016 Pillar 3 Disclosures” report (see Appendix IV).
Table 11. Differences between the own funds requirements of the Criteria Group and the CaixaBank Group
*The difference compared to the values reported in the financial statements is due to capital requirements of €22 million in relation to a correction made after the accounting close that has been implemented.
Criteria and its subsidiaries and investees contribute 13.9% (17.6% in 2015) to the Criteria Group's own funds requirements. The decrease in the contribution is largely due to the sale of 10% of Criteria’s stake in Gas Natural Fenosa in September 2016.
The main differences in the own funds requirements of the Criteria Group and the CaixaBank Group are the requirements for equity portfolio risk (82.7% of the total difference between scopes), and the credit risk requirements (9.9% of the total difference between scopes). These differences account for 92.6% of the total, and are shown in sections 3.1 and 3.2 of this document.
The bulk of the other own funds requirements applicable to the Criteria Group arise from the CaixaBank Group's business, and there are no significant differences between the two scopes.
(€ million)
Credit risk 7,784 72.2% 7,955 1 63.5% 171 9.8% 2.1%
Equity portfolio risk 1,896 17.6% 3,321 26.5% 1,425 81.6% 42.9%
Market risk 135 1.3% 307 2.4% 172 9.8% 55.9%
Operational risk 903 8.4% 881 7.0% -21 -1.2% -2.4%
CVA (Capital charge due to counterparty risk) 71 0.7% 71 0.6% 0 0.0% 0.0%
Total own funds requirements 10,789 100.0% 12,535 100.0% 1,746 100.0% 13.9%
1 Includes securitisation risk
% of total% of Criteria
GroupDifference% of totalType of risk CaixaBank Group % of total Criteria Group
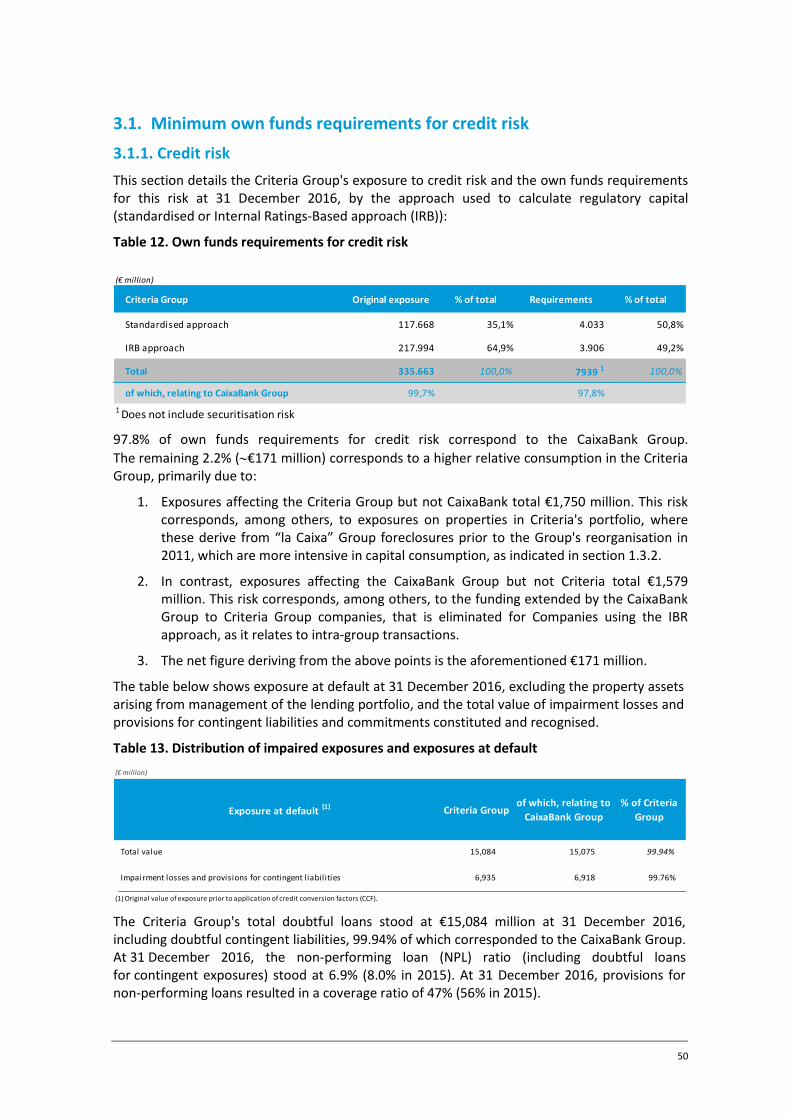
50
3.1. Minimum own funds requirements for credit risk
3.1.1. Credit risk
This section details the Criteria Group's exposure to credit risk and the own funds requirements for this risk at 31 December 2016, by the approach used to calculate regulatory capital (standardised or Internal Ratings-Based approach (IRB)):
Table 12. Own funds requirements for credit risk
97.8% of own funds requirements for credit risk correspond to the CaixaBank Group.
The remaining 2.2% (€171 million) corresponds to a higher relative consumption in the Criteria Group, primarily due to:
1. Exposures affecting the Criteria Group but not CaixaBank total €1,750 million. This risk corresponds, among others, to exposures on properties in Criteria's portfolio, where these derive from “la Caixa” Group foreclosures prior to the Group's reorganisation in 2011, which are more intensive in capital consumption, as indicated in section 1.3.2.
2. In contrast, exposures affecting the CaixaBank Group but not Criteria total €1,579 million. This risk corresponds, among others, to the funding extended by the CaixaBank Group to Criteria Group companies, that is eliminated for Companies using the IBR approach, as it relates to intra-group transactions.
3. The net figure deriving from the above points is the aforementioned €171 million.
The table below shows exposure at default at 31 December 2016, excluding the property assets arising from management of the lending portfolio, and the total value of impairment losses and provisions for contingent liabilities and commitments constituted and recognised.
Table 13. Distribution of impaired exposures and exposures at default
The Criteria Group's total doubtful loans stood at €15,084 million at 31 December 2016, including doubtful contingent liabilities, 99.94% of which corresponded to the CaixaBank Group. At 31 December 2016, the non-performing loan (NPL) ratio (including doubtful loans for contingent exposures) stood at 6.9% (8.0% in 2015). At 31 December 2016, provisions for non-performing loans resulted in a coverage ratio of 47% (56% in 2015).
(€ million)
Criteria Group Original exposure % of total Requirements % of total
Standardised approach 117.668 35,1% 4.033 50,8%
IRB approach 217.994 64,9% 3.906 49,2%
Total 335.663 100,0% 7939 1 100,0%
of which, relating to CaixaBank Group 99,7% 97,8%
1 Does not include securitisation risk
(€ million)
Exposure at default (1) Criteria Group
of which, relating to
CaixaBank Group
% of Criteria
Group
Total value 15,084 15,075 99.94%
Impairment losses and provisions for contingent liabilities 6,935 6,918 99.76%
(1) Original value of exposure prior to application of credit conversion factors (CCF).
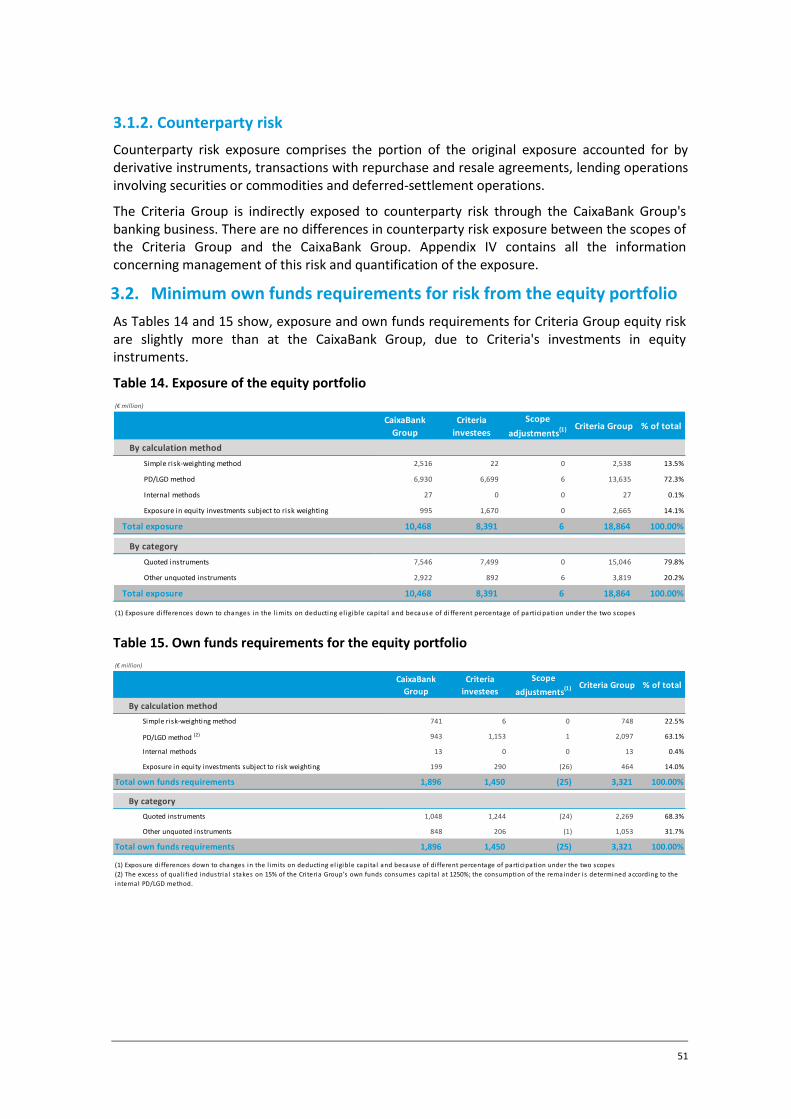
51
3.1.2. Counterparty risk
Counterparty risk exposure comprises the portion of the original exposure accounted for by derivative instruments, transactions with repurchase and resale agreements, lending operations involving securities or commodities and deferred-settlement operations.
The Criteria Group is indirectly exposed to counterparty risk through the CaixaBank Group's banking business. There are no differences in counterparty risk exposure between the scopes of the Criteria Group and the CaixaBank Group. Appendix IV contains all the information concerning management of this risk and quantification of the exposure.
3.2. Minimum own funds requirements for risk from the equity portfolio
As Tables 14 and 15 show, exposure and own funds requirements for Criteria Group equity risk are slightly more than at the CaixaBank Group, due to Criteria's investments in equity instruments.
Table 14. Exposure of the equity portfolio
Table 15. Own funds requirements for the equity portfolio
(€ million)
CaixaBank
Group
Criteria
investees
Scope
adjustments(1) Criteria Group % of total
By calculation method
Simple risk-weighting method 2,516 22 0 2,538 13.5%
PD/LGD method 6,930 6,699 6 13,635 72.3%
Internal methods 27 0 0 27 0.1%
Exposure in equity investments subject to risk weighting 995 1,670 0 2,665 14.1%
Total exposure 10,468 8,391 6 18,864 100.00%
By category
Quoted instruments 7,546 7,499 0 15,046 79.8%
Other unquoted instruments 2,922 892 6 3,819 20.2%
Total exposure 10,468 8,391 6 18,864 100.00%
(1) Exposure di fferences down to changes in the l imits on deducting el igible capita l and because of di fferent percentage of participation under the two scopes
(€ million)
CaixaBank
Group
Criteria
investees
Scope
adjustments(1) Criteria Group % of total
By calculation method
Simple risk-weighting method 741 6 0 748 22.5%
PD/LGD method (2) 943 1,153 1 2,097 63.1%
Internal methods 13 0 0 13 0.4%
Exposure in equity investments subject to risk weighting 199 290 (26) 464 14.0%
Total own funds requirements 1,896 1,450 (25) 3,321 100.00%
By category
Quoted instruments 1,048 1,244 (24) 2,269 68.3%
Other unquoted instruments 848 206 (1) 1,053 31.7%
Total own funds requirements 1,896 1,450 (25) 3,321 100.00%
(1) Exposure di fferences down to changes in the l imits on deducting el igible capita l and because of di fferent percentage of participation under the two scopes
(2) The excess of qual i fied industria l s takes on 15% of the Cri teria Group’s own funds consumes capita l at 1250%; the consumption of the remainder i s determined according to the
internal PD/LGD method.
52
The main differences between the Criteria Group and CaixaBank Group portfolios are as follows:
1. Depending on the calculation method:
Most capital exposures on Criteria’s portfolio are calculated using the PD/LGD approach, specifically, the stakes in Gas Natural Fenosa S.D.G., S.A. (24.44%), Abertis Infraestructuras, S.A. (18.99%), Grupo Financiero Inbursa, S.A.B. (9.01%), Suez Environnement S.A. (5.89%), Mediterranea Beach & Golf Community, S.A. (100%), Inmo Criteria Caixa, S.A. (100%), Saba Infraestructuras, S.A. (50.10%), Cellnex Telecom (5.77%), Vithas Sanidad, S.L. (20%) and Aigües de Barcelona, Empresa Metropolitana de Gestió del Cicle Integral de l’Aigua, S.A. (15%). For the financial stake in The Bank of East Asia, Limited (17.24%) exposure is calculated according to equity exposure subject to risk weighting.
2. Depending on the category:
Quoted instruments include Criteria’s stakes in Gas Natural Fenosa S.D.G., S.A., Abertis Infraestructuras, S.A., Suez Environnement S.A., Cellnex Telecom, and its financial stakes in Grupo Financiero Inbursa, S.A.B. and The Bank of East Asia, Limited. Unquoted instruments include Criteria’s stakes in Mediterranea Beach & Golf Community, S.A., Inmo Criteria Caixa, S.A., Saba Infraestructuras, S.A., Vithas Sanidad, S.L. and Aigües de Barcelona, Empresa Metropolitana de Gestió del Cicle Integral de l’Aigua, S.A.
As defined in section 1.1, the scope of application of this report is the disclosure of additional information regarding Criteria's contribution, as the parent of CaixaBank, to the Criteria Group's scope of prudential consolidation, other than the contribution by the CaixaBank Group. Appendix IV contains the information concerning the CaixaBank Group.
3.2.1. Description, accounting recognition and measurement
The Criteria Group's equity portfolio features major companies holding large shares in their respective markets and the capacity to generate value and recurring profitability. In general, these are strategic investments, and the Group is involved in their governing bodies and in defining their future policies and strategies. The Criteria Group’s 2016 financial statements show a breakdown of the companies in its equity investment portfolio, with information on their area of business and scope of activity20.
Stakes in these companies are recorded under the following asset categories:
Investments21. Equity investments in jointly controlled entities22 or associates.
Available for sale financial assets. Other stakes, excluding those in the trading portfolio or non-current assets held for sale.
The accounting policies and measurement methods used for each of the categories are described below.
20 See Note 6, “Business combinations, acquisition and disposal of ownership interests in subsidiaries”; Note 12, “Available-for-sale
financial assets”; Note 16 “Investments in associates and jointly controlled entities”; and Appendices 1, 2 and 3 to the Criteria Group’s 2016 financial statements. 21 For the purposes of capital adequacy, subsidiaries that cannot be consolidated in view of their business activity are entered under this heading, since they are accounted for using the equity method. 22 Exceptions are jointly controlled entities acting as holders of stakes. See section 1.1.1 of this document and Note 2.1, “Business combinations and basis of consolidation” to the Criteria Group’s 2016 financial statements.
53
1. Investments
Investments are measured using the equity method, with the best estimate of their underlying carrying amount when the financial statements are drawn up.
The Criteria Group has a methodology in place for performing a quarterly assessment of potential indicators of impairment in the carrying amount of these investments. Specifically, it assesses the company’s share prices throughout the period and the target prices published by renowned independent analysts. The Criteria Group uses these data to determine the fair value associated with the investment and, if this is well above the carrying amount of the company, it is considered that there are no indications of impairment.
When indications of impairment are considered to exist, the Criteria Group conducts additional tests to assess the fair value of the investments and verify the impairment loss recognised. Generally accepted valuation methods are employed, for example, DCF (discounted cash flow) models, DDM (dividend discount) models, and others. Moderate hypotheses are used, obtained from reliable sources of information in addition to individual discount rates for each business activity and country. No potential control premiums are considered for the purposes of valuation. The growth rates used to calculate the terminal value beyond the period covered by the forecasts drawn up are determined on the basis of the data for the last period projected, and never exceed the estimated rated GDP of the country or countries in which the investees operate.
2. Available-for-sale financial assets
Available-for-sale financial assets are always measured at fair value, with any changes in value, less the related tax effect, recognised with a balancing entry in equity. In the case of investments in quoted companies, their fair value will be the market value, and unquoted companies will be recognised at acquisition cost less any impairment loss incurred. At the time of sale, the loss or gain previously recognised in equity is taken to the income statement.
As a general rule, they are written down with a charge to the income statement when there is objective evidence that an impairment loss has occurred. This is assumed to have emerged following a 40% reduction in fair value and when a situation of continued losses has been observed over a period of more than 18 months.
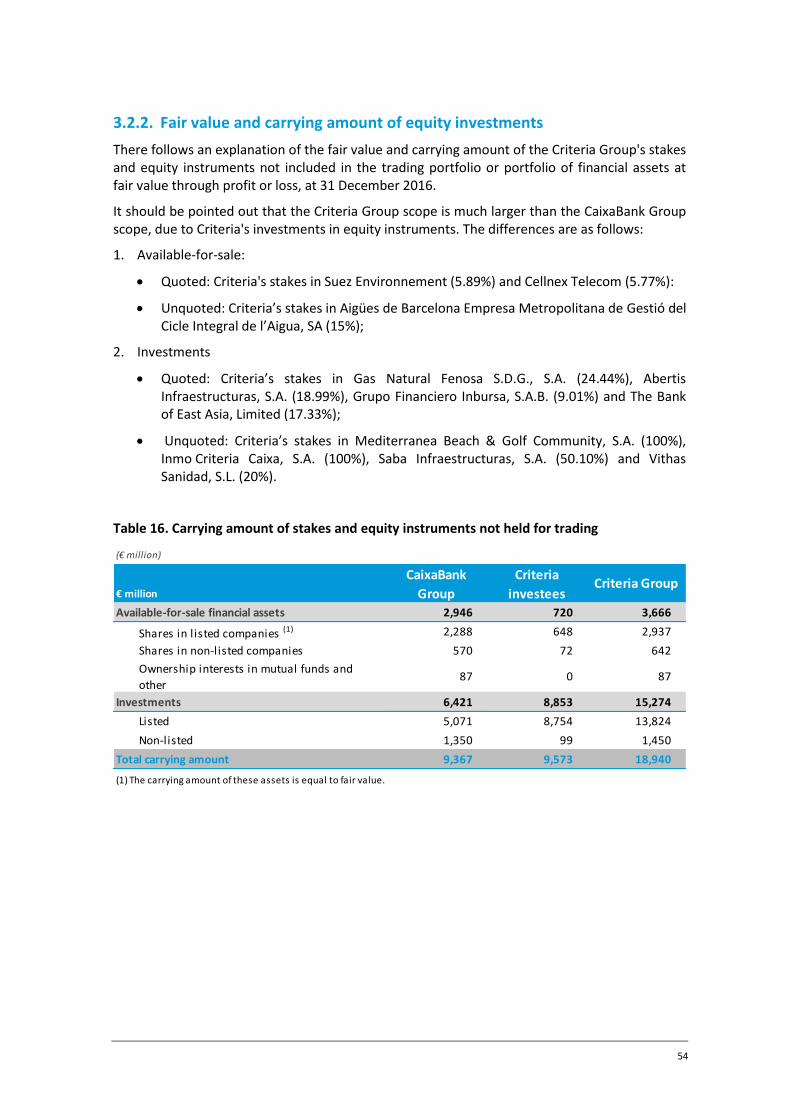
54
3.2.2. Fair value and carrying amount of equity investments
There follows an explanation of the fair value and carrying amount of the Criteria Group's stakes and equity instruments not included in the trading portfolio or portfolio of financial assets at fair value through profit or loss, at 31 December 2016.
It should be pointed out that the Criteria Group scope is much larger than the CaixaBank Group scope, due to Criteria's investments in equity instruments. The differences are as follows:
1. Available-for-sale:
Quoted: Criteria's stakes in Suez Environnement (5.89%) and Cellnex Telecom (5.77%):
Unquoted: Criteria’s stakes in Aigües de Barcelona Empresa Metropolitana de Gestió del Cicle Integral de l’Aigua, SA (15%);
2. Investments
Quoted: Criteria’s stakes in Gas Natural Fenosa S.D.G., S.A. (24.44%), Abertis Infraestructuras, S.A. (18.99%), Grupo Financiero Inbursa, S.A.B. (9.01%) and The Bank of East Asia, Limited (17.33%);
Unquoted: Criteria’s stakes in Mediterranea Beach & Golf Community, S.A. (100%), Inmo Criteria Caixa, S.A. (100%), Saba Infraestructuras, S.A. (50.10%) and Vithas Sanidad, S.L. (20%).
Table 16. Carrying amount of stakes and equity instruments not held for trading
(€ million)
€ million
Available-for-sale financial assets 2,946 720 3,666
Shares in listed companies (1) 2,288 648 2,937
Shares in non-listed companies 570 72 642
Ownership interests in mutual funds and
other87 0 87
Investments 6,421 8,853 15,274
Listed 5,071 8,754 13,824
Non-listed 1,350 99 1,450
Total carrying amount 9,367 9,573 18,940
CaixaBank
Group
Criteria
investeesCriteria Group
(1) The carrying amount of these assets is equal to fair value.
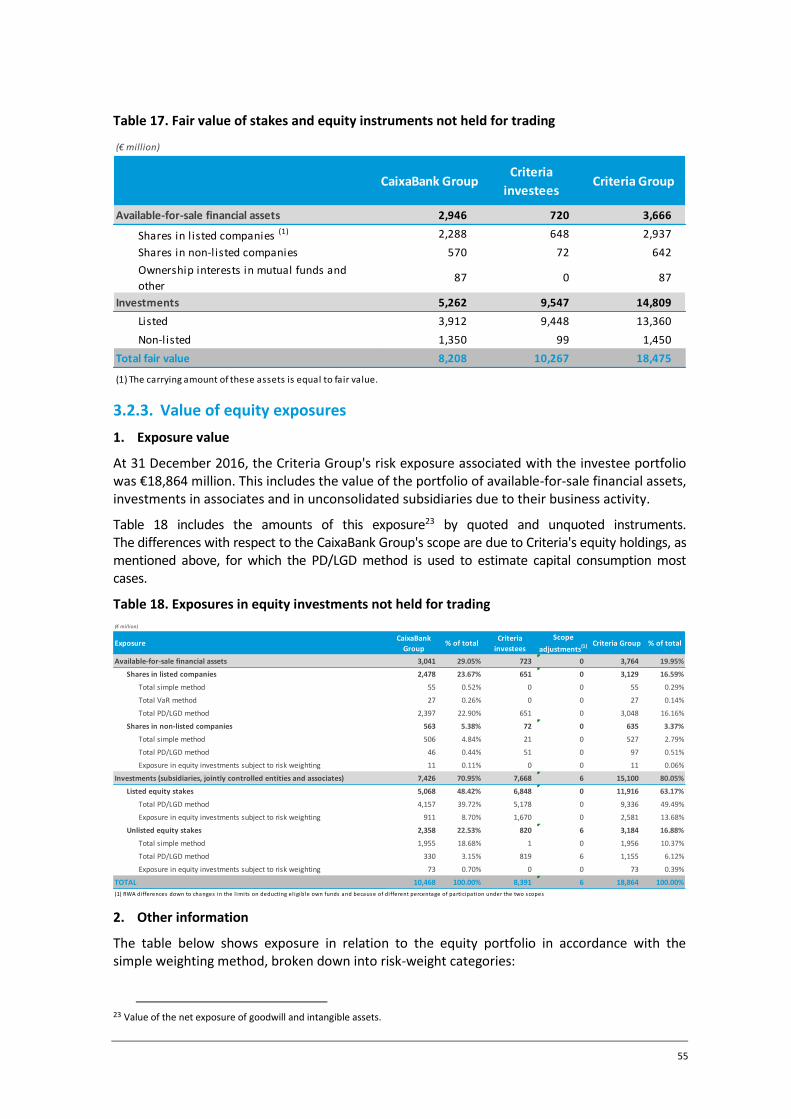
55
Table 17. Fair value of stakes and equity instruments not held for trading
3.2.3. Value of equity exposures
1. Exposure value
At 31 December 2016, the Criteria Group's risk exposure associated with the investee portfolio was €18,864 million. This includes the value of the portfolio of available-for-sale financial assets, investments in associates and in unconsolidated subsidiaries due to their business activity.
Table 18 includes the amounts of this exposure23 by quoted and unquoted instruments. The differences with respect to the CaixaBank Group's scope are due to Criteria's equity holdings, as mentioned above, for which the PD/LGD method is used to estimate capital consumption most cases.
Table 18. Exposures in equity investments not held for trading
2. Other information
The table below shows exposure in relation to the equity portfolio in accordance with the simple weighting method, broken down into risk-weight categories:
23 Value of the net exposure of goodwill and intangible assets.
(€ million)
Available-for-sale financial assets 2,946 720 3,666
Shares in l isted companies (1) 2,288 648 2,937
Shares in non-listed companies 570 72 642
Ownership interests in mutual funds and
other87 0 87
Investments 5,262 9,547 14,809
Listed 3,912 9,448 13,360
Non-listed 1,350 99 1,450
Total fair value 8,208 10,267 18,475
CaixaBank GroupCriteria
investeesCriteria Group
(1) The carrying amount of these assets is equal to fair value.
(€ million)
ExposureCaixaBank
Group% of total
Criteria
investees
Scope
adjustments(1) Criteria Group % of total
Available-for-sale financial assets 3,041 29.05% 723 0 3,764 19.95%
Shares in listed companies 2,478 23.67% 651 0 3,129 16.59%
Total simple method 55 0.52% 0 0 55 0.29%
Total VaR method 27 0.26% 0 0 27 0.14%
Total PD/LGD method 2,397 22.90% 651 0 3,048 16.16%
Shares in non-listed companies 563 5.38% 72 0 635 3.37%
Total simple method 506 4.84% 21 0 527 2.79%
Total PD/LGD method 46 0.44% 51 0 97 0.51%
Exposure in equity investments subject to risk weighting 11 0.11% 0 0 11 0.06%
Investments (subsidiaries, jointly controlled entities and associates) 7,426 70.95% 7,668 6 15,100 80.05%
Listed equity stakes 5,068 48.42% 6,848 0 11,916 63.17%
Total PD/LGD method 4,157 39.72% 5,178 0 9,336 49.49%
Exposure in equity investments subject to risk weighting 911 8.70% 1,670 0 2,581 13.68%
Unlisted equity stakes 2,358 22.53% 820 6 3,184 16.88%
Total simple method 1,955 18.68% 1 0 1,956 10.37%
Total PD/LGD method 330 3.15% 819 6 1,155 6.12%
Exposure in equity investments subject to risk weighting 73 0.70% 0 0 73 0.39%
TOTAL 10,468 100.00% 8,391 6 18,864 100.00%
(1) RWA di fferences down to changes in the l imits on deducting el igible own funds and because of di fferent percentage of participation under the two scopes

56
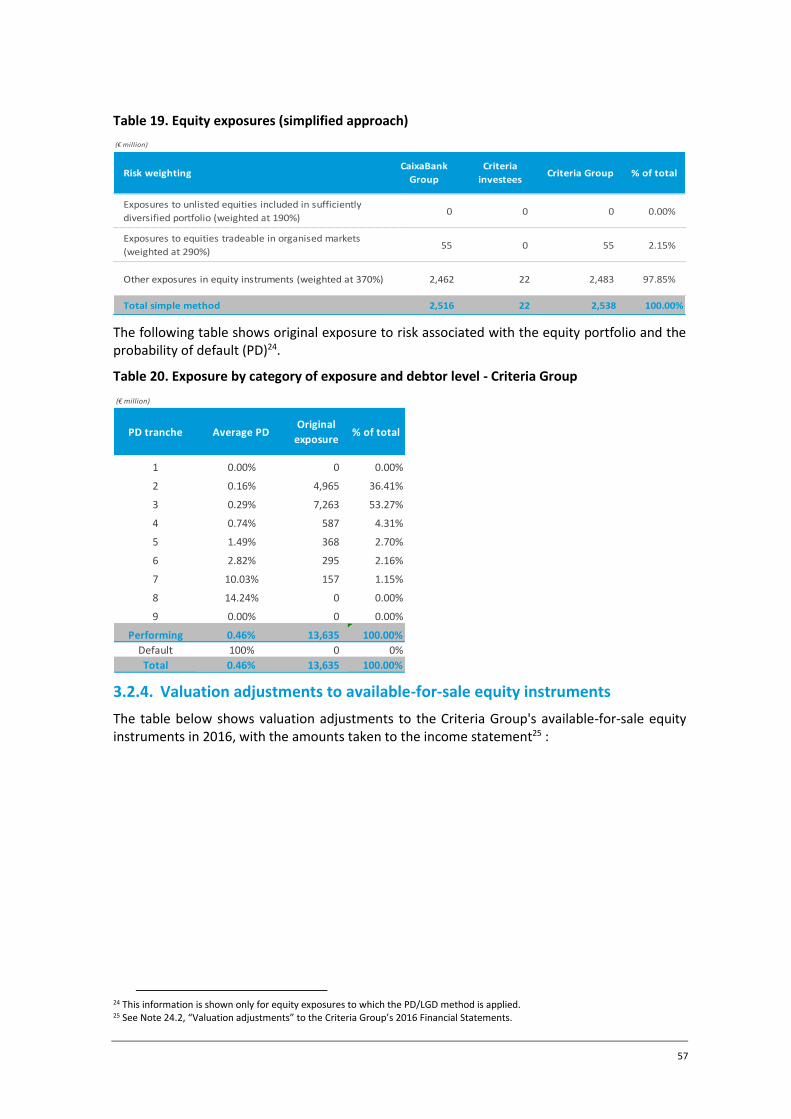
57
Table 19. Equity exposures (simplified approach)
The following table shows original exposure to risk associated with the equity portfolio and the probability of default (PD)24.
Table 20. Exposure by category of exposure and debtor level - Criteria Group
3.2.4. Valuation adjustments to available-for-sale equity instruments
The table below shows valuation adjustments to the Criteria Group's available-for-sale equity instruments in 2016, with the amounts taken to the income statement25 :
24 This information is shown only for equity exposures to which the PD/LGD method is applied. 25 See Note 24.2, “Valuation adjustments” to the Criteria Group’s 2016 Financial Statements.
(€ million)
Exposures to unlisted equities included in sufficiently
diversified portfolio (weighted at 190%)0 0 0 0.00%
Exposures to equities tradeable in organised markets
(weighted at 290%)55 0 55 2.15%
Other exposures in equity instruments (weighted at 370%) 2,462 22 2,483 97.85%
Total simple method 2,516 22 2,538 100.00%
Risk weightingCaixaBank
Group
Criteria
investeesCriteria Group % of total
(€ million)
1 0.00% 0 0.00%
2 0.16% 4,965 36.41%
3 0.29% 7,263 53.27%
4 0.74% 587 4.31%
5 1.49% 368 2.70%
6 2.82% 295 2.16%
7 10.03% 157 1.15%
8 14.24% 0 0.00%
9 0.00% 0 0.00%
Performing 0.46% 13,635 100.00%
Default 100% 0 0%
Total 0.46% 13,635 100.00%
PD tranche Average PDOriginal
exposure% of total
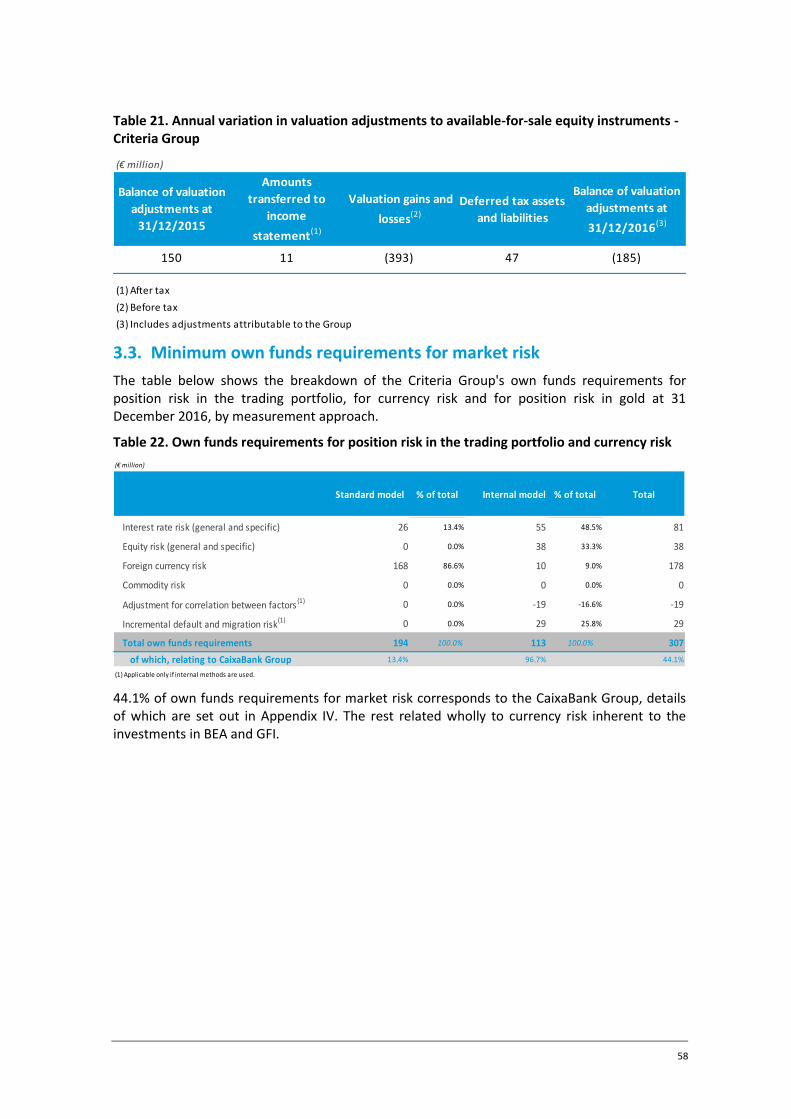
58
Table 21. Annual variation in valuation adjustments to available-for-sale equity instruments - Criteria Group
3.3. Minimum own funds requirements for market risk
The table below shows the breakdown of the Criteria Group's own funds requirements for position risk in the trading portfolio, for currency risk and for position risk in gold at 31 December 2016, by measurement approach.
Table 22. Own funds requirements for position risk in the trading portfolio and currency risk
44.1% of own funds requirements for market risk corresponds to the CaixaBank Group, details of which are set out in Appendix IV. The rest related wholly to currency risk inherent to the investments in BEA and GFI.
(€ million)
150 11 (393) 47 (185)
(1) After tax
(2) Before tax
(3) Includes adjustments attributable to the Group
Balance of valuation
adjustments at
31/12/2015
Amounts
transferred to
income
statement(1)
Valuation gains and
losses(2)
Deferred tax assets
and liabilities
Balance of valuation
adjustments at
31/12/2016(3)
(€ million)
Standard model % of total Internal model % of total Total
Interest rate risk (general and specific) 26 13.4% 55 48.5% 81
Equity risk (general and specific) 0 0.0% 38 33.3% 38
Foreign currency risk 168 86.6% 10 9.0% 178
Commodity risk 0 0.0% 0 0.0% 0
Adjustment for correlation between factors(1) 0 0.0% -19 -16.6% -19
Incremental default and migration risk(1) 0 0.0% 29 25.8% 29
Total own funds requirements 194 100.0% 113 100.0% 307
of which, relating to CaixaBank Group 13.4% 96.7% 44.1%
(1) Applicable only if internal methods are used.
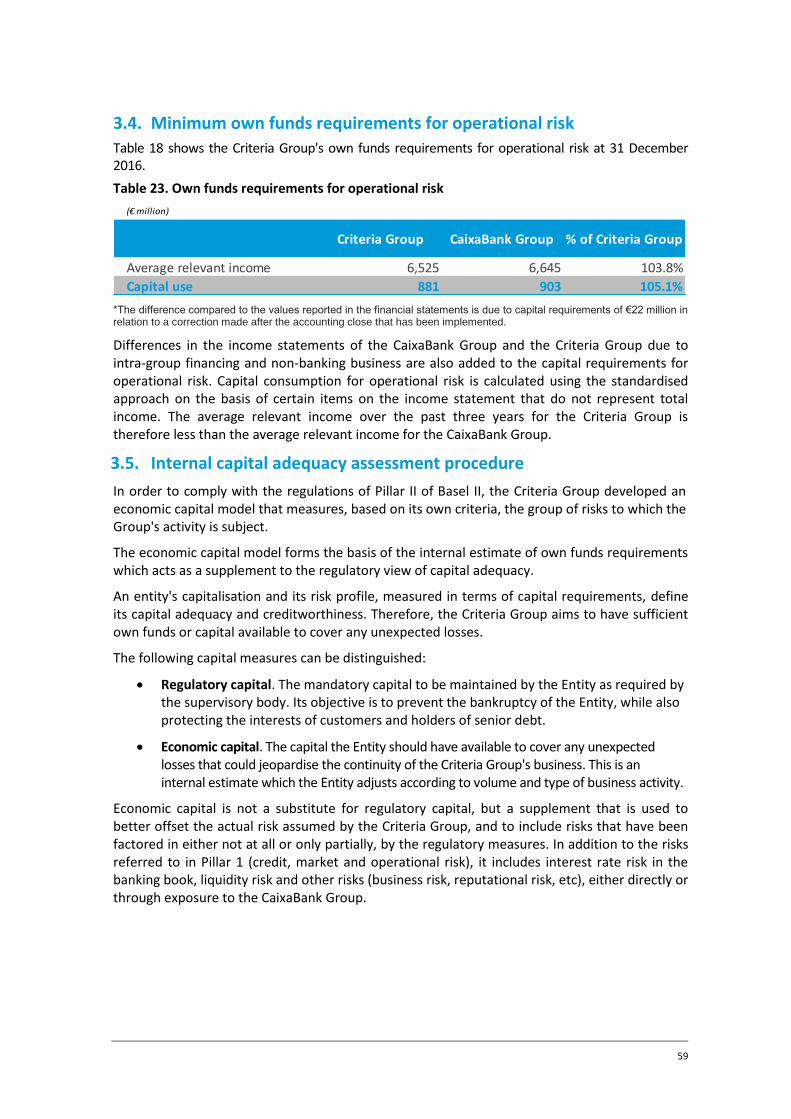
59
3.4. Minimum own funds requirements for operational risk
Table 18 shows the Criteria Group's own funds requirements for operational risk at 31 December 2016.
Table 23. Own funds requirements for operational risk
*The difference compared to the values reported in the financial statements is due to capital requirements of €22 million in relation to a correction made after the accounting close that has been implemented.
Differences in the income statements of the CaixaBank Group and the Criteria Group due to intra-group financing and non-banking business are also added to the capital requirements for operational risk. Capital consumption for operational risk is calculated using the standardised approach on the basis of certain items on the income statement that do not represent total income. The average relevant income over the past three years for the Criteria Group is therefore less than the average relevant income for the CaixaBank Group.
3.5. Internal capital adequacy assessment procedure
In order to comply with the regulations of Pillar II of Basel II, the Criteria Group developed an economic capital model that measures, based on its own criteria, the group of risks to which the Group's activity is subject.
The economic capital model forms the basis of the internal estimate of own funds requirements which acts as a supplement to the regulatory view of capital adequacy.
An entity's capitalisation and its risk profile, measured in terms of capital requirements, define its capital adequacy and creditworthiness. Therefore, the Criteria Group aims to have sufficient own funds or capital available to cover any unexpected losses.
The following capital measures can be distinguished:
Regulatory capital. The mandatory capital to be maintained by the Entity as required by the supervisory body. Its objective is to prevent the bankruptcy of the Entity, while also protecting the interests of customers and holders of senior debt.
Economic capital. The capital the Entity should have available to cover any unexpected losses that could jeopardise the continuity of the Criteria Group's business. This is an internal estimate which the Entity adjusts according to volume and type of business activity.
Economic capital is not a substitute for regulatory capital, but a supplement that is used to better offset the actual risk assumed by the Criteria Group, and to include risks that have been factored in either not at all or only partially, by the regulatory measures. In addition to the risks referred to in Pillar 1 (credit, market and operational risk), it includes interest rate risk in the banking book, liquidity risk and other risks (business risk, reputational risk, etc), either directly or through exposure to the CaixaBank Group.
(€ million)
Criteria Group CaixaBank Group % of Criteria Group
Average relevant income 6,525 6,645 103.8%
Capital use 881 903 105.1%
60
Two of the most important impacts or changes regarding the regulatory approach for credit risk are:
Large exposures: Large exposures or single large exposures (exposure above €100 million) have a considerable impact on economic capital estimations, particularly in the equity portfolio and the corporate and banking segments. The regulatory formula, which considers infinitely granular portfolios, is not particularly appropriate for covering the level of concentration of the Group portfolio. Accordingly, the internal model reflects the possibility of having single large exposures and simulates potential default of these specific positions. This means the simulated loss distribution already contains the individual concentration risk for large exposures. This concentration induces diversification among portfolios.
Estimation of sensitivities and diversification: The Criteria Group has developed its own scheme for determining sensitivities of probabilities of default to specific economic and financial variables, thereby implicitly estimating correlations of probabilities of default adjusted to the Group's scope of activity. In practice, these estimates introduce additional diversification among portfolios and industrial sectors, as the result of the various sensitivities produced. It also considers specific sensitivities for international financial stakes in the equity portfolio, providing additional diversification with the rest of the portfolio.
With regard to eligible own funds, the most significant internal effect is the recognition of gains or losses on the fixed income and equity portfolios, basically, fixed income held to maturity and equities of associates. These are recognised at fair value from an accounting perspective.
61
4. Information concerning remuneration
Article 450 of Regulation (EU) No. 575/2013 establishes the public disclosures required regarding remuneration, which, in accordance with article 85 of Law 10/2014 on the organisation, supervision and solvency of credit institutions, article 93 of Royal Decree 84/2015, which implements the aforementioned law, and standard 59 of BoS Circular 2/2016, should be disclosed yearly through the Pillar 3 Disclosures report.
Information to be disclosed includes the remuneration policy and practices for those categories of staff whose professional activities have a material impact on its risk profile (hereinafter, “Identified Staff”).
In particular, the information disclosed should meet the following characteristics:
With respect to qualitative information, this report contains the specific information corresponding to Criteria, while the qualitative information on CaixaBank and its consolidated subgroup is provided in the Pillar 3 Disclosures report included as Appendix IV.
In terms of quantitative information, this report contains that relating to Criteria on an individual basis as well as the consolidated information at the level of its prudential group. The Pillar 3 Disclosures report included as Appendix IV sets out information on CaixaBank and its consolidated sub-group.
1. CRITERIA'S REMUNERATION POLICY
a. Introduction
As established in Criteria's Identified Staff Remuneration Policy applicable in 2016 and approved by the Board of Directors on 26 February 2015, an later amended at the Board of Directors’ meeting of 29 April 2016, Criteria's business is based on managing FBLC's assets, liabilities and equity, through the holding and management of investments in companies in different sectors, including the financial sector through its holdings in CaixaBank, BEA and GFI.
Consequently, Criteria's employees and professionals do not perform financial activities typical of the risk-generating credit institutions that the LOSS aims to control through its remuneration-related provisions. These activities are carried out autonomously, directly and exclusively by professionals employed by CaixaBank, a listed company that has other non-controlling shareholders in addition to Criteria.
Consequently, and in application of the criteria of proportionality and taking into account the size, internal organisation, nature, scope and complexity of its activities, the remuneration and contractual conditions of the professionals comprising Criteria's Identified Staff are established in view of the particular characteristics of the Entity, with reference to the regulations set out in CaixaBank's remuneration policy for Identified Staff and, in any case, in accordance with the LOSS in respect of remuneration and with the applicable general principles of labour and contractual law.
The remuneration policy applicable to each member of Criteria's Identified Staff is enacted through complementary agreements signed in addition to their labour contracts. These complementary agreements set out the principles contained in the LOSS and the remaining implementing regulations concerning remuneration, which must be applied to this Identified Staff, in order to adapt the terms of their labour relationship to the Entity's remuneration policy.
62
b. Governance of the remuneration policy
The Board of Directors is entrusted with adopting and periodically reviewing the principles of the remuneration policy, and with supervising its application.
Among other non-delegable powers established in the restated text of the Spanish Corporate Enterprises Act (Texto Refundido de la Ley de Sociedades de Capital, hereinafter, “TRLSC”), the Board is also responsible for (i) determining the Company's general policies and strategies, (ii) establishing the contract conditions for executive directors, (iii) appointing and removing executives reporting directly to the Board or to any of its members, and establishing their basic contract conditions, including remuneration, and (iv) taking decisions about director remuneration, pursuant to the Company's articles of association and the remuneration policies approved by the shareholders in general meeting.
Among other duties, Criteria's Appointments and Remuneration Committee is entrusted with proposing to the Board of Directors the remuneration policy for Directors and general managers as well as those individuals carrying out senior management duties and reporting directly to the Board, the Board committees or the Executive Directors, as well as the individual remuneration and other contract conditions of executive directors, ensuring compliance therewith.
The Appointments and Remuneration Committee submits its proposals to the Board of Directors for consideration and possible approval. Should these decisions fall within the remit of the Annual General Meeting, the Board of Directors includes these on the agenda as proposed resolutions, as appropriate, along with the corresponding reports.
In 2016 and at present, the Appointments and Remuneration Committee comprises the following directors:
Table 24. Appointments and Remuneration Committee
During 2016, the Appointments and Remuneration Committee held five meetings, and its members received an aggregate total of €60,000 during the year for carrying out their committee duties.
2. DESCRIPTION OF CRITERIA'S IDENTIFIED STAFF
During 2016, the professionals forming part of Criteria's Identified Staff were determined in accordance with Commission Delegated Regulation (EU) No 604/2014 of 4 March 2014 supplementing Directive 2013/36/EU of the European Parliament and of the Council with regard to regulatory technical standards with respect to qualitative and appropriate quantitative criteria to identify categories of staff whose professional activities have a material impact on an institution's risk profile.
In accordance with the Delegated Regulation, the members of the Identified Staff are identified using a combination of the qualitative and quantitative criteria prescribed therein.
Following this evaluation, which is documented in accordance with the Delegated Regulation, Criteria's governing bodies approved the list of positions included Identified Staff, which for 2016 comprised 22 professionals (21 at year-ended 2016) including Criteria directors, chief executives and key employees.
Name Position Category
Isabel Estapé Tous Chairman Independent
José Antonio Asiáin Ayala Member Independent
Juan José López Burniol Member Proprietary
63
Of these, 18 (17 at year-end 2016) form part of the Identified Staff based on qualitative criteria and four are on the basis of quantitative criteria. All of the Identified Staff carry out their activities in Spain. For the purposes of this document and in view of Criteria's activity as a holding company, all of the Identified Staff form part of the same group without any distinction upon their between areas of activity.carrying out the same area of activity.
3. QUALITATIVE INFORMATION CONCERNING REMUNERATION OF CRITERIA'S IDENTIFIED STAFF
a. Remuneration of the members of the Board of Directors for membership on the Board
In accordance with Criteria's articles of association, remuneration of Criteria's directors for membership on the Board (non-executive directors) comprises non-variable items. No variable components are included. The articles of association also foresee potential share-based remuneration systems, which can only be implemented by virtue of a resolution taken at the Annual General Meeting. At the date of this report, no such systems have been implemented.
Non-executive directors have a purely organic working relationship with Criteria, and as such do not hold contracts with the Company nor are they entitled to any form of payment should they be dismissed from their position as director.
As such, remuneration for membership on Criteria's Board of Directors comprises a maximum annual fixed amount to be determined by the shareholders at the Annual General Meeting for the Board of Directors as a whole. This maximum amount remains applicable unless modified at another Annual General Meeting.
The amount determined at the Annual General Meeting is used to remunerate members of the Board of Directors and the Board committees and is distributed as the Board deems appropriate, subject to a proposal by Criteria's Appointments and Remuneration Committee. This proposal addresses distribution of the amount among the members, in particular the Chairman and the Deputy Chairman, based on the functions and involvement of each individual and their membership on the different committees, as well as the frequency and form of attendance fees, remuneration established in the articles of association, and other items. As a result of the above, this distribution may give rise to several different payments for each director.
In addition, Criteria's non-executive directors may elect to benefit from health insurance for themselves, their spouses and their children under 25, as payment in kind for their membership on the Board. Lastly, in accordance with market practice, non-executive directors are also covered by the civil liability insurance for directors and executives.
b. Characteristics of the remuneration system for the remaining Identified Staff
The most important characteristics of each item comprising Criteria's remuneration system are as follows:
I. Non-variable remuneration
Non-variable remuneration may be increased primarily to reflect market changes, referencing Criteria's activity sector or the main IBEX companies and other companies with similar business volumes and activity.
II. Variable remuneration (bonus)
Variable remuneration is determined on the basis of the target bonus established and updated by the Board of Directors on the proposal of the Appointments and Remuneration Committee.
The average ratio between fixed and variable remuneration components is 86%/14%. One member of the Identified Staff has not been assigned any variable remuneration.
64
Payment of the bonus depends on parameters linked to Criteria's performance, set for each year by Criteria's Board of Directors at the proposal of the Appointments and Remuneration Committee and subject to consultation with the Chairman. The bonus is weighted on the basis of objective items that may comprise, among other possibilities, of some or all of the following:
Management of equity assets
Debt management
Result of transactions performed during the year
The proposed composition and weighting of these parameters is established in accordance with the LOSS and its implementing regulations.
In addition, the global result of the valuation of the aforementioned targets (Initial Variable Remuneration) may be weighted in accordance with qualitative analysis parameters, such as personal performance and other challenges related with the Group's strategy. This final valuation (Final Variable Remuneration) is agreed by the Board of Directors at the proposal of the Appointments and Remuneration Committee and is subject to consultation with the Chairman.
III. Variable remuneration (bonus) payment cycle
At the forecast payment date (the “Initial Payment Date”), 50% of the bonus accrued is paid, half in cash and half in CaixaBank shares.
Providing there are no situations that give rise to a reduction in the variable remuneration, as indicated below in section d), the deferred part of the accrued bonus must be paid in three payments, as follows:
1/3: 12 months after the Initial Payment Date
1/3: 24 months after the Initial Payment Date
1/3: 36 months after the Initial Payment Date
50% of the amount payable at each of these three dates is paid in cash, while the remaining 50% is paid in CaixaBank shares. In all cases, CaixaBank shares are delivered after the corresponding taxes (withholdings or payments on account) have been settled. Shares delivered as remuneration may not be sold for one year from the date delivered.
Criteria retains ownership of retained shares and deferred cash payments. Nevertheless, to the extent permitted by regulations governing remunerations, both the interest accrued on the deferred cash payment and any returns on the retained shares correspond to the professional.
In special, unforeseen situations (such as corporate operations affecting ownership of the delivered or retained shares), specific solutions must be applied, in accordance with Criteria's Remuneration Policy.
In the event the labour relationship is terminated prior to 31 December of the year in which the variable remuneration is to accrue, this variable remuneration accrues in proportion to the time elapsed from the start of the accrual period, unless any of the cases foreseen in the following section should arise.
IV. Variable remuneration reduction and recovery clauses
In accordance with the LOSS, the professional's right to receive bonus amounts, including those pending payment, whether in cash or through shares, may be partially or fully reduced when the professional participates in or is responsible for conduct generating significant losses for the Entity or conduct that breaches suitability requirements, particularly in the case of circumstances giving rise to lawful disciplinary dismissal and, in general, when payment or
65
vesting of the amount are not sustainable in view of Criteria's overall financial position or are not justified on the basis of Criteria's overall results.
In addition, these rights may be reduced when the external auditor's report includes qualifications that lower the financial parameters used to calculate variable remuneration for a given year, providing that this circumstance is attributable to negligence or misconduct by the professional.
Had the causes leading to the above-mentioned situations occurred prior to payment of a variable remuneration amount but were not known until after the payment was made, and if, had the situation been known, that payment would not have been made, either in part or in full, Criteria may recover the part of the variable remuneration unduly paid. Criteria's right to require restitution of the amounts paid expires in the terms foreseen in prevailing labour legislation.
V. Employee benefits
Criteria's contributions to employee benefits systems are not determined or made in a way that qualifies them as discretionary pension benefits for the purposes of the regulations governing remuneration and applicable to Criteria, except for the minimum variable-base contribution of 15% established by Bank of Spain Circular 2/2016 of 2 February.
VI. Payments for early termination
In accordance with the LOSS, payments for early termination may not be used to compensate poor results or improper conduct.
Payment of any amounts for early termination must be deferred using formulas based on the principles applicable to deferral of variable remuneration, in line with the LOSS, its implementing regulation and the criteria issued by regulatory authorities exercising their power to regulate, execute or interpret the applicable regulation.
4. AGGREGATE QUANTITATIVE INFORMATION ON REMUNERATION (consolidated base)
Table 25. Remuneration paid to the Identified Staff (I)
Table 25.a) Individual
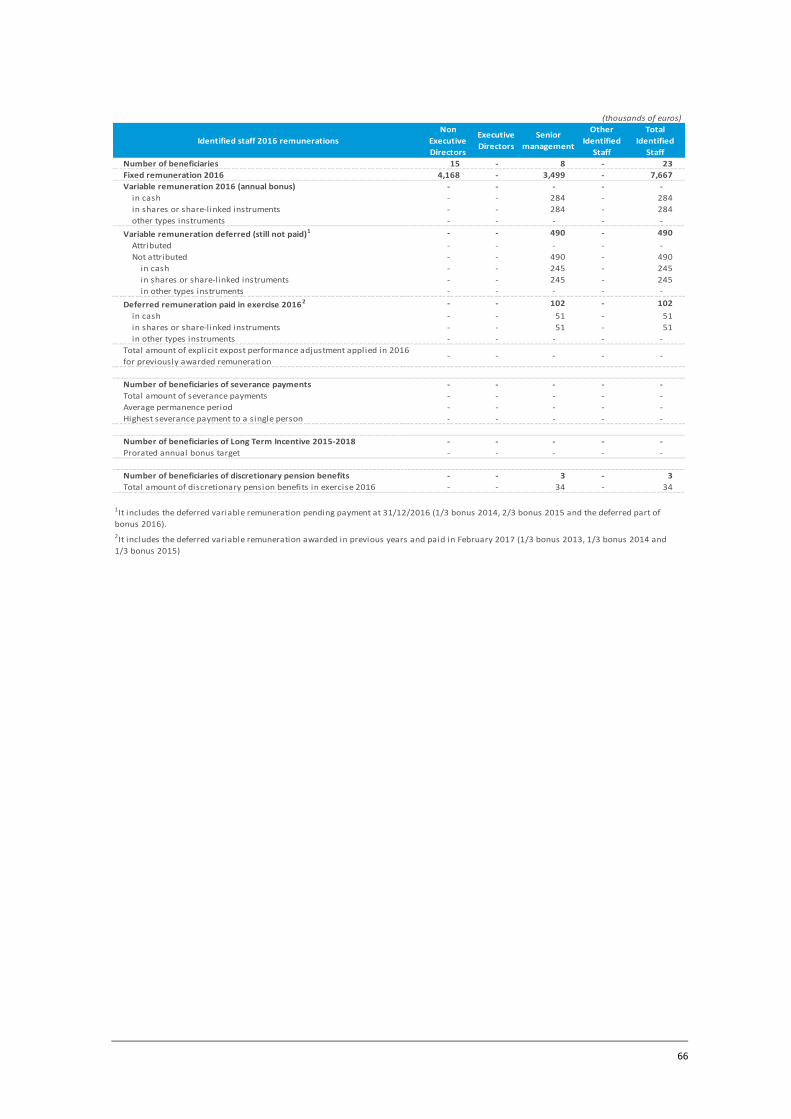
66
Identified staff 2016 remunerations
Non
Executive
Directors
Executive
Directors
Senior
management
Other
Identified
Staff
Total
Identified
Staff
Number of beneficiaries 15 - 8 - 23
Fixed remuneration 2016 4,168 - 3,499 - 7,667
Variable remuneration 2016 (annual bonus) - - - - -
in cash - - 284 - 284
in shares or share-linked instruments - - 284 - 284
other types instruments - - - - -
Variable remuneration deferred (still not paid)1 - - 490 - 490
Attributed - - - - -
Not attributed - - 490 - 490
in cash - - 245 - 245
in shares or share-linked instruments - - 245 - 245
in other types instruments - - - - -
Deferred remuneration paid in exercise 20162 - - 102 - 102
in cash - - 51 - 51
in shares or share-linked instruments - - 51 - 51
in other types instruments - - - - -
Total amount of explicit expost performance adjustment applied in 2016
for previously awarded remuneration- - - - -
Number of beneficiaries of severance payments - - - - -
Total amount of severance payments - - - - -
Average permanence period - - - - -
Highest severance payment to a single person - - - - -
Number of beneficiaries of Long Term Incentive 2015-2018 - - - - -
Prorated annual bonus target - - - - -
Number of beneficiaries of discretionary pension benefits - - 3 - 3
Total amount of discretionary pension benefits in exercise 2016 - - 34 - 34
2It includes the deferred variable remuneration awarded in previous years and paid in February 2017 (1/3 bonus 2013, 1/3 bonus 2014 and
1/3 bonus 2015)
(thousands of euros)
1It includes the deferred variable remuneration pending payment at 31/12/2016 (1/3 bonus 2014, 2/3 bonus 2015 and the deferred part of
bonus 2016).
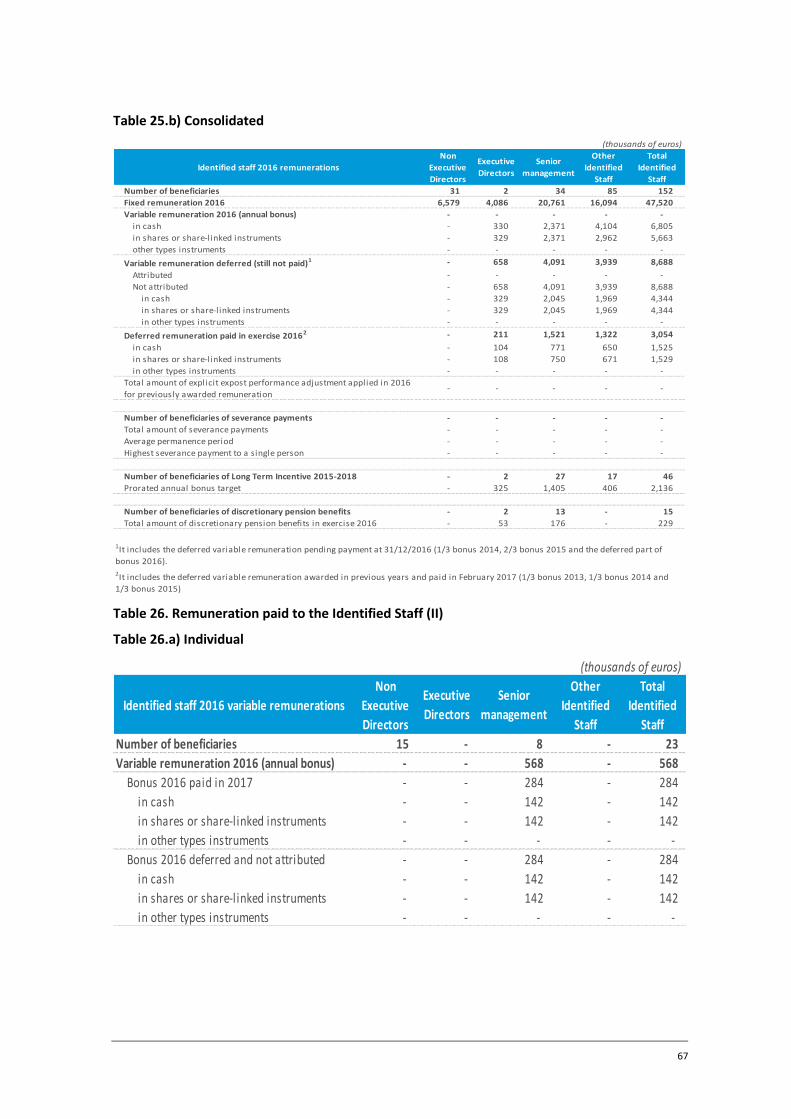
67
Table 25.b) Consolidated
Table 26. Remuneration paid to the Identified Staff (II)
Table 26.a) Individual
Identified staff 2016 remunerations
Non
Executive
Directors
Executive
Directors
Senior
management
Other
Identified
Staff
Total
Identified
Staff
Number of beneficiaries 31 2 34 85 152
Fixed remuneration 2016 6,579 4,086 20,761 16,094 47,520
Variable remuneration 2016 (annual bonus) - - - - -
in cash - 330 2,371 4,104 6,805
in shares or share-linked instruments - 329 2,371 2,962 5,663
other types instruments - - - - -
Variable remuneration deferred (still not paid)1 - 658 4,091 3,939 8,688
Attributed - - - - -
Not attributed - 658 4,091 3,939 8,688
in cash - 329 2,045 1,969 4,344
in shares or share-linked instruments - 329 2,045 1,969 4,344
in other types instruments - - - - -
Deferred remuneration paid in exercise 20162 - 211 1,521 1,322 3,054
in cash - 104 771 650 1,525
in shares or share-linked instruments - 108 750 671 1,529
in other types instruments - - - - -
Total amount of explicit expost performance adjustment applied in 2016
for previously awarded remuneration- - - - -
Number of beneficiaries of severance payments - - - - -
Total amount of severance payments - - - - -
Average permanence period - - - - -
Highest severance payment to a single person - - - - -
Number of beneficiaries of Long Term Incentive 2015-2018 - 2 27 17 46
Prorated annual bonus target - 325 1,405 406 2,136
Number of beneficiaries of discretionary pension benefits - 2 13 - 15
Total amount of discretionary pension benefits in exercise 2016 - 53 176 - 229
2It includes the deferred variable remuneration awarded in previous years and paid in February 2017 (1/3 bonus 2013, 1/3 bonus 2014 and
1/3 bonus 2015)
(thousands of euros)
1It includes the deferred variable remuneration pending payment at 31/12/2016 (1/3 bonus 2014, 2/3 bonus 2015 and the deferred part of
bonus 2016).
Identified staff 2016 variable remunerations
Non
Executive
Directors
Executive
Directors
Senior
management
Other
Identified
Staff
Total
Identified
Staff
Number of beneficiaries 15 - 8 - 23
Variable remuneration 2016 (annual bonus) - - 568 - 568
Bonus 2016 paid in 2017 - - 284 - 284
in cash - - 142 - 142
in shares or share-linked instruments - - 142 - 142
in other types instruments - - - - -
Bonus 2016 deferred and not attributed - - 284 - 284
in cash - - 142 - 142
in shares or share-linked instruments - - 142 - 142
in other types instruments - - - - -
(thousands of euros)
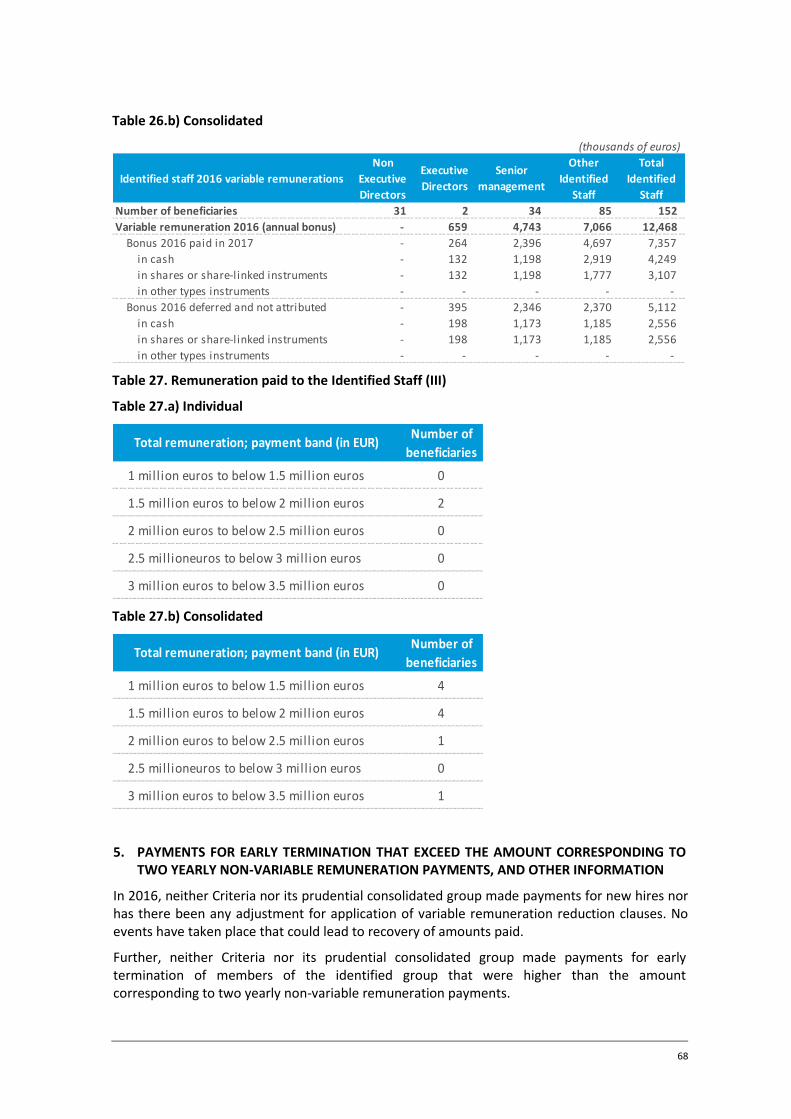
68
Table 26.b) Consolidated
Table 27. Remuneration paid to the Identified Staff (III)
Table 27.a) Individual
Table 27.b) Consolidated
5. PAYMENTS FOR EARLY TERMINATION THAT EXCEED THE AMOUNT CORRESPONDING TO TWO YEARLY NON-VARIABLE REMUNERATION PAYMENTS, AND OTHER INFORMATION
In 2016, neither Criteria nor its prudential consolidated group made payments for new hires nor has there been any adjustment for application of variable remuneration reduction clauses. No events have taken place that could lead to recovery of amounts paid.
Further, neither Criteria nor its prudential consolidated group made payments for early termination of members of the identified group that were higher than the amount corresponding to two yearly non-variable remuneration payments.
Identified staff 2016 variable remunerations
Non
Executive
Directors
Executive
Directors
Senior
management
Other
Identified
Staff
Total
Identified
Staff
Number of beneficiaries 31 2 34 85 152
Variable remuneration 2016 (annual bonus) - 659 4,743 7,066 12,468
Bonus 2016 paid in 2017 - 264 2,396 4,697 7,357
in cash - 132 1,198 2,919 4,249
in shares or share-linked instruments - 132 1,198 1,777 3,107
in other types instruments - - - - -
Bonus 2016 deferred and not attributed - 395 2,346 2,370 5,112
in cash - 198 1,173 1,185 2,556
in shares or share-linked instruments - 198 1,173 1,185 2,556
in other types instruments - - - - -
(thousands of euros)
1 million euros to below 1.5 million euros 0
1.5 million euros to below 2 million euros 2
2 million euros to below 2.5 million euros 0
2.5 millioneuros to below 3 million euros 0
3 million euros to below 3.5 million euros 0
Total remuneration; payment band (in EUR)Number of
beneficiaries
1 million euros to below 1.5 million euros 4
1.5 million euros to below 2 million euros 4
2 million euros to below 2.5 million euros 1
2.5 millioneuros to below 3 million euros 0
3 million euros to below 3.5 million euros 1
Number of
beneficiariesTotal remuneration; payment band (in EUR)

Appendix I. Main features of capital instruments
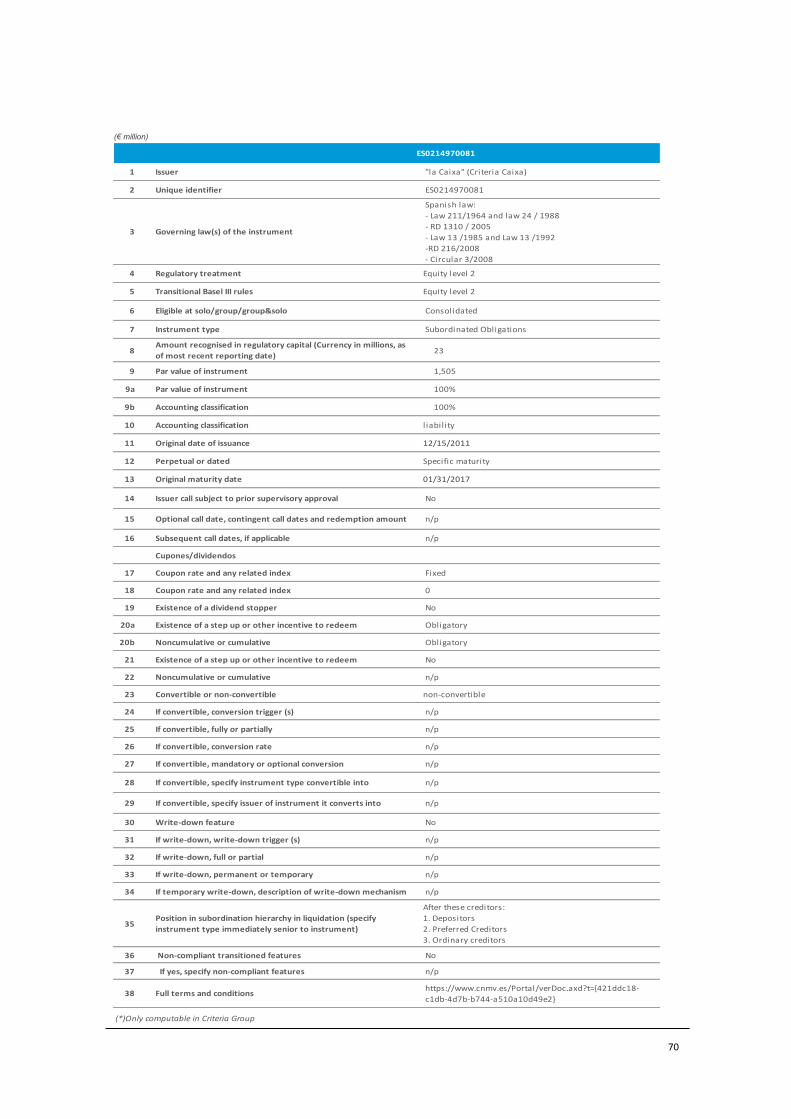
70
Amounts in millions of euros
ES0214970081
1 Issuer "la Caixa" (Criteria Caixa)
2 Unique identifier ES0214970081
3 Governing law(s) of the instrument
Spanish law:
- Law 211/1964 and law 24 / 1988
- RD 1310 / 2005
- Law 13 /1985 and Law 13 /1992
-RD 216/2008
- Circular 3/2008
4 Regulatory treatment Equity level 2
5 Transitional Basel III rules Equity level 2
6 Eligible at solo/group/group&solo Consolidated
7 Instrument type Subordinated Obligations
8Amount recognised in regulatory capital (Currency in millions, as
of most recent reporting date)23
9 Par value of instrument 1,505
9a Par value of instrument 100%
9b Accounting classification 100%
10 Accounting classification l iabil ity
11 Original date of issuance 12/15/2011
12 Perpetual or dated Specific maturity
13 Original maturity date 01/31/2017
14 Issuer call subject to prior supervisory approval No
15 Optional call date, contingent call dates and redemption amount n/p
16 Subsequent call dates, if applicable n/p
Cupones/dividendos
17 Coupon rate and any related index Fixed
18 Coupon rate and any related index 0
19 Existence of a dividend stopper No
20a Existence of a step up or other incentive to redeem Obligatory
20b Noncumulative or cumulative Obligatory
21 Existence of a step up or other incentive to redeem No
22 Noncumulative or cumulative n/p
23 Convertible or non-convertible non-convertible
24 If convertible, conversion trigger (s) n/p
25 If convertible, fully or partially n/p
26 If convertible, conversion rate n/p
27 If convertible, mandatory or optional conversion n/p
28 If convertible, specify instrument type convertible into n/p
29 If convertible, specify issuer of instrument it converts into n/p
30 Write-down feature No
31 If write-down, write-down trigger (s) n/p
32 If write-down, full or partial n/p
33 If write-down, permanent or temporary n/p
34 If temporary write-down, description of write-down mechanism n/p
35Position in subordination hierarchy in liquidation (specify
instrument type immediately senior to instrument)
After these creditors:
1. Depositors
2. Preferred Creditors
3. Ordinary creditors
36 Non-compliant transitioned features No
37 If yes, specify non-compliant features n/p
38 Full terms and conditionshttps://www.cnmv.es/Portal/verDoc.axd?t={421ddc18-
c1db-4d7b-b744-a510a10d49e2}
(*)Only computable in Criteria Group
(€ million)

71
Appendix II. Transitional own funds

72
Common equity Tier 1: Instruments and reserves
1 Equity instruments and the corresponding share premium accounts 4,17926 (1), 27, 28, 29
list of the EBA 26 (3)
2 Retained earnings 11,818 26 (1) (c)
3Other accumulated comprehensive results (and other reserves, to include unrealised
gains or losses, pursuant to applicable accounting law)351 34,105
5 Non-controlling interests (amount admitted in consolidated common equity Tier 1) 11,267 84, 479, 480
5a Interim profits verified independently, net of any foreseeable charge or dividend 689 26 (2)
6 Common equity Tier 1 before regulatory adjustments 28,304
Common equity Tier 1: regulatory adjustments
7 Additional value adjustments (negative amount) (170)
8 Intangible assets (net of tax debt) (negative amount) (3,595) 36 (1) (b), 37, 472 (4)
10
Deferred tax assets that rely on future profitability, with the exception of that derive
from temporary differences (net of corresponding tax liabilities when the terms of
article 38.3 are met) (negative amount)
(973) 36 (1) (c), 38, 472 (5)
11 Fair value reserves related to losses or gains on cash flow hedges 44 33 (a)
12 Negative amounts resulting from the calculation of expected losses (269)36 (1) (d), 40, 159, 472
(6)
13 Any increase in equity that results from securitised assets (negative amount) (45) 32 (1)
14Gains or losses on liabilities valued at fair value that result from changes in the own
credit standing(53) 33 (b)
16Direct and indirect holdings of own Common Equity Tier 1 instruments by an
institution (negative amount)(38) 36 (1) (f), 42, 472 (8)
19
Direct, indirect and synthetic holdings by the institution of the Common Equity Tier 1
instruments of financial sector entities where the institution has a significant
investment in those entities (amount exceeding 10% threshhold and net of qualifying
short positions) (negative amount)
(208)
36 (1) (i), 43, 45, 47,
48 (1) (b), 49 (1) a (3),
79, 470, 472 (11)
26Regulatory adjustments applied to CET1 in relation to amounts treated prior to the
CRR(27)
26a Regulatory adjustments to unrealised profit or loss pursuant to articles 467 and 469 (27) 467 a 468
27Qualifying deductions from Additional Tier 1 items that exceed the Additional Tier 1
capital of the institution (negative amount)(2,556) 36 (1) (j)
28 Total regulatory adjustments for Common Equity Tier 1 (7,889)
29 Common Equity Tier 1 20,415
Additional Tier 1 capital: Instruments
36 Additional Tier 1 capital before regulatory adjustments
Additional Tier 1 capital: regulatory adjustments
40
Direct and indirect holdings of CET1 instruments by financial sector entities where
the institution has a significant investment in those entities (amount over the 10%
threshold and net of qualifying short positions) (negative amount)
(69) 56 (d), 59, 79, 475 (3)
41a
Residual amounts deducted from Additional Tier 1 items with respect to deduction
from Common Tier 1 equity during the transitional period, in accordance with article
472 of Regulation (EU) 575/2013
(2,486)
472, 472 (3) (a), 472
(4), 472 (6), 472 (8) (a),
472 (9), 472 (10) (a),
472 (11) (a)
of which: intangible assets (2,396)
of which: expected losses on equities (90)
43 Total regulatory adjustments for Additional Tier 1 capital (2,556)
45Tier 1 capital (Tier 1 capital = common Tier 1 equity + additional tier 1
capital)20,415
Tier 2 capital: Instruments and provisions
46 Equity instruments and the corresponding share premium accounts 4,111 62,63
48
Qualifying equity instruments included in the Tier 2 consolidated capital (including
non-controlling interests and Tier 1 equity instruments not included in rows 5 or 34)
issued by subsidiaries and in the possession of third parties.
(1,693) 483 (4)
51 Tier 2 capital before regulatory adjustments 2,417
(A)
(€ million)
(A) Amount at reporting date; (B) reference to CRR article; (C) Amounts subject to
treatment prior to the CRR or residual amount prescribed by the CRR(B) (C)
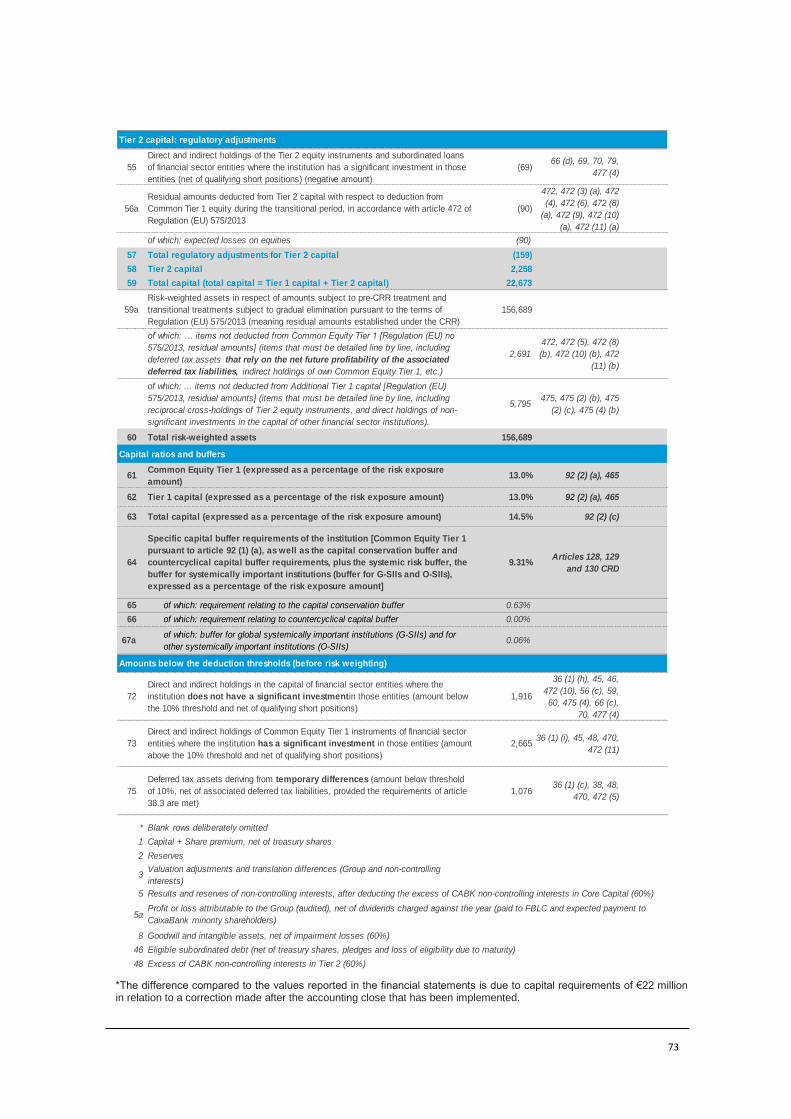
73
*The difference compared to the values reported in the financial statements is due to capital requirements of €22 million in relation to a correction made after the accounting close that has been implemented.
Tier 2 capital: regulatory adjustments
55
Direct and indirect holdings of the Tier 2 equity instruments and subordinated loans
of financial sector entities where the institution has a significant investment in those
entities (net of qualifying short positions) (negative amount)
(69)66 (d), 69, 70, 79,
477 (4)
56a
Residual amounts deducted from Tier 2 capital with respect to deduction from
Common Tier 1 equity during the transitional period, in accordance with article 472 of
Regulation (EU) 575/2013
(90)
472, 472 (3) (a), 472
(4), 472 (6), 472 (8)
(a), 472 (9), 472 (10)
(a), 472 (11) (a)
of which: expected losses on equities (90)
57 Total regulatory adjustments for Tier 2 capital (159)
58 Tier 2 capital 2,258
59 Total capital (total capital = Tier 1 capital + Tier 2 capital) 22,673
59a
Risk-weighted assets in respect of amounts subject to pre-CRR treatment and
transitional treatments subject to gradual elimination pursuant to the terms of
Regulation (EU) 575/2013 (meaning residual amounts established under the CRR)
156,689
of which: … items not deducted from Common Equity Tier 1 [Regulation (EU) no
575/2013, residual amounts] (items that must be detailed line by line, including
deferred tax assets that rely on the net future profitability of the associated
deferred tax liabilities, indirect holdings of own Common Equity Tier 1, etc.)
2,691
472, 472 (5), 472 (8)
(b), 472 (10) (b), 472
(11) (b)
of which: ... items not deducted from Additional Tier 1 capital [Regulation (EU)
575/2013, residual amounts] (items that must be detailed line by line, including
reciprocal cross-holdings of Tier 2 equity instruments, and direct holdings of non-
significant investments in the capital of other financial sector institutions).
5,795475, 475 (2) (b), 475
(2) (c), 475 (4) (b)
60 Total risk-weighted assets 156,689
Capital ratios and buffers
61Common Equity Tier 1 (expressed as a percentage of the risk exposure
amount)13.0% 92 (2) (a), 465
62 Tier 1 capital (expressed as a percentage of the risk exposure amount) 13.0% 92 (2) (a), 465
63 Total capital (expressed as a percentage of the risk exposure amount) 14.5% 92 (2) (c)
64
Specific capital buffer requirements of the institution [Common Equity Tier 1
pursuant to article 92 (1) (a), as well as the capital conservation buffer and
countercyclical capital buffer requirements, plus the systemic risk buffer, the
buffer for systemically important institutions (buffer for G-SIIs and O-SIIs),
expressed as a percentage of the risk exposure amount]
9.31%Articles 128, 129
and 130 CRD
65 of which: requirement relating to the capital conservation buffer 0.63%
66 of which: requirement relating to countercyclical capital buffer 0.00%
67aof which: buffer for global systemically important institutions (G-SIIs) and for
other systemically important institutions (O-SIIs)0.06%
Amounts below the deduction thresholds (before risk weighting)
72
Direct and indirect holdings in the capital of financial sector entities where the
institution does not have a significant investmentin those entities (amount below
the 10% threshold and net of qualifying short positions)
1,916
36 (1) (h), 45, 46,
472 (10), 56 (c), 59,
60, 475 (4), 66 (c),
70, 477 (4)
73
Direct and indirect holdings of Common Equity Tier 1 instruments of financial sector
entities where the institution has a significant investment in those entities (amount
above the 10% threshold and net of qualifying short positions)
2,66536 (1) (i), 45, 48, 470,
472 (11)
75
Deferred tax assets deriving from temporary differences (amount below threshold
of 10%, net of associated deferred tax liabilities, provided the requirements of article
38.3 are met)
1,07636 (1) (c), 38, 48,
470, 472 (5)
* Blank rows deliberately omitted
1 Capital + Share premium, net of treasury shares
2 Reserves
3Valuation adjustments and translation differences (Group and non-controlling
interests)
5
5a
8
46
48 Excess of CABK non-controlling interests in Tier 2 (60%)
Results and reserves of non-controlling interests, after deducting the excess of CABK non-controlling interests in Core Capital (60%)
Profit or loss attributable to the Group (audited), net of dividends charged against the year (paid to FBLC and expected payment to
CaixaBank minority shareholders)
Goodwill and intangible assets, net of impairment losses (60%)
Eligible subordinated debt (net of treasury shares, pledges and loss of eligibility due to maturity)

74
Appendix III. Information on leverage ratio
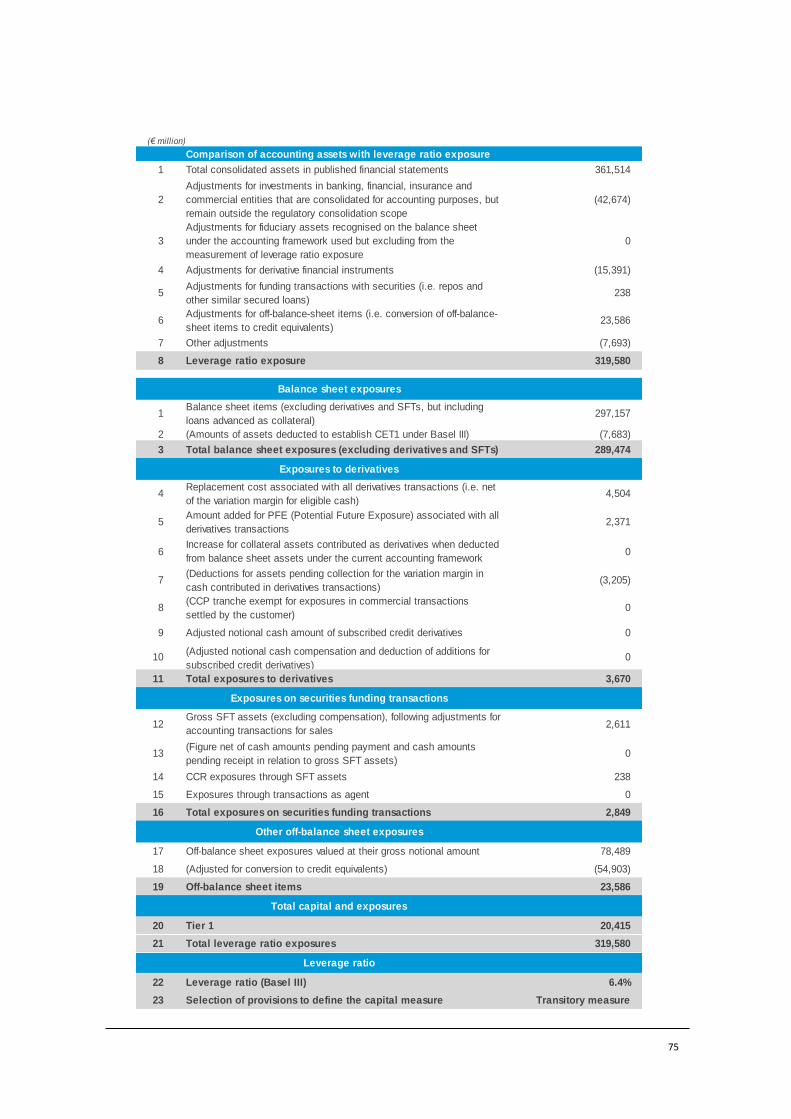
75
(€ million)
Comparison of accounting assets with leverage ratio exposure
1 Total consolidated assets in published financial statements 361,514
2
Adjustments for investments in banking, financial, insurance and
commercial entities that are consolidated for accounting purposes, but
remain outside the regulatory consolidation scope
(42,674)
3
Adjustments for fiduciary assets recognised on the balance sheet
under the accounting framework used but excluding from the
measurement of leverage ratio exposure
0
4 Adjustments for derivative financial instruments (15,391)
5Adjustments for funding transactions with securities (i.e. repos and
other similar secured loans)238
6Adjustments for off-balance-sheet items (i.e. conversion of off-balance-
sheet items to credit equivalents) 23,586
7 Other adjustments (7,693)
8 Leverage ratio exposure 319,580
Balance sheet exposures
1Balance sheet items (excluding derivatives and SFTs, but including
loans advanced as collateral)297,157
2 (Amounts of assets deducted to establish CET1 under Basel III) (7,683)
3 Total balance sheet exposures (excluding derivatives and SFTs) 289,474
Exposures to derivatives
4Replacement cost associated with all derivatives transactions (i.e. net
of the variation margin for eligible cash)4,504
5Amount added for PFE (Potential Future Exposure) associated with all
derivatives transactions 2,371
6Increase for collateral assets contributed as derivatives when deducted
from balance sheet assets under the current accounting framework0
7(Deductions for assets pending collection for the variation margin in
cash contributed in derivatives transactions)(3,205)
8(CCP tranche exempt for exposures in commercial transactions
settled by the customer)0
9 Adjusted notional cash amount of subscribed credit derivatives 0
10(Adjusted notional cash compensation and deduction of additions for
subscribed credit derivatives)0
11 Total exposures to derivatives 3,670
Exposures on securities funding transactions
12Gross SFT assets (excluding compensation), following adjustments for
accounting transactions for sales2,611
13(Figure net of cash amounts pending payment and cash amounts
pending receipt in relation to gross SFT assets)0
14 CCR exposures through SFT assets 238
15 Exposures through transactions as agent 0
16 Total exposures on securities funding transactions 2,849
Other off-balance sheet exposures
17 Off-balance sheet exposures valued at their gross notional amount 78,489
18 (Adjusted for conversion to credit equivalents) (54,903)
19 Off-balance sheet items 23,586
Total capital and exposures
20 Tier 1 20,415
21 Total leverage ratio exposures 319,580
Leverage ratio
22 Leverage ratio (Basel III) 6.4%
23 Selection of provisions to define the capital measure Transitory measure
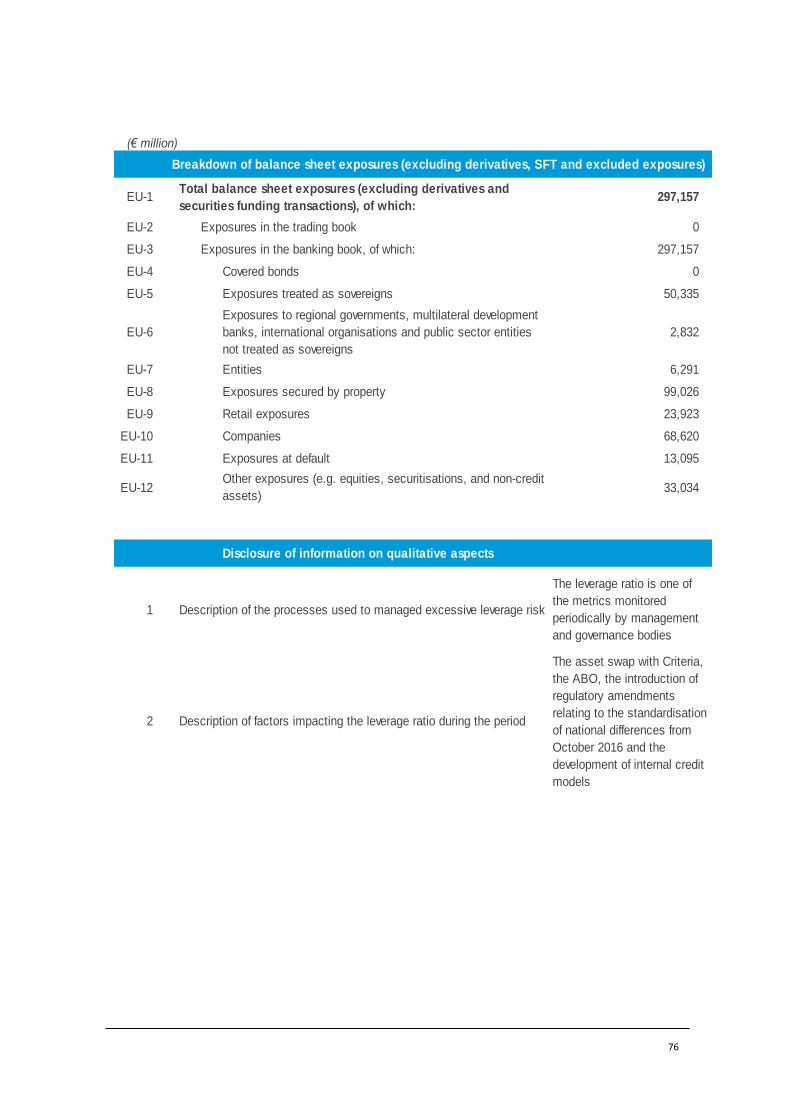
76
(€ million)
Breakdown of balance sheet exposures (excluding derivatives, SFT and excluded exposures)
EU-1Total balance sheet exposures (excluding derivatives and
securities funding transactions), of which:297,157
EU-2 Exposures in the trading book 0
EU-3 Exposures in the banking book, of which: 297,157
EU-4 Covered bonds 0
EU-5 Exposures treated as sovereigns 50,335
EU-6
Exposures to regional governments, multilateral development
banks, international organisations and public sector entities
not treated as sovereigns
2,832
EU-7 Entities 6,291
EU-8 Exposures secured by property 99,026
EU-9 Retail exposures 23,923
EU-10 Companies 68,620
EU-11 Exposures at default 13,095
EU-12Other exposures (e.g. equities, securitisations, and non-credit
assets)33,034
Disclosure of information on qualitative aspects
1 Description of the processes used to managed excessive leverage risk
The leverage ratio is one of
the metrics monitored
periodically by management
and governance bodies
2 Description of factors impacting the leverage ratio during the period
The asset swap with Criteria,
the ABO, the introduction of
regulatory amendments
relating to the standardisation
of national differences from
October 2016 and the
development of internal credit
models

77
Appendix IV. CaixaBank Group's Pillar 3 Disclosures - 2016

Pillar 3 Disclosures
CaixaBank Group at 31 December 2016

Information of Prudential Relevance 2016
(*) Translation of financial statements originally issued and prepared in Spanish. This English version is a translation of the original in Spanish for information purposes only. In the event of a discrepancy, the original Spanish-language version prevails.
Information of Prudential Relevance 2016
CONTENTS
1. KEY ASPECTS ................................................................................................................................... 1
2. CAIXABANK GROUP PILLAR 3 ........................................................................................................... 2
3. CAIXABANK GROUP ......................................................................................................................... 3
3.1. Regulatory framework ........................................................................................................................ 3
3.2. Scope of application ........................................................................................................................... 4
3.3. Other general information ................................................................................................................. 7
3.4. Description of the consolidated group for regulatory purposes ........................................................ 7
3.5. Accounting reconciliation between the financial statements and regulatory statements ................ 8
4. RISK GOVERNANCE, ORGANISATION AND MANAGEMENT ................................................................ 9
4.1. Governance and organisation .......................................................................................................... 10
4.1.1. Corporate governance .............................................................................................................. 10
4.1.2. Organisational structure ........................................................................................................... 15
4.1.3. Committees relevant to risk management and control ........................................................... 16
4.2. Corporate Risk Map .......................................................................................................................... 19
4.3. Risk Appetite Framework (RAF) ........................................................................................................ 20
4.4. Risk assessment and planning .......................................................................................................... 24
4.5. Risk Culture ....................................................................................................................................... 25
4.6. Internal control framework .............................................................................................................. 27
4.6.1. Internal Risk Control ................................................................................................................. 28
4.6.2. Internal Control over Information and Financial Models ......................................................... 28
4.6.3. Regulatory Compliance ............................................................................................................. 29
4.6.4. Internal Audit ............................................................................................................................ 29
5. CAPITAL ........................................................................................................................................ 32
5.1. Capital management ........................................................................................................................ 33
5.2. Regulatory capital ............................................................................................................................. 33
5.2.1. Eligible capital ........................................................................................................................... 33
5.2.2. Capital requirements ................................................................................................................ 35
5.2.3. Solvency evolution .................................................................................................................... 38
5.3. Capital buffers and SREP .................................................................................................................. 39
5.3.1. Pillar II: Internal Capital Adequacy Assessment ........................................................................ 39
5.3.2. Capital buffers ........................................................................................................................... 40
5.4. Stress test ......................................................................................................................................... 42
5.5. Economic capital ............................................................................................................................... 42
5.6. Leverage ratio ................................................................................................................................... 43
5.7. Indicators of global systemic importance ........................................................................................ 43
Information of Prudential Relevance 2016
6. TOTAL CREDIT RISK ........................................................................................................................ 44
6.1. CREDIT RISK ...................................................................................................................................... 45
6.1.1. Credit risk management ........................................................................................................... 46
6.1.2. Minimum own funds requirements for credit risk....................................................................... 57
6.1.3. Quantitative aspects ................................................................................................................. 69
6.2. COUNTERPARTY RISK ...................................................................................................................... 107
6.2.1. Counterpart risk management ............................................................................................... 108
6.2.2. Minimum own funds requirements for counterparty risk ......................................................... 110
6.2.3. Quantitative aspects ............................................................................................................... 111
6.3. SECURITISATIONS ........................................................................................................................... 117
6.3.1. Qualitative aspects ................................................................................................................. 118
6.3.2. Minimum own funds requirements for securitisation risk ..................................................... 123
6.3.3. Quantitative aspects ............................................................................................................... 126
6.4. EQUITY PORTFOLIO ........................................................................................................................ 128
6.4.1. Management of equity portfolio risk...................................................................................... 129
6.4.2. Minimum own funds requirements for risk from the equity portfolio .................................. 131
6.4.3. Quantitative aspects ............................................................................................................... 132
7. MARKET RISK .............................................................................................................................. 136
7.1. Management of market risk ........................................................................................................... 137
7.2. Minimum own funds requirements for market risk ....................................................................... 138
7.3. Quantitative aspects ....................................................................................................................... 138
8. OPERATIONAL RISK ...................................................................................................................... 144
8.1. Operational risk management ........................................................................................................ 145
8.2. Minimum own funds requirements ............................................................................................... 147
8.3. Operational risk management levers ............................................................................................. 147
8.4. Connection with corporate risk mapping ....................................................................................... 152
8.4.1. Legal and regulatory risk ......................................................................................................... 153
8.4.2. Compliance and conduct risk .................................................................................................... 154
8.4.3. Technological risk (IT) ............................................................................................................. 154
8.4.4. Operating processes and external events .............................................................................. 155
8.4.5. Risk associated with financial reporting reliability ................................................................. 156
9. INTEREST RATE RISK IN THE BANKING BOOK ................................................................................ 157
9.1. Management of interest rate in the banking book ........................................................................ 158
9.2. Quantitative aspects ....................................................................................................................... 161
9.3. Currency risk in the banking book .................................................................................................. 161
10. LIQUIDITY RISK ............................................................................................................................ 162
10.1. Liquidity risk management ..................................................................................................... 163
Information of Prudential Relevance 2016
10.2. Quantitative aspects ............................................................................................................... 165
11. OTHER RISKS ............................................................................................................................... 169
11.1. Reputational risk ..................................................................................................................... 169
11.2. Actuarial risk and risk relating to the insurance business ...................................................... 170
12. REMUNERATION.......................................................................................................................... 174
12.1. Remuneration policy: composition and mandate of the remuneration committee. ............. 174
12.2. Description of Identified Staff ................................................................................................. 175
12.3. Qualitative information concerning remuneration of Identified Staff ................................... 176
12.4. Quantitative information concerning remuneration of the Identified Staff .......................... 184
Appendix I. Information on transitory own funds .............................................................................. 187
Appendix II. Main features of equity instruments .............................................................................. 189
Appendix III. Information on leverage ratio ....................................................................................... 190
Appendix IV. Holdings subject to regulatory limits for deduction purposes. ....................................... 192
Appendix V. Companies with differing prudential and accounting consolidation treatment. ............... 193
Appendix VI. Acronyms .................................................................................................................... 194
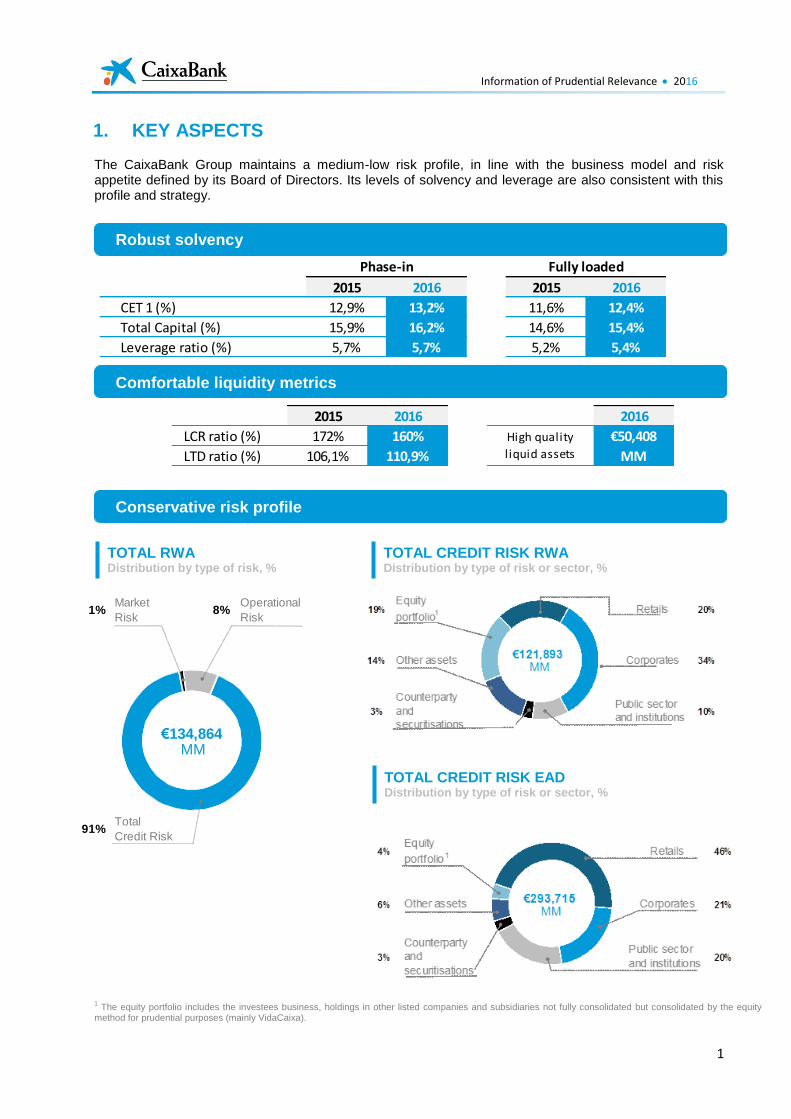
Information of Prudential Relevance 2016
1
1. KEY ASPECTS
The CaixaBank Group maintains a medium-low risk profile, in line with the business model and risk appetite defined by its Board of Directors. Its levels of solvency and leverage are also consistent with this profile and strategy.
1 The equity portfolio includes the investees business, holdings in other listed companies and subsidiaries not fully consolidated but consolidated by the equity
method for prudential purposes (mainly VidaCaixa).
2015 2016 2015 2016
CET 1 (%) 12,9% 13,2% 11,6% 12,4%
Total Capital (%) 15,9% 16,2% 14,6% 15,4%
Leverage ratio (%) 5,7% 5,7% 5,2% 5,4%
Phase-in Fully loaded
2015 2016 2016
LCR ratio (%) 172% 160%
LTD ratio (%) 106,1% 110,9%
High quality
liquid assets
€50,408
MM
Total
Credit Risk91%
8%1%Market
Risk
Operational
Risk
MM€134,864
Conservative risk profile
Comfortable liquidity metrics
Robust solvency
TOTAL CREDIT RISK EAD Distribution by type of risk or sector, %
TOTAL CREDIT RISK RWA Distribution by type of risk or sector, %
TOTAL RWA Distribution by type of risk, %
Information of Prudential Relevance 2016
2
2. CAIXABANK GROUP PILLAR 3
The Basel regulatory framework for banking is
based on three pillars:
Pillar 1: Minimum capital requirements.
Pillar 2: Supervisory review
Pillar 3: Market discipline
This report complies with the requirements of Part
Eight of EU Regulation 575/2013 of the European
Parliament and of the Council (hereinafter, the
CRR), which constitutes Pillar 3 of the Basel
regulations, with regard to public disclosure of the
entity's risk profile, risk management system,
control of own funds and solvency levels. In
preparing this report, we have also taken into
consideration a number of additional
developments and best practices, established by
the European Banking Authority (EBA) and the
Basel Committee on Banking Supervision
(BCBS).
The information in this report has been prepared
at the sub-consolidated level of CaixaBank, SA,
under a prudential scope, in compliance with
CRR requirements. The CaixaBank Group states
it has not omitted any of the items of information
required because it regarded them as confidential
or proprietary.
This report has been published on the CaixaBank
website, at:
http://www.caixabank.com/informacionparaaccion
istaseinversores/informacioneconomicofinanciera/
informacionconrelevanciaprudencial_es.html
As a complement to the information set out in this
annual document, CaixaBank deems appropriate
to publish some of the quantitative information
included in this report more frequently, pursuant
to article 433 of the CRR and the BCBS
recommendations set out in its “Revised Pillar 3
Disclosure Requirements”, of January 2015.
Since December 2015, CaixaBank has published
the main tables from this report on its website on
a quarterly basis, in Excel format. This
information is available on the CaixaBank
website, in the same location as this document.
CaixaBank's Pillar 3 disclosure policy, including
the aforementioned modifications to publishing,
was updated and approved by its Board of
Directors at its meeting on 25 March 2016.
This report is based on information referring to
31 December 2016. It was approved by
CaixaBank's Board of Directors at its meeting on
23 March 2017, following verification by the Audit
and Control Committee, pursuant to CaixaBank's
disclosure policy.
The figures in most of the tables in this report are
in millions of euros. However, some of the tables
are detailed in thousands of euros, to provide the
reader with more detailed information. This is
clearly indicated in the table.
Information of Prudential Relevance 2016
3
3. CAIXABANK GROUP
3.1. Regulatory framework
In 2010, the Basel Committee on Banking
Supervision approved the reform of the global
regulatory framework known as Basel III in the
aftermath of the international financial crisis. The
package of legislation transposing this framework
came into force in the European Union with effect
from 1 January 2014. It comprised Regulation
575/2013 (CRR) and Directive 2013/36 (CRD IV).
These modifications sought to improve the
banking sector’s ability to absorb the impact of
economic and financial crises, whilst enhancing
risk management and governance, transparency
and information disclosure. Specifically, these
improvements called for stricter requirements for
the quantity and quality of capital, and the
introduction of liquidity and leverage measures.
The CRR was applied immediately in Spain, with
CRD IV being implemented through Royal
Decree-Law 14/2013, Law 10/2014 and Royal
Decree 84/2015, in addition to other lower level
provisions, such as Bank of Spain Circular
2/2016. The CRR establishes a progressive
implementation schedule for the new
requirements in the European Union. Bank of
Spain Circulars 2/2014, partially repealed by
Circular 2/2016, and 3/2014 implemented the
regulatory options applicable during the Basel III
phase-in period. These Circulars were
superseded on 1 October 2016 by European
Regulation 2016/445 of the European Central
Bank (ECB), which sought to standardise various
significant national discretions and options.
In 2014, the ECB took responsibility for
supervision of the euro area, following Regulation
1024/2013 of the Council and ECB regulation
468/2014 coming into effect, giving rise to the
creation of the Single Supervisory Mechanism
(SSM). Under the SSM, the ECB takes direct
responsibility for supervision of the most
significant entities, including CaixaBank, and
indirect responsibility for other entities, which are
supervised directly by national authorities
(including the Bank of Spain).
In 2015, the ECB completed the first cycle of the
supervisory review evaluation process (SREP)
since the creation of the SSM, in implementation
of Pillar 2 of the Basel regulatory framework.
The SREP was designed by the EBA as a
supervisory process to evaluate the adequacy of
capital, liquidity, corporate governance, and risk
management and control through a standardised
European process based on the guidance
published by the European Banking Authority
(EBA) in December. The SREP process may
require additional capital or liquidity, or other
qualitative measures in response to any risks and
weaknesses detected by the supervisor in an
entity. The SREP seeks to assess the viability of
entities on an individual basis, also considering
comparisons against their peers. Any additional
capital requirements under the SREP process
(“Pillar 2” requirements) may also be
complemented by combined capital buffer
requirements (CBR), comprising capital
conservation, anti-cyclical capital and systemic risk
buffers.
In addition to the potential supervisory actions
mentioned above, in 2014 Directive 2014/59/EU -
otherwise known as the BRRD (Bank Recovery
and Resolution Directive) - was approved,
establishing a framework for the restructuring and
resolution of credit institutions. In 2015, the BRRD
was transposed into the Spanish regulatory
framework through Law 11/2015 and others
legislation. The BRRD, together with Directive
2014/49, on the Deposit Guarantee System,
enhances the capacity of the banking sector to
absorb the impact of economic and financial
crises, and the capacity of entities to wind up their
business in an orderly fashion, while maintaining
financial stability, protecting depositors and
avoiding the need for public bail-outs.
The Directive requires Member States to ensure
that institutions prepare and regularly update a
recovery plan setting out the measures that may
be taken by those institutions to restore their
financial position following a significant
deterioration thereof. In addition to the BRRD and
national legislation, the EBA has issued several
guidelines on the definition of a recovery plan.
The CaixaBank Group drew up its first Recovery
Plan in 2014, based on data from year-end 2013.
The 2016 Recovery Plan (based on 2015 data) is
the third edition and was approved by the Board
of Directors in September 2016.
CaixaBank’s Recovery Plan has been fully incorporated into the company’s internal risk and capital management and governance policies. The involvement of Senior Management in the Recovery and Resolution Plans Committee is noteworthy in this regard, as is the inclusion of
Information of Prudential Relevance 2016
4
recovery indicators in the risk appetite framework and in the entity’s regular monitoring reports.
The BRRD also introduced the framework to create a Single Resolution Mechanism (SRM), which was subsequently developed through Regulation EU 806/2014. Under the SRM, decisions are taken by the Single Resolution Board and executed by the National Resolution Authority (FROB and BoS in Spain), which also prepare the resolution plan in collaboration with each entity (which provides the information required). The BRRD also introduces a new Minimum Requirement for Own Funds and Eligible Liabilities (MREL) ratio. The SRM came into effect on 1 January 2016 and will set MREL requirements for entities, probably in 2017, following assessment of their resolution plans. The MREL requirements must be covered by eligible own funds and other eligible liabilities. On 23 November 2016, the European Commission put forward a package of reforms to address a series of banking regulations that will be submitted to the European Parliament and to the Council for approval. The objective of these reforms is to supplement the current prudential and resolution framework for the banking sector through a series of measures to reduce the risks to entities in the event of shocks, in accordance with the conclusions of the ECOFIN meeting in June 2016 and G-20 international standards. The reforms factor in the size, complexity and business profile of the banks. Measures are also included to support SME financing and boost investment in infrastructure.
The process of adapting applicable regulations is expected to continue throughout 2017, with the exception of the amendment to the BRRD relating to the hierarchy of lenders, which will be transposed into the legislation of member states in the first half of 2017, coming into force in July 2017.
In addition to capital regulations, in 2016 various pieces of legislation were published applicable to financial institutions. In particular, Bank of Spain Circular 4/2016, of 27 April introduces amendments to the content of Annex IX of Circular 4/2004, among others, on the calculation of impairment of debt instruments in the separate financial statements of financial institutions, to bring it into line with the latest developments in banking regulation, while remaining fully compatible with the IFRS accounting framework.
A number of international regulatory developments are also expected in 2017, emanating from both the Basel Committee and the EBA. These include: further progress on the review of capital consumption requirements for credit, market and operational risk; the treatment
of sovereign debt in a prudential framework; review of credit valuation adjustment (CVA) risk in the development of IFRS 9 and IFRS -16, among other initiatives.
3.2. Scope of application
The financial information in this report relates to the CaixaBank Group. CaixaBank, SA and its subsidiaries compose the CaixaBank Group (hereinafter "the CaixaBank Group" or "the Group"). CaixaBank, SA (“CaixaBank”), with tax identification (NIF) number A08663619 and registered address at Avenida Diagonal 621, Barcelona, was created through the transformation of Criteria CaixaCorp, SA which culminated on 30 June 2011 with the entry of CaixaBank in the Bank of Spain’s Registry of Banks and Bankers (“Registro Especial de Bancos y Banqueros”) and its listing on the Spanish stock markets—as a bank—on 1 July 2011.
The corporate object of CaixaBank mainly entails:
a) all manner of activities, operations, acts,
contracts and services related to the banking
sector in general, including the provision of
investment services and ancillary services and
performance of the activities of an insurance
agency;
b) receiving public funds in the form of irregular
deposits or in other similar formats, for the
purposes of application on its own account to
active credit and microcredit operations, and
other investments, providing customers with
services including dispatch, transfer, custody,
mediation and others; and
c) acquisition, holding, enjoyment and disposal of
all manner of securities and drawing up takeover
bids and sales of securities, and of all manner of
ownership interests in any entity or company.
As a listed bank, it is subject to oversight by the European Central Bank, the Bank of Spain and the Spanish national securities market regulator (the Comision Nacional del Mercado de Valores, CNMV).
At 31 December 2016, Criteria Caixa, SAU
("Criteria” or “CriteriaCaixa”) was CaixaBank's
majority shareholder, with a stake conferring
profit-sharing rights of 45.32% (56.76% at 31
December 2015) and voting rights of 44.68%
(56.17% at 31 December 2015). Criteria is 100%
owned by Fundación Bancaria Caixa d’Estalvis i
Pensions de Barcelona, "la Caixa" (hereinafter,
the "la Caixa” Banking Foundation”). Additionally,
the "la Caixa" Banking Foundation held 3,493
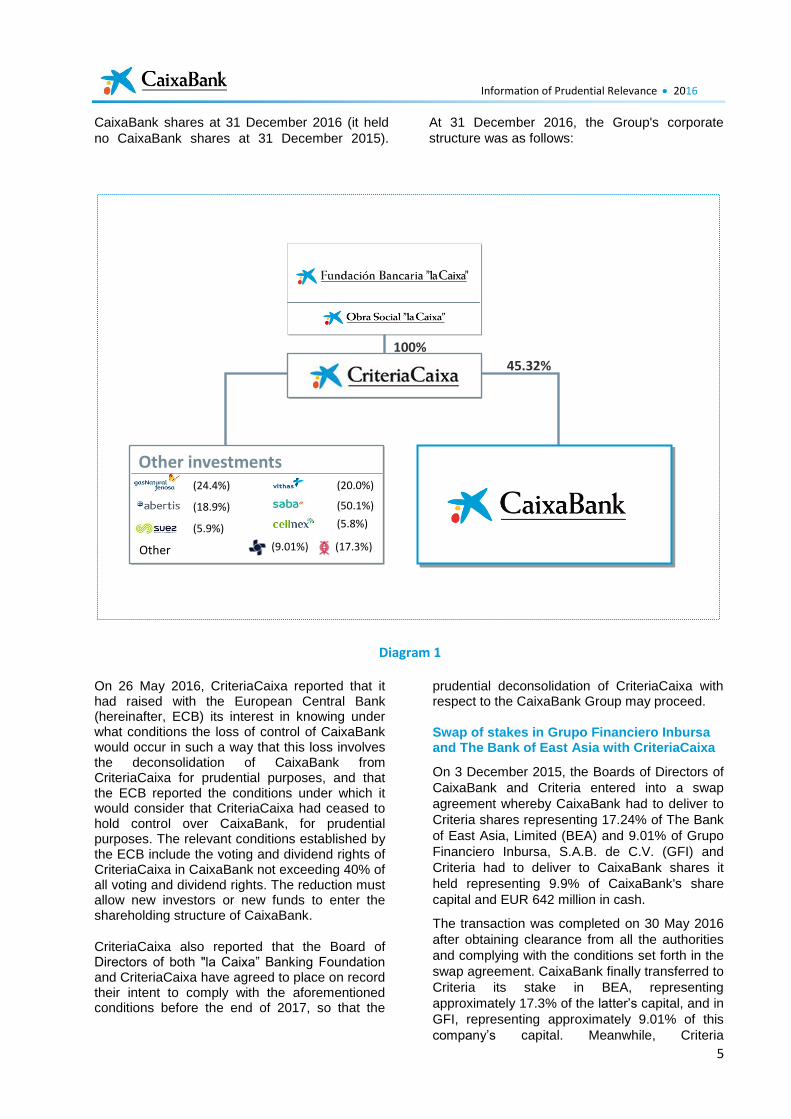
Information of Prudential Relevance 2016
5
CaixaBank shares at 31 December 2016 (it held
no CaixaBank shares at 31 December 2015).
At 31 December 2016, the Group's corporate
structure was as follows:
Diagram 1
On 26 May 2016, CriteriaCaixa reported that it had raised with the European Central Bank (hereinafter, ECB) its interest in knowing under what conditions the loss of control of CaixaBank would occur in such a way that this loss involves the deconsolidation of CaixaBank from CriteriaCaixa for prudential purposes, and that the ECB reported the conditions under which it would consider that CriteriaCaixa had ceased to hold control over CaixaBank, for prudential purposes. The relevant conditions established by the ECB include the voting and dividend rights of CriteriaCaixa in CaixaBank not exceeding 40% of all voting and dividend rights. The reduction must allow new investors or new funds to enter the shareholding structure of CaixaBank.
CriteriaCaixa also reported that the Board of Directors of both "la Caixa” Banking Foundation and CriteriaCaixa have agreed to place on record their intent to comply with the aforementioned conditions before the end of 2017, so that the
prudential deconsolidation of CriteriaCaixa with respect to the CaixaBank Group may proceed.
Swap of stakes in Grupo Financiero Inbursa and The Bank of East Asia with CriteriaCaixa
On 3 December 2015, the Boards of Directors of
CaixaBank and Criteria entered into a swap
agreement whereby CaixaBank had to deliver to
Criteria shares representing 17.24% of The Bank
of East Asia, Limited (BEA) and 9.01% of Grupo
Financiero Inbursa, S.A.B. de C.V. (GFI) and
Criteria had to deliver to CaixaBank shares it
held representing 9.9% of CaixaBank's share
capital and EUR 642 million in cash.
The transaction was completed on 30 May 2016
after obtaining clearance from all the authorities
and complying with the conditions set forth in the
swap agreement. CaixaBank finally transferred to
Criteria its stake in BEA, representing
approximately 17.3% of the latter’s capital, and in
GFI, representing approximately 9.01% of this
company’s capital. Meanwhile, Criteria
45.32%
Other investments
Other
(24.4%)
(18.9%)
(5.9%)
(50.1%)
(20.0%)
(5.8%)
(9.01%) (17.3%)
100%
Information of Prudential Relevance 2016
6
transferred to CaixaBank a number of CaixaBank
treasury shares representing approximately
9.89% of its share capital and a cash amount set
at EUR 678 million.
As provided for in the swap agreement, the
change relative to the 3 December 2015
announcement in the stake in BEA being
transferred to Criteria (17.24%) in CaixaBank
treasury shares to be delivered by Criteria (9.9%)
and in the cash amount to be paid by Criteria
(EUR 642 million) is according to the financial
flows received by each party from the signing date
of the swap agreement (3 December 2015), that
is, for the BEA shares received by CaixaBank as a
scrip dividend, the CaixaBank shares received by
Criteria as scrip dividend and the net adjustment
for the dividends received in cash by Criteria and
CaixaBank corresponding to the shares being
transferred under the swap agreement.
As a result of the swap, the shareholder
agreements relating to BEA and GFI were
amended accordingly in order for Criteria to take
over CaixaBank’s position as the new
shareholder. CaixaBank will remain banking
partner to both banks to continue cooperating
with them in commercial activities. If making
strategic investments in banks that operate on
the American continent and in the Asia-Pacific,
CaixaBank will keep its commitment to make
such investments through GFI and BEA,
respectively, except in the case of GFI, if that
bank decides not to participate in the investment.
The transfers included in the swap agreement
had a net impact of EUR -14 million on
CaixaBank’s consolidated result at the reporting
close, and an impact on the Tier 1 regulatory
capital (CET1) ratio of around -0.3% (phase-in)
and +0.2% (fully loaded).
At CaixaBank's Annual General Meeting held on
28 April 2016, the Board of Directors was
authorised to reduce capital through the
cancellation of 584,811,827 treasury shares
(representing 9.9% of share capital) to be
acquired under the swap agreement, or to not
execute the capital reduction if, based on the
Company's interests and due to circumstances
that may arise affecting CaixaBank, it were not
advisable. On 22 September 2016, the Board of
Directors exercised these powers and sold 585
million treasury shares, to shore up its regulatory
capital ratio in light of the takeover bid for Banco
BPI shares and to comply with CaixaBank's
Strategic Plan objective to maintain a fully loaded
ordinary Tier 1 capital ratio (CET 1) of between
11% and 12%. These shares represented 9.9%
of the Company's share capital. This sale was
worth EUR 1,322 million.
Takeover bid for Banco BPI
On 18 April 2016, CaixaBank notified the market
of its Board of Directors’ decision to launch a
takeover comprising a voluntary tender offer
(VTO) for Portugal’s Banco BPI.
The VTO price is EUR 1.113 per share in cash,
and is conditional upon removal of the Banco BPI
voting rights restriction, because it would involve
more than 50% of BPI’s capital, and obtaining
the pertinent regulatory approvals. The bid price
was the average weighted price of Banco BPI
shares for the six months prior to the bid.
Prior to the latest announcement, CaixaBank
held talks with the ECB to keep it abreast of the
entire process and request suspension of any
sanction proceedings against Banco BPI for
excess risk concentration, in order to allow
CaixaBank to find a solution to this situation
should it finally take control of Banco BPI.
The Supervisory Board also decided to put on
hold during this period the on-going sanction
proceedings against Banco BPI for the large
exposure breach prior to 2015.
CaixaBank was informed that the Supervisory
Board had taken these decisions in the context of
the takeover bid announced and that the
decisions were subject to effective acquisition by
CaixaBank of control of Banco BPI.
In response to this request, as reported by
CaixaBank on 22 June 2016, the Supervisory
Board of the ECB decided to grant CaixaBank a
period of four months from the completion of
CaixaBank’s acquisition of Banco BPI to solve
Banco BPI’s large exposure breach. At the end
of 2016, Banco BPI reached an agreement to sell
2% of its investment in its subsidiary Banco de
Fomento Angola (BFA) to Unitel. This transaction
was completed on 5 January 2017. As a result of
this transaction BFA will be deconsolidated from
BPI’s balance sheet and therefore the issue of its
excessive exposure to risks deriving from its
controlling stake in BFA will be resolved.
CaixaBank was informed that the Supervisory
Board had taken these decisions in the context of
the takeover bid announced and that the
decisions were subject to effective acquisition by
CaixaBank of control of Banco BPI.
With respect to the takeover bid announced on
18 April 2016, at Banco BPI’s Extraordinary
General Shareholders' Meeting on 21 September
2016, shareholders approved the elimination of
Information of Prudential Relevance 2016
7
the 20% voting cap on CaixaBank. As a result of
this elimination, the Portuguese stock market
regulator, the Comissão do Mercado de Valores
Mobiliários, then announced that it would retract
the dispensation from launching a mandatory
takeover bid on Banco BPI it had granted to
CaixaBank in 2012, thereby requiring CaixaBank
to make a mandatory takeover bid on Banco
BPI’s shares. Consequently, the takeover bid on
Banco BPI, which was initially a voluntary bid,
became a mandatory takeover bid. The new
price per share was set at EUR 1.134, equivalent
to the volume-weighted average price of Banco
BPI’s shares in the preceding six months.
Acceptance of the bid by BPI shareholders was
subject to compliance with the pertinent legal and
regulatory requirements, including those
foreseen in any foreign laws that apply to such
shareholders. On 17 October 2016, ECB
approval was obtained and the sale of 2% of
BFA to Unitel was completed on 5 January 2017.
This allowed CaixaBank to comply with another
of the mandatory conditions for proceeding with
its bid for 54.5% of BPI.
For further information on events subsequent to
31 December 2016 related to these and other
events, refer to note 1 to the CaixaBank Group's
2016 financial statements.
3.3. Other general information
At 31 December 2016, CaixaBank comfortably
met its minimum own funds requirements, at both
the individual and consolidated levels.
The remaining banking entities of the
consolidated group (banking subsidiaries and
financial credit establishments, i.e. CaixaBank
Consumer Finance, EFC, SA, Corporación
Hipotecaria Mutual, EFC, SA, CaixaBank
Payments, EFC, SA, Nuevo MicroBank, SA and
Credifimo, EFC, SA) are exempt from compliance
with individual minimum own funds requirements.
Similarly, all subsidiaries subject to compliance
with individual minimum capital requirements
(e.g. VidaCaixa) and not included in the
consolidated group meet the minimum capital
requirements prescribed by the various
regulations applicable.
In particular, there are no significant current or
foreseeable practical or legal obstacles to the
immediate transfer of own funds to the subsidiary
or to the reimbursement of its third party liabilities
by the parent company. This applies to
VidaCaixa, the insurance sector subsidiary with
which CaixaBank forms a financial conglomerate.
3.4. Description of the consolidated group for regulatory purposes
Pursuant to prevailing accounting regulations,
which follow the criteria set down in International
Financial Reporting Standards (particularly IFRS
10), a consolidated group is considered to exist
when a dominant entity exercise direct or indirect
control over the other entities (subsidiaries).
This relationship basically exists when a
dominant entity is exposed to or has the right to
variable returns from its involvement therein, and
also has the ability to influence these returns,
through the fact of having power over the
dependent entity.
The following provides a summary of the main
differences in relation to the consolidation scope
and methods applied to prepare information on
the CaixaBank Group in this report and to
prepare its consolidated financial statements:
1. For the preparation of the CaixaBank Group's
consolidated financial statements, all the
subsidiary undertakings (companies controlled
by the parent undertaking) were consolidated
using the full consolidation method. However,
associates (over which the parent exercises
significant influence) and jointly controlled (joint
management by the parent and other
shareholders) entities are consolidated using the
equity method.
2. For the purposes of solvency, subsidiary
undertakings with a different activity to that of a
credit institution or of investment undertakings as
defined in Directive 2013/36/EU and Regulation
(EU) 575/2013, both of 26 June 2013, are
accounted for using the equity method. Jointly
controlled entities that are financial institutions
are consolidated using the proportionate
consolidation method, regardless of the method
applied in the financial statements.
Appendix IV sets out details of holdings subject
to regulatory limits for deduction purposes, whilst
Appendix V provides details of companies with
differing prudential and accounting consolidation
treatment.
Information of Prudential Relevance 2016
8
3.5. Accounting reconciliation between the financial statements and regulatory statements
As set out in Annex I of Commission Implementing Regulation (EU) 1423/2013, the following table presents
the prudential balance sheet used for capital purposes, compared to the accounting information published
in the financial statements.
Table CONC1. Reconciliation between the public and prudential balance sheets
Amounts in millions of euros
Assets Public
Group entities
accounted for
the equity
method (1)
Jointly
controlled
entities
accounted for
proportional
method (2)
Regulatory
Scope
Cash and deposits at central banks 13,260 -28 0 13,266
Financial assets held for trading 11,668 0 6,428 18,096
Financial assets recognised at fair value 3,140 -3,140 0 0
Available-for-sale financial assets 65,077 -47,579 0 17,498
Loans and receivables 207,641 -519 607 207,729
Held-to-maturity investments 8,306 0 0 8,309
Derivatives 3,090 0 0 3,090
Fair value changes in covered portfolio for IR risk coverage 135 0 0 135
Investments 6,421 2,074 0 8,457
Associates 5,227 0 0 5,227
of which: Net badwill 16 0 0 16
Jointly controles entities 1,194 -1,052 -38 104
of which: Badwill 301 -246 0 55
Group Entities 0 3,127 0 3,127
of which: Badwill 0 973 0 973
Assets linked to insurance 344 -344 0 0
Tangible assets 6,437 -240 0 6,197
Intangible assets 3,687 -705 0 2,982
Tax assets 10,521 -377 228 10,374
Other Assets 1,796 -96 1,863 3,563
Non-current assets and other 6,405 -106 0 6,299
Total assets 347,927 -51,059 9,127 305,995
Liabilities Public
Group entities
accounted for
the equity
method (1)
Jointly
controlled
entities
accounted for
proportional
method (2)
Regulatory
Scope
Financial liabilities held for trading 10,292 0 6,428 16,721
Financial liabilities recognised at fair value 3,764 -3,764 0 0
Financial liabilities at amortized cost 254,093 -359 2,034 255,768
Derivatives 626 0 0 626
Fair value changes in covered portfolio for IR risk coverage 1,985 0 0 1,985
Liabilities linked to insurance 45,804 -45,804 0 0
Provisions 4,730 -5 6 4,731
Tax liabilities 1,186 -496 672 906
Other liabilities 1,806 -538 -14 1,710
Non-current liabilities and other 86 -86 0 0
Total liabilities 324,372 -51,052 9,127 282,447
Equity Public
Group entities
accounted for
the equity
method (1)
Jointly
controlled
entities
accounted for
proportional
method (2)
Regulatory
Scope
Shareholders' equity 23,400 0 0 23,400
Other cumulative overall profit 127 0 0 127
Non-Controlling Interest 29 -8 0 21
Total Equity 23,556 -8 0 23,548
Total Equity and liabilities 347,927 -51,059 9,127 305,995
(1) Entities of the Group which do not fully consolidate on the grounds of their activity, mainly VidaCaixa: its contribution is eliminated on accounting scope of
consolidation thus accounting for its carrying amount as an equity stake
(2) Mainly transactions between VidaCaixa an other investments being part of the non-fully consolidated economic group, which are not eliminated in the prudential
balance sheet
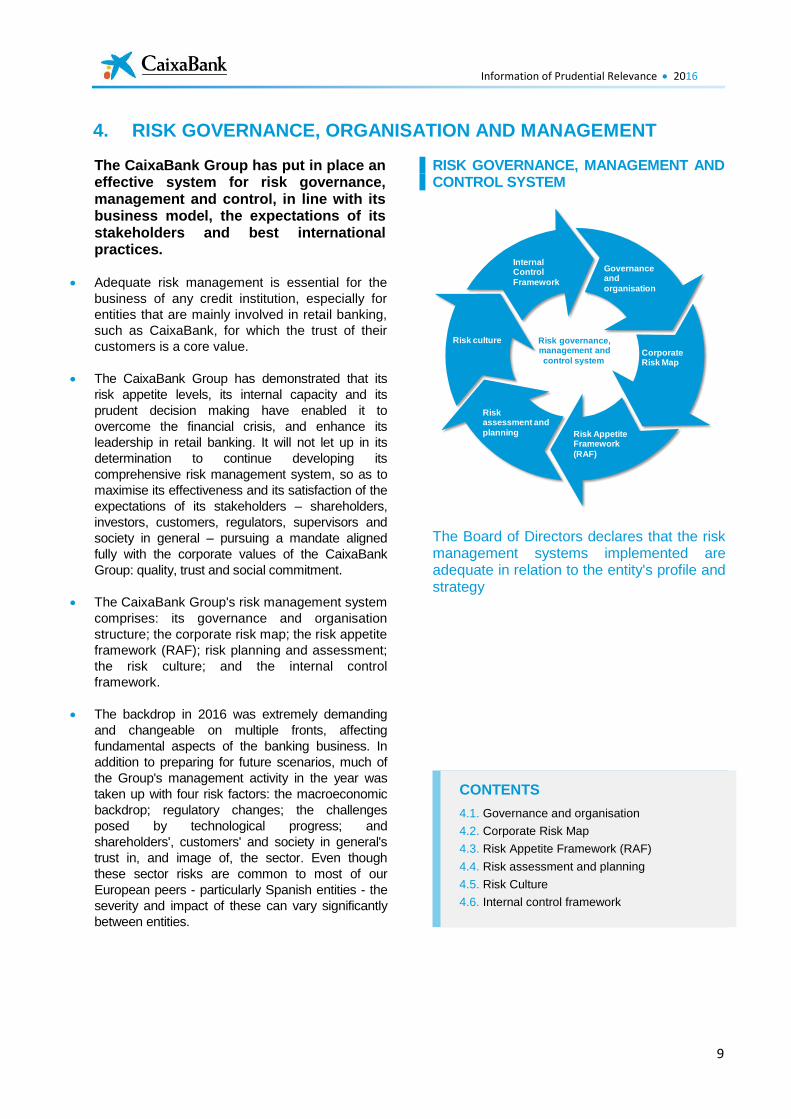
Information of Prudential Relevance 2016
9
4. RISK GOVERNANCE, ORGANISATION AND MANAGEMENT
The CaixaBank Group has put in place an effective system for risk governance, management and control, in line with its business model, the expectations of its stakeholders and best international practices.
Adequate risk management is essential for the
business of any credit institution, especially for
entities that are mainly involved in retail banking,
such as CaixaBank, for which the trust of their
customers is a core value.
The CaixaBank Group has demonstrated that its
risk appetite levels, its internal capacity and its
prudent decision making have enabled it to
overcome the financial crisis, and enhance its
leadership in retail banking. It will not let up in its
determination to continue developing its
comprehensive risk management system, so as to
maximise its effectiveness and its satisfaction of the
expectations of its stakeholders – shareholders,
investors, customers, regulators, supervisors and
society in general – pursuing a mandate aligned
fully with the corporate values of the CaixaBank
Group: quality, trust and social commitment.
The CaixaBank Group's risk management system
comprises: its governance and organisation
structure; the corporate risk map; the risk appetite
framework (RAF); risk planning and assessment;
the risk culture; and the internal control
framework.
The backdrop in 2016 was extremely demanding
and changeable on multiple fronts, affecting
fundamental aspects of the banking business. In
addition to preparing for future scenarios, much of
the Group's management activity in the year was
taken up with four risk factors: the macroeconomic
backdrop; regulatory changes; the challenges
posed by technological progress; and
shareholders', customers' and society in general's
trust in, and image of, the sector. Even though
these sector risks are common to most of our
European peers - particularly Spanish entities - the
severity and impact of these can vary significantly
between entities.
RISK GOVERNANCE, MANAGEMENT AND CONTROL SYSTEM
The Board of Directors declares that the risk management systems implemented are adequate in relation to the entity's profile and strategy
Corporate Risk Map
Risk Appetite Framework
(RAF)
Governance and
organisation
Risk assessment and
planning
Internal Control
Framework
Risk culture Risk governance,management and
control system
CONTENTS
4.1. Governance and organisation
4.2. Corporate Risk Map
4.3. Risk Appetite Framework (RAF)
4.4. Risk assessment and planning
4.5. Risk Culture
4.6. Internal control framework
Information of Prudential Relevance 2016
10
4.1. Governance and organisation
4.1.1. Corporate governance
The governing bodies are the Annual General
Meeting and the Board of Directors, which have
the powers that, respectively, are assigned to
them under the Law and the Bylaws (Bylaws |
Corporate governance and remuneration policy |
CaixaBank), and, in accordance with these, in
developments of the Regulations of each body.
Consequently, the company is managed and
governed by its Board of Directors: this is the
entity's representative body and, apart from
matters within the remit of the General Meeting,
is the highest decision-making body, equating to
the “management body” referred to in EBA
regulations and guidelines1.
Board of Directors of CaixaBank
Article 31.4 of the Regulations of the Board of
Directors stipulates that CaixaBank Directors
must observe the limitations on membership of
boards of directors laid down in prevailing
regulations on the organisation, supervision and
solvency of credit institutions. The current law
contains certain conditions depending on the
nature of the position and the combination with
other positions held by the director2.
Pursuant to the provisions of article 529.10 of Royal Legislative Decree 1/2010, of 2 July, approving the amended text of the Corporate Enterprises Act, and Articles 5 and 17-20 of the Regulations of the Board of Directors, proposed appointments and re-elections of directors submitted by the Board of Directors to the General Shareholders' Meeting, and resolutions regarding appointments which that body adopts by virtue of the powers of cooption legally attributed to it, must be preceded by the pertinent proposal by the Appointments Committee, in the case of independent directors, and by a report, in the case of the remaining directors. Proposals for the appointment and re-election of directors must be accompanied by a report from the Board of Directors setting out the
1 Notably, Consultation Paper “Draft Guidelines on internal
governance” (EBA/CP/2016/16, published on 28 October) 2 For more information on directorships held by CaixaBank directors in
other companies, see the curriculum vitaes of each member of the Board of Directors on the CaixaBank corporate website - www.caixabank.com/informacioncorporativa/consejoadministracion_es.html – and the statements on positions held in other listed companies and the companies of the significant shareholder or its Group in the 2016 Annual Corporate Governance Report (sections C.1.12 and C.1.17, respectively).
competencies, experience and merits of the candidate.
In addition, when exercising its powers to propose appointments to the General Shareholders’ Meeting and co-opt directors to cover vacancies, the Board shall endeavour to ensure that external directors or non-executive directors represent a majority over executive directors and that the latter should be the minimum necessary.
The Board shall also seek to ensure that the majority group of non-executive directors includes holders of stable significant shareholdings in the company or their representatives, or those shareholders that have been proposed as directors even though their holding is not significant (proprietary directors), and persons of recognised experience who can perform their functions without being influenced by the company or its group, its executive team or significant shareholders (independent directors).
Directors shall be classified using the definitions established in applicable regulations, as set out in article 18 of the Regulations of the Board of Directors.
The Board will also strive to ensure that its external directors include proprietary and independent directors who reflect the existing proportion of the Company’s share capital represented by proprietary directors and the rest of its capital. At least one third of the Company’s directors will be independent directors.
Directors shall remain in their posts for the term of office stipulated in the Bylaws while the General Meeting does not agree their removal and they do not resign from the position, and may be re-elected one or more times for periods of equal length. Nevertheless, independent Directors will not remain as such for a continuous period of more than 12 years.
Directors designated by co-option shall hold their post until the date of the next General Meeting or until the legal deadline for holding the General Meeting that is to decide whether to approve the financial statements for the previous financial year has passed. In the event that the vacancy arises after the General Meeting is called but before it is held, the appointment of the director by co-option to cover the vacancy will take effect until the next General Meeting is held.
Pursuant to article 529.9 of Royal Legislative
Decree 1/2010, of 2 July, and article 15.7 of the
Information of Prudential Relevance 2016
11
Regulations of the Board of Directors, at least once
a year, the Board, as a plenary body, shall:
evaluate the quality and efficiency of the functioning
of the Board; the performance of their duties by the
Chairman of the Board and the chief executive of
the company; and the functioning of the
Committees. The Board shall propose an action
plan to correct any issues detected in this review.
On 19 November 2015, the Board of Directors
approved the CaixaBank, S.A. Director Selection
Policy (hereinafter, the "Policy"). This forms part
of the company's corporate governance system,
governing key commitments and aspects of the
company and its Group in relation to the
selection and appointment of directors.
The Policy sets out the criteria considered by the
CaixaBank Board of Directors in selection
processes for the appointment and re-election of
its members, pursuant to applicable regulations
and best corporate governance practices.
Principles of diversity of knowledge, gender and
experience must be considered in selection
processes for members of the Board of Directors.
Selection processes for directors shall also
respect the principle of non-discrimination and
equal treatment, ensuring that the process for
appointment or re-election of members of the
Board of Directors facilitates the selection of the
least represented gender, avoiding any kind of
discrimination in this regard.
All resolutions under the Policy shall at all times
respect prevailing legislation, and the corporate
governance system and regulations of
CaixaBank, and the good governance principles
and recommendations to which it has signed up.
The members of the Board of Directors must
have the competencies, knowledge and
experience required for the exercise of their
position, considering the needs of the Board of
Directors and its overall composition. In
particular, the overall composition of the Board of
Directors must include the competencies,
knowledge and experience required for the
governance of credit institutions, including the
main risks faced, ensuring the effective capacity
of the Board of Directors to take autonomous and
independent decisions in the interests of the
company.
The General Meeting held on 28 April 2016
agreed to set the number of Board members at
eighteen (18) and to the appointments of Cajasol
Foundation (previously appointed by co-option
on 19 November 2015) and Ms. María Verónica
Fisas Vergés (previously appointed by co-option
on 25 February 2016).
On 30 June 2016, the following people ceased to
be members of the Board of Directors: Mr. Isidro
Fainé Casas, who also submitted his resignation
from his duties as Chairman and whose vacancy
was occupied by Mr. Jordi Gual Solé, who was
also appointed Non-Executive Chairman, Mr. Juan
José López Burniol and Ms. Maria Dolors Llobet
María, whose vacancies were occupied by Mr.
José Serna Masiá and Ms. Koro Usarraga Unsain.
In the context of the changes to the composition
of the Board of Directors which occurred on
30 June 2016, and following the respective
suitability notifications by the European Central
Bank, Mr. Serna Masía accepted his
appointment on 8 July 2016, Ms. Usarraga
Unsain on 4 August 2016 and Mr. Gual Solé on
14 September 2016.
On 27 October, the Caja Navarra Banking
Foundation submitted its resignation from its
duties as director, within the framework of the
amendment to the Integration Agreement
between CaixaBank and Banca Cívica, and the
Shareholders' Agreement.
On 15 December 2016, Ms. Eva Aurín also
submitted her resignation as a member of the
Board of Directors and Mr. Alejandro García-
Bragado Dalmau was appointed as a member of
the Board of Directors, a position he accepted
with effect from 1 January 2017.
The CaixaBank Board of Directors therefore
comprised 18 members (with two vacancies) at
31 December 2016. Pursuant to prevailing
corporate governance legislation, six members
were proprietary directors, eight were
independents and two were executive directors
(with one of these also being considered
a proprietary Director, as he was appointed to
represent the holding of the “la Caixa” Banking
Foundation in CaixaBank).
On 23 February 2017, CaixaBank disclosed that
its Board of Directors had accepted the
resignation of Fundación Cajasol as a member of
the Board of Directors, naming Fundación
CajaCanarias as a director in place thereof,
following a favourable report from the
Remuneration Committee and receipt of
a communication of suitability for performance of
the role of proprietary director from the European
Information of Prudential Relevance 2016
12
Central Bank. It also disclosed that Fundación
CajaCanarias had appointed Natalia Aznárez
Gómez as its natural person representative.
The call notice for CaixaBank's Annual General
Meeting was published on 28 February 2017.
The proposals to be put to the General Meeting
for approval with regard to the composition of the
Board of Directors included:
5. Ratification and Appointment of Directors:
5.1 Ratification and appointment of Jordi Gual Solé.
5.2 Ratification and appointment of José Serna Masiá.
5.3 Ratification and appointment of Koro Usarraga Unsain.
5.4 Ratification and appointment Alejandro García-Bragado Dalmau.
5.5 Ratification and appointment of Fundación Bancaria Canaria Caja General de Ahorros de Canarias – Fundación CajaCanarias.
5.6 Appointment of Ignacio Garralda Ruiz de Velasco.
The Appointments Committee, in compliance
with the provisions of section 7 of the Directors'
Selection Policy, approved by the Board on
19 November 2015, verified compliance with this
Policy in the agreements adopted referring to the
appointments of directors, which are in keeping
with the principles and guidelines contained
therein, and that the percentage of the lesser
represented sex stood at 23.53% on the date of
verifying compliance with the Policy. However,
this will change to 27.78% upon execution of the
already agreed appointments proposal to be
submitted to the next General Shareholders'
Meeting, called for 6 April 2017.
At year end 2016, women comprised 37.5% of
the independent Directors and 16.67% of
proprietary Directors, while
67% of the members of the Appointments
Committee are women, and the Remuneration
Committee is chaired by a woman, who is also
a member of the Risks Committee and the
Executive Committee. Likewise, the Audit and
Control Committee also has a female director.
That is to say, women are represented on all the
Committees.
Therefore, even though the number of women
Directors is not equal, it is deemed to be neither
few nor non-existent.
CaixaBank signed up to the "Diversity Charter" in
2012. This charter is signed voluntarily by
a company or a public institution to promote its
commitment to the principles of equality, its
actions to foster the inclusion of all people in the
workplace and society, the recognition of the
benefits of cultural, demographic and social
diversity within companies, the implementation of
specific policies which encourage a working
environment free from prejudice with regard to
employment, training and the promotion and
adoption of non-discrimination policies.
The biographies of the members of the
Company's Board of Directors are available on
its website:
https://www.caixabank.com/informacioncorporati
va/consejoadministracion_es.html
The profiles of the candidates for approval
proposed to the General Meeting called for 6
April 2017, on first call, are available on the
Company's website, in the Documentation for
Shareholders section of the 2017 Annual
General Meeting:
https://www.caixabank.com/deployedfiles/caixab
ank/Estaticos/PDFs/Informacion_accionistas_inv
ersores/Gobierno_corporativo/Junta_General_Ac
cionistas/2017/Informe_Consejo_nombramientos
v_es.pdf
In line with the above, and respecting the
provisions of the Company's Corporate
Governance Policy, candidates must: (i) be
persons of recognised business and professional
honour; (ii) possess suitable knowledge and
skills to perform the role; and (iii) be in a position
to exercise the good governance of CaixaBank.
The procedure for selecting members of the
Board of Directors set out in the Policy shall be
complemented, as applicable, by the provisions
of the Protocol on procedures for selecting and
assessing the suitability of posts (hereinafter, the
“Protocol”), or any other equivalent internal
regulations prevailing at the time.
The Protocol establishes the Company's units and internal procedures involved in the selection and ongoing assessment of members of the Board of Directors, general managers and other senior executives, the heads of the internal control function and other key posts in CaixaBank, as defined under applicable legislation. Under the “Protocol”, the Board of Directors, in plenary session, assesses the suitability of proposed candidates, based on a report from the Appointments Committee, also
Information of Prudential Relevance 2016
13
considering the limitations on the exercise of directorships set down in prevailing legislation. Sections C.1.11 and C.1.12 of the Company's Annual Corporate Governance Report list all directorships held by Board members in other Group companies and other listed companies. This Report is available on the Company's website.
Also, with regard to the procedure to assess the suitability of candidates prior to their appointment as Director, the Suitability Protocol also establishes procedures to continually evaluate Directors and to assess any unforeseeable circumstances which may affect their suitability for the post.
Once a year, the Board in plenary session evaluates the quality and efficiency of the Board's operation, the diversity in its composition, its powers as a collegiate body, the performance of the Chairman and the Chief Executive Officer and the performance and membership of its committees. However, no individual evaluation is carried out on the contribution of each Director to assess their performance or contribution to the Board or the Company. Individual performance assessments are not considered to be a practice that adds value to the awareness of any possible deficiencies in the functioning of the Board as a collegiate body, except for the cases of the Chairman and Chief Executive Officer who have specific and individualised tasks that are suitable for performance assessment.
Similarly, taking into account the provisions of Recommendation 36, the Board has adopted the decision to seek the assistance of a third party (previously approved by the Appointments Committee) to carry out its assessment for 2017.
Directors shall be removed from office when the period for which they were appointed has elapsed, when so decided by the General Meeting in use of the attributes granted thereto, legally or in the Bylaws, and when they resign.
In the event of the conditions described in section C.1.21 of the 2016 Corporate Governance Report arising, directors must place their position at the disposal of the Board of Directors and formalise the pertinent resignation, if the latter deems this appropriate.
When a director leaves office prior to the end of
his term, he must explain the reasons in a letter
which he shall send to all members of the Board
of Directors.
From September 2014, and pursuant to
Law 10/2014 on the organisation, supervision and
solvency of credit institutions, the CaixaBank
Board of Directors resolved to: change the
Appointments and Remuneration Committee into
an Appointments Committee; create a
Remuneration Committee and a Risks Committee;
and amend the Regulations of the Board of
Directors accordingly to incorporate the provisions
of the new Law and establish the duties of the
new Board Committees. These changes resulted
in the Entity having five Board Committees,
namely: the Appointments Committee, the
Remuneration Committee, the Risks Committee,
the Audit and Control Committee and the
Executive Committee. The Committees met a
number of times in 2016. The Appointments
Committee met 25 times; the Remuneration
Committee, 8 times; the Audit and Control
Committee, 13 times; the Executive Committee,
22 times; and the Risks Committee, 14 times.
Executive Committee
The Executive Committee has been delegated all
of the responsibilities and powers available to it
both legally and under the Company’s Bylaws.
For internal purposes, the Executive Committee
is subject to the limitations set forth under article
4 of the Regulation of the Board of Directors
(Regulations of the Board of Directors | Corporate
Governance and remuneration policy |
CaixaBank)
Risk Committee
The Risk Committee comprises exclusively non-executive Directors who possess the appropriate knowledge, skills and experience to fully understand and manage the risk strategy and risk propensity. At least a third of its members are independent Directors.
The main functions of this committee are to1:
Advise the Board of Directors on the Bank’s overall current and future susceptibility to risk, and its strategy in this area, reporting on the Risk Appetite Framework.
Propose the Group’s risk policy to the Board, including the different types of risk to which the Entity is exposed, the information and internal controls systems use to control and manage these risks and the measures in place to mitigate the impact of identified
1 The functions of each of the Committees with the greatest relevance
to risk management have been chosen.
Information of Prudential Relevance 2016
14
risks should these materialise.
Determine with the Board of Directors, the nature, quantity, format and frequency of the information concerning risks that the Board of Directors should receive and establish what the Committee should receive.
Regularly review exposures with its main customers and business sectors, as well as broken down by geographic area and type of risk.
Examine the information and control processes for the Group’s risk, as well as the information systems and indicators.
Evaluate regulatory compliance risk in its scope of action and decision making, carrying out monitoring and examining possible deficiencies in the principles of professional conduct.
Report on new products and services or significant changes to existing ones.
Appointments Committee
The Appointments Committee comprises Directors who do not perform executive functions. A third of its members must be independent. The Chairman of the Committee is appointed from among these.
The Chairman's core responsibilities are to:
Report and propose to the Board of Directors its assessment of the skills, knowledge and experience necessary for the members of the Board of Directors and for the key personnel of the Company;
Propose to the Board of Directors the nomination of the independent Directors to be appointed by co-option or for submission to the decision of the General Meeting, as well as the proposals for the reappointment or removal of such Directors by the General Meeting;
Report proposed appointments of the remaining Directors for them to be designated by co-option or subject to the decision of the General Meeting of Shareholders, as well as on proposals for their re-election or removal by the General Shareholders' Meeting;
Report on proposals for appointment or removal of senior executives, being able to effect such proposals directly in the case of senior managers which due to their roles of either control or support of the Board or its Committees, it is considered by the Committee that it should take the initiative; Propose, if deemed appropriate, basic conditions in senior executives' contracts, outside the remuneration aspects and
reporting on them when they have been established;
Report to the Board on gender diversity issues and establish a representation target for the less represented sex on the Board of Directors as well as preparing guidelines for how this should be achieved;
Evaluate periodically, and at least once a year, the structure, size, composition and actions of the Board and its Committees, its Chairperson, CEO and Secretary, making recommendations regarding possible changes to these; Evaluate the composition of the Steering Committee as well as its replacement tables for adequate provision for transitions;
Supervise the activities of the organisation in relation to corporate social responsibility issues and submit to the Board those proposals it deems appropriate in this matter.
Remuneration Committee
The composition of this Committee is subject to the same rules as the Appointments Committee. Its main functions include:
To propose to the Board of Directors the remuneration policy for Directors and senior executives, the system and amount of the annual remuneration of Directors and senior executives, the individual remuneration of executive Directors, General Managers and persons carrying out senior management functions, especially those of an economic nature, without prejudice to the duties of the Appointments Committee relative to any conditions proposed by the latter and unrelated to remuneration;
To ensure that the remuneration policy for Directors and senior employees as well as the conditions set forth in the contracts entered into with them are abided by;
To report on the Company's general remuneration policy and especially on policies relative to categories of employees whose professional activities significantly affect the Company's risk profile as well as on policies intended to avoid or manage conflicts of interest with the Company's customers;
To analyse, formulate and periodically review the remuneration programmes, deliberating on their adequacy and performance and ensuring that they are carried out;
To propose that the Board approve the remuneration policies and reports that the Board must submit to the Annual General
Information of Prudential Relevance 2016
15
Meeting, and to report to the Board on any remuneration-related proposals that the Board is going to make to the Annual General Meeting;
To consider the suggestions that it receives from the Company's Chairman, Board members, executives and shareholders.
Audit and Control Committee
The Audit and Control Committee is formed exclusively of non-executive Directors, most of whom are independent. One of these is appointed as the Chairman thereof on the basis of their knowledge and experience of accounting or auditing, or both. Considered as a whole, the members of the Audit and Control Committee shall have the required technical knowledge for the entity's activity. The main duties of the Committee are:
Providing information on issues within the scope of its duties to the General Meeting.
Overseeing the effectiveness of the Company’s internal control environment, internal audit and risk management systems, and discussing with the auditors any significant weaknesses in the internal control system identified during the course of an audit;
Overseeing the process for preparing and submitting regulated financial reporting;
Making proposals to the Board of Directors for submission to the Annual General Meeting concerning the appointment of auditors, in accordance with regulations applicable to the Company;
Establishing appropriate relationships with auditors in order to receive information, for examination by the Audit and Control Committee, on matters which may jeopardise their independence and any other matters relating to the audit process and any other communications provided for in audit legislation and technical audit regulations;
Receiving annual written confirmation from the auditors of their independence vis-à-vis the Company or entities related to it directly or indirectly, in addition to information on additional services of any kind rendered for these entities by the aforementioned auditors or by persons or entities related to them, as stipulated in auditing legislation.
4.1.2. Organisational structure
General Risks Division
As part of the executive team, the Chief Risks
Officer (CRO) is ultimately responsible for the
Group’s risks. The CRO operates independently
of the business areas from both a reporting and
operational perspective. The CRO has direct
access to the Group’s governing bodies,
especially the Risks Committee, reporting
regularly to the members thereof on the status of
and expected changes to the Entity’s risk profile.
The CRO has organised his team as follows:
Personal Loan Analysis and Approval
division, responsible for analysing and
granting loans to retail customers;
Business Loan Analysis and Approval
division, responsible for analysis and
approval of risk for other business segments
and specialised sectors (Companies and
SMEs, Corporate, Public Sector, Sovereign,
Financial Entities, Real Estate, Project
Finance, Tourism and Food & Agriculture);
Permanent Lending Committee, with powers
delegated by the Board to approve
transactions;
Global Risk Management Committee,
responsible for risk management and
overseeing asset performance, and solvency
and capital adequacy mechanisms;
Foreclosed Assets Division;
Internal Risks Control Division, including
control units and units tasked with the
Validation of Risk models;
The Risks Division’s functions include identifying, measuring and integrating the different risk exposures and risk-adjusted returns of each area of business, from the global perspective of the CaixaBank Group and in accordance with its management strategy;
Furthermore, one of its most significant tasks, in collaboration with the Bank's other areas, is to lead implementation in the entire branch network of instruments for the end-to-end management of risks under Basel guidelines, in order to assure a balance between the risks assumed and expected returns.
Deputy General Manager - Control & Compliance
The Deputy General Manager of Control & Compliance was appointed in December 2015, reporting directly to the CEO. In 2016, the Internal Control Units forming part of the General Risks Division and Financial Accounting, Control and Capital were strengthened, thereby
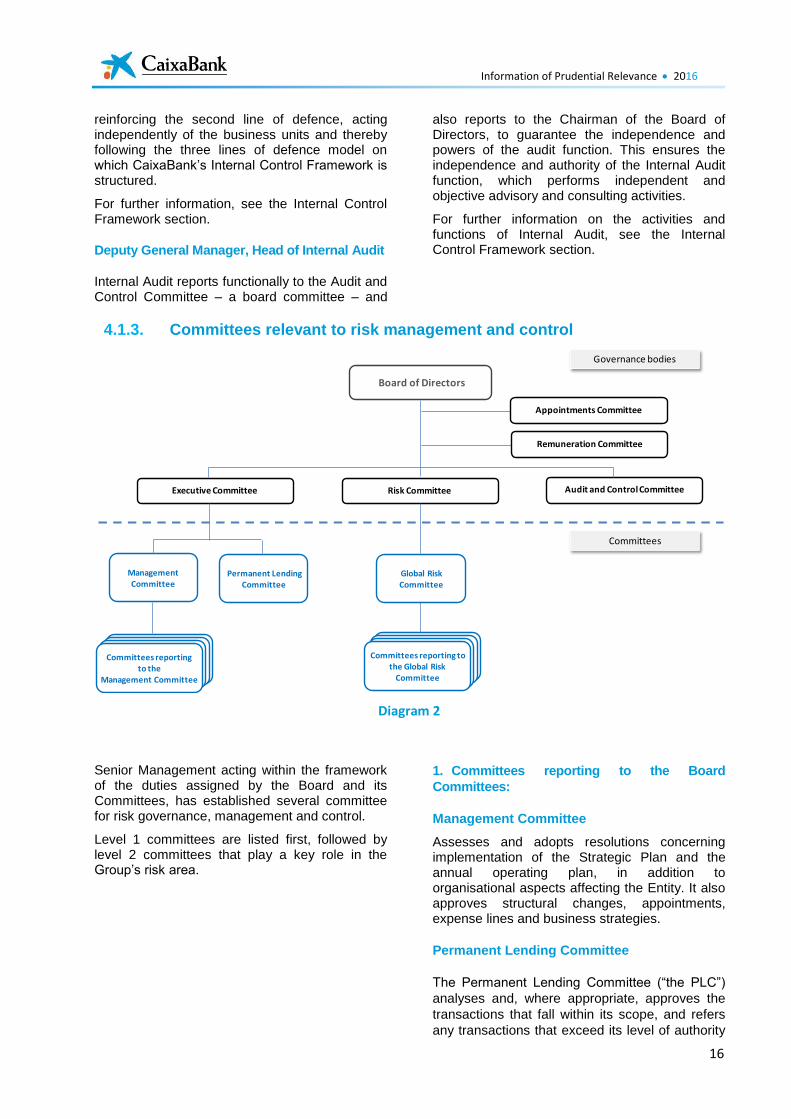
Information of Prudential Relevance 2016
16
reinforcing the second line of defence, acting independently of the business units and thereby following the three lines of defence model on which CaixaBank’s Internal Control Framework is structured.
For further information, see the Internal Control Framework section.
Deputy General Manager, Head of Internal Audit
Internal Audit reports functionally to the Audit and Control Committee – a board committee – and
also reports to the Chairman of the Board of Directors, to guarantee the independence and powers of the audit function. This ensures the independence and authority of the Internal Audit function, which performs independent and objective advisory and consulting activities.
For further information on the activities and functions of Internal Audit, see the Internal Control Framework section.
4.1.3. Committees relevant to risk management and control
Diagram 2
Senior Management acting within the framework of the duties assigned by the Board and its Committees, has established several committee for risk governance, management and control.
Level 1 committees are listed first, followed by level 2 committees that play a key role in the Group’s risk area.
1. Committees reporting to the Board
Committees:
Management Committee
Assesses and adopts resolutions concerning implementation of the Strategic Plan and the annual operating plan, in addition to organisational aspects affecting the Entity. It also approves structural changes, appointments, expense lines and business strategies.
Permanent Lending Committee
The Permanent Lending Committee (“the PLC”)
analyses and, where appropriate, approves the
transactions that fall within its scope, and refers
any transactions that exceed its level of authority
Board of Directors
Risk Committee
Committees reportingto the
Management Committee
Appointments Committee
Remuneration Committee
Executive Committee Audit and Control Committee
Committees reporting tothe Global Risk
Committee
ManagementCommittee
Permanent LendingCommittee
Global RiskCommittee
Governance bodies
Committees
Information of Prudential Relevance 2016
17
to the Board of Directors. It is the final level in the
approvals hierarchy, above which lending and
credit must be signed off by the Board of
Directors.
The PLC can also approve individual transactions
that do not fulfil all established criteria for each
type of product or applicable specific policy,
provided there is no cause for obtaining the
approval of the Board of Directors.
Global Risk Committee
This committee is responsible for the end-to-end
management, control and monitoring of risks to
which the Bank is exposed, as well as the
specific risks of the most relevant financial
investees, and the implications of these risks
when managing solvency and capital
consumption.
This Committee is also charged with adapting
CaixaBank's risk strategy to the risk appetite
framework (RAF) established by the Board,
clarifying and resolving doubts about its
interpretation and keeping CaixaBank's Board
informed through the Risk Committee of the main
areas of activity and the status of risks.
The committee also regularly analyses the
Group's global risk position and puts in place the
main measures to optimise risk management
within the framework of its strategic objectives.
2. Committees reporting to the Management
Committee
These include:
ALCO
The ALCO (Asset and Liability Committee) is
responsible for management, monitoring and
control of liquidity, interest rate and foreign currency
risk in the banking book. It is responsible for
optimising and ensuring the profitability of the
financial structure of the CaixaBank Group's
balance sheet and its profitability. This includes the
net interest income and non-recurring revenues in
trading income, determining internal transfer rates,
monitoring prices, maturities and volumes of
activities that generate assets and liabilities, under
the policies, risk appetite framework and risk limits
approved by the Board of Directors.
Transparency Committee
The Transparency Committee determines all transparency-related aspects of the design and
marketing of financial instruments, banking products and investment and savings insurance plans.
It is tasked with ensuring the transparent marketing of the Bank's products by defining and approving policies covering marketing, the prevention of conflicts of interest, the safeguarding of customer assets and enhanced execution of transactions. It also validates the classification of new financial instruments, banking products and savings and investment plans on the basis of their risk and complexity, in accordance with the provisions of MIFID and banking and insurance transparency regulations.
Regulation Committee
The Regulation Committee is an offshoot of the Management Committee. It is responsible for monitoring the regulatory environment as it affects or might affect the CaixaBank Group. It establishes strategic positions in relation to the different regulatory proposals and preliminary regulatory proposals and their potential impact on the Group. It also sets the key strategic lines for communicating these positions to stakeholders, including managing the representation of the Group's interests. Its ultimate purpose is to stay one step ahead of regulatory changes and facilitate the Group's adaptation to new and increasingly demanding regulatory requirements.
Planning Committee
The Planning Committee was created in June 2015 and is tasked with coordinating, monitoring and integrating the planning processes (targets, Operating Plan, ICAAP, Funding Plan, coordination with subsidiaries, etc). Its functions include: conveying the planning culture to all areas involved; establishing a common language for planning; approving and seeking consensus in both the intermediate and final stages of the process; raising proposals to the Management Committee; monitoring compliance with the plan during the year; and ensuring defined milestones are met.
Information and Data Quality Governance Committee (IDQGC)
The Information and Data Quality Governance Committee is in charge of overseeing the coherence, consistency and quality of the information reported to the regulator and to the Group's management, providing a transversal view at all times.
Among its main functions, the Committee defines
the data management strategy, promoting the
Information of Prudential Relevance 2016
18
value of information and data as a corporate
asset, and critical and differentiating factor;
promotes the definition of the policy regulating
the information and data quality governance
framework; and approves data quality targets
(criticality, indicators, tolerance thresholds, quality
plans), monitoring these and reporting to the
various governing bodies.
This Committee also reviews and approves
changes to critical reports (management and
regulatory), data or data structures affecting
various levels, and addresses any discrepancies.
Finally, it reports to the Management Committee
on the overall progress of the information and
data quality governance plan, the level of data
quality, and the level of compliance with
regulatory information and data requirements.
Data Protection Committee
This is a permanent committee with powers to
discuss, and work and decide on all aspects
relating to personal data protection involving
CaixaBank and its group companies. The
purpose of the Committee is to monitor the
application of data protection legislation in force
at all times, resolve any incidents that are
identified and lead the implementation of new
regulations and criteria in this area.
The Committee reports to the Management
Committee, which is responsible for informing the
Board of Directors of any aspects it considers to be
particularly important or that could seriously impact
CaixaBank's reputation or corporate interests.
Restructuring and Resolution Plans Committee
Another committee not reporting to the Risks
Division is the Restructuring and Resolution
Plans Committee (RRPC), which oversees all
issues related to recovery and resolution plans.
When drawing up the Recovery Plan, the RRPC
determines the Plan's scope and the areas
involved. It recommends that the Plan be
updated at least once a year in line with
prevailing legislation. It also directs the project
and supervises and controls the preparation
process which falls to the Project Office.
As part of the Recovery Plan approval process,
the RRPC validates the information proposed by
the Project Office, and submits it to the
Management Committee.
The RRPC reviews the quarterly recovery-
indicator report prepared by the Project Office,
and may submit a proposal to activate or
terminate the recovery plan, based on the
contents thereof.
The RRPC also coordinates all information
requests sent by both Spanish and European
resolution authorities such as the Bank of Spain,
FROB or the Single Resolution Board.
3. Committees reporting to the Global Risk Committee
The following committees are particularly important in risk management and control:
Risk Policies Committee
This committee approves the Group's credit and market risk policies. Policies are any of the guidelines governing the Bank's activities and any procedures through which they are implemented.
The Risk Policies Committee's remit is to establish policies that are in line with and underpin the CaixaBank Group's Risk Appetite Framework. Its powers, as conferred upon it by the Global Risk Committee, include defining and authorising policies for approving loans and monitoring risks, along with default and recovery policies.
The Risk Policies Committee, together with the New Products Committee, which must ensure that the risk and operational components of new products are adapted to and aligned with the framework established by Management, also analyses and approves loan and credit products.
Operational Risk Committee
The Operational Risk Committee is responsible for approving, communicating and monitoring policies, criteria and procedures for the management of Operational Risk in the CaixaBank Group.
The Committee regularly reviews the Operational Risk Management Framework and identifies critical points, analysing and reviewing procedures for the control and mitigation of operational risk.
Information of Prudential Relevance 2016
19
Models and Parameter Committee
The Models and Parameters Committee is responsible for reviewing and formally approving models and parameters for credit risk, market risk (including credit and counterparty risk in Treasury activity and operational risk), and any other methodologies used by the committee in performance of its control duties.
Among other functions, the Committee ensures compliance with prevailing regulations, monitoring how models are implemented and used.
Impairment Committee
This committee is responsible for adjusting ratings and accounting provisions of loans linked to borrowers assessed individually according to objective impairment criteria, and for adjusting the criteria for estimating provisions for assets whose impairment is determined collectively, and in general to perform any necessary adjustments to the provisioning structure that has a significant impact on the impairment provisions for the lending portfolio.
Default and Recovery Committee
This committee analyses default targets set by
Senior Management and applies them to the
managed portfolios and parties involved in
lending. It oversees and monitors the level of
compliance with the targets set, and liaises with
the various areas to take the steps needed to
redress any deviations.
It defines and monitors recovery policies and
procedures, which are presented to the Policies
Committee for approval before roll-out. It reports
to the Global Risk Committee on matters within
its remit.
Real Estate Acquisition and Appraisal
Committee (REAAC)
This committee analyses and approves, where
appropriate, any acquisitions of real estate assets
proposed by Regional General Divisions in lieu of
payment of real estate developer loans, taking
into account the legal aspects of each
arrangement, appraisal values and expected
recoveries.
It also signs off acquisitions of real estate from
insolvent companies, exceptionally when this is
the best option for recovering loans.
Internal Control Committee
The Internal Control Committee was created in
2016 to provide reasonable assurance to
management and governing bodies that risk
control policies and procedures are in place in the
organisation, and that they are designed correctly
and applied effectively, evaluating the risk control
environment in the CaixaBank Group.
Corporate Responsibility and Reputation
Committee (CRRC)
The CRRC is responsible for proposing general
policies for reputation management, monitoring
corporate social responsibility strategies and
practices, and managing, controlling and
monitoring the reputational risk affecting the
CaixaBank Group.
4.2. Corporate Risk Map
Developments in the financial system and the
transformation of the Regulatory Framework
indicate the growing importance of assessing risk
and the control environment of entities.
The CaixaBank Group has put in place
a “Corporate Risk Map” to identify, measure,
monitor, control and report on risks.
CaixaBank’s Corporate Risk Map includes
a Corporate Risk Catalogue that was updated in
2016. This helps with internal and external
monitoring and reporting of the Group’s risks,
grouped into three main categories: Business
Model Risks, Specific risks for the Bank’s
financial activity, and Operational and
Reputational Risk.
The main risks reported periodically to
CaixaBank’s management and governing bodies
are:
Business model risk
Eligible Own Funds/Solvency: Risk caused
by a restriction of the CaixaBank Group’s
ability to adapt its level of capital to
regulatory requirements or to a change in its
risk profile.
Liquidity and Funding: Risk of insufficient
liquid assets or limited access to market
financing to meet contractual maturities of
Information of Prudential Relevance 2016
20
liabilities, regulatory requirements, or the
investment needs of the Group.
Risks affecting financial activity
Credit risk: Risk of a decrease in the value
of the CaixaBank Group’s assets due to
uncertainty in a counterparty’s ability to meet
its obligations.
Market risk: Risk of a decrease in the value
of the Group’s assets held for trading or an
increase in the value of its liabilities held-for-
trading and in the held-to-maturity portfolio,
due to fluctuations in interest rates, credit
spreads, external factors or prices in the
market where the assets and liabilities are
traded.
Interest rate risk in the banking book: Risk
of a negative impact on the economic value
of the balance sheet or results, caused by
the renewal of assets and liabilities at rates
different to those previously established,
arising from changes in the structure of the
interest rate curve.
Actuarial risk: Risk of an increase in the value
of commitments assumed through insurance
contracts with customers (insurance business)
and employee pension plans (pension
obligations), due to differences between claims
estimates and actual performance.
Operational and reputational risk
Legal/Regulatory: Risk of losses due to errors in the interpretation or application of existing legislation and regulations or adverse judicial rulings. This also includes the risk of legislative or regulatory changes adversely impacting economic value.
Conduct and Compliance: Risk of
CaixaBank applying criteria for action contrary to the interests of its clients and stakeholders and deficient procedures resulting in actions or omissions that are not compliant with the legal or regulatory framework, or with internal codes and rules, and which could result in administrative sanctions or reputational damage.
Technological: Losses due to hardware or
software inadequacies or failures in the technical infrastructures that could compromise the availability, integrity,
accessibility and security of infrastructures and data.
Operating processes and external events:
Risk of loss or damage caused by operational errors in processes related to the Bank’s activity, due to external events beyond the Bank’s control, or due to third parties outside the Bank, both accidentally and fraudulently.
Reliability of financial reporting:
Deficiencies in the accuracy, integrity and criteria of the process used when preparing the data necessary to evaluate the financial and equity situation of the CaixaBank Group.
Reputational risk: Risk associated with
reduced competitiveness due to the loss of trust in CaixaBank by some of its stakeholders, based on their assessment of actions or omissions, real or purported, by CaixaBank, its Senior Management or Governing Bodies.
In order to restore the confidence of its
customers in the Group, CaixaBank has focused
on solvency and quality as strategic priorities.
Moreover, CaixaBank has spent the last few
years strengthening its control and regulatory
structures to minimise the probability of
occurrence of actions or omissions such as those
recently seen in certain global financial
corporations, which have had an increasing
media impact and affected the sector’s image.
4.3. Risk Appetite Framework (RAF)
Regulators and other advisory bodies in the
financial sector are increasingly advising on the
need to define and implement a Risk Appetite
Framework that backs up the decision-making
process and informed approval of risks.
In particular we would note the guiding principles
published by the Financial Stability Board
(November 2013), which considers these a
standard prerequisite for good governance, and
adequate management and oversight of financial
groups. The European Banking Authority and the
Bank of Spain adhere to these
recommendations, which are not yet mandatory.
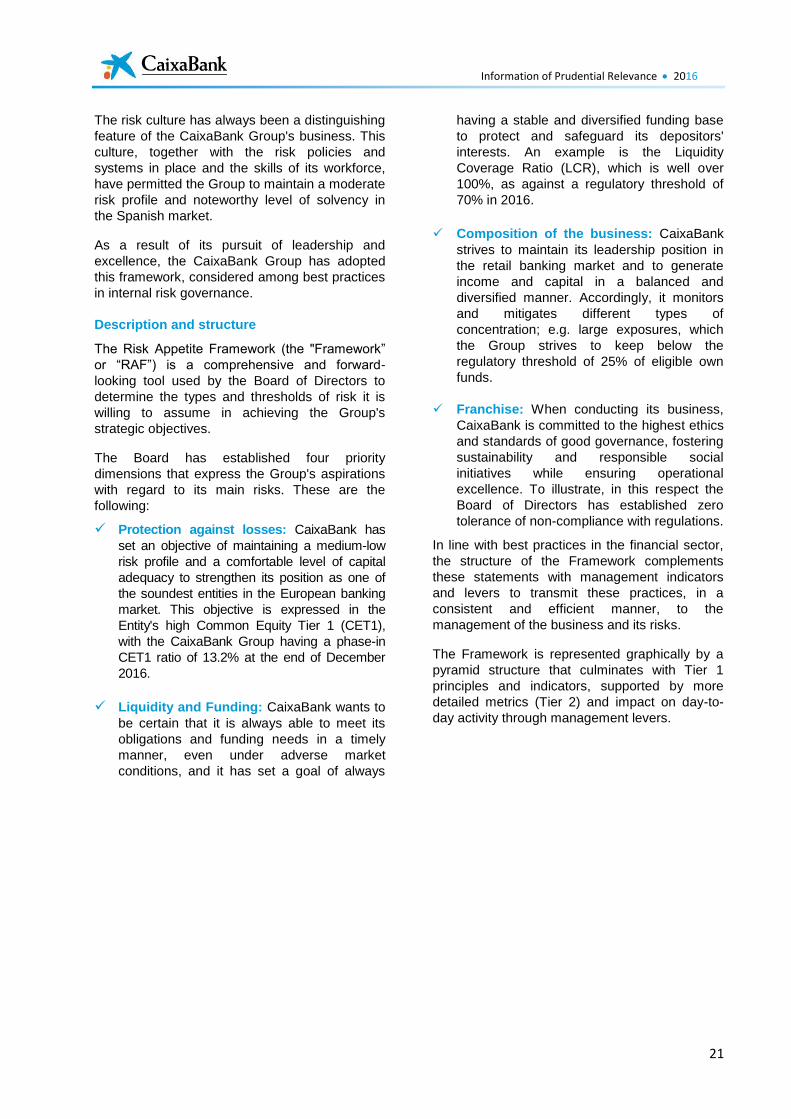
Information of Prudential Relevance 2016
21
The risk culture has always been a distinguishing
feature of the CaixaBank Group's business. This
culture, together with the risk policies and
systems in place and the skills of its workforce,
have permitted the Group to maintain a moderate
risk profile and noteworthy level of solvency in
the Spanish market.
As a result of its pursuit of leadership and
excellence, the CaixaBank Group has adopted
this framework, considered among best practices
in internal risk governance.
Description and structure
The Risk Appetite Framework (the "Framework”
or “RAF”) is a comprehensive and forward-
looking tool used by the Board of Directors to
determine the types and thresholds of risk it is
willing to assume in achieving the Group's
strategic objectives.
The Board has established four priority
dimensions that express the Group's aspirations
with regard to its main risks. These are the
following:
Protection against losses: CaixaBank has
set an objective of maintaining a medium-low
risk profile and a comfortable level of capital
adequacy to strengthen its position as one of
the soundest entities in the European banking
market. This objective is expressed in the
Entity's high Common Equity Tier 1 (CET1),
with the CaixaBank Group having a phase-in
CET1 ratio of 13.2% at the end of December
2016.
Liquidity and Funding: CaixaBank wants to
be certain that it is always able to meet its
obligations and funding needs in a timely
manner, even under adverse market
conditions, and it has set a goal of always
having a stable and diversified funding base
to protect and safeguard its depositors'
interests. An example is the Liquidity
Coverage Ratio (LCR), which is well over
100%, as against a regulatory threshold of
70% in 2016.
Composition of the business: CaixaBank
strives to maintain its leadership position in
the retail banking market and to generate
income and capital in a balanced and
diversified manner. Accordingly, it monitors
and mitigates different types of
concentration; e.g. large exposures, which
the Group strives to keep below the
regulatory threshold of 25% of eligible own
funds.
Franchise: When conducting its business,
CaixaBank is committed to the highest ethics
and standards of good governance, fostering
sustainability and responsible social
initiatives while ensuring operational
excellence. To illustrate, in this respect the
Board of Directors has established zero
tolerance of non-compliance with regulations.
In line with best practices in the financial sector,
the structure of the Framework complements
these statements with management indicators
and levers to transmit these practices, in a
consistent and efficient manner, to the
management of the business and its risks.
The Framework is represented graphically by a
pyramid structure that culminates with Tier 1
principles and indicators, supported by more
detailed metrics (Tier 2) and impact on day-to-
day activity through management levers.
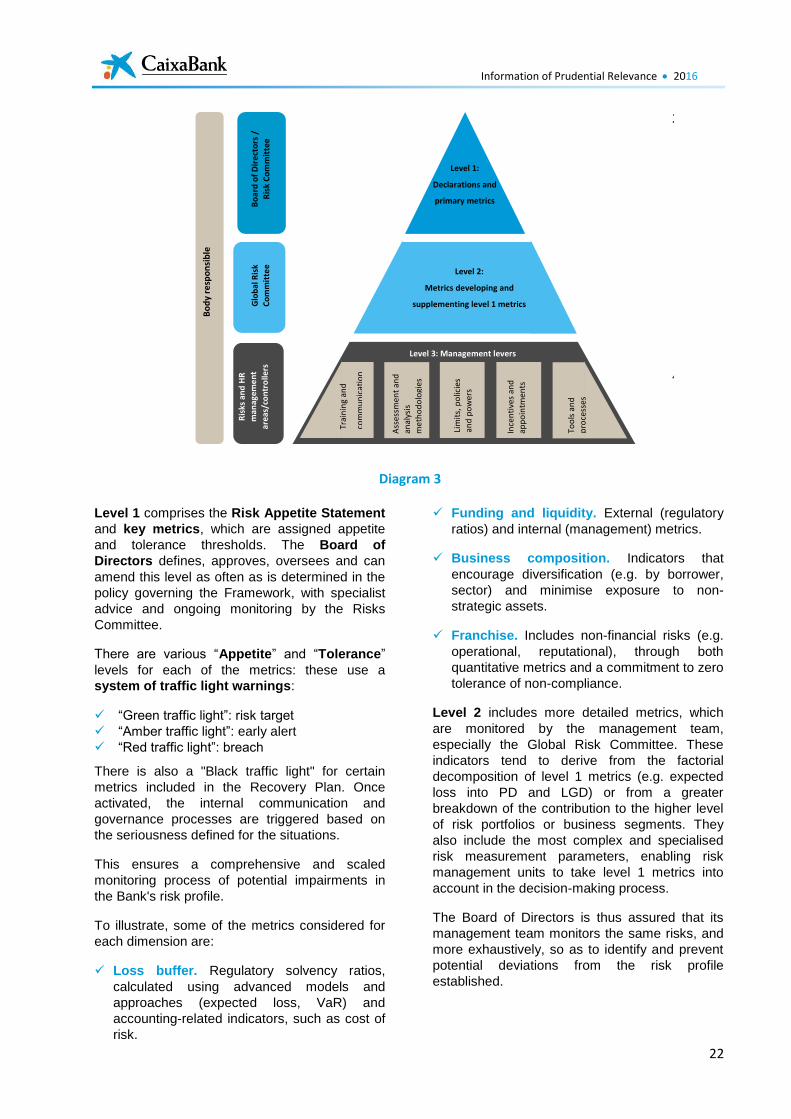
Information of Prudential Relevance 2016
22
Diagram 3
Level 1 comprises the Risk Appetite Statement
and key metrics, which are assigned appetite
and tolerance thresholds. The Board of
Directors defines, approves, oversees and can
amend this level as often as is determined in the
policy governing the Framework, with specialist
advice and ongoing monitoring by the Risks
Committee.
There are various “Appetite” and “Tolerance”
levels for each of the metrics: these use a
system of traffic light warnings:
“Green traffic light”: risk target
“Amber traffic light”: early alert
“Red traffic light”: breach
There is also a "Black traffic light" for certain
metrics included in the Recovery Plan. Once
activated, the internal communication and
governance processes are triggered based on
the seriousness defined for the situations.
This ensures a comprehensive and scaled
monitoring process of potential impairments in
the Bank's risk profile.
To illustrate, some of the metrics considered for
each dimension are:
Loss buffer. Regulatory solvency ratios,
calculated using advanced models and
approaches (expected loss, VaR) and
accounting-related indicators, such as cost of
risk.
Funding and liquidity. External (regulatory
ratios) and internal (management) metrics.
Business composition. Indicators that
encourage diversification (e.g. by borrower,
sector) and minimise exposure to non-
strategic assets.
Franchise. Includes non-financial risks (e.g.
operational, reputational), through both
quantitative metrics and a commitment to zero
tolerance of non-compliance.
Level 2 includes more detailed metrics, which
are monitored by the management team,
especially the Global Risk Committee. These
indicators tend to derive from the factorial
decomposition of level 1 metrics (e.g. expected
loss into PD and LGD) or from a greater
breakdown of the contribution to the higher level
of risk portfolios or business segments. They
also include the most complex and specialised
risk measurement parameters, enabling risk
management units to take level 1 metrics into
account in the decision-making process.
The Board of Directors is thus assured that its
management team monitors the same risks, and
more exhaustively, so as to identify and prevent
potential deviations from the risk profile
established.
1. 2.
3. 4.
Level 1:
Declarations and
primary metrics
Level 2:
Metrics developing and
supplementing level 1 metrics
Level 3: Management levers Tr
ain
ing
and
com
mu
nic
atio
n
Ass
essm
ent
and
anal
ysis
met
ho
do
logi
es
Lim
its,
po
licie
s
and
po
wer
s
Ince
nti
ves
and
app
oin
tmen
ts
Too
ls a
nd
pro
cess
es
Ris
ks a
nd
HR
man
agem
en
t
area
s/co
ntr
olle
rs
Glo
bal
Ris
k
Co
mm
itte
e
Bo
dy
resp
on
sib
le
Bo
ard
of
Dir
ect
ors
/
Ris
k C
om
mit
tee
Information of Prudential Relevance 2016
23
Finally, level 3 represents the management
mechanisms that the management team -
through the business units and areas responsible
for the intake, monitoring and control of each risk
- defines and implements to bring execution into
line with the established Framework. These
mechanisms include:
Training and communication: key factors
that enable all employees involved in the
Group’s decision-making process to be aware
of and take on board their contribution to the
Strategic Plan and maintaining the Board’s
risk appetite. Both training and
communication are fundamental to
establishing and fostering a clear and
effective risk culture, particularly against the
changing and uncertain backdrop we are
facing in the financial sector.
Risk assessment and analysis
methodologies: to provide the Board of
Directors with a precise, clear and coherent
vision of exposure to each risk. To a
considerable extent, the role of the RAF is to
select and propose the most suitable
methodologies for each case to governing
bodies, combining accounting, regulatory,
economic, potential loss and stress
perspectives, as necessary.
Limits, policies and powers in the approval
of new risk positions: these three
components transmit at organisation, process
and exposure level what can be done, in
alignment with the Risk Appetite Framework
and other pillars of the risk management
framework.
Incentives and appointments: the HR
processes considered to have the greatest
short-term impact on the behaviour of the
management team and employees in the
broadest sense. The bonus scheme for
members of the Management Committee and
Identified Staff considers the degree of
compliance with the RAF, with a 15%
weighting.
Tools and processes: the framework uses
technology infrastructure, execution and
control systems and existing internal reporting
processes within the Entity (e.g. to implement
the risk concentration limit for loan approvals).
A number of ad hoc mechanisms have also
been put in place to ensure adequate
management and compliance with the
Framework.
Monitoring and governance of the Risk
Appetite Framework in the CaixaBank Group
The Board of Directors defines and supervises
the Group’s risk profile, updating the framework’s
metrics and thresholds where necessary, and at
least annually.
The development of the Framework in 2016
continued to prove useful for the Board of
Directors and the Risks Committee as a single
comprehensive platform from which to direct the
Group’s strategy, management and control. In
the annual review conducted during the year,
new metrics were added and thresholds were
modified to take account of new regulatory
requirements and the Entity's strategic
developments.
Throughout this process, the Risks Committee is
responsible for helping the Board of Directors in
its tasks and reviewing the development of Tier 1
metrics more frequently and in greater depth,
and for compliance with the action plans to re-
direct underlying risks to the appetite zone as
rapidly as possible.
The following basic reporting structure has been
defined to ensure the Framework is compliant
and that transparency is in line with best
international practices:
Monthly presentation by the Corporate Global
Risk Management Division to the Global Risk
Committee, indicating the past and future trends
of Tier 1 and Tier 2 metrics, according to the
Strategic Plan/projection made as part of the
ICAAP exercise. If actual risk levels breach the
threshold for:
Appetite: an amber traffic light or early alert
is assigned to the indicator, and the party
responsible or the Management Committee is
entrusted by the Global Risk Committee with
preparing an action plan to return to the
"green" zone, and a timeline is drawn up. The
status of the action plan must be reported to
the Board Risks Committee as part of its
recurring reporting.
Tolerance: a "red traffic light" is assigned,
including an explanation as to why the previous
action plan did not work (if there was one).
Corrective or mitigating measures are proposed
to reduce exposure. This must be approved by
the Risks Committee. The Board must receive
information with the content and frequency
established by the Board Risks Committee.
Information of Prudential Relevance 2016
24
Recovery Plan: this would trigger the Plan's
governance process, which entails a set of
measures to:
1. Reduce the possibility of the Entity
going bankrupt or entering into a
resolution process.
2. Minimise the impact in the event of
bankruptcy, and avoid the need for a bail
out.
In the latter case, the regulator must be
informed of serious breaches and the action
plans expected to be adopted.
Quarterly presentation to the Risks Committee
on the situation, action plans and forecasts for
Tier 1 metrics.
Half-yearly presentation to the Board of Directors
on the situation, action plans and forecasts for
Tier 1 metrics.
During these sessions, the Board may decide to
amend or update the metrics and previously
assigned thresholds.
If a risk breaches a tolerance threshold,
threatening the Group's ability to continue as a
going concern, the Board may initiate the
measures set forth in the Recovery Plan.
Integration into planning processes and
stress testing
Since approval in November 2014, the Framework
has developed into a fundamental pillar of internal
planning processes and simulations of potential
stress scenarios. An overarching view of the RAF in
different scenarios was provided to the Board
through the ICAAP, the ILAAP and the 2016 EBA
stress test, to be able to take the right decisions on
amending or signing off the forecasts prepared by
the individuals responsible for these processes.
4.4. Risk assessment and planning
As a complement and reinforcement that feeds
back into both the Corporate Risk Map and the
Risk Appetite Framework, the CaixaBank Group
has put in place institutional processes and
mechanisms to evaluate both the evolution of the
risk profile (recent, future and hypothetical in
stress scenarios), and to evaluate its own ability
to ensure appropriate governance, management
and control.
Risk Assessment
Annual procedure in which the Entity seeks to:
Identify, assess, classify and internally
report significant changes in inherent
risks assumed by the Entity in its
environment and business model, due to
changes in the level of risk (evolving) or
to the appearance of other risks that
could potentially become significant
(emerging)1, and
Make a self-assessment of its risk
management, control and governance
capacity, as a tool to help detect best
practices and weaknesses in relation to
risks. All with the aim of maximising
internal transparency and the risk
culture, and to prioritise efforts and
investments with a larger potential
impact on the Group’s residual risk
profile.
The scope and depth of this process, which originated in the context of the Internal Capital Adequacy Assessment (ICAAP) report, has been evolving in line with the self-defined goal of continuous improvement, and through the inclusion of the guidelines and recommendations published by European regulatory and supervisory bodies in recent years. These include the EBA consultation document on Draft Guidelines on internal governance and the EBA's Final Guidelines for consistent ICAAP assessments by supervision teams.
This is currently performed on a stand-alone basis using quantitative information, benchmarks and qualitative input provided by the internal representatives of stakeholders (for example, the Investor Relations department), in the areas involved in risk management and control areas. This exercise is presented to the entity's governing bodies for review and approval, with the Board of Directors having the ultimate responsibility for approval, within the framework of the ICAAP report.
Risk planning
The Entity plans the expected performance of the
different factors and ratios that define the future
risk profile, as part of the four-year Strategic Plan
(the current plan is for 2015-2018), with regular
monitoring of compliance.
1 The latter case involves processing proposals for inclusion or
increasing the level in the Risk Catalogues
Information of Prudential Relevance 2016
25
Additionally, changes in this profile are evaluated
for potential stress scenarios, in both internal and
regulatory tests (ICAAP, ILAAP, EBA stress
tests). In this way, the management team and
governing bodies are provided with an overview
of the Entity’s resilience in the face of internal
and/or external events.
4.5. Risk Culture
General Risk Management Principles
The Board of Directors of CaixaBank is the
Group’s highest risk-policy setting body. The
Board-approved General Risk Management
Principles1 can be summarised as follows:
Risk is inherent to the Group’s business. The Board of Directors is the most senior risk
management body, a function in which management is involved.
The Group's target risk profile is medium-low. The entire organisation should be, and is,
involved in aligning the risk assumed to the desired profile.
Risk management entails the full cycle of transactions: from preliminary analysis until approval, to monitoring of customer and counterparty solvency, and profitability, and to repayment or recovery of impaired assets.
The risk function is independent of business and operating units.
Business decisions are taken jointly between at least two employees with different organisational reporting lines.
Inclusion of the table of powers in the systems facilitates the decentralisation of decision-making so that decisions are taken as close as possible to customers, while ensuring risks are approved at a suitable level.
Approvals are based on the borrower's repayment capacity and factor in an appropriate return.
Standard criteria and tools are employed throughout the organisation.
Risks are measured and analysed using advanced methods and tools in accordance with sector best practices. All risk measurement, monitoring and management work is carried out in accordance with the recommendation of the Basel Committee on Banking Supervision, European directives and Spanish legislation.
Appropriate resource allocation: The human and technical resources allocated to risk management are sufficient in terms of both
1 See Note 3 to the CaixaBank Group's 2016 consolidated financial
statements for more information.
quantity and quality to allow objectives to be achieved.
Training
With the objective of enabling the Group's branch managers, premier bank managers and private banking consultants to offer customers the best service and build their trust, since 2015 more than 6,000 branch managers and premier banking managers have obtained a diploma in Financial Advisory services from the UPF School of Management (run by Pompeu Fabra University) and almost the same number obtained a Certificate in Wealth Management from the Chartered Institute for Securities & Investment (CISI). This accreditation is recognised among financial institutions (e.g. HSBC, BNP Paribas, Credit Suisse, the National Bank of Abu Dhabi, Citi Bank, UBS, Barclays and Deutsche Bank) not only as a measure of their knowledge of financial advice services but also of the codes of conduct and ethics required to achieve excellence in customer service. This makes the Group the first Spanish financial institution to certify employees' training with a post-graduate Financial Advice diploma and a prestigious international financial sector certificate.
Turning to risks specifically, the General Risks Division and the General Human Resources Division define the content of any risk-related training for functions supporting the Board of Directors/Senior Management covering specific matters that help high-level decision-making, as well as the rest of the organisation, especially branch network staff. This is carried out to ensure: communication of the Risk Appetite Framework throughout the whole organisation; the decentralisation of decision making; the updating of risk analysis competencies; and optimisation of risk quality.
CaixaBank structures its training offering through its Risks School. It sees training as a strategic tool to provide support to business areas, whilst providing a conduit for disseminating the Bank's risk policies, providing training, information and tools for all of the Bank's staff. This proposal comprises a training circuit for specialising in risk management. This is linked to the professional development of the Bank's entire workforce from Retail Banking staff through to specialists in any field. The objective is for the Bank's workforce to have adequate knowledge of:
the financial system and the risks in the economic environment and banking business,
the organisation and operation of risk management in the Group,
Information of Prudential Relevance 2016
26
the processes and tools associated with lending transactions, with regard to acceptance and monitoring, through to renegotiation and recovery, if necessary,
credit products and the risks inherent to each of these, together with legislation applicable to credit agreements.
In September 2015, the Risk School launched its first Risk Analysis Certificate promotion (aimed at sales managers, with a total of 46,200 training hours) and the first postgraduate diploma in Risk Analysis, Specialising in Retail (aimed at branch managers and assistant managers, with a total of 37,900 training hours). More than 2,400 employees are currently taking part in training: new promotions of the Risk Analysis Certificate (one edition) and the Post-graduate diploma in Risk Analysis (two editions), which began in 2016.
The following training on banking risk is provided by the Risk School:
Basic Banking Risk course: Basic level
university qualification designed for generalist managers and staff from the branch network and other stakeholders who may need a basic knowledge of the organisation’s risk management criteria to carry out their work. (The 2nd course started in May 2016, with the participation of 320 employees and sales managers).
Postgraduate diploma in Banking Risk Analysis: University diploma for commercial branch deputy managers and managers and other stakeholders who, given their role, may be involved in approving loans or may require in-depth knowledge of risk at CaixaBank. In 2016, the 2nd course (March 2016, 1,013 participants) and the 3rd course (September 2016, 648 participants) began, along with the 1st course on Specialising in Retail, which began in September, for 690 employees with such responsibilities in the branch network.
More than 3,500 hours of training were provided to risk teams in 2016 through several courses for CaixaBank’s branch and Central Services personnel. The main programmes were:
Training in professional skills:
Site visit management for Risk Analysts, to maximise the effectiveness of company visits. Course covering the implementation of the New Regional Risk Approval Centre Organisation with customer classification and roll-out of the new model for collaboration between Risk Approvals and the centres serving businesses, institutions and the public sector. To this end, sales managers will sometimes be accompanied during visits to selected customers.
Training in multiple areas of expertise.
The main programmes were:
Impact of Appendix IX of BoS Circular 4/2016, aimed at training for all Regional Risk Approval Centre teams and analysts in Central Services, streamed live.
New Risk Analysts, to introduce this group to risk management criteria and policies, the tools available to them when carrying out their work, the main financing products offered by the Bank and legal aspects relating to risk. The course is intended mainly for a group of employees from Global Risk Management at Central Services and Asset Management Technicians (TGAS) with the aim of improving their technical and conceptual vision through a range of applied scenarios relating to risk policies and specific product characteristics and features, while enhancing their skills in relation to other risks for which they are not directly responsible (such as market risk).
Performance assessment and remuneration
As described in the Risk Appetite Framework
section, the CaixaBank Group works to ensure
that the extrinsic motivation of its employees is
consistent with its risk culture and compliance
with the levels of risk that the Board is prepared
to take on.
Two different plans are in place to achieve this:
15% of the variable remuneration
received by members of the
Management Committee and the
Identified Staff is directly related to
Information of Prudential Relevance 2016
27
successful annual compliance with the
Risk Appetite Framework.1
Employees working in business areas set
down their objectives in a bottom-up/top-
down process to ensure that, on
aggregate, the objectives of the Strategic
Plan (for the corresponding year) are
met. This ensures efficient and effective
transference and subsequent alignment
with the risk profile set by the Board is
achieved, insofar as these objectives are
already calibrated to ensure compliance
with the Risk Appetite Framework, in
addition to other institutional objectives
(identification and knowledge of
customers, according to KYC principles).
4.6. Internal control framework
CaixaBank's Internal Control Model offers a
reasonable degree of assurance that the Group
will achieve its objectives. This is structured
around the 3 Lines of Defence model, in line with
regulatory guidance and best practices in the
sector.
The first line of defence comprises the
Group's business units and support areas,
which are responsible for identifying,
measuring, controlling, mitigating and
reporting the key risks affecting the Group as
it carries out its business.
In 2015 the control functions in the first line of
defence were reinforced. Among other things,
this included the creation of the Corporate
Business Control Department as a specific
control unit for the General Business Division.
The second line of defence acts
independently of the business units and is
designed to: ensure the existence of risk
management and control policies and
procedures; monitor their application;
evaluate the control environment; and report
all of the Group's material risks.
The second line of defence was also
reinforced in December 2015 through the
creation of the Deputy General Control &
Compliance Area, and in 2016, by the Control
Units added in the General Risks Division and
the Financial Accounting, Control and Capital
area.
1 For more information, refer to the "Annual Report on Directors’
Remuneration for Listed Companies” on the CaixaBank website (http://www.caixabank.com/informacionparaaccionistaseinversores/gobiernocorporativo/remuneracionesdelosconsejeros/informeanualderemuneraciones_es.html)
The third line of defence, which comprises
Internal Audit, is responsible for assessing the
effectiveness and efficiency of risk management
and the internal control systems, applying
principles of independence and objectivity.
Global risk management and control ensures that
the Entity's risk profile: is aligned with its strategic
objectives; preserves solvency and liquidity
mechanisms; it achieves an optimal risk-return
ratio; and strives for excellence in customer
service with flexible and transparent processes.
In December 2016, the Internal Control
Committee was created, chaired by the Deputy
General Manager of Control and Compliance and
involving the Control Units of the second and
third lines of defence, and the Business Control
Unit.
The Control Units in the second line of defence have the following functions, each under their own scope of action, to:
Ensure that suitable policies and procedures are in place in relation to risk management, and that they are effectively complied with.
Ensure the existence of a suitable and effective Control Environment that mitigates the risks within its scope of action, including monitoring through indicators.
Detect the existence of gaps in the control, establish plans to remedy these and monitor their implementation.
Ensure the existence of proper reporting to the Internal Control Committee.
Foster a culture of control and compliance within its scope of action.
The Audit functions involved in assessing the internal control framework are set out in section 4.6.4.
The Internal Control Committee has the mission of providing reasonable assurance to management and governing bodies that risk control policies and procedures are in place in the organisation, and that they are designed correctly and applied effectively, evaluating the risk control environment in the CaixaBank Group.
The Control Units that make up the second and third lines of defence are:
Internal Risk Control.
Internal Control over Information and
Financial Models.
Regulatory Compliance.
Information of Prudential Relevance 2016
28
Internal Audit.
4.6.1. Internal Risk Control
The objective of the Internal Risk Control department is to unify into a single organisational area, reporting directly to the General Risks Division, the different functions of the second line of defence in operation within the aforementioned Division.
The management is organised into the following functions:
1. Internal Control of Operational and Credit Risk and Control of Markets.
The purpose of these functions is to monitor, as a second line of supervision:
The definition and implementation of processes in accordance with the bank's risk policies, ensuring that risk taking is always done within the framework defined by them and with a suitable control framework.
The consistency and effectiveness of the controls exercised from the first line of defence on the processes of assuming risk by the Bank.
The monitoring and control of the risks assumed, as well as their ongoing reporting to, among others, risk taking and/or management areas, Senior Management and the competent committees, as well as supervisory bodies and third party entities.
2. Internal Validation
Performs control functions for internal ratings systems, as described in greater detail in point 2, "Internal Validation", of section 2, “Internal Control Framework: Internal Control: Internal Risk Control", of note 3, “Risk governance, management and control", to the CaixaBank Group's 2016 financial statements.
4.6.2. Internal Control over Information and Financial Models
The objective of the Internal Control over Information and Financial Models Department is the supervision of risks associated with the Financial Accounting, Control and Capital (FACC) Department. This is organised into the following functions:
1. Internal Control over Financial Reporting (ICFR) System
As part of the Bank’s Internal Control, the ICFR is defined as a set of processes that provides reasonable assurance on the reliability of the financial information published by the Entity in the markets. It is designed in accordance with the guidance established by the Spanish National Securities Market Regulator (CNMV) in its document "Guidelines on Internal Control over Financial Reporting in Listed Companies" (companies issuing securities admitted to trading). As a second line of defence, it monitors whether the practices and processes in place at the Bank to produce the financial information ensure its reliability and compliance with applicable regulations. This function should specifically assess whether the financial information reported by the entities within the Group complies with the following principles:
a) The transactions, facts and other events
presented in the financial information in fact
exist and were recorded at the right time
(existence and occurrence).
b) The information includes all transactions,
facts and other events in which the entity is
the affected party (completeness).
c) The transactions, facts and other events are
recorded and valued in accordance with
applicable standards (valuation).
d) The transactions, facts and other events are
classified, presented and disclosed in the
financial information in accordance with
applicable standards (presentation,
disclosure and comparability).
e) The financial information shows, at the
corresponding date, the entity’s rights and
obligations through the corresponding
assets and liabilities, in accordance with
applicable standards (rights and
obligations).
Details of this function are presented in the Annual Corporate Governance Report for 2016, along with the activities carried out during the period.
2. Internal Control over Financial Planning Models (CFPM)
This recently created function has the objective of exercising the second line of defence's internal control over the activities carried out by the Corporate Planning and Capital Division, ensuring the existence of suitable policies and
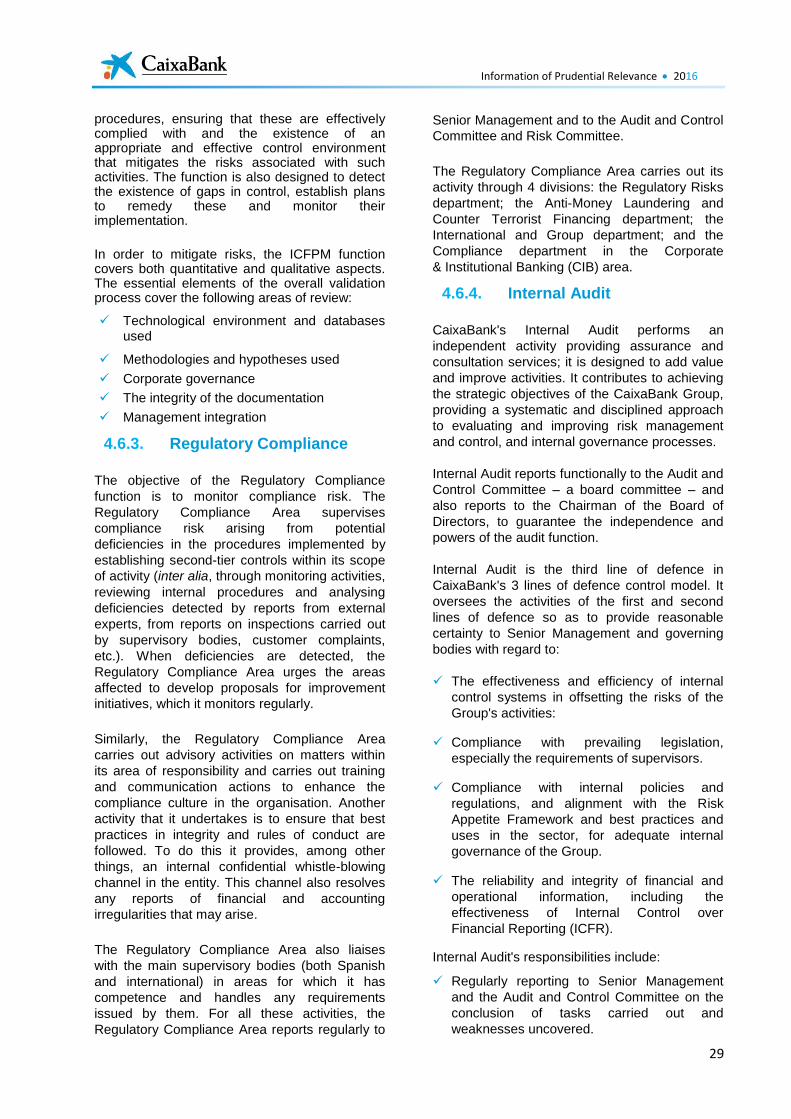
Information of Prudential Relevance 2016
29
procedures, ensuring that these are effectively complied with and the existence of an appropriate and effective control environment that mitigates the risks associated with such activities. The function is also designed to detect the existence of gaps in control, establish plans to remedy these and monitor their implementation.
In order to mitigate risks, the ICFPM function covers both quantitative and qualitative aspects. The essential elements of the overall validation process cover the following areas of review:
Technological environment and databases used
Methodologies and hypotheses used
Corporate governance
The integrity of the documentation
Management integration
4.6.3. Regulatory Compliance
The objective of the Regulatory Compliance
function is to monitor compliance risk. The
Regulatory Compliance Area supervises
compliance risk arising from potential
deficiencies in the procedures implemented by
establishing second-tier controls within its scope
of activity (inter alia, through monitoring activities,
reviewing internal procedures and analysing
deficiencies detected by reports from external
experts, from reports on inspections carried out
by supervisory bodies, customer complaints,
etc.). When deficiencies are detected, the
Regulatory Compliance Area urges the areas
affected to develop proposals for improvement
initiatives, which it monitors regularly.
Similarly, the Regulatory Compliance Area
carries out advisory activities on matters within
its area of responsibility and carries out training
and communication actions to enhance the
compliance culture in the organisation. Another
activity that it undertakes is to ensure that best
practices in integrity and rules of conduct are
followed. To do this it provides, among other
things, an internal confidential whistle-blowing
channel in the entity. This channel also resolves
any reports of financial and accounting
irregularities that may arise.
The Regulatory Compliance Area also liaises
with the main supervisory bodies (both Spanish
and international) in areas for which it has
competence and handles any requirements
issued by them. For all these activities, the
Regulatory Compliance Area reports regularly to
Senior Management and to the Audit and Control
Committee and Risk Committee.
The Regulatory Compliance Area carries out its
activity through 4 divisions: the Regulatory Risks
department; the Anti-Money Laundering and
Counter Terrorist Financing department; the
International and Group department; and the
Compliance department in the Corporate
& Institutional Banking (CIB) area.
4.6.4. Internal Audit
CaixaBank's Internal Audit performs an
independent activity providing assurance and
consultation services; it is designed to add value
and improve activities. It contributes to achieving
the strategic objectives of the CaixaBank Group,
providing a systematic and disciplined approach
to evaluating and improving risk management
and control, and internal governance processes.
Internal Audit reports functionally to the Audit and
Control Committee – a board committee – and
also reports to the Chairman of the Board of
Directors, to guarantee the independence and
powers of the audit function.
Internal Audit is the third line of defence in
CaixaBank's 3 lines of defence control model. It
oversees the activities of the first and second
lines of defence so as to provide reasonable
certainty to Senior Management and governing
bodies with regard to:
The effectiveness and efficiency of internal
control systems in offsetting the risks of the
Group's activities:
Compliance with prevailing legislation,
especially the requirements of supervisors.
Compliance with internal policies and
regulations, and alignment with the Risk
Appetite Framework and best practices and
uses in the sector, for adequate internal
governance of the Group.
The reliability and integrity of financial and
operational information, including the
effectiveness of Internal Control over
Financial Reporting (ICFR).
Internal Audit's responsibilities include:
Regularly reporting to Senior Management
and the Audit and Control Committee on the
conclusion of tasks carried out and
weaknesses uncovered.
Information of Prudential Relevance 2016
30
Adding value by proposing recommendations
to address weaknesses detected in reviews
and monitoring their implementation by the
appropriate centres.
The annual audit activity plan is approved by the
Audit and Control Committee. This plan focuses
on the main risks identified in the Group, and on
meeting the requirements of supervisors and
specific requests from governing bodies and
management. Internal Audit carries out these
reviews efficiently, fostering continuous auditing,
with advanced performance alerts, ongoing
auditor training and a suitable policy for
outsourcing specialised services.
Internal Audit supervises the risk management
control environment covered in this report, providing
an objective and independent assessment of the
efficacy and efficiency of the control framework
applied by the management areas.
In relation to credit risk, it verifies: the main
management processes implemented in this
sphere; the use of advanced credit risk models;
and compliance with established regulatory
requirements, in particular by:
Verifying compliance with the entity's internal and external regulations in connection with credit risk management.
Reviewing the main admission and approval, arrears management, borrower monitoring and recovery processes.
Ensuring the adequate integration of risk models into the Entity's day-to-day management, both in approval of transactions and in the subsequent management and monitoring thereof.
Monitoring the management of concentration and country risk.
Verifying the integrity and consistency of the databases used in the construction of risk models and the calibration of risk parameters.
Verifying the accuracy of the data fed into the Entity's systems and the existence and adequacy of controls.
Reviewing the implementation of risk models, procedures for calculating regulatory and economic capital, and risk measurement and management tools.
Assessment of accounting classifications and whether provisions for large debtors are sufficient.
Review of valuation models for coverage of loan portfolio impairment.
Supervision of the risk management control framework, assessing the independent control functions carried out by the first and second lines of defence.
Reviewing measurement, assessment and
management processes for operational risk,
including:
Reviewing compliance with, and
implementation of, the Operational Risk
Management Framework in the Group.
Verifying compliance with regulatory
requirements for use of the standardised
approach to calculating minimum capital
requirements.
Assessment of the integration into
management and uses of the operational risk
management model, verifying the effective
implementation of the model in the day-to-day
management of operational risk.
Assessment of the management procedures
and tools implemented and their on-going
evolution, verifying compliance with internal
regulations.
Review of the measurement system, mainly
verifying the accuracy and integrity of data.
Review of the technological environment and
applications, with regard to the integrity and
confidentiality of information, systems
availability and business continuity, through
planned reviews and continuous auditing and
monitoring of the risk indicators defined.
For market, liquidity and interest rate risk in the
banking book, Internal Audit verifies: the main
management processes implemented in these
areas; use of the internal advanced model for
market risk and internal models for liquidity,
interest-rate and exchange-rate risk in the
banking book; and compliance with regulatory
requirements, particularly:
Checking that the methodologies used
consider relevant risk factors.
The review of the process, and the integrity
and consistency of the data used in risk
management.
Supervision of the control environment,
including detailed control functions for the
Information of Prudential Relevance 2016
31
units responsible for risks in the first and
second lines of defence, and adequate
reporting to management and governing
bodies.
Checking that risk analysis, measurement,
monitoring and control systems have been
implemented in the Entity's day-to-day
management.
Verification that procedures relating to the risk
management system and process are
appropriately documented.
Verifying compliance with the entity's internal
and external regulations in connection with
management and regulatory reporting of
market and liquidity risk, and interest rate risk
in the banking book.
With regard to legal and regulatory risks, the
control environment put in place to offset risks
deriving from changes in legislation and the
regulatory framework, and management of court
proceedings is reviewed.
In terms of compliance risk, policies and
procedures established in the CaixaBank Group
are assessed to ensure they are consistent with
the legal and regulatory framework, and internal
codes and regulations.
In addition to supervising the Pillar I risks within
the comprehensive risk management framework
defined by Basel, Internal Audit reviews the
processes for assessing capital (ICAAP) and
liquidity (ILAAP). It also reviews the Recovery
Plan, which is updated annually by the Entity, and
this document prior to approval by the Board of
Directors.
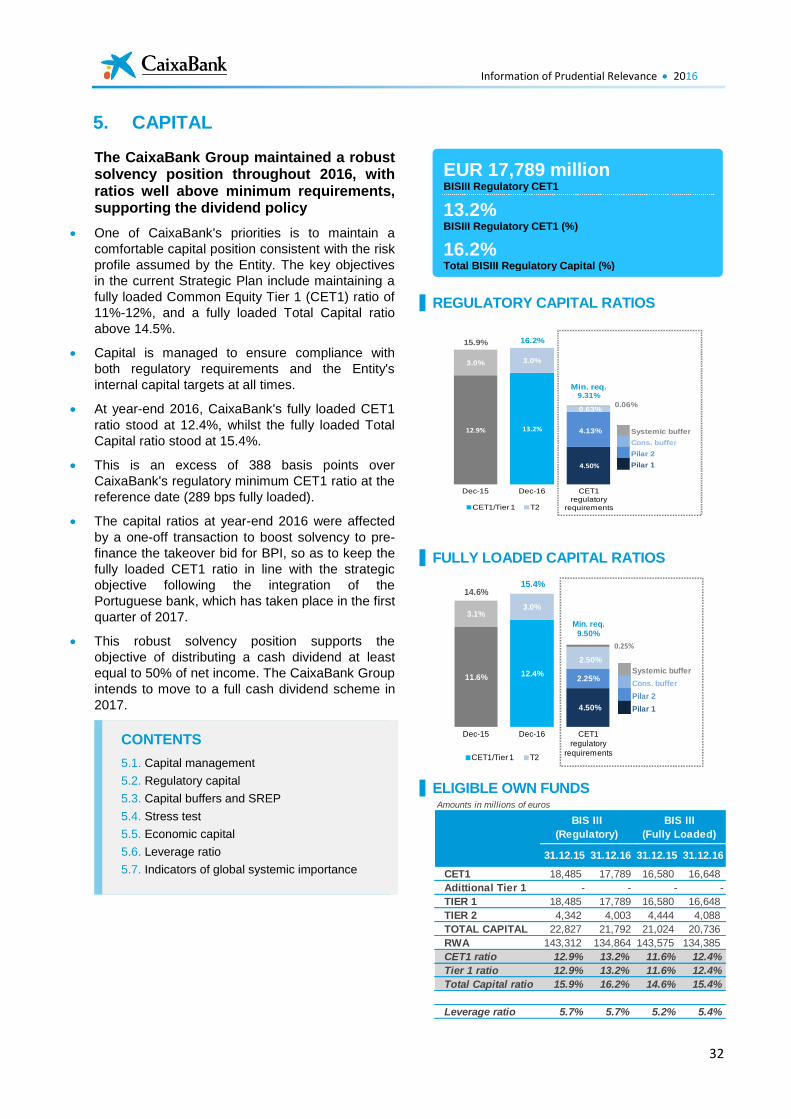
Information of Prudential Relevance 2016
32
5. CAPITAL
The CaixaBank Group maintained a robust solvency position throughout 2016, with ratios well above minimum requirements, supporting the dividend policy
One of CaixaBank's priorities is to maintain a
comfortable capital position consistent with the risk
profile assumed by the Entity. The key objectives
in the current Strategic Plan include maintaining a
fully loaded Common Equity Tier 1 (CET1) ratio of
11%-12%, and a fully loaded Total Capital ratio
above 14.5%.
Capital is managed to ensure compliance with
both regulatory requirements and the Entity's
internal capital targets at all times.
At year-end 2016, CaixaBank's fully loaded CET1
ratio stood at 12.4%, whilst the fully loaded Total
Capital ratio stood at 15.4%.
This is an excess of 388 basis points over
CaixaBank's regulatory minimum CET1 ratio at the
reference date (289 bps fully loaded).
The capital ratios at year-end 2016 were affected
by a one-off transaction to boost solvency to pre-
finance the takeover bid for BPI, so as to keep the
fully loaded CET1 ratio in line with the strategic
objective following the integration of the
Portuguese bank, which has taken place in the first
quarter of 2017.
This robust solvency position supports the
objective of distributing a cash dividend at least
equal to 50% of net income. The CaixaBank Group
intends to move to a full cash dividend scheme in
2017.
REGULATORY CAPITAL RATIOS
FULLY LOADED CAPITAL RATIOS
ELIGIBLE OWN FUNDS
12.9% 13.2%
4.50%
4.13%
3.0% 3.0%
0.63%0.06%
15.9% 16.2%
Min. req.9.31%
Dec-15 Dec-16 CET1 regulatory
requirements
Phase-in
CET1/Tier 1 T2
Systemic buffer
Cons. buffer
Pilar 2
Pilar 1
11.6% 12.4%
4.50%
2.25%
3.1%3.0%
2.50%
0.25%
14.6%15.4%
Min. req.9.50%
Dec-15 Dec-16 CET1 regulatory
requirementsCET1/Tier 1 T2
Systemic buffer
Cons. buffer
Pilar 2
Pilar 1
Amounts in millions of euros
31.12.15 31.12.16 31.12.15 31.12.16
CET1 18,485 17,789 16,580 16,648
Adittional Tier 1 - - - -
TIER 1 18,485 17,789 16,580 16,648
TIER 2 4,342 4,003 4,444 4,088
TOTAL CAPITAL 22,827 21,792 21,024 20,736
RWA 143,312 134,864 143,575 134,385
CET1 ratio 12.9% 13.2% 11.6% 12.4%
Tier 1 ratio 12.9% 13.2% 11.6% 12.4%
Total Capital ratio 15.9% 16.2% 14.6% 15.4%
Leverage ratio 5.7% 5.7% 5.2% 5.4%
BIS III
(Regulatory)
BIS III
(Fully Loaded)
EUR 17,789 million BISIII Regulatory CET1
13.2% BISIII Regulatory CET1 (%)
16.2% Total BISIII Regulatory Capital (%)
CONTENTS
5.1. Capital management
5.2. Regulatory capital
5.3. Capital buffers and SREP
5.4. Stress test
5.5. Economic capital
5.6. Leverage ratio
5.7. Indicators of global systemic importance
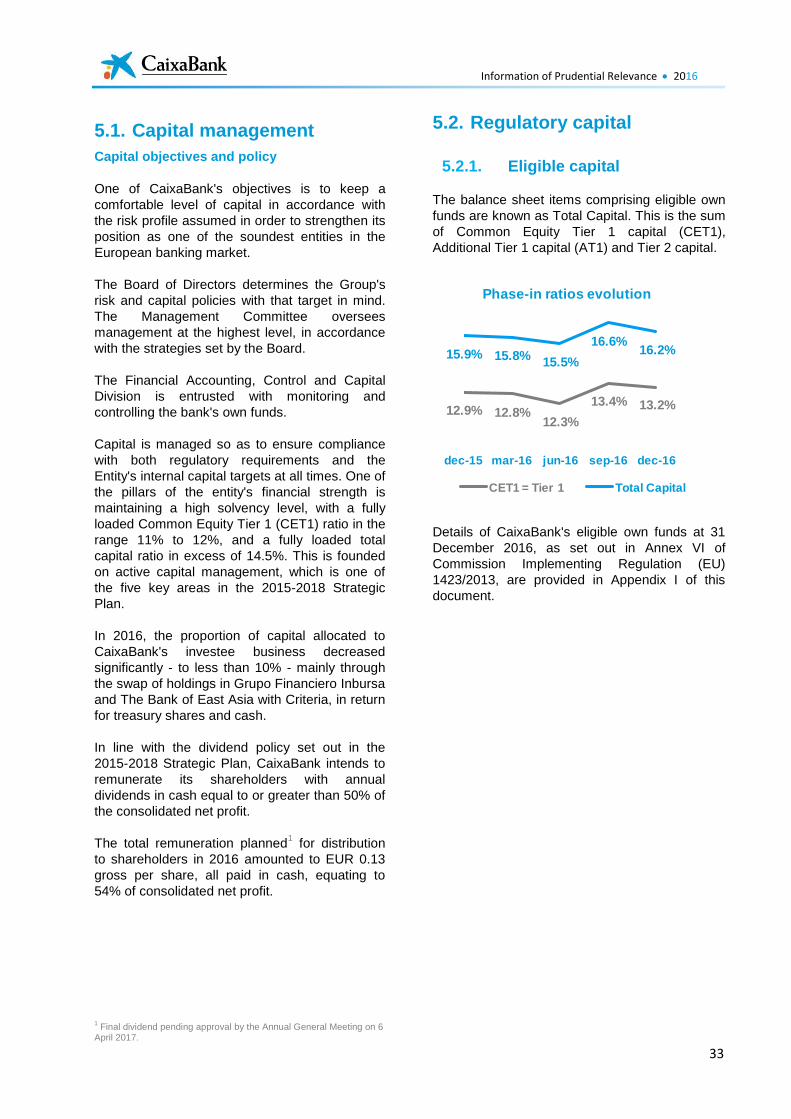
Information of Prudential Relevance 2016
33
5.1. Capital management
Capital objectives and policy
One of CaixaBank's objectives is to keep a
comfortable level of capital in accordance with
the risk profile assumed in order to strengthen its
position as one of the soundest entities in the
European banking market.
The Board of Directors determines the Group's
risk and capital policies with that target in mind.
The Management Committee oversees
management at the highest level, in accordance
with the strategies set by the Board.
The Financial Accounting, Control and Capital
Division is entrusted with monitoring and
controlling the bank's own funds.
Capital is managed so as to ensure compliance
with both regulatory requirements and the
Entity's internal capital targets at all times. One of
the pillars of the entity's financial strength is
maintaining a high solvency level, with a fully
loaded Common Equity Tier 1 (CET1) ratio in the
range 11% to 12%, and a fully loaded total
capital ratio in excess of 14.5%. This is founded
on active capital management, which is one of
the five key areas in the 2015-2018 Strategic
Plan.
In 2016, the proportion of capital allocated to
CaixaBank's investee business decreased
significantly - to less than 10% - mainly through
the swap of holdings in Grupo Financiero Inbursa
and The Bank of East Asia with Criteria, in return
for treasury shares and cash.
In line with the dividend policy set out in the
2015-2018 Strategic Plan, CaixaBank intends to
remunerate its shareholders with annual
dividends in cash equal to or greater than 50% of
the consolidated net profit.
The total remuneration planned1 for distribution
to shareholders in 2016 amounted to EUR 0.13
gross per share, all paid in cash, equating to
54% of consolidated net profit.
1 Final dividend pending approval by the Annual General Meeting on 6
April 2017.
5.2. Regulatory capital
5.2.1. Eligible capital
The balance sheet items comprising eligible own
funds are known as Total Capital. This is the sum
of Common Equity Tier 1 capital (CET1),
Additional Tier 1 capital (AT1) and Tier 2 capital.
Details of CaixaBank's eligible own funds at 31
December 2016, as set out in Annex VI of
Commission Implementing Regulation (EU)
1423/2013, are provided in Appendix I of this
document.
12.9% 12.8%12.3%
13.4% 13.2%
15.9% 15.8%15.5%
16.6%16.2%
dec-15 mar-16 jun-16 sep-16 dec-16
Phase-in ratios evolution
CET1 = Tier 1 Total Capital
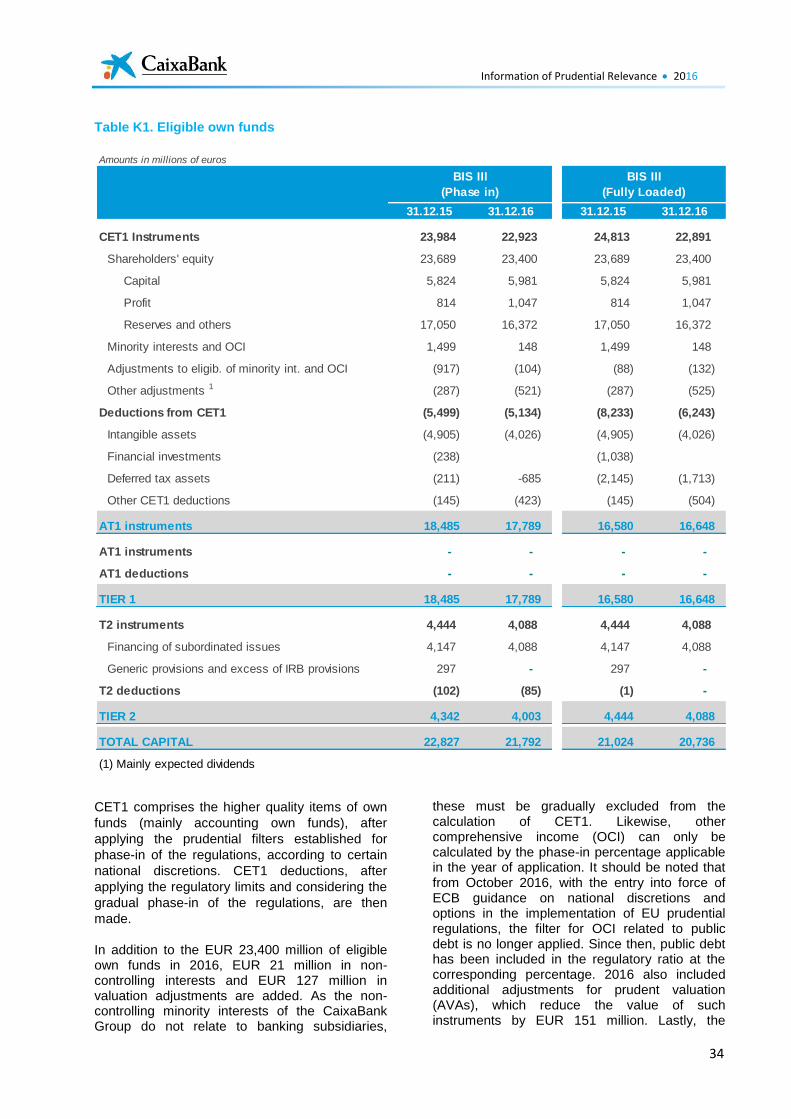
Information of Prudential Relevance 2016
34
Table K1. Eligible own funds
CET1 comprises the higher quality items of own
funds (mainly accounting own funds), after
applying the prudential filters established for
phase-in of the regulations, according to certain
national discretions. CET1 deductions, after
applying the regulatory limits and considering the
gradual phase-in of the regulations, are then
made.
In addition to the EUR 23,400 million of eligible own funds in 2016, EUR 21 million in non-controlling interests and EUR 127 million in valuation adjustments are added. As the non-controlling minority interests of the CaixaBank Group do not relate to banking subsidiaries,
these must be gradually excluded from the calculation of CET1. Likewise, other comprehensive income (OCI) can only be calculated by the phase-in percentage applicable in the year of application. It should be noted that from October 2016, with the entry into force of ECB guidance on national discretions and options in the implementation of EU prudential regulations, the filter for OCI related to public debt is no longer applied. Since then, public debt has been included in the regulatory ratio at the corresponding percentage. 2016 also included additional adjustments for prudent valuation (AVAs), which reduce the value of such instruments by EUR 151 million. Lastly, the
Amounts in millions of euros
31.12.15 31.12.16 31.12.15 31.12.16
CET1 Instruments 23,984 22,923 24,813 22,891
Shareholders' equity 23,689 23,400 23,689 23,400
Capital 5,824 5,981 5,824 5,981
Profit 814 1,047 814 1,047
Reserves and others 17,050 16,372 17,050 16,372
Minority interests and OCI 1,499 148 1,499 148
Adjustments to eligib. of minority int. and OCI (917) (104) (88) (132)
Other adjustments 1 (287) (521) (287) (525)
Deductions from CET1 (5,499) (5,134) (8,233) (6,243)
Intangible assets (4,905) (4,026) (4,905) (4,026)
Financial investments (238) (1,038)
Deferred tax assets (211) -685 (2,145) (1,713)
Other CET1 deductions (145) (423) (145) (504)
AT1 instruments 18,485 17,789 16,580 16,648
AT1 instruments - - - -
AT1 deductions - - - -
TIER 1 18,485 17,789 16,580 16,648
T2 instruments 4,444 4,088 4,444 4,088
Financing of subordinated issues 4,147 4,088 4,147 4,088
Generic provisions and excess of IRB provisions 297 - 297 -
T2 deductions (102) (85) (1) -
TIER 2 4,342 4,003 4,444 4,088
TOTAL CAPITAL 22,827 21,792 21,024 20,736
(1) Mainly expected dividends
BIS III
(Phase in)
BIS III
(Fully Loaded)
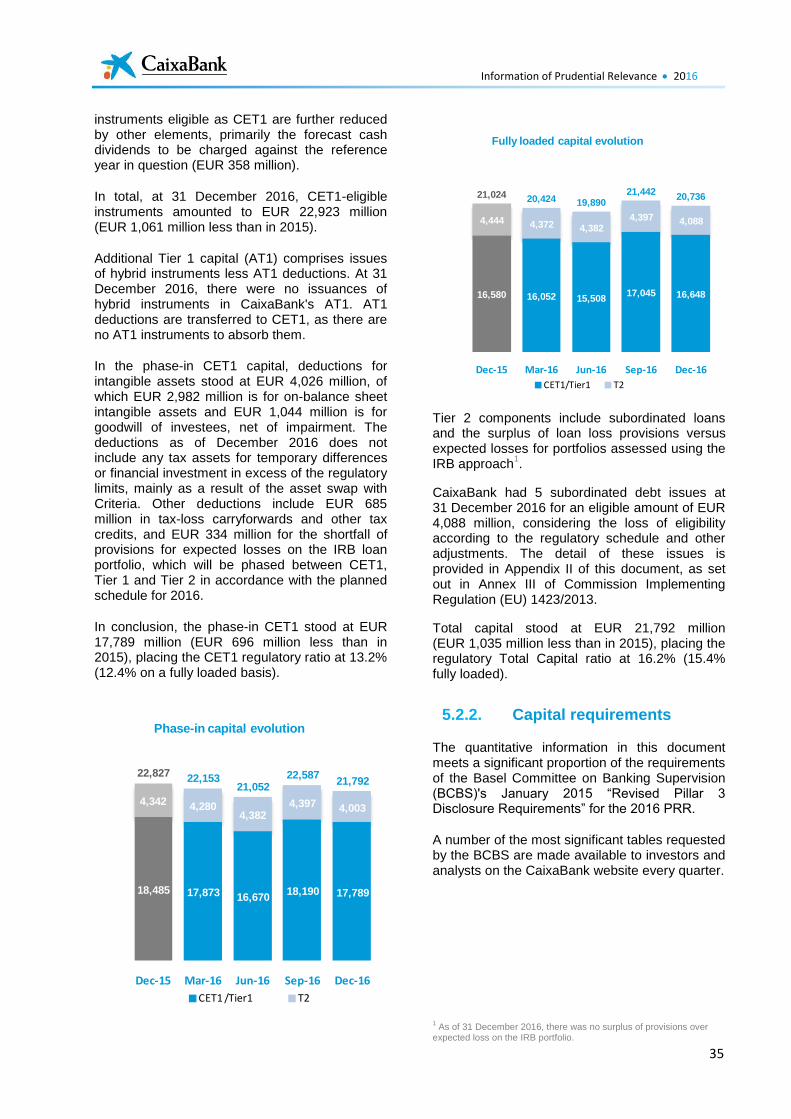
Information of Prudential Relevance 2016
35
instruments eligible as CET1 are further reduced by other elements, primarily the forecast cash dividends to be charged against the reference year in question (EUR 358 million).
In total, at 31 December 2016, CET1-eligible instruments amounted to EUR 22,923 million (EUR 1,061 million less than in 2015).
Additional Tier 1 capital (AT1) comprises issues of hybrid instruments less AT1 deductions. At 31 December 2016, there were no issuances of hybrid instruments in CaixaBank's AT1. AT1 deductions are transferred to CET1, as there are no AT1 instruments to absorb them.
In the phase-in CET1 capital, deductions for intangible assets stood at EUR 4,026 million, of which EUR 2,982 million is for on-balance sheet intangible assets and EUR 1,044 million is for goodwill of investees, net of impairment. The deductions as of December 2016 does not include any tax assets for temporary differences or financial investment in excess of the regulatory limits, mainly as a result of the asset swap with Criteria. Other deductions include EUR 685 million in tax-loss carryforwards and other tax credits, and EUR 334 million for the shortfall of provisions for expected losses on the IRB loan portfolio, which will be phased between CET1, Tier 1 and Tier 2 in accordance with the planned schedule for 2016.
In conclusion, the phase-in CET1 stood at EUR 17,789 million (EUR 696 million less than in 2015), placing the CET1 regulatory ratio at 13.2% (12.4% on a fully loaded basis).
Tier 2 components include subordinated loans and the surplus of loan loss provisions versus expected losses for portfolios assessed using the IRB approach
1.
CaixaBank had 5 subordinated debt issues at 31 December 2016 for an eligible amount of EUR 4,088 million, considering the loss of eligibility according to the regulatory schedule and other adjustments. The detail of these issues is provided in Appendix II of this document, as set out in Annex III of Commission Implementing Regulation (EU) 1423/2013.
Total capital stood at EUR 21,792 million (EUR 1,035 million less than in 2015), placing the regulatory Total Capital ratio at 16.2% (15.4% fully loaded).
5.2.2. Capital requirements
The quantitative information in this document meets a significant proportion of the requirements of the Basel Committee on Banking Supervision (BCBS)'s January 2015 “Revised Pillar 3 Disclosure Requirements” for the 2016 PRR.
A number of the most significant tables requested by the BCBS are made available to investors and analysts on the CaixaBank website every quarter.
1 As of 31 December 2016, there was no surplus of provisions over
expected loss on the IRB portfolio.
18,485 17,873 16,67018,190 17,789
4,342 4,2804,382
4,397 4,003
22,82722,153
21,05222,587
21,792
Dec-15 Mar-16 Jun-16 Sep-16 Dec-16
Phase-in capital evolution
CET1 /Tier1 T2
16,580 16,052 15,50817,045 16,648
4,444 4,372 4,3824,397 4,088
21,024 20,424 19,89021,442
20,736
Dec-15 Mar-16 Jun-16 Sep-16 Dec-16
Fully loaded capital evolution
CET1/Tier1 T2
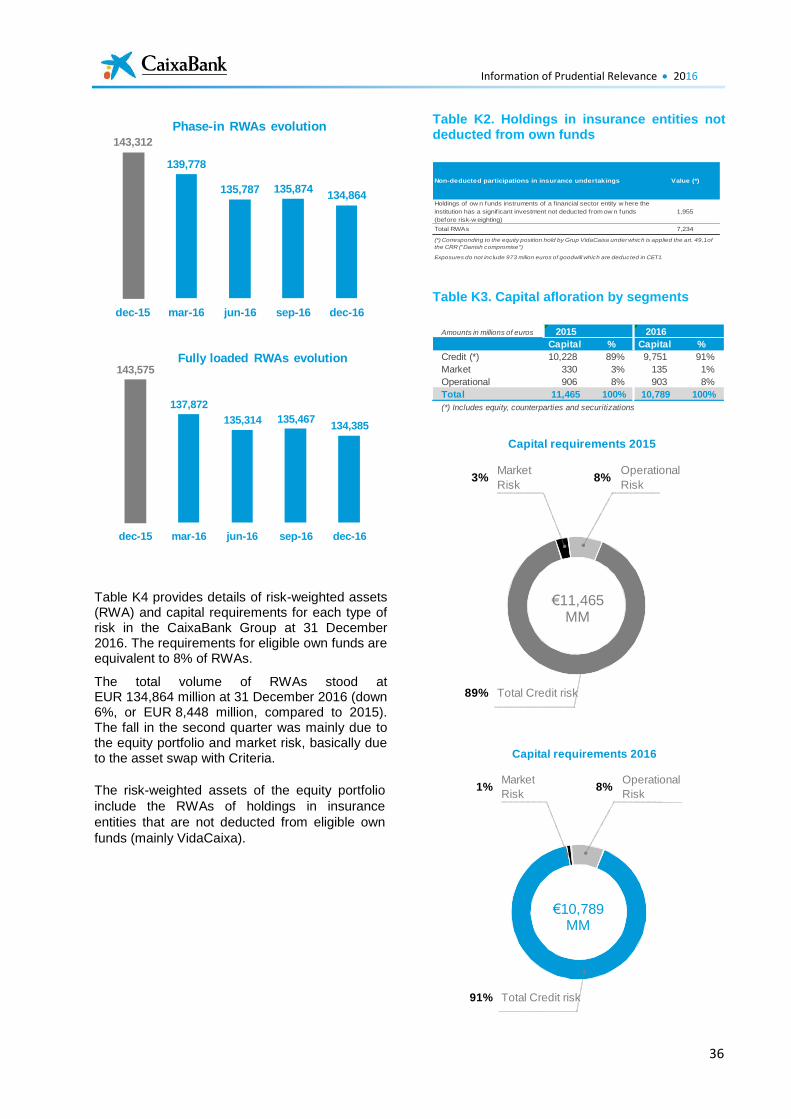
Information of Prudential Relevance 2016
36
Table K4 provides details of risk-weighted assets (RWA) and capital requirements for each type of risk in the CaixaBank Group at 31 December 2016. The requirements for eligible own funds are equivalent to 8% of RWAs.
The total volume of RWAs stood at EUR 134,864 million at 31 December 2016 (down 6%, or EUR 8,448 million, compared to 2015). The fall in the second quarter was mainly due to the equity portfolio and market risk, basically due to the asset swap with Criteria.
The risk-weighted assets of the equity portfolio
include the RWAs of holdings in insurance
entities that are not deducted from eligible own
funds (mainly VidaCaixa).
Table K2. Holdings in insurance entities not deducted from own funds
Table K3. Capital afloration by segments
143,312
139,778
135,787 135,874134,864
dec-15 mar-16 jun-16 sep-16 dec-16
Phase-in RWAs evolution
143,575
137,872
135,314 135,467 134,385
dec-15 mar-16 jun-16 sep-16 dec-16
Fully loaded RWAs evolution
Non-deducted participations in insurance undertakings Value (*)
Holdings of ow n funds instruments of a f inancial sector entity w here the
institution has a signif icant investment not deducted from ow n funds
(before risk-w eighting)
1,955
Total RWAs 7,234
(*) Corresponding to the equity position hold by Grup VidaCaixa under which is applied the art. 49,1 of
the CRR ("Danish compromise")
Exposures do not include 973 milion euros of goodwill which are deducted in CET1.
Amounts in millions of euros 2015 2016
Capital % Capital %
Credit (*) 10,228 89% 9,751 91%
Market 330 3% 135 1%
Operational 906 8% 903 8%
Total 11,465 100% 10,789 100%
(*) Includes equity, counterparties and securitizations
Capital requirements 2015
Operational
Risk
89% Total Credit risk
3%Market
Risk8%
€11,465MM
Capital requirements 2016
Operational
Risk
91% Total Credit risk
1%Market
Risk8%
€10,789MM
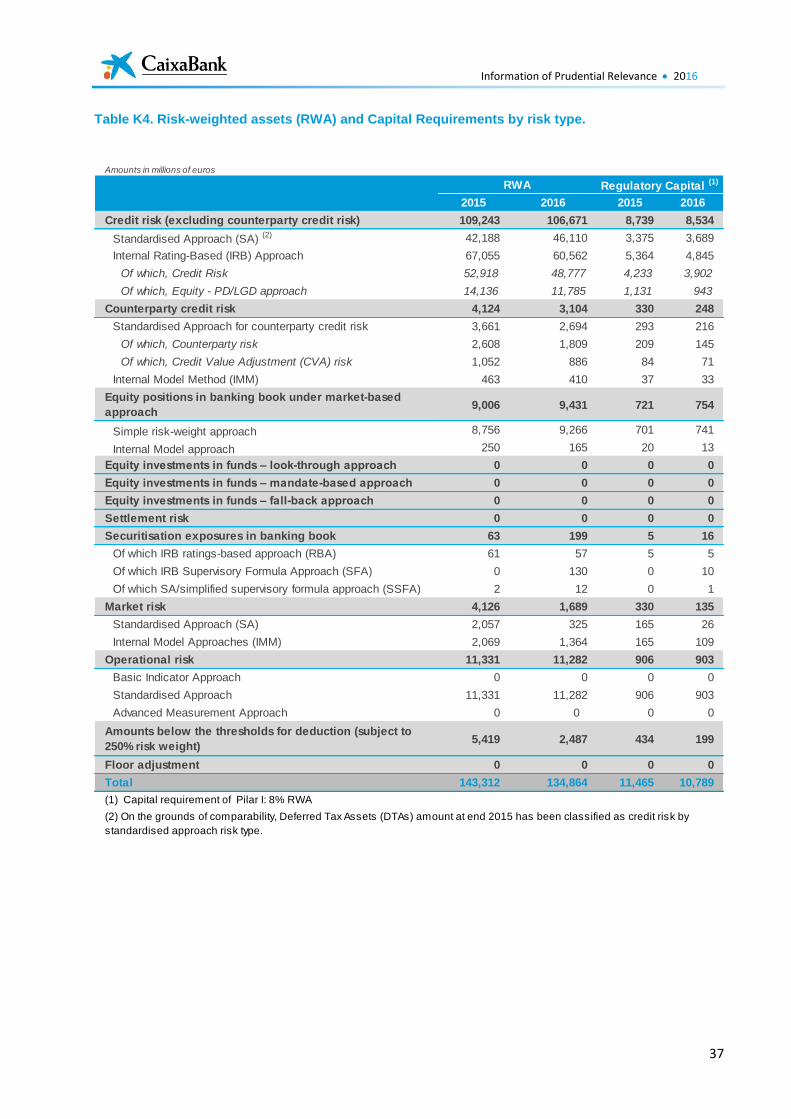
Information of Prudential Relevance 2016
37
Table K4. Risk-weighted assets (RWA) and Capital Requirements by risk type.
Amounts in millions of euros
2015 2016 2015 2016
Credit risk (excluding counterparty credit risk) 109,243 106,671 8,739 8,534
Standardised Approach (SA) (2) 42,188 46,110 3,375 3,689
Internal Rating-Based (IRB) Approach 67,055 60,562 5,364 4,845
Of which, Credit Risk 52,918 48,777 4,233 3,902
Of which, Equity - PD/LGD approach 14,136 11,785 1,131 943
Counterparty credit risk 4,124 3,104 330 248
Standardised Approach for counterparty credit risk 3,661 2,694 293 216
Of which, Counterparty risk 2,608 1,809 209 145
Of which, Credit Value Adjustment (CVA) risk 1,052 886 84 71
Internal Model Method (IMM) 463 410 37 33
Equity positions in banking book under market-based
approach9,006 9,431 721 754
Simple risk-weight approach 8,756 9,266 701 741
Internal Model approach 250 165 20 13
Equity investments in funds – look-through approach 0 0 0 0
Equity investments in funds – mandate-based approach 0 0 0 0
Equity investments in funds – fall-back approach 0 0 0 0
Settlement risk 0 0 0 0
Securitisation exposures in banking book 63 199 5 16
Of which IRB ratings-based approach (RBA) 61 57 5 5
Of which IRB Supervisory Formula Approach (SFA) 0 130 0 10
Of which SA/simplified supervisory formula approach (SSFA) 2 12 0 1
Market risk 4,126 1,689 330 135
Standardised Approach (SA) 2,057 325 165 26
Internal Model Approaches (IMM) 2,069 1,364 165 109
Operational risk 11,331 11,282 906 903
Basic Indicator Approach 0 0 0 0
Standardised Approach 11,331 11,282 906 903
Advanced Measurement Approach 0 0 0 0
Amounts below the thresholds for deduction (subject to
250% risk weight)5,419 2,487 434 199
Floor adjustment 0 0 0 0
Total 143,312 134,864 11,465 10,789
(1) Capital requirement of Pilar I: 8% RWA
RWA Regulatory Capital (1)
(2) On the grounds of comparability, Deferred Tax Assets (DTAs) amount at end 2015 has been classified as credit risk by
standardised approach risk type.
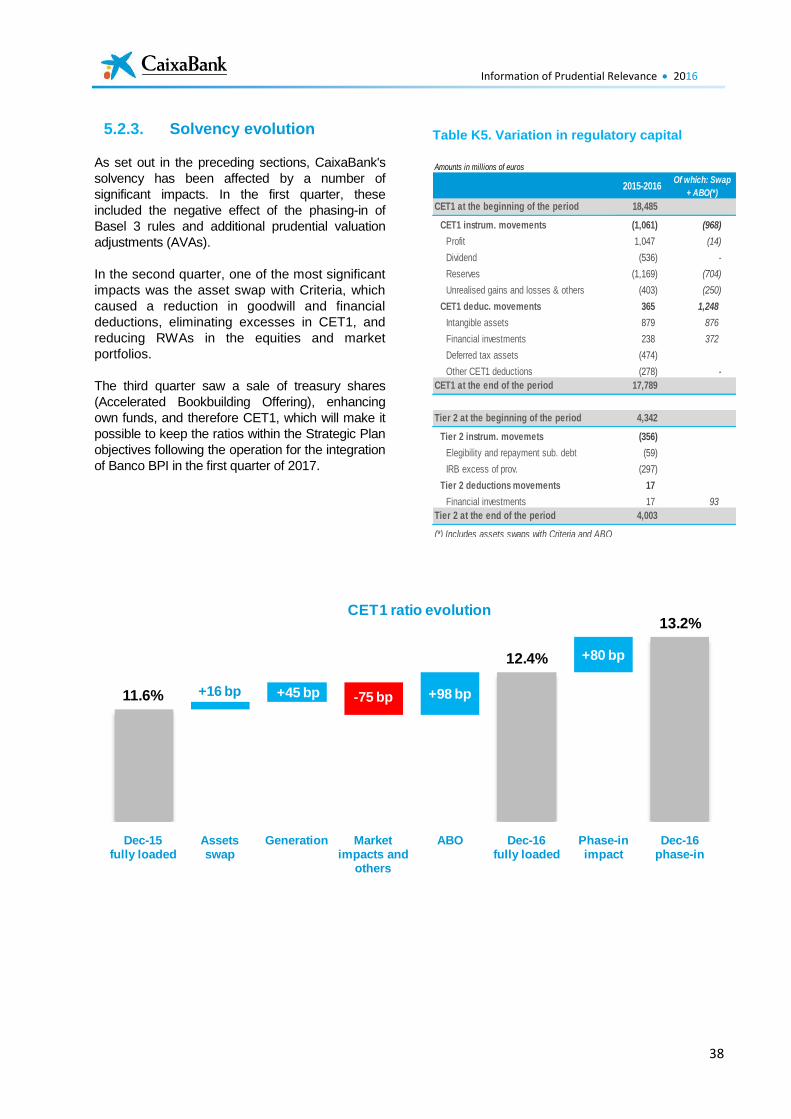
Information of Prudential Relevance 2016
38
5.2.3. Solvency evolution
As set out in the preceding sections, CaixaBank's
solvency has been affected by a number of
significant impacts. In the first quarter, these
included the negative effect of the phasing-in of
Basel 3 rules and additional prudential valuation
adjustments (AVAs).
In the second quarter, one of the most significant
impacts was the asset swap with Criteria, which
caused a reduction in goodwill and financial
deductions, eliminating excesses in CET1, and
reducing RWAs in the equities and market
portfolios.
The third quarter saw a sale of treasury shares
(Accelerated Bookbuilding Offering), enhancing
own funds, and therefore CET1, which will make it
possible to keep the ratios within the Strategic Plan
objectives following the operation for the integration
of Banco BPI in the first quarter of 2017.
Table K5. Variation in regulatory capital
Amounts in millions of euros
2015-2016Of which: Swap
+ ABO(*)
CET1 at the beginning of the period 18,485
CET1 instrum. movements (1,061) (968)
Profit 1,047 (14)
Dividend (536) -
Reserves (1,169) (704)
Unrealised gains and losses & others (403) (250)
CET1 deduc. movements 365 1,248
Intangible assets 879 876
Financial investments 238 372
Deferred tax assets (474)
Other CET1 deductions (278) -
CET1 at the end of the period 17,789
Tier 2 at the beginning of the period 4,342
Tier 2 instrum. movemets (356)
Elegibility and repayment sub. debt (59)
IRB excess of prov. (297)
Tier 2 deductions movements 17
Financial investments 17 93
Tier 2 at the end of the period 4,003
(*) Includes assets swaps with Criteria and ABO
+16 bp +45 bp +98 bp
+80 bp
-75 bp11.6%
12.4%
13.2%
Dec-15fully loaded
Assetsswap
Generation Market impacts and
others
ABO Dec-16fully loaded
Phase-in impact
Dec-16phase-in
CET1 ratio evolution
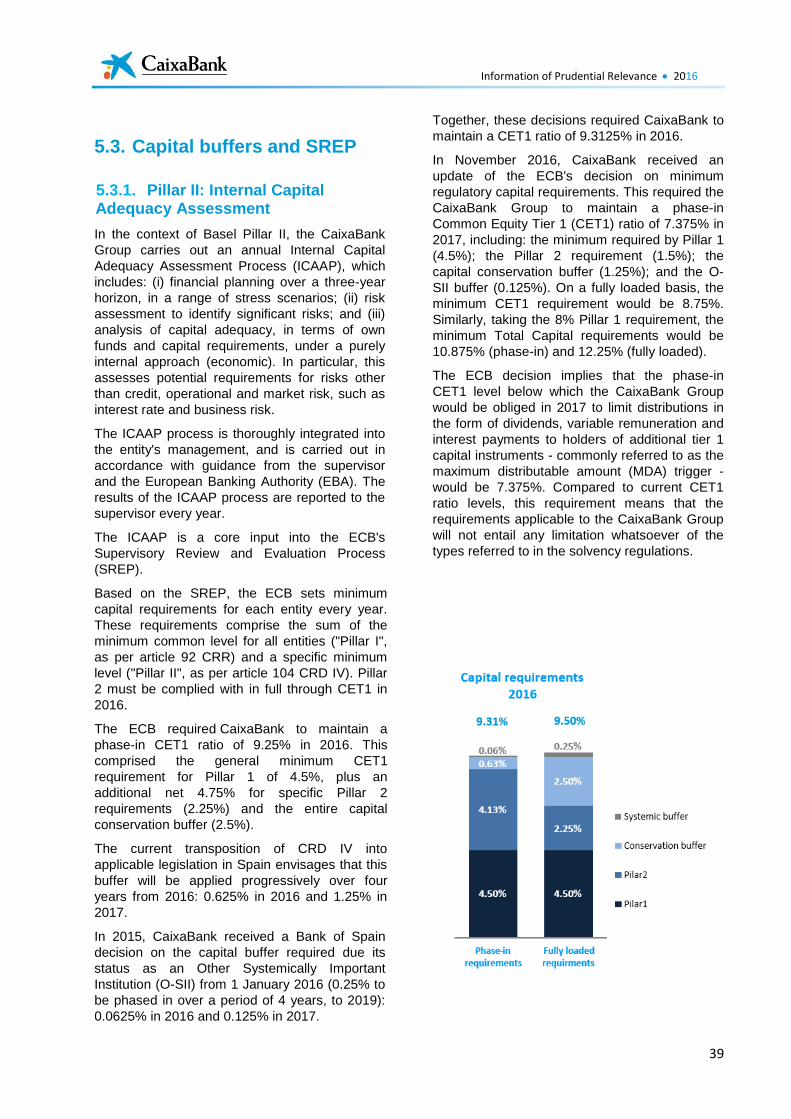
Information of Prudential Relevance 2016
39
5.3. Capital buffers and SREP
5.3.1. Pillar II: Internal Capital Adequacy Assessment
In the context of Basel Pillar II, the CaixaBank
Group carries out an annual Internal Capital
Adequacy Assessment Process (ICAAP), which
includes: (i) financial planning over a three-year
horizon, in a range of stress scenarios; (ii) risk
assessment to identify significant risks; and (iii)
analysis of capital adequacy, in terms of own
funds and capital requirements, under a purely
internal approach (economic). In particular, this
assesses potential requirements for risks other
than credit, operational and market risk, such as
interest rate and business risk.
The ICAAP process is thoroughly integrated into
the entity's management, and is carried out in
accordance with guidance from the supervisor
and the European Banking Authority (EBA). The
results of the ICAAP process are reported to the
supervisor every year.
The ICAAP is a core input into the ECB's
Supervisory Review and Evaluation Process
(SREP).
Based on the SREP, the ECB sets minimum
capital requirements for each entity every year.
These requirements comprise the sum of the
minimum common level for all entities ("Pillar I",
as per article 92 CRR) and a specific minimum
level ("Pillar II", as per article 104 CRD IV). Pillar
2 must be complied with in full through CET1 in
2016.
The ECB required CaixaBank to maintain a
phase-in CET1 ratio of 9.25% in 2016. This
comprised the general minimum CET1
requirement for Pillar 1 of 4.5%, plus an
additional net 4.75% for specific Pillar 2
requirements (2.25%) and the entire capital
conservation buffer (2.5%).
The current transposition of CRD IV into
applicable legislation in Spain envisages that this
buffer will be applied progressively over four
years from 2016: 0.625% in 2016 and 1.25% in
2017.
In 2015, CaixaBank received a Bank of Spain
decision on the capital buffer required due its
status as an Other Systemically Important
Institution (O-SII) from 1 January 2016 (0.25% to
be phased in over a period of 4 years, to 2019):
0.0625% in 2016 and 0.125% in 2017.
Together, these decisions required CaixaBank to
maintain a CET1 ratio of 9.3125% in 2016.
In November 2016, CaixaBank received an
update of the ECB's decision on minimum
regulatory capital requirements. This required the
CaixaBank Group to maintain a phase-in
Common Equity Tier 1 (CET1) ratio of 7.375% in
2017, including: the minimum required by Pillar 1
(4.5%); the Pillar 2 requirement (1.5%); the
capital conservation buffer (1.25%); and the O-
SII buffer (0.125%). On a fully loaded basis, the
minimum CET1 requirement would be 8.75%.
Similarly, taking the 8% Pillar 1 requirement, the
minimum Total Capital requirements would be
10.875% (phase-in) and 12.25% (fully loaded).
The ECB decision implies that the phase-in
CET1 level below which the CaixaBank Group
would be obliged in 2017 to limit distributions in
the form of dividends, variable remuneration and
interest payments to holders of additional tier 1
capital instruments - commonly referred to as the
maximum distributable amount (MDA) trigger -
would be 7.375%. Compared to current CET1
ratio levels, this requirement means that the
requirements applicable to the CaixaBank Group
will not entail any limitation whatsoever of the
types referred to in the solvency regulations.
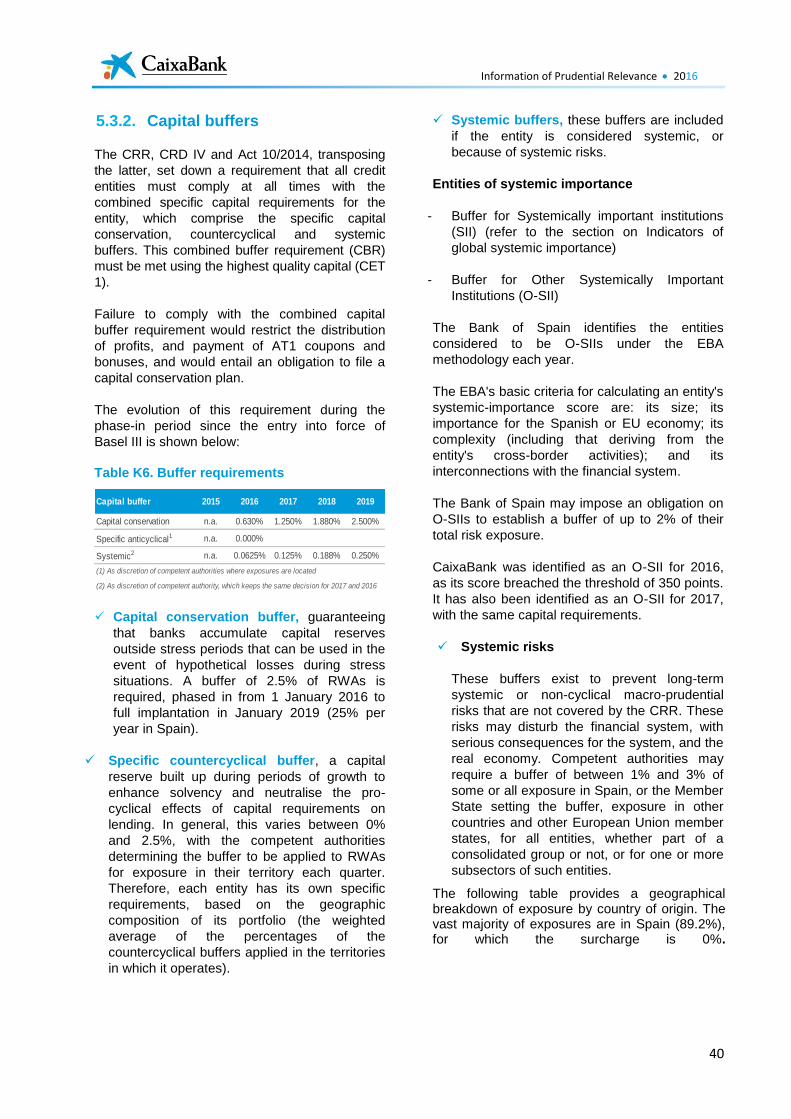
Information of Prudential Relevance 2016
40
5.3.2. Capital buffers
The CRR, CRD IV and Act 10/2014, transposing
the latter, set down a requirement that all credit
entities must comply at all times with the
combined specific capital requirements for the
entity, which comprise the specific capital
conservation, countercyclical and systemic
buffers. This combined buffer requirement (CBR)
must be met using the highest quality capital (CET
1).
Failure to comply with the combined capital
buffer requirement would restrict the distribution
of profits, and payment of AT1 coupons and
bonuses, and would entail an obligation to file a
capital conservation plan.
The evolution of this requirement during the
phase-in period since the entry into force of
Basel III is shown below:
Table K6. Buffer requirements
Capital conservation buffer, guaranteeing
that banks accumulate capital reserves
outside stress periods that can be used in the
event of hypothetical losses during stress
situations. A buffer of 2.5% of RWAs is
required, phased in from 1 January 2016 to
full implantation in January 2019 (25% per
year in Spain).
Specific countercyclical buffer, a capital
reserve built up during periods of growth to
enhance solvency and neutralise the pro-
cyclical effects of capital requirements on
lending. In general, this varies between 0%
and 2.5%, with the competent authorities
determining the buffer to be applied to RWAs
for exposure in their territory each quarter.
Therefore, each entity has its own specific
requirements, based on the geographic
composition of its portfolio (the weighted
average of the percentages of the
countercyclical buffers applied in the territories
in which it operates).
Systemic buffers, these buffers are included
if the entity is considered systemic, or
because of systemic risks.
Entities of systemic importance
- Buffer for Systemically important institutions
(SII) (refer to the section on Indicators of
global systemic importance)
- Buffer for Other Systemically Important
Institutions (O-SII)
The Bank of Spain identifies the entities
considered to be O-SIIs under the EBA
methodology each year.
The EBA's basic criteria for calculating an entity's
systemic-importance score are: its size; its
importance for the Spanish or EU economy; its
complexity (including that deriving from the
entity's cross-border activities); and its
interconnections with the financial system.
The Bank of Spain may impose an obligation on
O-SIIs to establish a buffer of up to 2% of their
total risk exposure.
CaixaBank was identified as an O-SII for 2016,
as its score breached the threshold of 350 points.
It has also been identified as an O-SII for 2017,
with the same capital requirements.
Systemic risks
These buffers exist to prevent long-term
systemic or non-cyclical macro-prudential
risks that are not covered by the CRR. These
risks may disturb the financial system, with
serious consequences for the system, and the
real economy. Competent authorities may
require a buffer of between 1% and 3% of
some or all exposure in Spain, or the Member
State setting the buffer, exposure in other
countries and other European Union member
states, for all entities, whether part of a
consolidated group or not, or for one or more
subsectors of such entities.
The following table provides a geographical breakdown of exposure by country of origin. The vast majority of exposures are in Spain (89.2%), for which the surcharge is 0%.
Capital buffer 2015 2016 2017 2018 2019
Capital conservation n.a. 0.630% 1.250% 1.880% 2.500%
Specific anticyclical1 n.a. 0.000%
Systemic2 n.a. 0.0625% 0.125% 0.188% 0.250%
(2) As discretion of competent authority, which keeps the same decision for 2017 and 2016
(1) As discretion of competent authorities where exposures are located
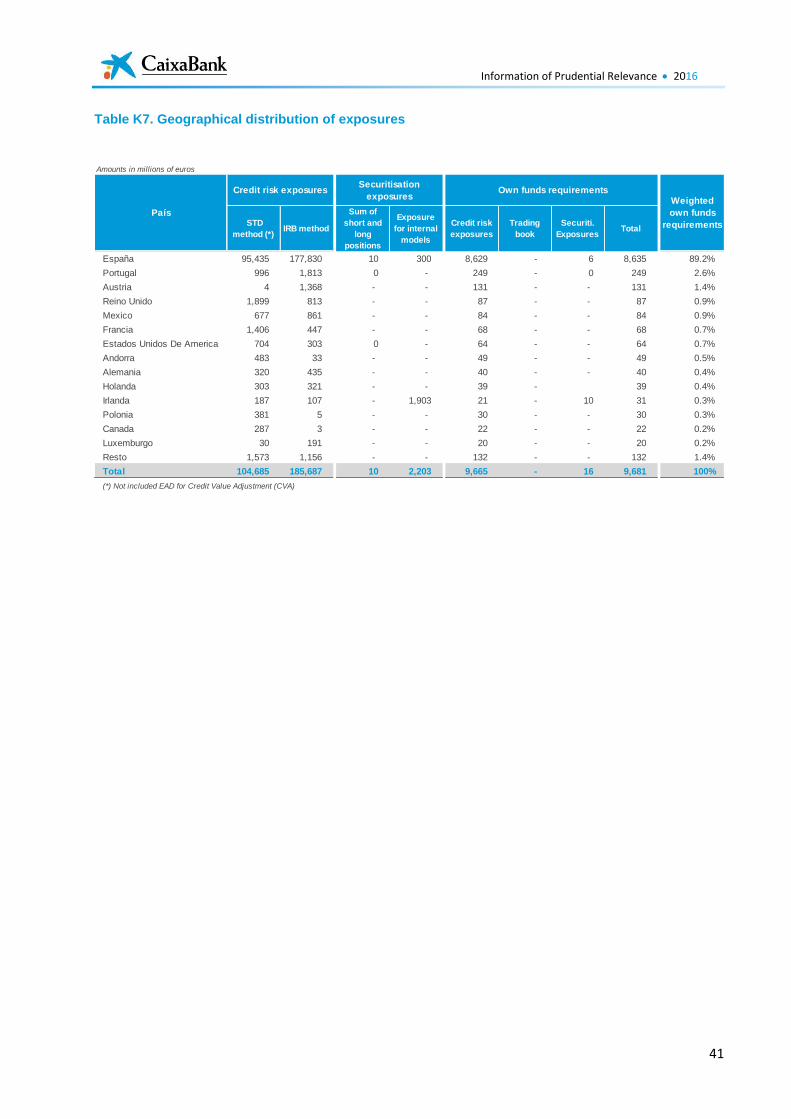
Information of Prudential Relevance 2016
41
Table K7. Geographical distribution of exposures
Amounts in millions of euros
STD
method (*)IRB method
Sum of
short and
long
positions
Exposure
for internal
models
Credit risk
exposures
Trading
book
Securiti.
ExposuresTotal
España 95,435 177,830 10 300 8,629 - 6 8,635 89.2%
Portugal 996 1,813 0 - 249 - 0 249 2.6%
Austria 4 1,368 - - 131 - - 131 1.4%
Reino Unido 1,899 813 - - 87 - - 87 0.9%
Mexico 677 861 - - 84 - - 84 0.9%
Francia 1,406 447 - - 68 - - 68 0.7%
Estados Unidos De America 704 303 0 - 64 - - 64 0.7%
Andorra 483 33 - - 49 - - 49 0.5%
Alemania 320 435 - - 40 - - 40 0.4%
Holanda 303 321 - - 39 - 39 0.4%
Irlanda 187 107 - 1,903 21 - 10 31 0.3%
Polonia 381 5 - - 30 - - 30 0.3%
Canada 287 3 - - 22 - - 22 0.2%
Luxemburgo 30 191 - - 20 - - 20 0.2%
Resto 1,573 1,156 - - 132 - - 132 1.4%
Total 104,685 185,687 10 2,203 9,665 - 16 9,681 100%
(*) Not included EAD for Credit Value Adjustment (CVA)
País
Credit risk exposuresSecuritisation
exposures Own funds requirements
Weighted
own funds
requirements
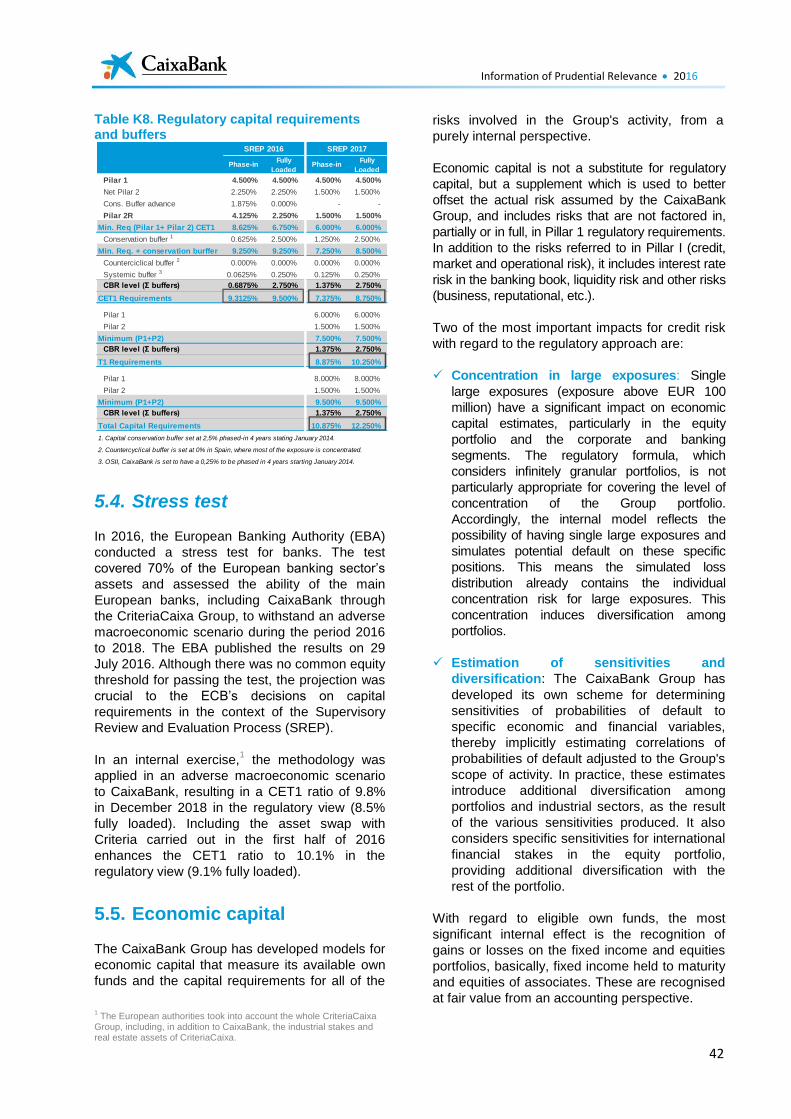
Information of Prudential Relevance 2016
42
Table K8. Regulatory capital requirements and buffers
5.4. Stress test
In 2016, the European Banking Authority (EBA)
conducted a stress test for banks. The test
covered 70% of the European banking sector’s
assets and assessed the ability of the main
European banks, including CaixaBank through
the CriteriaCaixa Group, to withstand an adverse
macroeconomic scenario during the period 2016
to 2018. The EBA published the results on 29
July 2016. Although there was no common equity
threshold for passing the test, the projection was
crucial to the ECB’s decisions on capital
requirements in the context of the Supervisory
Review and Evaluation Process (SREP).
In an internal exercise,1 the methodology was
applied in an adverse macroeconomic scenario
to CaixaBank, resulting in a CET1 ratio of 9.8%
in December 2018 in the regulatory view (8.5%
fully loaded). Including the asset swap with
Criteria carried out in the first half of 2016
enhances the CET1 ratio to 10.1% in the
regulatory view (9.1% fully loaded).
5.5. Economic capital
The CaixaBank Group has developed models for
economic capital that measure its available own
funds and the capital requirements for all of the
1 The European authorities took into account the whole CriteriaCaixa
Group, including, in addition to CaixaBank, the industrial stakes and real estate assets of CriteriaCaixa.
risks involved in the Group's activity, from a
purely internal perspective.
Economic capital is not a substitute for regulatory
capital, but a supplement which is used to better
offset the actual risk assumed by the CaixaBank
Group, and includes risks that are not factored in,
partially or in full, in Pillar 1 regulatory requirements.
In addition to the risks referred to in Pillar I (credit,
market and operational risk), it includes interest rate
risk in the banking book, liquidity risk and other risks
(business, reputational, etc.).
Two of the most important impacts for credit risk
with regard to the regulatory approach are:
Concentration in large exposures: Single
large exposures (exposure above EUR 100
million) have a significant impact on economic
capital estimates, particularly in the equity
portfolio and the corporate and banking
segments. The regulatory formula, which
considers infinitely granular portfolios, is not
particularly appropriate for covering the level of
concentration of the Group portfolio.
Accordingly, the internal model reflects the
possibility of having single large exposures and
simulates potential default on these specific
positions. This means the simulated loss
distribution already contains the individual
concentration risk for large exposures. This
concentration induces diversification among
portfolios.
Estimation of sensitivities and
diversification: The CaixaBank Group has
developed its own scheme for determining
sensitivities of probabilities of default to
specific economic and financial variables,
thereby implicitly estimating correlations of
probabilities of default adjusted to the Group's
scope of activity. In practice, these estimates
introduce additional diversification among
portfolios and industrial sectors, as the result
of the various sensitivities produced. It also
considers specific sensitivities for international
financial stakes in the equity portfolio,
providing additional diversification with the
rest of the portfolio.
With regard to eligible own funds, the most
significant internal effect is the recognition of
gains or losses on the fixed income and equities
portfolios, basically, fixed income held to maturity
and equities of associates. These are recognised
at fair value from an accounting perspective.
Phase-inFully
LoadedPhase-in
Fully
Loaded
Pilar 1 4.500% 4.500% 4.500% 4.500%
Net Pilar 2 2.250% 2.250% 1.500% 1.500%
Cons. Buffer advance 1.875% 0.000% - -
Pilar 2R 4.125% 2.250% 1.500% 1.500%
Min. Req (Pilar 1+ Pilar 2) CET1 8.625% 6.750% 6.000% 6.000%
Conservation buffer 1 0.625% 2.500% 1.250% 2.500%
Min. Req. + conservation burffer 9.250% 9.250% 7.250% 8.500%
Counterciclical buffer 2 0.000% 0.000% 0.000% 0.000%
Systemic buffer 3 0.0625% 0.250% 0.125% 0.250%
CBR level (Σ buffers) 0.6875% 2.750% 1.375% 2.750%
CET1 Requirements 9.3125% 9.500% 7.375% 8.750%
Pilar 1 6.00% 6.00% 6.000% 6.000%
Pilar 2 1.500% 1.500%
Minimum (P1+P2) 6.00% 6.00% 7.500% 7.500%
CBR level (Σ buffers) 0.69% 2.75% 1.375% 2.750%
T1 Requirements 6.69% 8.75% 8.875% 10.250%
Pilar 1 8.00% 8.00% 8.000% 8.000%
Pilar 2 1.500% 1.500%
Minimum (P1+P2) 8.00% 8.00% 9.500% 9.500%
CBR level (Σ buffers) 0.69% 2.75% 1.375% 2.750%
Total Capital Requirements 8.69% 10.75% 10.875% 12.250%
1. Capital conservation buffer set at 2,5% phased-in 4 years stating January 2014.
2. Countercyclical buffer is set at 0% in Spain, where most of the exposure is concentrated.
3. OSII, CaixaBank is set to have a 0,25% to be phased in 4 years starting January 2014.
SREP 2016 SREP 2017
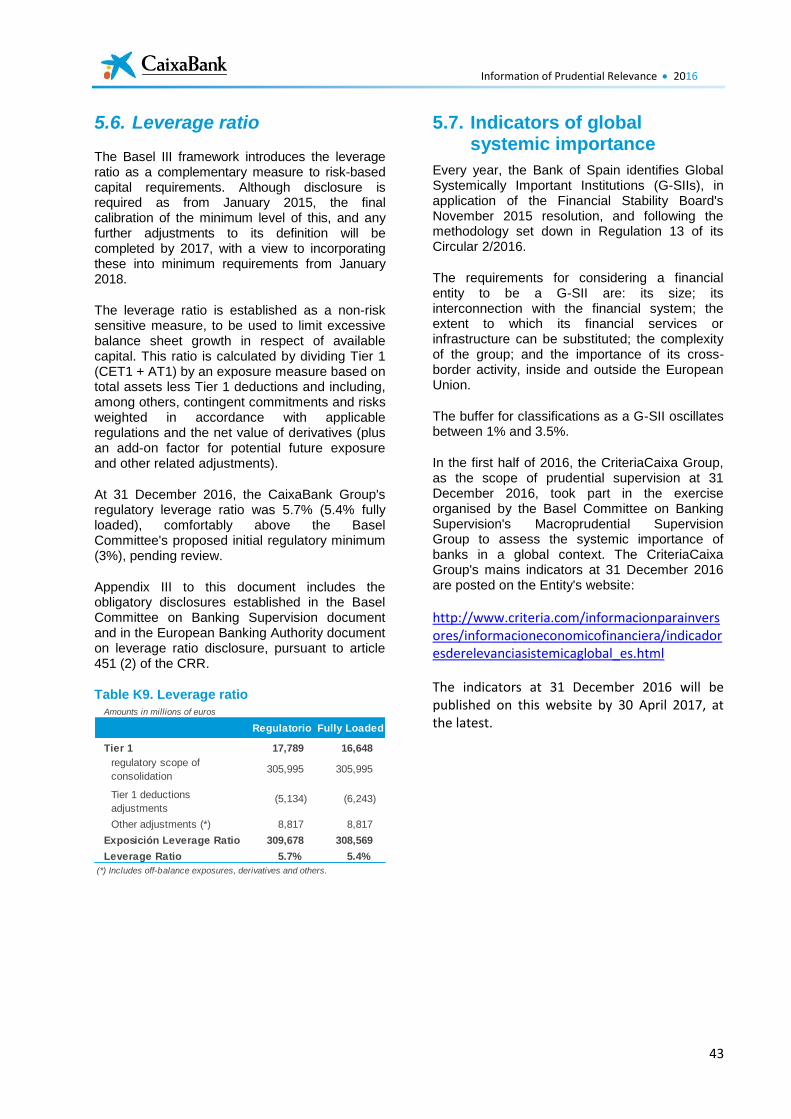
Information of Prudential Relevance 2016
43
5.6. Leverage ratio
The Basel III framework introduces the leverage ratio as a complementary measure to risk-based capital requirements. Although disclosure is required as from January 2015, the final calibration of the minimum level of this, and any further adjustments to its definition will be completed by 2017, with a view to incorporating these into minimum requirements from January 2018.
The leverage ratio is established as a non-risk sensitive measure, to be used to limit excessive balance sheet growth in respect of available capital. This ratio is calculated by dividing Tier 1 (CET1 + AT1) by an exposure measure based on total assets less Tier 1 deductions and including, among others, contingent commitments and risks weighted in accordance with applicable regulations and the net value of derivatives (plus an add-on factor for potential future exposure and other related adjustments).
At 31 December 2016, the CaixaBank Group's regulatory leverage ratio was 5.7% (5.4% fully loaded), comfortably above the Basel Committee's proposed initial regulatory minimum (3%), pending review.
Appendix III to this document includes the obligatory disclosures established in the Basel Committee on Banking Supervision document and in the European Banking Authority document on leverage ratio disclosure, pursuant to article 451 (2) of the CRR.
Table K9. Leverage ratio
5.7. Indicators of global systemic importance
Every year, the Bank of Spain identifies Global Systemically Important Institutions (G-SIIs), in application of the Financial Stability Board's November 2015 resolution, and following the methodology set down in Regulation 13 of its Circular 2/2016.
The requirements for considering a financial entity to be a G-SII are: its size; its interconnection with the financial system; the extent to which its financial services or infrastructure can be substituted; the complexity of the group; and the importance of its cross-border activity, inside and outside the European Union.
The buffer for classifications as a G-SII oscillates between 1% and 3.5%.
In the first half of 2016, the CriteriaCaixa Group, as the scope of prudential supervision at 31 December 2016, took part in the exercise organised by the Basel Committee on Banking Supervision's Macroprudential Supervision Group to assess the systemic importance of banks in a global context. The CriteriaCaixa Group's mains indicators at 31 December 2016 are posted on the Entity's website:
http://www.criteria.com/informacionparainversores/informacioneconomicofinanciera/indicadoresderelevanciasistemicaglobal_es.html
The indicators at 31 December 2016 will be published on this website by 30 April 2017, at the latest.
Amounts in millions of euros
Regulatorio Fully Loaded
Tier 1 17,789 16,648Total assets under
regulatory scope of
consolidation305,995 305,995
Tier 1 deductions
adjustments(5,134) (6,243)
Other adjustments (*) 8,817 8,817
Exposición Leverage Ratio 309,678 308,569
Leverage Ratio 5.7% 5.4%
(*) Includes off-balance exposures, derivatives and others.
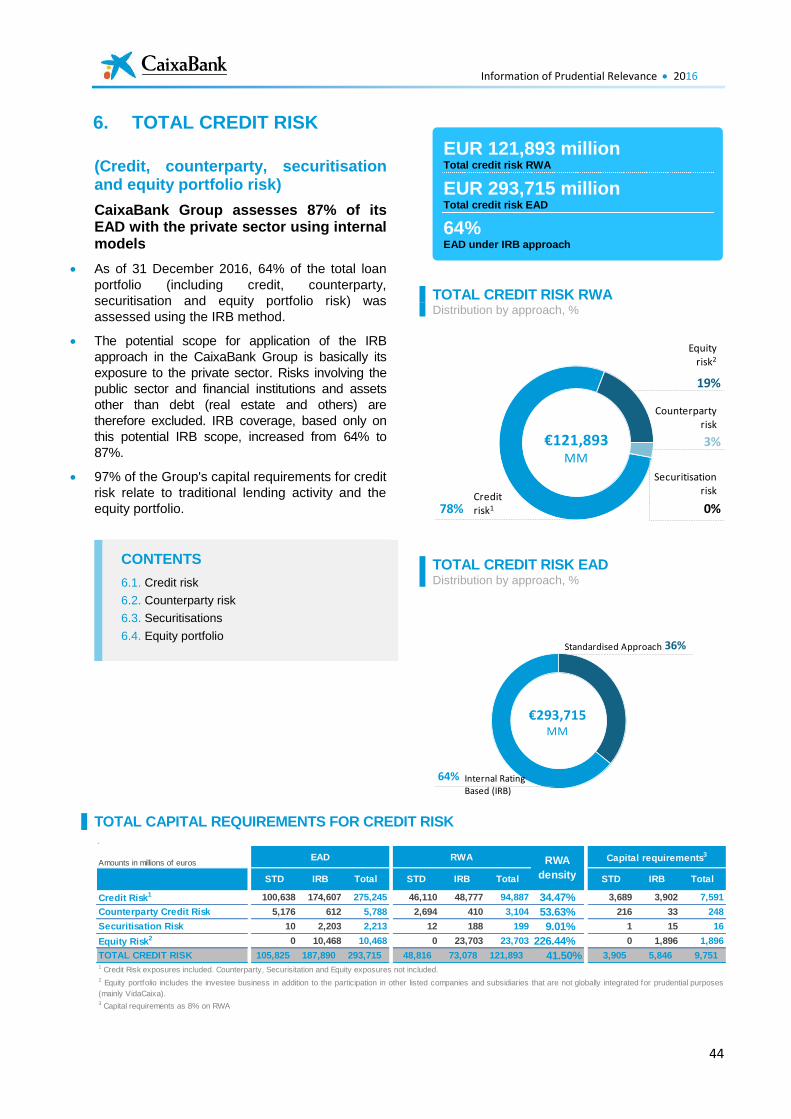
Information of Prudential Relevance 2016
44
6. TOTAL CREDIT RISK
(Credit, counterparty, securitisation and equity portfolio risk)
CaixaBank Group assesses 87% of its EAD with the private sector using internal models
As of 31 December 2016, 64% of the total loan
portfolio (including credit, counterparty,
securitisation and equity portfolio risk) was
assessed using the IRB method.
The potential scope for application of the IRB
approach in the CaixaBank Group is basically its
exposure to the private sector. Risks involving the
public sector and financial institutions and assets
other than debt (real estate and others) are
therefore excluded. IRB coverage, based only on
this potential IRB scope, increased from 64% to
87%.
97% of the Group's capital requirements for credit
risk relate to traditional lending activity and the
equity portfolio.
TOTAL CREDIT RISK RWA Distribution by approach, %
TOTAL CREDIT RISK EAD Distribution by approach, %
TOTAL CAPITAL REQUIREMENTS FOR CREDIT RISK
.
78%
19%
3%
0%
€121,893MM
Equityrisk2
Credit risk1
Counterpartyrisk
Securitisationrisk
36%
64%
€293,715MM
Internal RatingBased (IRB)
Standardised Approach
Amounts in millions of euros
STD IRB Total STD IRB Total STD IRB Total
Credit Risk1 100,638 174,607 275,245 46,110 48,777 94,887 34.47% 3,689 3,902 7,591
Counterparty Credit Risk 5,176 612 5,788 2,694 410 3,104 53.63% 216 33 248
Securitisation Risk 10 2,203 2,213 12 188 199 9.01% 1 15 16
Equity Risk2 0 10,468 10,468 0 23,703 23,703 226.44% 0 1,896 1,896
TOTAL CREDIT RISK 105,825 187,890 293,715 48,816 73,078 121,893 41.50% 3,905 5,846 9,751
3 Capital requirements as 8% on RWA
EAD RWA Capital requirements3
1 Credit Risk exposures included. Counterparty, Securisitation and Equity exposures not included.
2 Equity portfolio includes the investee business in addition to the participation in other listed companies and subsidiaries that are not globally integrated for prudential purposes
(mainly VidaCaixa).
RWA
density
EUR 121,893 million Total credit risk RWA
EUR 293,715 million Total credit risk EAD
64% EAD under IRB approach
CONTENTS
6.1. Credit risk
6.2. Counterparty risk
6.3. Securitisations
6.4. Equity portfolio
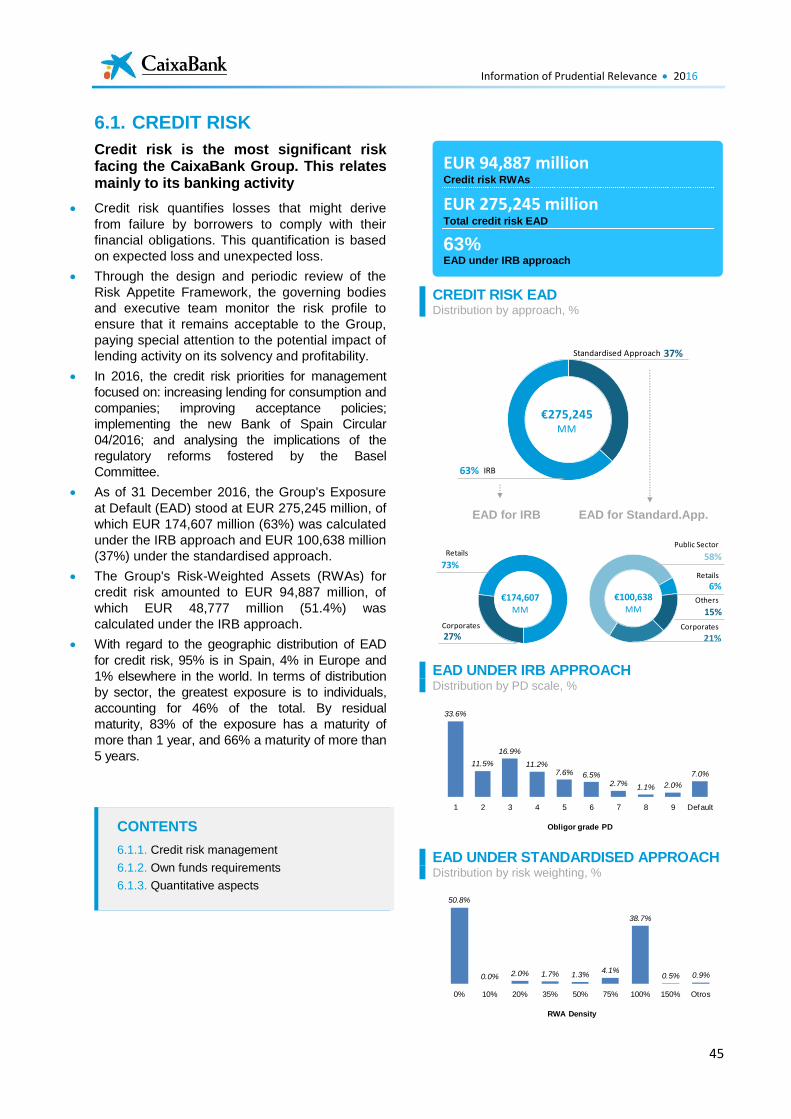
Information of Prudential Relevance 2016
45
6.1. CREDIT RISK
Credit risk is the most significant risk facing the CaixaBank Group. This relates mainly to its banking activity
Credit risk quantifies losses that might derive
from failure by borrowers to comply with their
financial obligations. This quantification is based
on expected loss and unexpected loss.
Through the design and periodic review of the
Risk Appetite Framework, the governing bodies
and executive team monitor the risk profile to
ensure that it remains acceptable to the Group,
paying special attention to the potential impact of
lending activity on its solvency and profitability.
In 2016, the credit risk priorities for management
focused on: increasing lending for consumption and
companies; improving acceptance policies;
implementing the new Bank of Spain Circular
04/2016; and analysing the implications of the
regulatory reforms fostered by the Basel
Committee.
As of 31 December 2016, the Group's Exposure
at Default (EAD) stood at EUR 275,245 million, of
which EUR 174,607 million (63%) was calculated
under the IRB approach and EUR 100,638 million
(37%) under the standardised approach.
The Group's Risk-Weighted Assets (RWAs) for
credit risk amounted to EUR 94,887 million, of
which EUR 48,777 million (51.4%) was
calculated under the IRB approach.
With regard to the geographic distribution of EAD
for credit risk, 95% is in Spain, 4% in Europe and
1% elsewhere in the world. In terms of distribution
by sector, the greatest exposure is to individuals,
accounting for 46% of the total. By residual
maturity, 83% of the exposure has a maturity of
more than 1 year, and 66% a maturity of more than
5 years.
CREDIT RISK EAD Distribution by approach, %
EAD UNDER IRB APPROACH Distribution by PD scale, %
EAD UNDER STANDARDISED APPROACH Distribution by risk weighting, %
37%
63%
€275,245MM
IRB
Standardised Approach
73%
27%
€174,607MM
Corporates
Retails 58%
6%
15%
21%
Retails
Others
Public Sector
Corporates
€100,638MM
33.6%
11.5%
16.9%
11.2%7.6% 6.5%
2.7% 1.1% 2.0%
7.0%
1 2 3 4 5 6 7 8 9 Default
Obligor grade PD
50.8%
0.0% 2.0% 1.7% 1.3%4.1%
38.7%
0.5% 0.9%
0% 10% 20% 35% 50% 75% 100% 150% Otros
RWA Density
EAD for IRB EAD for Standard.App.
EUR 94,887 million Credit risk RWAs
EUR 275,245 million Total credit risk EAD
63% EAD under IRB approach
CONTENTS
6.1.1. Credit risk management
6.1.2. Own funds requirements
6.1.3. Quantitative aspects
Information of Prudential Relevance 2016
46
6.1.1. Credit risk management
Description and general policy
Approval of lending transactions at CaixaBank follows the basic criterion of evaluation of the borrower’s repayment capacity. It is not the Entity's policy to approve transactions merely because guarantees exist. If repayment capacity is deemed to exist, it then becomes important for the Entity to obtain additional guarantees, particularly in respect of long-term transactions, and to fix a price in accordance with the above two requirements.
Regarding its ordinary business, CaixaBank gears its lending activity towards meeting the finance needs of households and businesses. Credit risk management is characterised by a prudent approvals policy and appropriate coverage. Most loans are to private borrowers and consist primarily of mortgages to first-time homebuyers. Therefore, the loan structure has a significantly low level of risk given the high degree of diversification and fragmentation. In accordance with the Strategic Plan, the CaixaBank Group is committed to retaining its leadership in retail lending and further strengthening its position in corporate lending. In terms of geographic distribution, business is mainly based in Spain.
To ensure appropriate protection of customers, natural persons and credit institutions, the current legal framework (Sustainable Economy Act 2/2011, of 4 March, and Ministerial Order EHA/2899/2011, of 28 October, on transparency and protection of customers of banking services) requires all institutions to establish policies, methods and procedures that ensure the correct study and granting of loans. The concept of a “responsible loan” establishes the need to adequately evaluate customer solvency and promote practices to ensure responsible lending.
Accordingly, CaixaBank has detailed policies, methods and procedures for studying and granting loans, or responsible lending, as required in Annex 6 of Circular 5/2012 of 27 June, of the Bank of Spain, addressed to credit institutions and payment service providers regarding transparency in banking services and responsible lending.
The document was approved by the Board of Directors in January 2015, in compliance with Bank of Spain Circulars 5/2012 and 3/2014, and establishes, inter alia, the following policies:
An appropriate relationship between income
and the expenses borne by consumers.
Documentary proof of the information
provided by the borrower and the borrower’s
solvency.
Pre-contractual information and information
protocols that are appropriate to the personal
circumstances and characteristics of each
customer and operation.
An appropriate independent assessment of
real estate collateral.
An Entity-wide policy of not granting foreign
currency loans to individuals.
The economic juncture calls for policies to
provide certain kinds of assistance to customers,
within a framework approved by the Entity's
management and ensuring that refinancing
processes are compliant with prevailing
standards. In this respect, CaixaBank has also
adhered to the Code of Good Practices for the
viable restructuring of mortgage debts on primary
residences included in Royal Decree-Law 6/2012,
of 9 March, on urgent measures to protect
mortgagors without funds, as amended by Law
1/2013, of 14 May, on measures to strengthen
the protection of mortgage borrowers, debt
restructuring and subsidised housing rentals, and
Royal Decree-Act 1/2015, of 27 February,
regarding second chance mechanisms and the
reduction in the financial burden, and other
measures of a social order.
In addition, bearing in mind the current economic-
social climate, CaixaBank has devised an
"Assistance Plan" for individuals with mortgages
on their main residence facing circumstantial
financial difficulties. This Plan is designed to
achieve three objectives:
Pro-actively prevent default.
Offer help to families that have long been
good customers of the Entity and who are at
risk of default due to the loss of work by one
of the mortgage holders, illness, a temporary
drop in income, or other circumstantial
factors.
Reduce the NPL ratio.
Structure and organisation of the credit risk management function
As discussed above, the main role of the
CaixaBank Global Risk Committee, composed of
Senior Management, is to analyse and set the
Information of Prudential Relevance 2016
47
general credit approval strategies and policies
across the network.
To strengthen relations between the Risks Area
and the governing bodies, the Global Risk
Committee reports directly to the Risks
Committee.
CaixaBank's Corporate Global Risk Management
Division is responsible for approval policies and
procedures, and also for drawing up and
monitoring credit risk models. This involves Risk
Models and Policies, which comprise:
Risk Policies and Infrastructure,
responsible for adopting the policies
applicable to new transactions: internal
powers, prices and profitability,
documentation for dossiers, mitigation of risk
through acceptance of guarantees and
collateral, and integration of measurement
tools in decision-making systems.
Credit Risk Models and Parameters,
responsible for the construction, maintenance
and integration into management of internal
rating-based (IRB) credit risk models, the
calculation of the main parameters (e.g. PD,
LGD), and the methodology, calculation and
analysis of trends in the economic capital
charge.
Global Risk Management Information: this
transversal unit is responsible for aggregating,
processing, validating and analysing internal
and external data (e.g. from regulators and
rating agencies), as well as the methodology,
calculation and analysis of trends in the
regulatory capital charge. This information is
reported to the Global Risk Committee and
the Risk Committee every month, and every
six months to the Board of Directors. Since
2014, it has also coordinated the design and
implementation of the Risk Appetite
Framework. This information is reported to the
Global Risk Committee every month, to the
Risk Committee every quarter, and to the
Board of Directors every six months.
Risk in Market Operations is responsible for
quantifying and monitoring the market risk
assumed by the Entity. It carries out day-to-
day monitoring of the risk and returns
resulting from the market risk positions taken
by the corresponding managers, as well as
the risk/return ratio. It also monitors
compliance with approved general risk
policies and the risk management model,
including monitoring of compliance with
quantitative limits and universes of securities,
and approved products and counterparties.
Credit Risk Monitoring and Recoveries,
responsible for monitoring borrowers and
inputting the results of this monitoring into the
approvals, arrears management and
recoveries systems.
Credit risk cycle
The full credit risk management cycle covers the
entire life of the transaction, from feasibility
studies and the approval of risks as per
established criteria, to monitoring solvency and
returns and, ultimately, to recovering non-
performing assets. Diligent management of each
of these stages is essential to successful
recovery.
Risk management. Measurement and information systems
CaixaBank has been using internal rating-based
(IRB) models since 1998; it uses the scorings and
ratings to measure the creditworthiness of
customers and transactions.
On 25 June 2008, the Bank of Spain authorised
CaixaBank to use IRB approaches to calculate
own funds requirements for credit risk.
Credit risk measures losses due to failure by
borrowers to meet their financial obligations
based on two concepts: expected loss and
unexpected loss.
Expected loss. Expected loss is the average
of possible losses calculated by multiplying
three factors: probability of default (PD),
exposure at default (EAD) and loss given
default (LGD).
Information of Prudential Relevance 2016
48
Unexpected loss. Potential unforeseen loss
caused by a possible variability in the
calculation of expected loss, which may occur
due to sudden changes in cycles, alterations
in risk factors, and the natural credit risk
correlation for the various debtors.
Unexpected losses have a low probability and
large amount, and should be absorbed by the
Entity's own funds. The calculation of
unexpected loss is also based on the
transaction's PD, EAD and LGD.
Credit risk parameters are estimated based on the Entity's historical default experience. CaixaBank has a set of tools and techniques for this in accordance with the specific needs of each type of risk: PD is estimated based on new defaults related to transaction ratings and scorings; LGD is estimated based on the present value of recoveries received net of direct and indirect costs associated with collection; and EAD is estimated based on observation of the use of credit limits in the months prior to the default.
CaixaBank has management tools in place to measure the PD for each borrower and transaction, covering virtually its entire lending portfolio. In segments not yet covered, it gathers relevant information for overall exposure with a view to creating future PD calculation tools.
In addition to regulatory use to determine the Entity's minimum own funds, the credit risk parameters (PD, LGD and EAD) are used in a number of management tools: e.g. the risk-adjusted return (RAR) calculation tool, the risk-adjusted bonus (RAB) system, pricing tools
1,
customer pre-qualification tools, monitoring tools and alert systems.
Admission and approval
Approval of lending transactions at CaixaBank is based on a decentralised organisation that allows branches to approve a high percentage of transactions. The system automatically assigns officers the tariff and risk levels delegated by Management as standard for their positions. In cases where an employee's approval authorisation is insufficient, the system requires approval from a higher level. Any transaction must be approved by at least two properly authorised employees.
There are two alternative systems for calculating the level of risk of a transaction:
1 See Note 3.3.3.2 “Admission and Approval” of the CaixaBank
Group's 2016 financial statements for more details.
1. Based on the accumulated expected loss of all the customer's transactions and those of its economic group. This system is used for applications where the principal borrower is a private company or real estate developer (in general, companies with annual revenue of up to EUR 200 million).
2. Based on the nominal amount and collateral of all risks posed by the customer or its economic group. This system is used for all other segments; e.g. natural persons, very large companies, public sector entities.
The process for admitting and approving new
loans is based on the analysis of four key issues:
the parties involved, the purpose of the loan, the
ability to repay and the characteristics of the
transaction.
One major component of the assessment of a
borrower's capacity to repay a debt is the PD (risk
parameter defined within the management
framework proposed by Basel Committee on
Banking Supervision) assigned by the scoring
and rating systems. These tools were developed
in due consideration of the Entity's past
experience of default, and include measures to
adjust the results to the economic situation.
Risk concentration
According to the principles published by the
Committee of European Banking Supervisors
(CEBS) in September 2010, shortly before it was
dissolved and its functions assumed by the EBA,
risk concentration is one of the main causes of
significant losses and has the potential to ruin a
financial institution's solvency, as was seen in
2008 and 2009.
Moreover, in line with the CEBS Guideline 7,
CaixaBank has developed methodologies,
processes and tools to systematically identify its
overall exposure with regard to a particular
customer, product, industry or geographic
location. Wherever it is considered necessary,
limits on relative exposures to each of these have
been defined under the Risk Appetite Framework,
as well as by concentration by economic sector,
differentiating between private business activities
and public sector financing. In keeping with the
internal communication policy of the Risk
Appetite Framework, trends in these indicators
are reported (at least) monthly to the Global Risk
Committee, quarterly to the Risks Committee and
every six months to the Board of Directors.
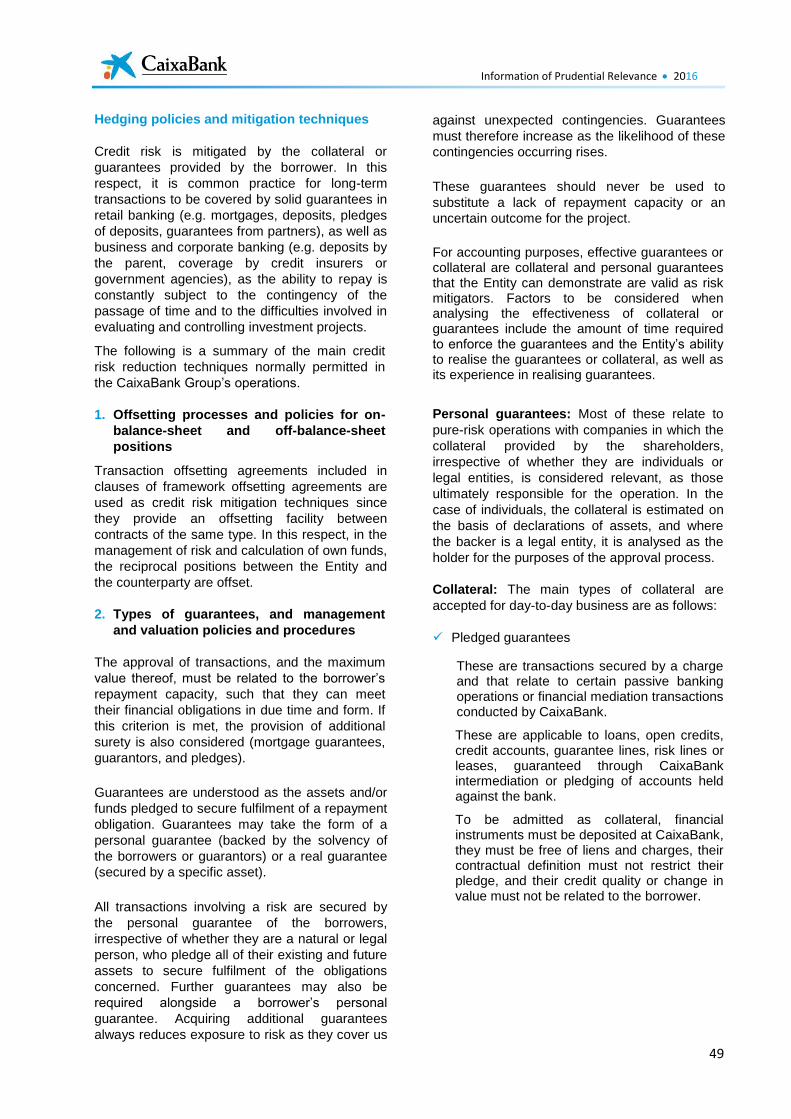
Information of Prudential Relevance 2016
49
Hedging policies and mitigation techniques
Credit risk is mitigated by the collateral or
guarantees provided by the borrower. In this
respect, it is common practice for long-term
transactions to be covered by solid guarantees in
retail banking (e.g. mortgages, deposits, pledges
of deposits, guarantees from partners), as well as
business and corporate banking (e.g. deposits by
the parent, coverage by credit insurers or
government agencies), as the ability to repay is
constantly subject to the contingency of the
passage of time and to the difficulties involved in
evaluating and controlling investment projects.
The following is a summary of the main credit
risk reduction techniques normally permitted in
the CaixaBank Group’s operations.
1. Offsetting processes and policies for on-
balance-sheet and off-balance-sheet
positions
Transaction offsetting agreements included in
clauses of framework offsetting agreements are
used as credit risk mitigation techniques since
they provide an offsetting facility between
contracts of the same type. In this respect, in the
management of risk and calculation of own funds,
the reciprocal positions between the Entity and
the counterparty are offset.
2. Types of guarantees, and management
and valuation policies and procedures
The approval of transactions, and the maximum
value thereof, must be related to the borrower’s
repayment capacity, such that they can meet
their financial obligations in due time and form. If
this criterion is met, the provision of additional
surety is also considered (mortgage guarantees,
guarantors, and pledges).
Guarantees are understood as the assets and/or
funds pledged to secure fulfilment of a repayment
obligation. Guarantees may take the form of a
personal guarantee (backed by the solvency of
the borrowers or guarantors) or a real guarantee
(secured by a specific asset).
All transactions involving a risk are secured by
the personal guarantee of the borrowers,
irrespective of whether they are a natural or legal
person, who pledge all of their existing and future
assets to secure fulfilment of the obligations
concerned. Further guarantees may also be
required alongside a borrower’s personal
guarantee. Acquiring additional guarantees
always reduces exposure to risk as they cover us
against unexpected contingencies. Guarantees
must therefore increase as the likelihood of these
contingencies occurring rises.
These guarantees should never be used to
substitute a lack of repayment capacity or an
uncertain outcome for the project.
For accounting purposes, effective guarantees or collateral are collateral and personal guarantees that the Entity can demonstrate are valid as risk mitigators. Factors to be considered when analysing the effectiveness of collateral or guarantees include the amount of time required to enforce the guarantees and the Entity’s ability to realise the guarantees or collateral, as well as its experience in realising guarantees.
Personal guarantees: Most of these relate to
pure-risk operations with companies in which the
collateral provided by the shareholders,
irrespective of whether they are individuals or
legal entities, is considered relevant, as those
ultimately responsible for the operation. In the
case of individuals, the collateral is estimated on
the basis of declarations of assets, and where
the backer is a legal entity, it is analysed as the
holder for the purposes of the approval process.
Collateral: The main types of collateral are
accepted for day-to-day business are as follows:
Pledged guarantees
These are transactions secured by a charge and that relate to certain passive banking operations or financial mediation transactions conducted by CaixaBank.
These are applicable to loans, open credits, credit accounts, guarantee lines, risk lines or leases, guaranteed through CaixaBank intermediation or pledging of accounts held against the bank.
To be admitted as collateral, financial instruments must be deposited at CaixaBank, they must be free of liens and charges, their contractual definition must not restrict their pledge, and their credit quality or change in value must not be related to the borrower.
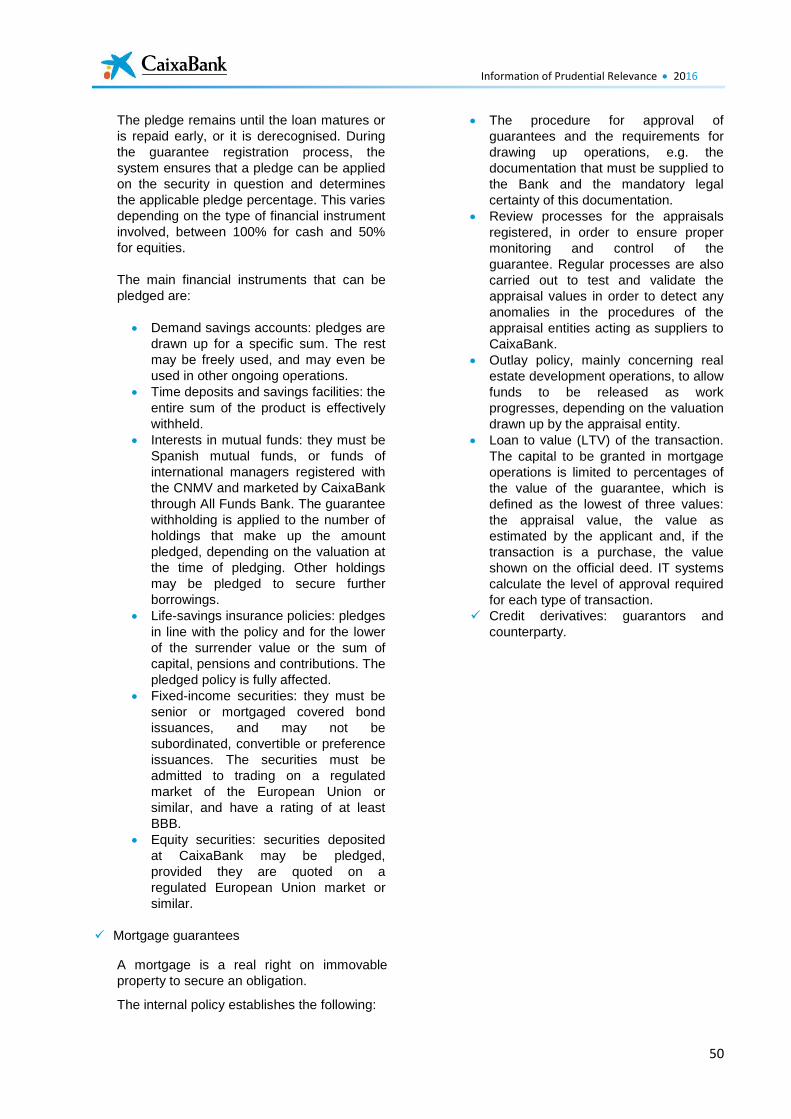
Information of Prudential Relevance 2016
50
The pledge remains until the loan matures or
is repaid early, or it is derecognised. During
the guarantee registration process, the
system ensures that a pledge can be applied
on the security in question and determines
the applicable pledge percentage. This varies
depending on the type of financial instrument
involved, between 100% for cash and 50%
for equities.
The main financial instruments that can be
pledged are:
Demand savings accounts: pledges are
drawn up for a specific sum. The rest
may be freely used, and may even be
used in other ongoing operations.
Time deposits and savings facilities: the
entire sum of the product is effectively
withheld.
Interests in mutual funds: they must be
Spanish mutual funds, or funds of
international managers registered with
the CNMV and marketed by CaixaBank
through All Funds Bank. The guarantee
withholding is applied to the number of
holdings that make up the amount
pledged, depending on the valuation at
the time of pledging. Other holdings
may be pledged to secure further
borrowings.
Life-savings insurance policies: pledges
in line with the policy and for the lower
of the surrender value or the sum of
capital, pensions and contributions. The
pledged policy is fully affected.
Fixed-income securities: they must be
senior or mortgaged covered bond
issuances, and may not be
subordinated, convertible or preference
issuances. The securities must be
admitted to trading on a regulated
market of the European Union or
similar, and have a rating of at least
BBB.
Equity securities: securities deposited
at CaixaBank may be pledged,
provided they are quoted on a
regulated European Union market or
similar.
Mortgage guarantees
A mortgage is a real right on immovable
property to secure an obligation.
The internal policy establishes the following:
The procedure for approval of
guarantees and the requirements for
drawing up operations, e.g. the
documentation that must be supplied to
the Bank and the mandatory legal
certainty of this documentation.
Review processes for the appraisals
registered, in order to ensure proper
monitoring and control of the
guarantee. Regular processes are also
carried out to test and validate the
appraisal values in order to detect any
anomalies in the procedures of the
appraisal entities acting as suppliers to
CaixaBank.
Outlay policy, mainly concerning real
estate development operations, to allow
funds to be released as work
progresses, depending on the valuation
drawn up by the appraisal entity.
Loan to value (LTV) of the transaction.
The capital to be granted in mortgage
operations is limited to percentages of
the value of the guarantee, which is
defined as the lowest of three values:
the appraisal value, the value as
estimated by the applicant and, if the
transaction is a purchase, the value
shown on the official deed. IT systems
calculate the level of approval required
for each type of transaction.
Credit derivatives: guarantors and
counterparty.
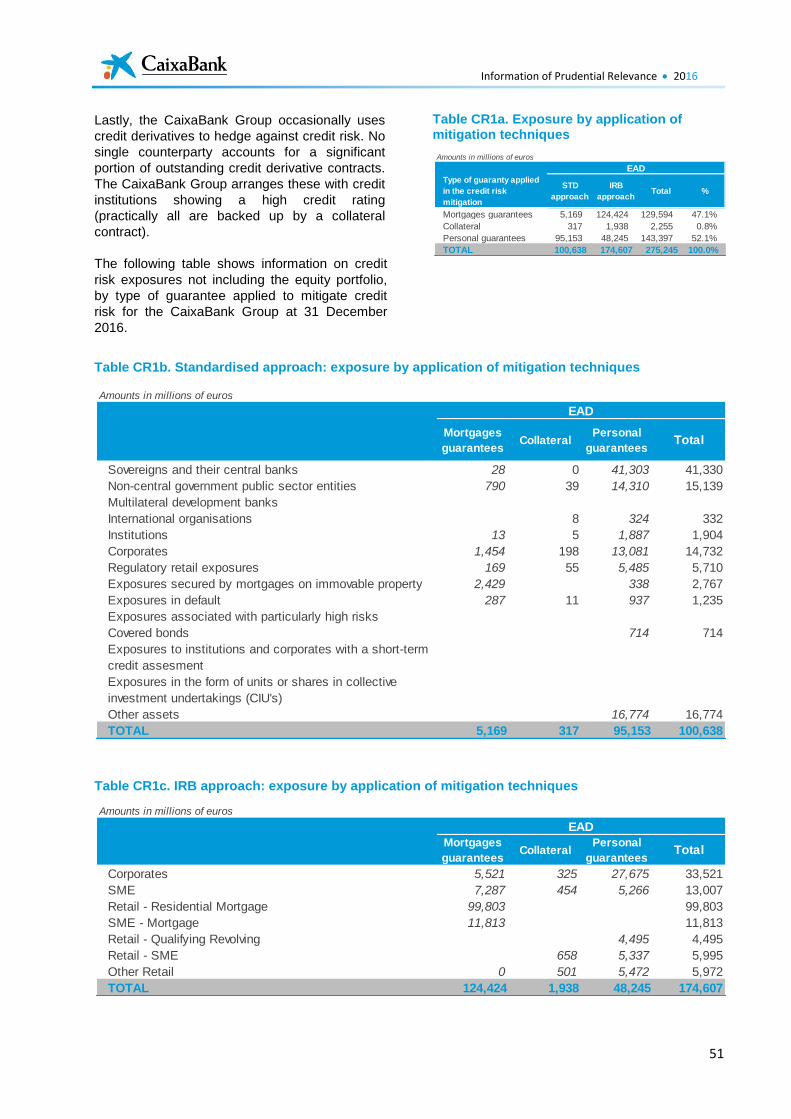
Information of Prudential Relevance 2016
51
Lastly, the CaixaBank Group occasionally uses
credit derivatives to hedge against credit risk. No
single counterparty accounts for a significant
portion of outstanding credit derivative contracts.
The CaixaBank Group arranges these with credit
institutions showing a high credit rating
(practically all are backed up by a collateral
contract).
The following table shows information on credit
risk exposures not including the equity portfolio,
by type of guarantee applied to mitigate credit
risk for the CaixaBank Group at 31 December
2016.
Table CR1a. Exposure by application of mitigation techniques
Table CR1b. Standardised approach: exposure by application of mitigation techniques
Table CR1c. IRB approach: exposure by application of mitigation techniques
Amounts in millions of euros
Type of guaranty applied
in the credit risk
mitigation
STD
approach
IRB
approachTotal %
Mortgages guarantees 5,169 124,424 129,594 47.1%
Collateral 317 1,938 2,255 0.8%
Personal guarantees 95,153 48,245 143,397 52.1%
TOTAL 100,638 174,607 275,245 100.0%
EAD
Amounts in millions of euros
Mortgages
guaranteesCollateral
Personal
guaranteesTotal
Sovereigns and their central banks 28 0 41,303 41,330
Non-central government public sector entities 790 39 14,310 15,139
Multilateral development banks
International organisations 8 324 332
Institutions 13 5 1,887 1,904
Corporates 1,454 198 13,081 14,732
Regulatory retail exposures 169 55 5,485 5,710
Exposures secured by mortgages on immovable property 2,429 338 2,767
Exposures in default 287 11 937 1,235
Exposures associated with particularly high risks
Covered bonds 714 714
Exposures to institutions and corporates with a short-term
credit assesment
Exposures in the form of units or shares in collective
investment undertakings (CIU's)
Other assets 16,774 16,774
TOTAL 5,169 317 95,153 100,638
EAD
Amounts in millions of euros
Mortgages
guaranteesCollateral
Personal
guaranteesTotal
Corporates 5,521 325 27,675 33,521
SME 7,287 454 5,266 13,007
Retail - Residential Mortgage 99,803 99,803
SME - Mortgage 11,813 11,813
Retail - Qualifying Revolving 4,495 4,495
Retail - SME 658 5,337 5,995
Other Retail 0 501 5,472 5,972
TOTAL 124,424 1,938 48,245 174,607
EAD
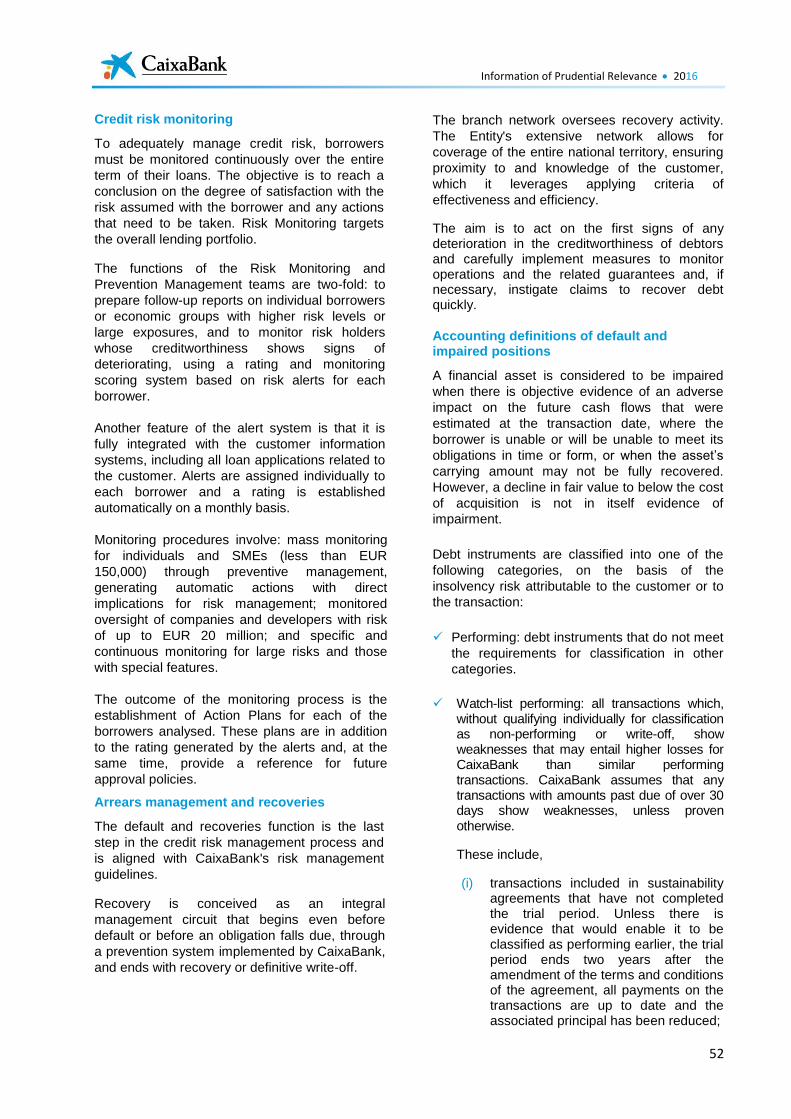
Information of Prudential Relevance 2016
52
Credit risk monitoring
To adequately manage credit risk, borrowers
must be monitored continuously over the entire
term of their loans. The objective is to reach a
conclusion on the degree of satisfaction with the
risk assumed with the borrower and any actions
that need to be taken. Risk Monitoring targets
the overall lending portfolio.
The functions of the Risk Monitoring and
Prevention Management teams are two-fold: to
prepare follow-up reports on individual borrowers
or economic groups with higher risk levels or
large exposures, and to monitor risk holders
whose creditworthiness shows signs of
deteriorating, using a rating and monitoring
scoring system based on risk alerts for each
borrower.
Another feature of the alert system is that it is
fully integrated with the customer information
systems, including all loan applications related to
the customer. Alerts are assigned individually to
each borrower and a rating is established
automatically on a monthly basis.
Monitoring procedures involve: mass monitoring
for individuals and SMEs (less than EUR
150,000) through preventive management,
generating automatic actions with direct
implications for risk management; monitored
oversight of companies and developers with risk
of up to EUR 20 million; and specific and
continuous monitoring for large risks and those
with special features.
The outcome of the monitoring process is the
establishment of Action Plans for each of the
borrowers analysed. These plans are in addition
to the rating generated by the alerts and, at the
same time, provide a reference for future
approval policies.
Arrears management and recoveries
The default and recoveries function is the last
step in the credit risk management process and
is aligned with CaixaBank's risk management
guidelines.
Recovery is conceived as an integral
management circuit that begins even before
default or before an obligation falls due, through
a prevention system implemented by CaixaBank,
and ends with recovery or definitive write-off.
The branch network oversees recovery activity.
The Entity's extensive network allows for
coverage of the entire national territory, ensuring
proximity to and knowledge of the customer,
which it leverages applying criteria of
effectiveness and efficiency.
The aim is to act on the first signs of any deterioration in the creditworthiness of debtors and carefully implement measures to monitor operations and the related guarantees and, if necessary, instigate claims to recover debt quickly.
Accounting definitions of default and impaired positions
A financial asset is considered to be impaired
when there is objective evidence of an adverse
impact on the future cash flows that were
estimated at the transaction date, where the
borrower is unable or will be unable to meet its
obligations in time or form, or when the asset’s
carrying amount may not be fully recovered.
However, a decline in fair value to below the cost
of acquisition is not in itself evidence of
impairment.
Debt instruments are classified into one of the
following categories, on the basis of the
insolvency risk attributable to the customer or to
the transaction:
Performing: debt instruments that do not meet
the requirements for classification in other
categories.
Watch-list performing: all transactions which, without qualifying individually for classification as non-performing or write-off, show weaknesses that may entail higher losses for CaixaBank than similar performing transactions. CaixaBank assumes that any transactions with amounts past due of over 30 days show weaknesses, unless proven otherwise.
These include,
(i) transactions included in sustainability agreements that have not completed the trial period. Unless there is evidence that would enable it to be classified as performing earlier, the trial period ends two years after the amendment of the terms and conditions of the agreement, all payments on the transactions are up to date and the associated principal has been reduced;
Information of Prudential Relevance 2016
53
(ii) refinancing, refinanced or restructured transactions that should not be reclassified as non-performing and that are still in the trial period (see Note 2.10 to the CaixaBank Group's 2016 financial statements); and
(iii) transactions made by insolvent borrowers that should not be classified as non-performing or write-off.
Non-performing:
(i) Due to customer arrears: this includes the total amount of debt instruments, whoever the obligor and whatever the guarantee or collateral, any part of whose principal, interest or contractually agreed expenses is past-due by more than 90 days, unless such instruments should be classified as write-off. This category also includes guarantees given where the guaranteed transaction is non-performing.
Transactions where all holders are classified according to cluster-effect criteria for personal risk are also classified as non-performing due to customer arrears. Cluster effect criteria for personal risk are also applied to a borrower when transactions with past-due amounts of over 90 days account for more than 20% of the amounts pending collection.
Transactions are reclassified to
performing when following collection of
part of the past-due amounts, the causes
for their classification as non-performing
as indicated above are no longer valid
and the holders does not have any past-
due amounts of more than 90 days in any
other transactions at the date of
reclassification as performing.
(ii) For reasons other than customer arrears: includes debt instruments, where due or not, which are not classifiable as write-off or non-performing due to customer arrears, but for which there are reasonable doubts about their full repayment (principal and interest) under the contractual terms in addition to off-balance sheet exposures not classified as non-performing due to customer arrears which are likely to be paid by the Company and where recovery is deemed to be doubtful.
This category includes transactions made by customers evidencing a reduction in solvency after an individualised review.
CaixaBank has established a methodology to assess specific indicators to identify any such reduction, flagging any significant financial difficulties affecting the borrower (weak economic-financial structure), non-compliance with contractual terms and conditions (recurring default of payment or late payment), high probability of insolvency and the disappearance of an active market for the financial asset in question due to financial difficulties.
These indicators apply to borrowers defined as materially relevant and their activation requires an individual analysis of the transaction to establish it as performing or non-performing.
In addition to transactions allocated to this category following an individual review, transactions meeting any of the following criteria are also classified as non-performing for reasons other than customer arrears:
Transactions with demanded balances or on which repayment by the entity has been legally demanded, despite being secured, in addition to transactions where the borrower is involved in litigation which can be resolved through collection.
Finance lease transaction where the contract is terminated in order to recover possession of the goods.
Transactions made by borrowers who have declared insolvency proceedings or are expected to declare insolvency proceedings where no liquidation petition has been made.
Guarantees extended to borrowers that are undergoing insolvency proceedings where the liquidation phase has or will be declared, or that have undergone a significant and irrecoverable loss of solvency, even though the beneficiary of the guarantee has not demanded payment.
Information of Prudential Relevance 2016
54
Refinancing, refinanced or restructured transaction classifiable as non-performing (see Note 2.10 to the CaixaBank Group's 2016 financial statements) including those that having been classified as non-performing during the trial period, are refinanced or restructured or that have amounts that are more than 30 days past-due.
Write-off: includes debt instruments, whether
due or not, for which the Group, after
analysing them individually, considers the
possibility of recovery to be remote and
proceeds to derecognise them, without
prejudice to any actions that the CaixaBank
Group may initiate to seek collection until their
contractual rights are extinguished definitively
by expiry of the statute-of-limitations period,
forgiveness or any other cause.
This category includes:
(i) non-performing transactions due to customer arrears in excess of four years, or, before the end of the four-year period when the amount not secured by effective guarantees is fully covered for more than two years, and
(ii) transactions made by borrowers declared to be insolvent which have entered or will enter the liquidation phase. In both cases, the transactions are not considered to be write-offs if they have real effective guarantees that cover at least 10% of its gross carrying amount.
To reclassify transactions to this category before these terms expire, the entity must demonstrate in its individual analysis that they have become write-offs.
On the basis of credit risk management and monitoring criteria, CaixaBank classifies as individually significant borrowers those that require an individual assessment due to their exposure and level of risk. Individually significant borrowers may meet any of the following conditions:
Borrowers with total exposure of more the EUR 20 million.
Borrowers with total exposure of more than EUR 10 million that, due to various factors, such as having been refinanced, evidencing early signals of non-performance or
surpassing specific expected loss thresholds, are classified as high risk.
Borrowers with total exposure of more than EUR 5 million, of which more than 5% of the balance is classified as non-performing.
In addition to the above, individually significant borrowers are also those that are considered to require individual treatment for any reason.
All borrowers that do not comply with the above criteria are treated as a group.
Refinancing or restructuring operations
Under current legislation, these relate to transactions in which the customer has, or will foreseeably have, financial difficulty in meeting its payment obligations under the contractually agreed terms and, therefore, has amended the agreement, cancelled the agreement and/or arranged a new transaction.
These transactions may arise when:
A new transaction (refinancing operation) is granted that fully or partially cancels other transactions (refinanced operations) previously extended by any CaixaBank Group company to the same borrower or other companies forming part of its economic group that become up to date on its payments for previously past-due loans.
The amendment of the contract terms of an existing transaction (restructured operations) that changes its repayment schedule (grace periods, extension of loan maturities, reduction in interest rates, changes in the repayment schedule, extension of all or part of the capital on maturity, etc.).
The activation of contract clauses agreed at source that extend the debt repayment terms (flexible grace period).
The partial cancellation of the debt without the contribution of funds by the customer (foreclosure, purchase or dation of the collateral, or forgiveness of capital, interest, fees and commissions or any other cost relating to the loan extended to the borrower).
The existence of previous defaults is an indication of financial difficulty. Unless otherwise demonstrated, a restructuring or refinancing operation is assumed to exist when the amendment to contractual term affects operations that have been past-due for more
Information of Prudential Relevance 2016
55
than 30 days at least once in the three months prior to the amendment. However, previous defaults are not a requirement for an operation to be classified as refinanced or restructured.
The cancellation of an operation, changes in the contractual terms or the activation of clauses that delay payments when the customer is unable to meet future repayment obligations can also be classified as refinancing/restructuring.
In contrast, debt renewals and renegotiations may be granted when the borrower does not have, or is not expected to have, financial difficulties; i.e. for business reasons, not to facilitate repayments.
For a transaction to be classified as such, the borrower must have the capacity to obtain credit from the market, at the date in question, for a similar amount and on similar terms to those offered by the Entity. These terms must be adjusted to reflect the terms offered to borrowers with a similar risk profile.
In general, refinanced or restructured and new operations carried out for refinancing, are classified in the watch-list performing category. However, according to the particular characteristics of the operation they may be classified as non-performing when they meet the general criteria for classifying debt instruments as such, and specifically i) operations backed by an unsuitable business plan, ii) operations that include contractual clauses that delay repayments in the form of grace periods longer than 24 months, and iii) operations that include amounts that have been removed from the balance sheet having been classified as unrecoverable that exceed the coverage applicable according to the percentage established for operations in the watch-list performing category.
Refinanced and restructured operations and new operations carried out for refinancing are classified as watch-list performing for a trial period until all the following requirements are met:
After reviewing the borrower’s asset and financial position it is concluded that they are unlikely to have financial difficulties and therefore it is highly probable that they will meet their obligations vis-a-vis the entity in both time and form.
A minimum period of two years has elapsed from the date of authorisation of the restructuring or refinancing operation, or, if
later, from the date of its reclassification from the non-performing category.
The borrower has covered all the principal and interest payments from the date of authorisation of the restructuring or refinancing operation, or, if later, from the date of its reclassification from the non-performing category. Additionally: i) the borrower must have made regular payments of an amount equivalent to the whole amount (principal and interest) falling due at the date of the restructuring or refinancing operation, or that were derecognised as a result of it, or ii) when it is deemed more appropriate given the nature of the operations that the borrower complies with other objective criteria that demonstrate their payment capacity.
If there are contractual clauses that may delay repayments, such as grace periods for the principal, the operation will remain classified as watch-list performing until all criteria are met.
The borrower must have no other operations with past-due amounts for more than 30 days at the end of the trial period.
When all the above requirements are met, the operations are no longer classified as refinancing, refinanced or restructured operations in the financial statements.
During the trial period, further refinancing or restructuring of the refinancing, refinanced or restructured operation, or the existence of past-due amounts of more than 30 days in these operations will mean that the operations are reclassified as non-performing for reasons other than arrears before the start of the trial period.
Refinanced and restructured operations and new operations carried out for refinancing remain classified as non-performing until they meet the general criteria for debt instruments; specifically the following requirements:
A period of one year has elapsed from the refinancing or restructuring date.
The borrower has covered all the principal and interest payments (i.e. they are up to date on payments) thereby reducing the renegotiated principal, from the date of authorisation of the restructuring or refinancing operation, or, if later, from the date of its reclassification to the non-performing category.
The borrower has made regular payments of an amount equivalent to the whole
Information of Prudential Relevance 2016
56
amount (principal and interest) falling due at the date of the restructuring or refinancing operation, or that were derecognised as a result of it, or, when it is deemed more appropriate given the nature of the operations, the borrower complies with other objective criteria that demonstrate their payment capacity.
The borrower has no other operations with past-due amounts for more than 90 days at the date the refinancing, refinanced or restructured operation is reclassified to the watch-list performing category.
Description of methods to determine impairment losses
The calculated coverage or provision is defined as the difference between the gross carrying amount of the transaction and the estimated value of future expected cash flows, discounted at the original effective interest rate of the transaction. Effective guarantees received are taken into consideration.
CaixaBank calculates the required amount to cover the risk attributable to the holder and to country risk, provided that the risk is not transferred to write-off.
For the purposes of estimating coverage, the amount of the risk for debt instruments is the gross carrying amount, and for off balance exposures, the estimated value of the disbursements.
In line with applicable rules, the coverage calculation method is set according to whether the borrower is individually significant and its accounting category.
If, in addition to being individually significant, the customer is doubtful (whether for reasons of delinquency or for other reasons), the specific coverage for the transaction is estimated through a detailed analysis of customer flows, factoring in the status of their owner and the flows expected to be recovered, which are assessed using two methodologies according to the borrower’s capacity to generate flows from their activities.
The calculation of the present value of the estimated future cash flows of a secured financial asset reflects the cash flows that could derive from the execution of this guarantee, less the costs of obtaining and selling the collateral, regardless of whether this is probable or not.
In all other cases, coverage is estimated collectively using internal methodologies based on CaixaBank’s past experience and factoring in the updated and adjusted value of the guarantees considered to be effective.
The collective coverage is calculated using the Company’s internal models in its current Models and Parameters Policy, consistently with Circular 4/2016.
At portfolio level, the calculation of allowances using internal models is designed to estimate the losses incurred on exposures contained in these portfolios. In addition to calculating allowances at portfolio level, the Company assigns allowances for each individual exposure. The calculation has two parts:
Setting the basis for the calculation of allowances, in two steps (i) calculation of exposure, which is the sum of the gross carrying amount at the time of calculation plus off balance-sheet amounts (available or exposure) expected to be disbursed when the borrower meets the conditions for being classified as doubtful, and (ii) calculation of the recoverable value of the effective guarantees linked to the exposure. In order to establish the recoverable value of these guarantees, for real estate collateral the models estimate the amount of the future sale of the collateral which is discounted from the total expenses incurred until the moment of the sale.
Establishing the coverage to be applied on this basis for the calculation of allowances. This calculation factors in the probability of borrower defaulting on the transaction obligations, the probability of the situation being remedied or resolved and the losses that would occur if this did not happen.
For insignificant portfolios where it is considered that the internal model approach is not suitable due to the processes involved or a lack of past experience, the Company may use the default coverage rates established by the Bank of Spain.
Both transactions classified as not bearing appreciable risk and those that, due to their type of collateral, are classified as not bearing appreciable risk, could have 0% coverage. This
Information of Prudential Relevance 2016
57
percentage will only be applied to the covered risk.
Individual or collective coverage for non-performing transactions must not be lower than the general coverage applied if they were classified as watch-list performing.
The final coverage applied in a transaction must be the greatest of the credit risk allowance allocated to the borrower and the country risk, although the latter is not material for CaixaBank.
In order to ensure the reliability and consistency of its estimated coverage, CaixaBank performs backtesting exercises to compare the estimates made with real losses observed and benchmarking exercises to compare the estimates with expected losses in terms of solvency, the alternative solution established in the Circular and any other reference considered to be appropriate.
Credit risk management priorities
To compensate the fall in demand for loans by households for the acquisition of homes with finance for consumption and companies (excluding real-estate developers).
Automation and digitalisation of the granting of credit to individual customers, increasing competitiveness and maximising efficiency through remote channels.
Policies, models and limits for controlling credit quality in new lending, to increase funding to the economy whilst ensuring sustainable levels of future delinquency.
Management of the portfolio of unproductive assets (mainly, foreclosed assets), to minimise their impact on profitability, with a decrease in new real-estate entries and maintenance of high levels of marketing, obtaining positive returns on sales.
Implementation of Bank of Spain Annex IX, which introduces substantial modifications to the classification of credit risk exposure, establishing expected loss as the fundamental factor in determining the provisions required by the portfolio.
Analysis, interaction with supervisors and preparation for future implementation of the “Basel IV” regulatory changes to the consumption of regulatory capital.
Synthetic securitisation.
6.1.2. Minimum own funds requirements for credit risk
Minimum own funds requirements for credit risk under the standardised approach
To calculate risk-weighted exposures using the
standardised approach, risk is weighted in
accordance with the exposure’s credit quality.
CaixaBank uses the external rating agencies
designated as being eligible by the Bank of Spain,
namely Standard & Poor’s, Moody’s, Fitch and
DBRS.
The CaixaBank Group applies the standardised
approach permanently to the following
exposures:
Central administrations and central banks
Regional administrations and local authorities
Institutions
Under the application of the measurement
approaches in the new European capital
requirements regulations - CRD IV and CRR -
where external ratings are not available for the
exposures of regional or local administrations, the
rating of the next highest level public body
available is used.
The Group does not assign credit ratings for
publicly traded security issues or comparable
assets not included in the trading portfolio.
The tables in this section detail:
original exposure (“Exposure prior to CCF and
CRM provisions”, including exposure to credit
risk both on- and off- the balance sheet, and
counterparty risk),
EAD (“Exposures after CCF and CRM”),
and Risk-weighted assets (RWA).
The ratio of EAD to APR gives the RWA density
ratio. This calculation equates to the average
weighting applied to each category of exposure.
The following table shows exposure guaranteed
by real estate assets, broken down into
commercial and residential.
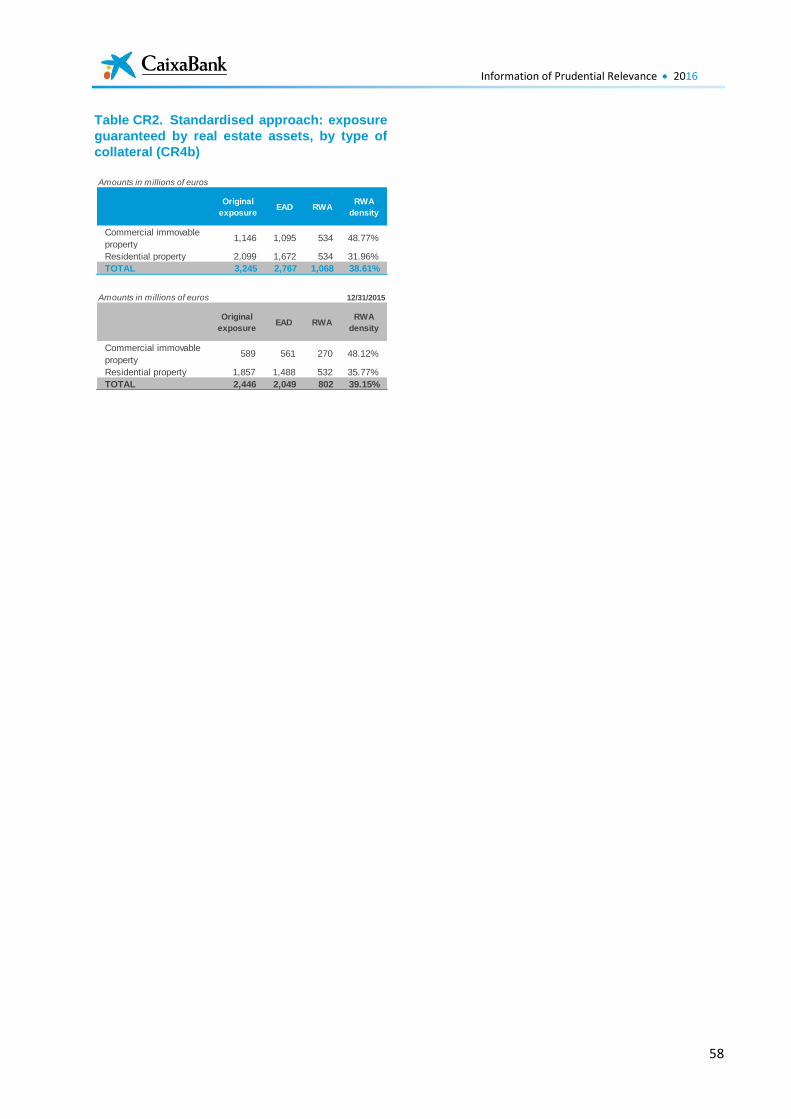
Information of Prudential Relevance 2016
58
Table CR2. Standardised approach: exposure
guaranteed by real estate assets, by type of
collateral (CR4b)
Amounts in millions of euros
Original
exposureEAD RWA
RWA
density
Commercial immovable
property1,146 1,095 534 48.77%
Residential property 2,099 1,672 534 31.96%
TOTAL 3,245 2,767 1,068 38.61%
Amounts in millions of euros 12/31/2015
Original
exposureEAD RWA
RWA
density
Commercial immovable
property589 561 270 48.12%
Residential property 1,857 1,488 532 35.77%
TOTAL 2,446 2,049 802 39.15%
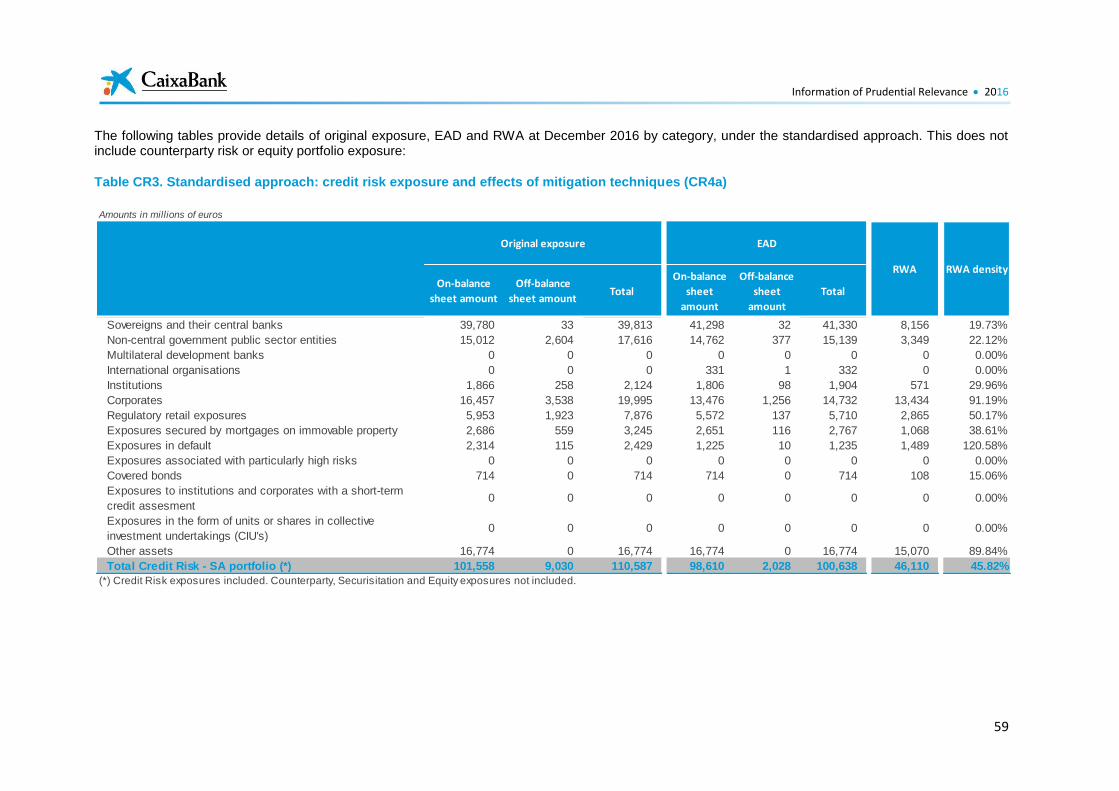
Information of Prudential Relevance 2016
59
The following tables provide details of original exposure, EAD and RWA at December 2016 by category, under the standardised approach. This does not include counterparty risk or equity portfolio exposure:
Table CR3. Standardised approach: credit risk exposure and effects of mitigation techniques (CR4a)
Amounts in millions of euros
On-balance
sheet amount
Off-balance
sheet amountTotal
On-balance
sheet
amount
Off-balance
sheet
amount
Total
Sovereigns and their central banks 39,780 33 39,813 41,298 32 41,330 8,156 19.73%
Non-central government public sector entities 15,012 2,604 17,616 14,762 377 15,139 3,349 22.12%
Multilateral development banks 0 0 0 0 0 0 0 0.00%
International organisations 0 0 0 331 1 332 0 0.00%
Institutions 1,866 258 2,124 1,806 98 1,904 571 29.96%
Corporates 16,457 3,538 19,995 13,476 1,256 14,732 13,434 91.19%
Regulatory retail exposures 5,953 1,923 7,876 5,572 137 5,710 2,865 50.17%
Exposures secured by mortgages on immovable property 2,686 559 3,245 2,651 116 2,767 1,068 38.61%
Exposures in default 2,314 115 2,429 1,225 10 1,235 1,489 120.58%
Exposures associated with particularly high risks 0 0 0 0 0 0 0 0.00%
Covered bonds 714 0 714 714 0 714 108 15.06%
Exposures to institutions and corporates with a short-term
credit assesment0 0 0 0 0 0 0 0.00%
Exposures in the form of units or shares in collective
investment undertakings (CIU's)0 0 0 0 0 0 0 0.00%
Other assets 16,774 0 16,774 16,774 0 16,774 15,070 89.84%
Total Credit Risk - SA portfolio (*) 101,558 9,030 110,587 98,610 2,028 100,638 46,110 45.82%
(*) Credit Risk exposures included. Counterparty, Securisitation and Equity exposures not included.
Original exposure EAD
RWA RWA density
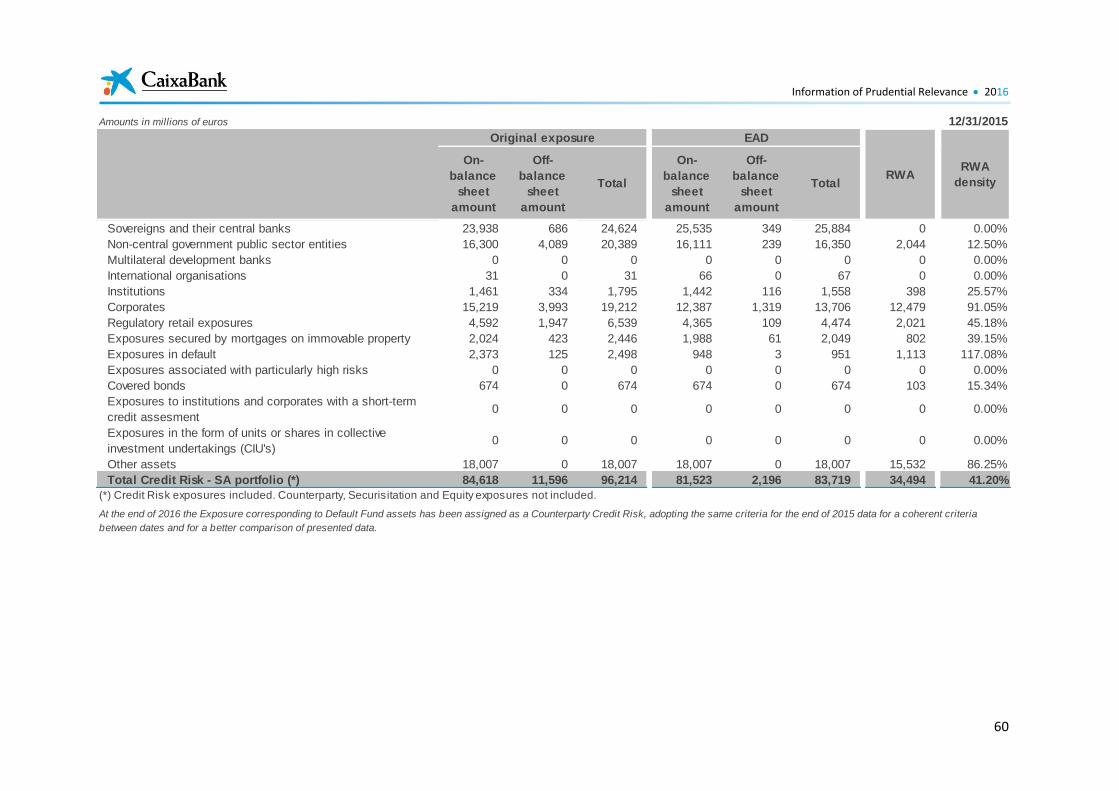
Information of Prudential Relevance 2016
60
Amounts in millions of euros 12/31/2015
On-
balance
sheet
amount
Off-
balance
sheet
amount
Total
On-
balance
sheet
amount
Off-
balance
sheet
amount
Total
Sovereigns and their central banks 23,938 686 24,624 25,535 349 25,884 0 0.00%
Non-central government public sector entities 16,300 4,089 20,389 16,111 239 16,350 2,044 12.50%
Multilateral development banks 0 0 0 0 0 0 0 0.00%
International organisations 31 0 31 66 0 67 0 0.00%
Institutions 1,461 334 1,795 1,442 116 1,558 398 25.57%
Corporates 15,219 3,993 19,212 12,387 1,319 13,706 12,479 91.05%
Regulatory retail exposures 4,592 1,947 6,539 4,365 109 4,474 2,021 45.18%
Exposures secured by mortgages on immovable property 2,024 423 2,446 1,988 61 2,049 802 39.15%
Exposures in default 2,373 125 2,498 948 3 951 1,113 117.08%
Exposures associated with particularly high risks 0 0 0 0 0 0 0 0.00%
Covered bonds 674 0 674 674 0 674 103 15.34%
Exposures to institutions and corporates with a short-term
credit assesment0 0 0 0 0 0 0 0.00%
Exposures in the form of units or shares in collective
investment undertakings (CIU's)0 0 0 0 0 0 0 0.00%
Other assets 18,007 0 18,007 18,007 0 18,007 15,532 86.25%
Total Credit Risk - SA portfolio (*) 84,618 11,596 96,214 81,523 2,196 83,719 34,494 41.20%
(*) Credit Risk exposures included. Counterparty, Securisitation and Equity exposures not included.
Original exposure EAD
RWARWA
density
At the end of 2016 the Exposure corresponding to Default Fund assets has been assigned as a Counterparty Credit Risk, adopting the same criteria for the end of 2015 data for a coherent criteria
between dates and for a better comparison of presented data.
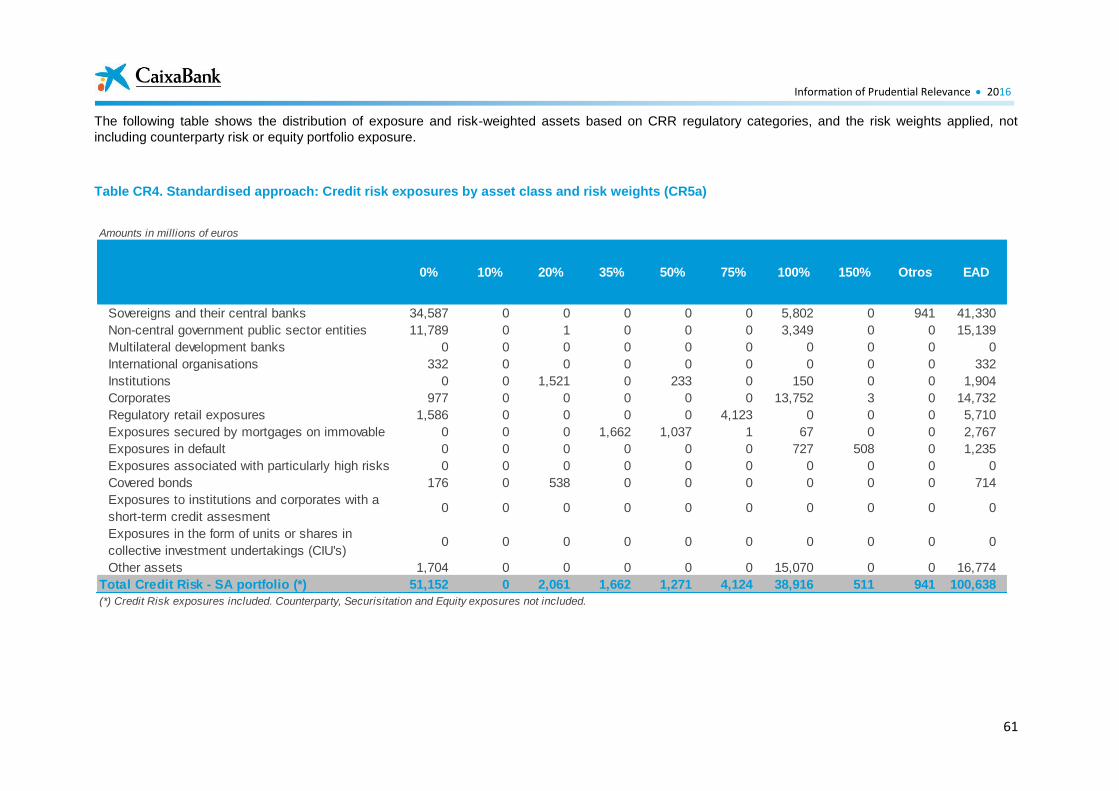
Information of Prudential Relevance 2016
61
The following table shows the distribution of exposure and risk-weighted assets based on CRR regulatory categories, and the risk weights applied, not
including counterparty risk or equity portfolio exposure.
Table CR4. Standardised approach: Credit risk exposures by asset class and risk weights (CR5a)
Amounts in millions of euros
0% 10% 20% 35% 50% 75% 100% 150% Otros EAD
Sovereigns and their central banks 34,587 0 0 0 0 0 5,802 0 941 41,330
Non-central government public sector entities 11,789 0 1 0 0 0 3,349 0 0 15,139
Multilateral development banks 0 0 0 0 0 0 0 0 0 0
International organisations 332 0 0 0 0 0 0 0 0 332
Institutions 0 0 1,521 0 233 0 150 0 0 1,904
Corporates 977 0 0 0 0 0 13,752 3 0 14,732
Regulatory retail exposures 1,586 0 0 0 0 4,123 0 0 0 5,710
Exposures secured by mortgages on immovable 0 0 0 1,662 1,037 1 67 0 0 2,767
Exposures in default 0 0 0 0 0 0 727 508 0 1,235
Exposures associated with particularly high risks 0 0 0 0 0 0 0 0 0 0
Covered bonds 176 0 538 0 0 0 0 0 0 714
Exposures to institutions and corporates with a
short-term credit assesment0 0 0 0 0 0 0 0 0 0
Exposures in the form of units or shares in
collective investment undertakings (CIU's)0 0 0 0 0 0 0 0 0 0
Other assets 1,704 0 0 0 0 0 15,070 0 0 16,774
Total Credit Risk - SA portfolio (*) 51,152 0 2,061 1,662 1,271 4,124 38,916 511 941 100,638
(*) Credit Risk exposures included. Counterparty, Securisitation and Equity exposures not included.
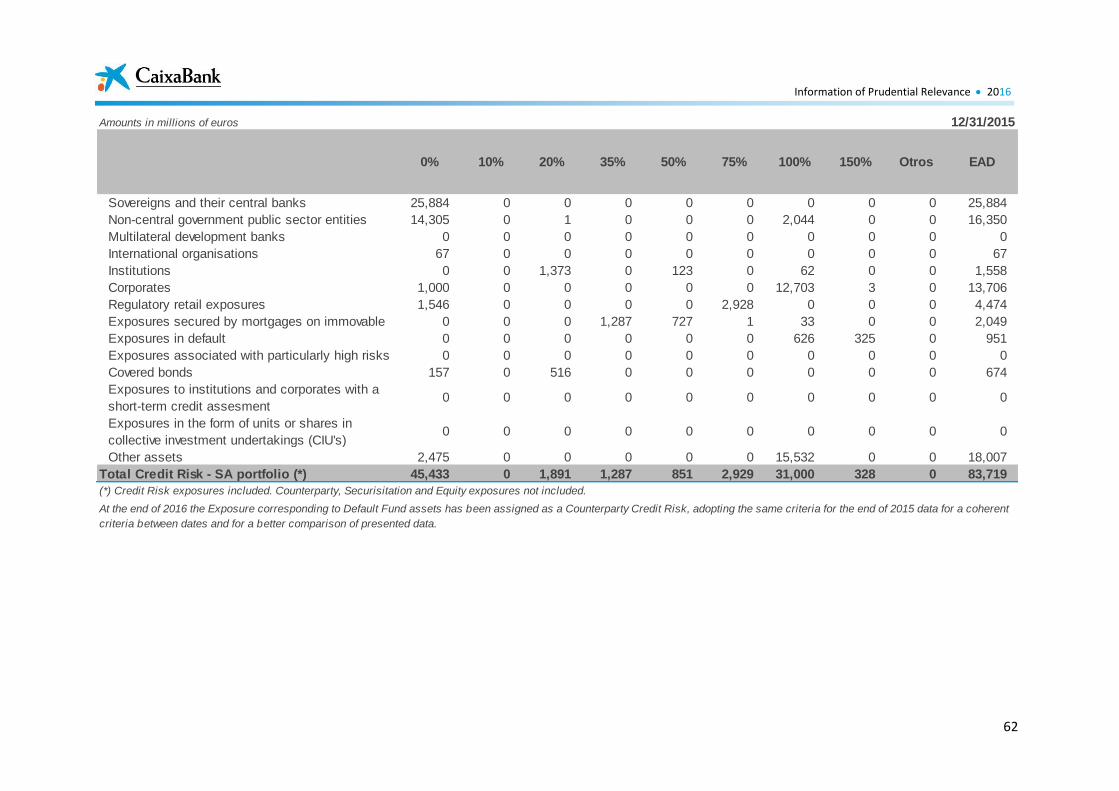
Information of Prudential Relevance 2016
62
Amounts in millions of euros 12/31/2015
0% 10% 20% 35% 50% 75% 100% 150% Otros EAD
Sovereigns and their central banks 25,884 0 0 0 0 0 0 0 0 25,884
Non-central government public sector entities 14,305 0 1 0 0 0 2,044 0 0 16,350
Multilateral development banks 0 0 0 0 0 0 0 0 0 0
International organisations 67 0 0 0 0 0 0 0 0 67
Institutions 0 0 1,373 0 123 0 62 0 0 1,558
Corporates 1,000 0 0 0 0 0 12,703 3 0 13,706
Regulatory retail exposures 1,546 0 0 0 0 2,928 0 0 0 4,474
Exposures secured by mortgages on immovable 0 0 0 1,287 727 1 33 0 0 2,049
Exposures in default 0 0 0 0 0 0 626 325 0 951
Exposures associated with particularly high risks 0 0 0 0 0 0 0 0 0 0
Covered bonds 157 0 516 0 0 0 0 0 0 674
Exposures to institutions and corporates with a
short-term credit assesment0 0 0 0 0 0 0 0 0 0
Exposures in the form of units or shares in
collective investment undertakings (CIU's)0 0 0 0 0 0 0 0 0 0
Other assets 2,475 0 0 0 0 0 15,532 0 0 18,007
Total Credit Risk - SA portfolio (*) 45,433 0 1,891 1,287 851 2,929 31,000 328 0 83,719
(*) Credit Risk exposures included. Counterparty, Securisitation and Equity exposures not included.
At the end of 2016 the Exposure corresponding to Default Fund assets has been assigned as a Counterparty Credit Risk, adopting the same criteria for the end of 2015 data for a coherent
criteria between dates and for a better comparison of presented data.
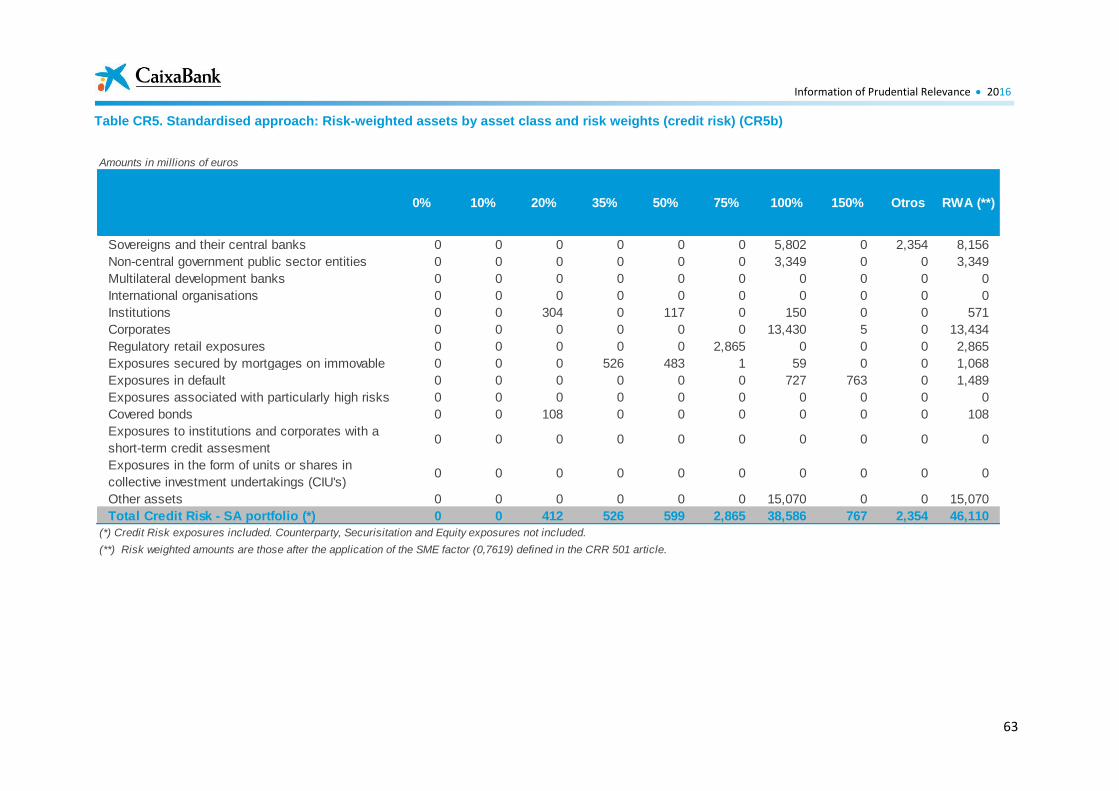
Information of Prudential Relevance 2016
63
Table CR5. Standardised approach: Risk-weighted assets by asset class and risk weights (credit risk) (CR5b)
Amounts in millions of euros
0% 10% 20% 35% 50% 75% 100% 150% Otros RWA (**)
Sovereigns and their central banks 0 0 0 0 0 0 5,802 0 2,354 8,156
Non-central government public sector entities 0 0 0 0 0 0 3,349 0 0 3,349
Multilateral development banks 0 0 0 0 0 0 0 0 0 0
International organisations 0 0 0 0 0 0 0 0 0 0
Institutions 0 0 304 0 117 0 150 0 0 571
Corporates 0 0 0 0 0 0 13,430 5 0 13,434
Regulatory retail exposures 0 0 0 0 0 2,865 0 0 0 2,865
Exposures secured by mortgages on immovable 0 0 0 526 483 1 59 0 0 1,068
Exposures in default 0 0 0 0 0 0 727 763 0 1,489
Exposures associated with particularly high risks 0 0 0 0 0 0 0 0 0 0
Covered bonds 0 0 108 0 0 0 0 0 0 108
Exposures to institutions and corporates with a
short-term credit assesment0 0 0 0 0 0 0 0 0 0
Exposures in the form of units or shares in
collective investment undertakings (CIU's)0 0 0 0 0 0 0 0 0 0
Other assets 0 0 0 0 0 0 15,070 0 0 15,070
Total Credit Risk - SA portfolio (*) 0 0 412 526 599 2,865 38,586 767 2,354 46,110
(*) Credit Risk exposures included. Counterparty, Securisitation and Equity exposures not included.
(**) Risk weighted amounts are those after the application of the SME factor (0,7619) defined in the CRR 501 article.
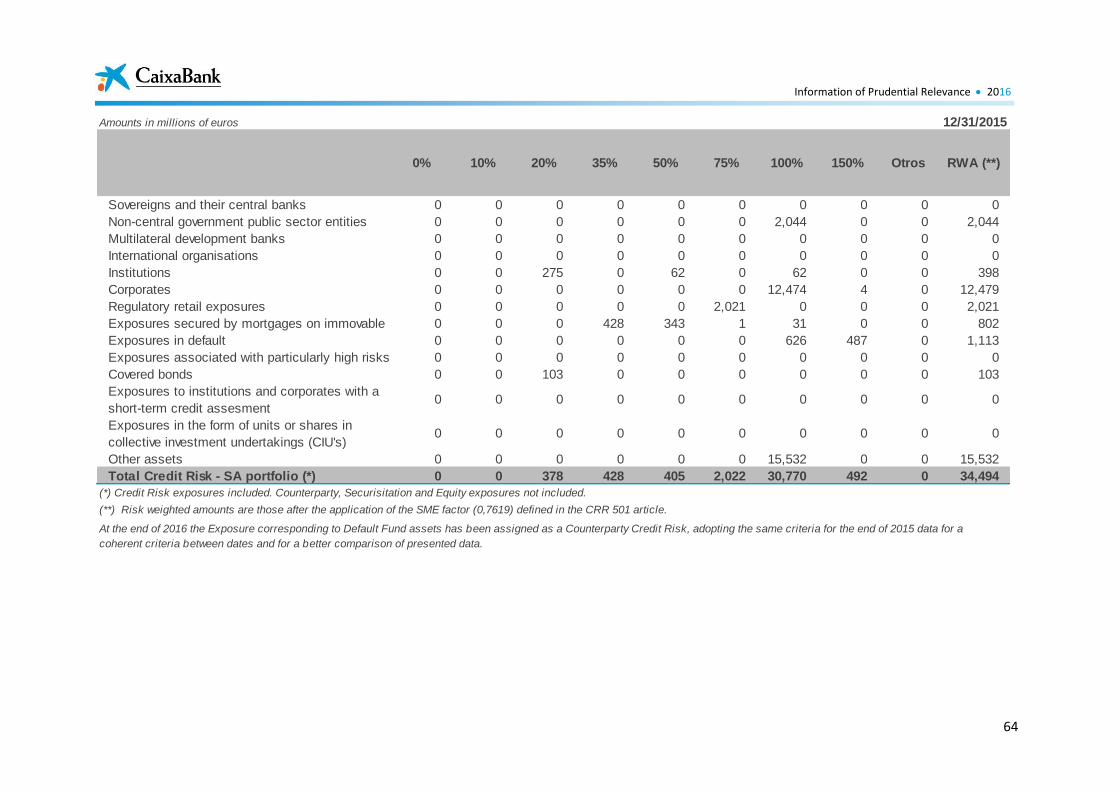
Information of Prudential Relevance 2016
64
Amounts in millions of euros 12/31/2015
0% 10% 20% 35% 50% 75% 100% 150% Otros RWA (**)
Sovereigns and their central banks 0 0 0 0 0 0 0 0 0 0
Non-central government public sector entities 0 0 0 0 0 0 2,044 0 0 2,044
Multilateral development banks 0 0 0 0 0 0 0 0 0 0
International organisations 0 0 0 0 0 0 0 0 0 0
Institutions 0 0 275 0 62 0 62 0 0 398
Corporates 0 0 0 0 0 0 12,474 4 0 12,479
Regulatory retail exposures 0 0 0 0 0 2,021 0 0 0 2,021
Exposures secured by mortgages on immovable 0 0 0 428 343 1 31 0 0 802
Exposures in default 0 0 0 0 0 0 626 487 0 1,113
Exposures associated with particularly high risks 0 0 0 0 0 0 0 0 0 0
Covered bonds 0 0 103 0 0 0 0 0 0 103
Exposures to institutions and corporates with a
short-term credit assesment0 0 0 0 0 0 0 0 0 0
Exposures in the form of units or shares in
collective investment undertakings (CIU's)0 0 0 0 0 0 0 0 0 0
Other assets 0 0 0 0 0 0 15,532 0 0 15,532
Total Credit Risk - SA portfolio (*) 0 0 378 428 405 2,022 30,770 492 0 34,494
(*) Credit Risk exposures included. Counterparty, Securisitation and Equity exposures not included.
(**) Risk weighted amounts are those after the application of the SME factor (0,7619) defined in the CRR 501 article.
At the end of 2016 the Exposure corresponding to Default Fund assets has been assigned as a Counterparty Credit Risk, adopting the same criteria for the end of 2015 data for a
coherent criteria between dates and for a better comparison of presented data.
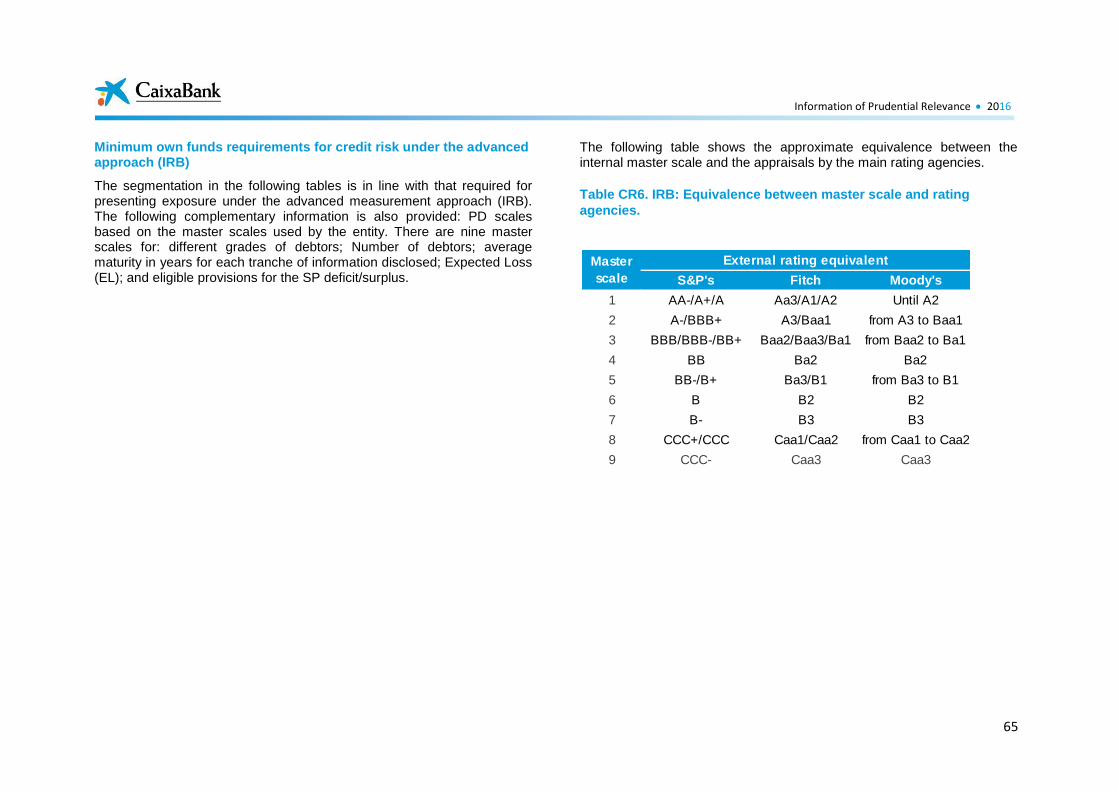
Information of Prudential Relevance 2016
65
Minimum own funds requirements for credit risk under the advanced approach (IRB)
The segmentation in the following tables is in line with that required for presenting exposure under the advanced measurement approach (IRB). The following complementary information is also provided: PD scales based on the master scales used by the entity. There are nine master scales for: different grades of debtors; Number of debtors; average maturity in years for each tranche of information disclosed; Expected Loss (EL); and eligible provisions for the SP deficit/surplus.
The following table shows the approximate equivalence between the internal master scale and the appraisals by the main rating agencies.
Table CR6. IRB: Equivalence between master scale and rating
agencies.
S&P's Fitch Moody's
1 AA-/A+/A Aa3/A1/A2 Until A2
2 A-/BBB+ A3/Baa1 from A3 to Baa1
3 BBB/BBB-/BB+ Baa2/Baa3/Ba1 from Baa2 to Ba1
4 BB Ba2 Ba2
5 BB-/B+ Ba3/B1 from Ba3 to B1
6 B B2 B2
7 B- B3 B3
8 CCC+/CCC Caa1/Caa2 from Caa1 to Caa2
9 CCC- Caa3 Caa3
Master
scale
External rating equivalent
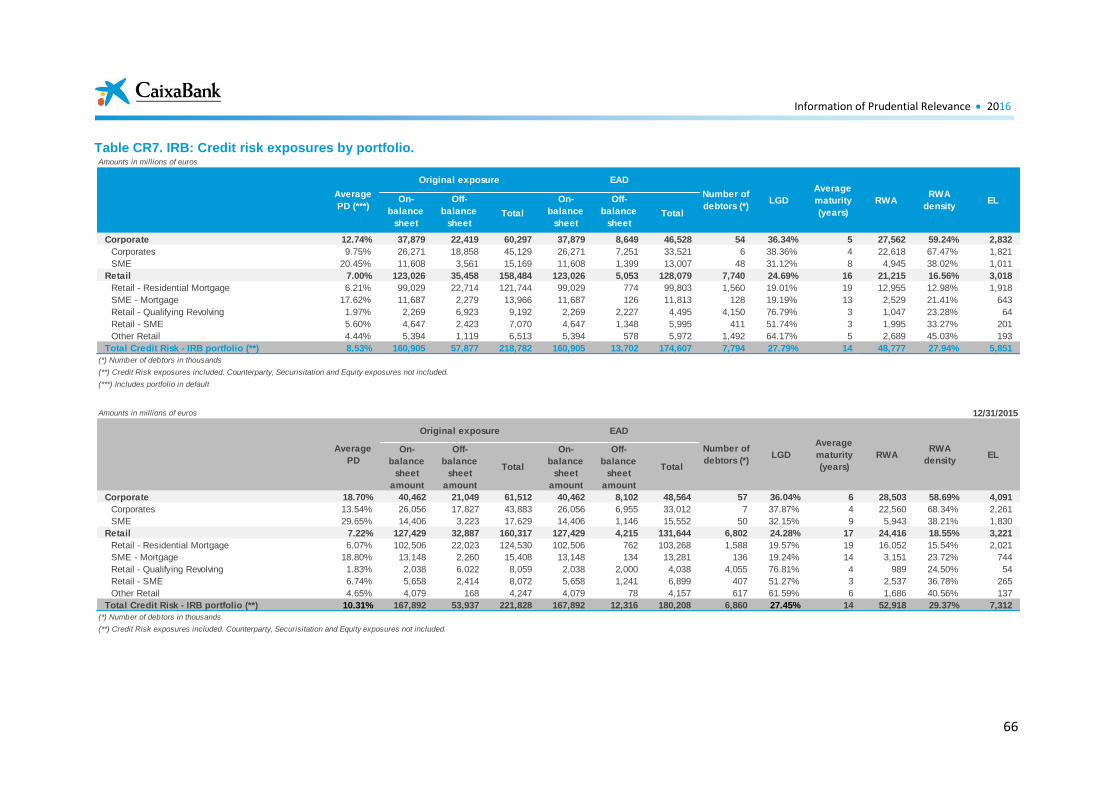
Information of Prudential Relevance 2016
66
Table CR7. IRB: Credit risk exposures by portfolio.
Amounts in millions of euros
On-
balance
sheet
amount
Off-
balance
sheet
amount
Total
On-
balance
sheet
amount
Off-
balance
sheet
amount
Total
Corporate 12.74% 37,879 22,419 60,297 37,879 8,649 46,528 54 36.34% 5 27,562 59.24% 2,832
Corporates 9.75% 26,271 18,858 45,129 26,271 7,251 33,521 6 38.36% 4 22,618 67.47% 1,821
SME 20.45% 11,608 3,561 15,169 11,608 1,399 13,007 48 31.12% 8 4,945 38.02% 1,011
Retail 7.00% 123,026 35,458 158,484 123,026 5,053 128,079 7,740 24.69% 16 21,215 16.56% 3,018
Retail - Residential Mortgage 6.21% 99,029 22,714 121,744 99,029 774 99,803 1,560 19.01% 19 12,955 12.98% 1,918
SME - Mortgage 17.62% 11,687 2,279 13,966 11,687 126 11,813 128 19.19% 13 2,529 21.41% 643
Retail - Qualifying Revolving 1.97% 2,269 6,923 9,192 2,269 2,227 4,495 4,150 76.79% 3 1,047 23.28% 64
Retail - SME 5.60% 4,647 2,423 7,070 4,647 1,348 5,995 411 51.74% 3 1,995 33.27% 201
Other Retail 4.44% 5,394 1,119 6,513 5,394 578 5,972 1,492 64.17% 5 2,689 45.03% 193
Total Credit Risk - IRB portfolio (**) 8.53% 160,905 57,877 218,782 160,905 13,702 174,607 7,794 27.79% 14 48,777 27.94% 5,851
(*) Number of debtors in thousands
(**) Credit Risk exposures included. Counterparty, Securisitation and Equity exposures not included.
(***) Includes portfolio in default
Average
PD (***)
RWA
densityEL
Original exposure EAD
Number of
debtors (*)LGD
Average
maturity
(years)
RWA
Amounts in millions of euros 12/31/2015
On-
balance
sheet
amount
Off-
balance
sheet
amount
Total
On-
balance
sheet
amount
Off-
balance
sheet
amount
Total
Corporate 18.70% 40,462 21,049 61,512 40,462 8,102 48,564 57 36.04% 6 28,503 58.69% 4,091
Corporates 13.54% 26,056 17,827 43,883 26,056 6,955 33,012 7 37.87% 4 22,560 68.34% 2,261
SME 29.65% 14,406 3,223 17,629 14,406 1,146 15,552 50 32.15% 9 5,943 38.21% 1,830
Retail 7.22% 127,429 32,887 160,317 127,429 4,215 131,644 6,802 24.28% 17 24,416 18.55% 3,221
Retail - Residential Mortgage 6.07% 102,506 22,023 124,530 102,506 762 103,268 1,588 19.57% 19 16,052 15.54% 2,021
SME - Mortgage 18.80% 13,148 2,260 15,408 13,148 134 13,281 136 19.24% 14 3,151 23.72% 744
Retail - Qualifying Revolving 1.83% 2,038 6,022 8,059 2,038 2,000 4,038 4,055 76.81% 4 989 24.50% 54
Retail - SME 6.74% 5,658 2,414 8,072 5,658 1,241 6,899 407 51.27% 3 2,537 36.78% 265
Other Retail 4.65% 4,079 168 4,247 4,079 78 4,157 617 61.59% 6 1,686 40.56% 137
Total Credit Risk - IRB portfolio (**) 10.31% 167,892 53,937 221,828 167,892 12,316 180,208 6,860 27.45% 14 52,918 29.37% 7,312
(*) Number of debtors in thousands
(**) Credit Risk exposures included. Counterparty, Securisitation and Equity exposures not included.
Average
PD
RWA
densityEL
Original exposure EAD
Number of
debtors (*)LGD
Average
maturity
(years)
RWA
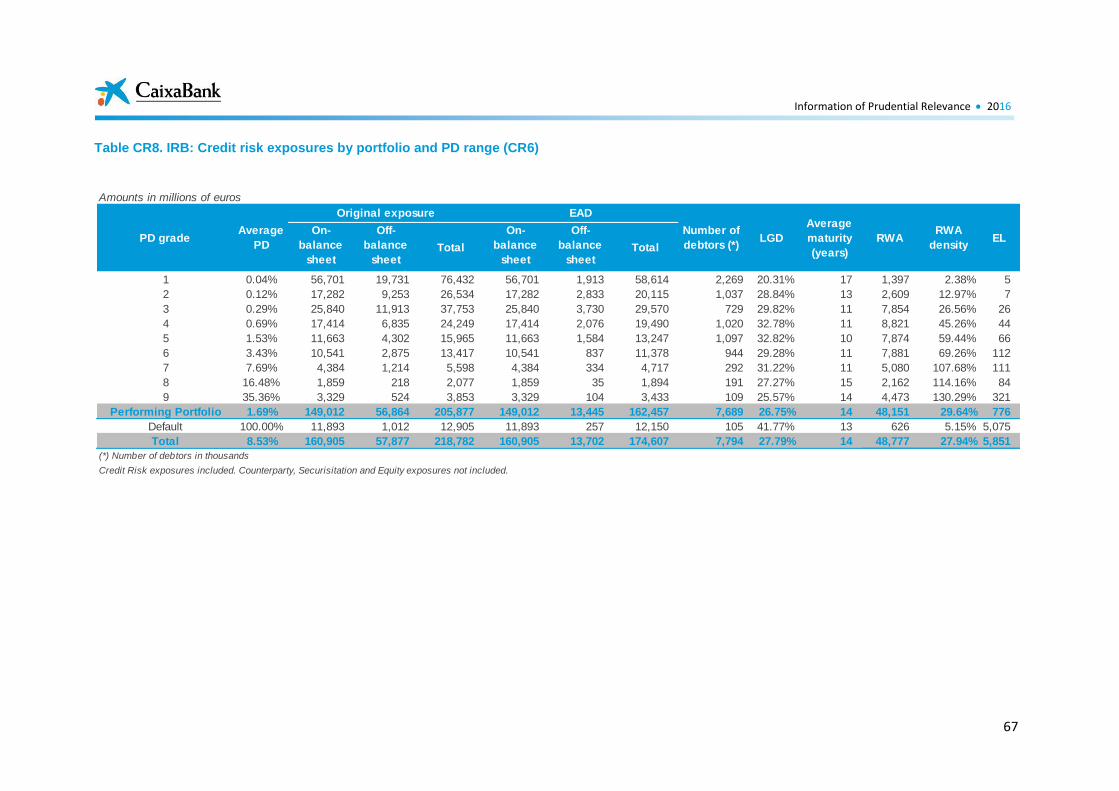
Information of Prudential Relevance 2016
67
Table CR8. IRB: Credit risk exposures by portfolio and PD range (CR6)
Amounts in millions of euros
On-
balance
sheet
amount
Off-
balance
sheet
amount
Total
On-
balance
sheet
amount
Off-
balance
sheet
amount
Total
1 0.04% 56,701 19,731 76,432 56,701 1,913 58,614 2,269 20.31% 17 1,397 2.38% 5
2 0.12% 17,282 9,253 26,534 17,282 2,833 20,115 1,037 28.84% 13 2,609 12.97% 7
3 0.29% 25,840 11,913 37,753 25,840 3,730 29,570 729 29.82% 11 7,854 26.56% 26
4 0.69% 17,414 6,835 24,249 17,414 2,076 19,490 1,020 32.78% 11 8,821 45.26% 44
5 1.53% 11,663 4,302 15,965 11,663 1,584 13,247 1,097 32.82% 10 7,874 59.44% 66
6 3.43% 10,541 2,875 13,417 10,541 837 11,378 944 29.28% 11 7,881 69.26% 112
7 7.69% 4,384 1,214 5,598 4,384 334 4,717 292 31.22% 11 5,080 107.68% 111
8 16.48% 1,859 218 2,077 1,859 35 1,894 191 27.27% 15 2,162 114.16% 84
9 35.36% 3,329 524 3,853 3,329 104 3,433 109 25.57% 14 4,473 130.29% 321
Performing Portfolio 1.69% 149,012 56,864 205,877 149,012 13,445 162,457 7,689 26.75% 14 48,151 29.64% 776
Default 100.00% 11,893 1,012 12,905 11,893 257 12,150 105 41.77% 13 626 5.15% 5,075
Total 8.53% 160,905 57,877 218,782 160,905 13,702 174,607 7,794 27.79% 14 48,777 27.94% 5,851
(*) Number of debtors in thousands
Credit Risk exposures included. Counterparty, Securisitation and Equity exposures not included.
LGD
Average
maturity
(years)
RWARWA
densityEL
Number of
debtors (*)PD grade
Average
PD
Original exposure EAD
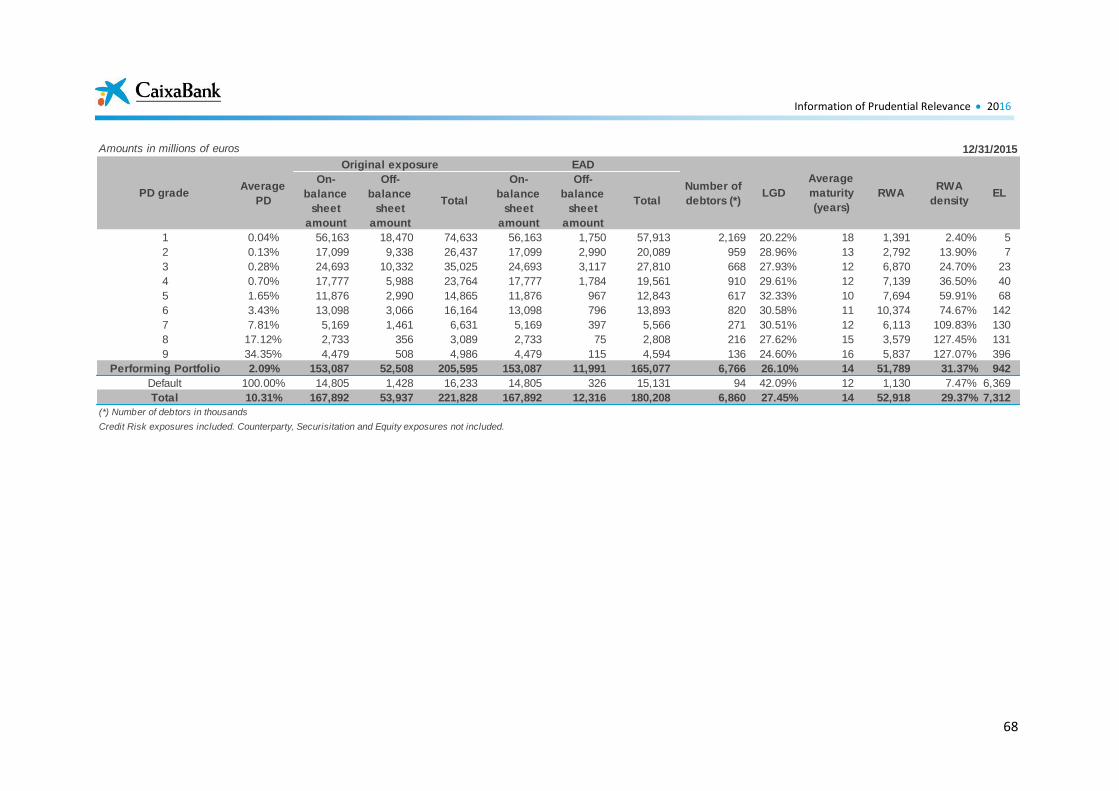
Information of Prudential Relevance 2016
68
Amounts in millions of euros
On-
balance
sheet
amount
Off-
balance
sheet
amount
Total
On-
balance
sheet
amount
Off-
balance
sheet
amount
Total
1 0.04% 56,163 18,470 74,633 56,163 1,750 57,913 2,169 20.22% 18 1,391 2.40% 5
2 0.13% 17,099 9,338 26,437 17,099 2,990 20,089 959 28.96% 13 2,792 13.90% 7
3 0.28% 24,693 10,332 35,025 24,693 3,117 27,810 668 27.93% 12 6,870 24.70% 23
4 0.70% 17,777 5,988 23,764 17,777 1,784 19,561 910 29.61% 12 7,139 36.50% 40
5 1.65% 11,876 2,990 14,865 11,876 967 12,843 617 32.33% 10 7,694 59.91% 68
6 3.43% 13,098 3,066 16,164 13,098 796 13,893 820 30.58% 11 10,374 74.67% 142
7 7.81% 5,169 1,461 6,631 5,169 397 5,566 271 30.51% 12 6,113 109.83% 130
8 17.12% 2,733 356 3,089 2,733 75 2,808 216 27.62% 15 3,579 127.45% 131
9 34.35% 4,479 508 4,986 4,479 115 4,594 136 24.60% 16 5,837 127.07% 396
Performing Portfolio 2.09% 153,087 52,508 205,595 153,087 11,991 165,077 6,766 26.10% 14 51,789 31.37% 942
Default 100.00% 14,805 1,428 16,233 14,805 326 15,131 94 42.09% 12 1,130 7.47% 6,369
Total 10.31% 167,892 53,937 221,828 167,892 12,316 180,208 6,860 27.45% 14 52,918 29.37% 7,312
(*) Number of debtors in thousands
Credit Risk exposures included. Counterparty, Securisitation and Equity exposures not included.
12/31/2015
Number of
debtors (*)PD grade
Average
PD
Original exposure EAD
LGD
Average
maturity
(years)
RWARWA
densityEL
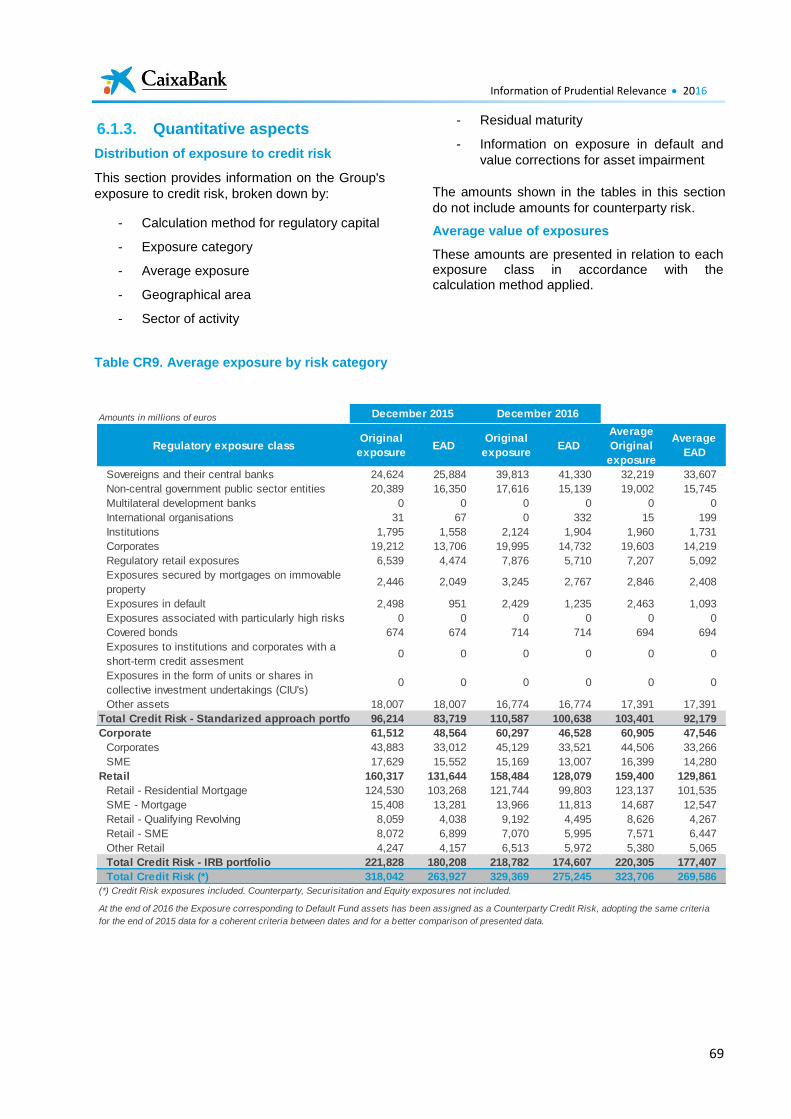
Information of Prudential Relevance 2016
69
6.1.3. Quantitative aspects
Distribution of exposure to credit risk
This section provides information on the Group's
exposure to credit risk, broken down by:
- Calculation method for regulatory capital
- Exposure category
- Average exposure
- Geographical area
- Sector of activity
- Residual maturity
- Information on exposure in default and
value corrections for asset impairment
The amounts shown in the tables in this section
do not include amounts for counterparty risk.
Average value of exposures
These amounts are presented in relation to each exposure class in accordance with the calculation method applied.
Table CR9. Average exposure by risk category
Amounts in millions of euros
Regulatory exposure classOriginal
exposureEAD
Original
exposureEAD
Average
Original
exposure
Average
EAD
Sovereigns and their central banks 24,624 25,884 39,813 41,330 32,219 33,607
Non-central government public sector entities 20,389 16,350 17,616 15,139 19,002 15,745
Multilateral development banks 0 0 0 0 0 0
International organisations 31 67 0 332 15 199
Institutions 1,795 1,558 2,124 1,904 1,960 1,731
Corporates 19,212 13,706 19,995 14,732 19,603 14,219
Regulatory retail exposures 6,539 4,474 7,876 5,710 7,207 5,092
Exposures secured by mortgages on immovable
property2,446 2,049 3,245 2,767 2,846 2,408
Exposures in default 2,498 951 2,429 1,235 2,463 1,093
Exposures associated with particularly high risks 0 0 0 0 0 0
Covered bonds 674 674 714 714 694 694
Exposures to institutions and corporates with a
short-term credit assesment0 0 0 0 0 0
Exposures in the form of units or shares in
collective investment undertakings (CIU's)0 0 0 0 0 0
Other assets 18,007 18,007 16,774 16,774 17,391 17,391
Total Credit Risk - Standarized approach portfolio 96,214 83,719 110,587 100,638 103,401 92,179
Corporate 61,512 48,564 60,297 46,528 60,905 47,546
Corporates 43,883 33,012 45,129 33,521 44,506 33,266
SME 17,629 15,552 15,169 13,007 16,399 14,280
Retail 160,317 131,644 158,484 128,079 159,400 129,861
Retail - Residential Mortgage 124,530 103,268 121,744 99,803 123,137 101,535
SME - Mortgage 15,408 13,281 13,966 11,813 14,687 12,547
Retail - Qualifying Revolving 8,059 4,038 9,192 4,495 8,626 4,267
Retail - SME 8,072 6,899 7,070 5,995 7,571 6,447
Other Retail 4,247 4,157 6,513 5,972 5,380 5,065
Total Credit Risk - IRB portfolio 221,828 180,208 218,782 174,607 220,305 177,407
Total Credit Risk (*) 318,042 263,927 329,369 275,245 323,706 269,586
(*) Credit Risk exposures included. Counterparty, Securisitation and Equity exposures not included.
December 2015 December 2016
At the end of 2016 the Exposure corresponding to Default Fund assets has been assigned as a Counterparty Credit Risk, adopting the same criteria
for the end of 2015 data for a coherent criteria between dates and for a better comparison of presented data.
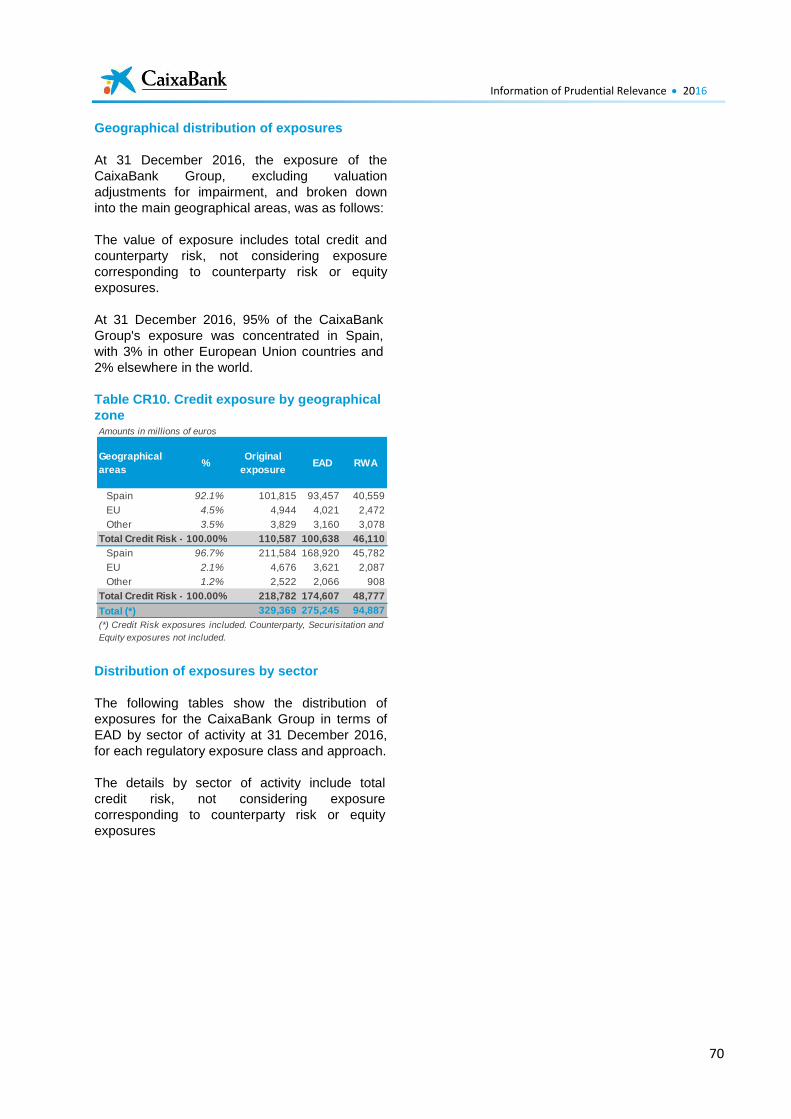
Information of Prudential Relevance 2016
70
Geographical distribution of exposures
At 31 December 2016, the exposure of the
CaixaBank Group, excluding valuation
adjustments for impairment, and broken down
into the main geographical areas, was as follows:
The value of exposure includes total credit and
counterparty risk, not considering exposure
corresponding to counterparty risk or equity
exposures.
At 31 December 2016, 95% of the CaixaBank
Group's exposure was concentrated in Spain,
with 3% in other European Union countries and
2% elsewhere in the world.
Table CR10. Credit exposure by geographical
zone
Distribution of exposures by sector
The following tables show the distribution of
exposures for the CaixaBank Group in terms of
EAD by sector of activity at 31 December 2016,
for each regulatory exposure class and approach.
The details by sector of activity include total
credit risk, not considering exposure
corresponding to counterparty risk or equity
exposures
Amounts in millions of euros
Geographical
areas%
Original
exposureEAD RWA
Spain 92.1% 101,815 93,457 40,559
EU 4.5% 4,944 4,021 2,472
Other 3.5% 3,829 3,160 3,078
Total Credit Risk -
SA portfolio
100.00% 110,587 100,638 46,110
Spain 96.7% 211,584 168,920 45,782
EU 2.1% 4,676 3,621 2,087
Other 1.2% 2,522 2,066 908
Total Credit Risk -
IRB portfolio
100.00% 218,782 174,607 48,777
Total (*) 329,369 275,245 94,887
(*) Credit Risk exposures included. Counterparty, Securisitation and
Equity exposures not included.
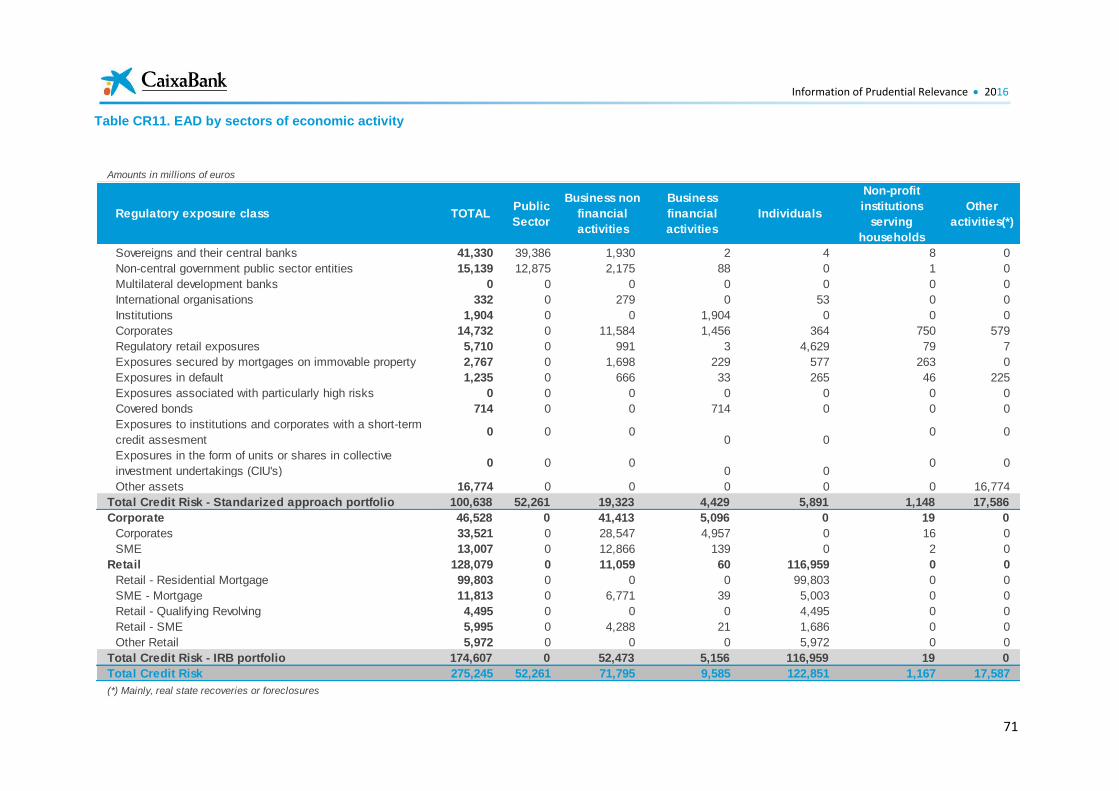
Information of Prudential Relevance 2016
71
Table CR11. EAD by sectors of economic activity
Amounts in millions of euros
Regulatory exposure class TOTALPublic
Sector
Business non
financial
activities
Business
financial
activities
Individuals
Non-profit
institutions
serving
households
Other
activities(*)
Sovereigns and their central banks 41,330 39,386 1,930 2 4 8 0
Non-central government public sector entities 15,139 12,875 2,175 88 0 1 0
Multilateral development banks 0 0 0 0 0 0 0
International organisations 332 0 279 0 53 0 0
Institutions 1,904 0 0 1,904 0 0 0
Corporates 14,732 0 11,584 1,456 364 750 579
Regulatory retail exposures 5,710 0 991 3 4,629 79 7
Exposures secured by mortgages on immovable property 2,767 0 1,698 229 577 263 0
Exposures in default 1,235 0 666 33 265 46 225
Exposures associated with particularly high risks 0 0 0 0 0 0 0
Covered bonds 714 0 0 714 0 0 0
Exposures to institutions and corporates with a short-term
credit assesment0 0 0
0 0 0 0
Exposures in the form of units or shares in collective
investment undertakings (CIU's)0 0 0
0 0 0 0
Other assets 16,774 0 0 0 0 0 16,774
Total Credit Risk - Standarized approach portfolio 100,638 52,261 19,323 4,429 5,891 1,148 17,586
Corporate 46,528 0 41,413 5,096 0 19 0
Corporates 33,521 0 28,547 4,957 0 16 0
SME 13,007 0 12,866 139 0 2 0
Retail 128,079 0 11,059 60 116,959 0 0
Retail - Residential Mortgage 99,803 0 0 0 99,803 0 0
SME - Mortgage 11,813 0 6,771 39 5,003 0 0
Retail - Qualifying Revolving 4,495 0 0 0 4,495 0 0
Retail - SME 5,995 0 4,288 21 1,686 0 0
Other Retail 5,972 0 0 0 5,972 0 0
Total Credit Risk - IRB portfolio 174,607 0 52,473 5,156 116,959 19 0
Total Credit Risk 275,245 52,261 71,795 9,585 122,851 1,167 17,587
(*) Mainly, real state recoveries or foreclosures
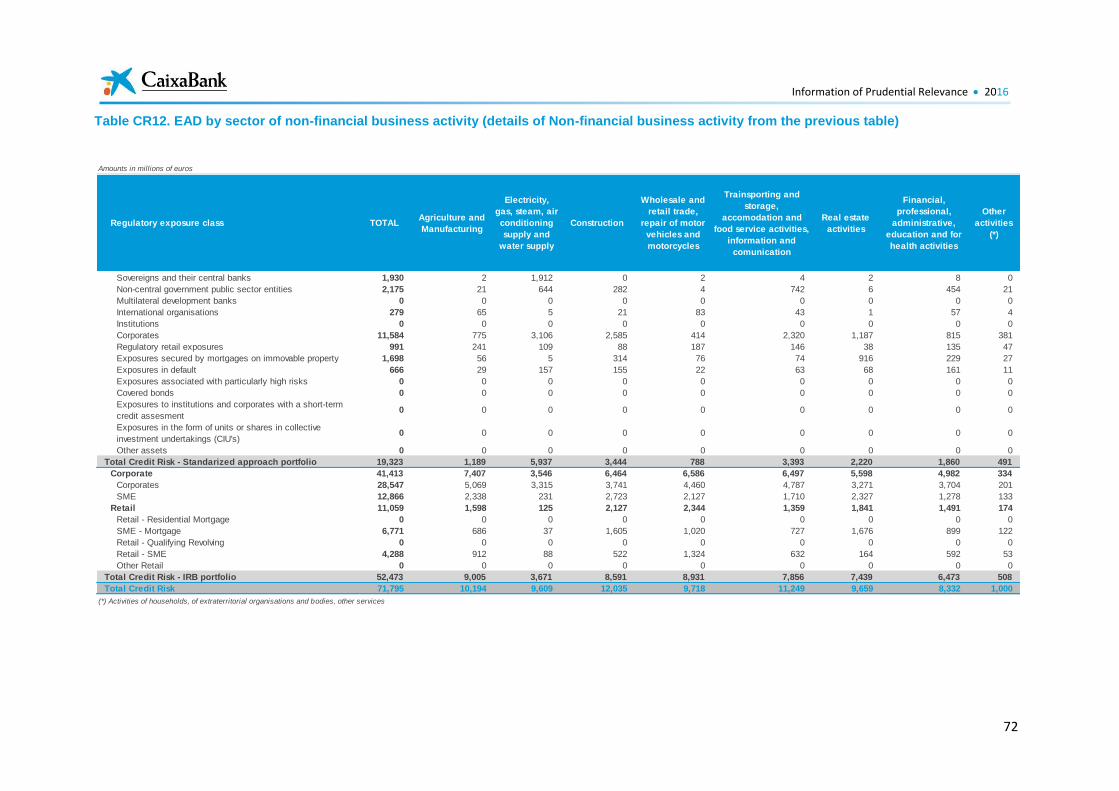
Information of Prudential Relevance 2016
72
Table CR12. EAD by sector of non-financial business activity (details of Non-financial business activity from the previous table)
Amounts in millions of euros
Regulatory exposure class TOTALAgriculture and
Manufacturing
Electricity,
gas, steam, air
conditioning
supply and
water supply
Construction
Wholesale and
retail trade,
repair of motor
vehicles and
motorcycles
Trainsporting and
storage,
accomodation and
food service activities,
information and
comunication
Real estate
activities
Financial,
professional,
administrative,
education and for
health activities
Other
activities
(*)
Sovereigns and their central banks 1,930 2 1,912 0 2 4 2 8 0
Non-central government public sector entities 2,175 21 644 282 4 742 6 454 21
Multilateral development banks 0 0 0 0 0 0 0 0 0
International organisations 279 65 5 21 83 43 1 57 4
Institutions 0 0 0 0 0 0 0 0 0
Corporates 11,584 775 3,106 2,585 414 2,320 1,187 815 381
Regulatory retail exposures 991 241 109 88 187 146 38 135 47
Exposures secured by mortgages on immovable property 1,698 56 5 314 76 74 916 229 27
Exposures in default 666 29 157 155 22 63 68 161 11
Exposures associated with particularly high risks 0 0 0 0 0 0 0 0 0
Covered bonds 0 0 0 0 0 0 0 0 0
Exposures to institutions and corporates with a short-term
credit assesment0 0 0 0 0 0 0 0 0
Exposures in the form of units or shares in collective
investment undertakings (CIU's)0 0 0 0 0 0 0 0 0
Other assets 0 0 0 0 0 0 0 0 0
Total Credit Risk - Standarized approach portfolio 19,323 1,189 5,937 3,444 788 3,393 2,220 1,860 491
Corporate 41,413 7,407 3,546 6,464 6,586 6,497 5,598 4,982 334
Corporates 28,547 5,069 3,315 3,741 4,460 4,787 3,271 3,704 201
SME 12,866 2,338 231 2,723 2,127 1,710 2,327 1,278 133
Retail 11,059 1,598 125 2,127 2,344 1,359 1,841 1,491 174
Retail - Residential Mortgage 0 0 0 0 0 0 0 0 0
SME - Mortgage 6,771 686 37 1,605 1,020 727 1,676 899 122
Retail - Qualifying Revolving 0 0 0 0 0 0 0 0 0
Retail - SME 4,288 912 88 522 1,324 632 164 592 53
Other Retail 0 0 0 0 0 0 0 0 0
Total Credit Risk - IRB portfolio 52,473 9,005 3,671 8,591 8,931 7,856 7,439 6,473 508
Total Credit Risk 71,795 10,194 9,609 12,035 9,718 11,249 9,659 8,332 1,000
(*) Activities of households, of extraterritorial organisations and bodies, other services
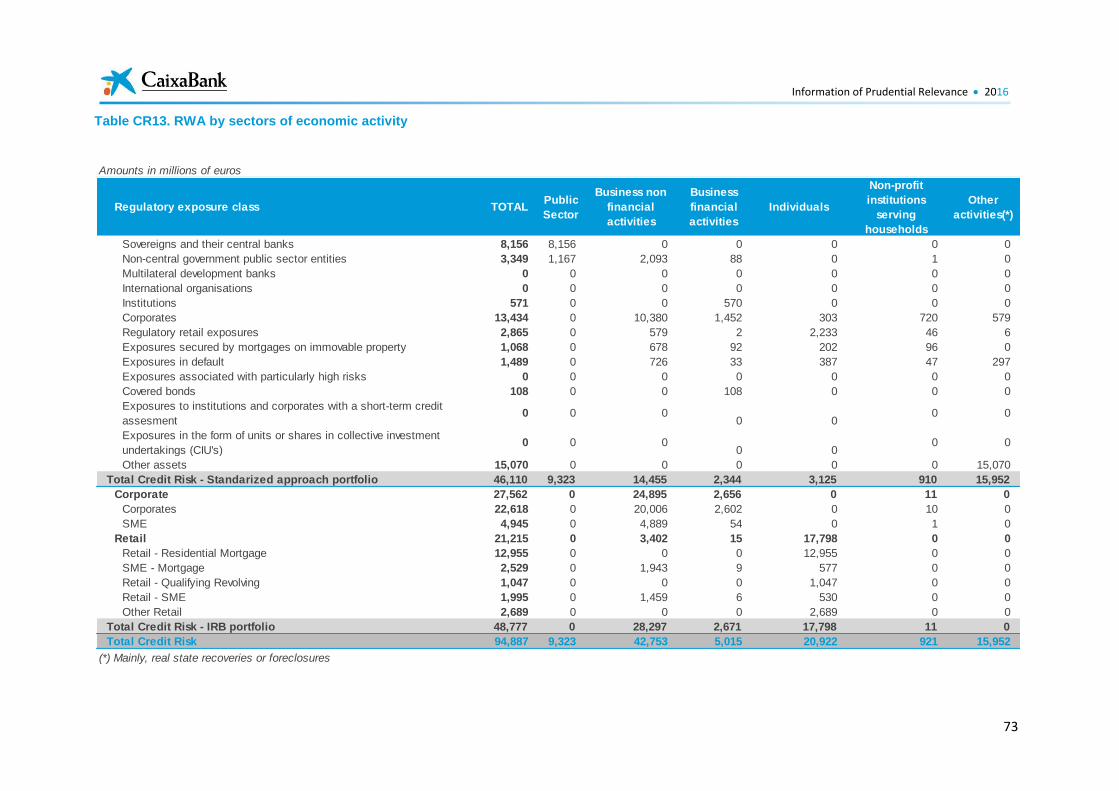
Information of Prudential Relevance 2016
73
Table CR13. RWA by sectors of economic activity
Amounts in millions of euros
Regulatory exposure class TOTALPublic
Sector
Business non
financial
activities
Business
financial
activities
Individuals
Non-profit
institutions
serving
households
Other
activities(*)
Sovereigns and their central banks 8,156 8,156 0 0 0 0 0
Non-central government public sector entities 3,349 1,167 2,093 88 0 1 0
Multilateral development banks 0 0 0 0 0 0 0
International organisations 0 0 0 0 0 0 0
Institutions 571 0 0 570 0 0 0
Corporates 13,434 0 10,380 1,452 303 720 579
Regulatory retail exposures 2,865 0 579 2 2,233 46 6
Exposures secured by mortgages on immovable property 1,068 0 678 92 202 96 0
Exposures in default 1,489 0 726 33 387 47 297
Exposures associated with particularly high risks 0 0 0 0 0 0 0
Covered bonds 108 0 0 108 0 0 0
Exposures to institutions and corporates with a short-term credit
assesment0 0 0
0 0 0 0
Exposures in the form of units or shares in collective investment
undertakings (CIU's)0 0 0
0 0 0 0
Other assets 15,070 0 0 0 0 0 15,070
Total Credit Risk - Standarized approach portfolio 46,110 9,323 14,455 2,344 3,125 910 15,952
Corporate 27,562 0 24,895 2,656 0 11 0
Corporates 22,618 0 20,006 2,602 0 10 0
SME 4,945 0 4,889 54 0 1 0
Retail 21,215 0 3,402 15 17,798 0 0
Retail - Residential Mortgage 12,955 0 0 0 12,955 0 0
SME - Mortgage 2,529 0 1,943 9 577 0 0
Retail - Qualifying Revolving 1,047 0 0 0 1,047 0 0
Retail - SME 1,995 0 1,459 6 530 0 0
Other Retail 2,689 0 0 0 2,689 0 0
Total Credit Risk - IRB portfolio 48,777 0 28,297 2,671 17,798 11 0
Total Credit Risk 94,887 9,323 42,753 5,015 20,922 921 15,952
(*) Mainly, real state recoveries or foreclosures
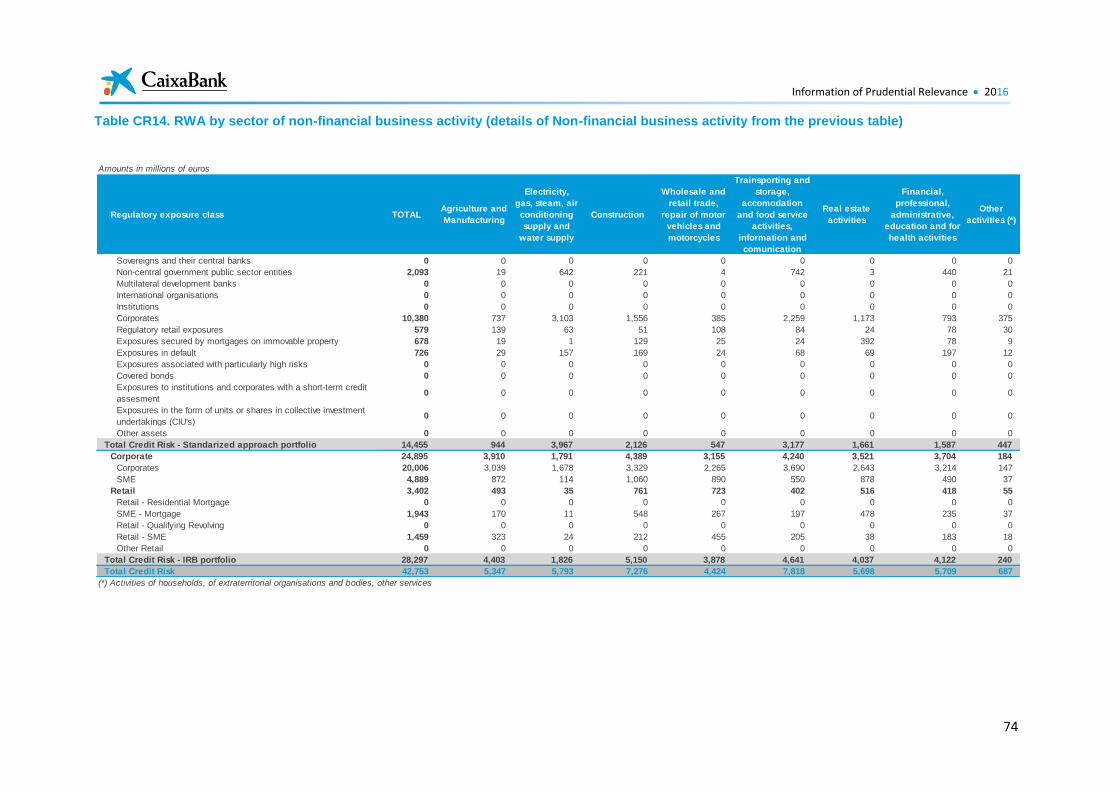
Information of Prudential Relevance 2016
74
Table CR14. RWA by sector of non-financial business activity (details of Non-financial business activity from the previous table)
Amounts in millions of euros
Regulatory exposure class TOTALAgriculture and
Manufacturing
Electricity,
gas, steam, air
conditioning
supply and
water supply
Construction
Wholesale and
retail trade,
repair of motor
vehicles and
motorcycles
Trainsporting and
storage,
accomodation
and food service
activities,
information and
comunication
Real estate
activities
Financial,
professional,
administrative,
education and for
health activities
Other
activities (*)
Sovereigns and their central banks 0 0 0 0 0 0 0 0 0
Non-central government public sector entities 2,093 19 642 221 4 742 3 440 21
Multilateral development banks 0 0 0 0 0 0 0 0 0
International organisations 0 0 0 0 0 0 0 0 0
Institutions 0 0 0 0 0 0 0 0 0
Corporates 10,380 737 3,103 1,556 385 2,259 1,173 793 375
Regulatory retail exposures 579 139 63 51 108 84 24 78 30
Exposures secured by mortgages on immovable property 678 19 1 129 25 24 392 78 9
Exposures in default 726 29 157 169 24 68 69 197 12
Exposures associated with particularly high risks 0 0 0 0 0 0 0 0 0
Covered bonds 0 0 0 0 0 0 0 0 0
Exposures to institutions and corporates with a short-term credit
assesment0 0 0 0 0 0 0 0 0
Exposures in the form of units or shares in collective investment
undertakings (CIU's)0 0 0 0 0 0 0 0 0
Other assets 0 0 0 0 0 0 0 0 0
Total Credit Risk - Standarized approach portfolio 14,455 944 3,967 2,126 547 3,177 1,661 1,587 447
Corporate 24,895 3,910 1,791 4,389 3,155 4,240 3,521 3,704 184
Corporates 20,006 3,039 1,678 3,329 2,265 3,690 2,643 3,214 147
SME 4,889 872 114 1,060 890 550 878 490 37
Retail 3,402 493 35 761 723 402 516 418 55
Retail - Residential Mortgage 0 0 0 0 0 0 0 0 0
SME - Mortgage 1,943 170 11 548 267 197 478 235 37
Retail - Qualifying Revolving 0 0 0 0 0 0 0 0 0
Retail - SME 1,459 323 24 212 455 205 38 183 18
Other Retail 0 0 0 0 0 0 0 0 0
Total Credit Risk - IRB portfolio 28,297 4,403 1,826 5,150 3,878 4,641 4,037 4,122 240
Total Credit Risk 42,753 5,347 5,793 7,276 4,424 7,818 5,698 5,709 687
(*) Activities of households, of extraterritorial organisations and bodies, other services
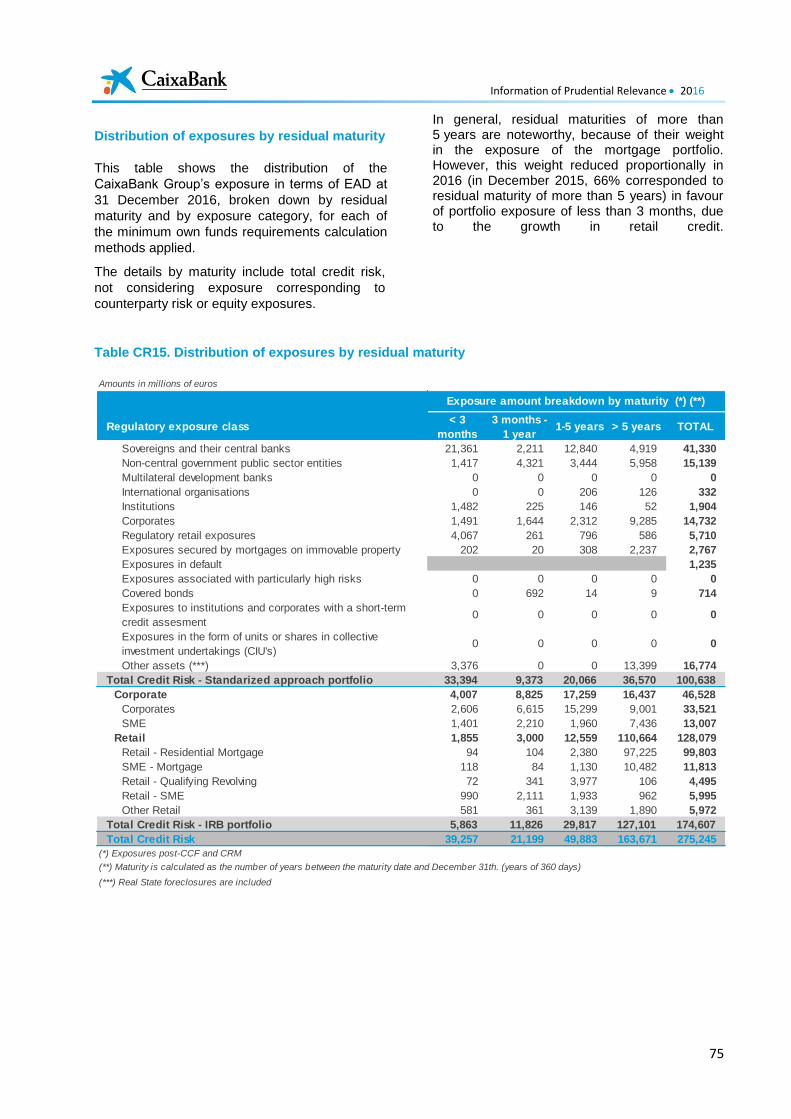
Information of Prudential Relevance 2016
75
Distribution of exposures by residual maturity
This table shows the distribution of the
CaixaBank Group’s exposure in terms of EAD at
31 December 2016, broken down by residual
maturity and by exposure category, for each of
the minimum own funds requirements calculation
methods applied.
The details by maturity include total credit risk,
not considering exposure corresponding to
counterparty risk or equity exposures.
In general, residual maturities of more than 5 years are noteworthy, because of their weight in the exposure of the mortgage portfolio. However, this weight reduced proportionally in 2016 (in December 2015, 66% corresponded to residual maturity of more than 5 years) in favour of portfolio exposure of less than 3 months, due to the growth in retail credit.
Table CR15. Distribution of exposures by residual maturity
Amounts in millions of euros
Regulatory exposure class< 3
months
3 months -
1 year1-5 years > 5 years TOTAL
Sovereigns and their central banks 21,361 2,211 12,840 4,919 41,330
Non-central government public sector entities 1,417 4,321 3,444 5,958 15,139
Multilateral development banks 0 0 0 0 0
International organisations 0 0 206 126 332
Institutions 1,482 225 146 52 1,904
Corporates 1,491 1,644 2,312 9,285 14,732
Regulatory retail exposures 4,067 261 796 586 5,710
Exposures secured by mortgages on immovable property 202 20 308 2,237 2,767
Exposures in default 1,235
Exposures associated with particularly high risks 0 0 0 0 0
Covered bonds 0 692 14 9 714
Exposures to institutions and corporates with a short-term
credit assesment0 0 0 0 0
Exposures in the form of units or shares in collective
investment undertakings (CIU's)0 0 0 0 0
Other assets (***) 3,376 0 0 13,399 16,774
Total Credit Risk - Standarized approach portfolio 33,394 9,373 20,066 36,570 100,638
Corporate 4,007 8,825 17,259 16,437 46,528
Corporates 2,606 6,615 15,299 9,001 33,521
SME 1,401 2,210 1,960 7,436 13,007
Retail 1,855 3,000 12,559 110,664 128,079
Retail - Residential Mortgage 94 104 2,380 97,225 99,803
SME - Mortgage 118 84 1,130 10,482 11,813
Retail - Qualifying Revolving 72 341 3,977 106 4,495
Retail - SME 990 2,111 1,933 962 5,995
Other Retail 581 361 3,139 1,890 5,972
Total Credit Risk - IRB portfolio 5,863 11,826 29,817 127,101 174,607
Total Credit Risk 39,257 21,199 49,883 163,671 275,245
(*) Exposures post-CCF and CRM
(***) Real State foreclosures are included
Exposure amount breakdown by maturity (*) (**)
(**) Maturity is calculated as the number of years between the maturity date and December 31th. (years of 360 days)
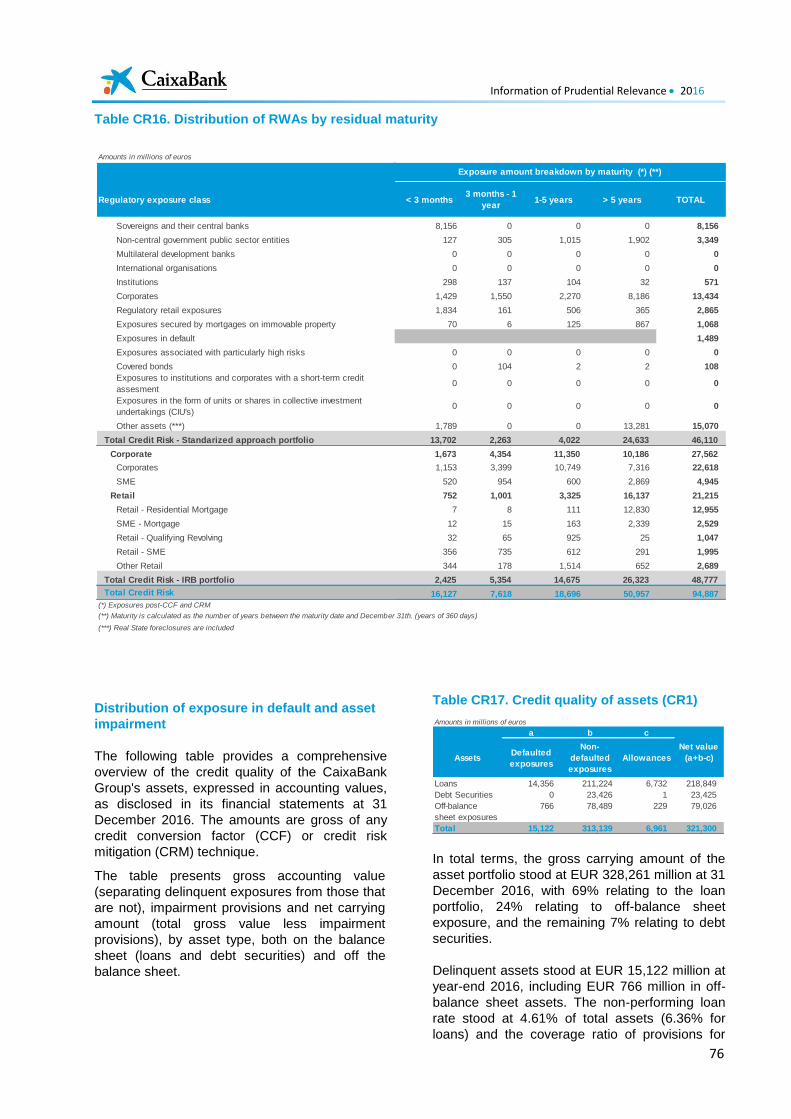
Information of Prudential Relevance 2016
76
Table CR16. Distribution of RWAs by residual maturity
Distribution of exposure in default and asset
impairment
The following table provides a comprehensive
overview of the credit quality of the CaixaBank
Group's assets, expressed in accounting values,
as disclosed in its financial statements at 31
December 2016. The amounts are gross of any
credit conversion factor (CCF) or credit risk
mitigation (CRM) technique.
The table presents gross accounting value
(separating delinquent exposures from those that
are not), impairment provisions and net carrying
amount (total gross value less impairment
provisions), by asset type, both on the balance
sheet (loans and debt securities) and off the
balance sheet.
Table CR17. Credit quality of assets (CR1)
In total terms, the gross carrying amount of the
asset portfolio stood at EUR 328,261 million at 31
December 2016, with 69% relating to the loan
portfolio, 24% relating to off-balance sheet
exposure, and the remaining 7% relating to debt
securities.
Delinquent assets stood at EUR 15,122 million at
year-end 2016, including EUR 766 million in off-
balance sheet assets. The non-performing loan
rate stood at 4.61% of total assets (6.36% for
loans) and the coverage ratio of provisions for
Amounts in millions of euros
Regulatory exposure class < 3 months3 months - 1
year1-5 years > 5 years TOTAL
Sovereigns and their central banks 8,156 0 0 0 8,156
Non-central government public sector entities 127 305 1,015 1,902 3,349
Multilateral development banks 0 0 0 0 0
International organisations 0 0 0 0 0
Institutions 298 137 104 32 571
Corporates 1,429 1,550 2,270 8,186 13,434
Regulatory retail exposures 1,834 161 506 365 2,865
Exposures secured by mortgages on immovable property 70 6 125 867 1,068
Exposures in default 1,489
Exposures associated with particularly high risks 0 0 0 0 0
Covered bonds 0 104 2 2 108
Exposures to institutions and corporates with a short-term credit
assesment0 0 0 0 0
Exposures in the form of units or shares in collective investment
undertakings (CIU's)0 0 0 0 0
Other assets (***) 1,789 0 0 13,281 15,070
Total Credit Risk - Standarized approach portfolio 13,702 2,263 4,022 24,633 46,110
Corporate 1,673 4,354 11,350 10,186 27,562
Corporates 1,153 3,399 10,749 7,316 22,618
SME 520 954 600 2,869 4,945
Retail 752 1,001 3,325 16,137 21,215
Retail - Residential Mortgage 7 8 111 12,830 12,955
SME - Mortgage 12 15 163 2,339 2,529
Retail - Qualifying Revolving 32 65 925 25 1,047
Retail - SME 356 735 612 291 1,995
Other Retail 344 178 1,514 652 2,689
Total Credit Risk - IRB portfolio 2,425 5,354 14,675 26,323 48,777
Total Credit Risk 16,127 7,618 18,696 50,957 94,887
(*) Exposures post-CCF and CRM
(***) Real State foreclosures are included
Exposure amount breakdown by maturity (*) (**)
(**) Maturity is calculated as the number of years between the maturity date and December 31th. (years of 360 days)
Amounts in millions of euros
a b c
AssetsDefaulted
exposures
Non-
defaulted
exposures
Allowances
Loans 14,356 211,224 6,732 218,849
Debt Securities 0 23,426 1 23,425
766 78,489 229 79,026
Total 15,122 313,139 6,961 321,300
Net value
(a+b-c)
Off-balance
sheet exposures
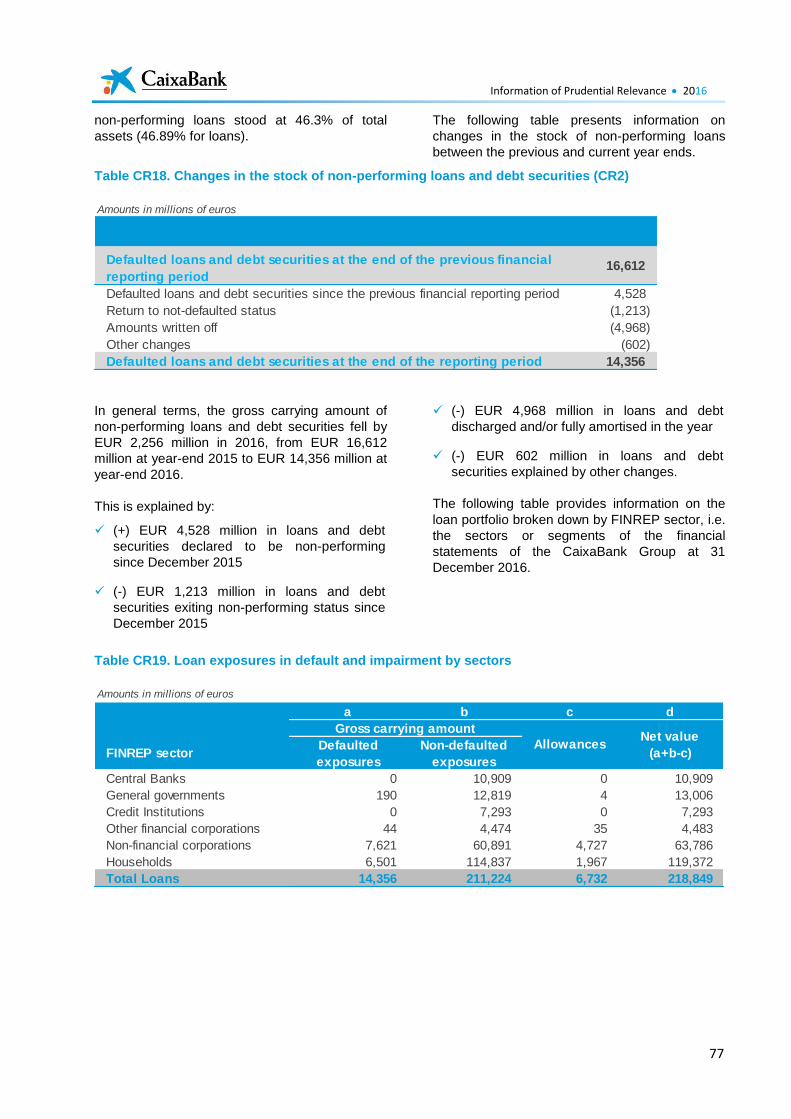
Information of Prudential Relevance 2016
77
non-performing loans stood at 46.3% of total
assets (46.89% for loans).
The following table presents information on
changes in the stock of non-performing loans
between the previous and current year ends.
Table CR18. Changes in the stock of non-performing loans and debt securities (CR2)
In general terms, the gross carrying amount of
non-performing loans and debt securities fell by
EUR 2,256 million in 2016, from EUR 16,612
million at year-end 2015 to EUR 14,356 million at
year-end 2016.
This is explained by:
(+) EUR 4,528 million in loans and debt
securities declared to be non-performing
since December 2015
(-) EUR 1,213 million in loans and debt
securities exiting non-performing status since
December 2015
(-) EUR 4,968 million in loans and debt
discharged and/or fully amortised in the year
(-) EUR 602 million in loans and debt
securities explained by other changes.
The following table provides information on the
loan portfolio broken down by FINREP sector, i.e.
the sectors or segments of the financial
statements of the CaixaBank Group at 31
December 2016.
Table CR19. Loan exposures in default and impairment by sectors
Amounts in millions of euros
Defaulted loans and debt securities at the end of the previous financial
reporting period16,612
Defaulted loans and debt securities since the previous financial reporting period 4,528
Return to not-defaulted status (1,213)
Amounts written off (4,968)
Other changes (602)
Defaulted loans and debt securities at the end of the reporting period 14,356
Amounts in millions of euros
a b c d
FINREP sectorDefaulted
exposures
Non-defaulted
exposures
Central Banks 0 10,909 0 10,909
General governments 190 12,819 4 13,006
Credit Institutions 0 7,293 0 7,293
Other financial corporations 44 4,474 35 4,483
Non-financial corporations 7,621 60,891 4,727 63,786
Households 6,501 114,837 1,967 119,372
Total Loans 14,356 211,224 6,732 218,849
Gross carrying amount
AllowancesNet value
(a+b-c)
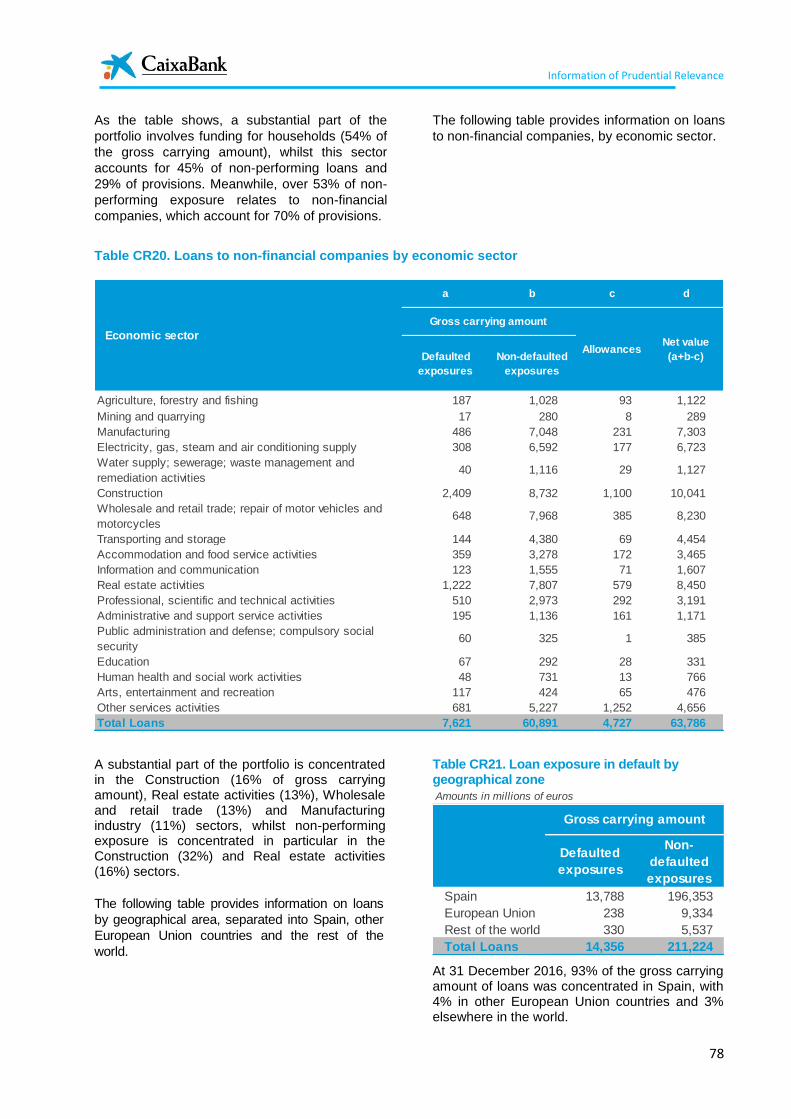
Information of Prudential Relevance
78
As the table shows, a substantial part of the
portfolio involves funding for households (54% of
the gross carrying amount), whilst this sector
accounts for 45% of non-performing loans and
29% of provisions. Meanwhile, over 53% of non-
performing exposure relates to non-financial
companies, which account for 70% of provisions.
The following table provides information on loans
to non-financial companies, by economic sector.
Table CR20. Loans to non-financial companies by economic sector
A substantial part of the portfolio is concentrated in the Construction (16% of gross carrying amount), Real estate activities (13%), Wholesale and retail trade (13%) and Manufacturing industry (11%) sectors, whilst non-performing exposure is concentrated in particular in the Construction (32%) and Real estate activities (16%) sectors.
The following table provides information on loans
by geographical area, separated into Spain, other
European Union countries and the rest of the
world.
Table CR21. Loan exposure in default by geographical zone
At 31 December 2016, 93% of the gross carrying amount of loans was concentrated in Spain, with 4% in other European Union countries and 3% elsewhere in the world.
a b c d
Defaulted
exposures
Non-defaulted
exposures
Agriculture, forestry and fishing 187 1,028 93 1,122
Mining and quarrying 17 280 8 289
Manufacturing 486 7,048 231 7,303
Electricity, gas, steam and air conditioning supply 308 6,592 177 6,723
Water supply; sewerage; waste management and
remediation activities40 1,116 29 1,127
Construction 2,409 8,732 1,100 10,041
Wholesale and retail trade; repair of motor vehicles and
motorcycles648 7,968 385 8,230
Transporting and storage 144 4,380 69 4,454
Accommodation and food service activities 359 3,278 172 3,465
Information and communication 123 1,555 71 1,607
Real estate activities 1,222 7,807 579 8,450
Professional, scientific and technical activities 510 2,973 292 3,191
Administrative and support service activities 195 1,136 161 1,171
Public administration and defense; compulsory social
security60 325 1 385
Education 67 292 28 331
Human health and social work activities 48 731 13 766
Arts, entertainment and recreation 117 424 65 476
Other services activities 681 5,227 1,252 4,656
Total Loans 7,621 60,891 4,727 63,786
Economic sector
Gross carrying amount
AllowancesNet value
(a+b-c)
Amounts in millions of euros
Defaulted
exposures
Non-
defaulted
exposures
Spain 13,788 196,353
European Union 238 9,334
Rest of the world 330 5,537
Total Loans 14,356 211,224
Gross carrying amount
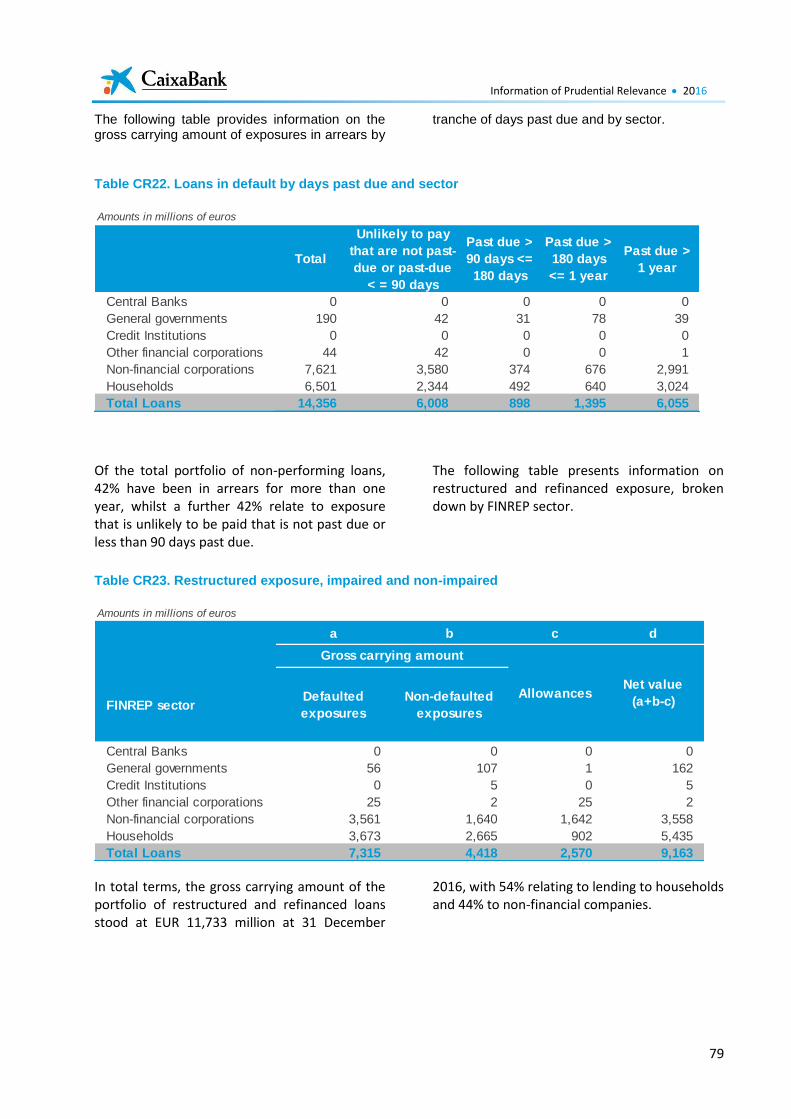
Information of Prudential Relevance 2016
79
The following table provides information on the gross carrying amount of exposures in arrears by
tranche of days past due and by sector.
Table CR22. Loans in default by days past due and sector
Of the total portfolio of non-performing loans, 42% have been in arrears for more than one year, whilst a further 42% relate to exposure that is unlikely to be paid that is not past due or less than 90 days past due.
The following table presents information on restructured and refinanced exposure, broken down by FINREP sector.
Table CR23. Restructured exposure, impaired and non-impaired
In total terms, the gross carrying amount of the portfolio of restructured and refinanced loans stood at EUR 11,733 million at 31 December
2016, with 54% relating to lending to households and 44% to non-financial companies.
Amounts in millions of euros
Total
Unlikely to pay
that are not past-
due or past-due
< = 90 days
Past due >
90 days <=
180 days
Past due >
180 days
<= 1 year
Past due >
1 year
Central Banks 0 0 0 0 0
General governments 190 42 31 78 39
Credit Institutions 0 0 0 0 0
Other financial corporations 44 42 0 0 1
Non-financial corporations 7,621 3,580 374 676 2,991
Households 6,501 2,344 492 640 3,024
Total Loans 14,356 6,008 898 1,395 6,055
Amounts in millions of euros
a b c d
FINREP sectorDefaulted
exposures
Non-defaulted
exposures
Central Banks 0 0 0 0
General governments 56 107 1 162
Credit Institutions 0 5 0 5
Other financial corporations 25 2 25 2
Non-financial corporations 3,561 1,640 1,642 3,558
Households 3,673 2,665 902 5,435
Total Loans 7,315 4,418 2,570 9,163
Gross carrying amount
AllowancesNet value
(a+b-c)
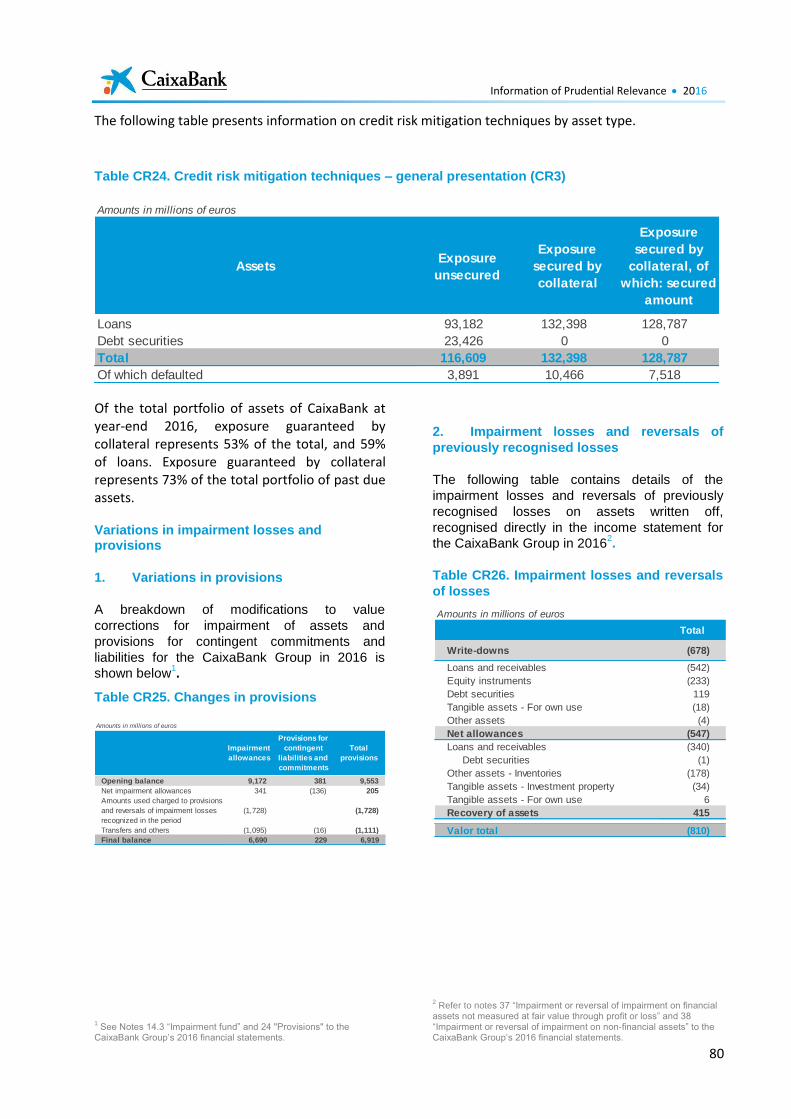
Information of Prudential Relevance 2016
80
The following table presents information on credit risk mitigation techniques by asset type.
Table CR24. Credit risk mitigation techniques – general presentation (CR3)
Of the total portfolio of assets of CaixaBank at year-end 2016, exposure guaranteed by collateral represents 53% of the total, and 59% of loans. Exposure guaranteed by collateral represents 73% of the total portfolio of past due assets.
Variations in impairment losses and provisions
1. Variations in provisions
A breakdown of modifications to value
corrections for impairment of assets and
provisions for contingent commitments and
liabilities for the CaixaBank Group in 2016 is
shown below1.
Table CR25. Changes in provisions
1 See Notes 14.3 “Impairment fund” and 24 "Provisions" to the
CaixaBank Group’s 2016 financial statements.
2. Impairment losses and reversals of
previously recognised losses
The following table contains details of the
impairment losses and reversals of previously
recognised losses on assets written off,
recognised directly in the income statement for
the CaixaBank Group in 20162.
Table CR26. Impairment losses and reversals
of losses
2 Refer to notes 37 “Impairment or reversal of impairment on financial
assets not measured at fair value through profit or loss” and 38 “Impairment or reversal of impairment on non-financial assets” to the CaixaBank Group’s 2016 financial statements.
Amounts in millions of euros
AssetsExposure
unsecured
Exposure
secured by
collateral
Exposure
secured by
collateral, of
which: secured
amount
Loans 93,182 132,398 128,787
Debt securities 23,426 0 0
Total 116,609 132,398 128,787
Of which defaulted 3,891 10,466 7,518
Amounts in millions of euros
Opening balance 9,172 381 9,553
Net impairment allowances 341 (136) 205
Amounts used charged to provisions
and reversals of impairment losses
recognized in the period
(1,728) (1,728)
Transfers and others (1,095) (16) (1,111)
Final balance 6,690 229 6,919
Impairment
allowances
Provisions for
contingent
liabilities and
commitments
Total
provisions
Amounts in millions of euros
Total
Write-downs (678)
Loans and receivables (542)
Equity instruments (233)
Debt securities 119
Tangible assets - For own use (18)
Other assets (4)
Net allowances (547)
Loans and receivables (340)
Debt securities (1)
Other assets - Inventories (178)
Tangible assets - Investment property (34)
Tangible assets - For own use 6
Recovery of assets 415
Valor total (810)
Information of Prudential Relevance 2016
81
Utilisation of the IRB approach
In July 2005, in accordance with the directives of
the Bank of Spain, the Board of Directors of "la
Caixa" approved the Master Plan for Adaptation
to Basel II. At that time, "la Caixa" requested
official permission from the Bank of Spain to use
internal models for measuring credit risk. The
Bank of Spain carried out a credit risk model
validation process in the course of 2007, and on
25 June 2008 issued authorisation for the "la
Caixa" Group to apply the model to calculate its
capital requirements as of that year.
The Bank of Spain has authorised the use of the
Internal Ratings-Based Approach (IRB) to
calculate own funds requirements for the
following credit exposure classes:
Exposures evaluated by models for mortgage
loans to individuals (behaviour and approval
models), applying internal estimates of losses
in the event of non-payment and credit
conversion factors
Exposures evaluated by models for personal
loans to individuals (behaviour and approval
models), applying internal estimates of losses
in the event of non-payment and credit
conversion factors
Exposures evaluated by models for cards to
individuals (behaviour and approval models),
applying internal estimates of losses in the
event of non-payment and credit conversion
factors
Exposures evaluated by SME models for the
range of medium-sized enterprises, small
companies and micro-enterprises, applying
internal estimates of losses in the event of
non-payment and credit conversion factors
Exposures evaluated by the developer SME
model, with no application of internal
estimates of losses in the event of non-
payment or credit conversion factors
Exposures evaluated by the corporate model,
applying internal estimates of losses in the
event of non-payment or credit conversion
factors
Equity exposures evaluated using the IRB
approach, with internal models (VaR),
PD/LGD and simple risk weighting
The Bank of Spain authorised the use of the IRB
approach for the calculation of own funds
requirements for credit exposures arising from
operations by Microbank de la Caixa, S.A.,
following the reorganisation of Grupo Nuevo
Micro Bank, S.A., applicable as of year-end 2009.
1. Implementation of internal estimates in the
management process
The results obtained from these tools are used in
the following courses of action1:
Back-up for the decision-making process
System of authorisations for expected loss in
the approval of risk for companies
System of diagnostics by risk premium in the
authorisation of retail lending
Optimisation of internal processes and
monitoring function
Risk-Adjusted Return (RAR) System
Risk approval pricing system
Calculation of provisions using internal
models under IAS 39 or Bank of Spain
Circular 4/2016.
2. Management process and recognition of
risk reduction
The result of the application of risk mitigating
techniques on the IRB portfolio is reflected in the
estimation and allocation of loss given default
(LGD) parameters, which vary in accordance with
the guarantees or collateral provided. To this end,
the type of guarantee is observed for each
transaction: financial, real estate or other
collateral. Moreover, in the case of properties
used as collateral, a consultation is made
concerning the characteristic of the mortgage
guarantee in order to ascertain whether it is a
residential or commercial item.
Description of the internal rating assignment process, for each exposure class
1. Structure of the internal rating systems
The CaixaBank Group has internal credit rating
models that assign internal solvency scores or
ratings to customers to provide forecasts of the
probability of default by each borrower, covering
practically all lending activity.
1 See Section 1.2.2.6 for more details on the integration of internal
estimations in management.
Information of Prudential Relevance 2016
82
These internal credit rating models, developed on
the basis of the Entity's experience of defaults,
with all the required measurements to adjust
results to the economic cycle, are both product-
oriented and customer-oriented. Product-oriented
tools take into consideration the specific
characteristics of the debtor relating to the
product concerned, and are mainly used for
approval of new retail banking operations.
Customer-orientated tools assess the debtor's
probability of default in a generic manner,
although in the case of individuals they may
provide different results depending on the
product.
Customer-orientated tools at the CaixaBank
Group consist of behaviour scorings for
individuals and ratings for companies, and are
implemented at all branches as standard tools for
approval of asset products.
In the case of companies, the rating tools operate
at the customer level, and vary considerably
depending on the segment to which they belong.
The rating results are also adjusted to the
business cycle using the same structure as that
employed for individuals.
The CaixaBank Group has a Corporate Rating
function in place to provide specialised rating
services for the large companies segment, and
has also developed internal rating models. These
are expert models that require the participation of
analysts. These models were built in line with
Standard & Poor’s methodology, and thus the
global default rates published by this rating
agency can be used, making the methodology
much more reliable.
Probability of default (PD) estimation
models
CaixaBank has 26 internal probability of
default (PD) estimation models, covering most
of the Group's portfolios. In segments not yet
covered, relevant information is captured for
the future construction of tools to estimate the
probability of default.
Default is defined as the inability of the
counterparty to meet payment obligations.
The type of probability of default (PD)
estimated at the Entity is "through the cycle".
In other words, the scores assigned by the
rating models are associated with the average
PDs for a full economic cycle. The estimate is
performed by anchoring the PD curve to the
long-term trend (central trend) estimated for
the portfolio. When a probability of default has
been assigned to each contract/customer, it is
then transferred to the master scale, a
categorisation to which the results of all
scoring and rating tools are linked for easier
interpretation. The following table provides a
summary of the relationship between the
master scale and the probability of default.
Information of Prudential Relevance 2016
83
Table CR27. Master scale for credit ratings
Exposure at default (EAD) estimation
models
CaixaBank has 9 internal exposure at default
(EAD) estimation models.
Exposure at default (EAD) is defined as the
amount the customer is expected to owe the
credit entity at the time of a hypothetical
commencement of default at some point over
the next 12 months.
EAD is calculated as the current balance
(amount included as assets on the Entity's
balance sheet) plus a percentage of the
unused (available) line granted, i.e. an
equivalence factor termed the Credit
Conversion Factor (CCF) representing a
quantitative estimate of the percentage of the
amount not used by the customer that will
ultimately be used or outlaid at the time of
commencement of the default.
The method used by the Entity to estimate
EAD is the variable-horizon approach (setting
a one-year horizon for calculation of realised
CCFs).
The Entity’s present EAD models for
available balance commitments have been
developed in accordance with the holder
segment and with the product.
Loss given default (LGD) estimation
models
CaixaBank has 38 loss given default (LGD)
estimation models.
LGD is the economic loss arising from a
default. The Entity currently estimates
average long-term LGD and LGD in adverse
cycle conditions (downturn) for all
transactions not in default. For transactions
that are in default, a “Best Estimate” of loss is
also calculated.
2. Rating models
A description of the rating models approved for
use in the calculation of own funds requirements
through the IRB approach is shown below:
Individuals and the self-employed
Asset-related Behaviour Model: provides
a monthly evaluation of all active
customers (private customers and self-
employed) involved in a transaction with a
personal or mortgage guarantee.
This is mainly used to monitor the risk
outstanding on all transactions made by
these customers past-due more than 12
months.
A multivariate analysis methodology was
used to build the model (logistic
regression). This is based exclusively on
information concerning the customer’s
financial behaviour.
Non-Asset-related Behaviour Model:
This provides a monthly evaluation of all
operating customers (private customers
and self-employed) that are operating with
no asset-related contracts other than credit
cards.
Its main use is to monitor the risk
outstanding on all cards past-due more
than 12 months.
A multivariate analysis methodology was
used to build the model (logistic
regression). This is based exclusively on
information concerning the customer’s
financial behaviour.
Customer Mortgage Model: Used to
evaluate the approval of mortgage
guarantee transactions for customers. The
rating at the time of approval is maintained
over the first twelve months of the
transaction.
A multivariate analysis methodology was
used to build the model (logistic
regression). It is based on information
concerning the transaction, socio-
demographic information and information
concerning the customer’s financial
behaviour.
Non-Customer Mortgage Model: used
for evaluation in the approval of mortgage
guarantee transactions for non-customers.
Master Scale Minimum PD (%) Maximum PD (%)
0 0.00% 0.03%
1 0.03% 0.08%
2 0.08% 0.18%
3 0.18% 0.42%
4 0.42% 1.00%
5 1.00% 2.34%
6 2.34% 5.37%
7 5.37% 11.84%
8 11.84% 24.15%
9 24.15% 100.00%
Information of Prudential Relevance 2016
84
The rating at the time of approval is
maintained over the first twelve months of
the transaction.
A multivariate analysis methodology was
used to build the model (logistic
regression). It is based on information
concerning the transaction, the guarantee,
and socio-demographic information on the
customer.
Customer Personal Guarantee Model:
used for evaluation at the time of approval
of personal-guarantee transactions for
customers and the approval of cards for
customers. The rating at the time of
approval is maintained over the first twelve
months of the transaction.
A multivariate analysis methodology was
used to build the model (logistic
regression). It is based on information
concerning the transaction, socio-
demographic information and information
concerning the customer’s financial
behaviour.
Non-customer personal model: used for
evaluation in the approval of personal-
guarantee transactions for non-customers.
The rating at the time of approval is
maintained over the first twelve months of
the transaction.
A multivariate analysis methodology was
used to build the model (logistic
regression). It is based on information
concerning the transaction, the risk
characteristics of the borrower, and
customer data (socio-demographic data,
employment, economic information etc.).
Self-Employed Customer model: Used
for evaluation in the approval of personal-
guarantee transactions for business
purposes. The rating at the time of
approval is maintained over the first twelve
months of the transaction.
A multivariate analysis methodology was
used to build the model (logistic
regression). It is based on information
concerning the transaction, socio-
demographic information and information
concerning the customer’s financial
behaviour.
Non-Customer Cards model: used for
evaluation in the approval of cards for non-
customers. The rating at the time of
approval is maintained over the first twelve
months of the transaction.
A multivariate analysis methodology was
used to build the model (logistic
regression). It is based on information
concerning the transaction, the risk
characteristics of the borrower, and
customer data (socio-demographic data,
employment, economic information etc.).
Corporates model.
Ratings of SMEs and Developer SMEs:
the aim of the SME and developer SME
rating model is to assign an internal rating
to private companies classified as
microenterprises, small enterprises,
medium-sized enterprises or developer
SMEs in accordance with the internal risk
segmentation system. The entire SME and
developer SME portfolio is evaluated
monthly, and also whenever a new
transaction is approved for an SME or
developer SME, if no calculated rating is
available.
A multivariate analysis methodology was
used to build the four models (logistic
regression), based on:
Financial information: information
available from balance sheets and
income statements. For instance: total
assets, own funds or net profit.
Operating information: bank and credit
information on the customer company,
in connection with CaixaBank or other
banks in the Spanish financial system
(Bank of Spain’s Risk Information
Facility - CIRBE). For instance: average
balance of liabilities or average CIRBE
utilisation.
Qualitative information: based on the
company's characteristics and position
within its sector. For instance: the
company manager’s experience, real
estate asset status etc.
Corporate ratings: The aim of the
corporate rating model is to assign an
internal rating to private companies and
real estate developers classified as Large
Companies, in accordance with the
CaixaBank internal risk segmentation
system. The corporate rating is calculated
by a centralised unit, and the frequency of
recalculation of the rating will depend on

Information of Prudential Relevance 2016
85
the receipt of new information added to the
appraisal, with a maximum validity of 12
months.
The corporate model is based on an
expert opinion produced in accordance
with the Standard & Poor’s methodology,
using a number of different rating tools
(templates) depending on the sector to
which the company belongs.
The variables used for the corporate
model take into account both qualitative
and quantitative factors:
The qualitative variables represent
business risk – the position of the
company within the sector, for example.
Quantitative variables are usually
financial ratios – total debt/EBITDA, for
example.
Exposure values and RWAs for IRB loan portfolios
The following tables show information on the
CaixaBank Group’s exposures at 31 December
2016 by IRB segment, for the various debtor
levels.
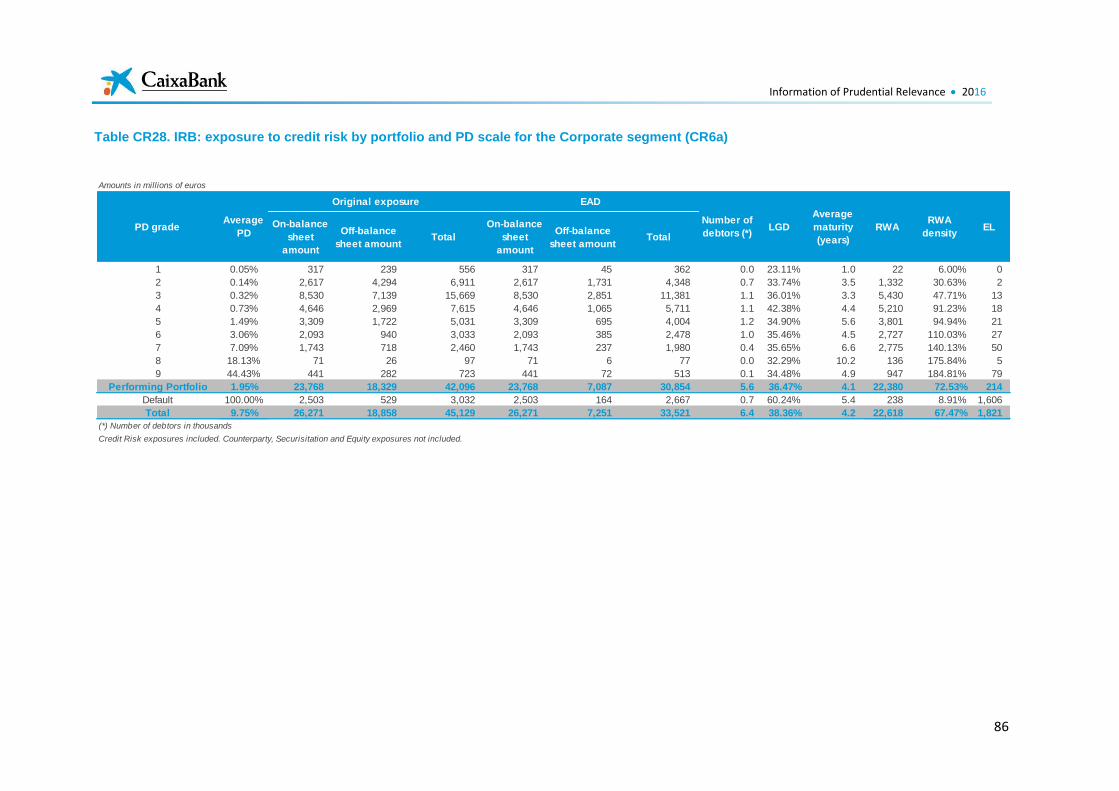
Information of Prudential Relevance 2016
86
Table CR28. IRB: exposure to credit risk by portfolio and PD scale for the Corporate segment (CR6a)
Amounts in millions of euros
On-balance
sheet
amount
Off-balance
sheet amountTotal
On-balance
sheet
amount
Off-balance
sheet amountTotal
1 0.05% 317 239 556 317 45 362 0.0 23.11% 1.0 22 6.00% 0
2 0.14% 2,617 4,294 6,911 2,617 1,731 4,348 0.7 33.74% 3.5 1,332 30.63% 2
3 0.32% 8,530 7,139 15,669 8,530 2,851 11,381 1.1 36.01% 3.3 5,430 47.71% 13
4 0.73% 4,646 2,969 7,615 4,646 1,065 5,711 1.1 42.38% 4.4 5,210 91.23% 18
5 1.49% 3,309 1,722 5,031 3,309 695 4,004 1.2 34.90% 5.6 3,801 94.94% 21
6 3.06% 2,093 940 3,033 2,093 385 2,478 1.0 35.46% 4.5 2,727 110.03% 27
7 7.09% 1,743 718 2,460 1,743 237 1,980 0.4 35.65% 6.6 2,775 140.13% 50
8 18.13% 71 26 97 71 6 77 0.0 32.29% 10.2 136 175.84% 5
9 44.43% 441 282 723 441 72 513 0.1 34.48% 4.9 947 184.81% 79
Performing Portfolio 1.95% 23,768 18,329 42,096 23,768 7,087 30,854 5.6 36.47% 4.1 22,380 72.53% 214
Default 100.00% 2,503 529 3,032 2,503 164 2,667 0.7 60.24% 5.4 238 8.91% 1,606
Total 9.75% 26,271 18,858 45,129 26,271 7,251 33,521 6.4 38.36% 4.2 22,618 67.47% 1,821
(*) Number of debtors in thousands
Credit Risk exposures included. Counterparty, Securisitation and Equity exposures not included.
LGD
Average
maturity
(years)
RWARWA
densityEL
Number of
debtors (*)PD grade
Average
PD
Original exposure EAD
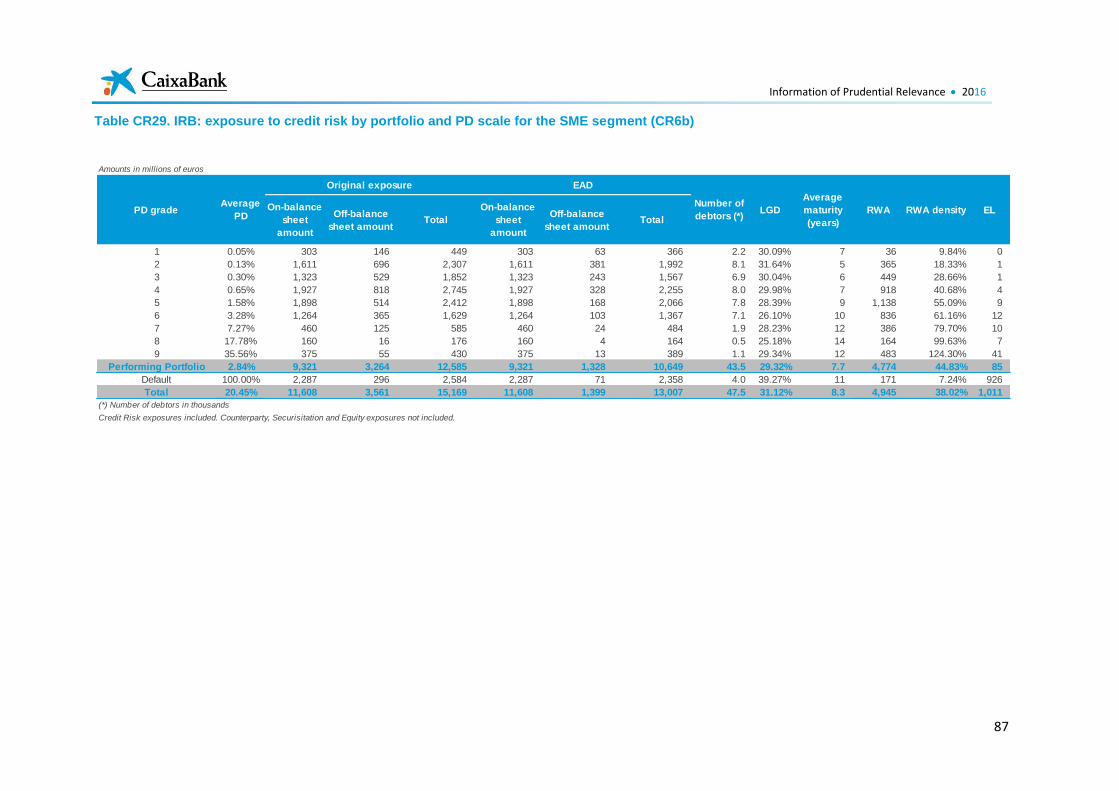
Information of Prudential Relevance 2016
87
Table CR29. IRB: exposure to credit risk by portfolio and PD scale for the SME segment (CR6b)
Amounts in millions of euros
On-balance
sheet
amount
Off-balance
sheet amountTotal
On-balance
sheet
amount
Off-balance
sheet amountTotal
1 0.05% 303 146 449 303 63 366 2.2 30.09% 7 36 9.84% 0
2 0.13% 1,611 696 2,307 1,611 381 1,992 8.1 31.64% 5 365 18.33% 1
3 0.30% 1,323 529 1,852 1,323 243 1,567 6.9 30.04% 6 449 28.66% 1
4 0.65% 1,927 818 2,745 1,927 328 2,255 8.0 29.98% 7 918 40.68% 4
5 1.58% 1,898 514 2,412 1,898 168 2,066 7.8 28.39% 9 1,138 55.09% 9
6 3.28% 1,264 365 1,629 1,264 103 1,367 7.1 26.10% 10 836 61.16% 12
7 7.27% 460 125 585 460 24 484 1.9 28.23% 12 386 79.70% 10
8 17.78% 160 16 176 160 4 164 0.5 25.18% 14 164 99.63% 7
9 35.56% 375 55 430 375 13 389 1.1 29.34% 12 483 124.30% 41
Performing Portfolio 2.84% 9,321 3,264 12,585 9,321 1,328 10,649 43.5 29.32% 7.7 4,774 44.83% 85
Default 100.00% 2,287 296 2,584 2,287 71 2,358 4.0 39.27% 11 171 7.24% 926
Total 20.45% 11,608 3,561 15,169 11,608 1,399 13,007 47.5 31.12% 8.3 4,945 38.02% 1,011
(*) Number of debtors in thousands
Credit Risk exposures included. Counterparty, Securisitation and Equity exposures not included.
LGD
Average
maturity
(years)
RWA RWA density ELNumber of
debtors (*)PD grade
Average
PD
Original exposure EAD
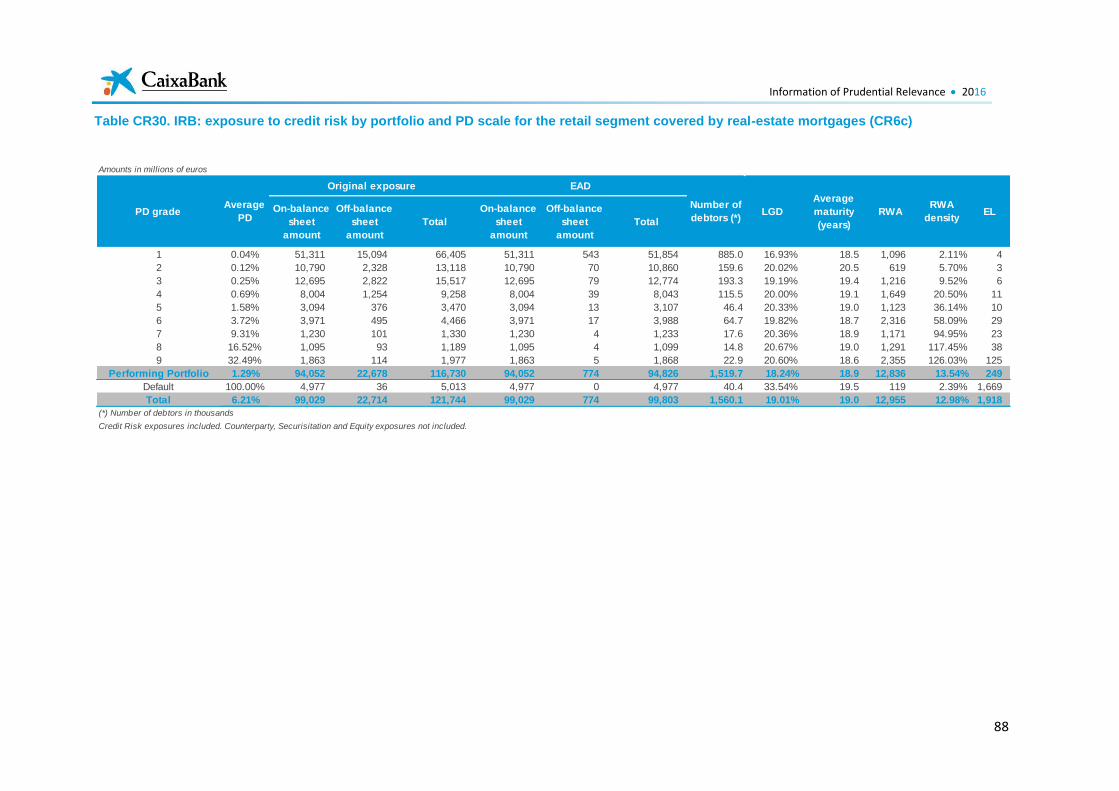
Information of Prudential Relevance 2016
88
Table CR30. IRB: exposure to credit risk by portfolio and PD scale for the retail segment covered by real-estate mortgages (CR6c)
Amounts in millions of euros
On-balance
sheet
amount
Off-balance
sheet
amount
Total
On-balance
sheet
amount
Off-balance
sheet
amount
Total
1 0.04% 51,311 15,094 66,405 51,311 543 51,854 885.0 16.93% 18.5 1,096 2.11% 4
2 0.12% 10,790 2,328 13,118 10,790 70 10,860 159.6 20.02% 20.5 619 5.70% 3
3 0.25% 12,695 2,822 15,517 12,695 79 12,774 193.3 19.19% 19.4 1,216 9.52% 6
4 0.69% 8,004 1,254 9,258 8,004 39 8,043 115.5 20.00% 19.1 1,649 20.50% 11
5 1.58% 3,094 376 3,470 3,094 13 3,107 46.4 20.33% 19.0 1,123 36.14% 10
6 3.72% 3,971 495 4,466 3,971 17 3,988 64.7 19.82% 18.7 2,316 58.09% 29
7 9.31% 1,230 101 1,330 1,230 4 1,233 17.6 20.36% 18.9 1,171 94.95% 23
8 16.52% 1,095 93 1,189 1,095 4 1,099 14.8 20.67% 19.0 1,291 117.45% 38
9 32.49% 1,863 114 1,977 1,863 5 1,868 22.9 20.60% 18.6 2,355 126.03% 125
Performing Portfolio 1.29% 94,052 22,678 116,730 94,052 774 94,826 1,519.7 18.24% 18.9 12,836 13.54% 249
Default 100.00% 4,977 36 5,013 4,977 0 4,977 40.4 33.54% 19.5 119 2.39% 1,669
Total 6.21% 99,029 22,714 121,744 99,029 774 99,803 1,560.1 19.01% 19.0 12,955 12.98% 1,918
(*) Number of debtors in thousands
Credit Risk exposures included. Counterparty, Securisitation and Equity exposures not included.
LGD
Average
maturity
(years)
RWARWA
densityEL
Number of
debtors (*)PD grade
Average
PD
Original exposure EAD
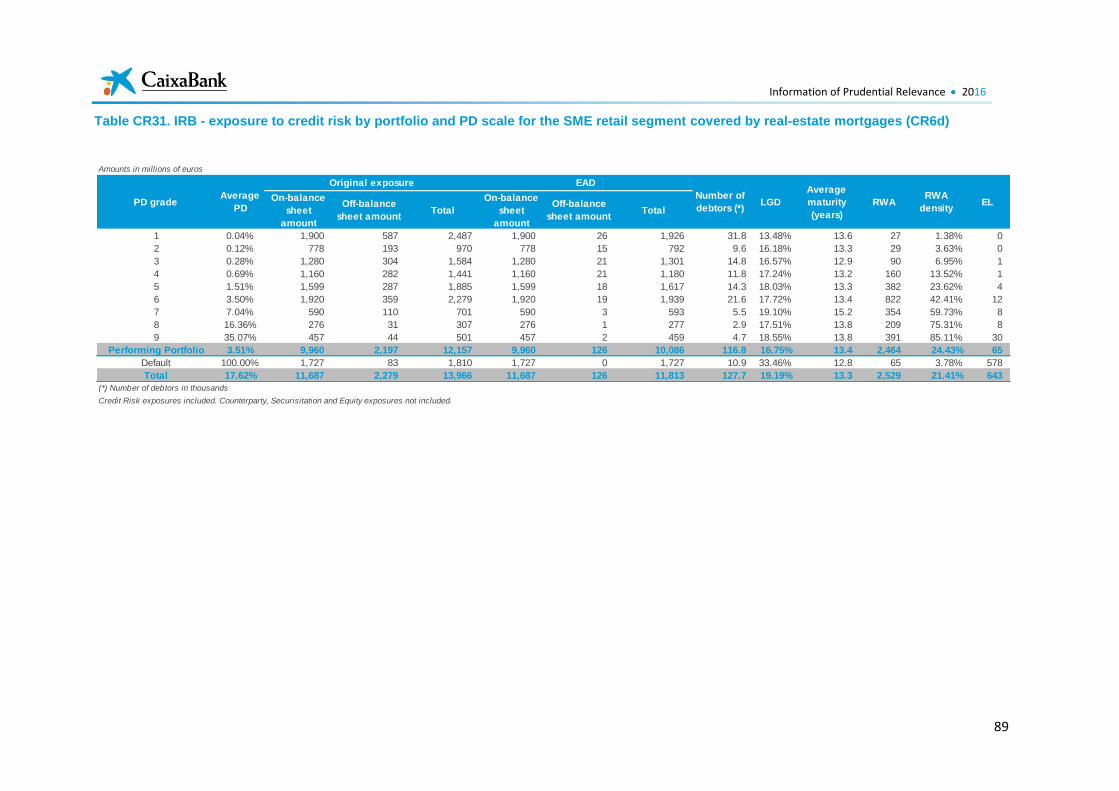
Information of Prudential Relevance 2016
89
Table CR31. IRB - exposure to credit risk by portfolio and PD scale for the SME retail segment covered by real-estate mortgages (CR6d)
Amounts in millions of euros
On-balance
sheet
amount
Off-balance
sheet amountTotal
On-balance
sheet
amount
Off-balance
sheet amountTotal
1 0.04% 1,900 587 2,487 1,900 26 1,926 31.8 13.48% 13.6 27 1.38% 0
2 0.12% 778 193 970 778 15 792 9.6 16.18% 13.3 29 3.63% 0
3 0.28% 1,280 304 1,584 1,280 21 1,301 14.8 16.57% 12.9 90 6.95% 1
4 0.69% 1,160 282 1,441 1,160 21 1,180 11.8 17.24% 13.2 160 13.52% 1
5 1.51% 1,599 287 1,885 1,599 18 1,617 14.3 18.03% 13.3 382 23.62% 4
6 3.50% 1,920 359 2,279 1,920 19 1,939 21.6 17.72% 13.4 822 42.41% 12
7 7.04% 590 110 701 590 3 593 5.5 19.10% 15.2 354 59.73% 8
8 16.36% 276 31 307 276 1 277 2.9 17.51% 13.8 209 75.31% 8
9 35.07% 457 44 501 457 2 459 4.7 18.55% 13.8 391 85.11% 30
Performing Portfolio 3.51% 9,960 2,197 12,157 9,960 126 10,086 116.8 16.75% 13.4 2,464 24.43% 65
Default 100.00% 1,727 83 1,810 1,727 0 1,727 10.9 33.46% 12.8 65 3.78% 578
Total 17.62% 11,687 2,279 13,966 11,687 126 11,813 127.7 19.19% 13.3 2,529 21.41% 643
(*) Number of debtors in thousands
Credit Risk exposures included. Counterparty, Securisitation and Equity exposures not included.
LGD
Average
maturity
(years)
RWARWA
densityEL
Number of
debtors (*)PD grade
Average
PD
Original exposure EAD
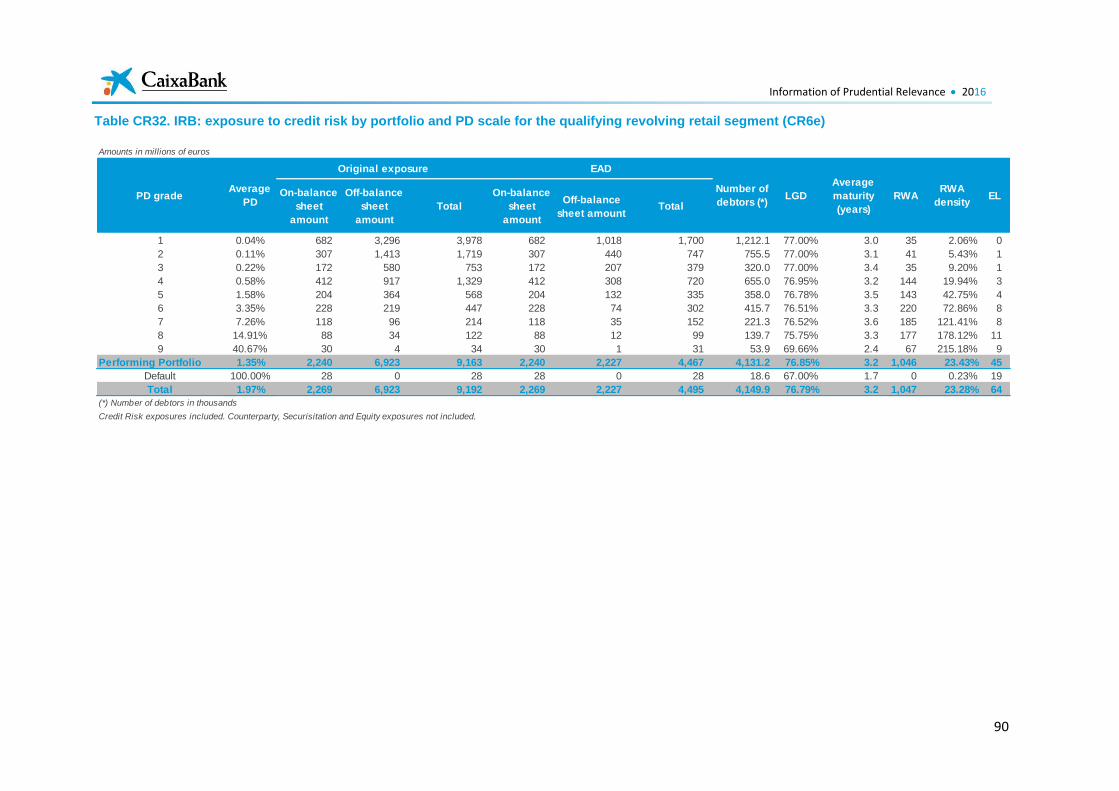
Information of Prudential Relevance 2016
90
Table CR32. IRB: exposure to credit risk by portfolio and PD scale for the qualifying revolving retail segment (CR6e)
Amounts in millions of euros
On-balance
sheet
amount
Off-balance
sheet
amount
Total
On-balance
sheet
amount
Off-balance
sheet amountTotal
1 0.04% 682 3,296 3,978 682 1,018 1,700 1,212.1 77.00% 3.0 35 2.06% 0
2 0.11% 307 1,413 1,719 307 440 747 755.5 77.00% 3.1 41 5.43% 1
3 0.22% 172 580 753 172 207 379 320.0 77.00% 3.4 35 9.20% 1
4 0.58% 412 917 1,329 412 308 720 655.0 76.95% 3.2 144 19.94% 3
5 1.58% 204 364 568 204 132 335 358.0 76.78% 3.5 143 42.75% 4
6 3.35% 228 219 447 228 74 302 415.7 76.51% 3.3 220 72.86% 8
7 7.26% 118 96 214 118 35 152 221.3 76.52% 3.6 185 121.41% 8
8 14.91% 88 34 122 88 12 99 139.7 75.75% 3.3 177 178.12% 11
9 40.67% 30 4 34 30 1 31 53.9 69.66% 2.4 67 215.18% 9
Performing Portfolio 1.35% 2,240 6,923 9,163 2,240 2,227 4,467 4,131.2 76.85% 3.2 1,046 23.43% 45
Default 100.00% 28 0 28 28 0 28 18.6 67.00% 1.7 0 0.23% 19
Total 1.97% 2,269 6,923 9,192 2,269 2,227 4,495 4,149.9 76.79% 3.2 1,047 23.28% 64
(*) Number of debtors in thousands
Credit Risk exposures included. Counterparty, Securisitation and Equity exposures not included.
LGD
Average
maturity
(years)
RWARWA
densityEL
Number of
debtors (*)PD grade
Average
PD
Original exposure EAD

Information of Prudential Relevance 2016
91
Table CR33. IRB: exposure to credit risk by portfolio and PD scale for the SME retail segment (CR6f)
Amounts in millions of euros
On-balance
sheet
amount
Off-balance
sheet
amount
Total
On-balance
sheet
amount
Off-balance
sheet amountTotal
1 0.05% 525 281 807 525 168 693 27.1 51.91% 3.7 40 5.80% 0
2 0.12% 492 316 809 492 187 679 29.5 53.08% 2.7 82 12.05% 0
3 0.32% 954 522 1,477 954 316 1,270 82.8 54.52% 2.7 308 24.26% 2
4 0.68% 582 334 916 582 183 766 45.6 49.40% 2.4 258 33.72% 3
5 1.45% 953 490 1,443 953 282 1,235 78.4 49.74% 2.1 573 46.37% 9
6 3.37% 609 313 922 609 145 754 107.5 48.58% 3.6 419 55.55% 12
7 6.67% 165 60 224 165 28 193 13.3 49.36% 2.1 118 61.06% 6
8 14.98% 83 16 99 83 7 90 7.3 50.26% 2.8 72 79.73% 7
9 38.04% 86 24 110 86 10 96 8.0 49.06% 3.4 98 102.53% 18
Performing Portfolio 2.02% 4,449 2,356 6,806 4,449 1,327 5,776 399.6 51.23% 2.8 1,968 34.07% 58
Default 100.00% 198 67 264 198 22 219 11.1 65.13% 2.6 27 12.24% 143
Total 5.60% 4,647 2,423 7,070 4,647 1,348 5,995 410.6 51.74% 2.8 1,995 33.27% 201
(*) Number of debtors in thousands
Credit Risk exposures included. Counterparty, Securisitation and Equity exposures not included.
LGD
Average
maturity
(years)
RWARWA
densityEL
Number of
debtors (*)PD grade
Average
PD
Original exposure EAD
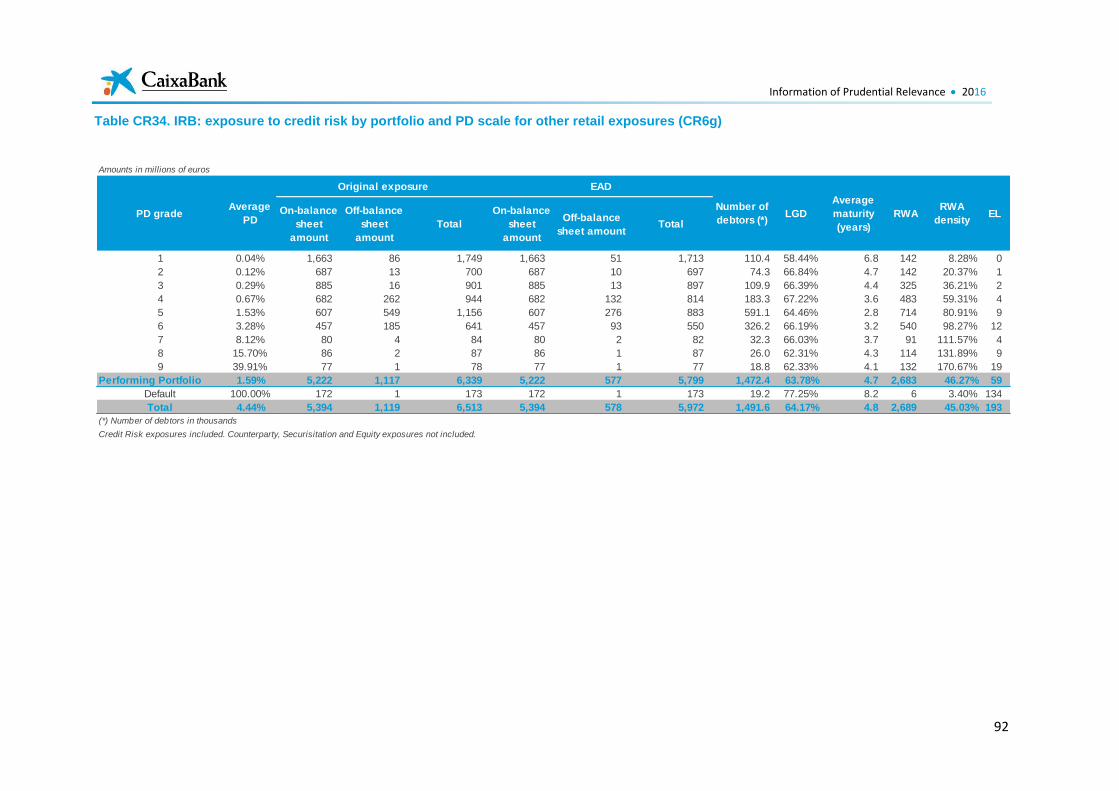
Information of Prudential Relevance 2016
92
Table CR34. IRB: exposure to credit risk by portfolio and PD scale for other retail exposures (CR6g)
Amounts in millions of euros
On-balance
sheet
amount
Off-balance
sheet
amount
Total
On-balance
sheet
amount
Off-balance
sheet amountTotal
1 0.04% 1,663 86 1,749 1,663 51 1,713 110.4 58.44% 6.8 142 8.28% 0
2 0.12% 687 13 700 687 10 697 74.3 66.84% 4.7 142 20.37% 1
3 0.29% 885 16 901 885 13 897 109.9 66.39% 4.4 325 36.21% 2
4 0.67% 682 262 944 682 132 814 183.3 67.22% 3.6 483 59.31% 4
5 1.53% 607 549 1,156 607 276 883 591.1 64.46% 2.8 714 80.91% 9
6 3.28% 457 185 641 457 93 550 326.2 66.19% 3.2 540 98.27% 12
7 8.12% 80 4 84 80 2 82 32.3 66.03% 3.7 91 111.57% 4
8 15.70% 86 2 87 86 1 87 26.0 62.31% 4.3 114 131.89% 9
9 39.91% 77 1 78 77 1 77 18.8 62.33% 4.1 132 170.67% 19
Performing Portfolio 1.59% 5,222 1,117 6,339 5,222 577 5,799 1,472.4 63.78% 4.7 2,683 46.27% 59
Default 100.00% 172 1 173 172 1 173 19.2 77.25% 8.2 6 3.40% 134
Total 4.44% 5,394 1,119 6,513 5,394 578 5,972 1,491.6 64.17% 4.8 2,689 45.03% 193
(*) Number of debtors in thousands
Credit Risk exposures included. Counterparty, Securisitation and Equity exposures not included.
LGD
Average
maturity
(years)
RWARWA
densityEL
Number of
debtors (*)PD grade
Average
PD
Original exposure EAD
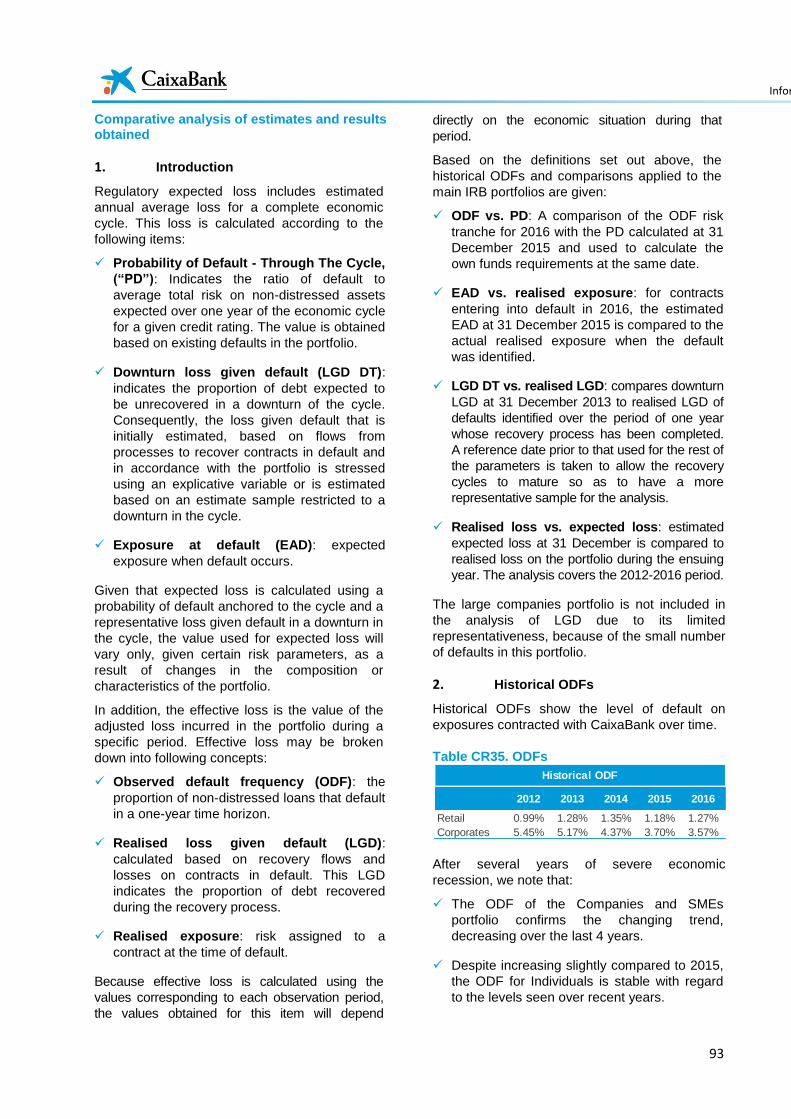
Information of Prudential Relevance 2016
93
Comparative analysis of estimates and results obtained
1. Introduction
Regulatory expected loss includes estimated
annual average loss for a complete economic
cycle. This loss is calculated according to the
following items:
Probability of Default - Through The Cycle,
(“PD”): Indicates the ratio of default to
average total risk on non-distressed assets
expected over one year of the economic cycle
for a given credit rating. The value is obtained
based on existing defaults in the portfolio.
Downturn loss given default (LGD DT):
indicates the proportion of debt expected to
be unrecovered in a downturn of the cycle.
Consequently, the loss given default that is
initially estimated, based on flows from
processes to recover contracts in default and
in accordance with the portfolio is stressed
using an explicative variable or is estimated
based on an estimate sample restricted to a
downturn in the cycle.
Exposure at default (EAD): expected
exposure when default occurs.
Given that expected loss is calculated using a
probability of default anchored to the cycle and a
representative loss given default in a downturn in
the cycle, the value used for expected loss will
vary only, given certain risk parameters, as a
result of changes in the composition or
characteristics of the portfolio.
In addition, the effective loss is the value of the
adjusted loss incurred in the portfolio during a
specific period. Effective loss may be broken
down into following concepts:
Observed default frequency (ODF): the
proportion of non-distressed loans that default
in a one-year time horizon.
Realised loss given default (LGD):
calculated based on recovery flows and
losses on contracts in default. This LGD
indicates the proportion of debt recovered
during the recovery process.
Realised exposure: risk assigned to a
contract at the time of default.
Because effective loss is calculated using the
values corresponding to each observation period,
the values obtained for this item will depend
directly on the economic situation during that
period.
Based on the definitions set out above, the
historical ODFs and comparisons applied to the
main IRB portfolios are given:
ODF vs. PD: A comparison of the ODF risk
tranche for 2016 with the PD calculated at 31
December 2015 and used to calculate the
own funds requirements at the same date.
EAD vs. realised exposure: for contracts
entering into default in 2016, the estimated
EAD at 31 December 2015 is compared to the
actual realised exposure when the default
was identified.
LGD DT vs. realised LGD: compares downturn
LGD at 31 December 2013 to realised LGD of
defaults identified over the period of one year
whose recovery process has been completed.
A reference date prior to that used for the rest of
the parameters is taken to allow the recovery
cycles to mature so as to have a more
representative sample for the analysis.
Realised loss vs. expected loss: estimated
expected loss at 31 December is compared to
realised loss on the portfolio during the ensuing
year. The analysis covers the 2012-2016 period.
The large companies portfolio is not included in
the analysis of LGD due to its limited
representativeness, because of the small number
of defaults in this portfolio.
2. Historical ODFs
Historical ODFs show the level of default on
exposures contracted with CaixaBank over time.
Table CR35. ODFs
After several years of severe economic
recession, we note that:
The ODF of the Companies and SMEs
portfolio confirms the changing trend,
decreasing over the last 4 years.
Despite increasing slightly compared to 2015,
the ODF for Individuals is stable with regard
to the levels seen over recent years.
2012 2013 2014 2015 2016
Retail 0.99% 1.28% 1.35% 1.18% 1.27%
Corporates 5.45% 5.17% 4.37% 3.70% 3.57%
Historical ODF
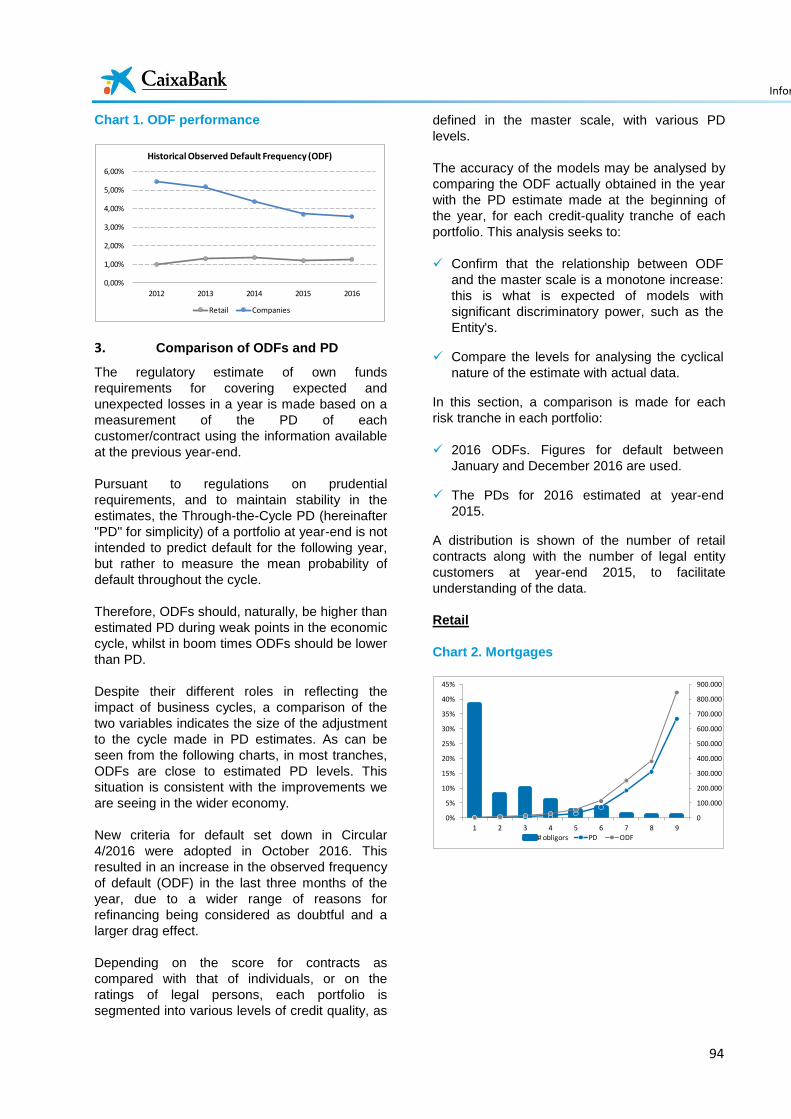
Information of Prudential Relevance 2016
94
Chart 1. ODF performance
3. Comparison of ODFs and PD
The regulatory estimate of own funds
requirements for covering expected and
unexpected losses in a year is made based on a
measurement of the PD of each
customer/contract using the information available
at the previous year-end.
Pursuant to regulations on prudential
requirements, and to maintain stability in the
estimates, the Through-the-Cycle PD (hereinafter
"PD" for simplicity) of a portfolio at year-end is not
intended to predict default for the following year,
but rather to measure the mean probability of
default throughout the cycle.
Therefore, ODFs should, naturally, be higher than
estimated PD during weak points in the economic
cycle, whilst in boom times ODFs should be lower
than PD.
Despite their different roles in reflecting the
impact of business cycles, a comparison of the
two variables indicates the size of the adjustment
to the cycle made in PD estimates. As can be
seen from the following charts, in most tranches,
ODFs are close to estimated PD levels. This
situation is consistent with the improvements we
are seeing in the wider economy.
New criteria for default set down in Circular
4/2016 were adopted in October 2016. This
resulted in an increase in the observed frequency
of default (ODF) in the last three months of the
year, due to a wider range of reasons for
refinancing being considered as doubtful and a
larger drag effect.
Depending on the score for contracts as
compared with that of individuals, or on the
ratings of legal persons, each portfolio is
segmented into various levels of credit quality, as
defined in the master scale, with various PD
levels.
The accuracy of the models may be analysed by
comparing the ODF actually obtained in the year
with the PD estimate made at the beginning of
the year, for each credit-quality tranche of each
portfolio. This analysis seeks to:
Confirm that the relationship between ODF
and the master scale is a monotone increase:
this is what is expected of models with
significant discriminatory power, such as the
Entity's.
Compare the levels for analysing the cyclical
nature of the estimate with actual data.
In this section, a comparison is made for each
risk tranche in each portfolio:
2016 ODFs. Figures for default between
January and December 2016 are used.
The PDs for 2016 estimated at year-end
2015.
A distribution is shown of the number of retail
contracts along with the number of legal entity
customers at year-end 2015, to facilitate
understanding of the data.
Retail
Chart 2. Mortgages
0,00%
1,00%
2,00%
3,00%
4,00%
5,00%
6,00%
2012 2013 2014 2015 2016
Historical Observed Default Frequency (ODF)
Retail Companies
0
100.000
200.000
300.000
400.000
500.000
600.000
700.000
800.000
900.000
0%
5%
10%
15%
20%
25%
30%
35%
40%
45%
1 2 3 4 5 6 7 8 9
# obligors PD ODF
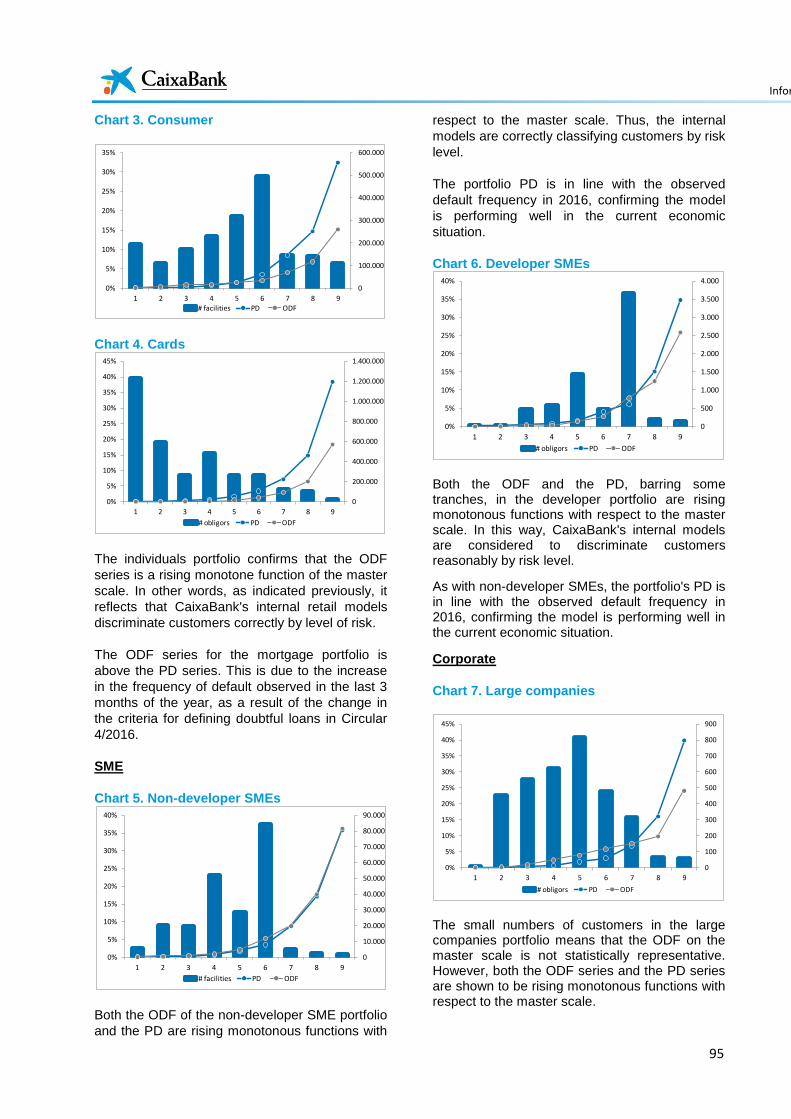
Information of Prudential Relevance 2016
95
Chart 3. Consumer
Chart 4. Cards
The individuals portfolio confirms that the ODF
series is a rising monotone function of the master
scale. In other words, as indicated previously, it
reflects that CaixaBank's internal retail models
discriminate customers correctly by level of risk.
The ODF series for the mortgage portfolio is
above the PD series. This is due to the increase
in the frequency of default observed in the last 3
months of the year, as a result of the change in
the criteria for defining doubtful loans in Circular
4/2016.
SME
Chart 5. Non-developer SMEs
Both the ODF of the non-developer SME portfolio
and the PD are rising monotonous functions with
respect to the master scale. Thus, the internal
models are correctly classifying customers by risk
level.
The portfolio PD is in line with the observed
default frequency in 2016, confirming the model
is performing well in the current economic
situation.
Chart 6. Developer SMEs
Both the ODF and the PD, barring some tranches, in the developer portfolio are rising monotonous functions with respect to the master scale. In this way, CaixaBank's internal models are considered to discriminate customers reasonably by risk level.
As with non-developer SMEs, the portfolio's PD is in line with the observed default frequency in 2016, confirming the model is performing well in the current economic situation.
Corporate
Chart 7. Large companies
The small numbers of customers in the large companies portfolio means that the ODF on the master scale is not statistically representative. However, both the ODF series and the PD series are shown to be rising monotonous functions with respect to the master scale.
0
100.000
200.000
300.000
400.000
500.000
600.000
0%
5%
10%
15%
20%
25%
30%
35%
1 2 3 4 5 6 7 8 9# facilities PD ODF
0
200.000
400.000
600.000
800.000
1.000.000
1.200.000
1.400.000
0%
5%
10%
15%
20%
25%
30%
35%
40%
45%
1 2 3 4 5 6 7 8 9
# obligors PD ODF
0
10.000
20.000
30.000
40.000
50.000
60.000
70.000
80.000
90.000
0%
5%
10%
15%
20%
25%
30%
35%
40%
1 2 3 4 5 6 7 8 9
# facilities PD ODF
0
500
1.000
1.500
2.000
2.500
3.000
3.500
4.000
0%
5%
10%
15%
20%
25%
30%
35%
40%
1 2 3 4 5 6 7 8 9
# obligors PD ODF
0
100
200
300
400
500
600
700
800
900
0%
5%
10%
15%
20%
25%
30%
35%
40%
45%
1 2 3 4 5 6 7 8 9
# obligors PD ODF

Information of Prudential Relevance 2016
96
The chart shows that ODF is slightly higher than PD in the intermediate stretches of the master scale.
Average PD and ODF for IRB loan portfolios
The following tables show information on the average PD of the CaixaBank Group's exposure at 31 December 2016, and the average annual default rate for the last five years, for each IRB segment, based on the PD scales defined by the master scale.
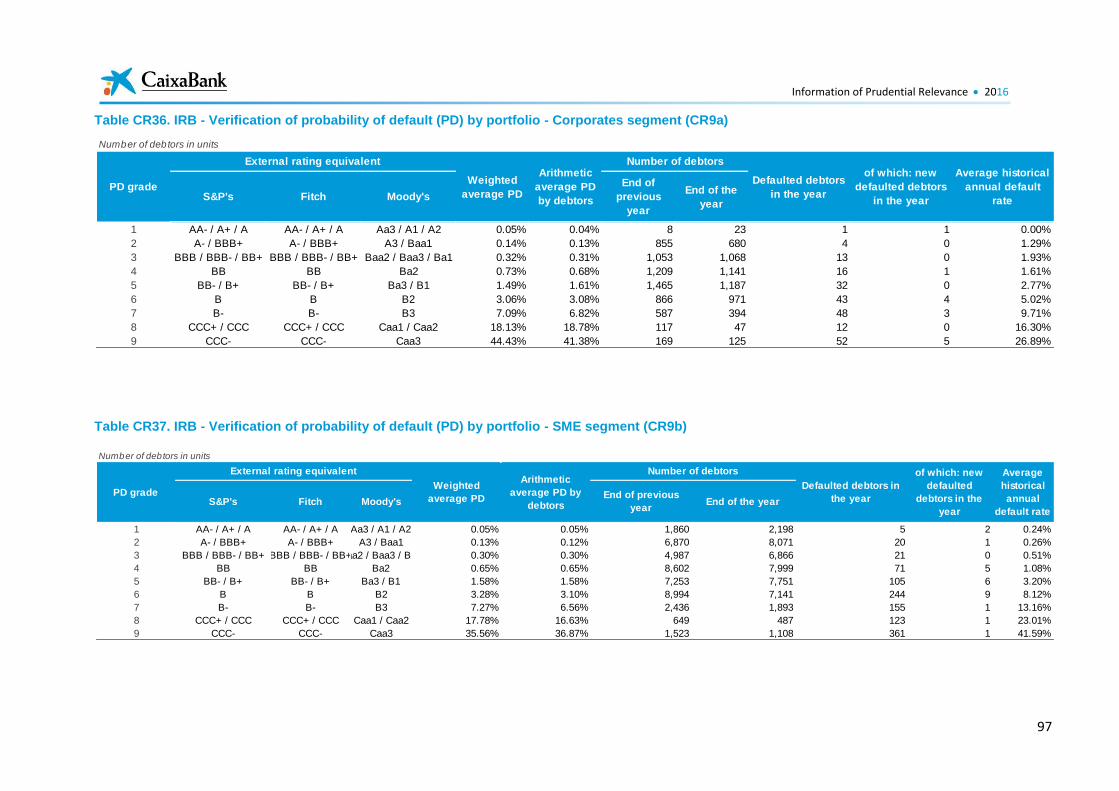
Information of Prudential Relevance 2016
97
Table CR36. IRB - Verification of probability of default (PD) by portfolio - Corporates segment (CR9a)
Table CR37. IRB - Verification of probability of default (PD) by portfolio - SME segment (CR9b)
Number of debtors in units
S&P's Fitch Moody's
End of
previous
year
End of the
year
1 AA- / A+ / A AA- / A+ / A Aa3 / A1 / A2 0.05% 0.04% 8 23 1 1 0.00%
2 A- / BBB+ A- / BBB+ A3 / Baa1 0.14% 0.13% 855 680 4 0 1.29%
3 BBB / BBB- / BB+ BBB / BBB- / BB+ Baa2 / Baa3 / Ba1 0.32% 0.31% 1,053 1,068 13 0 1.93%
4 BB BB Ba2 0.73% 0.68% 1,209 1,141 16 1 1.61%
5 BB- / B+ BB- / B+ Ba3 / B1 1.49% 1.61% 1,465 1,187 32 0 2.77%
6 B B B2 3.06% 3.08% 866 971 43 4 5.02%
7 B- B- B3 7.09% 6.82% 587 394 48 3 9.71%
8 CCC+ / CCC CCC+ / CCC Caa1 / Caa2 18.13% 18.78% 117 47 12 0 16.30%
9 CCC- CCC- Caa3 44.43% 41.38% 169 125 52 5 26.89%
of which: new
defaulted debtors
in the year
Average historical
annual default
rate
PD grade
External rating equivalent
Weighted
average PD
Arithmetic
average PD
by debtors
Number of debtors
Defaulted debtors
in the year
Number of debtors in units
S&P's Fitch Moody'sEnd of previous
yearEnd of the year
1 AA- / A+ / A AA- / A+ / A Aa3 / A1 / A2 0.05% 0.05% 1,860 2,198 5 2 0.24%
2 A- / BBB+ A- / BBB+ A3 / Baa1 0.13% 0.12% 6,870 8,071 20 1 0.26%
3 BBB / BBB- / BB+ BBB / BBB- / BB+Baa2 / Baa3 / Ba1 0.30% 0.30% 4,987 6,866 21 0 0.51%
4 BB BB Ba2 0.65% 0.65% 8,602 7,999 71 5 1.08%
5 BB- / B+ BB- / B+ Ba3 / B1 1.58% 1.58% 7,253 7,751 105 6 3.20%
6 B B B2 3.28% 3.10% 8,994 7,141 244 9 8.12%
7 B- B- B3 7.27% 6.56% 2,436 1,893 155 1 13.16%
8 CCC+ / CCC CCC+ / CCC Caa1 / Caa2 17.78% 16.63% 649 487 123 1 23.01%
9 CCC- CCC- Caa3 35.56% 36.87% 1,523 1,108 361 1 41.59%
of which: new
defaulted
debtors in the
year
Average
historical
annual
default rate
PD grade
External rating equivalent
Weighted
average PD
Arithmetic
average PD by
debtors
Number of debtors
Defaulted debtors in
the year
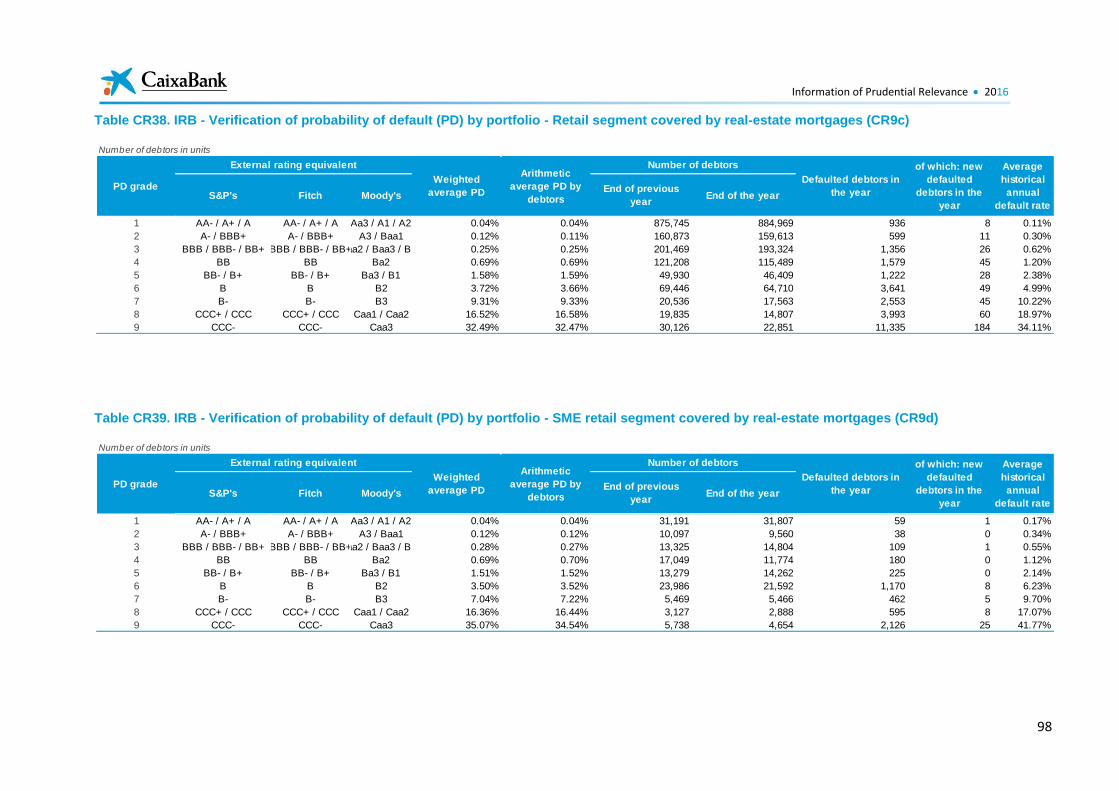
Information of Prudential Relevance 2016
98
Table CR38. IRB - Verification of probability of default (PD) by portfolio - Retail segment covered by real-estate mortgages (CR9c)
Table CR39. IRB - Verification of probability of default (PD) by portfolio - SME retail segment covered by real-estate mortgages (CR9d)
Number of debtors in units
S&P's Fitch Moody'sEnd of previous
yearEnd of the year
1 AA- / A+ / A AA- / A+ / A Aa3 / A1 / A2 0.04% 0.04% 875,745 884,969 936 8 0.11%
2 A- / BBB+ A- / BBB+ A3 / Baa1 0.12% 0.11% 160,873 159,613 599 11 0.30%
3 BBB / BBB- / BB+ BBB / BBB- / BB+Baa2 / Baa3 / Ba1 0.25% 0.25% 201,469 193,324 1,356 26 0.62%
4 BB BB Ba2 0.69% 0.69% 121,208 115,489 1,579 45 1.20%
5 BB- / B+ BB- / B+ Ba3 / B1 1.58% 1.59% 49,930 46,409 1,222 28 2.38%
6 B B B2 3.72% 3.66% 69,446 64,710 3,641 49 4.99%
7 B- B- B3 9.31% 9.33% 20,536 17,563 2,553 45 10.22%
8 CCC+ / CCC CCC+ / CCC Caa1 / Caa2 16.52% 16.58% 19,835 14,807 3,993 60 18.97%
9 CCC- CCC- Caa3 32.49% 32.47% 30,126 22,851 11,335 184 34.11%
of which: new
defaulted
debtors in the
year
Average
historical
annual
default rate
PD grade
External rating equivalent
Weighted
average PD
Arithmetic
average PD by
debtors
Number of debtors
Defaulted debtors in
the year
Number of debtors in units
S&P's Fitch Moody'sEnd of previous
yearEnd of the year
1 AA- / A+ / A AA- / A+ / A Aa3 / A1 / A2 0.04% 0.04% 31,191 31,807 59 1 0.17%
2 A- / BBB+ A- / BBB+ A3 / Baa1 0.12% 0.12% 10,097 9,560 38 0 0.34%
3 BBB / BBB- / BB+ BBB / BBB- / BB+Baa2 / Baa3 / Ba1 0.28% 0.27% 13,325 14,804 109 1 0.55%
4 BB BB Ba2 0.69% 0.70% 17,049 11,774 180 0 1.12%
5 BB- / B+ BB- / B+ Ba3 / B1 1.51% 1.52% 13,279 14,262 225 0 2.14%
6 B B B2 3.50% 3.52% 23,986 21,592 1,170 8 6.23%
7 B- B- B3 7.04% 7.22% 5,469 5,466 462 5 9.70%
8 CCC+ / CCC CCC+ / CCC Caa1 / Caa2 16.36% 16.44% 3,127 2,888 595 8 17.07%
9 CCC- CCC- Caa3 35.07% 34.54% 5,738 4,654 2,126 25 41.77%
of which: new
defaulted
debtors in the
year
Average
historical
annual
default rate
PD grade
External rating equivalent
Weighted
average PD
Arithmetic
average PD by
debtors
Number of debtors
Defaulted debtors in
the year
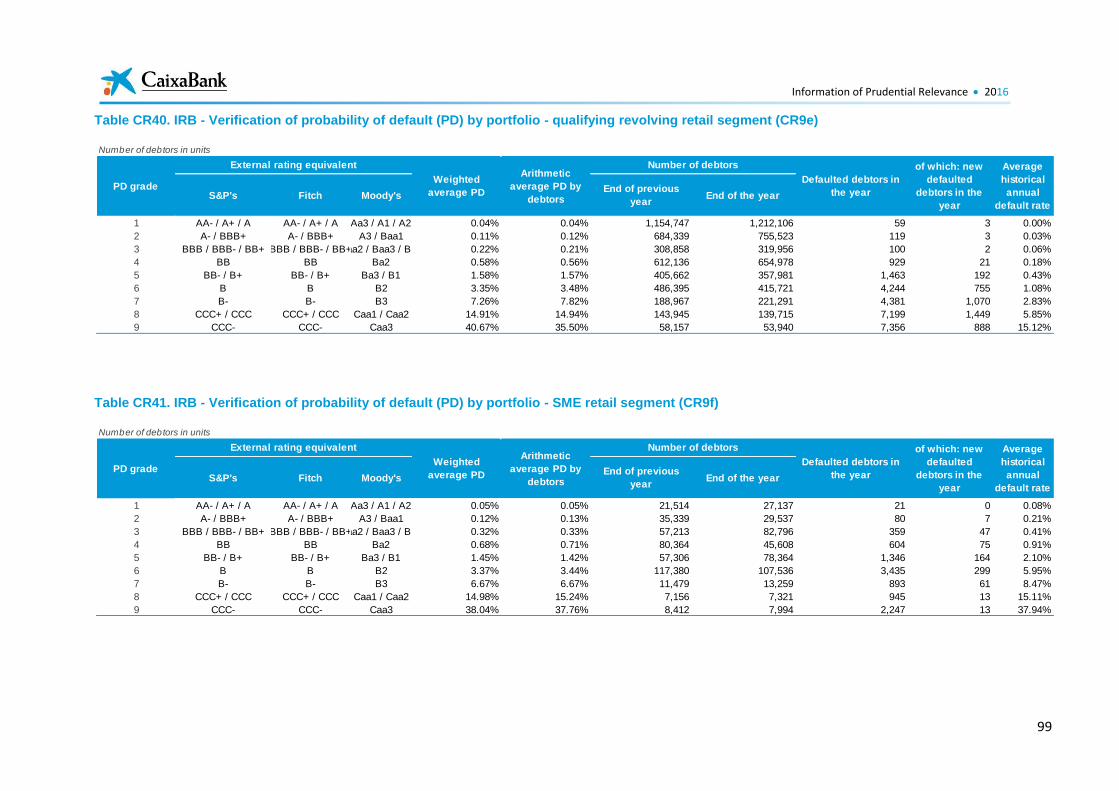
Information of Prudential Relevance 2016
99
Table CR40. IRB - Verification of probability of default (PD) by portfolio - qualifying revolving retail segment (CR9e)
Table CR41. IRB - Verification of probability of default (PD) by portfolio - SME retail segment (CR9f)
Number of debtors in units
S&P's Fitch Moody'sEnd of previous
yearEnd of the year
1 AA- / A+ / A AA- / A+ / A Aa3 / A1 / A2 0.04% 0.04% 1,154,747 1,212,106 59 3 0.00%
2 A- / BBB+ A- / BBB+ A3 / Baa1 0.11% 0.12% 684,339 755,523 119 3 0.03%
3 BBB / BBB- / BB+ BBB / BBB- / BB+Baa2 / Baa3 / Ba1 0.22% 0.21% 308,858 319,956 100 2 0.06%
4 BB BB Ba2 0.58% 0.56% 612,136 654,978 929 21 0.18%
5 BB- / B+ BB- / B+ Ba3 / B1 1.58% 1.57% 405,662 357,981 1,463 192 0.43%
6 B B B2 3.35% 3.48% 486,395 415,721 4,244 755 1.08%
7 B- B- B3 7.26% 7.82% 188,967 221,291 4,381 1,070 2.83%
8 CCC+ / CCC CCC+ / CCC Caa1 / Caa2 14.91% 14.94% 143,945 139,715 7,199 1,449 5.85%
9 CCC- CCC- Caa3 40.67% 35.50% 58,157 53,940 7,356 888 15.12%
of which: new
defaulted
debtors in the
year
Average
historical
annual
default rate
PD grade
External rating equivalent
Weighted
average PD
Arithmetic
average PD by
debtors
Number of debtors
Defaulted debtors in
the year
Number of debtors in units
S&P's Fitch Moody'sEnd of previous
yearEnd of the year
1 AA- / A+ / A AA- / A+ / A Aa3 / A1 / A2 0.05% 0.05% 21,514 27,137 21 0 0.08%
2 A- / BBB+ A- / BBB+ A3 / Baa1 0.12% 0.13% 35,339 29,537 80 7 0.21%
3 BBB / BBB- / BB+ BBB / BBB- / BB+Baa2 / Baa3 / Ba1 0.32% 0.33% 57,213 82,796 359 47 0.41%
4 BB BB Ba2 0.68% 0.71% 80,364 45,608 604 75 0.91%
5 BB- / B+ BB- / B+ Ba3 / B1 1.45% 1.42% 57,306 78,364 1,346 164 2.10%
6 B B B2 3.37% 3.44% 117,380 107,536 3,435 299 5.95%
7 B- B- B3 6.67% 6.67% 11,479 13,259 893 61 8.47%
8 CCC+ / CCC CCC+ / CCC Caa1 / Caa2 14.98% 15.24% 7,156 7,321 945 13 15.11%
9 CCC- CCC- Caa3 38.04% 37.76% 8,412 7,994 2,247 13 37.94%
of which: new
defaulted
debtors in the
year
Average
historical
annual
default rate
PD grade
External rating equivalent
Weighted
average PD
Arithmetic
average PD by
debtors
Number of debtors
Defaulted debtors in
the year
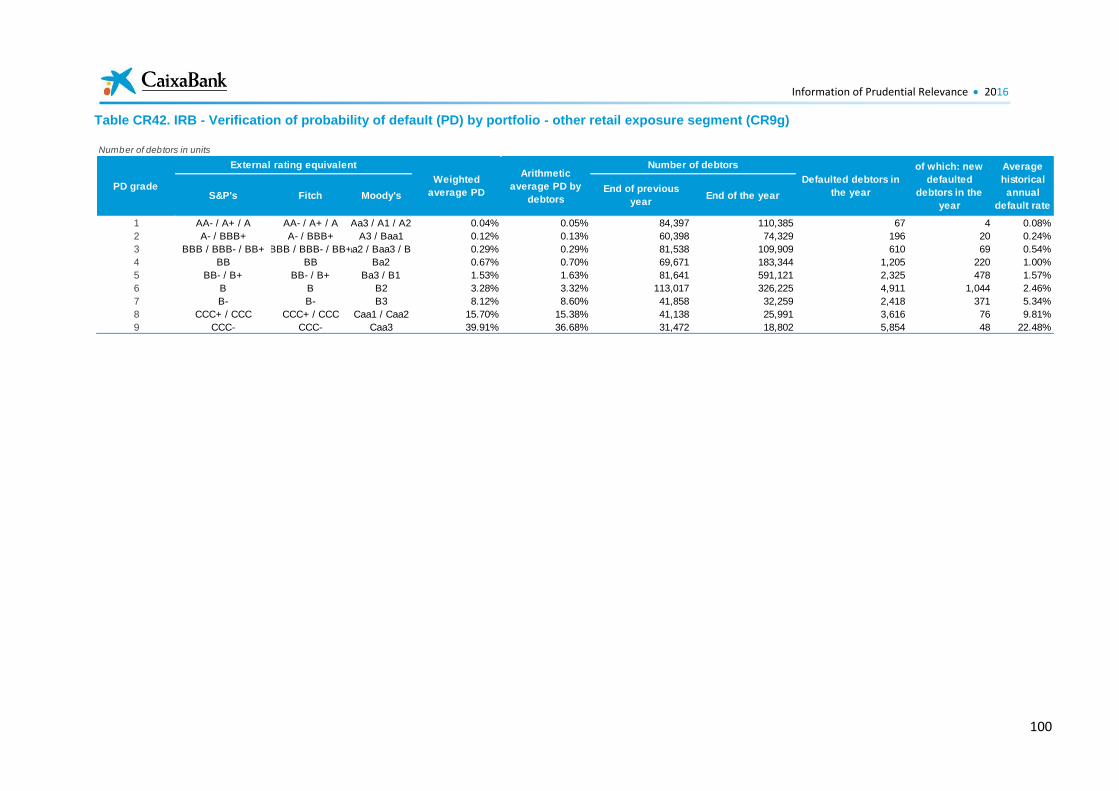
Information of Prudential Relevance 2016
100
Table CR42. IRB - Verification of probability of default (PD) by portfolio - other retail exposure segment (CR9g)
Number of debtors in units
S&P's Fitch Moody'sEnd of previous
yearEnd of the year
1 AA- / A+ / A AA- / A+ / A Aa3 / A1 / A2 0.04% 0.05% 84,397 110,385 67 4 0.08%
2 A- / BBB+ A- / BBB+ A3 / Baa1 0.12% 0.13% 60,398 74,329 196 20 0.24%
3 BBB / BBB- / BB+ BBB / BBB- / BB+Baa2 / Baa3 / Ba1 0.29% 0.29% 81,538 109,909 610 69 0.54%
4 BB BB Ba2 0.67% 0.70% 69,671 183,344 1,205 220 1.00%
5 BB- / B+ BB- / B+ Ba3 / B1 1.53% 1.63% 81,641 591,121 2,325 478 1.57%
6 B B B2 3.28% 3.32% 113,017 326,225 4,911 1,044 2.46%
7 B- B- B3 8.12% 8.60% 41,858 32,259 2,418 371 5.34%
8 CCC+ / CCC CCC+ / CCC Caa1 / Caa2 15.70% 15.38% 41,138 25,991 3,616 76 9.81%
9 CCC- CCC- Caa3 39.91% 36.68% 31,472 18,802 5,854 48 22.48%
of which: new
defaulted
debtors in the
year
Average
historical
annual
default rate
PD grade
External rating equivalent
Weighted
average PD
Arithmetic
average PD by
debtors
Number of debtors
Defaulted debtors in
the year
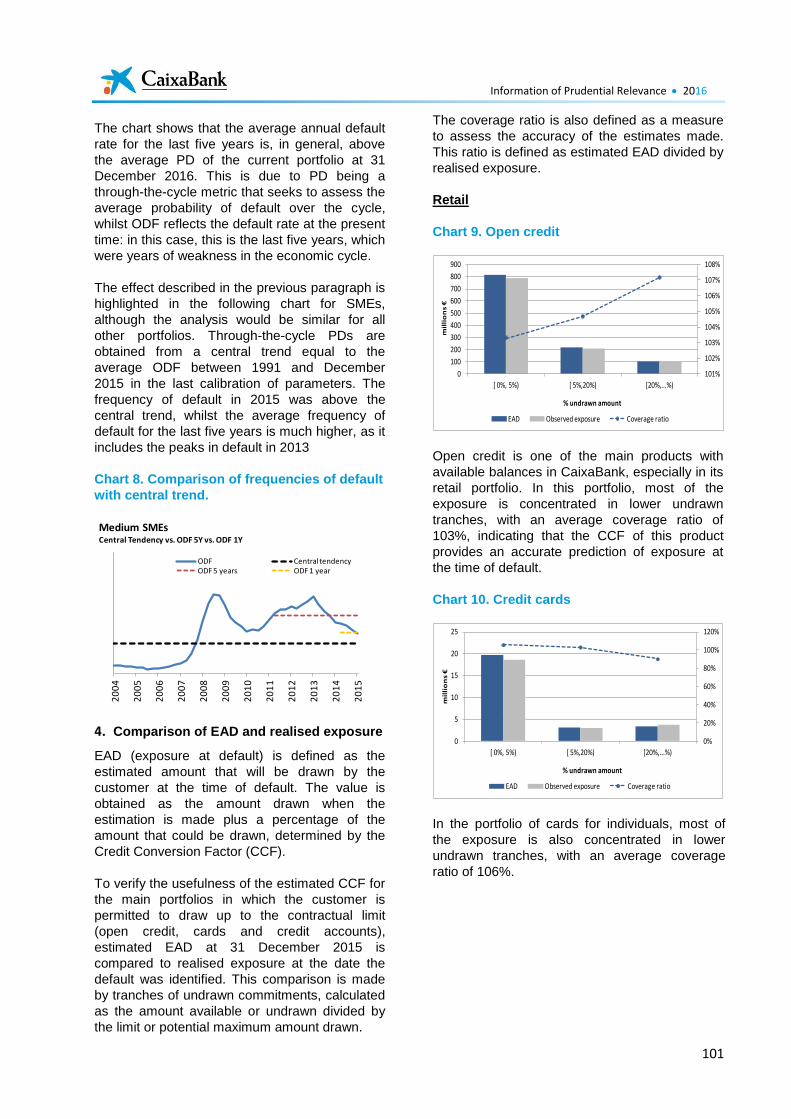
Information of Prudential Relevance 2016
101
The chart shows that the average annual default
rate for the last five years is, in general, above
the average PD of the current portfolio at 31
December 2016. This is due to PD being a
through-the-cycle metric that seeks to assess the
average probability of default over the cycle,
whilst ODF reflects the default rate at the present
time: in this case, this is the last five years, which
were years of weakness in the economic cycle.
The effect described in the previous paragraph is
highlighted in the following chart for SMEs,
although the analysis would be similar for all
other portfolios. Through-the-cycle PDs are
obtained from a central trend equal to the
average ODF between 1991 and December
2015 in the last calibration of parameters. The
frequency of default in 2015 was above the
central trend, whilst the average frequency of
default for the last five years is much higher, as it
includes the peaks in default in 2013
Chart 8. Comparison of frequencies of default
with central trend.
4. Comparison of EAD and realised exposure
EAD (exposure at default) is defined as the
estimated amount that will be drawn by the
customer at the time of default. The value is
obtained as the amount drawn when the
estimation is made plus a percentage of the
amount that could be drawn, determined by the
Credit Conversion Factor (CCF).
To verify the usefulness of the estimated CCF for
the main portfolios in which the customer is
permitted to draw up to the contractual limit
(open credit, cards and credit accounts),
estimated EAD at 31 December 2015 is
compared to realised exposure at the date the
default was identified. This comparison is made
by tranches of undrawn commitments, calculated
as the amount available or undrawn divided by
the limit or potential maximum amount drawn.
The coverage ratio is also defined as a measure
to assess the accuracy of the estimates made.
This ratio is defined as estimated EAD divided by
realised exposure.
Retail
Chart 9. Open credit
Open credit is one of the main products with
available balances in CaixaBank, especially in its
retail portfolio. In this portfolio, most of the
exposure is concentrated in lower undrawn
tranches, with an average coverage ratio of
103%, indicating that the CCF of this product
provides an accurate prediction of exposure at
the time of default.
Chart 10. Credit cards
In the portfolio of cards for individuals, most of
the exposure is also concentrated in lower
undrawn tranches, with an average coverage
ratio of 106%.
20
04
20
05
20
06
20
07
20
08
20
09
20
10
20
11
20
12
20
13
20
14
20
15
Medium SMEsCentral Tendency vs. ODF 5Y vs. ODF 1Y
ODF Central tendencyODF 5 years ODF 1 year
101%
102%
103%
104%
105%
106%
107%
108%
0
100
200
300
400
500
600
700
800
900
[ 0%, 5%) [ 5%,20%) [20%,...%)
mil
lio
ns
€
% undrawn amount
EAD Observed exposure Coverage ratio
0%
20%
40%
60%
80%
100%
120%
0
5
10
15
20
25
[ 0%, 5%) [ 5%,20%) [20%,...%)
mil
lio
ns
€
% undrawn amount
EAD Observed exposure Coverage ratio
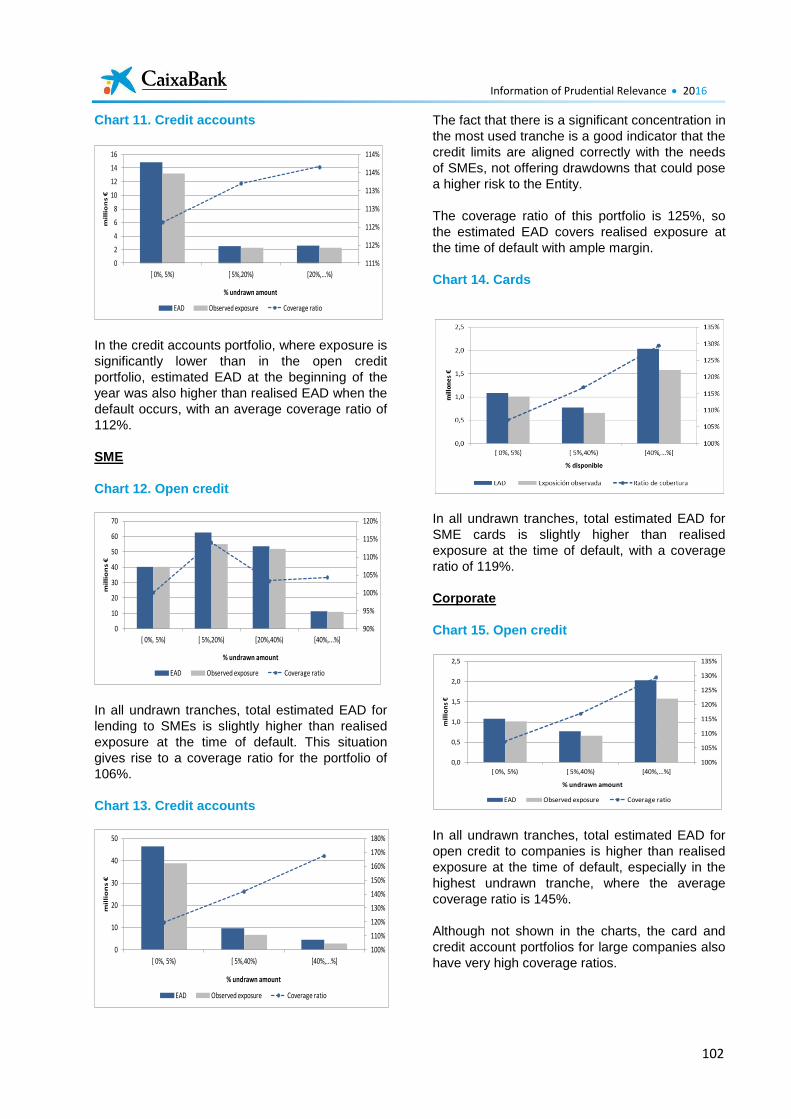
Information of Prudential Relevance 2016
102
Chart 11. Credit accounts
In the credit accounts portfolio, where exposure is
significantly lower than in the open credit
portfolio, estimated EAD at the beginning of the
year was also higher than realised EAD when the
default occurs, with an average coverage ratio of
112%.
SME
Chart 12. Open credit
In all undrawn tranches, total estimated EAD for
lending to SMEs is slightly higher than realised
exposure at the time of default. This situation
gives rise to a coverage ratio for the portfolio of
106%.
Chart 13. Credit accounts
The fact that there is a significant concentration in
the most used tranche is a good indicator that the
credit limits are aligned correctly with the needs
of SMEs, not offering drawdowns that could pose
a higher risk to the Entity.
The coverage ratio of this portfolio is 125%, so
the estimated EAD covers realised exposure at
the time of default with ample margin.
Chart 14. Cards
In all undrawn tranches, total estimated EAD for
SME cards is slightly higher than realised
exposure at the time of default, with a coverage
ratio of 119%.
Corporate
Chart 15. Open credit
In all undrawn tranches, total estimated EAD for
open credit to companies is higher than realised
exposure at the time of default, especially in the
highest undrawn tranche, where the average
coverage ratio is 145%.
Although not shown in the charts, the card and
credit account portfolios for large companies also
have very high coverage ratios.
111%
112%
112%
113%
113%
114%
114%
0
2
4
6
8
10
12
14
16
[ 0%, 5%) [ 5%,20%) [20%,...%)
mil
lio
ns €
% undrawn amount
EAD Observed exposure Coverage ratio
90%
95%
100%
105%
110%
115%
120%
0
10
20
30
40
50
60
70
[ 0%, 5%) [ 5%,20%) [20%,40%) [40%,...%]
mil
lio
ns
€
% undrawn amount
EAD Observed exposure Coverage ratio
100%
110%
120%
130%
140%
150%
160%
170%
180%
0
10
20
30
40
50
[ 0%, 5%) [ 5%,40%) [40%,...%]
mil
lio
ns €
% undrawn amount
EAD Observed exposure Coverage ratio
100%
105%
110%
115%
120%
125%
130%
135%
0,0
0,5
1,0
1,5
2,0
2,5
[ 0%, 5%) [ 5%,40%) [40%,...%]
mill
ion
s €
% undrawn amount
EAD Observed exposure Coverage ratio
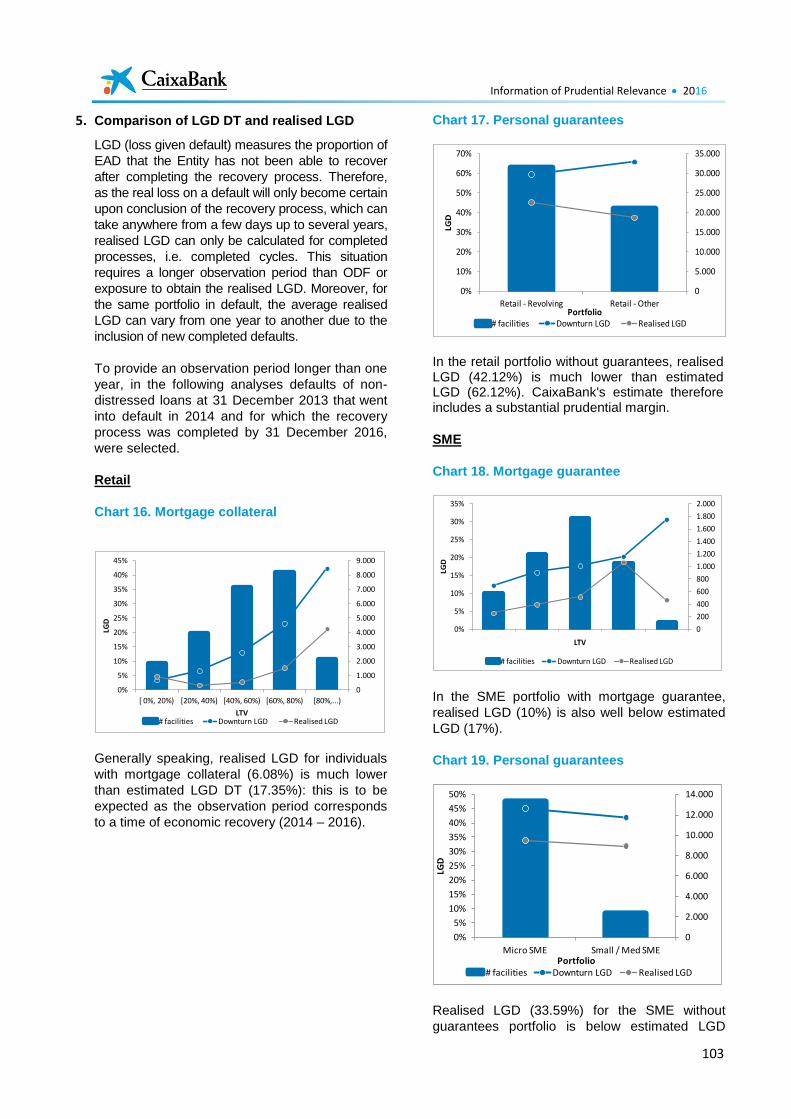
Information of Prudential Relevance 2016
103
5. Comparison of LGD DT and realised LGD
LGD (loss given default) measures the proportion of
EAD that the Entity has not been able to recover
after completing the recovery process. Therefore,
as the real loss on a default will only become certain
upon conclusion of the recovery process, which can
take anywhere from a few days up to several years,
realised LGD can only be calculated for completed
processes, i.e. completed cycles. This situation
requires a longer observation period than ODF or
exposure to obtain the realised LGD. Moreover, for
the same portfolio in default, the average realised
LGD can vary from one year to another due to the
inclusion of new completed defaults.
To provide an observation period longer than one
year, in the following analyses defaults of non-
distressed loans at 31 December 2013 that went
into default in 2014 and for which the recovery
process was completed by 31 December 2016,
were selected.
Retail
Chart 16. Mortgage collateral
Generally speaking, realised LGD for individuals
with mortgage collateral (6.08%) is much lower
than estimated LGD DT (17.35%): this is to be
expected as the observation period corresponds
to a time of economic recovery (2014 – 2016).
Chart 17. Personal guarantees
In the retail portfolio without guarantees, realised LGD (42.12%) is much lower than estimated LGD (62.12%). CaixaBank's estimate therefore includes a substantial prudential margin.
SME
Chart 18. Mortgage guarantee
In the SME portfolio with mortgage guarantee,
realised LGD (10%) is also well below estimated
LGD (17%).
Chart 19. Personal guarantees
Realised LGD (33.59%) for the SME without
guarantees portfolio is below estimated LGD
0
1.000
2.000
3.000
4.000
5.000
6.000
7.000
8.000
9.000
0%
5%
10%
15%
20%
25%
30%
35%
40%
45%
[ 0%, 20%) [20%, 40%) [40%, 60%) [60%, 80%) [80%,...)
LGD
LTV# facilities Downturn LGD Realised LGD
0
5.000
10.000
15.000
20.000
25.000
30.000
35.000
0%
10%
20%
30%
40%
50%
60%
70%
Retail - Revolving Retail - Other
LGD
Portfolio# facilities Downturn LGD Realised LGD
0
200
400
600
800
1.000
1.200
1.400
1.600
1.800
2.000
0%
5%
10%
15%
20%
25%
30%
35%
LGD
LTV
# facilities Downturn LGD Realised LGD
0
2.000
4.000
6.000
8.000
10.000
12.000
14.000
0%
5%
10%
15%
20%
25%
30%
35%
40%
45%
50%
Micro SME Small / Med SME
LGD
Portfolio# facilities Downturn LGD Realised LGD
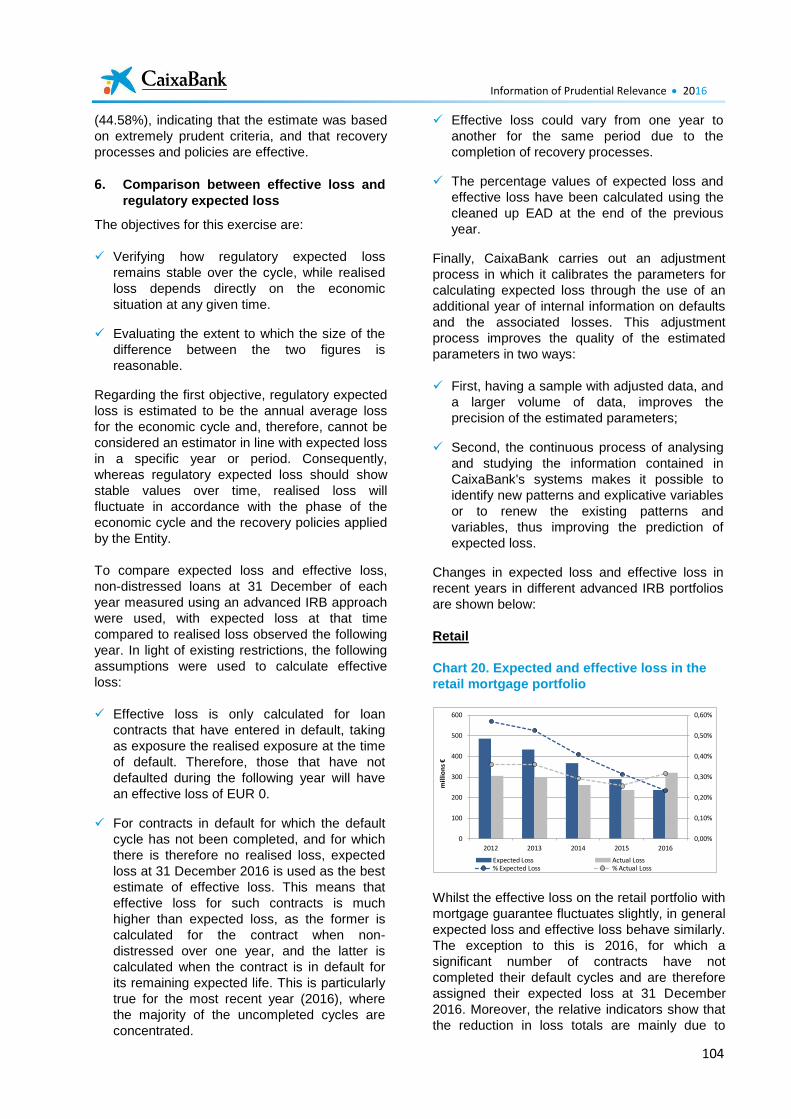
Information of Prudential Relevance 2016
104
(44.58%), indicating that the estimate was based
on extremely prudent criteria, and that recovery
processes and policies are effective.
6. Comparison between effective loss and
regulatory expected loss
The objectives for this exercise are:
Verifying how regulatory expected loss
remains stable over the cycle, while realised
loss depends directly on the economic
situation at any given time.
Evaluating the extent to which the size of the
difference between the two figures is
reasonable.
Regarding the first objective, regulatory expected
loss is estimated to be the annual average loss
for the economic cycle and, therefore, cannot be
considered an estimator in line with expected loss
in a specific year or period. Consequently,
whereas regulatory expected loss should show
stable values over time, realised loss will
fluctuate in accordance with the phase of the
economic cycle and the recovery policies applied
by the Entity.
To compare expected loss and effective loss,
non-distressed loans at 31 December of each
year measured using an advanced IRB approach
were used, with expected loss at that time
compared to realised loss observed the following
year. In light of existing restrictions, the following
assumptions were used to calculate effective
loss:
Effective loss is only calculated for loan
contracts that have entered in default, taking
as exposure the realised exposure at the time
of default. Therefore, those that have not
defaulted during the following year will have
an effective loss of EUR 0.
For contracts in default for which the default
cycle has not been completed, and for which
there is therefore no realised loss, expected
loss at 31 December 2016 is used as the best
estimate of effective loss. This means that
effective loss for such contracts is much
higher than expected loss, as the former is
calculated for the contract when non-
distressed over one year, and the latter is
calculated when the contract is in default for
its remaining expected life. This is particularly
true for the most recent year (2016), where
the majority of the uncompleted cycles are
concentrated.
Effective loss could vary from one year to
another for the same period due to the
completion of recovery processes.
The percentage values of expected loss and
effective loss have been calculated using the
cleaned up EAD at the end of the previous
year.
Finally, CaixaBank carries out an adjustment
process in which it calibrates the parameters for
calculating expected loss through the use of an
additional year of internal information on defaults
and the associated losses. This adjustment
process improves the quality of the estimated
parameters in two ways:
First, having a sample with adjusted data, and
a larger volume of data, improves the
precision of the estimated parameters;
Second, the continuous process of analysing
and studying the information contained in
CaixaBank's systems makes it possible to
identify new patterns and explicative variables
or to renew the existing patterns and
variables, thus improving the prediction of
expected loss.
Changes in expected loss and effective loss in
recent years in different advanced IRB portfolios
are shown below:
Retail
Chart 20. Expected and effective loss in the
retail mortgage portfolio
Whilst the effective loss on the retail portfolio with
mortgage guarantee fluctuates slightly, in general
expected loss and effective loss behave similarly.
The exception to this is 2016, for which a
significant number of contracts have not
completed their default cycles and are therefore
assigned their expected loss at 31 December
2016. Moreover, the relative indicators show that
the reduction in loss totals are mainly due to
0,00%
0,10%
0,20%
0,30%
0,40%
0,50%
0,60%
0
100
200
300
400
500
600
2012 2013 2014 2015 2016
mill
ion
s €
Expected Loss Actual Loss% Expected Loss % Actual Loss
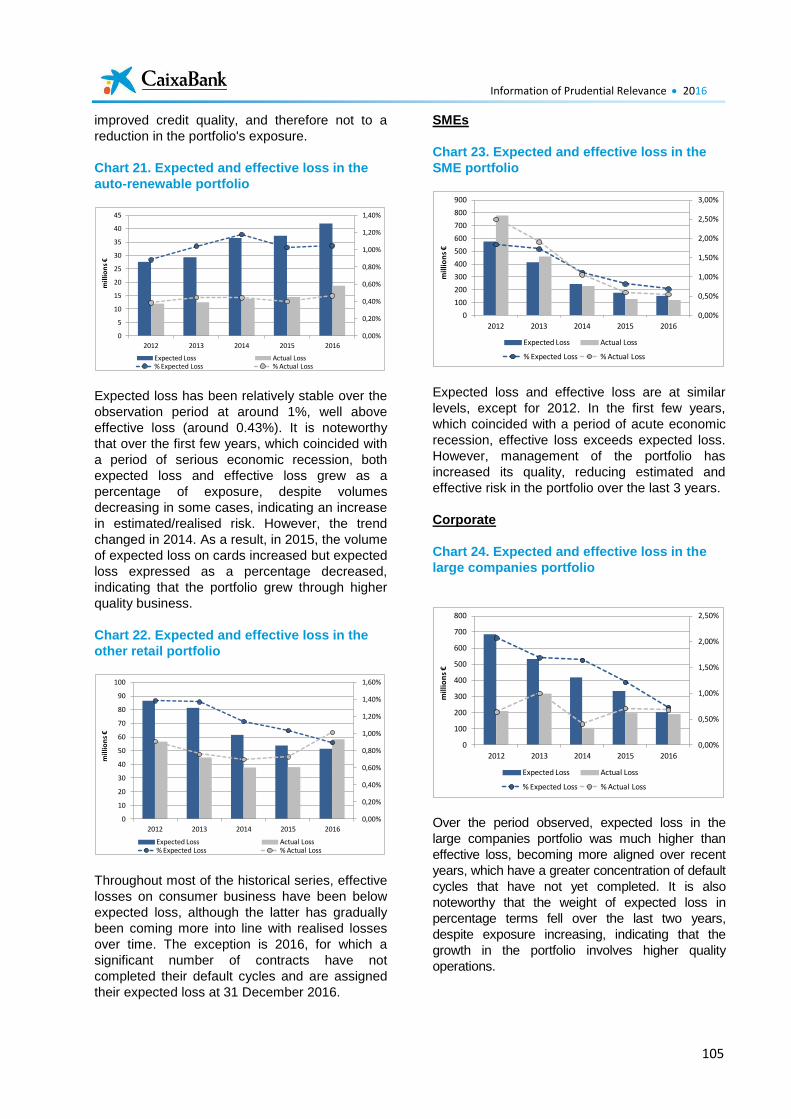
Information of Prudential Relevance 2016
105
improved credit quality, and therefore not to a
reduction in the portfolio's exposure.
Chart 21. Expected and effective loss in the
auto-renewable portfolio
Expected loss has been relatively stable over the
observation period at around 1%, well above
effective loss (around 0.43%). It is noteworthy
that over the first few years, which coincided with
a period of serious economic recession, both
expected loss and effective loss grew as a
percentage of exposure, despite volumes
decreasing in some cases, indicating an increase
in estimated/realised risk. However, the trend
changed in 2014. As a result, in 2015, the volume
of expected loss on cards increased but expected
loss expressed as a percentage decreased,
indicating that the portfolio grew through higher
quality business.
Chart 22. Expected and effective loss in the
other retail portfolio
Throughout most of the historical series, effective
losses on consumer business have been below
expected loss, although the latter has gradually
been coming more into line with realised losses
over time. The exception is 2016, for which a
significant number of contracts have not
completed their default cycles and are assigned
their expected loss at 31 December 2016.
SMEs
Chart 23. Expected and effective loss in the
SME portfolio
Expected loss and effective loss are at similar
levels, except for 2012. In the first few years,
which coincided with a period of acute economic
recession, effective loss exceeds expected loss.
However, management of the portfolio has
increased its quality, reducing estimated and
effective risk in the portfolio over the last 3 years.
Corporate
Chart 24. Expected and effective loss in the
large companies portfolio
Over the period observed, expected loss in the
large companies portfolio was much higher than
effective loss, becoming more aligned over recent
years, which have a greater concentration of default
cycles that have not yet completed. It is also
noteworthy that the weight of expected loss in
percentage terms fell over the last two years,
despite exposure increasing, indicating that the
growth in the portfolio involves higher quality
operations.
0,00%
0,20%
0,40%
0,60%
0,80%
1,00%
1,20%
1,40%
0
5
10
15
20
25
30
35
40
45
2012 2013 2014 2015 2016
mil
lio
ns
€
Expected Loss Actual Loss% Expected Loss % Actual Loss
0,00%
0,20%
0,40%
0,60%
0,80%
1,00%
1,20%
1,40%
1,60%
0
10
20
30
40
50
60
70
80
90
100
2012 2013 2014 2015 2016
mil
lio
ns
€
Expected Loss Actual Loss% Expected Loss % Actual Loss
0,00%
0,50%
1,00%
1,50%
2,00%
2,50%
3,00%
0
100
200
300
400
500
600
700
800
900
2012 2013 2014 2015 2016
mil
lio
ns
€
Expected Loss Actual Loss
% Expected Loss % Actual Loss
0,00%
0,50%
1,00%
1,50%
2,00%
2,50%
0
100
200
300
400
500
600
700
800
2012 2013 2014 2015 2016
mill
ion
s €
Expected Loss Actual Loss
% Expected Loss % Actual Loss
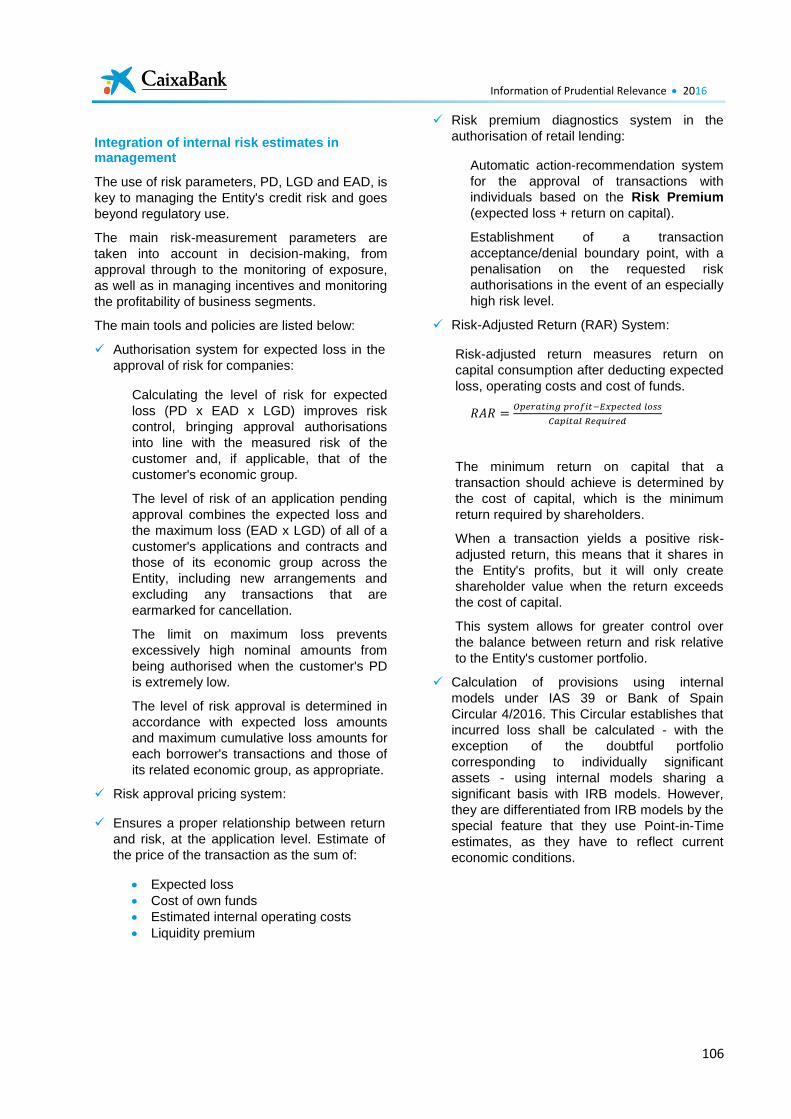
Information of Prudential Relevance 2016
106
Integration of internal risk estimates in management
The use of risk parameters, PD, LGD and EAD, is
key to managing the Entity's credit risk and goes
beyond regulatory use.
The main risk-measurement parameters are
taken into account in decision-making, from
approval through to the monitoring of exposure,
as well as in managing incentives and monitoring
the profitability of business segments.
The main tools and policies are listed below:
Authorisation system for expected loss in the
approval of risk for companies:
Calculating the level of risk for expected
loss (PD x EAD x LGD) improves risk
control, bringing approval authorisations
into line with the measured risk of the
customer and, if applicable, that of the
customer's economic group.
The level of risk of an application pending
approval combines the expected loss and
the maximum loss (EAD x LGD) of all of a
customer's applications and contracts and
those of its economic group across the
Entity, including new arrangements and
excluding any transactions that are
earmarked for cancellation.
The limit on maximum loss prevents
excessively high nominal amounts from
being authorised when the customer's PD
is extremely low.
The level of risk approval is determined in
accordance with expected loss amounts
and maximum cumulative loss amounts for
each borrower's transactions and those of
its related economic group, as appropriate.
Risk approval pricing system:
Ensures a proper relationship between return
and risk, at the application level. Estimate of
the price of the transaction as the sum of:
Expected loss
Cost of own funds
Estimated internal operating costs
Liquidity premium
Risk premium diagnostics system in the
authorisation of retail lending:
Automatic action-recommendation system
for the approval of transactions with
individuals based on the Risk Premium
(expected loss + return on capital).
Establishment of a transaction
acceptance/denial boundary point, with a
penalisation on the requested risk
authorisations in the event of an especially
high risk level.
Risk-Adjusted Return (RAR) System:
Risk-adjusted return measures return on
capital consumption after deducting expected
loss, operating costs and cost of funds.
The minimum return on capital that a
transaction should achieve is determined by
the cost of capital, which is the minimum
return required by shareholders.
When a transaction yields a positive risk-
adjusted return, this means that it shares in
the Entity's profits, but it will only create
shareholder value when the return exceeds
the cost of capital.
This system allows for greater control over
the balance between return and risk relative
to the Entity's customer portfolio.
Calculation of provisions using internal
models under IAS 39 or Bank of Spain
Circular 4/2016. This Circular establishes that
incurred loss shall be calculated - with the
exception of the doubtful portfolio
corresponding to individually significant
assets - using internal models sharing a
significant basis with IRB models. However,
they are differentiated from IRB models by the
special feature that they use Point-in-Time
estimates, as they have to reflect current
economic conditions.
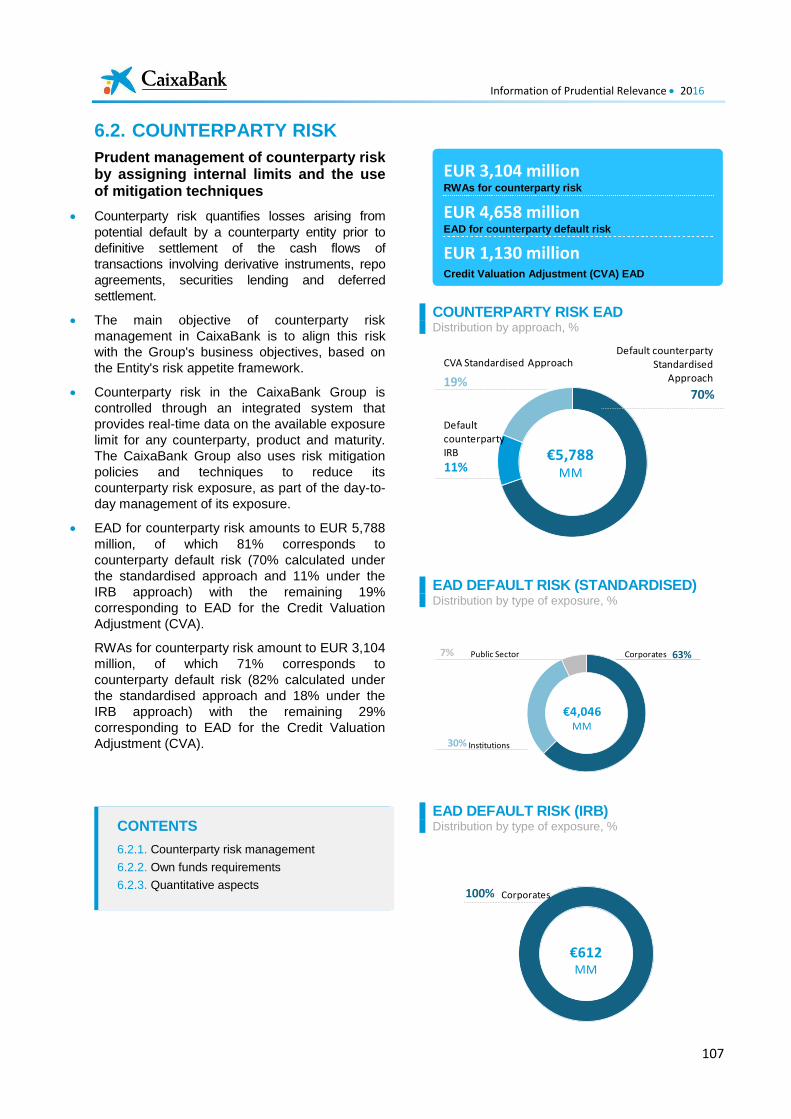
Information of Prudential Relevance 2016
107
6.2. COUNTERPARTY RISK
Prudent management of counterparty risk by assigning internal limits and the use of mitigation techniques
Counterparty risk quantifies losses arising from
potential default by a counterparty entity prior to
definitive settlement of the cash flows of
transactions involving derivative instruments, repo
agreements, securities lending and deferred
settlement.
The main objective of counterparty risk
management in CaixaBank is to align this risk
with the Group's business objectives, based on
the Entity's risk appetite framework.
Counterparty risk in the CaixaBank Group is
controlled through an integrated system that
provides real-time data on the available exposure
limit for any counterparty, product and maturity.
The CaixaBank Group also uses risk mitigation
policies and techniques to reduce its
counterparty risk exposure, as part of the day-to-
day management of its exposure.
EAD for counterparty risk amounts to EUR 5,788
million, of which 81% corresponds to
counterparty default risk (70% calculated under
the standardised approach and 11% under the
IRB approach) with the remaining 19%
corresponding to EAD for the Credit Valuation
Adjustment (CVA).
RWAs for counterparty risk amount to EUR 3,104
million, of which 71% corresponds to
counterparty default risk (82% calculated under
the standardised approach and 18% under the
IRB approach) with the remaining 29%
corresponding to EAD for the Credit Valuation
Adjustment (CVA).
COUNTERPARTY RISK EAD Distribution by approach, %
EAD DEFAULT RISK (STANDARDISED) Distribution by type of exposure, %
EAD DEFAULT RISK (IRB) Distribution by type of exposure, %
70%
11%
19%
€5,788MM
Defaultcounterparty IRB
Default counterparty Standardised
Approach
CVA Standardised Approach
63%
30%
7% Public Sector
€4,046MM
Institutions
Corporates
100%
€612MM
Corporates
EUR 3,104 million RWAs for counterparty risk
EUR 4,658 million EAD for counterparty default risk
EUR 1,130 million
Credit Valuation Adjustment (CVA) EAD
CONTENTS
6.2.1. Counterparty risk management
6.2.2. Own funds requirements
6.2.3. Quantitative aspects
Information of Prudential Relevance 2016
108
6.2.1. Counterpart risk management
Description and general policy
As defined in section 272 of the CRR,
counterparty risk is the risk that the counterparty
in an operation could enter into non-payment
before the definitive settlement of the cash flows
of the operation. Counterparty risk arises in
transactions involving derivative instruments,
repo agreements, securities lending and deferred
settlement.
The main aim of counterparty risk management
at CaixaBank is to align the counterparty risk
assumed with the Entity’s business objectives,
within its risk appetite framework. This involves
configuring a risk profile that simultaneously
helps profitability and value creation budgets to
be achieved and guarantees the Entity’s capital
adequacy in the medium and long term.
The approval of new transactions involving
counterparty risk in CaixaBank is subject to a
predefined internal framework, that enables rapid
decision making about assuming such risk, for
both financial and other counterparties.
Accordingly, in its business with financial entities,
CaixaBank has a credit approval system in place
approved by the Global Risk Committee, in which
the maximum authorised exposure to credit risk
with an entity, including counterparty risk, is
determined by a complex calculation based
mainly on the entity's ratings and analysis of its
financial statements.
In transactions with other counterparties,
including retail customers, derivative transactions
relating to loan applications (loan interest rate risk
hedging) are approved jointly with the application.
All other transactions are approved in accordance
with their compliance with the assigned risk limit
(and included in the corresponding derivatives
risk line) or their individual assessment. Approval
of transactions corresponds to the risk areas
responsible for loan analysis and approval.
The definition of limits for counterparty risk is
complemented by internal concentration limits,
mainly for country and large exposure risks.
The granting of pre-approved risk limits for
counterparties means the amount available for
contracting new operations is always known.
CaixaBank has put in place a specific internal
framework for risk with central counterparties
(CCPs), specifying how the limits for such entities
are determined, and how exposure is calculated
to determine the available balance on this limit.
This framework has been approved by the Global
Risk Committee.
Structure and organisation of the risk management function
The CaixaBank areas with direct responsibilities
for the quantification, monitoring and control of
counterparty risk are:
The Financial Sector and Country Risk
Department, part of the Executive Risk
Analysis and Approval Division for
Companies, is responsible for risks
undertaken by CaixaBank with financial
entities, regardless of the type of operation
and the sector of business that generates
them. Its main counterparty risk functions are:
Determining the risk thresholds per
counterparty;
Analysing and monitoring
counterparties and risks;
Controlling the use of limits and
authorising breaches;
Monitoring legal risk; and
Preparing risk information for internal
bodies.
Other centres reporting to the Executive
Risk Analysis and Approval Division for
Companies and the Corporate Analysis
and Approval Division for Individuals that
are responsible for accepting risks with non-
financial entities (companies and individuals,
respectively) on behalf of CaixaBank,
irrespective of the type of transaction and the
activity that generates them. This, therefore,
also includes operations that generate
counterparty risk for CaixaBank.
The Risk in Market Operations Department,
which is part of the Corporate Global Risk
Management Division. Its main functions with
regard to counterparty risk are:
Defining and implementing calculation
methodologies for the estimation of
credit exposure equivalent;
Daily valuation of OTC derivative
collateral agreements, repos and
securities lending;
Calculation of minimum capital
requirements for counterparty risk and
preparation of regular reports for the
supervisor.
Information of Prudential Relevance 2016
109
Preparing regular information on
counterparty risk for internal bodies.
The Operational Market Services Area, part
of the Banking Services Subdivision. This unit
is responsible for day-to-day operational
management of bilateral derivatives collateral
contracts, repos and securities lending, and
collateral contracts with central counterparties
(for both OTC and organised market trades).
Its main functions include:
Generation of margin calls for
counterparties,
Reconciliation of collateralised
positions and management of
discrepancies.
Monitoring settlements and the accounting associated with management of such contracts.
The Business Legal Advisory department,
part of the Executive Legal Advisory division,
responsible for preparing framework
agreements between CaixaBank and
counterparties.
Measurement and information systems for management of counterparty risk
Counterparty risk relating to derivative
transactions is quantitatively associated with the
related market risk, since the amount owed by
the counterparty must be calculated by reference
to the market value of the contracts, plus their
related potential value (possible changes in their
future value under extreme market price
conditions, based on known historical patterns of
market prices).
The equivalent credit exposure for derivatives is
understood as the maximum potential loss over
the life of an operation that CaixaBank might
incur should the counterparty default at any time
in the future. This is calculated using Monte Carlo
simulation with portfolio effect and offsetting of
positions, as applicable, at a 95% confidence
interval, based on stochastic models
incorporating the volatility of the underlying and
all of the characteristics of the operations.
Counterparty risk exposure for repos and
securities lending is calculated as the difference
between the market value of the asset granted to
the counterparty and the market value of the
collateral received from the counterparty,
considering the applicable volatility adjustments
in each case.
It also considers the mitigating effect of collateral
received under framework collateral agreements
(refer to the "Hedging policies and mitigation
techniques for counterparty risk" section). In
general, the methodology for calculating
counterparty risk exposure described above is
applied during the acceptance of new operations
and in recurrent calculations on subsequent days.
Counterparty risk in the CaixaBank Group for
financial counterparties is controlled through an
integrated system that provides real-time data on
the available exposure limit for any counterparty,
product and maturity. For the remaining
counterparties, counterparty risk is controlled
through corporate applications, which contain
both the limits of the lines of derivatives risk (if
any) and credit exposure of derivatives and
repos.
Hedging policies and mitigation techniques for counterparty risk
The main risk mitigation policies and techniques
employed for counterparty risk with financial
entities involve:
ISDA/CMOF contracts. Standardised
contracts for global derivative operations with
a counterparty. These explicitly provide for the
possibility of offsetting the flows of
outstanding collections and payments
between the parties for all derivatives trading
hedged by the contracts.
CSA contracts / CMOF appendix III.
Agreements whereby each of the parties
undertake to provide collateral (usually a cash
deposit) as security for the net counterparty
risk position arising from the derivatives
traded between them, on the basis of a prior
close-out netting agreement included in the
clauses of the ISDA/CMOF contracts.
GMRA/ CME/ GMSLA contracts (repo
agreements and securities lending).
Agreements whereby the parties undertake to
deliver collateral to each other for the net
counterparty risk exposure arising from
differences between the value of the sum
accrued by simultaneous buying and selling of
securities and the market value of the securities.
Break-up clauses. Such clauses provide for
early termination of the agreement by one of
the parties of its own free will, at a certain
point in a contract. This mitigates counterparty
risk by reducing the effective duration of the
operations subject to the clause.
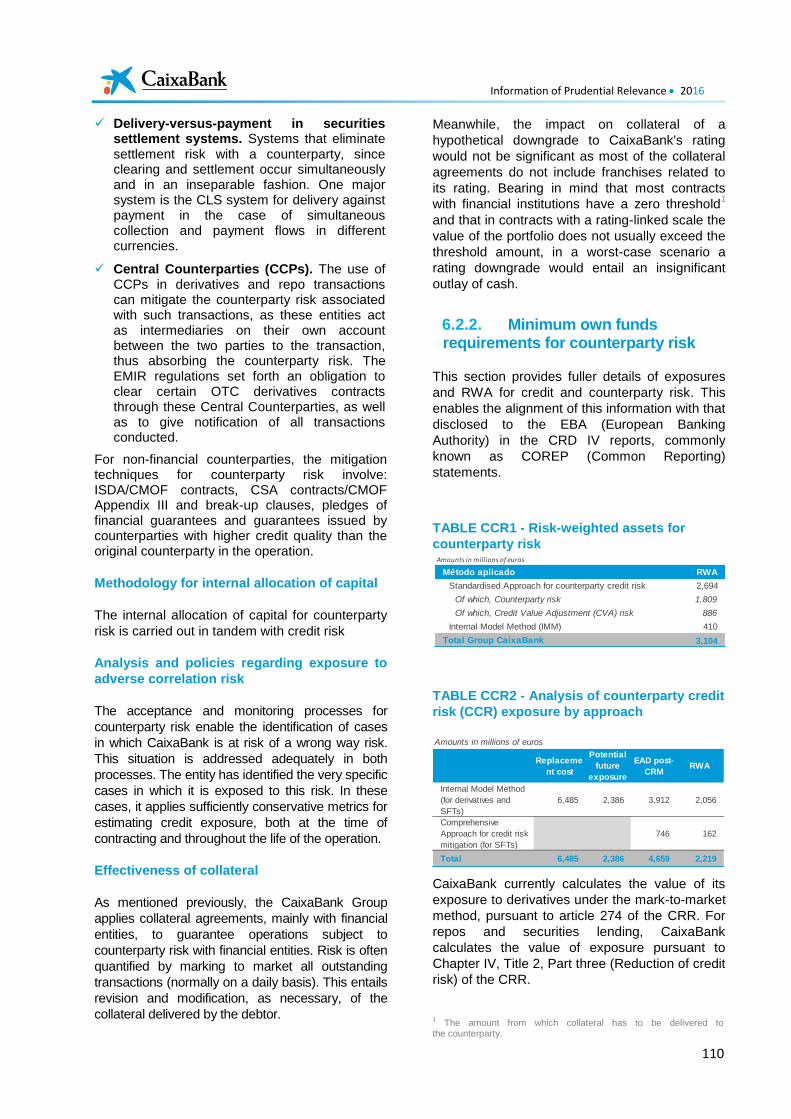
Information of Prudential Relevance 2016
110
Delivery-versus-payment in securities settlement systems. Systems that eliminate settlement risk with a counterparty, since clearing and settlement occur simultaneously and in an inseparable fashion. One major system is the CLS system for delivery against payment in the case of simultaneous collection and payment flows in different currencies.
Central Counterparties (CCPs). The use of CCPs in derivatives and repo transactions can mitigate the counterparty risk associated with such transactions, as these entities act as intermediaries on their own account between the two parties to the transaction, thus absorbing the counterparty risk. The EMIR regulations set forth an obligation to clear certain OTC derivatives contracts through these Central Counterparties, as well as to give notification of all transactions conducted.
For non-financial counterparties, the mitigation techniques for counterparty risk involve: ISDA/CMOF contracts, CSA contracts/CMOF Appendix III and break-up clauses, pledges of financial guarantees and guarantees issued by counterparties with higher credit quality than the original counterparty in the operation.
Methodology for internal allocation of capital
The internal allocation of capital for counterparty
risk is carried out in tandem with credit risk
Analysis and policies regarding exposure to
adverse correlation risk
The acceptance and monitoring processes for
counterparty risk enable the identification of cases
in which CaixaBank is at risk of a wrong way risk.
This situation is addressed adequately in both
processes. The entity has identified the very specific
cases in which it is exposed to this risk. In these
cases, it applies sufficiently conservative metrics for
estimating credit exposure, both at the time of
contracting and throughout the life of the operation.
Effectiveness of collateral
As mentioned previously, the CaixaBank Group
applies collateral agreements, mainly with financial
entities, to guarantee operations subject to
counterparty risk with financial entities. Risk is often
quantified by marking to market all outstanding
transactions (normally on a daily basis). This entails
revision and modification, as necessary, of the
collateral delivered by the debtor.
Meanwhile, the impact on collateral of a
hypothetical downgrade to CaixaBank's rating
would not be significant as most of the collateral
agreements do not include franchises related to
its rating. Bearing in mind that most contracts
with financial institutions have a zero threshold1
and that in contracts with a rating-linked scale the
value of the portfolio does not usually exceed the
threshold amount, in a worst-case scenario a
rating downgrade would entail an insignificant
outlay of cash.
6.2.2. Minimum own funds requirements for counterparty risk
This section provides fuller details of exposures
and RWA for credit and counterparty risk. This
enables the alignment of this information with that
disclosed to the EBA (European Banking
Authority) in the CRD IV reports, commonly
known as COREP (Common Reporting)
statements.
TABLE CCR1 - Risk-weighted assets for
counterparty risk
TABLE CCR2 - Analysis of counterparty credit
risk (CCR) exposure by approach
CaixaBank currently calculates the value of its
exposure to derivatives under the mark-to-market
method, pursuant to article 274 of the CRR. For
repos and securities lending, CaixaBank
calculates the value of exposure pursuant to
Chapter IV, Title 2, Part three (Reduction of credit
risk) of the CRR.
1 The amount from which collateral has to be delivered to
the counterparty.
Amounts in millions of euros
Método aplicado RWA
Standardised Approach for counterparty credit risk 2,694
Of which, Counterparty risk 1,809
Of which, Credit Value Adjustment (CVA) risk 886
Internal Model Method (IMM) 410
Total Group CaixaBank 3,104
Amounts in millions of euros
Replaceme
nt cost
Potential
future
exposure
EAD post-
CRMRWA
Internal Model Method
(for derivatives and
SFTs)
6,485 2,386 3,912 2,056
Comprehensive
Approach for credit risk
mitigation (for SFTs)
746 162
Total 6,485 2,386 4,659 2,219
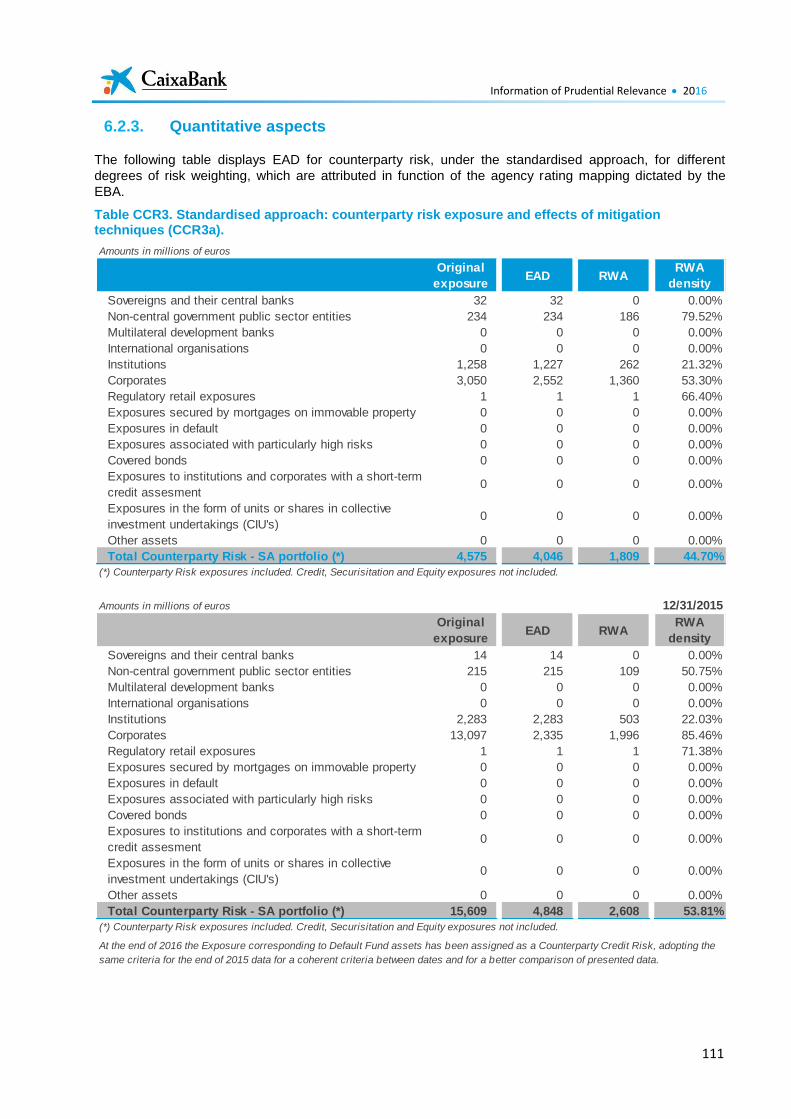
Information of Prudential Relevance 2016
111
6.2.3. Quantitative aspects
The following table displays EAD for counterparty risk, under the standardised approach, for different
degrees of risk weighting, which are attributed in function of the agency rating mapping dictated by the
EBA.
Table CCR3. Standardised approach: counterparty risk exposure and effects of mitigation techniques (CCR3a).
Amounts in millions of euros
Original
exposureEAD RWA
RWA
density
Sovereigns and their central banks 32 32 0 0.00%
Non-central government public sector entities 234 234 186 79.52%
Multilateral development banks 0 0 0 0.00%
International organisations 0 0 0 0.00%
Institutions 1,258 1,227 262 21.32%
Corporates 3,050 2,552 1,360 53.30%
Regulatory retail exposures 1 1 1 66.40%
Exposures secured by mortgages on immovable property 0 0 0 0.00%
Exposures in default 0 0 0 0.00%
Exposures associated with particularly high risks 0 0 0 0.00%
Covered bonds 0 0 0 0.00%
Exposures to institutions and corporates with a short-term
credit assesment0 0 0 0.00%
Exposures in the form of units or shares in collective
investment undertakings (CIU's)0 0 0 0.00%
Other assets 0 0 0 0.00%
Total Counterparty Risk - SA portfolio (*) 4,575 4,046 1,809 44.70%
(*) Counterparty Risk exposures included. Credit, Securisitation and Equity exposures not included.
Amounts in millions of euros 12/31/2015
Original
exposureEAD RWA
RWA
density
Sovereigns and their central banks 14 14 0 0.00%
Non-central government public sector entities 215 215 109 50.75%
Multilateral development banks 0 0 0 0.00%
International organisations 0 0 0 0.00%
Institutions 2,283 2,283 503 22.03%
Corporates 13,097 2,335 1,996 85.46%
Regulatory retail exposures 1 1 1 71.38%
Exposures secured by mortgages on immovable property 0 0 0 0.00%
Exposures in default 0 0 0 0.00%
Exposures associated with particularly high risks 0 0 0 0.00%
Covered bonds 0 0 0 0.00%
Exposures to institutions and corporates with a short-term
credit assesment0 0 0 0.00%
Exposures in the form of units or shares in collective
investment undertakings (CIU's)0 0 0 0.00%
Other assets 0 0 0 0.00%
Total Counterparty Risk - SA portfolio (*) 15,609 4,848 2,608 53.81%
(*) Counterparty Risk exposures included. Credit, Securisitation and Equity exposures not included.
At the end of 2016 the Exposure corresponding to Default Fund assets has been assigned as a Counterparty Credit Risk, adopting the
same criteria for the end of 2015 data for a coherent criteria between dates and for a better comparison of presented data.
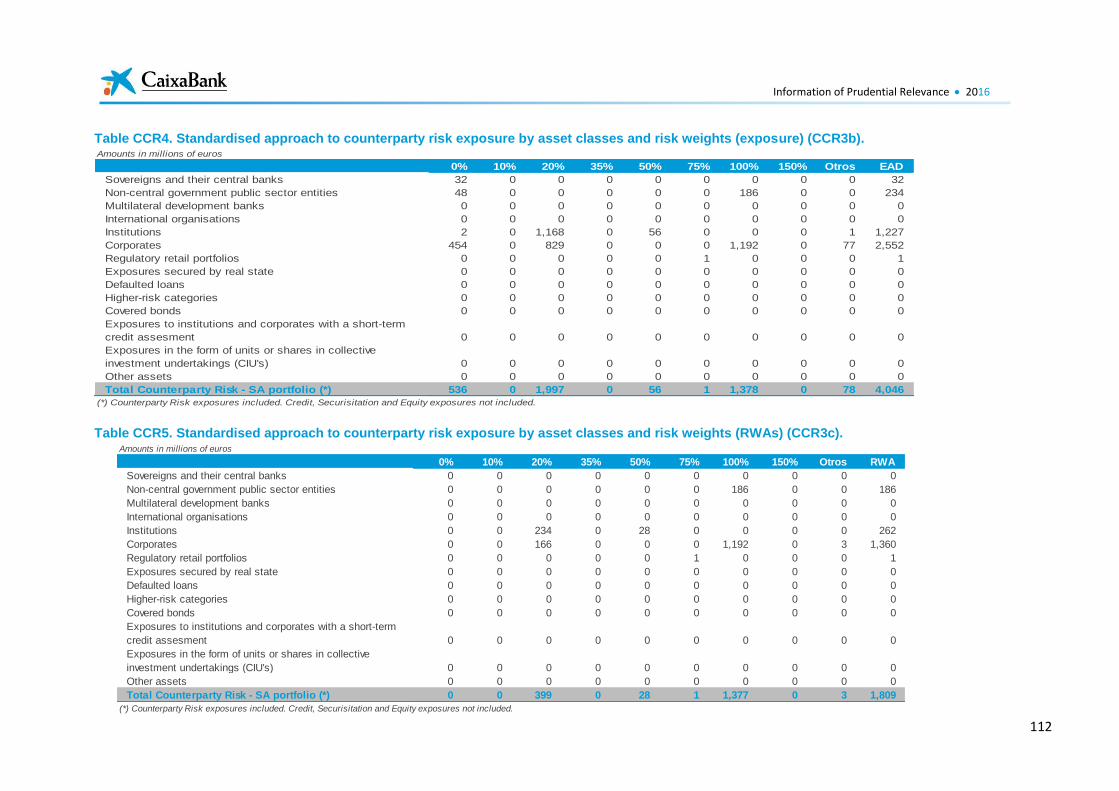
Information of Prudential Relevance 2016
112
Table CCR4. Standardised approach to counterparty risk exposure by asset classes and risk weights (exposure) (CCR3b).
Table CCR5. Standardised approach to counterparty risk exposure by asset classes and risk weights (RWAs) (CCR3c).
Amounts in millions of euros
0% 10% 20% 35% 50% 75% 100% 150% Otros EAD
Sovereigns and their central banks 32 0 0 0 0 0 0 0 0 32
Non-central government public sector entities 48 0 0 0 0 0 186 0 0 234
Multilateral development banks 0 0 0 0 0 0 0 0 0 0
International organisations 0 0 0 0 0 0 0 0 0 0
Institutions 2 0 1,168 0 56 0 0 0 1 1,227
Corporates 454 0 829 0 0 0 1,192 0 77 2,552
Regulatory retail portfolios 0 0 0 0 0 1 0 0 0 1
Exposures secured by real state 0 0 0 0 0 0 0 0 0 0
Defaulted loans 0 0 0 0 0 0 0 0 0 0
Higher-risk categories 0 0 0 0 0 0 0 0 0 0
Covered bonds 0 0 0 0 0 0 0 0 0 0
Exposures to institutions and corporates with a short-term
credit assesment 0 0 0 0 0 0 0 0 0 0
Exposures in the form of units or shares in collective
investment undertakings (CIU's) 0 0 0 0 0 0 0 0 0 0
Other assets 0 0 0 0 0 0 0 0 0 0
Total Counterparty Risk - SA portfolio (*) 536 0 1,997 0 56 1 1,378 0 78 4,046
(*) Counterparty Risk exposures included. Credit, Securisitation and Equity exposures not included.
Amounts in millions of euros
0% 10% 20% 35% 50% 75% 100% 150% Otros RWA
Sovereigns and their central banks 0 0 0 0 0 0 0 0 0 0
Non-central government public sector entities 0 0 0 0 0 0 186 0 0 186
Multilateral development banks 0 0 0 0 0 0 0 0 0 0
International organisations 0 0 0 0 0 0 0 0 0 0
Institutions 0 0 234 0 28 0 0 0 0 262
Corporates 0 0 166 0 0 0 1,192 0 3 1,360
Regulatory retail portfolios 0 0 0 0 0 1 0 0 0 1
Exposures secured by real state 0 0 0 0 0 0 0 0 0 0
Defaulted loans 0 0 0 0 0 0 0 0 0 0
Higher-risk categories 0 0 0 0 0 0 0 0 0 0
Covered bonds 0 0 0 0 0 0 0 0 0 0
Exposures to institutions and corporates with a short-term
credit assesment 0 0 0 0 0 0 0 0 0 0
Exposures in the form of units or shares in collective
investment undertakings (CIU's) 0 0 0 0 0 0 0 0 0 0
Other assets 0 0 0 0 0 0 0 0 0 0
Total Counterparty Risk - SA portfolio (*) 0 0 399 0 28 1 1,377 0 3 1,809
(*) Counterparty Risk exposures included. Credit, Securisitation and Equity exposures not included.
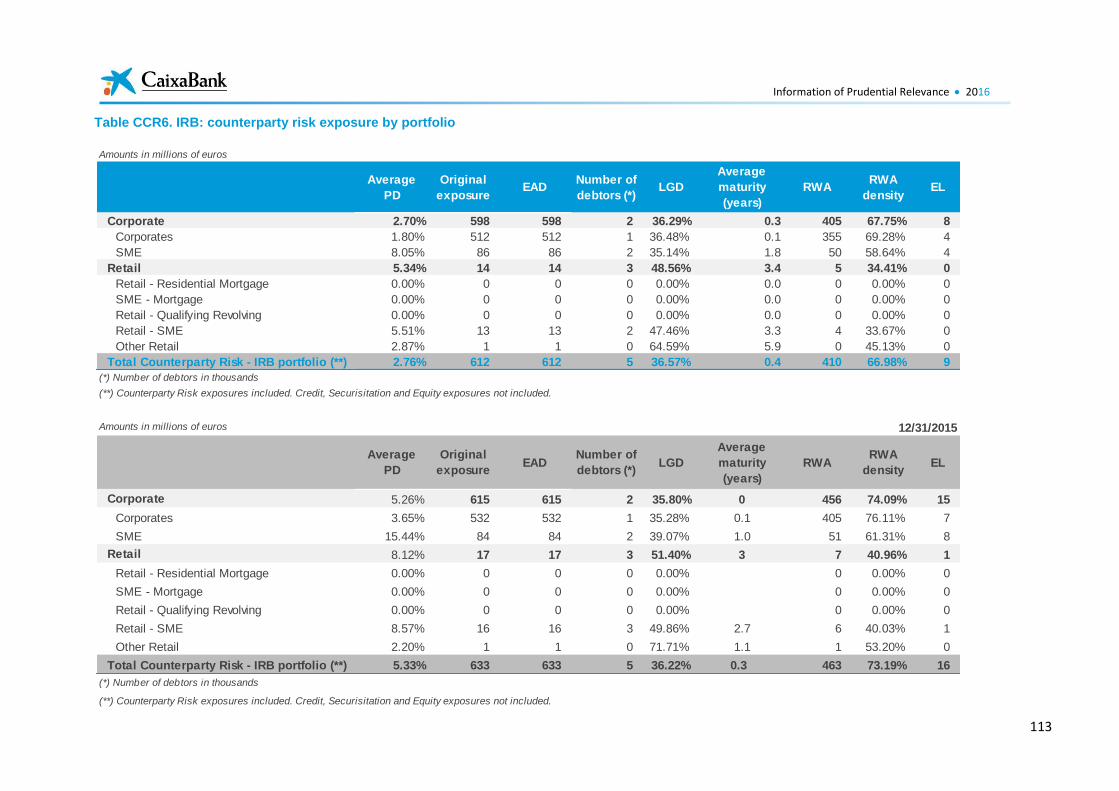
Information of Prudential Relevance 2016
113
Table CCR6. IRB: counterparty risk exposure by portfolio
Amounts in millions of euros
Corporate 2.70% 598 598 2 36.29% 0.3 405 67.75% 8
Corporates 1.80% 512 512 1 36.48% 0.1 355 69.28% 4
SME 8.05% 86 86 2 35.14% 1.8 50 58.64% 4
Retail 5.34% 14 14 3 48.56% 3.4 5 34.41% 0
Retail - Residential Mortgage 0.00% 0 0 0 0.00% 0.0 0 0.00% 0
SME - Mortgage 0.00% 0 0 0 0.00% 0.0 0 0.00% 0
Retail - Qualifying Revolving 0.00% 0 0 0 0.00% 0.0 0 0.00% 0
Retail - SME 5.51% 13 13 2 47.46% 3.3 4 33.67% 0
Other Retail 2.87% 1 1 0 64.59% 5.9 0 45.13% 0
Total Counterparty Risk - IRB portfolio (**) 2.76% 612 612 5 36.57% 0.4 410 66.98% 9
(*) Number of debtors in thousands
(**) Counterparty Risk exposures included. Credit, Securisitation and Equity exposures not included.
RWARWA
densityEL
Average
PD
Original
exposureEAD
Number of
debtors (*)LGD
Average
maturity
(years)
Amounts in millions of euros
Corporate 5.26% 615 615 2 35.80% 0 456 74.09% 15
Corporates 3.65% 532 532 1 35.28% 0.1 405 76.11% 7
SME 15.44% 84 84 2 39.07% 1.0 51 61.31% 8
Retail 8.12% 17 17 3 51.40% 3 7 40.96% 1
Retail - Residential Mortgage 0.00% 0 0 0 0.00% 0 0.00% 0
SME - Mortgage 0.00% 0 0 0 0.00% 0 0.00% 0
Retail - Qualifying Revolving 0.00% 0 0 0 0.00% 0 0.00% 0
Retail - SME 8.57% 16 16 3 49.86% 2.7 6 40.03% 1
Other Retail 2.20% 1 1 0 71.71% 1.1 1 53.20% 0
Total Counterparty Risk - IRB portfolio (**) 5.33% 633 633 5 36.22% 0.3 463 73.19% 16
(*) Number of debtors in thousands
(**) Counterparty Risk exposures included. Credit, Securisitation and Equity exposures not included.
12/31/2015
Average
PD
Original
exposureEAD
Number of
debtors (*)LGD
Average
maturity
(years)
RWARWA
densityEL
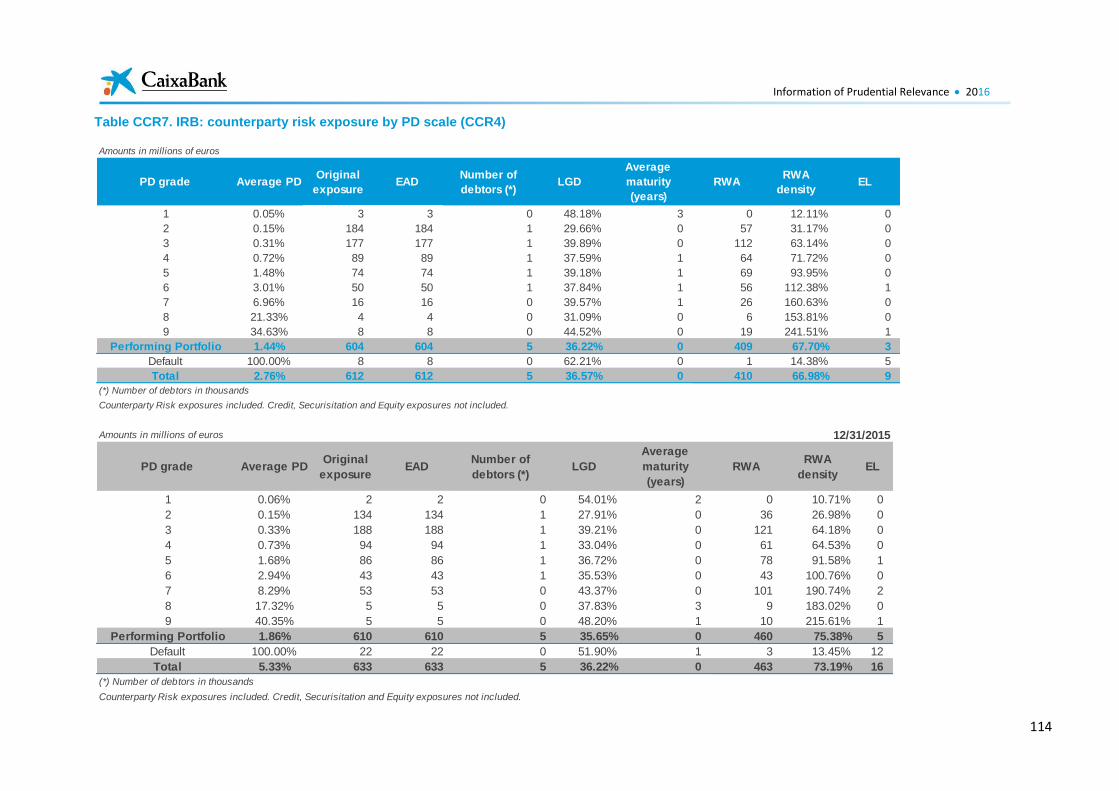
Information of Prudential Relevance 2016
114
Table CCR7. IRB: counterparty risk exposure by PD scale (CCR4)
Amounts in millions of euros
1 0.05% 3 3 0 48.18% 3 0 12.11% 0
2 0.15% 184 184 1 29.66% 0 57 31.17% 0
3 0.31% 177 177 1 39.89% 0 112 63.14% 0
4 0.72% 89 89 1 37.59% 1 64 71.72% 0
5 1.48% 74 74 1 39.18% 1 69 93.95% 0
6 3.01% 50 50 1 37.84% 1 56 112.38% 1
7 6.96% 16 16 0 39.57% 1 26 160.63% 0
8 21.33% 4 4 0 31.09% 0 6 153.81% 0
9 34.63% 8 8 0 44.52% 0 19 241.51% 1
Performing Portfolio 1.44% 604 604 5 36.22% 0 409 67.70% 3
Default 100.00% 8 8 0 62.21% 0 1 14.38% 5
Total 2.76% 612 612 5 36.57% 0 410 66.98% 9
(*) Number of debtors in thousands
Counterparty Risk exposures included. Credit, Securisitation and Equity exposures not included.
Average
maturity
(years)
RWARWA
densityELPD grade Average PD
Original
exposureEAD
Number of
debtors (*)LGD
Amounts in millions of euros
1 0.06% 2 2 0 54.01% 2 0 10.71% 0
2 0.15% 134 134 1 27.91% 0 36 26.98% 0
3 0.33% 188 188 1 39.21% 0 121 64.18% 0
4 0.73% 94 94 1 33.04% 0 61 64.53% 0
5 1.68% 86 86 1 36.72% 0 78 91.58% 1
6 2.94% 43 43 1 35.53% 0 43 100.76% 0
7 8.29% 53 53 0 43.37% 0 101 190.74% 2
8 17.32% 5 5 0 37.83% 3 9 183.02% 0
9 40.35% 5 5 0 48.20% 1 10 215.61% 1
Performing Portfolio 1.86% 610 610 5 35.65% 0 460 75.38% 5
Default 100.00% 22 22 0 51.90% 1 3 13.45% 12
Total 5.33% 633 633 5 36.22% 0 463 73.19% 16
(*) Number of debtors in thousands
Counterparty Risk exposures included. Credit, Securisitation and Equity exposures not included.
EL
12/31/2015
PD grade Average PDOriginal
exposureEAD
Number of
debtors (*)LGD
Average
maturity
(years)
RWARWA
density
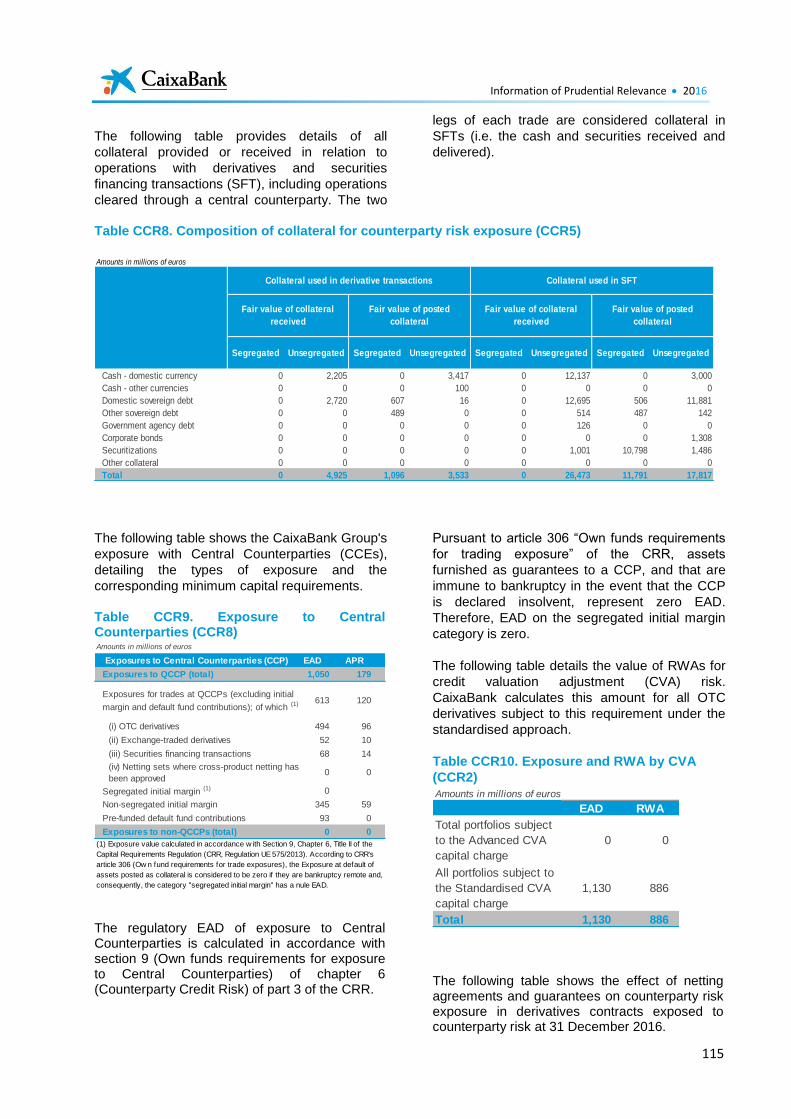
Information of Prudential Relevance 2016
115
The following table provides details of all
collateral provided or received in relation to
operations with derivatives and securities
financing transactions (SFT), including operations
cleared through a central counterparty. The two
legs of each trade are considered collateral in
SFTs (i.e. the cash and securities received and
delivered).
Table CCR8. Composition of collateral for counterparty risk exposure (CCR5)
The following table shows the CaixaBank Group's
exposure with Central Counterparties (CCEs),
detailing the types of exposure and the
corresponding minimum capital requirements.
Table CCR9. Exposure to Central Counterparties (CCR8)
The regulatory EAD of exposure to Central Counterparties is calculated in accordance with section 9 (Own funds requirements for exposure to Central Counterparties) of chapter 6 (Counterparty Credit Risk) of part 3 of the CRR.
Pursuant to article 306 “Own funds requirements
for trading exposure” of the CRR, assets
furnished as guarantees to a CCP, and that are
immune to bankruptcy in the event that the CCP
is declared insolvent, represent zero EAD.
Therefore, EAD on the segregated initial margin
category is zero.
The following table details the value of RWAs for
credit valuation adjustment (CVA) risk.
CaixaBank calculates this amount for all OTC
derivatives subject to this requirement under the
standardised approach.
Table CCR10. Exposure and RWA by CVA
(CCR2)
The following table shows the effect of netting agreements and guarantees on counterparty risk exposure in derivatives contracts exposed to counterparty risk at 31 December 2016.
Amounts in millions of euros
Segregated Unsegregated Segregated Unsegregated Segregated Unsegregated Segregated Unsegregated
Cash - domestic currency 0 2,205 0 3,417 0 12,137 0 3,000
Cash - other currencies 0 0 0 100 0 0 0 0
Domestic sovereign debt 0 2,720 607 16 0 12,695 506 11,881
Other sovereign debt 0 0 489 0 0 514 487 142
Government agency debt 0 0 0 0 0 126 0 0
Corporate bonds 0 0 0 0 0 0 0 1,308
Securitizations 0 0 0 0 0 1,001 10,798 1,486
Other collateral 0 0 0 0 0 0 0 0
Total 0 4,925 1,096 3,533 0 26,473 11,791 17,817
Collateral used in derivative transactions Collateral used in SFT
Fair value of collateral
received
Fair value of posted
collateral
Fair value of collateral
received
Fair value of posted
collateral
Amounts in millions of euros
Exposures to Central Counterparties (CCP) EAD APR
Exposures to QCCP (total) 1,050 179
Exposures for trades at QCCPs (excluding initial
margin and default fund contributions); of which (1) 613 120
(i) OTC derivatives 494 96
(ii) Exchange-traded derivatives 52 10
(iii) Securities financing transactions 68 14
(iv) Netting sets where cross-product netting has
been approved0 0
Segregated initial margin (1) 0
Non-segregated initial margin 345 59
Pre-funded default fund contributions 93 0
Exposures to non-QCCPs (total) 0 0
(1) Exposure value calculated in accordance w ith Section 9, Chapter 6, Title II of the
Capital Requirements Regulation (CRR, Regulation UE 575/2013). According to CRR's
article 306 (Ow n fund requirements for trade exposures), the Exposure at default of
assets posted as collateral is considered to be zero if they are bankruptcy remote and,
consequently, the category "segregated initial margin" has a nule EAD.
Amounts in millions of euros
EAD RWA
Total portfolios subject
to the Advanced CVA
capital charge
0 0
All portfolios subject to
the Standardised CVA
capital charge
1,130 886
Total 1,130 886
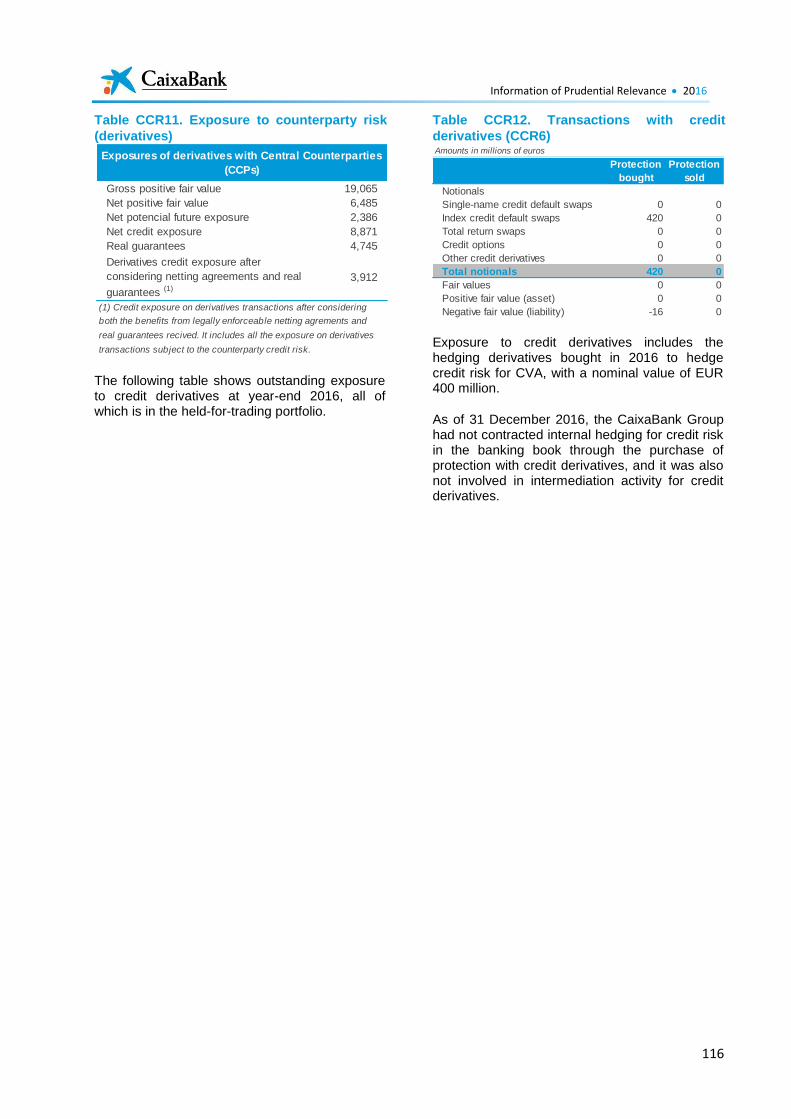
Information of Prudential Relevance 2016
116
Table CCR11. Exposure to counterparty risk
(derivatives)
The following table shows outstanding exposure to credit derivatives at year-end 2016, all of which is in the held-for-trading portfolio.
Table CCR12. Transactions with credit
derivatives (CCR6)
Exposure to credit derivatives includes the hedging derivatives bought in 2016 to hedge credit risk for CVA, with a nominal value of EUR 400 million.
As of 31 December 2016, the CaixaBank Group had not contracted internal hedging for credit risk in the banking book through the purchase of protection with credit derivatives, and it was also not involved in intermediation activity for credit derivatives.
Gross positive fair value 19,065
Net positive fair value 6,485
Net potencial future exposure 2,386
Net credit exposure 8,871
Real guarantees 4,745
Derivatives credit exposure after
considering netting agreements and real
guarantees (1)
3,912
(1) Credit exposure on derivatives transactions after considering
both the benefits from legally enforceable netting agrements and
real guarantees recived. It includes all the exposure on derivatives
transactions subject to the counterparty credit risk.
Exposures of derivatives with Central Counterparties
(CCPs)
Amounts in millions of euros
Protection
bought
Protection
sold
Notionals
Single-name credit default swaps 0 0
Index credit default swaps 420 0
Total return swaps 0 0
Credit options 0 0
Other credit derivatives 0 0
Total notionals 420 0
Fair values 0 0
Positive fair value (asset) 0 0
Negative fair value (liability) -16 0
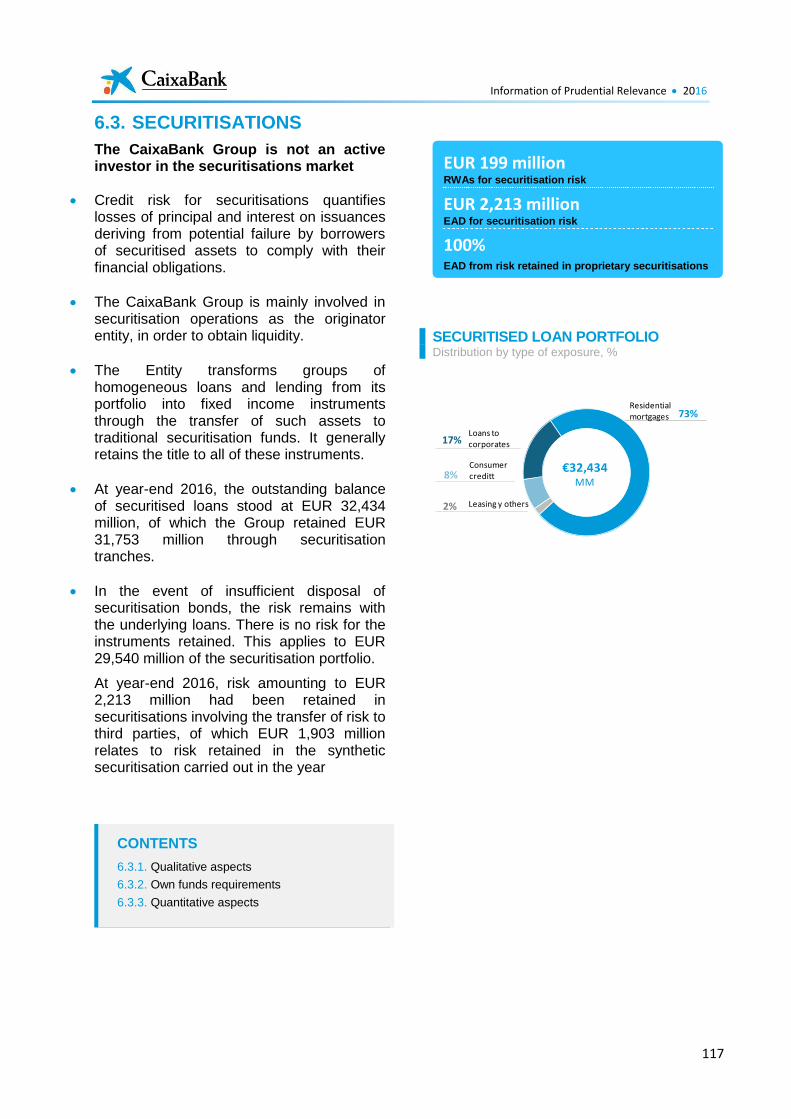
Information of Prudential Relevance 2016
117
6.3. SECURITISATIONS
The CaixaBank Group is not an active investor in the securitisations market
Credit risk for securitisations quantifies losses of principal and interest on issuances deriving from potential failure by borrowers of securitised assets to comply with their financial obligations.
The CaixaBank Group is mainly involved in securitisation operations as the originator entity, in order to obtain liquidity.
The Entity transforms groups of homogeneous loans and lending from its portfolio into fixed income instruments through the transfer of such assets to traditional securitisation funds. It generally retains the title to all of these instruments.
At year-end 2016, the outstanding balance of securitised loans stood at EUR 32,434 million, of which the Group retained EUR 31,753 million through securitisation tranches.
In the event of insufficient disposal of securitisation bonds, the risk remains with the underlying loans. There is no risk for the instruments retained. This applies to EUR 29,540 million of the securitisation portfolio.
At year-end 2016, risk amounting to EUR 2,213 million had been retained in securitisations involving the transfer of risk to third parties, of which EUR 1,903 million relates to risk retained in the synthetic securitisation carried out in the year
SECURITISED LOAN PORTFOLIO Distribution by type of exposure, %
2%
8%
17%
73%
Loans tocorporates
Consumer creditt
€32,434MM
Leasing y others
Residentialmortgages
EUR 199 million RWAs for securitisation risk
EUR 2,213 million EAD for securitisation risk
100%
EAD from risk retained in proprietary securitisations
CONTENTS
6.3.1. Qualitative aspects
6.3.2. Own funds requirements
6.3.3. Quantitative aspects
Information of Prudential Relevance 2016
118
6.3.1. Qualitative aspects
Description and general policy
The CaixaBank Group treats securitisation
operations as set forth in Chapter 5, Title II, Part
Three of the CRR.
A number of basic concepts helpful to
understanding this chapter are defined below in
accordance with CRR definitions:
Securitisation: means a transaction or
scheme, whereby the credit risk associated
with an exposure or pool of exposures is
tranched, having both of the following
characteristic:
payments in the transaction or scheme
are dependent upon the performance of
the exposure or pool of exposures;
the subordination of tranches determines
the distribution of losses during the
ongoing life of the transaction or scheme.
Securitisation position: means an exposure
to a securitisation.
Tranche: means a contractually established
segment of the credit risk associated with an
exposure or a number of exposures, where a
position in the segment entails a risk of credit
loss greater than or less than a position of the
same amount in each other such segment,
without taking account of credit protection
provided by third parties directly to the
holders of positions in the segment or in other
segments.
First loss tranche: means the most
subordinated tranche in a securitisation that
is the first tranche to bear losses incurred on
the securitised exposures and thereby
provides protection to second loss and,
where relevant, higher ranking tranches.
Mezzanine exposure tranche: a tranche,
other than a first-loss tranche, with lower
ranking for payment than the position with the
highest ranking for payment in the
securitisation, and lower ranking than any
securitisation position within the
securitisation, assigned a credit quality of 1
under the standardised approach, or a credit
quality of 1 or 2 under the IRB approach.
Senior tranche: any tranche other than first
loss and mezzanine exposure tranches.
Within the “senior tranches”, the ‘maximum
preference tranche' is that in first position in
the ranking for payment of the securitisation,
not considering amounts due under
derivatives contracts for interest or exchange
rates, brokerage fees or other charges.
Traditional securitisation: means a
securitisation involving the economic transfer
of the exposures being securitised. This shall
be accomplished by the transfer of ownership
of the securitised exposures from the
originator institution to an SSPE or through
sub-participation by an SSPE. The securities
issued do not represent payment obligations
of the originator institution.
Synthetic securitisation: means a
securitisation where the transfer of risk is
achieved by the use of credit derivatives or
guarantees, and the exposures being
securitised remain exposures of the originator
institution.
Resecuritisation: a securitisation in which
the risk associated with a group of underlying
exposures is divided into tranches, and at
least one of the underlying exposures is a
securitisation position.
Originator: an entity that:
a) itself or through related entities,
directly or indirectly, was involved in
the original agreement which created
the obligations or potential
obligations of the debtor or potential
debtor giving rise to the exposure
being securitised; or
b) purchases a third party's exposures
for its own account and then
securitises them.
Sponsor: means an institution other than an
originator institution that establishes and
manages an asset-backed commercial paper
programme or other securitisation scheme
that purchases exposures from third-party
entities.
The objectives of securitisation
Asset securitisation facilitates effective balance
sheet management, as it fosters:
Obtaining liquidity: securitisations mobilise
the balance sheet, transforming illiquid assets
and attracting finance in the wholesale
markets through their sale and use as
collateral. Retained securitisation positions
can be used as collateral to be discounted by
the ECB.
Information of Prudential Relevance 2016
119
Diversification of sources of funding:
another objective related to obtaining liquidity
is to diversity the Group's sources of finance,
in terms of both maturities and product types.
Management and diversification of credit
risk: the sale of securitised bonds to the
market can reduce exposure to the credit risk
that arises in the normal course of business
activity.
Optimisation of capital consumption:
securitisation operations that transfer a
significant part of their risk also enable
optimisation of capital management.
The nature of the risks inherent to securitisation activity
Securitisations offer a number of advantages for
liquidity and risk management. However,
securitisations also entail risks, which are
basically assumed by the originator entity and/or
the investor entities.
Credit risk: the risk that the borrower will fail
to meet their contractual obligations in due
time or form, resulting in impairment to the
asset underlying the securitisation positions
originated. This is the main risk transferred to
investors through the instruments issued in
the securitisation.
Pre-payment risk: the risk of early
redemption, in part or in full, of the underlying
assets for the securitisation, meaning that the
actual maturity of the securitisation positions
will be shorter than the contractual maturity of
the underlying assets.
Basis risk: risk of the interest rates or
maturities of securitised assets not matching
those of the securitisation positions. This risk
is usually covered through interest rate
swaps.
Liquidity risk: there are a number of ways of
understanding this risk. From the point of view
of the originator, this is reduced by the
securitisation process, which transforms
assets that are intrinsically illiquid into
instruments that can be traded on financial
markets. From the investor's perspective,
there is no guarantee that there will be
sufficient trading volumes or frequency for the
bonds in the market to enable it to unwind its
position at a particular time.
Risk in the ranking of securitisation positions
Securitisation bonds are issued with a defined payment ranking for the underlying securitisation positions. The funds in which the CaixaBank Group is involved are usually structured into a number of tranches, each of which has their own credit rating.
The first set of tranches is described as “senior”. This comprises the bonds with the highest credit quality and, therefore, the highest credit rating. These are followed by mezzanine tranches, which are subordinate to the senior tranches. At the base of the structure we find the tranches with the lowest credit quality, which are known as “first loss” or equity tranches: in some cases, these are subordinated loans that the CaixaBank Group has granted to the fund, whilst in others they are a series of bonds. The first loss tranches meet the first percentage of losses on the securitised portfolio.
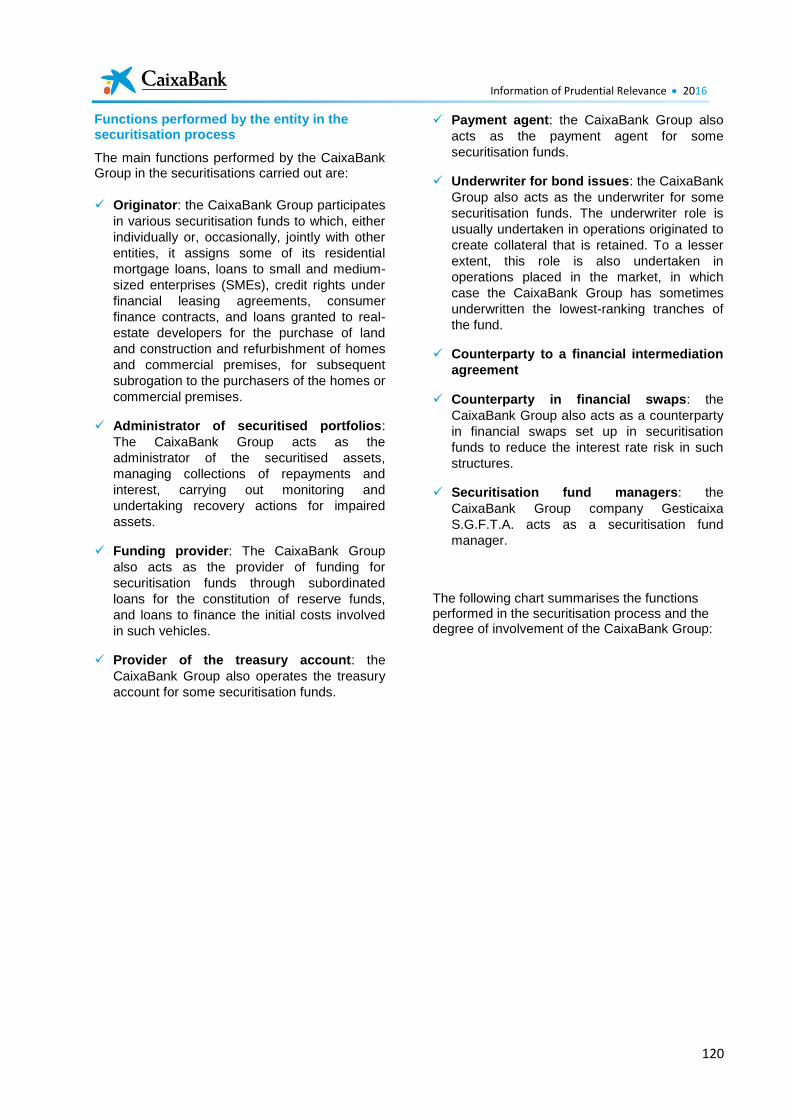
Information of Prudential Relevance 2016
120
Functions performed by the entity in the securitisation process
The main functions performed by the CaixaBank Group in the securitisations carried out are:
Originator: the CaixaBank Group participates
in various securitisation funds to which, either
individually or, occasionally, jointly with other
entities, it assigns some of its residential
mortgage loans, loans to small and medium-
sized enterprises (SMEs), credit rights under
financial leasing agreements, consumer
finance contracts, and loans granted to real-
estate developers for the purchase of land
and construction and refurbishment of homes
and commercial premises, for subsequent
subrogation to the purchasers of the homes or
commercial premises.
Administrator of securitised portfolios:
The CaixaBank Group acts as the
administrator of the securitised assets,
managing collections of repayments and
interest, carrying out monitoring and
undertaking recovery actions for impaired
assets.
Funding provider: The CaixaBank Group
also acts as the provider of funding for
securitisation funds through subordinated
loans for the constitution of reserve funds,
and loans to finance the initial costs involved
in such vehicles.
Provider of the treasury account: the
CaixaBank Group also operates the treasury
account for some securitisation funds.
Payment agent: the CaixaBank Group also
acts as the payment agent for some
securitisation funds.
Underwriter for bond issues: the CaixaBank
Group also acts as the underwriter for some
securitisation funds. The underwriter role is
usually undertaken in operations originated to
create collateral that is retained. To a lesser
extent, this role is also undertaken in
operations placed in the market, in which
case the CaixaBank Group has sometimes
underwritten the lowest-ranking tranches of
the fund.
Counterparty to a financial intermediation
agreement
Counterparty in financial swaps: the
CaixaBank Group also acts as a counterparty
in financial swaps set up in securitisation
funds to reduce the interest rate risk in such
structures.
Securitisation fund managers: the
CaixaBank Group company Gesticaixa
S.G.F.T.A. acts as a securitisation fund
manager.
The following chart summarises the functions performed in the securitisation process and the degree of involvement of the CaixaBank Group:
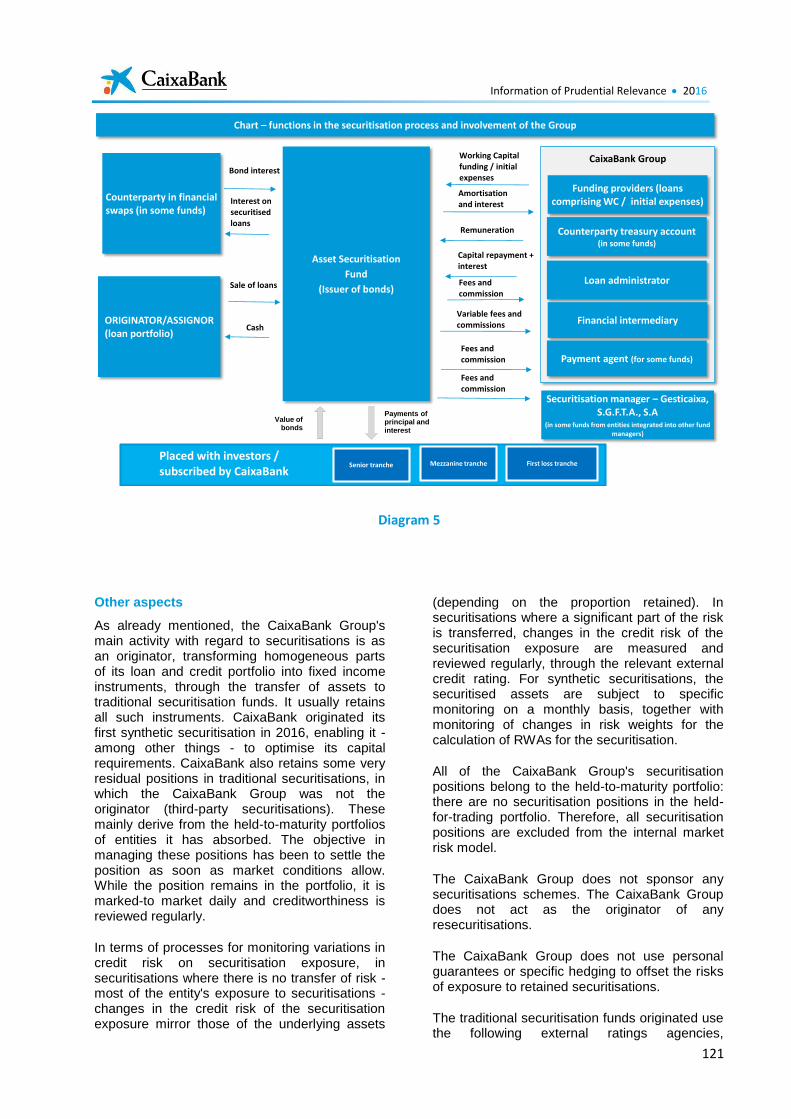
Information of Prudential Relevance 2016
121
Diagram 5
Other aspects
As already mentioned, the CaixaBank Group's main activity with regard to securitisations is as an originator, transforming homogeneous parts of its loan and credit portfolio into fixed income instruments, through the transfer of assets to traditional securitisation funds. It usually retains all such instruments. CaixaBank originated its first synthetic securitisation in 2016, enabling it - among other things - to optimise its capital requirements. CaixaBank also retains some very residual positions in traditional securitisations, in which the CaixaBank Group was not the originator (third-party securitisations). These mainly derive from the held-to-maturity portfolios of entities it has absorbed. The objective in managing these positions has been to settle the position as soon as market conditions allow. While the position remains in the portfolio, it is marked-to market daily and creditworthiness is reviewed regularly.
In terms of processes for monitoring variations in credit risk on securitisation exposure, in securitisations where there is no transfer of risk - most of the entity's exposure to securitisations - changes in the credit risk of the securitisation exposure mirror those of the underlying assets
(depending on the proportion retained). In securitisations where a significant part of the risk is transferred, changes in the credit risk of the securitisation exposure are measured and reviewed regularly, through the relevant external credit rating. For synthetic securitisations, the securitised assets are subject to specific monitoring on a monthly basis, together with monitoring of changes in risk weights for the calculation of RWAs for the securitisation.
All of the CaixaBank Group's securitisation positions belong to the held-to-maturity portfolio: there are no securitisation positions in the held-for-trading portfolio. Therefore, all securitisation positions are excluded from the internal market risk model.
The CaixaBank Group does not sponsor any securitisations schemes. The CaixaBank Group does not act as the originator of any resecuritisations.
The CaixaBank Group does not use personal guarantees or specific hedging to offset the risks of exposure to retained securitisations.
The traditional securitisation funds originated use the following external ratings agencies,
CaixaBank Group
Chart – functions in the securitisation process and involvement of the Group
Loan administrator
Asset Securitisation
Fund
(Issuer of bonds)
ORIGINATOR/ASSIGNOR(loan portfolio)
Sale of loans
Cash
Fees and commission
Placed with investors / subscribed by CaixaBank
Senior tranche Mezzanine tranche First loss tranche
Value of bonds
Payments of principal and interest
Securitisation manager – Gesticaixa, S.G.F.T.A., S.A
(in some funds from entities integrated into other fund managers)
Financial intermediary
Fees and commission
Capital repayment + interest
Variable fees and commissions
Payment agent (for some funds)Fees and commission
Counterparty treasury account (in some funds)
Funding providers (loans comprising WC / initial expenses)
Remuneration
Amortisation and interest
Working Capital funding / initial expenses
Counterparty in financial swaps (in some funds)
Bond interest
Interest on securitised loans
Information of Prudential Relevance 2016
122
irrespective of the underlying assets securitised: Standard & Poor's, DBRS, Moody's, Fitch and SCOPE. No external rating has been requested for the synthetic securitisation.
The CaixaBank Group had no assets pending securitisation at 31 December 2016.
Securitisation activity in 2016
CaixaBank originated three traditional securitisation funds in 2016. These are managed by GestiCaixa, with CaixaBank retaining all of the instruments issued in all of these cases. It also originated one synthetic securitisation. Details were as follows:
CAIXABANK RMBS 1, F.T. (February 2016):
A traditional securitisation of residential
mortgages, with an initial securitised value of
EUR 14,415 million.
GAUDI SYNTHETIC 2015-I (February 2016):
A synthetic securitisation involving loans to
SMEs with an initial value of EUR 2,025
million, instrumentalised through a protection
CDS purchased on a mezzanine loss tranche.
CAIXABANK CONSUMO 2, F.T. (June
2016): A traditional securitisation of consumer
loans, with an initial securitised value of EUR
1,390 million.
CAIXABANK PYMES 8, F.T. (November
2016): A traditional securitisation of SME
loans, with an initial securitised value of EUR
2,428 million.
Risk management. Measurement and information systems
Accounting policies
Pursuant to accounting regulations, all or part of
a financial asset is derecognised when the
contractual rights to the cash flows from the
financial asset expire or when the entity transfers
the asset to a third party outside the entity.
The accounting treatment of transfers of financial
assets depends on the extent to which the risks
and rewards associated with ownership of the
transferred assets are transferred to third parties.
In this regard:
If substantially all the risks and rewards of
ownership of the transferred asset are
transferred (such as asset securitisations in
which the transferor does not retain any
subordinated loans and does not provide any
type of credit enhancement to the new
owners), it is derecognised, and any rights or
obligations retained or arising as a result of
the transfer are simultaneously recognised.
If the Group retains substantially all the rights
and rewards associated with the transferred
financial asset, the transferred financial asset
is not derecognised and continues to be
recognised, measured using the same criteria
as used before the transfer.
1. A financial liability equal to the
consideration received, which is
subsequently measured at amortised
cost, unless it meets the requirements
to be classified under other liabilities at
fair value through profit or loss; and
2. The income generated on the
transferred (but not derecognised)
financial asset and the expenses of
the new financial liability, without
offset.
If substantially all the risks and rewards of
ownership of the transferred financial asset
are neither transferred nor retained (such as
in the case of securitisations in which the
transferor assumes a subordinated loan or
other type of credit enhancement for part of
the transferred asset), the following distinction
is made:
1. If the transferor does not retain control
over the financial asset transferred it is
derecognised and any right or
obligation retained or arising from the
transfer is recognised; or
Information of Prudential Relevance 2016
123
2. If the transferor retains control over the
financial asset transferred it continues
to recognise the asset for an amount
equal to its exposure to changes in
value of the asset, recognising a
liability associated with the financial
asset transferred. The net amount of
the transferred asset and the
associated liability shall be the
amortised cost of the rights and
obligations retained, if the asset is
measured at amortised cost, or at fair
value of the rights and obligations
retained, if the transferred asset is
measured at fair value.
According to the terms of the transfer
agreements in place, virtually the entire portfolio
of loans and receivables securitised by the
CaixaBank Group does not need to be written off
the balance sheet.
The assets securitised through securitisation
funds prior to 2004, in accordance with the
prospective application mentioned in paragraph
106 of IAS 39, which entered into force with the
application of the International Accounting
Standards, and in accordance with Transitional
Provision One of Circular 4/2004, were not
recognised on the balance sheet.
Securitisation funds set up before 1 January
2004 relate to the securitisation funds of investee
Unión de Crédito para la Financiación
Inmobiliaria (Credifimo), acquired in the business
combination with Banca Cívica. These funds
were derecognised when they were opened, all
prior to the business combination with Banca
Cívica, and this did not have any impact on profit
or loss. In accordance with regulations, the
securitised loans were derecognised when the
bonds were issued, given that circumstances
arose that substantially allowed all risks and
rewards relating to the underlying securitised
financial asset to be transferred. All bonds issued
by these securitisation funds were transferred to
third parties, and the bondholder bore the
majority of the losses arising from the securitised
loans that were derecognised.
6.3.2. Minimum own funds requirements for securitisation risk
Pursuant to Chapter 5 of Title II of Part Three of
the CRR, for funds that do not comply with the
provisions of Articles 243 and 244 of the CRR, for
considering whether a significant part of the risk
has been transferred, the method used to
calculate capital requirements for securitisation
transactions is the same as that applied to assets
that have not been securitised. In funds that
comply with the provisions of Articles 243 and
244 of the CRR relating to the transfer of risk, the
standardised or IRB approaches are used to
calculate minimum own fund requirements for
securitisations, depending on the method that
would be applied to the underlying portfolio for
the issue if it were not securitised.
The following table provides details of exposure
to securitisations and their capital requirements in
cases where the CaixaBank Group acts as the
originator. This table only includes securitisations
in which the transfer of a significant part of the
risk is recognised, and includes investor tranches
of multi-seller securitisations where the
CaixaBank Group acts as the originator, and for
which the calculation of capital requirements is
independent of whether the risk on the originator
tranches has been transferred.
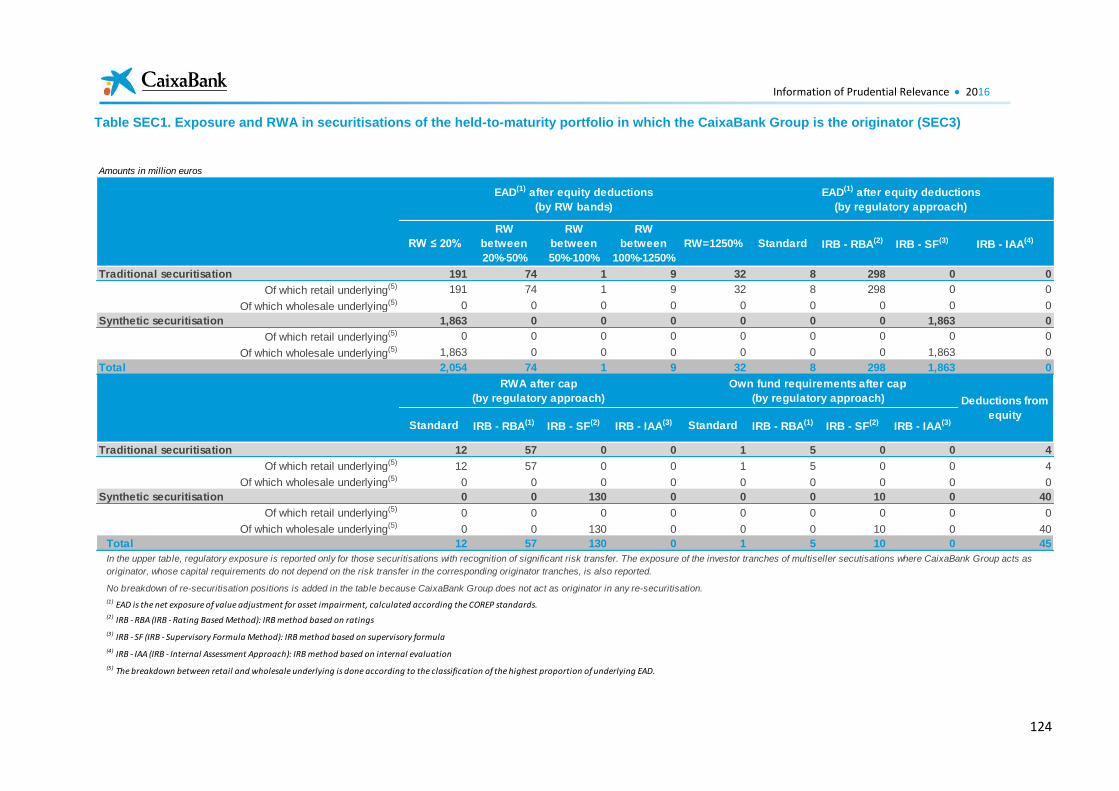
Information of Prudential Relevance 2016
124
Table SEC1. Exposure and RWA in securitisations of the held-to-maturity portfolio in which the CaixaBank Group is the originator (SEC3)
Amounts in million euros
RW ≤ 20%
RW
between
20%-50%
RW
between
50%-100%
RW
between
100%-1250%
RW=1250% Standard IRB - RBA(2) IRB - SF(3) IRB - IAA(4)
Traditional securitisation 191 74 1 9 32 8 298 0 0
Of which retail underlying(5) 191 74 1 9 32 8 298 0 0
Of which wholesale underlying(5) 0 0 0 0 0 0 0 0 0
Synthetic securitisation 1,863 0 0 0 0 0 0 1,863 0
Of which retail underlying(5) 0 0 0 0 0 0 0 0 0
Of which wholesale underlying(5) 1,863 0 0 0 0 0 0 1,863 0
Total 2,054 74 1 9 32 8 298 1,863 0
Standard IRB - RBA(1) IRB - SF(2) IRB - IAA(3) Standard IRB - RBA(1) IRB - SF(2) IRB - IAA(3)
Traditional securitisation 12 57 0 0 1 5 0 0 4
Of which retail underlying(5) 12 57 0 0 1 5 0 0 4
Of which wholesale underlying(5) 0 0 0 0 0 0 0 0 0
Synthetic securitisation 0 0 130 0 0 0 10 0 40
Of which retail underlying(5) 0 0 0 0 0 0 0 0 0
Of which wholesale underlying(5) 0 0 130 0 0 0 10 0 40
Total 12 57 130 0 1 5 10 0 45
EAD(1) after equity deductions
(by RW bands)
EAD(1) after equity deductions
(by regulatory approach)
(4) IRB - IAA (IRB - Internal Assessment Approach): IRB method based on internal evaluation
RWA after cap
(by regulatory approach)
Own fund requirements after cap
(by regulatory approach) Deductions from
equity
In the upper table, regulatory exposure is reported only for those securitisations with recognition of significant risk transfer. The exposure of the investor tranches of multiseller secutisations where CaixaBank Group acts as
originator, whose capital requirements do not depend on the risk transfer in the corresponding originator tranches, is also reported.
No breakdown of re-securitisation positions is added in the table because CaixaBank Group does not act as originator in any re-securitisation.
(1) EAD is the net exposure of value adjustment for asset impairment, calculated according the COREP standards.(2) IRB - RBA (IRB - Rating Based Method): IRB method based on ratings
(3) IRB - SF (IRB - Supervisory Formula Method): IRB method based on supervisory formula
(5) The breakdown between retail and wholesale underlying is done according to the classification of the highest proportion of underlying EAD.
Information of Prudential Relevance 2016
125
As can be seen from the table, at year-end 2016
the CaixaBank Group applied the IRB-RBA (IRB-
Ratings Based Approach) approach in most of its
traditional securitisation exposure, whilst it
applied the IRB SF (IRB - Supervisory Formula)
approach to the synthetic securitisation. The
CaixaBank Group does not apply the IRB -IAA
(IRB - Internal Assessment Approach) approach
in any cases. The table also shows that most of
the securitisation exposure subject to capital
requirements receives the lowest level of risk
weighting (less than 20%).
The CaixaBank Group uses four external rating
agencies considered acceptable by the regulator
- Moody's, S&P, Fitch and DBRS - in the
calculation methods for the capital requirements
of securitisations mentioned above that require
external credit ratings.
The most significant change in regulatory
exposure and capital requirements compared to
year-end 2015 was due to the new “Gaudi
Synthetic 2015” synthetic securitisation
(originated in February 2016), with regulatory
exposure following deductions of EUR 1,863
million. This securitisation involved an increase in
capital requirements through the securitisation of
EUR 10.4 million and capital deductions of EUR
40.5 million. Taken overall, and considering the
capital charge for the securitised assets, this
operation resulted in a significant release of risk-
weighted assets for the entity.
The securitisations in which the CaixaBank Group acts as an investor are not shown in an additional table (SEC4) as they are very residual and insignificant in size. These securitisations involved regulatory exposure of EUR 0.025 million at December 2016. The standardised approach is used in calculating capital requirements for all such securitisations, which amount to EUR 0.001 million (applying risk weights between 20%-50%).
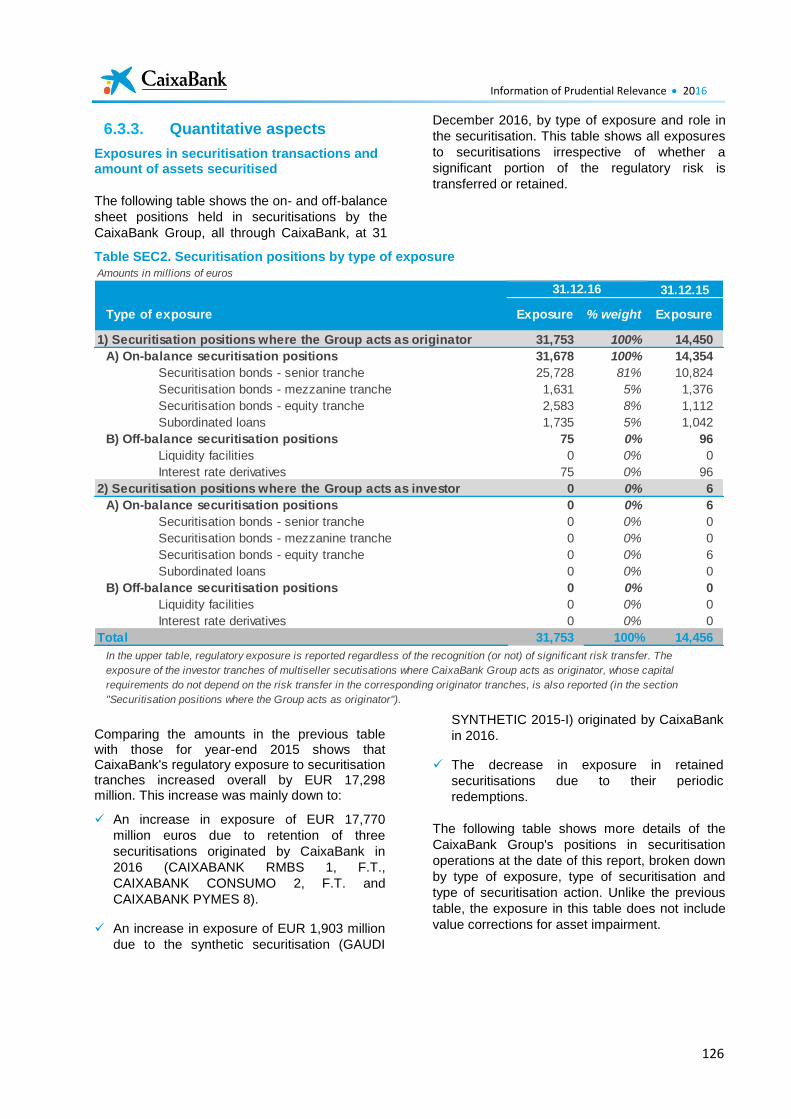
Information of Prudential Relevance 2016
126
6.3.3. Quantitative aspects
Exposures in securitisation transactions and amount of assets securitised
The following table shows the on- and off-balance
sheet positions held in securitisations by the
CaixaBank Group, all through CaixaBank, at 31
December 2016, by type of exposure and role in
the securitisation. This table shows all exposures
to securitisations irrespective of whether a
significant portion of the regulatory risk is
transferred or retained.
Table SEC2. Securitisation positions by type of exposure
Comparing the amounts in the previous table with those for year-end 2015 shows that CaixaBank's regulatory exposure to securitisation tranches increased overall by EUR 17,298 million. This increase was mainly down to:
An increase in exposure of EUR 17,770
million euros due to retention of three
securitisations originated by CaixaBank in
2016 (CAIXABANK RMBS 1, F.T.,
CAIXABANK CONSUMO 2, F.T. and
CAIXABANK PYMES 8).
An increase in exposure of EUR 1,903 million
due to the synthetic securitisation (GAUDI
SYNTHETIC 2015-I) originated by CaixaBank
in 2016.
The decrease in exposure in retained
securitisations due to their periodic
redemptions.
The following table shows more details of the
CaixaBank Group's positions in securitisation
operations at the date of this report, broken down
by type of exposure, type of securitisation and
type of securitisation action. Unlike the previous
table, the exposure in this table does not include
value corrections for asset impairment.
Amounts in millions of euros
31.12.15
Type of exposure Exposure % weight Exposure
1) Securitisation positions where the Group acts as originator 31,753 100% 14,450
A) On-balance securitisation positions 31,678 100% 14,354
Securitisation bonds - senior tranche 25,728 81% 10,824
Securitisation bonds - mezzanine tranche 1,631 5% 1,376
Securitisation bonds - equity tranche 2,583 8% 1,112
Subordinated loans 1,735 5% 1,042
B) Off-balance securitisation positions 75 0% 96
Liquidity facilities 0 0% 0
Interest rate derivatives 75 0% 96
2) Securitisation positions where the Group acts as investor 0 0% 6
A) On-balance securitisation positions 0 0% 6
Securitisation bonds - senior tranche 0 0% 0
Securitisation bonds - mezzanine tranche 0 0% 0
Securitisation bonds - equity tranche 0 0% 6
Subordinated loans 0 0% 0
B) Off-balance securitisation positions 0 0% 0
Liquidity facilities 0 0% 0
Interest rate derivatives 0 0% 0
Total 31,753 100% 14,456
31.12.16
In the upper table, regulatory exposure is reported regardless of the recognition (or not) of significant risk transfer. The
exposure of the investor tranches of multiseller secutisations where CaixaBank Group acts as originator, whose capital
requirements do not depend on the risk transfer in the corresponding originator tranches, is also reported (in the section
"Securitisation positions where the Group acts as originator").
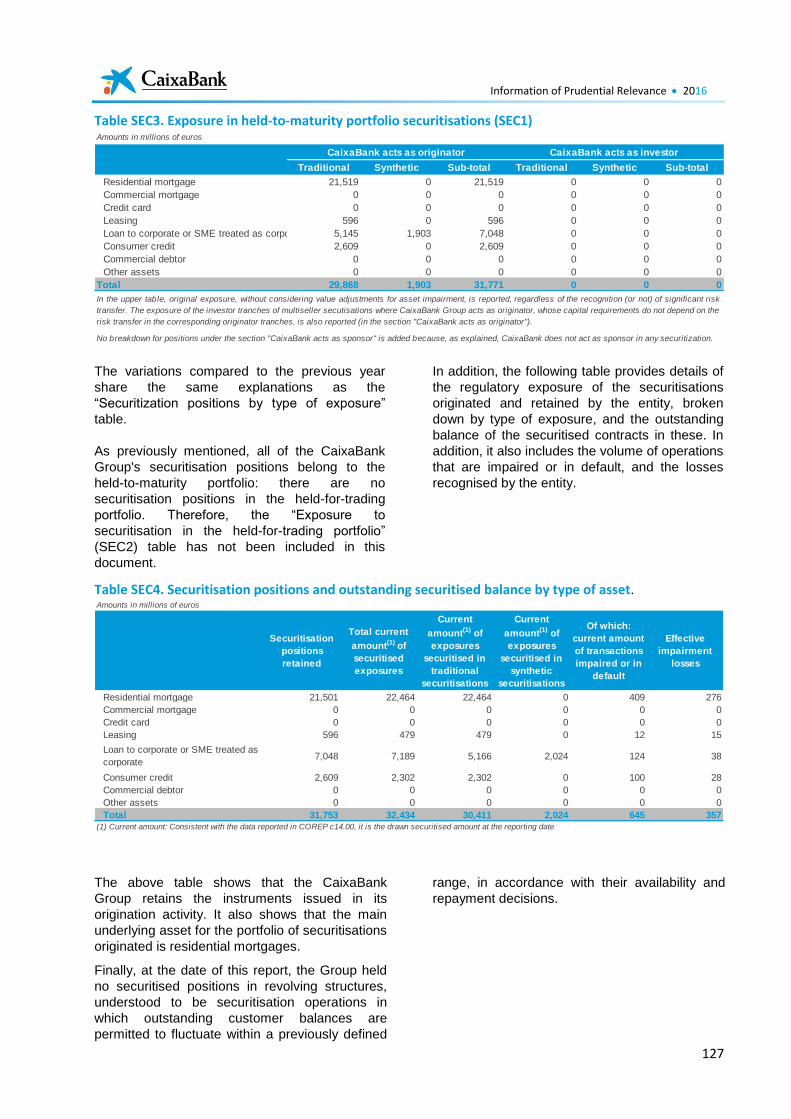
Information of Prudential Relevance 2016
127
Table SEC3. Exposure in held-to-maturity portfolio securitisations (SEC1)
The variations compared to the previous year
share the same explanations as the
“Securitization positions by type of exposure”
table.
As previously mentioned, all of the CaixaBank
Group's securitisation positions belong to the
held-to-maturity portfolio: there are no
securitisation positions in the held-for-trading
portfolio. Therefore, the “Exposure to
securitisation in the held-for-trading portfolio”
(SEC2) table has not been included in this
document.
In addition, the following table provides details of
the regulatory exposure of the securitisations
originated and retained by the entity, broken
down by type of exposure, and the outstanding
balance of the securitised contracts in these. In
addition, it also includes the volume of operations
that are impaired or in default, and the losses
recognised by the entity.
Table SEC4. Securitisation positions and outstanding securitised balance by type of asset.
The above table shows that the CaixaBank
Group retains the instruments issued in its
origination activity. It also shows that the main
underlying asset for the portfolio of securitisations
originated is residential mortgages.
Finally, at the date of this report, the Group held
no securitised positions in revolving structures,
understood to be securitisation operations in
which outstanding customer balances are
permitted to fluctuate within a previously defined
range, in accordance with their availability and
repayment decisions.
Amounts in millions of euros
Traditional Synthetic Sub-total Traditional Synthetic Sub-total
Residential mortgage 21,519 0 21,519 0 0 0
Commercial mortgage 0 0 0 0 0 0
Credit card 0 0 0 0 0 0
Leasing 596 0 596 0 0 0
Loan to corporate or SME treated as corporate 5,145 1,903 7,048 0 0 0
Consumer credit 2,609 0 2,609 0 0 0
Commercial debtor 0 0 0 0 0 0
Other assets 0 0 0 0 0 0
Total 29,868 1,903 31,771 0 0 0
No breakdown for positions under the section "CaixaBank acts as sponsor" is added because, as explained, CaixaBank does not act as sponsor in any securitization.
CaixaBank acts as originator CaixaBank acts as investor
In the upper table, original exposure, without considering value adjustments for asset impairment, is reported, regardless of the recognition (or not) of significant risk
transfer. The exposure of the investor tranches of multiseller secutisations where CaixaBank Group acts as originator, whose capital requirements do not depend on the
risk transfer in the corresponding originator tranches, is also reported (in the section "CaixaBank acts as originator").
Amounts in millions of euros
Securitisation
positions
retained
Total current
amount(1) of
securitised
exposures
Current
amount(1) of
exposures
securitised in
traditional
securitisations
Current
amount(1) of
exposures
securitised in
synthetic
securitisations
Of which:
current amount
of transactions
impaired or in
default
Effective
impairment
losses
Residential mortgage 21,501 22,464 22,464 0 409 276
Commercial mortgage 0 0 0 0 0 0
Credit card 0 0 0 0 0 0
Leasing 596 479 479 0 12 15
Loan to corporate or SME treated as
corporate7,048 7,189 5,166 2,024 124 38
Consumer credit 2,609 2,302 2,302 0 100 28
Commercial debtor 0 0 0 0 0 0
Other assets 0 0 0 0 0 0
Total 31,753 32,434 30,411 2,024 645 357(1) Current amount: Consistent with the data reported in COREP c14.00, it is the drawn securitised amount at the reporting date
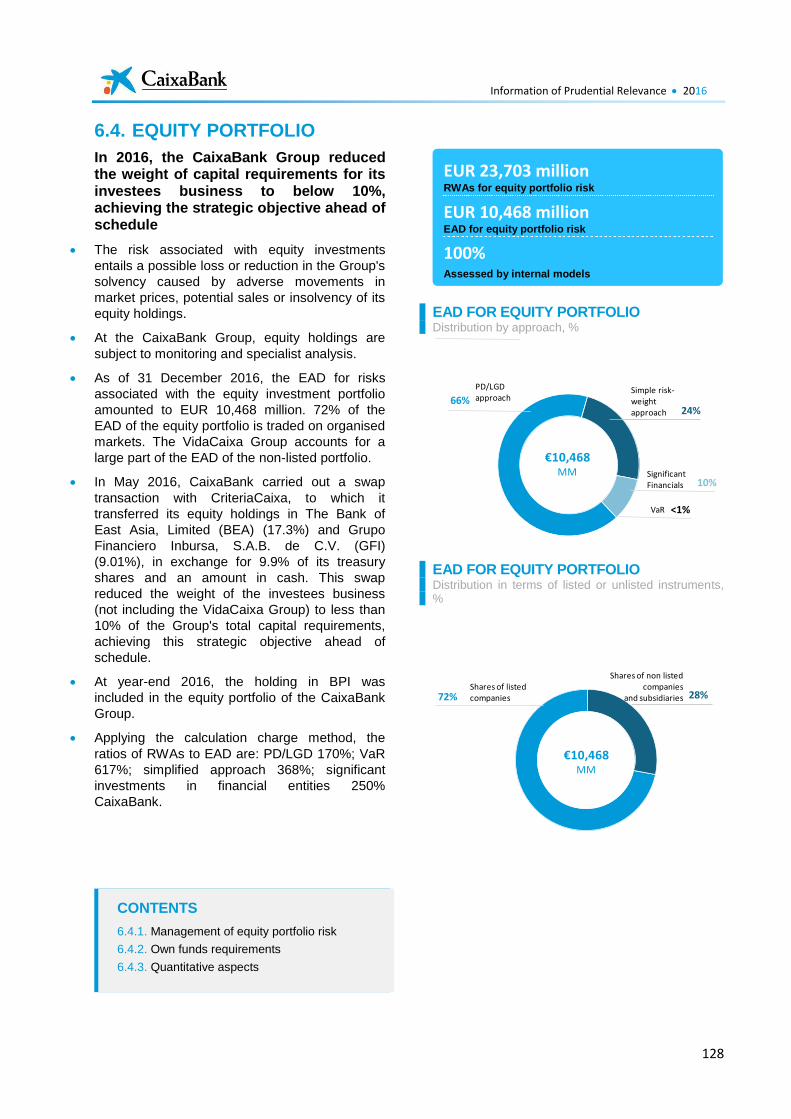
Information of Prudential Relevance 2016
128
6.4. EQUITY PORTFOLIO
In 2016, the CaixaBank Group reduced the weight of capital requirements for its investees business to below 10%, achieving the strategic objective ahead of schedule
The risk associated with equity investments
entails a possible loss or reduction in the Group's
solvency caused by adverse movements in
market prices, potential sales or insolvency of its
equity holdings.
At the CaixaBank Group, equity holdings are
subject to monitoring and specialist analysis.
As of 31 December 2016, the EAD for risks
associated with the equity investment portfolio
amounted to EUR 10,468 million. 72% of the
EAD of the equity portfolio is traded on organised
markets. The VidaCaixa Group accounts for a
large part of the EAD of the non-listed portfolio.
In May 2016, CaixaBank carried out a swap
transaction with CriteriaCaixa, to which it
transferred its equity holdings in The Bank of
East Asia, Limited (BEA) (17.3%) and Grupo
Financiero Inbursa, S.A.B. de C.V. (GFI)
(9.01%), in exchange for 9.9% of its treasury
shares and an amount in cash. This swap
reduced the weight of the investees business
(not including the VidaCaixa Group) to less than
10% of the Group's total capital requirements,
achieving this strategic objective ahead of
schedule.
At year-end 2016, the holding in BPI was
included in the equity portfolio of the CaixaBank
Group.
Applying the calculation charge method, the
ratios of RWAs to EAD are: PD/LGD 170%; VaR
617%; simplified approach 368%; significant
investments in financial entities 250%
CaixaBank.
EAD FOR EQUITY PORTFOLIO Distribution by approach, %
EAD FOR EQUITY PORTFOLIO Distribution in terms of listed or unlisted instruments, %
66%24%
10%
<1%
PD/LGDapproach
€10,468MM Significant
Financials
Simple risk-weight approach
VaR
72% 28%Shares of listedcompanies
€10,468MM
Shares of non listedcompanies
and subsidiaries
EUR 23,703 million RWAs for equity portfolio risk
EUR 10,468 million EAD for equity portfolio risk
100%
Assessed by internal models
CONTENTS
6.4.1. Management of equity portfolio risk
6.4.2. Own funds requirements
6.4.3. Quantitative aspects
Information of Prudential Relevance 2016
129
6.4.1. Management of equity portfolio risk
Definition and general policy
The risk associated with equity investments
entails the possible loss or reduction in the
Group's solvency through equity instruments
caused by adverse movements in market prices,
potential sales or investee insolvency.
The equity portfolio includes strategic
investments, with a medium-long term horizon
which the CaixaBank Group manages actively, as
well as stakes in subsidiaries which serve a
specific or complementary financial purpose.
In line with the active management of equity
investments, there are investment agreements
with core shareholders of international banks in
which CaixaBank holds stakes, as well as
strategic agreements with the respective banks,
to undertake joint venture opportunities,
cooperate on customer service in the respective
regions of influence and analyse cost and
knowledge synergies. The purpose of this is to
create shareholder value (not replicable through
capital markets) and move forward with
CaixaBank's international expansion, tapping
emerging business opportunities and adopting
the best practices of other markets.
Structure and organisation of the risk management function
At the CaixaBank Group, equity investments are
subject to monitoring and specialist analysis. This
monitoring and analysis is carried out at a deeper
level in the case of permanent investments
and/or those involving a more material amount
and impact on capital.
The Group's organisational structure has various
levels and types of control:
Representation on the governing bodies of
investees: depending on the percentage
stake and the strategic alliance with the
majority shareholder (when the majority
shareholder is not the CaixaBank Group),
members of the Board of Directors or Senior
Management are appointed to serve as
members of the investees' boards of
directors. On occasion, this also includes
board committees, such as the Risks or Audit
Committees.
This allows these directors to remain abreast
of, participate in, and influence the most
important decisions of these companies,
contributing their individual experience with
and their knowledge of the financial sector.
Controlling and financial analysis, through
specialists responsible exclusively for
monitoring changes in economic and financial
data and for understanding and issuing alerts
in the event of changes in regulations and
fluctuations in competition in the countries
and sectors in which the investees operate.
The International Banking area (responsible
for banking stakes), the Financial area (for
industrial stakes) and the Holding Companies
Control area (for subsidiaries) gather and
share information on these stakes.
In general, with the most significant
shareholdings, both the estimates of and
actual data on investees’ contributions to
income and shareholders’ equity (where
applicable) are updated regularly. In these
processes, the outlook for securities markets
and analysts’ views (e.g. recommendations,
target prices, ratings) are shared with Senior
Management for regular comparison with the
market.
These financial analysts also liaise with listed
investees’ investor relations departments and
gather information, including reports from third
parties (e.g. investment banks, rating
agencies), as necessary for an overview of
possible risks to the value of the
shareholdings.
The conclusions on the accounting profit and
loss and the most relevant alerts of changes
in the contributions of equity investments are
submitted to the Management Committee and
shared with CaixaBank's governing bodies,
generally each quarter.
Accounting recognition: the Financial
Accounting area ensures that all information
meets the relevant quality requirements, is
submitted by the required deadlines to the
Entity's IT systems, and that the subsequent
external reporting is carried out. In this
process, the controls established in Internal
Control over Financial Reporting (ICFR) are
applied, and the regulations set forth therein
are complied with. In matters of finance,
changes in shareholders' equity in companies
accounted for using the equity method are
also recognised.
Information of Prudential Relevance 2016
130
Management of equity exposures at CaixaBank
Pursuant to banking regulations, the Executive
Global Risk Management Division monitors the
exposure and regulatory capital charge
associated with CaixaBank's stakes, according to
the classification of equity investment.
This uses, inter alia, tools arising under the
framework of the new European regulation
governing capital requirements: CRD IV and
CRR1.
This division works with other areas of the Entity,
directly carrying out the calculation of, and
regulatory reporting on, the solvency of the
Group's equity portfolio, in addition to other tasks
related to risk management.
This Executive Division also performs functions
related to quantifying and monitoring equity
exposure, namely: 1) incorporation, on a daily
basis, of the market risk of derivatives and the
currency risk associated with the equity portfolio
into the monitoring of the Group's market risk;
and 2) ongoing monitoring of risks in portfolios
arising from dealings in financial markets in
connection with financial stakes. This approach is
explained in more detail below.
Measurement and information systems
The risk of positions that make up the equity
portfolio is measured using the regulatory tools
available in accordance with the Basel II
framework and subsequent revisions thereto,
bearing in mind developments in the sector, as
follows:
From the standpoint of the risk inherent to
market price volatility, using VaR models (a
statistical estimate of maximum potential
losses based on historical data on changes in
the prices of quoted assets).
From the standpoint of the possibility of
default, using models based on the PD/LGD
approach.
Applying the simple weighting model if neither
of the above can be applied.
All required information is fed into the corporate
databases used by the Risks Department, with
the consequent validations and measurements to
ensure the reliability of the data.
1 Regulation No. 575/2013 of the European Parliament and of the
Council, of 26 June 2013 (the "CRR")
Criteria for assignment of the various risk measurement approaches
Within the margins set by the supervisor and in
accordance with the incentive for adoption of the
most risk-sensitive advanced methods covered
by Basel III, the criterion for assigning the various
risk measurement approaches to the equity
investments not included in the trading portfolio is
as follows.
The selection between a PD/LGD approach and
a market approach (VaR model) will depend on
the classification of the stake for accounting
purposes:
For stakes not classified as available-for-sale,
the most significant risk is credit risk and the
PD/LGD approach is therefore applied. Where
PD is not available, the simple risk-weighted
method is used.
For available-for-sale investments listed on
organised markets, the most significant risk is
market risk and, therefore, the market-based
approach (VaR model) is used. Where
historical price data from organised markets in
not available for stakes - ruling out
measurement using the VaR model - the
PD/LGD approach is used as far as possible.
Where PD is not available, the simple risk
weight method is used. For mutual funds, the
simple risk-weighted method is used.
However, the PD/LGD approach is used for some
strategic investments classified as available for
sale, for which there is a long-term management
relationship. The use of this approach depends
on whether there is sufficient information on the
equity exposure in order to assess the internal
rating and assign a reliable, duly grounded PD for
that equity holding. When the information
available is insufficient, the simple risk weight
method is used.
The result obtained from using internal models to
measure capital charges (VaR, PD/LGD) is a key
element for calculating the quantity and quality of
the risk assumed, without prejudice to the
analysis of other types of measurements that
supplement those required by regulations
designed to determine the market value of the
stakes, their liquidity, and the estimated
contribution to the Group's profit and loss, and
capital.
To illustrate this point, some of the reports
generated by the Executive Global Risk
Information of Prudential Relevance 2016
131
Management Division and distributed to the
relevant committees are listed below:
Market risk report, monitoring the risk (VaR)
of the CaixaBank Group's trading derivatives
in connection with Criteria's strategic
holdings.
The report on Currency Risk in CaixaBank
Investees, which includes monitoring of risk
(VaR) for the exchange rate associated with
these holdings.
The CaixaBank Group's Positioning Report
for financial instruments, which is part of the
global monitoring of the positions that
comprise market operations, and covers both
the fixed-income and equity positions held by
the CaixaBank Group, including those in
VidaCaixa, and guaranteed mutual and
pension funds.
6.4.2. Minimum own funds requirements for risk from the equity portfolio
The following table contains a breakdown of
exposure and RWAs for the equity portfolio. This
information is presented in accordance with the
measurement approaches in the new European
capital requirements regulations - CRD IV and
CRR - and by equity instrument class1.
1 Described in section 6.4.1.
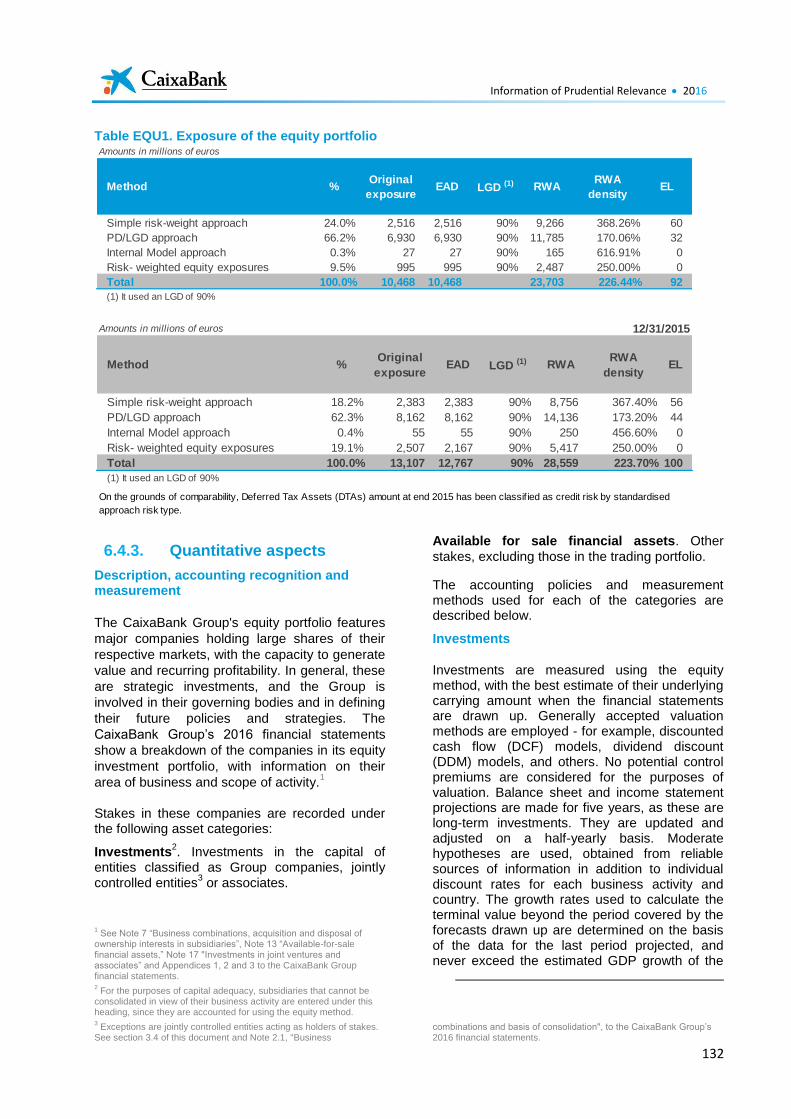
Information of Prudential Relevance 2016
132
Table EQU1. Exposure of the equity portfolio
6.4.3. Quantitative aspects
Description, accounting recognition and measurement
The CaixaBank Group's equity portfolio features
major companies holding large shares of their
respective markets, with the capacity to generate
value and recurring profitability. In general, these
are strategic investments, and the Group is
involved in their governing bodies and in defining
their future policies and strategies. The
CaixaBank Group’s 2016 financial statements
show a breakdown of the companies in its equity
investment portfolio, with information on their
area of business and scope of activity.1
Stakes in these companies are recorded under the following asset categories:
Investments2. Investments in the capital of
entities classified as Group companies, jointly controlled entities
3 or associates.
1 See Note 7 “Business combinations, acquisition and disposal of
ownership interests in subsidiaries”, Note 13 “Available-for-sale financial assets,” Note 17 "Investments in joint ventures and associates” and Appendices 1, 2 and 3 to the CaixaBank Group financial statements. 2 For the purposes of capital adequacy, subsidiaries that cannot be
consolidated in view of their business activity are entered under this heading, since they are accounted for using the equity method. 3 Exceptions are jointly controlled entities acting as holders of stakes.
See section 3.4 of this document and Note 2.1, "Business
Available for sale financial assets. Other
stakes, excluding those in the trading portfolio.
The accounting policies and measurement methods used for each of the categories are described below.
Investments
Investments are measured using the equity method, with the best estimate of their underlying carrying amount when the financial statements are drawn up. Generally accepted valuation methods are employed - for example, discounted cash flow (DCF) models, dividend discount (DDM) models, and others. No potential control premiums are considered for the purposes of valuation. Balance sheet and income statement projections are made for five years, as these are long-term investments. They are updated and adjusted on a half-yearly basis. Moderate hypotheses are used, obtained from reliable sources of information in addition to individual discount rates for each business activity and country. The growth rates used to calculate the terminal value beyond the period covered by the forecasts drawn up are determined on the basis of the data for the last period projected, and never exceed the estimated GDP growth of the
combinations and basis of consolidation", to the CaixaBank Group’s 2016 financial statements.
Amounts in millions of euros
Simple risk-weight approach 24.0% 2,516 2,516 90% 9,266 368.26% 60
PD/LGD approach 66.2% 6,930 6,930 90% 11,785 170.06% 32
Internal Model approach 0.3% 27 27 90% 165 616.91% 0
Risk- weighted equity exposures 9.5% 995 995 90% 2,487 250.00% 0
Total 100.0% 10,468 10,468 23,703 226.44% 92
(1) It used an LGD of 90%
Method %Original
exposureEAD LGD (1) RWA
RWA
densityEL
Amounts in millions of euros
Simple risk-weight approach 18.2% 2,383 2,383 90% 8,756 367.40% 56
PD/LGD approach 62.3% 8,162 8,162 90% 14,136 173.20% 44
Internal Model approach 0.4% 55 55 90% 250 456.60% 0
Risk- weighted equity exposures 19.1% 2,507 2,167 90% 5,417 250.00% 0
Total 100.0% 13,107 12,767 90% 28,559 223.70% 100
(1) It used an LGD of 90%
On the grounds of comparability, Deferred Tax Assets (DTAs) amount at end 2015 has been classif ied as credit risk by standardised
approach risk type.
12/31/2015
Method %Original
exposureEAD LGD (1) RWA
RWA
densityEL
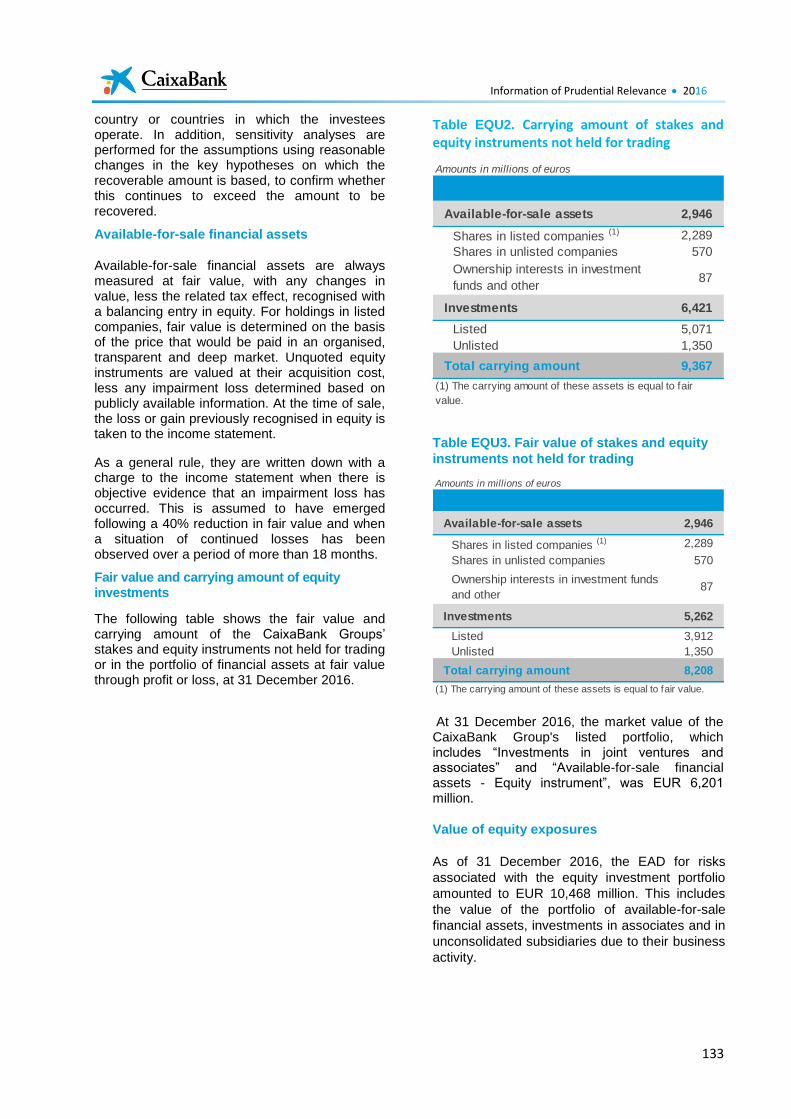
Information of Prudential Relevance 2016
133
country or countries in which the investees operate. In addition, sensitivity analyses are performed for the assumptions using reasonable changes in the key hypotheses on which the recoverable amount is based, to confirm whether this continues to exceed the amount to be recovered.
Available-for-sale financial assets
Available-for-sale financial assets are always measured at fair value, with any changes in value, less the related tax effect, recognised with a balancing entry in equity. For holdings in listed companies, fair value is determined on the basis of the price that would be paid in an organised, transparent and deep market. Unquoted equity instruments are valued at their acquisition cost, less any impairment loss determined based on publicly available information. At the time of sale, the loss or gain previously recognised in equity is taken to the income statement.
As a general rule, they are written down with a charge to the income statement when there is objective evidence that an impairment loss has occurred. This is assumed to have emerged following a 40% reduction in fair value and when a situation of continued losses has been observed over a period of more than 18 months.
Fair value and carrying amount of equity investments
The following table shows the fair value and carrying amount of the CaixaBank Groups’ stakes and equity instruments not held for trading or in the portfolio of financial assets at fair value through profit or loss, at 31 December 2016.
Table EQU2. Carrying amount of stakes and equity instruments not held for trading
Table EQU3. Fair value of stakes and equity
instruments not held for trading
At 31 December 2016, the market value of the CaixaBank Group's listed portfolio, which includes “Investments in joint ventures and associates” and “Available-for-sale financial assets - Equity instrument”, was EUR 6,201 million.
Value of equity exposures
As of 31 December 2016, the EAD for risks
associated with the equity investment portfolio
amounted to EUR 10,468 million. This includes
the value of the portfolio of available-for-sale
financial assets, investments in associates and in
unconsolidated subsidiaries due to their business
activity.
Amounts in millions of euros
Available-for-sale assets 2,946
Shares in listed companies (1) 2,289
Shares in unlisted companies 570
Ownership interests in investment
funds and other87
Investments 6,421
Listed 5,071
Unlisted 1,350
Total carrying amount 9,367
(1) The carrying amount of these assets is equal to fair
value.
Amounts in millions of euros
Available-for-sale assets 2,946
Shares in listed companies (1) 2,289
Shares in unlisted companies 570
Ownership interests in investment funds
and other87
Investments 5,262
Listed 3,912
Unlisted 1,350
Total carrying amount 8,208
(1) The carrying amount of these assets is equal to fair value.
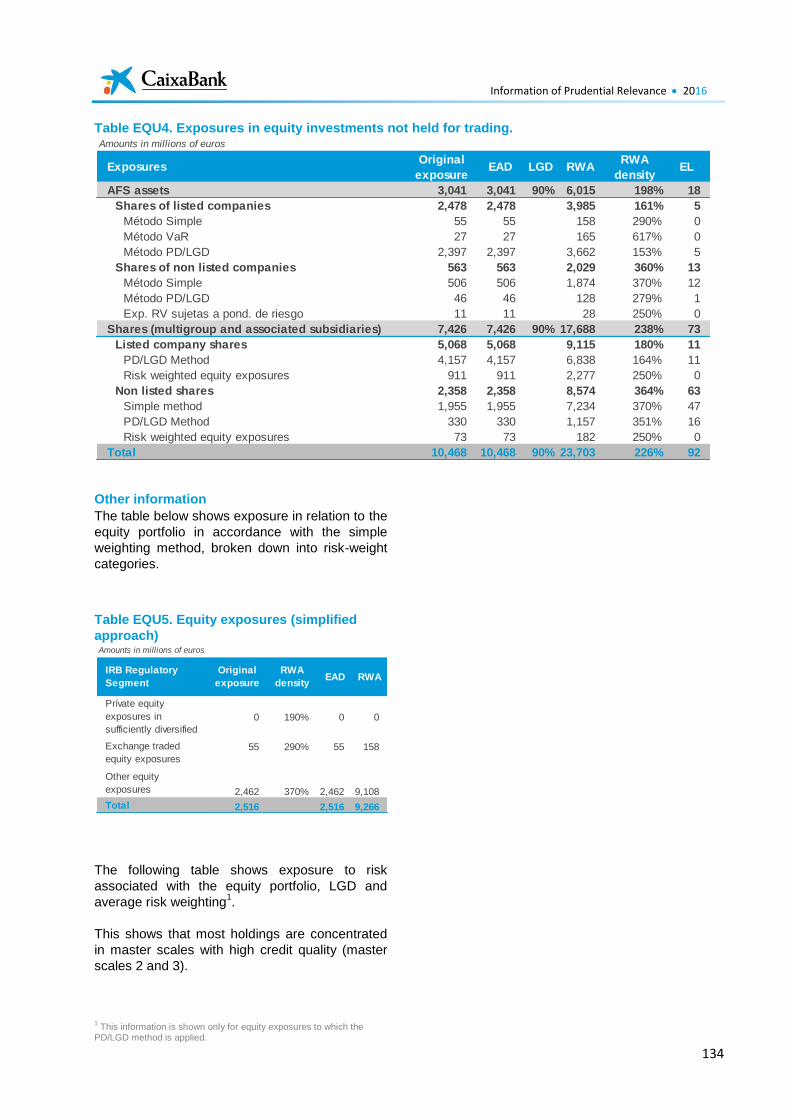
Information of Prudential Relevance 2016
134
Table EQU4. Exposures in equity investments not held for trading.
Other information
The table below shows exposure in relation to the
equity portfolio in accordance with the simple
weighting method, broken down into risk-weight
categories.
Table EQU5. Equity exposures (simplified
approach)
The following table shows exposure to risk
associated with the equity portfolio, LGD and
average risk weighting1.
This shows that most holdings are concentrated
in master scales with high credit quality (master
scales 2 and 3).
1 This information is shown only for equity exposures to which the
PD/LGD method is applied.
Amounts in millions of euros
ExposuresOriginal
exposureEAD LGD RWA
RWA
densityEL
AFS assets 3,041 3,041 90% 6,015 198% 18
Shares of listed companies 2,478 2,478 3,985 161% 5
Método Simple 55 55 158 290% 0
Método VaR 27 27 165 617% 0
Método PD/LGD 2,397 2,397 3,662 153% 5
Shares of non listed companies 563 563 2,029 360% 13
Método Simple 506 506 1,874 370% 12
Método PD/LGD 46 46 128 279% 1
Exp. RV sujetas a pond. de riesgo 11 11 28 250% 0
Shares (multigroup and associated subsidiaries) 7,426 7,426 90% 17,688 238% 73
Listed company shares 5,068 5,068 9,115 180% 11
PD/LGD Method 4,157 4,157 6,838 164% 11
Risk weighted equity exposures 911 911 2,277 250% 0
Non listed shares 2,358 2,358 8,574 364% 63
Simple method 1,955 1,955 7,234 370% 47
PD/LGD Method 330 330 1,157 351% 16
Risk weighted equity exposures 73 73 182 250% 0
Total 10,468 10,468 90% 23,703 226% 92
Amounts in millions of euros
Prívate equity
exposures in
sufficiently diversified
portfolios
0 190% 0 0
55 290% 55 158
Other equity
exposures 2,462 370% 2,462 9,108
Total 2,516 2,516 9,266
RWA
Exchange traded
equity exposures
IRB Regulatory
Segment
Original
exposure
RWA
densityEAD
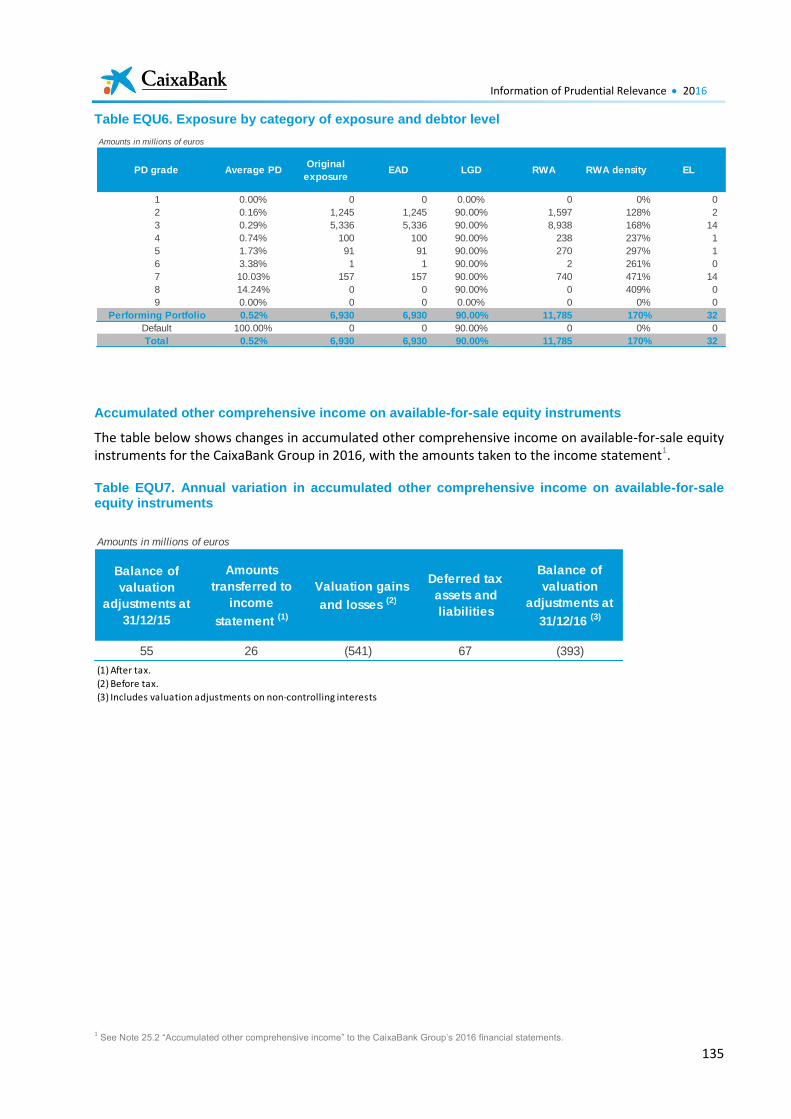
Information of Prudential Relevance 2016
135
Table EQU6. Exposure by category of exposure and debtor level
Accumulated other comprehensive income on available-for-sale equity instruments
The table below shows changes in accumulated other comprehensive income on available-for-sale equity instruments for the CaixaBank Group in 2016, with the amounts taken to the income statement1.
Table EQU7. Annual variation in accumulated other comprehensive income on available-for-sale equity instruments
1 See Note 25.2 “Accumulated other comprehensive income” to the CaixaBank Group’s 2016 financial statements.
Amounts in millions of euros
1 0.00% 0 0 0.00% 0 0% 0
2 0.16% 1,245 1,245 90.00% 1,597 128% 2
3 0.29% 5,336 5,336 90.00% 8,938 168% 14
4 0.74% 100 100 90.00% 238 237% 1
5 1.73% 91 91 90.00% 270 297% 1
6 3.38% 1 1 90.00% 2 261% 0
7 10.03% 157 157 90.00% 740 471% 14
8 14.24% 0 0 90.00% 0 409% 0
9 0.00% 0 0 0.00% 0 0% 0
Performing Portfolio 0.52% 6,930 6,930 90.00% 11,785 170% 32
Default 100.00% 0 0 90.00% 0 0% 0
Total 0.52% 6,930 6,930 90.00% 11,785 170% 32
RWA density ELPD grade Average PDOriginal
exposureEAD LGD RWA
Amounts in millions of euros
Balance of
valuation
adjustments at
31/12/15
Amounts
transferred to
income
statement (1)
Valuation gains
and losses (2)
Deferred tax
assets and
liabilities
Balance of
valuation
adjustments at
31/12/16 (3)
55 26 (541) 67 (393)
(1) After tax.
(2) Before tax.
(3) Includes valuation adjustments on non-controlling interests
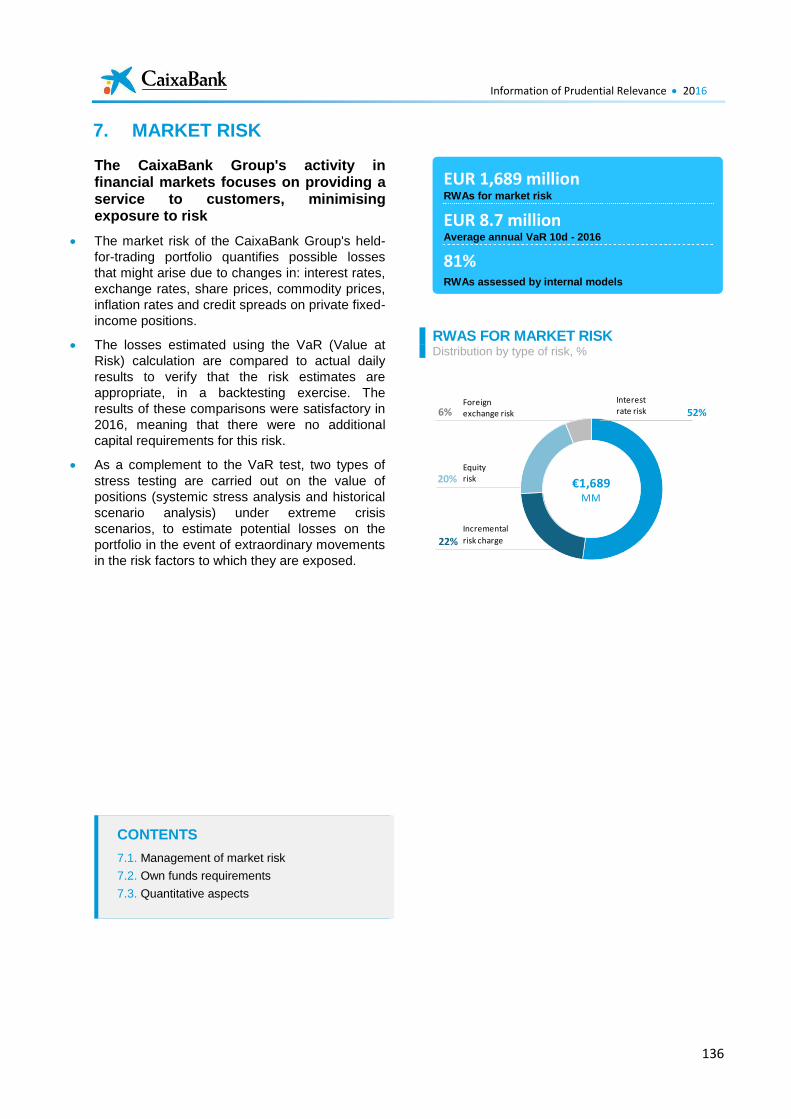
Information of Prudential Relevance 2016
136
7. MARKET RISK
The CaixaBank Group's activity in financial markets focuses on providing a service to customers, minimising exposure to risk
The market risk of the CaixaBank Group's held-
for-trading portfolio quantifies possible losses
that might arise due to changes in: interest rates,
exchange rates, share prices, commodity prices,
inflation rates and credit spreads on private fixed-
income positions.
The losses estimated using the VaR (Value at
Risk) calculation are compared to actual daily
results to verify that the risk estimates are
appropriate, in a backtesting exercise. The
results of these comparisons were satisfactory in
2016, meaning that there were no additional
capital requirements for this risk.
As a complement to the VaR test, two types of
stress testing are carried out on the value of
positions (systemic stress analysis and historical
scenario analysis) under extreme crisis
scenarios, to estimate potential losses on the
portfolio in the event of extraordinary movements
in the risk factors to which they are exposed.
RWAS FOR MARKET RISK Distribution by type of risk, %
52%
22%
20%
6%
Equityrisk
Incremental
risk charge
€1,689MM
Foreign exchange risk
Interest rate risk
EUR 1,689 million RWAs for market risk
EUR 8.7 million Average annual VaR 10d - 2016
81%
RWAs assessed by internal models
CONTENTS
7.1. Management of market risk
7.2. Own funds requirements
7.3. Quantitative aspects
Information of Prudential Relevance 2016
137
7.1. Management of market risk
Definition and general policy
The CaixaBank Group is exposed to market risk in the trading portfolio from adverse movements in the following factors: interest rates, exchange rates, share prices, inflation risks, and changes in the credit spreads of private fixed-income positions.
Risk factors are managed according to the return-risk ratio determined by market conditions and expectations, the limits structure and the authorised operating framework.
To manage this risk, the CaixaBank Group has used internal models to calculate regulatory own funds for market risk associated with the trading portfolio, currency and gold risk, and commodity price risk since 13 December 2007, when the Bank of Spain authorised the Group to apply them. In 2012, this authorisation was extended to the calculation of regulatory own funds for internal incremental default and migration risk (IRC) and stressed VaR models. Nevertheless, hedging derivatives (CDS) for CVA credit risk accounted for as a trading portfolio are calculated under the standardised approach for the purpose of regulatory capital requirements.
Structure and organisation of the risk management function
CaixaBank's Risk in Market Operations Division is responsible for the valuation of financial instruments, as well as the measurement, control and monitoring of the related risks, the estimation of counterparty risk and of the operational risk associated with activities in financial markets.
In performance of its functions, on a daily basis the Division monitors the contracts traded, calculates how changes in the market will affect the positions held (daily marked-to-market result), quantifies the market risk assumed, monitors compliance with the thresholds, and analyses the ratio of actual returns to the risk assumed. A daily control report is submitted to Senior Management, supervisors, Internal Validation and Internal Audit.
The Executive Global Risk Management Division, which comprises the Risk in Market Operations Department, acts, organisationally and functionally, independently of the risk-taking. This enhances the autonomy of its risk management, monitoring and control tasks, as it seeks to facilitate the comprehensive management of the various risks. Its task focuses on configuring a
risk profile in accordance with the Group's strategic objectives.
Risk management. Measurement and information systems
1
The standard measurement for market risk is VaR at 99% with a time horizon of one day. Daily VaR is defined as the highest of the following three calculations:
Parametric VaR with a covariance matrix calculated over 75 market days and exponential smoothing, giving more weight to recent observations.
Parametric VaR with a covariance matrix arising from historical performance over one year and equal weightings.
Historical VaR with a time frame of one year.
Moreover, since a downgrade in the credit rating of asset issuers can also give rise to adverse changes in quoted market prices, quantification of risk is completed with an estimate of the losses arising from changes in the volatility of the credit spread on private fixed-income and credit derivative positions (spread VaR), which constitutes an estimate of the specific risk attributable to the security issuers. This calculation is made using a historical approach taking into account the potentially lower liquidity of these assets, and a confidence interval of 99%.
To verify the suitability of the risk estimates, two backtests (gross, i.e. actual; and net, i.e. hypothetical) are conducted to compare the daily results to the losses estimated using the VaR technique. Stress tests are also performed on the value of the treasury positions and on positions included in the internal model in order to calculate the potential losses on the portfolio in situations of extreme crisis.
Hedging policies and mitigation techniques
Formalising and updating the risk appetite presented to the governing bodies delimits and validates that the market risk metrics defined by the CaixaBank Group are commensurate with the established risk tolerance levels. The RAF approved by the Board of Directors sets a limit for VaR with a one-day time horizon and confidence level of 99% for all trading activities, excluding hedging derivatives for the Credit Valuation Adjustment (CVA), which are recognised for accounting purposes in the held-for-trading portfolio. Moreover, both positions in the trading
1 See Note 3.4 Market Risk to the CaixaBank Group's 2016
consolidated financial statements for more information.
Information of Prudential Relevance 2016
138
portfolio and bank stakes are restricted to the concentration limits set out in the Risk Appetite Framework (e.g. concentration in large exposures, in the public sector or in an economic sector).
As part of the required monitoring and control of the market risks undertaken, the Board of Directors and, by delegation of the latter and on a more restricted basis, CaixaBank's Global Risk Committee and the Executive Finance Division approve a structure of overall VaR and sensitivity limits for the assumption of market risk. This structure establishes the following types of limits:
Global limit. The Board of Directors is responsible for defining the maximum level of market risk that may be undertaken in the Entity’s treasury and trading management operations.
Limit on treasury operations. In accordance with the general framework determined by the Board of Directors, CaixaBank's Global Risk Committee and/or the Executive Finance Division are authorised to implement the market risk limits structure and to determine lower levels of maximum risk if appropriate given the market circumstances and/or the approved management approach. This has been used to draw up specific limits for these operations, both on a global basis (VaR, stop loss, stress test, as determined by the Global Risk Committee) and by risk factors (as determined by the Executive Finance Division).
Limit on trading derivatives linked to CaixaBank's long-term stakes. In June 2008, the "la Caixa" Board of Directors developed the general framework, approving a specific limit on this activity, managed using market risk management criteria and incorporated into the internal market risk model. The limit was lowered in January 2009 by the "la Caixa" Global Risk Committee. On 25 July 2011, CaixaBank's Global Risk Committee adapted this framework to the "la Caixa" Group's new organisational structure.
Subsequently, CaixaBank Global Risk Committee defined specific limits for incremental default and migration risk of ratings (IRC) on fixed-income portfolios and stressed VaR in July 2011 and March 2012, respectively.
7.2. Minimum own funds requirements for market risk
The table below shows the breakdown of risk-weighted assets for position risk in the trading portfolio, for foreign exchange risk and for position risk in gold at 31 December 2016 by measurement approach (internal model or standardised approach, as applicable).
Table MR1. Breakdown of RWAs for market risk
Whilst capital requirements for hedging derivatives for CVA interest rate risk are calculated using the internal approach, capital requirements for market risk on hedging derivatives for CVA credit risk (in this case, CDS, also included in the accounting held-for-trading portfolio) are calculated under the standardised approach (specific interest rate risk). There is no breakdown of the calculation of RWAs under the standardised approach for options, as all of the options in the held-for-trading portfolio are subject to the internal approach. Likewise, there is no breakdown of market risk for securitisations, as the CaixaBank Group has no securitisation transactions in its held-for-trading portfolio.
At 31 December 2016, there were no RWAs for liquidity risk.
7.3. Quantitative aspects
General requirements
The Entity has policies and procedures in place for managing the trading portfolios, bearing in mind its own ability to manage risks and best market practices, and for determining which positions are included in the internal model for calculating regulatory capital.
Amounts in millions of euros
Internal
Model
Approach
Standarized
ApproachTotal
Interest rate risk (1) 678 324 1,003
Equity risk (1) 421 0 421
Foreign exchange risk 126 0 126
Commodity risk 0 0 0
Adjustment for correlation
between factors (2) -224 0 -224
Incremental risk charge (2) 364 0 364
Total 1,364 325 1,689
RWA
(1) General and Specific
(2) Only for the internal model
Information of Prudential Relevance 2016
139
Trading activity includes operations related to management of market risk arising from commercial or distribution efforts involving typical operations in financial markets with CaixaBank customers, as well as transactions carried out to obtain returns through trading and positioning in, mainly, money, fixed-income, equity and currency markets. It also includes CVA hedging derivatives for credit and market risk, which are recognised from an accounting perspective in the held-for-trading portfolio.
A specific policy has been approved for determining, identifying, potentially including in the internal approach, managing, monitoring and controlling this scope. Each day, a unit of the Risks area, which operates independently from the business areas, measures and calculates the performance and risks of the trading portfolio and ensures compliance with this policy.
The Entity has sufficient systems and controls providing prudent and reliable estimates of the fair value of financial instruments, in addition to policies and procedures setting out the responsibility of each area in the measurement process and reporting lines (ensuring the independence of this function from the business lines), the data sources used, the eligible models and the timing of closing prices.
Although the Entity uses appropriate measurement models and inputs, in line with standard market practice, the fair value of an asset may be exposed to a certain degree of uncertainty arising from the existence of alternative market data sources, the bid-offer spread, alternative models to those used and their unobservable inputs, concentration or the scant liquidity of the underlying asset. The measurement of this uncertainty in fair value is carried out through Additional Valuation Adjustments (AVA).
Adjustments for this uncertainty are applied and calculated mainly for assets with thin liquidity, where the most conservative bid-offer spread from comparable sources or conservative assumptions under the scope of the mark-to-model measurement are used. There are no Level 3 assets in the trading portfolio. This reduces potential model risk significantly.
For capital adequacy purposes, the trading portfolio consists of financial assets and liabilities that are held for trading by the Entity or form part of a portfolio of financial instruments (jointly identified and managed) with specific evidence of a trading intention.
According to points (86) and (87) of Article 4(1) of Regulation EU 575/2013, there is "trading intent" when positions are intended to be resold short term or held to benefit from actual or expected short term differences between buying and selling price differences or from other price or interest rate variations.
Unlike the trading portfolio as established in the Bank of Spain’s Circular 4/2004, the trading portfolio for the purposes of calculation of capital requirements also consists of financial instruments used to hedge other items in the portfolio and, in compliance with certain requirements, of internal hedging (positions that significantly offset the risk of a position or positions not included in the trading portfolio). Therefore, the trading portfolio for the purposes of capital adequacy has a greater scope than the trading portfolio determined by the Bank of Spain’s Circular 4/2004.
At 31 December 2016, the amount of minimum own funds requirements for exposure to positions in the trading portfolio and to foreign currency risk was EUR 135,111 thousand.
Internal models
The CaixaBank Group is exposed to market risk for adverse movements in the following factors: interest rates, exchange rates, share prices, inflation, volatility and changes in the credit spread of private fixed-income and credit derivatives positions. Estimates are drawn up daily, on the basis of sensitivity and VaR, aggregated and also segmented by risk factors and business units.
In July 2006, permission from the Bank of Spain was requested to use an internal VaR model for regulatory own funds for market risk in the trading portfolio, foreign currency risk, gold risk and commodity price risk. In 2007, following the appropriate validation process, the Bank of Spain granted permission for the use of this internal model, which was first applied for the calculation of capital requirements at 31 December 2007. Subsequently, in 2011, a request was made for the Bank of Spain to permit the use of internal models to calculate the own funds requirements for incremental default and migration risk and stressed VaR. In 2012, following the appropriate validation process, the Bank of Spain authorized the use of this internal model, which was first applied for the calculation of capital requirements on 31 December 2011.
Information of Prudential Relevance 2016
140
1. Characteristics of the models used
The methodologies used to comply with the requirements of Part 3, Title IV, Chapter 5, Sections 1-4 of Regulation EU 575/2013 for calculating own funds requirements according to the CaixaBank Group's internal model are as follows.
As a general rule, there are two types of measurements which constitute a common denominator and market standard for the measurement of market risk: sensitivity and VaR:
Sensitivity calculates risk as the impact a slight change in risk factors has on the value of positions, but does not provide any assumptions about the probability of such a change.
To standardise risk measurement across the entire portfolio, and provide certain assumptions regarding the extent of changes in market risk factors, VaR methodology is employed using a one-day time horizon and a statistical confidence interval of 99% (i.e. 99 times out of 100, actual losses will be less than the losses estimated in the VaR model). There are two methodologies used to obtain this measurement, parametric VaR and historical VaR:
The parametric VaR technique is based on the statistical treatment of parameters such as volatility and matching fluctuations in the prices and interest and exchange rates of the assets composing the portfolio, using two time horizons: a 75-day data window (giving more weight to recent observations through exponential smoothing), and a one-year data window (giving equal weight to all observations). Both of these windows are updated on a daily basis.
Historical VaR is calculated according to the impact on the value of the current portfolio of full-revaluation of historical daily changes in risk factors over the past year, with daily updating of the observation window. Risk factors are modelled using relative changes, except for interest rate variations, for which absolute changes are used.
A downgrade in the credit rating of asset issuers can also give rise to adverse changes in quoted market prices. Accordingly, the quantification of market risk is completed with an estimate of the losses arising from changes in the credit spread on private fixed-income positions and credit derivatives (Spread VaR), which constitutes an estimate of the specific risk attributable to issuers of securities. This calculation is made using a full-revaluation historical simulation and taking into
account the potentially lower liquidity of these assets, with a confidence interval of 99%, and assuming absolute variations in the simulation of credit spreads.
VaR under the internal model results from the aggregation of the VaR on the interest rate and exchange rate portfolios (from fluctuations in interest rates, foreign exchange rates and the volatility of these) and the Spread VaR, which are aggregated on a conservative basis, assuming zero correlation between the two groups of risk factors, with the addition of equities VaR and commodities (if any) VaR to the previous metrics, assuming a correlation of one between the three. A single model is used that splits out the general and specific risk of equities, whilst the specific risk of private fixed income and credit derivatives is estimated in a separate calculation (Spread VaR), and added to the VaR of the interest rate and exchange rate portfolios with zero correlation. Interest rate VaR separates out the general and specific risk of sovereign debt in a single model.
Daily VaR is defined as the highest of the three quantifications (historical VaR, 1 year parametric VaR and 75d parametric VaR). Historical VaR is an extremely appropriate system for completing the estimates obtained using the parametric VaR technique, since the latter does not provide any assumptions regarding the statistical behaviour of the risk factors (the parametric technique assumes fluctuations that can be modelled through a “normal” distribution). Historical VaR is also an especially suitable technique since it includes non-linear relationships between the risk factors, which are particularly necessary for options transactions.
In addition to the VaR metric already explained, own funds requirements under the internal model include another two variables: stressed VaR and incremental default and migration risks, included in Basel 2.5 and transposed through Circular 4/2011 and, subsequently, EU Regulation 575/2013.
Stressed VaR is calculated using full-simulation historical VaR with a confidence interval of 99% on the basis of daily fluctuations in market prices in a one-year period of significant stress for the portfolio positioning. The annual stress window is updated every week, choosing those that maximise VaR for the portfolio at the time. In general, and depending on the portfolio positioning, the stressed year chosen is usually the annual period following the Lehman Brothers collapse or the Spanish sovereign debt crisis (2012). The Stressed VaR calculation is
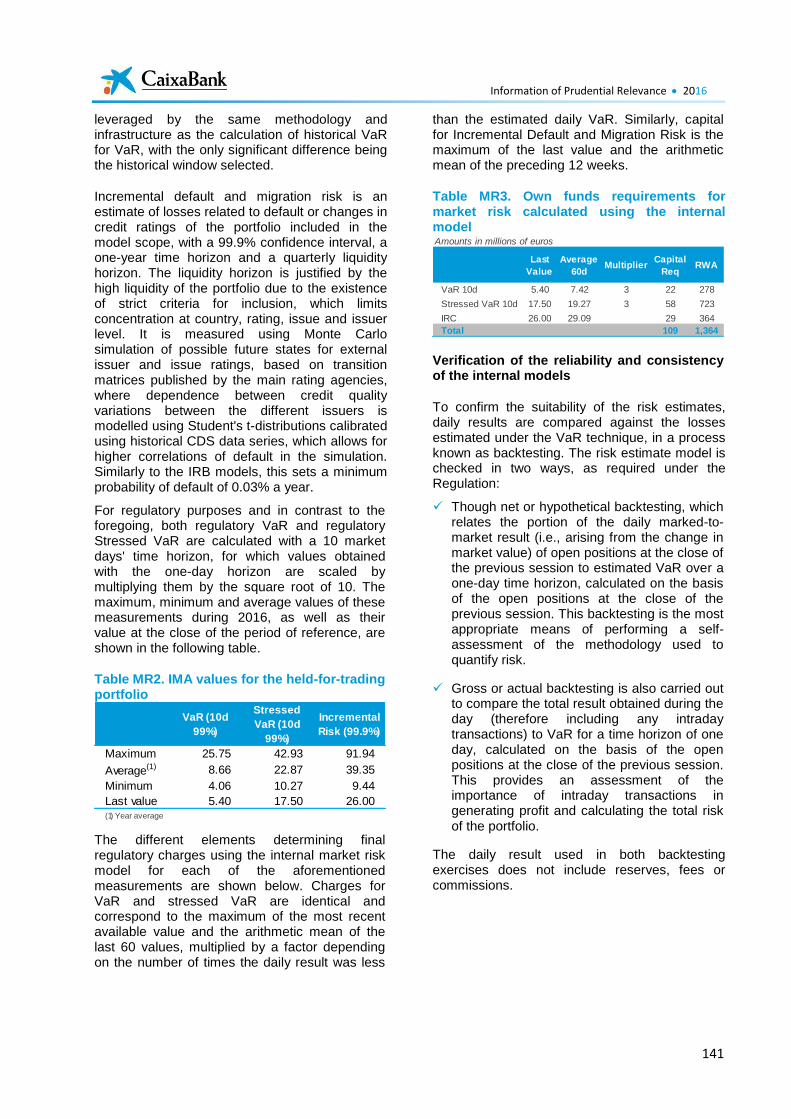
Information of Prudential Relevance 2016
141
leveraged by the same methodology and infrastructure as the calculation of historical VaR for VaR, with the only significant difference being the historical window selected.
Incremental default and migration risk is an estimate of losses related to default or changes in credit ratings of the portfolio included in the model scope, with a 99.9% confidence interval, a one-year time horizon and a quarterly liquidity horizon. The liquidity horizon is justified by the high liquidity of the portfolio due to the existence of strict criteria for inclusion, which limits concentration at country, rating, issue and issuer level. It is measured using Monte Carlo simulation of possible future states for external issuer and issue ratings, based on transition matrices published by the main rating agencies, where dependence between credit quality variations between the different issuers is modelled using Student's t-distributions calibrated using historical CDS data series, which allows for higher correlations of default in the simulation. Similarly to the IRB models, this sets a minimum probability of default of 0.03% a year.
For regulatory purposes and in contrast to the foregoing, both regulatory VaR and regulatory Stressed VaR are calculated with a 10 market days' time horizon, for which values obtained with the one-day horizon are scaled by multiplying them by the square root of 10. The maximum, minimum and average values of these measurements during 2016, as well as their value at the close of the period of reference, are shown in the following table.
Table MR2. IMA values for the held-for-trading portfolio
The different elements determining final regulatory charges using the internal market risk model for each of the aforementioned measurements are shown below. Charges for VaR and stressed VaR are identical and correspond to the maximum of the most recent available value and the arithmetic mean of the last 60 values, multiplied by a factor depending on the number of times the daily result was less
than the estimated daily VaR. Similarly, capital for Incremental Default and Migration Risk is the maximum of the last value and the arithmetic mean of the preceding 12 weeks.
Table MR3. Own funds requirements for market risk calculated using the internal model
Verification of the reliability and consistency of the internal models
To confirm the suitability of the risk estimates, daily results are compared against the losses estimated under the VaR technique, in a process known as backtesting. The risk estimate model is checked in two ways, as required under the Regulation:
Though net or hypothetical backtesting, which relates the portion of the daily marked-to-market result (i.e., arising from the change in market value) of open positions at the close of the previous session to estimated VaR over a one-day time horizon, calculated on the basis of the open positions at the close of the previous session. This backtesting is the most appropriate means of performing a self-assessment of the methodology used to quantify risk.
Gross or actual backtesting is also carried out to compare the total result obtained during the day (therefore including any intraday transactions) to VaR for a time horizon of one day, calculated on the basis of the open positions at the close of the previous session. This provides an assessment of the importance of intraday transactions in generating profit and calculating the total risk of the portfolio.
The daily result used in both backtesting exercises does not include reserves, fees or commissions.
VaR (10d
99%)
Stressed
VaR (10d
99%)
Incremental
Risk (99.9%)
Maximum 25.75 42.93 91.94
Average(1) 8.66 22.87 39.35
Minimum 4.06 10.27 9.44
Last value 5.40 17.50 26.00(1) Year average
Amounts in millions of euros
Last
Value
Average
60dMultiplier
Capital
ReqRWA
VaR 10d 5.40 7.42 3 22 278
Stressed VaR 10d 17.50 19.27 3 58 723
IRC 26.00 29.09 29 364
Total 109 1,364
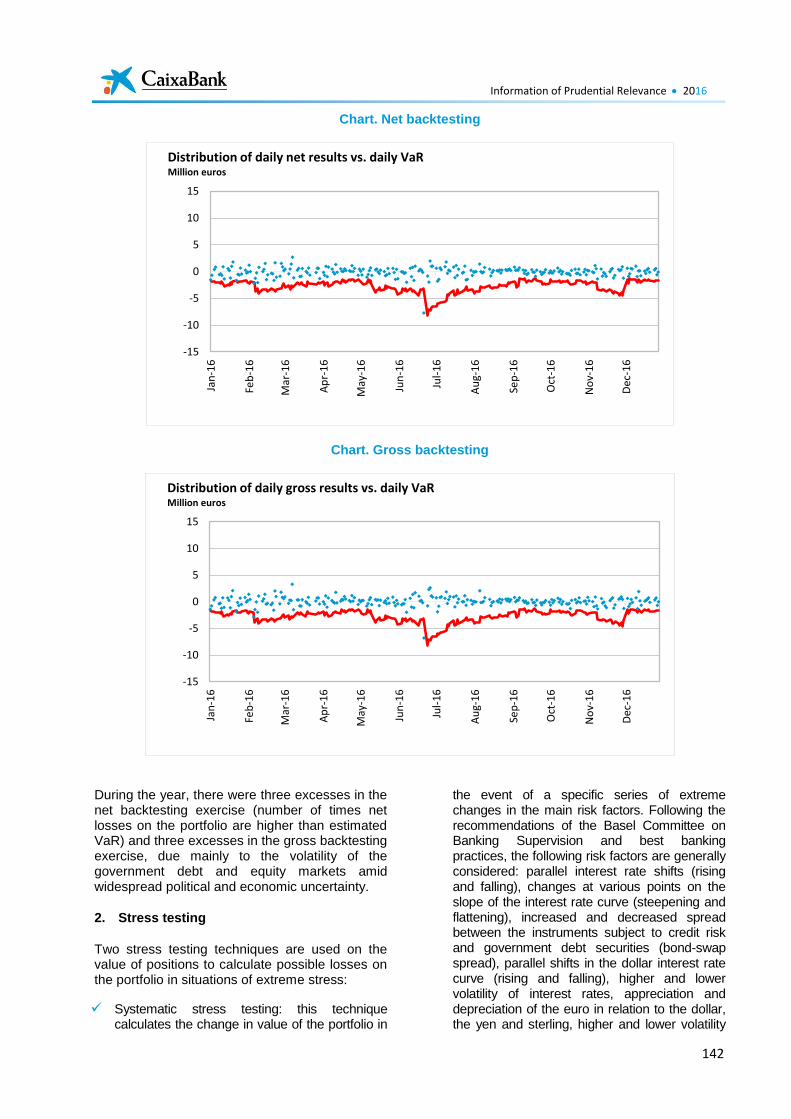
Information of Prudential Relevance 2016
142
Chart. Net backtesting
Chart. Gross backtesting
During the year, there were three excesses in the net backtesting exercise (number of times net losses on the portfolio are higher than estimated VaR) and three excesses in the gross backtesting exercise, due mainly to the volatility of the government debt and equity markets amid widespread political and economic uncertainty.
2. Stress testing
Two stress testing techniques are used on the value of positions to calculate possible losses on the portfolio in situations of extreme stress:
Systematic stress testing: this technique calculates the change in value of the portfolio in
the event of a specific series of extreme changes in the main risk factors. Following the recommendations of the Basel Committee on Banking Supervision and best banking practices, the following risk factors are generally considered: parallel interest rate shifts (rising and falling), changes at various points on the slope of the interest rate curve (steepening and flattening), increased and decreased spread between the instruments subject to credit risk and government debt securities (bond-swap spread), parallel shifts in the dollar interest rate curve (rising and falling), higher and lower volatility of interest rates, appreciation and depreciation of the euro in relation to the dollar, the yen and sterling, higher and lower volatility
-15
-10
-5
0
5
10
15
Jan
-16
Feb
-16
Mar
-16
Ap
r-1
6
May
-16
Jun
-16
Jul-
16
Au
g-1
6
Sep
-16
Oct
-16
No
v-1
6
Dec
-16
Distribution of daily net results vs. daily VaRMillion euros
-15
-10
-5
0
5
10
15
Jan
-16
Feb
-16
Mar
-16
Ap
r-1
6
May
-16
Jun
-16
Jul-
16
Au
g-1
6
Sep
-16
Oct
-16
No
v-1
6
Dec
-16
Distribution of daily gross results vs. daily VaRMillion euros
Information of Prudential Relevance 2016
143
of exchange rates, increases and decreases in the price of shares and commodities, higher and lower volatility of shares and commodities and, lastly, an increase in volatility of shares and raw materials.
Historical scenario analysis: this technique addresses the potential impact of actual past situations on the value of the positions held, such as the collapse of the Nikkei in 1990, the US debt crisis and the Mexican peso crisis in 1994, the 1997 Asian crisis, the 1998 Russian debt crisis, the emergence of the technology bubble in 1999 and its collapse in 2000, the terrorist attacks that have caused the most severe effects on the financial markets in recent years, the credit crunch of the summer of 2007, the liquidity and confidence crisis produced by the collapse of Lehman Brothers in September 2008, the increase in credit spreads in peripheral countries of the euro zone due to the contagion effect of the crises in Greece and Ireland in 2010 and the Spanish debt crisis in 2011 and 2012.
To complete these analyses of risk under extreme situations, the "worst-case scenario" is determined as the state of the risk factors in the last year that would cause the heaviest losses in the current portfolio. This is followed by an analysis of the “distribution tail”, i.e. the size of the losses that would arise if the market movement causing the losses were calculated on the basis of a 99.9% confidence interval using the Extreme Value Theory.
3. Monitoring and control
As part of the required monitoring and control of the market risks taken, the Global Risk Committee approves a structure of daily and monthly overall VaR, stress and loss limits, and delegates to the Executive Finance Division sensitivities and factor-specific VaR sublimits for Treasury Desk activity. The same metrics and models are used for market risk management and for calculating own funds for market risk under the internal model. The risk factors are managed by the Executive Finance Division on the basis of the return/risk ratio determined by market conditions and expectations. The Risk in Market Operations Department, which is part of the Executive Risk Models Division (which, in turn, is part of the General Risks Division), is responsible for monitoring these risks. On a daily basis, this department monitors the contracts traded, calculates how changes in the market will affect the positions held through daily marked-to-market results and use of generally accepted approaches in the market; quantifies the market risk taken; monitors compliance with limits; and analyses the actual return compared to the risk
undertaken.
The Risk in Market Operations Department has sufficient human resources, with considerable technical capacity, to apply the internal market risks model.
As noted, the Risk in Market Operations Department is responsible for daily monitoring of compliance with market risk limits and for notifying any breaches to Senior Management and to the appropriate risk-taking unit, with an instruction for the latter to restructure or close the positions leading to this situation or to obtain explicit authorisation to maintain them from the appropriate body. The risk report is distributed daily, and provides an explicit contrast between actual consumption and the authorised limits. Daily estimates are also provided of sensitivity and VaR, both in the aggregate and segmented by risk factors and business units.
On a daily basis, the Risk in Market Operations Department draws up and distributes the following market risk monitoring reports for Management, supervisors and Internal Audit:
All treasury activity.
The position constituted by the internal market risk model for calculation of own funds, including equity derivatives on investees.
The structural position in foreign currency.
The monitoring process generally consists of three different sections: daily risk measurement, backtesting and stress testing.
On a monthly basis, the Risk in Market Operations Department draws up the "Market Risk" section of the "Risks Scorecard”, which is submitted to the Entity’s Global Risk Committee.
The General Risks Division, which includes the Risk in Market Operations Department, carries out a supervisory function, the main objective of which is to ensure a healthy risk profile and preserve the solvency and guarantee mechanisms, thereby ensuring the comprehensive management of the various risks.
In addition, the Risk Validation Model area performs internal validation of the models and methodologies used to quantify and monitor market risk.
Lastly, the CaixaBank Group’s treasury and market activities and the risk measurement and control mechanisms used for these activities are subject to ongoing internal audit. In its most recent report, in 2016, Internal Audit concluded that the methodologies and procedures used for the purposes of management, measurement and control of market risk in association with trading on financial markets were adequate and complied with the prevailing requirements in the areas analysed.
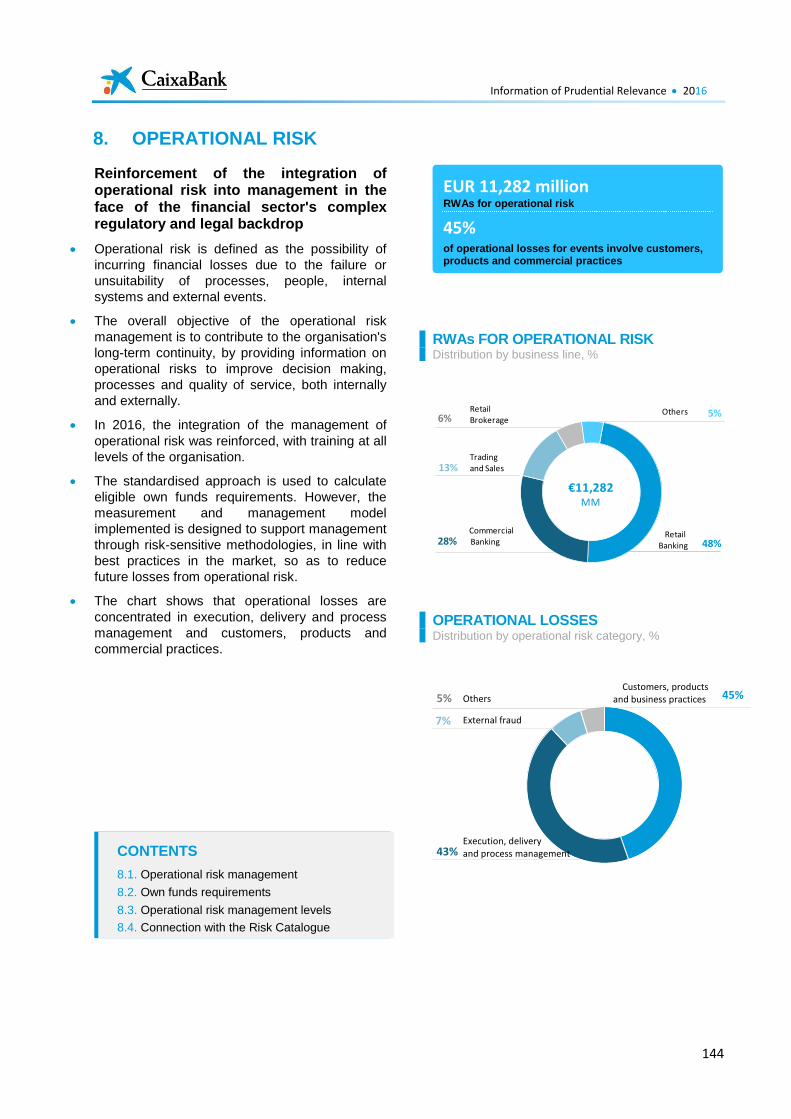
Information of Prudential Relevance 2016
144
8. OPERATIONAL RISK
Reinforcement of the integration of operational risk into management in the face of the financial sector's complex regulatory and legal backdrop
Operational risk is defined as the possibility of
incurring financial losses due to the failure or
unsuitability of processes, people, internal
systems and external events.
The overall objective of the operational risk
management is to contribute to the organisation's
long-term continuity, by providing information on
operational risks to improve decision making,
processes and quality of service, both internally
and externally.
In 2016, the integration of the management of
operational risk was reinforced, with training at all
levels of the organisation.
The standardised approach is used to calculate
eligible own funds requirements. However, the
measurement and management model
implemented is designed to support management
through risk-sensitive methodologies, in line with
best practices in the market, so as to reduce
future losses from operational risk.
The chart shows that operational losses are
concentrated in execution, delivery and process
management and customers, products and
commercial practices.
RWAs FOR OPERATIONAL RISK Distribution by business line, %
OPERATIONAL LOSSES Distribution by operational risk category, %
48%28%
13%
6% 5%
Tradingand Sales
CommercialBanking
€11,282MM
RetailBrokerage
Retail Banking
Others
45%
43%
7%
5%
Execution, deliveryand process management
External fraud
Customers, productsand business practices Others
EUR 11,282 million RWAs for operational risk
45%
of operational losses for events involve customers, products and commercial practices
CONTENTS
8.1. Operational risk management
8.2. Own funds requirements
8.3. Operational risk management levels
8.4. Connection with the Risk Catalogue
Information of Prudential Relevance 2016
145
8.1. Operational risk management
General policy
The CaixaBank Group seeks to manage operational risk homogeneously and consistently across all the companies within its scope as a financial conglomerate. It achieves this by promoting consistency in the tools, measurements and reporting used, ensuring the existence of full and comparable information for operational risk decisions. It also promotes the use of advanced measurement and management models for each sector of activity; these are implemented consistently with the degree of development and maturity in each sector.
The CaixaBank Group manages the operational risk within its scope of financial solvency in accordance with best practices in the market, for which it has put in place the necessary tools, policies and structures.
Structure and organisation of the management of operational risk
Business areas and Group companies: responsible for the daily management of operational risk within their respective areas. This implies identifying, assessing, managing, controlling and reporting the operational risks of their activity and helping CaixaBank's Operational Risk Division to implement the management model.
This division is part of the Global Risk Management Information Department, which reports to the Corporate Risk Models and Policies Division, which in turn reports to the Executive Global Risk Management Division. Overall control and oversight of operational risk is carried out by this Executive Division, which materialises the independence functions required by the Basel Committee on Banking Supervision. Its responsibilities include the control and oversight of operational risk.
The Operational Risk Division is responsible for defining, standardising, and implementing the model for the management, measurement and control of operational risk. It also provides back-up to Areas and consolidates information on operational risk throughout the Group for the purposes of reporting to Senior Management and to the risk management committees involved.
The Corporate Business Control Division is the specific control unit of the General Business Division and oversees monitoring of the control environment in the first line of defence.
The Risk Models Validation area is in charge of validating the international operational risk model
if an internal approach to quantifying capital is available.
According to the 3 lines of defence model implemented, Internal Audit is the third line of defence. It oversees the activities of the first and second lines, providing support to Senior Management and the governing bodies so as to provide reasonable certainty with regard to, inter alia, regulatory compliance and the appropriate application of internal policies and regulations regarding operational risk management.
IT Services is responsible for the technological infrastructure on which operational risk management is based.
Operational risk categories
The types of operational risk in the CaixaBank Group are structured into four categories or hierarchical levels, from the most generic to the most specific and detailed.
The main risk categorisation in the Group is based on levels 1 and 2, as defined under the regulations (the most generic or aggregated). These are extended and developed for risk circumstances up to levels 3 and 4, which are specific to the Group. These are obtained from detailed analysis of operational risk at divisional/Group company level, based on the regulatory levels (1 and 2).
The CaixaBank Group has defined its own main risk categorisation based on an analysis of operational risk in the various business areas and Group companies. The categories are the same for the entire Group and are shared by the qualitative approaches to identifying risks and the quantitative measurement approaches based on an operational loss database.
Level 3 risk represents the combined individual risk of all the business areas and Group companies.
Level 4 represents the materialisation of particular level 3 risks in a specific process, activity and/or business area.
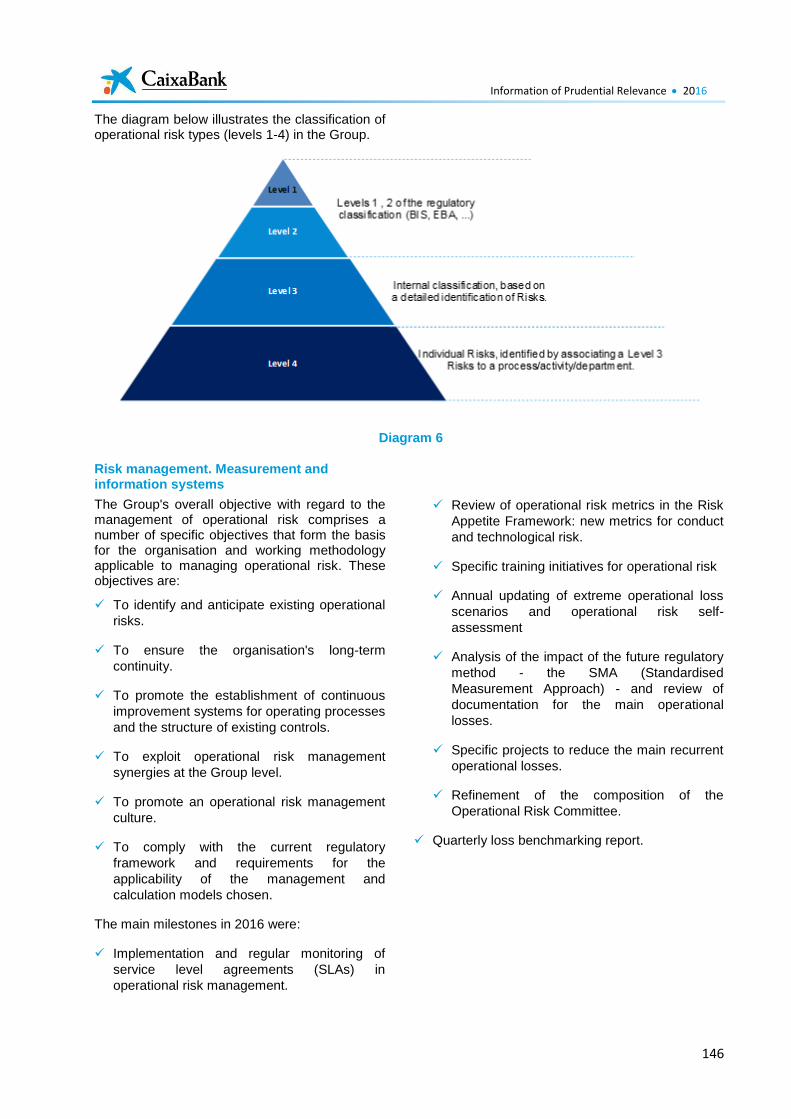
Information of Prudential Relevance 2016
146
The diagram below illustrates the classification of operational risk types (levels 1-4) in the Group.
Diagram 6
Risk management. Measurement and information systems
The Group's overall objective with regard to the management of operational risk comprises a number of specific objectives that form the basis for the organisation and working methodology applicable to managing operational risk. These objectives are:
To identify and anticipate existing operational
risks.
To ensure the organisation's long-term
continuity.
To promote the establishment of continuous
improvement systems for operating processes
and the structure of existing controls.
To exploit operational risk management
synergies at the Group level.
To promote an operational risk management
culture.
To comply with the current regulatory
framework and requirements for the
applicability of the management and
calculation models chosen.
The main milestones in 2016 were:
Implementation and regular monitoring of
service level agreements (SLAs) in
operational risk management.
Review of operational risk metrics in the Risk
Appetite Framework: new metrics for conduct
and technological risk.
Specific training initiatives for operational risk
Annual updating of extreme operational loss
scenarios and operational risk self-
assessment
Analysis of the impact of the future regulatory
method - the SMA (Standardised
Measurement Approach) - and review of
documentation for the main operational
losses.
Specific projects to reduce the main recurrent
operational losses.
Refinement of the composition of the
Operational Risk Committee.
Quarterly loss benchmarking report.
Information of Prudential Relevance 2016
147
8.2. Minimum own funds requirements
The following table shows the CaixaBank
Group's RWA for operational risk at 31
December 2016.
Table OR1. RWA for operational risk
Calculation of eligible own funds requirements
The Group applies the standardised approach for calculating regulatory capital for operational risk.
The standardised approach involves multiplying a relevant indicator of exposure to operational risk by a coefficient.
This indicator is practically equivalent to the three-year average of gross income taken from the income statement.
Regulations set down that the indicator should be broken down into eight regulatory business lines, with the part assigned to each of these being multiplied by a specific coefficient, as shown in the following table:
Table OR2. Operational risk: business lines
and weights
This assumes that firms are able to map the corresponding part of the Relevant Indicator to each of these regulatory business lines.
The regulations establish that firms using the Standardised Approach must comply with certain demanding requirements for operational risk management and measurement.
8.3. Operational risk management levers
To achieve the management objective, the
operational risk model is based on the:
Operational Risk Management Framework
(ORMF): This is the Governance Framework and
Management Structure for the operational risk
model set out in this Operational Risk
Management Framework and the documents
implementing it. This framework defines the
Operational Risk Measurement System, based
on the policies, procedures and processes used
to manage operational risk, in line with the
Group’s general risk policies.
Operational Risk Measurement System
(ORMS): This is the system the Entity uses to
determine its operational risk and related capital
requirements. It integrates operational risk
management into the Group’s day-to-day
activities, based on a combination and interaction
of qualitative and quantitative methodologies.
Amounts in millions of euros
Average of
Relevant
Income
RWA
Retail Banking 3,304 4,956
Retail Brokerage 524 787
Asset Management 123 184
Commercial Banking 1,856 3,480
Agency Services 28 52
Trading and Sales 662 1,488
Coporate Finance 148 334
Payment and Setlements 0 0
Total 6,645 11,282
Beta Factors
Corporate Finance 18%
Trading and Sales 18%
Retail Brokerage 12%
Commercial Banking 15%
Retail Banking 12%
Payment and Setlements 18%
Agency Services 15%
Assets Management 12%
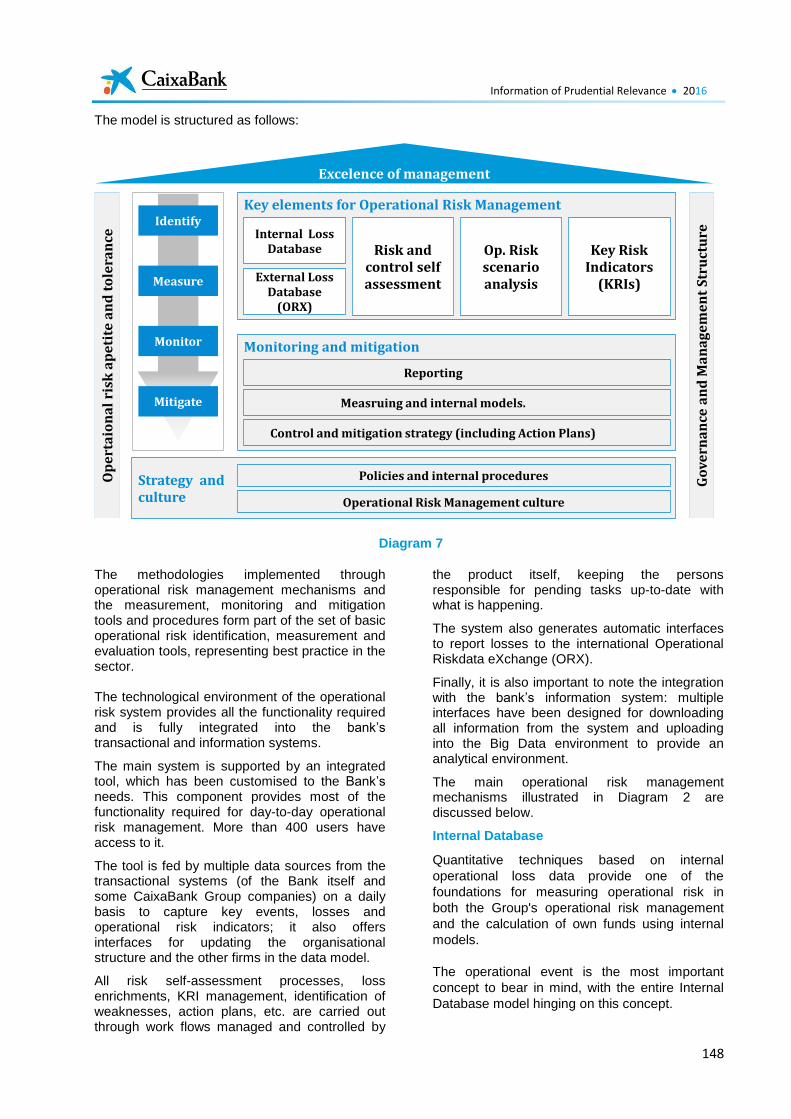
Information of Prudential Relevance 2016
148
The model is structured as follows:
Diagram 7
The methodologies implemented through operational risk management mechanisms and the measurement, monitoring and mitigation tools and procedures form part of the set of basic operational risk identification, measurement and evaluation tools, representing best practice in the sector. The technological environment of the operational risk system provides all the functionality required and is fully integrated into the bank’s transactional and information systems.
The main system is supported by an integrated tool, which has been customised to the Bank’s needs. This component provides most of the functionality required for day-to-day operational risk management. More than 400 users have access to it.
The tool is fed by multiple data sources from the transactional systems (of the Bank itself and some CaixaBank Group companies) on a daily basis to capture key events, losses and operational risk indicators; it also offers interfaces for updating the organisational structure and the other firms in the data model.
All risk self-assessment processes, loss enrichments, KRI management, identification of weaknesses, action plans, etc. are carried out through work flows managed and controlled by
the product itself, keeping the persons responsible for pending tasks up-to-date with what is happening.
The system also generates automatic interfaces to report losses to the international Operational Riskdata eXchange (ORX).
Finally, it is also important to note the integration with the bank’s information system: multiple interfaces have been designed for downloading all information from the system and uploading into the Big Data environment to provide an analytical environment.
The main operational risk management mechanisms illustrated in Diagram 2 are discussed below.
Internal Database
Quantitative techniques based on internal
operational loss data provide one of the
foundations for measuring operational risk in
both the Group's operational risk management
and the calculation of own funds using internal
models.
The operational event is the most important
concept to bear in mind, with the entire Internal
Database model hinging on this concept.
Excelence of management
Op
ert
aio
na
l ri
sk a
pe
tite
an
d t
ole
ran
ce
Go
ve
rna
nce
an
d M
an
ag
em
en
t S
tru
ctu
re
Strategy andculture
Policies and internal procedures
Operational Risk Management culture
Key elements for Operational Risk Management
Monitoring and mitigation
Internal Loss Database
External Loss Database
(ORX)
Risk and control self assessment
Op. Risk scenario analysis
Key Risk Indicators
(KRIs)
Reporting
Measruing and internal models.
Control and mitigation strategy (including Action Plans)
Identify
Monitor
Mitigate
Measure
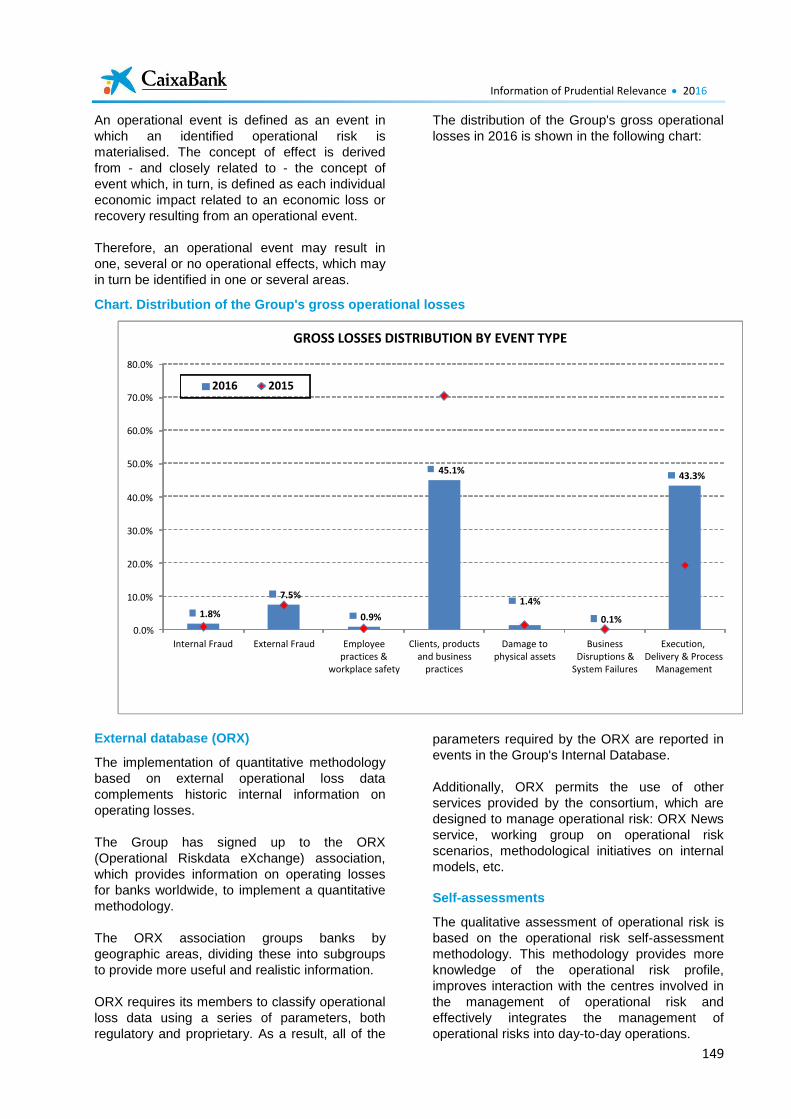
Information of Prudential Relevance 2016
149
An operational event is defined as an event in
which an identified operational risk is
materialised. The concept of effect is derived
from - and closely related to - the concept of
event which, in turn, is defined as each individual
economic impact related to an economic loss or
recovery resulting from an operational event.
Therefore, an operational event may result in
one, several or no operational effects, which may
in turn be identified in one or several areas.
The distribution of the Group's gross operational
losses in 2016 is shown in the following chart:
Chart. Distribution of the Group's gross operational losses
External database (ORX)
The implementation of quantitative methodology
based on external operational loss data
complements historic internal information on
operating losses.
The Group has signed up to the ORX
(Operational Riskdata eXchange) association,
which provides information on operating losses
for banks worldwide, to implement a quantitative
methodology.
The ORX association groups banks by
geographic areas, dividing these into subgroups
to provide more useful and realistic information.
ORX requires its members to classify operational
loss data using a series of parameters, both
regulatory and proprietary. As a result, all of the
parameters required by the ORX are reported in
events in the Group's Internal Database.
Additionally, ORX permits the use of other
services provided by the consortium, which are
designed to manage operational risk: ORX News
service, working group on operational risk
scenarios, methodological initiatives on internal
models, etc.
Self-assessments
The qualitative assessment of operational risk is
based on the operational risk self-assessment
methodology. This methodology provides more
knowledge of the operational risk profile,
improves interaction with the centres involved in
the management of operational risk and
effectively integrates the management of
operational risks into day-to-day operations.
1.8%
7.5%
0.9%
45.1%
1.4%
0.1%
43.3%
0.0%
10.0%
20.0%
30.0%
40.0%
50.0%
60.0%
70.0%
80.0%
Internal Fraud External Fraud Employee practices &
workplace safety
Clients, products and business
practices
Damage to physical assets
Business Disruptions &
System Failures
Execution, Delivery & Process
Management
GROSS LOSSES DISTRIBUTION BY EVENT TYPE
2016 2015
Information of Prudential Relevance 2016
150
There are three main stages in the self-
assessment process:
Assessment of the risk by the area. The
input parameters requested are estimated figures for: frequency and impact of potential loss events, allocation of risk to business lines, assessment of related controls.
Validation of the assessment by the area manager.
Final validation by the Operational Risk Division.
The operational risk internal assessment (over
600 risks) was updated in 2016, accompanied by
a training campaign specifically for the contact
persons involved. This was designed to improve
on the results of the backtesting exercise carried
out on completion of the 2015 campaign.
Operational risk scenarios
One of the foundations of the Group's
management of operational risk is identification
through qualitative techniques. To this end, it has
implemented a methodology for generating
operational risk scenarios that allows it to:
Obtain greater knowledge of the Group's operational risk profile.
Improve the level of interaction with areas involved in managing operational risk.
Effectively integrate operational risk management.
The scenario generation process is a qualitative,
recurring process carried out annually. It entails
workshops and meetings with experts to
generate hypothetical extreme operational loss
scenarios for use in the own funds calculation
methodology by internal models to detect areas
for improvement.
The scenario generation process involves five
stages: scope setting, scenario identification,
scenario workshops, determination of scenarios,
and monitoring and reporting.
The extreme operational loss scenarios were
updated for the third time in 2016, making further
efforts to detect drivers for quantifying losses and
probability of occurrence, and providing experts
with new proposals for scenarios obtained from
the ORX scenario library.
Operational risk indicators (KRIs)
Measurement of operational risk indicators (Key
Risk Indicators - KRIs) is one of the main
qualitative/quantitative operational risk
measurement methodologies. These:
Enable us to anticipate the development of
operational risks, taking a forward-looking
approach to their management.
Provide information on development of the
entity's operational risk profile and the
reasons for this.
A KRI is a metric, index or measure that detects
and anticipates changes in operational risk
levels. KRIs are not by nature a direct result of
risk exposure. They are metrics that can be used
to identify and actively manage operational risk.
The main concepts in the definition and structure
of operational risk indicators are the definition of
the KRIs (including any sub-KRIs), thresholds,
alerts (and related actions), frequency, the
updating method and criticality.
Over 400 KRIs were studied during 2016,
specifically to assess their suitability, predictive
capability, usefulness for managing operational
risk, and importance in global monitoring.
Moreover, as part of the set of operational risk
metrics in the RAF (risk appetite framework), two
new level 2 indicators were started, one for
conduct risk and one for IT risk.
Action and mitigation plans
The generation of action and mitigation plans is
one of the links in the Group's operational risk
management chain. To this end, it has
implemented an action and mitigation plan
methodology that allows it to:
Effectively offset the Group's operational
risks, reducing their frequency and their
impact when they do arise.
Have in place a solid control structure based
on policies, methodologies, processes and
systems.
Effectively integrate operational risk
management.
The action and mitigation plans may originate
from any of the operational risk management
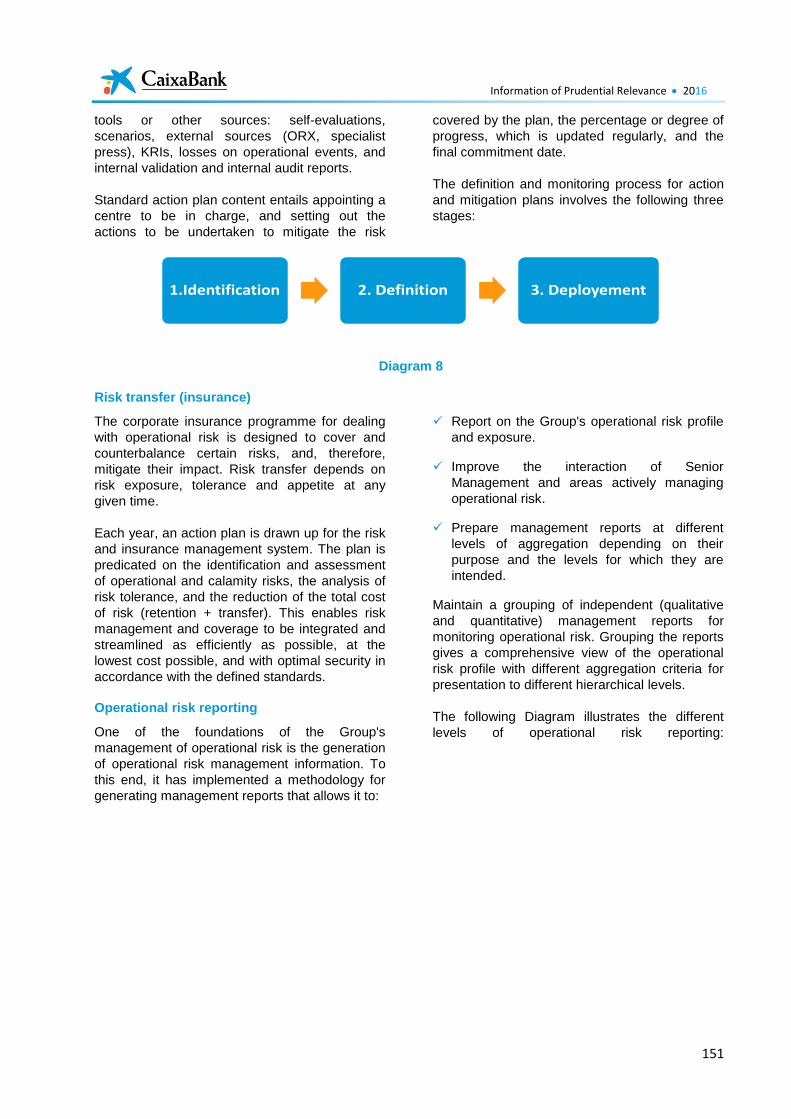
Information of Prudential Relevance 2016
151
tools or other sources: self-evaluations,
scenarios, external sources (ORX, specialist
press), KRIs, losses on operational events, and
internal validation and internal audit reports.
Standard action plan content entails appointing a
centre to be in charge, and setting out the
actions to be undertaken to mitigate the risk
covered by the plan, the percentage or degree of
progress, which is updated regularly, and the
final commitment date.
The definition and monitoring process for action
and mitigation plans involves the following three
stages:
Diagram 8
Risk transfer (insurance)
The corporate insurance programme for dealing
with operational risk is designed to cover and
counterbalance certain risks, and, therefore,
mitigate their impact. Risk transfer depends on
risk exposure, tolerance and appetite at any
given time.
Each year, an action plan is drawn up for the risk
and insurance management system. The plan is
predicated on the identification and assessment
of operational and calamity risks, the analysis of
risk tolerance, and the reduction of the total cost
of risk (retention + transfer). This enables risk
management and coverage to be integrated and
streamlined as efficiently as possible, at the
lowest cost possible, and with optimal security in
accordance with the defined standards.
Operational risk reporting
One of the foundations of the Group's
management of operational risk is the generation
of operational risk management information. To
this end, it has implemented a methodology for
generating management reports that allows it to:
Report on the Group's operational risk profile
and exposure.
Improve the interaction of Senior
Management and areas actively managing
operational risk.
Prepare management reports at different
levels of aggregation depending on their
purpose and the levels for which they are
intended.
Maintain a grouping of independent (qualitative
and quantitative) management reports for
monitoring operational risk. Grouping the reports
gives a comprehensive view of the operational
risk profile with different aggregation criteria for
presentation to different hierarchical levels.
The following Diagram illustrates the different
levels of operational risk reporting:
1.Identification 2. Definition 3. Deployement
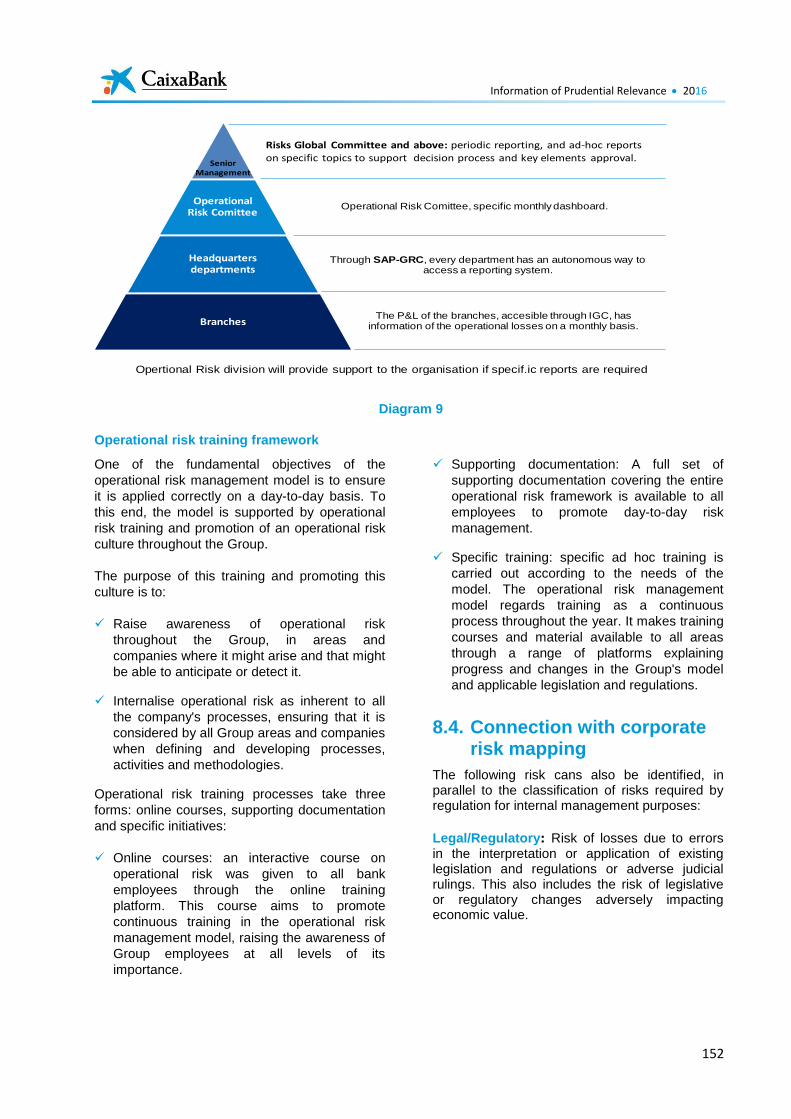
Information of Prudential Relevance 2016
152
Diagram 9
Operational risk training framework
One of the fundamental objectives of the
operational risk management model is to ensure
it is applied correctly on a day-to-day basis. To
this end, the model is supported by operational
risk training and promotion of an operational risk
culture throughout the Group.
The purpose of this training and promoting this
culture is to:
Raise awareness of operational risk
throughout the Group, in areas and
companies where it might arise and that might
be able to anticipate or detect it.
Internalise operational risk as inherent to all
the company's processes, ensuring that it is
considered by all Group areas and companies
when defining and developing processes,
activities and methodologies.
Operational risk training processes take three
forms: online courses, supporting documentation
and specific initiatives:
Online courses: an interactive course on
operational risk was given to all bank
employees through the online training
platform. This course aims to promote
continuous training in the operational risk
management model, raising the awareness of
Group employees at all levels of its
importance.
Supporting documentation: A full set of
supporting documentation covering the entire
operational risk framework is available to all
employees to promote day-to-day risk
management.
Specific training: specific ad hoc training is
carried out according to the needs of the
model. The operational risk management
model regards training as a continuous
process throughout the year. It makes training
courses and material available to all areas
through a range of platforms explaining
progress and changes in the Group's model
and applicable legislation and regulations.
8.4. Connection with corporate risk mapping
The following risk cans also be identified, in parallel to the classification of risks required by regulation for internal management purposes:
Legal/Regulatory: Risk of losses due to errors in the interpretation or application of existing legislation and regulations or adverse judicial rulings. This also includes the risk of legislative or regulatory changes adversely impacting economic value.
Senior Management
Operational Risk Comittee
Headquarters departments
Branches
Risks Global Committee and above: periodic reporting, and ad-hoc reports on specific topics to support decision process and key elements approval.
Operational Risk Comittee, specific monthly dashboard.
Through SAP-GRC, every department has an autonomous way to access a reporting system.
The P&L of the branches, accesible through IGC, has information of the operational losses on a monthly basis.
Opertional Risk division will provide support to the organisation if specif.ic reports are required
Information of Prudential Relevance 2016
153
Conduct and Compliance: Risk of CaixaBank applying criteria for action contrary to the interests of its clients and stakeholders and deficient procedures that generate actions or omissions that are not aligned with the legal or regulatory framework, or with internal codes and rules, and which could result in administrative sanctions or reputational damage.
Technological (IT): Losses due to hardware or
software inadequacies or failures in the technical infrastructures that could compromise the availability, integrity, accessibility and security of infrastructures and data.
Operating processes and external events: Risk of loss or damage caused by operational errors in processes related to the Bank’s activity, due to external events beyond the Bank’s control, or due to third parties outside the Bank, both accidentally and fraudulently.
Reliability of financial reporting: Deficiencies in the accuracy, integrity and criteria of the process used when preparing the data necessary to evaluate the financial and equity situation of the CaixaBank Group.
8.4.1. Legal and regulatory risk
Definition and general policy
Within the context of operational risk, legal and regulatory risk is defined as the probability of losses or decreases in the CaixaBank Group's profitability as a result of changes in the regulatory framework or unfavourable court rulings. This includes two risks: (i) risks deriving from changes to the general legal framework or to specific sector regulations (banking, insurance, and asset management) that cause a loss or decrease in the Group's profitability; and (ii) risks of legal claims by public administrations, customers, investors, suppliers or employees alleging non-compliance or illegal actions, violation of contractual clauses, or a lack of transparency in the products marketed by the Group.
Structure and organisation of the risk
management function
To manage this risk, CaixaBank, S.A.'s Legal Advisory area, through the Regulation Division, and the Corporate Legal, Business Legal, Disputes Advisory and Tax Advisory Departments, monitors and analyses regulations, as well as adaptation to regulations and the risks identified, in defence of the entity in all legal proceedings.
Risk management. Measurement and
information systems
The Regulation Division, belonging to the Legal
Advisory Area, is tasked with continuously
monitoring regulatory changes, handling regulatory
alerts and establishing positions in coordination
with the different areas. This coordination is carried
out through the Regulation Committee, which
reports to the Management Committee. This
committee is chaired by the Executive Head of
International Strategic Relations. Its members
include the Chief Executive, the General Secretary,
the Chief Risk Officer, the Chief Insurance and
Asset Management Officer, the Chief Business
Officer, the Head of Finance, the Head of Financial
Accounting, Control and Capital, the Head of Legal
Advisory, the Head of Private and Premier Banking
and the Corporate Banking Stakes Manager.
The Regulation Committee is responsible for
tracking the regulatory environment, analysing its
impacts, establishing strategic positions in
respect of impending or proposed laws or
regulations, and determining the main features of
the strategy to be followed in response to these
changes, including overseeing the defence of the
Entity's interests. The ultimate purpose is to stay
one step ahead of regulatory changes and make
the CaixaBank Group more flexible and ready to
adapt to new regulatory requirements.
In conjunction with the areas affected, Legal
Advisory prepares and coordinates regulatory
impact analyses of new approved and applicable
regulations by identifying and systematising new
regulatory requirements and their impact on
processes, documentation and internal rules. They
also promote and coordinate the process of drafting
and reviewing contracts, standards, and internal
procedures and policies that mainstream applicable
regulations into internal documentation.
The Corporate Legal Advisory, Business Legal
Advisory and Tax Advisory areas participate in
implementing the new regulations by determining
interpretation criteria and establishing
procedures to adequately manage regulatory
risks in respect of securities markets (e.g.
issuances of securities, rules of conduct),
transparency in banking and collective
investment schemes and data protection, among
others.
Information of Prudential Relevance 2016
154
The processes for implementing and adapting to
regulations regarding the marketing of financial
instruments, and banking, savings insurance and
investment products are submitted to the
Transparency Committee, as the most senior
decision-making body for all transparency-related
aspects of these products.
The Tax Advisory Department is responsible for
coordinating tax risk management systems in
compliance with applicable fiscal obligations, and
ensuring that these are continually aligned with
the regulatory and technology environment.
The Disputes Advisory Department is the last line
of defence for legal and regulatory risk. It is the
source of knowledge for issues involving
commercial practices and products, and the
interpretation, application and execution of the
regulations assigned to the jurisdictional function.
It provides regular information to various areas
and regularly certifies processes for legal risks.
Legal Advisory is also responsible for managing
official customer complaints channels (the
Customer Service Centre, Customer
Ombudsman, Bank of Spain and CNMV) and the
entity's position and arguments, unifying criteria
and fostering appropriate rectifications to the
benefit of the customer. It identifies and
promotes improvements in policies, procedures
and documentation by analysing complaints and,
in particular, reports issued by supervisory
complaints services.
Therefore, in addition to detailed analysis of the
regulation and its impact, this system also
ensures that the interpretation and application of
regulations is always based on criteria of
prudence. To this end, it meticulously monitors
developments in Spanish and EU case law, the
recommendations of supervisors and regulators
and, in the tax area, queries involving the
General Directorate of Tax (DGT, for the Spanish
acronym).
Based on the analysis carried out, controls are
established with a specific frequency and
organisation for execution and oversight by other
areas in the Entity, in particular, Regulatory
Compliance and/or Internal Control/Internal
Audit.
8.4.2. Compliance and conduct risk
Definition and general policy
In the context of operational risk, compliance risk
is defined as risk arising from deficient
procedures that generate actions or omissions
that are not in line with the legal or regulatory
frameworks or with the internal codes and rules,
and which could result in administrative
sanctions or reputation damage.
The CaixaBank Group’s objective is to minimise
the probability of occurrence of compliance risk
and, if it occurs, to detect, report and address the
weaknesses promptly.
The management of regulatory compliance risk is
not limited to any specific area, but rather the
entire Entity. All employees must ensure
compliance with prevailing regulations, applying
procedures that capture regulations in their
activity.
In order to manage compliance risk, management and governing bodies encourage the dissemination and promotion of the values and principles set out in the Code of Business Conduct and Ethics, and its members and other employees and Senior Management must ensure that they are compliant as a core criterion guiding their day-to-day activities. Therefore, as the first line of defence, the areas whose business is subject to compliance risk implement and manage a first level of indicators and controls to detect potential sources of risk and act effectively to mitigate them. As a second line of defence, the Regulatory Compliance Area reviews internal procedures to verify that they are up-to-date and, as appropriate, to identify situations of risk, in which case it calls upon the affected areas to develop and implement the improvement actions necessary.
8.4.3. Technological risk (IT)
Definition and general policy
Within the context of operational risk, and pursuant to EBA guidance for the Supervisory Review and Evaluation Process (SREP), IT risk is defined as:
Risks of losses due to hardware or software inadequacies or failures in technical infrastructure that could compromise the availability, integrity, accessibility and security of the infrastructures and data.
Information of Prudential Relevance 2016
155
IT risk is broken down into 5 categories:
ICT availability and continuity risk.
ICT security risk.
Risk of changes in ICT.
Data integrity risk in ICT.
Outsourcing risk in ICT.
CaixaBank's Resources Governance defines the measurement of IT risk through a level 2 RAF (Risk Appetite Framework) indicator.
This indicator is calculated from the individual indicators by the heads of:
IT Governance; and
Information Security; and
Technology Contingency.
Resources Governance reports all of the individual indicators, and the resulting RAF level 2 indicator, to Operational Risk (ROP) on a monthly basis in a specific report.
The individual indicators and their alignment with the categories we have mentioned are set out below, with the group responsible for their measurement:
% compliance in technological contingency simulations
% effectiveness of defence against cyber-attacks
Indication of maintenance of ISO27001 certification
% availability of channels
Components transferred in critical period
Components transferred > 5 times
Quality of suppliers
Manual intervention in the systems during critical period
Controls applied Resources Governance carries out regular reviews of a sample of indicators. This review verifies the quality of the information and validates the methodology used in creating the indicators reviewed.
Tools used Having assessed various options for risk management, Resources Governance decided to use the available IT tools. These tools make it
simple to run a model to collect, assess, compare and store data for the indicators being managed.
Additional information CaixaBank has also put in place a range of governance frameworks, designed according to leading international standards, for:
Business continuity, designed and developed under the ISO22301 standard;
Technological contingency, designed and developed under the ISO 27031 standard;
IT governance, designed and developed under the ISO 38500 standard; and
Information security, designed and developed under the ISO 27001 standard.
These governance models respond to regulatory, operational and business requirements, ensuring the implementation of best practices in their respective fields
8.4.4. Operating processes and external events
Definition and general policy
Within the context of operational risk, this is
defined as the risk of losses or damage caused
by operational errors in processes related to the
Bank’s activity, due to external events beyond
the Bank’s control, or due to third parties outside
the Bank, both accidentally and fraudulently.
The CaixaBank Group seeks to manage operational risk homogeneously and consistently across all the companies within its scope as a financial conglomerate. It achieves this by promoting consistency in the tools, measurements and reporting used, ensuring the existence of full and comparable information for operational risk decisions. It also promotes the use of advanced measurement and management models for each sector of activity; these are implemented consistently with the degree of development and maturity in each sector.
The CaixaBank Group manages the operational risk within its scope of financial solvency in accordance with best practices in the market, for which it has put in place the necessary tools, policies and structures.
Structure and organisation of management
All of the Group's areas and companies are responsible for the operational risks that arise from operating processes and external events within their respective remits.
Information of Prudential Relevance 2016
156
This implies identifying, assessing, managing, controlling and reporting the operational risks of their activity and helping CaixaBank's Operational Risk Division to implement the management model.
8.4.5. Risk associated with financial reporting reliability
This is the risk of damage, whether financial or other, stemming from possible deficiencies in the accuracy, integrity and criteria of the processes used in preparing the data necessary to evaluate the financial and equity situation of the CaixaBank Group.
This risk is managed using the 3 lines of defence model. The Internal Control over Financial Planning Models and Internal Audit functions exercise the second and third lines of defence, respectively, ensuring the quality of the information reported internally and to supervisors and the market
For more information on the control environment, refer to the internal control section in chapter 4. Risk Governance, Organisation and Management.
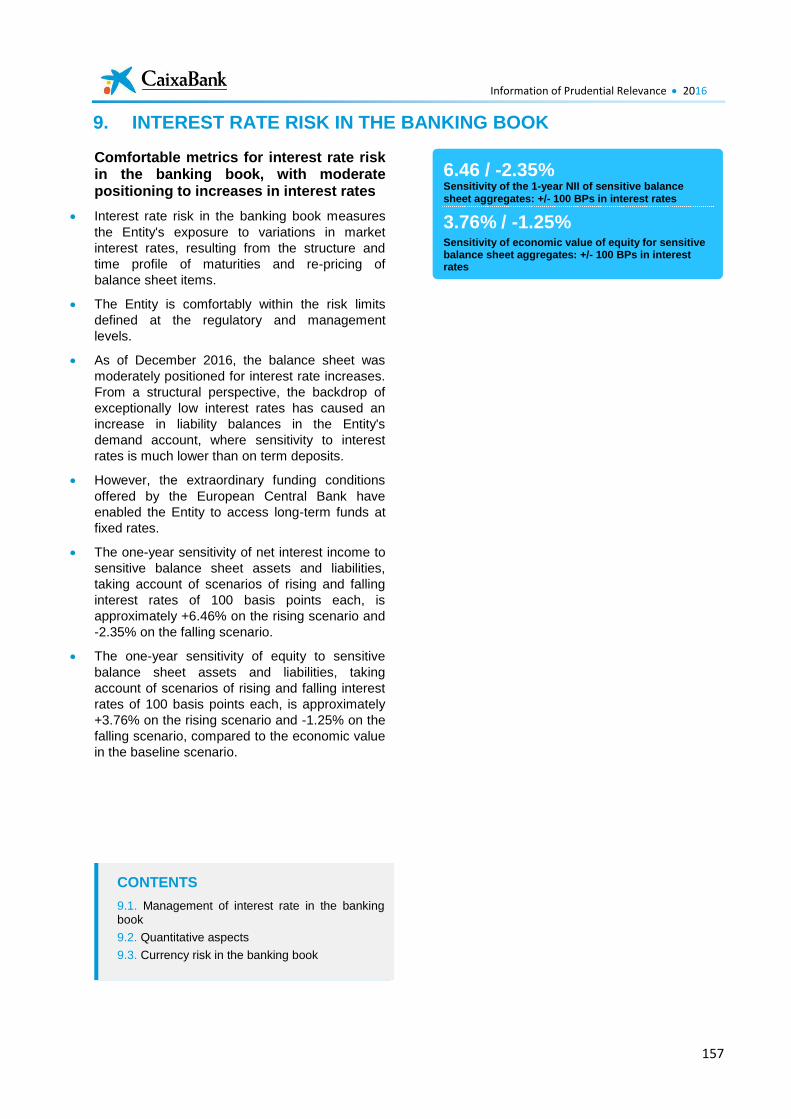
Information of Prudential Relevance 2016
157
9. INTEREST RATE RISK IN THE BANKING BOOK
Comfortable metrics for interest rate risk in the banking book, with moderate positioning to increases in interest rates
Interest rate risk in the banking book measures
the Entity's exposure to variations in market
interest rates, resulting from the structure and
time profile of maturities and re-pricing of
balance sheet items.
The Entity is comfortably within the risk limits
defined at the regulatory and management
levels.
As of December 2016, the balance sheet was
moderately positioned for interest rate increases.
From a structural perspective, the backdrop of
exceptionally low interest rates has caused an
increase in liability balances in the Entity's
demand account, where sensitivity to interest
rates is much lower than on term deposits.
However, the extraordinary funding conditions
offered by the European Central Bank have
enabled the Entity to access long-term funds at
fixed rates.
The one-year sensitivity of net interest income to
sensitive balance sheet assets and liabilities,
taking account of scenarios of rising and falling
interest rates of 100 basis points each, is
approximately +6.46% on the rising scenario and
-2.35% on the falling scenario.
The one-year sensitivity of equity to sensitive
balance sheet assets and liabilities, taking
account of scenarios of rising and falling interest
rates of 100 basis points each, is approximately
+3.76% on the rising scenario and -1.25% on the
falling scenario, compared to the economic value
in the baseline scenario.
6.46 / -2.35% Sensitivity of the 1-year NII of sensitive balance sheet aggregates: +/- 100 BPs in interest rates
3.76% / -1.25%
Sensitivity of economic value of equity for sensitive balance sheet aggregates: +/- 100 BPs in interest rates
CONTENTS
9.1. Management of interest rate in the banking book
9.2. Quantitative aspects
9.3. Currency risk in the banking book
Information of Prudential Relevance 2016
158
9.1. Management of interest rate in the banking book
Definition and general policy
Interest rate risk is inherent to all banking activity.
It arises from the impact - potentially negative -
that changes in market interest rates might have
on the net interest income and economic value of
an entity's balance sheet. As balance sheet
assets and liabilities are linked to different
benchmark indices, and have differing maturities,
they may be contracted (in the case of new
production) or renewed at interest rates different
to those currently prevailing, affecting their fair
value and resulting net interest income.
CaixaBank manages interest rate risk with a
twofold purpose:
To optimise the entity's net interest income
within the risk appetite limits established.
To keep the economic value of the balance
sheet consistent with the risk appetite at all
times.
In pursuit of its operating objectives, CaixaBank
has established certain thresholds applicable to
both the volatility of net interest income and the
sensitivity of balance sheet economic value.
The thresholds described form part of
CaixaBank's risk appetite framework (“RAF”). The
Risk Appetite Framework is a comprehensive tool
used to define, at the highest governance level,
the overall amount and type of risk it is willing to
assume to achieve its strategic targets.
For the limits on net interest income, based on
stressed interest rate scenarios for increases and
decreases in interest rates, net interest income is
projected and compared to the net interest
income obtained in the baseline scenario of
implied market rates.
The scenarios for parallel increases and
decreases in interest rates apply different
values (200 bp and 100 bp), and gradual and
immediate impact.
In 2016, 8 additional stress scenarios were
established with non-parallel movements in
the interest rate curve, including considering
the possibility of negative interest rates.
These scenarios have been used to set a
limit on variations in net interest income over
1 year, in the worst resulting scenario.
Net interest income subject to volatility limits
refers to both 1-year and 2-year net interest
income.
There are three metrics for limits on economic
value:
A limit on total balance sheet sensitivity to the
stress of a 200 bp increase and decrease in
interest rates. The limit is established as a
percentage loss.
In 2016, 8 additional stress scenarios were
established with non-parallel movements in
the interest rate curve, including considering
the possibility of negative interest rates.
These scenarios have been used to set a
limit on variations in economic value in the
worst resulting scenario.
There is also a limit on the VaR of the
sensitive balance sheet (measured in terms
of economic capital), which must be below a
specified % of potential loss.
Information of Prudential Relevance 2016
159
Structure and organisation of the risk management function
The Board of Directors is responsible for
approving the general risk control and
management policy, and for regular oversight of
internal monitoring and control systems. The
Board of Directors is the Bank’s highest risk
policy-setting body.
The Board of Directors has allocated to the
Risks Committee the functions related to the
ongoing monitoring of risk management. The
Asset and Liability Committee (ALCO) is in
charge of managing, monitoring and controlling
interest rate risk in the banking book. To this
end, it carries out monthly monitoring of
compliance with the risk appetite framework
(RAF), from the twin perspectives of net interest
income and economic value. The Global Risk
Committee (GRC), which reports to the Risk
Committee, is responsible for controlling and
monitoring interest-rate risk limits and indicators,
but is not involved in their management.
The ALM (Asset and Liability Management) and
Finance Division, which reports to CaixaBank's
Executive Finance Division, is responsible for
management of interest rate risk in the banking
book, within the constraints imposed by
management and regulatory limits.
The Balance Sheet Analysis and Monitoring
Division, which reports to the Executive Finance
Division, oversees modelling, analysis and
monitoring of interest rate risk, and maintenance
of the databases and forecasting tools needed to
carry out such measurements. It also proposes
and implements the methodologies and
improvements required for its functions.
This risk is analysed considering a wide range of
stress scenarios, including the potential impact
of all possible sources of interest rate risk in the
banking book, i.e. pricing risk, curve risk, basis
risk and optionality risk. Optionality risk
considers automatic optionality related to the
behaviour of interest rates and the optionality of
customer behaviour, which is dependent on a
range of other factors, in addition to interest
rates.
In performance of its functions, the Balance
Sheet Analysis and Monitoring Division reports
on the development of risks and factors affecting
their evolution. In addition to the ALCO
committee, it also reports to internal supervision
functions (the 2nd and 3rd lines of defence, Risk
in Market Operations Department and Internal
Audit, respectively), with which it maintains on-
going dialogue to ensure that risk is measured
correctly and that adequate operating processes
are maintained.
Risk management. Measurement and
information systems
The entity applies best practices in the market
and the recommendations of regulators in
measuring interest rate risk. It sets risk thresholds
based on these metrics and considering the
complexity of its balance sheet. It uses both static
and dynamic measurements:
Static measurements: Static measurements are
not designed based on assumptions of new
business and refer to a specific point in time.
Static gap:
The static GAP shows the contractual distribution
of maturities and interest rate reviews for
applicable balance sheet and/or off-balance
aggregates at a particular date. GAP analysis is
based on comparison of the values of the assets
and liabilities reviewed or that mature in a
particular period.
Balance Sheet Economic Value:
The economic value (EV) of the balance sheet is
calculated as the sum of: i) the fair values of net
interest-rate sensitive assets and liabilities on the
balance sheet; ii) the fair value of off-balance
sheet products (derivatives); and iii) the net
carrying amounts of non-interest-rate sensitive
asset and liability items.
Economic Value Sensitivity:
The economic value of sensitive balances on-
and off- the balance sheet is reassessed under
the various stress scenarios considered by the
entity. The difference between this value and the
economic value calculated at current market
rates gives us a numeric representation of the
sensitivity of economic value to the various
scenarios.
The entity then uses this sensitivity measurement
to define operating thresholds for economic value
for particular interest rate scenarios.
Information of Prudential Relevance 2016
160
Balance sheet VaR:
Balance sheet VaR is the maximum amount that
could be lost from the balance sheet in a
particular period, applying market prices at a
given confidence interval. CaixaBank uses a 1-
day horizon and 99% confidence interval in its
measurement of balance sheet VaR. This means
that, statistically, the entity's balance sheet might
lose more than the calculated VaR on only 1 day
in every 100.
CaixaBank uses the treasury activity
methodology for calculating balance sheet
VaR. In practice, this means it carries out 3
VaR calculations.
1. Parametric VaR with a 75 day data
window for estimating the parameters;
2. Parametric VaR with a 250 day data
window for estimating the parameters;
3. Historical VaR over a 250 day period,
assuming that what occurred to the value
of the balance sheet over the last 250
days is a good guide for estimating what
might happen between today and
tomorrow.
Applying the principle of prudence, the highest
of these three values is then used as the
balance sheet VaR.
The entity then uses this VaR measurement to
define management thresholds for its
economic value.
Dynamic measurements: These are based on
the current position and also take new business
into account. Therefore, in addition to considering
the current on- and off-balance-sheet positions,
growth forecasts from the Entity's operating plan
are included.
Net interest income projections:
The entity projects future net interest income (1,
2 and 3 years ahead) under various interest rate
scenarios using current market curves. The
objective is to project net interest income based
on current market curves, the outlook for the
business and wholesale issuances and portfolio
purchases and sales, and to predict how it will
vary under stressed interest rates scenarios.
The interest rate scenarios used are parallel and
immediate, parallel and progressive, and
immediate changes of slope (Steepening or
Flattening, Short Up, Short Down, Long Up and
Long Down).
Forecasts of net interest income depend on
assumptions and events other than just the
future interest rate curve: they also consider
factors such as customer behaviour (early
cancellation of loans and early redemption of
fixed-term deposits), the maturity of demand
accounts and the future performance of the
entity's business.
Net interest income volatility:
We use a range of interest rate scenarios to
forecast net interest income. We apply
movements in the curve (parallel and not
parallel, instantaneous and gradual) to the
baseline interest rate scenario to produce
different projections for net interest income,
which we then compare.
The difference between these net interest
income figures (the differences resulting from
an increase or decrease compared to the
baseline scenario) compared to the baseline
scenario give us a measure of the sensitivity,
or volatility, of net interest income.
With regard to measurement tools and systems, information is obtained at the transaction level of the Entity’s sensitive balance sheet transactions from each computer application used to manage the various products. This information is used to produce databases with a certain amount of aggregation in order to speed up the calculations without impairing the quality or reliability of the information.
The assets and liabilities management application is parameterised in order to include the financial characteristics of products on the balance sheet. Growth data budgeted in the financial plan (volumes, products and margins) and information on the various market scenarios (interest and exchange rate curves) is also fed into this tool, in order to perform a reasonable estimate of the risks involved. This tool measures static gaps and net interest income projections.
There are a number of key assumptions related to management of interest rate risk in the banking book. The assumptions of early termination of asset and liability products are obtained using internal models based on past experience, employing the behavioural variables of customers, variables concerning the products themselves, seasonality and macroeconomic variables. In the case of items with no contract maturity, measurements are performed of their sensitivity to interest rates, along with the expected maturity date, considering the possibility that the customer may terminate products early, based on past experience.
Information of Prudential Relevance 2016
161
The treatment of demand accounts is based on
the study of customers performed by the Entity
and past experience to adapt the indefinite
maturity of balances to a specific maturity. Two
criteria are used to this end (modification of the
interest rate and the level of permanence of the
balances), with constant consideration of the
principle of prudence for the purposes of
modelling.
Hedging policies and mitigation
techniques
At 31 December 2016, CaixaBank was using fair value macro-hedges as a strategy to mitigate its exposure to interest-rate risk and to preserve the economic value of its balance sheet. In 2016, CaixaBank arranged hedges for new fixed-rate loans and purchases of the long-term fixed income portfolio.
9.2. Quantitative aspects
Interest rate risk in the banking book is subject to
specific control and includes various risk
measures, such as analysis of the sensitivity of
net interest income and the present value of
future cash flows to different interest rate
scenarios, including scenarios of negative
interest rates and Value at Risk (VaR)
measurements.
The sensitivity of net interest income shows the
impact on the review of balance sheet
transactions caused by changes in the interest
rate curve. This sensitivity is determined by
comparing a net interest income simulation, at
one or two years, on the basis of various interest
rate scenarios (immediate parallel and
progressive movements of different intensities,
as well as changes in slope). The most likely
scenario, which is obtained using the implicit
market rates, is compared with other scenarios of
rising or falling interest rates and parallel and
non-parallel movements in the slope of the curve.
The one-year sensitivity of net interest income to
sensitive balance sheet assets and liabilities,
taking account of scenarios of rising and falling
interest rates of 100 basis points each, is
approximately 6.46% on the rising scenario and -
2.35% on the falling scenario.
The sensitivity of equity to interest rates measures the effect of interest rate fluctuations on economic value. The one-year sensitivity of equity to sensitive balance sheet assets and liabilities, taking account of scenarios of rising and falling interest rates of 100 basis points each (not considering negative interest rates) is
approximately +3.76% on the rising scenario and -1.25% on the falling scenario, compared to the economic value in the baseline scenario.
The sensitivities of net interest income and equity
are measurements that complement each other
and provide an overview of structural risk, which
focuses more on the short and medium term, in
the case of net interest income, and on the
medium and long term in the case of equity. As a
supplement to these measurements of
sensitivity, VaR measures are applied in
accordance with treasury-specific methodology.
In accordance with current regulations, the
CaixaBank Group does not use own funds for the
interest rate risk in the banking book undertaken,
in view of the low risk profile of its balance sheet.
The balance sheet interest rate risk assumed by
the CaixaBank Group is substantially below
levels considered significant (outliers) under
current regulations.
CaixaBank continues to carry out a series of
actions designed to strengthen the monitoring
and management of balance sheet interest rate
risk.
9.3. Currency risk in the banking book
The Executive Finance Division is responsible for
managing the foreign currency risk arising from
balance sheet positions denominated in foreign
currency, a task performed through the market
risk hedging activity undertaken by the Treasury
Area. This risk is managed by applying the
principle of minimising the assumed currency
risks, which explains why the exposure of the
CaixaBank Group to this risk is low or virtually nil.
Also as a result of the active management of
currency risk by the Treasury Area, the remaining
minor foreign currency positions are primarily
held with credit institutions in major currencies
(e.g. US dollar, pound sterling or Swiss franc),
quantified by employing common methodologies
in conjunction with the risk measurements
implemented for treasury activities as a whole.
As of 31 December 2016, the CaixaBank Group
held very small positions in foreign currencies
and there were no capital requirements for such
positions (as they fell below the regulatory
threshold).
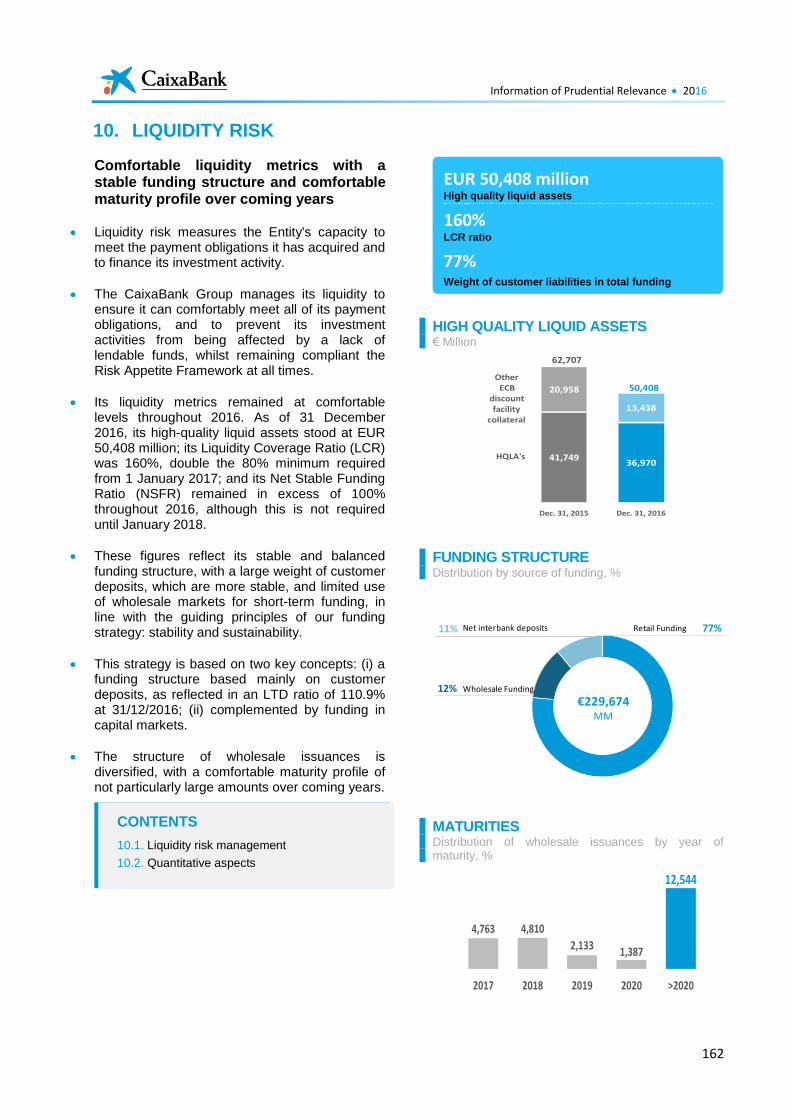
Information of Prudential Relevance 2016
162
10. LIQUIDITY RISK
Comfortable liquidity metrics with a stable funding structure and comfortable maturity profile over coming years
Liquidity risk measures the Entity's capacity to meet the payment obligations it has acquired and to finance its investment activity.
The CaixaBank Group manages its liquidity to ensure it can comfortably meet all of its payment obligations, and to prevent its investment activities from being affected by a lack of lendable funds, whilst remaining compliant the Risk Appetite Framework at all times.
Its liquidity metrics remained at comfortable levels throughout 2016. As of 31 December 2016, its high-quality liquid assets stood at EUR 50,408 million; its Liquidity Coverage Ratio (LCR) was 160%, double the 80% minimum required from 1 January 2017; and its Net Stable Funding Ratio (NSFR) remained in excess of 100% throughout 2016, although this is not required until January 2018.
These figures reflect its stable and balanced funding structure, with a large weight of customer deposits, which are more stable, and limited use of wholesale markets for short-term funding, in line with the guiding principles of our funding strategy: stability and sustainability.
This strategy is based on two key concepts: (i) a funding structure based mainly on customer deposits, as reflected in an LTD ratio of 110.9% at 31/12/2016; (ii) complemented by funding in capital markets.
The structure of wholesale issuances is diversified, with a comfortable maturity profile of not particularly large amounts over coming years.
HIGH QUALITY LIQUID ASSETS € Million
FUNDING STRUCTURE Distribution by source of funding, %
MATURITIES Distribution of wholesale issuances by year of maturity, %
41,749 36,970
20,958
13,438
62,707
50,408
Dec. 31, 2015 Dec. 31, 2016
Other ECB
discountfacility
collateral
HQLA's
77%
12%
11%
Wholesale Funding
Retail FundingNet interbank deposits
€229,674MM
4,763 4,810
2,1331,387
12,544
2017 2018 2019 2020 >2020
EUR 50,408 million High quality liquid assets
160% LCR ratio
77%
Weight of customer liabilities in total funding
CONTENTS
10.1. Liquidity risk management
10.2. Quantitative aspects
Information of Prudential Relevance 2016
163
10.1. Liquidity risk management
Definition and general policy
CaixaBank manages liquidity to maintain
sufficient levels so that it can comfortably meet
all its payment obligations on time and to prevent
its investment activities from being affected by a
lack of lendable funds, at all times within the Risk
Appetite Framework (RAF).
Formalising and updating the Risk Appetite
Framework (RAF) presented to the governing
bodies delimits the liquidity risk metrics defined
for CaixaBank, validating that they are
commensurate with the established risk
tolerance levels. The risk strategy and appetite
for liquidity and financing are set out through:
a) Identification of significant liquidity risks for
the institution;
b) The formulation of the strategic principles the
Group must observe in managing each of
these risks;
c) The definition of significant metrics for each
risk;
d) Setting appetite, alert, tolerance and, as the
case may be, stress levels within the Risk
Appetite Framework (RAF);
e) Establishing management and control
procedures for each of the risks, including
mechanisms of systematic internal and
external reporting;
f) Defining a stress testing framework and a
Liquidity Contingency Plan to ensure that
liquidity risk is managed accordingly in
situations of moderate and serious crisis;
g) And a Recovery Planning framework, in which
scenarios and measures are devised for
stress conditions.
The liquidity strategy can be summarised as:
a) General liquidity strategy: maintenance of
liquidity levels within the Risk Appetite
Framework to ensure payment obligations
can be met comfortably on time, without
harming investment activity owing to a lack of
lendable funds.
b) Specific strategy. specific strategies have
been put in place for:
Management of intraday liquidity risk
Management of short-term liquidity risk
Management of funding sources
Management of liquid assets
Management of collateralised assets
c) The strategy for managing liquidity risk in
crisis situations has three objectives:
Early detection of a possible liquidity
crisis;
Minimisation of negative impact on the
initial liquidity position in a crisis
situation
Liquidity management focused on
overcoming potential liquidity crises
Two groups of risk appetite indicators have been
established, namely: five level 11 indicators
relating to short-term liquidity (position and LCR -
Liquidity Coverage Ratio), the long-term funding
structure (retail and wholesale) and the cost of
wholesale funds; and seven level 22 indicators
relating to short-term liquidity (position), balance
sheet structure with NSFR ratio, concentration of
wholesale maturities, and concentration of
liability counterparties, intraday liquidity and
asset encumbrance.
A stress metric was incorporated in 2016 to
ensure the integration of stress exercises into the
risk appetite and management. This stress metric
is based on a new stress model that has been
developed to implement best practices (draft
EBA document on stress) and new requirements
(the EBA's final ILAAP guidance)
To achieve the liquidity management objectives
it:
Has a centralised liquidity management
system that includes a segregation of duties
to ensure optimum control and monitoring of
risks.
Maintains an efficient level of liquid funds to
meet obligations assumed, fund business
plans and comply with regulatory
requirements.
Actively manages liquidity through
continuous monitoring of liquid assets and
the balance sheet structure.
Considers sustainability and stability as core
principles of its funding sources strategy,
based on:
A funding structure mainly consisting of
customer deposits.
Capital market funding complements
the funding requirements.
1 Established by the Board of Directors and reported to it regularly.
2 Limits delegated by the Board of Directors to Management for
monitoring, management and control.
Information of Prudential Relevance 2016
164
Structure and organisation of the risk management function
The Board of Directors is responsible for
approving the general risk control and
management policy, and for the periodic
monitoring of internal information and control
systems. The Board of Directors is the Bank’s
highest risk policy-setting body.
The Board of Directors has allocated to the
Risks Committee the functions related to the
ongoing monitoring of risk management. The
ALCO is in charge of managing, monitoring and
controlling liquidity risk. To do so, it monitors, on
a monthly basis, compliance with the Risk
Appetite Framework (RAF), the Entity's long-
term funding plan, trends in liquidity, expected
gaps in the balance sheet structure, and
indicators and alerts to anticipate a liquidity crisis
so that it can take corrective measures in
accordance with the Liquidity Contingency Plan.
It also analyses the potential liquidity levels
under each of the hypothetical crisis scenarios.
The ALM (Asset and Liability Management) and
Financing Division, which reports to CaixaBank's
Executive Finance Division, is responsible for
analysing and managing liquidity risk, ensuring
that liquid assets are permanently available in
the balance sheet, i.e. minimising liquidity risk in
the banking book under the guidelines
established by the ALCO. The Balance Sheet
Analysis and Monitoring Division, which reports
to the Executive Finance Division, oversees the
analysis and monitoring of liquidity risk. The
analysis is performed under both normal and
business-as-usual market situations and under
stress situations.
On the basis of these analyses, a Contingency
Plan has been drawn up and approved by the
Board of Directors, defining an action plan for
each of the crisis scenarios (systemic, specific
and combined), setting out the measures to be
taken on the commercial, institutional and
disclosure level to deal with such situations,
including the possibility of using a number of
stand-by reserves or extraordinary sources of
finance.
In addition, a Recovery Plan has been drawn up
and approved by the Board of Directors. This
includes an action plan to respond to a more
severe stress situation than that would trigger the
Contingency Plan.
Available liquid assets are under the operational
control of the liquidity management function,
which is the responsibility of the ALM area.
These include the liquid assets that ALM
manages as part of its responsibility for
managing balance sheet portfolios, and those
managed by "Markets", which oversees
investment in fixed-income portfolios arising from
market making and trading activities.
In the event of a situation of stress, the liquid
asset buffer will be managed with the sole
objective of minimising liquidity risk.
The ALM and Markets units report hierarchically
to the Executive Financial Division.
Risk management. Measurement and information systems
Liquidity risk is measured, monitored and
controlled through static measurement of the
liquidity position, dynamic measurements of
liquidity projections and stress exercises for
liquidity under different scenarios. In addition,
static and dynamic comparisons of the funding
structure are performed and regulatory ratios are
calculated (LCR, NSFR and Encumbered Assets)
Static measurements of liquidity are made on a
daily basis, including certain Risk Appetite
Framework (RAF) metrics. Monthly liquidity
projections are carried out, including the most
relevant Risk Appetite Framework metrics,
together with two stress exercises (internal
approach and LCR-based model). Annual
liquidity exercises are carried out for the
Recovery Plan and Capital Adequacy
Assessment Process (ICAAP).
An Internal Liquidity Adequacy Assessment
Process (ILAAP) is carried out every year. This
includes a review of the management framework
for funding and liquidity risk, in accordance with
the requirement received from the supervisor. In
addition, the Board of Directors makes a
declaration about the adequacy of liquidity buffers
for existing funding and liquidity risks.
Hedging policies and mitigation techniques
Liquidity risk is mitigated with positions in liquid
assets that can be used at the time of the
contingency or liquidity risk and with available
lines of finance.
Management strategies have been defined at the
liquid asset level that highlights the existence of
sufficient liquidity reserves. These include:
discounting capacity with central banks for use in
adverse situations; continuous monitoring of
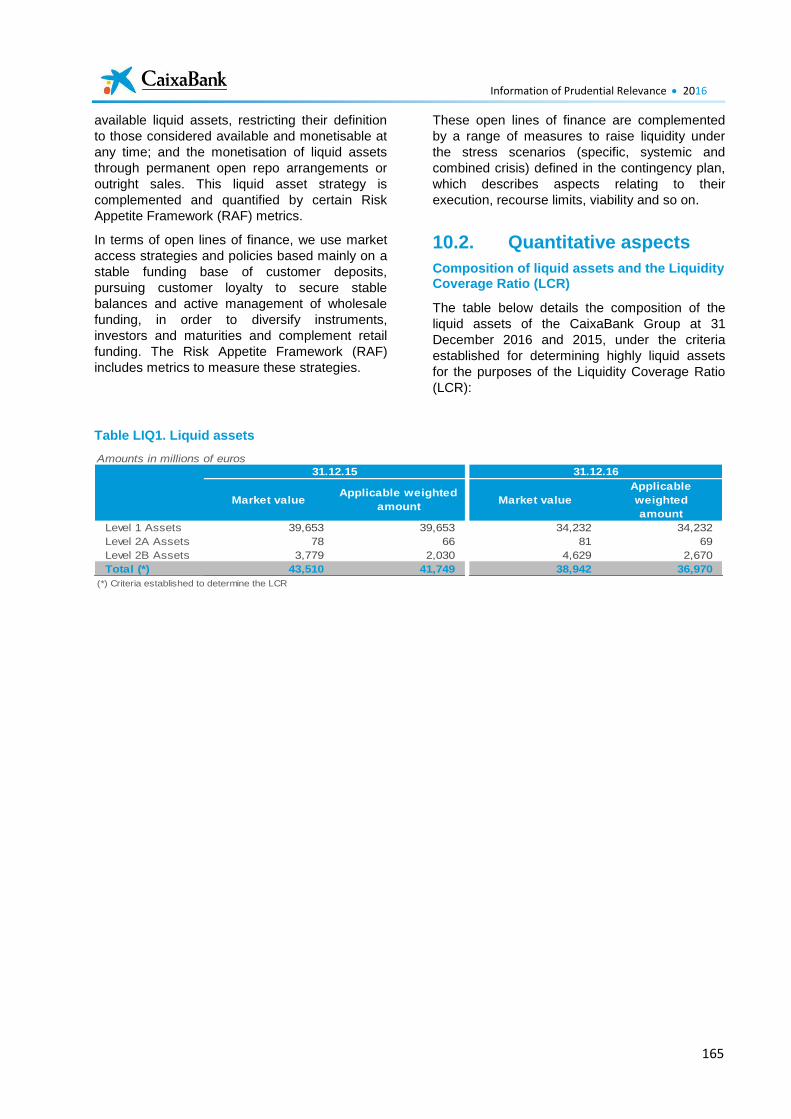
Information of Prudential Relevance 2016
165
available liquid assets, restricting their definition
to those considered available and monetisable at
any time; and the monetisation of liquid assets
through permanent open repo arrangements or
outright sales. This liquid asset strategy is
complemented and quantified by certain Risk
Appetite Framework (RAF) metrics.
In terms of open lines of finance, we use market
access strategies and policies based mainly on a
stable funding base of customer deposits,
pursuing customer loyalty to secure stable
balances and active management of wholesale
funding, in order to diversify instruments,
investors and maturities and complement retail
funding. The Risk Appetite Framework (RAF)
includes metrics to measure these strategies.
These open lines of finance are complemented
by a range of measures to raise liquidity under
the stress scenarios (specific, systemic and
combined crisis) defined in the contingency plan,
which describes aspects relating to their
execution, recourse limits, viability and so on.
10.2. Quantitative aspects
Composition of liquid assets and the Liquidity Coverage Ratio (LCR)
The table below details the composition of the
liquid assets of the CaixaBank Group at 31
December 2016 and 2015, under the criteria
established for determining highly liquid assets
for the purposes of the Liquidity Coverage Ratio
(LCR):
Table LIQ1. Liquid assets
Amounts in millions of euros
Market valueApplicable weighted
amountMarket value
Applicable
weighted
amount
Level 1 Assets 39,653 39,653 34,232 34,232
Level 2A Assets 78 66 81 69
Level 2B Assets 3,779 2,030 4,629 2,670
Total (*) 43,510 41,749 38,942 36,970
31.12.15 31.12.16
(*) Criteria established to determine the LCR
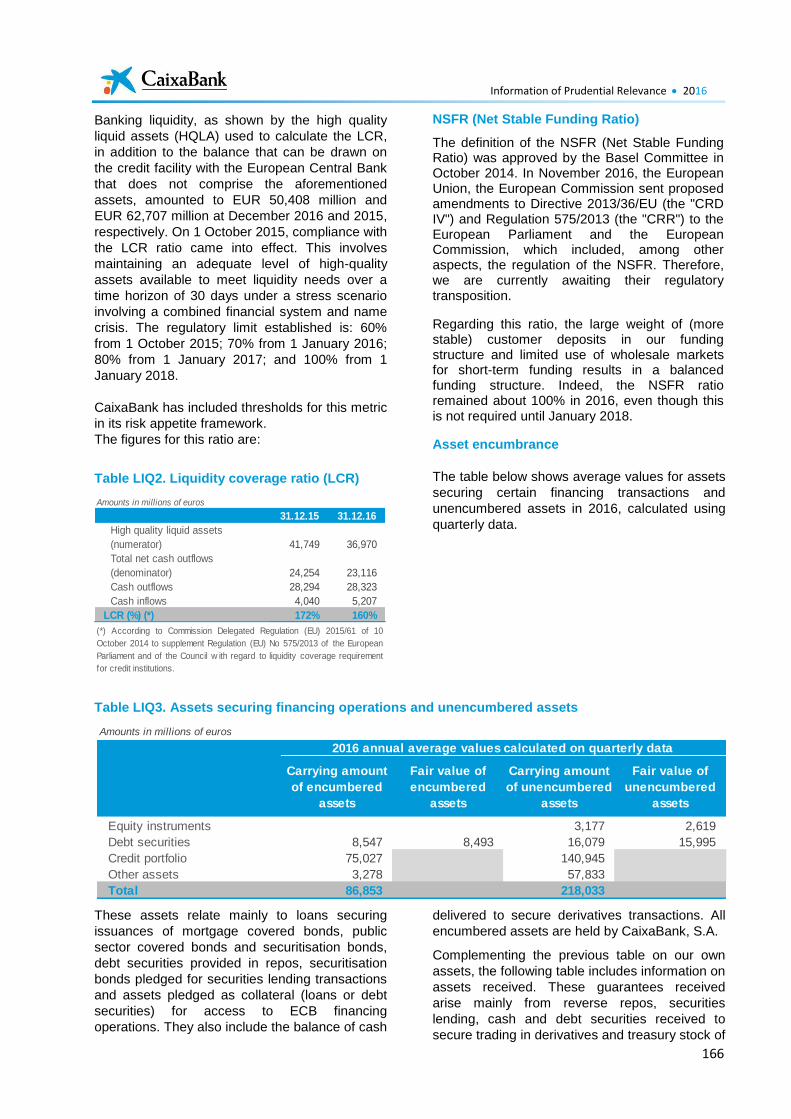
Information of Prudential Relevance 2016
166
Banking liquidity, as shown by the high quality
liquid assets (HQLA) used to calculate the LCR,
in addition to the balance that can be drawn on
the credit facility with the European Central Bank
that does not comprise the aforementioned
assets, amounted to EUR 50,408 million and
EUR 62,707 million at December 2016 and 2015,
respectively. On 1 October 2015, compliance with
the LCR ratio came into effect. This involves
maintaining an adequate level of high-quality
assets available to meet liquidity needs over a
time horizon of 30 days under a stress scenario
involving a combined financial system and name
crisis. The regulatory limit established is: 60%
from 1 October 2015; 70% from 1 January 2016;
80% from 1 January 2017; and 100% from 1
January 2018.
CaixaBank has included thresholds for this metric
in its risk appetite framework.
The figures for this ratio are:
Table LIQ2. Liquidity coverage ratio (LCR)
NSFR (Net Stable Funding Ratio)
The definition of the NSFR (Net Stable Funding Ratio) was approved by the Basel Committee in October 2014. In November 2016, the European Union, the European Commission sent proposed amendments to Directive 2013/36/EU (the "CRD IV") and Regulation 575/2013 (the "CRR") to the European Parliament and the European Commission, which included, among other aspects, the regulation of the NSFR. Therefore, we are currently awaiting their regulatory transposition.
Regarding this ratio, the large weight of (more stable) customer deposits in our funding structure and limited use of wholesale markets for short-term funding results in a balanced funding structure. Indeed, the NSFR ratio remained about 100% in 2016, even though this is not required until January 2018.
Asset encumbrance
The table below shows average values for assets
securing certain financing transactions and
unencumbered assets in 2016, calculated using
quarterly data.
Table LIQ3. Assets securing financing operations and unencumbered assets
These assets relate mainly to loans securing
issuances of mortgage covered bonds, public
sector covered bonds and securitisation bonds,
debt securities provided in repos, securitisation
bonds pledged for securities lending transactions
and assets pledged as collateral (loans or debt
securities) for access to ECB financing
operations. They also include the balance of cash
delivered to secure derivatives transactions. All
encumbered assets are held by CaixaBank, S.A.
Complementing the previous table on our own
assets, the following table includes information on
assets received. These guarantees received
arise mainly from reverse repos, securities
lending, cash and debt securities received to
secure trading in derivatives and treasury stock of
Amounts in millions of euros
31.12.15 31.12.16
High quality liquid assets
(numerator) 41,749 36,970
Total net cash outflows
(denominator) 24,254 23,116
Cash outflows 28,294 28,323
Cash inflows 4,040 5,207
LCR (%) (*) 172% 160%
(*) According to Commission Delegated Regulation (EU) 2015/61 of 10
October 2014 to supplement Regulation (EU) No 575/2013 of the European
Parliament and of the Council w ith regard to liquidity coverage requirement
for credit institutions.
Amounts in millions of euros
Carrying amount
of encumbered
assets
Fair value of
encumbered
assets
Carrying amount
of unencumbered
assets
Fair value of
unencumbered
assets
Equity instruments 3,177 2,619
Debt securities 8,547 8,493 16,079 15,995
Credit portfolio 75,027 140,945
Other assets 3,278 57,833
Total 86,853 218,033
2016 annual average values calculated on quarterly data
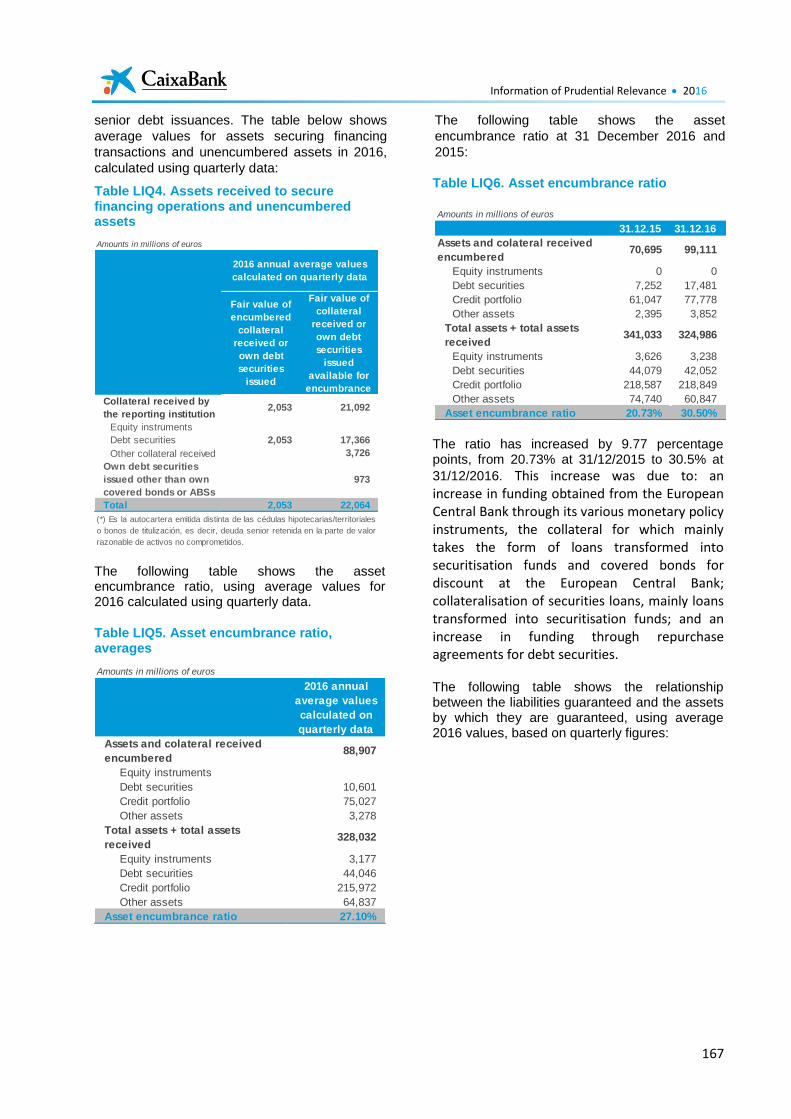
Information of Prudential Relevance 2016
167
senior debt issuances. The table below shows
average values for assets securing financing
transactions and unencumbered assets in 2016,
calculated using quarterly data:
Table LIQ4. Assets received to secure financing operations and unencumbered assets
The following table shows the asset encumbrance ratio, using average values for 2016 calculated using quarterly data.
Table LIQ5. Asset encumbrance ratio, averages
The following table shows the asset
encumbrance ratio at 31 December 2016 and
2015:
Table LIQ6. Asset encumbrance ratio
The ratio has increased by 9.77 percentage points, from 20.73% at 31/12/2015 to 30.5% at
31/12/2016. This increase was due to: an increase in funding obtained from the European Central Bank through its various monetary policy instruments, the collateral for which mainly takes the form of loans transformed into securitisation funds and covered bonds for discount at the European Central Bank; collateralisation of securities loans, mainly loans transformed into securitisation funds; and an increase in funding through repurchase agreements for debt securities.
The following table shows the relationship between the liabilities guaranteed and the assets by which they are guaranteed, using average 2016 values, based on quarterly figures:
Amounts in millions of euros
Fair value of
encumbered
collateral
received or
own debt
securities
issued
Fair value of
collateral
received or
own debt
securities
issued
available for
encumbrance
Collateral received by
the reporting institution2,053 21,092
Equity instruments
Debt securities 2,053 17,366
Other collateral received 3,726
Own debt securities
issued other than own
covered bonds or ABSs
973
Total 2,053 22,064
2016 annual average values
calculated on quarterly data
(*) Es la autocartera emitida distinta de las cédulas hipotecarias/territoriales
o bonos de titulización, es decir, deuda senior retenida en la parte de valor
razonable de activos no comprometidos.
Amounts in millions of euros
2016 annual
average values
calculated on
quarterly data
Assets and colateral received
encumbered88,907
Equity instruments
Debt securities 10,601
Credit portfolio 75,027
Other assets 3,278
Total assets + total assets
received328,032
Equity instruments 3,177
Debt securities 44,046
Credit portfolio 215,972
Other assets 64,837
Asset encumbrance ratio 27.10%
Amounts in millions of euros
31.12.15 31.12.16
Assets and colateral received
encumbered70,695 99,111
Equity instruments 0 0
Debt securities 7,252 17,481
Credit portfolio 61,047 77,778
Other assets 2,395 3,852
Total assets + total assets
received341,033 324,986
Equity instruments 3,626 3,238
Debt securities 44,079 42,052
Credit portfolio 218,587 218,849
Other assets 74,740 60,847
Asset encumbrance ratio 20.73% 30.50%
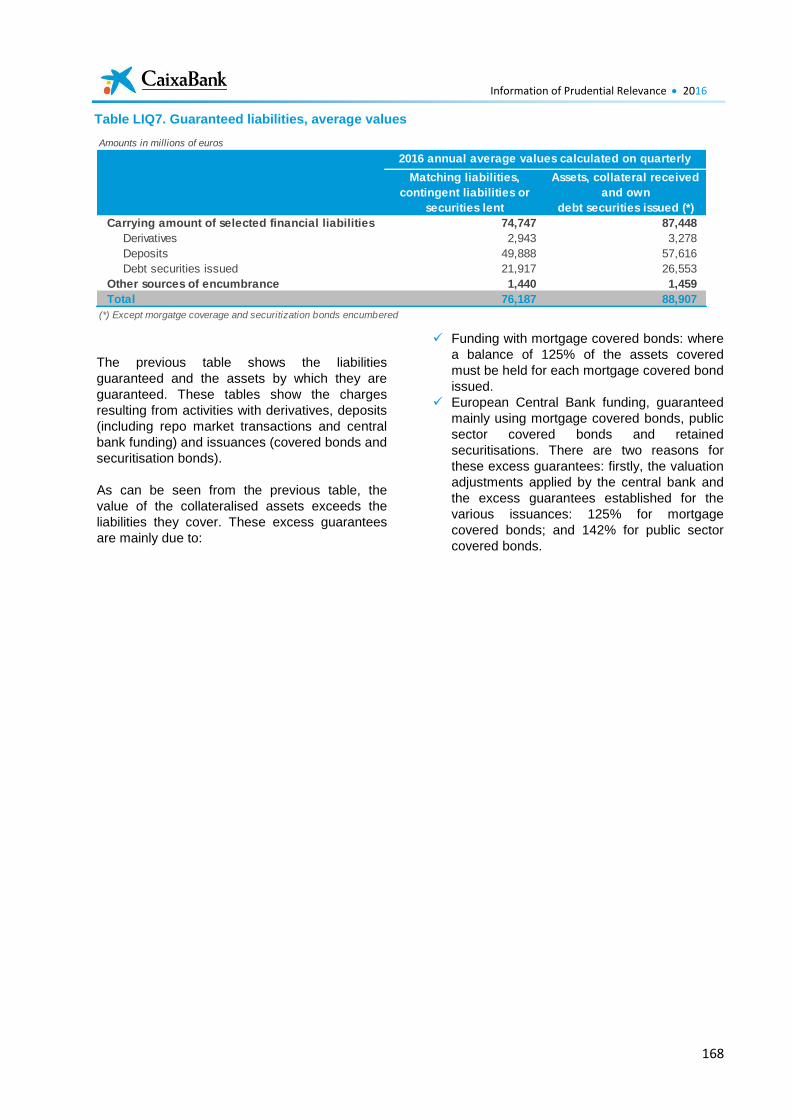
Information of Prudential Relevance 2016
168
Table LIQ7. Guaranteed liabilities, average values
The previous table shows the liabilities
guaranteed and the assets by which they are
guaranteed. These tables show the charges
resulting from activities with derivatives, deposits
(including repo market transactions and central
bank funding) and issuances (covered bonds and
securitisation bonds).
As can be seen from the previous table, the
value of the collateralised assets exceeds the
liabilities they cover. These excess guarantees
are mainly due to:
Funding with mortgage covered bonds: where
a balance of 125% of the assets covered
must be held for each mortgage covered bond
issued.
European Central Bank funding, guaranteed
mainly using mortgage covered bonds, public
sector covered bonds and retained
securitisations. There are two reasons for
these excess guarantees: firstly, the valuation
adjustments applied by the central bank and
the excess guarantees established for the
various issuances: 125% for mortgage
covered bonds; and 142% for public sector
covered bonds.
Amounts in millions of euros
Matching liabilities,
contingent liabilities or
securities lent
Assets, collateral received
and own
debt securities issued (*)
Carrying amount of selected financial liabilities 74,747 87,448
Derivatives 2,943 3,278
Deposits 49,888 57,616
Debt securities issued 21,917 26,553
Other sources of encumbrance 1,440 1,459
Total 76,187 88,907
2016 annual average values calculated on quarterly
data
(*) Except morgatge coverage and securitization bonds encumbered
Information of Prudential Relevance 2016
169
11. OTHER RISKS
11.1. Reputational risk
1. Definition and general policy
Reputational risk refers to the possibility that
CaixaBank's competitive edge could be blunted
by loss of trust by some of its stakeholders,
based on their assessment of actions or
omissions, real or purported, by the Entity, its
Senior Management or governing bodies.
2. Structure and organisation of the risk
management function
All employees and areas share responsibility for
reputational risk at CaixaBank and, therefore,
they are involved in identifying the reputational
risks that threaten the Entity.
There is also a specific area and body whose
functions include coordinating and monitoring the
entity's reputation and any risks that might
undermine this:
The Corporate Social Responsibility and
Reputation Area, part of the Executive
Division of Communication, Institutional
Relations, Brand and CSR, was responsible
for developing the entity's Corporate Social
Responsibility and Reputation Area policy.
This policy was approved by CaixaBank's
Board of Directors in September 2015, setting
out the underlying principles and strategy in
this area, and its commitments to its main
stakeholders.
The responsibilities of the Corporate
Responsibility and Reputation Committee,
which is composed of the areas with the
greatest impact on reputation, include
analysing risks that might affect the Entity's
reputation and proposing actions to manage
the risks detected. The Committee reports on
the monitoring of reputational risks to the
Board Risk Committee through the Global
Risk Committee.
3. Risk management. Measurement and
information systems
To establish reputational risk mitigation policies,
reputational risk must first be measured, both in
relation to the main sources of risk and to trends
in the Entity's reputation levels over time.
The Reputational Risk Map is one of the main
tools for managing and mitigating risks that might
impact CaixaBank's reputation.
This Map enables CaixaBank to:
Identify the risks that could affect its
reputation and classify them.
Rank risks by criticality according to their
damage to the entity's reputation and the
coverage of preventative policies.
Identify key performance indicators (KPIs) to
allow for proactive management with a view to
establishing additional management, action
and communication policies.
The process for obtaining these indicators is
decentralised and is the responsibility of different
areas: CaixaBank's Corporate Social
Responsibility and Reputation Committee
receives regular presentations on these
indicators.
CaixaBank's reputation is measured using a
scorecard featuring a range of reputational
indicators relating to the entity (both internal and
external). This includes CaixaBank's
stakeholders and key reputational values, which
are given a weighting based on their importance
to the entity. The scorecard forms the basis for
CaixaBank's six-monthly Global Reputation
Index, which measures its reputation over time
and against its peers. CaixaBank's Corporate
Social Responsibility and Reputation Committee
receives regular presentations on the reputation
scorecard.
CaixaBank has a range of tools and initiatives for
measuring its reputation with its stakeholders:
Customers: Surveys on the service level
offered (in person and through remote
channels), communications received by
Customer Service and measurement of the
customer experience.
Employees: Regular employment surveys and
consultations, the suggestions box, surveys to
measure internal quality and services and
other internal dialogue mechanisms.
Shareholders: Shareholder office, regular
surveys, meetings of the Shareholder
Advisory Committee, comments received by
the Shareholder Service
Society: Reports on trends in reputation in
written and online media, as well as in social
networks, attendance at forums and
conferences as a leading entity, dialogue with
consumer associations.
Information of Prudential Relevance 2016
170
Other external sources for CaixaBank's reputation include:
Results published in various reputation
monitors and rankings drafted by independent
experts, both Spanish and international.
Membership of sustainability indices and
rankings of the performance of CaixaBank’s
activities in various areas (economic,
corporate governance, social, environmental,
etc.), and Awards and acknowledgements obtained for
the business.
4. Hedging policies and mitigation
techniques
A number of policies impact on the control and
minimisation of reputational risk. These include
the Corporate Social Responsibility Policy, the
Code of Conduct and Anti-Corruption Policy, the
Defence Policy, the Tax Strategy, the New
Products Policy, and the Communication and
Marketing Policy. CaixaBank is also a signatory
to the United Nation's Global Compact, the
Equator Principles, the Principles for Responsible
Investment (PRI), the Women’s Empowerment
Principles, the Code of Best Practice for the
Restructuring of Mortgage Debts on Primary
Residences and the Code of Good Tax Practices.
The main tools for the Corporate Responsibility
area and the Corporate Social Responsibility and
Reputation Committee in monitoring reputational
risk and establishing appropriate mitigating
measures include the Reputational Risk Map and
the Reputation Dashboard, which considers the
reputational perceptions of the Entity's main
stakeholders (customers, the financial
community, employees, society, the media, and
so on).
11.2. Actuarial risk and risk relating to the insurance business
1. Definition and general policy
The main risks in the insurance business are
managed by CaixaBank's insurance subsidiaries,
basically VidaCaixa S.A.U., de Seguros y
Reaseguros. The main risks of the investee
SegurCaixa Adeslas, S.A. de Seguros y
Reaseguros are also monitored
The applicable regulatory framework for
insurance entities from 1 January 2016 is
Directive 2009/138/EC, of the European
Parliament and of the Council, of 25 November
2009, on the taking-up and pursuit of the
business of Insurance and Reinsurance
(Solvency II). This Directive is complemented by
Directive 2014/51/EU, of the European
Parliament and of the Council, of 16 April 2014
(also known as Omnibus).
The Directive was transposed into Spanish law
through Act 20/2015, of 14 July, on the
regulation, supervision and solvency of insurance
and reinsurance entities (LOSSEAR), and Royal
Decree 1060/2015, of 20 November
(ROSSEAR).
The Solvency II Directive was developed through
Commission Delegated Regulation (EU)
2015/35, of 10 October 2014, completing the
Solvency II Directive, which is directly applicable.
The insurance business is exposed to
subscription or actuarial risk.
Actuarial risk is defined as the risk of an increase
in the value of commitments assumed for
benefits under insurance contracts with
customers and employee pension plans, due to
differences between estimates for claims and
management costs used in determining the price
of the insurance (the premium) and the actual
performance of these. According to the EC
Solvency II Directive, it reflects the risk relating to
underwriting life and non-life insurance contracts,
attending to claims covered and the processes
deployed in the exercise of this activity, with the
following breakdown.
Mortality risk: The risk of loss, or of adverse
change in the value of insurance liabilities,
resulting from changes in the level, trend or
volatility of mortality rates, where an increase
in the mortality rate leads to an increase in the
value of insurance liabilities.
Longevity risk: The risk of loss, or of adverse
change in the value of insurance liabilities,
resulting from changes in the level, trend or
volatility of mortality rates, where a decrease
in the mortality rate leads to an increase in the
value of insurance liabilities.
Disability or morbidity risk: The risk of loss, or
of adverse change in the value of insurance
liabilities, resulting from changes in the level,
Information of Prudential Relevance 2016
171
trend or volatility of disability, sickness and
morbidity rates.
Lapse risk: The risk of loss, or of adverse
change in the value of benefits (reduction) or
future expected losses (increase) of insurance
liabilities, resulting from changes in the level
or volatility of the rates of policy lapses,
terminations, renewals and surrenders.
Expense risk: The risk of loss, or of adverse
change in the value of insurance liabilities,
resulting from changes in the level, trend, or
volatility of the expenses incurred in servicing
insurance and reinsurance contracts.
Catastrophe risk: The risk of loss, or of
adverse change in the value of insurance
liabilities, resulting from the significant
uncertainty of pricing and provisioning
assumptions related to extreme or irregular
events.
Therefore, in the life insurance business, the
main variables determining actuarial risk are
mortality, survival, disability, lapse and expense
rates, while the key variable in the other business
lines is the claims rate.
Actuarial risk management is guided by the
regulations established by Solvency II (European
Union – EIOPA) and the Directorate-General of
Insurance and Pension Funds (DGSFP). The
policies are based on these regulations. This
entails monitoring technical trends in products,
which fundamentally depend on the actuarial
factors indicated previously. This stable, long-
term management is reflected in actuarial risk
management policies:
These policies were updated in 2016 as follows:
Underwriting and provision of reserves: for
each line of business, various parameters are
identified for risk approval, measurement,
rate-setting and lastly, to calculate and set
aside reserves covering underwritten policies.
General operating procedures are also in
place for underwriting and the provision of
reserves.
Reinsurance: The extent to which risk is
passed on is determined taking into account
the risk profile of direct insurance contracts,
and the type, suitability and effectiveness of
the reinsurance agreements in place.
2. Structure and organisation of the risk
management function
Risk management is one of the four functions
identified as being fundamental under Solvency II
regulations. Under these regulations, the
governance system for insurance companies
must address four basic functions: risk
management, actuarial, compliance and internal
audit functions.
The risk management function in VidaCaixa is
distributed throughout the organisation, falling on
the organisational areas responsible for
measurement, management and control of each
of the main risk areas, and the coordination and
aggregation of the information they generate.
At the organisational level, the areas of the
Group's insurer directly involved in the
management of actuarial risk are the Risks and
Liability Models Area and the Supply Division.
The Entity also has a Risk Control Department in
the Economic-Finance Area, the responsibilities
of which include developing the risks function
and risk control in cooperation with the other
areas involved and described above.
3. Risk management. Measurement and information systems
In addition to monitoring of the technical
performance of the aforementioned products,
technical provisions are estimated using specific
procedures and tools and are quantified and
tested for adequacy on an individual policy basis.
In addition, pursuant to the provisions of
Solvency II, the Insurance Group has an
Actuarial Function department responsible for:
coordinating the calculation of technical
provisions.
assessing whether the methods and
assumptions used in calculating technical
provisions are adequate.
assessing whether the IT systems used in
calculating technical provisions are suitable
for actuarial and statistical purposes.
giving its opinion on the entity's subscription
and reinsurance policy.
As already mentioned, Solvency II came into
force on 1 January 2016 and entails new risk
management requirements, along other
developments.
The Insurance Group was in a position to comply
with the new regulations on day one, based on
Information of Prudential Relevance 2016
172
the adaptation it had carried out over recent
years.
The main risk-management milestones achieved
in 2016 were:
preparation of the first risk and solvency self
assessment (ORSA) report in the definitive
phase, analysing and detailing the solvency
position, comparing own funds to the capital
required, and projecting these over a 3 year
horizon. This report is approved by the Global
Risk Committee and the Board of Directors of
VidaCaixa, and sent to DGSFP. It is also
submitted to CaixaBank's Global Risk
Committees.
updating by the Global Risk Committee and
the VidaCaixa Board of Directors of the
corporate policies required under Solvency II.
These policies are submitted to CaixaBank's
Global Risk Committee.
Further development of the application and
reporting of compliance with a range of
metrics under the VidaCaixa Risk Appetite
Framework (RAF), limiting capital
consumption for actuarial, credit and market
risk to a percentage of the best estimate of
provisions.
Annual validation and execution of detailed
profit and loss allocations in the partial
internal model for longevity and mortality.
4. Technological support
The Insurance Group operates in an environment
of highly-mechanised processes and integrated
systems. All production operations, irrespective
of the channel, are recorded in the systems using
the various contracting, benefits management
and provision calculation applications (e.g. TAV
for individual and ACO or Avanti for group
insurance). Investment software (e.g. the GIF
application) is used to manage and control the
investments backing the company’s insurance
activity. All of the applications are accounted for
automatically in the accounting support software.
Under the framework of these integrated and
automated systems, there are also a number of
applications that perform management support
duties, including data processing and preparation
of reporting and risk management information. In
addition, there is a Solvency and Risk datamart,
which serves as a support tool for compliance
with all the requirements of the Solvency II
Directive. This datamart brings together the
information needed for Solvency II calculations,
and prepares the regulated reporting for
disclosure to the supervisor and the market.
5. Reporting and reports prepared
As indicated previously, technical monitoring of
products allows for monitoring and control of the
Group’s actuarial risk.
The position and control of the Insurance
Group’s risks are monitored regularly by
VicaCaixa’s Management, Investment and
Global Risk Committee and CaixaBank’s Global
Risk Committee and ALCO. This involves
calculation and analysis of the sufficiency of
technical provisions, analysis of the sufficiency of
expenses, and analysis of products and
operations.
The reports prepared include:
The Expense Surcharges Sufficiency Report
(Annual - Global Risk Committee).
The SME Business Monitoring Report (Annual
- Global Risk Committee).
The Collective Risk Policies Results
Monitoring Report (Quarterly).
The Internal Longevity and Mortality
Calibration Report (Annual – Global Risk
Committee).
The Invalidity Claims Monitoring Report (Six
monthly – Management Committee).
Actuarial Risk Report (Annual – Global Risk
Committee).
Actuarial Function Report (Annual – Global
Risk Committee).
The Solvency II opening balance was presented
in 2016, with reporting of the definitive quarterly
QRTs (Quantitative Reporting Templates) to the
insurance supervisor (DGSFP).
6. Hedging policies and mitigation techniques
Insurance companies assume risk towards
policyholders and mitigate these risks by taking
out insurance with reinsurance companies. By
doing so, an insurance company can reduce risk,
stabilise solvency levels, use available capital
more efficiently and expand its underwriting
capacity. However, regardless of the reinsurance
taken out, the insurance company is
contractually liable for the settlement of all claims
with policyholders.
Information of Prudential Relevance 2016
173
The Insurance Group’s reinsurance programme
lists the procedures that must be followed to
implement the established reinsurance policy.
These include:
Disclosure of the types of reinsurance to be
contracted, the terms and conditions of the
policy, and aggregate exposure by type of
business.
Definition of the amount and type of insurance
to be automatically covered by the
reinsurance contract, e.g. mandatory
reinsurance contracts.
Procedures for acquiring facultative
reinsurance.
In this respect, the Insurance Group has
established limits on the net risk retained per
business line, by risk or event (or a combination
of both). These limits are set in accordance with
the risk profile and reinsurance cost.
The Internal Control Systems ensure that all
underwriting is carried out pursuant to the
reinsurance policy and that the planned
reinsurance cover is appropriate, identifying and
reporting any breach of the established limits by
the underwriters, in addition to any failure to
comply with the instructions provided or if risks
are taken on that surpass the entity’s capital
levels or reinsurance coverage.
Handling claims and ensuring the adequacy of
the provisions are basic principles of insurance
management. The definition and follow-up of the
aforementioned policies enables them to be
changed, if required, to adapt risks to the
Insurance Group's global strategy. As previously
mentioned, these policies have been approved
by the Global Risk Committee and the VidaCaixa
Board of Directors, and submitted to the
CaixaBank Global Risk Committee.
7. Action programme for the Insurance Group
The Insurance Group's future action programme
focuses on the continuity of, and rigorous
compliance with, the regulatory requirements of
Solvency II. 2017 will see the reporting of the first
annual QRTs (the new reporting for supervisory,
statistical and accounting purposes established
at the European level).
The Group plans to continue improving its
internal risk control and management systems in
order to extend the control culture and
environment to the entire organisation, while
maintaining coordination and alignment at the
CaixaBank Group level at all times.
Information of Prudential Relevance 2016
174
12. REMUNERATION
Article 85 of Act 10/2014, of 26 June, on the
organisation, supervision and solvency of credit
entities (hereinafter, the LOSS), and article 93 of
Royal Decree 84/2015, of 13 February,
developing the LOSS, set down the information
to be provided on remuneration policies and
practices in the Prudential Relevance Report
pursuant to Article 450 of EU Regulation
575/2013, of the European Parliament and of the
Council, for those categories of staff whose
professional activities have a significant impact
on the risk profile (Identified Staff).
This information is set out in this chapter on
“Information of Prudential Relevance”.
12.1. Remuneration policy: composition and mandate of the remuneration committee.
Introduction
The following information relates to employees of
CaixaBank and the entities that form part of its
consolidation group for prudential purposes
(hereinafter, the CaixaBank Group) who are
classified as being members of Identified Staff
pursuant to applicable regulations relating to
2016.
Duties of CaixaBank's Remuneration
Committee
Pursuant to the LSC, the Remuneration
Committee (the "RC") of a listed company shall
have, inter alia, the following functions: to
propose to the Board of Directors the
remuneration policy for directors or general
managers or whoever performs Senior
Management functions and reports directly to the
board, the executive committees or the chief
executive officers. Moreover, according to the
LOSS, the Remuneration Committee is
responsible for the direct oversight of
remuneration of senior executives in charge of
risk management and compliance functions.
CaixaBank's Bylaws and the Regulations of the
Board of Directors are consistent with these
precepts.
Finally, pursuant to EBA guidance on appropriate
remuneration policies, the RC shall: (i) be
responsible for the preparation of
recommendations to the Board of Directors, on
the definition of the entity's remuneration policy;
(ii) provide its support and advice to the Board of
Directors on the design of the institution’s overall
remuneration policy; (iii) support the Board of
Directors in overseeing the remuneration
system’s design and operation on behalf of the
supervisory function; (iv) ensure that the current
remuneration policy is up-to-date and propose
any changes required; (v) devote specific
attention to assessment of the mechanisms
adopted, to ensure that the remuneration system
properly takes into account all types of risks,
liquidity and capital levels, ensuring that the
overall remuneration policy is consistent with the
long-term, sound and prudent management of
the institution.
All decisions regarding remuneration outlined in
the Remuneration Policy and proposed by the
Remuneration Committee shall be studied by the
Chairman before being laid before the Board of
Directors for its deliberation and, if applicable,
approval. Should these decisions fall within the
remit of the CaixaBank Annual General Meeting,
the Board of Directors shall include these on the
agenda as proposed resolutions along with the
corresponding reports.
Composition of CaixaBank's Remuneration
Committee
Under the provisions of the LSC and the LOSS,
on 31 December 2016, the Remuneration
Committee comprised the following directors:
María Amparo Moraleda Martínez (independent
Director) Chairman
Salvador Gabarró Serra (proprietary director),
Member
Alain Minc (independent director), Member
In 2016, the CaixaBank's Appointments and
Remuneration Committee met 8 times, and its
members received EUR 96,000 for belonging to
the committee.
Information of Prudential Relevance 2016
175
Functions of CaixaBank's Control Areas and
Management Committee
EBA and ESMA guidelines establish that the
control functions (internal audit, risk control and
management, and regulatory compliance), and
other competent corporate bodies (human
resources, legal, strategic planning, budget, etc.)
and the business units shall provide the
necessary information for the definition,
implementation and supervision of the entity's
remuneration policies. The EBA's guidelines
place specific responsibilities on the human
resources, risk management and internal audit
functions, which are undertaken by the
corresponding CaixaBank departments.
CaixaBank's Management Committee comprises
representatives of the risks, finance, internal
audit, internal control and regulatory compliance,
human resources and general secretariat (legal
services) areas, among others. The Management
Committee is responsible for ensuring that the
necessary information is obtained and prepared
for the RC to perform its responsibilities
efficiently.
CaixaBank's Human Resources and
Organisation Department (hereinafter, HR)
promotes these actions within the Management
Committee.
To prevent conflicts of interest, the Remuneration
Committee is directly responsible for obtaining,
preparing and reviewing information on: (i) the
members of the CaixaBank Board of Directors,
whether for their oversight or executive duties;
and (ii) the members of the Management
Committee.
The CaixaBank Group's Management Committee
has delegated to the Human Resources Division
the task of carrying out various studies and
research in collaboration with external advisors
(Garrigues Abogados y Asesores Tributarios and
KPMG), in order to update and adapt the Group's
remuneration policy to the new legal
requirements.
Approval of the Remuneration Policy of
Identified Staff in force in 2016
On 26 February 2015, the Remuneration
Committee submitted its proposed Remuneration
Policy for the CaixaBank Group's Identified Staff
to the Board of Directors for approval, pursuant
to the requirements of Article 29.1d) of Act
10/2014, of 26 June, on the planning, supervision
and solvency of credit institutions.
The Board of Directors approved the new
Remuneration Policy for the CaixaBank Group's
Identified Staff, at the proposal of the
Remuneration Committee, on 15 December
2016. This came into effect on 1 January 2017,
with the exception of the adjustment system and
proportionality criteria applied to deferred
payments, which was already applied in 2016.
The remuneration policy for members of the
CaixaBank Board of Directors, including the
executive directors as members of its Identified
Staff, was approved by the Board of Directors on
26 February 2015 and approved by the General
Shareholders' Meeting on 23 April 2015, with
99.03% of the votes. This policy applies to the
period 2015-2018.
The Remuneration Policy for CaixaBank
Directors is available on the Company's website
(www.caixabank.com).
12.2. Description of Identified Staff
During 2016, the professionals who should form
part of the CaixaBank Group's Identified Staff, at
the individual or consolidated level, were
determined in accordance with Commission
Delegated Regulation (EU) No 604/2014, of 4
March 2014, supplementing the CRD IV with
regard to regulatory technical standards with
respect to appropriate qualitative and quantitative
criteria to identify categories of staff whose
professional activities have a material impact on
an institution's risk profile.
In accordance with the delegated regulation,
members of Identified Staff should be identified
using a combination of the qualitative and
quantitative criteria set out therein.
Following this evaluation, which is documented in
accordance with the delegated regulation and
other applicable regulations, CaixaBank's
governing bodies approved the list of positions
classified as Identified Staff, which in 2016
consisted of 134 professionals, including the
CaixaBank Group's executive directors, non-
executive directors, members of the
Information of Prudential Relevance 2016
176
Management Committee, senior executives and
key employees.
12.3. Qualitative information concerning remuneration of Identified Staff
1. General aspects
The remuneration policy for Identified Staff is
structured taking into account both the prevailing
circumstances and the Entity's results, and
comprises:
Fixed remuneration based on the level of
responsibility and the career path of each
employee, which constitutes a relevant part
of total compensation
Variable remuneration linked to the
achievement of pre-established targets and
prudent risk management
Social benefits
A long-term, share-based variable
remuneration plan for executive directors,
members of the Management Committee
and the remaining members of the
Company's executive team and key
employees, some of whom are classified as
Identified Staff.
Fixed remuneration is of a sufficient amount,
while variable remuneration generally accounts
for a relatively small percentage of fixed annual
compensation. It cannot in any case exceed
100% of the total fixed remuneration unless the
CaixaBank General Meeting approves a higher
amount, which shall be no more than 200% of
the fixed components.
The LOSS and the EBA guidelines set out that
the fixed and variable components of total
remuneration must be duly balanced, and that
the fixed component must constitute a sufficiently
large proportion of total remuneration, and that
the policy applied to variable component can be
fully flexible up to the limits for paying such
components.
In this regard, the EBA Guidelines establish that
staff should not be dependent on the award of
variable remuneration, as this would incentivise
the taking of excessive short-term risk when the
results of the entity or persons involved would
not permit the award of the variable remuneration
without the taking of such risks.
In lines with this, CaixaBank considers that the
higher the possible variable remuneration
compared to the fixed remuneration, the stronger
the incentive will be to deliver the performance
needed, and the bigger the associated risks may
become. In contrast, if the fixed component is too
low compared to the variable component, an
institution may find it difficult to reduce or
eliminate variable remuneration in a poor
financial year.
Thus, implicitly, variable remuneration may
become a potential incentive to assume risk, and
therefore, a low level of variable remuneration is
a simple protection method against such
incentives.
Furthermore, the risk appetite must take into
account the category of employees included in
Identified Staff, applying the principle of internal
proportionality. As a result, the appropriate
balance between the fixed and variable
remuneration components may vary across the
staff, depending on market conditions and the
specific context in which the undertaking
operates.
2. Fixed remuneration
As a general rule, Identified Staff are subject to
the professional classification system and salary
tables set out in applicable collective bargaining
agreements and the specific employment
agreements reached with workers'
representatives.
Each employee's fixed remuneration is based on
the position held, applying the salary table set
out in the aforementioned collective bargaining
agreement, and taking into account the
professional level of the employee and the
employment agreements currently in force,
mainly reflecting the employee's professional
experience and responsibility in the organisation
through their role.
Posts in Central and Regional Services and other
non-regulated positions fall into a classification
based on contribution levels, with salary bands
established to foster internal fairness. Moreover,
to ensure that the Entity remains competitive vis-
à-vis its peers, the salary bands are quantified on
the basis of the entity's competitive position. This
entails closely monitoring market trends in
salaries and participating in several annual salary
surveys.
Information of Prudential Relevance 2016
177
Fixed remuneration and the supplements applied
to the positions of members of CaixaBank's
Management Committee are based mainly on
market criteria, through salary surveys and
specific ad hoc research. The salary surveys and
specific ad hoc research used by CaixaBank are
performed by specialist companies, based on
comparable samples of the financial sector in the
market where CaixaBank operates, and, for
posts not specific to the financial sector, leading
companies in the IBEX and other companies with
comparable business volumes.
3. Variable remuneration
3.1 Variable remuneration, annual bonus
Risk-adjusted variable remuneration for Identified Staff is based on the remuneration mix (a proportional balance between fixed and variable remuneration, as mentioned above) and on performance measurements.
Ex-ante and ex-post remuneration adjustments are applied in view of the performance measurements, as a risk alignment mechanism.
Both quantitative (financial) and qualitative (non-financial) criteria are taken into account when assessing performance and evaluating individual results. The appropriate mix of quantitative and qualitative criteria also depends on the tasks and responsibilities of each staff member. In all cases, the quantitative and qualitative criteria and the balance between them should be specified and clearly documented for each level and category of staff.
For the purposes of the ex-ante adjustment of variable remuneration, all members of Identified Staff, with the exception of members of the Board of Directors in their supervisory function, and other positions determined based on their characteristics that have no variable remuneration elements, are assigned to one of the categories described below. This assignment is based on the functions of the person in question, and is notified to each of them individually.
a) Executive directors and members of
CaixaBank's Management Committee
Variable remuneration for executive directors and
members of the Management Committee is
determined based on the target bonus
established for each of them by the Board of
Directors, at the proposal of the Remuneration
Committee, subject to a maximum achievement
percentage of 120%. The achievement level is
set based on the following measurable
parameters:
50% based on individual targets
50% based on corporate targets
The 50% corresponding to corporate targets is
set each year by CaixaBank's Board of Directors,
at the proposal of the Remuneration Committee.
This is weighted across various concepts for
which targets can be set, based on the Entity's
main objectives. In 2016 these were:
ROTE
Change in recurring operating expenses
Risk Appetite Framework
Quality
The proposed composition and weighting of
these corporate targets is established in
accordance with the LOSS and its implementing
regulations, and may vary between Executive
Directors and members of the Management
Committee.
The part of variable remuneration based on
individual targets (50%) has a minimum
achievement level for collection of 60%, and a
maximum of 120%. It is distributed across
various targets related to CaixaBank's strategy.
The final valuation carried out by the
Remuneration Committee, following consultation
with the Chairman, may vary by +/-25% in
relation to the objective assessment of the
individual targets, providing that it remains below
the limit of 120%. This flexibility allows for the
qualitative assessment of the performance of the
Executive Director or Management Committee
member, and consideration of any exceptional
targets that may have arisen during the year that
were not considered at the outset.
b) Other categories
For professionals in other categories of Identified
Staff, the variable remuneration system depends
on their role, with a risk adjustment reflecting the
area to which they belong or position they hold.
Therefore, all members of Identified Staff are
assigned a variable remuneration programme or
specific bonuses.
Information of Prudential Relevance 2016
178
Each of the Entity's business areas has a specific
bonus programme with its own structure and
measurement criteria, based on the targets and
terms and conditions that determine the variable
remuneration assigned to Identified Staff in that
area. The main areas in which these
programmes are applied are: Retail and
Commercial Banking, Private Banking, Business
Banking, Transactional Banking, Finance,
International Private Banking and Corporate &
Institutional Banking.
The remuneration model applied in Central and
Regional Services is known as the "Targets
Programme” and encompasses all members of
Identified Staff who work in business control and
support areas. The targets in these areas are set
through an agreement between each employee
and the employee's supervisor, and are
consistent with the targets set for the area.
The maximum achievement percentage varies
between 100% and 150%, depending on the
bonus programme applicable to each
professional. The payment level is determined
based on achievement of individual and
corporate objectives, as set out in the
corresponding bonus programmes approved by
the Management Committee, with a prior opinion
by the Regulatory Compliance function, to avoid
potential conflicts of interest.
The weighting for corporate targets is set for
each year, and distributed across measurable
concepts, based on the main targets for the area.
These concepts may, by way of example, include
some or all of:
ROTE
Change in recurring operating expenses
The ordinary income of the regional business
Accounting NPL in the regional business
Quality
The proposed composition and weighting of the
corporate targets is established in accordance
with the LOSS and its implementing regulations.
Pursuant to the LOSS, the targets set for
employees who perform control functions, on
which their bonus-related performance is
predicated, are established in accordance with
the performance indicators set jointly by the
employee and his or her manager, and are
unrelated to the results achieved by the business
areas they supervise or control.
Risk adjustment indicator
The ratios used to adjust for ex-ante risk in the
calculation of variable remuneration, as
established in the “Target programme", may vary
according to the different categories of Identified
Staff, pursuant to the following model:
The indicators in the Risk Appetite Framework
approved for CaixaBank are used as the metrics
for the risk adjustment. A set of metrics is
established for each professional, based on their
group, area of responsibility and position, which
in combination determine the value of the Risk
Adjustment Indicator (hereinafter, the RAI).
The Risk Appetite Framework comprises a set of
quantitative and qualitative metrics that evaluate
all of CaixaBank's risks, in the following areas:
Protection against losses: mainly metrics for
solvency and profitability, credit risk, market
risk and interest rate risk.
Liquidity and Funding: exclusively comprising
metrics related to market activity.
Business composition: metrics for sector
exposure.
Franchise: including common, global metrics.
Each professional involved must be notified
individually of the dimensions as a whole, or the
specific indicators for a particular dimension, that
constitute their RAI, together with the
remuneration policy.
Although the evaluation of the quantitative
indicators comprising the Risk Appetite
Framework may return a numeric result, in order
to calculate overall compliance with the
qualitative metrics, the result of each of the
metrics in the 4 dimensions is summarised using
a colour: green, amber or red.
The resulting RAI for the set of metrics for each
professional must have a value of between 0 and
1, based on:
The sum of variations in the RAF
indicators between the end of the
previous year and the end of the year of
accrual of the variable remuneration: the
value of the indicator will oscillate
between 0.85 and 1, in accordance with
the following compliance scale:
Information of Prudential Relevance 2016
179
Initial
colour Variation
Final colour
-3%
+3%
-6%
+6%
If one of the metrics included in the risk
adjustment for a group enters Recovery,
the value of the RAI indicator will be 0.
The amount payable to members of this category
is calculated using the following formula:
Risk-adjusted bonus = RAI x Bonus target x (%
individual targets achieved + % of corporate
targets achieved) x entity adjustment factor
The amount of the bonus received by each
employee in each specific programme is based
on performance and the results of the business
and the Entity. The initial amount is adjusted
according to a “bonus-adjustment factor”
determined each year by the Entity's
management, pursuant to applicable regulations.
This adjustment aims to reflect the entity's global
results and other, more qualitative factors.
In general, the adjustment is applied to all
employees uniformly and ranges from a
minimum of 0.85 to a maximum of 1.15.
3.2 Special cases of restrictions
Variable remuneration shall be reduced if, at the
time of the performance assessment, CaixaBank
is subject to any requirement or recommendation
from competent authorities to restrict its dividend
distribution policy, or if this is required by the
competent authority under its regulatory powers,
pursuant to Royal Decree 84/2015 and Circular
2/2016.
3.3 Payment cycle for variable remuneration
Professionals subject to deferred payment
In application of the principle of proportionality
set down in the LOSS, this deferral applies only
when the total amount of the variable
remuneration accrued by Identified Staff
professionals exceeds EUR 50,000.
For the categories of CaixaBank's general
managers, deputy general managers, executive
managers and regional directors included in
Identified Staff, the deferral is applied
independently of the total amount of variable
remuneration accrued.
Deferment process
On the payment date scheduled in the targets
programme for each employee, the percentage
of variable remuneration accrued for the
professional category in question is paid outright
(hereinafter, upfront payment date). The
percentage of variable remuneration retained is
as follows:
Executive directors: 60%
Management Committee, Executive
Managers and Regional Managers: 50%
Other Identified Staff: 40%
50% of the amount of the initial payment is paid
in cash, and the remaining 50% in CaixaBank
shares.
Providing that none of the situations giving rise to
reductions arise, the retained portion of variable
remuneration is paid in three instalments, in the
amounts and on the dates determined as follows:
1/3: 12 months after the Initial Payment Date.
1/3: 24 months after the Initial Payment Date.
1/3: 36 months after the Initial Payment Date.
Of the amount payable at each of these three
dates, 50% is paid in cash. The remaining 50% is
paid in CaixaBank shares, after the
corresponding taxes (withholdings and payments
on account) have been satisfied.
Shares delivered as remuneration may not be
sold for one year from the date delivered.
CaixaBank retains ownership of retained shares
and cash payments. The deferred cash accrues
interest in favour of the recipient, calculated by
applying the interest rate under the same terms
and conditions as apply to the employee's
holding account. The returns on retained shares
accrue to the professional, and include any
remuneration payable to shareholders or yields
on the shares, including, but not limited to, gross
Information of Prudential Relevance 2016
180
dividends distributed, bonus shares assigned to
the deferred shares, and, where applicable,
gains on sales of rights to bonus shares or of
preferential subscription rights, among others (in
the latter case, the option applied will always be
sale of the rights and delivery in cash).
3.4 Long-term, share-based variable
remuneration plan 2015-2018
The General Meeting held on 23 April 2015
approved the implementation of a four year
Long-Term Incentive Plan (LTI) for 2015-2018,
linked to the Strategic Plan. At the end of the four
years, Plan participants will receive a number of
CaixaBank shares, providing certain strategic
objectives and requirements are met. The Plan
participants include members of CaixaBank's
Management Committee and other members of
its management team, and key employees of
CaixaBank and CaixaBank Group companies
who are expressly invited.
Some of the beneficiaries of this long-term
incentives plan are classified as Identified Staff in
CaixaBank.
Duration and settlement of the Plan:
The measurement period for the Plan runs from
1 January 2015 to 31 December 2018
(hereinafter, the Measurement Period).
The above notwithstanding, the Plan formally
commenced when it was approved at the Annual
General Meeting held on 23 April 2015
(hereinafter, the Start Date).
The Plan will expire on 31 December 2018
(hereinafter, the End Date), without prejudice to
the effective settlement of the Plan, which will
take place in June 2019.
Instrument:
The Plan is implemented through the award, free
of charge, of a certain number of units to each
Beneficiary. These units serve as the basis to
determine the number of CaixaBank shares to be
given, if any, to each Plan Beneficiary,
depending on the degree of fulfilment of certain
targets.
Under this Plan, beneficiaries do not become
shareholders of the Entity until delivery of the
shares. Therefore, the units awarded do not
confer economic or voting rights over the Entity,
or any other shareholder entitlements.
Determination of the number of units to be
assigned to each beneficiary
The number of units to be assigned to each
beneficiary is based on: (i) a target amount,
determined by the professional function of the
beneficiary; and (ii) the arithmetic average of
CaixaBank's closing share price in stock market
sessions in February 2015, rounded to the third
decimal place. The units to be assigned to each
beneficiary are determined using the following
formula:
NU = TA / AAP
Where:
NU = the Number of Units to be assigned to each
beneficiary, rounded up to the nearest whole
number.
TA = the Target Amount for the beneficiary,
based on their professional category.
AAP = the Average Arithmetic Price of
CaixaBank's closing share price in stock market
sessions in February 2015, rounded to the third
decimal place.
Determination of the number of shares to be
delivered on settlement of the Plan
The total number of shares to be delivered to
each beneficiary on the settlement date is
determined using the following formula:
NS = NU x GCI
Where:
NS = Number of Shares in the Entity awarded to
each beneficiary on the Plan Settlement Date,
rounded up to the nearest whole number.
NU = the Number of Units assigned to the
beneficiary.
DFI = Degree of fulfilment of the Incentive,
depending on the degree of fulfilment of the
targets to which the Plan is linked.
Information of Prudential Relevance 2016
181
Maximum number of shares to be delivered
The Annual General Meeting resolved that a
maximum of 3,943,275 shares would be
delivered to Plan beneficiaries.
This is the maximum number of shares that could
be delivered, in the event of the maximum
coefficients for achieving objectives applying.
Metrics
The Degree of fulfilment of the Incentive shall
depend on the degree of compliance with the
objectives to which the Plan is linked.
The specific number of CaixaBank shares to be
delivered to each beneficiary on the Settlement
Date, if the conditions established are met,
depends on: (i) the Entity's Total Shareholder
Return (hereinafter, TSR) in comparison with the
same indicator for 19 peer banks (20 banks in
total, including CaixaBank); (ii) the Entity's
Return on Tangible Equity (hereinafter, ROTE);
and (iii) the Entity's Cost-to-Income ratio
(hereinafter, CIR).
a) TSR:
The difference (expressed as percentage
relationship) between the initial and final value of
an investment in ordinary shares. The calculation
of final value includes dividends and similar items
(such as scrip dividends) received by the
shareholder for their investment over the
corresponding period.
A coefficient of between 0 and 1.5 will be
established, depending on CaixaBank's position
in the sample of 20 comparable banks selected:
If CaixaBank's position in the TSR ranking is
between 1 and 3, the TSR coefficient = 1.5
If CaixaBank's position in the TSR ranking is
between 4 and 6, the TSR coefficient = 1.2
If CaixaBank's position in the TSR ranking is
between 7 and 9, the TSR coefficient = 1
If CaixaBank's position in the TSR ranking is
between 10 and 12, the TSR coefficient = 0.5
If CaixaBank's position in the TSR ranking is
between 13 and 20, the TSR coefficient = 0.
The peer banks used as benchmarks for TSR
under the Plan (hereinafter, the Comparison
Group) are Santander, BNP, BBVA, ING Groep
NV-CVA, Intesa Sanpaolo, Deutsche Bank AG-
Registered, Unicredit SPA, Credit Agricole SA,
Societe General SA, KBC Groep NV, Natixis,
Commerzbank AG, Bank of Ireland, Banco
Sabadell SA, Erste Group Bank AG, Banco
Popular Español, Mediobanca SPA, Bankinter
SA and Bankia SA.
In order to avoid any anomalous movements in
this indicator, the benchmark values on the date
immediately prior to the start of the Measurement
Period (31 December 2014) and End Date of the
Measurement Period (31 December 2018) will
use the average arithmetic closing price of the
shares over 31 stock market sessions, rounded
to three decimal places. These 31 sessions will
comprise the 31 December session and the 15
sessions immediately preceding and following
this date.
b) ROTE:
The return on tangible equity over the
Measurement Period. This formula does not
include intangible goods or goodwill in a
company's equity.
A coefficient of between 0 and 1.2 will be set for
ROTE, based on the following scale of ROTE
targets:
If ROTE is >12: ROTE coefficient = 1.2
If ROTE is = 12: ROTE coefficient = 1
If ROTE is = 10: ROTE coefficient = 0.8
If ROTE is < 10: ROTE coefficient = 0.
The degree of fulfilment of the incentive arising
from the ROTE target will be calculated,
following the above table, by linear interpolation.
The ROTE indicator will be calculated as the
average for this metric between the close on 31
December 2017 and the close on 31 December
2018.
c) CIR:
The percentage of income consumed by costs.
This is calculated as the percentage ratio
between ordinary operating income and costs.
A coefficient of between 0 and 1.2 will be set for
CIR, based on the following scale:
If 2018 CIR < 43: CIR coefficient = 1.2.
If 2018 CIR = 45: CIR coefficient = 1.
If 2018 CIR = 47: CIR coefficient = 0.8.
Information of Prudential Relevance 2016
182
If 2018 CIR > 47: CIR coefficient = 0.
The degree of fulfilment of the incentive arising
from the CIR target will be calculated, following
the above table, by linear interpolation.
The value of the CIR metric at 31 December
2018 will be used.
The Degree of fulfilment of the Incentive will be
determined depending on the following formula,
with the weights included in it:
Where:
DFI = Degree of fulfilment of the Incentive
expressed as a percentage.
CTSR = the TSR coefficient, based on the scale
for the TSR target.
CROTE = the ROTE coefficient, based on the
scale for ROTE targets.
CCIR = the CIR coefficient, based on the scale
for the CIR target.
The TSR metric will be calculated by an
independent expert of recognised renown at the
end of the Plan, at the request of the Entity. The
Entity will determine the ROTE and CIR metrics,
which will be subject to audit of the Entity's
financial statements.
Requirements for receiving shares
The requirements for the beneficiary to receive
shares under the Plan are:
1. They must comply with the objectives set for
them under the Plan, subject to the terms and
conditions set out in the Plan regulations.
2. The beneficiary must remain part of the
Company until the End Date of the Plan, except
in special circumstances, such as death,
permanent disability, retirement, and others as
set out in the Plan regulations, which must be
approved by the Company's Board of Directors.
Therefore, the beneficiary will lose their
entitlement to shares under the Plan in the event
of resignation or justified dismissal.
The shares will be delivered in all cases on the
date established for Plan beneficiaries, in
accordance with the requirements and
procedures set down in the Plan.
The Plan will only be settled and the shares
delivered if this is sustainable and justified given
CaixaBank's situation and results.
The shares under this Plan will not be delivered
to the beneficiaries - who will lose any right to
receive them - in the event that CaixaBank
makes a loss, does not distribute a dividend or
does not pass the stress tests required by the
European Banking Authority, in the year of the
Plan End Date or Settlement Date.
Early termination or modification of the Plan
The Plan may be terminated ahead of schedule or modified in the event of change of control in the Company or in the light of events that, in the opinion of the Board of Directors, significantly impact the Plan.
3.5 Reduction and recovery of variable
remuneration (ex-post adjustment of the
annual bonus and LTI).
Reductions.
Pursuant to the LOSS, the right of persons
classified as Identified Staff to receive variable
remuneration, including that pending payment,
whether in cash or shares, shall be reduced, in
part or in full, in the following situations:
Significant failures in risk management by
CaixaBank, or one of its business units, or in
risk control, including the existence of
qualifications in the external auditor's report
or other circumstances that undermine the
financial parameters used in the calculation
of variable remuneration.
An increase in capital requirements for
CaixaBank or one of its business units that
was not envisaged at the time that the
exposure was generated.
Regulatory sanctions or legal rulings relating
to issues that may be attributed to the unit or
the professional responsible for them.
DFI = CTSR x 34% + CROTE x 33% +
CCIR x 33%.
Information of Prudential Relevance 2016
183
Failure to comply with the entity's internal
regulations or codes of conduct, including, in
particular:
Any serious or very serious regulatory
breaches attributable to them.
Any serious or very serious breaches of
internal regulations.
Failure to comply with applicable
suitability and behavioural requirements.
Regulatory breaches for which they are
responsible, irrespective of whether they
cause losses that put at risk the solvency of
a business line, and, in general, involvement
in, or responsibility for, behaviour that
causes significant losses.
Any irregular behaviour, whether individual
or collective, particularly negative effects
resulting from the misselling of products and
the responsibilities of the persons or bodies
that make such decisions.
Justified disciplinary dismissal or, in the case
of commercial contracts, due to just cause at
the instigation of the Entity (in which case
the reduction will be total).
Where payment or consolidation of these
amounts is not sustainable in light of
CaixaBank's overall situation, or where
payment is not justified in view of the results
of CaixaBank as a whole, the business unit,
or the employee in question.
Any others that might be provided for in the
corresponding contracts. Any others as set
down in applicable legislation or by
regulatory authorities in exercise of their
powers to issue or interpret regulations, or
their executive powers.
Recovery situations.
In the event that causes leading to the above-
mentioned situations occur before payment of a
variable remuneration amount, such that the
payment would not have been made, either in
part or in full, if the situation had been known
about, the person involved must return the part of
variable remuneration unduly paid, to the
corresponding CaixaBank Group entity. This
reimbursement must be made in cash or shares,
as applicable.
4. Employee benefits
Mandatory contributions for variable
remuneration
In compliance with the provisions of Circular
2/2016, 15% of agreed contributions to
complementary social welfare plans for members
of CaixaBank's Management Committee are
considered the target amount (the remaining
85% being considered a fixed remuneration
component).
This amount is determined following the same
principles and procedures established for
variable remuneration through bonus payments,
based only on individual parameters, and shall
involve contributions to a discretionary pension
benefit scheme.
The contribution shall be considered deferred
variable remuneration for the purposes of
Circular 2/2016. Therefore, the discretionary
pension benefit scheme shall contain the
necessary clauses for it to be explicitly subject to
the causes of reductions set down for variable
remuneration in the form of bonuses. It shall also
be included in the sum of variable remuneration
for the purposes of limits and other factors that
might be established.
If a professional leaves the entity as a result of
retirement or before planned for any other
reasons, the discretionary pension benefits shall
be subject to a five-year withholding period, from
the date on which the professional ceases to
provide their services to the Entity for whatever
reason.
During this withholding period, CaixaBank shall
apply the same requirements as set forth in the
reduction and recovery clauses for variable
remuneration already paid.
5. Payments for early termination
Amount and limit of severance compensation
As a general rule, and unless prevailing
legislation imposes a higher amount, the amount
of compensation for severance or separation of
professionals with Senior Management roles in
Identified Staff shall not exceed the annual value
of their fixed remuneration components, without
prejudice to any compensation for post-
contractual non-competition that might be
established.
For professionals with an ordinary employment
relationship, the amount of compensation for
severance or separation calculated for the
purposes of the maximum ratio of variable
remuneration shall not exceed legal limits.
Information of Prudential Relevance 2016
184
Post-contractual non-competition agreements
Exceptionally, post-contractual non-competition
agreements may be included in contracts for
Identified Staff in the CaixaBank Group. Such
agreements shall consist of an amount that in
general shall not exceed the sum of the fixed
components of remuneration that the
professional would have received had they
remained with the entity.
The amount of the compensation shall be divided
into equal instalments, payable at regular
intervals over the non-competition period.
Any breach of the post-contractual non-
competition agreement shall give the Entity the
right to seek compensation from the professional
proportionate to the compensation paid.
Deferral and payment
Payment of amounts for early severance
considered to be variable remuneration shall be
subject to deferral and payment in the manner
set down for variable remuneration in the form of
bonuses.
Reduction and recovery
Payments for early termination must be based on
the results secured over time, and must not
compensate poor results or undue conduct. The
amount of payments for termination considered
to represent variable remuneration under
prevailing regulations shall be subject to the
cases of reduction and recovery set down for
variable remuneration.
12.4. Quantitative information concerning remuneration of the Identified Staff
In 2016, remuneration paid to the Identified Staff,
in adherence to the applicable regulatory
provisions concerning remuneration, and
according to the Entity's different areas of
activity, was as follows:
The fixed remuneration information for 2016 set
out in this report includes all fixed remuneration
components received by each member of the
Identified Staff. Therefore, this concept includes
both fixed monetary remuneration and
remuneration in-kind (contributions to pension
plans, health insurance, etc.).
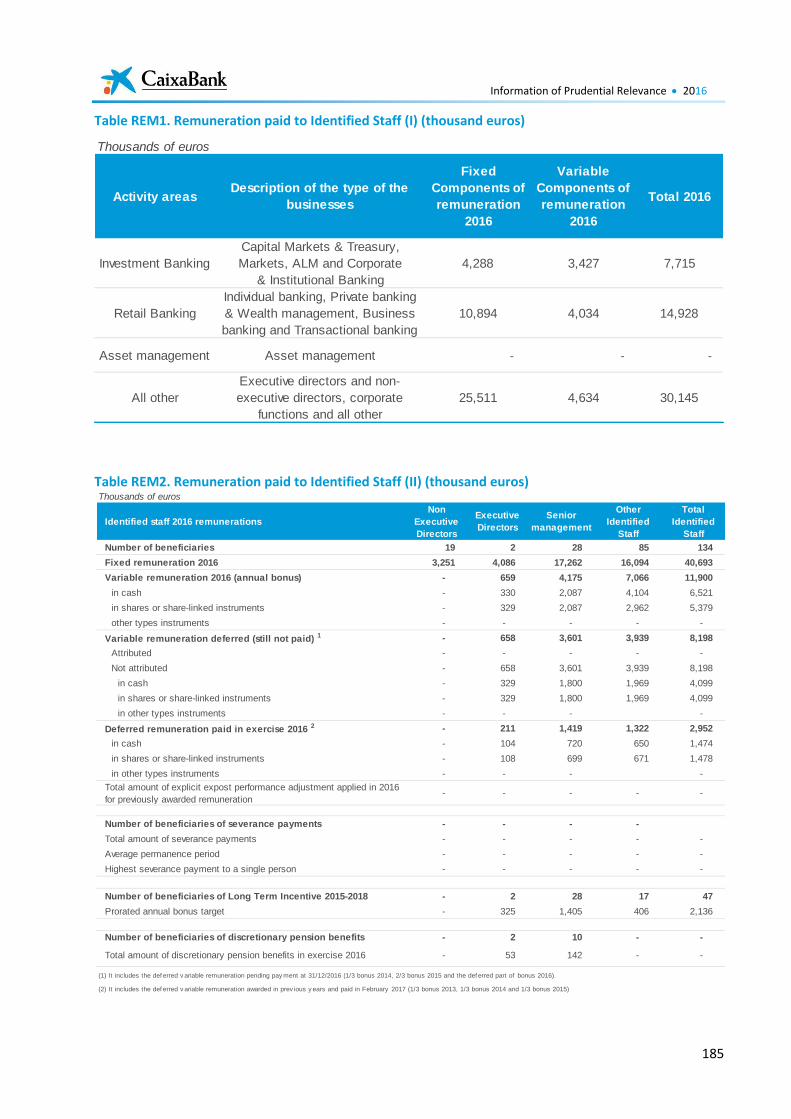
Information of Prudential Relevance 2016
185
Table REM1. Remuneration paid to Identified Staff (I) (thousand euros)
Table REM2. Remuneration paid to Identified Staff (II) (thousand euros)
Thousands of euros
Activity areasDescription of the type of the
businesses
Fixed
Components of
remuneration
2016
Variable
Components of
remuneration
2016
Total 2016
Investment Banking
Capital Markets & Treasury,
Markets, ALM and Corporate
& Institutional Banking
4,288 3,427 7,715
Retail Banking
Individual banking, Private banking
& Wealth management, Business
banking and Transactional banking
10,894 4,034 14,928
Asset management Asset management - - -
All other
Executive directors and non-
executive directors, corporate
functions and all other
25,511 4,634 30,145
Identified staff 2016 remunerations
Non
Executive
Directors
Executive
Directors
Senior
management
Other
Identified
Staff
Total
Identified
Staff
Number of beneficiaries 19 2 28 85 134
Fixed remuneration 2016 3,251 4,086 17,262 16,094 40,693
Variable remuneration 2016 (annual bonus) - 659 4,175 7,066 11,900
in cash - 330 2,087 4,104 6,521
in shares or share-linked instruments - 329 2,087 2,962 5,379
other types instruments - - - - -
Variable remuneration deferred (still not paid) 1 - 658 3,601 3,939 8,198
Attributed - - - - -
Not attributed - 658 3,601 3,939 8,198
in cash - 329 1,800 1,969 4,099
in shares or share-linked instruments - 329 1,800 1,969 4,099
in other types instruments - - - -
Deferred remuneration paid in exercise 2016 2 - 211 1,419 1,322 2,952
in cash - 104 720 650 1,474
in shares or share-linked instruments - 108 699 671 1,478
in other types instruments - - - -
Total amount of explicit expost performance adjustment applied in 2016
for previously awarded remuneration- - - - -
Number of beneficiaries of severance payments - - - -
Total amount of severance payments - - - - -
Average permanence period - - - - -
Highest severance payment to a single person - - - - -
Number of beneficiaries of Long Term Incentive 2015-2018 - 2 28 17 47
Prorated annual bonus target - 325 1,405 406 2,136
Number of beneficiaries of discretionary pension benefits - 2 10 - -
Total amount of discretionary pension benefits in exercise 2016 - 53 142 - -
(2) It includes the def erred v ariable remuneration awarded in prev ious y ears and paid in February 2017 (1/3 bonus 2013, 1/3 bonus 2014 and 1/3 bonus 2015)
Thousands of euros
(1) It includes the def erred v ariable remuneration pending pay ment at 31/12/2016 (1/3 bonus 2014, 2/3 bonus 2015 and the def erred part of bonus 2016).
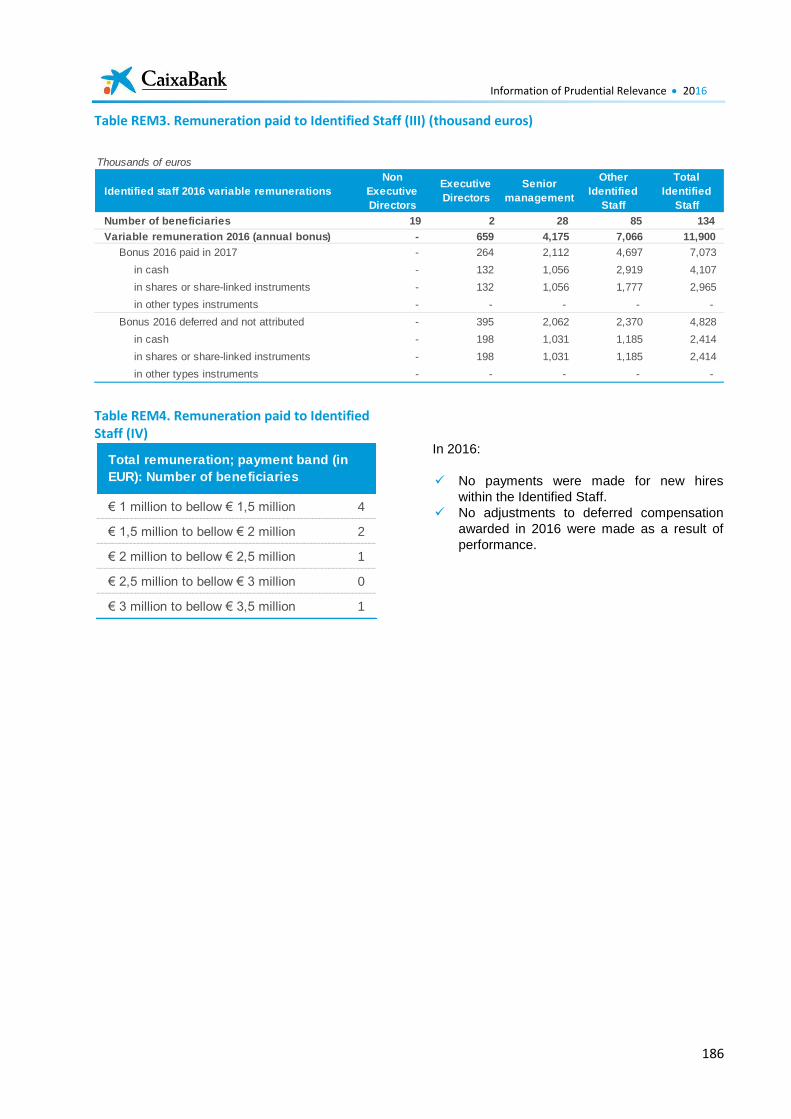
Information of Prudential Relevance 2016
186
Table REM3. Remuneration paid to Identified Staff (III) (thousand euros)
Table REM4. Remuneration paid to Identified Staff (IV)
In 2016:
No payments were made for new hires
within the Identified Staff.
No adjustments to deferred compensation
awarded in 2016 were made as a result of
performance.
Identified staff 2016 variable remunerations
Non
Executive
Directors
Executive
Directors
Senior
management
Other
Identified
Staff
Total
Identified
Staff
Number of beneficiaries 19 2 28 85 134
Variable remuneration 2016 (annual bonus) - 659 4,175 7,066 11,900
Bonus 2016 paid in 2017 - 264 2,112 4,697 7,073
in cash - 132 1,056 2,919 4,107
in shares or share-linked instruments - 132 1,056 1,777 2,965
in other types instruments - - - - -
Bonus 2016 deferred and not attributed - 395 2,062 2,370 4,828
in cash - 198 1,031 1,185 2,414
in shares or share-linked instruments - 198 1,031 1,185 2,414
in other types instruments - - - - -
Thousands of euros
€ 1 million to bellow € 1,5 million 4
€ 1,5 million to bellow € 2 million 2
€ 2 million to bellow € 2,5 million 1
€ 2,5 million to bellow € 3 million 0
€ 3 million to bellow € 3,5 million 1
Total remuneration; payment band (in
EUR): Number of beneficiaries
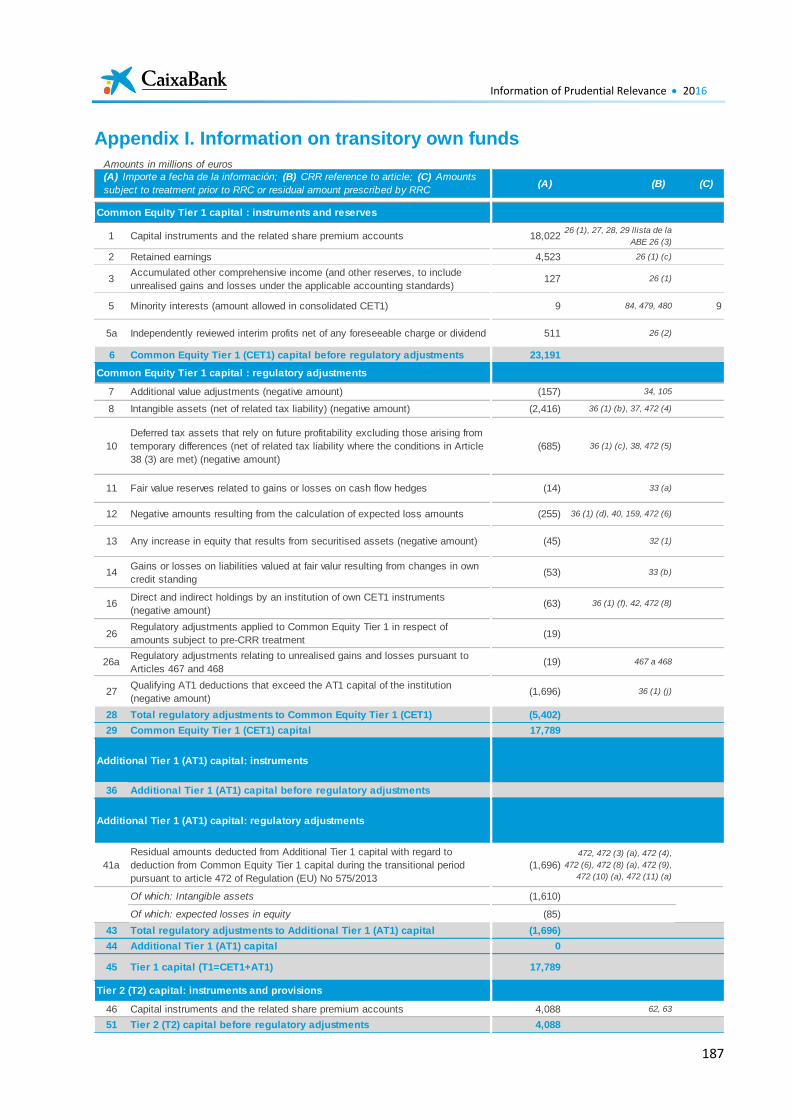
Information of Prudential Relevance 2016
187
Appendix I. Information on transitory own funds
Common Equity Tier 1 capital : instruments and reserves
1 Capital instruments and the related share premium accounts 18,02226 (1), 27, 28, 29 llista de la
ABE 26 (3)
2 Retained earnings 4,523 26 (1) (c)
3Accumulated other comprehensive income (and other reserves, to include
unrealised gains and losses under the applicable accounting standards)127 26 (1)
5 Minority interests (amount allowed in consolidated CET1) 9 84, 479, 480 9
5a Independently reviewed interim profits net of any foreseeable charge or dividend 511 26 (2)
6 Common Equity Tier 1 (CET1) capital before regulatory adjustments 23,191
Common Equity Tier 1 capital : regulatory adjustments
7 Additional value adjustments (negative amount) (157) 34, 105
8 Intangible assets (net of related tax liability) (negative amount) (2,416) 36 (1) (b), 37, 472 (4)
10
Deferred tax assets that rely on future profitability excluding those arising from
temporary differences (net of related tax liability where the conditions in Article
38 (3) are met) (negative amount)
(685) 36 (1) (c), 38, 472 (5)
11 Fair value reserves related to gains or losses on cash flow hedges (14) 33 (a)
12 Negative amounts resulting from the calculation of expected loss amounts (255) 36 (1) (d), 40, 159, 472 (6)
13 Any increase in equity that results from securitised assets (negative amount) (45) 32 (1)
14Gains or losses on liabilities valued at fair valur resulting from changes in own
credit standing(53) 33 (b)
16Direct and indirect holdings by an institution of own CET1 instruments
(negative amount)(63) 36 (1) (f), 42, 472 (8)
26Regulatory adjustments applied to Common Equity Tier 1 in respect of
amounts subject to pre-CRR treatment(19)
26aRegulatory adjustments relating to unrealised gains and losses pursuant to
Articles 467 and 468(19) 467 a 468
27Qualifying AT1 deductions that exceed the AT1 capital of the institution
(negative amount)(1,696) 36 (1) (j)
28 Total regulatory adjustments to Common Equity Tier 1 (CET1) (5,402)
29 Common Equity Tier 1 (CET1) capital 17,789
Additional Tier 1 (AT1) capital: instruments
36 Additional Tier 1 (AT1) capital before regulatory adjustments
Additional Tier 1 (AT1) capital: regulatory adjustments
41a
Residual amounts deducted from Additional Tier 1 capital with regard to
deduction from Common Equity Tier 1 capital during the transitional period
pursuant to article 472 of Regulation (EU) No 575/2013
(1,696)
472, 472 (3) (a), 472 (4),
472 (6), 472 (8) (a), 472 (9),
472 (10) (a), 472 (11) (a)
Of which: Intangible assets (1,610)
Of which: expected losses in equity (85)
43 Total regulatory adjustments to Additional Tier 1 (AT1) capital (1,696)
44 Additional Tier 1 (AT1) capital 0
45 Tier 1 capital (T1=CET1+AT1) 17,789
Tier 2 (T2) capital: instruments and provisions
46 Capital instruments and the related share premium accounts 4,088 62, 63
51 Tier 2 (T2) capital before regulatory adjustments 4,088
(C)(A) (B)(A) Importe a fecha de la información; (B) CRR reference to article; (C) Amounts
subject to treatment prior to RRC or residual amount prescribed by RRC
Amounts in millions of euros
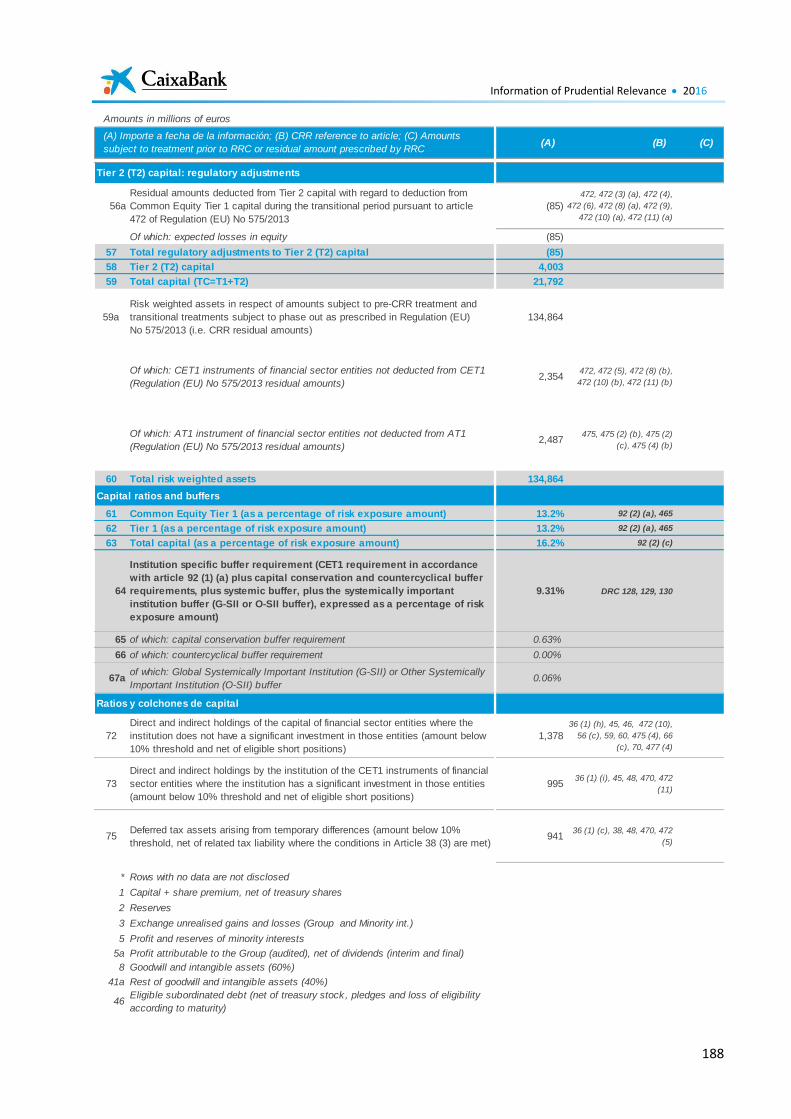
Information of Prudential Relevance 2016
188
Tier 2 (T2) capital: regulatory adjustments
56a
Residual amounts deducted from Tier 2 capital with regard to deduction from
Common Equity Tier 1 capital during the transitional period pursuant to article
472 of Regulation (EU) No 575/2013
(85)
472, 472 (3) (a), 472 (4),
472 (6), 472 (8) (a), 472 (9),
472 (10) (a), 472 (11) (a)
Of which: expected losses in equity (85)
57 Total regulatory adjustments to Tier 2 (T2) capital (85)
58 Tier 2 (T2) capital 4,003
59 Total capital (TC=T1+T2) 21,792
59a
Risk weighted assets in respect of amounts subject to pre-CRR treatment and
transitional treatments subject to phase out as prescribed in Regulation (EU)
No 575/2013 (i.e. CRR residual amounts)
134,864
Of which: CET1 instruments of financial sector entities not deducted from CET1
(Regulation (EU) No 575/2013 residual amounts) 2,354
472, 472 (5), 472 (8) (b),
472 (10) (b), 472 (11) (b)
Of which: AT1 instrument of financial sector entities not deducted from AT1
(Regulation (EU) No 575/2013 residual amounts) 2,487
475, 475 (2) (b), 475 (2)
(c), 475 (4) (b)
60 Total risk weighted assets 134,864
Capital ratios and buffers
61 Common Equity Tier 1 (as a percentage of risk exposure amount) 13.2% 92 (2) (a), 465
62 Tier 1 (as a percentage of risk exposure amount) 13.2% 92 (2) (a), 465
63 Total capital (as a percentage of risk exposure amount) 16.2% 92 (2) (c)
64
Institution specific buffer requirement (CET1 requirement in accordance
with article 92 (1) (a) plus capital conservation and countercyclical buffer
requirements, plus systemic buffer, plus the systemically important
institution buffer (G-SII or O-SII buffer), expressed as a percentage of risk
exposure amount)
9.31% DRC 128, 129, 130
65 of which: capital conservation buffer requirement 0.63%
66 of which: countercyclical buffer requirement 0.00%
67aof which: Global Systemically Important Institution (G-SII) or Other Systemically
Important Institution (O-SII) buffer0.06%
Ratios y colchones de capital
72
Direct and indirect holdings of the capital of financial sector entities where the
institution does not have a significant investment in those entities (amount below
10% threshold and net of eligible short positions)
1,378
36 (1) (h), 45, 46, 472 (10),
56 (c), 59, 60, 475 (4), 66
(c), 70, 477 (4)
73
Direct and indirect holdings by the institution of the CET1 instruments of financial
sector entities where the institution has a significant investment in those entities
(amount below 10% threshold and net of eligible short positions)
99536 (1) (i), 45, 48, 470, 472
(11)
75Deferred tax assets arising from temporary differences (amount below 10%
threshold, net of related tax liability where the conditions in Article 38 (3) are met)941
36 (1) (c), 38, 48, 470, 472
(5)
* Rows with no data are not disclosed
1 Capital + share premium, net of treasury shares
2 Reserves
3 Exchange unrealised gains and losses (Group and Minority int.)
5 Profit and reserves of minority interests
5a Profit attributable to the Group (audited), net of dividends (interim and final)
8 Goodwill and intangible assets (60%)
41a Rest of goodwill and intangible assets (40%)
46Eligible subordinated debt (net of treasury stock, pledges and loss of eligibility
according to maturity)
Resultados y Reservas de Minoritarios
Resultados del ejercicio atribuidos al Grupo Fondos de comercio y activos intangib les, netos de
fondos de corrección (60%)Activos intangib les: Fondos de comercio y activos Deuda subordinada computable (neta de
autocartera, pignoraciones y pérdida de
computabilidad según vencimiento)
(A) (B) (C)(A) Importe a fecha de la información; (B) CRR reference to article; (C) Amounts
subject to treatment prior to RRC or residual amount prescribed by RRC
Amounts in millions of euros
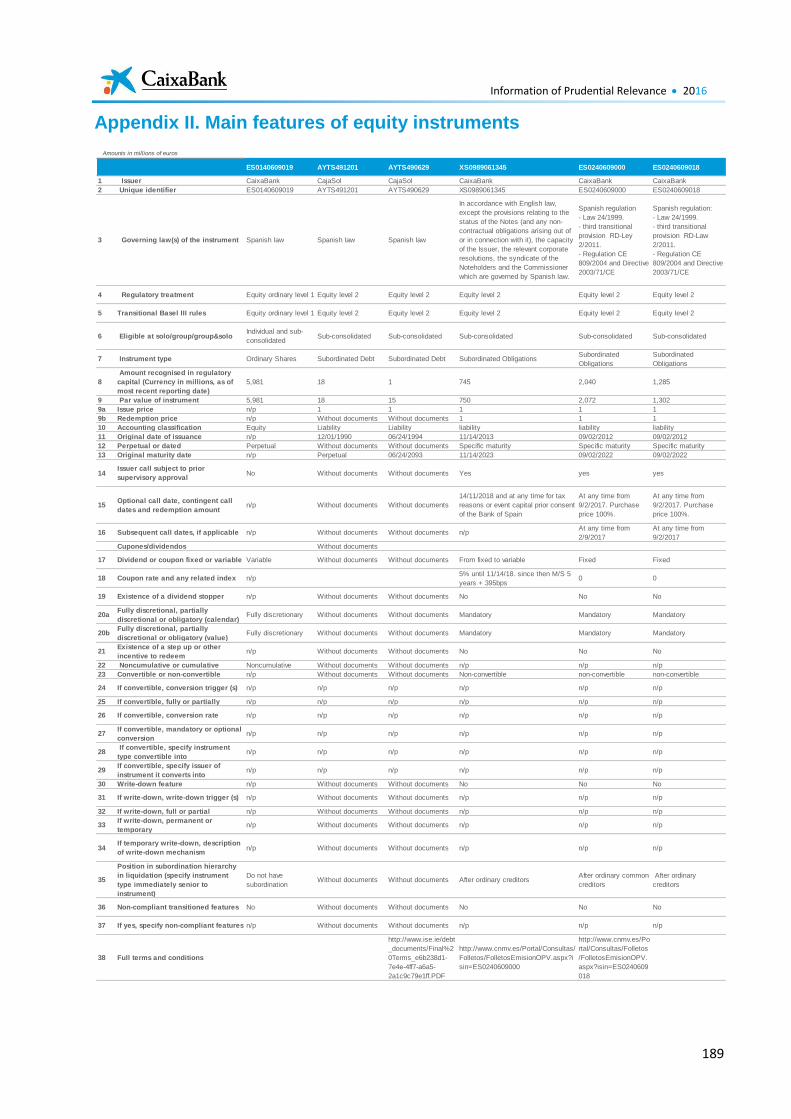
Information of Prudential Relevance 2016
189
Appendix II. Main features of equity instruments
ES0140609019 AYTS491201 AYTS490629 XS0989061345 ES0240609000 ES0240609018
1 Issuer CaixaBank CajaSol CajaSol CaixaBank CaixaBank CaixaBank
2 Unique identifier ES0140609019 AYTS491201 AYTS490629 XS0989061345 ES0240609000 ES0240609018
3 Governing law(s) of the instrument Spanish law Spanish law Spanish law
In accordance with English law,
except the provisions relating to the
status of the Notes (and any non-
contractual obligations arising out of
or in connection with it), the capacity
of the Issuer, the relevant corporate
resolutions, the syndicate of the
Noteholders and the Commissioner
which are governed by Spanish law.
Spanish regulation
- Law 24/1999.
- third transitional
provision RD-Ley
2/2011.
- Regulation CE
809/2004 and Directive
2003/71/CE
Spanish regulation:
- Law 24/1999.
- third transitional
provision RD-Law
2/2011.
- Regulation CE
809/2004 and Directive
2003/71/CE
4 Regulatory treatment Equity ordinary level 1 Equity level 2 Equity level 2 Equity level 2 Equity level 2 Equity level 2
5 Transitional Basel III rules Equity ordinary level 1 Equity level 2 Equity level 2 Equity level 2 Equity level 2 Equity level 2
6 Eligible at solo/group/group&soloIndividual and sub-
consolidatedSub-consolidated Sub-consolidated Sub-consolidated Sub-consolidated Sub-consolidated
7 Instrument type Ordinary Shares Subordinated Debt Subordinated Debt Subordinated ObligationsSubordinated
Obligations
Subordinated
Obligations
8
Amount recognised in regulatory
capital (Currency in millions, as of
most recent reporting date)
5,981 18 1 745 2,040 1,285
9 Par value of instrument 5,981 18 15 750 2,072 1,302
9a Issue price n/p 1 1 1 1 1
9b Redemption price n/p Without documents Without documents 1 1 1
10 Accounting classification Equity Liability Liability liability liability liability
11 Original date of issuance n/p 12/01/1990 06/24/1994 11/14/2013 09/02/2012 09/02/2012
12 Perpetual or dated Perpetual Without documents Without documents Specific maturity Specific maturity Specific maturity
13 Original maturity date n/p Perpetual 06/24/2093 11/14/2023 09/02/2022 09/02/2022
14Issuer call subject to prior
supervisory approvalNo Without documents Without documents Yes yes yes
15Optional call date, contingent call
dates and redemption amountn/p Without documents Without documents
14/11/2018 and at any time for tax
reasons or event capital prior consent
of the Bank of Spain
At any time from
9/2/2017. Purchase
price 100%.
At any time from
9/2/2017. Purchase
price 100%.
16 Subsequent call dates, if applicable n/p Without documents Without documents n/pAt any time from
2/9/2017
At any time from
9/2/2017
Cupones/dividendos Without documents
17 Dividend or coupon fixed or variable Variable Without documents Without documents From fixed to variable Fixed Fixed
18 Coupon rate and any related index n/p5% until 11/14/18. since then M/S 5
years + 395bps0 0
19 Existence of a dividend stopper n/p Without documents Without documents No No No
20aFully discretional, partially
discretional or obligatory (calendar)Fully discretionary Without documents Without documents Mandatory Mandatory Mandatory
20bFully discretional, partially
discretional or obligatory (value)Fully discretionary Without documents Without documents Mandatory Mandatory Mandatory
21Existence of a step up or other
incentive to redeemn/p Without documents Without documents No No No
22 Noncumulative or cumulative Noncumulative Without documents Without documents n/p n/p n/p
23 Convertible or non-convertible n/p Without documents Without documents Non-convertible non-convertible non-convertible
24 If convertible, conversion trigger (s) n/p n/p n/p n/p n/p n/p
25 If convertible, fully or partially n/p n/p n/p n/p n/p n/p
26 If convertible, conversion rate n/p n/p n/p n/p n/p n/p
27If convertible, mandatory or optional
conversionn/p n/p n/p n/p n/p n/p
28 If convertible, specify instrument
type convertible inton/p n/p n/p n/p n/p n/p
29If convertible, specify issuer of
instrument it converts inton/p n/p n/p n/p n/p n/p
30 Write-down feature n/p Without documents Without documents No No No
31 If write-down, write-down trigger (s) n/p Without documents Without documents n/p n/p n/p
32 If write-down, full or partial n/p Without documents Without documents n/p n/p n/p
33If write-down, permanent or
temporaryn/p Without documents Without documents n/p n/p n/p
34If temporary write-down, description
of write-down mechanismn/p Without documents Without documents n/p n/p n/p
35
Position in subordination hierarchy
in liquidation (specify instrument
type immediately senior to
instrument)
Do not have
subordinationWithout documents Without documents After ordinary creditors
After ordinary common
creditors
After ordinary
creditors
36 Non-compliant transitioned features No Without documents Without documents No No No
37 If yes, specify non-compliant features n/p Without documents Without documents n/p n/p n/p
38 Full terms and conditions
http://www.ise.ie/debt
_documents/Final%2
0Terms_e6b238d1-
7e4e-4ff7-a6a5-
2a1c9c79e1ff.PDF
http://www.cnmv.es/Portal/Consultas/
Folletos/FolletosEmisionOPV.aspx?i
sin=ES0240609000
http://www.cnmv.es/Po
rtal/Consultas/Folletos
/FolletosEmisionOPV.
aspx?isin=ES0240609
018
Amounts in millions of euros
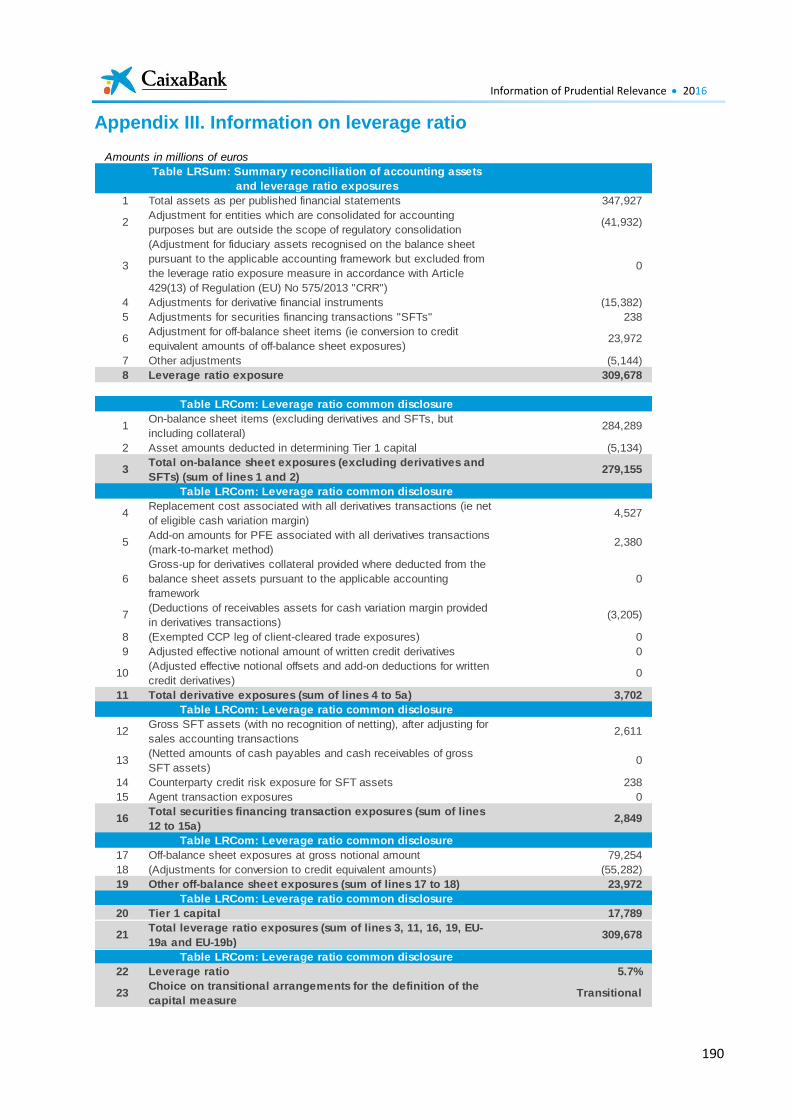
Information of Prudential Relevance 2016
190
Appendix III. Information on leverage ratio
Amounts in millions of euros
Table LRSum: Summary reconciliation of accounting assets
and leverage ratio exposures
1 Total assets as per published financial statements 347,927
2Adjustment for entities which are consolidated for accounting
purposes but are outside the scope of regulatory consolidation(41,932)
3
(Adjustment for fiduciary assets recognised on the balance sheet
pursuant to the applicable accounting framework but excluded from
the leverage ratio exposure measure in accordance with Article
429(13) of Regulation (EU) No 575/2013 "CRR")
0
4 Adjustments for derivative financial instruments (15,382)
5 Adjustments for securities financing transactions "SFTs" 238
6Adjustment for off-balance sheet items (ie conversion to credit
equivalent amounts of off-balance sheet exposures)23,972
7 Other adjustments (5,144)
8 Leverage ratio exposure 309,678
Table LRCom: Leverage ratio common disclosure
1On-balance sheet items (excluding derivatives and SFTs, but
including collateral)284,289
2 Asset amounts deducted in determining Tier 1 capital (5,134)
3Total on-balance sheet exposures (excluding derivatives and
SFTs) (sum of lines 1 and 2)279,155
Table LRCom: Leverage ratio common disclosure
4Replacement cost associated with all derivatives transactions (ie net
of eligible cash variation margin)4,527
5Add-on amounts for PFE associated with all derivatives transactions
(mark-to-market method)2,380
6
Gross-up for derivatives collateral provided where deducted from the
balance sheet assets pursuant to the applicable accounting
framework
0
7(Deductions of receivables assets for cash variation margin provided
in derivatives transactions)(3,205)
8 (Exempted CCP leg of client-cleared trade exposures) 0
9 Adjusted effective notional amount of written credit derivatives 0
10(Adjusted effective notional offsets and add-on deductions for written
credit derivatives)0
11 Total derivative exposures (sum of lines 4 to 5a) 3,702
Table LRCom: Leverage ratio common disclosure
12Gross SFT assets (with no recognition of netting), after adjusting for
sales accounting transactions2,611
13(Netted amounts of cash payables and cash receivables of gross
SFT assets)0
14 Counterparty credit risk exposure for SFT assets 238
15 Agent transaction exposures 0
16Total securities financing transaction exposures (sum of lines
12 to 15a)2,849
Table LRCom: Leverage ratio common disclosure
17 Off-balance sheet exposures at gross notional amount 79,254
18 (Adjustments for conversion to credit equivalent amounts) (55,282)
19 Other off-balance sheet exposures (sum of lines 17 to 18) 23,972
Table LRCom: Leverage ratio common disclosure
20 Tier 1 capital 17,789
21Total leverage ratio exposures (sum of lines 3, 11, 16, 19, EU-
19a and EU-19b)309,678
Table LRCom: Leverage ratio common disclosure
22 Leverage ratio 5.7%
23Choice on transitional arrangements for the definition of the
capital measureTransitional
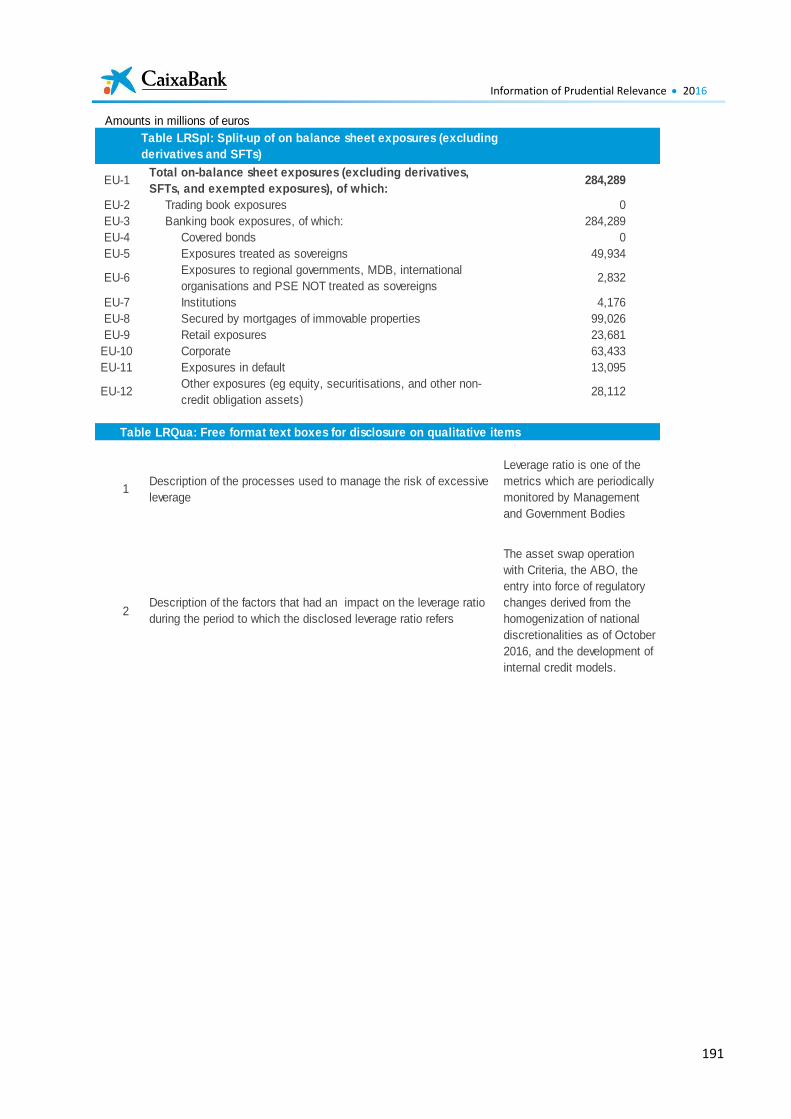
Information of Prudential Relevance 2016
191
Amounts in millions of euros
Table LRSpl: Split-up of on balance sheet exposures (excluding
derivatives and SFTs)
EU-1Total on-balance sheet exposures (excluding derivatives,
SFTs, and exempted exposures), of which:284,289
EU-2 Trading book exposures 0
EU-3 Banking book exposures, of which: 284,289
EU-4 Covered bonds 0
EU-5 Exposures treated as sovereigns 49,934
EU-6Exposures to regional governments, MDB, international
organisations and PSE NOT treated as sovereigns2,832
EU-7 Institutions 4,176
EU-8 Secured by mortgages of immovable properties 99,026
EU-9 Retail exposures 23,681
EU-10 Corporate 63,433
EU-11 Exposures in default 13,095
EU-12Other exposures (eg equity, securitisations, and other non-
credit obligation assets)28,112
Table LRQua: Free format text boxes for disclosure on qualitative items
1Description of the processes used to manage the risk of excessive
leverage
Leverage ratio is one of the
metrics which are periodically
monitored by Management
and Government Bodies
2Description of the factors that had an impact on the leverage ratio
during the period to which the disclosed leverage ratio refers
The asset swap operation
with Criteria, the ABO, the
entry into force of regulatory
changes derived from the
homogenization of national
discretionalities as of October
2016, and the development of
internal credit models.
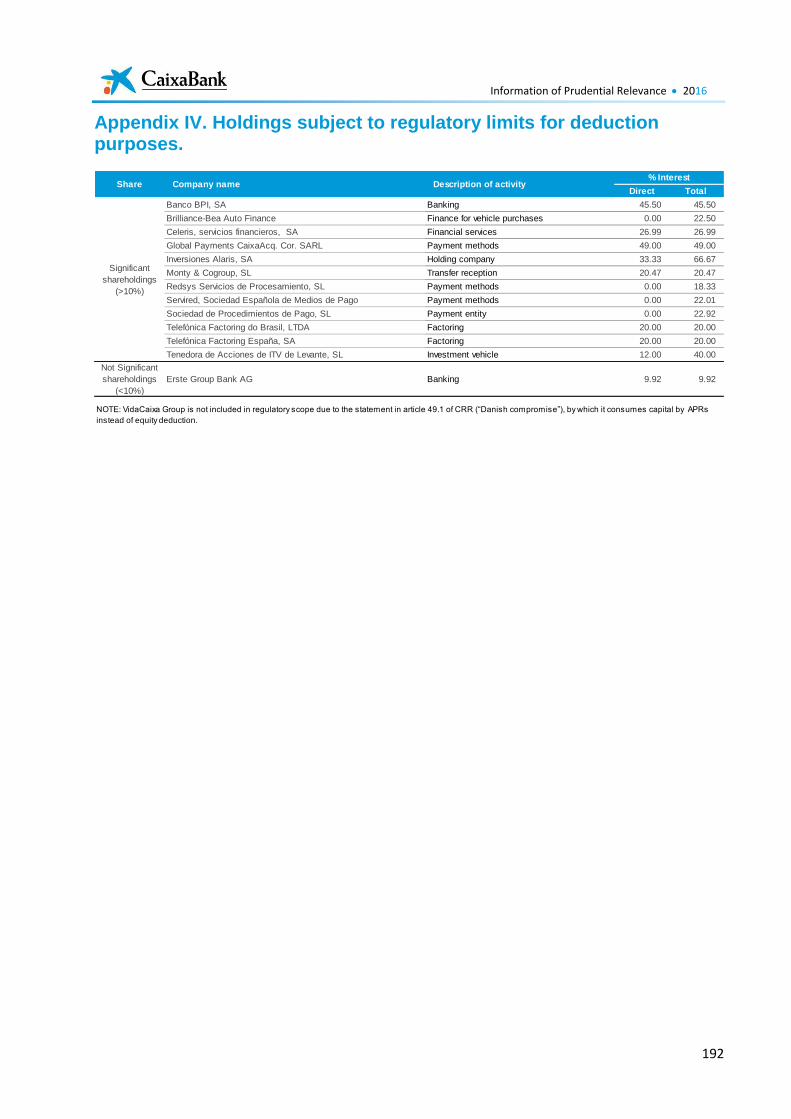
Information of Prudential Relevance 2016
192
Appendix IV. Holdings subject to regulatory limits for deduction purposes.
Direct Total
Banco BPI, SA Banking 45.50 45.50
Brilliance-Bea Auto Finance Finance for vehicle purchases 0.00 22.50
Celeris, servicios financieros, SA Financial services 26.99 26.99
Global Payments CaixaAcq. Cor. SARL Payment methods 49.00 49.00
Inversiones Alaris, SA Holding company 33.33 66.67
Monty & Cogroup, SL Transfer reception 20.47 20.47
Redsys Servicios de Procesamiento, SL Payment methods 0.00 18.33
Servired, Sociedad Española de Medios de Pago Payment methods 0.00 22.01
Sociedad de Procedimientos de Pago, SL Payment entity 0.00 22.92
Telefónica Factoring do Brasil, LTDA Factoring 20.00 20.00
Telefónica Factoring España, SA Factoring 20.00 20.00
Tenedora de Acciones de ITV de Levante, SL Investment vehicle 12.00 40.00
Not Significant
shareholdings
(<10%)
Erste Group Bank AG Banking 9.92 9.92
NOTE: VidaCaixa Group is not included in regulatory scope due to the statement in article 49.1 of CRR (“Danish compromise”), by which it consumes capital by APRs
instead of equity deduction.
Share Company name Description of activity% Interest
Significant
shareholdings
(>10%)
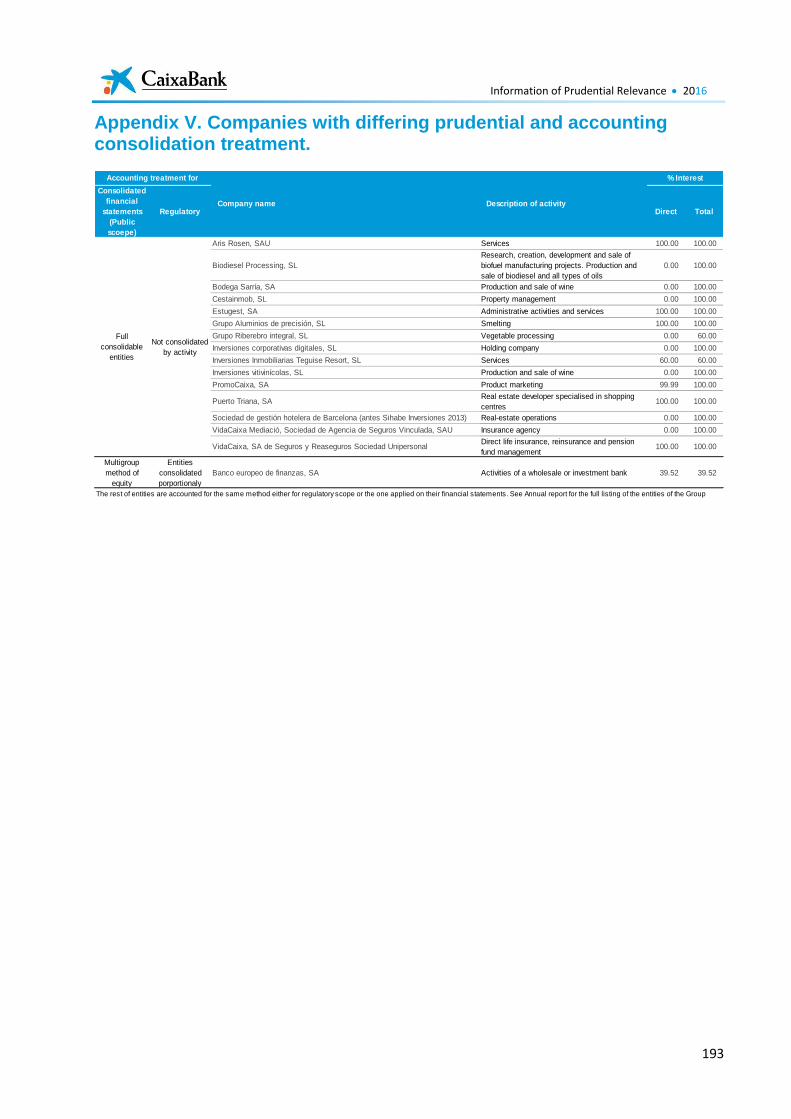
Information of Prudential Relevance 2016
193
Appendix V. Companies with differing prudential and accounting consolidation treatment.
Consolidated
financial
statements
(Public
scoepe)
Regulatory Direct Total
Aris Rosen, SAU Services 100.00 100.00
Biodiesel Processing, SL
Research, creation, development and sale of
biofuel manufacturing projects. Production and
sale of biodiesel and all types of oils
0.00 100.00
Bodega Sarría, SA Production and sale of wine 0.00 100.00
Cestainmob, SL Property management 0.00 100.00
Estugest, SA Administrative activities and services 100.00 100.00
Grupo Aluminios de precisión, SL Smelting 100.00 100.00
Grupo Riberebro integral, SL Vegetable processing 0.00 60.00
Inversiones corporativas digitales, SL Holding company 0.00 100.00
Inversiones Inmobiliarias Teguise Resort, SL Services 60.00 60.00
Inversiones vitivinícolas, SL Production and sale of wine 0.00 100.00
PromoCaixa, SA Product marketing 99.99 100.00
Puerto Triana, SAReal estate developer specialised in shopping
centres100.00 100.00
Sociedad de gestión hotelera de Barcelona (antes Sihabe Inversiones 2013) Real-estate operations 0.00 100.00
VidaCaixa Mediació, Sociedad de Agencia de Seguros Vinculada, SAU Insurance agency 0.00 100.00
VidaCaixa, SA de Seguros y Reaseguros Sociedad UnipersonalDirect life insurance, reinsurance and pension
fund management100.00 100.00
Multigroup
method of
equity
Entities
consolidated
porportionaly
Banco europeo de finanzas, SA Activities of a wholesale or investment bank 39.52 39.52
The rest of entities are accounted for the same method either for regulatory scope or the one applied on their financial statements. See Annual report for the full listing of the entities of the Group
Accounting treatment for
Company name Description of activity
% Interest
Full
consolidable
entities
Not consolidated
by activity
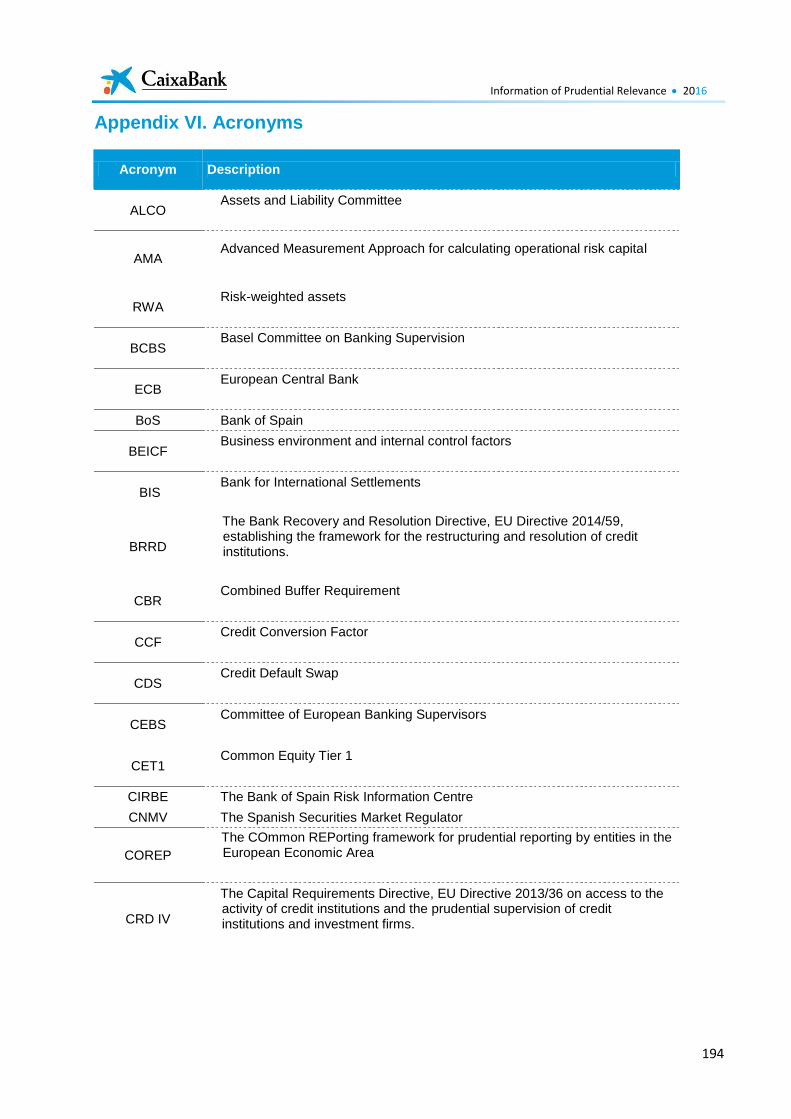
Information of Prudential Relevance 2016
194
Appendix VI. Acronyms
Acronym Description
ALCO Assets and Liability Committee
AMA Advanced Measurement Approach for calculating operational risk capital
RWA Risk-weighted assets
BCBS Basel Committee on Banking Supervision
ECB European Central Bank
BoS Bank of Spain
BEICF Business environment and internal control factors
BIS Bank for International Settlements
BRRD
The Bank Recovery and Resolution Directive, EU Directive 2014/59, establishing the framework for the restructuring and resolution of credit institutions.
CBR Combined Buffer Requirement
CCF Credit Conversion Factor
CDS Credit Default Swap
CEBS Committee of European Banking Supervisors
CET1 Common Equity Tier 1
CIRBE The Bank of Spain Risk Information Centre
CNMV The Spanish Securities Market Regulator
COREP
The COmmon REPorting framework for prudential reporting by entities in the European Economic Area
CRD IV
The Capital Requirements Directive, EU Directive 2013/36 on access to the activity of credit institutions and the prudential supervision of credit institutions and investment firms.
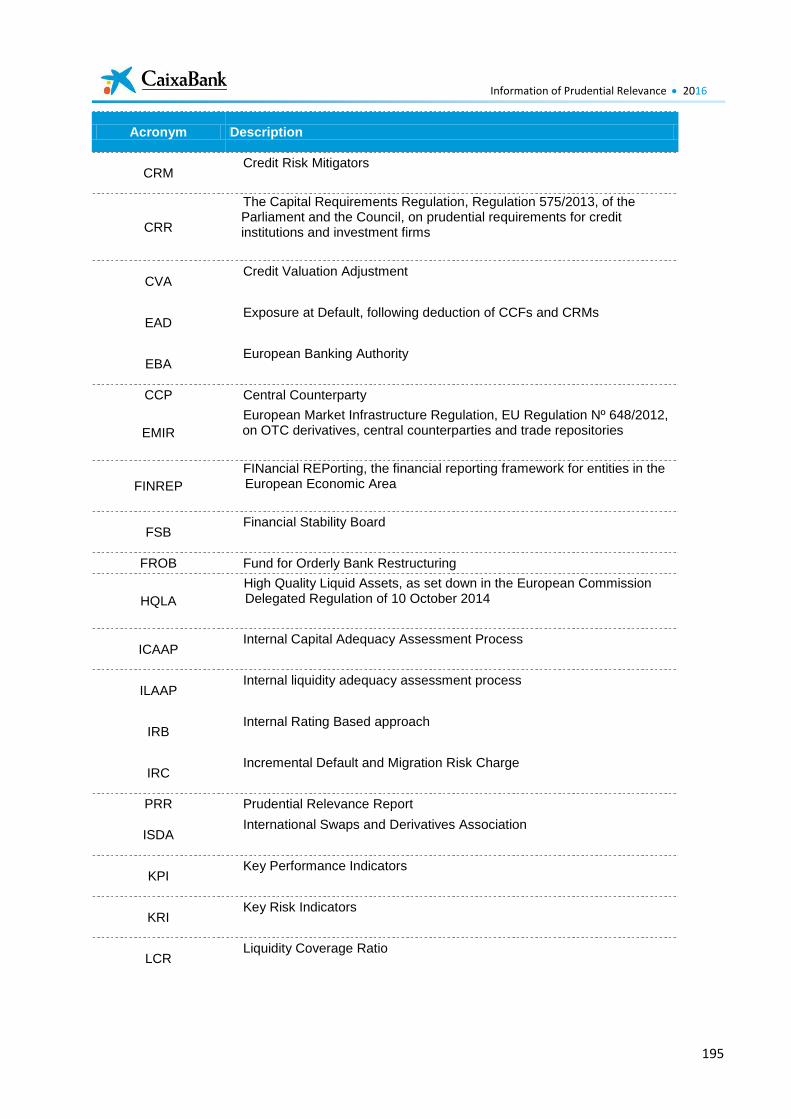
Information of Prudential Relevance 2016
195
Acronym Description
CRM Credit Risk Mitigators
CRR
The Capital Requirements Regulation, Regulation 575/2013, of the Parliament and the Council, on prudential requirements for credit institutions and investment firms
CVA Credit Valuation Adjustment
EAD Exposure at Default, following deduction of CCFs and CRMs
EBA European Banking Authority
CCP Central Counterparty
EMIR
European Market Infrastructure Regulation, EU Regulation Nº 648/2012, on OTC derivatives, central counterparties and trade repositories
FINREP
FINancial REPorting, the financial reporting framework for entities in the European Economic Area
FSB Financial Stability Board
FROB Fund for Orderly Bank Restructuring
HQLA
High Quality Liquid Assets, as set down in the European Commission Delegated Regulation of 10 October 2014
ICAAP Internal Capital Adequacy Assessment Process
ILAAP Internal liquidity adequacy assessment process
IRB Internal Rating Based approach
IRC Incremental Default and Migration Risk Charge
PRR Prudential Relevance Report
ISDA International Swaps and Derivatives Association
KPI Key Performance Indicators
KRI Key Risk Indicators
LCR Liquidity Coverage Ratio
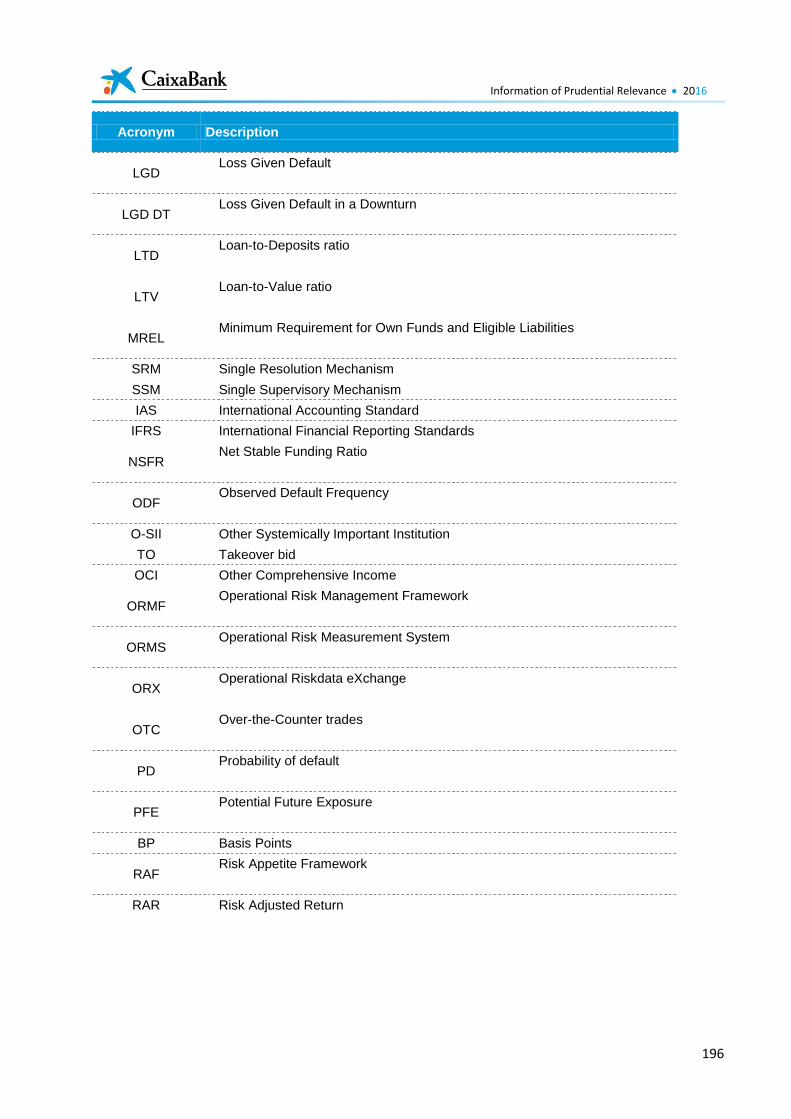
Information of Prudential Relevance 2016
196
Acronym Description
LGD Loss Given Default
LGD DT Loss Given Default in a Downturn
LTD Loan-to-Deposits ratio
LTV Loan-to-Value ratio
MREL Minimum Requirement for Own Funds and Eligible Liabilities
SRM Single Resolution Mechanism
SSM Single Supervisory Mechanism
IAS International Accounting Standard
IFRS International Financial Reporting Standards
NSFR Net Stable Funding Ratio
ODF Observed Default Frequency
O-SII Other Systemically Important Institution
TO Takeover bid
OCI Other Comprehensive Income
ORMF Operational Risk Management Framework
ORMS Operational Risk Measurement System
ORX Operational Riskdata eXchange
OTC Over-the-Counter trades
PD Probability of default
PFE Potential Future Exposure
BP Basis Points
RAF Risk Appetite Framework
RAR Risk Adjusted Return
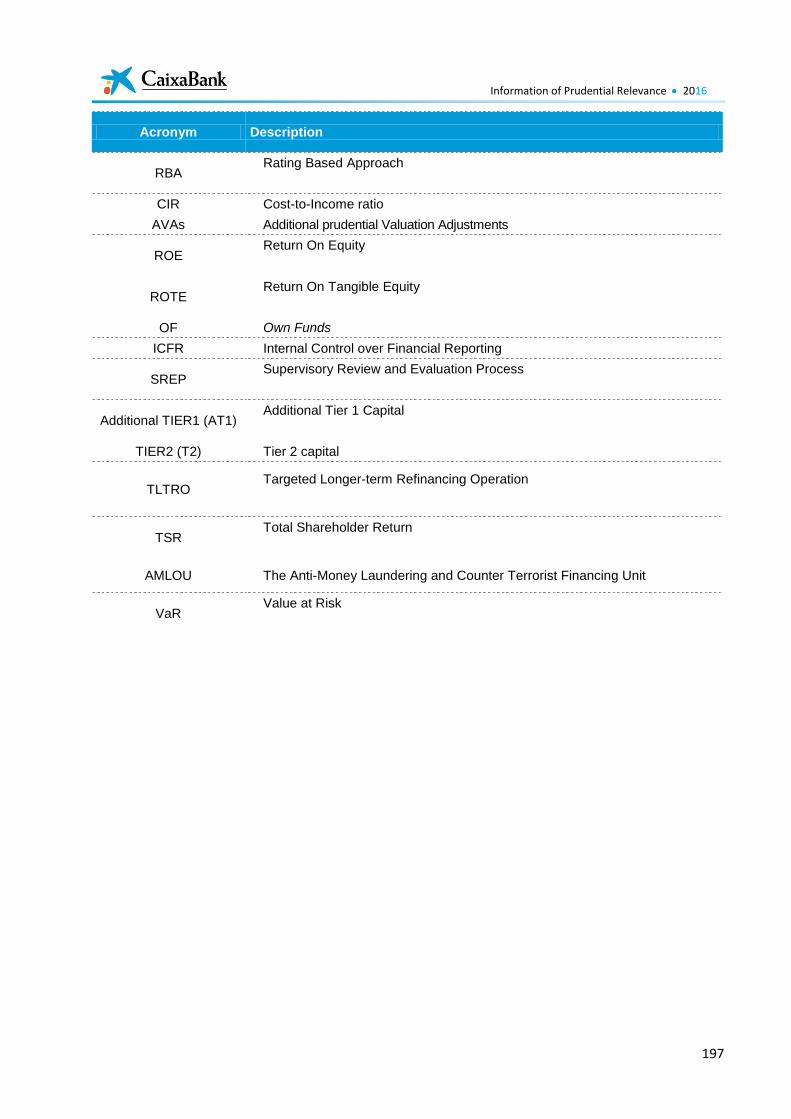
Information of Prudential Relevance 2016
197
Acronym Description
RBA Rating Based Approach
CIR Cost-to-Income ratio
AVAs Additional prudential Valuation Adjustments
ROE Return On Equity
ROTE Return On Tangible Equity
OF Own Funds
ICFR Internal Control over Financial Reporting
SREP Supervisory Review and Evaluation Process
Additional TIER1 (AT1) Additional Tier 1 Capital
TIER2 (T2) Tier 2 capital
TLTRO Targeted Longer-term Refinancing Operation
TSR Total Shareholder Return
AMLOU The Anti-Money Laundering and Counter Terrorist Financing Unit
VaR Value at Risk

Information of Prudential Relevance 2016
198


![[[Pillar 3 Disclosures Quarterly Statutory Return]]](https://img.pdfslide.us/doc/110x75/625c032c23894d2dce57fb27/pillar-3-disclosures-quarterly-statutory-return.jpg)