Embed Size (px)
Citation preview

Pi Global Portfolios
Pi Global Portfolios
Annual Report Year ended 31 March 2014
Pi Global Portfolios
1
Contents
Page Directory 2 Manager's Investment Reports 3 Reports to Unitholders 5 Report to the Trustee 13 Statement by the Manager 14 Independent Auditor's Report 15 Statements of Total Return FS1 Statements of Financial Position FS2 Statements of Movements in Unitholders' Funds FS3 Statements of Portfolio FS4 Notes to the Financial Statements FS8 Important Information FS19
Pi Global Portfolios
2
DIRECTORY
MANAGER Phillip Capital Management (S) Ltd 250 North Bridge Road #06-00 Raffles City Tower Singapore 179101 (Company Registration No. 199905233W)
DIRECTORS OF THE MANAGER Lim Hua Min Loh Hoon Sun Jeffrey Lee Chay Khiong Linus Lim Wen Sheong Lee Ken Hoon
TRUSTEE & REGISTRAR BNP Paribas Trust Services Singapore Limited 20 Collyer Quay #01-01 Singapore 049319 (Company Registration No. 200800851W) CUSTODIAN BNP Paribas Securities Services Singapore Branch 20 Collyer Quay #01-01 Singapore 049319 (Company Registration No. T08FC7287D)
AUDITORS KPMG LLP 16 Raffles Quay #22-00 Hong Leong Building Singapore 048581
SOLICITORS TO THE MANAGER Chan & Goh LLP 50 Craig Road, #03-01 Singapore 089688
SOLICITORS TO THE TRUSTEE Rodyk & Davidson LLP 80 Raffles Place #33-00 UOB Plaza I Singapore 048624
Pi Global Portfolios
3
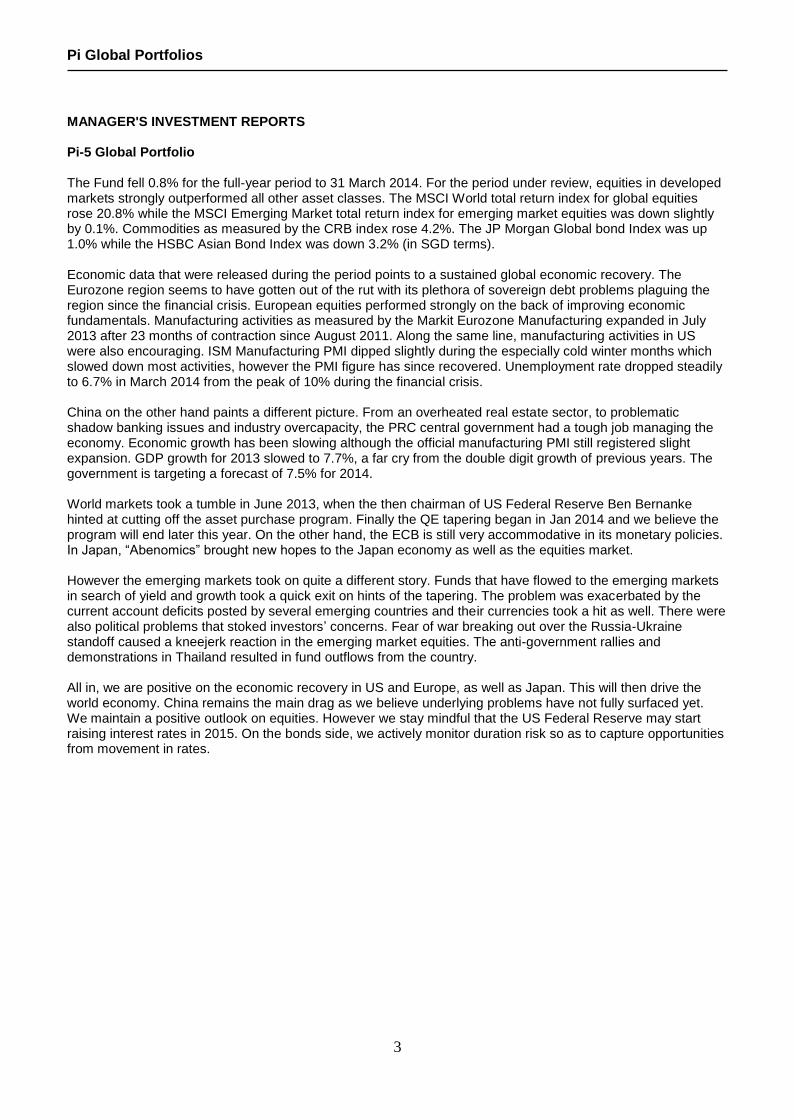
MANAGER'S INVESTMENT REPORTS Pi-5 Global Portfolio The Fund fell 0.8% for the full-year period to 31 March 2014. For the period under review, equities in developed markets strongly outperformed all other asset classes. The MSCI World total return index for global equities rose 20.8% while the MSCI Emerging Market total return index for emerging market equities was down slightly by 0.1%. Commodities as measured by the CRB index rose 4.2%. The JP Morgan Global bond Index was up 1.0% while the HSBC Asian Bond Index was down 3.2% (in SGD terms). Economic data that were released during the period points to a sustained global economic recovery. The Eurozone region seems to have gotten out of the rut with its plethora of sovereign debt problems plaguing the region since the financial crisis. European equities performed strongly on the back of improving economic fundamentals. Manufacturing activities as measured by the Markit Eurozone Manufacturing expanded in July 2013 after 23 months of contraction since August 2011. Along the same line, manufacturing activities in US were also encouraging. ISM Manufacturing PMI dipped slightly during the especially cold winter months which slowed down most activities, however the PMI figure has since recovered. Unemployment rate dropped steadily to 6.7% in March 2014 from the peak of 10% during the financial crisis. China on the other hand paints a different picture. From an overheated real estate sector, to problematic shadow banking issues and industry overcapacity, the PRC central government had a tough job managing the economy. Economic growth has been slowing although the official manufacturing PMI still registered slight expansion. GDP growth for 2013 slowed to 7.7%, a far cry from the double digit growth of previous years. The government is targeting a forecast of 7.5% for 2014. World markets took a tumble in June 2013, when the then chairman of US Federal Reserve Ben Bernanke hinted at cutting off the asset purchase program. Finally the QE tapering began in Jan 2014 and we believe the program will end later this year. On the other hand, the ECB is still very accommodative in its monetary policies. In Japan, “Abenomics” brought new hopes to the Japan economy as well as the equities market. However the emerging markets took on quite a different story. Funds that have flowed to the emerging markets in search of yield and growth took a quick exit on hints of the tapering. The problem was exacerbated by the current account deficits posted by several emerging countries and their currencies took a hit as well. There were also political problems that stoked investors’ concerns. Fear of war breaking out over the Russia-Ukraine standoff caused a kneejerk reaction in the emerging market equities. The anti-government rallies and demonstrations in Thailand resulted in fund outflows from the country. All in, we are positive on the economic recovery in US and Europe, as well as Japan. This will then drive the world economy. China remains the main drag as we believe underlying problems have not fully surfaced yet. We maintain a positive outlook on equities. However we stay mindful that the US Federal Reserve may start raising interest rates in 2015. On the bonds side, we actively monitor duration risk so as to capture opportunities from movement in rates.
Pi Global Portfolios
4
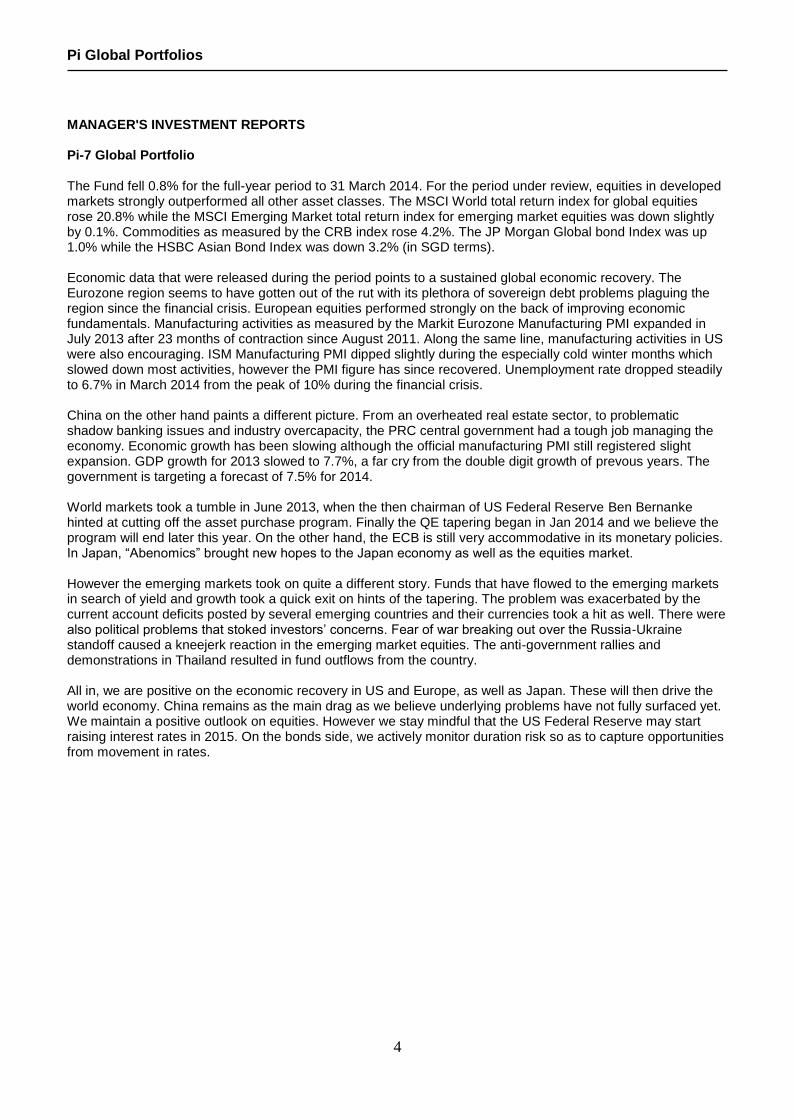
MANAGER'S INVESTMENT REPORTS Pi-7 Global Portfolio The Fund fell 0.8% for the full-year period to 31 March 2014. For the period under review, equities in developed markets strongly outperformed all other asset classes. The MSCI World total return index for global equities rose 20.8% while the MSCI Emerging Market total return index for emerging market equities was down slightly by 0.1%. Commodities as measured by the CRB index rose 4.2%. The JP Morgan Global bond Index was up 1.0% while the HSBC Asian Bond Index was down 3.2% (in SGD terms). Economic data that were released during the period points to a sustained global economic recovery. The Eurozone region seems to have gotten out of the rut with its plethora of sovereign debt problems plaguing the region since the financial crisis. European equities performed strongly on the back of improving economic fundamentals. Manufacturing activities as measured by the Markit Eurozone Manufacturing PMI expanded in July 2013 after 23 months of contraction since August 2011. Along the same line, manufacturing activities in US were also encouraging. ISM Manufacturing PMI dipped slightly during the especially cold winter months which slowed down most activities, however the PMI figure has since recovered. Unemployment rate dropped steadily to 6.7% in March 2014 from the peak of 10% during the financial crisis. China on the other hand paints a different picture. From an overheated real estate sector, to problematic shadow banking issues and industry overcapacity, the PRC central government had a tough job managing the economy. Economic growth has been slowing although the official manufacturing PMI still registered slight expansion. GDP growth for 2013 slowed to 7.7%, a far cry from the double digit growth of prevous years. The government is targeting a forecast of 7.5% for 2014. World markets took a tumble in June 2013, when the then chairman of US Federal Reserve Ben Bernanke hinted at cutting off the asset purchase program. Finally the QE tapering began in Jan 2014 and we believe the program will end later this year. On the other hand, the ECB is still very accommodative in its monetary policies. In Japan, “Abenomics” brought new hopes to the Japan economy as well as the equities market. However the emerging markets took on quite a different story. Funds that have flowed to the emerging markets in search of yield and growth took a quick exit on hints of the tapering. The problem was exacerbated by the current account deficits posted by several emerging countries and their currencies took a hit as well. There were also political problems that stoked investors’ concerns. Fear of war breaking out over the Russia-Ukraine standoff caused a kneejerk reaction in the emerging market equities. The anti-government rallies and demonstrations in Thailand resulted in fund outflows from the country. All in, we are positive on the economic recovery in US and Europe, as well as Japan. These will then drive the world economy. China remains as the main drag as we believe underlying problems have not fully surfaced yet. We maintain a positive outlook on equities. However we stay mindful that the US Federal Reserve may start raising interest rates in 2015. On the bonds side, we actively monitor duration risk so as to capture opportunities from movement in rates.
Pi Global Portfolios
5
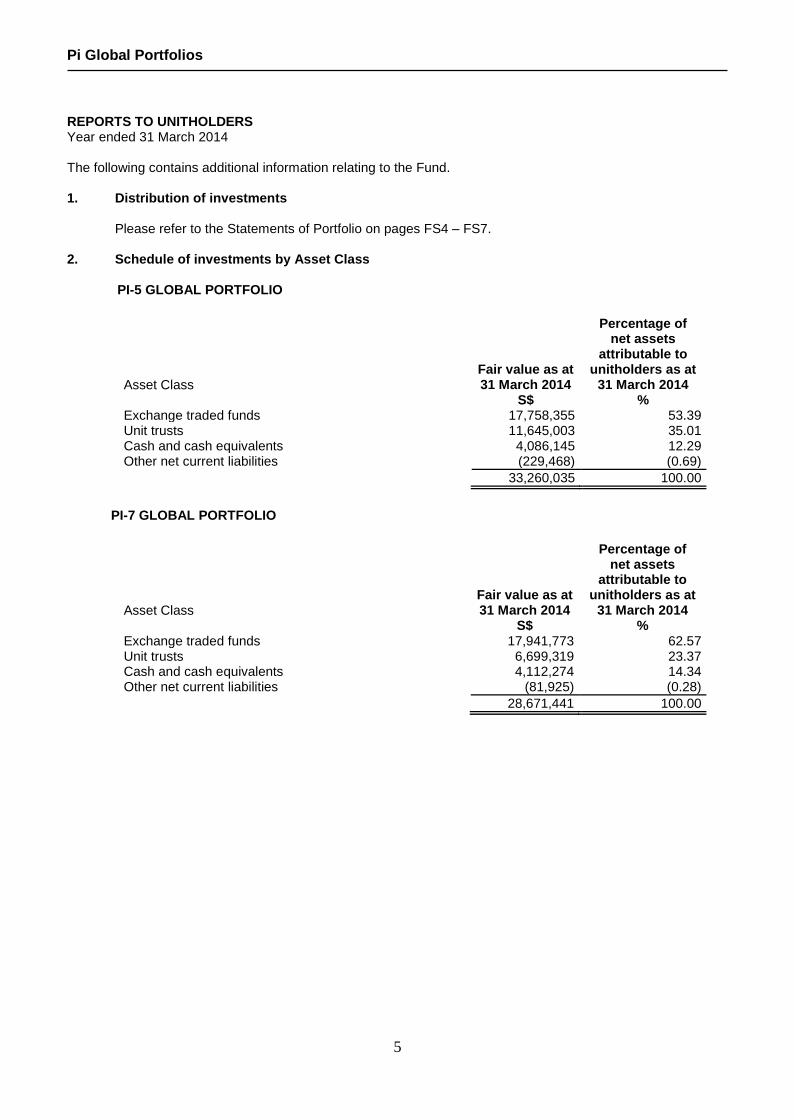
REPORTS TO UNITHOLDERS Year ended 31 March 2014 The following contains additional information relating to the Fund. 1. Distribution of investments
Please refer to the Statements of Portfolio on pages FS4 – FS7. 2. Schedule of investments by Asset Class
PI-5 GLOBAL PORTFOLIO
Asset Class
Fair value as at 31 March 2014
S$
Percentage of net assets
attributable to unitholders as at
31 March 2014 %
Exchange traded funds 17,758,355 53.39 Unit trusts 11,645,003 35.01 Cash and cash equivalents 4,086,145 12.29 Other net current liabilities (229,468) (0.69)
33,260,035 100.00
PI-7 GLOBAL PORTFOLIO
Asset Class
Fair value as at 31 March 2014
S$
Percentage of net assets
attributable to unitholders as at
31 March 2014 %
Exchange traded funds 17,941,773 62.57 Unit trusts 6,699,319 23.37 Cash and cash equivalents 4,112,274 14.34 Other net current liabilities (81,925) (0.28)
28,671,441 100.00
Pi Global Portfolios
6
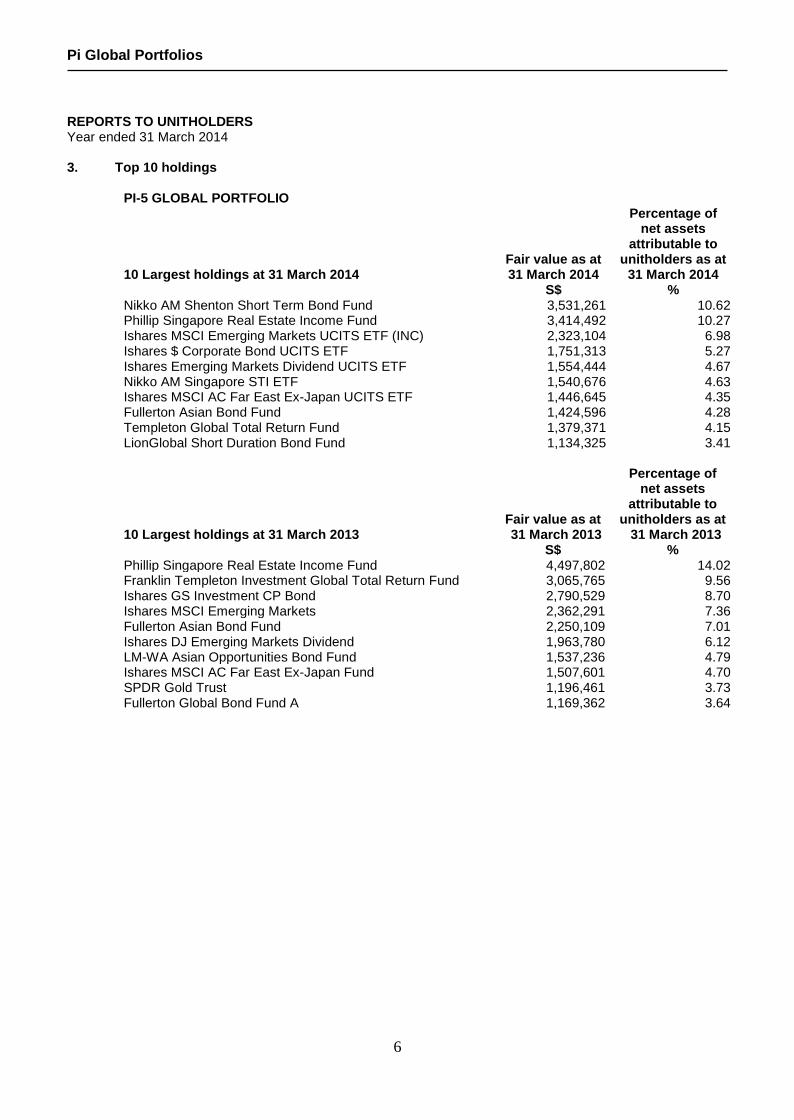
REPORTS TO UNITHOLDERS Year ended 31 March 2014 3. Top 10 holdings
PI-5 GLOBAL PORTFOLIO 10 Largest holdings at 31 March 2014
Fair value as at 31 March 2014
S$
Percentage of net assets
attributable to unitholders as at
31 March 2014 %
Nikko AM Shenton Short Term Bond Fund 3,531,261 10.62 Phillip Singapore Real Estate Income Fund 3,414,492 10.27 Ishares MSCI Emerging Markets UCITS ETF (INC) 2,323,104 6.98 Ishares $ Corporate Bond UCITS ETF 1,751,313 5.27 Ishares Emerging Markets Dividend UCITS ETF 1,554,444 4.67 Nikko AM Singapore STI ETF 1,540,676 4.63 Ishares MSCI AC Far East Ex-Japan UCITS ETF 1,446,645 4.35 Fullerton Asian Bond Fund 1,424,596 4.28 Templeton Global Total Return Fund 1,379,371 4.15 LionGlobal Short Duration Bond Fund 1,134,325 3.41 10 Largest holdings at 31 March 2013
Fair value as at 31 March 2013
S$
Percentage of net assets
attributable to unitholders as at 31 March 2013
% Phillip Singapore Real Estate Income Fund 4,497,802 14.02 Franklin Templeton Investment Global Total Return Fund 3,065,765 9.56 Ishares GS Investment CP Bond 2,790,529 8.70 Ishares MSCI Emerging Markets 2,362,291 7.36 Fullerton Asian Bond Fund 2,250,109 7.01 Ishares DJ Emerging Markets Dividend 1,963,780 6.12 LM-WA Asian Opportunities Bond Fund 1,537,236 4.79 Ishares MSCI AC Far East Ex-Japan Fund 1,507,601 4.70 SPDR Gold Trust 1,196,461 3.73 Fullerton Global Bond Fund A 1,169,362 3.64
Pi Global Portfolios
7
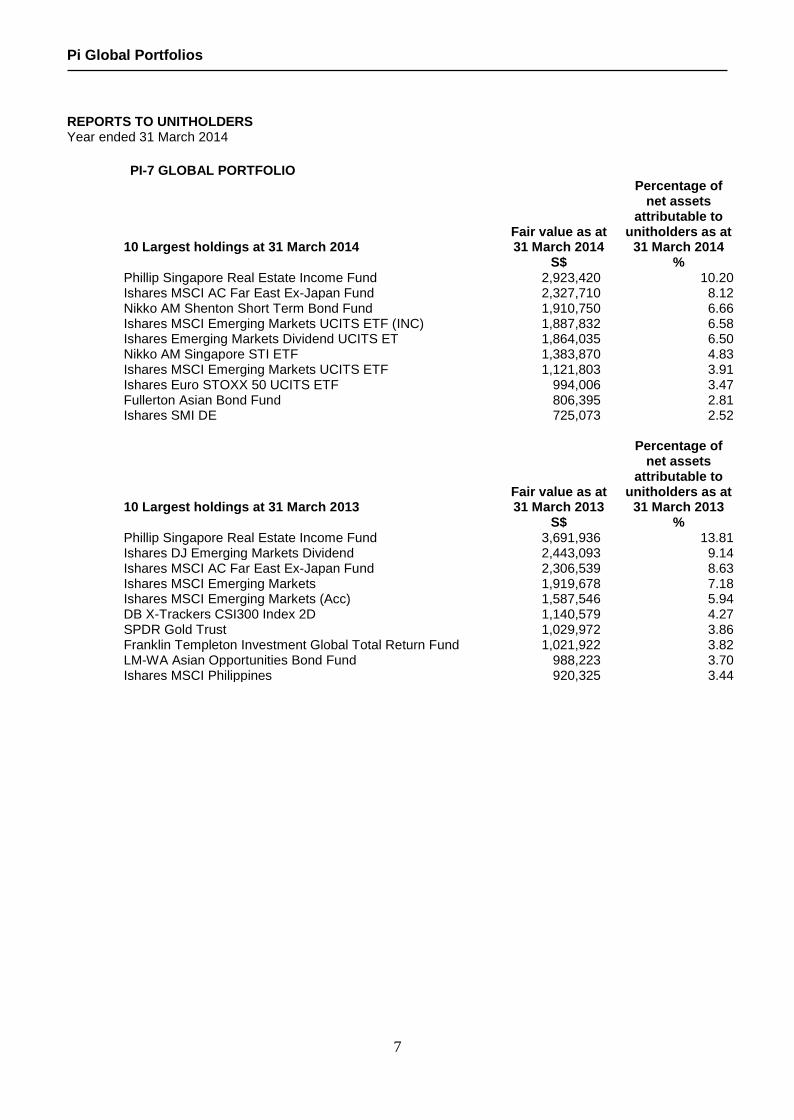
REPORTS TO UNITHOLDERS Year ended 31 March 2014
PI-7 GLOBAL PORTFOLIO 10 Largest holdings at 31 March 2014
Fair value as at 31 March 2014
S$
Percentage of net assets
attributable to unitholders as at
31 March 2014 %
Phillip Singapore Real Estate Income Fund 2,923,420 10.20 Ishares MSCI AC Far East Ex-Japan Fund 2,327,710 8.12 Nikko AM Shenton Short Term Bond Fund 1,910,750 6.66 Ishares MSCI Emerging Markets UCITS ETF (INC) 1,887,832 6.58 Ishares Emerging Markets Dividend UCITS ET 1,864,035 6.50 Nikko AM Singapore STI ETF 1,383,870 4.83 Ishares MSCI Emerging Markets UCITS ETF 1,121,803 3.91 Ishares Euro STOXX 50 UCITS ETF 994,006 3.47 Fullerton Asian Bond Fund 806,395 2.81 Ishares SMI DE 725,073 2.52 10 Largest holdings at 31 March 2013
Fair value as at 31 March 2013
S$
Percentage of net assets
attributable to unitholders as at
31 March 2013 %
Phillip Singapore Real Estate Income Fund 3,691,936 13.81 Ishares DJ Emerging Markets Dividend 2,443,093 9.14 Ishares MSCI AC Far East Ex-Japan Fund 2,306,539 8.63 Ishares MSCI Emerging Markets 1,919,678 7.18 Ishares MSCI Emerging Markets (Acc) 1,587,546 5.94 DB X-Trackers CSI300 Index 2D 1,140,579 4.27 SPDR Gold Trust 1,029,972 3.86 Franklin Templeton Investment Global Total Return Fund 1,021,922 3.82 LM-WA Asian Opportunities Bond Fund 988,223 3.70 Ishares MSCI Philippines 920,325 3.44
Pi Global Portfolios
8
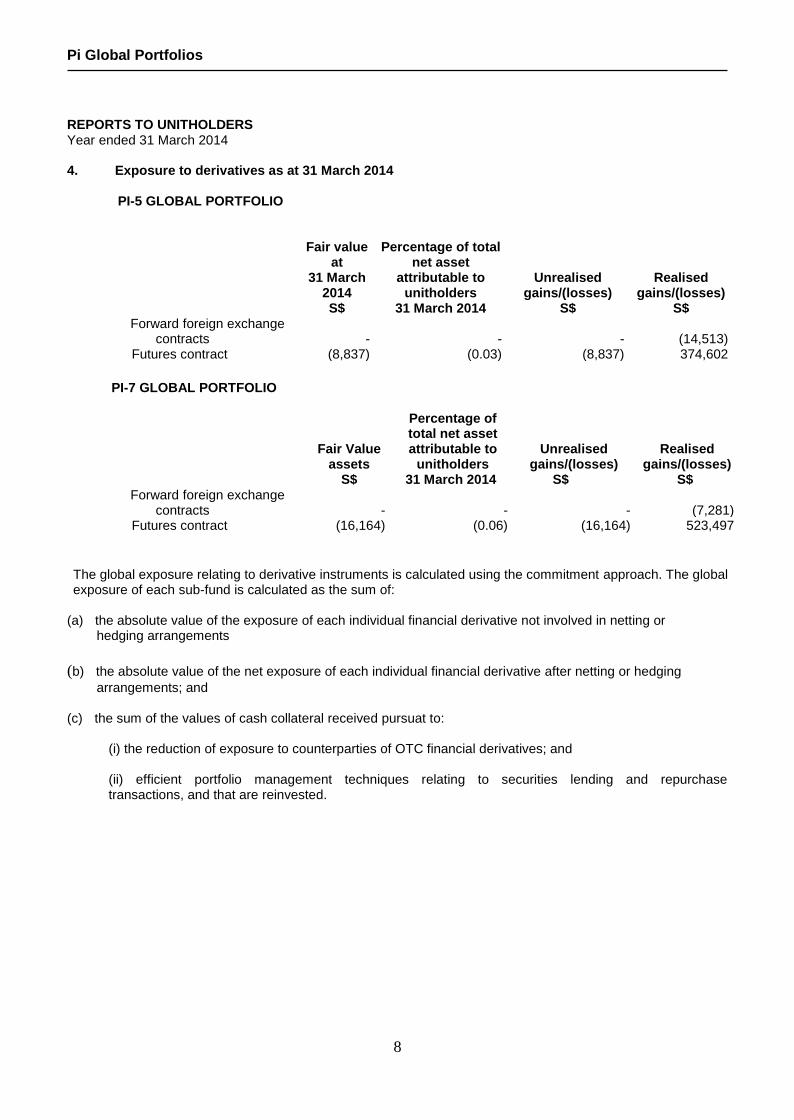
REPORTS TO UNITHOLDERS Year ended 31 March 2014 4. Exposure to derivatives as at 31 March 2014 PI-5 GLOBAL PORTFOLIO
Fair value at
31 March 2014 S$
Percentage of total net asset
attributable to unitholders
31 March 2014
Unrealised
gains/(losses) S$
Realised gains/(losses)
S$ Forward foreign exchange
contracts - - - (14,513) Futures contract (8,837) (0.03) (8,837) 374,602
PI-7 GLOBAL PORTFOLIO
Fair Value assets
S$
Percentage of total net asset attributable to
unitholders 31 March 2014
Unrealised
gains/(losses) S$
Realised gains/(losses)
S$ Forward foreign exchange
contracts - - - (7,281) Futures contract (16,164) (0.06) (16,164) 523,497
The global exposure relating to derivative instruments is calculated using the commitment approach. The global exposure of each sub-fund is calculated as the sum of:
(a) the absolute value of the exposure of each individual financial derivative not involved in netting or hedging arrangements
(b) the absolute value of the net exposure of each individual financial derivative after netting or hedging
arrangements; and (c) the sum of the values of cash collateral received pursuat to:
(i) the reduction of exposure to counterparties of OTC financial derivatives; and (ii) efficient portfolio management techniques relating to securities lending and repurchase transactions, and that are reinvested.
Pi Global Portfolios
9
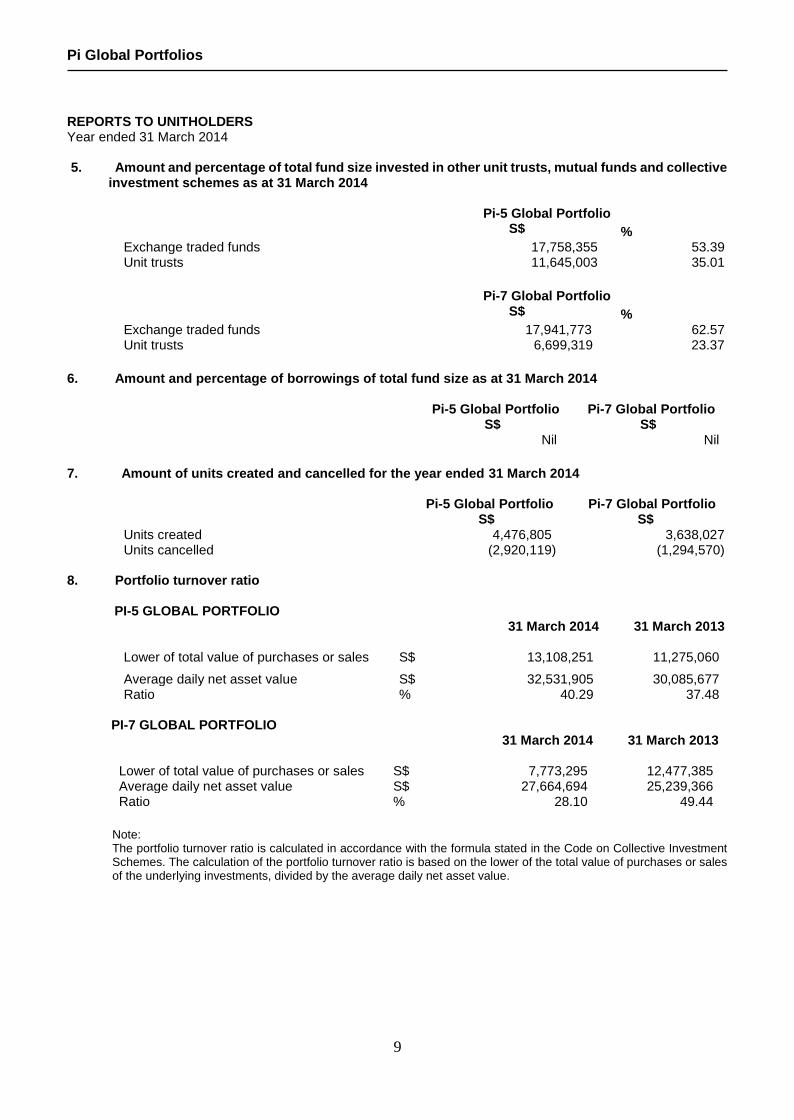
REPORTS TO UNITHOLDERS Year ended 31 March 2014 5. Amount and percentage of total fund size invested in other unit trusts, mutual funds and collective
investment schemes as at 31 March 2014
Pi-5 Global Portfolio S$
%
Exchange traded funds 17,758,355 53.39 Unit trusts 11,645,003 35.01
Pi-7 Global Portfolio S$
%
Exchange traded funds 17,941,773 62.57 Unit trusts 6,699,319 23.37
6. Amount and percentage of borrowings of total fund size as at 31 March 2014
Pi-5 Global Portfolio S$
Pi-7 Global Portfolio S$
Nil Nil
7. Amount of units created and cancelled for the year ended 31 March 2014
Pi-5 Global Portfolio S$
Pi-7 Global Portfolio S$
Units created 4,476,805 3,638,027 Units cancelled (2,920,119) (1,294,570)
8. Portfolio turnover ratio
PI-5 GLOBAL PORTFOLIO
31 March 2014
31 March 2013
Lower of total value of purchases or sales S$ 13,108,251 11,275,060
Average daily net asset value S$ 32,531,905 30,085,677 Ratio % 40.29 37.48
PI-7 GLOBAL PORTFOLIO
31 March 2014
31 March 2013
Lower of total value of purchases or sales S$ 7,773,295 12,477,385 Average daily net asset value S$ 27,664,694 25,239,366 Ratio % 28.10 49.44
Note: The portfolio turnover ratio is calculated in accordance with the formula stated in the Code on Collective Investment Schemes. The calculation of the portfolio turnover ratio is based on the lower of the total value of purchases or sales of the underlying investments, divided by the average daily net asset value.
Pi Global Portfolios
10
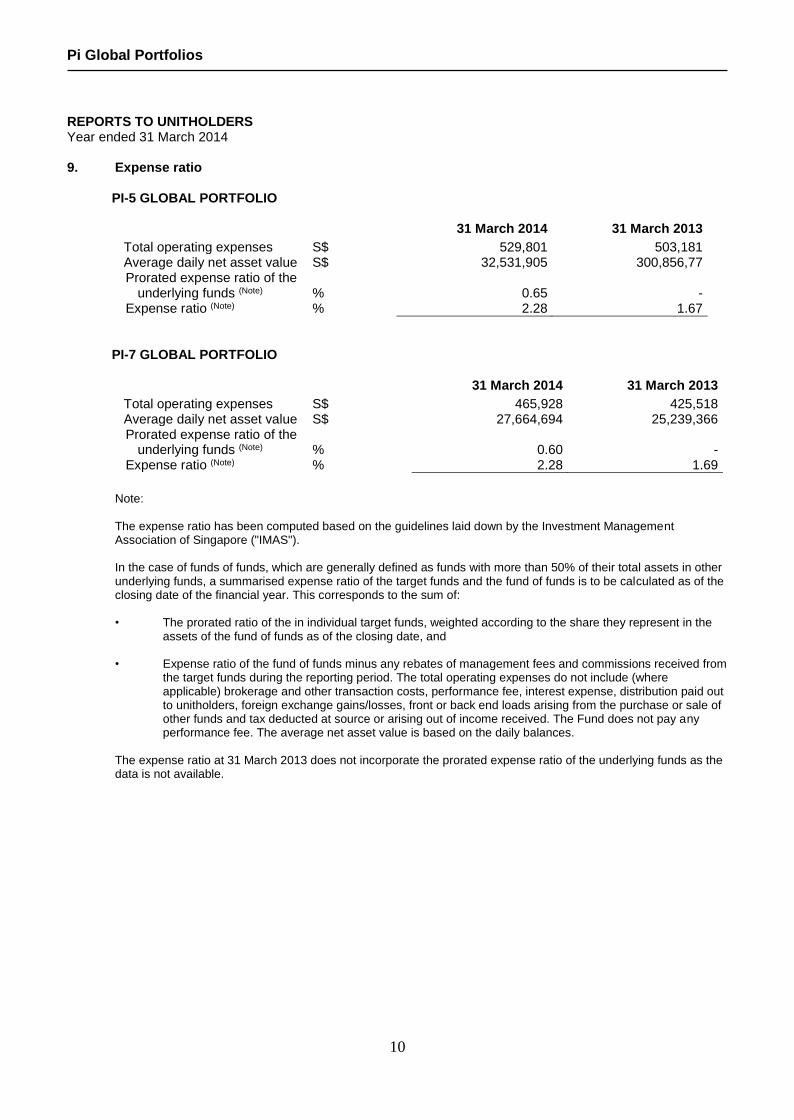
REPORTS TO UNITHOLDERS Year ended 31 March 2014 9. Expense ratio PI-5 GLOBAL PORTFOLIO
31 March 2014 31 March 2013
Total operating expenses S$ 529,801 503,181 Average daily net asset value S$ 32,531,905 300,856,77 Prorated expense ratio of the
underlying funds (Note) %
0.65
-
Expense ratio (Note) % 2.28 1.67
PI-7 GLOBAL PORTFOLIO
31 March 2014 31 March 2013
Total operating expenses S$ 465,928 425,518 Average daily net asset value S$ 27,664,694 25,239,366 Prorated expense ratio of the
underlying funds (Note) %
0.60
-
Expense ratio (Note) % 2.28 1.69
Note: The expense ratio has been computed based on the guidelines laid down by the Investment Management Association of Singapore ("IMAS"). In the case of funds of funds, which are generally defined as funds with more than 50% of their total assets in other underlying funds, a summarised expense ratio of the target funds and the fund of funds is to be calculated as of the closing date of the financial year. This corresponds to the sum of: • The prorated ratio of the in individual target funds, weighted according to the share they represent in the
assets of the fund of funds as of the closing date, and • Expense ratio of the fund of funds minus any rebates of management fees and commissions received from
the target funds during the reporting period. The total operating expenses do not include (where applicable) brokerage and other transaction costs, performance fee, interest expense, distribution paid out to unitholders, foreign exchange gains/losses, front or back end loads arising from the purchase or sale of other funds and tax deducted at source or arising out of income received. The Fund does not pay any performance fee. The average net asset value is based on the daily balances.
The expense ratio at 31 March 2013 does not incorporate the prorated expense ratio of the underlying funds as the data is not available.
Pi Global Portfolios
11
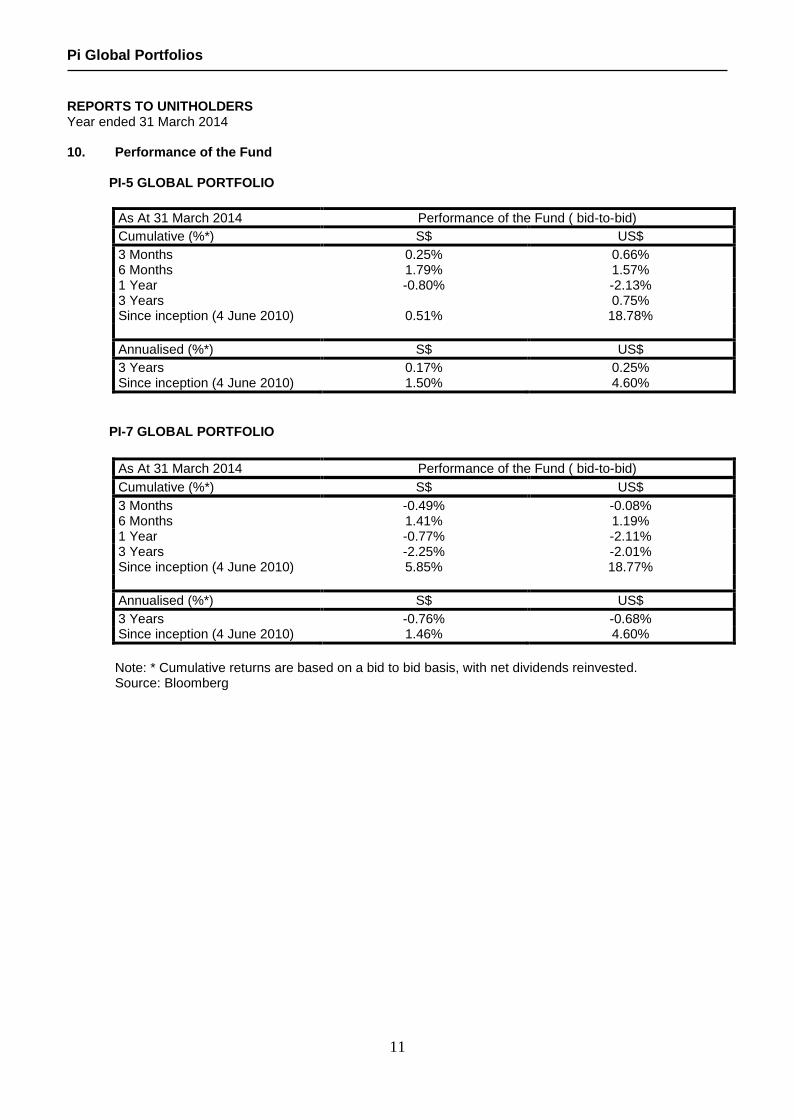
REPORTS TO UNITHOLDERS Year ended 31 March 2014 10. Performance of the Fund
PI-5 GLOBAL PORTFOLIO
As At 31 March 2014 Performance of the Fund ( bid-to-bid)
Cumulative (%*) S$ US$
3 Months 0.25% 0.66% 6 Months 1.79% 1.57% 1 Year -0.80% -2.13% 3 Years 0.75% Since inception (4 June 2010) 0.51% 18.78%
Annualised (%*) S$ US$
3 Years 0.17% 0.25% Since inception (4 June 2010) 1.50% 4.60%
PI-7 GLOBAL PORTFOLIO
As At 31 March 2014 Performance of the Fund ( bid-to-bid)
Cumulative (%*) S$ US$
3 Months -0.49% -0.08% 6 Months 1.41% 1.19% 1 Year -0.77% -2.11% 3 Years -2.25% -2.01% Since inception (4 June 2010) 5.85% 18.77%
Annualised (%*) S$ US$
3 Years -0.76% -0.68% Since inception (4 June 2010) 1.46% 4.60%
Note: * Cumulative returns are based on a bid to bid basis, with net dividends reinvested. Source: Bloomberg
Pi Global Portfolios
12
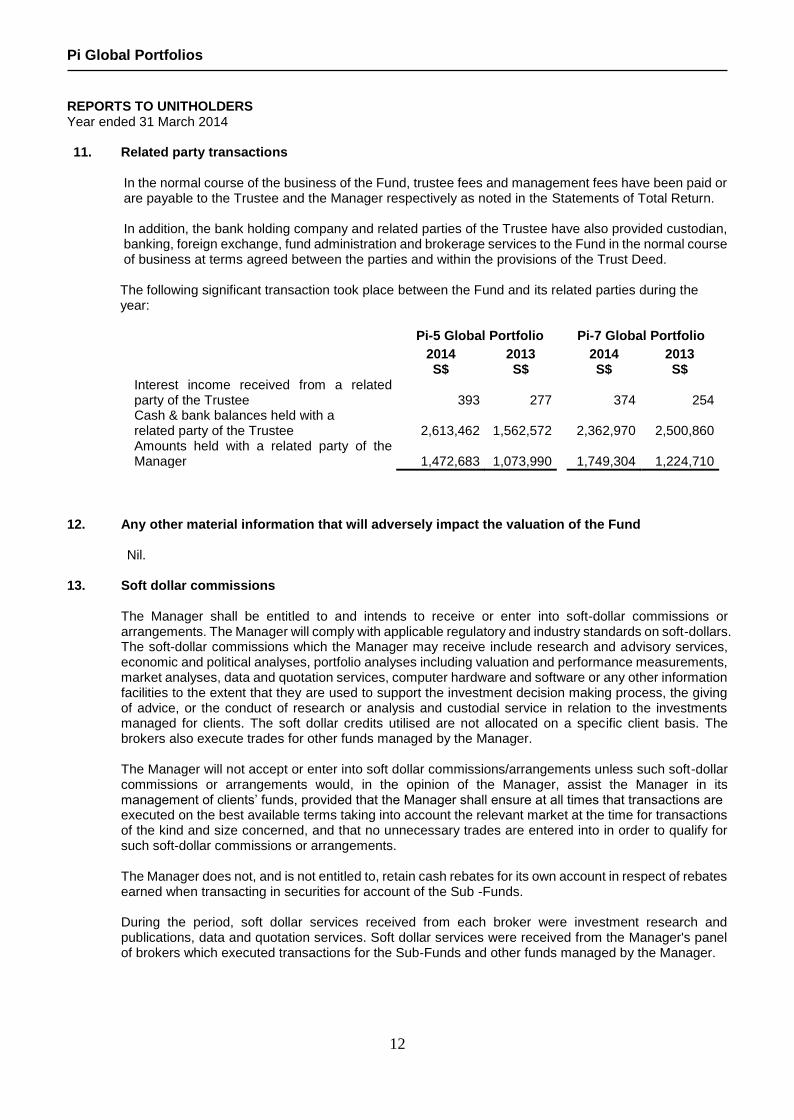
REPORTS TO UNITHOLDERS Year ended 31 March 2014 11. Related party transactions
In the normal course of the business of the Fund, trustee fees and management fees have been paid or are payable to the Trustee and the Manager respectively as noted in the Statements of Total Return. In addition, the bank holding company and related parties of the Trustee have also provided custodian, banking, foreign exchange, fund administration and brokerage services to the Fund in the normal course of business at terms agreed between the parties and within the provisions of the Trust Deed.
The following significant transaction took place between the Fund and its related parties during the year:
Pi-5 Global Portfolio Pi-7 Global Portfolio
2014 S$
2013 S$
2014 S$
2013 S$
Interest income received from a related party of the Trustee 393 277 374 254 Cash & bank balances held with a related party of the Trustee 2,613,462 1,562,572 2,362,970 2,500,860 Amounts held with a related party of the Manager 1,472,683 1,073,990 1,749,304 1,224,710
12. Any other material information that will adversely impact the valuation of the Fund Nil. 13. Soft dollar commissions
The Manager shall be entitled to and intends to receive or enter into soft-dollar commissions or arrangements. The Manager will comply with applicable regulatory and industry standards on soft-dollars. The soft-dollar commissions which the Manager may receive include research and advisory services, economic and political analyses, portfolio analyses including valuation and performance measurements, market analyses, data and quotation services, computer hardware and software or any other information facilities to the extent that they are used to support the investment decision making process, the giving of advice, or the conduct of research or analysis and custodial service in relation to the investments managed for clients. The soft dollar credits utilised are not allocated on a specific client basis. The brokers also execute trades for other funds managed by the Manager. The Manager will not accept or enter into soft dollar commissions/arrangements unless such soft-dollar commissions or arrangements would, in the opinion of the Manager, assist the Manager in its management of clients’ funds, provided that the Manager shall ensure at all times that transactions are executed on the best available terms taking into account the relevant market at the time for transactions of the kind and size concerned, and that no unnecessary trades are entered into in order to qualify for such soft-dollar commissions or arrangements. The Manager does not, and is not entitled to, retain cash rebates for its own account in respect of rebates earned when transacting in securities for account of the Sub -Funds. During the period, soft dollar services received from each broker were investment research and publications, data and quotation services. Soft dollar services were received from the Manager's panel of brokers which executed transactions for the Sub-Funds and other funds managed by the Manager.
Pi Global Portfolios
13
Report of the Trustee The Trustee is under a duty to take into custody and hold the assets of Pi Global Portfolios in trust for the unitholders. In accordance with the Securities and Futures Act (Cap. 289), its subsidiary legislation and the Code on Collective Investment Schemes, the Trustee shall monitor the activities of the Manager for compliance with the limitations imposed on the investment and borrowing powers as set out in the Trust Deed in each annual accounting period and report thereon to unitholders in an annual report. To the best knowledge of the Trustee, the Manager has, in all material respects, managed Pi Global Portfolios during the period covered by these financial statements, set out on pages FS1 to FS18, in accordance with the limitations imposed on the investment and borrowing powers set out in the Trust Deed. For and on behalf of the Trustee BNP Paribas Trust Services Singapore Limited Authorised signatory [date of signing]
:
Pi Global Portfolios
14
Statement by the Manager In the opinion of the directors of Phillip Capital Management (S) Ltd, the accompanying financial statements set out on pages FS1 to FS18, comprising the Statements of Total Return, Statements of Financial Position, Statements of Movements in Unitholders’ Funds, Statements of Portfolio and Notes to the Financial Statements are drawn up so as to present fairly, in all material respects, the financial position of Pi Global Portfolios as at 31 March 2014, and the total return and changes in unitholders’ funds for the year then ended in accordance with the recommendations of Statement of Recommended Accounting Practice 7 “Reporting Framework for Unit Trusts” issued by the Institute of Singapore Chartered Accountants (formerly known as the Institute of Certified Public Accountants of Singapore). At the date of this statement, there are reasonable grounds to believe that Pi Global Portfolios will be able to meet its financial obligations as and when they materialise.
For and on behalf of directors of the Manager Phillip Capital Management (S) Ltd Jeffrey Lee Chay Khiong
Director
[date of signing]:
Pi Global Portfolios
15
Independent auditors' report
Auditors' Report to the Unitholders of Pi Global Portfolios (Constituted under a Trust Deed in the Republic of Singapore)
We have audited the financial statements of Pi Global Portfolios (the “Fund”), which comprise the Statements of Financial Position and Statements of Portfolio as at 31 March 2014, Statements of Total Return and Statements of Movements in Unitholders’ Funds for the year then ended, and a summary of significant accounting policies and other explanatory information, as set out on pages FS1 to FS18. Manager's responsibility for the financial statements The Fund’s Manager (the “Manager”) is responsible for the preparation and fair presentation of these financial statements in accordance with the recommendations of Statement of Recommended Accounting Practice 7 “Reporting Framework for Unit Trusts” issued by the Institute of Singapore Chartered Accountants (formerly known as Institute of Certified Public Accountants of Singapore), and for such internal controls as the Manager determines is necessary to enable the preparation of financial statements that are free from material misstatement, whether due to fraud or error. Auditor’s responsibility Our responsibility is to express an opinion on these financial statements based on our audit. We conducted our audit in accordance with Singapore Standards on Auditing. Those standards require that we comply with ethical requirements and plan and perform the audit to obtain reasonable assurance about whether the financial statements are free from material misstatement. An audit involves performing procedures to obtain audit evidence about the amounts and disclosures in the financial statements. The procedures selected depend on the auditor’s judgment, including the assessment of the risks of material misstatement of the financial statements, whether due to fraud or error. In making those risk assessments, the auditor considers internal control relevant to the Fund’s preparation and fair presentation of financial statements in order to design audit procedures that are appropriate in the circumstances, but not for the purpose of expressing an opinion on the effectiveness of the Fund’s internal control. An audit also includes evaluating the appropriateness of accounting policies used and the reasonableness of accounting estimates made by the Manager, as well as evaluating the overall presentation of the financial statements. We believe that the audit evidence we have obtained is sufficient and appropriate to provide a basis for our audit opinion. Opinion In our opinion, the financial statements present fairly, in all material respects, the financial position of the Fund as at 31 March 2014 and the total return and movements in unitholders' funds for the year then ended, in accordance with the recommendations of Statement of Recommended Accounting Practice 7 “Reporting Framework for Unit Trusts” issued by the Institute of Singapore Chartered Accountants (formerly known as the Institute of Certified Public Accountants of Singapore). KPMG LLP Public Accountants and Chartered Accountants Singapore [date of signing]
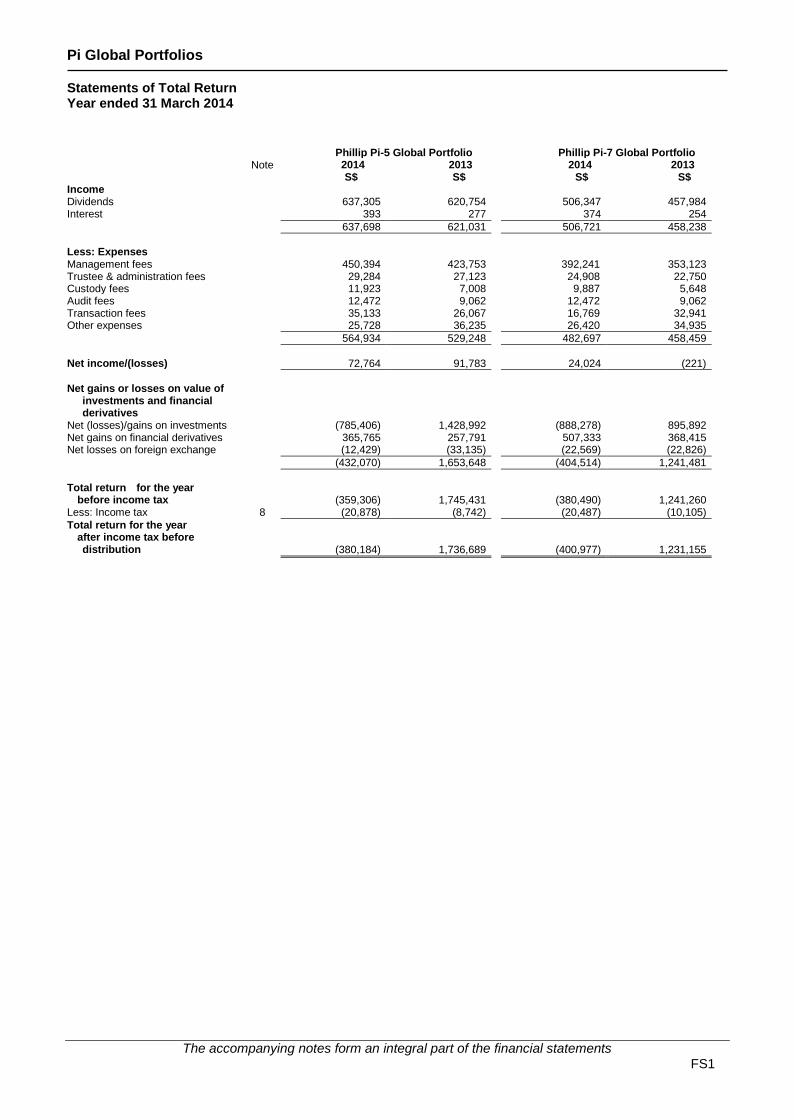
Pi Global Portfolios Statements of Total Return Year ended 31 March 2014
The accompanying notes form an integral part of the financial statements FS1
Phillip Pi-5 Global Portfolio Phillip Pi-7 Global Portfolio Note 2014 2013 2014 2013 S$ S$ S$ S$ Income Dividends 637,305 620,754 506,347 457,984 Interest 393 277 374 254
637,698 621,031 506,721 458,238
Less: Expenses Management fees 450,394 423,753 392,241 353,123 Trustee & administration fees 29,284 27,123 24,908 22,750 Custody fees 11,923 7,008 9,887 5,648 Audit fees 12,472 9,062 12,472 9,062 Transaction fees 35,133 26,067 16,769 32,941 Other expenses 25,728 36,235 26,420 34,935
564,934 529,248 482,697 458,459
Net income/(losses) 72,764 91,783 24,024 (221)
Net gains or losses on value of investments and financial derivatives
Net (losses)/gains on investments (785,406) 1,428,992 (888,278) 895,892 Net gains on financial derivatives 365,765 257,791 507,333 368,415 Net losses on foreign exchange (12,429) (33,135) (22,569) (22,826)
(432,070) 1,653,648 (404,514) 1,241,481
Total return for the year before income tax
(359,306) 1,745,431 (380,490) 1,241,260
Less: Income tax 8 (20,878) (8,742) (20,487) (10,105)
Total return for the year after income tax before distribution
(380,184)
1,736,689
(400,977)
1,231,155
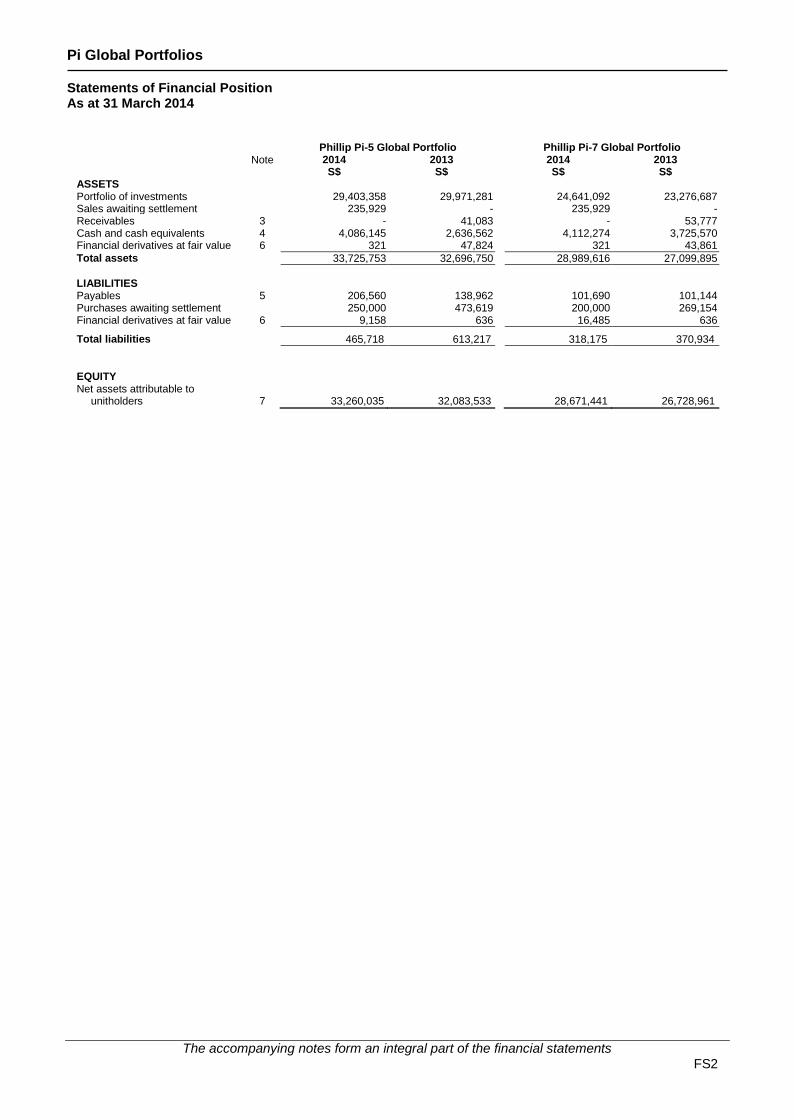
Pi Global Portfolios Statements of Financial Position As at 31 March 2014
The accompanying notes form an integral part of the financial statements FS2
Phillip Pi-5 Global Portfolio Phillip Pi-7 Global Portfolio
Note 2014 2013 2014 2013 S$ S$ S$ S$ ASSETS Portfolio of investments 29,403,358 29,971,281 24,641,092 23,276,687 Sales awaiting settlement 235,929 - 235,929 - Receivables 3 - 41,083 - 53,777 Cash and cash equivalents 4 4,086,145 2,636,562 4,112,274 3,725,570 Financial derivatives at fair value 6 321 47,824 321 43,861
Total assets 33,725,753 32,696,750 28,989,616 27,099,895
LIABILITIES Payables 5 206,560 138,962 101,690 101,144 Purchases awaiting settlement 250,000 473,619 200,000 269,154 Financial derivatives at fair value 6 9,158 636 16,485 636
Total liabilities 465,718 613,217 318,175 370,934
EQUITY Net assets attributable to unitholders 7 33,260,035 32,083,533 28,671,441 26,728,961
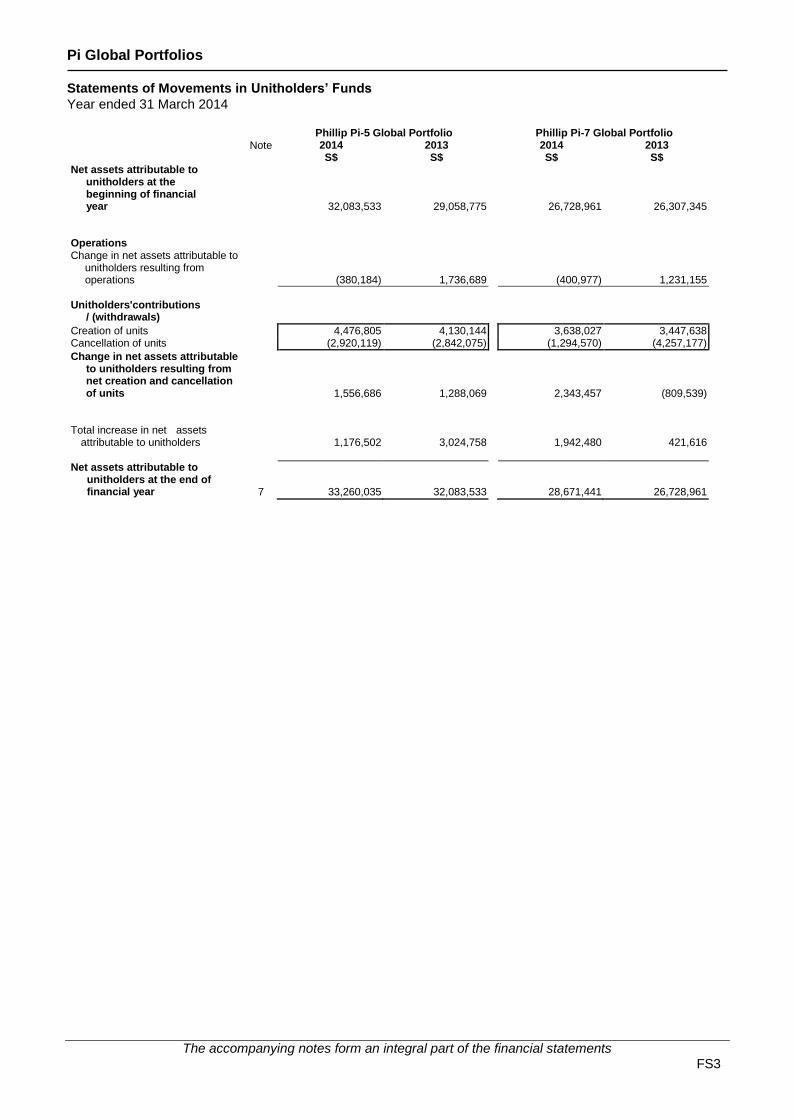
Pi Global Portfolios Statements of Movements in Unitholders’ Funds
Year ended 31 March 2014
The accompanying notes form an integral part of the financial statements FS3
Phillip Pi-5 Global Portfolio Phillip Pi-7 Global Portfolio Note 2014 2013 2014 2013 S$ S$ S$ S$ Net assets attributable to unitholders at the beginning of financial year
32,083,533 29,058,775 26,728,961 26,307,345 Operations Change in net assets attributable to unitholders resulting from operations
(380,184)
1,736,689
(400,977)
1,231,155
Unitholders'contributions / (withdrawals)
Creation of units 4,476,805 4,130,144 3,638,027 3,447,638 Cancellation of units (2,920,119) (2,842,075) (1,294,570) (4,257,177)
Change in net assets attributable to unitholders resulting from net creation and cancellation of units
1,556,686
1,288,069
2,343,457
(809,539) Total increase in net assets
attributable to unitholders
1,176,502
3,024,758
1,942,480
421,616
Net assets attributable to unitholders at the end of financial year 7
33,260,035
32,083,533
28,671,441
26,728,961
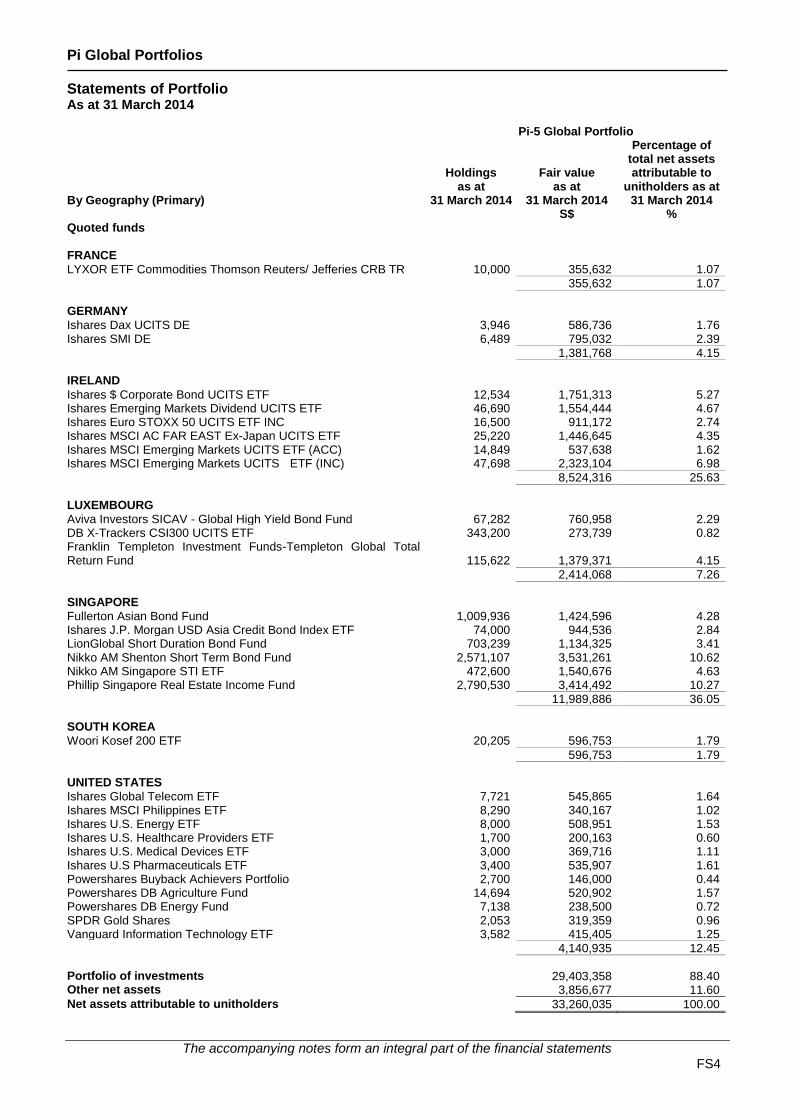
Pi Global Portfolios Statements of Portfolio As at 31 March 2014
The accompanying notes form an integral part of the financial statements FS4
Pi-5 Global Portfolio
By Geography (Primary)
Holdings as at
31 March 2014
Fair value as at
31 March 2014
Percentage of total net assets attributable to
unitholders as at 31 March 2014
S$ % Quoted funds
FRANCE
LYXOR ETF Commodities Thomson Reuters/ Jefferies CRB TR 10,000 355,632 1.07
355,632 1.07
GERMANY
Ishares Dax UCITS DE 3,946 586,736 1.76
Ishares SMI DE 6,489 795,032 2.39
1,381,768 4.15
IRELAND
Ishares $ Corporate Bond UCITS ETF 12,534 1,751,313 5.27
Ishares Emerging Markets Dividend UCITS ETF 46,690 1,554,444 4.67
Ishares Euro STOXX 50 UCITS ETF INC 16,500 911,172 2.74
Ishares MSCI AC FAR EAST Ex-Japan UCITS ETF 25,220 1,446,645 4.35
Ishares MSCI Emerging Markets UCITS ETF (ACC) 14,849 537,638 1.62
Ishares MSCI Emerging Markets UCITS ETF (INC) 47,698 2,323,104 6.98
8,524,316 25.63
LUXEMBOURG
Aviva Investors SICAV - Global High Yield Bond Fund 67,282 760,958 2.29
DB X-Trackers CSI300 UCITS ETF 343,200 273,739 0.82
Franklin Templeton Investment Funds-Templeton Global Total Return Fund 115,622 1,379,371 4.15
2,414,068 7.26
SINGAPORE
Fullerton Asian Bond Fund 1,009,936 1,424,596 4.28 Ishares J.P. Morgan USD Asia Credit Bond Index ETF 74,000 944,536 2.84 LionGlobal Short Duration Bond Fund 703,239 1,134,325 3.41 Nikko AM Shenton Short Term Bond Fund 2,571,107 3,531,261 10.62 Nikko AM Singapore STI ETF 472,600 1,540,676 4.63 Phillip Singapore Real Estate Income Fund 2,790,530 3,414,492 10.27
11,989,886 36.05
SOUTH KOREA Woori Kosef 200 ETF 20,205 596,753 1.79
596,753 1.79
UNITED STATES Ishares Global Telecom ETF 7,721 545,865 1.64 Ishares MSCI Philippines ETF 8,290 340,167 1.02 Ishares U.S. Energy ETF 8,000 508,951 1.53 Ishares U.S. Healthcare Providers ETF 1,700 200,163 0.60 Ishares U.S. Medical Devices ETF 3,000 369,716 1.11 Ishares U.S Pharmaceuticals ETF 3,400 535,907 1.61 Powershares Buyback Achievers Portfolio 2,700 146,000 0.44 Powershares DB Agriculture Fund 14,694 520,902 1.57 Powershares DB Energy Fund 7,138 238,500 0.72 SPDR Gold Shares 2,053 319,359 0.96 Vanguard Information Technology ETF 3,582 415,405 1.25 4,140,935 12.45
Portfolio of investments 29,403,358 88.40 Other net assets 3,856,677 11.60
Net assets attributable to unitholders 33,260,035 100.00
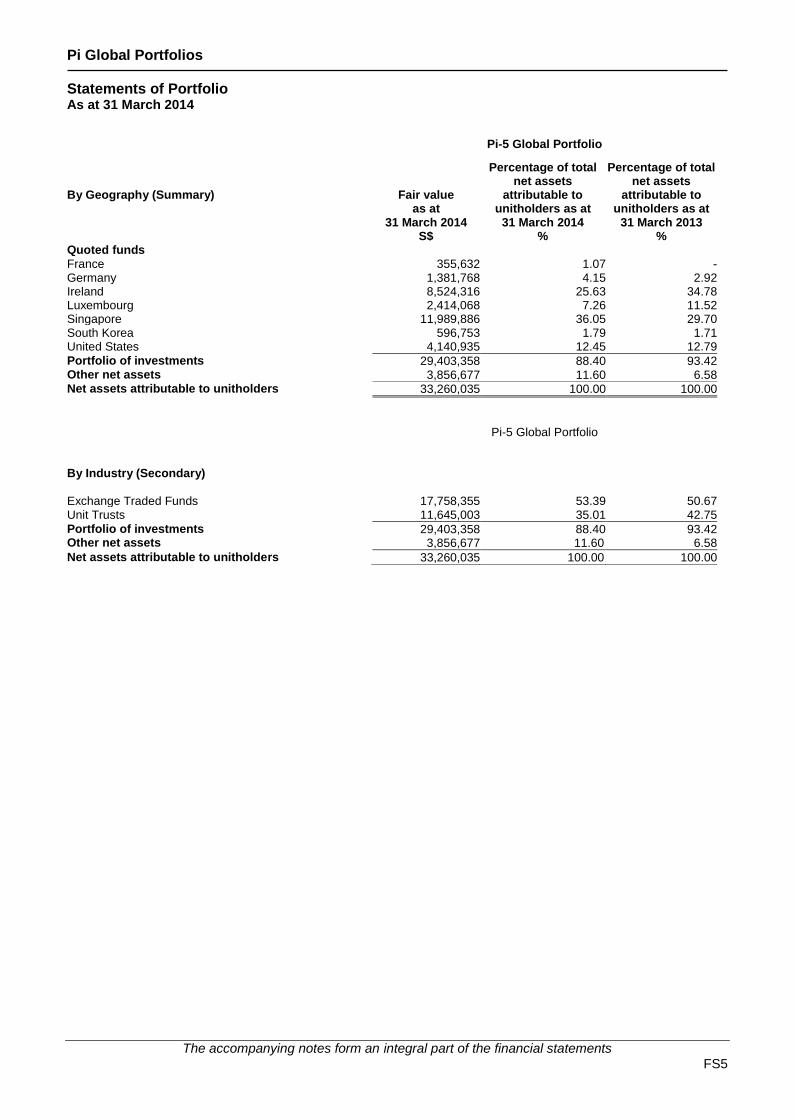
Pi Global Portfolios Statements of Portfolio As at 31 March 2014
The accompanying notes form an integral part of the financial statements FS5
Pi-5 Global Portfolio
By Geography (Summary)
Fair value as at
31 March 2014
Percentage of total net assets
attributable to unitholders as at
31 March 2014
Percentage of total net assets
attributable to unitholders as at
31 March 2013 S$ % % Quoted funds
France 355,632 1.07 -
Germany 1,381,768 4.15 2.92 Ireland 8,524,316 25.63 34.78 Luxembourg 2,414,068 7.26 11.52 Singapore 11,989,886 36.05 29.70 South Korea 596,753 1.79 1.71 United States 4,140,935 12.45 12.79
Portfolio of investments 29,403,358 88.40 93.42 Other net assets 3,856,677 11.60 6.58 Net assets attributable to unitholders 33,260,035 100.00 100.00
Pi-5 Global Portfolio
By Industry (Secondary)
Exchange Traded Funds 17,758,355 53.39 50.67 Unit Trusts 11,645,003 35.01 42.75
Portfolio of investments 29,403,358 88.40 93.42 Other net assets 3,856,677 11.60 6.58
Net assets attributable to unitholders 33,260,035 100.00 100.00
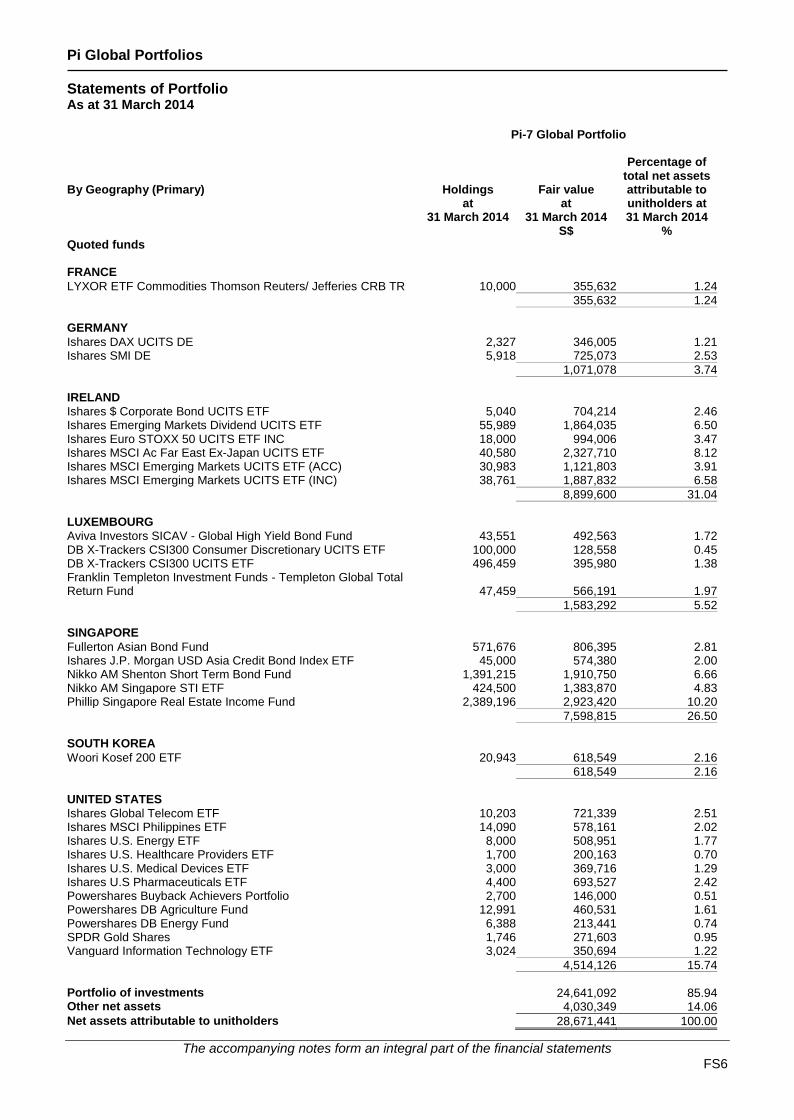
Pi Global Portfolios Statements of Portfolio As at 31 March 2014
The accompanying notes form an integral part of the financial statements FS6
Pi-7 Global Portfolio
By Geography (Primary)
Holdings at
31 March 2014
Fair value at
31 March 2014
Percentage of total net assets attributable to unitholders at 31 March 2014
S$ % Quoted funds
FRANCE
LYXOR ETF Commodities Thomson Reuters/ Jefferies CRB TR 10,000 355,632 1.24
355,632 1.24
GERMANY
Ishares DAX UCITS DE 2,327 346,005 1.21
Ishares SMI DE 5,918 725,073 2.53
1,071,078 3.74
IRELAND
Ishares $ Corporate Bond UCITS ETF 5,040 704,214 2.46
Ishares Emerging Markets Dividend UCITS ETF 55,989 1,864,035 6.50
Ishares Euro STOXX 50 UCITS ETF INC 18,000 994,006 3.47
Ishares MSCI Ac Far East Ex-Japan UCITS ETF 40,580 2,327,710 8.12
Ishares MSCI Emerging Markets UCITS ETF (ACC) 30,983 1,121,803 3.91
Ishares MSCI Emerging Markets UCITS ETF (INC) 38,761 1,887,832 6.58
8,899,600 31.04
LUXEMBOURG
Aviva Investors SICAV - Global High Yield Bond Fund 43,551 492,563 1.72
DB X-Trackers CSI300 Consumer Discretionary UCITS ETF 100,000 128,558 0.45
DB X-Trackers CSI300 UCITS ETF 496,459 395,980 1.38
Franklin Templeton Investment Funds - Templeton Global Total Return Fund 47,459 566,191 1.97
1,583,292 5.52
SINGAPORE
Fullerton Asian Bond Fund 571,676 806,395 2.81
Ishares J.P. Morgan USD Asia Credit Bond Index ETF 45,000 574,380 2.00
Nikko AM Shenton Short Term Bond Fund 1,391,215 1,910,750 6.66
Nikko AM Singapore STI ETF 424,500 1,383,870 4.83
Phillip Singapore Real Estate Income Fund 2,389,196 2,923,420 10.20
7,598,815 26.50
SOUTH KOREA
Woori Kosef 200 ETF 20,943 618,549 2.16
618,549 2.16
UNITED STATES
Ishares Global Telecom ETF 10,203 721,339 2.51
Ishares MSCI Philippines ETF 14,090 578,161 2.02
Ishares U.S. Energy ETF 8,000 508,951 1.77
Ishares U.S. Healthcare Providers ETF 1,700 200,163 0.70
Ishares U.S. Medical Devices ETF 3,000 369,716 1.29
Ishares U.S Pharmaceuticals ETF 4,400 693,527 2.42
Powershares Buyback Achievers Portfolio 2,700 146,000 0.51
Powershares DB Agriculture Fund 12,991 460,531 1.61
Powershares DB Energy Fund 6,388 213,441 0.74
SPDR Gold Shares 1,746 271,603 0.95
Vanguard Information Technology ETF 3,024 350,694 1.22
4,514,126 15.74
Portfolio of investments 24,641,092 85.94 Other net assets 4,030,349 14.06
Net assets attributable to unitholders 28,671,441 100.00
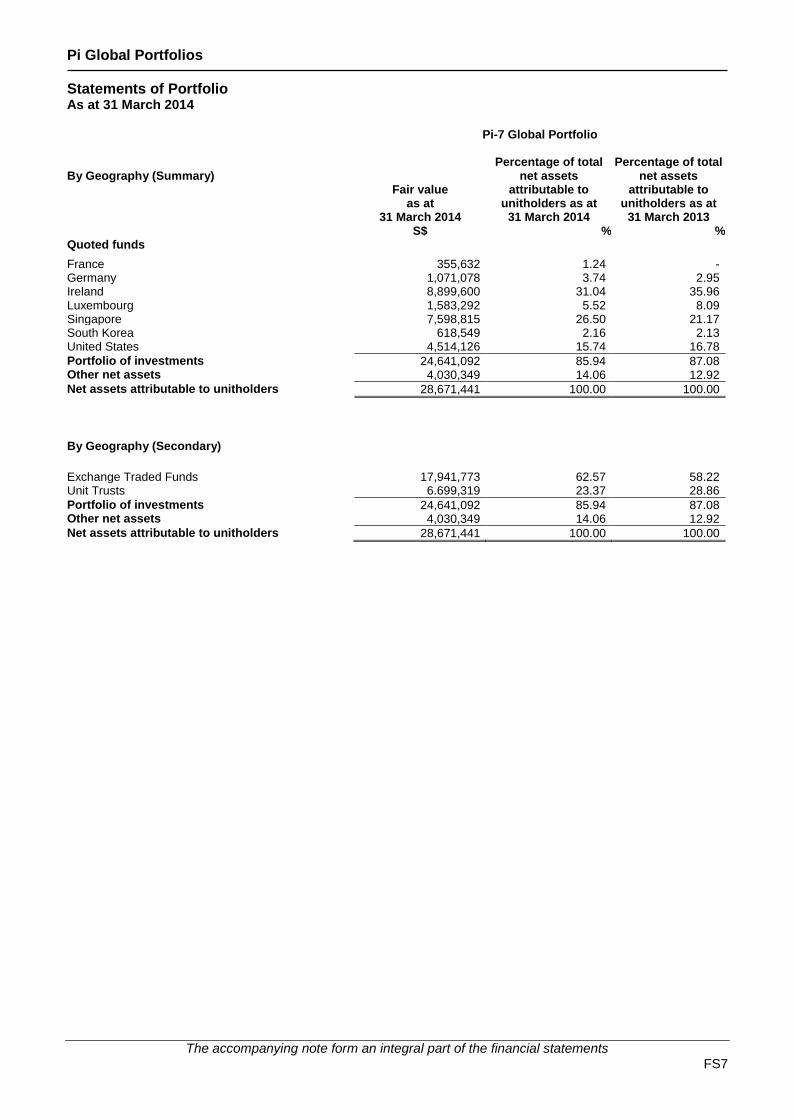
Pi Global Portfolios Statements of Portfolio As at 31 March 2014
The accompanying note form an integral part of the financial statements FS7
Pi-7 Global Portfolio
By Geography (Summary)
Fair value as at
31 March 2014
Percentage of total net assets
attributable to unitholders as at
31 March 2014
Percentage of total net assets
attributable to unitholders as at
31 March 2013 S$ % % Quoted funds
France 355,632 1.24 - Germany 1,071,078 3.74 2.95 Ireland 8,899,600 31.04 35.96 Luxembourg 1,583,292 5.52 8.09 Singapore 7,598,815 26.50 21.17 South Korea 618,549 2.16 2.13 United States 4,514,126 15.74 16.78
Portfolio of investments 24,641,092 85.94 87.08 Other net assets 4,030,349 14.06 12.92
Net assets attributable to unitholders 28,671,441 100.00 100.00
By Geography (Secondary)
Exchange Traded Funds 17,941,773 62.57 58.22 Unit Trusts 6.699,319 23.37 28.86
Portfolio of investments 24,641,092 85.94 87.08 Other net assets 4,030,349 14.06 12.92
Net assets attributable to unitholders 28,671,441 100.00 100.00

Pi Global Portfolios Notes To The Financial Statements
FS8
These notes form an integral part of the financial statements.
1. Domicile and activities Pi Global Portfolios (the "Fund") is an open ended umbrella unit trust constituted pursuant to a Trust Deed dated 3 May 2010 together with its Amending and Restating Deeds thereon (thereafter referred to as the “Trust Deed”) between Phillip Capital Management (S) Ltd (the "Manager") and BNP Paribas Trust Services Singapore Ltd (the "Trustee"). The Trust Deed is governed by and construed in accordance with the laws of the Republic of Singapore.
The Fund offers 2 sub-funds (the “Sub-Funds”); these were first offered for sale in Singapore on the following launch dates:
Sub-Fund Launch date Pi-5 Global Portfolio 17 May 2010 Pi-7 Global Portfolio 17 May 2010
The investment objectives of the Sub-Funds are to aim to achieve medium to long term capital appreciation, in line with their respective asset class/market performance.
It is the Manager’s intention to primarily invest the assets of each Sub-Fund into Exchange Traded Funds (“ETFs”) and underlying funds and collective investment schemes in accordance with each Sub-Fund’s investment objective and asset allocation strategy.
2. Significant accounting policies
2.1 Basis of financial statements preparation
The financial statements, expressed in Singapore dollars, have been prepared under the historical cost basis, as modified by the revaluation of investments, and in accordance with the Statement of Recommended Accounting Practice 7 “Reporting Framework for Unit Trusts” issued by the Institute of Singapore Chartered Accountants (formerly known as the Institute of Certified Public Accountants of Singapore).
For the purposes of preparation of these financial statements, the basis used for calculating the expense ratio and turnover ratio are in accordance with the guidelines issued by the Investment Management Association of Singapore and the Code on Collective Investment Schemes under the Securities and Futures Act (Cap 289) respectively
. 2.2 Basis of valuation of investments
Quoted investments are stated at fair value based on the bid prices at the reporting date. Unrealised gains/losses on investments are represented by the difference between the fair value and the carrying value of investments and are recognised in the Statement of Total Return. Realised gains and losses upon disposal of investments are computed on the basis of the difference between the carrying value and the selling price of investments on trade date and are taken to the Statements of Total Return.

Pi Global Portfolios Notes To The Financial Statements
FS9
2.3 Financial derivatives
Derivatives are recognised initially at fair value; attributable transaction costs are recognised in the Statement of Total Return when incurred. Subsequent to initial recognition, derivatives are measured at fair value, and changes in fair value therein are recognised in the Statements of Total Return.
2.4 Recognition on income
Interest income is recognised using the effective interest method.
Dividend income is recognised when declared and is stated gross of tax credits.
2.5 Foreign currency translation
Transactions in foreign currencies are translated at the exchange rate at the date of transaction. Monetary assets and liabilities denominated in foreign currencies at the reporting date are translated at exchange rates at the reporting date. All exchange differences are recognised in the Statements of Total Return.
2.6 Income tax expense
Prior to 15 January 2013, the Fund was a designated unit trust under the Singapore Income Tax Act (Chapter 134).
The Fund was approved for the Enhanced-Tier Fund Tax Incentive Scheme under Section 13X of the Income Tax Act by the Monetary Authority of Singapore (MAS) with effect from 15 January 2013. The tax exemption status will be for the life of the Fund, provided the Fund continues to meet all the terms and conditions set out by MAS and the relevant Income Tax legislations.
2.7 Cash and cash equivalents
Cash and cash equivalents comprise cash and bank balances and amounts held with brokers. Cash equivalents are short-term highly liquid investments that are readily convertible to known amounts of cash and are subject to an insignificant risk of changes in value.
2.8 Net assets attributable to unitholders
Net assets attributable to unitholders are classified as equity.
Pi Global Portfolios Notes To The Financial Statements
FS10
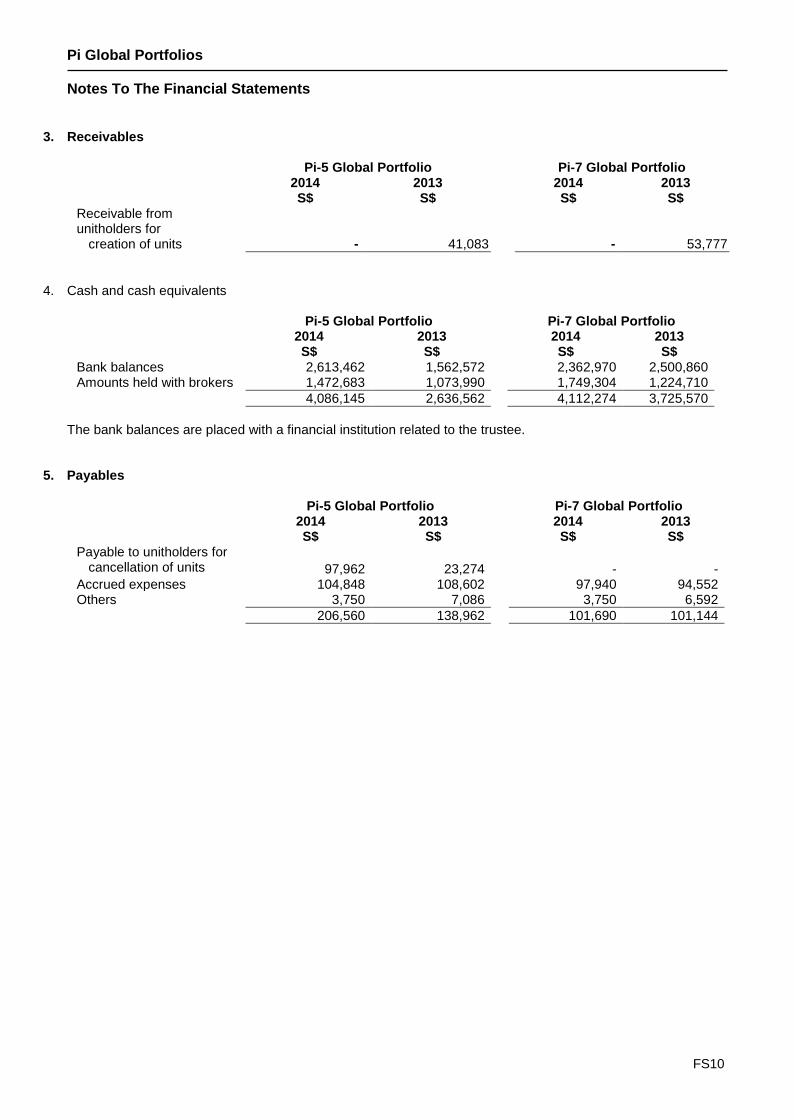
3. Receivables
Pi-5 Global Portfolio Pi-7 Global Portfolio 2014
S$ 2013 S$
2014 S$
2013 S$
Receivable from unitholders for creation of units
- 41,083
- 53,777
4. Cash and cash equivalents
Pi-5 Global Portfolio Pi-7 Global Portfolio 2014
S$ 2013 S$
2014 S$
2013 S$
Bank balances 2,613,462 1,562,572 2,362,970 2,500,860 Amounts held with brokers 1,472,683 1,073,990 1,749,304 1,224,710
4,086,145 2,636,562 4,112,274 3,725,570
The bank balances are placed with a financial institution related to the trustee.
5. Payables
Pi-5 Global Portfolio Pi-7 Global Portfolio 2014
S$ 2013 S$
2014 S$
2013 S$
Payable to unitholders for cancellation of units 97,962 23,274 - - Accrued expenses 104,848 108,602 97,940 94,552 Others 3,750 7,086 3,750 6,592
206,560 138,962 101,690 101,144
Pi Global Portfolios Notes To The Financial Statements
FS11
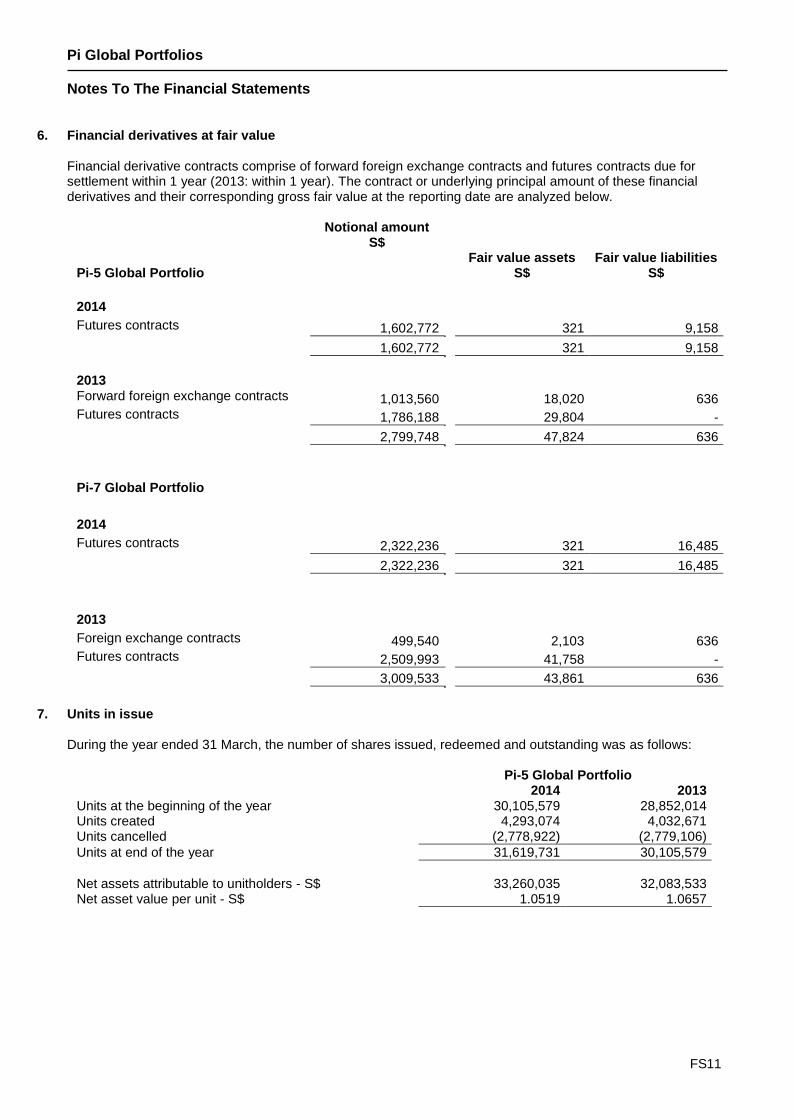
6. Financial derivatives at fair value
Financial derivative contracts comprise of forward foreign exchange contracts and futures contracts due for settlement within 1 year (2013: within 1 year). The contract or underlying principal amount of these financial derivatives and their corresponding gross fair value at the reporting date are analyzed below.
Pi-5 Global Portfolio
Notional amount S$
Fair value assets S$
Fair value liabilities S$
2014 Futures contracts 1,602,772 321 9,158
1,602,772 321 9,158
2013
Forward foreign exchange contracts 1,013,560 18,020 636 Futures contracts 1,786,188 29,804 -
2,799,748 47,824 636
Pi-7 Global Portfolio
2014
Futures contracts 2,322,236 321 16,485
2,322,236 321 16,485
2013
Foreign exchange contracts 499,540 2,103 636 Futures contracts 2,509,993 41,758 -
3,009,533 43,861 636
7. Units in issue
During the year ended 31 March, the number of shares issued, redeemed and outstanding was as follows:
Pi-5 Global Portfolio 2014 2013 Units at the beginning of the year 30,105,579 28,852,014 Units created 4,293,074 4,032,671 Units cancelled (2,778,922) (2,779,106)
Units at end of the year 31,619,731 30,105,579
Net assets attributable to unitholders - S$ 33,260,035 32,083,533 Net asset value per unit - S$ 1.0519 1.0657

Pi Global Portfolios Notes To The Financial Statements
FS12
Pi-7 Global Portfolio 2014 2013 Units at beginning of the financial year 25,095,759 25,952,057 Units created 3,471,574 3,393,562 Units cancelled (1,235,873) (4,249,860)
Units at end of the financial year 27,331,460 25,095,759
Net assets attributable to unitholders - S$ 28,671,441 26,728,961 Net asset value per unit - S$ 1.0490 1.0651
For subscriptions and redemptions and for various fee calculations, investments are stated at the last traded prices on the valuation day for the purpose of determining net asset value per unit while for reporting purpose the investments are valued at the relevant bid market prices as at the reporting date.
The assets of the Sub-Funds are valued in S$. For the purposes of calculating the Net Asset Value of each unit for the US$ Class, the value will be translated from S$ to US$ at the prevailing foreign exchange rate.
The effect of bid market prices in the net assets attributable to unitholders is as follows:
Pi-5 Global Portfolio
2014 S$
2013 S$
Net assets attributable to unitholders per financial statements 33,260,035 32,083,533 Effect of adopting bid prices at fair value 215,055 35,453
Net assets attributable to unitholders for issuing/redeeming 33,475,090 32,118,986
Pi-7 Global Portfolio 2014
S$ 2013 S$
Net asset per unit per financial statements 28,671,441 26,728,961 Effect of adopting bid prices at fair value 259,179 35,493
Net assets attributable to unitholders for issuing/redeeming 28,930,620 26,764,454
8. Income tax
Pi-5 Global Portfolio Pi-7 Global Portfolio
2014 S$
2013 S$
2014 S$
2013 S$
Singapore income tax 7,924 2,929 4,483 1,894
Overseas income tax 12,984 5,813 16,006 8,211
20,878 8,742 20,487 10,105
The overseas income tax charges relates to withholding tax suffered on receipt of distribution from overseas investments.
Pi Global Portfolios Notes To The Financial Statements
FS13
9. Financial risk management The Sub-Funds’ activities expose them to a variety of market risks (including price risk, interest rate risk and currency risk), liquidity risk and credit risk. The Sub-Funds’ overall risk management programme seeks to minimise potential adverse effects on the Sub-Funds’ financial performance. The Sub-Funds may use futures contracts and/or forward foreign exchange contracts, subject to the terms of the Trust Deed to moderate certain risk exposures. Specific guidelines on exposures to individual securities and certain industries are in place for the Sub-Funds at any time as part of the overall financial risk management to reduce the Sub-Funds’ risk exposures.
(a) Market risks
i. Price risk
Price risk is the risk that the fair values of equities or future cash flows of a financial instrument will fluctuate because of changes in market prices (other than those arising from interest rate risk or currency risk).
The investments of the Sub-Funds are subject to normal market fluctuations and the risks inherent in investing in securities markets and there can be no assurance that appreciation will occur. It is the policy of the Manager to maintain a diversified portfolio of investments so as to minimize the risk.
ii. Interest rate risk
Interest rate risk is the risk that the value of a financial instrument will fluctuate due to changes in market interest
rates.
The Sub-Funds are not subjected to significant risk of fluctuations in the market interest rates as the Sub-Funds’ financial assets and liabilities are largely non-interest bearing other than the cash balances.
iii. Currency risk
The Sub-Funds are denominated in Singapore dollars. The Sub-Funds invest in underlying securities which are denominated in foreign currencies where fluctuations in the relevant exchange rates may have an impact on the income and value of the Sub-Funds. The Manager may seek to minimize exposure to foreign currency fluctuation to the extent practicable.
As at 31 March 2014 and 2013, the concentration of the Sub-Funds’ investments is set out in the Portfolio Statements.
Pi Global Portfolios Notes To The Financial Statements
FS14
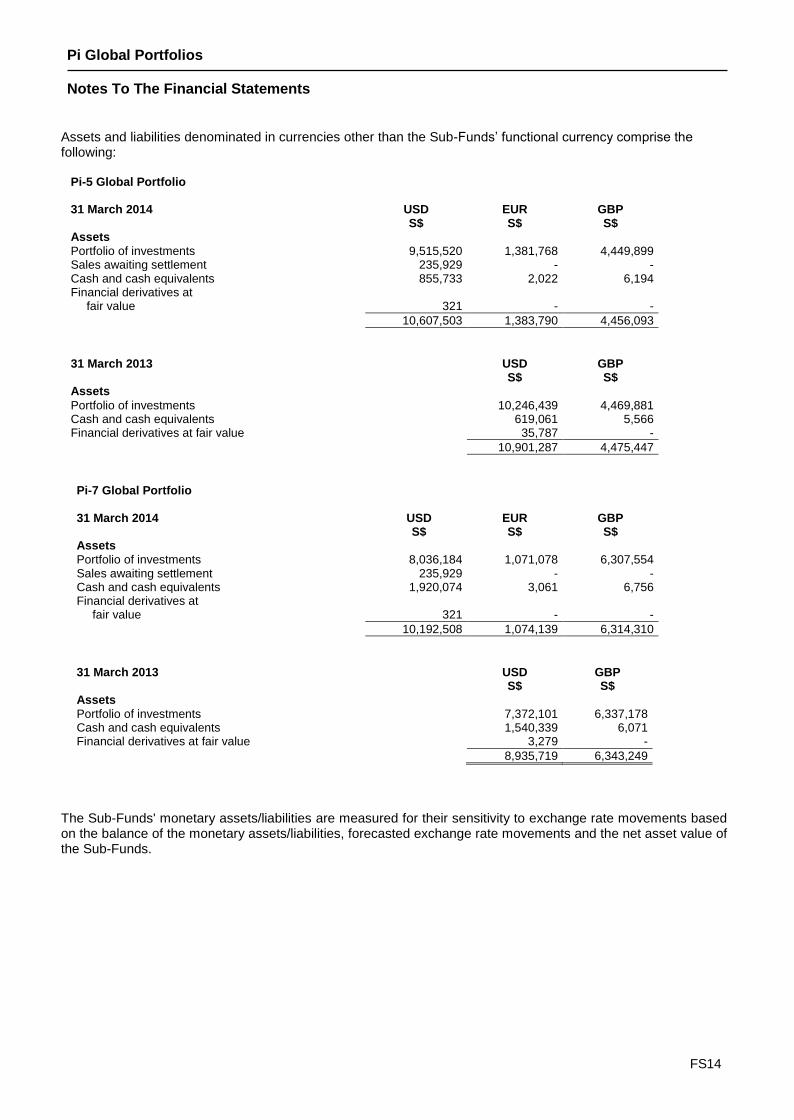
Assets and liabilities denominated in currencies other than the Sub-Funds’ functional currency comprise the following: Pi-5 Global Portfolio 31 March 2014 USD
S$ EUR S$
GBP S$
Assets
Portfolio of investments 9,515,520 1,381,768 4,449,899 Sales awaiting settlement 235,929 - - Cash and cash equivalents 855,733 2,022 6,194 Financial derivatives at fair value 321 - -
10,607,503 1,383,790 4,456,093
31 March 2013 USD
S$ GBP S$
Assets
Portfolio of investments 10,246,439 4,469,881 Cash and cash equivalents 619,061 5,566 Financial derivatives at fair value 35,787 -
10,901,287 4,475,447
Pi-7 Global Portfolio 31 March 2014 USD
S$ EUR S$
GBP S$
Assets
Portfolio of investments 8,036,184 1,071,078 6,307,554 Sales awaiting settlement 235,929 - - Cash and cash equivalents 1,920,074 3,061 6,756 Financial derivatives at fair value 321 - -
10,192,508 1,074,139 6,314,310
31 March 2013 USD
S$ GBP S$
Assets
Portfolio of investments 7,372,101 6,337,178 Cash and cash equivalents 1,540,339 6,071 Financial derivatives at fair value 3,279 -
8,935,719 6,343,249
The Sub-Funds' monetary assets/liabilities are measured for their sensitivity to exchange rate movements based on the balance of the monetary assets/liabilities, forecasted exchange rate movements and the net asset value of the Sub-Funds.
Pi Global Portfolios Notes To The Financial Statements
FS15
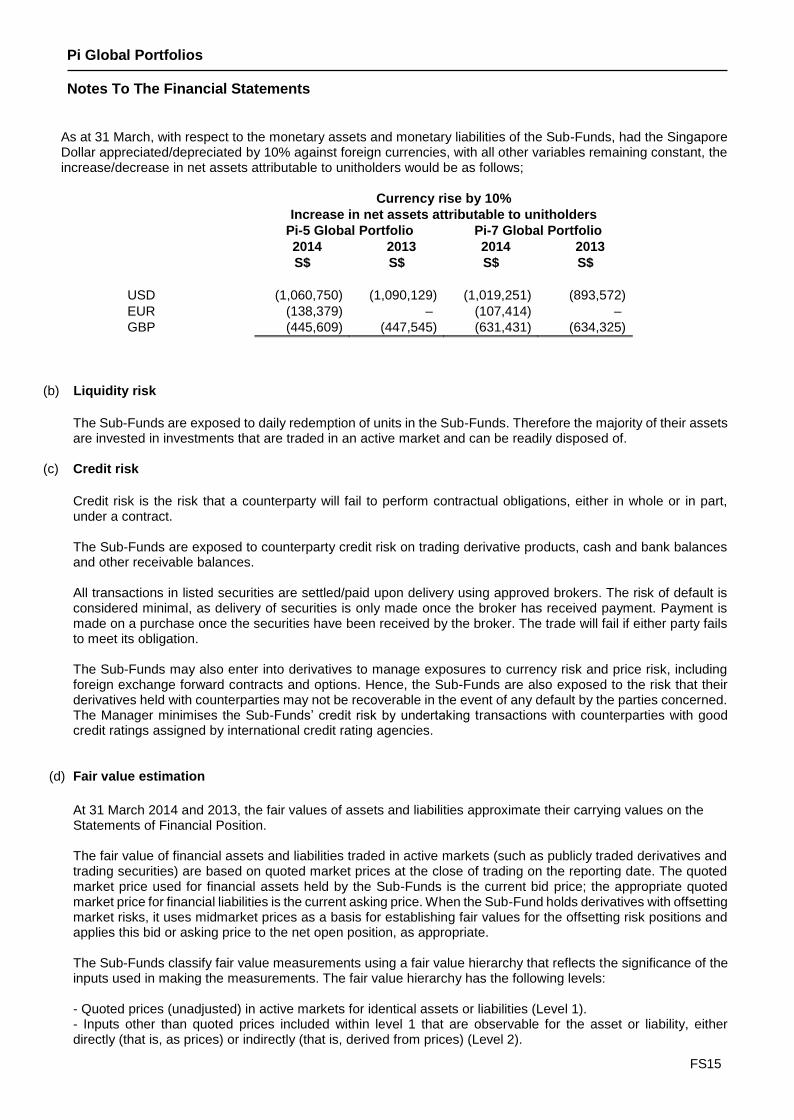
As at 31 March, with respect to the monetary assets and monetary liabilities of the Sub-Funds, had the Singapore Dollar appreciated/depreciated by 10% against foreign currencies, with all other variables remaining constant, the increase/decrease in net assets attributable to unitholders would be as follows;
Currency rise by 10%
Increase in net assets attributable to unitholders
Pi-5 Global Portfolio Pi-7 Global Portfolio
2014 2013 2014 2013
S$ S$ S$ S$
USD (1,060,750) (1,090,129) (1,019,251) (893,572)
EUR (138,379) – (107,414) –
GBP (445,609) (447,545) (631,431) (634,325)
(b) Liquidity risk
The Sub-Funds are exposed to daily redemption of units in the Sub-Funds. Therefore the majority of their assets are invested in investments that are traded in an active market and can be readily disposed of.
(c) Credit risk Credit risk is the risk that a counterparty will fail to perform contractual obligations, either in whole or in part, under a contract. The Sub-Funds are exposed to counterparty credit risk on trading derivative products, cash and bank balances and other receivable balances. All transactions in listed securities are settled/paid upon delivery using approved brokers. The risk of default is considered minimal, as delivery of securities is only made once the broker has received payment. Payment is made on a purchase once the securities have been received by the broker. The trade will fail if either party fails to meet its obligation. The Sub-Funds may also enter into derivatives to manage exposures to currency risk and price risk, including foreign exchange forward contracts and options. Hence, the Sub-Funds are also exposed to the risk that their derivatives held with counterparties may not be recoverable in the event of any default by the parties concerned. The Manager minimises the Sub-Funds’ credit risk by undertaking transactions with counterparties with good credit ratings assigned by international credit rating agencies.
(d) Fair value estimation
At 31 March 2014 and 2013, the fair values of assets and liabilities approximate their carrying values on the Statements of Financial Position. The fair value of financial assets and liabilities traded in active markets (such as publicly traded derivatives and trading securities) are based on quoted market prices at the close of trading on the reporting date. The quoted market price used for financial assets held by the Sub-Funds is the current bid price; the appropriate quoted market price for financial liabilities is the current asking price. When the Sub-Fund holds derivatives with offsetting market risks, it uses midmarket prices as a basis for establishing fair values for the offsetting risk positions and applies this bid or asking price to the net open position, as appropriate. The Sub-Funds classify fair value measurements using a fair value hierarchy that reflects the significance of the inputs used in making the measurements. The fair value hierarchy has the following levels: - Quoted prices (unadjusted) in active markets for identical assets or liabilities (Level 1). - Inputs other than quoted prices included within level 1 that are observable for the asset or liability, either directly (that is, as prices) or indirectly (that is, derived from prices) (Level 2).
Pi Global Portfolios Notes To The Financial Statements
FS16
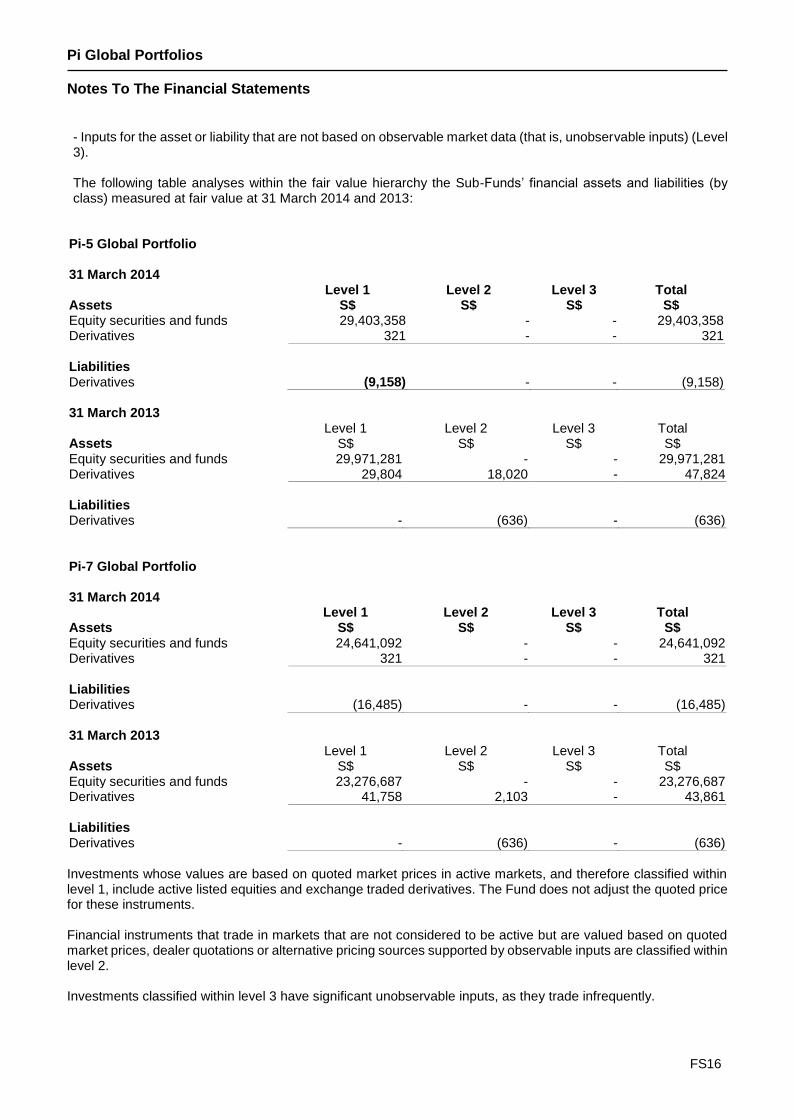
- Inputs for the asset or liability that are not based on observable market data (that is, unobservable inputs) (Level 3). The following table analyses within the fair value hierarchy the Sub-Funds’ financial assets and liabilities (by class) measured at fair value at 31 March 2014 and 2013:
Pi-5 Global Portfolio 31 March 2014 Assets
Level 1 S$
Level 2 S$
Level 3 S$
Total S$
Equity securities and funds 29,403,358 - - 29,403,358 Derivatives 321 - - 321
Liabilities
Derivatives (9,158) - - (9,158)
31 March 2013 Assets
Level 1 S$
Level 2 S$
Level 3 S$
Total S$
Equity securities and funds 29,971,281 - - 29,971,281 Derivatives 29,804 18,020 - 47,824
Liabilities
Derivatives - (636) - (636)
Pi-7 Global Portfolio 31 March 2014 Assets
Level 1 S$
Level 2 S$
Level 3 S$
Total S$
Equity securities and funds 24,641,092 - - 24,641,092 Derivatives 321 - - 321
Liabilities
Derivatives (16,485) - - (16,485)
31 March 2013 Assets
Level 1 S$
Level 2 S$
Level 3 S$
Total S$
Equity securities and funds 23,276,687 - - 23,276,687 Derivatives 41,758 2,103 - 43,861
Liabilities
Derivatives - (636) - (636)
Investments whose values are based on quoted market prices in active markets, and therefore classified within level 1, include active listed equities and exchange traded derivatives. The Fund does not adjust the quoted price for these instruments. Financial instruments that trade in markets that are not considered to be active but are valued based on quoted market prices, dealer quotations or alternative pricing sources supported by observable inputs are classified within level 2. Investments classified within level 3 have significant unobservable inputs, as they trade infrequently.
Pi Global Portfolios Notes To The Financial Statements
FS17
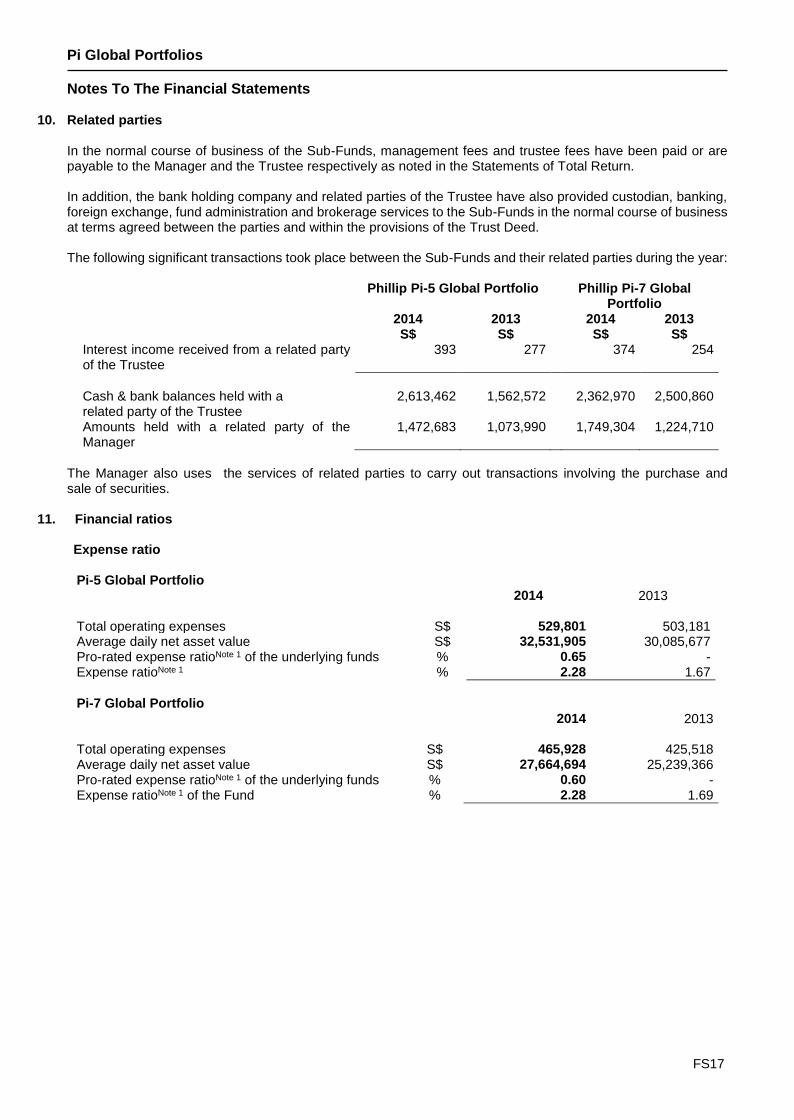
10. Related parties
In the normal course of business of the Sub-Funds, management fees and trustee fees have been paid or are payable to the Manager and the Trustee respectively as noted in the Statements of Total Return. In addition, the bank holding company and related parties of the Trustee have also provided custodian, banking, foreign exchange, fund administration and brokerage services to the Sub-Funds in the normal course of business at terms agreed between the parties and within the provisions of the Trust Deed. The following significant transactions took place between the Sub-Funds and their related parties during the year:
Phillip Pi-5 Global Portfolio Phillip Pi-7 Global Portfolio
2014 S$
2013 S$
2014 S$
2013 S$
Interest income received from a related party of the Trustee
393 277 374 254
Cash & bank balances held with a related party of the Trustee
2,613,462 1,562,572 2,362,970 2,500,860
Amounts held with a related party of the Manager
1,472,683 1,073,990 1,749,304 1,224,710
The Manager also uses the services of related parties to carry out transactions involving the purchase and sale of securities.
11. Financial ratios
Expense ratio
Pi-5 Global Portfolio 2014 2013 Total operating expenses S$ 529,801 503,181 Average daily net asset value S$ 32,531,905 30,085,677 Pro-rated expense ratioNote 1 of the underlying funds % 0.65 - Expense ratioNote 1 % 2.28 1.67
Pi-7 Global Portfolio 2014 2013 Total operating expenses S$ 465,928 425,518 Average daily net asset value S$ 27,664,694 25,239,366 Pro-rated expense ratioNote 1 of the underlying funds % 0.60 - Expense ratioNote 1 of the Fund % 2.28 1.69
Pi Global Portfolios Notes To The Financial Statements
FS18
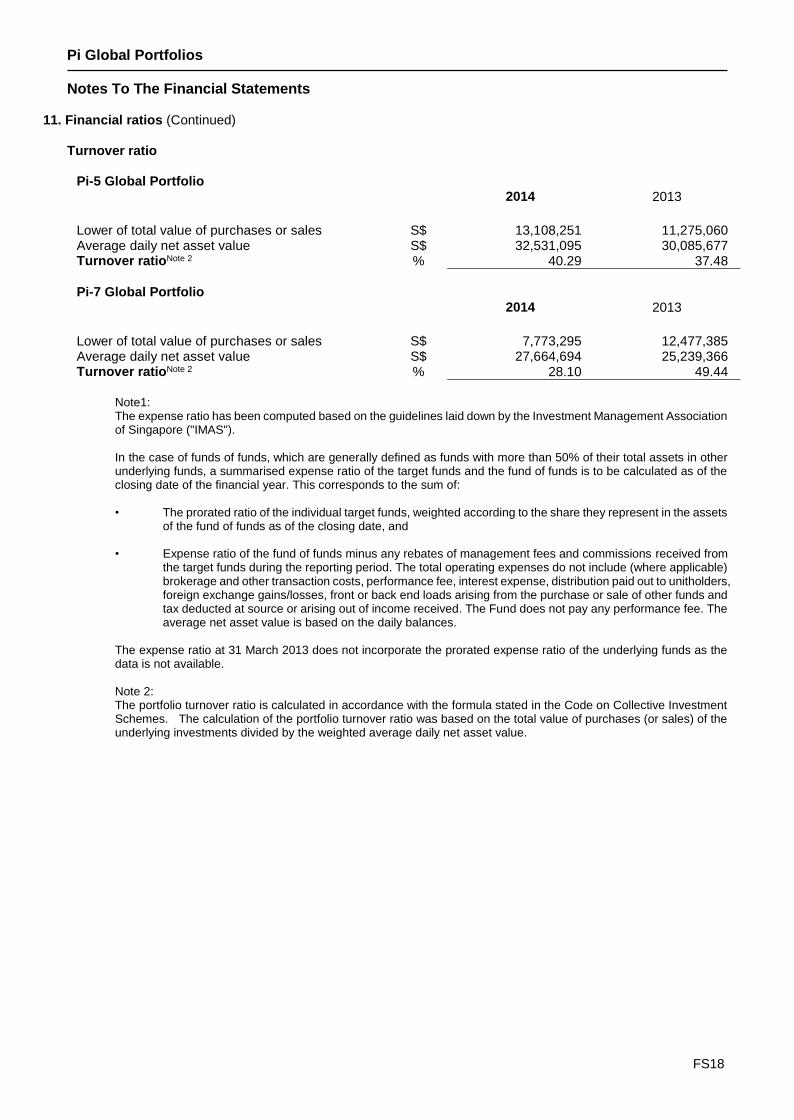
11. Financial ratios (Continued)
Turnover ratio
Pi-5 Global Portfolio 2014 2013
Lower of total value of purchases or sales S$ 13,108,251 11,275,060 Average daily net asset value S$ 32,531,095 30,085,677 Turnover ratioNote 2 % 40.29 37.48
Pi-7 Global Portfolio 2014 2013
Lower of total value of purchases or sales S$ 7,773,295 12,477,385 Average daily net asset value S$ 27,664,694 25,239,366 Turnover ratioNote 2 % 28.10 49.44
Note1: The expense ratio has been computed based on the guidelines laid down by the Investment Management Association of Singapore ("IMAS").
In the case of funds of funds, which are generally defined as funds with more than 50% of their total assets in other underlying funds, a summarised expense ratio of the target funds and the fund of funds is to be calculated as of the closing date of the financial year. This corresponds to the sum of:
• The prorated ratio of the individual target funds, weighted according to the share they represent in the assets
of the fund of funds as of the closing date, and
• Expense ratio of the fund of funds minus any rebates of management fees and commissions received from the target funds during the reporting period. The total operating expenses do not include (where applicable) brokerage and other transaction costs, performance fee, interest expense, distribution paid out to unitholders, foreign exchange gains/losses, front or back end loads arising from the purchase or sale of other funds and tax deducted at source or arising out of income received. The Fund does not pay any performance fee. The average net asset value is based on the daily balances.
The expense ratio at 31 March 2013 does not incorporate the prorated expense ratio of the underlying funds as the data is not available.
Note 2: The portfolio turnover ratio is calculated in accordance with the formula stated in the Code on Collective Investment Schemes. The calculation of the portfolio turnover ratio was based on the total value of purchases (or sales) of the underlying investments divided by the weighted average daily net asset value.

Pi Global Portfolios REPORT TO UNITHOLDERS
FS19
IMPORTANT INFORMATION
Pi-5 Global Portfolio and Pi-7 Global Portfolio (the “Sub-Funds”) are sub-funds of Pi Global Portfolios (the “Fund”), an open-ended umbrella unit trust authorised under the Securities and Futures Act, Chapter 289, by the Monetary Authority of Singapore.
This document is published by Phillip Capital Management (S) Ltd, the manager of the Fund (the “Manager”), for information only and it does not constitute a prospectus nor form part of any offer or invitation to subscribe for or to purchase, or solicitation of any offer to subscribe for or to purchase, any units in the Sub-Funds. All applications for units in the Sub-Funds must be made on the application forms accompanying the latest prospectus of the Fund (the “Prospectus”). The information and opinions contained in this document have been obtained from public sources which the Manager believes to be reliable and accurate. However, no representation or warranty, express or implied, is made as to the fairness, accuracy, completeness or correctness of the information and it should not be relied upon as such. Opinions included herein constitute the judgement of the Manager at the time specified and may be subject to change without notice, they are not to be relied upon as authoritative or taken in substitution for the exercise of judgment by any recipient and are not intended to provide the sole basis of evaluation of any investment. Neither the Manager nor the Fund, nor any of their respective associates, directors, officers or employees, accepts any liability whatsoever for any loss arising directly or indirectly from any use of this document or any information contained herein. Given the economic and market risks, there can be no assurance that the Sub-Funds will achieve their investment objectives. Investments in the Sub-Funds are not deposits or other obligations of, or guaranteed, or insured by the Manager or the distributors or their affiliates and are subject to investment risks, including the possible loss of the full principal amount invested. Returns may be affected by, among other things, the investment strategies or objectives of the Sub-Funds and material market and economic conditions. The value of the units and the income from them can fall as well as rise. Past performance is not necessarily indicative of the future performance of the Sub-Funds. This document should not be taken as a recommendation to buy or sell since it does not take into account the specific investment objectives, financial situation and the particular needs of any particular recipient of this document. Investors should seek advice from a financial advisor before purchasing units in the Sub-Funds. In any case, investors should read the Prospectus and consider the risks as well as suitability of the Fund before deciding whether to subscribe for units in the Fund. Copies of the Prospectus are available and may be obtained from the Manager.