Embed Size (px)
Citation preview
United Global Telecoms FundSemi Annual Report
for the period 1st January to 30th June 2014

United Global Telecoms Fund(Constituted under a Trust Deed in the Republic of Singapore)
1
MANAGERUOB Asset Management LtdRegistered Address:80 Raffles PlaceUOB PlazaSingapore 048624Company Registration No. : 198600120Z
OPERATIONS ADDRESS80 Raffles Place#06-00, UOB Plaza 2Singapore 048624Tel: 1800 22 22 228
DIRECTORS OF UOB ASSET MANAGEMENTTerence Ong Sea EngCheo Chai HongThio Boon Kiat
TRUSTEE / REGISTRARHSBC Institutional Trust Services (Singapore) Limited21 Collyer Quay#10-02, HSBC BuildingSingapore 049320
CUSTODIANState Street Bank and Trust CompanyOne Lincoln StreetBoston, MA 02111United States of America
AUDITORSPricewaterhouseCoopers LLP8 Cross Street#17-00, PWC BuildingSingapore 048424
SOLICITORS TO THE MANAGERAllen & Gledhill LLPOne Marina Boulevard#28-00Singapore 018989
SOLICITORS TO THE TRUSTEEShook Lin & Bok LLP1 Robinson Road#18-00, AIA TowerSingapore 048542
United Global Telecoms Fund(Constituted under a Trust Deed in the Republic of Singapore)
2
A) Fund Performance
Fund Performance/ Benchmark Returns
3 mth
% Growth
6 mth
% Growth
1 yr %
Growth
3yr Ann
Comp Ret
5 yr Ann
Comp Ret
10 yr Ann
Comp Ret
Since Inception
16 August 1999 Ann
Comp Ret
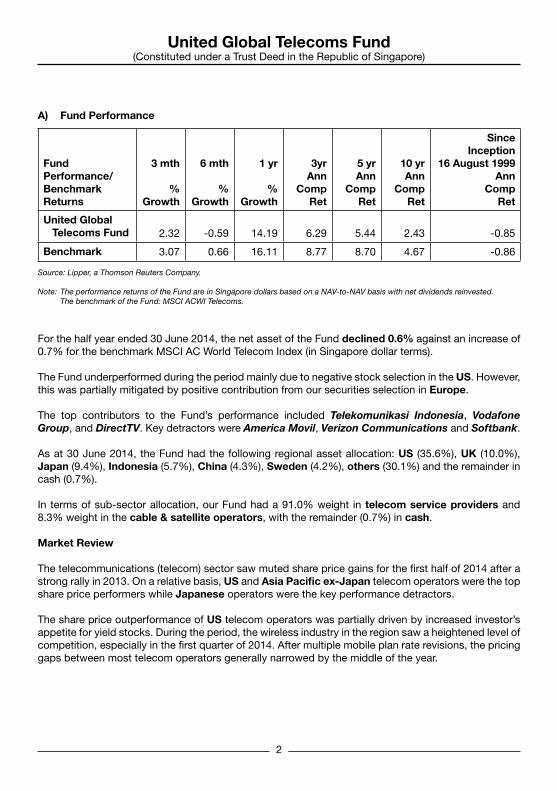
United Global Telecoms Fund 2.32 -0.59 14.19 6.29 5.44 2.43 -0.85
Benchmark 3.07 0.66 16.11 8.77 8.70 4.67 -0.86
Source: Lipper, a Thomson Reuters Company.
Note: The performance returns of the Fund are in Singapore dollars based on a NAV-to-NAV basis with net dividends reinvested. The benchmark of the Fund: MSCI ACWI Telecoms.
For the half year ended 30 June 2014, the net asset of the Fund declined 0.6% against an increase of 0.7% for the benchmark MSCI AC World Telecom Index (in Singapore dollar terms).
The Fund underperformed during the period mainly due to negative stock selection in the US. However, this was partially mitigated by positive contribution from our securities selection in Europe.
The top contributors to the Fund’s performance included Telekomunikasi Indonesia, Vodafone Group, and DirectTV. Key detractors were America Movil, Verizon Communications and Softbank.
As at 30 June 2014, the Fund had the following regional asset allocation: US (35.6%), UK (10.0%), Japan (9.4%), Indonesia (5.7%), China (4.3%), Sweden (4.2%), others (30.1%) and the remainder in cash (0.7%).
In terms of sub-sector allocation, our Fund had a 91.0% weight in telecom service providers and 8.3% weight in the cable & satellite operators, with the remainder (0.7%) in cash.
Market Review
The telecommunications (telecom) sector saw muted share price gains for the first half of 2014 after a strong rally in 2013. On a relative basis, US and Asia Pacific ex-Japan telecom operators were the top share price performers while Japanese operators were the key performance detractors.
The share price outperformance of US telecom operators was partially driven by increased investor’s appetite for yield stocks. During the period, the wireless industry in the region saw a heightened level of competition, especially in the first quarter of 2014. After multiple mobile plan rate revisions, the pricing gaps between most telecom operators generally narrowed by the middle of the year.
United Global Telecoms Fund(Constituted under a Trust Deed in the Republic of Singapore)
3
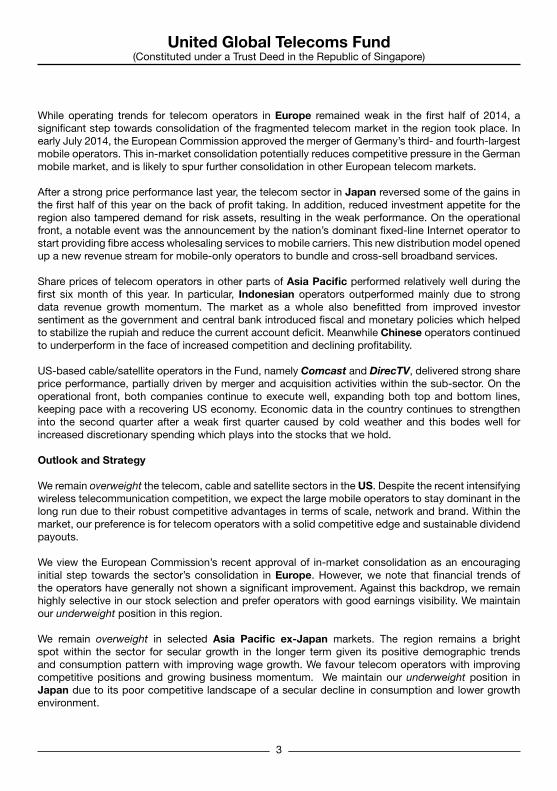
While operating trends for telecom operators in Europe remained weak in the first half of 2014, a significant step towards consolidation of the fragmented telecom market in the region took place. In early July 2014, the European Commission approved the merger of Germany’s third- and fourth-largest mobile operators. This in-market consolidation potentially reduces competitive pressure in the German mobile market, and is likely to spur further consolidation in other European telecom markets.
After a strong price performance last year, the telecom sector in Japan reversed some of the gains in the first half of this year on the back of profit taking. In addition, reduced investment appetite for the region also tampered demand for risk assets, resulting in the weak performance. On the operational front, a notable event was the announcement by the nation’s dominant fixed-line Internet operator to start providing fibre access wholesaling services to mobile carriers. This new distribution model opened up a new revenue stream for mobile-only operators to bundle and cross-sell broadband services.
Share prices of telecom operators in other parts of Asia Pacific performed relatively well during the first six month of this year. In particular, Indonesian operators outperformed mainly due to strong data revenue growth momentum. The market as a whole also benefitted from improved investor sentiment as the government and central bank introduced fiscal and monetary policies which helped to stabilize the rupiah and reduce the current account deficit. Meanwhile Chinese operators continued to underperform in the face of increased competition and declining profitability.
US-based cable/satellite operators in the Fund, namely Comcast and DirecTV, delivered strong share price performance, partially driven by merger and acquisition activities within the sub-sector. On the operational front, both companies continue to execute well, expanding both top and bottom lines, keeping pace with a recovering US economy. Economic data in the country continues to strengthen into the second quarter after a weak first quarter caused by cold weather and this bodes well for increased discretionary spending which plays into the stocks that we hold.
Outlook and Strategy
We remain overweight the telecom, cable and satellite sectors in the US. Despite the recent intensifying wireless telecommunication competition, we expect the large mobile operators to stay dominant in the long run due to their robust competitive advantages in terms of scale, network and brand. Within the market, our preference is for telecom operators with a solid competitive edge and sustainable dividend payouts.
We view the European Commission’s recent approval of in-market consolidation as an encouraging initial step towards the sector’s consolidation in Europe. However, we note that financial trends of the operators have generally not shown a significant improvement. Against this backdrop, we remain highly selective in our stock selection and prefer operators with good earnings visibility. We maintain our underweight position in this region.
We remain overweight in selected Asia Pacific ex-Japan markets. The region remains a bright spot within the sector for secular growth in the longer term given its positive demographic trends and consumption pattern with improving wage growth. We favour telecom operators with improving competitive positions and growing business momentum. We maintain our underweight position in Japan due to its poor competitive landscape of a secular decline in consumption and lower growth environment.
United Global Telecoms Fund(Constituted under a Trust Deed in the Republic of Singapore)
4
In summary, the Fund’s focus is to invest in high quality firms with strong franchises such as superior networks through scale or differentiating technologies against competitors. The firm has to exhibit the ability to outperform in a highly competitive and tough regulatory environment with profitability that commensurate with the capital invested.
We will maintain a focus on companies with strong cash flow generation, resilient balance sheet and stable growing dividend. The Fund is invested in telecom names within developed markets which would provide strong stable growing dividends and emerging markets telecom operators and cable/satellite operators that provide both growth and defensive characteristics at reasonable valuation.
United Global Telecoms Fund(Constituted under a Trust Deed in the Republic of Singapore)
5
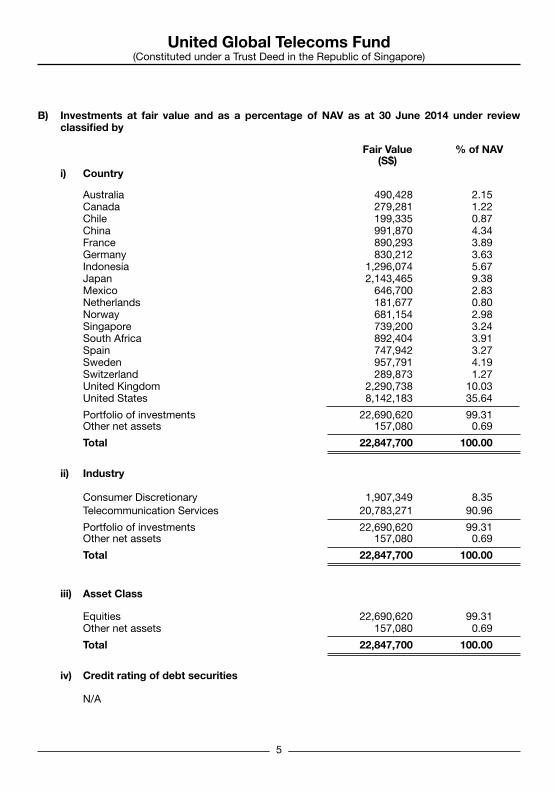
B) Investments at fair value and as a percentage of NAV as at 30 June 2014 under review classified by
Fair Value % of NAV (S$)
i) Country
Australia 490,428 2.15 Canada 279,281 1.22 Chile 199,335 0.87 China 991,870 4.34 France 890,293 3.89 Germany 830,212 3.63 Indonesia 1,296,074 5.67 Japan 2,143,465 9.38 Mexico 646,700 2.83 Netherlands 181,677 0.80 Norway 681,154 2.98 Singapore 739,200 3.24 South Africa 892,404 3.91 Spain 747,942 3.27 Sweden 957,791 4.19 Switzerland 289,873 1.27 United Kingdom 2,290,738 10.03 United States 8,142,183 35.64
Portfolio of investments 22,690,620 99.31 Other net assets 157,080 0.69
Total 22,847,700 100.00
ii) Industry
Consumer Discretionary 1,907,349 8.35 Telecommunication Services 20,783,271 90.96
Portfolio of investments 22,690,620 99.31 Other net assets 157,080 0.69
Total 22,847,700 100.00
iii) Asset Class
Equities 22,690,620 99.31Other net assets 157,080 0.69
Total 22,847,700 100.00
iv) Credit rating of debt securities
N/A
United Global Telecoms Fund(Constituted under a Trust Deed in the Republic of Singapore)
6
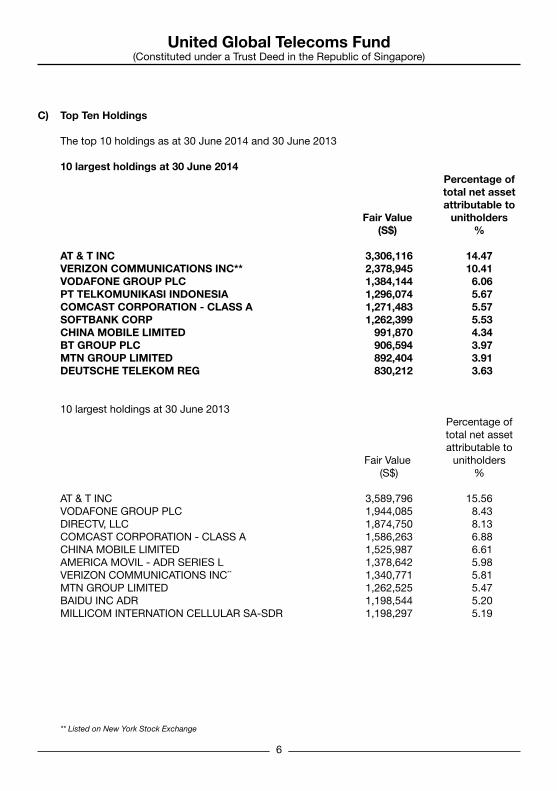
C) Top Ten Holdings
The top 10 holdings as at 30 June 2014 and 30 June 2013
10 largest holdings at 30 June 2014 Percentage of total net asset attributable to Fair Value unitholders (S$) %
AT & T INC 3,306,116 14.47VERIZON COMMUNICATIONS INC** 2,378,945 10.41VODAFONE GROUP PLC 1,384,144 6.06PT TELKOMUNIKASI INDONESIA 1,296,074 5.67COMCAST CORPORATION - CLASS A 1,271,483 5.57SOFTBANK CORP 1,262,399 5.53CHINA MOBILE LIMITED 991,870 4.34BT GROUP PLC 906,594 3.97MTN GROUP LIMITED 892,404 3.91DEUTSCHE TELEKOM REG 830,212 3.63
10 largest holdings at 30 June 2013 Percentage of total net asset attributable to Fair Value unitholders (S$) %
AT & T INC 3,589,796 15.56VODAFONE GROUP PLC 1,944,085 8.43DIRECTV, LLC 1,874,750 8.13COMCAST CORPORATION - CLASS A 1,586,263 6.88CHINA MOBILE LIMITED 1,525,987 6.61AMERICA MOVIL - ADR SERIES L 1,378,642 5.98VERIZON COMMUNICATIONS INC** 1,340,771 5.81MTN GROUP LIMITED 1,262,525 5.47BAIDU INC ADR 1,198,544 5.20MILLICOM INTERNATION CELLULAR SA-SDR 1,198,297 5.19
** Listed on New York Stock Exchange
United Global Telecoms Fund(Constituted under a Trust Deed in the Republic of Singapore)
7
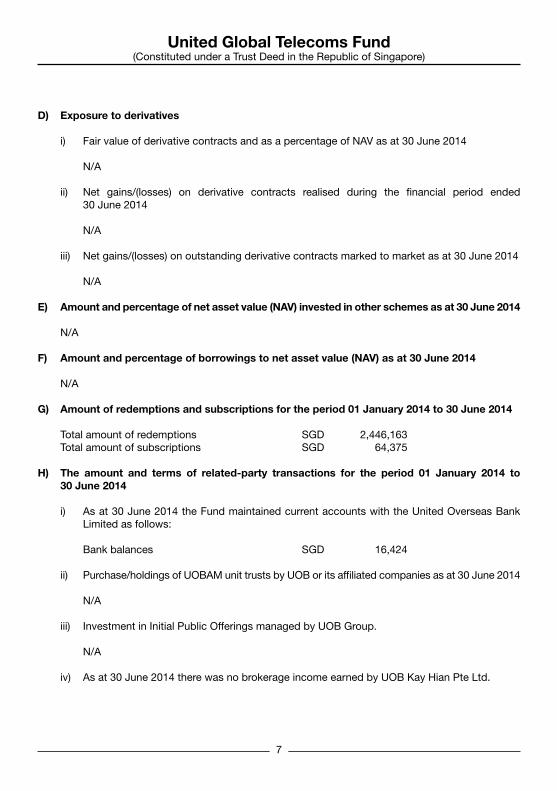
D) Exposure to derivatives
i) Fair value of derivative contracts and as a percentage of NAV as at 30 June 2014
N/A ii) Net gains/(losses) on derivative contracts realised during the financial period ended
30 June 2014 N/A iii) Net gains/(losses) on outstanding derivative contracts marked to market as at 30 June 2014
N/A
E) Amount and percentage of net asset value (NAV) invested in other schemes as at 30 June 2014
N/A
F) Amount and percentage of borrowings to net asset value (NAV) as at 30 June 2014
N/A
G) Amount of redemptions and subscriptions for the period 01 January 2014 to 30 June 2014
Total amount of redemptions SGD 2,446,163 Total amount of subscriptions SGD 64,375
H) The amount and terms of related-party transactions for the period 01 January 2014 to 30 June 2014
i) As at 30 June 2014 the Fund maintained current accounts with the United Overseas Bank Limited as follows:
Bank balances SGD 16,424
ii) Purchase/holdings of UOBAM unit trusts by UOB or its affiliated companies as at 30 June 2014
N/A
iii) Investment in Initial Public Offerings managed by UOB Group. N/A iv) As at 30 June 2014 there was no brokerage income earned by UOB Kay Hian Pte Ltd.
United Global Telecoms Fund(Constituted under a Trust Deed in the Republic of Singapore)
8
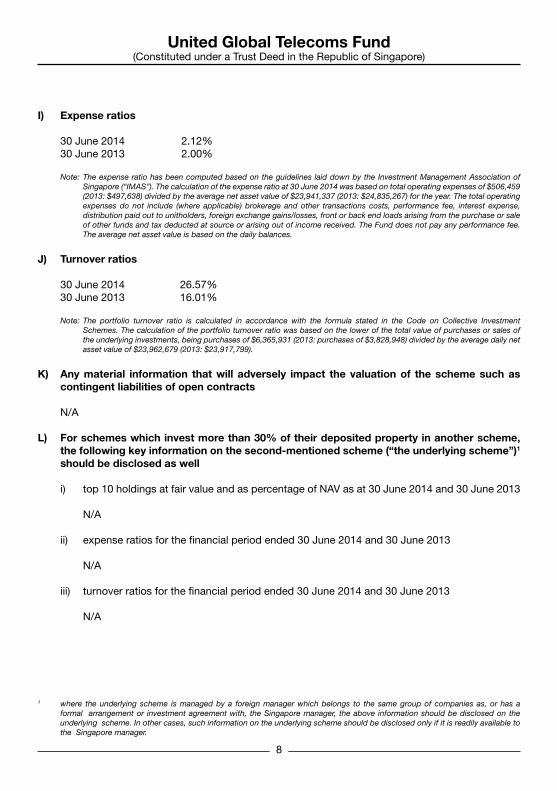
I) Expense ratios
30 June 2014 2.12%30 June 2013 2.00%
Note: The expense ratio has been computed based on the guidelines laid down by the Investment Management Association of Singapore (“IMAS”). The calculation of the expense ratio at 30 June 2014 was based on total operating expenses of $506,459 (2013: $497,638) divided by the average net asset value of $23,941,337 (2013: $24,835,267) for the year. The total operating expenses do not include (where applicable) brokerage and other transactions costs, performance fee, interest expense, distribution paid out to unitholders, foreign exchange gains/losses, front or back end loads arising from the purchase or sale of other funds and tax deducted at source or arising out of income received. The Fund does not pay any performance fee. The average net asset value is based on the daily balances.
J) Turnover ratios
30 June 2014 26.57%30 June 2013 16.01%
Note: The portfolio turnover ratio is calculated in accordance with the formula stated in the Code on Collective Investment Schemes. The calculation of the portfolio turnover ratio was based on the lower of the total value of purchases or sales of the underlying investments, being purchases of $6,365,931 (2013: purchases of $3,828,948) divided by the average daily net asset value of $23,962,679 (2013: $23,917,799).
K) Any material information that will adversely impact the valuation of the scheme such as contingent liabilities of open contracts
N/A
L) For schemes which invest more than 30% of their deposited property in another scheme, the following key information on the second-mentioned scheme (“the underlying scheme”)1 should be disclosed as well
i) top 10 holdings at fair value and as percentage of NAV as at 30 June 2014 and 30 June 2013 N/A ii) expense ratios for the financial period ended 30 June 2014 and 30 June 2013 N/A iii) turnover ratios for the financial period ended 30 June 2014 and 30 June 2013 N/A
1 where the underlying scheme is managed by a foreign manager which belongs to the same group of companies as, or has a formal arrangement or investment agreement with, the Singapore manager, the above information should be disclosed on the underlying scheme. In other cases, such information on the underlying scheme should be disclosed only if it is readily available to the Singapore manager.
United Global Telecoms Fund(Constituted under a Trust Deed in the Republic of Singapore)
9
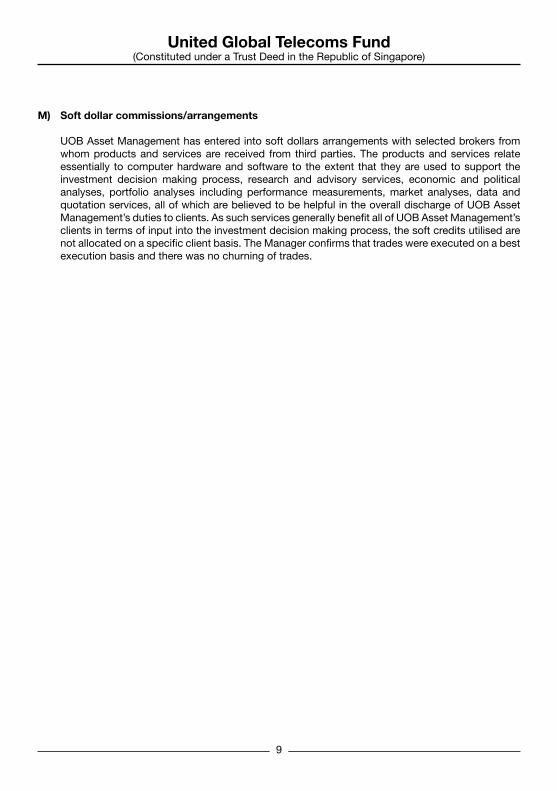
M) Soft dollar commissions/arrangements
UOB Asset Management has entered into soft dollars arrangements with selected brokers from whom products and services are received from third parties. The products and services relate essentially to computer hardware and software to the extent that they are used to support the investment decision making process, research and advisory services, economic and political analyses, portfolio analyses including performance measurements, market analyses, data and quotation services, all of which are believed to be helpful in the overall discharge of UOB Asset Management’s duties to clients. As such services generally benefit all of UOB Asset Management’s clients in terms of input into the investment decision making process, the soft credits utilised are not allocated on a specific client basis. The Manager confirms that trades were executed on a best execution basis and there was no churning of trades.
United Global Telecoms Fund(Constituted under a Trust Deed in the Republic of Singapore)
10
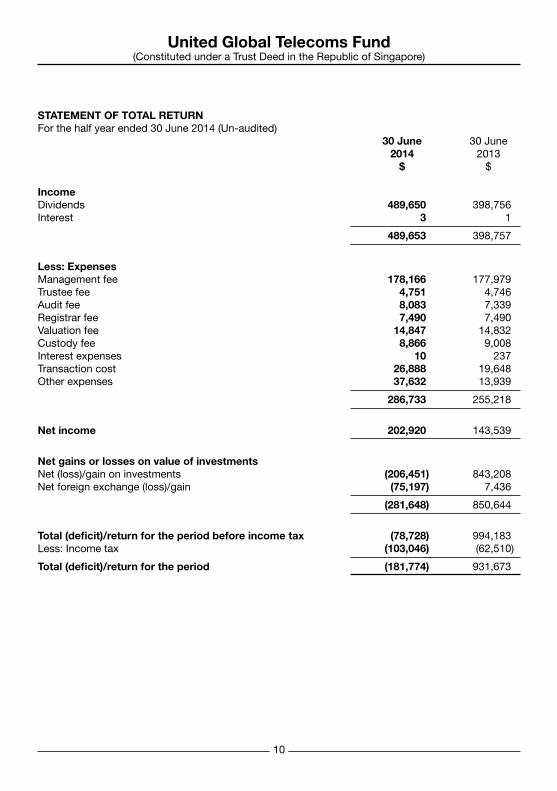
STATEMENT OF TOTAL RETURN For the half year ended 30 June 2014 (Un-audited) 30 June 30 June 2014 2013 $ $
Income Dividends 489,650 398,756 Interest 3 1
489,653 398,757
Less: ExpensesManagement fee 178,166 177,979 Trustee fee 4,751 4,746 Audit fee 8,083 7,339 Registrar fee 7,490 7,490 Valuation fee 14,847 14,832 Custody fee 8,866 9,008 Interest expenses 10 237 Transaction cost 26,888 19,648 Other expenses 37,632 13,939
286,733 255,218
Net income 202,920 143,539
Net gains or losses on value of investments Net (loss)/gain on investments (206,451) 843,208 Net foreign exchange (loss)/gain (75,197) 7,436
(281,648) 850,644
Total (deficit)/return for the period before income tax (78,728) 994,183Less: Income tax (103,046) (62,510)
Total (deficit)/return for the period (181,774) 931,673
United Global Telecoms Fund(Constituted under a Trust Deed in the Republic of Singapore)
11
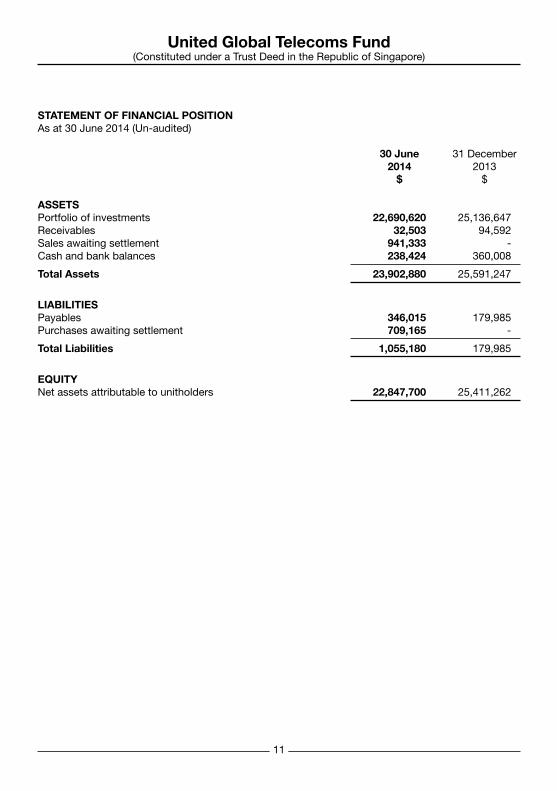
STATEMENT OF FINANCIAL POSITIONAs at 30 June 2014 (Un-audited)
30 June 31 December 2014 2013 $ $
ASSETSPortfolio of investments 22,690,620 25,136,647 Receivables 32,503 94,592 Sales awaiting settlement 941,333 - Cash and bank balances 238,424 360,008
Total Assets 23,902,880 25,591,247
LIABILITIESPayables 346,015 179,985 Purchases awaiting settlement 709,165 -
Total Liabilities 1,055,180 179,985
EQUITYNet assets attributable to unitholders 22,847,700 25,411,262
United Global Telecoms Fund(Constituted under a Trust Deed in the Republic of Singapore)
12
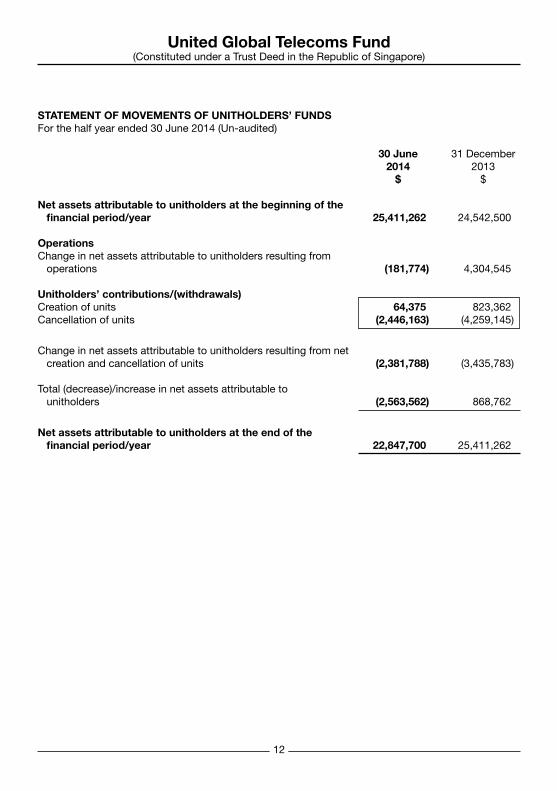
STATEMENT OF MOVEMENTS OF UNITHOLDERS’ FUNDSFor the half year ended 30 June 2014 (Un-audited)
30 June 31 December 2014 2013 $ $
Net assets attributable to unitholders at the beginning of the financial period/year 25,411,262 24,542,500
Operations Change in net assets attributable to unitholders resulting from operations (181,774) 4,304,545
Unitholders’ contributions/(withdrawals) Creation of units 64,375 823,362 Cancellation of units (2,446,163) (4,259,145)
Change in net assets attributable to unitholders resulting from net creation and cancellation of units (2,381,788) (3,435,783)
Total (decrease)/increase in net assets attributable to unitholders (2,563,562) 868,762
Net assets attributable to unitholders at the end of the financial period/year 22,847,700 25,411,262
United Global Telecoms Fund(Constituted under a Trust Deed in the Republic of Singapore)
13
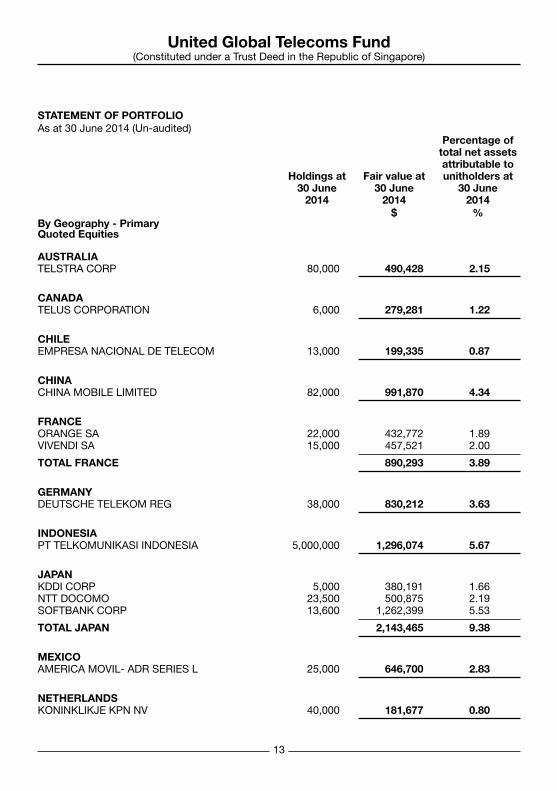
STATEMENT OF PORTFOLIO As at 30 June 2014 (Un-audited) Percentage of total net assets attributable to Holdings at Fair value at unitholders at 30 June 30 June 30 June 2014 2014 2014 $ %By Geography - PrimaryQuoted Equities
AUSTRALIATELSTRA CORP 80,000 490,428 2.15
CANADATELUS CORPORATION 6,000 279,281 1.22
CHILEEMPRESA NACIONAL DE TELECOM 13,000 199,335 0.87
CHINACHINA MOBILE LIMITED 82,000 991,870 4.34
FRANCEORANGE SA 22,000 432,772 1.89 VIVENDI SA 15,000 457,521 2.00
TOTAL FRANCE 890,293 3.89
GERMANYDEUTSCHE TELEKOM REG 38,000 830,212 3.63
INDONESIAPT TELKOMUNIKASI INDONESIA 5,000,000 1,296,074 5.67
JAPAN KDDI CORP 5,000 380,191 1.66 NTT DOCOMO 23,500 500,875 2.19 SOFTBANK CORP 13,600 1,262,399 5.53
TOTAL JAPAN 2,143,465 9.38
MEXICO AMERICA MOVIL- ADR SERIES L 25,000 646,700 2.83
NETHERLANDS KONINKLIKJE KPN NV 40,000 181,677 0.80
United Global Telecoms Fund(Constituted under a Trust Deed in the Republic of Singapore)
14
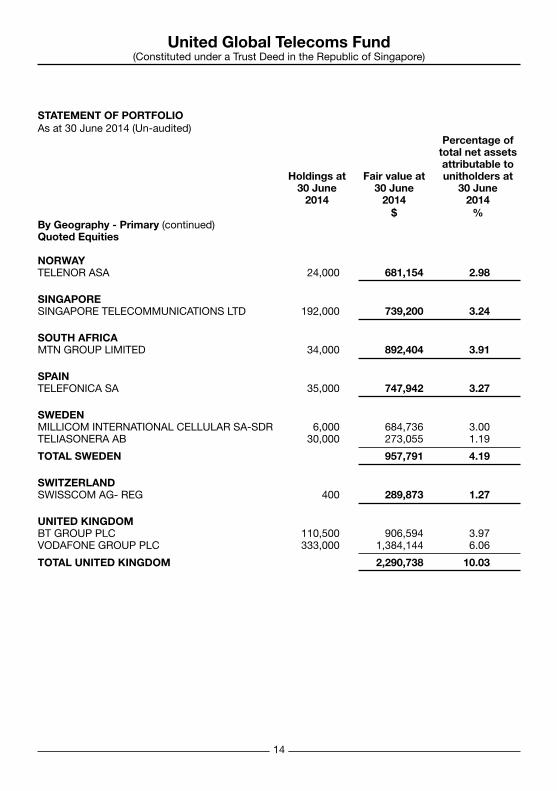
STATEMENT OF PORTFOLIO As at 30 June 2014 (Un-audited) Percentage of total net assets attributable to Holdings at Fair value at unitholders at 30 June 30 June 30 June 2014 2014 2014 $ %By Geography - Primary (continued)Quoted Equities
NORWAYTELENOR ASA 24,000 681,154 2.98
SINGAPORESINGAPORE TELECOMMUNICATIONS LTD 192,000 739,200 3.24
SOUTH AFRICAMTN GROUP LIMITED 34,000 892,404 3.91
SPAINTELEFONICA SA 35,000 747,942 3.27
SWEDENMILLICOM INTERNATIONAL CELLULAR SA-SDR 6,000 684,736 3.00 TELIASONERA AB 30,000 273,055 1.19
TOTAL SWEDEN 957,791 4.19
SWITZERLANDSWISSCOM AG- REG 400 289,873 1.27
UNITED KINGDOMBT GROUP PLC 110,500 906,594 3.97 VODAFONE GROUP PLC 333,000 1,384,144 6.06
TOTAL UNITED KINGDOM 2,290,738 10.03
United Global Telecoms Fund(Constituted under a Trust Deed in the Republic of Singapore)
15
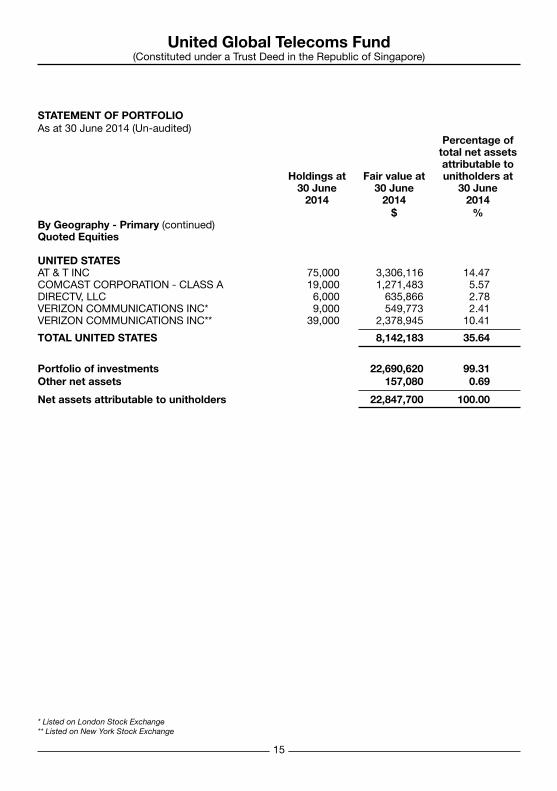
STATEMENT OF PORTFOLIO As at 30 June 2014 (Un-audited) Percentage of total net assets attributable to Holdings at Fair value at unitholders at 30 June 30 June 30 June 2014 2014 2014 $ %By Geography - Primary (continued)Quoted Equities
UNITED STATESAT & T INC 75,000 3,306,116 14.47 COMCAST CORPORATION - CLASS A 19,000 1,271,483 5.57 DIRECTV, LLC 6,000 635,866 2.78 VERIZON COMMUNICATIONS INC* 9,000 549,773 2.41 VERIZON COMMUNICATIONS INC** 39,000 2,378,945 10.41
TOTAL UNITED STATES 8,142,183 35.64
Portfolio of investments 22,690,620 99.31 Other net assets 157,080 0.69
Net assets attributable to unitholders 22,847,700 100.00
* Listed on London Stock Exchange** Listed on New York Stock Exchange
United Global Telecoms Fund(Constituted under a Trust Deed in the Republic of Singapore)
16
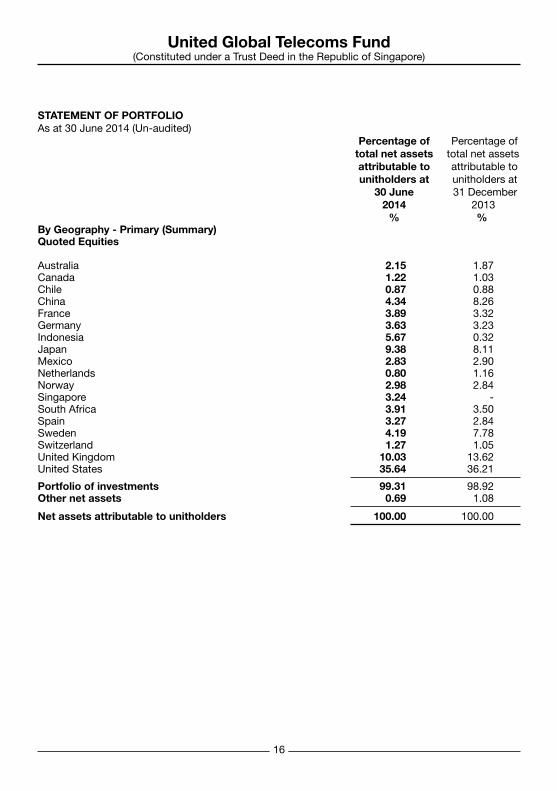
STATEMENT OF PORTFOLIO As at 30 June 2014 (Un-audited) Percentage of Percentage of total net assets total net assets attributable to attributable to unitholders at unitholders at 30 June 31 December 2014 2013 % %By Geography - Primary (Summary)Quoted Equities Australia 2.15 1.87Canada 1.22 1.03Chile 0.87 0.88China 4.34 8.26France 3.89 3.32Germany 3.63 3.23Indonesia 5.67 0.32Japan 9.38 8.11Mexico 2.83 2.90Netherlands 0.80 1.16Norway 2.98 2.84Singapore 3.24 - South Africa 3.91 3.50Spain 3.27 2.84Sweden 4.19 7.78Switzerland 1.27 1.05United Kingdom 10.03 13.62United States 35.64 36.21
Portfolio of investments 99.31 98.92 Other net assets 0.69 1.08
Net assets attributable to unitholders 100.00 100.00
United Global Telecoms Fund(Constituted under a Trust Deed in the Republic of Singapore)
17
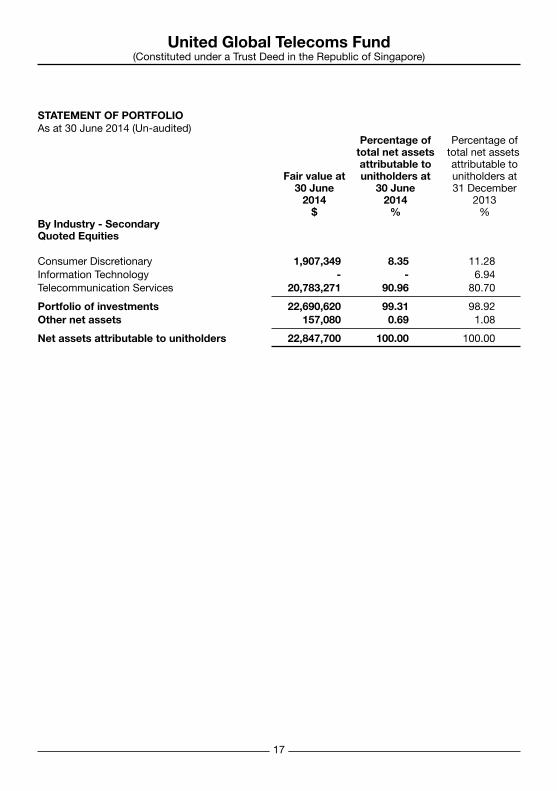
STATEMENT OF PORTFOLIO As at 30 June 2014 (Un-audited) Percentage of Percentage of total net assets total net assets attributable to attributable to Fair value at unitholders at unitholders at 30 June 30 June 31 December 2014 2014 2013 $ % %By Industry - SecondaryQuoted Equities Consumer Discretionary 1,907,349 8.35 11.28 Information Technology - - 6.94 Telecommunication Services 20,783,271 90.96 80.70
Portfolio of investments 22,690,620 99.31 98.92 Other net assets 157,080 0.69 1.08
Net assets attributable to unitholders 22,847,700 100.00 100.00

United Global Telecoms Fund(Constituted under a Trust Deed in the Republic of Singapore)
18
This page has been intentionally left blank.
United Global Telecoms Fund(Constituted under a Trust Deed in the Republic of Singapore)
19
This page has been intentionally left blank.

United Global Telecoms Fund(Constituted under a Trust Deed in the Republic of Singapore)
20
This page has been intentionally left blank.