Embed Size (px)
Citation preview
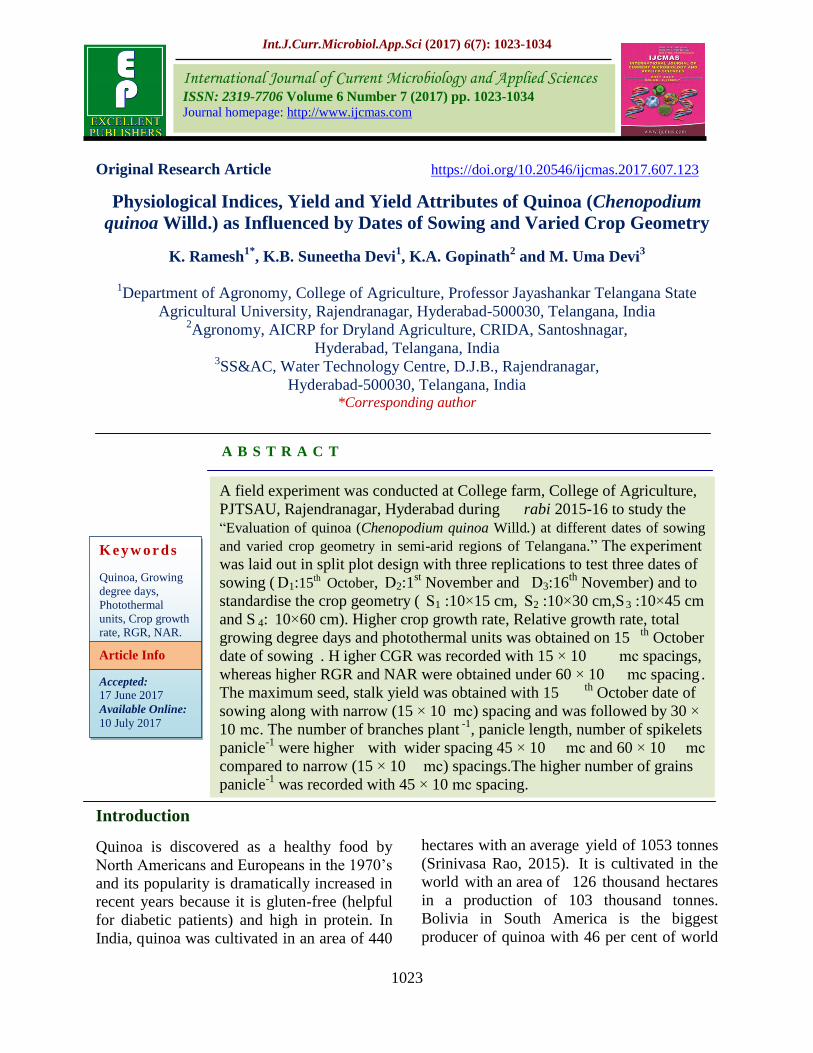
Int.J.Curr.Microbiol.App.Sci (2017) 6(7): 1023-1034
1023
Original Research Article https://doi.org/10.20546/ijcmas.2017.607.123
Physiological Indices, Yield and Yield Attributes of Quinoa (Chenopodium
quinoa Willd.) as Influenced by Dates of Sowing and Varied Crop Geometry
K. Ramesh1*
, K.B. Suneetha Devi1, K.A. Gopinath
2 and M. Uma Devi
3
1Department of Agronomy, College of Agriculture, Professor Jayashankar Telangana State
Agricultural University, Rajendranagar, Hyderabad-500030, Telangana, India 2Agronomy, AICRP for Dryland Agriculture, CRIDA, Santoshnagar,
Hyderabad, Telangana, India 3SS&AC, Water Technology Centre, D.J.B., Rajendranagar,
Hyderabad-500030, Telangana, India *Corresponding author
A B S T R A C T
Introduction
Quinoa is discovered as a healthy food by
North Americans and Europeans in the 1970’s
and its popularity is dramatically increased in
recent years because it is gluten-free (helpful
for diabetic patients) and high in protein. In
India, quinoa was cultivated in an area of 440
hectares with an average yield of 1053 tonnes
(Srinivasa Rao, 2015). It is cultivated in the
world with an area of 126 thousand hectares
in a production of 103 thousand tonnes.
Bolivia in South America is the biggest
producer of quinoa with 46 per cent of world
International Journal of Current Microbiology and Applied Sciences ISSN: 2319-7706 Volume 6 Number 7 (2017) pp. 1023-1034 Journal homepage: http://www.ijcmas.com
A field experiment was conducted at College farm, College of Agriculture,
PJTSAU, Rajendranagar, Hyderabad during rabi 2015-16 to study the
“Evaluation of quinoa (Chenopodium quinoa Willd.) at different dates of sowing
and varied crop geometry in semi-arid regions of Telangana.” The experiment
was laid out in split plot design with three replications to test three dates of
sowing ( D1:15th October, D2:1
st November and D3:16
th November) and to
standardise the crop geometry ( S1 : 15×10 cm, S2 : 30×10 cm,S3 : 45×10 cm
and S 4: 60×10 cm). Higher crop growth rate, Relative growth rate, total
growing degree days and photothermal units was obtained on 15th
October
date of sowing . H igher CGR was recorded with 15 × 10 mc spacings,
whereas higher RGR and NAR were obtained under 60 × 10 mc spacing .
The maximum seed, stalk yield was obtained with 15th
October date of
sowing along with narrow (15 × 10 mc) spacing and was followed by 30 ×
10 mc. The number of branches plant-1
, panicle length, number of spikelets
panicle-1
were higher with wider spacing 45 × 10 mc and 60 × 10 mc
compared to narrow (15 × 10 mc) spacings.The higher number of grains
panicle-1
was recorded with 45 × 10 mc spacing.
K e y w o r d s
Quinoa, Growing
degree days,
Photothermal
units, Crop growth
rate, RGR, NAR.
Accepted:
17 June 2017
Available Online:
10 July 2017
Article Info
Int.J.Curr.Microbiol.App.Sci (2017) 6(7): 1023-1034
1024
production followed by Peru with 42 per cent
and United States of America with 6.3 per
cent (FAOSTAT, 2013). As per United
Nations Organisation for Agriculture and
Food, the quinoa grain is the only vegetable
food that provides all amino acids essential to
the life of humans in optimum quantities and
is comparable with milk. The protein and oil
content ranges from 7.47 to 22.08 per cent
and 1.8 to 9.5 per cent. FAO nominated 2013
as International year of Quinoa (Bhargava et
al., 2006).
Growing period of quinoa varied between 70
to 200 days and some entries did not mature
in some locations. The experiment conducted
to evaluate quinoa entries in America, Europe
and Africa and reported that growing period
of quinoa in Kenya was 65-98 days and all
cultivars matured with seed yield of 4000 kg
ha-1
.
In Denmark and Sweden, growing period was
120-160 days but yields were low and few
varieties only matured. The growing period in
Greece was 110-160 days and the yield was
2000 kg ha-1
(Jacobsen, 2003)
It can play a major role in future
diversification of agriculture system in India.
Inspite of its wide adaptability, nutritional
superiority, its commercial potential has
remained untapped. Hence, an experiment
was conducted entitled “Evaluation of Quinoa
(Chenopodium quinoa willd.) At different
dates of sowing and varied crop geometry in
semi-arid regions of Telangana” during rabi
season, 2015-16.
Materials and Methods
A field experiment was conducted at College
farm, College of Agriculture, Professor
Jayashankar Telangana State Agricultural
University, Rajendranagar, Hyderabad during
rabi 2015-16 . The farm is geographically
situated at an altitude of 542.3 m above mean
sea level at 170 19’ N latitude, 78
0 28’ E
longitude. The experiment was laid out in
split plot design with three replications with
three different dates of sowing ( D1:15th
October, D2:1st November and D3:16
th
November) as main plots and four crop
geometry levels ( S1 : 15×10 cm, S2 : 30×10
cm,S3 : 45×10 cm and S 4: 60×10 cm) as sub
plots under semi arid conditions of Telangana.
The variety used was accession line of EC
series (Golden yellow colour seed) . The
weekly mean (maximum and minimum)
temperature. Weekly mean relative humidity
(maximum and minimum) 84.3 per cent and
39.5 per cent, Where as weekly mean
sunshine hours, evaporation and wind
velocity was 8.1 h day-1
, 5.5 mm day-1
and 1.3
km h-1
respectively and rain fall of 18.3 mm
received in a single day during the crop
growing seaon.
The experimental soil was sandy loam in
texture, high organic carbon, medium in soil
available nitrogen (258 kg ha-1
), phosphorus
(25.3 kg ha-1
), and potassium (238 kg ha-1
).
Recommended dose of fertilizer i.e., 100 kg
N, 50 kg P2O5 and 50 kg K2O ha-1
in the form
of urea, single super phosphate and muriate of
potash, respectively, Entire dose of P, K and
½ of N was applied as basal through
placement in the furrows made with hand
hoes 5 cm away from seed rows and at a
depth of 2 cm below the seed zone. The
remaining ½ dose of N was applied in two
more equal splits at 25 and 50 days after
sowing. One irrigation was provided after
sowing to facilitate uniform germination of
the crop, and 5-6 irrigations were given at 12-
15 days interval. During the seedling stage,
the crop was affected by leaf eating
caterpillars and leaf miners those were
controlled by spraying Quinolphos @ 2ml lit-1
of water. Data on growth and yield attributes
from randomly selected five plants from each
net plot was recorded and the mean value was
Int.J.Curr.Microbiol.App.Sci (2017) 6(7): 1023-1034
1025
worked out and yield was recorded from each
net plot. The crop was harvested at 107, 101
and 97 days in three dates of sowing ( D1:15th
October, D2:1st November and D3:16
th
November) respectively. The physiological
indices i.e., crop growth rate ( CGR), relative
growth rate ( RGR), net assimilation rate
(NAR) were calculated at monthly interval
upto harvest, yield atrributes and yield were
recorded and data was statistically analyzed
by using WINDOSTAT Software Version-7.
Significance of the treatments was determined
on the basis of F test and critical difference
was calculated at 5% level of probability.
Growing degree days ( GDD), photothermal
units ( PTU) were calculated based on the
following formulae.
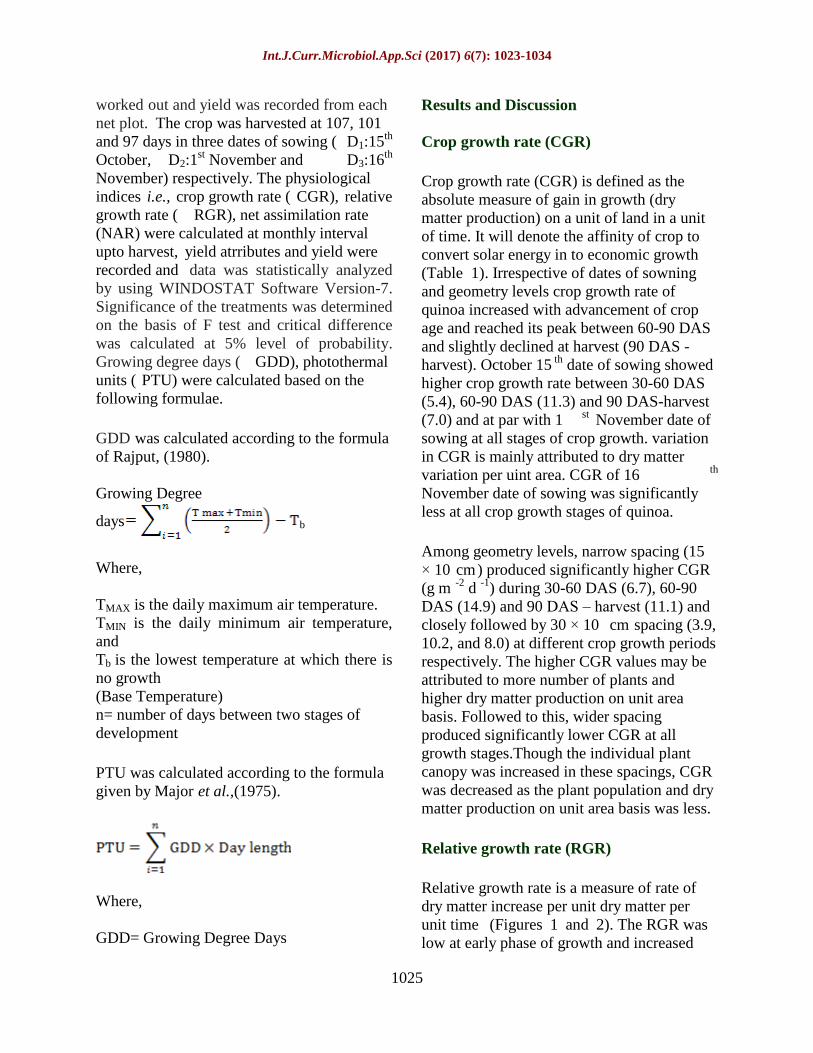
GDD was calculated according to the formula
of Rajput, (1980).
Growing Degree
days b
Where,
TMAX is the daily maximum air temperature.
TMIN is the daily minimum air temperature,
and
Tb is the lowest temperature at which there is
no growth
(Base Temperature)
n= number of days between two stages of
development
PTU was calculated according to the formula
given by Major et al.,(1975).
Where,
GDD= Growing Degree Days
Results and Discussion
Crop growth rate (CGR)
Crop growth rate (CGR) is defined as the
absolute measure of gain in growth (dry
matter production) on a unit of land in a unit
of time. It will denote the affinity of crop to
convert solar energy in to economic growth
(Table 1). Irrespective of dates of sowning
and geometry levels crop growth rate of
quinoa increased with advancement of crop
age and reached its peak between 60-90 DAS
and slightly declined at harvest (90 DAS -
harvest). October 15th
date of sowing showed
higher crop growth rate between 30-60 DAS
(5.4), 60-90 DAS (11.3) and 90 DAS-harvest
(7.0) and at par with 1st
November date of
sowing at all stages of crop growth. variation
in CGR is mainly attributed to dry matter
variation per uint area. CGR of 16th
November date of sowing was significantly
less at all crop growth stages of quinoa.
Among geometry levels, narrow spacing (15
× 10 cm) produced significantly higher CGR
(g m-2
d-1
) during 30-60 DAS (6.7), 60-90
DAS (14.9) and 90 DAS – harvest (11.1) and
closely followed by 30 × 10 cm spacing (3.9,
10.2, and 8.0) at different crop growth periods
respectively. The higher CGR values may be
attributed to more number of plants and
higher dry matter production on unit area
basis. Followed to this, wider spacing
produced significantly lower CGR at all
growth stages.Though the individual plant
canopy was increased in these spacings, CGR
was decreased as the plant population and dry
matter production on unit area basis was less.
Relative growth rate (RGR)
Relative growth rate is a measure of rate of
dry matter increase per unit dry matter per
unit time (Figures 1 and 2). The RGR was
low at early phase of growth and increased
Int.J.Curr.Microbiol.App.Sci (2017) 6(7): 1023-1034
1026
between 30-60 DAS and againdecreased
maturity. October 15th
date of sowing
maintained higher RGR at 30-60 DAS, 60-90
DAS and at 90 DAS-harvest growth stages
and superior over 1st November and 16
th
November dates of sowing.
Relative growth rate was infuenced by
various levels of crop geometries at different
growth periods. The higher RGR was
achieved under wider 60 × 10 cm spacing
compared to closer 15 × 10 cm spacing but
the difference between the geometries was
non significant at 90 DAS- harvest period of
the crop. However, highest RGR was
observed at 30-60 DAS under 15 × 10 cm and
at 60-90 DAS under wider 60 × 10 cm
spacing superior over other crop geometries.
This might be due to better performance of
individual plant in terms of dry matter
production under wider spacing because of
utilisation of available resources such as sun
light, water, nutrient and space which made
higher relative growth rate under wider
spacing compared to narrow spacing.
Net assimilation rate (NAR)
Net assimilation rate or unit leaf rate is the net
gain of assimilate per unit of leaf area and
unit time (Figures 3 and 4). The production of
crop is dependent on its inherent capacity of
net assimilation rate (NAR) and leaf area. As
NAR dependent on leaf area similarly it was
lower at early growth stage and peak at
reproductive stage and decreased with
advancement of crop growht period further.
November 16th
date of sowing was superior
over other dates of sowing. However, highest
gain was observed at 60-90 DAS.
Increase in crop geometry of quinoa showed
significant increase in NAR at all the crop
growth periods. Maximum net gain of
assimilates was observed under wider 60 × 10
cm spacing between 60-90 DAS which was
signifiactly higher compared to closer
spacing. While minimum NAR shown in
figure at all stages of crop growth with closer
spacing.
Growing degree days (GDD)
The crop sown on 15th
October date of sowing
took 107 days to maturity followed by 101
and 97 days in 1st November and 16
th
November date of sowing respectively
Jacobsen (2003) reported that growing period
of quinoa varied between 70 to 200 days over
Globe and some entries did not mature in
some locations. 15th
October date of sowing
showed optimum allocation of days to
different phenological stages, i.e., vegetative
(35 days), flowering (22 days), grain initiation
to development (25 days) and grain maturity
(13 days) and thus resulted in higher yield
attributes and seed yield of quinoa with less
vegetative growth (plant height, number of
branches). The results were suported by
Hirich et al., (2014) and Bertero (2001).
Contradictory to this, 1st November and 16
th
November dates of sowing took less number
of days for germination and establishment
stage (10 and 9 days) respectively because of
lower temperature (21 to 220 C) but
vegetative growth for more days (37 and 36
days). Hence, the plant height, number of
branches, dry matter production of leaf and
stem upto 60 DAS is higher compared to 15th
October date of sowing. Afterwards flowering
period and grain initiation and development
was reduced in 1st November (19 and 17
days) and 16th
November (22 and 21 days)
date of sowing respectively. This resulted in
less partitioning of dry matter to reproductive
parts and reduced seed yield of quinoa. The
grain hardening and maturity stage was not
affected by sowing dates. Growing degree
days represents influence of temperature on
growth and development of crop (Table 2).
Int.J.Curr.Microbiol.App.Sci (2017) 6(7): 1023-1034
1027
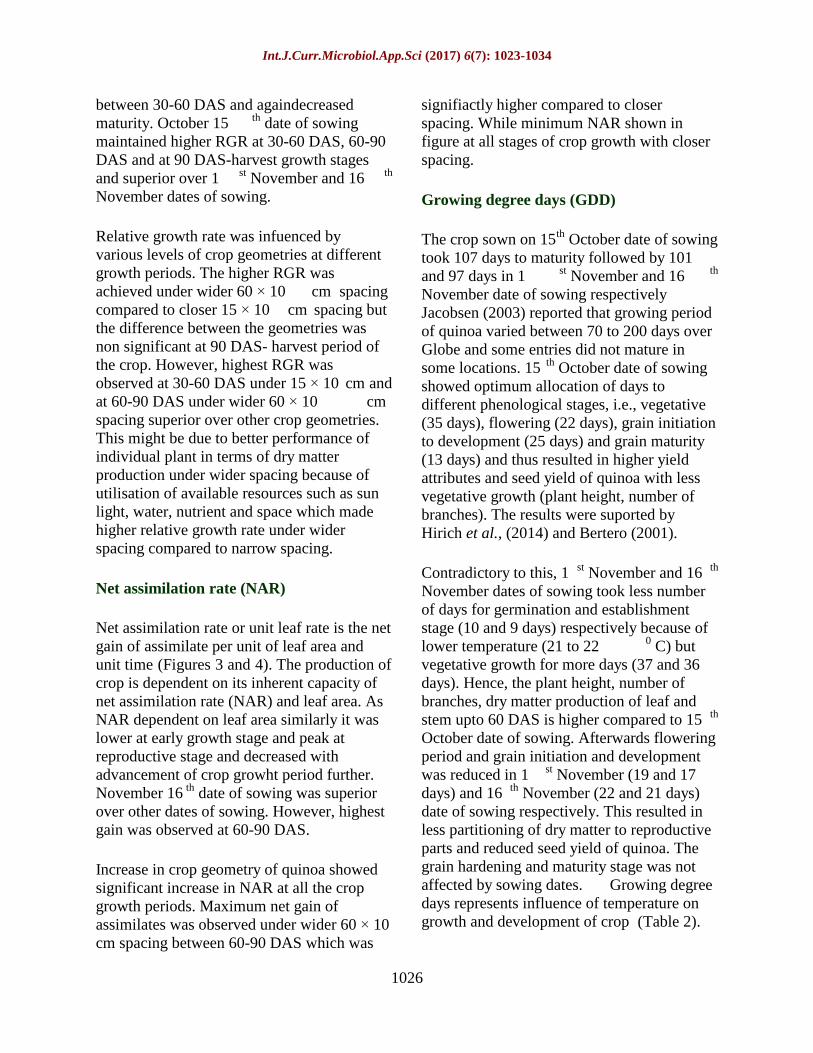
Table.1 Effect of sowing dates and varied crop geometry on crop growth rate (CGR) (gm-2
d-1
)
Treatments 30-60 DAS 60-90 DAS 90 DAS -Harvest
Main: Sowing dates
D1: October 15 5.4 11.3 7.0
D2:November 1 5.1 10.4 5.3
D3:November 16 4.4 8.6 4.4
SEm± 0.1 0.9 0.7
CD(P=0.05) 0.3 2.4 2.0
CV(%) 7.1 10.6 11.3
Sub: Geometrylevels
S1:15×10 cm 6.7 14.9 11.1
S2:30×10 cm 3.9 10.2 8.0
S3:45×10 cm 4.5 8.3 7.2
S4:60×10 cm 4.9 6.9 6.1
SEm ± 0.1 0.6 0.5
CD(P=0.05) 0.4 1.3 1.5
CV(%) 8.14 13.7 14.1
Interaction
D×S (main at samelevel of sub)
SEm± 0.3 1.1 0.9
CD (P=0.05) 0.7 2.3 NS
S×D (sub at same or different level of main)
SEm± 0.3 1.3 1.1
CD (P=0.05) 0.7 3.2 NS
Table.1a Interaction between sowing dates and varied crop geometry on CGR of quinoa at 30-60
DASand 60-90 DAS
CGR at 30-60 DAS
Treatments Crop geometry (cm)
15×10 30×10 45×10 60×10 Mean
Sowing dates
October15 9.8 5.3 3.0 3.1 5.4
November1 6.5 3.0 5.0 6.0 5.1
November16 3.7 2.9 5.4 5.6 4.4
Mean 6.7 3.9 4.5 4.9
Interaction
D×S SEm± 0.3 CD (P=0.05) 0.7
S×D SEm± 0.3 CD (P=0.05) 0.7 CGR at 60-90 DAS
Treatments Crop geometry (cm)
15×10 30×10 45×10 60×10 Mean
Sowing dates
October15 18.9 11.4 8.1 6.8 11.3
November1 14.8 9.8 9.2 7.7 10.4
November16 11.1 9.3 7.5 6.4 8.5
Mean 14.9 10.2 8.3 6.69
Interaction
D×S SEm± 1.1 CD (P=0.05) 2.3
S×D SEm± 1.3 CD (P=0.05) 3.2

Int.J.Curr.Microbiol.App.Sci (2017) 6(7): 1023-1034
1028
Table.2 Growing degree days and photothermal units during different phenophases of as
influenced by dates of sowing of Quinoa
Phenophase Growing degree days
(GDD)
Photothermal unit
(PTU)
D1: October 15 - Jan.27
Germination and Establishment (12 days) 272.5 3174.6
Vegetative (35 days) 726.8 8234.6
Flowering (22 days) 431.2 4764.7
Grain initiation andDevelopment (25 days) 415.8 4569.6
Grain hardening and Maturity (13 days) 272.8 3017.1
Total (107 days) 2119.1 23760.8
D2:November 1 – Feb.7
Germination and Establishment (10 days) 219.8 2503.5
Vegetative (37 days) 739.6 8483.2
Flowering (19 days) 325.2 3573.9
Grain initiation andDevelopment (22 days) 409.0 4511.2
Grain hardening and Maturity (13 days) 267.5 2987.9
Total (101 days) 1959.3 22059.9
D3:November 16 – Feb.17
Germination and Establishment (9 days) 186.9 2095.1
Vegetative (36 days) 723.3 7992.4
Flowering (17 days) 265.7 2922.7
Grain initiation andDevelopment (21 days) 399.4 4437.3
Grain hardening and Maturity (14 days) 282.2 3188.8
Total (97 days) 1857.5 20636
Int.J.Curr.Microbiol.App.Sci (2017) 6(7): 1023-1034
1029
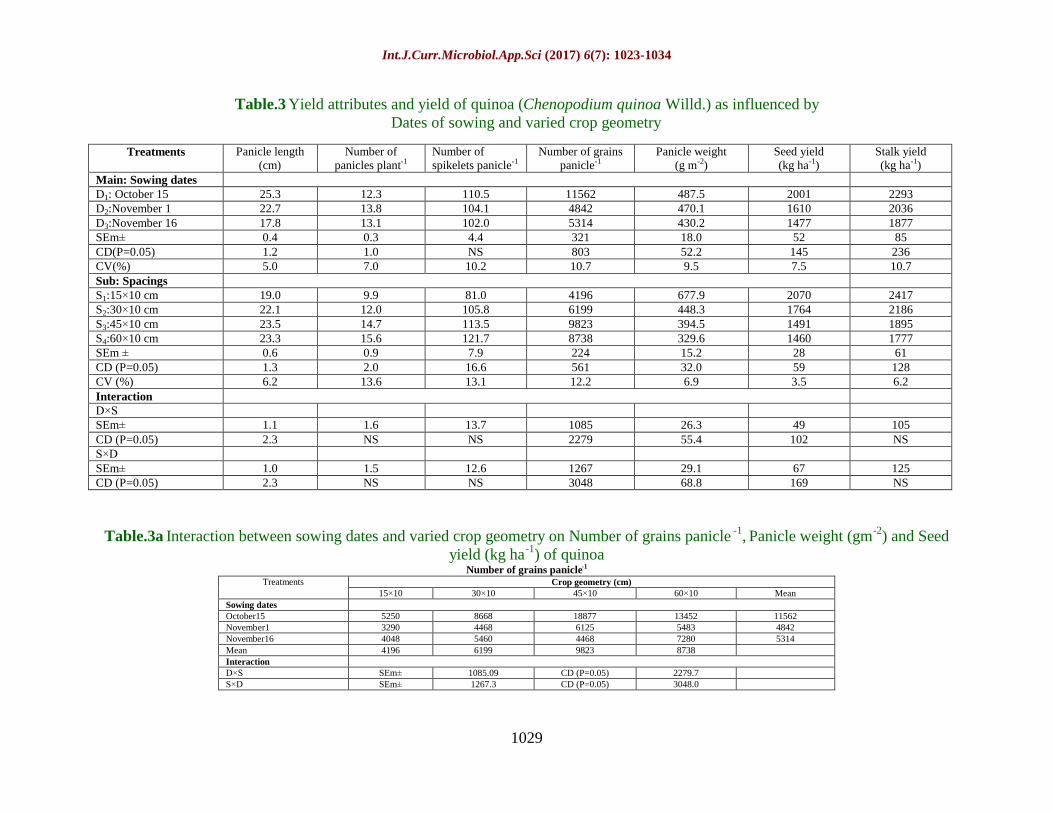
Table.3 Yield attributes and yield of quinoa (Chenopodium quinoa Willd.) as influenced by
Dates of sowing and varied crop geometry
Treatments Panicle length
(cm)
Number of
panicles plant-1
Number of
spikelets panicle-1
Number of grains
panicle-1
Panicle weight
(g m-2)
Seed yield
(kg ha-1)
Stalk yield
(kg ha-1)
Main: Sowing dates
D1: October 15 25.3 12.3 110.5 11562 487.5 2001 2293
D2:November 1 22.7 13.8 104.1 4842 470.1 1610 2036
D3:November 16 17.8 13.1 102.0 5314 430.2 1477 1877
SEm± 0.4 0.3 4.4 321 18.0 52 85
CD(P=0.05) 1.2 1.0 NS 803 52.2 145 236
CV(%) 5.0 7.0 10.2 10.7 9.5 7.5 10.7
Sub: Spacings
S1:15×10 cm 19.0 9.9 81.0 4196 677.9 2070 2417
S2:30×10 cm 22.1 12.0 105.8 6199 448.3 1764 2186
S3:45×10 cm 23.5 14.7 113.5 9823 394.5 1491 1895
S4:60×10 cm 23.3 15.6 121.7 8738 329.6 1460 1777
SEm ± 0.6 0.9 7.9 224 15.2 28 61
CD (P=0.05) 1.3 2.0 16.6 561 32.0 59 128
CV (%) 6.2 13.6 13.1 12.2 6.9 3.5 6.2
Interaction
D×S
SEm± 1.1 1.6 13.7 1085 26.3 49 105
CD (P=0.05) 2.3 NS NS 2279 55.4 102 NS
S×D
SEm± 1.0 1.5 12.6 1267 29.1 67 125
CD (P=0.05) 2.3 NS NS 3048 68.8 169 NS
Table.3a Interaction between sowing dates and varied crop geometry on Number of grains panicle-1
, Panicle weight (gm
-2) and Seed
yield (kg ha-1
) of quinoa Number of grains panicle-1
Treatments Crop geometry (cm)
15×10 30×10 45×10 60×10 Mean
Sowing dates
October15 5250 8668 18877 13452 11562
November1 3290 4468 6125 5483 4842
November16 4048 5460 4468 7280 5314
Mean 4196 6199 9823 8738
Interaction
D×S SEm± 1085.09 CD (P=0.05) 2279.7
S×D SEm± 1267.3 CD (P=0.05) 3048.0
Int.J.Curr.Microbiol.App.Sci (2017) 6(7): 1023-1034
1030
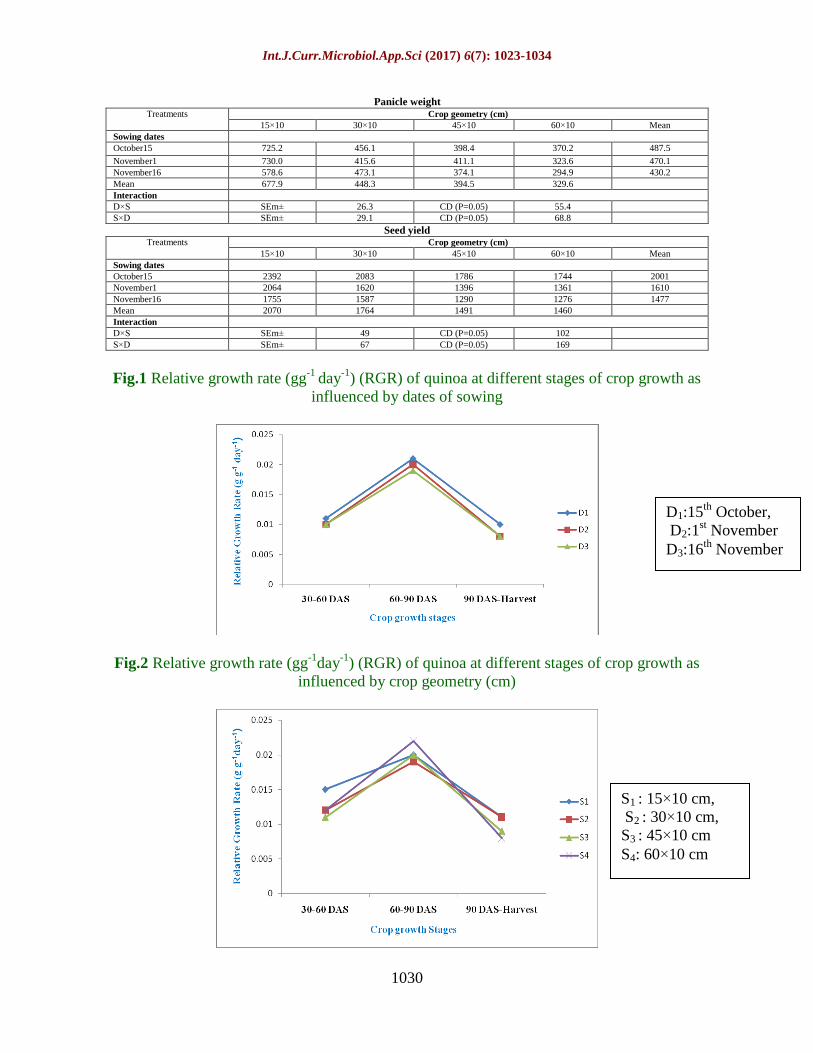
Panicle weight Treatments Crop geometry (cm)
15×10 30×10 45×10 60×10 Mean
Sowing dates
October15 725.2 456.1 398.4 370.2 487.5
November1 730.0 415.6 411.1 323.6 470.1
November16 578.6 473.1 374.1 294.9 430.2
Mean 677.9 448.3 394.5 329.6
Interaction
D×S SEm± 26.3 CD (P=0.05) 55.4
S×D SEm± 29.1 CD (P=0.05) 68.8
Seed yield Treatments Crop geometry (cm)
15×10 30×10 45×10 60×10 Mean
Sowing dates
October15 2392 2083 1786 1744 2001
November1 2064 1620 1396 1361 1610
November16 1755 1587 1290 1276 1477
Mean 2070 1764 1491 1460
Interaction
D×S SEm± 49 CD (P=0.05) 102
S×D SEm± 67 CD (P=0.05) 169
Fig.1 Relative growth rate (gg-1
day-1
) (RGR) of quinoa at different stages of crop growth as
influenced by dates of sowing
Fig.2 Relative growth rate (gg-1
day-1
) (RGR) of quinoa at different stages of crop growth as
influenced by crop geometry (cm)
D1:15th
October,
D2:1st November
D3:16th
November
S1 : 15×10 cm,
S2 : 30×10 cm,
S3 : 45×10 cm
S4: 60×10 cm

Int.J.Curr.Microbiol.App.Sci (2017) 6(7): 1023-1034
1031
Fig.3 Net assimilation rate (g day-1
m-2
) (NAR) of quinoa at different stages of crop growth as
influenced by dates of sowing
Fig.4 Net assimilation rate (g day-1
m-2
) (NAR) of quinoa at different stages of crop growth as
influenced by crop geometry (cm)
The results indicated that GDD of each
phenophase and total crop period was
influenced due to sowing dates. Growing
degree days were higher in January 2nd
week
(17.10
C) and higher during October 15 to
22nd
(230 C).
Total growing degree days were higher
(2119.1) with 15th
October date of sowing and
was followed by 1st November (1959.3) and
16th
November (1857.5) dates of sowing. The
same range of growing degree days (2000-
2200) was reported by Hirich et al., (2014) in
Morocco.
In different phenophases, 15th
October date of
sowing recorded more growing degree days
(273) for germination and establishment than
1st November (220) date of sowing and 16
th
November (187). It may be due to higher
average temperature (22.850 C) than 1
st
November (22.150 C) and 16
th November
(20.550 C) dates of sowing.
The vegetative stage attained less growing
degree days (727) during 15th
October date of
D1:15th
October
D2:1st November
D3:16th
November
S1 : 15×10 cm,
S2 : 30×10 cm,
S3 : 45×10 cm
S4: 60×10 cm
Int.J.Curr.Microbiol.App.Sci (2017) 6(7): 1023-1034
1032
sowing compared to 1st November (740) and
16th
November (723) date of sowing. The
vegetative growth of quinoa interms of plant
height, number of branches plant-1
, dry matter
of stem and leaf was less compared to 1st
November and 16th
November dates of
sowing. Growing degree days of flowering,
grain initiation and development stages (431
and 416) was higher in 15th
October date of
sowing compared to 1st November (325 and
409) and 16th
November date of sowing (266
and 399). Hence relatively higheryield
attributes (panicle length, number of grains
panicle-1
) and seed yield was observed in 15th
October date of sowing. Grain hardening and
maturity stages of quinoa attained higher
growing degree days (282) in 15th
October
date of sowing followed by 16th
November
(273) and 1st November (268) dates of
sowing.
Photothermal units (PTU)
Photothermal units represents the influence of
photoperiod (day length) and temperature on
growth and development of crop (Table 2).
Quinoa is a short day plant and photoperiod
had strong influence on reproductive phase
(Bertero et al., 1991). The lower day length of
10.99 was observed during December to
January and higher day lenghth of 11.65 was
observed in October during crop growth
period of quinoa.
Photothermal units (PTU) recorded in 15th
October date of sowing was higher (23761)
than 1st November (22060) and 16
th
November (20636) date of sowing.
photpthermal units during germination and
estblishment and vegetative stages were
almost similar for three dates of sowing, but
15th
October date of sowing recorded higher
number of photothermal units during
flowering (4765) and grain initiation and
development (4570) stages mainly because of
more number of days in these phenological
stages. Sajjad et al., (2014) also reported
sensitivity of quinoa genotypes to photoperiod
and temperature. Photothermal units during
grain hardening and maturity stage showed
less variation due to dates of sowing. Bertero
et al., (1991) reported that combination of
high temperature with long day length (>14 h)
showed greatest inhibitiion of seed growth by
73 per cent.
Yield attributes and yield
Panicle length (cm), Number of panicles
plant-1
, Number of spikelets panicle-1
,
Number of grains panicle-1
, Panicle weight (g
m-2
), Seed yield (kg ha-1
) and Stalk yield (kg
ha-1
) were recorded significantly higher on
15th
October date of sowing compared to
other dates of sowing ( Table 3). T he
superiority of October 15th
date of sowing
with respect to yield attributes and yield may
be due to efficient utilization of natural
resources (water and nutrients) with optimum
vegetative growth and higher translocatation
of photosynthates from source to sink. Similar
results were reported by Hakan Geren et
al.,(2014) and Sajjad et al., (2014) in Quinoa
and Chaudhari et al., (2009) in amaranth crop.
Parvin et al., (2013) also stated that late
planting reduces yield because the plant life
cycle is limited with temperature and
photoperiod.
Among various crop geometries, 45 cm × 10
cm recorded signficantly higher panicle
length, number of grains panicle-1
60× 10cm
recorded higher number of panicles plant-1
,
and number of spikelets panicle-1
, where as
higher Panicle weight, Seed and Stalk yield
(kg ha-1
) were recorded with 15× 10 cm as
compared to the other crop geometries. The
plants grown in wider spacing grew broader
with more number of branches, number of
panicles and increased panicle length due to
availability of light, space, nutrients for single
plant. Chaudhari et al., (2009) also reported
higher panicle length and spikelets due to
Int.J.Curr.Microbiol.App.Sci (2017) 6(7): 1023-1034
1033
lower inter row competetion for space,
nutrients and moisture in wider row spacing
(45× 10 cm and 60× 10 cm) than narrow 15×
10 cm and 30× 10 cm) spacings.
Interaction effect between date of sowing
and varied crop geometry on Physiological
indices and yield of quinoa
The interaction between dates of sowing and
varied geometry was significant on crop
growth rate at 30-60 DAS and 60-90 DAS
(Table 1a). Within each date of sowing, CGR
was significantly higher in narrow spacing
(15 × 10 cm) with sharp decline with increase
in spacing from 30 × 10 cm to 60 × 10 cm
spacing. At 30-60 DAS and at 60-90 DAS,
higher CGR (9.8 and 18.9) was observed with
15th
October date of sowing at 15 × 10 cm
spacing and was at par with same spacing at
1st November date of sowing and during 30-
60 DAS, it was also at par with 1st November
date of sowing at 60 × 10 cm spacing.
Interaction effect of date of sowing and varied
crop geometry on number of panicles plant-1
,
number of spikelets panicle-1
and stalk yield
was found as non significant ( Table 3a).
Among the treatment combinations, panicle
length of 28.4 cm was significantly higher
with 15th
October date of sowing in 45× 10cm
spacing and was at par with same date of
sowing with 60× 10cm spacing. Higher
number of grains panicle-1
was found at 15th
October date of sowing with 45 cm × 10 cm
spacing (18877) followed by same date of
sowing with 60× 10 cm spacing (13452). The
15th
October (725.2 g m-2
) and 1st November
(730.0 g m-2
) dates of sowing with 15× 10 cm
spacing were found at par and recorded
significantly higher panicle weight compared
to other combinations. The October 15th
date
of sowing recorded higher seed yield when
grown under 15×10cm (2392 kg ha-1
)
followed by same date of sowing with
30×10cm (2083kg ha-1
) spacing that was at
par with 1st November date of sowing with
15×10cm spacing (2064 kg ha-1
).
Higher crop growth rate, relative growth rate,
total growing degree days and photothermal
units was obtained on 15th
October date of
sowing. H igher CGR , NAR and RGR was
recorded with narrow (15 × 10 cm) spacing.
Among the yield attributes, number of
panicles plant-1
was higher in 1st
November
and 16th
November dates of sowing. The
panicle length, number of spikelets panicle-1
and number of grains panicle-1
was recorded
higher at 15th
October date of sowing. Among
geometry levels, number of branches plant-1
,
panicle length, number of spikelets panicle-1
were higher under wider spacing 45 × 10 cm
and 60 × 10 cm compared to narrow (15 × 10
cm) spacings. The highest seed and stalk yield
were obtained with 15th
October date of
sowing with narrow (15 × 10 cm) spacing and
was followed by 30 × 10 cm.
References
Bertero, H.D., King, R.W and Hall, A.J.1991.
Photoperiod sensitive development
phases in quinoa (Chenopodium
quinoa willd.). Field crops Research
(60) :231-243.
Bertero,H. 2001. Effect of photoperiod,
Temperature and radiation on the rate of
leaf appearance in quinoa (Chenopodium quinoa willd.) under
field condtions. Annals of Botany
(87):495-502.
Bhargava, A.,Sudhir, S and Deepak Ohri.
2006. Quinoa (Chenopodium quinoa
willd.).An Indian perspective. Industrial
crops and products (23):73-87.
Chaudhari, J.H., Raj, V.C., Srivastava, K. and
Ahir, M.P. 2009. Effect of varying
sowing date and row spacings on yield
attributes and yields of Rabi grain
amaranth ( Amaranthus
hypochondriacaus L. ) under South

Int.J.Curr.Microbiol.App.Sci (2017) 6(7): 1023-1034
1034
Gujarat conditions. Agricultural Science
Digest,29(2):66-68.
FAOSTAT (2013).Quinoa area and
production in the
World.http://www.fao.org
Hakan Geren., Tuncer, K., Gulcan, D.T.,
Siddika, E and Deniz, I. 2014. Effect of
differentsowing dates on the grain yield
and some yield components of Quinoa
(Chenopodium quinoa Willd.) grown
under Mediterranean climatic
conditions. Ege University, Ziraat
Fakultesi. 51(3):297-305
Hirich, A.,Choukr –Allah, R and Jacobsen,
S.E. 2014. Quinoa in Morocco - Effect
of sowing dates on development and
yield. Journal of Agronomy and Crop
Science:1-7
Jacobsen, S.E. 2003. The world potential for
Quinoa (Chenopodium quinoa willd.).
Food Reviews International (19):167-
177.
Major, D.J., Joanson, D.R., Tanner, J.W and
Anderson, I.C.1975. Effect of the day
length and temperature on soyabean
development. Crop Science (15): 174-
179
Parvin, N.,Islam, M.R., Nessa, B., Zahan, A.,
Akhand, MIM. 2013. Effect of sowing
time and plant density on growth and
yield of amaranth. Eco-friendly
Agriculture Journal 6 (10): 215-219.
Rajput, R.P. 1980. Response of Soyabean
crop to climatic and soil environments.
Ph.D. Thesis, IARI,New Delhi,India.
Sajjad, A., Munir, H., Ehsanullah, Anjum,
S.A., Tanveer, M., and Rehman, A.
2014. Growth and development of
quinoa (Chenopodium quinoa willd.) at
different sowing dates. Journal of
Agricultural Research.52 (4):535-546.
Srinivasa Rao, K., Sarikotha panta quinoa,
Sakhi News Paper page:10 on
11.08.2015
How to cite this article:
Ramesh, K., K.B. Suneetha Devi, K.A. Gopinath and Uma Devi, M. 2017. Physiological
Indices, Yield and Yield Attributes of Quinoa (Chenopodium quinoa Willd.) as Influenced by
Dates of Sowing and Varied Crop Geometry. Int.J.Curr.Microbiol.App.Sci. 6(7): 1023-1034.
doi: https://doi.org/10.20546/ijcmas.2017.607.123