Embed Size (px)
Citation preview
Physical Properties of Seawater
Brian K. Arbic
Brian K. Arbic Physical Properties of Seawater

Outline
1. Temperature and salinity distributions
2. Seawater density and stratification
3. Water masses
Reading: Stewart Chapter 6 (Google “Bob Stewart oceanographybook”)
Brian K. Arbic Physical Properties of Seawater

Motivation
• The physical properties of seawater–temperature, salinity,pressure, density, and related quantities such as potential density,heat capacity, sound speed, and others–are of fundamentalimportance to physical oceanography.
1. The potential density stratification (layered structure) ofseawater is controlled by temperature and salinity.
2. Temperature and salinity are two of the most importantvariables that control, and are controlled by, interactionsbetween the ocean and atmosphere at the ocean surface.
3. Sound is one of the most important probes we have formeasuring various quantities in the ocean.
4. Thermal expansion is a major factor in sea level rise.
5. The large heat capacity of seawater is one of the reasons theocean is important for climate.
Brian K. Arbic Physical Properties of Seawater

Pressure in the ocean
• Pressure is measured in decibars (db).
• For every m of seawater the pressure increases by ≈ 1 db
• At sea level, atmospheric pressure is about 10 db. Thus at atypical open-ocean depth of 4000 m, the pressure is equal to 400atmospheres.
• In modern oceanographic instruments, pressure is measured withstrain gauges (pressure transducers).
Brian K. Arbic Physical Properties of Seawater

Demonstration of pressure in the deep ocean
• Type “youtube head shrinkers university of washington” intogoogle
Brian K. Arbic Physical Properties of Seawater

Ocean temperatures
• Temperature “T” is arguably the most important physicaloceanographic variable in the ocean.
1. T often sets the rate of biological and chemical reactions
2. T is the major factor determining latent and sensible heattransfers between the ocean and atmosphere, a critical factorin Earth’s climate
3. T (and velocity) together set the rate of meridional(north-south) heat transport, another critical factor in Earth’sclimate
4. T and Salinity control the potential density and hence thestratification (layering) of seawater; in most regions, T is moreimportant
Brian K. Arbic Physical Properties of Seawater

Some modern methods for measuring ocean temperature
1. CTD’s (Conductivity-Temperature-Depth sensors) are theprimary instrument of choice for large-scale hydrographicsurveys (surveys of temperature and salinity). They measuretemperature with thermistors, which work on the principlethat the electrical resistance of a wire is a function oftemperature. Measurement uncertainty is about 0.001◦C.
2. Ship-based CTD surveys are expensive because they requirethe ship to stop while the wire is spooled out.
3. XBT’s (Expendable bathythermographs) also utilize theresistance of a wire to measure temperature. They can bedropped off of ships without requiring the ship to slow down,and are typically not as carefully calibrated.
4. Recently, CTD’s have been mounted on profiling floats,gliders, and other autonomous vehicles for cheaper operation.
5. Satellites measure blackbody radiation to infer temperaturesat the sea surface.
Brian K. Arbic Physical Properties of Seawater

In-class exercise: Using the web to learn about oceantemperatures
• Type “Conductivity temperature depth WHOI” on google, whichshould lead you to the sitehttp://www.whoi.edu/instruments/viewInstrument.do?id=1003
• Spend a moment reading this page, then click on “Viewslideshow” on the right and note the bottles used to collect watersamples, which are used to calibrate the CTD and measurebiogeochemical tracers.
• Why are ship-based CTD measurements generally more accuratethan autonomous measurements?
Brian K. Arbic Physical Properties of Seawater

In-class exercise continued
• Type “Reynolds sst analysis” on google, which should lead youto the sitehttp://www.nhc.noaa.gov/aboutsst.shtml
• Click on both the Atlantic and Eastern Pacific maps and answerthe following questions:
1. What is the general north-to-south pattern of temperaturechange?
2. What are some typical warm and cold temperatures you seeon the map?
3. Does the temperature change more sharply along the eastcoast of North America, or the west coast?
Brian K. Arbic Physical Properties of Seawater

In-class exercise continued
• Type “WOCE Atlas UCSD” on google which should lead you tohttp://www-pord.ucsd.edu/whp atlas/pacific index.html
• Click on “Section-based plots and information” and find “P16”on the map.
• Set “Line number” to “P16”, and “Type of Information” to“Section Plots”, then click “go”
• Look for “CTD sections” and click on the leftmost plot
Brian K. Arbic Physical Properties of Seawater

In-class exercise continued
• Click on “POT TEMP upper jpg” and “POT TEMP lower jpg”and answer the following questions:
1. What are some typical temperatures in the upper ocean?Deep ocean?
2. Do temperatures change most rapidly in the upper ocean ordeep ocean?
3. Considering the north-to-south pattern of sea surfacetemperature and the vertical profile of ocean temperature, atwhat latitudes do you think water in the deep oceanoriginates?
Brian K. Arbic Physical Properties of Seawater

Recap: In-class exercise
• Sea surface temperature is generally warm in low latitudes, coldin high latitudes, and changes rapidly across western boundarycurrents such as the Gulf Stream.
• Temperatures change most rapidly in the “thermocline” which istypically in the upper 500-1000 meters of the water column.
• Below about 1000 m, the water temperatures change slowly andare near freezing, even near the equator, meaning that deep waterssource from high-latitude regions.
Brian K. Arbic Physical Properties of Seawater

Potential temperature and compressibility
• Potential temperature (usually denoted by θ) is the temperaturea fluid parcel would have if it were brought adiabatically to aspecified reference pressure; generally the sea surface unlessotherwise specified.
• An increase in pressure means that work is done compressing thewater; this shows up as an increase in internal energy (hencetemperature) of the water.
• For a decrease in pressure the water expands, does work on itssurroundings, and hence experiences a decrease in temperature.
Brian K. Arbic Physical Properties of Seawater
Salinity
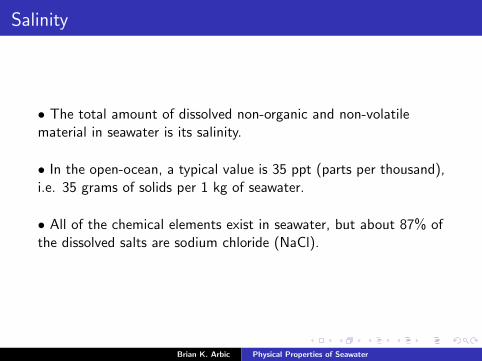
• The total amount of dissolved non-organic and non-volatilematerial in seawater is its salinity.
• In the open-ocean, a typical value is 35 ppt (parts per thousand),i.e. 35 grams of solids per 1 kg of seawater.
• All of the chemical elements exist in seawater, but about 87% ofthe dissolved salts are sodium chloride (NaCl).
Brian K. Arbic Physical Properties of Seawater

Salinity
• Today the standard method for determining salinity is based onthe electrical conductivity of seawater, which is a function of thedissolved solids in the water. Present units of salinity are psu(Practical Salinity Units), and again a typical value in the openocean is 35 psu. Measurement uncertainty is about 0.002 psu.
• The definition of salinity is quite subtle and still a matter ofresearch. The quantity which can be conveniently and accuratelymeasured–electrical conductivity–is related to, but not exactlyequivalent to, the amount of dissolved material.
Brian K. Arbic Physical Properties of Seawater
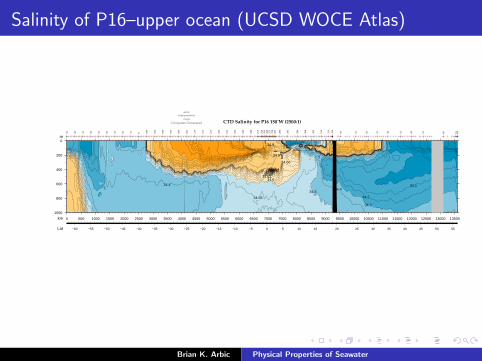
Salinity of P16–upper ocean (UCSD WOCE Atlas)
0
200
400
600
800
1000
0 500 1000 1500 2000 2500 3000 3500 4000 4500 5000 5500 6000 6500 7000 7500 8000 8500 9000 9500 10000 10500 11000 11500 12000 12500 13000 13500
34
34.1
34.2
34.3
34.434.4
34.5
34.55
34.634.6234.6434.66
34.66
34.6834.6934.734.7134.7234.73
34.8
34.9
−60 −55 −50 −45 −40 −35 −30 −25 −20 −15 −10 −5 0 5 10 15 20 25 30 35 40 45 50 55
CTD Salinity for P16 150˚W (2500:1)
km
Lat
m
53 48 43 38 33 28 23 18 13 8 180
185
190
195
200
205
210
215
221
226
231
236
241
246
251
258
263
268
273
278
283
288
293
299
304
309
314
319
324
18 23 28 33 38 43 48 53 66 61 64
Computer Generated
Brian K. Arbic Physical Properties of Seawater
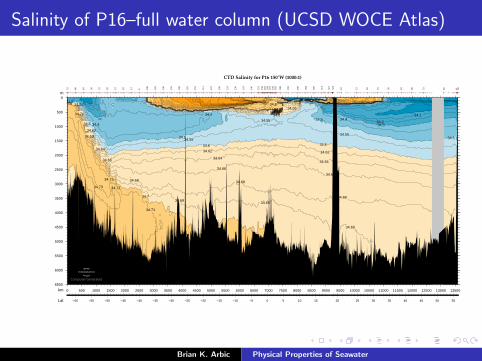
Salinity of P16–full water column (UCSD WOCE Atlas)
0
500
1000
1500
2000
2500
3000
3500
4000
4500
5000
5500
6000
6500
0 500 1000 1500 2000 2500 3000 3500 4000 4500 5000 5500 6000 6500 7000 7500 8000 8500 9000 9500 10000 10500 11000 11500 12000 12500 13000 13500
34
34.1
34.234.3
34.4
34.434.4
34.5
34.5
34.5
34.5
34.55
34.55
34.55
34.55
34.6
34.634.6
34.6
34.62
34.6234.62
34.62
34.64
34.6434.64
34.64
34.66
34.66
34.66
34.66
34.6634.68
34.68
34.6834.68
34.69
34.69
34.6934.69
34.69
34.7
34.7
34.7
34.7
34.7
34.71
34.71
34.7134.72
34.72
34.73
34.73
34.73
34.8
−60 −55 −50 −45 −40 −35 −30 −25 −20 −15 −10 −5 0 5 10 15 20 25 30 35 40 45 50 55
CTD Salinity for P16 150˚W (1000:1)
km
Lat
m
53 48 43 38 33 28 23 18 13 8 180
185
190
195
200
205
210
215
221
226
231
236
241
246
251
258
263
268
273
278
283
288
293
299
304
309
314
319
324
18 23 28 33 38 43 48 53 66 61 64
Computer Generated
Brian K. Arbic Physical Properties of Seawater

Salinity variations
• Salinity varies over about 34 to 35 psu over most of the oceanvolume.
• The largest salinity values are found in the surface of thesubtropics, where evaporation rates are high.
• The tropics are slightly fresher due to greater rainfall.
• Surface salinities are generally lowest in high latitudes.
• Like temperature, salinity varies in the vertical, especially in theupper ocean; the region of large variations in the upper 500 or someters is called the “halocline”.
Brian K. Arbic Physical Properties of Seawater

Water masses
• Potential temperature and salinity are well-correlated over muchof the world ocean.
• Potential temperature and salinity can be used to identifydistinctive water masses which originate in well-known locations.In the Atlantic Ocean, below about 500-1000 m the waters consistof four main water masses:
1. Mediterranean Water (warm and salty)
2. Antarctic Intermediate Water (AAIW–cold and fresh)
3. Antarctic Bottom Water (AABW–very cold and dense, thedensest water mass in the world ocean)
4. North Atlantic Deep Water (NADW–denser than AAIW, lessdense than AABW), which sources from three locations
4.1 Labrador Sea4.2 Denmark Strait4.3 Greenland Sea
Brian K. Arbic Physical Properties of Seawater

Water mass identification in horizontal plot of salinity
• Salinity at 1000 m, taken from WOCE Atlantic Atlashttp://www.bsh.de/aktdat/mk/AIMS/atlas/maps.html
Salinity at 1000 m Depth
10.00 33.00 34.05 34.35 34.65 34.95 35.25 35.55 43.00
80˚S 80˚S
60˚S 60˚S
40˚S 40˚S
20˚S 20˚S
0˚ 0˚
20˚N 20˚N
40˚N 40˚N
60˚N 60˚N
80˚N 80˚N
30oW10oE70oW
30oW10oE70oW
Brian K. Arbic Physical Properties of Seawater

Water mass identification in vertical plot of salinity takenfrom http://sam.ucsd.edu/vertical sections/Atlantic.html#a16a23
0
500
1000
1500
2000
2500
3000
3500
4000
4500
5000
5500
6000
0 1000 2000 3000 4000 5000 6000 7000 8000 9000 10000 11000 12000 13000 14000 15000
34.2
34.3
34.3
34.4
34.4
34.434.5
34.5
34.5
34.5
34.6
34.6
34.6
34.6
34.62
34.62
34.62
34.6234.64
34.64
34.64
34.64
34.64
34.66
34.66
34.66
34.66
34.66
34.66
34.66
34.66
34.66
34.66
34.66
34.68
34.68
34.68
34.68
34.68
34.68
34.68
34.6834.68
34.6834.68
34.7
34.7
34.7
34.7
34.7
34.7
34.7
34.7
34.7
34.7
34.7 34.7
34.72
34.72
34.72
34.72
34.72
34.72
34.72
34.74
34.74
34.74
34.74
34.74
34.74
34.74
34.76
34.76
34.7634.76
34.76
34.76
34.76
34.78
34.78
34.78
34.78
34.78
34.78
34.78
34.8
34.8
34.8
34.8
34.8
34.8
34.82
34.82
34.82
34.82
34.82
34.84
34.84
34.84
34.84
34.84
34.86
34.86
34.86
34.86
34.86
34.88
34.88
34.88
34.88
34.88
34.88
34.88
34.9
34.9
34.9
34.934.9
34.9
34.9
34.9
34.9
34.91
34.91
34.91
34.91
34.91
34.91
34.91
34.91
34.91
34.91
34.91
34.91
34.91
34.92
34.92
34.92
34.92
34.92 34.92
34.92
34.92
34.92
34.93
34.93
34.93
34.93
34.93
34.9334.93 34.93
34.93
34.94
34.94
34.94
34.94
34.94
34.94
34.94
34.9434.94
34.95
34.95
34.95
34.95
34.95
34.95
34.95
34.95
34.95
34.95
34.96
34.96
34.96
34.96
34.96
34.96
34.96
34.96
34.98
34.98
34.98
34.98
34.98
35
35
35
35
35
35.02
35.02
35.02
35.02
35.02
35.04
35.04
35.04
35.04
35.04
35.06
35.06
35.06
35.06
35.06
35.08
35.08
35.08
35.08
35.08
35.1
35.1
35.1
35.135.1
35.2
35.2
35.2
35.2
35.235.3
35.3
35.3
35.3
35.4
35.4
35.4
35.5
35.5
35.5
35.535.55
35.55
35.55
35.55
35.55
35.6
35.6
35.6
35.65
35.65
35.65
35.7
35.7
35.7
35.835.8
35.8
35.8
35.9 35.9
35.9
36
36
36.1
CTD salinity for A23_A16 25W
km
Lat
3 14 24 34 44 54 274
264
254
244
316
326
336
346
356
366
112
102
92 82 72 62 52 42 32 22 12 2-70 -60 -50 -40 -30 -20 -10 0 10 20 30 40 50 60
Brian K. Arbic Physical Properties of Seawater

Need for an accurate equation of state
• We have seen that the differences in both temperature andsalinity are quite small in the deep ocean.
• Since oceanic subsurface flow is along potential density surfaces(isopycnals), it’s very important to have an accurate equation ofstate, along with accurate measurements of temperature, salinity,and pressure, to define these surfaces.
• We turn to the equation of state as our next topic.
Brian K. Arbic Physical Properties of Seawater

Equation of state for seawater
• The equation of state for seawater is of the form ρ = ρ(S ,T , p),where ρ is density (in-situ density), S is salinity, T is temperature,and p is pressure.
• Seawater is extremely complicated. There is nothing like an idealgas law for seawater. Instead the equation of state for seawater isdetermined empirically.
• The form of this function is known from careful laboratory work.It is represented by a huge polynomial which fits the data (forexample, UNESCO equation of state EOS-80). Note UNESCOstands for United Nations Educational, Scientific, and CulturalOrganization.
Brian K. Arbic Physical Properties of Seawater
Equation of state for seawater
• A long list of thermodynamic properties can be computed fromthe equation of state–density, potential density, sound speed, heatcapacity, potential temperature, etc. For instance sound speed c isgiven by c2 = ∂p
∂ρ
Brian K. Arbic Physical Properties of Seawater

Nick Fofonoff, 1929-2003, the ”father” of the modernequation of state
Brian K. Arbic Physical Properties of Seawater

New equation of state
• The equation of state is still a matter of research–in fact it wasjust revised in 2010. TEOS-10 is the new standard, supplantingEOS-80.
Brian K. Arbic Physical Properties of Seawater

Trevor McDougall, the chair of the working group whichestablished TEOS-10
Brian K. Arbic Physical Properties of Seawater

Frank Millero, the only member of both the EOS-80 andTEOS-10 working groups
Brian K. Arbic Physical Properties of Seawater

Potential density
• Potential density, like potential temperature, is a quantity that isreferenced to a particular pressure, so that compressibility effectscan be dramatically reduced.
• For instance, σ2000 = σ(S ,T , p, 2000) is the potential density at2000 db, i.e. the density a water parcel would have if broughtadiabatically to 2000 db.
• Similarly, σ4000 = σ(S ,T , p, 4000) and σ0 = σ(S ,T , p, 0)
Brian K. Arbic Physical Properties of Seawater