Embed Size (px)
Citation preview

6Physical Capital: The Role of Infrastructure in Green Growth
Strategies
Getting infrastructure “right” is at the heart of green growth. It is critical because infrastructure choices have
long-lived and diffi cult-to-reverse impacts on the carbon, land, and water intensity of future patterns of development. Infra-structure also offers substantial co-benefi ts: many investments needed for growth and improved living conditions are also good for the environment.
The challenges and opportunities of greening infrastructure in developing coun-tries must be understood in the context of the huge unsatisfi ed needs that remain: the
fact that much remains to be built creates an opportunity to build right; the fact that needs are so large implies important trade-offs between “building right” and “build-ing more.” While the additional costs of building green are relatively modest, they occur in a context of frequently binding fi nancing and fi scal constraints. Compli-cating matters is the dramatic rise in popu-lation and growing urbanization. As such, a framework for green infrastructure needs to offer strategies to minimize the potential for regrets and maximize short-term local benefits; and it must build on efforts to
133
Key Messages
Infrastructure policies are central to green • growth strategies, because of the huge poten-tial for regret (given the massive infrastruc-ture investments required and the inertia they create) and substantial potential for co-benefi ts (given the current gap in infra-structure service provision).The infrastructure gap offers opportunities to • “build right” and leapfrog; but huge unmet needs also can imply diffi cult trade-offs between
“building right” and “building more,” particu-larly given fi nancing and fi scal constraints.A framework for green infrastructure must • build on efforts to address overall con-straints on infrastructure finance (includ-ing cost recovery issues) and must develop strategies to both minimize the potential for regrets and maximize short-term co-benefi ts to address social and political acceptability constraints.
GG_133-152.indd 133GG_133-152.indd 133 5/8/12 1:01:13 PM5/8/12 1:01:13 PM

1 3 4 I N C L U S I V E G R E E N G R O W T H : T H E P A T H W A Y T O S U S T A I N A B L E D E V E L O P M E N T
address overall constraints on infrastruc-ture fi nance.
This chapter focuses on long-lived infra-structure systems such as energy, water, sani-tation and transport infrastructure, although it recognizes other infrastructure—for exam-ple, buildings—also play a key role in driving the demand for infrastructure services (irri-gation is covered in chapter 5).
Infrastructure as the heart of green growthInfrastructure policies are central to green growth strategies because of their unique characteristics, namely the large poten-tial for regret (linked with the large inertia embodied in infrastructure investments) and the substantial potential for co-benefi ts (linked to the current gap in infrastructure service provision).
A massive potential for regret
Infrastructure decisions are long-lived (table 6.1). They influence the purchase of con-sumer durables and the location choices of households and fi rms. As such, they create substantial inertia in socioeconomic sys-tems. Because the economic system reorgan-izes itself around infrastructure, this inertia can even exceed the physical lifetime of spe-cifi c infrastructure investments. A delay in greening investments may therefore prove
extremely costly if it results in a lock-in into technologies that turn out to no longer be appropriate (because of their excessive car-bon, land, or water intensity) or settlement patterns that prove vulnerable to chang-ing climatic conditions. The infrastructure already in place now will raise global tem-peratures by 1.3°C–1.7°C unless it is retro-fi tted or retired before the end of its useful life (Davis and others 2010; Guivarch and Hallegatte 2011).
Inertia is particularly evident in urban policies and the transport-related decisions that shape cities. The consequences of these decisions are illustrated by the contrast between Atlanta and Barcelona, two cit-ies with roughly the same population and income but dramatically different densities and, hence, dramatically different options in terms of urban transportation and hous-ing (fi gure 6.1). Once a city is developed, it is diffi cult to change its form. This irrevers-ibility makes the idea of “growing dirty and cleaning up later” inapplicable in this domain (box 6.1).
The consequence of the inertia in infra-structure development is an enormous potential for regret if decisions are made without adequate consideration of how conditions—socioeconomic, environmental, and technological—will change over time. The potential for regret has always been a challenge for infrastructure policy; it is made much more complex by climate change, which introduces deep uncertainty about future climatic conditions, technologies, and environmental standards and prices.
Uncertainty about future climatic con-ditions. This complicates decision making, given the importance of weather and cli-mate conditions for infrastructure design and performance (Hallegatte 2009). In the energy sector, weather directly affects demand (which varies with temperature) and supply. Water availability affects elec-tricity production from hydropower and thermal plants (because of cooling needs), and wind and nebulosity determine wind and solar power. Electricity networks are also highly vulnerable to extreme events
TABLE 6.1 Sectors in which inertia and sensitivity to climate conditions are great
Sector ExampleTime scale
(years)
Water Dams, reservoirs 30–200Land-use planning New development in fl ood plain
or coastal areas>100
Coastal and fl ood defenses Dikes, sea walls >50Building and housing Insulation, windows 30–150Transportation Port infrastructure, bridge, roads,
railways30–200
Urbanism Urban density, parks >100Energy production Coal-fi re plants 20–70
Source: Hallegatte 2009.
GG_133-152.indd 134GG_133-152.indd 134 5/8/12 1:01:14 PM5/8/12 1:01:14 PM

P H Y S I C A L C A P I T A L 1 3 5
FIGURE 6.1 Urban densities determine cities’ options for greening(built-up areas of Atlanta and Barcelona, represented at the same scale)
Source: Bertaud 2003.
(such as strong winds and snowstorms, as illustrated by the January 2008 snowstorm that left millions of people stranded across China or the repeated power outages caused by heavy snow in the United States). Trans-port infrastructure, which affects urban development and land use, including in flood-prone areas, must also account for long-term climate changes.
Uncertainty about how technologies evolve. This has a particularly important effect on cities. With current technologies, low-density single-home suburban develop-ments lead to high carbon emissions. But they may become sustainable in terms of emissions (albeit maybe not in terms of water and land consumption) with effi cient electric vehicles, decarbonized electricity production and low-energy-consumption houses (box 6.2). Uncer-tainty about the evolution of energy technol-ogy costs complicates the design of energy policy (Kalkuhl and others 2011). Anecdotal evidence suggests that uncertainty is also leading investors to postpone investments for
fear of being stuck with an older and uncom-petitive technology.
Uncertainty about environmental poli-cies and prices for energy, oil, or carbon. Energy-intensive development may create deep vulnerabilities and loss of competitive-ness in a future with high carbon or energy prices (Rozenberg and others 2010; World Bank 2010). Dense cities are less vulnerable to shocks in energy—hence transportation—prices (Gusdorf and Hallegatte 2007).
The combination of sensitivity to uncer-tain parameters and the high level of inertia creates a high risk of lock-ins into situations that will be undesirable in the future. Avoid-ing these lock-ins—and the corresponding regret or retrofi tting costs—should be a pri-ority for decision making on infrastructure (see chapter 7).
The vast potential for co-benefi ts
The second reason why infrastructure will play a key role in green growth strategy is that
GG_133-152.indd 135GG_133-152.indd 135 5/8/12 1:01:14 PM5/8/12 1:01:14 PM

1 3 6 I N C L U S I V E G R E E N G R O W T H : T H E P A T H W A Y T O S U S T A I N A B L E D E V E L O P M E N T
BOX 6.1 The case for immediate action in the transport sector
Transport is a major contributor to CO2 emis-sions. It is also one of the fastest-growing sources of emissions. Not surprisingly given the 1 billion cars already on the road, road transport accounts for about two-thirds of total transport emissions.
Developing countries, which still face a huge transport infrastructure gap, have the opportunity to choose their transport development path: low-emission transport or car-dependent transport (box figure B6.1.1). Experience suggests that demand for car ownership increases dramatically at annual household incomes of $6,000–$8,000. If history repeats itself, an additional 2.3 billion cars will be added by 2050, mostly in developing countries,
given expected economic growth and past patterns of motorization (Chamon and others 2008). With-out policies to encourage high-density urbanization and public transport, high reliance on individual car transport will ensue.
If public transport is included as a major part of modal structure in urban transport, there is no conflict between a low emission transport sector and rapid growth or high income. In fact, economies with some of the lowest ratios of energy consump-tion to gross domestic product (GDP) in the world—including Japan, Singapore, and Hong Kong SAR, China—have experienced extraordinary develop-ment over the past few decades.
FIGURE B6.1.1 As income rises, will countries choose low energy consumption in road transport?(relationship between per capita income and energy consumption from the road sector)
Canada
Cuba
Hong Kong SAR, China
Iceland
Iran, IslamicRep.
IsraelJapan
Korea,Rep.
Norway
Qatar
Saudi Arabia
Singapore
Switzerland
United Arab Emirates
United States
0
0.2
0.4
0.6
0.8
1.0
1.2
1.4
1.6
1.8
2.0
2.2
0 5,000 10,000 15,000 20,000 25,000 30,000 35,000 40,000 45,000
GDP per capita ($2000)
kilo
ton
of o
il eq
uiva
lent
Source: World Bank 2011d.
GG_133-152.indd 136GG_133-152.indd 136 5/8/12 1:01:15 PM5/8/12 1:01:15 PM

P H Y S I C A L C A P I T A L 1 3 7
BOX 6.2 The impact of technologies on transport policies—not enough?
Given the signifi cance of emissions from road trans-port, the green growth path of transport depends on how rapidly vehicle technologies develop. If low- or zero-emission vehicles become available in the near future, relatively small changes in existing transport infrastructure stock would be required. People could continue relying on individual cars without harming the climate. But this may not be realistic.
Technical standards in transport can also help reduce emissions in the sector. Emissions per kilo-meter of new cars have historically been reduced through better gasoline and diesel internal combus-tion engines, better lighting and air conditioning, and better tires. The aviation fl eet has also reduced emissions in accord with international efficiency agreements. There is also an opportunity to reduce emissions levels through Intelligent Transport Systems—for instance, by allowing drivers to access timely traffic reports, identify available parking spots, and optimize routing.
But technical standards are unlikely to lead to massive reductions in emissions, so barring the rapid emergence and global adoption of low-carbon engine technologies, modal shifts will be needed. An
average bus emits only half as much CO2 equivalent per passenger kilometer as a small car. For travel between distant cities, railways are even more eco-friendly than buses: emissions from light-rail transit can be as much as half of average bus emissions. But the effi ciency and feasibility of modal shifts depend on urban forms, with mass transit requiring mini-mum levels of density, and on tackling market struc-ture and coordination failures.
Modal shifts will also imply addressing con-sumer preferences, and here the “nudging” and social marketing campaigns discussed in chapter 2 are an important complement to price incentives and supply-side interventions. In a world in which major automobile companies spent some $21 billion worldwide on advertising in 2009—an increasing percentage of which is aimed at emerging markets—public transport agencies across Africa, Europe, and North and South America are beginning to apply to public transportation the same marketing approaches used by the auto industry to bolster sales to shift demand for public transportation (Weber and others 2011).
infrastructure is a domain in which substantial synergies exist between economic growth and the environment. Infrastructure systems are indeed designed to provide welfare- improving and productivity-enhancing services, which are critical for development, but they also often provide environmental benefi ts.
Providing service to the unserved—who usually pay a higher price for water and energy than connected households— provides both social and environmental ben-efi ts (box 6.3). Universal access to water and sanitation is good not only for welfare and economic growth—with impacts on health and human capital, especially for the poor—but also for the environment. (For instance, providing sanitation services to the slums surrounding the Guarapiranga Lake helped slum dwellers but also preserved the water source of 25 percent of São Paulo’s 18 million inhabitants in the early 1990s.) This is also
true for energy. When reliable network elec-tricity is available, pollution is reduced and competitiveness increases, as fi rms no longer need to rely on expensive back-up diesel gen-erators. Photovoltaic (PV) solar systems are optimal solutions for isolated, low-density areas; hydroelectricity is the cheapest and most reliable energy source for some coun-tries (box 6.4). Better public urban transport reduces congestion and air pollution, with large economic and health impacts.1
An additional source of co-benefits is linked to distributional effects. Infrastructure consumption subsidies are both regressive and bad for the environment (Komives and oth-ers 2005). Subsidies not only distort demand, with financial and environmental conse-quences, they also often fail to reach the very poor they are supposed to help (see chapter 2). The poor do not own cars and often are not served by utilities; if they do, they consume
GG_133-152.indd 137GG_133-152.indd 137 5/8/12 1:01:15 PM5/8/12 1:01:15 PM

1 3 8 I N C L U S I V E G R E E N G R O W T H : T H E P A T H W A Y T O S U S T A I N A B L E D E V E L O P M E N T
BOX 6.3 Benefi ts from using photovoltaic electricity in rural areas
Power grids in Africa are available only in cities and high-density areas. In most rural areas, kerosene and candles are the main source of lighting, while dry cell batteries are used to power radios. All are expensive (1 liter of kerosene can cost more than $0.80 and provides about 20 hours of light). PV systems are superior solutions. For example, a solar home system may be sized to power a refrigerator and television (costing $1,000); a large television and three lamps (for $250); a small television, three lamps, and a radio (for $100); or a lamp, radio, and cell phone charger (for as low as $50—about the same cost as a cell phone).
Africa offers a huge market for modern, energy-efficient lighting products. Although the market has a low profi t margin, its strength is in the high number of clients (if the right product for the right price can be offered). The GTZ-sponsored pico-PV program and the World Bank Group’s Lighting Africa are examples of two initiatives that aim to transform the lighting market from fuel-based prod-ucts to clean, safe, and efficient modern lighting appliances.
Source: ESMAP 2009.
BOX 6.4 Hydropower as a green choice for lower-income countries
For lower-income countries, sustainable hydropower represents an important clean energy source—and one that will assume a larger share of the world’s energy production as these countries develop fur-ther. Africa is exploiting only 7 percent of its hydro-power potential; if the region developed it to the same extent that Canada has, its electricity supply would be multiplied by a factor of 8.
The reality, however, is that hydropower projects are complex—with impacts on agriculture, water management, irrigation, food production, climate change, and the sustainability of communities. They require detailed planning and studies before a shovel breaks the ground. Social and environmental impacts have to be assessed and addressed, consultations must be held, and regulations need to be developed. In some cases, new institutions have to be created
and made viable. None of this is easy or cheap, but it is essential, because well-managed hydro projects can generate an array of benefi ts, including fl ood control, drought management, provision of water supply, and environmental benefi ts.
Storage facilities for hydropower are essential to adapt to changes in the hydrological cycle that are expected to occur as a result of climate change. With increasing water scarcity in some regions, there is a need to develop multiyear storage that is economi-cally, environmentally, and socially feasible. Where the intensity and frequency of floods increases, storage is required to manage fl ows. Multipurpose storage facilities can also provide water services to agriculture, water supply, and environmental fl ows.
Box text contributed by Diego Rodriguez.
small quantities of water and electricity or transport fuel. The lion’s share of consump-tion subsidies benefi ts wealthier segments of the population (Arze del Granado and others 2010). The urban poor may enjoy some spill-overs, but the rural poor seldom do.
There are also trade-offs between infra-structure development and the environment. A fi rst trade-off is related to infrastructure’s
direct environmental footprint. Building the infrastructure that is needed for develop-ment will have detrimental impacts on natu-ral areas, biodiversity, and the environment (Geneletti 2003). Another trade-off is linked to the fact that building better (cleaner, more resilient, or both) can be more expensive. This trade-off raises the fear that countries faced with severe fi nancing constraints may need
GG_133-152.indd 138GG_133-152.indd 138 5/8/12 1:01:16 PM5/8/12 1:01:16 PM
P H Y S I C A L C A P I T A L 1 3 9
to chose between “building right” (which may make both economic and environmental sense) and “building more” (which may be what is required socially).
But the additional cost of building greener infrastructure should not be overstated. In some sectors, green infrastructure is more expensive—where electricity grids are present, solar or wind energy is more expensive than electricity produced from coal, for example. But thanks to innovation and economies of scale, the difference in cost is narrowing rap-idly, and green energies are now competitive in some contexts (where the hydropower endow-ment is large, where electricity is produced off-grid, or where carbon is priced). In the transport sector, providing public transport is more expensive than building roads, but pub-lic and individual transports are imperfect substitutes: in highly congested cities, public transportation becomes necessary for eco-nomic reasons, and the environmental ben-efi ts can be reaped with no or little additional cost. In the construction sector, the additional cost to build lower-energy buildings—thanks to better insulation and more effi cient heating systems—may not exceed 5 percent, and this additional investment cost is rapidly recouped by reduced energy bills.
One case in which additional costs may create trade-offs is the retrofi t of existing build-ings. Indeed, retrofi tting the lowest-effi ciency buildings into average-efficiency build-ings costs €500 per square meter in France (Giraudet and others 2011). However, energy savings can pay back upfront costs in many instances. The main constraint is thus one of access to capital rather than fi nancial or eco-nomic viability, as many green investments pay for themselves over the medium to long term.
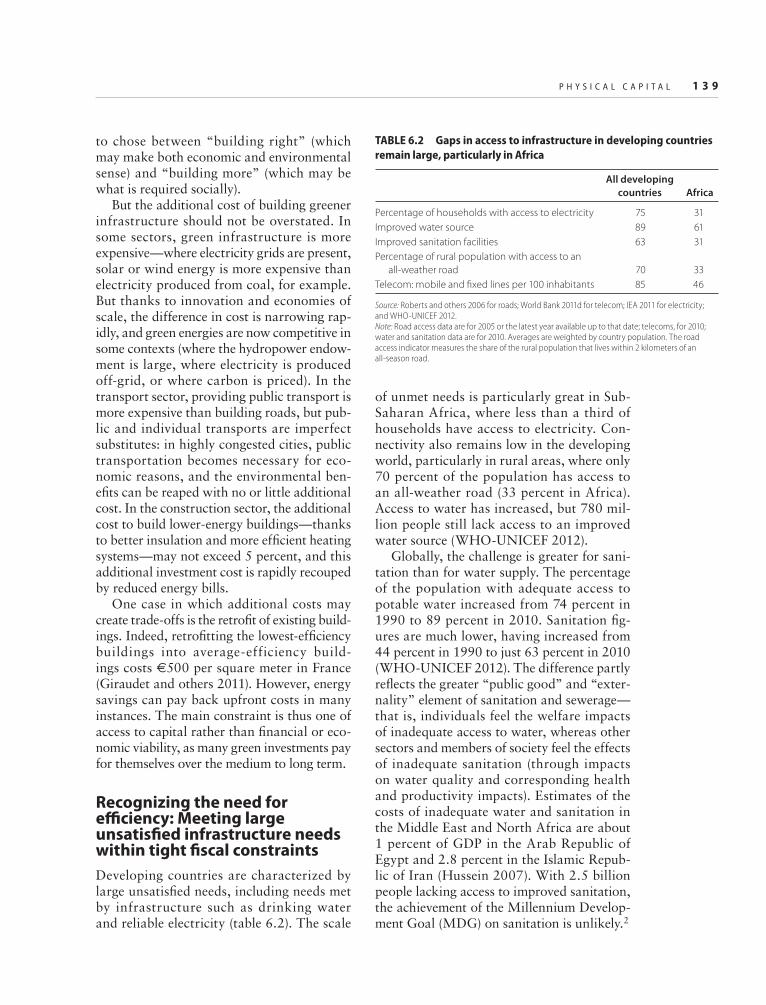
Recognizing the need for effi ciency: Meeting large unsatisfi ed infrastructure needs within tight fi scal constraintsDeveloping countries are characterized by large unsatisfi ed needs, including needs met by infrastructure such as drinking water and reliable electricity (table 6.2). The scale
of unmet needs is particularly great in Sub-Saharan Africa, where less than a third of households have access to electricity. Con-nectivity also remains low in the developing world, particularly in rural areas, where only 70 percent of the population has access to an all-weather road (33 percent in Africa). Access to water has increased, but 780 mil-lion people still lack access to an improved water source (WHO-UNICEF 2012).
Globally, the challenge is greater for sani-tation than for water supply. The percentage of the population with adequate access to potable water increased from 74 percent in 1990 to 89 percent in 2010. Sanitation fi g-ures are much lower, having increased from 44 percent in 1990 to just 63 percent in 2010 (WHO-UNICEF 2012). The difference partly refl ects the greater “public good” and “exter-nality” element of sanitation and sewerage—that is, individuals feel the welfare impacts of inadequate access to water, whereas other sectors and members of society feel the effects of inadequate sanitation (through impacts on water quality and corresponding health and productivity impacts). Estimates of the costs of inadequate water and sanitation in the Middle East and North Africa are about 1 percent of GDP in the Arab Republic of Egypt and 2.8 percent in the Islamic Repub-lic of Iran (Hussein 2007). With 2.5 billion people lacking access to improved sanitation, the achievement of the Millennium Develop-ment Goal (MDG) on sanitation is unlikely.2
TABLE 6.2 Gaps in access to infrastructure in developing countries remain large, particularly in Africa
All developing countries Africa
Percentage of households with access to electricity 75 31Improved water source 89 61Improved sanitation facilities 63 31Percentage of rural population with access to an
all-weather road 70 33Telecom: mobile and fi xed lines per 100 inhabitants 85 46
Source: Roberts and others 2006 for roads; World Bank 2011d for telecom; IEA 2011 for electricity; and WHO-UNICEF 2012.Note: Road access data are for 2005 or the latest year available up to that date; telecoms, for 2010; water and sanitation data are for 2010. Averages are weighted by country population. The road access indicator measures the share of the rural population that lives within 2 kilometers of an all-season road.
GG_133-152.indd 139GG_133-152.indd 139 5/8/12 1:01:16 PM5/8/12 1:01:16 PM

1 4 0 I N C L U S I V E G R E E N G R O W T H : T H E P A T H W A Y T O S U S T A I N A B L E D E V E L O P M E N T
Filling the infrastructure gaps in develop-ing countries—to address household needs and expanding infrastructure so that fi rms have access to the kind of energy and trans-port services they need to compete—will cost an estimated $1.0–$1.5 trillion a year, or 7 percent of developing-country GDP (Fay and others 2010).3 Developing countries are currently investing about half that amount, although the amount varies dramatically by region and income level. In Africa, infrastruc-ture needs were projected to reach 15 percent of the region’s GDP in 2008, about twice
the level actually spent (Foster and Brice-ño-Garmendia 2010). Moreover, given the constraints on poor households’ budgets, increases in infrastructure services need to be provided in a way that is affordable.
In the energy sector, the challenge is to provide all people with modern energy to meet their basic needs at affordable costs while ensuring the sustainable growth path of energy consumption (through conserva-tion and greater energy effi ciency) and mak-ing energy sources more environmentally sustainable (box 6.5). Thus, the goals of the
BOX 6.5 The energy challenge: Expanding access and increasing supply in an effi cient, clean, and cost-eff ective manner
How will countries meet the goal of the United Nations Sustainable Energy for All initiative of pro-viding universal energy access at affordable costs while ensuring environmental sustainability through improved effi ciency and an increased role for renew-ables? The answer is through a portfolio of technol-ogies (World Bank 2010).
To achieve universal access to electricity by 2030, countries need to develop not only grid systems but also off- and mini-grid power systems, at least as a transition solution. The International Energy Agency estimates that about 45 percent of electric-ity will come from national grids, 36 percent from mini-grid solutions, and the remaining 20 percent from isolated off-grid solutions serving remote and low-density areas. Off- and mini-grid technologies can be complemented by other solutions at the end-user level. For instance, the Lighting Africa initiative lowers entry barriers to the off-grid lighting mar-ket by establishing quality standards, developing a good investment climate, and supporting product development while educating consumers on the ben-efi ts of solar lighting products. In 2010, more than 134,000 solar portable lamps that had passed Light-ing Africa quality tests were sold in Africa, provid-ing more than 672,000 people with cleaner, safer, better lighting and improved energy access.
Energy-effi ciency policies could potentially con-tribute a quarter to a third of averted greenhouse gas emissions by 2050 (World Bank 2010). Technologies that increase energy effi ciency are typically not costly or innovative: existing technologies alone could
reduce energy consumption 30–40 percent across many sectors and countries. For instance, 70 percent of lighting (which consumes 20 percent of total global electricity consumption) can save 50 percent of energy use just by using current technologies alone. A prob-lem is that the transaction costs for energy- effi ciency projects tend to be high, compared with their rela-tively small amount of investment. Relatively long pay-back periods may still be a considerable barrier to fi nancing these projects (World Bank forthcoming).
Among renewable sources of energy, large-scale hydropower tends to be the least expensive. It can be competitive with conventional thermal genera-tion. Geothermal energy can also be cost competitive, making it another suitable candidate. Both types of energy involve large upfront costs and long lead-times for development, however. At the opposite end of the spectrum, solar energy is more expensive, but it may still be the least-cost option in remote, isolated areas.
One challenge in developing renewables is the temporal variation in the availability of electricity. Demand for electricity varies continuously, with large fluctuations during the day and even larger variation from season to season. Rapid variability of some renewables can add to the challenge of main-taining a balance between supply and demand at all times. A proper mix of generation technologies with varied output control characteristics (for example, hydropower with storage and fast-responding gas units), well-developed transmission systems, and improved forecast and grid operations capacity will help cushion the effects of variability.
GG_133-152.indd 140GG_133-152.indd 140 5/8/12 1:01:16 PM5/8/12 1:01:16 PM

P H Y S I C A L C A P I T A L 1 4 1
United Nations Sustainable Energy for All (UN SE4ALL) initiative are to achieve uni-versal access to modern energy, doubling the global rate of improvement of energy effi ciency, and doubling the global share of renewable energy.
And providing modern energy services to all does not need to be done at the expense of the environment—in fact, the environmental impacts are likely to be modest to positive, even when using brown technologies. This is because the poor consume little even when they are connected to modern infrastructure services, particularly in comparison to the rich. For instance, the additional emissions produced by providing electricity using stan-dard technologies to the 1.3 billion people who currently lack service could be offset by a switch of the U.S. vehicle fl eet to Euro-pean standards (World Bank 2010). Green-ing, infrastructure does not need to come at the expense of universal access—in fact, universal access is likely to be good for the environment.
In the water sector, developing countries will need to invest an estimated $72 billion a year to reach the MDG targets on improved water supply and sanitation, 75 percent of which is needed just to maintain existing facilities (Hutton and Bartram 2008).
Meeting infrastructure needs, protecting the environment
Even with significant synergies between infrastructure service development and environmental consideration, greening growth will increase investment needs in the infrastructure sector. As an illustration, an analysis of mitigation scenarios from four models suggests that the global energy investment needed to achieve a greenhouse gas concentration of 450 ppm CO2-eq (parts per million CO2 equivalent) could amount to $350 billion–$1.1 trillion a year by 2030 (fi gure 6.2). A 550 ppm target appears much easier to achieve, requiring $50–$200 billion of additional annual investments. (These fi g-ures are gross investment costs; they do not take into account the benefi ts from higher
energy efficiency and reduced operating costs.) These additional investment needs are significant, but they remain a small share of total world investments, at least for the 550 ppm target. They do not include the cost of adapting infrastructure to a changed climate, which could cost developing coun-tries an additional $15–$30 billion a year by 2050 (World Bank 2010).
Financing infrastructure: Effi ciency and cost recovery to improve access and sustainability
Investment in infrastructure in the devel-oping world is inadequate partly because infrastructure is expensive and “lumpy”—capacity can be increased only in large incre-ments, not through a continuous process. In addition, when investments require public funding, the fi nancing gap is linked to limits to the borrowing capacity. Even when a proj-ect is economically benefi cial and will gen-erate suffi cient tax revenues to pay back the upfront cost, it is diffi cult to mobilize private fi nance because of information asymmetry, long return on investments, and political risks. Doing so would require shifting the risk- adjusted return upward, by increasing returns or reducing risks, so that proposed projects can compete with other categories of investment.
Another reason for the insufficiency of investment in infrastructure is that economic and fiscal sustainability has long been a major challenge in the infrastructure sector. Full-cost pricing continues to be an elusive goal, and infrastructure often involves signif-icant technical and nontechnical ineffi ciency. Colombia grappled with both issues success-fully (box 6.6). In Africa, quasi-fi scal defi cits caused by underpricing, technical losses, and nonpayment amount to about 2 percent of GDP. Eliminating these problems could offset about a third of the fi nancing gap (Briceño-Garmendia and others 2008). In South Asia, more than 20 percent of electricity produced is lost because of technical and nontechni-cal reasons, including illegal connections (World Bank 2011d); 30–45 percent of water
GG_133-152.indd 141GG_133-152.indd 141 5/8/12 1:01:17 PM5/8/12 1:01:17 PM

1 4 2 I N C L U S I V E G R E E N G R O W T H : T H E P A T H W A Y T O S U S T A I N A B L E D E V E L O P M E N T
FIGURE 6.2 Upfront investment costs for energy supply and greater energy effi ciency could be substantial(additional investment needs in the energy sector projected by four global models and for two climate objectives)
Source: Authors’ compilation based on following sources: MESSAGE: van Vliet and others 2012; REMIND: Luderer and others forthcoming; TIAM-World: Loulou and Labriet 2008; IEA: IEA 2011.Note: The targets 450 ppm and 550 ppm are in CO2-eq (parts per million CO2 equivalent) which measures the concentration of all greenhouse gases using the functionally equivalent amount or concentration of CO2 as the reference; 450 ppm CO2-eq is the concentration is needed to maintain a 50 percent chance of not exceeding global warming of more than 2°C above preindustrial tempera-tures. IEA 2011 does not provide estimates for a 550 ppm scenario.
1,200
1,000
800
600
400
addi
tiona
l ann
ual i
nves
tmen
t in
2030
($bi
llion
)
200
0550 ppm 450 ppm 550 ppm 450 ppm 550 ppm 450 ppm 450 ppm
MESSAGE TIAM-WORLD REMIND IEA
is leaked from the network or not accounted for (IBNET 2011).
What can be done? Addressing these inefficiencies would help improve both infrastructure coverage and the greening of infrastructure. Strengthening cost recovery would not only contribute to the fi nancial sustainability of energy sector develop-ment, it would also encourage consumers to use energy wisely. Effi cient management of metering, billing, and collection would improve the fi nancial performance of service providers. New metering technologies based on information and communications tech-nology are facilitating this activity in many places, including small, off-grid private serv-ice providers and large publicly owned dis-tribution utilities. And more effi cient man-agement of utilities would eliminate waste and reduce environmental impacts.
In addition, incentive mechanisms should be tightened at the utility and end-user levels. The biggest hurdles to doing so are account-ability and enforceability in implementing
tariff setting and collection. The cost of energy imports and power generation can be volatile; it needs to be passed on to con-sumer prices, although smoothing mecha-nisms may be required. Adjusting tariffs will greatly improve the fi nancial sustainability of utilities. But utilities will also have to take measures against illegal connections and nonpayers.
Chapter 2 discusses the difficulties in eliminating subsidies to infrastructure serv-ices. It suggests complementary actions to mitigate undesirable distributive impacts of these measures (such as connection subsidies or targeted cash transfers).
Another measure in the arsenal may be cross-country collaboration. Because infrastructure exhibits significant econo-mies of scale and scope, cross-country collaboration—for instance, through regional power pools—is generally helpful, particu-larly for small countries.
In Africa, where many countries are too small to build national power plants at an efficient scale, $2 billion of energy invest-ment could be saved if trade in power trade was fully exploited (Foster and Briceño-Garmendia 2010). Regional power pools (for example, in West and East Africa) can help capture benefi ts from economies of scale and smooth the intermittency of solar and wind energy. Trade and cross-country coor-dination also help countries manage natural resources (such as shared water resources) and improve reliability.
Hydro-meteorological services also benefi t from cross-country collaboration. An analy-sis of South Eastern Europe estimates that the fi nancing needed to strengthen national hydro-meteorological services in seven coun-tries without regional cooperation and coor-dination would be about €90 million (ISDR and others 2011). With deeper cooperation, the cost would be 30 percent lower.
Managing demand
Improving the delivery of infrastruc-ture services is critical. But in infrastruc-ture, increased supply often translates into
GG_133-152.indd 142GG_133-152.indd 142 5/8/12 1:01:17 PM5/8/12 1:01:17 PM

P H Y S I C A L C A P I T A L 1 4 3
BOX 6.6 Pairing cost recovery with deregulation in Colombia
In 1964, only 50 percent of people in Bogota and other large cities had access to electric-ity, water, and sanitation. And coverage rates were even worse in smaller cities (about 40 percent for water and electricity and 20 percent for sanitation). Today, Colombia has almost universal access to basic services in cities of all sizes. But achieving convergence took more than 40 years (box fi gure B6.6.1).
How did Colombia achieve near uni-versal coverage? The key was a series of policy reforms in the 1990s that brought tariffs toward cost recovery levels. In the water sector, average residential tariffs per cubic meter were increased from $0.33 in 1990 to $0.78 in 2001 (World Bank 2004). With almost 90 percent of households hav-ing metered connections, the price increase triggered a decrease in household water consumption from 34 to 19 cubic meters per month over the same period—in the process reducing the need for major new infrastructure. But even with higher prices, water remains relatively affordable for the average household. The tariff structure allows the Colombian government to cross-subsidize the poorest consumers from richer households and industrial users. As a result, the average poor household spends less than 5 percent of its income on utility services.
In the electricity sector, in the 1990s the rules on who gets to generate and sell elec-tricity were changed. After two major black-out periods (1983 and 1992/93), the govern-ment grappled with increasing capacity or increasing effi ciency. Given severe fi nancial constraints, increasing capacity was not an option. Deregulation was therefore under-taken to improve the effi ciency of existing capacity (Larsen and others 2004). As part of the reforms, electricity was unbundled into generation, transmission, distribu-tion, and commercialization. In the 1990s, the electricity sector represented a third of Colombia’s public debt stock. By 2004, this had fallen to less than 5 percent and Colombia had become a net exporter of electricity.
Box text contributed by Somik Lall.
FIGURE B6.6.1 Access to basic infrastructure services has risen dramatically in Colombia(access to services, by city size, 1964–2005)
0
25
50
75
100
0
25
50
75
100a. Access to electricity
b. Access to water
c. Access to sanitation
perc
ent
perc
ent
Bogota
largest
smalle
st
Bogota
largest
smalle
st
city size
city size
0
25
50
75
100
Bogota
largest
smalle
st
perc
ent
city size
1964 1993 2005
Source: Based on data from the Colombia’s National Administrative Department of Statistics (DANE) census 1964, 1993, and 2005.
GG_133-152.indd 143GG_133-152.indd 143 5/8/12 1:01:17 PM5/8/12 1:01:17 PM
1 4 4 I N C L U S I V E G R E E N G R O W T H : T H E P A T H W A Y T O S U S T A I N A B L E D E V E L O P M E N T
increased demand, making a supply-side-only approach both costly and ineffective. For instance, building new roads is often ineffec-tive in reducing congestion because it incen-tivizes the use of individual vehicles, leav-ing congestion unchanged. For this reason, action is also needed to manage demand. Policy makers can chose from an array of tools that includes price instruments, regula-tion, and integrated planning of supply and demand.
Prices: Important but hampered by low elasticityPrice elasticity—that is, the percentage change in quantity demanded in response to a change in price—is relatively low in the transporta-tion sector, at least in the short term. This is, in part, because consumers may be slow in responding to price signals. But it is also because the real cost of transport (sometimes referred to as the generalized cost) includes both the monetary cost of transport and the cost of the time spent in transportation. And sometimes the cost of time is larger than the monetary cost of transportation. Elasticity is greater in the long run, because individuals can adjust their choice of where to live, means of transportation, or lifestyle. For instance, the price elasticity of automobile fuel demand ranges from –0.1 to –0.4 in the short run and –0.6 to –1.1 in the long run (Chamon and others 2008).
This low elasticity explains why the rebound effect (whereby people may increase their driving when the cost of car use decreases as a result of improved effi ciency) is relatively limited, even though it may be greater at lower income levels. Sorrel (2007) fi nds that this effect should remain below 30 percent (that is, less than 30 percent of the gain in efficiency will be “taken back” by the increase in demand). Greene and others (1999) fi nd that the rebound effect for indi-vidual transport in the United States is about 20 percent.
Various price instruments have proven effi -cient. Singapore’s Area Licensing Scheme—the first-ever comprehensive road pricing scheme in the world—required drivers to
pay an area license fee of S$3 ($1.25) a day to enter the central business district during peak hours. The number of vehicles entering the restricted zone declined by 73 percent, and average speeds increased by an estimated 10–20 percent (Federal Highway Administra-tion 2008). Modal shift can improve the effi -ciency of such price-based transport policies and help mitigate their negative consequences (such as the signifi cant spatial inequality they can create) (see Gusdorf and others 2008). But it requires investments in public transport multimodal coordination (such as creating parking lots next to train stations), and urban planning (to maximize access to public tran-sit and ensure that passenger density is high enough to justify the required investments).
In the water sector, different uses have different elasticities. Residential use has a low price elasticity, estimated at about –0.1 to –0.3 (Nauges and van den Berg 2009; Nieswiadomy and Molina 1989). Agricul-tural use has a higher elasticity, and subsidies (whether to water or to the electricity needed for pumping) in this sector can thus create distorted incentives, favoring activities with high water consumption. And disincentives to water conservation are greatest where the resource is scarcest (Frederick and Schwarz 2000). Removing subsidies and raising prices can thus be effi cient in this sector.
Demand-side actions, standards,and regulations: Critical complements to pricesPrice-based instruments can be made more effi cient if complemented with appropriate demand-management actions. Large quanti-ties of water can be saved in India through better irrigation technologies, obviating the need to exploit new raw water sources. In China, industrial water reuse systems can save water, reducing the need to build expensive water conveyance systems. Many of the technologies that can make a differ-ence already exist and are in use in devel-oped countries. Further application needs to be supported by institutions and promoted by sector leaders. India’s Total Sanitation campaign is a successful example of using
GG_133-152.indd 144GG_133-152.indd 144 5/8/12 1:01:18 PM5/8/12 1:01:18 PM

P H Y S I C A L C A P I T A L 1 4 5
noneconomic incentives to promote greener options (box 6.7).
Standards and regulations may also be useful where price elasticity is limited or the political economy of price reform is complex. Examples of such instruments include renew-able portfolio standards, in which regulators require utilities to include a given percentage or an absolute quantity of renewable energy capacity in their energy mix.
In transport, fuel economy standards are common for new vehicles (see chapter 2). In 1995, Japan introduced fuel economy stan-dards to reduce new car fuel consumption by 19 percent, achieving the target by 2004. A new target, set in 2006, aims for another 23.5 percent reduction (An and others 2007). In Europe, improvements in fuel economy occurred largely as a side effect of air pol-lutant regulations, although automobile manufacturers agreed with the European Commission on a voluntary fleet average emission target of 140 grams of CO2 per kilo-meter for new passenger cars. Governments can also create automobile restricted zones to limit passenger car traffi c in urban areas, as Denmark did in the city of Aalborg.
Promoting clean cooking and heating solutions is another case in which standards and public investments are likely to be more helpful than pricing instruments. Replac-ing traditional three-stone cooking fires with advanced stoves could significantly reduce emissions and health risks (World Bank 2011b). Without drastic interventions, 2.7 billion people may still lack clean cook-ing facilities in 2030 (IEA 2011).
Integrated market development, includ-ing technology standards, is needed to pro-mote the use of clean and effi cient solutions at the household level. The Global Alliance for Clean Cookstoves, launched in September 2010, aims to enable 100 million households to adopt clean and effi cient stoves and fuels by 2020. The alliance works with public, pri-vate, and nonprofi t partners to help overcome the market barriers that impede the produc-tion, deployment, and use of clean cookstoves in the developing world.
Green infrastructure requires planning and strong institutionsBecause infrastructure is lumpy, infrastruc-ture systems cannot be grown incremen-tally and continuously, and they need to be planned in a holistic manner. A road or train line cannot be designed without considering other parts of the transport system, land use regulations, and urban planning.
Moreover, different infrastructure systems interact across sectors and cannot be designed in isolation. Water availability affects elec-tricity generation, and electricity is critical in water management (for groundwater pump-ing, for example). Transportation and energy interact closely: energy production often requires transport infrastructure, and dif-ferent transport modes have different energy needs (from liquid fuel transport to electricity grids for electrifi ed cars). Smart use of infor-mation and communication technologies can green the urban environment and improve the effi ciency of other infrastructure systems (box 6.8). Thus, much can be gained from
BOX 6.7 Using noneconomic incentives to reduce the demand for water and sanitation
India’s Total Sanitation Campaign, launched in 1999, focused on communication, education, com-munity mobilization, and the provision of toilets in government schools, mother/child centers, and low-income households (World Bank 2011c). There was little government contribution to the capital cost of sanitation facilities. Instead, the focus was on pri-vate investment and private behavior change.
Part of the effort involved the Clean Village Award Program—awards to local councils that achieved the status of “Open-Defecation Free and Fully Sanitized Uni.” The awards—inspired by a pro-gram initially introduced in Maharastra (the “Sant Gadge Baba”)—helped increase reported sanitation coverage from 21 percent in 2001 to 57 percent in 2008.
GG_133-152.indd 145GG_133-152.indd 145 5/8/12 1:01:18 PM5/8/12 1:01:18 PM

1 4 6 I N C L U S I V E G R E E N G R O W T H : T H E P A T H W A Y T O S U S T A I N A B L E D E V E L O P M E N T
a planning system that can integrate various objectives and infrastructure systems at both the country and regional level to signifi cantly reduce infrastructure costs.
Developing cities: Managing rapid expansion to tap the potential for effi ciency gains
Rapid urbanization is both a driver and a feature of economic development, with seri-ous consequences for infrastructure design (World Bank 2009). In many developing countries—particularly countries transition-ing from low- to middle-income status—the next few decades will see a dramatic increase in the share of people living in cities. In fact, the number of people living in urban areas in developing countries is expected to double, from 2 billion to 4 billion, between 2000 and 2030. And this massive increase is expected to triple the physical footprint of urbanized areas from 200,000 to 600,000 square kilometers. The public policy and investment challenges of managing the social and environmental implications while promoting cities that are economic drivers of the economy are substantial. Fortunately, practical options exist to efficiently green the urbanization process.
The fi rst priority is designing policies and institutions that can help anticipate future urbanization. These policies should enable
existing urban areas to be redeveloped and should prepare the peri-urban fringe to accommodate new settlements. For this to work, land markets need to be functional. Urban land markets mediate demand and supply and enable the effi cient use of land and optimal development of constructed fl oor area, both of which shape a city’s spa-tial structure. Developed countries typically rely on market data from transactions and property attributes to reveal land and prop-erty prices. In contrast, most developing countries lack the basic institutional machin-ery to value and price land.
Higher land prices routinely lead to higher density—which enhances productiv-ity spillovers, potentially increases the supply of affordable housing, and helps manage the demand for transport. But this mechanism is sometimes impaired by land regulations—in many Indian cities the fl oor-space index is limited to 1 (as opposed to 5–15 in other Asian cities). As a result, high land prices coexist with low density and sprawl, creat-ing both housing affordability and transpor-tation issues.
Also, when “official” land prices do not refl ect demand and are depressed at the urban periphery, it is likely that sprawl or subur-banization will be excessive. How the peri-urban expansion is managed will be a criti-cal determinant of whether cities can harness agglomeration economies and induce effi cient
BOX 6.8 Harnessing smart information and communication technologies to shape a green future
The smart application of information and commu-nication technologies can facilitate green growth, both by reducing emissions of greenhouse gases and by creating new market opportunities, such as smart grids and Intelligent Transport Systems (ITS). To date, most of these mitigation opportunities have been applied in high- and middle-income countries. But it is arguably in the megacities of the developing world where the impact could be greatest. Applica-tion of ITS in Bangkok or Manila, where there are
few substitution opportunities for private road traf-fi c in the form of mass-transit system, would have a much more benefi cial impact than in, say Hong Kong SAR, China, or Singapore. Asian countries commit-ted to introducing ITS—such as electronic fare and road-user charging systems, transport control cen-ters, and real-time user information—in Goal 11 of the Bangkok Declaration on Sustainable Transport Goals for 2010–20.
GG_133-152.indd 146GG_133-152.indd 146 5/8/12 1:01:18 PM5/8/12 1:01:18 PM
P H Y S I C A L C A P I T A L 1 4 7
resource allocation. The absence of a func-tioning land market creates a major urban governance challenge, as the scale at which urban and metropolitan economies now oper-ate often does not coincide with their physical and administrative boundaries. The institu-tional arrangements that can enhance coordi-nation across these entities is likely to be con-text specifi c, but signifi cant efforts are needed to make them emerge.
The second priority is redeveloping older, obsolescent areas to promote more effi cient development and achieve higher densities. Older areas typically share several common traits. Their network of streets and alleys is often irregular and highly granular—limiting the ability of developers to build modern high-rise buildings. An alternative is to rede-sign these areas to accommodate higher den-sities. Doing so typically requires assembling small plots into larger and more effi cient par-cels and ensuring that the redeveloped area has adequate infrastructure (particularly transport, water, electricity, broadband Inter-net, and public services) to support higher population densities. These actions should be designed using consultations with the local population, to make sure they benefi t. For instance, rehabilitation projects need to account for the fact that slum dwellers often gain more from slum upgrading than from relocation (World Bank 2006).
The third priority is integrating land policy with urban mobility and transporta-tion (Viguié and Hallegatte 2012). Options for urban transportation are closely tied to
urban land development and can create both positive and negative externalities as cities grow. Problems arise when there are inconsis-tencies between new developments and mass transit investment—as in Hanoi, where new dense urban development projects are not being located near the planned transit net-work. This kind of planning creates a dou-ble risk of having too few users of a public transit system, threatening the fi nancial and social return on investment, and increasing the number of cars on the roads, with conse-quences on congestion and air pollution.
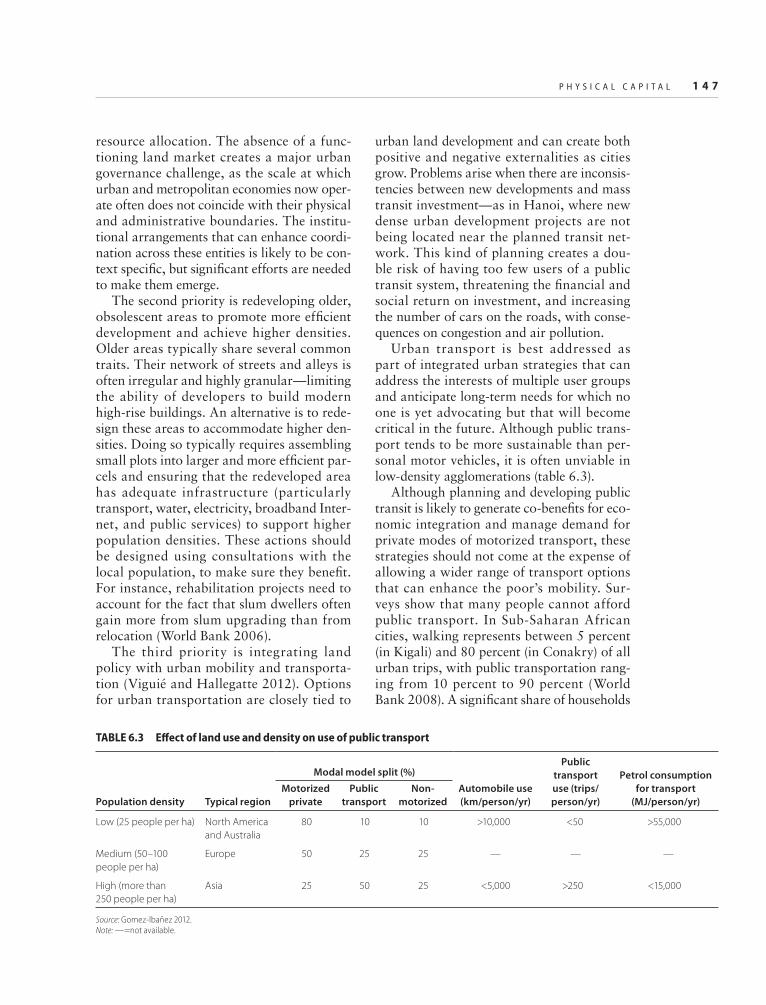
Urban transport is best addressed as part of integrated urban strategies that can address the interests of multiple user groups and anticipate long-term needs for which no one is yet advocating but that will become critical in the future. Although public trans-port tends to be more sustainable than per-sonal motor vehicles, it is often unviable in low-density agglomerations (table 6.3).
Although planning and developing public transit is likely to generate co-benefi ts for eco-nomic integration and manage demand for private modes of motorized transport, these strategies should not come at the expense of allowing a wider range of transport options that can enhance the poor’s mobility. Sur-veys show that many people cannot afford public transport. In Sub-Saharan African cities, walking represents between 5 percent (in Kigali) and 80 percent (in Conakry) of all urban trips, with public transportation rang-ing from 10 percent to 90 percent (World Bank 2008). A signifi cant share of households
TABLE 6.3 Eff ect of land use and density on use of public transport
Population density Typical regionAutomobile use (km/person/yr)
Public transport use (trips/person/yr)
Petrol consumption for transport
(MJ/person/yr)Motorized
privatePublic
transportNon-
motorized
Low (25 people per ha) North America and Australia
80 10 10 >10,000 <50 >55,000
Medium (50–100 people per ha)
Europe 50 25 25 — — —
High (more than 250 people per ha)
Asia 25 50 25 <5,000 >250 <15,000
Source: Gomez-Ibañez 2012.Note: —=not available.
Modal model split (%)
GG_133-152.indd 147GG_133-152.indd 147 5/8/12 1:01:18 PM5/8/12 1:01:18 PM

1 4 8 I N C L U S I V E G R E E N G R O W T H : T H E P A T H W A Y T O S U S T A I N A B L E D E V E L O P M E N T
reports no public transport expenditure, but the average share of income spent in public transport ranges from 3 percent (in Addis Ababa) to 14 percent (in Lagos), reaching about $12–$16 a month in most cities. This implies that at low-income levels, the wider availability of different service levels and modes at different prices is a necessary strat-egy for providing urban transport serv ices. In particular, improving sidewalks, streetlights, and other measures to protect pedestrian users should be parts of an urban transport strategy.
Urban transport also plays a key role in spatially integrating urban labor markets. As cities around the world expand their spatial footprints, the limited reach of walking trips may exacerbate slum formation, as many people trade off housing quality to be close to jobs. It can also severely limit labor mar-ket opportunities for people who live farther away from economic centers. Bovenberg and Goulder (1996) suggest that higher commut-ing costs can decrease labor supply. Graham (2005) fi nds that productive fi rms are located in accessible and densely populated places.
A fourth priority is integrating urban planning with natural risk management—still rare, especially in low-income countries. In 2005, the global community adopted the Hyogo Framework for Action, a 10-year plan to make the world safe from natural disasters. To date, 70 percent of high-income countries are carrying out urban and land-use planning under the framework, but only about 15 percent of low-income countries are doing so (fi gure 6.3). This low participation matters because cities are increasingly vul-nerable to natural hazards, including fl oods that are becoming more destructive in many parts of the world. And considering the limited protection offered by dikes and sea walls, only risk-sensitive land-use planning can mitigate fl ood losses over the long term (Hallegatte 2011).
Given the role of urbanization in devel-opment, a green policy able to develop cities without increasing risks and negative envi-ronmental outcomes would help maintain or increase cities’ attractiveness and pro-duce economic benefi ts (World Bank 2009). It is an open question as to how cities can
FIGURE 6.3 Too few countries are implementing plans to mitigate against natural disasters(percentage of countries that implemented risk management policies under the 2005 UN Hyogo Framework for Action)
Source: UN 2011.
80
40
50
60
70
perc
ent
0
10
20
30
drainage infrastructure slope stabilizationin landslideprone areas
masons training onsafe construction
provision of safeland for low-income
households
urban and land-useplanning
high income low incomeupper-middle lower-middle
GG_133-152.indd 148GG_133-152.indd 148 5/8/12 1:01:19 PM5/8/12 1:01:19 PM

P H Y S I C A L C A P I T A L 1 4 9
accommodate the huge increase in urban population that is expected in many regions without experiencing a hike in disaster losses (World Bank 2010). That said, a recent World Bank study uses Alexandria, Casablanca, Rabat, and Tunis to illustrate how flood risks and climate change can be integrated in urban planning (World Bank 2011a). Trans-portation infrastructure has a key role to play to make it possible for the population to live in safe locations while retaining access to jobs and services (Hallegatte 2011).
Infrastructure robustness and redundancy are critical to maintaining the functions of the economic system after disasters, especially in urban environments, where the failure of one component (such as electricity, trans-port, water, or sanitation) can paralyze activ-ity. In many cases, indirect disaster impacts caused by the loss of lifeline and essential infrastructure services are of similar mag-nitude to direct disaster losses (Hallegatte 2008; Tierney 1997). However, increasing robustness and redundancy is costly, creat-ing trade-offs between the resilience of the economic system and its effi ciency in normal conditions (Henriet and others 2012).
Minimizing the potential for regrets and maximizing short-term benefi tsSome infrastructure investments that are required from a development and economic perspective and useful from an environmen-tal point of view cannot be implemented because of fi nancial, institutional, or plan-ning constraints. Given these constraints, a green growth policy should seek to mini-mize the risk from regret and maximize short-term benefi ts.
To do so, one needs first to identify what investments made today can lead to irreversibility that will cause regret in the future. An example is urban planning and urban form, which are being decided on now in many countries and cannot be easily reversed in the future. Next, one needs to identify what policies (such as
removing subsidies or imposing an envi-ronmental tax) or additional investments in infrastructure (such as sanitation sys-tems) can yield large co-benefi ts and syner-gies between economic and environmental objectives. An example is the provision of urban public transport in crowded cit-ies with high congestion and air pollution levels, where public transport can increase economic effi ciency and improve environ-mental conditions. Sometimes the synergy is between the environment and welfare, without being uniquely mediated by eco-nomic effi ciency (an example is sanitation infrastructure, which improves water qual-ity and thus population health).
Previous chapters have shown that many actions and policies can green growth and capture synergies between environmental protection and development. Designing a green growth strategy requires policy mak-ers to choose among these options, based on what is most important and urgent. The next chapter proposes a methodology to identify priority actions, as a function of the iner-tia and irreversibility they imply and of the trade-offs and synergies they create.
Notes 1. Transport externalities in the United States are
estimated at $0.11 per mile (Parry and others 2007). Traffi c congestion not only increases emissions, it also increases local pollutants and noise.
2. WHO-UNICEF (2012) projects that by 2015 the share of people without improved water will have fallen to 8 percent, exceeding the tar-get of 12 percent. In contrast, about 33 per-cent of the world’s population is projected to lack access to improved sanitation, far from the 23 percent target.
3. Investment needs is a relative concept, as it depends on what the target level of cov-erage and quality is. No fi rm data exist on how much countries invest in infrastructure, although efforts have been made to collect information for Africa and for private invest-ments in infrastructure (see Fay and others 2010; MDB Working Group on Infrastructure 2011).
GG_133-152.indd 149GG_133-152.indd 149 5/8/12 1:01:19 PM5/8/12 1:01:19 PM
1 5 0 I N C L U S I V E G R E E N G R O W T H : T H E P A T H W A Y T O S U S T A I N A B L E D E V E L O P M E N T
ReferencesAn, F., D. Gordon, H. He, D. Kodjak, and
D. Rutherford. 2007. Passenger Vehicle Greenhouse Gas and Fuel Economy, Standards: A Global Update. Washington, DC: Internat ional Counci l on Clean Transportation.
Arze del Granado, J. D. Coady, and R. Gillingham. 2010. “The Unequal Benefits of Fuel Subsidies: A Review of Evidence for Developing Countries.” IMF working paper WP/10/02, International Monetary Fund, Washington, DC.
Bertaud, A. 2003. “Clearing the Air in Atlanta: Transit and Smart Growth or Conventional Economics?” Journal of Urban Economics 54 (3): 379–400.
Bovenberg, A. L., and L. H. Goulder. 1996. “Optimal Environmental Taxation in the Presence of Other Taxes: General Equilibrium Analysis.” American Economic Review 86 (4): 985–1000.
Briceño-Garmendia, C., K. Smits, V. Foster. 2008. “Financing Public Infrastructure in Sub-Saharan Africa: Patterns and Emerging Issues.” Background Paper 15. Africa Infrastructure Country Diagnostic, World Bank, Washington, DC.
Chamon, M., P. Mauro, and Y. Okawa. 2008. “Mass Car Ownership in the Emerging Market Giants.” Economic Policy 23 (54): 243–96.
Davis, S. J., K. Caldeira, and H. D. Matthews. 2010. “Future CO2 Emissions and Climate Change from Existing Energy Infrastructure.” Science 329 (5997): 1330–3.
ESMAP (Energy Sector Assistance Management Program). 2009. “Offgrid Technology and Lighting Africa”. Session 6 of the Africa Electrification Initiative Workshop. Maputo, Mozambique, May 9–12. http://www.esmap.org/esmap/sites/esmap.org/fi les/Rpt_Senegal_Morocco_Ecuador_AEI6.pdf.
Fay, M., M. Toman, D. Benitez, and S. Csordas. 2010. “Infrastructure and Sustainable Development.” In Postcrisis Growth and Development: A Development Agenda for the G20, ed. S. Fardoust, Y. Kim, and C. Sepulveda. Washington, DC: World Bank.
Federal Highway Administrat ion. 2008. “Lessons Learned from Internat ional Experience in Congestion Pricing.” Publication FHWA-HOP–08–047. Federal Highway Administration, Washington, DC.
Foster, V. , and C. Br iceño-Garmendia. 2010. Africa’s Infrastructure: A Time for Transformation. Paris: Agence Française de Dévelopment; Washington, DC: World Bank.
Frederick, K. D., and G. E. Schwarz. 2000. “Socioeconomic Impacts of Climate Variability and Change on U.S. Water Resources.” RFF Discussion Paper 00–21, Resources for the Future, Washington, DC.
Geneletti, D. 2003. “Biodiversity Impact Assessment of Roads: An Approach Based on Ecosystem Rarity.” Environmental Impact Assessment Review 23 (3): 343–65.
Giraudet, L.-G., C. Givarch, and P. Quirion. 2011. “Exploring the Potential for Energy Conservation in French Households through Hybrid Modeling.” Energy Economics 34 (2): 426–45.
Gomez-Ibañez, J. A. 2012. “Urban Transportation and Green Growth.” Paper prepared for the Green Growth Knowledge Platform inaugural conference, Mexico City, January 12–13.
Graham, D. 2005. “Wider Economic Benefits of Transport Improvements: Link between Agglomeration and Productivity”. Report to Department of Transport, London.
Greene, D. L., J. R. Kahn, and R. C. Gibson. 1999. “Fuel Economy Rebound Effect for US Household Vehicles.” Energy Journal 20 (3): 1–31.
Guivarch C., and S. Hallegatte. 2011. “Existing Infrastructure and the 2°C Target.” Climatic Change Letters 109 (3): 801–5.
Gusdorf, F., and S. Hallegatte. 2007. “Compact or Spread-Out Cities: Urban Planning, Taxation, and the Vulnerability to Transportation Shocks.” Energy Policy 35 (10): 4826–38. doi:10.1016/j.enpol.2007.04.017.
Gusdorf, F., S. Hallegatte, and A. Lahellec. 2008. “Time and Space Matter: How Urban Transitions Create Inequality.” Global Environment Change 18 (4): 708–19. doi:10.1016/j.gloenvcha.2008.06.005.
Hallegatte, S. 2008. “An Adaptive Regional Input-Output Model and Its Application to the Assessment of the Economic Cost of Katrina.” Risk Analysis 28 (3): 779–99.
———. 2009. “Strategies to Adapt to an Uncertain Climate Change.” Global Environmental Change 19 (2): 240–7.
———. 2011. “How Economic Growth and Rational Decisions Can Make Disaster Losses Grow Faster than Wealth.” Policy Research
GG_133-152.indd 150GG_133-152.indd 150 5/8/12 1:01:19 PM5/8/12 1:01:19 PM

P H Y S I C A L C A P I T A L 1 5 1
Working Paper 5617, World Bank, Washington, DC.
Henriet F., S. Hallegatte, and L. Tabourier. 2012. “Firm-Network Characteristics and Economic Robustness to Natural Disasters.” Journal of Economic Dynamics and Control 36 (1): 150–67.
Hussein, M. A. 2007. “Cost of Environmental Degradation: An Analysis in the Middle East and North Africa Region.” Management of Environmental Quality 19 (3): 305–7.
Hutton, G., J. Bartram. 2008. “Global Costs of Attaining the Millennium Development Goal for Water Supply and Sanitation.” Bulletin of the World Health Organization 86 (1): 13–19.
IBNET. 2011. The IBNET Water Supply and Sanitation Performance Blue Book. Washington, DC: World Bank.
IEA (International Energy Agency). 2011. World Energy Outlook 2011. Paris: IEA.
ISDR (International Strategy for Disaster Reduction), World Bank, World Meteorological Organization, International Monetary Fund. 2011. Strengthening the Hydro-Meteorological Services in South Eastern Europe. http://www.unisdr.org/we/inform/publications/7650.
Kalkuhl, M., O. Edenhofer, and K. Lessmann. 2011. “Learning or Lock-In: Optimal Technology Policies to Support Mitigation.” Resource and Energy Economics 34 (1): 1–23.
Komives, K., V. Foster, J. Halpern, and Q. Wodon. 2005. Water, Electricity, and the Poor: Who Benefi ts from Utility Subsidies? Washington, DC: World Bank.
Larsen, E. R., I. Dyner, L. Bedoya V, and C. J. Franco. 2004. “Lessons from Deregulation in Colombia: Successes, Failures and the Way Ahead.” Energy Policy 32 (15): 1767–80.
Loulou, R., and M. Labriet. 2008. “ETSAP-TIAM: The TIMES Integrated Assessment Model Part I: Model Structure.” Computational Management Science, Special Issue on Managing Energy and the Environment 5 (1): 7–40.
Luderer, G., R. Pietzcker, E. Kriegler, M. Haller, and N. Bauer. Forthcoming. “Asia’s Role in Mitigating Climate Change: A Technology and Sector Specific Analysis with ReMIND-R.” Preprint.
MDB Working Group on Infrastructure. 2011. Infrastructure Action Plan, submission to the G20.
Nauges, C., and C. Van Den Berg. 2009. “Demand for Piped and Non-Piped Water Supply Services: Evidence from Southwest Sri Lanka.”
Environmental and Resource Economics 42 (4): 535–49.
Nieswiadomy, M. L., and D. J. Molina. 1989. “Comparing Residential Water Demand Estimates under Decreasing and Increasing Block Rates Using Household Data.” Land Economics 65 (3): 280–9.
Parry, I.W.H., M. Walls, W. Harrington. 2007. “Automobile Externalities and Policies.” Journal of Economic Literature 45: 373–399.
Roberts, P, K. C. Shyam, and C. Rastogi. 2006. “Rural Access Index: A Key Development Indicator.” Transport Sector Board Technical Paper 10, World Bank, Washington DC.
Rozenberg, J., S. Hallegatte, A. Vogt-Schilb, O. Sassi, C. Guivarch, H. Waisman, and J. C. Hourcade. 2010. “Climate Policies as a Hedge against the Uncertainty on Future Oil Supply.” Climatic Change 101 (3–4): 663–8.
Sorrel, S. 2007. The Rebound Effect: An Assessment of the Evidence for Economy-Wide Energy Savings from Improved Energy Efficiency. London, UK: UK Energy Research Centre.
Tierney, K. J. 1997. “Business Impacts of the Northridge Earthquake.” Journal of Contingencies and Crisis Management 5 (2): 87–97.
UN (United Nations). 2011. United Nations Global Assessment Report on Disaster Risk Reduction. New York: United Nations.
van Vliet, O., V. Krey, D. McCollum, S. Pachauri, Y. Nagai, S. Rao, and K. Riahi. 2012. “Synergies in the Asian Energy System: Climate Change, Energy Security, Energy Access and Air Pollution.” Energy Economics.
Viguie, V., and S. Hallegatte. 2012. “Trade-Offs and Synergies in Urban Climate Policies.” Nature Climate Change 2:334–7. doi: 10.1038/nclimate 1434.
Weber, E., E. Arpi, A. Carrigan. 2011. “From Here to There: A Creative Guide to Make Public Transport the Way to Go.” Embarq, the WRI Center for Sustainable Transport, World Resource Institute, Washington, DC. http://www.embarq.org/sites/default/fi les/EMB2011_From_Here_to_There_web.pdf.
WHO-UNICEF (World Health Organization; United Nations Children’s Fund) Joint Monitoring Programme for Water Supply and Sanitation. 2012. Progress on Drinking Water and Sanitation: 2012 Update. New York: UNICEF.
World Bank. 2004. Colombia: Recent Economic Developments in Infrastructure (REDI):
GG_133-152.indd 151GG_133-152.indd 151 5/8/12 1:01:19 PM5/8/12 1:01:19 PM

1 5 2 I N C L U S I V E G R E E N G R O W T H : T H E P A T H W A Y T O S U S T A I N A B L E D E V E L O P M E N T
Balancing Social and Productive Needs for Infrastructure. Washington, DC: World Bank.
———. 2006. Morocco, Poverty and Social Impact Analysis of the National Slum Upgrading Program. Washington, DC: World Bank.
———. 2008. Stuck in Traffi c: Urban Transport in Africa. Africa Infrastructure Country Diagnostic Report, World Bank, Washington, DC.
———. 2009. World Development Report 2009: Reshaping Economic Geography. Washington, DC: World Bank.
———. 2010. World Development Report 2010: Development and Climate Change. Washington, DC: World Bank.
———. 2011a. Climate Change Adaptation and Natural Disasters Preparedness in the Coastal
Cities of North Africa. Washington DC: World Bank.
———. 2011b. Household Cookstoves , Environment, Health, and Climate Change: A New Look at an Old Problem. Washington, DC: World Bank.
———. 2011c. The Political Economy of Sanitation: How Can We Increase Investment and Improve Service for the Poor? Washington, DC: World Bank.
———. 2011d. World Development Indicators. Washington, DC: World Bank.
———. Forthcoming. Maximizing Leverage of Public Funds to Unlock Commercial Financing for Clean Energy in East Asia. Washington, DC: World Bank.
GG_133-152.indd 152GG_133-152.indd 152 5/8/12 1:01:20 PM5/8/12 1:01:20 PM