Embed Size (px)
Citation preview
#2002-4Institutional Support for Investment in New Technologies:
the Role of Venture Capital Institutions in DevelopingCountries
Sunil Mani and Anthony BartzokasMay 2002
Discussion Paper Series
United Nations University, Institute for New Technologies, Keizer Karelplein 19, 6211 TC Maastricht, The NetherlandsTel: (31) (43) 350 6300, Fax: (31) (43) 350 6399, e-mail: [email protected], URL: http://www.intech.unu.edu


INSTITUTIONAL SUPPORT FOR INVESTMENT IN NEWTECHNOLOGIES: THE ROLE OF VENTURE CAPITAL
INSTITUTIONS IN DEVELOPING COUNTRIES
Sunil Mani* and Anthony Bartzokas
UNU/INTECH Discussion Papers
ISSN 1564-8370
Copyright © 2002 The United Nations University, Institute for New Technologies,UNU/INTECH
UNU/INTECH discussion papers intend to disseminate preliminary results of the researchcarried out at the institute to attract comments
* Corresponding author: Keizer Karelplein 19, 6211 TC Maastricht, the Netherlands, Tel. : +31-43-3506331; Fax,. : +31-43-3506399; E-mail: [email protected] (Sunil Mani).

TABLE OF CONTENTS
ABSTRACT 7
INTRODUCTION 9
I. FINANCING OF DOMESTIC TECHNOLOGY GENERATION. 11
FINANCING OF R&D 12FINANCING OF NEW TECHNOLOGY-BASED ENTERPRISES AND THE NEW ECONOMY 13
II. THE CONCEPT OF VENTURE CAPITAL 15
III. PROFILE OF VC INDUSTRY IN DEVELOPING ASIA 21
(A) TRENDS IN CAPITAL UNDER MANAGEMENT (TCUM) 21(B) INVESTMENT PROFILE 23Industry-wide funding 24Stage of financing 31(C) SOURCE OF FUNDS 34(D) EXITING VC INVESTMENTS 37(E) HUMAN RESOURCE REQUIREMENT FOR VENTURE CAPITAL 43(F) INDEX OF VC DEVELOPMENT 44
CONCLUSIONS 47
REFERENCES 49
APPENDIX 1: INDUSTRY CLASSIFICATION ACCORDING TO THE AVCJ 53
APPENDIX 2: INDEX OF VC DEVELOPMENT ACROSS COUNTRIES, 1999 55
THE UNU/INTECH DISCUSSION PAPER SERIES 57


7
ABSTRACT
An important component of the institutional framework supporting investment in new
technologies is venture capital institutions. A group of developing countries, especially from
Asia has been rather successful in establishing and nurturing this way of financing new
technologies. The present paper attempts to survey the efforts of these countries towards using
venture capital institutions as financiers of new technologies. In specific terms, the paper,
based essentially on secondary source material, maps out the ways in which these countries
have gone about promoting venture capital based new technology firms. In addition, we analyse
the VC investments in these countries in terms of stage, technology and source. The paper also
develops an index of venture capital development across the selected developing countries. The
index allows the ranking of the VC industry in any particular country according to its level of
development.
JEL classification: G32, O31, O38Keywords: venture capital, innovation, initial public offerings, technology financing

9
INTRODUCTION
Developing countries have over time emerged as leading producers and exporters of high
technology products. The share of developing countries in the total world exports of high
technology products have increased from just about 8 per cent in 1988 to a little over 21 per
cent in 1998 (Mani, 2000). However there is considerable concentration of this activity in a few
developing countries from the Asian region. In fact about 95 per cent of the developing country
exports of high technology products are concentrated in just five developing countries, namely
Singapore, Malaysia, Philippines, Thailand and Korea. During the same period, one also see a
significant increase in the innovative activity of these countries: the number of US patents
granted to innovators from developing countries increased from about a 1 per cent (of the total
world) to about 6 per cent (Mani, 2002). The relatively speaking, better performance of these
countries is very often attributed to the particular kind of economic policy followed by their
respective governments.
This policy is usually characterized by highly open trading regimes to both foreign trade and
capital. But this line of reasoning does not pay any attention at all at the considerable efforts of
these countries towards strengthening the ability of their domestic enterprises to enhance their
technology generating efforts. They have put in place a number of institutional arrangements for
this activity to flourish. While there are significant variations in the specific components of this
policy across the various countries, there is one common thread that unites them, namely the use
of elements of science, technology and industrial policy that explicitly aim at promoting the
development, spread and efficient use of new products, services and processes in markets or
inside private and public organizations (Bartzokas and Teubal, 2002). In the context, the
purpose of this paper is to examine the role of one such institutional support mechanism for
growing technology-based firms in developing countries.
Technological change is the aggregate outcome of investment decisions at the firm level. By
focusing on investment decisions at the firm level we can identify significant barriers to the
introduction of technological change at the firm level. These barriers refer to credit constraints
and knowledge gaps. The decision to invest in new technologies is constrained by uncertainty
and information costs. Uncertainty is particularly high when technologies are new and still
changing rapidly and investments are considerable. If certain categories of firms do not qualify
for credit, they are more subject to exogenous shocks than if they did. Large established firms
may survive thanks to better access to credit even though their profitability has eroded. But
because barriers to credit stifle the emergence and growth of new firms, the new investment
10
opportunities opened by technological change and macroeconomic adjustment are not fully
taken advantage of. This effect is particularly noticeable in manufacturing exports. In addition,
growth and development imply structural transformation and the emergence of new firms
undertaking new economic activities. Adjustment to macroeconomic shocks similarly requires
that certain economic activities and firms disappear and that others emerge in their place. If new
technology-based firms have limited access to credit, the introduction of new products and
innovation are slowed. (Bartzokas, 2001).
Early in the growth cycle, small business typically do not have many business assets that can be
easily evaluated or pledged as collateral, and have little repayment history or record of
profitability upon which external suppliers of funds can rely. For such business, Venture
Capital (VC) plays a critical role in the development of knowledge as information producers
who can provide detailed assessment of the quality of investment plans and they can address
information problems through the activities of screening, contracting and monitoring. The stage
in the life cycle of Start Ups and/or New Technology Based Firms (NTBFs) the nature of the
need for funding and the characteristics of the firm are important factors considered by VC
investment analysts. The problem of valuing technology as an asset from a financial point of
view is one of the main issues. Even after some experience, new technology-based firms may
remain opaque relative to large firms. The technological role of VCs is not so much significant
because of their role in the financing of research activities or the direct promotion of industrial
innovation but rather because of their direct and indirect involvement in the design and
execution of investment projects in innovation.
The paper is structured into four sections. The first section undertakes a quick survey of the
literature on financing new technologies. This literature has largely developed against the
context of developed countries. The second section examines in more detail one such financing
mechanism, namely the VC institutions. The conceptual underpinning of this institution and its
growth across both the developed and developing world are mapped out in this section. The
third section maps out the structure of the VC industry in developing Asia. Six different
dimensions of the growth of the sector in the continent are discussed. The fourth and final
section summarises the main findings of the study.

11
I. FINANCING OF DOMESTIC TECHNOLOGY GENERATION.
The SMEs now account for a growing proportion of the manufacturing sector of developing
countries. Especially during the last decade, the fastest growing segment were those NTBFs
which are based on new technologies such as information technology and biotechnology.1
These firms are generally located in industries such as communications, IT, computing,
biotechnology, electronics and medical/life sciences. A general feeling is that these technology-
based ventures, whether in the developed or developing country contexts, face extreme
difficulties from the point of view of getting their projects adequately funded by the
conventional capital market, whether debt or equity. Considerable attention has been paid to this
aspect in the literature. The key characteristics of NTBFs identified in the literature (Bank of
England, 2001) are that:
• their success is linked to difficult-to-value growth potential derived from scientific
knowledge and intellectual property;
• they lank tangible assets in the early stages of their life cycles which may be used
as collateral; and
• their products have little or no track record, are largely untested in markets, and are
usually subject to high obsolescence rates.
Needless to add, these factors imply that NTBFs are more vulnerable than SMEs generally to
asymmetric information about risk characteristics and default probabilities given the fact that it
is not even possible for financiers to attach probabilities to the potential outcomes of these
projects.
Funding of domestic technology generation has attracted a small but growing literature. This
literature is almost entirely based on the experience of developed countries, though there have
been some sporadic attempts at extending this to developing countries as well (Mani, 2002).
The literature can be broadly classified into three categories:
1 This was in 1997. See Lockett, Murray and Wright (2002) for the details. The term NewTechnology Based Firms (NTBFs) were defined for the first time by Arthur D.Little as'independently owned businesses established for not more than 25 years and based on theexploitation of an invention or technical innovation which implies substantial technologicalrisks'.

12
Figure 1: Classification of the literature on financing of domestic technology generationSource: Own compilation
We shall briefly explain the central questions dealt within the first two of these three
divisions. At the outset it must be made very clear that the above three categories are
not necessarily mutually exclusive. There is some overlap between all the three and
especially the latter two. Discussion of the last category is dealt with in the next section
on the concept of venture capital.
Financing of R&D
The general belief is that most firms create technologies through the formal R&D route, though
there have been some disenchantment with this position for some time now. The literature in
this area has therefore focused on various fiscal arrangements, especially tax incentives of
various sorts for encouraging firms to commit more resources to industrial R&D. Much of the
literature on this theme focuses exclusively on the U.S. situation and the main research question
analysed is the efficacy of fiscal incentives for promoting R&D. A succinct review of the
various international studies can be found in Hall and Reenen (2000). Mani (2002) has made a
detailed study of the various tax and research grant schemes that exist in six developing
countries, namely Korea, Singapore, Malaysia, India, South Africa and Brazil. A recent attempt
by Hall (2002) has attempted to link this literature with the literature on venture capital and
other ways of financing technology-based startups. The main conclusions of this study are that
(i) small and innovative firms experience high costs of capital that are only partly mitigated by
the presence of VC; (ii) evidence of high costs of R&D capital for large firms is mixed,
Financing of Domestic Technology Generation
Financing of R&D(Hall and Reenen, (2000),Mani (2002), Hall (2002 )
Financing of NewTechnology-basedfirms and the new
economy( Story and Tether, (1998),
European Commission,(2000), Mayer (2001))
Contribution of specificfinancial institution topromoting innovation-
the role of VentureCapital
(Aylward, (1998), Kortum andLerner (2000), Jeng and Wells,
(2000))

13
although these firms do prefer internal funds for financing these investments; (iii) there are
limits to VC as a solution to the funding gap, especially in countries where public equity
markets are not highly developed. The paper ends by making out a case for further work on
governmental seed capital and subsidy programmes.
Financing of New Technology-based enterprises and the new economy
There are two lines of inquiry in this area. The first one focuses more specifically on the
financing of new technology-based enterprises while the second one has a more general focus
on the financing of the so-called new economy or the high technology sector. Most of the
literature fall into the first category and is based largely on the European experience. One of the
more important papers is on public policy measures to support new technology-based firms in
the European Union by Storey and Tether (1998). They examine five policy instruments, one of
which is direct financial support to NTBFs from national governments. The study makes a
distinction between support provided in direct financial terms such as loans, grants, guarantees,
tax relief, etc., and indirect support provided in the form of advisory services, access to
information and so on. According to their survey only three countries, namely Germany,
Sweden and the UK have financial support schemes targeted exclusively and explicitly upon
NTBFs. These range from outright subsidies (covering up to 75 per cent of project costs) in the
case of the UK to subsidised interest rates and access to funding in the case of Sweden.
In the literature on financing of the new economy, the most important work is by Mayer (2001).
The paper examines the financial sector preconditions for the successful development of the
high technology sector (used synonymously with the new economy). The author examine
whether the concentration of innovative activity (measured by patents) in science based
industries reflect the advantage of funding these activities through stock markets and whether
the more production oriented patenting activity in Germany relate to its highly concentrated
ownership and large banking system. The main finding is that there is a close relation between
types of activities undertaken in different countries and their institutional structures. Although
stock markets are very important source of development for the successful high technology
firm, they are not the most common.
Needless to add, that NTBFs are vulnerable to asymmetric information about risk characteristics
and default probabilities given the fact that it is not even possible for financiers to attach
probabilities to the potential outcomes of these projects. Indeed, there is a strategic
complementarity between financial markets and investment in innovation at the firm level. If
financial markets are underdeveloped, then people will choose poorly productive, but flexible
technologies. Firms will choose technologies that are less risky, with many applications, but

14
less productive. SMEs are reluctant to engage in sophisticated technologies as long as they
cannot share the risk they incur with financial markets (Bartzokas, 2001).
15
II. THE CONCEPT OF VENTURE CAPITAL
There is a certain amount of confusion regarding the definition of VC. It is usually referred to as
one type of private equity investments. According to Jeng and Wells (2000, p. 243), “private
equity investments are investments by institutions or wealthy individuals in both publicly
quoted and privately held companies. Private equity investors are more actively involved in
managing their portfolio companies than regular, passive retail investors. The main types of
financing included in private equity investing are venture capital and management and
leveraged buyouts”2. Excepting for the US, and especially in Europe this distinction between
the two is not usually made. In the US, VC as a per cent of total private equity has increased
from 18 per cent in 1993 to 43 per cent in 19993. The growth of VC institutions, have to a
certain extent eased this financial barrier. VC has a number of positive features when
compared to other forms of financing and especially debt-financing (Table 1).
However the most distinguishing aspect of venture financing is the rendition of a number of
value added services provided by the venture capitalist to its portfolio companies. But its
growth especially as a source of risk capital for technology based ventures have been highly
uneven not only across the world, but even within the developing world. In fact a recent study
by Kuemmerle (2001) showed that there are considerable differences in the evolution of venture
capital system in the three technologically developed countries namely, the United States,
Germany and Japan. (See Table 2 on pp. 27-8.). It shows that USA alone has a well developed
venture capital system. In the US, the pool of capital managed by venture capital firms grew
dramatically during the 1980s as venture capital emerged as a truly important source of
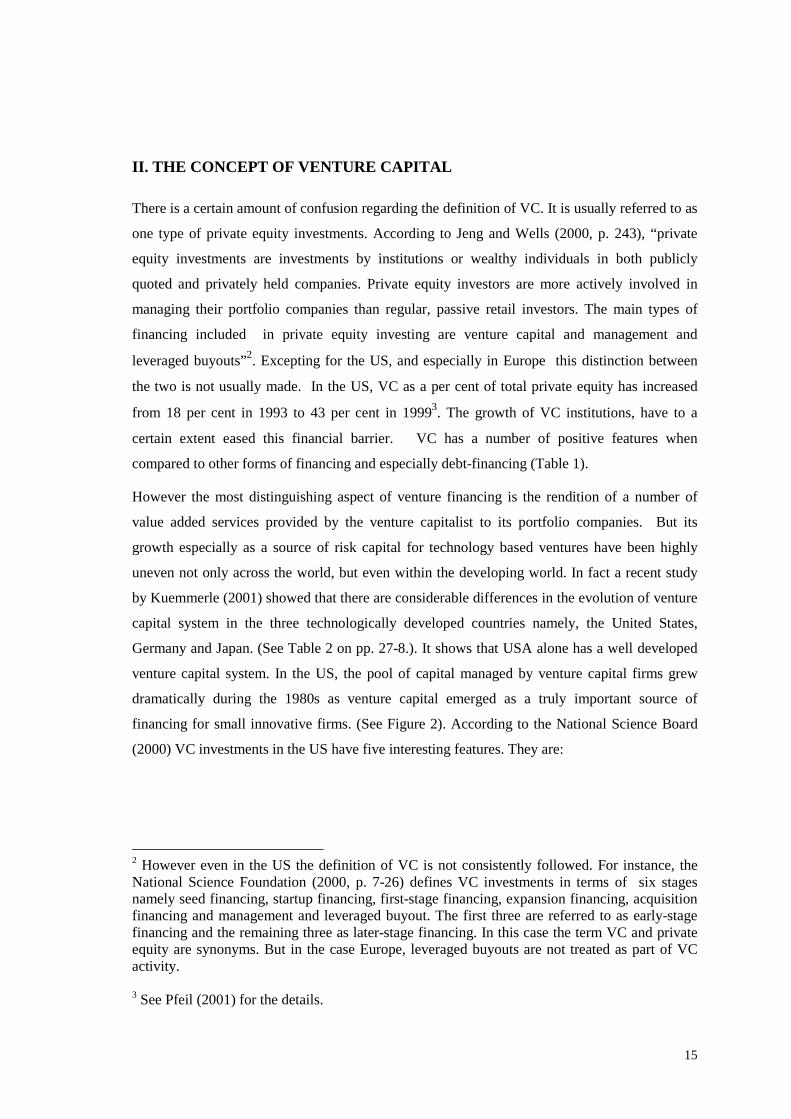
financing for small innovative firms. (See Figure 2). According to the National Science Board
(2000) VC investments in the US have five interesting features. They are:
2 However even in the US the definition of VC is not consistently followed. For instance, theNational Science Foundation (2000, p. 7-26) defines VC investments in terms of six stagesnamely seed financing, startup financing, first-stage financing, expansion financing, acquisitionfinancing and management and leveraged buyout. The first three are referred to as early-stagefinancing and the remaining three as later-stage financing. In this case the term VC and privateequity are synonyms. But in the case Europe, leveraged buyouts are not treated as part of VCactivity.
3 See Pfeil (2001) for the details.

16
Table 1: Distinguishing features of VC financing*
Venture Capital Debt Financing1. Objective Maximise return Interest payment2. Holding Period 2-5 years Short/long term3. Instruments Common shares
Convertible bonds, options,warrants
Loan, factoring, leasing
4. Pricing Price-earnings ratio Interest spread5. Collateral No Yes6. Ownership Yes No7. Control Minority shareholders Covenants8. Impact on balance sheet Reduce leverage Increase leverage9. Exit mechanism Public offering, sale to third
party, sale to entrepreneursLoan repayment
10. Value added services Yes, (i) financial and strategicplanning, (ii) recruitment ofkey personnel, (iii) obtainingbank and other debt financing,(iv) access to internationalmarkets and technology, (v)introduction to strategicpartners and acquisitiontargets in the region, (vi)regional expansion ofmanufacturing and marketingoperations, (vii) negotiatingand executing mergers andacquisitions, (viii) obtainpublic listing.
Nil
Note: These features are largely based on the US experience but could be applied to thesituation in Asia as well.Source: Asian Venture Capital Journal, AVCJ (2000)
(i) From the mid 1990s onwards there has been a growing gap between the new capitalraised and those that are actually disbursed by VC firms implying the availability ofsurplus funds for investing in new and expanding enterprises;
(ii) Since 1990, firms producing computer software or providing computer-related servicesgenerally received the largest share of new investments;
(iii) Later-stage financing (financing of expansion, acquisition or management andleveraged buyout) accounted for very nearly three-quarters of total investments. Withinthis stage, capital for company expansion accounted for one half of the totaldisbursement;
(iv) VC firms in the US cluster around locales considered to be hotbeds of technologicalactivity such as California, New York and Massachusetts;
(v) Contrary to the popular impression, only a relatively small amount of venture capitalgoes to the struggling inventor or entrepreneur. Such seed financing accounted for lessthan five per cent of all venture capital financing during the period 1994-2000.Computer software, telecommunications, medical and health-related firms accountedfor three-quarters of VC investments.
17
0.00
50,000.00
100,000.00
150,000.00
200,000.00
250,000.00
Mill
ions
of U
S $
New capital comitted 2,073. 1,133. 4,120. 3,048. 3,613. 4,023. 3,491. 2,550. 1,488. 4,115. 7,339. 8,426. 15,175 25,292 93,436
Total disbursements 703.3 1559 3651 5293 4686 4888 5603 3869 2875 5236 5188 5946 13558 16778 90551
Total venture capital under management 4,071. 5,685. 12,201 15,759 23,371 26,998 29,539 34,000 31,587 31,894 34,841 38,465 59,614 84,180 233,66
1980 1981 1983 1984 1986 1987 1988 1990 1991 1993 1994 1995 1997 1998 2000
Figure 2: Trends VC Investments, New capital committed and Total VC undermanagement in US, 1980-2000
Notes:1. New capital committed represents the flow of external capital to venture capitalists and VCinvestments denotes the actual investments by VC to investee firms.
2. There are some problems with the concept of total funds under management as some [firms]include committed capital plus capital gains, while some others define it as committed capitalless liquidations. We are grateful to Andrea Schertler for drawing our attention to the nuances ofVC data.
Source: National Science Board (2002).
Comparative studies have shown that there is a fundamental difference between Europe and the
United States in the extent to which the venture capital industry is willing to invest in early
stage technology-based ventures (Storey and Tether, 1994). Two contrasting reasons are
offered to explain the comparatively low European figures. Those supplying the finance point to
an absence of suitable projects, and particularly an absence of individuals with suitable
managerial skills to make the project successful, as the key reason for the reluctance to invest.
In contrast, those entrepreneurs seeking finance point to the technological naiveté of the
financial community and the availability in Europe of comparatively high rewards for making
investments in conventional sectors with which bankers are more familiar. According to the
authors, there is some validity in both arguments. During the 1970s and 1980s, in both France
and Sweden, there was clearly willingness on the part of financiers to invest in technology-
based smaller enterprises. Unfortunately, the results were so poor that financiers subsequently
became very cautious about investing in technology-based firms. This emphasis that the

18
selection of technology-based projects for investment is difficult. There are, of course, some
specialist firms with this ability. In general and in essence, investments in technology-based
firms may be deemed more uncertain, even if they are not more risky. Bankers and financiers in
Europe, therefore, because they generally lack the expertise, and that expertise is expensive to
acquire, have tended to favour investments outside the technology-based sector. This serves to
reinforce the difficulties experienced by technology-based new and small firms in raising
capital.
The growth of VC firms in the developing world is of very recent origin. In most developing
countries it is not older than ten years. There are at least two reasons for this. First, most of
these countries do not have one of the primary requirements for a venture capital industry,
namely an exiting mechanism such as an organised market for public equity. Research has
shown that (Black and Gilson, 1998, Jeng and Wells, 2000) countries which have well-
developed stock markets have highly developed VC market as it provides an important form of
exit to the VC investors. Second, most of them do not have large pension funds etc., which are
the main financiers of VCs worldwide. But all these three factors are now changing. However a
major positive factor, which can pave the way for a systematic growth of the sector in
developing countries is that fact that unlike in developed countries the main locus of innovation
is individuals as opposed to companies and research institutes and universities in developed
countries. This is indicated by the fact that most of the patents that are granted to developing
country inventors in the US are individuals from these countries. Consequently, the venture
capital industry is now on a growth trajectory although highly uneven as far as the developing
countries are considered. In fact the industry is just confined only to developing countries from
Asia, while its growth in Latin America and Africa (even including South Africa) is very tardy
or practically non existent. In some cases the VC industry exists merely as a subset of the
private equity industry4 (See Table 3).
4 The VC industry in South Africa is an example of this. See Mani (2002) for the details.

19
Table 3: The uneven spread of VC across the world
Total Capital under management (Millions of US$)
1991 1999USA 28300(389) 134,400(620)Germany na 1,826Japan 15,352 (115)* 21,729 (221)Israel 300 (15) 3,600 (90)Taiwan 412(22) 4,447 (132)Korea 1,547(57) 4,986(131)Hong Kong/ China 2,173(39) 22,288(190)India 93(14) 1,826(44)Singapore 868(23) 7,791(85)
Malaysia 75(8) 667(28)Indonesia 76(8) 333(44)Thailand 64(9) 265(15)Philippines 16(1) 292 (14)Australia 1,231(34) 3,616 (124)New Zealand 14(1)** 413(16)
Note: * Figures in parentheses indicate the total number of VC firms; ** Data refers to 1993
Sources: AVCJ (2000); Kuemmerle (2001).
The table presents some interesting facts. First, the total capital under management in the US
industry is almost 1.81 times the combined total of all other countries. Second, the size of the
VC industry in Germany is only as big as the one in India. Third, the size of the VC industry in
China/Hongkong is big as the one in Japan. Finally the Japanese VC industry has shown some
significant increases and it is actually much bigger than the German one. This is an interesting
result as it is generally believed that the VC industry in Japan is, at best, a budding one
(Kuemmerle, 2001, Hurwitz, 1999)5. Finally what is striking about the above table is the
5 The term 'venture business' first surfaced in Japan in the 1960s, but it was not until the bubble-economy years in the 1980s that funds began pouring in volume. At this time, corporationsaccounted for the lion's share of investing, spending Y20.5bn in 1989, according to the Ministryof International Trade and Industry. Banks invested Y15.8bn in ventures that year. As thebubble deflated, investor enthusiasm for venture businesses flagged: banks and corporationswere strapped for cash. Funding dropped off sharply through the 1990s and did not pick upagain until 1998. However, by 1998 the situation had changed dramatically. Instead of bankemployees and corporate salarymen, this time around it was young mavericks from two newJapanese companies that were investing. Softbank and Hikari Tsushin altered the course ofJapanese venture capital single-handedly by sending dozens of employees out on the street tolook for deals. Softbank turned up 450 such companies; Hikari Tsushin does not disclose thesize of its portfolio.See Financial Times, http://specials.ft.com/ln/ftsurveys/industry/sc23436.htm) for the details.

20
phenomenal growth of the industry in developing Asia. In the next section we shall analyse
various dimensions of Asia's VC industry.

21
III. PROFILE OF VC INDUSTRY IN DEVELOPING ASIA
In this section, we consider the pattern of growth and specialisation of the VC industry in Asia.
In this study we consider the following Asian countries Hong Kong/China, India, Indonesia,
Korea, Malaysia, Myanmar, Pakistan, Philippines, Singapore, Sri Lanka, Taiwan, Thailand and
Vietnam. The data are based on the 12th survey of Asian venture capital and private equity
conducted by the VCJ( 2000)6 and the period of study is 1991-1999. The dimensions considered
are (a) trends in capital under management and the geographical spread of the industry; (b) the
investment profile in terms of both stage and industry-wise flows; (c)source of capital to the VC
firms and the role of government in it; (d) the channels that are available for VC firms to exit
from their investee firms; (e) the human resource requirement for VC firms; and (f) index of VC
development across the selected countries. The main purpose here is to develop an index of VC
development in each of the major Asian countries and compare it with that of the USA, Europe,
Japan and Australia. Such an exercise, we feel, will enable us to make a proper benchmarking of
the industry in Asia.
(a) Trends in capital under management (TCUM)
At the outset the term capital under management is defined by (1).
TCUM = TFAI + TIPCH (1)
Where,
TCUM = Total capital under managementTFAI = Total funds available for investmentTIPCH= Total investment portfolio currently held = Cumulative total of existing investmentsless any divestments made.
Notwithstanding the low base, the TCUM has registered an impressive rate of growth of 89 per
cent per annum (Table 4). Vietnam has registered the highest rate of growth. But among the
countries with at least TCUM of US $ 1.5 billion and above, it is India, which has registered a
very high rate of growth. Even countries such as Korea, Singapore, and Malaysia which were
hit hard by the so-called Asian financial crisis has managed to register increases in the TCUM
since 1997. Perhaps the positive effects of the IT boom might have offset the negative effects of
6 According to the AVCJ (2000), the data contained in the survey are reliable but cannotguaranteed to be complete.

22
the financial crisis. The only notable exception to this is Indonesia which has experienced
negative rates of growth during this period.
Table 4: Trends in TCUM, 1991-1999 (in millions of US $)
1991 1992 1993 1994 1995 1996 1997 1998 1999 Average Annual Growth Rate (%)Hong Kong/China 2,173 2,656 3,095 6,037 8,044 8,729 10,670 15,442 22,288 115.71Singapore 868 896 1,013 1,833 3,164 3,981 4,468 5,258 7,791 99.70Korea 1,547 1,629 1,687 1,902 2,567 3,224 1,857 2,995 4,986 27.79Taiwan 412 470 508 562 696 1,336 1,913 3,598 4,447 122.42India 93 113 149 243 281 784 1,016 1,053 1,826 232.93Malaysia 75 147 160 194 437 448 406 460 667 98.67Indonesia 76 57 99 225 245 289 426 328 333 42.27Vietnam 10 22 131 247 303 276 292 258 318 385.00Philippines 16 26 58 85 123 166 169 224 292 215.63Thailand 64 90 98 117 165 201 177 242 265 39.26Sri Lanka 4 16 20 49 64 67 71 68 68 200.00Pakistan 4 4 3 3 7 6 6 15 57 165.63Myanmar 112 112 113 83 36 -16.96Total 5342 6126 7021 11497 16208 19619 21584 30024 43374 88.99Note: * Average annual growth rates are computed by taking the arithmetic mean of annualpercentage changes.Source: AVCJ (2000)
There is, however, considerable geographic concentration (Table 5). About 95 per cent of
TCUM are concentrated in just five countries namely, Hong Kong/China, Singapore, Korea,
Taiwan and India. Within the top five, all the countries have increased their respective shares
with the sole exception of Korea which has actually seen a significant erosion of its share
primarily because its industry has grown at a much slower rate.
Table 5: Geographical spread of the VC Industry in Asia, 1991 and 1999(Percentage share)
1991 1999Hong Kong/China 40.678 51.386Singapore 16.249 17.962Korea 28.959 11.495Taiwan 7.712 10.253India 1.741 4.210Malaysia 1.404 1.538Indonesia 1.423 0.768Vietnam 0.187 0.733Philippines 0.300 0.673Thailand 1.198 0.611Sri Lanka 0.075 0.157Pakistan 0.075 0.131Myanmar 0.000 0.083
Total 100 100
Source: AVCJ (2000)

23
Within the countries, excepting for India where there is a concentration of VC firms in the city
of Bangalore (which is usually referred to as the Silicon Valley of India), there is lack of
information whether the VC industry is concentrated in any region.
(b) Investment Profile
The investment portfolio and new investments have registered sharp increases over the last two
years across all the countries excepting Thailand. In Thailand there has been a reduction in
actual investments (Table 6). What is striking about the investment profile is the fact that
despite the 'Asian financial crisis' there has been no slowing down of actual VC investments in
any of the countries (excepting Thailand) worst affected by the crisis. In fact the actual
investments have almost doubled within such a short period.
Table 6: VC Investments in Developing Asia, 1998-1999 (in Millions of US $)
Investment portfolio New investments during1998 1999 1998 1999
Hong Kong/China 6715 8787 1378 1985
Korea 2969 3720 609 1253
Taiwan 2056 2951 881 1043
Singapore 1938 2830 424 1060
India 435 802 92 384
Malaysia 265 343 53 81
Vietnam 198 289 44 91
Thailand 234 264 74 53
Philippines 102 157 54 65
Indonesia 98 136 34 48
Sri Lanka 31 36 5 8
Myanmar 32 32 0 0
Pakistan 3 6 2 3
Total 15076 20353 3650 6074
Source: AVCJ (2000)
An interesting fact is that there is considerable gap between TIPCH and TCUM for
most countries and especially for Hong Kong\China. In fact the ratio between TIPCH to
TCUM was 0.39 in the case of Hong Kong\China for the year 1999. This can mean at

24
least two things: first the opportunities available for investment is far less than the
amount of VC available, second it can also mean that the quality and quantity of VC
professionals available for screening proposals are lacking. This latter point is subjected
to some further scrutiny in the section on availability of appropriate human resource.
Industry-wide fundingIt is generally believed that burgeoning venture capital industry has had a significant impact on
innovation in the United States. A recent empirical study by Kortum and Lerner (2000) measure
the impact VC has had on innovation and patenting in the US manufacturing sector during the
period 1983-1992. The authors explain that, while innovation occurs in large and small
companies, projects undertaken by corporate research labs are distinct from those funded by
venture capitalists. The latter scruitnise business plans thoroughly, accept only one per cent of
them, disburse funds in stages and monitor managers extensively. The impact venture capital
has on innovation is particularly strong at the early stage of financing. The authors regress a
measure of the number of successful patent applications, in each industry, against a measure of
the number of firms that obtained venture capital backing, and against total investments.
Patenting patterns across industries over a three-decade period suggest that the effect is positive
and significant. The results are robust to different measures of venture activity, subsamples of
industries, and representations of the relationship between patenting, R&D, and venture capital.
Averaging across regressions, the authors come up with an estimate, for the impact on patenting
of a dollar of venture capital relative to a dollar, of 3.1 and this estimate suggested that VC
accounted for 8 per cent of industrial innovations in the decade ending in 1992. Further
according to the authors, given the rapid increase in venture funding since 1992, and assuming
that the potency of venture funding has remained constant, the results imply that by 1998,
venture funding accounted for about 14 per cent of the innovative activity in the U.S.
However, in some countries, even in the West, majority of the VC investments have gone
towards consumer related industries. So excepting for the US, VC industry is not that
technology-friendly. According to Schertler (2001, p. 32), 'compared to the US share of
investments in communications and computer-related enterprises to total venture capital,
European private equity investors have only invested a small share of private equity in these
high-technology enterprises'. Following Shertler (2001), we define the following four industries
as high technology-oriented industries. These are7 (i) Computer related; (ii) Information
Technology (IT); (iii) Medical; and (iv) Telecommunications. A comparative picture of the
distribution of VC investments flowing towards the high technology sector is presented in
7 Detailed list of industries which fall into each of these categories are presented in Appendix 1.

25
Figure 3. It is seen that the developing Asia is marginally better than Europe on this front, but is
significantly better than Japan and Australia.
0
10
20
30
40
50
60
70
80
90
Percentage share
1999 85.4 76.5 35.68 30.5 26.3 25.4
USA Israel Developing Asia Europe Japan Australia
Figure 3: Distribution of VC investments flowing towards high technology sectors.Source: AVCJ (2000), National Science Board (2000).
The above figure hides considerable inter country variations in the investment pattern (Table 7
on p.28). Two propositions can be made with reference to technology specialisation. First,
among the four technology areas, much of the investments have actually gone towards
computers, IT and telecommunications while the medical industry (which includes
biotechnology) has received only 13 per cent of the total investments. Second, it is only in
Taiwan that approximately 60 per cent have gone to the high technology sector, followed by
Singapore and India. Surprisingly in two other important countries, namely in China/Hong
Kong and Korea only a quarter of the investments have been in high technology sectors. This
may perhaps be a an explanation for the fact that the share of Hong Kong \China in total high
technology exports from developing countries is not very high. The only country, which has
matched the US specialisation, is the Israeli one.
An important hypothesis in the literature is the nexus between VC funding and the growth of
certain high technology industries such as the IT (Singh, Singh and Weisse, 2000) and other
high technology sectors. The empirical evidence from both the USA and Israel substantiates this

26
hypothesis. In order to see the link between the growth of VC investments and the growth of the
high technology sector in the Asian countries under consideration, we do two excerises: first at
the macro level and second at the micro level by taking the case of a specific country which has
done excellently in terms of an index of high technology development. At the macro level, we
take into account all the Asian countries. For these countries we analyse the relationship
between that portion of the VC funding that flow towards the high technology sectors and the
growth of the high technology sector itself (Figure 4). The two variables related are the rate of
growth of the VC funding towards high technology sectors and the rate of growth of high
technology exports from these countries. Since only nine of the thirteen countries in our sample
are high technology exporters, we restrict our analysis to these countries. They are China, India,
Korea, Malaysia, Pakistan, Philippines, Singapore and Thailand. A notable omission is Taiwan.
Despite this, the correlation between the two variables appear to be very high: the zero- order
correlation coefficient is (+) 0.76

27
Table 2: Evolution of Venture Capital Systems in the U.S., Germany and Japan
U.S. Germany JapanFundamentals
Legal system
Financial system
Primary locus of industrialinnovation
common law
market-based/separation ofcommercial and investment banking
research universities, companies
civil law
bank-based/universal banks
research universities, companies
civil law
bank-based (with keiretsuties)/separation of commercial and
investment banking
companies
History
First public effort to foster enterprisecreation
First venture capital organisationinvolving not-for profit institutions
First private venture capital firm
Date of creation of first public equitymarket dedicated to high-growthcompanies
1958: Small Business Investment Act
1946: American Research andDevelopment Corporation (venture
capital firm co funded by MIT)
1958
1971: NASDAQ
Early 1960s: Capital InvestmentCompanies
1975: WFG (semi-public venturecapital firm)
1979
1997: Neuer Markt
1963: Small Business InvestmentCompanies
1975: Center for promotion of R&DIntensive Businesses (not a venturecapital firm but an industry group
coordinated by MITI)1973
1999: Mothers(JASDAQ, started in 1991 was not
very successful)
Current State

28
Number of registered private equityfirms
Private equity under management
…….. of which percentage venturecapital
Number of companies listed on high-growth exchange
Market capitalisation of exchange
Initial public offerings in 2001
1999: 620 (venture capital only)
1999: $ 400 billion
1999: 33.6 per cent
NASDAQ: 4, 072 (31/01/2002)
$2873 billion (31/01/02)
63
1999: 172 private equity firms, ofwhich 15 were pure venture capital
firms
1997: $8.3 billion
1999: 22 per cent
Neuer Markt: 202 (31/12/1999)
na
1999: 232 private equity firms, ofwhich 10 were pure venture capital
firms( author's estimates)
1998: $12.5 billion
1998: 16 per cent
Mothers: 10 (30/06/2000)
na
Source: Adapted from Kuemmerle (2001), pp. 244-5, Rausch (1998)
Table 7: Industry-wide disbursement of VC investments, 1999(Percentage share)
China Hong Kong India Indonesia Korea Malaysia Pakistan Philippines Singapore Sri Lanka Taiwan Thailand Computer Related 6.7 6.5 16.4 5.9 9.8 7.7 8.1 10.2 8.4 4.5 25.1 5.2Electronics 6 6.3 4.5 21.1 15.7 15.2 5 7 14.5 6.1 15.3 8.1Information technology 5.9 6.3 11 8.7 5.3 13.9 0 11.6 15 7.5 24.6 7.3Manufacturing-Heavy 6.5 8.3 5.6 8.9 11.7 12.1 36 3.1 1.9 11.4 3.9 3.1Telecommunications 5.8 16.4 10.9 8.3 13.4 7.4 0 12.7 15.8 11.3 7.5 9.4High-technology based 30.9 43.8 48.4 52.9 55.9 56.3 49.1 44.6 55.6 40.8 76.4 33.1Medium and low-technology based 69.1 56.2 51.6 47.1 44.1 43.7 50.9 55.4 44.4 59.2 23.6 66.9Total 100 100 100 100 100 100 100 100 100 100 100 100
Source: AVCJ (2000)

29
-40.00
-20.00
0.00
20.00
40.00
60.00
80.00
100.00
120.00
140.00
Rat
e of
Gro
wth
(in
per c
ent)
Rate of Growth of VC Investments 72.38 97.28 20.39 38.46 10.79 -23.36 130.45Rate of Growth of High TechnologyExports
21.3 43.5 37.8 11.5 7.0 -12.0
1993 1994 1995 1996 1997 1998 1999
Figure 4: Relationship between the rates of growth of VC funding and high tech exports,1993-1999Sources: AVCJ (2000); Mani (2000)
It must of course be pointed out that one is not making any causation between the two. Among
the countries, India has the highest correlation coefficient between the two variables (+ 0.81)8.
This is highly plausible as the country has emerged as a leading exporter of computer software
and as noted earlier about 46 per cent of the VC financing in India have gone towards the high
technology sector (Table 7 on p. 28). Therefore, the micro exercise is to estimate this link
between VC funding (that is high tech VC funding) and software exports and this is attempted
below. This link between the availability of VC financing and the growth of the domestic
software industry has been discussed in the literature ( Miller, 2000 and Baskar and
Krishnaswamy, 2002). According to Baskar and Krishnaswamy (p. 14), VC is 'required by
most software firms in India for their sales and marketing expenses rather than for product
innovation'. However this proposition needs further empirical scrutiny, as the authors have not
adduced sufficient factual evidence excepting for a case study. Government of India and some
of the state governments within the country have now established venture capital schemes
specifically targeted at the software and IT industry. (See Box 1.). Given that this is initiative is
of very recent origin, it is too early to measure its impact on the performance of the industry.
8 For an examination of the relation between the venture capital and information technologyindustries in India see Dossani and Kenney (2002).

30
The National Taskforce on the IT industry had estimated a total VC investments US $ 500
million in the five years beginning 19989. At current rate of growth of VC funding towards this
sector, this target appears to be easily achievable (Figure 5).
0.0
20.0
40.0
60.0
80.0
100.0
120.0
140.0
160.0
180.0
200.0
Mill
ions
of U
S $
India 8.9 10.8 18.3 26.9 38.1 48.7 41.5 176.71992 1993 1994 1995 1996 1997 1998 1999
Figure 5: Estimated VC financing towards high technology sector in India, 1992-1999Source: AVCJ (2000)
9 See http://it-taskforce.nic.in/vsit-taskforce/bgr3.htm

31
Box 1: Governmental efforts to establish VC funding for the Software and IT Industry inIndia
Small Industries Development Bank of India (SIDBI), in association with Ministry of InformationTechnology, Govt. of India, has set up a 10 year close ended venture capital fund called the "NationalVenture Fund for Software and IT industry" (NFSIT). This was launched in December 1 1999. NFSIThas a corpus fund of Rs. 1 billion (approximately US $ 21 million) and is a dedicated IT Fund with afocus on small-scale sector. The objective of the fund, besides meeting total financial requirements of theunits, is to enable these units to achieve rapid growth rates and develop and maintain globalcompetitiveness. The fund endeavours to develop international networking and enable assisted units toattract co-investments from international venture capitalists. International linkages will help the assistedunits to get a listing with foreign stock markets viz. NASDAQ; thereby achieving better valuations andoffering alternate exit routes to the investors.A portion of the Fund has been earmarked for incubation projects that involve high risks and might beused for development of software products. Software products require rigorous risk evaluation for whichhigh degrees of expertise including international linkages are required. The fund managed to attract anumber of high-class professionals as investment managers in the Asset Management Company.
Many state governments have already set up venture capital funds for the IT sector in partnership withlocal state financial institutions and SIDBI. These states include: Andhra Pradesh, Karnataka, Delhi,Kerala, Gujarat, and Tamil Nadu among others.
Source: http://www.sidbiventure.co.in/svc-01r.htm
In short VC financing is an important input for successful performance especially in the high
technology sector.
Stage of financingIn a recent a recent succinct review of the facts that are known about venture capital activity,
Gompers and Lerner (2001) have identified four different factors that affect the financing of
young firms. They are:
(i) There is a tendency for the paid managers of a firm to indulge in wasteful expenditures,
if the firm raises equity from outside investors. This is because the manager may benefit
disproportionately from this activity and has not to bear its entire cost;
(ii) Likewise, if the firm raises debt, the manager may increase risk to undesirable levels;
(iii) It may be difficult to write a contract governing the financing of a firm if the effort of
the entrepreneurial firm cannot be ascertained with complete confidence. This arises in
a situation when all the outcomes of the firm cannot be correctly predicted; and
(iv) The above three gives rise to uncertainty and informational asymmetries in the case of
young firms.
The above four factors are likely to be acute for companies with intangible assets and whose
performance is difficult to assess. A very good illustration of this is in the case of high
technology companies with a heavy reliance on R&D, especially in their early stages (seed,

32
startup and first stage financing). The theoretical expectation is that specialised financial
intermediaries such as venture capital institutions are designed to reduce these information gaps
and thus allow firms to receive the financing that they cannot raise from other external
sources10.
Mayer (2001) has outlined the sources of capital for a young high technology firm through its
various stages of growth (Figure 6) At the initial stages of such a firm a lion's share of the
financial input emanate from own savings of the entrepreneurs and from their family members
and relatives. Whatever external equity these firms are able to generate are raised from informal
venture capital sources referred to as business angels (wealthy or reasonably wealthy private
investors). In actuality, even in the best situation namely in the US case (Figure 7) not more
than a quarter of the VC funding has actually gone towards this stage. In fact there has been
considerable erosion in the share of all early stages in total investments over time.
The factors that determine the different contributions of business angels and venture capitalists
to start-up financing has been examined in Van Osnabrugge (1998). This was done by
comparing the initial screening, due diligence, investment criteria, contracts, monitoring and
exit routes employed by the different types of investor. The results of the analysis (quoted in
Mayer, 2001) showed two important differences between the two groups. First, that venture
capitalists act like institutions following principal-agent relations of limiting risks through
monitoring, while business angels place more emphasis on ex post involvement. This
differential behaviour is very much a function of the nature of ownership of VCs. Second, from
the very outset VC are focused on exit and expect a much higher rate of return than business
angels: in the UK these were almost double the rates expected by business angels. It is against
this background that we analyse the stage of financing of VC firms in the developing Asian
context.
10 VC employ a number monitoring and information tools to scruitnise investee forms beforeproviding them with capital. Afterwards the investee firms are monitored very closely. Themonitoring and information tools of venture capitalists include: meting out financing in discretestages over time; syndicating investments with other venture capital firms; taking seats on afirm's board of directors; and compensation arrangements including stock options. For a detailedsurvey of a number of studies documenting the efforts of VCs in employing these tools, seeGompers and Lerner (2001).

33
Seed S tart-up Early grow th E stablished
Founders, friends,
fam ily
B usiness angels
V enture capitalists
N on-financia l com panies
E quity m arkets
Com m ercia l banks
H igh
L ow
Figure 6: Stages in the financing of a typical high technology firmSource: Mayer (2001), p. 7

34
0
10
20
30
40
50
60
70
80
Perc
enta
ge s
hare
Early stage 47.8 44 37.5 38.2 27.3 28.7 31.8 29 26.2 24.3 29.7 28.7 22.7 40.1 30.5 36 26.9 24.9 28 21.1 22.4Later stage 52.2 56 62.5 61.8 72.7 71.3 68.2 71 73.8 75.7 70.3 71.3 77.3 59.9 69.5 64 73.1 75.1 72 78.9 77.6Seed capital 1.6 3.1 3.3 3.1 2.5 2.8 2.5 2.5 2.6 3.2 3.2 3.1 3 6 4.6 5.3 3.8 4.6 4.3 1.4 1.4
1980 1981 1982 1983 1984 1985 1986 1987 1988 1989 1990 1991 1992 1993 1994 1995 1996 1997 1998 1999 2000
Figure 7: Share of early stage financing in total VC investments in the USA, 1980-2000Source: National Science Board (2002)
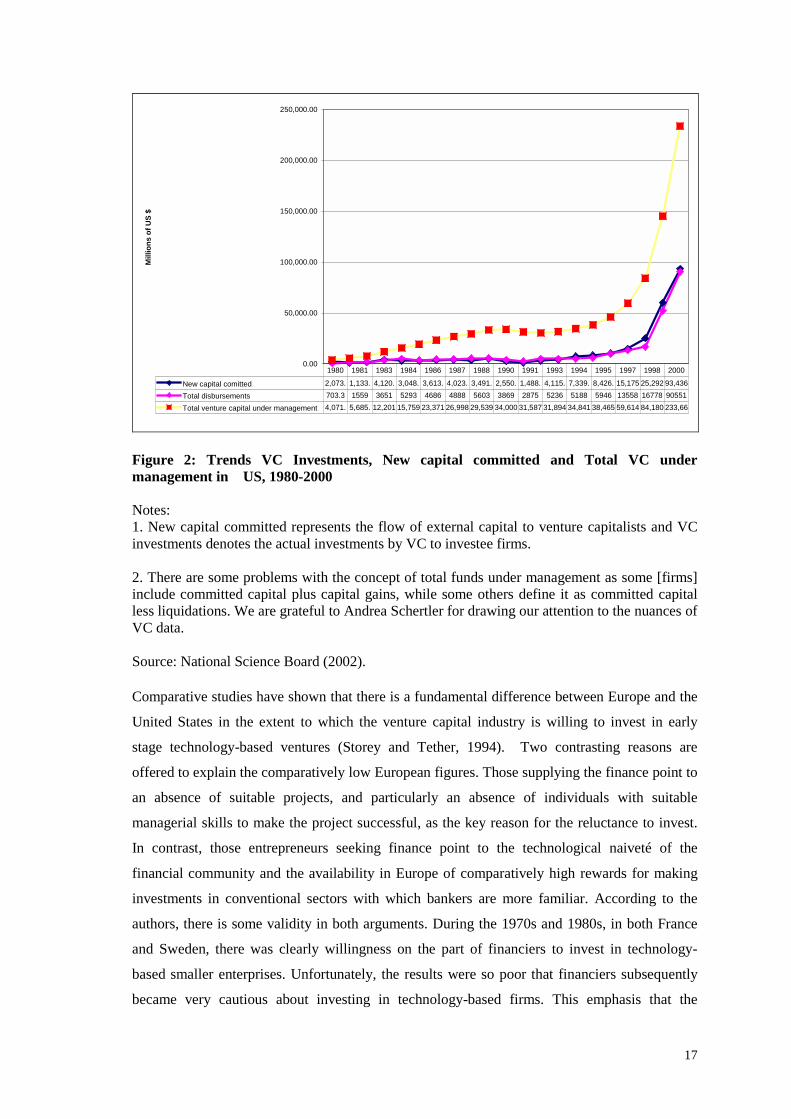
The Asian countries have a much better performance in terms of funding projects at their early
stage (seed and startup). In fact the weighted average ratio of early stage financing to later stage
for all the countries in the sample is 0.48 (Figure 8). Only the ratio for India is greater than unity
implying a preponderance of early stage financing. China is the only other country, which has a
ratio greater than the average. The availability of good quality high-tech projects in India and
China may be an explanation. Also most of the Indian venture capital firms were initially based
on governmental funding though this has changed in the recent period and this helped them to
be really venturesome. This shows, despite its relatively speaking small size, the Asian VC
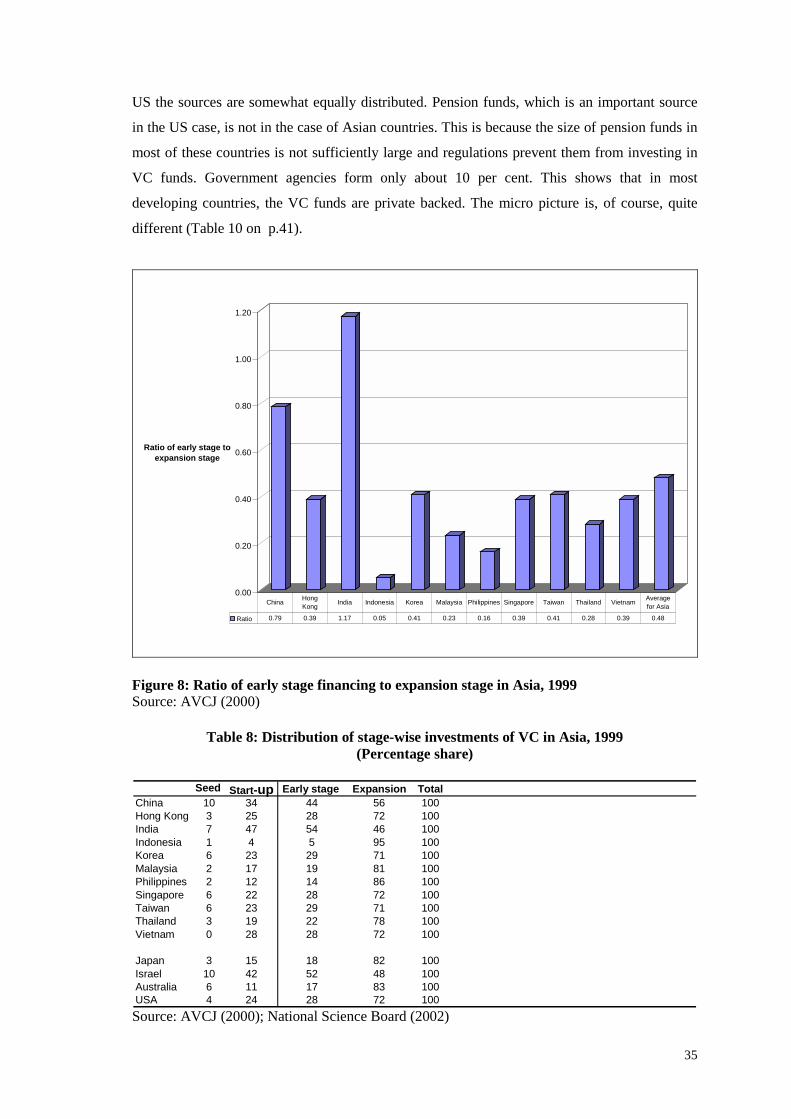
industry is showing signs of sound development. Within the early stage, much of the funding is
towards the startup stage (Table 8) and within the expansion stage (which consists of expansion,
mezzanine (also known as bridge finance), buyout/buy in, turnaround/restructuring); it is the
expansion stage, which accounts for the maximum share. Lack of consistent time series data
does not allow us to track any inter temporal changes in investments across the various
countries.
(c) Source of Funds
In terms of source of funds, the situation in developing Asia is somewhat similar to Japan and
Israel than in the US (Table 9). Corporations account for the single largest share, while in the
35
US the sources are somewhat equally distributed. Pension funds, which is an important source
in the US case, is not in the case of Asian countries. This is because the size of pension funds in
most of these countries is not sufficiently large and regulations prevent them from investing in
VC funds. Government agencies form only about 10 per cent. This shows that in most
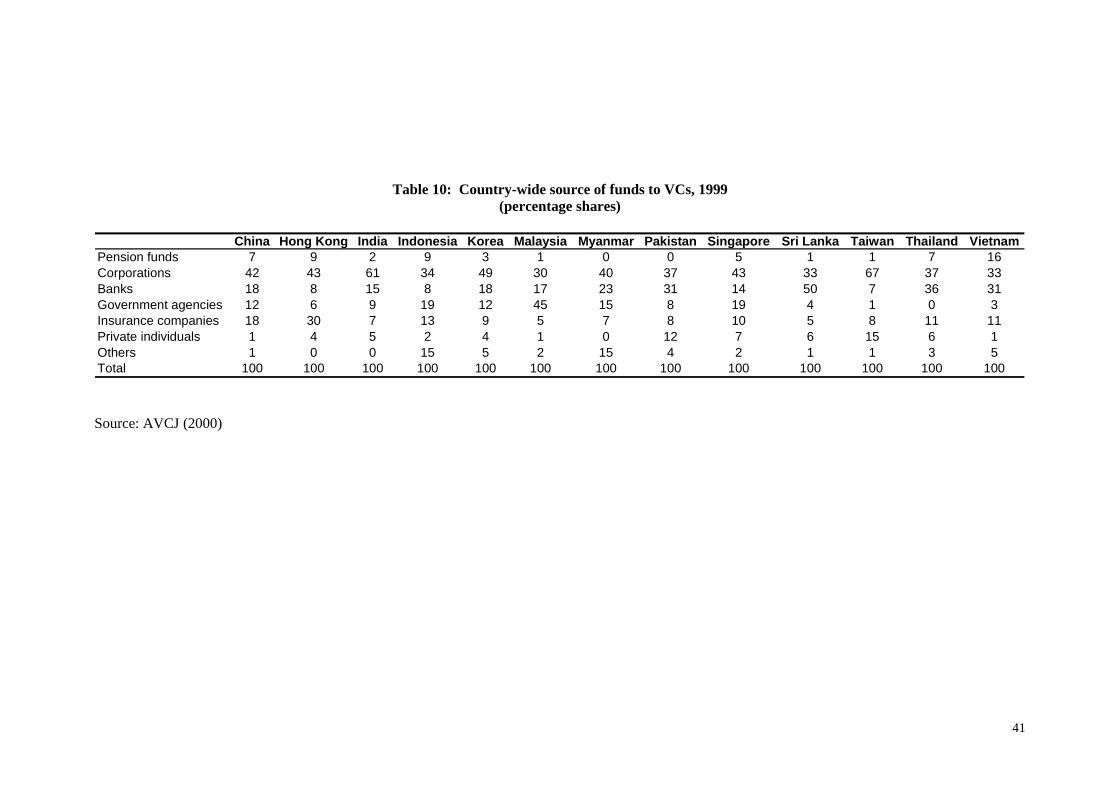
developing countries, the VC funds are private backed. The micro picture is, of course, quite
different (Table 10 on p.41).
0.00
0.20
0.40
0.60
0.80
1.00
1.20
Ratio of early stage to expansion stage
Ratio 0.79 0.39 1.17 0.05 0.41 0.23 0.16 0.39 0.41 0.28 0.39 0.48
China Hong Kong India Indonesia Korea Malaysia Philippines Singapore Taiwan Thailand Vietnam Average
for Asia
Figure 8: Ratio of early stage financing to expansion stage in Asia, 1999Source: AVCJ (2000)
Table 8: Distribution of stage-wise investments of VC in Asia, 1999(Percentage share)
Seed Start-up Early stage Expansion TotalChina 10 34 44 56 100Hong Kong 3 25 28 72 100India 7 47 54 46 100Indonesia 1 4 5 95 100Korea 6 23 29 71 100Malaysia 2 17 19 81 100Philippines 2 12 14 86 100Singapore 6 22 28 72 100Taiwan 6 23 29 71 100Thailand 3 19 22 78 100Vietnam 0 28 28 72 100
Japan 3 15 18 82 100Israel 10 42 52 48 100Australia 6 11 17 83 100USA 4 24 28 72 100Source: AVCJ (2000); National Science Board (2002)

36
Table 9: Source of funds to VC, 1999(Percentage shares)
Developing Asia* Australia Japan Israel USACorporations 47 8 54 39 16Insurance companies 17 7 17 11 11**Banks 13 10 18 22Government agencies 10 13 3 13 0Pension funds 6 55 4 4 18Private individuals 5 6 2 8 19Endowments 0 0 0 0 15Others 2 1 2 3 22***
Total 100 100 100 100 100
Notes: * Weighted average of all the countries, but excludes data on Philippines; ** Refers toboth insurance and banks; *** Includes foreign investors also
Sources: AVCJ (2000); Gompers and Lerner (2001)
Table 11: Geographical breakdown of VC sources, 1999(Percentage shares)
ForeignCountry Domestic
Total Other Asian Non-Asian1. China 28 72 33 39
2. Hong Kong 7 93 16 77
3. India 34 66 6 60
4. Indonesia 42 58 18 40
5. Korea 75 25 5 20
6. Malaysia 51 49 24 25
7. Myanmar 18 82 70 12
8. Pakistan 91 9 0 9
9. Philippines 89 11 10 1
10. Singapore 27 73 35 38
11. Sri Lanka 75 25 6 16
12. Taiwan 85 15 4 11
13. Thailand 35 65 22 43
14. Vietnam 14 86 6 80
15. Australia 89 11 6 5
15. Israel 78 22 3 19
16. Japan 82 18 3 15
Source: AVCJ (2000)
37
It is only in Malaysia, that the government is an important source of funds. Majority of the
capital for the Asian VC companies has emanated from domestic sources itself (Table 11). But
there are some notable exceptions to this like China, Hong Kong, India and Singapore. In these
cases much of the VC has actually originated from Western sources. This shows that intra Asian
investments are quite limited.
Governmental programmes of various sorts have played an important role in establishing and
pump priming the VC industry even in developed countries. A survey of these in the OECD
countries can be found in OECD (1998) and Jeng and Wells (2000). These governmental
schemes vary from providing legal infrastructure and specifically tax exemptions to establishing
funds that invest directly in private equity projects. Among the developing countries in our
sample, there has been explicit governmental support for establishing a VC industry in all the
countries and especially in India and Singapore. A detailed survey of this can be found in Mani
(1997 and 2002).
Apart from the domestic governments of these countries, a major impetus for the establishment
and growth of the VC industry in developing countries have emanated from multilateral
institutions such as the World Bank and one of its affiliates, namely the International Finance
Corporation (Aylward, 1996; Pfeil, 2001). In fact as Mani (1997, p. 232) documents the genesis
of the VC industry in India can be traced to a series of efforts by the World Bank in the 1980s as
part of its 'Industrial Technology Development Project' in India. As part of this project a loan of
$45 million was made available to the government to support four venture capital entities for
financing technologically innovative and growth oriented small enterprises. The government,
however, relent this amount to four state-owned venture capital firms.
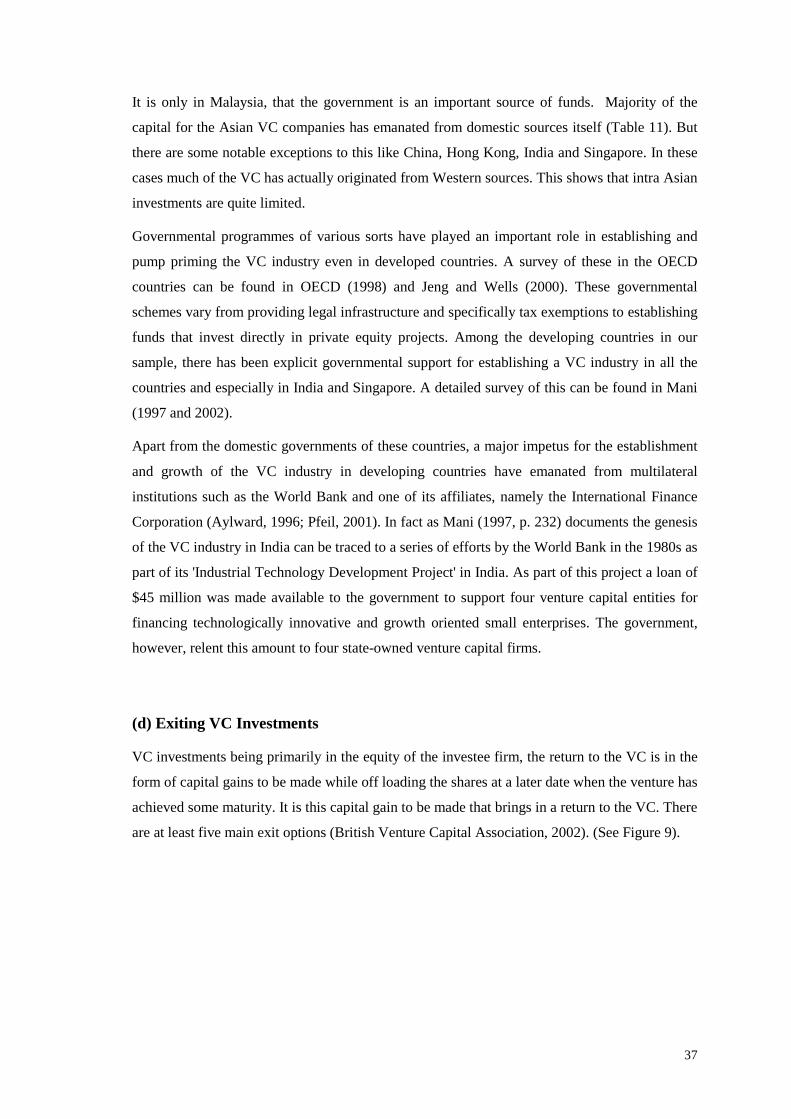
(d) Exiting VC Investments
VC investments being primarily in the equity of the investee firm, the return to the VC is in the
form of capital gains to be made while off loading the shares at a later date when the venture has
achieved some maturity. It is this capital gain to be made that brings in a return to the VC. There
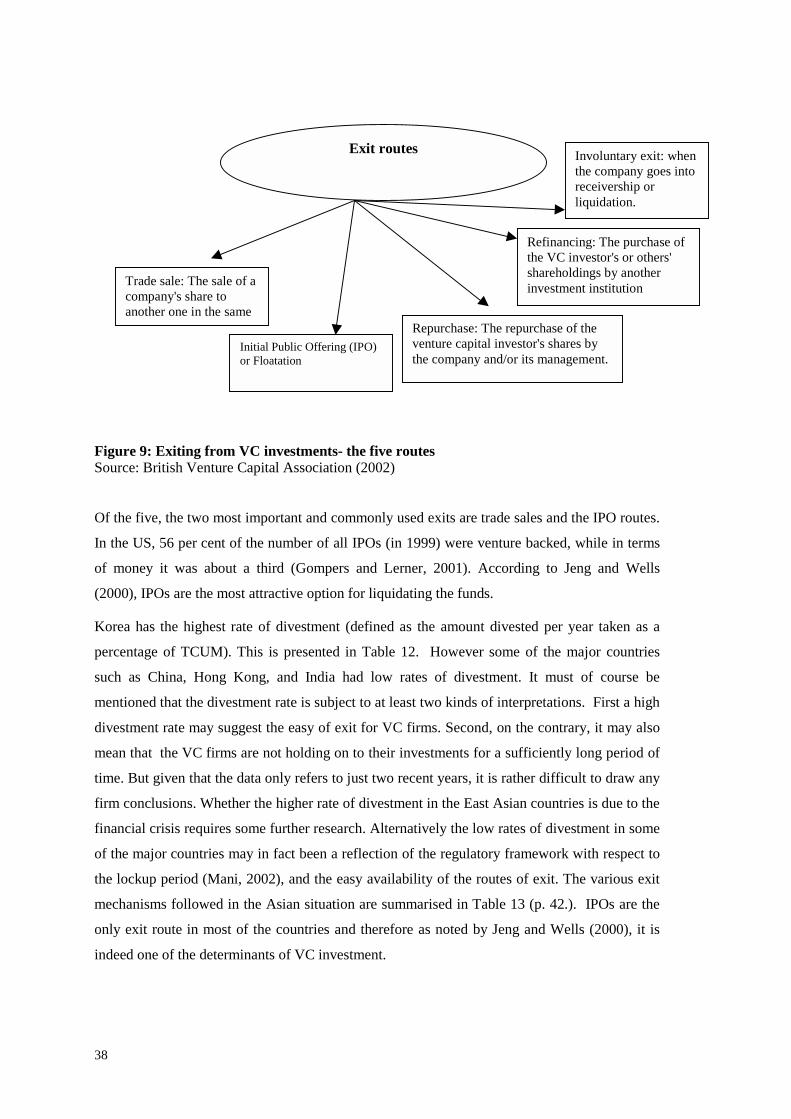
are at least five main exit options (British Venture Capital Association, 2002). (See Figure 9).
38
Figure 9: Exiting from VC investments- the five routesSource: British Venture Capital Association (2002)
Of the five, the two most important and commonly used exits are trade sales and the IPO routes.
In the US, 56 per cent of the number of all IPOs (in 1999) were venture backed, while in terms
of money it was about a third (Gompers and Lerner, 2001). According to Jeng and Wells
(2000), IPOs are the most attractive option for liquidating the funds.
Korea has the highest rate of divestment (defined as the amount divested per year taken as a
percentage of TCUM). This is presented in Table 12. However some of the major countries
such as China, Hong Kong, and India had low rates of divestment. It must of course be
mentioned that the divestment rate is subject to at least two kinds of interpretations. First a high
divestment rate may suggest the easy of exit for VC firms. Second, on the contrary, it may also
mean that the VC firms are not holding on to their investments for a sufficiently long period of
time. But given that the data only refers to just two recent years, it is rather difficult to draw any
firm conclusions. Whether the higher rate of divestment in the East Asian countries is due to the
financial crisis requires some further research. Alternatively the low rates of divestment in some
of the major countries may in fact been a reflection of the regulatory framework with respect to
the lockup period (Mani, 2002), and the easy availability of the routes of exit. The various exit
mechanisms followed in the Asian situation are summarised in Table 13 (p. 42.). IPOs are the
only exit route in most of the countries and therefore as noted by Jeng and Wells (2000), it is
indeed one of the determinants of VC investment.
Exit routes
Trade sale: The sale of acompany's share toanother one in the same
Initial Public Offering (IPO)or Floatation
Repurchase: The repurchase of theventure capital investor's shares bythe company and/or its management.
Refinancing: The purchase ofthe VC investor's or others'shareholdings by anotherinvestment institution
Involuntary exit: whenthe company goes intoreceivership orliquidation.

39
Table 12: Divestment Rate in VCs, 1999
Divestment Rate 1998 Divestment Rate 1999Korea 14.47 13.24Indonesia 2.30 6.41Thailand 5.13 5.36Taiwan 3.24 4.38Philippines 1.43 2.12Singapore 1.13 1.89Sri Lanka 1.71 1.77Malaysia 0.34 0.39India 0.20 0.35China 1.57 0.27Hong Kong 2.73 0.02Vietnam 3.88 0.00Pakistan 0.00 0.00
Australia 5.50 6.51Israel 7.82 9.33Japan 11.89 4.03
Source: AVCJ (2000)
In fact Jeng and Wells (2000) identifies two specific reasons as to why it is an important source
of exit to a VC investor. (i) According to the literature the most attractive option for exit is
through an IPO. A study by Venture Economics (1998) quoted in Jeng and Wells finds that US
$ 1.00 invested in a firm that eventually goes public yields a 195 per cent return for a 4.2 year
average holding period. The same investment in an acquired firm only provides an average
return of 40 per cent over a 3.7 year average holding period; (ii) If regaining control is important
to an entrepreneur, IPOs are the best choice given the fact that the other options such as trade
sales frequently result in loss of control. The empirical work of Black and Gilson (1998)
statistically established, for the first time, a direct positive link between the existence of a well
developed stock market and IPOs and the growth of VC financing, though of course the study
was restricted to the US case. Building on this, Jeng and Wells established the same result for a
group of 21 developed countries over the period 1986-1995. Apart from IPOs, they also
included six other independent variables namely accounting standards, labour market rigidity,
market capitalisation, and GDP growth, availability of private pension funds and government
support programmes. Among all these the IPO variable turned out to be most important
determinant of especially later stage VC investment across the selected countries. Our own
qualitative study (Table 12) shows that this is indeed the likely case in our sample of developing
countries. Since data on country-wide IPOs are not readily available11, we are constrained to
11 However data on the total number and amount of IPOs in five countries, namely Malaysia(since 1998, http://www.klse.com.my/website/listing/ipo1998.htm), Hong Kong (since 1994,http://www.hkex.com.hk/listedco/newlist/1994.xls), Singapore (only for 2002,

40
limit the analysis only to one country, namely India. For India, we relate the rate of growth of
annual VC investments during the period 1993 through 1999 to the corresponding IPOs (actual
subscription of issues by new companies). The results are presented in Figure 9 and it shows a
rather high degree of positive correlation between the two variables, if one omits the two
terminal years of 1993 and 1999. However, more sophisticated tests are required before one can
draw any firm conclusions about the importance of IPOs for the successful growth of VC
financing in developing countries.
-150
-100
-50
0
50
100
150
200
250
300
350
Ann
ual p
erce
ntag
e ch
ange
Rate of Growth of IPOs 251.83 68.54 15.85 -51.79 -27.15 -70.27 -91.38
Rate of Growth of VC 20.71 69.80 46.94 41.61 27.75 -14.75 325.99
1992 1993 1994 1995 1996 1997 1998 1999
Figure 10: Relationship between IPOs and VC Investment in India, 1993-1999Sources: AVCJ (2000); Reserve Bank of India: http://rbi.org.in/sec7/25891.doc?
http://info.sgx.com/webipo.nsf/IPO+By+Closing+Date?OpenView), Taiwan (only for1999, http://www.tse.com.tw/plan/factbook/2000/table2.htm) and S.Korea ( from 1999onwards, http://www.kse.or.kr/eng/list/ncop/listNewCorp.jsp) are available. But in most casethe data merely refers to amount offered and not amounts actually subscribed.
41
Table 10: Country-wide source of funds to VCs, 1999(percentage shares)
China Hong Kong India Indonesia Korea Malaysia Myanmar Pakistan Singapore Sri Lanka Taiwan Thailand VietnamPension funds 7 9 2 9 3 1 0 0 5 1 1 7 16Corporations 42 43 61 34 49 30 40 37 43 33 67 37 33Banks 18 8 15 8 18 17 23 31 14 50 7 36 31Government agencies 12 6 9 19 12 45 15 8 19 4 1 0 3Insurance companies 18 30 7 13 9 5 7 8 10 5 8 11 11Private individuals 1 4 5 2 4 1 0 12 7 6 15 6 1Others 1 0 0 15 5 2 15 4 2 1 1 3 5Total 100 100 100 100 100 100 100 100 100 100 100 100 100
Source: AVCJ (2000)

42
Table 13: Profile of Exit Routes for VC firms in Asia, 1998
Country MarketCapitalisation
(Millions ofUS $)
Size of the IPOMarket (Millions
of US $)
Remarks
1. China 284, 766(853)*
Exits in China remain problematic, only one stock exchange, handful of Chinese companies arelisted on the Hong Kong stock exchange and on NASDAQ.
2. Hong Kong IPOs and trade sales constitute the most frequently used exit routes. Two stock exchanges, thesecond one being the Growth Enterprise Market launched in 1999.
3. India 64,498(5860) 1,796 (1575)** There are 22 stock exchanges.An OTC was established in 1992. Some high tech companies arelisted on NASDAQ.
4. Indonesia 9,709 (287) The Pakades (government assisted) guidelines outline multiple divestment avenues for VC firms.Exits can be made via the capital market, private placements and the sale of shares. An OTC wasestablished in 1994
5. Korea 137,859(748) Trade sales and IPOs are the viable routes. OTC (Korean Securities Automated Quotation System)was established in 1996
6. Malaysia 28,889(736) A new OTC (MESDAQ) was established in 1999, but attracted only one listing
7. Pakistan 5,418(773) IPO is the only route.
8. Philippines 9,992(221) Trade sales and IPOs are the viable routes. Companies prefer regional exchanges.9. Singapore 94,469 IPOs and trade sales . An OTC (SESDAQ) was established in 1986. Two Singaporean companies
aere listed on the NASDAQ.10. Sri Lanka 281 (233) IPOs, buy-back of shares and the sale of shares to third parties are the main routes.
11. Taiwan 884,698 (437) IPOs is the main exit route. More than 200 venture backed Taiwanese companies are listed on theUS OTC market
12. Thailand 20,734(418) The main exit route is trade sales. An OTC was established in 1995. About 400 firms are listed (as onDecember 31, 1999). The other exchange, the Securities Exchange of Thailand (SET)also allowed thefloatation of Vietnamese companies and Thai-Vietnamese joint ventures. The main exit route, however, istrade sales and not IPOs.
13. Japan 2,495,75714. Australia 874,28315. Israel 39,628
Notes: * Figures in parentheses indicate the number of companies that are listed on the stock exchange; ** Figures in brackets indicate the size of market capitaluisation in millions of US $ of India's OTC exchange
Source: AVCJ (2000); http://www.sebi.gov.in/pmd/aprmar01.htm; International Finance Corporation (1999)

43
(e) Human resource requirement for venture capital
VC as we have noted is a specialised form of financing technology-based ventures. So the
human resource requirement for this sort of an agency is much more than other forms financial
institutions such as normal commercial and development banks. Venture funds typically look
for talented managers who can spot clever new ideas around them. It is not difficult to
understand that without these business leaders ideas remain untapped and founds dormant. The
sophisticated nature of the human resource requirement for the VC industry may easily be
gleaned from the five different stages in typical VC investment process (Figure 11).
Figure 11: The five stages in a typical VC investment processSource: AVCJ (2000)
Given the fact that most countries are new to this industry, lack of availability of VC
professionals can be an important detriment to the successful growth of the industry. In
fact, as shown by Table 14, the density of VC professionals per 10, 000 labour force is
extremely low: Singapore and Korea are the only two countries which have a
reasonable number. Even in countries like India, there have been serious shortages of
Stage 1: Initial evaluation andnegotiation: Following submission ofthe business plan, the venturecapitalists evaluate the proposal usinga number of pre determined criteria
Step 2: Due diligence: This is a process ofinvestigating the business to assess thefeasibility of the business proposals
Step 3: Final negotiation andcompletion: Using the data andinsight gained during due diligence,the venture capitalist will carry outa "valuation" of the company
Step 4: Monitoring: Most oftenthe VC will be given a seat onthe investee company's Board ofDirectors and will monitor themajor events in the company'sbusiness from the vantage point
Step 5: Exits: The VChas to decide on theright route of exit thatwill result in maximumreturns.

44
VC personnel especially at steps 2 and 312. So this is another aspect which may require
some governmental intervention to create an adequate pool of VC professionals.
Table 14: Density of VC professionals (per 10,000 labour force)
1998 1999Total labour
forceTotal number
of VCprofessionals
Densityof VC
professionals
Total labourforce
Totalnumberof VC
professionals
Density of VCprofessionals
China 744,065,792 494 0.007 750,903,424 609 0.008
India 430,076,416 212 0.005 440,901,696 247 0.006
Indonesia 96,747,224 189 0.020 99,370,376 189 0.019
Korea 23,354,290 409 0.175 23,757,006 435 0.183
Malaysia 9,049,440 59 0.065 9,333,810 78 0.084
Myanmar 23,477,220 6 0.003 23,865,132 6 0.003
Pakistan 48,685,340 6 0.001 50,141,880 9 0.002
Philippines 30,387,212 44 0.014 31,114,466 60 0.019
Singapore 1,936,866 331 1.709 1,943,106 453 2.331
Sri Lanka 8,093,318 25 0.031 8,258,475 28 0.034
Thailand 35,935,892 356 0.099 36,328,216 381 0.105
Vietnam 39,178,240 28 0.007 39,765,196 30 0.008
Japan 67,755,760 1786 0.264 67,968,088 1711 0.252
Australia 9,525,508 369 0.387 9,654,203 421 0.436
Source: AVCJ (2000); World Bank (2001)
(f) Index of VC Development
We are now in a position to arrive at a summary measure which captures the extent to which a
country's VC institutions are developed to service technology-based. This is called the index of
VC development (VCDI). It consists of two separate indices combined into one. The two
separate indices are (i) Finance Index (FI); and (ii) Technology Index (TI). The FI captures the
extent to which the VC institutions in a particular country finance early stage ventures, namely
at the seed and startup stage. It is computed by taking the relative share of this stage in the total
12 Analysing the Indian situation with respect to the availability of VC professionals, McKinsey,the management consultancy firm : "We have reviewed what's going wrong here (in India) andone issue recurs: we just can't hire quickly enough. To get world class valuations, we needworld class people. But we can't find enough talented leaders to start and run a company. This isthe biggest single barrier [for VCs]." See Financial Times,http://specials.ft.com/ln/ftsurveys/industry/sc23446.htm.
45
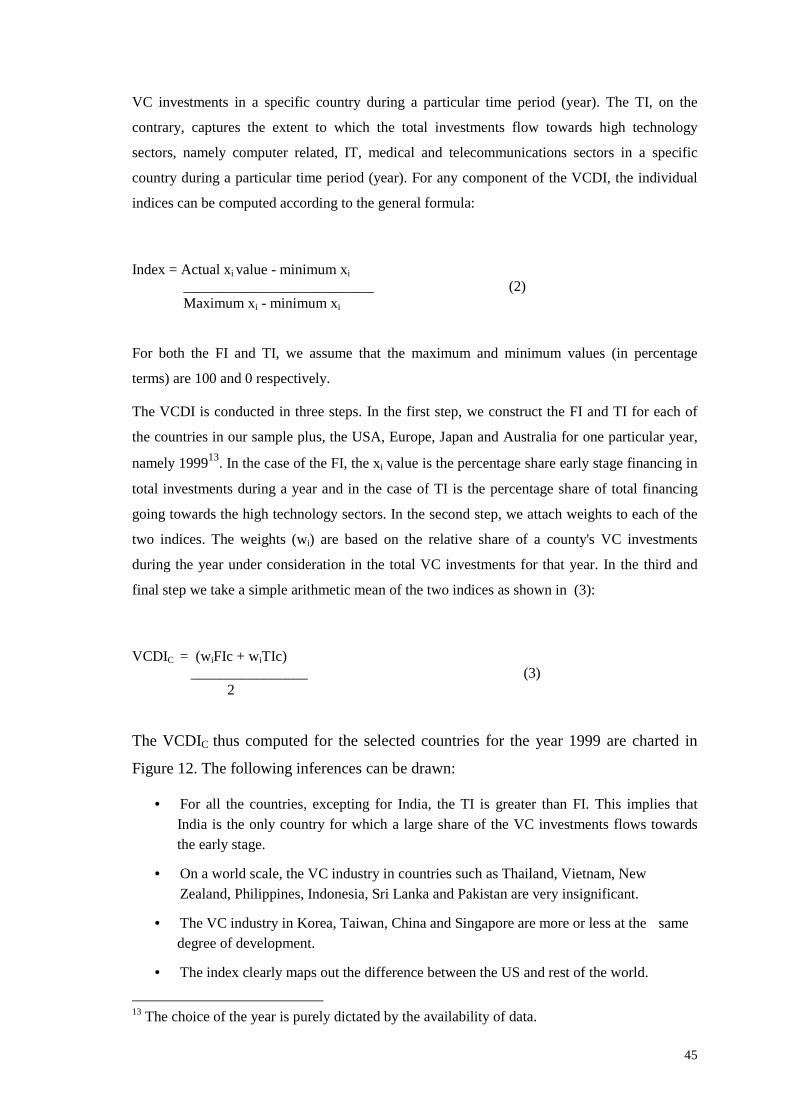
VC investments in a specific country during a particular time period (year). The TI, on the
contrary, captures the extent to which the total investments flow towards high technology
sectors, namely computer related, IT, medical and telecommunications sectors in a specific
country during a particular time period (year). For any component of the VCDI, the individual
indices can be computed according to the general formula:
Index = Actual xi value - minimum xi __________________________ (2) Maximum xi - minimum xi
For both the FI and TI, we assume that the maximum and minimum values (in percentage
terms) are 100 and 0 respectively.
The VCDI is conducted in three steps. In the first step, we construct the FI and TI for each of
the countries in our sample plus, the USA, Europe, Japan and Australia for one particular year,
namely 199913. In the case of the FI, the xi value is the percentage share early stage financing in
total investments during a year and in the case of TI is the percentage share of total financing
going towards the high technology sectors. In the second step, we attach weights to each of the
two indices. The weights (wi) are based on the relative share of a county's VC investments
during the year under consideration in the total VC investments for that year. In the third and
final step we take a simple arithmetic mean of the two indices as shown in (3):
VCDIC = (wiFIc + wiTIc) ________________ (3) 2
The VCDIC thus computed for the selected countries for the year 1999 are charted in
Figure 12. The following inferences can be drawn:
• For all the countries, excepting for India, the TI is greater than FI. This implies thatIndia is the only country for which a large share of the VC investments flows towardsthe early stage.
• On a world scale, the VC industry in countries such as Thailand, Vietnam, New Zealand, Philippines, Indonesia, Sri Lanka and Pakistan are very insignificant.
• The VC industry in Korea, Taiwan, China and Singapore are more or less at the samedegree of development.
• The index clearly maps out the difference between the US and rest of the world.
13 The choice of the year is purely dictated by the availability of data.

46
0.0000 0.0500 0.1000 0.1500 0.2000 0.2500 0.3000 0.3500 0.4000
Indices
USA
Europe
Japan
Hong Kong
Korea
Taiwan
Israel
China
Singapore
Australia
India
Malaysia
Thailand
Vietnam
New Zealand
Philippines
Indonesia
Sri Lanka
Pakistan
TI FI VCDI
Figure 12: Index of VC Development, 1999Source: Appendix 2
An year- wise computation of the VCDI will allow us to chart the growth trajectory of the VC
industry in a specific country compared to rest of the world especially as a source finance to
technology-based firms in their early stage.
47
CONCLUSIONS
The role of VC as an input to innovation is now a more or less accepted fact, though the
empirical substantiation for this statement has come only from the US. However, our present
analysis has sought to extend this line of reasoning to developing countries. Although uneven in
its spread across of countries, the concept of VC is now fast spreading to most countries and
especially to those countries which have well developed exit mechanisms such as reasonably
well functioning stock market. An examination of the relationship between VC investments and
the growth of the high technology sector shows a positive relationship between the two. This
macro exercise has been further substantiated by a micro one by taking the specific case of
India, which has emerged as a successful exporter of computer software. This is a hypothesis,
which needs further empirical scrutiny. The successful growth of the industry also requires the
availability of adequate quantity of VC professionals and an avenue such as IPOs for a proper
exit. The study concludes by constructing an index of VC development, which allows one to
benchmark the degree of VC development in a country with that of the best practice. Such a
comparative analysis of performance should aid policy makers in redirecting the efforts of their
local venture capital institutions towards the enhancement of innovative activities in new
technologies.
Acknowledgements
We thank Djono Subagjo and Ad Notten for their help in writing this paper. Comments on an
earlier draft by Andrea Schertler, Michael Stolpe and Dilek Cetindamar are gratefully
acknowledged. and However, we are solely responsible for any errors or shortcomings that may
still remain and the views expressed in the paper are those of the authors and do not necessarily
reflect the views of the United Nations.


49
REFERENCES
Asian Venture Capital Journal, AVCJ (2000), The 2001 Guide To Venture Capital inAsia, Hong Kong: Asian Venture Capital Journal.
Aylward, Anthony ( 1998), Trends in Venture Capital Finance in DevelopingCountries, IFC Discussion Paper No: 36,http://www.ifc.org/economics/pubs/dp36/dp36.pdf.
Bank of England (2001), Financing of Technology-Based Small Firms,http://www.bankofengland.co.uk/hightech2001.pdf.
Bartzokas, Anthony (2001) Financial Markets and Technological Change: Patterns ofTechnological and Financial Decisions by Manufacturing Firms in Southern Europe ,UNU/ INTECH Discussion paper, 2001-4.
Bartzokas, Anthony and Morris Teubal (2002) Introduction to a Special issue on thePolitical Economy of Innovation Policy Implementation in Industrialising Countries,Journal of the Economics of Innovation and New Technology, (Vol. XI, No. 3 and 4, pp.271-4.
Baskar, Vijay M and Girija Krishna Swamy (2002), Determinants of Dynamism in SoftwareClusters in Developing Countries: A Study of Bangalore, Southern India. Bangalore: IndianInstitute of Information Technology.
Black, B., Gilson, R., (1998), ' Venture capital and the structure of capital markets:banks versus stock markets, Journal of Financial Economics, Vol. 47, pp.
British Venture Capital Association (2002), A Guide to Venture Capital, London:British Venture Capital Association.
Dossani, Rafiq and Martin Kenney (2002), 'Creating an Environment for VentureCapital in India', World Development, Vol.30, No: 2, pp. 227-253.
European Commission (2000), Funding of new technology-based firms in commercialbanks in Europe, http://www.cordis.lu/finance/src/publicat.htm.
Gompers, Paul and Josh Lerner (2001), 'The Venture Capital Revolution', Journal ofEconomic Perspectives, Vol. 15, pp. 145-168.
Hall, Bronwyn (2002, forthcoming), 'The Financing of Research and Development',Oxford Review of Economic Policy, (Summer).
Hall, Bronwyn and John Van Reenen (2000), 'How effective are fiscal incentives forR&D ? A review of the evidence', Research Policy, Vol. 29, pp. 449-469.

50
Hurwitz, Seth L., (1999), The Japanese Venture Capital Industry, MIT Japan Program,Working Paper Series, MITJP 99-04.
International Finance Corporation (1999)Emerging Stock Markets Factbook 1999,Washington, D.C: International Finance Corporation.
Jeng, Leslie A and Philippe C.Wells (2000), 'The determinants of venture capitalfunding: evidence across countries', Journal of Corporate Finance, Vol. 6, pp. 241-289.
Kortum, Samuel and Josh Lerner (2000), 'Assessing the contribution of venture capitalto innovation', RAND Journal of Economics, Vol. 31, No: 4, pp. 674-692.
Kuemmerle, Walter (2001), ' Comparing catalysts of change:evolution and institutionaldifferences in the venture capital industries in the U.S., Japan and Germany' in RobertA. Burgleman and Henry Chesbrough (eds. ), Comparative Studies of TechnologicalEvolution, New York: Jai, pp. 227-261.
Lockett, Andy, Gordon, Murray and Mike Wright (2002), ' Do UK venture capitalistsstill have a bias against investment in new technology firms', Research Policy, Vol. 31,Issue 6, pp. 1009-1030.
Mani, Sunil (1997), ‘Financial barriers to domestic technology development andventure capital: evidence from India”, Science, Technology and Development, Vol. 15,No. 2 and 3, pp. 227- 40.
Mani, Sunil (2000), Exports of high technology products from developing countries: isit real or a statistical artifact?, Maastricht: United Nations University, Institute forNew Technologies, Discussion Paper: 2001,http://www.intech.unu.edu/publications/index.htm.
Mani, Sunil (2002), Government, Innovation and Technology Policy, An InternationalComparative Analysis, Cheltenham UK and Nothampton, MA, USA: Edward Elgar.
Mayer, Colin (2001), ' Financing the New Economy: financial institutions and corporategovernance', Information Economics and Policy, Vol. 1, pp.
Millar, Robert R (2000), Venture Capital in a Transition Economy-A Case Study ofThree Hungarian Funds, Washington, D,.C.: International Finance Corporation.
National Science Board (2002), National Science Board (2000), Science andEngineering Indicators: 2002, NSB 02-1, Arlington, VA; NSF.
OECD (1998), Government Venture Capital for Technology-based Firms,OCDE/GD(97)201, Paris: OECD.
Pfeil, Andreas (2000), 'Venture capital, New ways of financing technology innovation',Background Paper to the Human Development Report 2001, New York: UNDP.

51
Rausch, Lawrence (1998), Venture Capital Investment Trends in the United States andEurope, Division of Science Resources Studies, Directorate for Social, Behavioral, andEconomic Sciences, NSF 99-303.
Schertler, Andrea (2001), Venture Capital in Europe's Common Market: A QuantitativeDescription, Working Paper No; 01-4, EIFC Technology and Finance Series,Maastricht: UNU/INTECH.
Singh, Ajit, Alaka Singh and Bruce Weisse (2000), Information Technology, VentureCapital and the Stock Market, Background Paper for the World Employment Report2000-2001, Geneva: International Labour Organisation.
Storey, David.J and Bruce Tether (1994), A Review of Empirical Knowledge anassessment of statistical data on the economic importance of New Technology BasedFirms in Europe, http://www.cordis.lu/eims/src/eims-r31.htm
Storey, David.J and Bruce Tether (1998), 'Public policy measures to support newtechnology-based firms in the European Union', Research Policy, Vol. 26, pp. 1037-1057.
World Bank (2001), World Development Indicators 2001, Washington, D.C: WorldBank.


53
APPENDIX 1: INDUSTRY CLASSIFICATION ACCORDING TO THE AVCJ
Manufacturing – Light
Furniture
Leather products
Lumber & wood products
Office equipment
Precision instruments
Tobacco
Materials – other
Manufacturing – other light
Media
Information services
Magazines and periodicals
Movies – production
Newspapers
Television and radio stations
Theatres
Medical/Biotechnology
Doctors and services
Drugs – OTC/prescription
Pharmaceuticals
Hospital management
Home healthcare
Diagnostic/therapeutic products
Mining and metals
Iron and coal
Natural resources – other
Oil & gas – exploration and development
Oil & gas – refining and retail
Precious metals
Retail/Wholesale
Automotive
Books and printed material
Clothing and apparel
Eating and drinking
Electronics
Energy – gas, oil, and alternative
Food and drugs
Wholesale – trade
Wholesale – consumer
General merchandise
Specialty retail – other

54
Services – Non-financial
Advertising/public relations
Business services
Consulting
Educational
Engineering
Legal
Medical
Personal services
Temporary help
Services – other non-financial
Telecommunications
Cable
Cellular and wireless
Phones and related equipment
Satellite
Service provider
Textile and clothing
Textiles – manufacturing
Textiles – raw materials
Transportation/Distribution
Airlines
Air cargo
Buses
Cabs and cars
Couriers
Pipelines
Railroad
Rockets and orbital
Shipping
Trucking
Warehousing
Travel/hospitality
Airport services
Hotels and lodging
Restaurants and pubs
Travel agencies
Tourism services – other
Utilities
Electric
Gas
Water

55
APPENDIX 2: INDEX OF VC DEVELOPMENT ACROSS COUNTRIES, 1999
T I F I V C D IU S A 0 .3 7 4 0 0 .1 1 3 8 0 .2 4 3 9E u r o p e 0 .0 6 7 3 0 .0 2 7 6 0 .0 4 7 4J a p a n 0 .0 4 0 7 0 .0 1 6 9 0 .0 2 8 8H o n g K o n g 0 .0 3 2 9 0 .0 2 1 0 0 .0 2 7 0K o r e a 0 .0 2 1 7 0 .0 1 1 3 0 .0 1 6 5T a iw a n 0 .0 2 3 6 0 .0 0 8 9 0 .0 1 6 3Is r a e l 0 .0 1 7 5 0 .0 1 0 5 0 .0 1 4 0C h in a 0 .0 1 1 0 0 .0 1 5 7 0 .0 1 3 3S in g a p o r e 0 .0 1 6 4 0 .0 0 8 3 0 .0 1 2 4A u s t r a l ia 0 .0 0 8 7 0 .0 0 3 7 0 .0 0 6 2In d ia 0 .0 0 4 1 0 .0 0 4 5 0 .0 0 4 3M a la y s ia 0 .0 0 2 0 0 .0 0 0 7 0 .0 0 1 3T h a i la n d 0 .0 0 0 9 0 .0 0 0 6 0 .0 0 0 8V ie tn a m 0 .0 0 0 4 0 .0 0 0 8 0 .0 0 0 6N e w Z e a la n d 0 .0 0 0 8 0 .0 0 0 4 0 .0 0 0 6P h i l ip p in e s 0 .0 0 0 7 0 .0 0 0 2 0 .0 0 0 5In d o n e s ia 0 .0 0 0 8 0 .0 0 0 1 0 .0 0 0 4S r i L a n k a 0 .0 0 0 2 0 .0 0 0 2 0 .0 0 0 2P a k is ta n 0 .0 0 0 0 0 .0 0 0 1 0 .0 0 0 0
Source: Computed from AVCJ (2000)


57
THE UNU/INTECH DISCUSSION PAPER SERIES
# 2002-4 Institutional Support for Investment in New Technologies: The Role of VentureCapital Institutions in Developing Countries By Sunil Mani and Anthony Bartzokas,May 2001
# 2002-3 Manufacturing Response in a National system of Innovation: Evidence from theBrewing Firms in Nigeria By Banji Oyelaran-Oyeyinka, April 2001
# 2002-2 Prospects for the Digital Economy in South Africa: Technology, Policy, People, andStrategies By Derrick L. Cogburn & Catherine Nyaki Adeya, April 2001
# 2002-1 TRIPS and Capability Building in Developing Economies By Rajah Rasiah,March 2001
# 2001-11Government, Innovation and Technology Policy, An Analysis of the BrazilianExperience During the 1990s By Sunil Mani, December 2001
# 2001-10Innovation Systems, Institutional Change and the New Knowledge Market:Implications for Third World Agricultural Development By Norman Clark,December 2001
# 2001-9 Working with the Market: The Israeli Experience of Promoting R&D in the EnterpriseSector and the Lessons for Developing Countries By Sunil Mani, December 2001
# 2001-8 Conditions for Successful Technology Policy in Developing Countries– LearningRents, State Structures, and Institutions By Ha-Joon Chang Ali Cheema,December 2001
# 2001-7 Technological Change and Corporate Strategies in the Fertiliser Industry By AnthonyBartzokas, October 2001
# 2001-6 A Framework for Policy-Oriented Innovation Studies in Industrialising CountriesBy Anthony Bartzokas and Morris Teubal, September 2001
# 2001-5 Networks and Linkages in African Manufacturing Cluster: A Nigerian Case StudyBy Banji Oyelaran-Oyeyinka, September 2001
# 2001-4Financial Markets and Technological Change: Patterns of Technological and FinancialDecisions by Manufacturing Firms in Southern Europe By Anthony Bartzokas,August 2001
# 2001-3 Role of Government in Promoting Innovation in the Enterprise Sector An Analysis ofthe Indian Experience By Sunil Mani, April 2001
# 2001-2 Government and Innovation Policy An Analysis of the South African Experiencesince 1994 By Sunil Mani, February 2001
# 2001-1 Firm Size, Technological Capabilities and Market-Oriented Policies in MauritiusBy Ganeshan Wignaraja, February 2001
# 2000-9 Policy Instruments for Stimulating R&D in the Enterprise Sector: The ContrastingExperiences of Two MNC Dominated Economies from Southeast Asia.By Sunil Mani, December 2000.
# 2000-8 Industrialisation Meets Globalisation: Uncertain Reflections on East Asia Experience.By Larry Westphal, October 2000.

58
# 2000-7 The Dynamics of Technological Learning in Industrialisation. By Linsu Kim,October 2000.
# 2000-6 The Policy Relevance of Innovation Studies. By Anthony Bartzokas, October 2000.
# 2000-5 Local Clusters, Innovation Systems and Sustained Competitiveness. By Lynn Mytelka& Fulvia Farinelli, October 2000.
# 2000-4 Korea’s Innovation System: Challenges and New Policy Agenda. By Joonghae Suh,July 2000.
# 2000-3 Exploring the Challenges and Opportunities for Africa in the Information Economy.By Derrick L. Cogburn and Catherine Nyaki Adeya, July 2000.
# 2000-2* Special Series of UNU/INTECH Discussion Papers: Information Revolution andPolicy Implications for Developing Countries
• #2000-2 Download the full series (274 pages, 620KB) or download your choice of theindividual papers listed below:
• #2000-2a Charles Cooper, “Some Themes for the Workshop: An Outline for PolicyAnalysis”
• #2000-2b Constantine Vaitsos, “Policy Agenda for the Information Revolution andExclusion Phenomena in Developing Countries”
• #2000-2c Shulin Gu and W. Edward Steinmueller, “National Innovation Systems andthe Innovative Recombination of Technological Capability in Economic Transition inChina: Getting Access to the Information Revolution”
• #2000-2d Carlos M. Correa, “Implications of Intellectual Property Rights for the Accessto and Use of Information Technologies in Developing Countries
• #2000-2e Cecilia Ng Choon Sim, “Making Women’s Voices Heard: TechnologicalChange and Women’s Employment with Special Reference to Malaysia”
• #2000-2f Ludovico Alcorta, “The Information Revolution and Economic and SocialExclusion: The Experiences of Burkina Faso, South Africa and Tanzania”
# 2000-1 Exports of High Technology Products from Developing Countries: Is it Real or aStatistical Artifact. By Sunil Mani, May 2000.
# 9903 Implications of National Innovation Systems for Developing Countries--ManagingChange and Complexity in Economic Development. By Gu Shulin, November 1999.
# 9902 Public Innovation Policies and Developing Countries In a Phase of EconomicLiberalisation. By Sunil Mani, October 1999.
# 9901 The Determinants of Firm-level Technological Performances - A Study on the IndianCapital Goods Sector. By Mohan Babu, September 1999.
# 9805 Flexible Automation and Location of Production in Developing Countries. ByLudovico Alcorta, May 1998.
# 9804 Foreign Firms and Technology Transfer Knowledge Spillovers to IndianManufacturing Firms. By Vinish Kathuria, January 1998.
# 9803 The Experience of Technological Collaborations by Mercosur Companies. ByLudovico Alcorta, Guilherme Ary Plonski and Celso Augusto Rimoli, January 1998.
# 9802 The North-South Dimension of the Environment and Cleaner Technology Industries.By Jonathan R. Barton, January 1998.
59
# 9801 Environmental Regulation and International Competitiveness: A Review of Literatureand Some European Evidence. By Rhys Jenkins, January 1998.
# 9707 Inter-Firm Technological Cupertino Effects of Absorptive Capacity, Firm-Size andSpecialisation. By Frederico Rocha, December 1997.
# 9706 Technology Trends in Pollution-Intensive Industries: A Review of Sectoral Trends.By Anthony Bartzokas and Masaru Yarime, December 1997.
#9705 The World Market for Telematics Applications to Education: Challenges andOpportunities for Industrialised and Developing Countries. By Maria Bastos,November 1997.
#9704 Multinational Enterprises and export-Oriented Industrialisation in the Host Countries:An Empirical Analysis for the US and Japanese Affiliates. By Nagesh Kumar,September 1997.
#9703 Technology Acquisition, De-regulation and Competitiveness: A Study of IndianAutomobile Industry. By Krishnan. Narayanan, September 1997.
#9702 Technology Generation and Technology Transfers in the World Economy: RecentTrends and Implications for Developing Countries. By Nagesh Kumar, June 1997.
#9701 China's National Innovation System Approach to Participating in InformationTechnology: The Innovative Recombination of Technological Capability. By GuShulin and Edward Steinmueller, May 1997.
#9606 Foreign Direct Investments and Technology Transfers in Development: A Perspectiveon Recent Literature. By Nagesh Kumar, August 1996.
#9605 Toward an Analytical Framework for National Innovation Systems. By Gu Shulin,April 1996.
#9604 EST (Environmentally Sound Technologies) from the West - Asymmetry, Regimesand Polish Policy Implementation. By Mikael Sandberg, April 1996.
#9603 Environmentally Sound Technology: Is Poland Overcoming Soviet-Type LearningBarriers? By Mikael Sandberg, April 1996.
#9602 Multinational Enterprises, New Technologies and Export-Oriented Industrialisation inDeveloping Countries: Trends and Prospects. By Nagesh Kumar, January 1996.
#9601 The Relevance of Environmental Legislation for the Transfer of EnvironmentallySound Technology: The Tanzanian Experience. By Yvonne Ruijters, January 1996.(now only available as a Working Paper)
#9516 Changing Character of Foreign Direct Investment from Developing Countries: CaseStudies from Asia. By Nagesh Kumar, December 1995.
#9515 The Relevance of Environmental Legislation for the Transfer of EnvironmentallySound Technology: The Mexican Experience. By Yvonne Ruijters, December 1995.
#9514 The Implications of New Organisational Techniques for Developing Countries. ByRaphael Kaplinsky, 1995.
#9513 Technology, Manufactured Exports and Competitiveness. By Charles Cooper, 1995.
#9512 Does New Technology bode well for Working Women? An Evaluation and analysis.By Swasti Mitter, 1995.
#9511 Information and Communication Technologies: Growth, Competitiveness, and Policyfor Developing Nations. By Edward Steinmueller and Maria-Inês Bastos, 1995.

60
#9510 Technological Change and Dual Economies. By Charles Cooper, 1995.
#9509 Innovation Systems and Technological Specialisation in Latin America and theCaribbean. By Ludovico Alcorta and Wilson Peres, October 1995.
#9508 The Impact of Industrial Automation on Industrial Organisation: Implications forDeveloping Countries' Competitiveness. By Ludovico Alcorta, October 1995.
#9507 International Linkages, Technology and Exports of Developing Countries: Trends andPolicy Implications. By Nagesh Kumar, August 1995.
#9506 Technological Upgrading, Manufactured Exports and Optimal Accumulation. ByCharles Cooper and Roy Turner, September 1995.
#9505 What Hope can Democracy bring to S&T Policy Making in Latin America?. ByMaria-Inês Bastos, June 1995.
#9504 Industrialisation, Liberalisation and Two Way Flows of Foreign Direct Investment:The Case of India. By Nagesh Kumar, June 1995. [same as article published inEconomic and Political Weekly]
#9503 Telecommunication Industry in Brazil: Public-Private Relationship and TechnologyDevelopment. By Maria-Inês Bastos, April 1995.
#9502 New Technologies, Scale and Scope, and Location of Production in DevelopingCountries. By Ludovico Alcorta, March 1995.
#9501 Intellectual Property Protection, Market Orientation and Location of Overseas R&DActivities by Multinational Enterprises. By Nagesh Kumar, March 1995.


![VENTURE CAPITAL FOR SUSTAINABILITY 2007 REPORT [2007] Venture Capital... · growing sector as Venture Capital for Sustainability ... Venture Capitalists’ stake in ... Venture Capital](https://img.pdfslide.us/doc/110x75/5a7926b77f8b9a00168dc540/venture-capital-for-sustainability-2007-2007-venture-capitalgrowing-sector.jpg)