Embed Size (px)
Citation preview
U.S. Department of the InteriorU.S. Geological Survey
Open-File Report 2006-1284
Prepared in cooperation with the Southern Nevada Water Authority and the Bureau of Reclamation
Physical and Chemical Water-Quality Data from Automatic Profiling Systems, Boulder Basin, Lake Mead, Arizona and Nevada, Water Years 2001–04

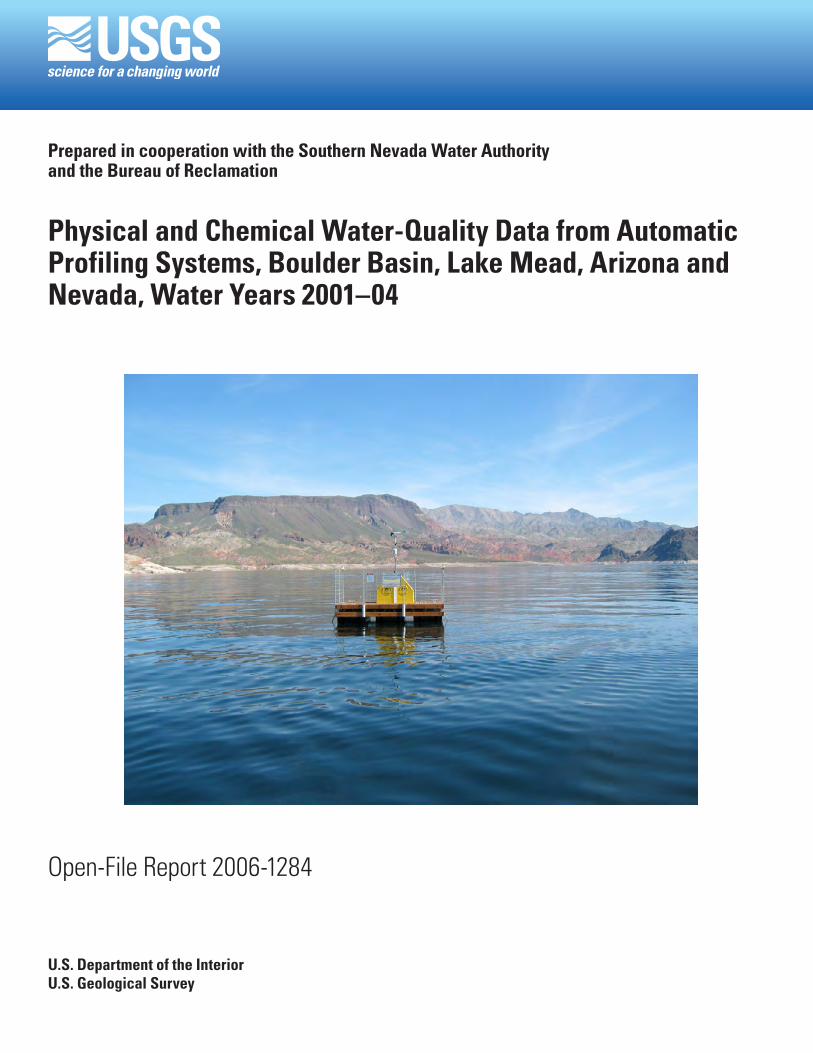
Cover. U.S. Geological Survey Automatic Profiling System near Sentinel Island, Boulder Basin, Lake Mead, Arizona and Nevada, August 2004. Photograph by Ryan C. Rowland.

Physical and Chemical Water-Quality Data from Automatic Profiling Systems, Boulder Basin, Lake Mead, Arizona and Nevada, Water Years 2001–04
By Ryan C. Rowland, Craig L. Westenburg, Ronald J. Veley, and Walter E. Nylund
Prepared in cooperation with the Southern Nevada Water Authority and the Bureau of Reclamation
Open-File Report 2006-1284
U.S. Department of the InteriorU.S. Geological Survey
U.S. Department of the InteriorDIRK KEMPTHORNE, Secretary
U.S. Geological SurveyMark D. Myers, Director
U.S. Geological Survey, Carson City, Nevada: 2006
For product and ordering information: World Wide Web: http://www.usgs.gov/pubprod Telephone: 1-888-ASK-USGS
For more information on the USGS—the Federal source for science about the Earth, its natural and living resources, natural hazards, and the environment: World Wide Web: http://www.usgs.gov Telephone: 1-888-ASK-USGS
Any use of trade, product, or firm names is for descriptive purposes only and does not imply endorsement by the U.S. Government.
Although this report is in the public domain, permission must be secured from the individual copyright owners to reproduce any copyrighted materials contained within this report.
Suggested citation:Rowland, R.C., Westenburg, C.L., Veley, R.J., and Nylund, W.E., 2006, Physical and chemical water-quality data from automatic profiling systems, Boulder Basin, Lake Mead, Arizona and Nevada, water years 2001–04: U.S. Geological Survey Open-File Report 2006-1284, 17 p. Available at <http://pubs.water.usgs.gov/ofr2006-1284>.
iii
ContentsAbstract .......................................................................................................................................................... 1Introduction.................................................................................................................................................... 1Purpose and Scope ...................................................................................................................................... 3Equipment....................................................................................................................................................... 3
Profiling Systems ................................................................................................................................. 4System Maintenance .......................................................................................................................... 6
Methodology .................................................................................................................................................. 6Data Collection ..................................................................................................................................... 6Data Processing ................................................................................................................................... 7Records Computation .......................................................................................................................... 8
References Cited......................................................................................................................................... 10
Figures 1. Map showing profiling system locations in Las Vegas Bay and near
Sentinel Island, Boulder Basin, Lake Mead, Arizona and Nevada . .................................... 2 2. Map showing profiling system locations in Las Vegas Bay, Lake Mead,
Arizona and Nevada ................................................................................................................... 3 3. Graph showing Lake Mead elevation during period of data collection ............................. 4 4. Schematic diagram of variable-buoyancy-profiling system ................................................ 5 5. Photos of variable-depth-winch system components mounted to a t-frame . .................. 5 6. Data processing flowchart for automatic-profile data . ........................................................ 8 7. Plots of physical and chemical water-quality properties in selected profiles
recorded at Las Vegas Bay site 1, Lake Mead, Arizona and Nevada .............................. 14 8. Plots of physical and chemical water-quality properties in selected profiles
recorded at Las Vegas Bay site 2, Lake Mead, Arizona and Nevada .............................. 15 9. Plots of physical and chemical water-quality properties in selected profiles
recorded at Las Vegas Bay site 3, Lake Mead, Arizona and Nevada .............................. 16 10. Plots of physical and chemical water-quality properties in selected profiles
recorded at Sentinel Island site, Lake Mead, Arizona and Nevada ................................. 17
Tables 1. Location and period of operation for the Las Vegas Bay and Sentinel Island
water-quality profiling systems ................................................................................................ 3 2. Calibration criteria for sensors used to measure physical and chemical
water-quality properties in profiles at Las Vegas Bay and near Sentinal Island, Lake Mead, Arizona and Nevada ............................................................................................. 7
3. Manufacturer specifications for sensors used to measure physical and chemical water-quality properties in profiles at Las Vegas Bay and near Sentinel Island, Lake Mead, Arizona and Nevada ................................................................. 7

iv
4. Station identification number, station name, and period of record for automatic-profile site target depths, Lake Mead, Arizona and Nevada ............................ 9
5. Maximum allowable limits for applying data corrections to near-continuous water-quality data . .................................................................................................................... 10
6. Criteria for rating near-continuous water-quality data ....................................................... 11 7. Data quality ratings for physical and chemical water-quality properties
measured in profiles at Las Vegas Bay and Sentinel Island sites, Lake Mead, Arizona and Nevada ................................................................................................................. 11
8. Physical and chemical water-quality data in profiles at Las Vegas Bay site 1, October 1, 2000–July 9, 2001 .................................................................................................... 13
9. Physical and chemical water-quality data in profiles at Las Vegas Bay site 2, September 6, 2001–June 19, 2002 ........................................................................................... 13
10. Physical and chemical water-quality data in profiles at Las Vegas Bay site 3, April 4, 2003–September 30, 2004 ............................................................................................ 13
11. Physical and chemical water-quality data in profiles at Sentinel Island site, January 24, 2002–September 30, 2004 ................................................................................... 13
12. Total water depth measured at Las Vegas Bay sites and at Sentinel Island site, Lake Mead, Arizona and Nevada ........................................................................................... 13

v
Conversion Factors and Datums
Multiply By To obtain
Length
meter (m) 3.281 foot (ft)
Volume
cubic meter (m³) 264.2 gallon (gal)
cubic meter (m³) 0.0002642 million gallons (Mgal)
cubic meter (m³) 0.0008107 acre-foot (acre-ft)
liter (L) 0.2642 gallon (gal)
liter (L) 61.02 cubic inch (in³)
Flow rate
cubic meter per second (m³/s) 70.04 acre-foot per day (acre-ft/d)
cubic meter per second (m³/s) 35.31 cubic foot per second (ft³/s)
cubic meter per second (m³/s) 22.83 million gallons per day (Mgal/d)
Temperature in degrees Celsius (°C) may be converted to degrees Fahrenheit (°F) as follows:
°F=(1.8×°C)+32
Temperature in degrees Fahrenheit (°F) may be converted to degrees Celsius (°C) as follows:
°C=(°F-32)/1.8
Vertical coordinate information is referenced to the U.S. Geological Survey datum, adjustment of 1912, locally known as “Power House Datum.” Add 0.17 meter to convert to datum of 1929, leveling of 1935. Add 0.13 meter to convert to datum of 1929, leveling of 1940. Add 0.12 meter to convert to datum of 1929, leveling of 1948. Add 0.01 meter to convert to datum of 1929, leveling of 1963. No elevations have been converted to datum of 1929. Datum of 1929 is known as National Geodetic Vertical Datum of 1929 (NVGD of 1929) and was formerly called “Sea-Level Datum of 1929.”
Horizontal coordinate information is referenced to the North American Datum of 1983 (NAD 83).
Altitude, as used in this report, refers to distance above the vertical datum.
Specific conductance is given in microsiemens per centimeter at 25 degrees Celsius (µS/cm at 25°C).
Concentrations of chemical constituents in water are given either in milligrams per liter (mg/L) or micrograms per liter (µg/L).

vi
This page intentionally left blank.
AbstractWater-quality profile data were collected in Las Vegas
Bay and near Sentinel Island in Lake Mead, Arizona and Nevada, from October 2000 to September 2004. The majority of the profiles were completed with automatic variable- buoyancy systems equipped with multiparameter water- quality sondes. Profile data near Sentinel Island were collected in August 2004 with an automatic variable-depth-winch system also equipped with a multiparameter water-quality sonde. Physical and chemical water properties collected and recorded by the profiling systems, including depth, water temperature, specific conductance, pH, dissolved-oxygen concentration, and turbidity are listed in tables and selected water-quality profile data are shown in graphs.
IntroductionLake Mead is a reservoir on the Colorado River formed
by the completion of Hoover Dam in 1936 and is on the boundary of Arizona and Nevada (fig. 1). The reservoir is comprised of four large basins (Gregg, Temple, Virgin, and Boulder) that trend east-west, several narrow canyons, and one relatively large north-south canyon (Overton Arm) created by the Muddy and Virgin Rivers, which are tributaries of the Colorado River. Lake Mead is the largest capacity reservoir (storage capacity at 372.3 m is 35,200,444,061 m³ of water, http://www.usbr.gov/lc/hooverdam/faqs/lakefaqs.html) in the United States. Lake Mead provides recreational watercraft activities and drinking water to southern Nevada. The Colo-rado River downstream of Lake Mead provides drinking, industrial, and irrigation water for over 22 million people throughout areas in Arizona and California.
The Colorado River provides an estimated 97 percent of the inflow to Lake Mead (fig. 1). About 3 percent of the inflow is from the Muddy and Virgin Rivers on the northern side of the lake and from Las Vegas Wash on the western side of the lake (fig. 1). Las Vegas Wash carries treated municipal waste-water, stormwater and urban runoff, and ground-water seepage from the Las Vegas Valley to Las Vegas Bay of Boulder Basin in Lake Mead (Boyd and Furlong, 2002; LaBounty and Horn, 1997; Bevans and others, 1996). Urban development in Las Vegas Valley has resulted in increased streamflow into Las
Vegas Wash. The average daily streamflow in Las Vegas Wash increased 33 percent, from 5.1 m3/s in 1992 to 7.6 m3/s in 2004 (Hess and others, 1993; Bonner and others, 2004).
The need to reduce the potential for deterioration of water quality in Las Vegas Wash and Lake Mead has been recog-nized by local municipal agencies and private organizations. For example, the Southern Nevada Water Authority (SNWA) Board of Directors approved in January 2000 the Las Vegas Wash Comprehensive Adaptive Management Plan (LVW-CAMP) that addresses specific environmental issues associ-ated with Las Vegas Wash. These issues include water quality, long-term enhancement and management, and public outreach. Three important components of the LVWCAMP are (1) the establishment of wetlands along Las Vegas Wash and in Las Vegas Bay, (2) environmental monitoring, and (3) timely dissemination to the public of data collected through various monitoring programs. To assist in the environmental monitor-ing and data dissemination components of the LVWCAMP, the U.S. Geological Survey (USGS), in cooperation with the SNWA and the Bureau of Reclamation, installed two water-quality monitoring stations on Lake Mead equipped with automatic profiling systems. The USGS water-quality moni-toring stations were in Boulder Basin: one downgradient of the Las Vegas Wash in Las Vegas Bay and the other near Sentinel Island (fig. 1). The Las Vegas Bay station has been in opera-tion since October 2000. The Sentinel Island station has been in operation since January 2002. Data collected at the sites included depth, water temperature, specific conductance, pH, dissolved-oxygen concentration, and turbidity.
The automatic profiling systems provide many advan-tages over manual, instantaneous measurements. These advan-tages include (1) a continuous record of long-term and tran-sient changes in physical and chemical properties in profiles, (2) detection of changes in physical and chemical properties in profiles related to storm events at tributary inflow sites by remotely initiating unscheduled profiles during storm events, and (3) the ability to access profile data in near real time.
The objectives of the water-quality monitoring program are to (1) collect near continuous, depth-dependent water-quality data at two floating platforms, (2) report data on the internet in near real time <http://nevada.usgs.gov/lmqw/index.htm>, and (3) document vertical and temporal changes in the water column at each station in a USGS report.
Physical and Chemical Water-Quality Data from Automatic Profiling Systems, Boulder Basin, Lake Mead, Arizona and Nevada, Water Years 2001–04
By Ryan C. Rowland, Craig L. Westenburg, Ronald J. Veley, and Walter E. Nylund
Introduction 1
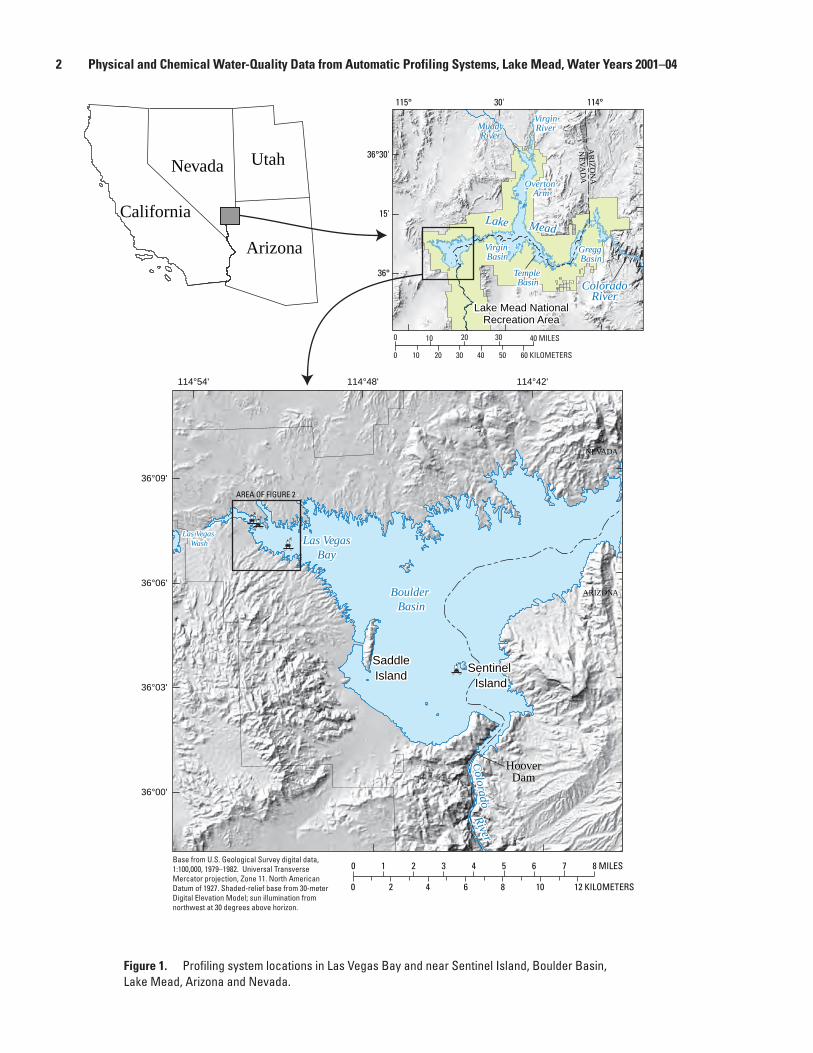
Figure 1. Profiling system locations in Las Vegas Bay and near Sentinel Island, Boulder Basin, Lake Mead, Arizona and Nevada.
AR
IZO
NA
NE
VA
DA
NEVADA
ARIZONA
115° 30' 114°
36°
15'
36°30'
114°54' 114°48' 114°42'
36°00'
36°03'
36°06'
36°09'
Base from U.S. Geological Survey digital data,1:100,000, 1979–1982. Universal TransverseMercator projection, Zone 11. North AmericanDatum of 1927. Shaded-relief base from 30-meterDigital Elevation Model; sun illumination fromnorthwest at 30 degrees above horizon.
SentinelIsland
SentinelIsland
Lake Mead NationalRecreation Area
Lake Mead NationalRecreation Area
SaddleIslandSaddleIsland
Lake MeadLake Mead
Las VegasBay
Las VegasBay
Las Vegas Wash
Las Vegas Wash
BoulderBasin
BoulderBasin
Colorado
Colorado
RiverRiver
VirginRiverVirginRiver
OvertonArm
OvertonArm
Virgin BasinVirgin Basin
Gregg BasinGregg Basin
Temple Basin
Temple Basin
MuddyRiver
MuddyRiver
HooverDam
ColoradoRiver
ColoradoRiver
0 2010 30 40 MILES
2010 30 40 60 KILOMETERS500
76543210 8 MILES
0 2 4 6 8 10 12 KILOMETERS
UtahNevada
California
Arizona
AREA OF FIGURE 2
2 Physical and Chemical Water-Quality Data from Automatic Profiling Systems, Lake Mead, Water Years 2001–04
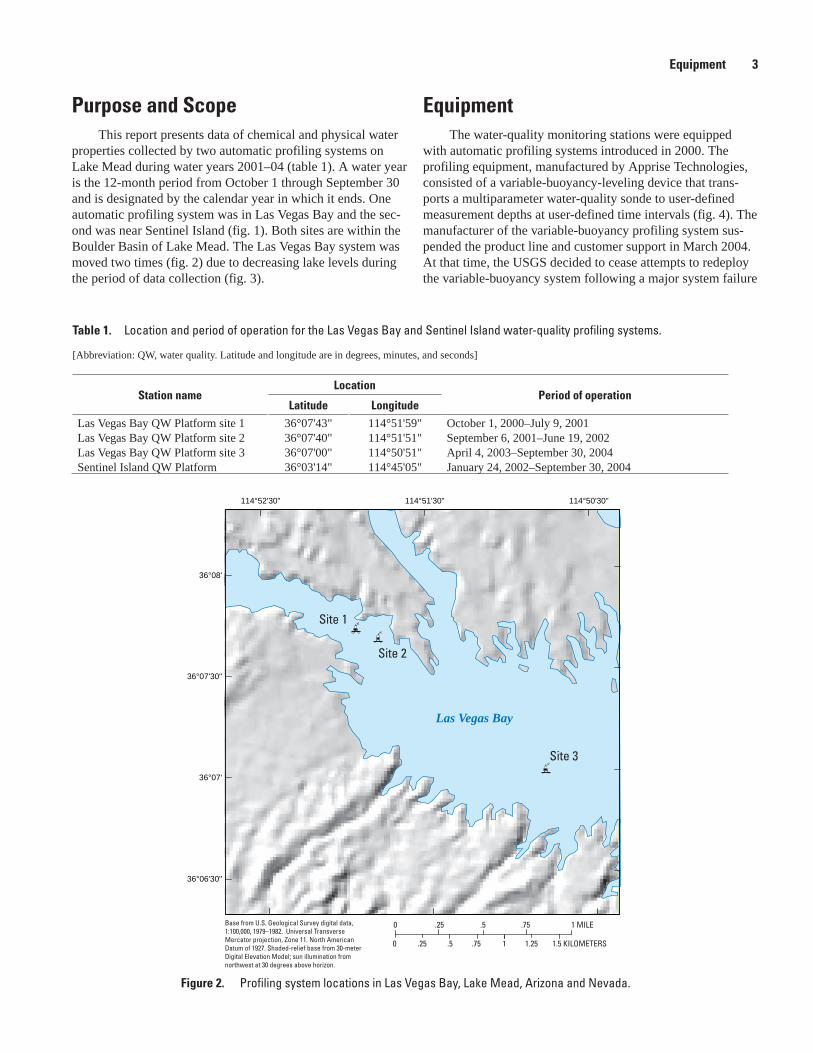
Purpose and ScopeThis report presents data of chemical and physical water
properties collected by two automatic profiling systems on Lake Mead during water years 2001–04 (table 1). A water year is the 12-month period from October 1 through September 30 and is designated by the calendar year in which it ends. One automatic profiling system was in Las Vegas Bay and the sec-ond was near Sentinel Island (fig. 1). Both sites are within the Boulder Basin of Lake Mead. The Las Vegas Bay system was moved two times (fig. 2) due to decreasing lake levels during the period of data collection (fig. 3).
Table 1. Location and period of operation for the Las Vegas Bay and Sentinel Island water-quality profiling systems.
[Abbreviation: QW, water quality. Latitude and longitude are in degrees, minutes, and seconds]
Station nameLocation
Period of operationLatitude Longitude
Las Vegas Bay QW Platform site 1 36°07'43" 114°51'59" October 1, 2000–July 9, 2001Las Vegas Bay QW Platform site 2 36°07'40" 114°51'51" September 6, 2001–June 19, 2002Las Vegas Bay QW Platform site 3 36°07'00" 114°50'51" April 4, 2003–September 30, 2004Sentinel Island QW Platform 36°03'14" 114°45'05" January 24, 2002–September 30, 2004
EquipmentThe water-quality monitoring stations were equipped
with automatic profiling systems introduced in 2000. The profiling equipment, manufactured by Apprise Technologies, consisted of a variable-buoyancy-leveling device that trans-ports a multiparameter water-quality sonde to user-defined measurement depths at user-defined time intervals (fig. 4). The manufacturer of the variable-buoyancy profiling system sus-pended the product line and customer support in March 2004. At that time, the USGS decided to cease attempts to redeploy the variable-buoyancy system following a major system failure
Figure 2. Profiling system locations in Las Vegas Bay, Lake Mead, Arizona and Nevada.
Las Vegas Bay
Base from U.S. Geological Survey digital data,1:100,000, 1979–1982. Universal TransverseMercator projection, Zone 11. North AmericanDatum of 1927. Shaded-relief base from 30-meterDigital Elevation Model; sun illumination fromnorthwest at 30 degrees above horizon.
Site 2
Site 3
Site 1
114°52'30" 114°51'30" 114°50'30"
36°06'30"
36°07'
36°07'30"
36°08'
0 1 MILE.5
0 1 1.5 KILOMETERS.5
.25 .75
.25 1.25.75
Equipment �
(non-operational 15 days or more) at the Sentinel Island site. The USGS began researching an alternative automatic profil-ing technology. The variable-buoyancy-profiling system at the Sentinel Island site was replaced on August 27, 2004, with a variable-depth-winch system manufactured by Endeco/YSI. This system also provides water-quality profiles at user-defined depth increments and user-defined time intervals (fig. 5). Maintenance for both systems involved routine and periodic site visits. Standard operating procedures for service visits were established to mitigate system failures.
Profiling SystemsThe profiling equipment consisted of a variable-buoy-
ancy-leveling device that transports a multiparameter water-quality sonde (fig. 4). When the leveling device reaches a target depth, physical and chemical properties are collected by the sonde (after an equilibration period determined by the dissolved-oxygen sensor), and recorded on the profiling- system data logger. The sondes were equipped with sensors to measure depth, water temperature, specific conductance, pH, dissolved-oxygen concentration, and turbidity. The leveling device consists of a dry cylinder that houses a high pressure pump, valves, and electronic circuits and a wet cylinder that houses an air bladder. The buoyancy of the leveling device is adjusted when the system pumps water into or out of the wet
cylinder. The leveling device is suspended below the floating platform by a weighted data cable. The data cable is connected to a system computer, which is housed in a weather resistant shelter on top of the platform. A second communication cable connects the sonde to the electronics in the dry cylinder on the leveling device. The Las Vegas Bay system was equipped with a 30 m data cable and was powered by one 12-volt, deep-cycle marine battery. The Sentinel Island system was equipped with a 100 m data cable and was powered by two 12-volt, deep-cycle marine batteries. The batteries were charged by 50-watt solar panels. Both systems also were equipped with cellular-telephone modems so that at any time the user could download data, change scheduled profile depths and start times, and initiate profiles.
In August 2004, the variable-buoyancy system near Senti-nel Island was replaced with a variable-depth-winch system that became available for consumer distribution in 2004 (fig. 5). This system utilizes a winch and reel assembly mounted on a platform to transport the water-quality sonde in the water column. The sondes were equipped with sensors to measure depth, water temperature, specific conductance, pH, dissolved-oxygen concentration, and turbidity. Variable-depth-winch systems are composed of a winch assembly, data cable, data logger/sensor-control module, 95-amps per hour rechargeable gel-cell battery, cellular-telephone modem, and 30-watt solar panels.
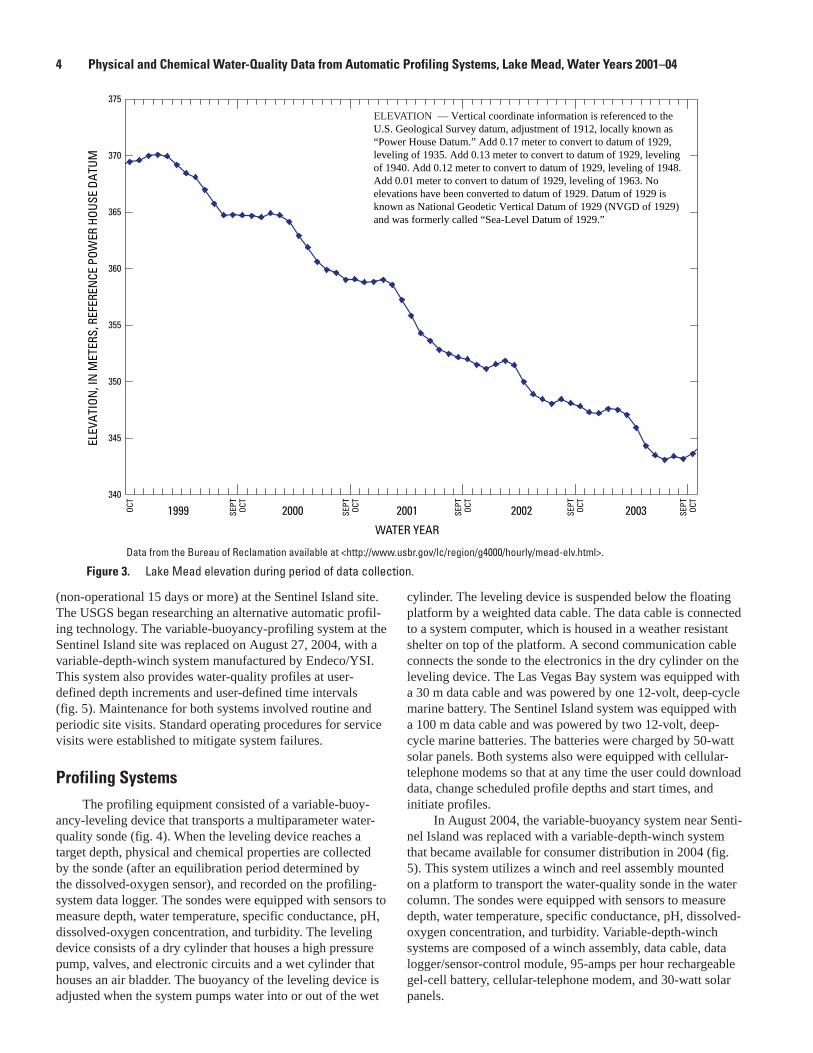
Figure �. Lake Mead elevation during period of data collection.
NV16-0019_fig03
ELEV
ATIO
N,I
NM
ETER
S,RE
FERE
NCE
POW
ERHO
USE
DATU
M
340
345
350
355
360
365
370
375
2002200120001999 2003
WATER YEAR
OCT
OCT
SEPT
OCT
SEPT
OCT
SEPT
OCT
SEPT
OCT
SEPT
ELEVATION — Vertical coordinate information is referenced to the U.S. Geological Survey datum, adjustment of 1912, locally known as“Power House Datum.” Add 0.17 meter to convert to datum of 1929,leveling of 1935. Add 0.13 meter to convert to datum of 1929, levelingof 1940. Add 0.12 meter to convert to datum of 1929, leveling of 1948.Add 0.01 meter to convert to datum of 1929, leveling of 1963. Noelevations have been converted to datum of 1929. Datum of 1929 isknown as National Geodetic Vertical Datum of 1929 (NVGD of 1929)and was formerly called “Sea-Level Datum of 1929.”
Data from the Bureau of Reclamation available at <http://www.usbr.gov/lc/region/g4000/hourly/mead-elv.html>.
4 Physical and Chemical Water-Quality Data from Automatic Profiling Systems, Lake Mead, Water Years 2001–04

Equipment 5
Variable buoyancyleveling device
Cable weight
Data cableMultiprobe
Solar panel
Modem antenna
Beacon
Anchored platform
Multiprobe cable
Water line
Weather resistant shelterhousing data logger,modem, and battery
NV16-0019_fig05
3
4
2
1
Front view of t-frame Back view of t-frame
Components are (1) variable-profiler-winch assembly, (2) modemantenna, (3) watertight housing for data logger and modem, and(4) watertight housing for 12-volt, 95-amps per hour battery.
Figure 4. Variable-buoyancy-profiling system.
Figure 5. Variable-depth-winch system components mounted to a t-frame.

System MaintenanceAutomatic profiling systems are a relatively new technol-
ogy. The systems operate in extreme conditions. The sondes, variable-buoyancy devices, and depth-winch systems are exposed to a wide range of water temperatures and pressure during a profile, and the surface-mounted electronics are exposed to large daily and seasonal air-temperature fluctua-tions. The complexity of the profiling systems combined with the dynamic environment they operate in at Lake Mead led to system failures during the data-collection period. The system failures resulted in periods of missing data or incomplete profiles.
Minor equipment problems were repaired in the field or in the office electronics lab and the amount of missing data record was limited to less than 15 days. Major equipment problems, such as leaks in cable connections and the elec-tronics cylinder on the variable-buoyancy device, had to be repaired by the system manufacturer and resulted in extended periods of missing data (15 days up to 11 months.) The Las Vegas Bay system did not experience a major failure, which can be attributed to the relatively shallow maximum target depth (up to 19 m) at the Las Vegas Bay sites. Whereas, the Sentinel Island system, whose maximum target depth was up to 95 m, experienced several major failures and one vandalism event, which lead to significant periods of missing data.
To minimize periods of missing data and incomplete profiles, sites were visited every 2 to 4 weeks to perform preventative maintenance, and as needed in response to system failures. Standard operating procedures for service visits completed from October 1, 2000, to September 30, 2003, were as follows:
The leveling device was brought to surface,
the sonde was removed and placed in a bucket of water collected from the lake’s surface,
a second clean and calibrated sonde (calibration checked less than 24 hours prior to service visit) was placed in the same bucket and concurrent readings from the sondes were recorded, and
the clean and calibrated sonde was secured to the leveling device and the sonde that was deployed during the monitoring period was brought back to the office where it was serviced (service included cleaning and sensor calibration according to manufacturer direc-tions).
From October 1, 2003, to September 30, 2004, revised standard operating procedures were followed. The revised procedures were based on published USGS guidelines and protocols (Wagner and others, 2001). The revised standard operating procedures included:
Bring the sonde to the surface,
immerse the sonde in a bucket of lakewater that is maintained at surface-water temperature and record readings prior to cleaning sensor,
•
•
•
•
•
•
check the calibration of the dissolved-oxygen sensor using the saturated air in water method,
remove the dissolved-oxygen sensor and replace it with a sensor that was serviced less than 24 hours prior to the site visit,
calibrate the dissolved-oxygen sensor using the satu-rated air in water method,
clean the remaining sensors according to manufacturer specifications,
immerse the sonde in the bucket of lakewater main-tained at surface-water temperature and record the cleaned sensor readings,
check the calibration of the sensors and calibrate the sensors if they exceed the calibration criteria (table 2),
record postservice sensor readings in the bucket of lakewater maintained at surface-water temperature, and
reconnect the sonde to the profiling system and deploy.
MethodologyThe methodology, for the purpose of this data report,
included the collection of near-continuous water-quality data at a total of three sites within Las Vegas Bay and one site near Sentinel Island in Lake Mead, Arizona and Nevada (fig. 1). The data were processed in compliance with USGS quality-assurance and control guidelines, and the data records were computed based on established USGS criteria.
Data CollectionData were collected at the Las Vegas Bay sites at 2 m
increments, starting at 1 or 3 m below the water surface. Data were collected at the Sentinel Island site at 5 m increments, starting at 5 m below the water surface. Maximum depths at the Las Vegas Bay sites ranged from 5 to 19 m. The maximum depth at the Sentinel Island site was 95 m when the variable-depth-buoyancy system was used, and 45 m when the vari-able-depth-winch system was used. Profiles generally were completed at intervals of 6 hours; usually the first profile was started from 20 to 30 minutes after midnight. Profiles at the Las Vegas Bay sites took about 30 minutes to complete and profiles at the Sentinel Island site took about 60 minutes to complete. The profile duration was related to the maximum profile depths. Total water depth was measured during a majority of the service visits to the Las Vegas Bay sites and selected visits to the site near Sentinel Island. Depth was mea-sured with a weighted tape measure at the Las Vegas Bay sites and with a commercial depth finder at the site near Sentinel Island. Some of the variability in the depth data measured at the Sentinel Island site is due to the platform drifting towards or away from Sentinel Island, depending on the wind direc-tion.
•
•
•
•
•
•
•
•
� Physical and Chemical Water-Quality Data from Automatic Profiling Systems, Lake Mead, Water Years 2001–04

Physical and chemical water-quality properties were collected by a YSI model 6600 multiparameter sondes equipped with sensors to measure depth, water temperature, specific conductance, pH, dissolved-oxygen concentration, and turbidity. Manufacturer’s specifications are provided for each type of sensor (table 3). Definitions of the physical and chemical water properties measured by the sensors are pro-vided below:
Depth: water depth, in meters below water surface;
Water temperature: a measure of warmth or cold-ness of water, in degrees Celsius;
Specific conductance: a measure of the electrical conductance of a substance normalized to a unit length and unit cross section at a specified tempera-ture, in microsiemens per centimeter at 25 degrees Celsius;
pH: a measure of the concentration of hydrogen ions, in standard units. pH values above 7 are basic, pH values below 7 are acidic, and pH equal to 7 is neutral;
Dissolved-oxygen concentration: a measure of dis-solved-molecular-oxygen (oxygen gas) concentra-tion in water, in milligrams per liter; and
Turbidity: an expression of the optical properties of a liquid that causes light rays to be scattered and absorbed rather than transmitted in straight lines through a sample, in formazin nephelometric turbid-ity units.
Data Processing
Automatic near-continuous profiling systems are a relatively new technology and managing the data they generate poses new challenges. Data processing procedures, described in detail below, are specific to managing the profile data in the USGS National Water Information System (NWIS) database; however, the overall approach could apply to any data-management system.
Each measurement depth is assigned a unique station identification number and name, which are used to identify the station and associated depth-specific data that are stored in NWIS (table 4). Station identification numbers contain the station’s latitude (first 6 characters) and longitude (characters 7 to 13), in degrees-minutes-seconds format, plus two addi-tional characters that are specific to a target depth at a site. The station name references a nearby landmark, such as an island, bay, or basin. The station name also includes the mea-surement depth.
Table 2. Calibration criteria for sensors used to measure physical and chemical water-quality properties in profiles at Las Vegas Bay and near Sentinel Island, Lake Mead, Arizona and Nevada.
[Abbreviations: ºC, degrees Celsius; µS/cm, microsiemens per centimeter; mg/L, milligrams per liter; FNU, formazin nephelometric turbidity unit; m, meter]
Property Calibration criteriaDepth ±0.3 mWater temperature ±0.2ºCSpecific conductance The greater of ±5 µS/cm at 25ºC or ±3 percent of the measured value
pH ±0.2 unitsDissolved-oxygen concentration ±0.3 mg/LTurbidity The greater of ±2 FNU or ±5 percent of the measured value
Table �. Manufacturer specifications for sensors used to measure physical and chemical water-quality properties in profiles at Las Vegas Bay and near Sentinel Island, Lake Mead, Arizona and Nevada.
[Abbreviations: ºC, degrees Celsius; µS/cm, microsiemens per centimeter; mg/L, milligrams per liter; FNU, formazin nephelometric turbidity unit; m, meters]
Sensor Range AccuracyDepth, nonvented, deep level. 0–200 m ±0.3 m.Water temperature, sintered metallic oxide
thermistor.-5–45ºC ±0.15ºC.
Specific conductance, four nickel electrode cell with autoranging.
0–100,000 µS/cm at 25ºC ±0.5 percent of reading +1 µS/cm at 25ºC.
pH, glass combination electrode. 0–14 units ± 0.2 units.Dissolved-oxygen concentration, rapid pulse Clark
type, polarographic.0–50 mg/L 0–20 mg/L: the greater of ±2 percent of the reading or
0.2 mg/L. 20–50 mg/L: ±6 percent.Turbidity, optical, 90 degree scatter with mechani-
cal cleaning.0–1,000 FNU The greater of ±2 FNU or ±5 percent of the measured
value.
Methodology �
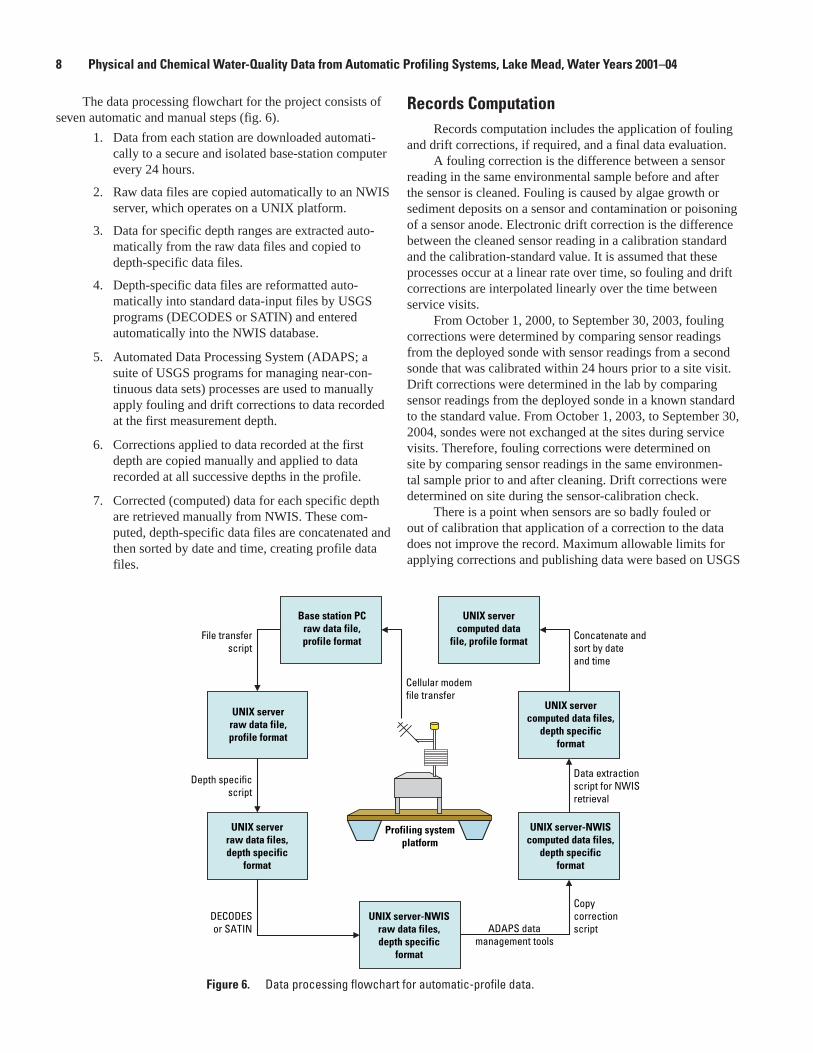
The data processing flowchart for the project consists of seven automatic and manual steps (fig. 6).
Data from each station are downloaded automati-cally to a secure and isolated base-station computer every 24 hours.
Raw data files are copied automatically to an NWIS server, which operates on a UNIX platform.
Data for specific depth ranges are extracted auto-matically from the raw data files and copied to depth-specific data files.
Depth-specific data files are reformatted auto-matically into standard data-input files by USGS programs (DECODES or SATIN) and entered automatically into the NWIS database.
Automated Data Processing System (ADAPS; a suite of USGS programs for managing near-con-tinuous data sets) processes are used to manually apply fouling and drift corrections to data recorded at the first measurement depth.
Corrections applied to data recorded at the first depth are copied manually and applied to data recorded at all successive depths in the profile.
Corrected (computed) data for each specific depth are retrieved manually from NWIS. These com-puted, depth-specific data files are concatenated and then sorted by date and time, creating profile data files.
1.
2.
3.
4.
5.
6.
7.
Records ComputationRecords computation includes the application of fouling
and drift corrections, if required, and a final data evaluation.A fouling correction is the difference between a sensor
reading in the same environmental sample before and after the sensor is cleaned. Fouling is caused by algae growth or sediment deposits on a sensor and contamination or poisoning of a sensor anode. Electronic drift correction is the difference between the cleaned sensor reading in a calibration standard and the calibration-standard value. It is assumed that these processes occur at a linear rate over time, so fouling and drift corrections are interpolated linearly over the time between service visits.
From October 1, 2000, to September 30, 2003, fouling corrections were determined by comparing sensor readings from the deployed sonde with sensor readings from a second sonde that was calibrated within 24 hours prior to a site visit. Drift corrections were determined in the lab by comparing sensor readings from the deployed sonde in a known standard to the standard value. From October 1, 2003, to September 30, 2004, sondes were not exchanged at the sites during service visits. Therefore, fouling corrections were determined on site by comparing sensor readings in the same environmen-tal sample prior to and after cleaning. Drift corrections were determined on site during the sensor-calibration check.
There is a point when sensors are so badly fouled or out of calibration that application of a correction to the data does not improve the record. Maximum allowable limits for applying corrections and publishing data were based on USGS
Figure �. Data processing flowchart for automatic-profile data.
NV16-0019_fig06
UNIX serverraw data file,profile format
Copycorrectionscript
Profiling systemplatform
Cellular modemfile transfer
UNIX serverraw data files,depth specific
format
UNIX server-NWISraw data files,depth specific
format
UNIX server-NWIScomputed data files,
depth specificformat
UNIX servercomputed data files,
depth specificformat
UNIX servercomputed data
file, profile format
Base station PCraw data file,profile formatFile transfer
script
Depth specificscript
Concatenate andsort by dateand time
Data extractionscript for NWISretrieval
DECODESor SATIN ADAPS data
management tools
Figure 6. Data processing flowchart for automatic-profile data.
� Physical and Chemical Water-Quality Data from Automatic Profiling Systems, Lake Mead, Water Years 2001–04
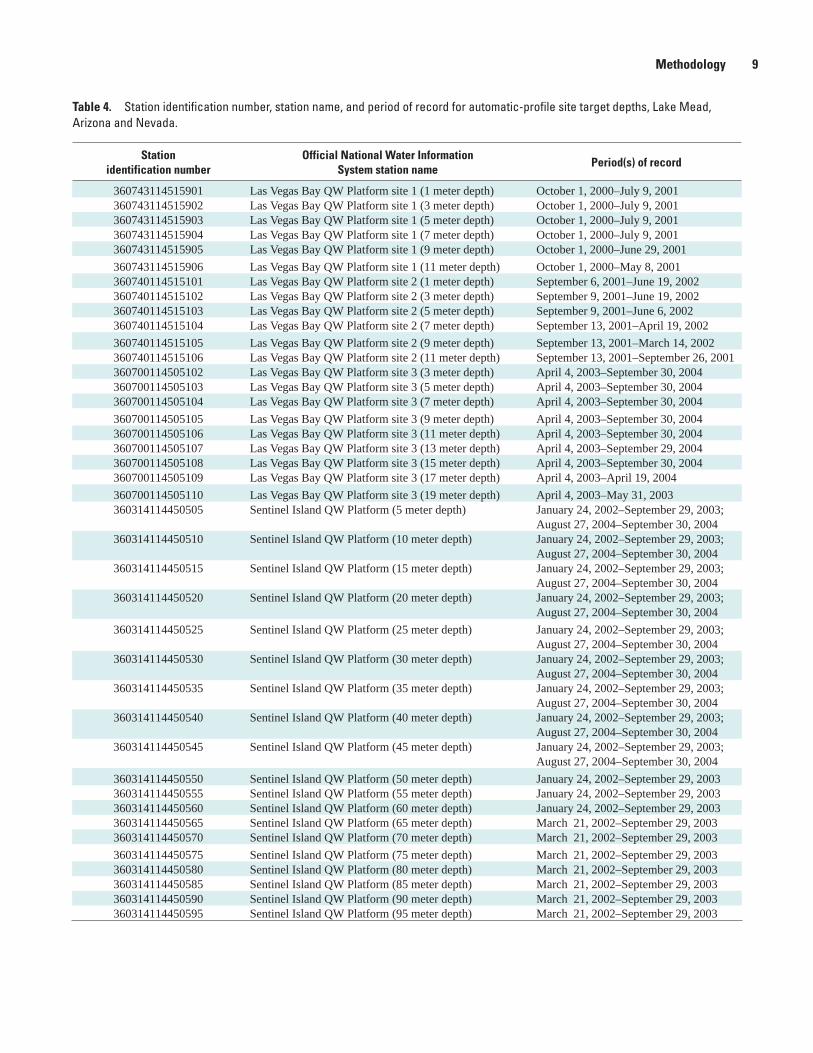
Table 4. Station identification number, station name, and period of record for automatic-profile site target depths, Lake Mead, Arizona and Nevada.
Station identification number
Official National Water Information System station name
Period(s) of record
360743114515901 Las Vegas Bay QW Platform site 1 (1 meter depth) October 1, 2000–July 9, 2001360743114515902 Las Vegas Bay QW Platform site 1 (3 meter depth) October 1, 2000–July 9, 2001360743114515903 Las Vegas Bay QW Platform site 1 (5 meter depth) October 1, 2000–July 9, 2001360743114515904 Las Vegas Bay QW Platform site 1 (7 meter depth) October 1, 2000–July 9, 2001360743114515905 Las Vegas Bay QW Platform site 1 (9 meter depth) October 1, 2000–June 29, 2001
360743114515906 Las Vegas Bay QW Platform site 1 (11 meter depth) October 1, 2000–May 8, 2001360740114515101 Las Vegas Bay QW Platform site 2 (1 meter depth) September 6, 2001–June 19, 2002360740114515102 Las Vegas Bay QW Platform site 2 (3 meter depth) September 9, 2001–June 19, 2002360740114515103 Las Vegas Bay QW Platform site 2 (5 meter depth) September 9, 2001–June 6, 2002360740114515104 Las Vegas Bay QW Platform site 2 (7 meter depth) September 13, 2001–April 19, 2002
360740114515105 Las Vegas Bay QW Platform site 2 (9 meter depth) September 13, 2001–March 14, 2002360740114515106 Las Vegas Bay QW Platform site 2 (11 meter depth) September 13, 2001–September 26, 2001360700114505102 Las Vegas Bay QW Platform site 3 (3 meter depth) April 4, 2003–September 30, 2004360700114505103 Las Vegas Bay QW Platform site 3 (5 meter depth) April 4, 2003–September 30, 2004360700114505104 Las Vegas Bay QW Platform site 3 (7 meter depth) April 4, 2003–September 30, 2004
360700114505105 Las Vegas Bay QW Platform site 3 (9 meter depth) April 4, 2003–September 30, 2004360700114505106 Las Vegas Bay QW Platform site 3 (11 meter depth) April 4, 2003–September 30, 2004360700114505107 Las Vegas Bay QW Platform site 3 (13 meter depth) April 4, 2003–September 29, 2004360700114505108 Las Vegas Bay QW Platform site 3 (15 meter depth) April 4, 2003–September 30, 2004360700114505109 Las Vegas Bay QW Platform site 3 (17 meter depth) April 4, 2003–April 19, 2004
360700114505110 Las Vegas Bay QW Platform site 3 (19 meter depth) April 4, 2003–May 31, 2003360314114450505 Sentinel Island QW Platform (5 meter depth) January 24, 2002–September 29, 2003;
August 27, 2004–September 30, 2004360314114450510 Sentinel Island QW Platform (10 meter depth) January 24, 2002–September 29, 2003;
August 27, 2004–September 30, 2004360314114450515 Sentinel Island QW Platform (15 meter depth) January 24, 2002–September 29, 2003;
August 27, 2004–September 30, 2004360314114450520 Sentinel Island QW Platform (20 meter depth) January 24, 2002–September 29, 2003;
August 27, 2004–September 30, 2004
360314114450525 Sentinel Island QW Platform (25 meter depth) January 24, 2002–September 29, 2003; August 27, 2004–September 30, 2004
360314114450530 Sentinel Island QW Platform (30 meter depth) January 24, 2002–September 29, 2003; August 27, 2004–September 30, 2004
360314114450535 Sentinel Island QW Platform (35 meter depth) January 24, 2002–September 29, 2003; August 27, 2004–September 30, 2004
360314114450540 Sentinel Island QW Platform (40 meter depth) January 24, 2002–September 29, 2003; August 27, 2004–September 30, 2004
360314114450545 Sentinel Island QW Platform (45 meter depth) January 24, 2002–September 29, 2003; August 27, 2004–September 30, 2004
360314114450550 Sentinel Island QW Platform (50 meter depth) January 24, 2002–September 29, 2003360314114450555 Sentinel Island QW Platform (55 meter depth) January 24, 2002–September 29, 2003360314114450560 Sentinel Island QW Platform (60 meter depth) January 24, 2002–September 29, 2003360314114450565 Sentinel Island QW Platform (65 meter depth) March 21, 2002–September 29, 2003360314114450570 Sentinel Island QW Platform (70 meter depth) March 21, 2002–September 29, 2003
360314114450575 Sentinel Island QW Platform (75 meter depth) March 21, 2002–September 29, 2003360314114450580 Sentinel Island QW Platform (80 meter depth) March 21, 2002–September 29, 2003360314114450585 Sentinel Island QW Platform (85 meter depth) March 21, 2002–September 29, 2003360314114450590 Sentinel Island QW Platform (90 meter depth) March 21, 2002–September 29, 2003360314114450595 Sentinel Island QW Platform (95 meter depth) March 21, 2002–September 29, 2003
Methodology �
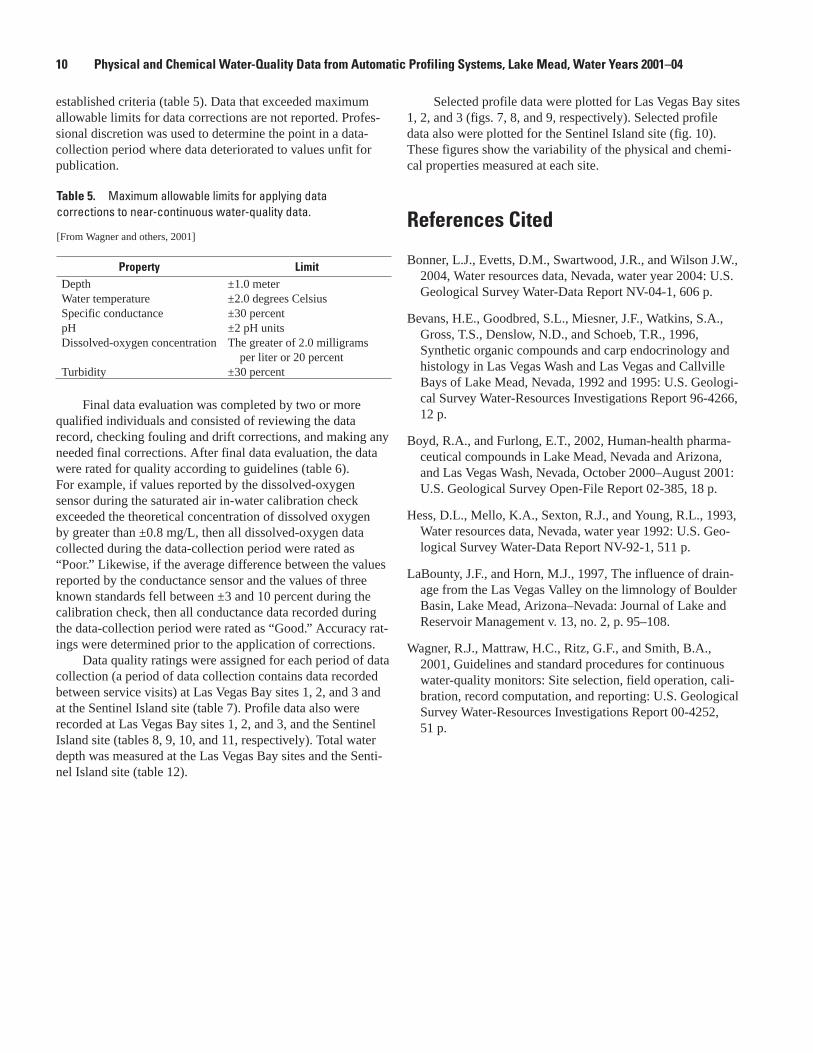
established criteria (table 5). Data that exceeded maximum allowable limits for data corrections are not reported. Profes-sional discretion was used to determine the point in a data-collection period where data deteriorated to values unfit for publication.
Final data evaluation was completed by two or more qualified individuals and consisted of reviewing the data record, checking fouling and drift corrections, and making any needed final corrections. After final data evaluation, the data were rated for quality according to guidelines (table 6). For example, if values reported by the dissolved-oxygen sensor during the saturated air in-water calibration check exceeded the theoretical concentration of dissolved oxygen by greater than ±0.8 mg/L, then all dissolved-oxygen data collected during the data-collection period were rated as “Poor.” Likewise, if the average difference between the values reported by the conductance sensor and the values of three known standards fell between ±3 and 10 percent during the calibration check, then all conductance data recorded during the data-collection period were rated as “Good.” Accuracy rat-ings were determined prior to the application of corrections.
Data quality ratings were assigned for each period of data collection (a period of data collection contains data recorded between service visits) at Las Vegas Bay sites 1, 2, and 3 and at the Sentinel Island site (table 7). Profile data also were recorded at Las Vegas Bay sites 1, 2, and 3, and the Sentinel Island site (tables 8, 9, 10, and 11, respectively). Total water depth was measured at the Las Vegas Bay sites and the Senti-nel Island site (table 12).
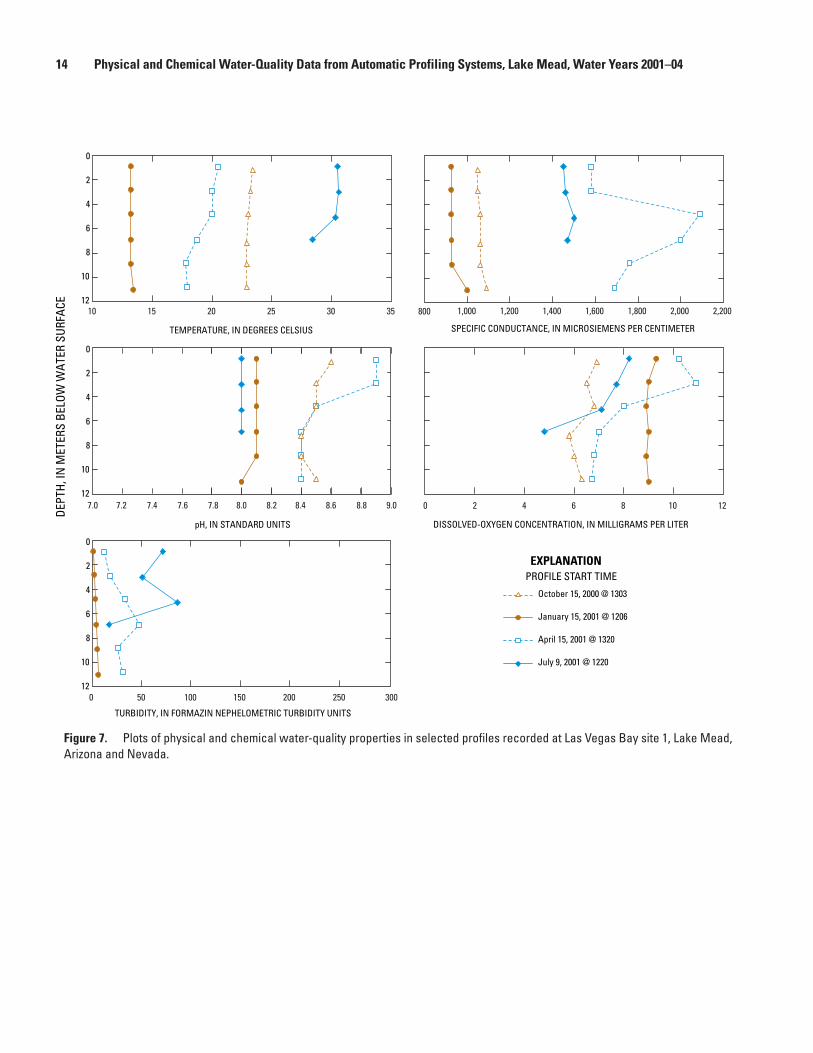
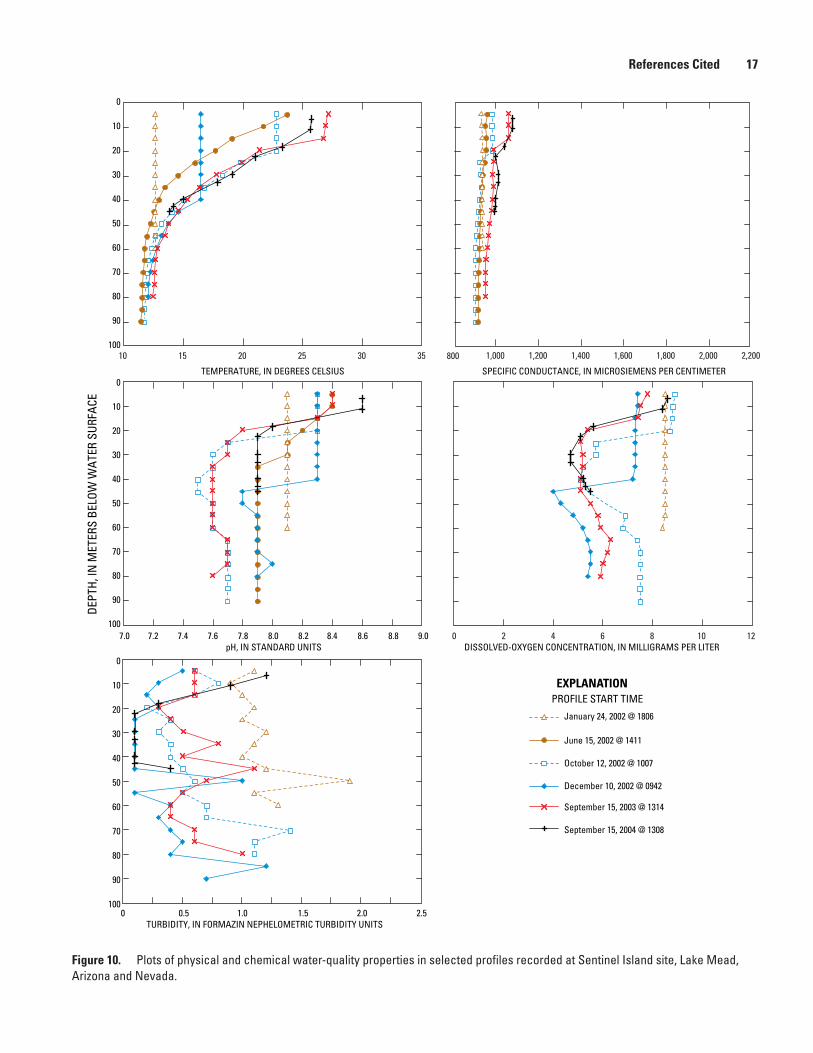
Selected profile data were plotted for Las Vegas Bay sites 1, 2, and 3 (figs. 7, 8, and 9, respectively). Selected profile data also were plotted for the Sentinel Island site (fig. 10). These figures show the variability of the physical and chemi-cal properties measured at each site.
References Cited
Bonner, L.J., Evetts, D.M., Swartwood, J.R., and Wilson J.W., 2004, Water resources data, Nevada, water year 2004: U.S. Geological Survey Water-Data Report NV-04-1, 606 p.
Bevans, H.E., Goodbred, S.L., Miesner, J.F., Watkins, S.A., Gross, T.S., Denslow, N.D., and Schoeb, T.R., 1996, Synthetic organic compounds and carp endocrinology and histology in Las Vegas Wash and Las Vegas and Callville Bays of Lake Mead, Nevada, 1992 and 1995: U.S. Geologi-cal Survey Water-Resources Investigations Report 96-4266, 12 p.
Boyd, R.A., and Furlong, E.T., 2002, Human-health pharma-ceutical compounds in Lake Mead, Nevada and Arizona, and Las Vegas Wash, Nevada, October 2000–August 2001: U.S. Geological Survey Open-File Report 02-385, 18 p.
Hess, D.L., Mello, K.A., Sexton, R.J., and Young, R.L., 1993, Water resources data, Nevada, water year 1992: U.S. Geo-logical Survey Water-Data Report NV-92-1, 511 p.
LaBounty, J.F., and Horn, M.J., 1997, The influence of drain-age from the Las Vegas Valley on the limnology of Boulder Basin, Lake Mead, Arizona–Nevada: Journal of Lake and Reservoir Management v. 13, no. 2, p. 95–108.
Wagner, R.J., Mattraw, H.C., Ritz, G.F., and Smith, B.A., 2001, Guidelines and standard procedures for continuous water-quality monitors: Site selection, field operation, cali-bration, record computation, and reporting: U.S. Geological Survey Water-Resources Investigations Report 00-4252, 51 p.
Table 5. Maximum allowable limits for applying data corrections to near-continuous water-quality data.
[From Wagner and others, 2001]
Property LimitDepth ±1.0 meterWater temperature ±2.0 degrees CelsiusSpecific conductance ±30 percentpH ±2 pH unitsDissolved-oxygen concentration The greater of 2.0 milligrams
per liter or 20 percent Turbidity ±30 percent
10 Physical and Chemical Water-Quality Data from Automatic Profiling Systems, Lake Mead, Water Years 2001–04
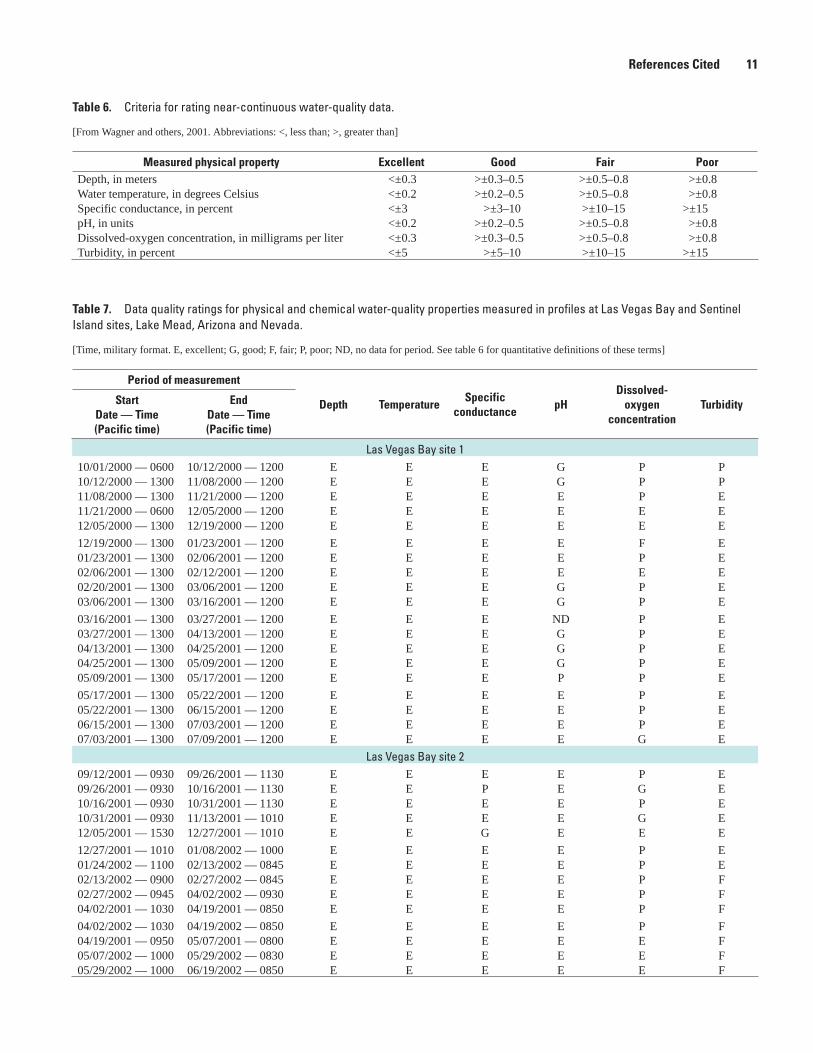
Table �. Criteria for rating near-continuous water-quality data.
[From Wagner and others, 2001. Abbreviations: <, less than; >, greater than]
Measured physical property Excellent Good Fair PoorDepth, in meters <±0.3 >±0.3–0.5 >±0.5–0.8 >±0.8Water temperature, in degrees Celsius <±0.2 >±0.2–0.5 >±0.5–0.8 >±0.8Specific conductance, in percent <±3 >±3–10 >±10–15 >±15pH, in units <±0.2 >±0.2–0.5 >±0.5–0.8 >±0.8Dissolved-oxygen concentration, in milligrams per liter <±0.3 >±0.3–0.5 >±0.5–0.8 >±0.8Turbidity, in percent <±5 >±5–10 >±10–15 >±15
Table �. Data quality ratings for physical and chemical water-quality properties measured in profiles at Las Vegas Bay and Sentinel Island sites, Lake Mead, Arizona and Nevada.
[Time, military format. E, excellent; G, good; F, fair; P, poor; ND, no data for period. See table 6 for quantitative definitions of these terms]
Period of measurement
Depth TemperatureSpecific
conductancepH
Dissolved- oxygen
concentrationTurbidityStart
Date — Time(Pacific time)
EndDate — Time(Pacific time)
Las Vegas Bay site 110/01/2000 — 0600 10/12/2000 — 1200 E E E G P P10/12/2000 — 1300 11/08/2000 — 1200 E E E G P P11/08/2000 — 1300 11/21/2000 — 1200 E E E E P E11/21/2000 — 0600 12/05/2000 — 1200 E E E E E E12/05/2000 — 1300 12/19/2000 — 1200 E E E E E E
12/19/2000 — 1300 01/23/2001 — 1200 E E E E F E01/23/2001 — 1300 02/06/2001 — 1200 E E E E P E02/06/2001 — 1300 02/12/2001 — 1200 E E E E E E02/20/2001 — 1300 03/06/2001 — 1200 E E E G P E03/06/2001 — 1300 03/16/2001 — 1200 E E E G P E
03/16/2001 — 1300 03/27/2001 — 1200 E E E ND P E03/27/2001 — 1300 04/13/2001 — 1200 E E E G P E04/13/2001 — 1300 04/25/2001 — 1200 E E E G P E04/25/2001 — 1300 05/09/2001 — 1200 E E E G P E05/09/2001 — 1300 05/17/2001 — 1200 E E E P P E
05/17/2001 — 1300 05/22/2001 — 1200 E E E E P E05/22/2001 — 1300 06/15/2001 — 1200 E E E E P E06/15/2001 — 1300 07/03/2001 — 1200 E E E E P E07/03/2001 — 1300 07/09/2001 — 1200 E E E E G E
Las Vegas Bay site 209/12/2001 — 0930 09/26/2001 — 1130 E E E E P E09/26/2001 — 0930 10/16/2001 — 1130 E E P E G E10/16/2001 — 0930 10/31/2001 — 1130 E E E E P E10/31/2001 — 0930 11/13/2001 — 1010 E E E E G E12/05/2001 — 1530 12/27/2001 — 1010 E E G E E E
12/27/2001 — 1010 01/08/2002 — 1000 E E E E P E01/24/2002 — 1100 02/13/2002 — 0845 E E E E P E02/13/2002 — 0900 02/27/2002 — 0845 E E E E P F02/27/2002 — 0945 04/02/2002 — 0930 E E E E P F04/02/2001 — 1030 04/19/2001 — 0850 E E E E P F
04/02/2002 — 1030 04/19/2002 — 0850 E E E E P F04/19/2001 — 0950 05/07/2001 — 0800 E E E E E F05/07/2002 — 1000 05/29/2002 — 0830 E E E E E F05/29/2002 — 1000 06/19/2002 — 0850 E E E E E F
References Cited 11
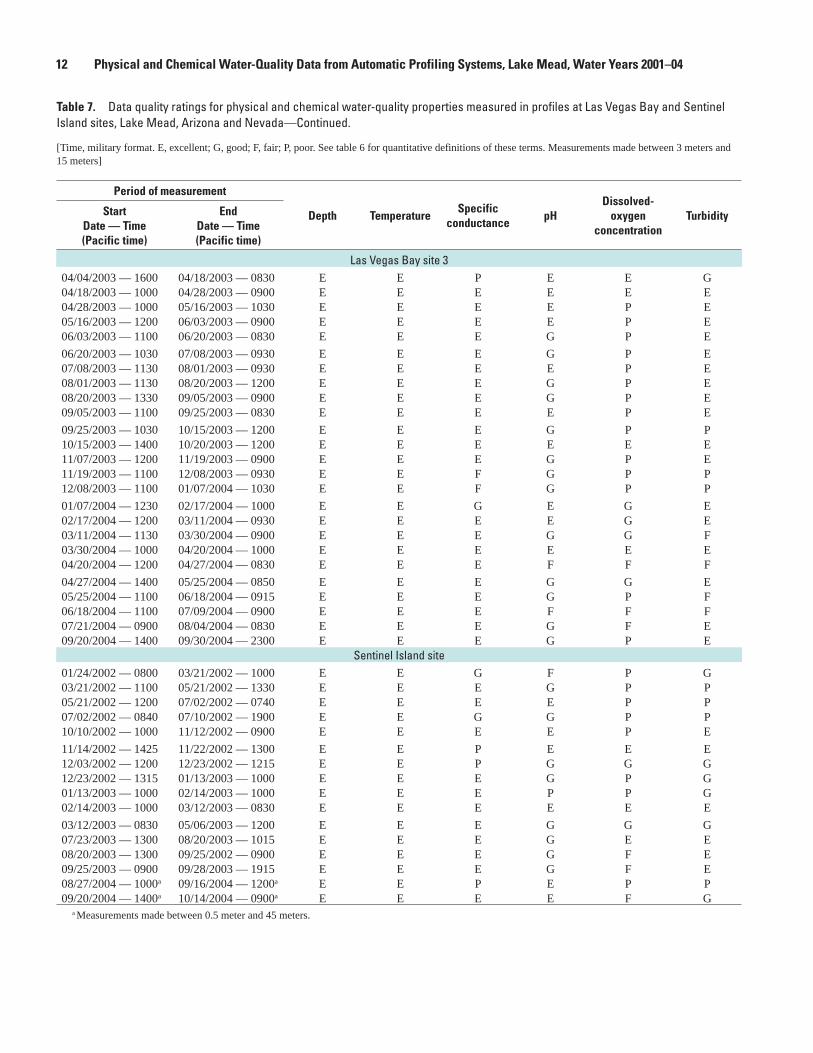
Table �. Data quality ratings for physical and chemical water-quality properties measured in profiles at Las Vegas Bay and Sentinel Island sites, Lake Mead, Arizona and Nevada—Continued.
[Time, military format. E, excellent; G, good; F, fair; P, poor. See table 6 for quantitative definitions of these terms. Measurements made between 3 meters and 15 meters]
Period of measurement
Depth TemperatureSpecific
conductancepH
Dissolved- oxygen
concentrationTurbidityStart
Date — Time(Pacific time)
EndDate — Time(Pacific time)
Las Vegas Bay site 304/04/2003 — 1600 04/18/2003 — 0830 E E P E E G04/18/2003 — 1000 04/28/2003 — 0900 E E E E E E04/28/2003 — 1000 05/16/2003 — 1030 E E E E P E05/16/2003 — 1200 06/03/2003 — 0900 E E E E P E06/03/2003 — 1100 06/20/2003 — 0830 E E E G P E
06/20/2003 — 1030 07/08/2003 — 0930 E E E G P E07/08/2003 — 1130 08/01/2003 — 0930 E E E E P E08/01/2003 — 1130 08/20/2003 — 1200 E E E G P E08/20/2003 — 1330 09/05/2003 — 0900 E E E G P E09/05/2003 — 1100 09/25/2003 — 0830 E E E E P E
09/25/2003 — 1030 10/15/2003 — 1200 E E E G P P10/15/2003 — 1400 10/20/2003 — 1200 E E E E E E11/07/2003 — 1200 11/19/2003 — 0900 E E E G P E11/19/2003 — 1100 12/08/2003 — 0930 E E F G P P12/08/2003 — 1100 01/07/2004 — 1030 E E F G P P
01/07/2004 — 1230 02/17/2004 — 1000 E E G E G E02/17/2004 — 1200 03/11/2004 — 0930 E E E E G E03/11/2004 — 1130 03/30/2004 — 0900 E E E G G F03/30/2004 — 1000 04/20/2004 — 1000 E E E E E E04/20/2004 — 1200 04/27/2004 — 0830 E E E F F F
04/27/2004 — 1400 05/25/2004 — 0850 E E E G G E05/25/2004 — 1100 06/18/2004 — 0915 E E E G P F06/18/2004 — 1100 07/09/2004 — 0900 E E E F F F07/21/2004 — 0900 08/04/2004 — 0830 E E E G F E09/20/2004 — 1400 09/30/2004 — 2300 E E E G P E
Sentinel Island site 01/24/2002 — 0800 03/21/2002 — 1000 E E G F P G03/21/2002 — 1100 05/21/2002 — 1330 E E E G P P05/21/2002 — 1200 07/02/2002 — 0740 E E E E P P07/02/2002 — 0840 07/10/2002 — 1900 E E G G P P10/10/2002 — 1000 11/12/2002 — 0900 E E E E P E
11/14/2002 — 1425 11/22/2002 — 1300 E E P E E E12/03/2002 — 1200 12/23/2002 — 1215 E E P G G G12/23/2002 — 1315 01/13/2003 — 1000 E E E G P G01/13/2003 — 1000 02/14/2003 — 1000 E E E P P G02/14/2003 — 1000 03/12/2003 — 0830 E E E E E E
03/12/2003 — 0830 05/06/2003 — 1200 E E E G G G07/23/2003 — 1300 08/20/2003 — 1015 E E E G E E08/20/2003 — 1300 09/25/2002 — 0900 E E E G F E09/25/2003 — 0900 09/28/2003 — 1915 E E E G F E08/27/2004 — 1000a 09/16/2004 — 1200a E E P E P P09/20/2004 — 1400a 10/14/2004 — 0900a E E E E F G
a Measurements made between 0.5 meter and 45 meters.
12 Physical and Chemical Water-Quality Data from Automatic Profiling Systems, Lake Mead, Water Years 2001–04
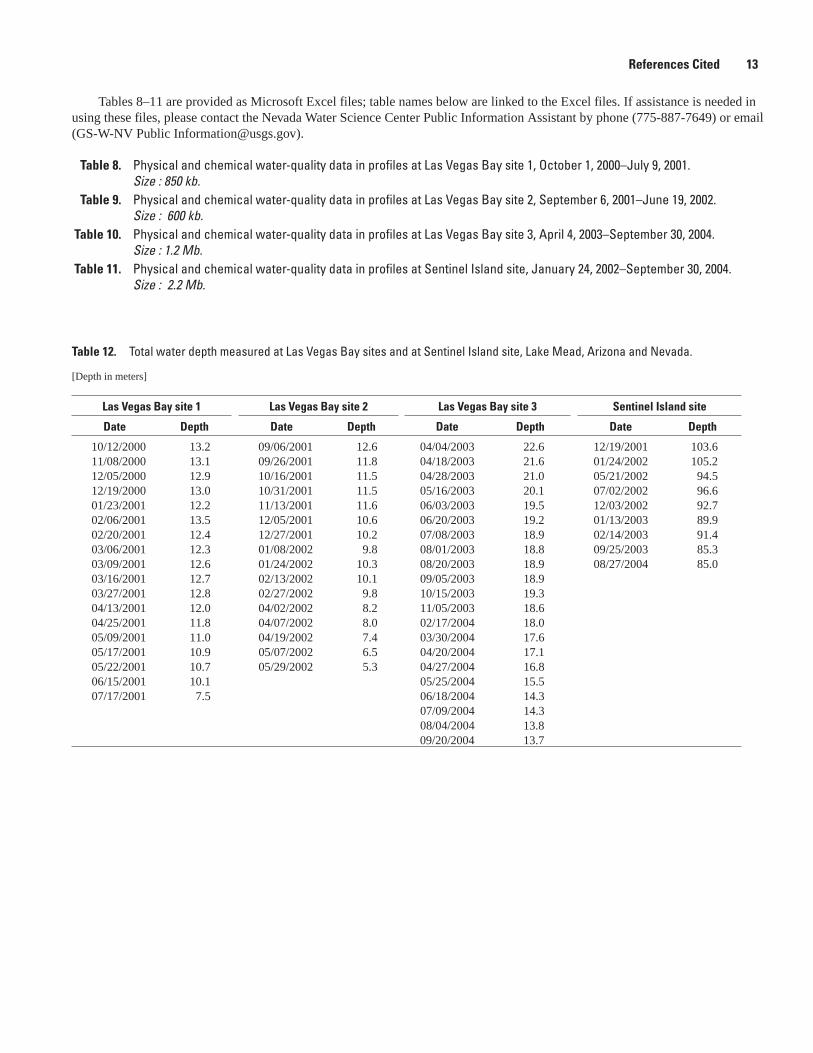
Tables 8–11 are provided as Microsoft Excel files; table names below are linked to the Excel files. If assistance is needed in using these files, please contact the Nevada Water Science Center Public Information Assistant by phone (775-887-7649) or email (GS-W-NV Public [email protected]).
Table �. Physical and chemical water-quality data in profiles at Las Vegas Bay site 1, October 1, 2000–July 9, 2001. Size : 850 kb.
Table �. Physical and chemical water-quality data in profiles at Las Vegas Bay site 2, September 6, 2001–June 19, 2002. Size : 600 kb.
Table 10. Physical and chemical water-quality data in profiles at Las Vegas Bay site 3, April 4, 2003–September 30, 2004. Size : 1.2 Mb.
Table 11. Physical and chemical water-quality data in profiles at Sentinel Island site, January 24, 2002–September 30, 2004. Size : 2.2 Mb.
Table 12. Total water depth measured at Las Vegas Bay sites and at Sentinel Island site, Lake Mead, Arizona and Nevada.
[Depth in meters]
Las Vegas Bay site 1 Las Vegas Bay site 2 Las Vegas Bay site � Sentinel Island site
Date Depth Date Depth Date Depth Date Depth
10/12/2000 13.2 09/06/2001 12.6 04/04/2003 22.6 12/19/2001 103.611/08/2000 13.1 09/26/2001 11.8 04/18/2003 21.6 01/24/2002 105.212/05/2000 12.9 10/16/2001 11.5 04/28/2003 21.0 05/21/2002 94.512/19/2000 13.0 10/31/2001 11.5 05/16/2003 20.1 07/02/2002 96.601/23/2001 12.2 11/13/2001 11.6 06/03/2003 19.5 12/03/2002 92.702/06/2001 13.5 12/05/2001 10.6 06/20/2003 19.2 01/13/2003 89.902/20/2001 12.4 12/27/2001 10.2 07/08/2003 18.9 02/14/2003 91.403/06/2001 12.3 01/08/2002 9.8 08/01/2003 18.8 09/25/2003 85.303/09/2001 12.6 01/24/2002 10.3 08/20/2003 18.9 08/27/2004 85.003/16/2001 12.7 02/13/2002 10.1 09/05/2003 18.903/27/2001 12.8 02/27/2002 9.8 10/15/2003 19.304/13/2001 12.0 04/02/2002 8.2 11/05/2003 18.604/25/2001 11.8 04/07/2002 8.0 02/17/2004 18.005/09/2001 11.0 04/19/2002 7.4 03/30/2004 17.605/17/2001 10.9 05/07/2002 6.5 04/20/2004 17.105/22/2001 10.7 05/29/2002 5.3 04/27/2004 16.806/15/2001 10.1 05/25/2004 15.507/17/2001 7.5 06/18/2004 14.3
07/09/2004 14.308/04/2004 13.809/20/2004 13.7
References Cited 1�
NV16-0019_fig07
0
2
4
6
8
10
12
0
2
4
6
8
10
12
0
2
4
6
8
10
12
TEMPERATURE, IN DEGREES CELSIUS
DEPT
H, IN
MET
ERS
BELO
W W
ATER
SUR
FACE
SPECIFIC CONDUCTANCE, IN MICROSIEMENS PER CENTIMETER
pH, IN STANDARD UNITS DISSOLVED-OXYGEN CONCENTRATION, IN MILLIGRAMS PER LITER
TURBIDITY, IN FORMAZIN NEPHELOMETRIC TURBIDITY UNITS
PROFILE START TIMEEXPLANATION
October 15, 2000 @ 1303
January 15, 2001 @ 1206
April 15, 2001 @ 1320
July 9, 2001 @ 1220
10 30252015 35 2,2002,0001,8001,6001,4001,2001,000800
7.0 8.0 8.2 8.4 8.6 8.87.87.4 7.67.2 9.0 0 642 8 10 12
0 50 250200150100 300
Figure �. Plots of physical and chemical water-quality properties in selected profiles recorded at Las Vegas Bay site 1, Lake Mead, Arizona and Nevada.
14 Physical and Chemical Water-Quality Data from Automatic Profiling Systems, Lake Mead, Water Years 2001–04

NV16-0019_fig08
PROFILE START TIMEEXPLANATION
September 15, 2001 @ 1332
December 15, 2001 @ 1255
March 15, 2002 @ 1234
June 15, 2002 @ 1313
4
2
0
6
8
10
12
TEMPERATURE, IN DEGREES CELSIUS SPECIFIC CONDUCTANCE, IN MICROSIEMENS PER CENTIMETER
pH, IN STANDARD UNITS DISSOLVED-OXYGEN CONCENTRATION, IN MILLIGRAMS PER LITER
TURBIDITY, IN FORMAZIN NEPHELOMETRIC TURBIDITY UNITS
4
2
0
6
8
12
10
4
2
0
6
8
10
120 50 250200150100 300
DEPT
H, IN
MET
ERS
BELO
W W
ATER
SUR
FACE 10 30252015 35 2,2002,0001,8001,6001,4001,2001,000800
0 642 8 10 127.0 8.0 8.2 8.4 8.6 8.87.87.4 7.67.2 9.0
Figure �. Plots of physical and chemical water-quality properties in selected profiles recorded at Las Vegas Bay site 2, Lake Mead, Arizona and Nevada.
References Cited 15

NV16-0019_fig09
pH, IN STANDARD UNITS DISSOLVED-OXYGEN CONCENTRATION, IN MILLIGRAMS PER LITER
TURBIDITY, IN FORMAZIN NEPHELOMETRIC TURBIDITY UNITS
20
18
16
14
12
10
8
6
4
2
0
TEMPERATURE, IN DEGREES CELSIUS SPECIFIC CONDUCTANCE, IN MICROSIEMENS PER CENTIMETER
20
18
16
14
12
10
8
6
4
2
0
20
18
16
14
12
10
8
6
4
2
0
7.0 8.0 8.2 8.4 8.6 8.87.87.4 7.67.2 9.0 0 642 8 10 12
DEPT
H, IN
MET
ERS
BELO
W W
ATER
SUR
FACE
10 30252015 35 2,2002,0001,8001,6001,4001,2001,000800
0 50 250200150100 300
PROFILE START TIMEEXPLANATION
April 15, 2003 @ 1136
July 15, 2003 @ 1338
October 15, 2003 @ 1935
January 15, 2004 @ 1225
April 15, 2004 @ 1341
July 8, 2004 @ 1324
Figure �. Plots of physical and chemical water-quality properties in selected profiles recorded at Las Vegas Bay site 3, Lake Mead, Arizona and Nevada.
1� Physical and Chemical Water-Quality Data from Automatic Profiling Systems, Lake Mead, Water Years 2001–04
NV16-0019_fig10
PROFILE START TIMEEXPLANATION
January 24, 2002 @ 1806
June 15, 2002 @ 1411
October 12, 2002 @ 1007
December 10, 2002 @ 0942
September 15, 2003 @ 1314
September 15, 2004 @ 1308
pH, IN STANDARD UNITS DISSOLVED-OXYGEN CONCENTRATION, IN MILLIGRAMS PER LITER
0 0.5 1.0 1.5 2.0 2.5
TEMPERATURE, IN DEGREES CELSIUS SPECIFIC CONDUCTANCE, IN MICROSIEMENS PER CENTIMETER
100
90
80
70
60
50
40
30
20
10
100
90
80
70
60
50
40
30
20
10
0
0
100
90
80
70
60
50
40
30
20
10
0
7.0 8.0 8.2 8.4 8.6 8.87.87.4 7.67.2 9.0
DEPT
H, IN
MET
ERS
BELO
W W
ATER
SUR
FACE
TURBIDITY, IN FORMAZIN NEPHELOMETRIC TURBIDITY UNITS
10 30252015 35 2,2002,0001,8001,6001,4001,2001,000800
0 642 8 10 12
Figure 10. Plots of physical and chemical water-quality properties in selected profiles recorded at Sentinel Island site, Lake Mead, Arizona and Nevada.
References Cited 1�

This page intentionally left blank.
1� Physical and Chemical Water-Quality Data from Automatic Profiling Systems, Lake Mead, Water Years 2001–04

Rowland and others—
Physical and Chemical W
ater-Quality D
ata from A
utomatic Profiling System
s, Boulder B
asin, Lake Mead, A
rizona and Nevada, W
ater Years 2001–04—USGS OFR 2006-1284