Embed Size (px)
Citation preview

State Water Survey Division WATER QUALITY SECTION
AT PEORIA, ILLINOIS
SWS Contract Report 274
PHYSICAL, CHEMICAL, AND BIOLOGICAL WATER QUALITY
CHARACTERISTICS OF LAKE ELLYN
by
Thomas E. Hill, David L. Hullinger, and V. Kothandaraman
Final Report Submitted to the Northeastern Illinois Planning Commission
August 31, 1981

CONTENTS
PAGE Introduction 1
Scope of work 1
Methods 1
Results and observations 4
Acknowledgments 5
References 6
Table 1 7
Table 2 14
Table 3 . 18
Table 4 22

PHYSICAL, CHEMICAL, AND BIOLOGICAL WATER QUALITY CHARACTERISTICS
OF LAKE ELLYN
by Thomas E. Hill, David L. Hullinger, and V. Kothandaraman
INTRODUCTION
As a part of the major efforts undertaken by the Northeastern Illinois Planning Commission (NIPC) under the National Urban Runoff Program to evaluate the water quality effects of storm water detention storage, the Water Quality Section of the Illinois State Water Survey carried out field and laboratory investigations to characterize the physical, chemical, and biological nature of the water column in Lake Ellyn. The investigation was performed by the Illinois State Water Survey in accordance with the contractual arrangements (1-44-26-84-355-000) between NIPC and the Board of Trustees, University of Illinois, commencing on July 1, 1980, and ending on August 31, 1981. The results of four sampling trips and the subsequent laboratory analyses are summarized and discussed in this report.
SCOPE OF WORK
Temporal and spatial variations in the lake water quality characteristics were monitored through a series of intensive three-day sampling programs conducted in July, August, and October of 1980, and in April of 1981.
During each of these three-day sampling schedules, in-situ observations were made for dissolved oxygen and temperature. On-site determinations for pH and alkalinity were made. Depth integrated water samples were also collected for chemical and biological characterizations. The following chemical analyses were performed on the water samples: chloride, chemical oxygen demand, total phosphate-P, total dissolved phosphate-P, total ortho phosphate-P, dissolved ortho phosphate-P, total ammonia-N, dissolved ammonia-N, dissolved nitrate and nitrite-N, suspended solids, dissolved solids, total and dissolved organic nitrogen, and total and dissolved Kjeldahl nitrogen. Also, determinations were made for the total and dissolved fractions of the following metals: arsenic, cadmium, copper, chromium, iron, lead, mercury, and zinc.
The identification and enumeration of algae and zooplankton were also performed.
METHODS
Lake Ellyn water quality characteristics were examined by means of an intensive three-day sampling program on four different occasions: July 29-31, 1980; August 26-28, 1980; October 28-30, 1980; and April 20-22, 1981. During
1

the first visit to the lake, samples were collected at two stations, A and B (figure 1). As the data gathered at these stations were not significantly different, samples were collected only at station B during subsequent visits.
During each of these field visits, diel observations and sample collections at 2-hour intervals were made for dissolved oxygen, temperature, pH, alkalinity, and chlorophyll-a. Also water samples were collected at 12-hour intervals (at noon and midnight) covering a period of two days for chemical and biological examinations.
In-situ dissolved oxygen and temperature measurements were made with a galvanic cell oxygen analyzer equipped with a thermister. An oxygen meter, Yellow Spring Instrument Company Model 54, was standardized in lake surface water in which dissolved oxygen content was determined by the modified Winkler method as outlined by the American Public Health Association (1976). Temperature and dissolved oxygen measurements were obtained in the water column at 1-foot intervals commencing from the surface of the lake.
Samples for diel determinations of pH and alkalinity were obtained from the surface and 2-foot and 4-foot depths. Alkalinity and pH determinations were made in the field using a Metrohm Herisau pH meter. Total alkalinity was determined by titrating a 50-ml sample with a 0.02N sulfuric acid standard solution.
Depth integrated samples were collected for chlorophyll-a determinations. The samples were frozen immediately and kept frozen until analyzed. Also the samples collected at 12-hour intervals for chemical and biological characterizations were all depth integrated samples. Water samples for laboratory chemical analyses were transported in ice and kept refrigerated until analyses were completed.
Laboratory chemical analyses were made according to Standard Methods for the Examination of Water and Wastewater (American Public Health Association, 1976). The procedures used are indicated below:
Chloride Argentometric method Chemical oxygen demand Dichromate reflux method Ortho phosphate-P Ascorbic acid method Total phosphate-P Digestion with sulfuric acid, nitric
acid mixtures and determination by ascorbic acid method
Ammonia-N Distillation followed by endophenol-hypochlorite colorimetric determination
Nitrate and nitrate-N Chromotropic and diazonation methods Kjeldahl-N Digestion and distillation followed
by endophenol-hypochlorite colorimetric determination
2

Figure 1. Lake Ellyn, showing sampling locations
3

For determining the dissolved fractions of various chemical constituents, water samples were filtered through 0.45 µm filters. Filterable solids were determined by filtering water samples through glass fiber filters (Whatman GFC grade) using gooch crucibles.
For heavy metal analyses, the following sample preparation method was used. A representative portion of the water sample was digested several times in a beaker with a concentrated nitric acid and hydrochloric acid mixture on a hot plate, making certain that the sample did not boil. Finally, a small volume of concentrated nitric acid was added to the beaker and warmed to dissolve the residue. The sample was brought up to the desired volume with double deionized water and centrifuged to remove insoluble silicate and other materials.
Concentrations of cadmium, chromium, copper, iron, lead, mercury, and zinc were determined by using atomic absorption spectroscopy as detailed by the American Public Health Association (1976). Arsenic concentrations were determined by the ICP (inductively coupled plasma) procedure.
Water samples in a volume of 380 ml were collected for phytoplankton identification and enumeration. These samples were preserved in 20 ml of formalin at the time of collection and stored at room temperature until examined.
For algal identification and enumeration, the sample was thoroughly mixed and a 1-ml aliquot pipetted into a Sedgwick-Rafter cell. A differential interference contrast microscope equipped with a 10X or 20X eyepiece, 20X or 100X objective, and a Whipple disc was used for identification and counting purposes. Five short strips were counted. The phytoplankton were identified as to species and were classified into five main groups: blue-greens, greens, diatoms, flagellates, and others. For enumeration, blue-green algae were counted by the trichomes. Green algae were counted by individual cells except Actvnastrum, Coelastrum, and Pediastrum, which were recorded by each colony observed. Scenedesmus was counted by each cell packet. Diatoms were counted as one organism regardless of their grouping connections. For flagellates, a colony of Dinobryon or a single cell of Ceratium was recorded as a unit.
For zooplankton identification and enumeration, 20 liters of depth integrated water samples were filtered through a Wisconsin plankton net, and the material retained in the net was washed into a plastic container with deionized water and preserved in 95 percent ethanol.
In the laboratory, the volume of the sample was made up to equal 200 ml, and a 1-ml aliquot was pipetted into a Sedgwick-Rafter cell. A differential interference contrast microscope was used to identify and enumerate the zoo-planktons. Five strips were counted and the results extrapolated.
RESULTS AND OBSERVATIONS
The results of the first 3-day intensive sampling of the Lake Ellyn waters carried out during July 29-31, 1980, are shown in table 1. As the water quality characteristics at these two stations are not significantly different,
4

only station B was monitored subsequently. Consequently, data for station B only are shown in tables 2 to 4.
The diel observations for temperature, dissolved oxygen, pH, alkalinity, and chlorophyll-a are shown for both stations A and B in tables la-e. Results of chemical and BOD determinations, and phytoplankton and zooplankton identification and enumeration for station A are shown respectively in tables 1f, 1g, 1j, and 1k. Likewise results for station B are shown in table 1h, 1i, 1l, and 1m. Values for the three succeeding intensive surveys are similarly arranged in tables 2, 3, and 4.
Even though Lake Ellyn is a shallow lake, it exhibits a 6 C vertical temperature gradient during the afternoon hours in July (table la). The magnitude of this gradient was only about 2°C in August and it was practically absent in October and April.
The lake exhibited a high degree of photosynthetic activity during July and August. Dissolved oxygen in the photic zone exceeded 20 mg/1 during the afternoon hours in July. This observation is reinforced by the fact that chlorophyll-a concentrations were higher. Also at this time there was a concomitant increase in pH and decrease in alkalinity (table 1c and 1d) at the surface when compared with waters at depths below 3 feet. This is mainly because the oxygen demands exerted by the lake bottom sediments on the overlying waters were much higher than the oxygen replenishment from the atmosphere and algal activities.
Diel fluctuations and variations with depth in temperature, DO, pH, and alkalinity were more moderate in August than in July. The lake had practically uniform water quality characteristics with depth in October and April.
Chloride concentration levels found in the lake during April were 3 to 5 orders of magnitude higher than values observed for other periods. This clearly reflects the impact of winter road salt applications. Phosphorus and nitrogen concentrations in their various forms were found to be similar to the values for other lakes in northeastern Illinois (Kothandaraman et al., 1977; Kothanda-raman and Evans, 1979). The heavy metals concentrations found in Lake Ellyn waters were comparable to and sometimes less than the values reported for sixteen central and southern Illinois lakes (Hullinger, '1975).
Algal growths of bloom proportions were observed during all four sampling periods. Algal counts were the highest during July investigations with the blue-green algae being the dominant group. Blue-green algae were the dominant group in August but their numbers were less than in July. Subsequently the dominance shifted to greens in October and then to diatoms in April.
ACKNOWLEDGMENTS
This investigation was sponsored and funded by the Northeastern Illinois Planning Commission and was conducted under the general guidance of Stanley A. Changnon, Jr., Chief of the Illinois State Water Survey. The following person-
5

nel, under the supervision of Ralph L. Evans, Head of the Survey's Water Quality Section, participated in various phases of this investigation: Davis B. Beuscher, Dan Gallagher, Dana B. Shackleford, Brent B. Gregory, Donald Roseboom, and Richard Twait. Linda Johnson typed the manuscript and tables.
REFERENCES
American Public Health Association, American Water Works Association, and Water Pollution Control Federation. 1976. Standard methods for the examination of water and wastewater. American Public Health Association, 1015 Eighteenth Street NW, Washington, D.C. 20036, 1193 p., 14th edition.
Hullinger, David L. 1975. A study of heavy metals in Illinois impoundments. Journal American Water Works Association, vol. 67, no. 10.
Kothandaraman, V., Ralph L. Evans, Nani G. Bhowmik, John B. Stall, David L. Gross, Jerry A. Lineback, and Gary B. Dreher. 1977. Fox Chain of Lakes investigation and water quality management plan. Illinois State Water Survey and Illinois Geological Survey, Cooperative Resources Report 5, 200 p.
Kothandaraman, v., and Ralph L. Evans. 1979. A reconnaissance investigation of the inter quality characteristics of Island Lake. Unpublished report, Water Quality Section, Illinois State Water Survey, Peoria, Illinois.
6
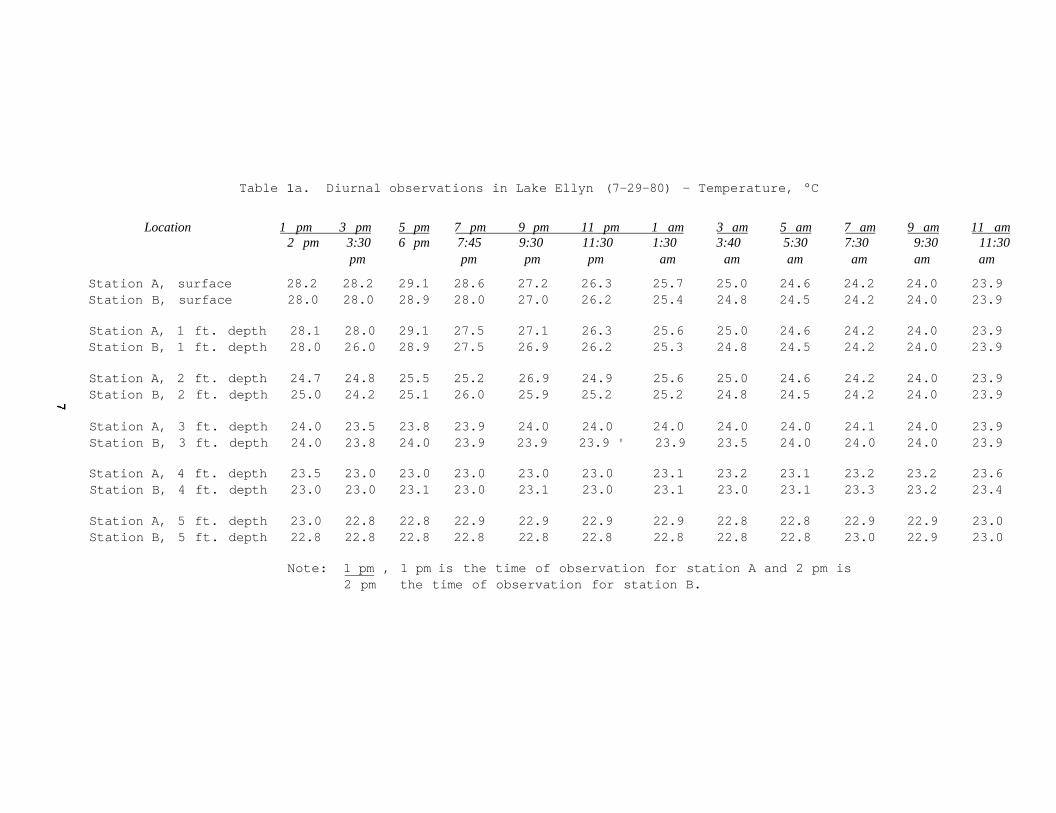
Table 1a. Diurnal observations in Lake Ellyn (7-29-80) - Temperature, °C
Location 1 pm 3 pm 5 pm 7 pm 9 pm 11 pm 1 am 3 am 5 am 7 am 9 am 11 am 2 pm 3:30 6 pm 7:45 9:30 11:30 1:30 3:40 5:30 7:30 9:30 11:30
pm pm pm pm am am am am am am
Station A, surface 28.2 28.2 29.1 28.6 27.2 26.3 25.7 25.0 24.6 24.2 24.0 23.9 Station B, surface 28.0 28.0 28.9 28.0 27.0 26.2 25.4 24.8 24.5 24.2 24.0 23.9
Station A, 1 ft. depth 28.1 28.0 29.1 27.5 27.1 26.3 25.6 25.0 24.6 24.2 24.0 23.9 Station B, 1 ft. depth 28.0 26.0 28.9 27.5 26.9 26.2 25.3 24.8 24.5 24.2 24.0 23.9
Station A, 2 ft. depth 24.7 24.8 25.5 25.2 26.9 24.9 25.6 25.0 24.6 24.2 24.0 23.9 Station B, 2 ft. depth 25.0 24.2 25.1 26.0 25.9 25.2 25.2 24.8 24.5 24.2 24.0 23.9
Station A, 3 ft. depth 24.0 23.5 23.8 23.9 24.0 24.0 24.0 24.0 24.0 24.1 24.0 23.9 Station B, 3 ft. depth 24.0 23.8 24.0 23.9 23.9 23.9 ' 23.9 23.5 24.0 24.0 24.0 23.9
Station A, 4 ft. depth 23.5 23.0 23.0 23.0 23.0 23.0 23.1 23.2 23.1 23.2 23.2 23.6 Station B, 4 ft. depth 23.0 23.0 23.1 23.0 23.1 23.0 23.1 23.0 23.1 23.3 23.2 23.4
Station A, 5 ft. depth 23.0 22.8 22.8 22.9 22.9 22.9 22.9 22.8 22.8 22.9 22.9 23.0 Station B, 5 ft. depth 22.8 22.8 22.8 22.8 22.8 22.8 22.8 22.8 22.8 23.0 22.9 23.0
Note: 1 pm , 1 pm is the time of observation for station A and 2 pm is 2 pm the time of observation for station B.

Table 1b. Diurnal observations in Lake Ellyn (7-29-80) - Dissolved Oxygen, mg/1
Location 1pm 3 pm 5 pm 7 pm 9 pm 11 pm 1 am 3 am 5 am 7 am 9 am 11 am 2 pm 3:30 6 pm 7:45 9:30 11:30 1:30 3:40 5:30 7:30 9:30 11:30
pm pm pm pm am am am am am am
Station A, Surface 20.0+ 19.5 19.4 20.0+ 20.0+ 19.0 16.0 14.2 12.2 10.0 9.5 8.8 Station B, Surface 20.0+ 20.1 20.0+ 20.0+ 20.0+ 18.2 16.2 14.0 12.2 10.4 11.0 10.2
Station A, 1 ft. depth 20.1 20.0 20.1 20.0+ 20.0+ 18.6 15.9 14.4 12.2 10.0 9.4 8.8 Station B, 1 ft. depth 20.0 20.0+ 20.0+ 20.0+ 19.8 18.0 16.2 14.2 12.2 10.4 11.0 10.2
Station A, 2 ft. depth 12.0 12.2 14.6 14.5 16.2 14.8 15.8 14.4 12.2 10.0 8.8 8.8 Station B, 2 ft. depth 11.8 10.0 16.2 15.8 14.2 14.3 15.1 13.6 12.2 10.4 11.0 10.2
Station A, 3 ft. depth 7.7 3.5 5.4 5.7 6.3 6.2 4.9 3.3 3.5 9.1 8.4 8.7 Station B, 3 ft. depth 0.8 . 5.3 5.2 5.2 5.3 5.2 4.2 1.5 2.4 2.4 7.2 9.8
Station A, 4 ft. depth 1.6 0.4 0.4 0.4 0.4 0.3 0.3 0.3 0.3 0.2 0.2 1.3 Station B, 4 ft. depth 0.4 0.4 0.6 0.3 0.3 0.3 0.3 0.3 0.2 0.2 0.2 2.2
Station A, 5 ft. depth 0.4 0.2 0.2 0.1 0.2 0.2 0.2 0.2 0.2 0.2 0.2 0.2 Station B, 5 ft. depth 0.3 0.2 0.2 0.2 0.2 0.1 0.1 0.2 0.2 0.2 0.2 0.2
Note: 1 pm , 1 pm is the time of observation for Station A and 2 pm 2 pm is the time of observation for Station B.

Table 1c. Diurnal observation in Lake Ellyn (7-29-80) - pH
Location 1 pm 3 pm 5 pm 7 pm 9 pm 11 pm 1 am 3 am 5 am 7 am 9 am 11 am 2 pm 3:30 6 pm 7:45 9:30 11:30 1:30 3:40 5:30 7:30 9:30 11:30
pm pm pm pm am am am am am am
Station A, surface 9.92 9.92 10.30 10.42 10.13 9.95 9.78 9.65 9.52 9.43 9.35 9.25 Station B, surface 10.00 10.02 10.30 10.22 10.05 9.91 9.75 9.55 9.58 9.50 9.40 9.43
Station A, 2 ft. depth 9.30 9.20 9.62 9.32 9.20 9.15 9.23 9.48 9.42 9.40 .9.35 9.25 Station B, 2 ft. depth 9.25 9.18 9.42 9.38 9.30 9.28 9.18 9.15 9.58 9.48 9.40 9.43
Station A, 4 ft. depth 8.18 8.29 8.25 8.30 8.00 7.90 7.95 7.88 7.85 8.00 7.93 7.90 Station B, 4 ft. depth 8.38 8.28 8.00 7.80 7.85 7.65 7.73 7.83 7.78 8.05 7.90 7.80
Table 1d. Diurnal observation in Lake Ellyn (7-29-80) - alkalinity, mg/1 as CaCO3
Location 1 pm 3 pm 5 pm 7 pm 9 pm 11 pm 1 am 3 am 5 am 7 am 9 am 11 am 2 pm 3:30 6 pm 7:45 9:30 11:30 1:30 3:40 5:30 7:30 9:30 11:30
pm pm pm pm am am am am am am
Station A, surface 76 109 109 105 96 96 90 95 95 93 93 91 Station B, surface 105 107 107 105 96 95 93 87 95 91 93 90
Station A, 2 ft. depth 101 115 112 111 105 101 96 97 93 90 90 94 Station B, 2 ft. depth 111 113 113 105 101 100 95 95 95 89 90 88
Station A, 4 ft. depth 107 125 123 119 111 114 107 107 117 103 109 112 Station B, 4 ft. depth 119 123 125 140 111 113 112 108 115 105 108 108
Table 1e. Diurnal observation in Lake Ellyn (7-29-80) - Chlorophyll a, mg/m3
Location 1 pm 3 pm 5 pm 7 pm 9 pm 11 pm 1 am 3 am 5 am 7 am 9 am 11 am 2 pm 3:30 6 pm 7:45 9:30 11:30 1:30 3:40 5:30 7:30 9:30 11:30
pm pm pm pm am am am am am am
Station A 52.0 48.0 49.0 40.0 40.0 38.0 37.0 37.0 35.0 35.0 35.0 36.0 Station B 39.0 33.0 43.0 41.0 35.0 35.0 36.0 41.0 36.0 34.0 30.0 35.0
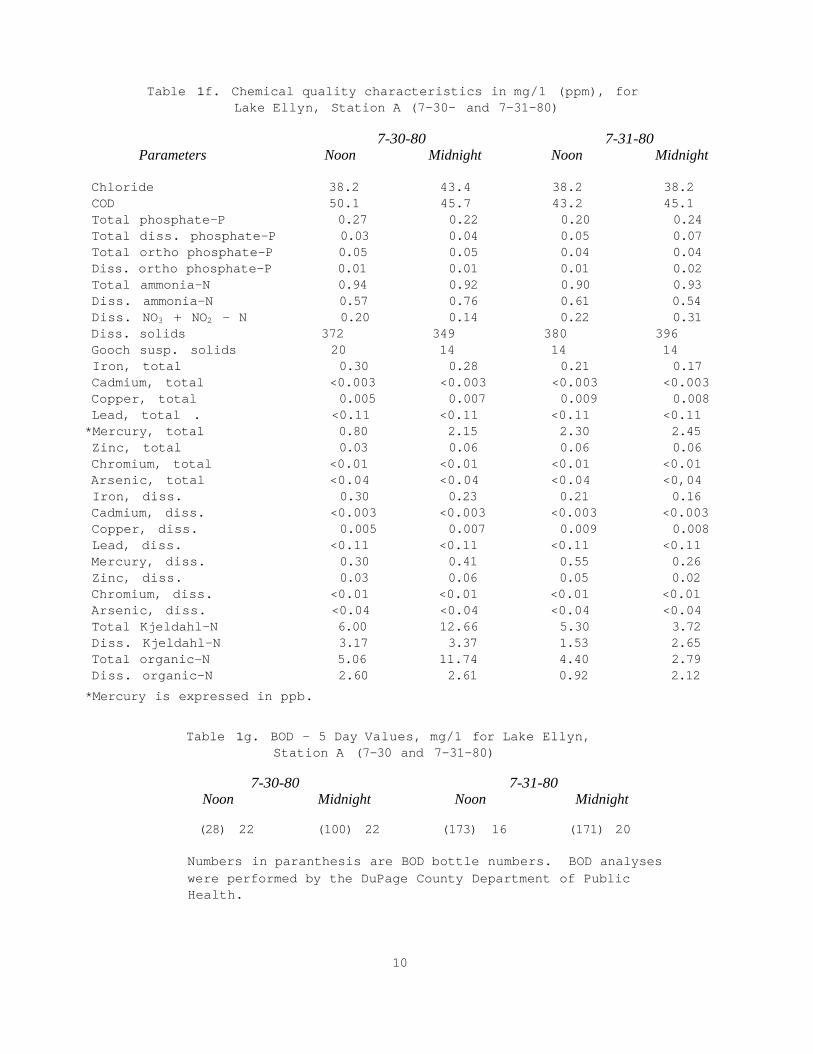
Table 1f. Chemical quality characteristics in mg/1 (ppm), for Lake Ellyn, Station A (7-30- and 7-31-80)
7-30-80 7-31-80 Parameters Noon Midnight Noon Midnight
Chloride 38.2 43.4 38.2 38.2 COD 50.1 45.7 43.2 45.1 Total phosphate-P 0.27 0.22 0.20 0.24 Total diss. phosphate-P 0.03 0.04 0.05 0.07 Total ortho phosphate-P 0.05 0.05 0.04 0.04 Diss. ortho phosphate-P 0.01 0.01 0.01 0.02 Total ammonia-N 0.94 0.92 0.90 0.93 Diss. ammonia-N 0.57 0.76 0.61 0.54 Diss. NO3 + NO2 - N 0.20 0.14 0.22 0.31 Diss. solids 372 349 380 396 Gooch susp. solids 20 14 14 14 Iron, total 0.30 0.28 0.21 0.17 Cadmium, total <0.003 <0.003 <0.003 <0.003 Copper, total 0.005 0.007 0.009 0.008 Lead, total . <0.11 <0.11 <0.11 <0.11 *Mercury, total 0.80 2.15 2.30 2.45 Zinc, total 0.03 0.06 0.06 0.06 Chromium, total <0.01 <0.01 <0.01 <0.01 Arsenic, total <0.04 <0.04 <0.04 <0,04 Iron, diss. 0.30 0.23 0.21 0.16 Cadmium, diss. <0.003 <0.003 <0.003 <0.003 Copper, diss. 0.005 0.007 0.009 0.008 Lead, diss. <0.11 <0.11 <0.11 <0.11 Mercury, diss. 0.30 0.41 0.55 0.26 Zinc, diss. 0.03 0.06 0.05 0.02 Chromium, diss. <0.01 <0.01 <0.01 <0.01 Arsenic, diss. <0.04 <0.04 <0.04 <0.04 Total Kjeldahl-N 6.00 12.66 5.30 3.72 Diss. Kjeldahl-N 3.17 3.37 1.53 2.65 Total organic-N 5.06 11.74 4.40 2.79 Diss. organic-N 2.60 2.61 0.92 2.12 *Mercury is expressed in ppb.
Table 1g. BOD - 5 Day Values, mg/1 for Lake Ellyn, Station A (7-30 and 7-31-80)
7-30-80 7-31-80 Noon Midnight Noon Midnight
(28) 22 (100) 22 (173) 16 (171) 20
Numbers in paranthesis are BOD bottle numbers. BOD analyses were performed by the DuPage County Department of Public Health.
10

Table 1h. Chemical quality characteristics in mg/1 (ppm), for Lake Ellyn, Station B (7-30 and 7-31-80)
7-30-80 7-31-80 Parameters Noon Midnight Noon Midnight
Chloride 37.8 37.6 38.2 38.2 COD 53.3 47.2 47.7 41.5 Total phosphate-P 0.26 0.29 0.21 0.26 Total diss. phosphate-P 0.02 0.04 0.02 0.07 Total ortho phosphate-P 0.05 0.06 0.04 0.05 Diss. ortho phosphate-P 0.02 0.02 0.01 0.03 Total ammonia-N 0.92 0.92 0.75 0.76 Diss. ammonia-N 0.57 0.59 0.64 0.65 Diss. NO3 + NO2 - N 0.30 0.28 0.44 0.35 Diss. solids 371 374 380 398 Gooch susp. solids 19 18 14 14 Iron, total 0.17 0.17 0.16 0.24 Cadmium, total <0.003 <0.003 <0.003 <0.003 Copper, total 0.008 0.008 0.008 0.008 Lead, total <0.11 <0.11 <0.11 <0.11 Mercury, total 0.98 0.76 0.50 0.55 Zinc, total 0.03 0.03 0.03 0.06 Chromium, total <0.01 <0.01 <0.01 <0.01 Arsenic, total <0.04 <0.04 <0.04 <0.04 Iron, diss. 0.12 0.16 0.16 0.12 Cadmium, diss. <0.003 <0.003 <0.003 <0.003 Copper, diss. 0.007 0.008 0.008 0.008 Lead, diss. <0.11 <0.11 <0.11 <0.11 Mercury, diss. 0.28 0.16 0.22 0.11 Zinc, diss. 0.03 0.03 0.03 0.05 Chromium, diss. <0.01 <0.01 <0.01 <0.01 Arsenic, diss. <0.04 <0.04 <0.04 <0.04 Total kjeldahl-N 12.61 4.75 6.31 19.30 Diss. kjeldahl-N 2.97 3.46 5.24 12.38 Total organic-N 11.69 3.83 5.56 18.54 Diss. organic-N 2.40 2.87 4.60 11.73
Mercury is expressed in ppb.
Table 1i. BOD 5 Day Values, mg/1, for Lake Ellyn, Station B (7-30 and 7-31-80)
7-30-80 7-31-80 Noon Midnight Noon Midnight
(172) 18 (102) 23 (44) 19 (27) 18
Numbers in paranthesis are BOD bottle numbers. BOD analyses were performed by the DuPage County Department of Public Health.
11

Table 1j. Phytoplankton data, counts/ml, for Lake Ellyn, Station A (7-30 and 7-31-80)
7-30-80 7-31-80 Types and Species Noon Midnight Noon Midnight
Blue-greens Aphanizomenon flos-aquae 92,720 149,260 95,080 165,950 Anabaena spiroides 950
Greens Actinastrum hantzschii 100 370 1,000 Scenedesmus carinatus 630 370 1,260 Ulothrix variablis 31,550 2,050
Diatoms Tabellaris fenestrata 110
Flagellates Euglena viridis 1,100 Trachelomonas crebea 260 370
Total Count 92,820 151,470 128,210 170,630
Table 1k. Zooplankton data, counts/1, for Lake Ellyn, Station A (7-30 and 7-31-80)
7-30-80 7-31-80 Organisms Noon Midnight Noon Midnight
*Chaoborus 500 — 100
Senecella calanoides 100 800 —
Total Counts 100 1,300 0 100
* Chaoborus are midge fly larvae
12

Table 1l. Phytoplankton data, counts/ml, for Lake Ellyn Station B (7-30 and 7-31-80)
7-30-80 7-31-80 Types and species Noon Midnight Noon Midnight
Blue-greens Aphanizomenon flos-aquae 110,990 167,900 74,030 137,180
Greens Actinastrum hantzschii 420 1,520 Ankistrodesmus falcatus 370 1,630 Scenedesmus carinatus 1,370 690 1,420 Ulothrix variablis 370 53,180
Diatoms Tabellaria fenestrata 420
Flagellates Trachelomonas crebea 210
Total Counts 111,780 170,790 75,090 194,040
Table 1m. Zooplankton data, counts/1, for Lake Ellyn, Station B (7-30 and 7-31-80)
7-30-80 7-31-80 Organisms Noon Midnight Noon Midnight
*Chaoborus — 200 — 400 Daphnia pulex — — — 100 Diaptomus minutus — 500 — Mosquito larvae — 400
Total Counts 0 1,100 0 500
*Chaoborus are midge fly larvae
13

Table 2 a . D i u r n a l O b s e r v a t i o n s a t S t a t i o n B in Lake E l l y n (8 -26 -80 ) - T e m p e r a t u r e °C
Depth 2:30 4:30 6:30 8:30 10:30 12:30 2:30 4:30 6:30 8:30 10:30 12:30 (ft) pm pm pm pm pm am am am am am am pm
0 27 .2 2 8 . 6 2 8 . 0 2 7 . 1 26 .2 2 6 . 5 2 5 . 9 2 5 . 0 2 4 . 9 2 5 . 0 2 6 . 8 2 8 . 1 1 2 7 . 1 2 8 . 3 2 7 . 8 2 7 . 1 2 6 . 5 2 6 . 5 2 6 . 0 2 5 . 3 2 4 . 9 2 5 . 1 2 6 . 3 27 .7 2 2 7 . 0 2 8 . 0 2 7 . 7 2 7 . 1 2 6 . 8 2 6 . 5 2 6 . 0 2 5 . 5 2 5 . 2 2 5 . 1 2 5 . 8 2 7 . 0 3 2 6 . 0 2 6 . 9 26 .2 2 6 . 5 2 6 . 3 2 6 . 0 2 6 . 0 2 5 . 5 25 .2 2 5 . 1 2 5 . 5 2 6 . 0 4 2 5 . 5 2 5 . 7 2 5 . 5 2 5 . 4 2 5 . 8 2 5 . 5 25 .2 2 5 . 3 2 5 . 1 2 5 . 0 2 5 . 4 2 5 . 0 5 2 5 . 0 2 5 . 1 2 4 . 9 2 4 . 9 2 5 . 0 2 4 . 7 2 4 . 8 2 4 . 8 2 4 . 8 2 4 . 8 2 5 . 0 2 5 . 3
Table 2b. Diurnal Observations at Station B,in Lake Ellyn (8-26-80) Dissolved Oxygen, mg/1
Depth 2:30 4:30 6:30 8:30 10:30 12:30 2:30 4:30 6:30 8:30 10:30 12:30 (ft) pm pm pm pm pm am am am am am am pm
0 16.6 18.1 18.8 17.2 17.0 16.3 14.6 11.8 11.6 12.0 13.4 15.4 1 16.3 18.0 15.6 16.6 16.2 16.3 14.6 11.7 11.6 12.1 13.4 15.8 2 17.0 17.8 14.1 15.0 15.8 15.8 14.2 11.4 11.4 12.0 12.8 15.8 3 13.9 14.6 11.2 12.6 13.4 12.4 13.8 11.4 11.1 11.4 10.6 13.8 4 11.9 12.4 9.5 9.4 8.6 7.8 7.8 9.2 10.6 8.6 10.4 12.5 5 9.9 10.0 7.4 7.8 6.4 5.0 4.1 6.7 3.8 6.6 6.9 10.8
14

Table 2c. Diurnal Observations at Station B in Lake. Ellyn (8-26-80) - pH
Depth 2:30 4:30 6:30 8:30 10:30 12:30 2:30 4:30 6:30 8:30 10:30 12:30 (ft) pm pm pm pm pm am am am am am am pm
0 9.52 9.65 9.70 9.65 9.58 9.57 9.49 9.32 9.22 9.27 9.38 9.48 2 9.42 9.55 9.60 9.50 9.53 9.50 9.43 9.25 9.20 9.20 9.22 9.45 4 9.00 9.02 8.95 8.70 8.64 8.57 8.60 8.30 8.57 8.35 8.81 9.12
Table 2d. Diurnal Observations at Station B in Lake Ellyn (8-26-80) Alkalinity, mg/1 as CaCO3
Depth 2:30 4:30 6:30 8:30 10:30 12:30 2:30 4:30 6:30 8:30 10:30 12:30 (ft) pm pm pm pm pm am am am am am am pm
0 — 109 105 108 101 104 103 107 108 110 105 106 2 91 108 109 112 100 102 103 106 112 112 106 111 4 108 116 114 122 114 117 113 119 114 116 114 111
Table 2e. Diurnal Observations at Station B in Lake Ellyn (8-26-80) Chlorophyll a, mg/m3
2:30 4:30 6:30 8:30 10:30 12:30 2:30 4:30 6:30 8:30 10:30 12:30 pm pm pm pm pm am am am am am am pm
37.0 40.0 48.0 41.0 40.0 40.0 40.0 36.0 36.0 40.0 40.0 36.0
15

Table 2f. Chemical quality characteristics in mg/1 (ppm), for Lake Ellyn, Station B (8-27 and 8-28-80)
8-27-80 8-28-80 Parameters Noon Midnight Noon Midnight
Chloride 63.0 62.2 63.5 64.0 COD 41.2 42.5 40.0 38.6 Total phosphate-P 0.22 0.22 0.22 0.21 Total diss. phosphate-P 0.09 0.11 0.10 0.08 Total ortho phosphate-P 0.03 0.03 0.03 0.04 Diss. ortho phosphate-P 0.03 0.01 0.03 0.02 Total ammonia-N 0.31 0.30 0.28 0.20 Diss. ammonia-N 0.06 0.15 0.19 0.09 Diss. NO3 + NO2 - N 0.07 0.06 0.06 0.06 Diss. solids 304 308 312 320 Gooch susp. solids 17 22 15 16 Iron, total 0.26 0.58 0.41 0.32 Copper, total 0.023 0.017 0.012 0.013 Lead, total <0.11 <0.11 <0.11 0.13 Zinc, total 0.03 0.03 0.02 0.02 Chromium, total <0.01 <0.01 <0.01 <0.01 Iron, diss. 0.21 0.41 0.32 0,18 Copper, diss. 0.023 0.017 0.012 0.013 Lead, diss. <0.11 <0.11 <0.11 <0.11 Zinc, diss. 0.03 0.03 0.02 0.02 Chromium, diss. <0.01 <0.01 <0.01 <0.01 Total Kjeldahl-N 6.52 4.70 18.80 4.30 Diss. Kjeldahl-N 3.72 2.36 10.30 2.60 Total Organic-N 6.21 4.40 18.52 4.10 Diss. Organic-N 3.66 2.21 10.11 2.51
Table 2g. BOD - 5 Day Values, mg/1, for Lake Ellyn, Station B (8-27 and 8-28-80)
8-27-80 8-28-80 Noon Midnight Noon Midnight
(103) 11 (139) 13 (327) 11 (46) 13*
Numbers in paranthesis are BOD bottle numbers. BOD analyses were performed by the DuPage County Department of PUblic Health. *6 day BOD value
16

Table 2h. Phytoplankton data, counts/ml, for Lake Ellyn, Station B (8-27 and 8-28-80)
8-27-80 8-28-80 Types and Species Noon Midnight Noon Midnight
Blue-greens Aphanizomenon flos-aquae 14,020 26,570 13,700 16,070 Anacystis cyanea 1,520 1,470 2,420 680 Anabaena spiroides 470 1,000
Greens Colastrum microporum 530 370 210 Ankistrodesmus falcatus 210 Micractinium pusillum 470 Scenedesmus carinatus 580
Diatoms None
Flagellates Trachelomonas crebea 320
Total Count 16,280 28,880 18,120 17,330
Table 2i. Zooplankton data, counts/1 for Lake Ellyn, Station B (8-27 and 8-28-80)
8-27-80 8-28-80 Types and Species Noon Midnight Noon Midnight
Bosmina longirostris 2,500 Cyclops vernalis 1,100 500 2,000 1,000 Daphnia parvula 1,900 3,600 Diaptomus minutus 200 300 300 Mosquito larvae 300
Total Count 3,500 3,300 5,600 1,300
17

Table 3a. Diurnal Observations at Station B in Lake Ellyn (10-29-80) Temperature, °C
Depth .1:00 3:00 5:00 7:00 9:00 11:00 1:00 3:00 5:00 7:00 9:00 11:00 (ft) pm pm pm pm pm pm am am am am am am
0 7.5 7.8 7.5 7.5 7.2 7.0 6.8 6.8 6.5 6.4 6.5 7.0 1 7.5 7.8 7.5 7.5 7.2 7.0 6.8 6.8 6.5 6.4 6.5 6.8 2 7.5 7.8 7.5 7.5 7.2 7.0 6.8 6.8 6.5 6.4 6.5 6.8 3 7.0 7.2 7.5 7.5 7.2 7.0 6.8 6.8 6.5 6.4 6.5 6.8 4 6.8 7.0 7.4 7.0 7.2 7.0 6.8 6.8 6.5 6.5 6.5 6.8 5 7.0 7.0 7.2 7.2 7.2 7.5 7.0 7.0 6.5 6.5 6.5 6.8
Table 3b. Diurnal Observations at Station B in Lake Ellyn (10-29-80) Dissolved Oxygen, mg/1
Depth 1:00 3:00 5:00 7:00 9:00 11:00 1:00 3:00 5:00 7:00 9:00 11:00 (ft) pm pm pm pm pm pm am am am am am am
0 13.8 15.0 15.2 14.6 14.0 14.2 14.0 13.8 13.0 12.4 13.2 13.4 1 13.8 15.2 15.2 14.8 13.8 14.3 14.0 13.8 12.9 12.6 13.2 13.5 2 13.8 15.2 15.2 14.8 13.8 14.3 14.0 13.8 12.9 12.4 13.2 13.4 3 12.6 14.2 15.1 14.8 13.8 14.3 14.0 13.8 12.9 12.4 13.2 13.4 4 12.2 13.3 14.0 12.5 13.6 14.3 14.0 13.8 12.8 12.4 13.1 13.4 5 11.3 12.6 14.0 11.4 11.6 11.7 13.8 11.4 12.8 12.4 13.0 13.4
18
Table 3c. Diurnal Observations at Station B in Lake Ellyn (10-29-80) - pH
Depth 1:00 3:00 5:00 7:00 9:00 11:00 1:00 3:00 5:00 7:00 9:00 11:00 (ft) pm pm pm pm pm pm am am am am am am
0 9.08 9.12 9.12 9.10 9.08 9.10 9.08 9.08 9.00 8.98 9.02 9.05 2 9.08 9.12 9.15 9.12 9.08 9.10 9.08 9.08 8.98 8.98 9.00 9.05 4 8.90 8.95 9.05 9.08 8.95 9.02 8.92 9.00 8.98 8.95 9.02 9.05
Table 3d. Diurnal Observations at Station B in Lake Ellyn (10-29-80) -Alkalinity, mg/1 as CaCO3
Depth 1:00 3:00 5:00 7:00 9:00 11:00 1:00 3:00 5:00 7:00 9:00 11:00 (ft) pm pm pm pm pm pm am am am am am am
0 136 136 136 136 134 136 134 134 136 138 138 138 2 136 136 136 134 134 136 136 134 136 138 136 136 4 140 138 136 136 136 138 142 136 138 138 136 138
Table 3e. Diurnal Observations at Station B in Lake Ellyn (10-29-80) -Chlorophyll a, mg/m3
1:00 3:00 5:00 7:00 9:00 11:00 1:00 3:00 5:00 7:00 9:00 11:00 pm pm pm pm pm pm am am am am am am
34.0 26.0 46.0 30.0 26.0 22.0 40.0 40.0 27.0 26.0 40.0 30.0
19

Table 3f. Chemical quality characteristics in mg/1 (ppm), for Lake Ellyn, Station B (10-28 and 10-30-80)
10-28-80 10-30-80 Parameters Noon Midnight Noon Midnight
Chloride 69.5 69.0 69.0 68.5 COD 35.7 34.5 33.3 35.7 Total phosphate-P 0.19 0.18 0.20 0.19 Total diss. phosphate-P 0.02 0.02 0.01 0.03 Total ortho phosphate-P 0.04 0.04 0.03 0.03 Diss. ortho phosphate-P <0.01 0.01 0.01 0.01 Total ammonia-N 0.30 0.25 0.23 0.18 Diss. ammonia-N 0.05 0.10 0.08 0.04 Diss. NO3 + NO2 - N 0.07 0.08 0.08 0.09 Diss. solids 392 394 402 396 Gooch susp. solids 30 31 23 23 Iron, total 0.40 0.36 0.32 0.30 Copper, total 0.010 0.008 0.006 0.007 Lead', total <0.11 <0.11 <0.11 <0.11 Zinc, total 0.02 0.02 0.01 0.01 Chromium, total <0.01 <0.01 <0.01 <0.01 Iron, diss. 0.22 0.20 0.20 0.18 Copper, diss. 0.010 0.008 0.006 0.007 Lead, diss. <0.11 <0.11 <0.11 <0.ll Zinc, diss. 0.02 0.02 0.01 0.01 Chromium, diss. <0.01 <0.01 <0.01 <0.01 Total Kjeldahl-N 2.08 1.37 5.03 1.67 Diss. Kjeldahl-N 1.38 1.34 1.29 1.14 Total Organic-N 1.78 1.12 4.80 1.49 Diss. Organic-N 1.33 1.24 1.21 1.10
Table 3g. BOD - 5 Day Values, mg/1, for Lake Ellyn, Station B (10-28 and 10-30-80)
10-28-80 10-30-80 Noon Midnight Noon Midnight
(117) — (124) — (123) 15+ (130) 12+
Numbers in paranthesis are BOD bottle numbers. BOD analyses were performed by the DuPage County Department of Public Health. + 8 day BOD value
20

Table 3h. Phytoplankton data, counts/ml, for Lake Ellyn, Station B (10-28 and 10-30-80)
10-28-80 10-30-80 Types and Species Noon Midnight Noon Midnight
Blue-greens Aphanizomenon flos-aquae 1,580 3,730 6,770 4,250
Greens Ankistrodesmus falcatus 5,090 1,630 Chlorella ellipsoidea 26,300 42,580 32,340 16,330 Scenedesmus carinatus 2,100 3,520 Ulothrix variablis 2,260 890
Diatoms None
Flagellates Euglena viridis 950 1,730 1,100 320
Total Count 30,930 51,560 47,560 23,420
Table 3i. Zooplankton data, counts/1, for Lake Ellyn, Station B (10-28 and 10-30-80)
10-28-80 10-30-80 Types and Species Noon Midnight Noon Midnight
Bosmina longirostris 700 700 Brachionus urceus 1,200 Daphnia pulex 1,500 100 Diaptomus minutus 200 1,300 Keratella cochearis 400 1,600 1,000 2,200
Total Count 400 5,000 1,200 4,300
21

Table 4a. Diurnal Observations at Station B in Lake Ellyn (4-20-81) Temperature, °C
Depth 4:00 6:00 8:00 10:00 12:00 2:00 4:00 6:00 8:00 10:00 12:00 2:00 (ft) pm pm pm pm am am am am am pm
0 14.0 14.0 13.5 13.0 13.0 12.8 12.2 12.0 12.2 12.8 13.5 14.0 1 14.0 14.0 13.5 13.0 13.0 12.8 12.2 12.0 12.2 12.8 13.5 14.0 2 14.0 14.0 13.5 13.0 13.0 12.8 12.5 12.2 12.2 12.5 13.5 14.0 3 14.0 14.0 13.8 13.0 13.0 12.8 12.5 12.2 12.2 12.5 13.5 14.0 4 14.0 14.0 13.8 13.0 13.0 12.8 12.5 12.2 12.2 12.2 13.0 13.0 5 14.0 14.0 13.8 13.0 13.0 12.8 12.5 12.2 12.2 12.2 12.8 12.8
Table 4b. Diurnal Observations at Station B in Lake Ellyn (4-20-81) Dissolved Oxygen, mg/1
Depth 4:00 6:00 8:00 10:00 12:00 2:00 4:00 6:00 8:00 10:00 12:00 2:00 (ft) pm pm pm pm am am am am am pm
0 11.8 11.6 10.8 10.4 9.9 9.7 9.4. 9.3 9.6 9.9 11.0 11.4 1 11.8 11.6 10.8 10.0 9.9 9.7 9.4 9.3. 9.6 9.9 11.0 11.4 2 11.8 11.6 11.0 10.4 9.9 9.7 9.4 9.3 9.6 9.8 11.0 11.4 3 11.7 11.6 11.0 10.3 9.9 9.7 9.4 9.3 9.6 9.8 11.0 11.4 4 11.7 11.6 11.0 10.3 9.8 9.7 9.3 9.3 9.4 9.7 10.4 10.6 5 10.4 9.6 6.5 5.8 4.5 4.9 6.0 6.9 5.0 5.7 5.0 5.0
22

Table 4c. Diurnal Observations at Station B in Lake Ellyn (4-20-81) - pH
Depth 4:00 6:00 8:00 10:00 12:00 2:00 4:00 6:00 8:00 10:00 12:00 2:00 (ft) pm pm pm pm am am am am am pm
0 9.00 9.00 9.00 8.95 8.70 8.80 8.75 8.75 8.78 8.80 8.88 8.90 2 9.00 9.00 9.00 8.95 8.75 8.75 8.75 8.72 8.75 8.78 8.85 8.88 4 9.00 9.00 9.00 8.95 8.75 8.75 8.72 8.72 8.75 8.75 8.75 8.85
Table 4d. Diurnal Observations at Station B in Lake Ellyn (4-20-81) Alkalinity, mg/1 as CaCO3
Depth 4:00 6:00 8:00 10:00 12:00 2:00 4:00 6:00 8:00 10:00 12:00 2:00 (ft) pm pm pm pm am am am am am pm
0 161.7 161.7 161.7 161.7 161.7 157.5 157.5 157.5 159.6 159.6 157.5 161.7 2 159.6 161.7 159.6 161.7 161.7 157.5 157.5 157.5 157.5 159.6 157.5 159.6 4 159.6 161.7 159.6 161.7 159.6 157.5 157.5 157.5 157.5 157.5 159.6 157.5
Table 4e. Diurnal Observations at Station B in Lake Ellyn (4-20-81) Chlorophyll a, mg/m
4:00 6:00 8:00 10:00 12:00 2:00 4:00 6:00 8:00 10:00 12:00. 2:00 pm pm pm pm am am am am am pm
40.0 30.0 30.0 30.0 40.0 50.0 30.0 40.0 50.0 40.0 40.0 30.0
23

Table 4f. Chemical quality characteristics in mg/1 (ppm), for Lake Ellyn, Station B (4-21 and 4-22-81)
4-21-81 4-22-81 Parameters Noon Midnight Noon Midnight
Chloride 173 175 173 157 COD 27.5 27.6 27.7 29.5 Total phosphate-P 0.13 0.12 0.16 0.14 Total diss. phosphate-P 0.02 0.02 0.03 0.01 Total ortho phosphate-P 0.04 0.04 0.06 0.06 Diss. ortho phosphate-P 0.01 0.01 0.02 0.00 Total ammonia-N 0.11 0.21 0.32 0.13 Diss. ammonia-N 0.04 0.11 0.13 0.13 Diss. NO3 + NO2 - N 0.076 0.078 0.078 0.205 Diss. solids 319 321 318 294. Gooch susp. solids 16 17 20 27 Iron, total 0.27 0.27 0.44 0.50 Copper, total 0.007 0.007 0.007 0.008 Lead, total 0.05 0.04 0.04 0.04 Zinc, total 0.01 0.01 0.03 0„06 Chromium, total <0.01 <0.01 <0.01 <0.01 Iron, diss. 0.02 0.02 0.02 0.02 Copper, diss. 0.005 0.006 0.005 0.004 Lead, diss. <0.04 <0.04 <0.04 <0.04 Zinc, diss. 0.01 0.01 0.02 0.02 Chromium, diss. <0.01 <0.01 <0.01 <0.01 Total Kjeldahl-N 1.22 1.39 1.47 1.64 Diss. Kjeldahl-N 0.85 0.41 0.60 0.59 Total Organic-N 1.11 1.18 1.15 1.51 Diss. Organic-N 0.81 0.30 0.47 0.46
Table 4g. BOD - 5 Day Values, mg/1, for Lake Ellyn, Station B (4-21 and 4-22-81) 4-21-81 4-22-81
Noon Midnight Noon Midnight
(84) 7.5 (115) 8.5 (121) 8.0 (237) 17
Numbers in parenthesis are BOD bottle numbers. BOD analyses were performed by the DuPage County Department of Public Health.
24

Table 4h. Phytoplankton data, counts/ml, for Lake Ellyn, Station B (4-21 and 4-22-81)
4-21-81 4-22-81 Types and Species Noon Midnight Noon Midnight
Blue-greens Aphanizomenon flos-aquae 5,828 9,503 7,665 2,048
Greens Ankistrodesmus falcatus 945 Chlorella ellipsoidea 1,890 Colastrum microporum 3,150 Crucigenia rectangularis 945 Oocystis borgei 578 Scenedesmus dimorphus 1,050 1,103
Diatoms Cyclotella meneghiniana 3,308 2,153 2,993 Melosira granulata 735 Navicula gastrum 5,933 4,253 6,195 3,728 Navicula gracilis 4,148 3,150 Navicula zanoni 3,308 Synedra acus 5,145 5,303 7,298 12,126
Flagellates None
Total Count 31,397 28,773 21,893 22,418
Table 4i. Zooplankton data, counts/1 for Lake Ellyn, Station B (4-21 and 4-22-81)
4-21-81 4-22-81 Types and Species Noon Midnight Noon Midnight
Asplanchnopus myrmeleo 750 Bosmina longirostris 700 Brachionus calyciflonus 600 Brachionus havanaensis 1,050 Cyclops strenum 650 800 Diaptomus pallidus 1,050 250 Keratella valga 1,200 500
Total Count 2,500 2,850 1,150 1,050
25