Embed Size (px)
Citation preview
1
PHOTOELECTRON SPECTRA OF LIQUID METALS Sayani Chattopadhyay (CY04C028), Sheleena Hom (CY04C030) Course CY653; February, 2006 ________________________________________________________________________ INTRODUCTION The study of liquid metals can be done using time resolved photoelectron spectroscopy and angle resolved photoelectron spectroscopy: TR-PES: Time-resolved photoelectron spectroscopy aims to measure the electron distribution in a molecule as it is going through a transient process, such as dissociation. One ultra fast pulse excites the system under study, and a second ultra fast pulse probes the system at varying time delays by ionizing the molecule and collecting the electrons produced. Ejected photoelectrons reflect the initial binding energies of the electrons in the molecule; therefore the time-dependent electron energy redistribution can be monitored. AR-PES: In Angle Resolved Photo Emission Spectroscopy one uses the photoelectric effect to eject electrons from the sample. By conservation of energy and momentum, one can then determine the energy and momentum that the electron has in its initial state, and therefore the complete electronic structure of the sample. Schematic Representation of a photoelectron spectrometer
2
The basic requirements for a photoemission experiment are:
1. A source of fixed-energy radiation. 2. An electron energy analyzer (which can disperse the emitted electrons according
to their kinetic energy, and thereby measure the flux of emitted electrons of a particular energy).
3. A high vacuum environment (to enable the emitted photoelectrons to be analyzed without interference from gas phase collisions).
Photoelectron spectroscopy in liquid metals deals with the study of transition from solid to liquid state, which can have substantial effects on the electronic properties of metals. For example, in semi-conducting Ge, the forbidden states in the band gap of the crystals are filled and the melt is metallic. The challenge lies in understanding the evolution of the electronic wave functions, which underlie such changes in physical properties. UPS and XPS have been applied in order to study the electronic structure of metals. The problems associated with such studies were that the contaminated surface (solid or liquid) did not allow the valence band spectra to reflect the intrinsic valence bond structure. No standard cleaning procedure for liquid metals had been introduced, till the introduction of Wire cleaner device, which enabled the study of all metals with vapour pressure below 0.0001 Pa at the melting point. In crystalline solids periodicity allows classification of electronic wave functions as Bloch states (plane waves, modulated by lattice functions that extend through the entire crystal). In liquids and amorphous solids due to the loss of periodicity the crystal momentum is no longer a good quantum number and this restricts the information provided by important experimental probes. Unlike in a crystalline solid where the momentum needed for photoemission is provided in discreet quantities by reciprocal lattice vectors, in liquid metal the photoelectrons gather arbitrary momenta. The extent to which electronic wave functions are itinerant or localized has eluded experimental investigation for decades. This is due to the loss of periodicity. AR-PES gives direct access to single particle spectral function and only measures the projection of the momentum-resolved quantity on the energy coordinate (i.e., the spectral density) in a liquid. This limitation can be overcome by working on the interface of a liquid and a crystalline material. For a liquid monolayer, the momentum of the initial state can be retrieved, because the proximity of the crystalline substrate allows transfer of reciprocal lattice vectors to the liquid states. Example: The electron dispersion and spectral function in a 2D liquid, molten Pb was studied. A crystalline Cu (111) substrate serves as a support with minimal influence on the atomic arrangement of the 2D Pb liquid, and at the same time ensures that the parallel momentum of the initial Pb states is conserved in the photoemission process.
3
Figure 1 Figure 2
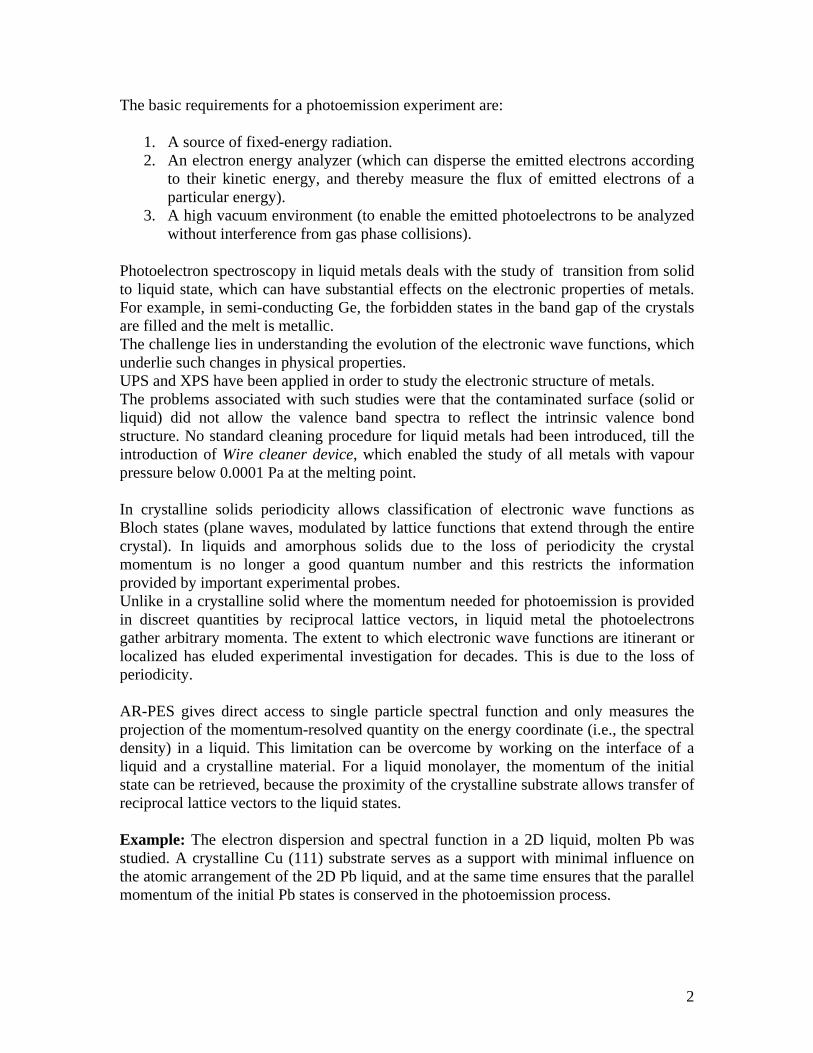
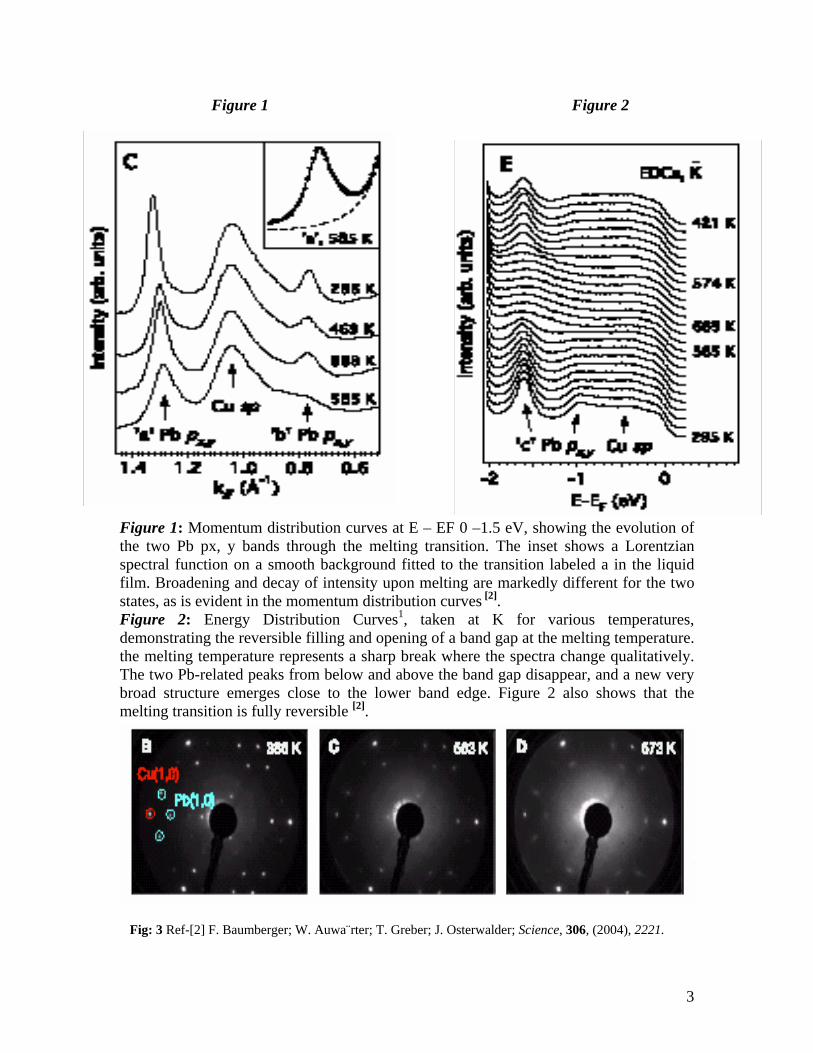
Figure 1: Momentum distribution curves at E – EF 0 –1.5 eV, showing the evolution of the two Pb px, y bands through the melting transition. The inset shows a Lorentzian spectral function on a smooth background fitted to the transition labeled a in the liquid film. Broadening and decay of intensity upon melting are markedly different for the two states, as is evident in the momentum distribution curves [2]. Figure 2: Energy Distribution Curves1, taken at K for various temperatures, demonstrating the reversible filling and opening of a band gap at the melting temperature. the melting temperature represents a sharp break where the spectra change qualitatively. The two Pb-related peaks from below and above the band gap disappear, and a new very broad structure emerges close to the lower band edge. Figure 2 also shows that the melting transition is fully reversible [2]. LEED patterns of a 0.8-ML film measured with an electron energy of 65 eV at temperatures above and below the melting transition. The Cu (111) principal spots show lit Fig: 3 Ref-[2] F. Baumberger; W. Auwa¨rter; T. Greber; J. Osterwalder; Science, 306, (2004), 2221.
4
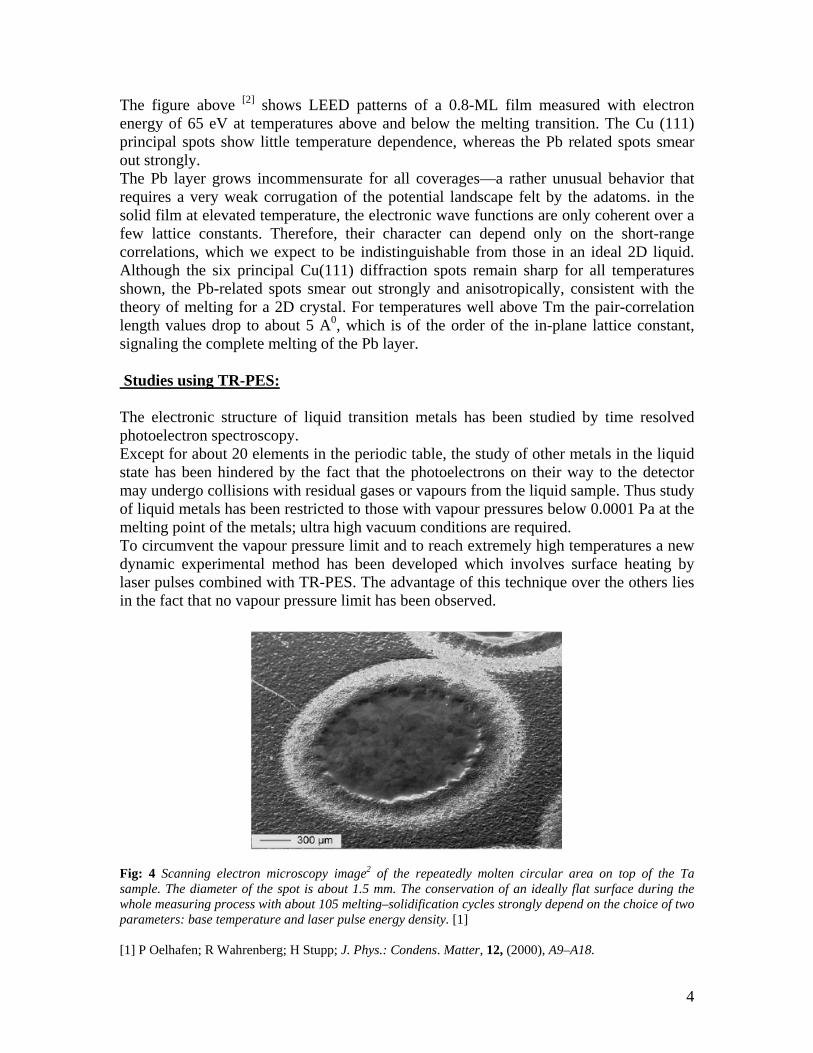
The figure above [2] shows LEED patterns of a 0.8-ML film measured with electron energy of 65 eV at temperatures above and below the melting transition. The Cu (111) principal spots show little temperature dependence, whereas the Pb related spots smear out strongly. The Pb layer grows incommensurate for all coverages—a rather unusual behavior that requires a very weak corrugation of the potential landscape felt by the adatoms. in the solid film at elevated temperature, the electronic wave functions are only coherent over a few lattice constants. Therefore, their character can depend only on the short-range correlations, which we expect to be indistinguishable from those in an ideal 2D liquid. Although the six principal Cu(111) diffraction spots remain sharp for all temperatures shown, the Pb-related spots smear out strongly and anisotropically, consistent with the theory of melting for a 2D crystal. For temperatures well above Tm the pair-correlation length values drop to about 5 A0, which is of the order of the in-plane lattice constant, signaling the complete melting of the Pb layer. Studies using TR-PES: The electronic structure of liquid transition metals has been studied by time resolved photoelectron spectroscopy. Except for about 20 elements in the periodic table, the study of other metals in the liquid state has been hindered by the fact that the photoelectrons on their way to the detector may undergo collisions with residual gases or vapours from the liquid sample. Thus study of liquid metals has been restricted to those with vapour pressures below 0.0001 Pa at the melting point of the metals; ultra high vacuum conditions are required. To circumvent the vapour pressure limit and to reach extremely high temperatures a new dynamic experimental method has been developed which involves surface heating by laser pulses combined with TR-PES. The advantage of this technique over the others lies in the fact that no vapour pressure limit has been observed.
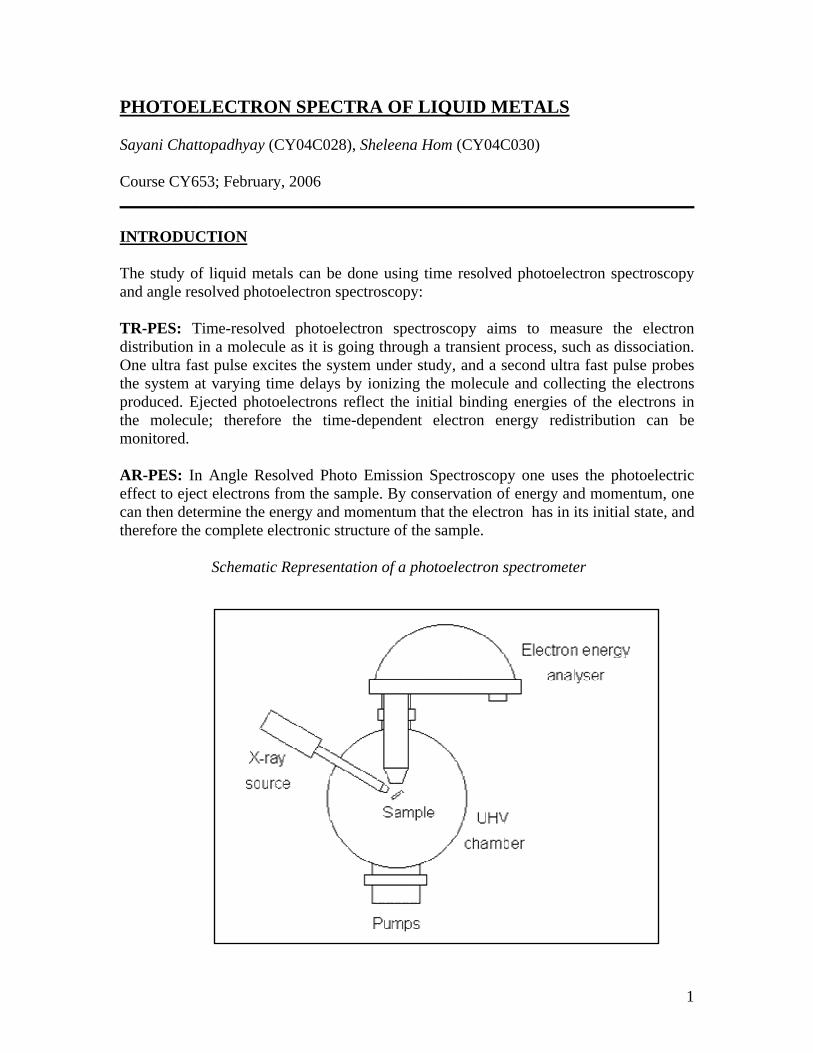
Fig: 4 Scanning electron microscopy image2 of the repeatedly molten circular area on top of the Ta sample. The diameter of the spot is about 1.5 mm. The conservation of an ideally flat surface during the whole measuring process with about 105 melting–solidification cycles strongly depend on the choice of two parameters: base temperature and laser pulse energy density. [1] [1] P Oelhafen; R Wahrenberg; H Stupp; J. Phys.: Condens. Matter, 12, (2000), A9–A18.
5
The quality of the surface of the sample is observed directly using a CCD microscope camera and ensured by scanning tunneling microscopy.
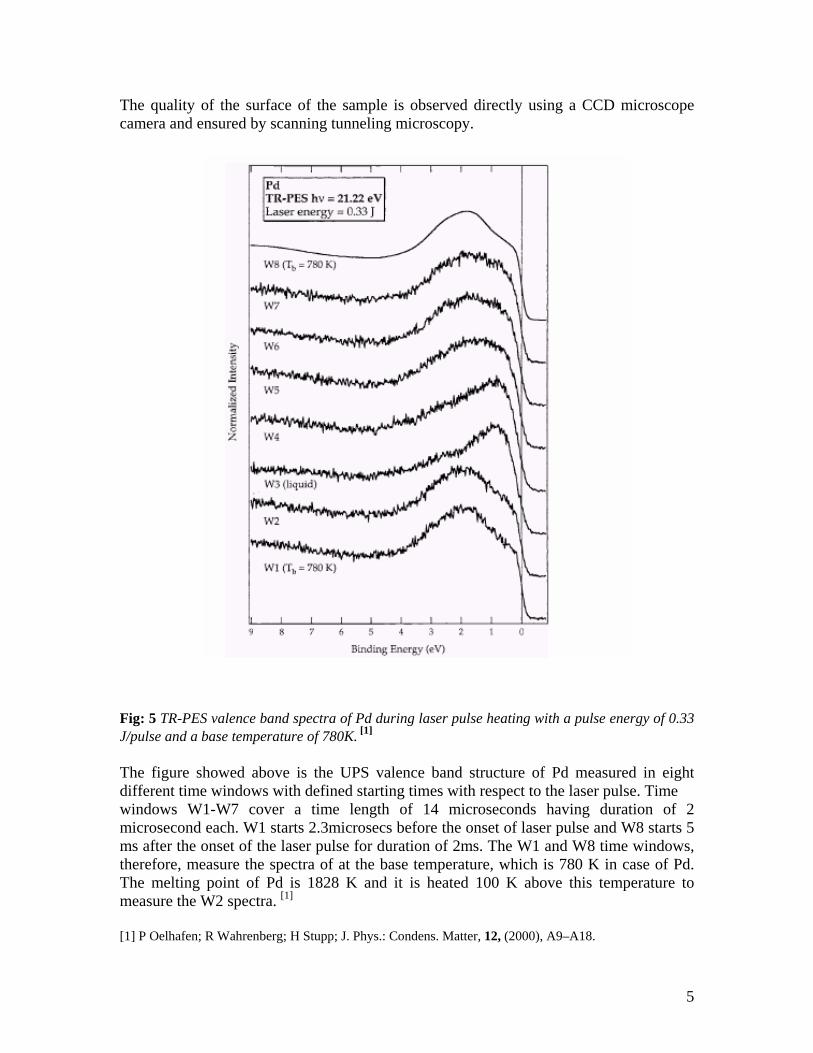
Fig: 5 TR-PES valence band spectra of Pd during laser pulse heating with a pulse energy of 0.33 J/pulse and a base temperature of 780K. [1]
The figure showed above is the UPS valence band structure of Pd measured in eight different time windows with defined starting times with respect to the laser pulse. Time windows W1-W7 cover a time length of 14 microseconds having duration of 2 microsecond each. W1 starts 2.3microsecs before the onset of laser pulse and W8 starts 5 ms after the onset of the laser pulse for duration of 2ms. The W1 and W8 time windows, therefore, measure the spectra of at the base temperature, which is 780 K in case of Pd. The melting point of Pd is 1828 K and it is heated 100 K above this temperature to measure the W2 spectra. [1]
[1] P Oelhafen; R Wahrenberg; H Stupp; J. Phys.: Condens. Matter, 12, (2000), A9–A18.
6
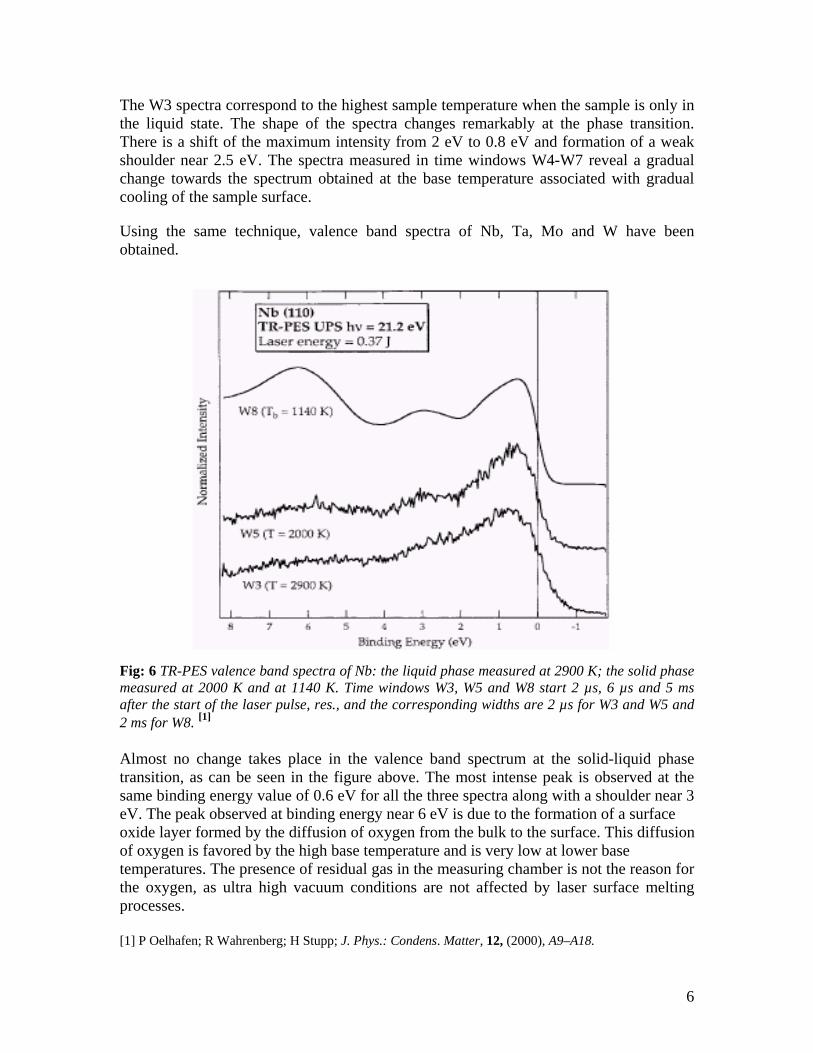
The W3 spectra correspond to the highest sample temperature when the sample is only in the liquid state. The shape of the spectra changes remarkably at the phase transition. There is a shift of the maximum intensity from 2 eV to 0.8 eV and formation of a weak shoulder near 2.5 eV. The spectra measured in time windows W4-W7 reveal a gradual change towards the spectrum obtained at the base temperature associated with gradual cooling of the sample surface.
Using the same technique, valence band spectra of Nb, Ta, Mo and W have been obtained. Fig: 6 TR-PES valence band spectra of Nb: the liquid phase measured at 2900 K; the solid phase measured at 2000 K and at 1140 K. Time windows W3, W5 and W8 start 2 µs, 6 µs and 5 ms after the start of the laser pulse, res., and the corresponding widths are 2 µs for W3 and W5 and 2 ms for W8. [1]
Almost no change takes place in the valence band spectrum at the solid-liquid phase transition, as can be seen in the figure above. The most intense peak is observed at the same binding energy value of 0.6 eV for all the three spectra along with a shoulder near 3 eV. The peak observed at binding energy near 6 eV is due to the formation of a surface oxide layer formed by the diffusion of oxygen from the bulk to the surface. This diffusion of oxygen is favored by the high base temperature and is very low at lower base temperatures. The presence of residual gas in the measuring chamber is not the reason for the oxygen, as ultra high vacuum conditions are not affected by laser surface melting processes. [1] P Oelhafen; R Wahrenberg; H Stupp; J. Phys.: Condens. Matter, 12, (2000), A9–A18.
7
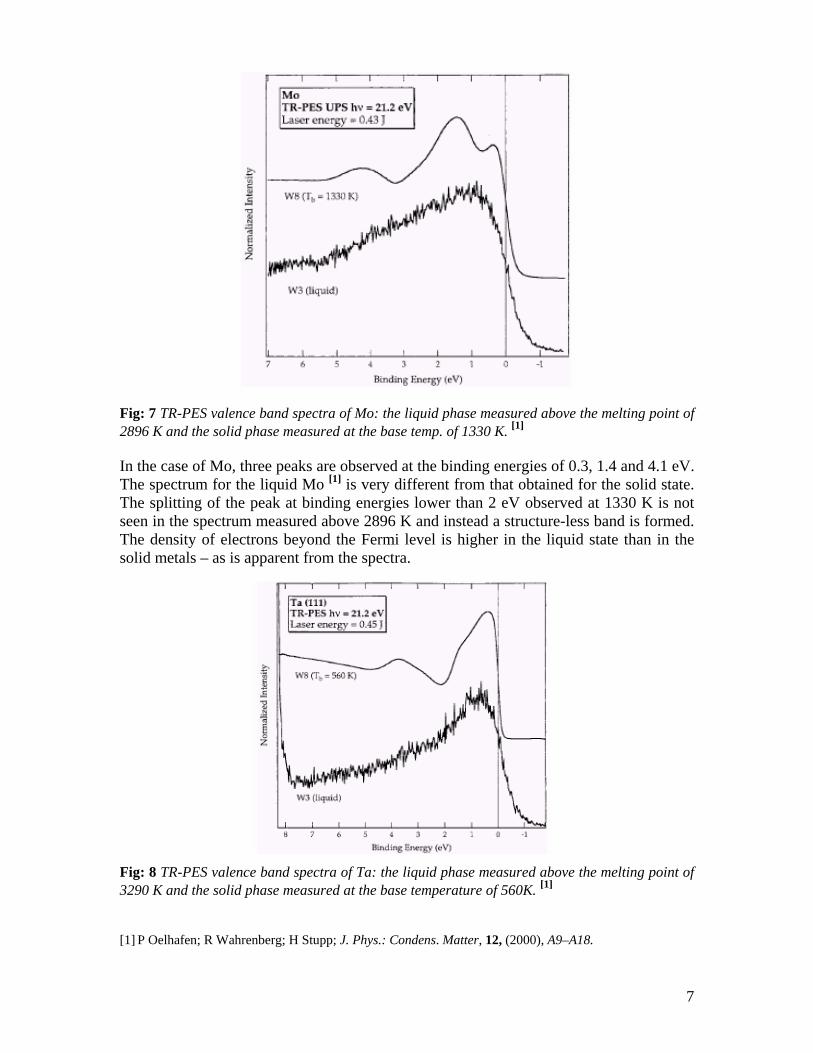
Fig: 7 TR-PES valence band spectra of Mo: the liquid phase measured above the melting point of 2896 K and the solid phase measured at the base temp. of 1330 K. [1]
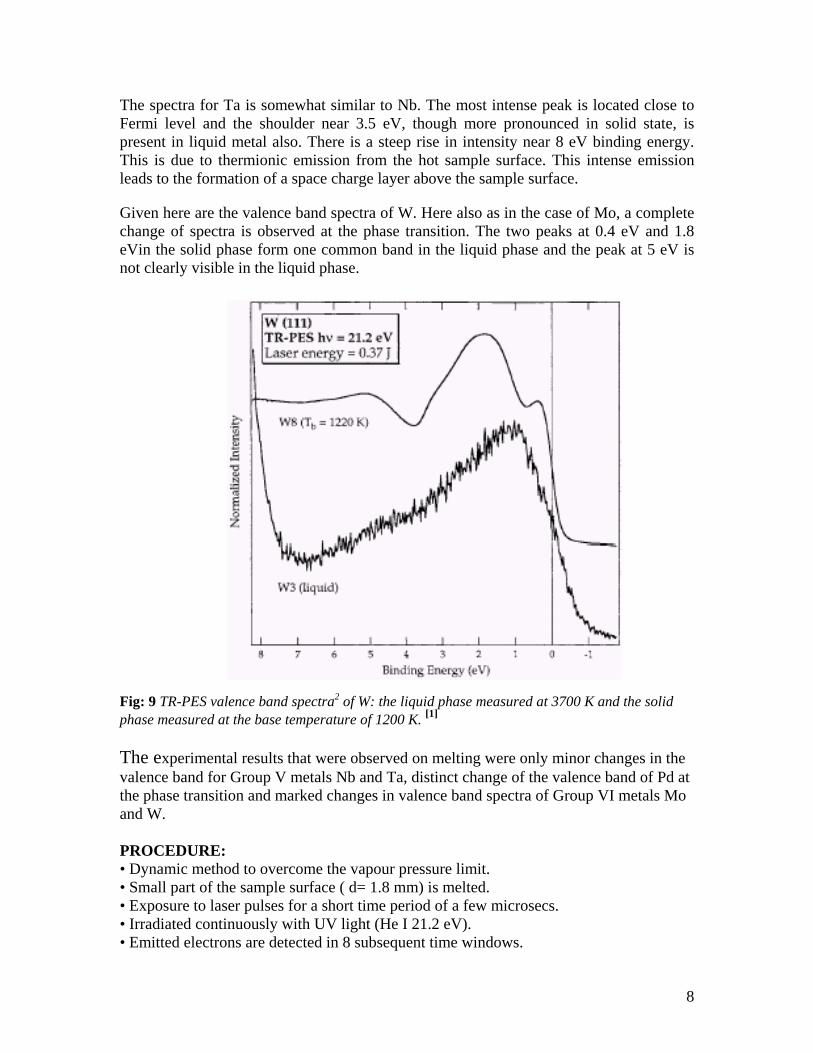
In the case of Mo, three peaks are observed at the binding energies of 0.3, 1.4 and 4.1 eV. The spectrum for the liquid Mo [1] is very different from that obtained for the solid state. The splitting of the peak at binding energies lower than 2 eV observed at 1330 K is not seen in the spectrum measured above 2896 K and instead a structure-less band is formed. The density of electrons beyond the Fermi level is higher in the liquid state than in the solid metals – as is apparent from the spectra. Fig: 8 TR-PES valence band spectra of Ta: the liquid phase measured above the melting point of 3290 K and the solid phase measured at the base temperature of 560K. [1]
[1] P Oelhafen; R Wahrenberg; H Stupp; J. Phys.: Condens. Matter, 12, (2000), A9–A18.
8
The spectra for Ta is somewhat similar to Nb. The most intense peak is located close to Fermi level and the shoulder near 3.5 eV, though more pronounced in solid state, is present in liquid metal also. There is a steep rise in intensity near 8 eV binding energy. This is due to thermionic emission from the hot sample surface. This intense emission leads to the formation of a space charge layer above the sample surface.
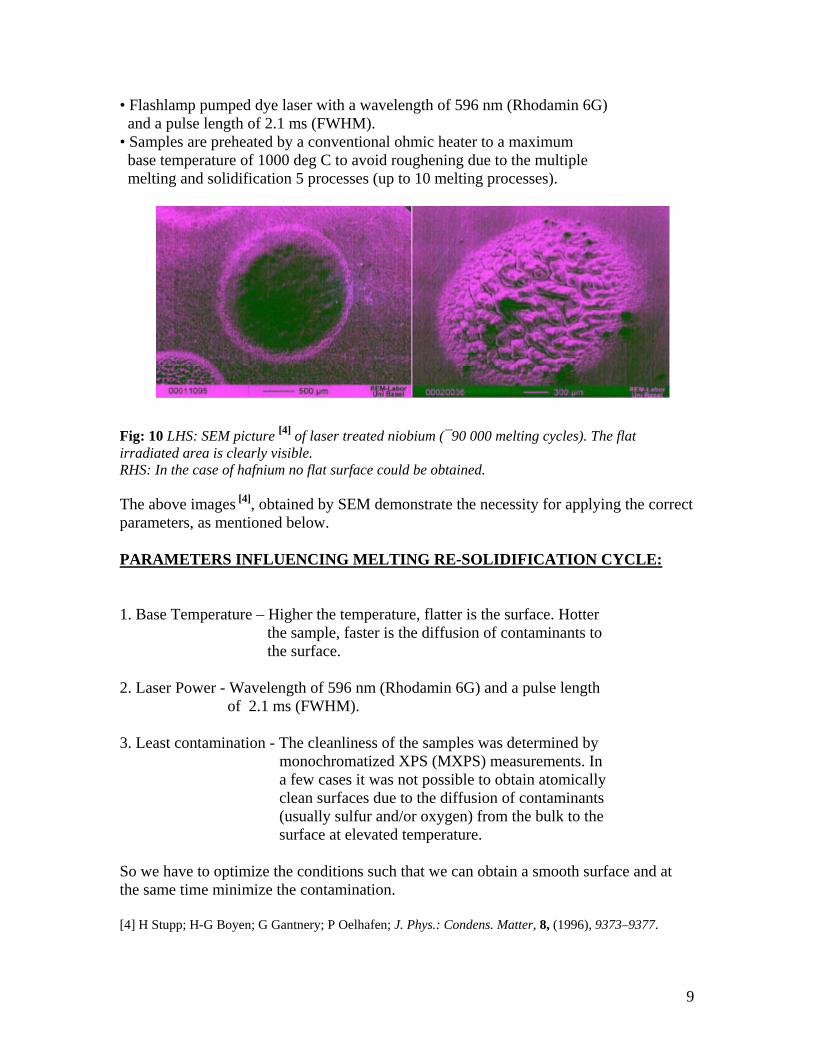
Given here are the valence band spectra of W. Here also as in the case of Mo, a complete change of spectra is observed at the phase transition. The two peaks at 0.4 eV and 1.8 eVin the solid phase form one common band in the liquid phase and the peak at 5 eV is not clearly visible in the liquid phase. Fig: 9 TR-PES valence band spectra2 of W: the liquid phase measured at 3700 K and the solid phase measured at the base temperature of 1200 K. [1]
The experimental results that were observed on melting were only minor changes in the valence band for Group V metals Nb and Ta, distinct change of the valence band of Pd at the phase transition and marked changes in valence band spectra of Group VI metals Mo and W. PROCEDURE: • Dynamic method to overcome the vapour pressure limit. • Small part of the sample surface ( d= 1.8 mm) is melted. • Exposure to laser pulses for a short time period of a few microsecs. • Irradiated continuously with UV light (He I 21.2 eV). • Emitted electrons are detected in 8 subsequent time windows.
9
• Flashlamp pumped dye laser with a wavelength of 596 nm (Rhodamin 6G) and a pulse length of 2.1 ms (FWHM). • Samples are preheated by a conventional ohmic heater to a maximum base temperature of 1000 deg C to avoid roughening due to the multiple melting and solidification 5 processes (up to 10 melting processes). Fig: 10 LHS: SEM picture [4] of laser treated niobium (¯90 000 melting cycles). The flat irradiated area is clearly visible. RHS: In the case of hafnium no flat surface could be obtained. The above images [4], obtained by SEM demonstrate the necessity for applying the correct parameters, as mentioned below. PARAMETERS INFLUENCING MELTING RE-SOLIDIFICATION CYCLE: 1. Base Temperature – Higher the temperature, flatter is the surface. Hotter the sample, faster is the diffusion of contaminants to the surface. 2. Laser Power - Wavelength of 596 nm (Rhodamin 6G) and a pulse length of 2.1 ms (FWHM). 3. Least contamination - The cleanliness of the samples was determined by monochromatized XPS (MXPS) measurements. In a few cases it was not possible to obtain atomically clean surfaces due to the diffusion of contaminants (usually sulfur and/or oxygen) from the bulk to the surface at elevated temperature. So we have to optimize the conditions such that we can obtain a smooth surface and at the same time minimize the contamination. [4] H Stupp; H-G Boyen; G Gantnery; P Oelhafen; J. Phys.: Condens. Matter, 8, (1996), 9373–9377.
10
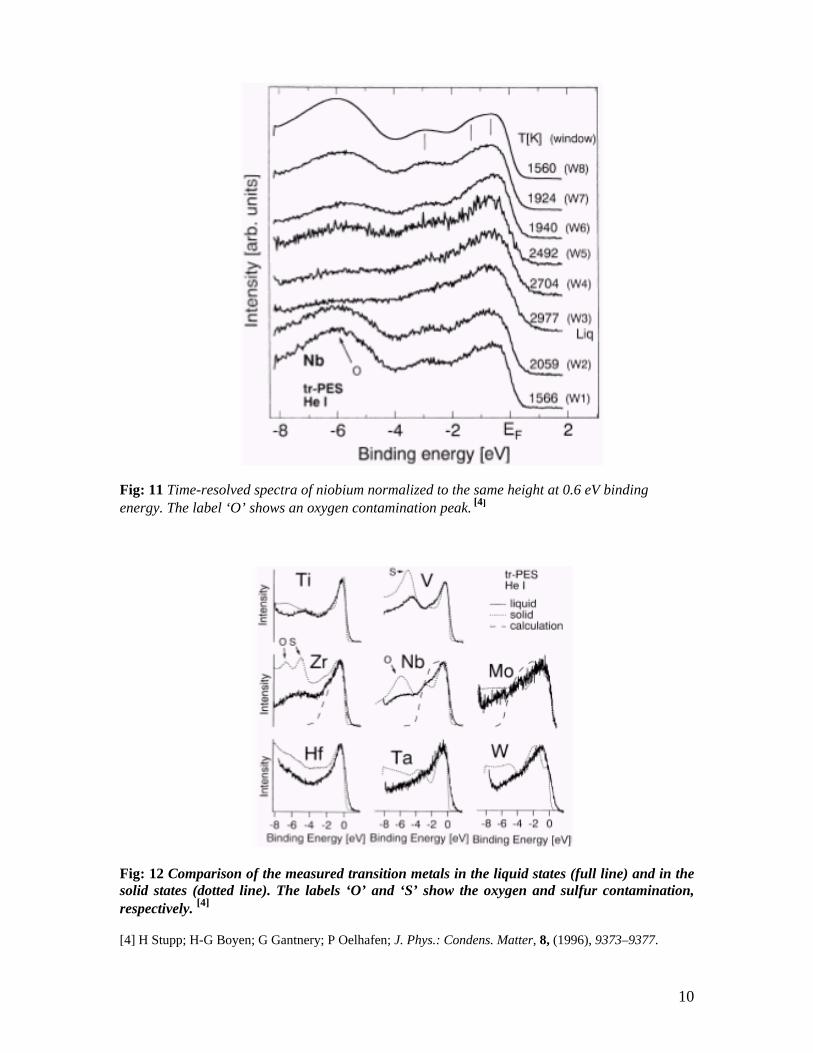
Fig: 11 Time-resolved spectra of niobium normalized to the same height at 0.6 eV binding energy. The label ‘O’ shows an oxygen contamination peak. [4] Fig: 12 Comparison of the measured transition metals in the liquid states (full line) and in the solid states (dotted line). The labels ‘O’ and ‘S’ show the oxygen and sulfur contamination, respectively. [4]
[4] H Stupp; H-G Boyen; G Gantnery; P Oelhafen; J. Phys.: Condens. Matter, 8, (1996), 9373–9377.
11
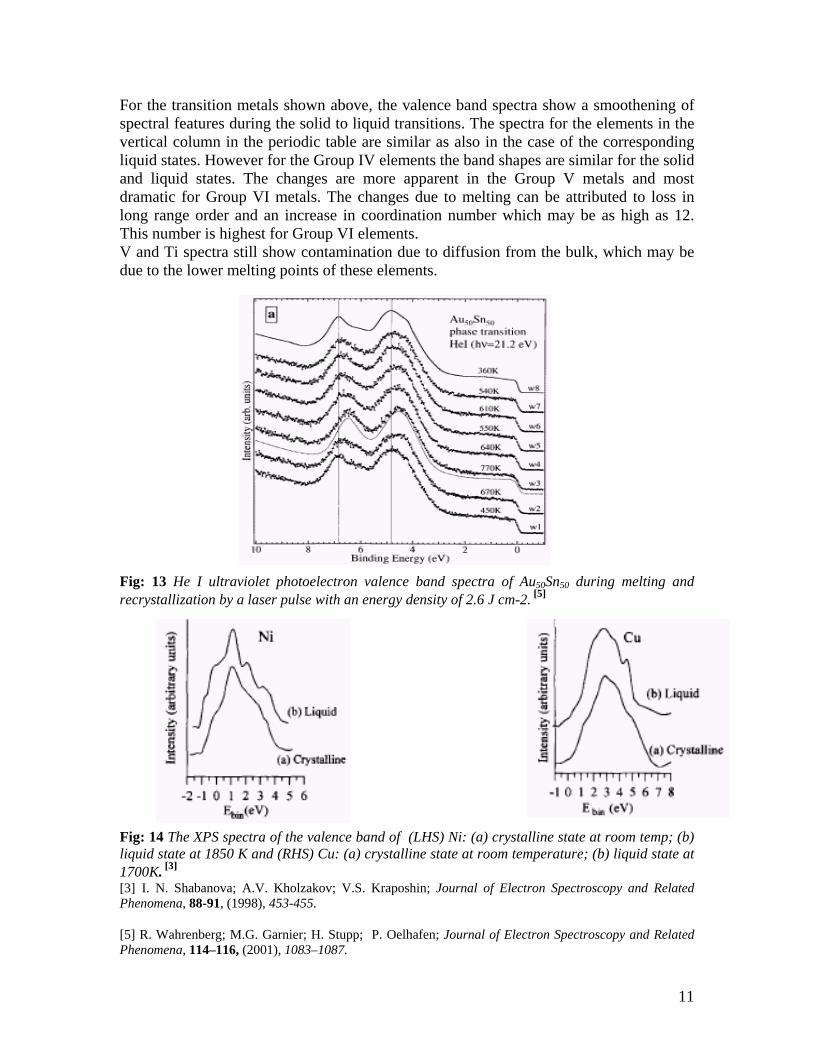
For the transition metals shown above, the valence band spectra show a smoothening of spectral features during the solid to liquid transitions. The spectra for the elements in the vertical column in the periodic table are similar as also in the case of the corresponding liquid states. However for the Group IV elements the band shapes are similar for the solid and liquid states. The changes are more apparent in the Group V metals and most dramatic for Group VI metals. The changes due to melting can be attributed to loss in long range order and an increase in coordination number which may be as high as 12. This number is highest for Group VI elements. V and Ti spectra still show contamination due to diffusion from the bulk, which may be due to the lower melting points of these elements. Fig: 13 He I ultraviolet photoelectron valence band spectra of Au50Sn50 during melting and recrystallization by a laser pulse with an energy density of 2.6 J cm-2. [5]
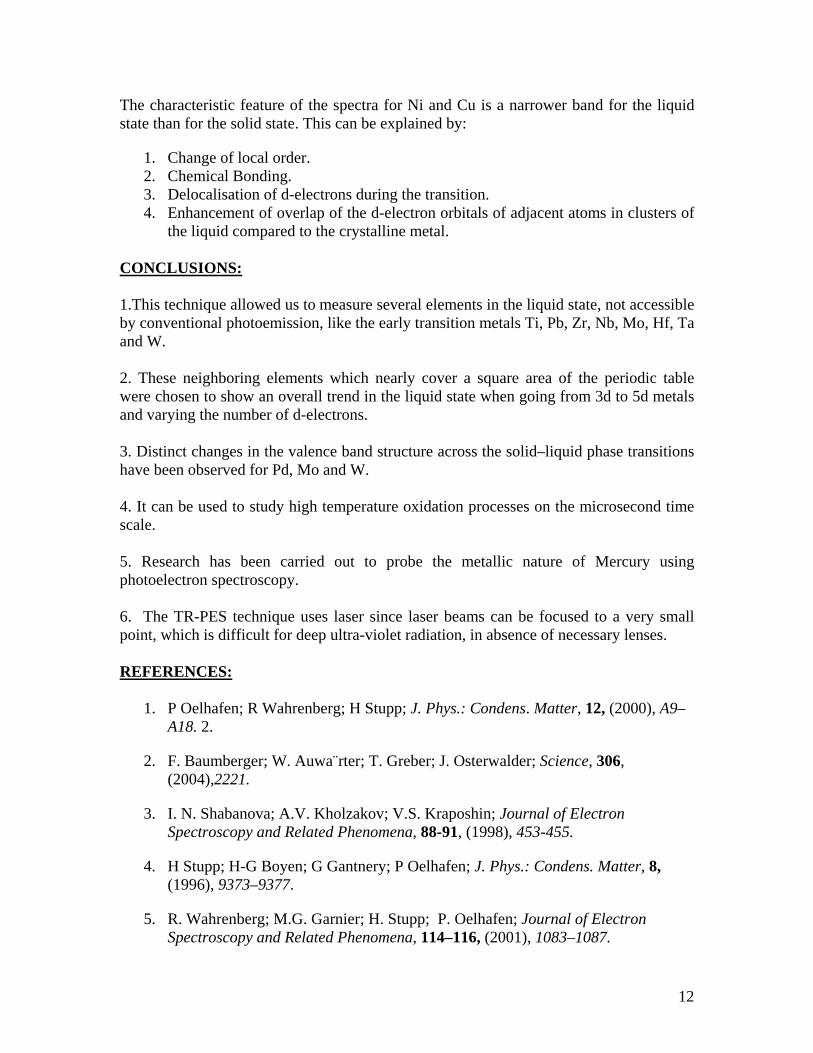
Fig: 14 The XPS spectra of the valence band of (LHS) Ni: (a) crystalline state at room temp; (b) liquid state at 1850 K and (RHS) Cu: (a) crystalline state at room temperature; (b) liquid state at 1700K. [3] [3] I. N. Shabanova; A.V. Kholzakov; V.S. Kraposhin; Journal of Electron Spectroscopy and Related Phenomena, 88-91, (1998), 453-455.
[5] R. Wahrenberg; M.G. Garnier; H. Stupp; P. Oelhafen; Journal of Electron Spectroscopy and Related Phenomena, 114–116, (2001), 1083–1087.
12
The characteristic feature of the spectra for Ni and Cu is a narrower band for the liquid state than for the solid state. This can be explained by:
1. Change of local order. 2. Chemical Bonding. 3. Delocalisation of d-electrons during the transition. 4. Enhancement of overlap of the d-electron orbitals of adjacent atoms in clusters of
the liquid compared to the crystalline metal.
CONCLUSIONS: 1.This technique allowed us to measure several elements in the liquid state, not accessible by conventional photoemission, like the early transition metals Ti, Pb, Zr, Nb, Mo, Hf, Ta and W. 2. These neighboring elements which nearly cover a square area of the periodic table were chosen to show an overall trend in the liquid state when going from 3d to 5d metals and varying the number of d-electrons. 3. Distinct changes in the valence band structure across the solid–liquid phase transitions have been observed for Pd, Mo and W. 4. It can be used to study high temperature oxidation processes on the microsecond time scale. 5. Research has been carried out to probe the metallic nature of Mercury using photoelectron spectroscopy. 6. The TR-PES technique uses laser since laser beams can be focused to a very small point, which is difficult for deep ultra-violet radiation, in absence of necessary lenses. REFERENCES:
1. P Oelhafen; R Wahrenberg; H Stupp; J. Phys.: Condens. Matter, 12, (2000), A9–A18. 2.
2. F. Baumberger; W. Auwa¨rter; T. Greber; J. Osterwalder; Science, 306, (2004),2221.
3. I. N. Shabanova; A.V. Kholzakov; V.S. Kraposhin; Journal of Electron Spectroscopy and Related Phenomena, 88-91, (1998), 453-455.
4. H Stupp; H-G Boyen; G Gantnery; P Oelhafen; J. Phys.: Condens. Matter, 8, (1996), 9373–9377.
5. R. Wahrenberg; M.G. Garnier; H. Stupp; P. Oelhafen; Journal of Electron Spectroscopy and Related Phenomena, 114–116, (2001), 1083–1087.